Embed Size (px)
Citation preview
AP Statistics Course Syllabus 2017-2018 Coach Alan Adair
Chapel Hill High Mathematics Department
770 – 651 – 6282 Course Description:
AP Statistics is the high school equivalent of an introductory college statistics course. In AP Statistics, students develop
strategies for the collection, organization, and analysis of data as well as how to draw conclusions from data. Students will
design, administer, and tabulate results from surveys and experiments. Simulations and probability aid students in
constructing models for random phenomena. Sampling distributions provide the logical structure for the study of
confidence intervals and hypothesis testing. Students use a TI-83/84 graphing calculator, statistical software (Minitab),
and web-based java applets to investigate statistical concepts. Students will be required to prepare written analyses of real
data in order to effectively develop statistical communication skills. All students taking the AP Statistics course are
EXPECTED to take the AP Statistics Exam.
Primary Textbook:
Yates, Moore, Starnes, Tabor. The Practice of Statistics, Fifth Edition (For the AP Exam), 2014
COURSE GOALS:
In AP Statistics, students are expected to learn
Skills
To produce convincing oral and written statistical arguments, using appropriate terminology, in a variety of
applied settings.
When and how to use technology to aid them in solving statistical problems
Knowledge
Essential techniques for producing data (surveys, experiments, observational studies), analyzing data (graphical &
numerical summaries), modeling data (probability, random variables, sampling distributions), and drawing
conclusions from data (inference procedures – confidence intervals and significance tests)
Habits of mind
To become critical consumers of published statistical results by heightening their awareness of ways in which
statistics can be improperly used to mislead, confuse, or distort the truth. EVALUATION (Grading): Your grade in this course will be determined by your performance on tests, quizzes,
homework, graded assignments, projects, and a final exam.
Tests: Tests will be given following each chapter or, in some instances, following two chapters. The test format
will reflect that of the AP Statistics Exam (Multiple-Choice and Free Response).
Quizzes: There will be occasional announced and unannounced (pop) quizzes on course content.
Homework/Tasks/Practice/Review: Homework will be inspected and/or collected regularly. Text assignments
will generally examined for completion. Practice handouts, AP Practice/Review, and Case Studies will be graded.
Project: A grading rubric will be distributed with each project. Each member of a group will earn the same grade
since all are expected to do an equal amount of work.
Exams: There will be a comprehensive final exam at the end of the course.
FINAL PROJECT: Students will be required to complete a project, alone or in teams, on a topic to be determined from
a teacher-generated list. Statistical Inference will be the basis of the project. Students must collect and analyze data and
test an appropriate hypothesis. The project data analysis must include all necessary descriptive statistics (for quantitative
variables), graphical presentations, and inferential statistics. Both a written analysis and a brief oral presentation [again
using the appropriate statistical vocabulary] are required for this project. This should be the bulk of our emphasis after the
AP Exam.
GRADE DETERMINATION
Your grade in this course will be determined using the following criteria:
Informal Assessments 30%
Daily/Homework Activities 10%
Quiz/Practice/Review Activities 20%
Summative Assessments (Tests/Projects) 50%
Comprehensive Final Exam 20%
The topics in AP Statistics are divided into four major themes:
I. Exploring Data: Describing Patterns and Departure from Patterns (20 – 30% of AP Exam)
A. Constructing and interpreting graphical displays of distributions of univariate data (dotplot, stemplot, histogram,
cumulative frequency plot)
1. Center and spread
2. Clusters and gaps
3. Outliers and other unusual features
4. Shape
B. Summarizing distributions of univariate data
1. Measuring center: median, mean
2. Measuring spread: range, interquartile range, standard deviation
3. Measuring position: quartiles, percentiles, standardized scores (z-scores)
4. Using boxplots
5. The effect of changing units on summary measures
C. Comparing distributions of univariate data (dotplots, back-to-back stemplots, parallel boxplots)
1. Comparing center and spread: within group, between group variation
2. Comparing clusters and gaps
3. Comparing outliers and other unusual features
4. Comparing shapes
D. Exploring bivariate data
1. Analyzing patterns in scatter plots
2. Correlation and linearity
3. Least-squares regression line
4. Residual plots, outliers, and influential points
5. Transformations to achieve linearity: logarithmic and power transformations
E. Exploring categorical data
1. Frequency tables and bar charts
2. Marginal and joint frequencies for two-way tables
3. Conditional relative frequencies and association
4. Comparing distributions using bar charts
II. Sampling and Experimentation: Planning and Conducting a Study (10 – 15% of AP Exam)
A. Overview of methods of data collection
1. Census
2. Sample survey
3. Experiment
4. Observational study
B. Planning and conducting surveys
1. Characteristics of a well-designed and well-conducted survey
2. Populations, samples, and random samples
3. Sources of bias in sampling and surveys
4. Sampling methods, including simple random sampling, stratified random sampling, and cluster sampling
C. Planning and conducting experiments
1. Characteristics of a well-designed and well-conducted experiment
2. Treatments, control groups, experimental units, random assignments, and replication
3. Sources of bias and confounding, including placebo effect and blinding
4. Completely randomized design
5. Randomized block design, including matched pairs design
D. Generalizability of results and types of conclusions that can be drawn from observational studies, experiments, and
surveys
III. Anticipating Patterns: Exploring random phenomena using probability and simulation (20 – 30% of AP Exam)
A. Probability
1. Interpreting probability, including long-run relative frequency interpretation
2. “Law of Large Numbers” concept
3. Addition rule, multiplication rule, conditional probability, and independence
4. Discrete random variables and their probability distributions, including binomial and geometric
5. Simulation of random behavior and probability distributions
6. Mean (expected value) and standard deviation of a random variable, and linear transformations of a random
variable
B. Combining independent random variables
1. Notion of independence versus dependence
2. Mean and standard deviation for sums and differences of independent random variables
C. The normal distribution
1. Properties of the normal distribution
2. Using tables of the normal distribution
3. The normal distribution as a model for measurements
D. Sampling Distributions
1. Sampling distribution of a sample proportion
2. Sampling distribution of a sample mean
3. Central Limit Theorem
4. Sampling distribution of a difference between two independent sample proportions
5. Sampling distribution of a difference between two independent sample means
6. Simulation of sampling distributions
7. t-distributions
8. Chi-square distribution.
IV. Statistical Inference: Estimating population parameters and testing hypotheses (30 – 40% of AP Exam)
A. Estimation
1. Estimating population parameters and margin of error
2. Properties of point estimators, including unbiasedness and variability
3. Logic of confidence intervals, meaning of confidence level and confidence intervals, and properties of
confidence intervals
4. Large sample confidence interval for a proportion
5. Large sample confidence interval for a difference between proportions
6. Confidence interval for a mean
7. Confidence interval for a difference between two means (paired and unpaired) 8. Confidence interval for the slope of a least-squares regression line
B. Tests of significance
1. Logic of significance testing, null and alternate hypotheses; p-values; one- and two-sided tests; concepts of
Type I and Type II errors; concept of power
2. Large sample test for a proportion
3. Large sample test for a difference between two proportions
4. Test for a mean
5. Test for a difference between two means (paired and unpaired)
6. Chi-square test for goodness of fit, homogeneity of proportions, and independence (one- and two-way tables)
7. Test for the slope of a least-squares regression line
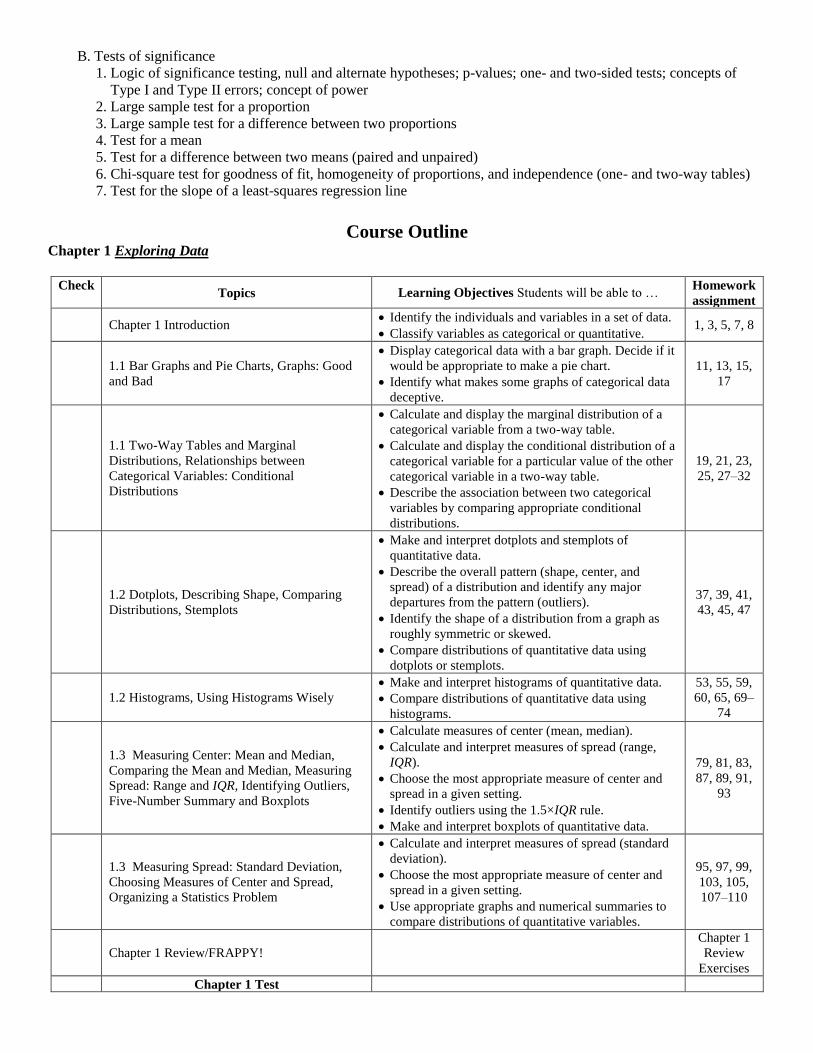
Course Outline Chapter 1 Exploring Data
Check
Topics Learning Objectives Students will be able to … Homework
assignment
Chapter 1 Introduction
Identify the individuals and variables in a set of data.
Classify variables as categorical or quantitative. 1, 3, 5, 7, 8
1.1 Bar Graphs and Pie Charts, Graphs: Good
and Bad
Display categorical data with a bar graph. Decide if it
would be appropriate to make a pie chart.
Identify what makes some graphs of categorical data
deceptive.
11, 13, 15,
17
1.1 Two-Way Tables and Marginal
Distributions, Relationships between
Categorical Variables: Conditional
Distributions
Calculate and display the marginal distribution of a
categorical variable from a two-way table.
Calculate and display the conditional distribution of a
categorical variable for a particular value of the other
categorical variable in a two-way table.
Describe the association between two categorical
variables by comparing appropriate conditional
distributions.
19, 21, 23,
25, 27–32
1.2 Dotplots, Describing Shape, Comparing
Distributions, Stemplots
Make and interpret dotplots and stemplots of
quantitative data.
Describe the overall pattern (shape, center, and
spread) of a distribution and identify any major
departures from the pattern (outliers).
Identify the shape of a distribution from a graph as
roughly symmetric or skewed.
Compare distributions of quantitative data using
dotplots or stemplots.
37, 39, 41,
43, 45, 47
1.2 Histograms, Using Histograms Wisely
Make and interpret histograms of quantitative data.
Compare distributions of quantitative data using
histograms.
53, 55, 59,
60, 65, 69–
74
1.3 Measuring Center: Mean and Median,
Comparing the Mean and Median, Measuring
Spread: Range and IQR, Identifying Outliers,
Five-Number Summary and Boxplots
Calculate measures of center (mean, median).
Calculate and interpret measures of spread (range,
IQR).
Choose the most appropriate measure of center and
spread in a given setting.
Identify outliers using the 1.5×IQR rule.
Make and interpret boxplots of quantitative data.
79, 81, 83,
87, 89, 91,
93
1.3 Measuring Spread: Standard Deviation,
Choosing Measures of Center and Spread,
Organizing a Statistics Problem
Calculate and interpret measures of spread (standard
deviation).
Choose the most appropriate measure of center and
spread in a given setting.
Use appropriate graphs and numerical summaries to
compare distributions of quantitative variables.
95, 97, 99,
103, 105,
107–110
Chapter 1 Review/FRAPPY!
Chapter 1
Review
Exercises
Chapter 1 Test
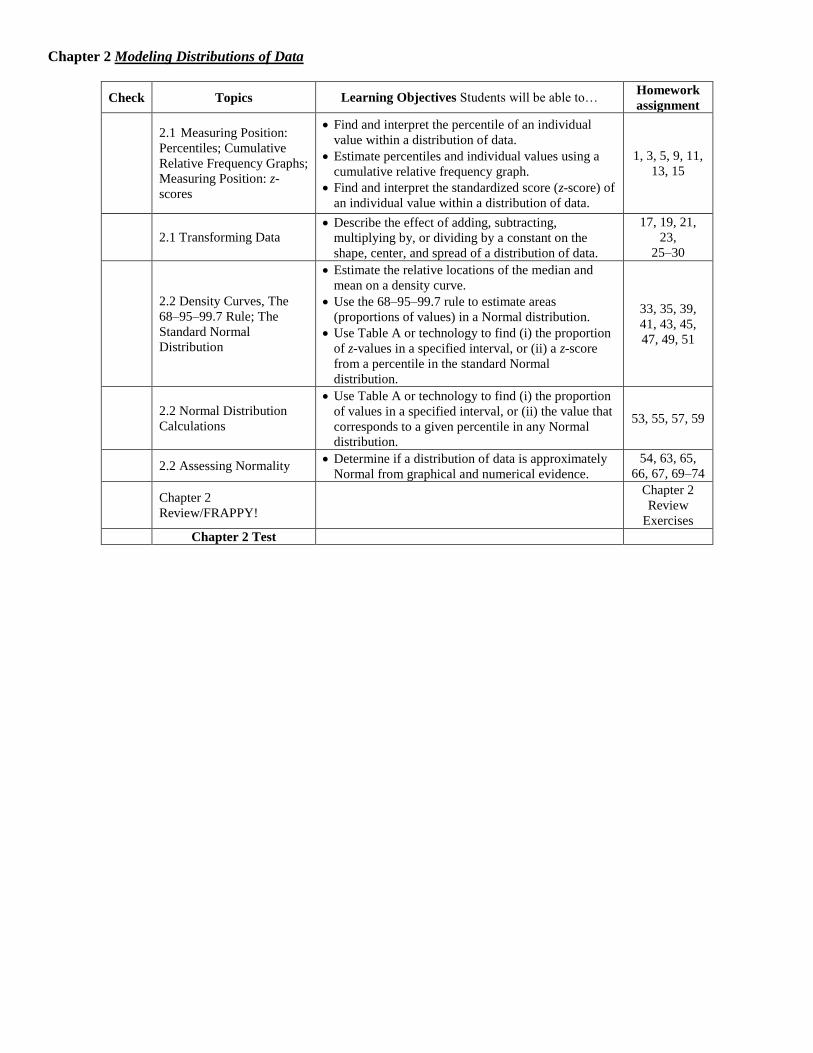
Chapter 2 Modeling Distributions of Data
Check Topics Learning Objectives Students will be able to… Homework
assignment
2.1 Measuring Position:
Percentiles; Cumulative
Relative Frequency Graphs;
Measuring Position: z-
scores
Find and interpret the percentile of an individual
value within a distribution of data.
Estimate percentiles and individual values using a
cumulative relative frequency graph.
Find and interpret the standardized score (z-score) of
an individual value within a distribution of data.
1, 3, 5, 9, 11,
13, 15
2.1 Transforming Data Describe the effect of adding, subtracting,
multiplying by, or dividing by a constant on the
shape, center, and spread of a distribution of data.
17, 19, 21,
23,
25–30
2.2 Density Curves, The
68–95–99.7 Rule; The
Standard Normal
Distribution
Estimate the relative locations of the median and
mean on a density curve.
Use the 68–95–99.7 rule to estimate areas
(proportions of values) in a Normal distribution.
Use Table A or technology to find (i) the proportion
of z-values in a specified interval, or (ii) a z-score
from a percentile in the standard Normal
distribution.
33, 35, 39,
41, 43, 45,
47, 49, 51
2.2 Normal Distribution
Calculations
Use Table A or technology to find (i) the proportion
of values in a specified interval, or (ii) the value that
corresponds to a given percentile in any Normal
distribution.
53, 55, 57, 59
2.2 Assessing Normality Determine if a distribution of data is approximately
Normal from graphical and numerical evidence.
54, 63, 65,
66, 67, 69–74
Chapter 2
Review/FRAPPY!
Chapter 2
Review
Exercises
Chapter 2 Test
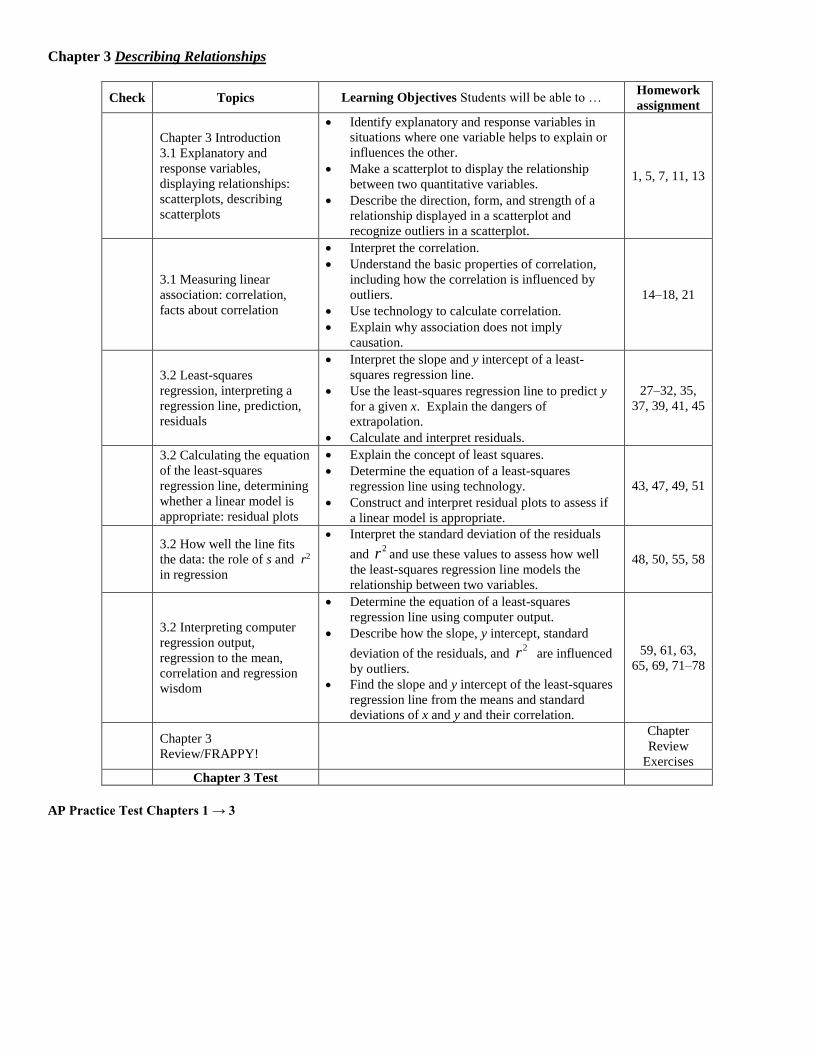
Chapter 3 Describing Relationships
Check Topics Learning Objectives Students will be able to … Homework
assignment
Chapter 3 Introduction
3.1 Explanatory and
response variables,
displaying relationships:
scatterplots, describing
scatterplots
Identify explanatory and response variables in
situations where one variable helps to explain or
influences the other.
Make a scatterplot to display the relationship
between two quantitative variables.
Describe the direction, form, and strength of a
relationship displayed in a scatterplot and
recognize outliers in a scatterplot.
1, 5, 7, 11, 13
3.1 Measuring linear
association: correlation,
facts about correlation
Interpret the correlation.
Understand the basic properties of correlation,
including how the correlation is influenced by
outliers.
Use technology to calculate correlation.
Explain why association does not imply
causation.
14–18, 21
3.2 Least-squares
regression, interpreting a
regression line, prediction,
residuals
Interpret the slope and y intercept of a least-
squares regression line.
Use the least-squares regression line to predict y
for a given x. Explain the dangers of
extrapolation.
Calculate and interpret residuals.
27–32, 35,
37, 39, 41, 45
3.2 Calculating the equation
of the least-squares
regression line, determining
whether a linear model is
appropriate: residual plots
Explain the concept of least squares.
Determine the equation of a least-squares
regression line using technology.
Construct and interpret residual plots to assess if
a linear model is appropriate.
43, 47, 49, 51
3.2 How well the line fits
the data: the role of s and r2
in regression
Interpret the standard deviation of the residuals
and 2r and use these values to assess how well
the least-squares regression line models the
relationship between two variables.
48, 50, 55, 58
3.2 Interpreting computer
regression output,
regression to the mean,
correlation and regression
wisdom
Determine the equation of a least-squares
regression line using computer output.
Describe how the slope, y intercept, standard
deviation of the residuals, and 2r are influenced
by outliers.
Find the slope and y intercept of the least-squares
regression line from the means and standard
deviations of x and y and their correlation.
59, 61, 63,
65, 69, 71–78
Chapter 3
Review/FRAPPY!
Chapter
Review
Exercises
Chapter 3 Test
AP Practice Test Chapters 1 → 3
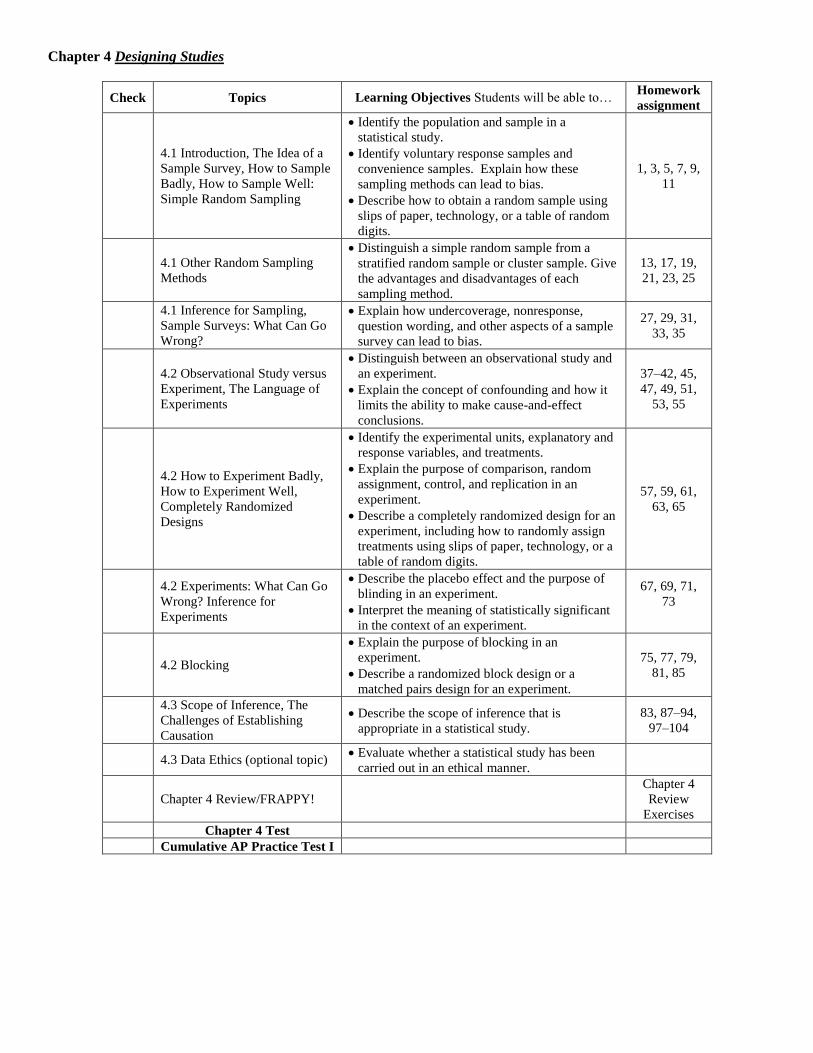
Chapter 4 Designing Studies
Check Topics Learning Objectives Students will be able to… Homework
assignment
4.1 Introduction, The Idea of a
Sample Survey, How to Sample
Badly, How to Sample Well:
Simple Random Sampling
Identify the population and sample in a
statistical study.
Identify voluntary response samples and
convenience samples. Explain how these
sampling methods can lead to bias.
Describe how to obtain a random sample using
slips of paper, technology, or a table of random
digits.
1, 3, 5, 7, 9,
11
4.1 Other Random Sampling
Methods
Distinguish a simple random sample from a
stratified random sample or cluster sample. Give
the advantages and disadvantages of each
sampling method.
13, 17, 19,
21, 23, 25
4.1 Inference for Sampling,
Sample Surveys: What Can Go
Wrong?
Explain how undercoverage, nonresponse,
question wording, and other aspects of a sample
survey can lead to bias.
27, 29, 31,
33, 35
4.2 Observational Study versus
Experiment, The Language of
Experiments
Distinguish between an observational study and
an experiment.
Explain the concept of confounding and how it
limits the ability to make cause-and-effect
conclusions.
37–42, 45,
47, 49, 51,
53, 55
4.2 How to Experiment Badly,
How to Experiment Well,
Completely Randomized
Designs
Identify the experimental units, explanatory and
response variables, and treatments.
Explain the purpose of comparison, random
assignment, control, and replication in an
experiment.
Describe a completely randomized design for an
experiment, including how to randomly assign
treatments using slips of paper, technology, or a
table of random digits.
57, 59, 61,
63, 65
4.2 Experiments: What Can Go
Wrong? Inference for
Experiments
Describe the placebo effect and the purpose of
blinding in an experiment.
Interpret the meaning of statistically significant
in the context of an experiment.
67, 69, 71,
73
4.2 Blocking
Explain the purpose of blocking in an
experiment.
Describe a randomized block design or a
matched pairs design for an experiment.
75, 77, 79,
81, 85
4.3 Scope of Inference, The
Challenges of Establishing
Causation
Describe the scope of inference that is
appropriate in a statistical study.
83, 87–94,
97–104
4.3 Data Ethics (optional topic)
Evaluate whether a statistical study has been
carried out in an ethical manner.
Chapter 4 Review/FRAPPY!
Chapter 4
Review
Exercises
Chapter 4 Test
Cumulative AP Practice Test I
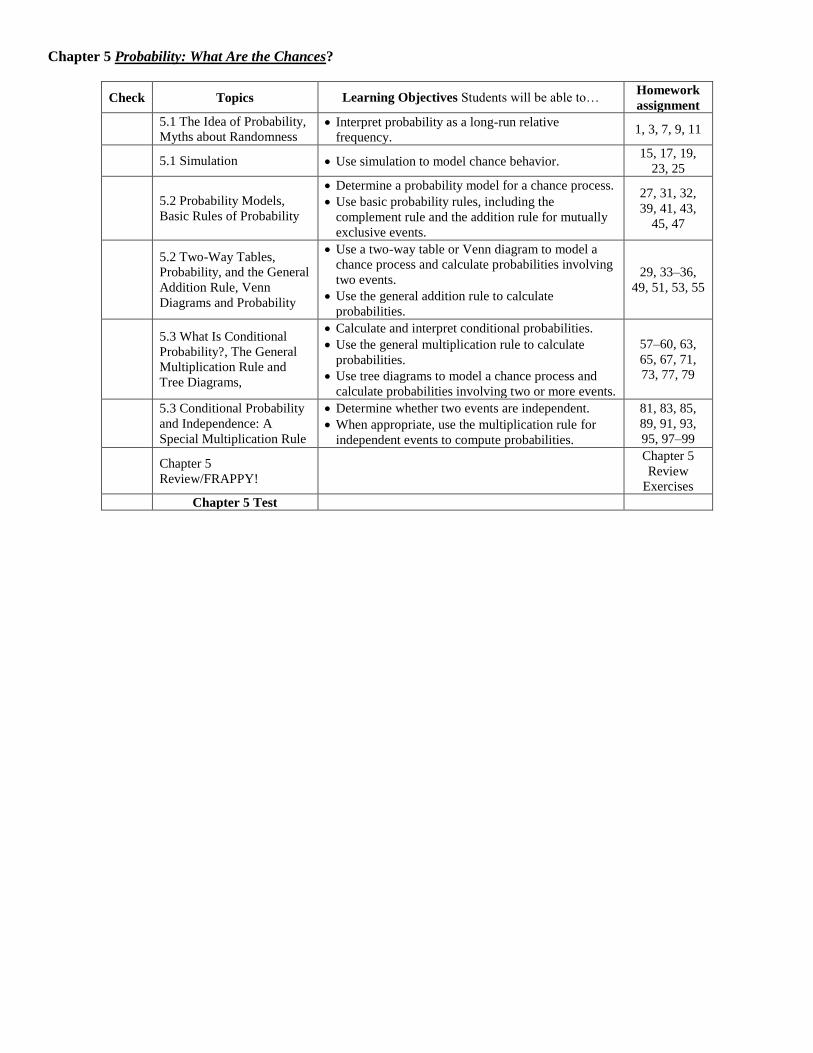
Chapter 5 Probability: What Are the Chances?
Check Topics Learning Objectives Students will be able to… Homework
assignment
5.1 The Idea of Probability,
Myths about Randomness Interpret probability as a long-run relative
frequency. 1, 3, 7, 9, 11
5.1 Simulation Use simulation to model chance behavior.
15, 17, 19,
23, 25
5.2 Probability Models,
Basic Rules of Probability
Determine a probability model for a chance process.
Use basic probability rules, including the
complement rule and the addition rule for mutually
exclusive events.
27, 31, 32,
39, 41, 43,
45, 47
5.2 Two-Way Tables,
Probability, and the General
Addition Rule, Venn
Diagrams and Probability
Use a two-way table or Venn diagram to model a
chance process and calculate probabilities involving
two events.
Use the general addition rule to calculate
probabilities.
29, 33–36,
49, 51, 53, 55
5.3 What Is Conditional
Probability?, The General
Multiplication Rule and
Tree Diagrams,
Calculate and interpret conditional probabilities.
Use the general multiplication rule to calculate
probabilities.
Use tree diagrams to model a chance process and
calculate probabilities involving two or more events.
57–60, 63,
65, 67, 71,
73, 77, 79
5.3 Conditional Probability
and Independence: A
Special Multiplication Rule
Determine whether two events are independent.
When appropriate, use the multiplication rule for
independent events to compute probabilities.
81, 83, 85,
89, 91, 93,
95, 97–99
Chapter 5
Review/FRAPPY!
Chapter 5
Review
Exercises
Chapter 5 Test
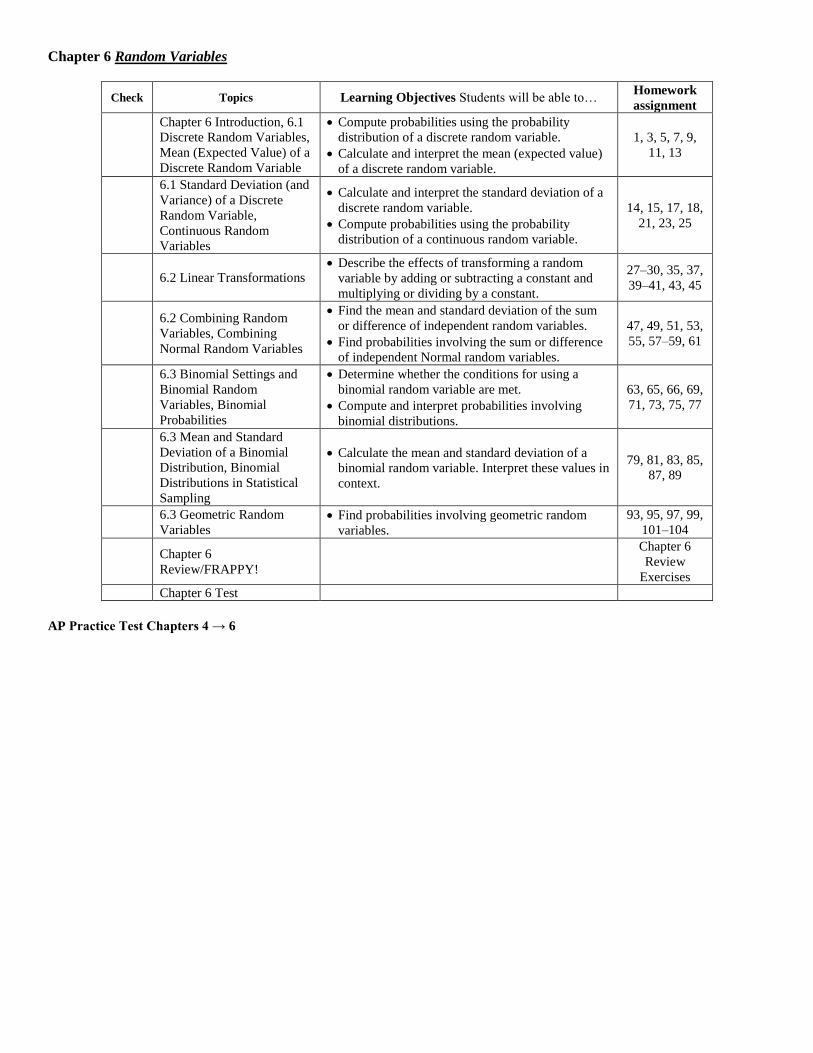
Chapter 6 Random Variables
Check Topics Learning Objectives Students will be able to… Homework
assignment
Chapter 6 Introduction, 6.1
Discrete Random Variables,
Mean (Expected Value) of a
Discrete Random Variable
Compute probabilities using the probability
distribution of a discrete random variable.
Calculate and interpret the mean (expected value)
of a discrete random variable.
1, 3, 5, 7, 9,
11, 13
6.1 Standard Deviation (and
Variance) of a Discrete
Random Variable,
Continuous Random
Variables
Calculate and interpret the standard deviation of a
discrete random variable.
Compute probabilities using the probability
distribution of a continuous random variable.
14, 15, 17, 18,
21, 23, 25
6.2 Linear Transformations Describe the effects of transforming a random
variable by adding or subtracting a constant and
multiplying or dividing by a constant.
27–30, 35, 37,
39–41, 43, 45
6.2 Combining Random
Variables, Combining
Normal Random Variables
Find the mean and standard deviation of the sum
or difference of independent random variables.
Find probabilities involving the sum or difference
of independent Normal random variables.
47, 49, 51, 53,
55, 57–59, 61
6.3 Binomial Settings and
Binomial Random
Variables, Binomial
Probabilities
Determine whether the conditions for using a
binomial random variable are met.
Compute and interpret probabilities involving
binomial distributions.
63, 65, 66, 69,
71, 73, 75, 77
6.3 Mean and Standard
Deviation of a Binomial
Distribution, Binomial
Distributions in Statistical
Sampling
Calculate the mean and standard deviation of a
binomial random variable. Interpret these values in
context.
79, 81, 83, 85,
87, 89
6.3 Geometric Random
Variables Find probabilities involving geometric random
variables.
93, 95, 97, 99,
101–104
Chapter 6
Review/FRAPPY!
Chapter 6
Review
Exercises
Chapter 6 Test
AP Practice Test Chapters 4 → 6
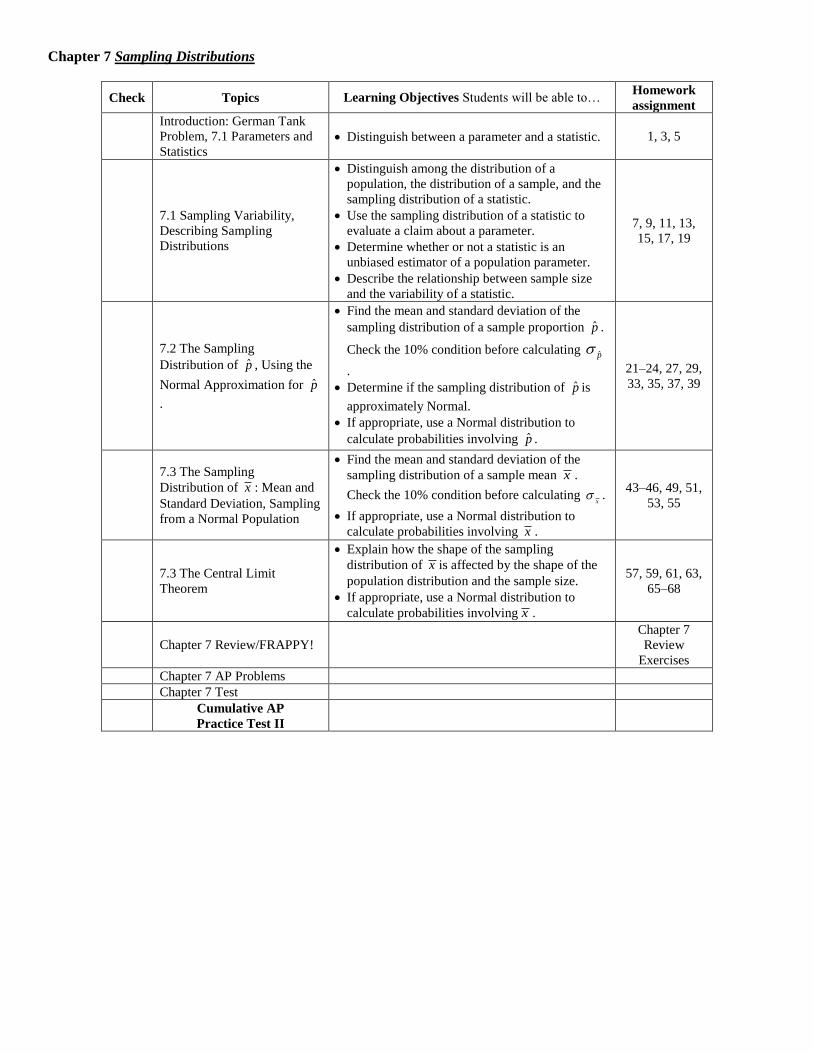
Chapter 7 Sampling Distributions
Check Topics Learning Objectives Students will be able to… Homework
assignment
Introduction: German Tank
Problem, 7.1 Parameters and
Statistics Distinguish between a parameter and a statistic. 1, 3, 5
7.1 Sampling Variability,
Describing Sampling
Distributions
Distinguish among the distribution of a
population, the distribution of a sample, and the
sampling distribution of a statistic.
Use the sampling distribution of a statistic to
evaluate a claim about a parameter.
Determine whether or not a statistic is an
unbiased estimator of a population parameter.
Describe the relationship between sample size
and the variability of a statistic.
7, 9, 11, 13,
15, 17, 19
7.2 The Sampling
Distribution of p̂ , Using the
Normal Approximation for p̂
.
Find the mean and standard deviation of the
sampling distribution of a sample proportion p̂ .
Check the 10% condition before calculating p̂
.
Determine if the sampling distribution of p̂ is
approximately Normal.
If appropriate, use a Normal distribution to
calculate probabilities involving p̂ .
21–24, 27, 29,
33, 35, 37, 39
7.3 The Sampling
Distribution of x : Mean and
Standard Deviation, Sampling
from a Normal Population
Find the mean and standard deviation of the
sampling distribution of a sample mean x .
Check the 10% condition before calculating x
.
If appropriate, use a Normal distribution to
calculate probabilities involving x .
43–46, 49, 51,
53, 55
7.3 The Central Limit
Theorem
Explain how the shape of the sampling
distribution of x is affected by the shape of the
population distribution and the sample size.
If appropriate, use a Normal distribution to
calculate probabilities involving x .
57, 59, 61, 63,
65–68
Chapter 7 Review/FRAPPY!
Chapter 7
Review
Exercises
Chapter 7 AP Problems
Chapter 7 Test
Cumulative AP
Practice Test II
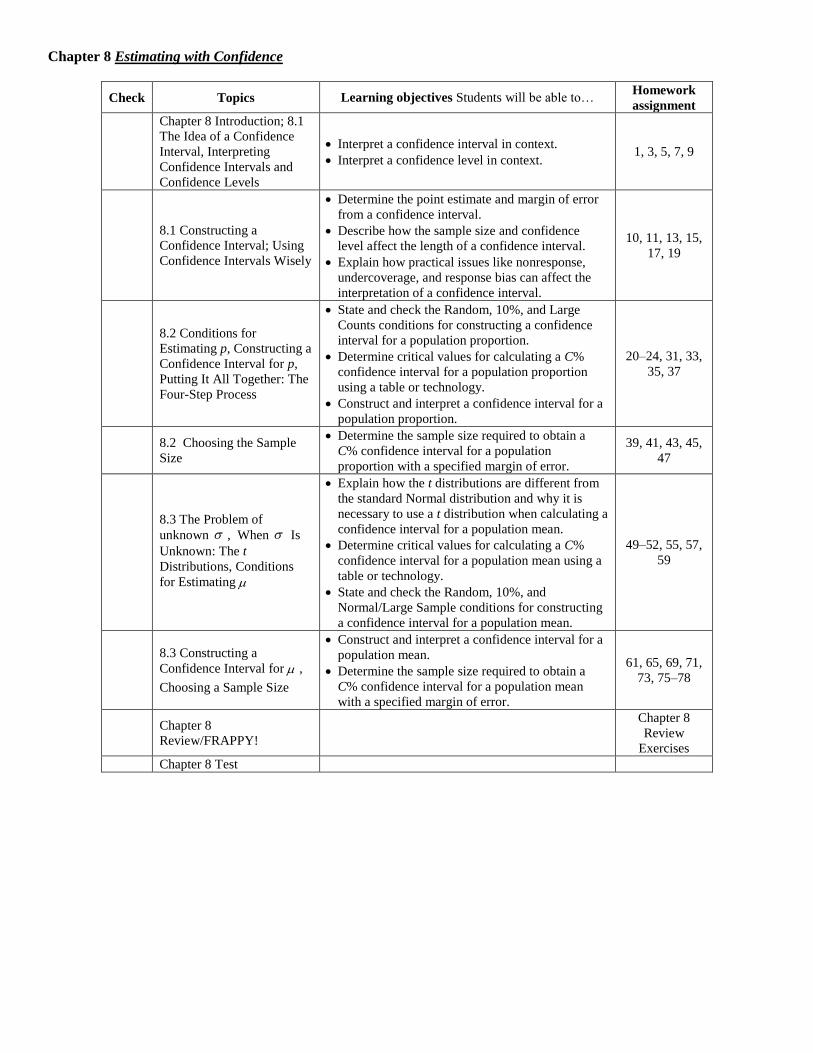
Chapter 8 Estimating with Confidence
Check Topics Learning objectives Students will be able to… Homework
assignment
Chapter 8 Introduction; 8.1
The Idea of a Confidence
Interval, Interpreting
Confidence Intervals and
Confidence Levels
Interpret a confidence interval in context.
Interpret a confidence level in context. 1, 3, 5, 7, 9
8.1 Constructing a
Confidence Interval; Using
Confidence Intervals Wisely
Determine the point estimate and margin of error
from a confidence interval.
Describe how the sample size and confidence
level affect the length of a confidence interval.
Explain how practical issues like nonresponse,
undercoverage, and response bias can affect the
interpretation of a confidence interval.
10, 11, 13, 15,
17, 19
8.2 Conditions for
Estimating p, Constructing a
Confidence Interval for p,
Putting It All Together: The
Four-Step Process
State and check the Random, 10%, and Large
Counts conditions for constructing a confidence
interval for a population proportion.
Determine critical values for calculating a C%
confidence interval for a population proportion
using a table or technology.
Construct and interpret a confidence interval for a
population proportion.
20–24, 31, 33,
35, 37
8.2 Choosing the Sample
Size
Determine the sample size required to obtain a
C% confidence interval for a population
proportion with a specified margin of error.
39, 41, 43, 45,
47
8.3 The Problem of
unknown , When Is
Unknown: The t
Distributions, Conditions
for Estimating
Explain how the t distributions are different from
the standard Normal distribution and why it is
necessary to use a t distribution when calculating a
confidence interval for a population mean.
Determine critical values for calculating a C%
confidence interval for a population mean using a
table or technology.
State and check the Random, 10%, and
Normal/Large Sample conditions for constructing
a confidence interval for a population mean.
49–52, 55, 57,
59
8.3 Constructing a
Confidence Interval for ,
Choosing a Sample Size
Construct and interpret a confidence interval for a
population mean.
Determine the sample size required to obtain a
C% confidence interval for a population mean
with a specified margin of error.
61, 65, 69, 71,
73, 75–78
Chapter 8
Review/FRAPPY!
Chapter 8
Review
Exercises
Chapter 8 Test
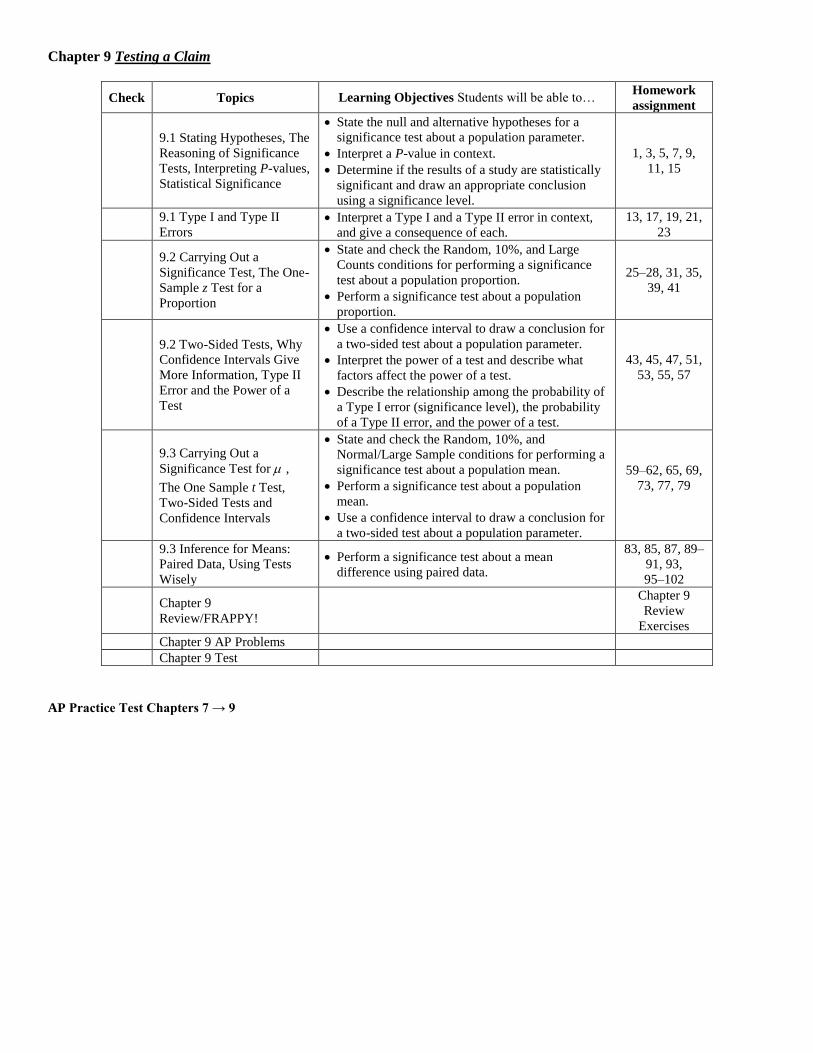
Chapter 9 Testing a Claim
Check Topics Learning Objectives Students will be able to… Homework
assignment
9.1 Stating Hypotheses, The
Reasoning of Significance
Tests, Interpreting P-values,
Statistical Significance
State the null and alternative hypotheses for a
significance test about a population parameter.
Interpret a P-value in context.
Determine if the results of a study are statistically
significant and draw an appropriate conclusion
using a significance level.
1, 3, 5, 7, 9,
11, 15
9.1 Type I and Type II
Errors Interpret a Type I and a Type II error in context,
and give a consequence of each.
13, 17, 19, 21,
23
9.2 Carrying Out a
Significance Test, The One-
Sample z Test for a
Proportion
State and check the Random, 10%, and Large
Counts conditions for performing a significance
test about a population proportion.
Perform a significance test about a population
proportion.
25–28, 31, 35,
39, 41
9.2 Two-Sided Tests, Why
Confidence Intervals Give
More Information, Type II
Error and the Power of a
Test
Use a confidence interval to draw a conclusion for
a two-sided test about a population parameter.
Interpret the power of a test and describe what
factors affect the power of a test.
Describe the relationship among the probability of
a Type I error (significance level), the probability
of a Type II error, and the power of a test.
43, 45, 47, 51,
53, 55, 57
9.3 Carrying Out a
Significance Test for ,
The One Sample t Test,
Two-Sided Tests and
Confidence Intervals
State and check the Random, 10%, and
Normal/Large Sample conditions for performing a
significance test about a population mean.
Perform a significance test about a population
mean.
Use a confidence interval to draw a conclusion for
a two-sided test about a population parameter.
59–62, 65, 69,
73, 77, 79
9.3 Inference for Means:
Paired Data, Using Tests
Wisely
Perform a significance test about a mean
difference using paired data.
83, 85, 87, 89–
91, 93,
95–102
Chapter 9
Review/FRAPPY!
Chapter 9
Review
Exercises
Chapter 9 AP Problems
Chapter 9 Test
AP Practice Test Chapters 7 → 9
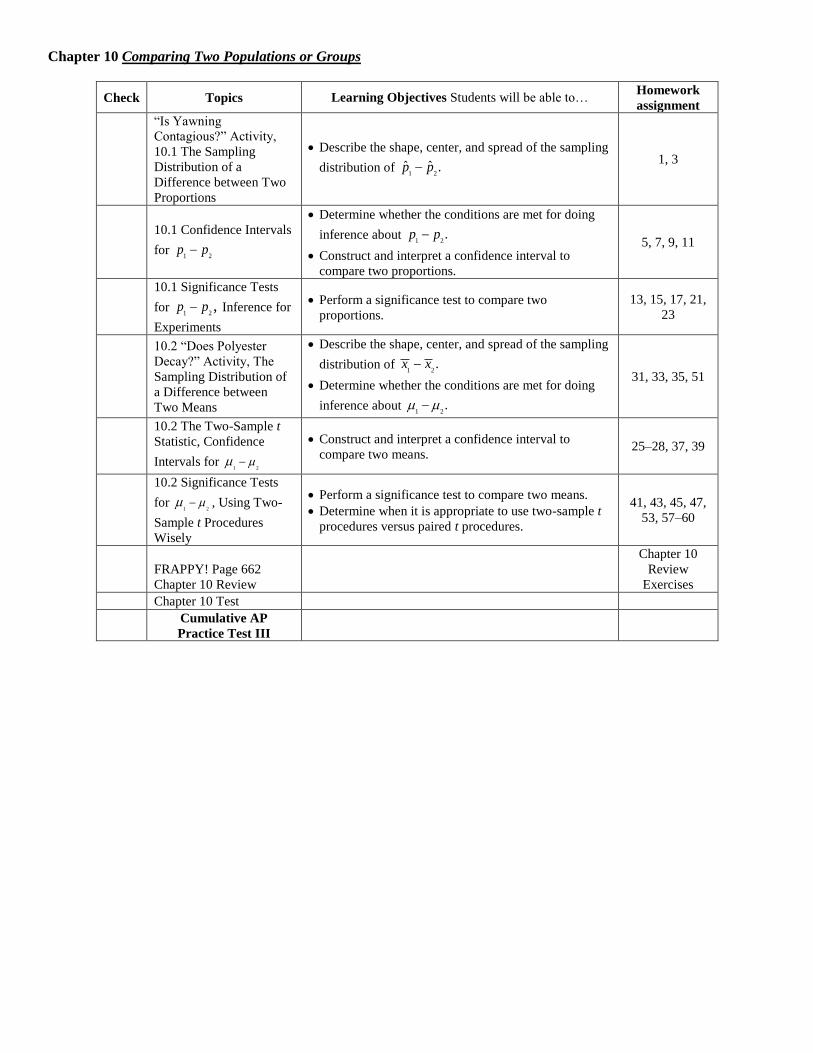
Chapter 10 Comparing Two Populations or Groups
Check Topics Learning Objectives Students will be able to… Homework
assignment
“Is Yawning
Contagious?” Activity,
10.1 The Sampling
Distribution of a
Difference between Two
Proportions
Describe the shape, center, and spread of the sampling
distribution of 1 2
ˆ ˆ .p p 1, 3
10.1 Confidence Intervals
for 1 2
p p
Determine whether the conditions are met for doing
inference about 1 2
.p p
Construct and interpret a confidence interval to
compare two proportions.
5, 7, 9, 11
10.1 Significance Tests
for 1 2
,p p Inference for
Experiments
Perform a significance test to compare two
proportions.
13, 15, 17, 21,
23
10.2 “Does Polyester
Decay?” Activity, The
Sampling Distribution of
a Difference between
Two Means
Describe the shape, center, and spread of the sampling
distribution of 1 2
.x x
Determine whether the conditions are met for doing
inference about 1 2
.
31, 33, 35, 51
10.2 The Two-Sample t
Statistic, Confidence
Intervals for 1 2
Construct and interpret a confidence interval to
compare two means. 25–28, 37, 39
10.2 Significance Tests
for 1 2
, Using Two-
Sample t Procedures
Wisely
Perform a significance test to compare two means.
Determine when it is appropriate to use two-sample t
procedures versus paired t procedures.
41, 43, 45, 47,
53, 57–60
FRAPPY! Page 662
Chapter 10 Review
Chapter 10
Review
Exercises
Chapter 10 Test
Cumulative AP
Practice Test III
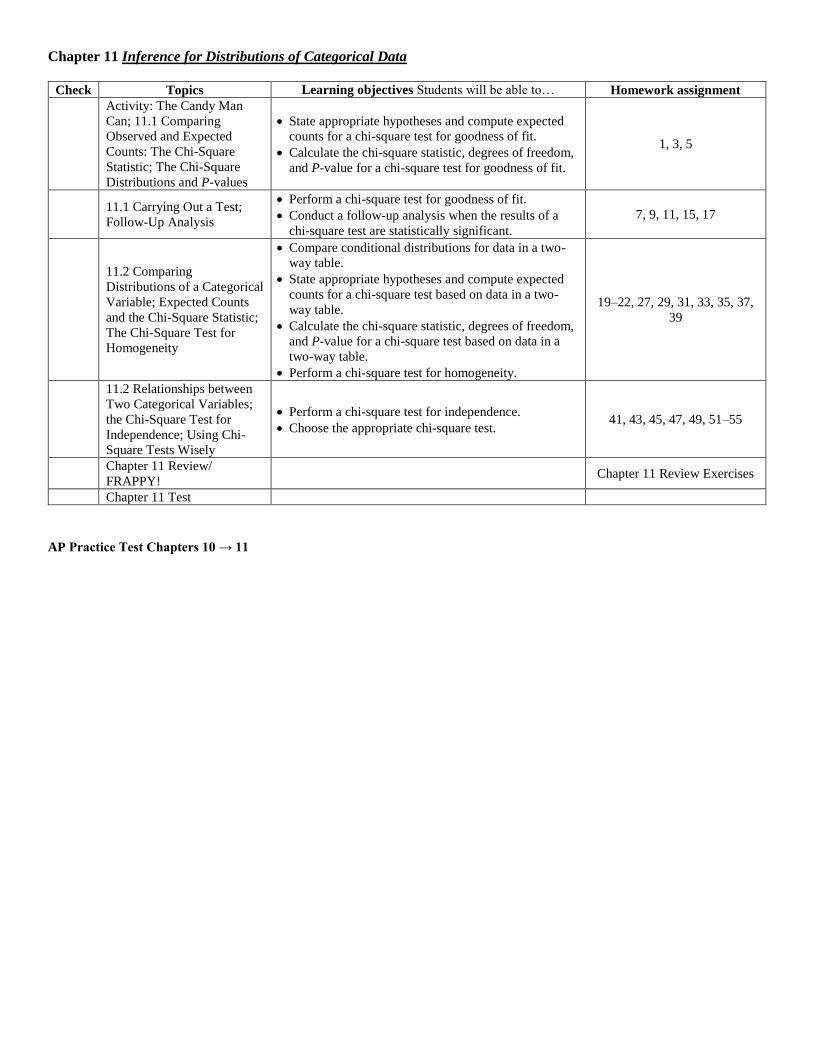
Chapter 11 Inference for Distributions of Categorical Data
Check Topics Learning objectives Students will be able to… Homework assignment
Activity: The Candy Man
Can; 11.1 Comparing
Observed and Expected
Counts: The Chi-Square
Statistic; The Chi-Square
Distributions and P-values
State appropriate hypotheses and compute expected
counts for a chi-square test for goodness of fit.
Calculate the chi-square statistic, degrees of freedom,
and P-value for a chi-square test for goodness of fit.
1, 3, 5
11.1 Carrying Out a Test;
Follow-Up Analysis
Perform a chi-square test for goodness of fit.
Conduct a follow-up analysis when the results of a
chi-square test are statistically significant.
7, 9, 11, 15, 17
11.2 Comparing
Distributions of a Categorical
Variable; Expected Counts
and the Chi-Square Statistic;
The Chi-Square Test for
Homogeneity
Compare conditional distributions for data in a two-
way table.
State appropriate hypotheses and compute expected
counts for a chi-square test based on data in a two-
way table.
Calculate the chi-square statistic, degrees of freedom,
and P-value for a chi-square test based on data in a
two-way table.
Perform a chi-square test for homogeneity.
19–22, 27, 29, 31, 33, 35, 37,
39
11.2 Relationships between
Two Categorical Variables;
the Chi-Square Test for
Independence; Using Chi-
Square Tests Wisely
Perform a chi-square test for independence.
Choose the appropriate chi-square test. 41, 43, 45, 47, 49, 51–55
Chapter 11 Review/
FRAPPY! Chapter 11 Review Exercises
Chapter 11 Test
AP Practice Test Chapters 10 → 11
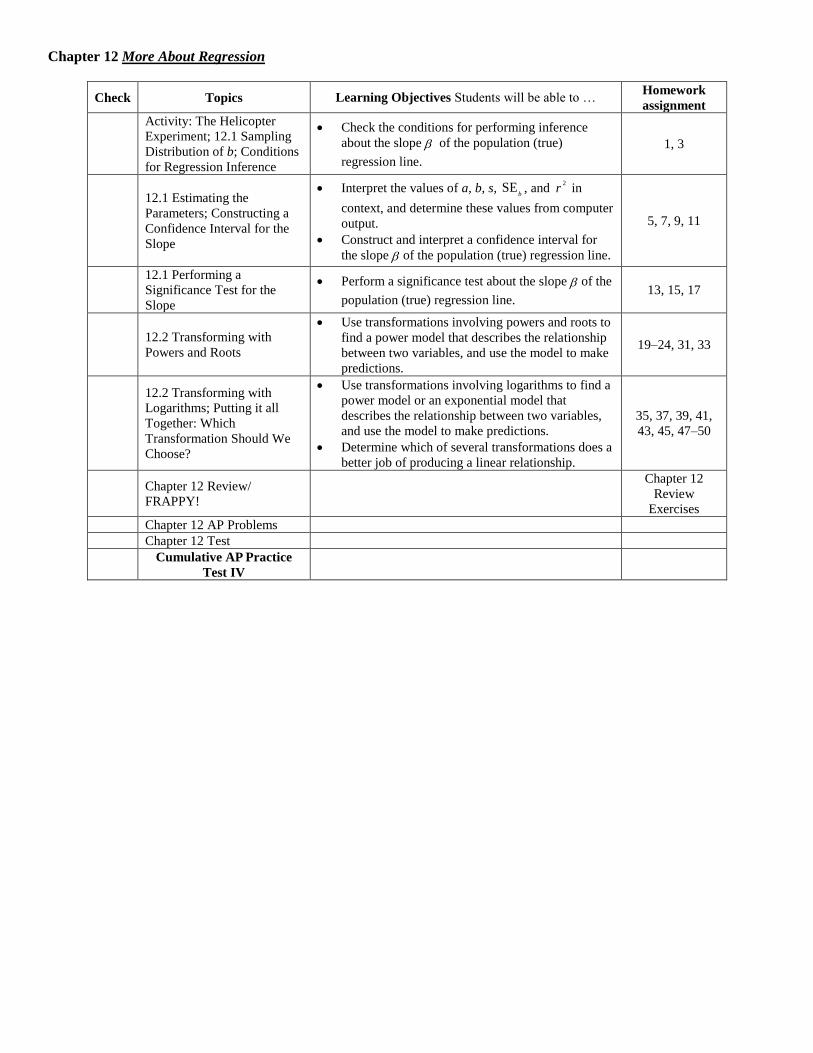
Chapter 12 More About Regression
Check Topics Learning Objectives Students will be able to … Homework
assignment
Activity: The Helicopter
Experiment; 12.1 Sampling
Distribution of b; Conditions
for Regression Inference
Check the conditions for performing inference
about the slope of the population (true)
regression line.
1, 3
12.1 Estimating the
Parameters; Constructing a
Confidence Interval for the
Slope
Interpret the values of a, b, s, SEb, and
2r in
context, and determine these values from computer
output.
Construct and interpret a confidence interval for
the slope of the population (true) regression line.
5, 7, 9, 11
12.1 Performing a
Significance Test for the
Slope
Perform a significance test about the slope of the
population (true) regression line. 13, 15, 17
12.2 Transforming with
Powers and Roots
Use transformations involving powers and roots to
find a power model that describes the relationship
between two variables, and use the model to make
predictions.
19–24, 31, 33
12.2 Transforming with
Logarithms; Putting it all
Together: Which
Transformation Should We
Choose?
Use transformations involving logarithms to find a
power model or an exponential model that
describes the relationship between two variables,
and use the model to make predictions.
Determine which of several transformations does a
better job of producing a linear relationship.
35, 37, 39, 41,
43, 45, 47–50
Chapter 12 Review/
FRAPPY!
Chapter 12
Review
Exercises
Chapter 12 AP Problems
Chapter 12 Test
Cumulative AP Practice
Test IV


![AP Statistics Syllabus · 2011. 9. 11. · AP Statistics Second Semester Example Project UC2a,b,c,dJ] [[C311[[C411([C511 Activity: "SAT Performance" In these task students will investigate](https://img.pdfslide.net/doc/110x75/60ecbc4b3b52c95407065849/ap-statistics-syllabus-2011-9-11-ap-statistics-second-semester-example-project.jpg)