Embed Size (px)
Citation preview

Agenda1. AP Stats Exam Overview
2. AP FRQ Scoring & FRQ: 2016 #1
3. Distributions Review
4. FRQ: 2015 #6
5. Distribution Mash-Up
6. FRQ:

AP Stats Exam

Exam Format
• Two 90 minute sections
• Reference Sheet and Calculator!
• First section: 40 multiple choice questions
• Second section: 6 free response questions (FRQs)
– First 5 FRQs = 12 minutes each
– FRQ # 6 : Investigative task for 30 minutes

Scoring
• Exam is scored out of 100 points.
• Each MC is worth 1.25 points
• Each FRQ (#1-5) is worth 7.5 points
• FRQ #6 is worth 15 points

What’s on the Exam?Exploring Data (20-30%): Describing patterns and departures from patterns (CH. 1-3)
Sampling and Experimentation (10-15%): Planning and conducting a study (CH. 4)
Anticipating Patterns (20-30%): Exploring random phenomena using probability and simulation (CH. 5-7)
Statistical Inference (30-40%): Estimating population parameters and testing hypotheses (CH 8-12)

FRQ Scoring
• Each question is scored from 1 to 4.
• The raw score is then multiplied by 1.875 to determined the scaled score.
• The numerical score is derived from a series of:
– Essentially Correct
– Partially Correct
– Incorrect
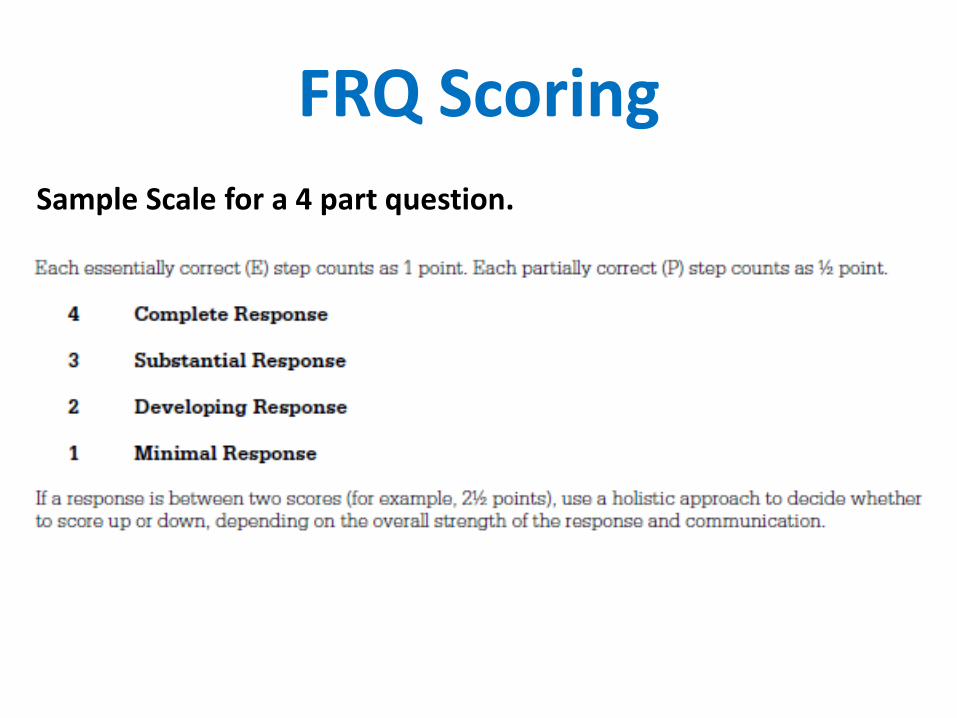
FRQ Scoring
Sample Scale for a 4 part question.

FRQ Scoring

AP Stats 2016 Scores

Thursday, May 11, 2017
NOON

FRQ: 2016 #1You have 12 minutes. Go!!!

SolutionPart a:The distribution of Robin’s tip amounts is skewed to the right. There is a gap between the largest tip amount (between $20 to 22.50) and the second largest tip amount (between $12.50 and $15 interval). The largest tip amount appears to be an outlier. The median tip amount is between $2.50 and $5. Robin’s tip amounts vary from a minimum of $0 to $2.50 to a maximum of between $20 and $22.50. About 78% of tip amounts are between $0 and $5.

Scoring

Solution
Part b:
If the $8 tip had really been $18, the total would increase by $10. Then, we would divide by 60, so the increase to the mean would be about 17 cents.
The median would not change, since both $8 and $18 are greater than the current median.

Scoring

Scoring Guidelines


Distributions
• Normal
• Binomial
• Geometric
• Sampling

Normal Distributions• All Normal curves are symmetric, single-peaked, and bell-
shaped
• A Specific Normal curve is described by giving its mean µand standard deviation σ.
Two Normal curves, showing the mean µ and
standard deviation σ.

Normal Distributions
• We abbreviate the Normal distribution with mean µ and standard deviation σ as N(µ,σ).
• Any particular Normal distribution is completely specified by two numbers: its mean µ and standard deviation σ.
• The mean of a Normal distribution is the center of the symmetric Normal curve.
• The standard deviation is the distance from the center to the change-of-curvature points on either side.

Although there are many different sizes and shapes of Normal curves, they all have properties in common.
The 68-95-99.7 Rule
The 68-95-99.7 Rule (“The Empirical Rule”)
In the Normal distribution with mean µ and standard deviation σ:
•Approximately 68% of the observations fall within σ of µ.
•Approximately 95% of the observations fall within 2σ of µ.
•Approximately 99.7% of the observations fall within 3σ of µ.


Binomial v. Geometric
• The primary difference between a binomial random variable and a geometric random variable is what you are counting.
• A binomial random variable counts the number of "successes" in n trials.
• A geometric random variable counts the number of trials up to and including the first "success."

Binomial vs. Geometric
The Binomial Setting The Geometric Setting
1. Each observation falls intoone of two categories.
2. The probability of successis the same for each observation.
3. The observations are allindependent.
4. There is a fixed number nof observations.
4. The variable of interest is the number of trials required to obtain the 1st
success.
1. Each observation falls intoone of two categories.
2. The probability of successis the same for each observation.
3. The observations are allindependent.

FRQ Answers Must Include:1. Name of distribution
Geometric, Binomial2. Parameters
Binomial: X (define variable), n & pGeometric: X (define variable), p
3. Probability StatementEx: P (X = 7) or P (X ≥ 3)
4. Calculation and p-valueCalculator notation is okay, but needs to be labeled.
5. Solution interpreted in context.

Twenty-five percent of the customers entering a grocery store between 5 p.m. and 7 p.m. use an express checkout. Consider five randomly selected customers, and let X denote the number among the five who use the express checkout. What is the probability that two customers used the express check out?
Let’s Practice…
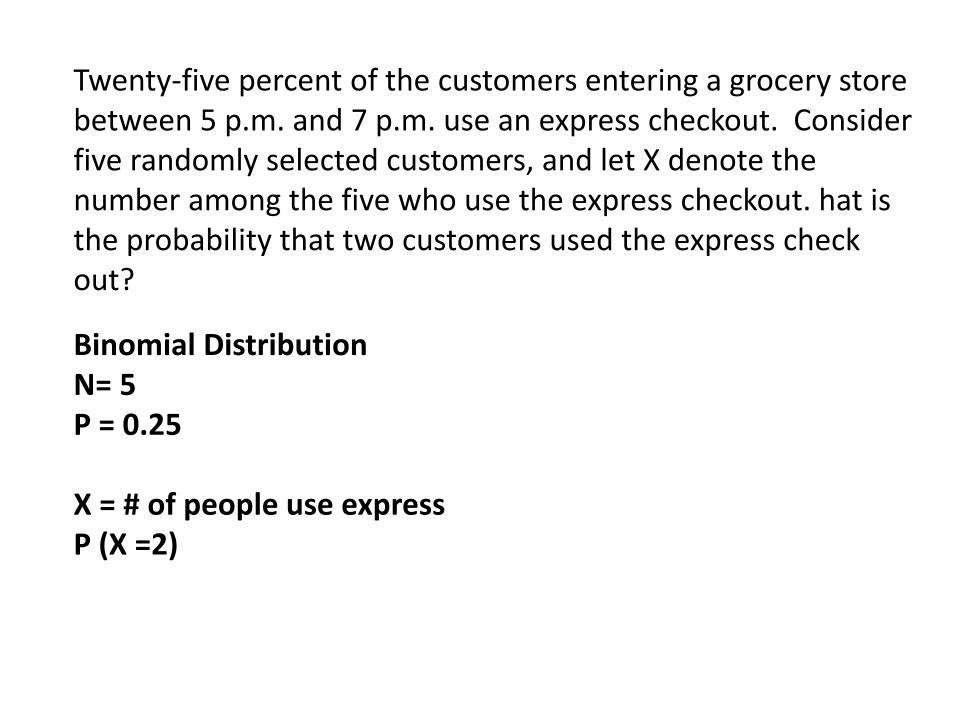
Twenty-five percent of the customers entering a grocery store between 5 p.m. and 7 p.m. use an express checkout. Consider five randomly selected customers, and let X denote the number among the five who use the express checkout. hat is the probability that two customers used the express check out?
Binomial DistributionN= 5P = 0.25
X = # of people use expressP (X =2)

Twenty-five percent of the customers entering a grocery store between 5 p.m. and 7 p.m. use an express checkout. Consider five randomly selected customers, and let X denote the number among the five who use the express checkout. What is the probability that two customers used the express check out?
binompdf(5, 0.25, 2) = .26375= number of customers0.25= probability of success2= number of successes desired
There is a 26.37% chance that exactly 2 customers will use the express checkout lane between 5pm and 7pm.

Sampling Distribution
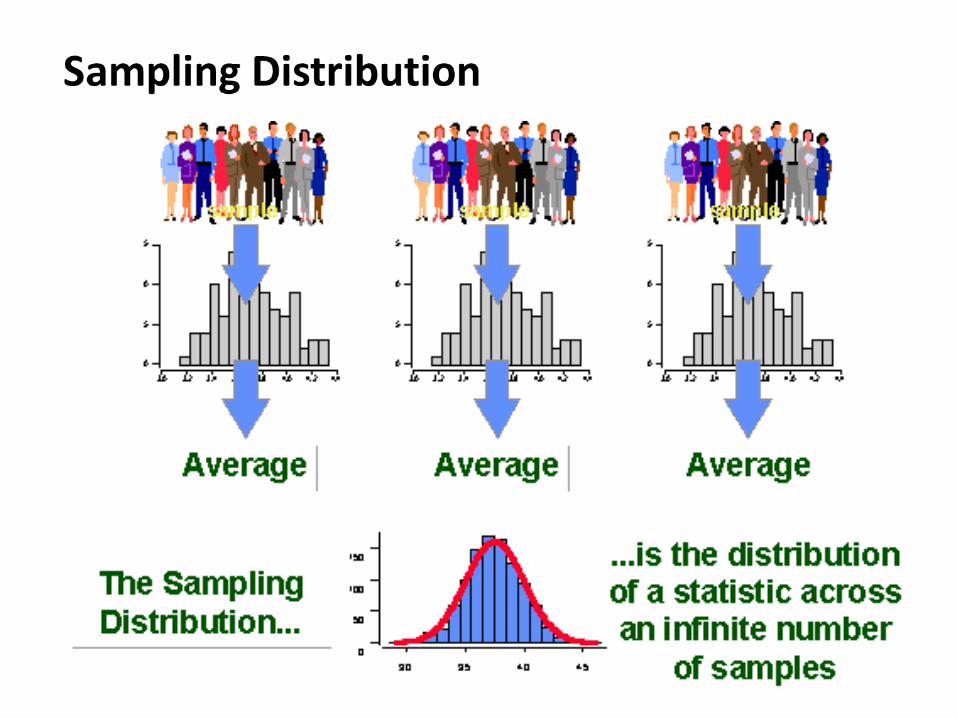

Population Distributions vs. Sampling Distributions
There are actually three distinct distributions involved when we sample repeatedly and measure a variable of interest.
1) The population distribution gives the values of the variable for all the individuals in the population.
2) The distribution of sample data shows the values of the variable for all the individuals in the sample.
3) The sampling distribution shows the statistic values from all the possible samples of the same size from the population.

Sample Proportion Formulas
n
ppp
)1(ˆ
The sample size MUST be less than 10% of the total population.

Sample Means Formulas
Notes: The sample size must be less than 10% of the population to satisfy the independence condition. The mean and standard deviation of the sample mean are true no matter the same of the population distribution.
x

Sample Distributions & Normality:

Sample Distributions & Normality:

Sample Distributions & Normality:
HOW LARGE IS LARGE ENOUGH?
If the Population shape is….
Minimum Sample Size to assume Normal
Normal 0
Slightly Skewed 15
Heavily Skewed 30
Unknown 30

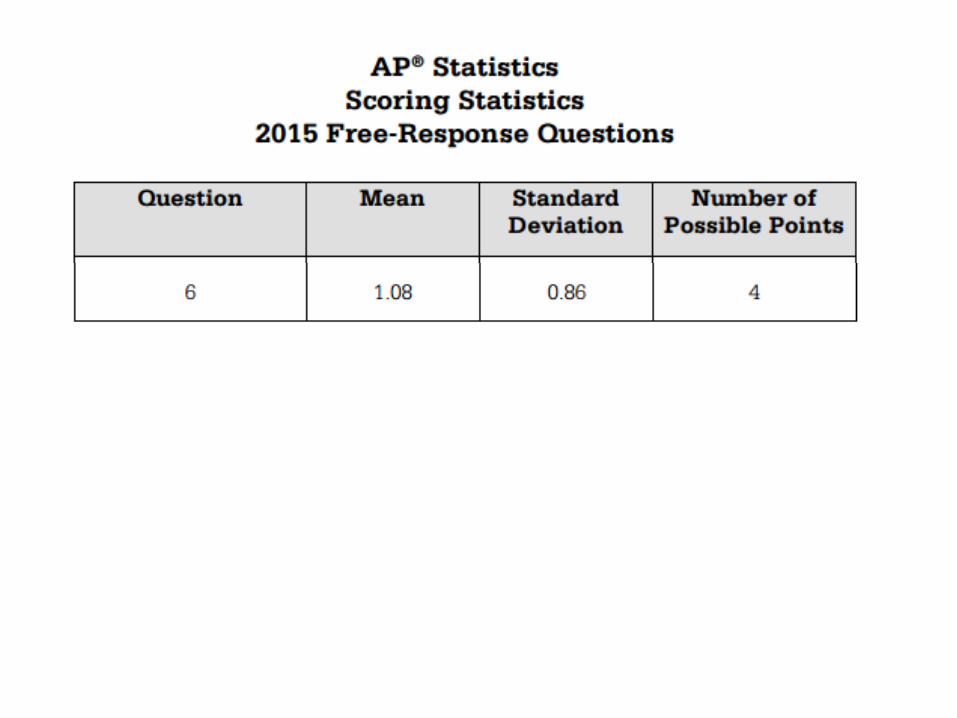
FRQ: 2015 #6You have 22 minutes. Go!!!

Scoring Rubric

Scoring Rubric

Scoring Rubric
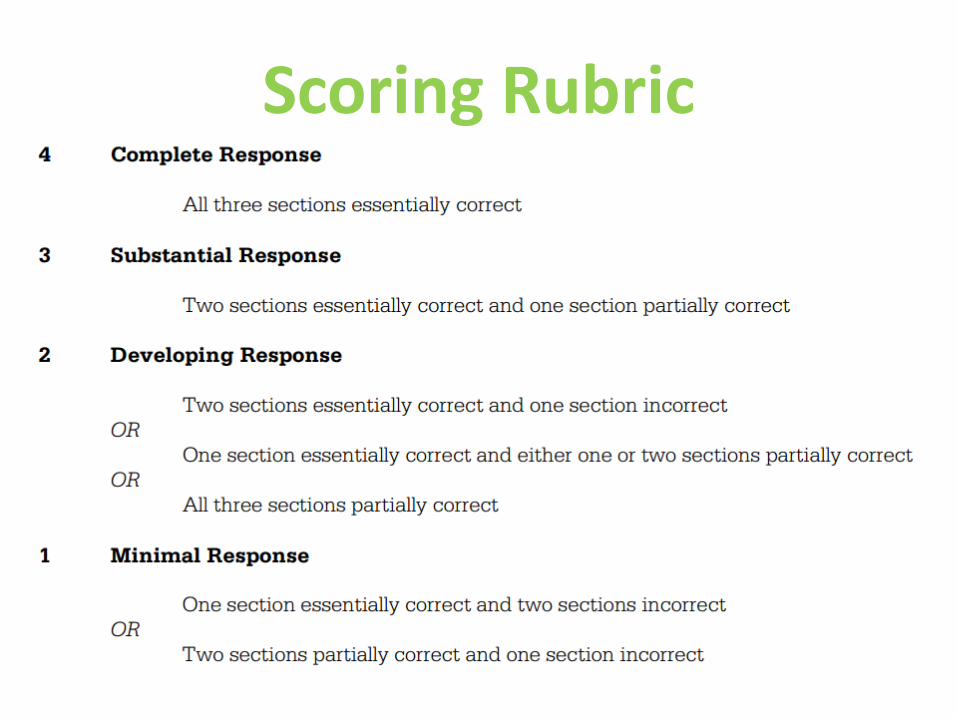
Scoring Rubric

Distributions Mash Up

SKIP: Distributions Mash Up
2B.
3B (bonus!!)
6 A

Distributions Mash Up
1. a. 0.019
2. a. normalcdf ( 140, inf, 120, 10.5) = 0.0287
c. binompdf (3, .5, 0) = 0.064
3. a. normpdf (850, inf, 840, 7.9) = 0.064
4. a. $0.70
b. 715 plays
c. Normcdf ( 500, inf, 700, 92.79) = 0.9844

Distributions Mash Up
5. a. geometcdf (.1, 4, 100) = 0.729
b. binompdf (20, .1, 2) = 0.285
c. binomcdf (104, .1, 21) = 0.001368
6. b. normcdf (4, inf, 3.9, 1.1
40) = 0.282659
OR normcdf (160, inf, 156, 6.987)
7. a. 5 questions
b. 18 + .2(7) - .8(7)(.25)
c. binomcdf (7, 0.2, 3, 7) = 0.148

FRQ: 2011 #6You have 25 minutes. Go!!!