Embed Size (px)
Citation preview

International Scholarly Research NetworkISRN Renewable EnergyVolume 2012, Article ID 489379, 7 pagesdoi:10.5402/2012/489379
Research Article
A Permanent Magnet Generator for Energy Conversion fromMarine Currents: No Load and Load Experiments
Karin Thomas, Marten Grabbe, Katarina Yuen, and Mats Leijon
The Swedish Centre for Renewable Electric Energy Conversion and Department of Engineering Sciences, Uppsala University,P.O. Box 534, 751 21 Uppsala, Sweden
Correspondence should be addressed to Karin Thomas, [email protected]
Received 4 April 2012; Accepted 3 May 2012
Academic Editors: S. Li, Y.-C. Lin, Z. Oktay, and S. Santoso
Copyright © 2012 Karin Thomas et al. This is an open access article distributed under the Creative Commons Attribution License,which permits unrestricted use, distribution, and reproduction in any medium, provided the original work is properly cited.
This paper presents experiments and measurements on a low speed permanent magnet cable wound generator for marine currentenergy conversion. Measurements were made for no load and nominal load (4.44Ω/phase) conditions at nominal speed (10 rpm).For either load condition, the magnetic fields in the air gap were also measured. The measurements on the generator werecompared with the corresponding finite element method simulations used to design the machine. It is shown in the paper thatmeasurements and corresponding case simulations show good agreement. At nominal speed, the measured and simulated loadvoltages (nominal load) differ less than 1% for the rms values and less than 5% for peak values. At no load, measured and simulatedvoltages had larger differences, that is, <9% for rms values and <5% for peak values. Harmonic analyses of measured and simulatedphase voltages and currents show only the presence of third harmonics. The percentage of harmonics in the measured data wascomparable with the corresponding predictions of the simulations. The discussions and results presented in the paper could bebeneficial for future design of efficient and reliable marine current energy converter systems.
1. Introduction
For energy resources such as wind, wave, and tidal power, itmay be beneficial to adapt the generators to the nature of theresource. For wind and wave power, several generator designshave been presented by both industry and academia [1–9].So far, published material concerning generators designedspecifically to match the tidal current regime have been lessabundant. However, in recent years interesting generatortopologies suited for marine current turbines have beensuggested in literature, for example [9–12]. Authors of thispaper have previously discussed the advantages of having avariable speed permanent magnet (PM) direct drive gener-ator for extracting energy from tidal and marine currentsand presented simulations, for example [13]. Some of themain design objectives were to achieve a high efficiency atlow speeds to exclude the use of a gearbox, and to maintain alow load angle to allow for electrical control and breaking ofthe turbine at high flow velocities.
To study the electrical performance of such a low speedmachine, a prototype generator with nominal ratings 5 kW,
150 V, 10 rpm, and 10 Hz was designed and constructedfor laboratory tests, see Figure 1 and Table 1. A thoroughpresentation of the electrical and mechanical design of thegenerator can be found in [14]. The experimental resultspresented here validate the simulations previously presentedin [13, 14]. The generator is designed for a system with avertical axis turbine with fixed blade pitch and a directlydriven generator [15]. This requires a generator that can beefficiently operated at different speeds and loads.
In this paper, results from no load and nominal loadoperation are presented. Voltages and currents are measured,as well the magnetic field in the air gap. These measurementsform a reference for comparisons with the correspondingfinite element method (FEM) simulations used for the initialdesign of the generator [14]. Simulations of the generatorperformance at variable speed operation are also presentedto highlight its ability to electrically control and brake theturbine at high flow velocities that can occur in rivers or tidalcurrents. Such electrical power control is intended to replacemechanical systems for power control, such as blade pitchmechanisms and mechanical brakes.

2 ISRN Renewable Energy
Figure 1: The 5 kW experimental generator.
Table 1: Generator design parameters.
Parameter Value
Power 5 kW
Line voltage 150 V
Nominal speed 10 rpm
Frequency 10 Hz
Outer diameter 2000 mm
Inner diameter 1835 mm
Air gap 10.5 mm
Slots per pole and phase 7/5
Cables per slot 6
Magnet width 32 mm
Magnet thickness 13 mm
Stator axial length 294 mm
Stacking factor 0.956
Resistance per phase 0.47Ω
Load 4.44Ω per phase
The load tests were carried out primarily to evaluate theperformance of the machine under nominal load conditions.Harmonic analyses of the measured data are presentedand possible reasons for the electromagnetic losses andharmonics in the experimental machine are discussed. Theresults and discussions presented in the paper could be usefulfor future design and construction of generators for marinecurrent energy conversion.
2. Finite Element Generator Model
For electromagnetic analysis and design of electrical ma-chines, FEM has emerged as more or less a standard tool.The generator presented in this paper has been analyzed inthe finite element environment ACE (ACE, Modified Version3.1, ABB common platform for field analysis and simu-lations, ABB Corporate Research Centre, ABB AB, CorporateResearch, 721 78 Vasteras, Sweden), based on a two dimen-sional field model of an axial cross-section of the generator.
After the generator geometry is decided, the differ-ent subdomains of the calculation geometry are allocated
Position of the Hall probe
Figure 2: Location of the Hall probe (magnetic field measure-ments) and the simulated magnetic field distribution in one section.
material properties such as electric conductivity, σ , andrelative magnetic permeability, μr . Nonlinear ferromagneticmaterial properties of the stator steel are represented by asingle-valued BH curve. Three-dimensional end effects aretaken into account by introducing coil end impedances in thecircuit equations of the stator windings and the permanentmagnets are modeled by surface current sources.
Rotating machines usually present symmetry conditionsthat allow for a reduction of the necessary calculation geom-etry. In this case, a fractional winding with 7/5 slots per poleand phase is used, and thus the calculation geometry includesa section of five poles and 21 stator slots (see Figure 2).
The complete generator model is described by a com-bined set of field and circuit equations. The magnetic vectorpotential inside the generator is described by
σ∂Az
∂t+∇ ·
(1
μ0μr∇Az
)= −σ · ∂V
∂z, (1)
where σ is the conductivity, μ is the permeability, Az is theaxial component of the magnetic vector potential, and V isthe applied potential (thus the right hand term denotes theapplied current density).
The circuit equations are described by
Ia + Ib + Ic = 0, (2)
Uab = Ua + RsIa + Lends
∂Ia∂t−Ub − RsIb − Lend
s∂Ib∂t
, (3)
Ucb = Uc + RsIc + Lends
∂Ic∂t−Ub − RsIb − Lend
s∂Ib∂t
, (4)
where Ia, Ib, and Ic are the conductor currents in the threephases a, b, and c, respectively. Uab and Ucb are the terminalline voltages and Ua, Ub, and Uc are the phase voltagesobtained from solving the field equation. Rs is the windingresistance and Lend
s describes the coil end inductance. Fur-thermore, it should be noted that frictional losses in thebearings and windage losses are neglected while evaluatingthe efficiency due to the low rotational speed and hightorque.

ISRN Renewable Energy 3
3. Generator Parameters
Before performing the tests on the machine, some of theelectrical circuit parameters and geometrical parameters ofthe experimental machine were measured under standstillconditions. The resistance and inductance per phase of thewinding is 0.475Ω and 11.5 mH. These values were mea-sured using a precision bridge [16]. For a full description ofthe generator geometry, see [14].
A fractional winding is used and the number of slotsper pole per phase is 1.4, hence the angular displacementbetween the slots is β = 42.8◦ and the phase spread angleis 60◦. Hence, the distribution factor is kd = 0.977. In thepresent case the pole pitch is 4.2 slots. The designed machineis short pitched by 35.5◦ and the pitch factor is kp = 0.952.
For safety, and to avoid possible floating conditions ofeither generator or the load, the neutral of both the generatorand the load are shorted and grounded to the common powersupply ground of the motor drive unit. Both the generatorand the loads are Y connected.
4. Generator Performance
4.1. No Load Experiments. The generator no load test wascarried out at the nominal speed of 10 rpm. Once the genera-tor had reached a constant speed, the magnetic field in the airgap was measured on a stator tooth using a 7010 Gauss/Teslameter [17], that is, the Hall probe was fixed at one statortooth perpendicular to the magnetic flux. Note that there aretwo components of magnetic fields in the air gap, namely,normal, Bn, and tangential, Bt, components. Only the normalcomponent was measured by the Hall probe. The simulatedvalue for the B-field is taken at a point 1 mm in front of astator tooth as shown in Figure 2, to match the position of theHall probe during measurements. Also shown in Figure 2 arethe magnetic field lines in one section of the machine. Themeasured normal component of the no load air gap magneticfields is shown in Figure 3 together with the magnetic fieldpredicted by the simulations. Simulations show that themaximum normal component and tangential components ofthe magnetic field in the air gap are around 0.6 T and 0.15 T,respectively. The difference in the peak normal componentof the measured and calculated magnetic fields is about 6%.The force per unit area in the air gap at no load is calculatedto 65 kN/m2 using the simulation tool.
The no load phase voltages were measured for all threephases and they all were balanced and phase shifted by 120◦.Hence only the voltage for one phase is shown in Figure 4together with the voltage predicted by the simulations. Thedifferences in the rms value of simulated and measuredvoltages are shown in Table 2. It is found that the rmsvalue of the simulated voltages are about 9% higher whencompared with the measurements. This is most likely dueto measurement uncertainties and modeling inaccuraciesregarding for example end effects. Furthermore, the smalldifferences in axial length of the rotor and the stator dueto constructional errors are not taken into account in themodeling of the generator. The voltages were measured usingthree Tektronix P2220 voltage probes [18].
B-fi
eld
(T)
Calculated BnCalculated BtMeasured Bn
No load B-field
Time (s)
0.6
0.4
0.2
0
−0.2
−0.4
−0.6
0 0.02 0.04 0.06 0.08
Figure 3: The magnetic field components in the air gap at no loadand nominal speed of 10 rpm.
CalculatedMeasured
100
50
0
−50
−100
Vol
tage
(V
)
0 0.05 0.1 0.15 0.2
Time (s)
No load phase voltage
Figure 4: The voltage across one of the phases under no loadconditions and at nominal speed of 10 rpm.
Table 2: No load tests.
No load tests Simulations Experiments Difference
Line voltage (peak) 251 V 228 V 9%
Line voltage (rms) 176 V 158 V 10%
Phase voltage (peak) 134 V 128 V 4%
Phase voltage (rms) 101 V 92 V 9%
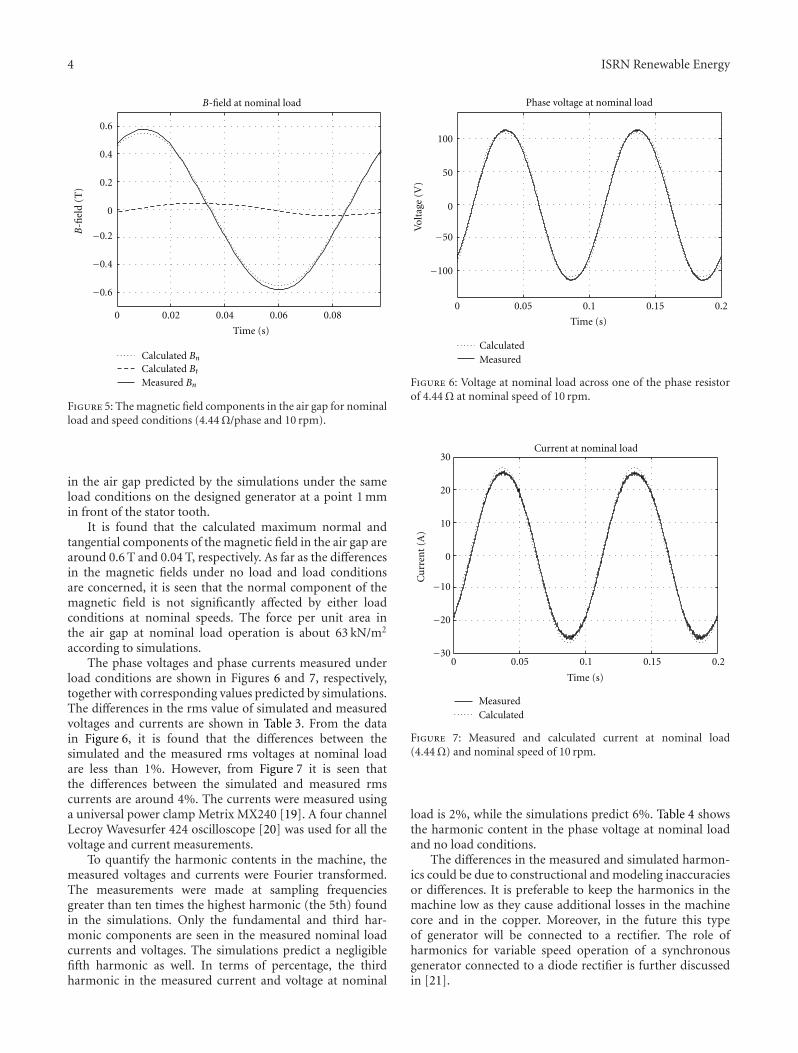
4.2. Nominal Load Experiments. The generator load testswere carried out at the nominal speed of 10 rpm and witha Y connected load of 4.44Ω/phase. The magnetic field wasmeasured in the same way as in the no load test case. Themeasured normal component of the magnetic field is shownin Figure 5. Also shown in Figure 5 are the magnetic fields
4 ISRN Renewable Energy
Time (s)
0.6
0.4
0.2
0
−0.2
−0.4
−0.6
0 0.02 0.04 0.06 0.08
Calculated BnCalculated BtMeasured Bn
B-fi
eld
(T)
B-field at nominal load
Figure 5: The magnetic field components in the air gap for nominalload and speed conditions (4.44Ω/phase and 10 rpm).
in the air gap predicted by the simulations under the sameload conditions on the designed generator at a point 1 mmin front of the stator tooth.
It is found that the calculated maximum normal andtangential components of the magnetic field in the air gap arearound 0.6 T and 0.04 T, respectively. As far as the differencesin the magnetic fields under no load and load conditionsare concerned, it is seen that the normal component of themagnetic field is not significantly affected by either loadconditions at nominal speeds. The force per unit area inthe air gap at nominal load operation is about 63 kN/m2
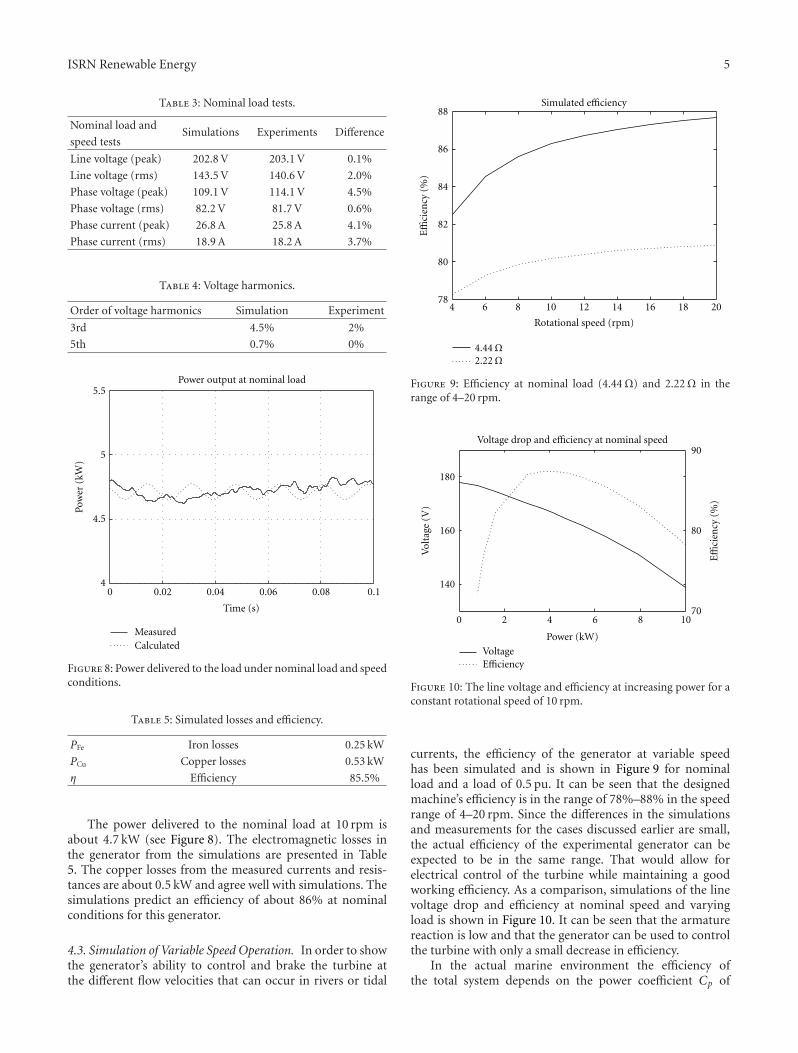
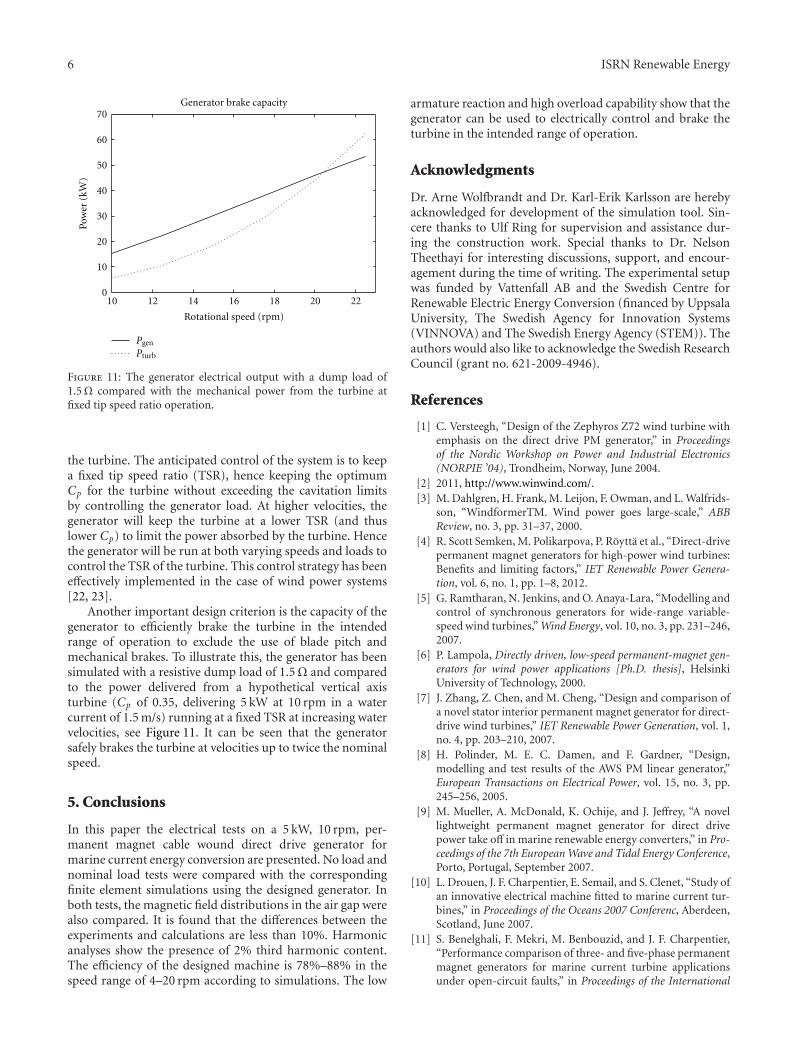
according to simulations.The phase voltages and phase currents measured under
load conditions are shown in Figures 6 and 7, respectively,together with corresponding values predicted by simulations.The differences in the rms value of simulated and measuredvoltages and currents are shown in Table 3. From the datain Figure 6, it is found that the differences between thesimulated and the measured rms voltages at nominal loadare less than 1%. However, from Figure 7 it is seen thatthe differences between the simulated and measured rmscurrents are around 4%. The currents were measured usinga universal power clamp Metrix MX240 [19]. A four channelLecroy Wavesurfer 424 oscilloscope [20] was used for all thevoltage and current measurements.
To quantify the harmonic contents in the machine, themeasured voltages and currents were Fourier transformed.The measurements were made at sampling frequenciesgreater than ten times the highest harmonic (the 5th) foundin the simulations. Only the fundamental and third har-monic components are seen in the measured nominal loadcurrents and voltages. The simulations predict a negligiblefifth harmonic as well. In terms of percentage, the thirdharmonic in the measured current and voltage at nominal
Phase voltage at nominal load
CalculatedMeasured
Vol
tage
(V
)
100
50
0
−50
Time (s)
0 0.05 0.1 0.15 0.2
−100
Figure 6: Voltage at nominal load across one of the phase resistorof 4.44Ω at nominal speed of 10 rpm.
30
20
10
0
−10
−20
−30
Cu
rren
t (A
)
0 0.05 0.1 0.15 0.2
Time (s)
Current at nominal load
MeasuredCalculated
Figure 7: Measured and calculated current at nominal load(4.44Ω) and nominal speed of 10 rpm.
load is 2%, while the simulations predict 6%. Table 4 showsthe harmonic content in the phase voltage at nominal loadand no load conditions.
The differences in the measured and simulated harmon-ics could be due to constructional and modeling inaccuraciesor differences. It is preferable to keep the harmonics in themachine low as they cause additional losses in the machinecore and in the copper. Moreover, in the future this typeof generator will be connected to a rectifier. The role ofharmonics for variable speed operation of a synchronousgenerator connected to a diode rectifier is further discussedin [21].
ISRN Renewable Energy 5
Table 3: Nominal load tests.
Nominal load andSimulations Experiments Difference
speed tests
Line voltage (peak) 202.8 V 203.1 V 0.1%
Line voltage (rms) 143.5 V 140.6 V 2.0%
Phase voltage (peak) 109.1 V 114.1 V 4.5%
Phase voltage (rms) 82.2 V 81.7 V 0.6%
Phase current (peak) 26.8 A 25.8 A 4.1%
Phase current (rms) 18.9 A 18.2 A 3.7%
Table 4: Voltage harmonics.
Order of voltage harmonics Simulation Experiment
3rd 4.5% 2%
5th 0.7% 0%
5.5
5
4.5
4
Pow
er (
kW)
MeasuredCalculated
0 0.02 0.04 0.06 0.08 0.1
Time (s)
Power output at nominal load
Figure 8: Power delivered to the load under nominal load and speedconditions.
Table 5: Simulated losses and efficiency.
PFe Iron losses 0.25 kW
PCu Copper losses 0.53 kW
η Efficiency 85.5%
The power delivered to the nominal load at 10 rpm isabout 4.7 kW (see Figure 8). The electromagnetic losses inthe generator from the simulations are presented in Table5. The copper losses from the measured currents and resis-tances are about 0.5 kW and agree well with simulations. Thesimulations predict an efficiency of about 86% at nominalconditions for this generator.
4.3. Simulation of Variable Speed Operation. In order to showthe generator’s ability to control and brake the turbine atthe different flow velocities that can occur in rivers or tidal
88
86
84
82
80
78
Effi
cien
cy (
%)
Simulated efficiency
4 6 8 10 12 14 16 18 20
Rotational speed (rpm)
4.44 Ω2.22 Ω
Figure 9: Efficiency at nominal load (4.44Ω) and 2.22Ω in therange of 4–20 rpm.
180
160
140
Vol
tage
(V
)
0 2 4 6 8 10
Power (kW)
VoltageEfficiency
90
80
70
Effi
cien
cy (
%)
Voltage drop and efficiency at nominal speed
Figure 10: The line voltage and efficiency at increasing power for aconstant rotational speed of 10 rpm.
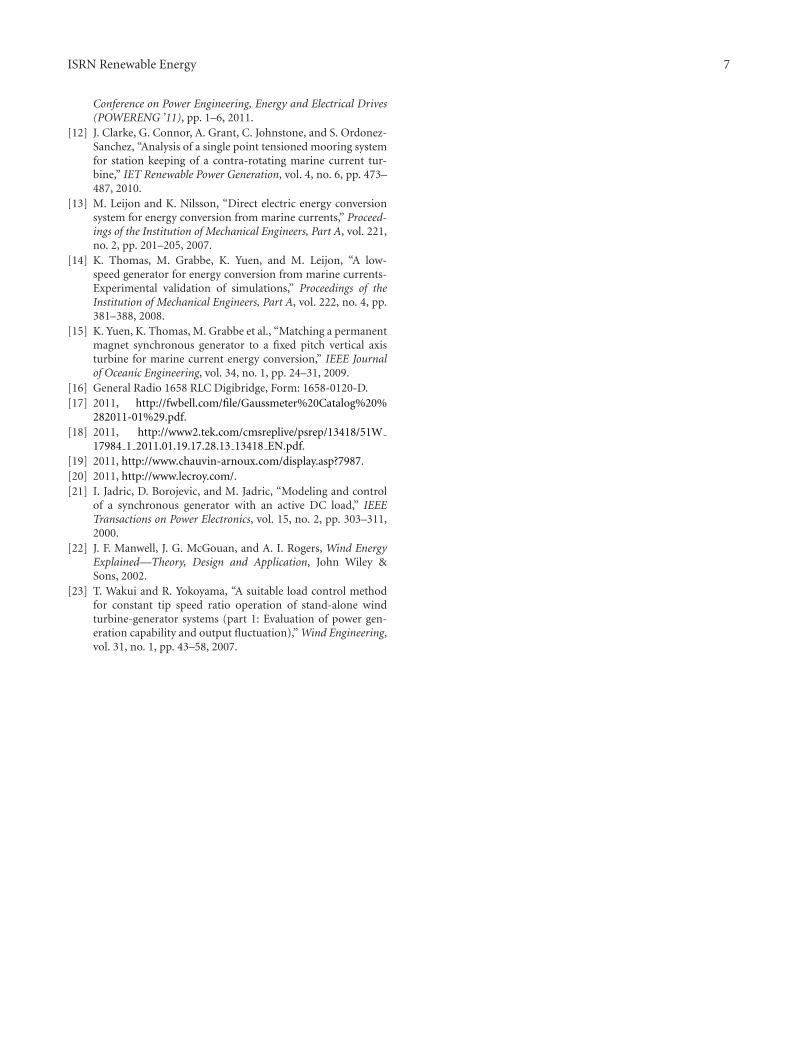
currents, the efficiency of the generator at variable speedhas been simulated and is shown in Figure 9 for nominalload and a load of 0.5 pu. It can be seen that the designedmachine’s efficiency is in the range of 78%–88% in the speedrange of 4–20 rpm. Since the differences in the simulationsand measurements for the cases discussed earlier are small,the actual efficiency of the experimental generator can beexpected to be in the same range. That would allow forelectrical control of the turbine while maintaining a goodworking efficiency. As a comparison, simulations of the linevoltage drop and efficiency at nominal speed and varyingload is shown in Figure 10. It can be seen that the armaturereaction is low and that the generator can be used to controlthe turbine with only a small decrease in efficiency.
In the actual marine environment the efficiency ofthe total system depends on the power coefficient Cp of
6 ISRN Renewable Energy
70
60
50
40
30
20
10
0
Pow
er (
kW)
10 12 14 16 18 20 22
Rotational speed (rpm)
Pgen
Pturb
Generator brake capacity
Figure 11: The generator electrical output with a dump load of1.5Ω compared with the mechanical power from the turbine atfixed tip speed ratio operation.
the turbine. The anticipated control of the system is to keepa fixed tip speed ratio (TSR), hence keeping the optimumCp for the turbine without exceeding the cavitation limitsby controlling the generator load. At higher velocities, thegenerator will keep the turbine at a lower TSR (and thuslower Cp) to limit the power absorbed by the turbine. Hencethe generator will be run at both varying speeds and loads tocontrol the TSR of the turbine. This control strategy has beeneffectively implemented in the case of wind power systems[22, 23].
Another important design criterion is the capacity of thegenerator to efficiently brake the turbine in the intendedrange of operation to exclude the use of blade pitch andmechanical brakes. To illustrate this, the generator has beensimulated with a resistive dump load of 1.5Ω and comparedto the power delivered from a hypothetical vertical axisturbine (Cp of 0.35, delivering 5 kW at 10 rpm in a watercurrent of 1.5 m/s) running at a fixed TSR at increasing watervelocities, see Figure 11. It can be seen that the generatorsafely brakes the turbine at velocities up to twice the nominalspeed.
5. Conclusions
In this paper the electrical tests on a 5 kW, 10 rpm, per-manent magnet cable wound direct drive generator formarine current energy conversion are presented. No load andnominal load tests were compared with the correspondingfinite element simulations using the designed generator. Inboth tests, the magnetic field distributions in the air gap werealso compared. It is found that the differences between theexperiments and calculations are less than 10%. Harmonicanalyses show the presence of 2% third harmonic content.The efficiency of the designed machine is 78%–88% in thespeed range of 4–20 rpm according to simulations. The low
armature reaction and high overload capability show that thegenerator can be used to electrically control and brake theturbine in the intended range of operation.
Acknowledgments
Dr. Arne Wolfbrandt and Dr. Karl-Erik Karlsson are herebyacknowledged for development of the simulation tool. Sin-cere thanks to Ulf Ring for supervision and assistance dur-ing the construction work. Special thanks to Dr. NelsonTheethayi for interesting discussions, support, and encour-agement during the time of writing. The experimental setupwas funded by Vattenfall AB and the Swedish Centre forRenewable Electric Energy Conversion (financed by UppsalaUniversity, The Swedish Agency for Innovation Systems(VINNOVA) and The Swedish Energy Agency (STEM)). Theauthors would also like to acknowledge the Swedish ResearchCouncil (grant no. 621-2009-4946).
References
[1] C. Versteegh, “Design of the Zephyros Z72 wind turbine withemphasis on the direct drive PM generator,” in Proceedingsof the Nordic Workshop on Power and Industrial Electronics(NORPIE ’04), Trondheim, Norway, June 2004.
[2] 2011, http://www.winwind.com/.[3] M. Dahlgren, H. Frank, M. Leijon, F. Owman, and L. Walfrids-
son, “WindformerTM. Wind power goes large-scale,” ABBReview, no. 3, pp. 31–37, 2000.
[4] R. Scott Semken, M. Polikarpova, P. Roytta et al., “Direct-drivepermanent magnet generators for high-power wind turbines:Benefits and limiting factors,” IET Renewable Power Genera-tion, vol. 6, no. 1, pp. 1–8, 2012.
[5] G. Ramtharan, N. Jenkins, and O. Anaya-Lara, “Modelling andcontrol of synchronous generators for wide-range variable-speed wind turbines,” Wind Energy, vol. 10, no. 3, pp. 231–246,2007.
[6] P. Lampola, Directly driven, low-speed permanent-magnet gen-erators for wind power applications [Ph.D. thesis], HelsinkiUniversity of Technology, 2000.
[7] J. Zhang, Z. Chen, and M. Cheng, “Design and comparison ofa novel stator interior permanent magnet generator for direct-drive wind turbines,” IET Renewable Power Generation, vol. 1,no. 4, pp. 203–210, 2007.
[8] H. Polinder, M. E. C. Damen, and F. Gardner, “Design,modelling and test results of the AWS PM linear generator,”European Transactions on Electrical Power, vol. 15, no. 3, pp.245–256, 2005.
[9] M. Mueller, A. McDonald, K. Ochije, and J. Jeffrey, “A novellightweight permanent magnet generator for direct drivepower take off in marine renewable energy converters,” in Pro-ceedings of the 7th European Wave and Tidal Energy Conference,Porto, Portugal, September 2007.
[10] L. Drouen, J. F. Charpentier, E. Semail, and S. Clenet, “Study ofan innovative electrical machine fitted to marine current tur-bines,” in Proceedings of the Oceans 2007 Conferenc, Aberdeen,Scotland, June 2007.
[11] S. Benelghali, F. Mekri, M. Benbouzid, and J. F. Charpentier,“Performance comparison of three- and five-phase permanentmagnet generators for marine current turbine applicationsunder open-circuit faults,” in Proceedings of the International
ISRN Renewable Energy 7
Conference on Power Engineering, Energy and Electrical Drives(POWERENG ’11), pp. 1–6, 2011.
[12] J. Clarke, G. Connor, A. Grant, C. Johnstone, and S. Ordonez-Sanchez, “Analysis of a single point tensioned mooring systemfor station keeping of a contra-rotating marine current tur-bine,” IET Renewable Power Generation, vol. 4, no. 6, pp. 473–487, 2010.
[13] M. Leijon and K. Nilsson, “Direct electric energy conversionsystem for energy conversion from marine currents,” Proceed-ings of the Institution of Mechanical Engineers, Part A, vol. 221,no. 2, pp. 201–205, 2007.
[14] K. Thomas, M. Grabbe, K. Yuen, and M. Leijon, “A low-speed generator for energy conversion from marine currents-Experimental validation of simulations,” Proceedings of theInstitution of Mechanical Engineers, Part A, vol. 222, no. 4, pp.381–388, 2008.
[15] K. Yuen, K. Thomas, M. Grabbe et al., “Matching a permanentmagnet synchronous generator to a fixed pitch vertical axisturbine for marine current energy conversion,” IEEE Journalof Oceanic Engineering, vol. 34, no. 1, pp. 24–31, 2009.
[16] General Radio 1658 RLC Digibridge, Form: 1658-0120-D.[17] 2011, http://fwbell.com/file/Gaussmeter%20Catalog%20%
282011-01%29.pdf.[18] 2011, http://www2.tek.com/cmsreplive/psrep/13418/51W
17984 1 2011.01.19.17.28.13 13418 EN.pdf.[19] 2011, http://www.chauvin-arnoux.com/display.asp?7987.[20] 2011, http://www.lecroy.com/.[21] I. Jadric, D. Borojevic, and M. Jadric, “Modeling and control
of a synchronous generator with an active DC load,” IEEETransactions on Power Electronics, vol. 15, no. 2, pp. 303–311,2000.
[22] J. F. Manwell, J. G. McGouan, and A. I. Rogers, Wind EnergyExplained—Theory, Design and Application, John Wiley &Sons, 2002.
[23] T. Wakui and R. Yokoyama, “A suitable load control methodfor constant tip speed ratio operation of stand-alone windturbine-generator systems (part 1: Evaluation of power gen-eration capability and output fluctuation),” Wind Engineering,vol. 31, no. 1, pp. 43–58, 2007.


![Overview of the Rectangular Wire Windings AC …2019/06/25 · wire windings and the stranded windings, where the welding technic has been involved [4]. Thus, it is necessary to reasonably](https://img.pdfslide.net/doc/110x75/5ea4411122769e408b4b5e35/overview-of-the-rectangular-wire-windings-ac-20190625-wire-windings-and-the.jpg)