Embed Size (px)
Citation preview

CAPITAL STRUCTURE AND FINANCIAL RISK: EVIDENCE FROM FOREIGN DEBT USE IN EAST ASIA
George Allayannis Darden School of Business
University of Virginia PO Box 6550
Charlottesville, VA 22906 (434) 924-3434
Gregory W. Brown Kenan-Flagler Business School
The University of North Carolina at Chapel Hill CB 3490, McColl Building
Chapel Hill, NC 27599-3490 (919) 962-9250
Leora F. Klapper Development Research Group
The World Bank 1818 H Street, NW
Washington, DC 20433 (202) 473-8738
June 2002
A previous version of this paper was entitled “Exchange Rate Risk Management: Evidence from East Asia.” We thank Warren Bailey, Arturo Bris, Stijn Claessens, Simeon Djankov, Jack Glen, Benny Goodman, John Graham, Bob Harris, David Haushalter, James Hodder, Bernadette Minton, S. Janakiraman, Ajay Patel, N.R Prabhala, Kimberly Rodgers, James Weston, Marc Zenner, and an anonymous referee for helpful comments. The paper has also benefited from seminar discussion at Cornell University, Rice University, Georgetown University, Pennsylvania State University, INSEAD, University of Maastricht, The Darden School, The University of North Carolina at Chapel Hill, the 6th Georgia Tech International Finance Conference, the EFMA 2000 in Athens, the 11th Annual Financial Economics and Accounting Conference (Michigan) and The World Bank. We are indebted to Craig Doidge and Paisan Limratanamongkol for providing excellent research assistance. The opinions expressed do not necessarily reflect those of the World Bank.

CAPITAL STRUCTURE AND FINANCIAL RISK: EVIDENCE FROM FOREIGN DEBT USE IN EAST ASIA
ABSTRACT
Using a unique dataset of East Asian non-financial companies, this paper examines a firm’s choice between local currency, foreign currency, and synthetic local currency (hedged foreign currency) debt. We also exploit the Asian financial crisis of 1997 as a natural experiment to investigate the role of debt type in financial and operating performance. We find evidence of unique, as well as common, factors that determine each debt type’s use thus indicating the importance of examining debt at a disaggregated level. Specifically, the use of natural local currency debt is associated primarily with factors found by many other studies to determine total debt levels such as size, profitability, and the market-to-book ratio. Foreign currency debt is used as a complement to local currency debt by firms with substantial capital needs seeking to lower the cost or extend the maturity structure of debt. However, the use of foreign currency debt is also determined by asset and income type consistent with agency cost and financial risk management theories. The use of synthetic local debt is primarily determined by risk management concerns. Finally, contrary to anecdotal reports and existing theory, we find no evidence that unhedged foreign currency debt is associated with significantly worse performance during the Asian crisis. Surprisingly, the use of synthetic local currency debt is associated with the biggest drop in market value, possibly due to currency derivative market illiquidity during the crisis.

1
1 Introduction and Summary of Results
Capital markets, both debt and equity, are becoming more global. For example, in 2000,
434 foreign companies from 51 different countries had listed shares on the New York Stock
Exchange. This compares to only 60 foreign listings from a dozen countries in 1990. Recent
research has examined the issuance of foreign equity and cross-listing by non-US corporations
(see, for example, Foerster and Karolyi (1999), Miller (1999), Chaplinsky and Ramchand (2000),
and Doidge et al. (2001)). Other related research has investigated the capital structure choice of
various samples of non-U.S. firms (see Booth et al. (2001) and Rajan and Zingales (1995), among
others) using aggregate debt-to-value ratios. While this prior work enhances our understanding
regarding aggregate capital structure choices, very little is known about the way firms make
capital structure decisions in regards to the currency denomination of debt.1 This is important,
especially for non-US firms which raise a large proportion of their debt in foreign currency and
which frequently use more foreign debt than foreign equity. 2 In addition, the choice of currency
is complicated by the ability of firms to effectively convert foreign currency denominated debt
into “synthetic” local currency debt by using foreign exchange derivative contracts.
Our analysis employs a unique database describing both local and foreign currency debt
used by 327 of the largest East Asian (EA) corporations from 1996 to 1998. Our data, which
were collected by SBC Warburg Dillon Reed, have two unusual and interesting characteristics.
For one, whereas Generally Accepted Accounting Principals (GAAP) do not require firms to
report the breakdown of their debt by currency, our data include debt classified as local or foreign
currency denominated. As importantly, our data include the percentage of foreign currency
denominated debt hedged with currency derivatives.
Using this database we examine the determinants of, and the inter-linkages between,
three alternative types of debt: foreign currency (FC), “natural” local currency (NLC), and
“synthetic” local (hedged foreign) currency (SLC) debt. In other words, we examine whether it is
1 Prior studies have been limited to examining certain types of foreign debt. For example, Miller and Puthenpurackal (2000) examine Ya nkee Bond issuance, Chaplinsky and Ramchand (2001) investigate SEC Rule 144A debt, and Kim and Stulz (1988) and Kedia and Mozumbar (2001) examine foreign public debt issuance by US corporations. Harvey et al. (2001) examine valuation effects for emerging market companies of internationally-syndicated term loans as well as new issues in the Eurobond and Yankee bond markets. Studies primarily in the accounting and taxation literatures (Froot and Hines (1995), Newberry (1998), Altshuler and Grubert (2000), and Newberry and Dhaliwal (2001)) have examined the relation between debt use by US multinational corporations and corporate taxes. 2 For example, in the sample of firms examined in this study, only 35.8% have equity listings outside their home country whereas 61.7% have foreign currency (FC) denominated debt. Foreign debt constitutes 41.8% of total debt for the firms in our sample. We note that foreign currency denominated financing can be obtained from a variety of sources including local financial institutions. However, for expositional purposes we subsequently use foreign currency denominated debt, foreign debt, and FC debt interchangeably. See discussion in Section 2.2.

2
sufficient to study capita l raising decisions at an aggregate level or if analyzing the components
of debt capital by currency denomination yields additional insights.3 We argue, and find
confirming empirical evidence, that there are unique motivations that determine the use of each
debt type. Thus, examining aggregate capital structure might mask factors that affect only the
mix of debt types. Similarly, factors that affect the aggregate capital structure choice may be the
result of separate decisions concerning the choice and mix of debt types, not necessarily the result
of a single decision regarding aggregate debt. For example, we find that the tangibility of a
firm’s assets seems to only affect EA firms’ decisions regarding the type of debt, not total debt.
This suggests that it is foreign currency lenders that are most interested in the existence of
tangible assets, consistent with agency theoretic explanations.
Another interesting aspect of our sample is that it spans the 1997 Asian financial crisis.
At least two aspects of the crisis provide for a unique natural experiment. First, the extreme
depreciation of many regional currencies and the ensuing economic fallout is an example of an
event that should reveal the risks associated with the use of alternative types of debt and, in
particular, foreign currency debt. Thus, the crisis allows us to directly measure changes in
financial and operating performance associated with an exchange rate shock and relate these to
the use of FC debt. Second, because the economies and exchange rates in the region were
affected differently by the crisis, our analysis can exploit differences in institutional factors and
exchange rate movements across countries. In particular, previous research has suggested that
large amounts of foreign debt contributed to the poor performance of EA firms and that foreign
debt may be in part responsible for the Asian crisis (see Krugman (1999), and Chang and Velasco
(1999), among others, for theoretical arguments; see Harvey and Roper (1999) for empirical
evidence).4 Our data allows for direct tests of this hypothesis.
While debt is often equated with financial risk, different types of debt give rise to
different types of risk. Since foreign currency debt by definition requires repayment in a foreign
currency, it exposes firms to exchange rate fluctuations. Consequently, firms must consider the
impact of currency risk (and other factors correlated with currency risk) when deciding on the use
of foreign debt as part of their preferred funding policy. In practice, there are many ways for a
corporation to affect its foreign exchange exposure. These vary from operational decisions such
as location of manufacturing facilities and sourcing of raw materials to financial decisions such as
3 Other research has examined alternative ways debt can be “disaggregated,” for example, by maturity or lender type. 4 Harvey and Roper (1999) suggest that “corporate managers levered up their investment in a period of declining performance in an attempt to ‘bet’ on the long-run performance of their firms and increased the stake by using foreign currency denominated debt; hence, to the extent that foreign debt is left unhedged, the bet also involves the direction of the country’s exchange rate.”

3
the use of foreign exchange derivative contracts, invoicing currencies, and foreign cash reserves.
For US firms, foreign debt is often synonymous with foreign exchange risk management.
Specifically, US companies report issuing foreign debt that can be serviced with operating
cashflows denominated in foreign currency (see Kedia and Mozumdar (2001), Geczy et al.
(1997), and Pearl et al. (1999), among others). Outside the US, non-financial firms frequently
cite the lower cost of foreign debt and the lack of depth in domestic lending markets as
motivations for using foreign debt. For example, treasury manager T. Duongporn of Thailand’s
CP Intertrade stated in early 1993,
“The financial markets in Thailand are in the process of changing. There are more financial products in the market. People are borrowing more in US Dollars and other currencies…In our case, we borrow in US Dollars, Yen and Deutschmarks… The [cost of borrowing] Baht is so high that most of us are borrowing in other currencies, and once you do that you have currency risk.”
--Euromoney Treasury Management, Nov. 5, 1993
While not often addressing the choice of local versus foreign debt directly, financial
theory does provide guidance on the choice of debt type. Since local and foreign debt are, of
course, types of debt, theories of optimal capital structure (e.g., static -tradeoff, pecking order, and
agency cost) should also be applicable in explaining the decision to use foreign and local debt.5
However, the theories need to be expanded to include factors specifically related to debt type.
For instance, if there exist differences in real interest rates across countries, this should figure into
the trade-off between local versus foreign borrowing. Specifically, firms will probably make a
risk-return tradeoff between the benefits of lower foreign borrowing costs and a probable increase
in financial risk due to exchange rate uncertainty. At the same time, foreign revenues may make
it easier for a firm to seek foreign debt or reduce exchange-rate risk. Existing theoretical
arguments outside of mainstream capital structure theory can also provide insights. For example,
optimal risk-sharing arguments suggest that foreign lenders may have a comparative advantage in
bearing some country-specific risks.
The choice between natural and synthetic local currency debt is largely unexamined.
Since NLC and SLC debt are in many ways both local currency debt, one may hypothesize that
their use is similarly determined. Still, the mix between synthetic and natural local currency debt
is likely related to factors characterizing relative costs between the two, such as the sizes of local
and foreign debt markets, differences in effective interest rates between the two markets, the costs
of foreign currency risk management, etc. For example, if the costs of foreign currency
5 See Harris and Raviv (1991), Titman and Wessels (1998), and Booth et al. (2001), among others for detailed discussions on testing alternative capital structure theories.

4
derivatives are high, then firms should use less synthetic versus natural local debt, all else equal.
However, the use of SLC debt depends on a firm’s ability to access foreign debt markets in the
first place, so factors that determine FC debt use may also play a role in the use of SLC debt.
The starting point for our analysis is an examination of aggregate capital structure in a
manner similar to Rajan and Zingales (1995) and Booth et al. (2001). Consistent with prior
findings, we find negative relations between the total debt level and both the market-to-book ratio
and operating margin, as well as a positive relation between tax gains-to-leverage and total debt.
Our data allow us to examine the impact of several additional factors, such as foreign cash flow,
that prior researchers were not able to measure. Some are important determinants of total capital
structure (and subsequently used in our disaggregated analysis). For example, consistent with
theoretical arguments of Bris and Koskinen (2002), we find a positive relation between a firm’s
total debt level and foreign earnings before interest and taxes (EBIT). While these results on total
debt are interesting in their own right, they are most useful as a benchmark for analyzing the
findings related to the components of total debt.
In our disaggregated analysis we identify which factors are important for each type of
debt. Some factors are related to only one type of debt, others to multiple types. For example,
variables related to risk management (foreign EBIT), agency costs (asset tangibility), large
external capital needs (near-term committed capital expenditures), and to the pecking order
theory (foreign equity listing) are important in explaining levels of foreign currency, but not
natural local currency, debt. On the other hand, size and market-to-book are related to levels of
both foreign and natural local currency debt. Consistent with implications of the static -tradeoff
theory, the direct cost of debt (as measured by the difference between local interest rates and
LIBOR) are important determinants for both local and foreign debt use. We find that the higher
the difference in interest rates, the higher (lower) the level of foreign (local) currency debt. These
results are consistent with anecdotal evidence that EA firms are likely to borrow in foreign
currency in an attempt to exploit lower interest rates.6
Some factors are also found to influence primarily local currency debt levels. We find a
strong negative relation between operating margins and NLC debt levels which is consistent with
a pecking order theory of capital structure. A (somewhat tenuous) positive relation between a
country’s tax advantage of corporate debt and local debt levels is consistent with tax
motivations.7 The decision to use synthetic local debt seems almost exclusively motivated by risk
6 Kim and Stulz (1988) suggest that firms may be able to exploit temporary financial opportunities and issue bonds in the market where interest costs are lowest. 7 See Booth et al. (2001) for a detailed discussion of Miller’s (1977) gains-to-leverage formula and for results from a cross-country analysis.

5
management concerns. We find a negative relation between both foreign EBIT and the interest
rate differential and the level of SLC debt. This suggests that managers trade-off the benefit of
lower interest expense with foreign exchange risk that cannot be covered with other risk
management tools such as foreign currency cashflows. Other tests with debt-mix ratios (instead
of levels) provide additional support for the existence of unique motivations behind the use of
alternative debt types. For example, we find that firms with a relatively high proportion of
synthetic local debt tend to be smaller, have higher market-to-book ratios, and reside in countries
with a lower interest rate differential, thus confirming the apparent risk management motivations
for SLC debt.
Our data also allow us to understand potential inter-linkages among alternative types of
debt. There exists a negative relation between SLC debt and NLC debt suggesting that these are
used as substitutes. We also find a significant positive relation between both types of local debt
and FC debt, implying that local and FC debt are used as complements. This result is consistent
with anecdotal evidence suggesting that local markets were not sufficiently deep. Overall, these
results point to two aspects of EA firms’ capital structure decisions: one that concerns the level of
debt and another that determines the composition of debt, again highlighting the importance of
examining capital structure at a disaggregate level.
Since our data span eight East Asian countries–Hong Kong and China,8 Indonesia, South
Korea, Malaysia, Philippines, Singapore, Taiwan, and Thailand–which differ in many respects,
we also attempt to isolate country characteristics that influence a firm’s capital-raising decision.
A surprising result from this analysis is that, with the exception of the tax and interest rate
variables already discussed, much of the variation in debt use is explained by firm-specific
variables. We have examined several additional country and currency specific factors (such as
creditor rights, legal origin, derivative market size and depth, etc.) and find that these variables do
not marginally explain differences in debt type.
To the extent possible, we control for differences between features of local and foreign
currency debt. For example, if FC debt is primarily long-term debt, and LC debt is only short
term, then our results would speak primarily to maturity structure choice, not currency choice.
However, we find that for firms with foreign currency debt, about half (49%) of their local
currency debt is long term (versus about 73% of their foreign currency debt), suggesting foreign
currency debt is not used just to obtain long-term debt. In multivariate tests we control for debt
maturity and find this to be important, but it is clear that maturity does not drive our findings.
Because there are likely to be institutional differences across countries that we do not capture
8 Our sample for Hong Kong includes “red-chip” firms operating in China.

6
with our country-specific variables, we also repeat our analysis including country dummies and
find our results are robust. However, one assumption underlying our analysis is that debt types
are reasonably similar with respect to certain specific features such as covenants and collateral for
which we do not have data.
Having identified the motivations behind the use of alternative debt types, we next
examine how alternative types of debt relate to firm performance during the Asian crisis. We
investigate both financial and operating performance using a variety of alternative performance
measures. As expected, our findings suggest that leverage, regardless of type, negatively
affected the financial performance of EA firms during the crisis (as measured by equity returns,
interest coverage ratios, and modified Z-scores). In contrast with prior findings, foreign currency
debt did not have a significantly larger impact on financial performance than local currency debt.
This suggests that the firms in our sample did not use FC debt in a less prudent manner than
natural local debt. Most surprisingly, SLC debt (i.e., hedged FC debt) is associated with
significantly worse performance. We provide evidence that this result is due to FX derivative
market illiquidity during the crisis which kept firms from being able to “roll-over” short-term
hedging strategies associated with SLC debt. Results using measures of operating performance
show that FC debt is positively related to changes in sales and net property, plant, and equipment
(standardized by sales) consistent with the predictions of Bris and Koskinen (2002).9 However,
similar to our finding on financial performance, SLC debt also appears to have had a negative
effect on sales and operating margins. Although we cannot completely eliminate the risk of
endogeneity driving these results, our primary findings remain unaltered when we correct for
possible endogeneity by estimating a two-stage least squares model. In addition, univariate tests
do not indicate SLC users are more susceptible than non-users to distress in the pre-crisis period.
The performance analysis is also robust to controls for differences in maturity between foreign
and local currency debt.
Finally, we quantify the direct impact of exchange rate depreciations on EA firm value.
Overall, we estimate that the increase in foreign debt liabilities net of hedging and foreign cash
reserves (measured in local currency terms) accounts for only 37% of the decline in firms’ market
values. We suggest this can be interpreted either as (1) the stock market overreacting, or (2) the
economic aspects of the crisis (as opposed to direct financial aspects) being responsible for the
majority of EA stock markets’ declines. However, there exists substantial variation across both
9 One interesting implication of these results is that equity return and operating performance measures may speak to effects of the crisis at different horizons. Specifically, market performance may reflect the long-term negative impact of the crisis, whereas operating performance may reflect short-term increase in competitiveness arising from the local currency depreciation.

7
countries and industries. About 80% of the decline in market values in Indonesia is attributable
to the increase in the local currency value of net foreign debt liabilities. In contrast, comparable
values for firms in the Philippines and Singapore are less than 10%. Interestingly, about 7% of
EA firms appear to have directly benefited from the currency depreciations due to foreign cash
reserves in excess of unhedged foreign debt.
The remainder of the paper is organized as follows: Section 2 describes the East Asian
currency crisis and the data. Section 3 examines the determinants of total debt and types of debt.
Section 4 tests the relation between type of debt and firm performance. Section 5 concludes.
2 The East Asian Crisis and Data on Non-financial Corporations
2.1 The Currency Crisis in East Asia
During the first half of the 1990s, East Asian firms underwent rapid investment in fixed
assets (see Pomerleano (1998)). On average, internally generated funds were not sufficient for
financing this expansion, and as a result, most firms depended on external financing. New equity
was used less than debt, often because stock markets were perceived as under-performing, and
insiders preferred to not dilute their shareholdings so as to retain management control of their
companies. Consequently, domestic and foreign borrowing and measures of firms’ financial
leverage increased significantly in the mid-1990s. For example, prior to the crisis in 1996, the
average listed firm in South Korea and Thailand had a debt-to-equity ratio of 3.5 and 2.3
respectively, relative to ratios in the US and Germany of 1.1 and 1.5, respectively. 10 Furthermore,
much of the debt was denominated in foreign currency. Consequently, on average, EA firms
were exposed to declines in Asian currencies against the US dollar (USD) and worsening regional
macroeconomic conditions. Corsetti, et al. (1998) find an indication of financial fragility, the
ratio of short-term external liabilities to foreign reserves, was above 100% in Thailand, Indonesia,
and Korea.
The EA financial crisis is in several ways an unusual event in economic and exchange
rate history. As late as one year prior to the crisis, most equity and foreign exchange markets
showed little sign of the impending calamity. Table 1 shows exchange rate volatility and equity
market returns for the eight EA countries in our sample. We define three periods (fixed for all
countries) that describe the general state of financial markets: Pre-crisis (June 29, 1996 to June
27, 1997), intra-crisis (June 28, 1997 to June 26, 1998), and post-crisis (June 27, 1998 to June 25,
1999).11 Panel A shows annual exchange rate volatility (as measured by the standard deviation of
10 For a detailed discussion of corporate debt in East Asia see Claessens et al. (1999). 11 Because all countries were not struck simultaneously, these dates are somewhat arbitrary. However, this interval classification includes all of the significant exchange rate depreciation in the “crisis” period.

8
weekly percent changes in exchange rates versus the USD) by country for each of the three
periods. Panel B shows equity returns for the major market index in each country (see the
Appendix for details).
In the pre-crisis period, exchange rate volatility is very low across the region, averaging
only 2.7%. For no country does pre-crisis exchange rate volatility exceed that of the Japanese
Yen (against the USD). Equity returns in the region were mixed, but only Thailand and South
Korea showed a decline of more than 20%.
On July 2, 1997, the Bank of Thailand announced a managed float of the Baht and called
on the International Monetary Fund for "technical assistance." This announcement effectively
devalued the Baht by about 20% and is considered a trigger for the East Asian crisis. (See
http://www.stern.nyu.edu/~nroubini/ for a detailed timeline of the Asian crisis.) Figure 1 shows a
plot of USD exchange rates from July 1996 to July 1999. Soon after the Baht depreciation, other
EA currencies followed, succumbing to the so-called devaluation “contagion.” By the end of
1997, the Thai Baht (THB), Malaysian Ringgit (MYR), Indonesian Rupiah (IND), South Korean
Won (KRW), and Philippine Peso (PHP) were all down more than 30% against the USD; the
Singapore Dollar (SGD), and Taiwan Dollar (TWD) were each down about 15%. Only Hong
Kong and China were able to maintain a stable exchange rate against the USD. Table 1 shows
that during this crisis period, exchange rate volatilities increase more than tenfold to an average of
35.1%, and equity markets across the region slumped an average of 51.5%.
By the middle of 1998, the worst of the currency crisis was over, exchange rates
stabilized, and equity markets started to rebound. During the post-crisis period, local currencies
tended to appreciate somewhat against the USD.12 Exchange rate volatilities moderated
averaging only 11.3% (less than for the Japanese Yen over the same period) and equity markets
in all countries rebounded significantly, up an average of 75.4%.
2.2 Data
Our primary data source is a set of SBC Warburg Dillon Read (SBC-WDR) equity
reports from 1997 to 1999. These report firms’ level, currency (local or foreign) and maturity of
debt, the percentage of foreign currency debt that is hedged with foreign exchange derivatives,
the level of foreign cash, and the percentage of EBIT earned abroad, among other items, for 1996
to 1998. These reports cover about 40 of the largest exchange-listed non-bank firms in each of
Furthermore each period is one year long, which facilitates the use of annual accounting data in the subsequent analysis. The break at the end of June is also convenient since it allows time for the reporting of the previous year’s financial results. 12 Singapore showed a slight decline, Hong Kong and China retained their pegs despite attacks by speculators, and Malaysia instituted strict currency controls.

9
eight East Asian countries.13
Because these data are not from a commercial vendor and were often collected through
direct contact with the firms in the sample, we attempted to verify the data’s accuracy in two
ways. First, we compare the debt levels reported by WorldScope and by SBC-WDR; these
comparisons are reassuring. For example, the correlation between the total debt values reported
by the two sources in 1996 is 0.92. We do not have a viable method for checking the breakdown
of foreign and local currency debt reported by SBC-WDR, but the high correlations for the more
aggregate data are comforting. Second, we verified the quality of the derivative use data by
searching through a subset of firms’ annual reports. We selected derivative users and non-users
alphabetically from each country so that we would have at least five non-users and the minimum
of all or five users from each country. For the 68 firms searched we find no reference to hedging
debt with derivatives for all but one of the non-user firms. Furthermore, we find only two firms
that use derivatives but do not hedge foreign debt. For example, Singapore’s Cycle and Carriage
uses forward contracts to manage foreign currency liabilities on imports (according to the 1997
annual report) but apparently not foreign debt exposure. For derivative users, we find specific
references to FX derivative use for all but two firms. This crosschecking leads us to conclude
that the quality of the SBC-WDR data is very good.
We use the SBC-WDR data to construct three mutually exclusive measures of firm debt:
natural local currency (NLC) debt is the total value of debt originally borrowed in local currency;
foreign currency (FC) debt is the value of foreign currency denominated debt that is left
unhedged and therefore exposed to fluctuations in foreign exchange rates; synthetic local
currency (SLC) debt is the value of foreign currency denominated debt that the firm has in effect
converted into local currency through the use of foreign exchange derivative contracts.14 These
13 The reports do not coincide exactly with calendar or fiscal years. However, by cross-referencing variables also available in the WorldScope database it is apparent that the data are most representative of calendar years 1996 to 1998. Table 2, discussed subsequently, reports the number of firms from each country for 1996 data. The exact set of firms surveyed changes slightly from the 1996 to 1997 reports. The project was curtailed in the middle of the data collection stage for 1998 data, so many of the firms have missing observations for this year. We do not have data on the precise currency denomination of debt. However, other evidence suggests that the majority of foreign debt was denominated in US dollars and most of the remaining part in “strong” currencies such as the Japanese Yen or the Deutschmark (see, for example, Eichengreen and Hausmann (1999)). It is therefore safe to assume, as we subsequently do, that the vast majority of the foreign debt assumed by EA firms was exposed to currency risk and to a potential depreciation of the local currencies against these currencies. 14 One drawback to East Asia is the generally less developed foreign currency derivative markets. However, derivatives were readily available to at least the larger EA corporate customers except in South Korea. For more information on EA derivative markets and common hedging strategies see, “Forex Swaps in Demand,” AsiaRISK, November 1995, p. 4, and “Special FX,” AsiaRISK, October 1997, p. 28. From discussions with derivative dealers we learned most hedging of foreign currency debt with derivatives was with relatively short-term contracts, not only because the debt was short-term debt, but also because of less liquidity in longer-dated contracts.

10
variables are used to construct debt-to-market-value ratios—the primary variables of interest.
Detailed definitions of all variables are provided in Appendix A.
Classifying debt as NLC, FC, or SLC is a necessary simplifying assumption. There are
other aspects of debt that might also be important factors in the subsequent analysis. For
example, the physical location of the lender does not always match the currency of the loan—
local banks can make loans in foreign currency and vice versa. By adding this dimension we can
think of each debt type as fitting into one of six cells in the 2x2x2 cube represented in Figure 2.
Figure 2. Types of Debt
Because we do not have precise information on the physical location of lenders we are
forced to collapse the third dimension of the cube by making the assumption that original-issue
foreign currency debt (FC and SLC debt) is primarily offered by foreign lenders and original-
issue local currency debt (NLC) is primarily offered by local lenders. While this assumption is
not necessary for most of our analysis, evidence suggests this is a reasonable, but not perfect,
simplification. Obviously firms with public foreign currency debt issues such as Yankee bonds
and Eurobonds are borrowing these funds primarily from foreign lenders. However, the
distinction between local and foreign lender is not always straightforward. For example, should a
local affiliate of a global bank be considered a local or foreign lender? As a rough check for our
assumption we compare data from the IMF on aggregate net flows of debt to the private sector for
1994-1996 for firms in five of our sample countries (Indonesia, South Korea, Malaysia, the
Philippines, and Thailand) to the total foreign currency borrowings of our sample firms. For
every country except the Philippines (which saw net outflows in 1995) the net inflows in just
these three years are greatly in excess of the total foreign currency denominated debt of our
Foreign Lender Local Lender
Local Currency
“Hedged” “Unhedged”
Foreign Currency
Natural Local Currency Debt
= NLC
Natural Foreign Currency Debt
= FC
Synthetic Local Currency Debt
= SLC
Synthetic Foreign Currency Debt
= SFC
? ? ? ?

11
sample firms. This confirms that the level of foreign currency debt flows was generally sufficient
to finance the level of FC and SLC debt we observe. Nonetheless, some of the debt flows are
loans to local financial institutions that then make FC loans to firms in our sample.
Our analysis is also simplified by the fact that our firms generally appear not to create
synthetic foreign currency (SFC) debt. In fact, only one firm in our sample, Tipco Asphalt of
Thailand, effectively does this. In 1996 Tipco reports a negative “hedge” ratio of 18% which we
interpret as a derivative position that increases exposure to a depreciating Baht.15 A negative
hedge ratio for foreign currency debt is the equivalent to converting local currency debt into
synthetic foreign currency debt. Discussions with derivatives dealers in East Asia revealed that
some Indonesian companies had structured derivative products in the mid 1990s that increased
exposure to a depreciating Rupiah to create synthetic foreign currency debt with zero interest
expense. Albeit in hindsight, dealers perceived this as a purely speculative transaction. This may
also have been Tipco’s motivation since the effective interest rate on their debt for 1996 is lower
than the average yield on US Treasury Bills in 1996 but then doubles in 1997. Overall, we
observe no other firms in our sample that create synthetic foreign currency debt, therefore not
considering this debt type seems warranted.
There may exist other distinctions between NLC, FC, and SLC debt, such as differences
in covenants or collateral, for which data are unavailable. Given the strength and consistency of
the subsequent results, we suspect that these limitations do not drive our findings though we
cannot be sure.
We augment the SBC-WDR dataset with the WorldScope database, which provides
additional balance sheet and income statement data for publicly traded firms. For firms with data
not available on WorldScope, we searched Hoover’s Online, WorldVest, and company annual
reports (in that order) to fill in as many missing datapoints as possible. Equity returns are
obtained from DataStream. For companies not in DataStream, we obtained price data from the
listing exchange or company websites when available. Data for some additional variables (for
example, foreign sales, family affiliation, number of shareholders, etc.) are obtained from the
Asian Company Handbook and Claessens et al. (2000). Our final dataset has complete data for
nearly all companies in the 1996 SBC-WDR report. Specifically, we have, at a minimum, basic
accounting data and equity return data for 1996-98 for 315 of the 327 firms in the 1996 SBC-
WDR report.
Given the widespread financial distress in EA during the sample period, we are also
concerned with potential survivorship bias. Surprisingly, only eight firms exited the sample

12
because of a change in organization from 1996 to 1998. We conjecture that the generally large
size of the firms in the SBC-WDR reports results in a lower proportion of the firms in our sample
being forced to merge or liquidate (as compared to all publicly traded EA firms). Of the eight
firms, four merged with other firms, three went bankrupt, and one was nationalized. Six of the
eight firms were foreign debt users and two of the eight firms were hedgers, roughly the same
percentage as in the overall sample (61.7% and 21.5%, respectively). Given these facts, we are
confident that the performance results are not tainted by a significant survivorship bias.
Panel A of Table 2 provides sample means and correlations for many of the variables
used in the analysis for 1996. Overall, the firms in our sample appear somewhat less levered than
those in other studies of EA firms. This may be due to our use of market-value ratios in 1996
which was a stock market peak in most of our countries. Firms from middle -income countries
use both more FC and total debt than firms from high-income countries (e.g., total debt-to-value
ratio of 0.320 versus 0.201).16 Among middle-income countries, firms in Indonesia, Thailand and
South Korea have the highest total and FC debt ratios. South Korean firms are the most levered
with a debt-to-value ratio of 0.677 and also have the highest level of natural local debt. There is
substantial variation across EA countries in the use of SLC debt. SLC debt-to-value ratios vary
from a high of 0.068 for firms in Indonesia to 0.0 for firms in South Korea (which are prohibited
by law from using FX derivatives to hedge FC debt).17 About 57% of our firms’ debt is long-
term (maturity greater than 1 year). This is somewhat higher than values reported by Demirguc-
Kunt and Maksimovic (1999) for four of the countries in our sample but this discrepancy is likely
due to differences in average firm size and the sample period. Some interesting relations are also
found in the correlation table at the bottom of Panel A. For example, FC debt is positively related
to total debt thus providing indirect evidence that local currency debt and FC debt are
complements. SLC debt is negatively related to NLC debt thus suggesting that these may be
substitutes. We defer detailed discussion of other relations and variables until the next section.
3 Local and Foreign Currency Debt Use by EA Corporations
While the primary contribution of this study is that we are the first to provide a detailed
description of debt currency type used by non-financial corporations, prior research has
15 In our analysis we set Tipco’s hedge ratio equal to zero though dropping the company from the sample leaves our results essentially unchanged. 16 Middle income countries, as defined by IMF, include Indonesia, South Korea, Malaysia, the Philippines and Thailand. 17 South Korean firms have the lowest operating margin (6.1%), market-to-book (0.93) and business risk (0.033) among firms in the region, results also present in Booth et al. (2001).

13
investigated total debt use by non-US firms. Hence, we begin our analysis by briefly describing
the use of total debt by our firms and by comparing our results to those in other studies.
3.1 Total Debt
Innumerable empirical studies have tested capital structure theories using samples of US-
based firms. Although interpretations differ, a set of stylized facts has emerged. For example,
one widely cited review by Harris and Raviv (1991) concludes that debt use is positively related
to fixed assets, nondebt tax shields, investment levels, and firm size and is negatively related to
cashflow volatility, growth opportunities, advertising expenditure, the probability of bankruptcy,
profitability, and uniqueness of product. Rajan and Zingales (1995) and Booth et al. (2001)
examine the determinants of capital structure in the G-7 countries and developing countries,
respectively, and find that, despite substantial institutional differences across countries, firm debt
ratios in developed and developing countries seem to be affected by some similar factors. First,
debt ratios are typically lower for more profitable firms. Second, debt use is generally higher for
firms with more tangible assets that can be used as collateral. Firm size is frequently positively
related to leverage while market-to-book ratios are negatively related to debt use (though Booth et
al. suggests this may be a country effect in developing countries). In addition, Booth et al. find
some evidence of tax motivated leverage using Miller’s (1977) gains-to-leverage formula.
We begin by examining total debt levels for the firms in our sample so our firms can be
compared to those in previous studies (e.g., Booth et al. (2001)) and to provide a benchmark for
our more detailed analysis. We include in our analysis many of the proxies used in prior studies.
We also include variables unavailable to other researchers that we posit are related to the total
debt ratio (and, as discussed subsequently, to disaggregate debt ratios).
Prior studies have used existing theory to motivate specific empirical tests.18 For
example, the static trade-off theory predicts that leverage should be increasing with benefits of
debt (such as the size of tax shie lds and profitability) and decreasing as a function of the costs of
debt (such as probability and costs of financial distress and real interest rates). We use operating
margin as a measure of profitability. To measure the size of firms’ tax shields, we employ a
18 It should be noted however that the interpretation of empirical findings is a matter of debate and that many variables can be considered proxies for factors in competing models. For example, Harris and Raviv (1991) conclude that, “It would be difficult to reject any models based on the available evidence,” (page 350) whereas Rajan and Zingales (1995) conclude, “that the theoretical underpinnings of the observed correlations are still largely unresolved” (page 1458). Since the primary purpose of this paper is not to resolve these differences concerning total capital structure, we present our results with limited interpretation and let the reader draw conclusions regarding the implications for existing (aggregate) capital structure theory.

14
firm’s average tax rate19 and the country-specific gains-to-leverage formula of Miller (1977).
Business risk (as measured by the standard deviation of operating margins) is a proxy for the
probability of financial distress. Firm size may also be an inverse proxy for the probability of
financial distress and therefore be positively related to leverage. We use the natural logarithm of
US Dollar sales to measure firm size. Direct costs of debt include the real cost of borrowing. In
the subsequent analysis we also examine differential costs of borrowing across different
currencies, hence we calculate the difference between the short-term local-currency interest rate
and LIBOR as a proxy for direct costs of debt.20 Note the first column of Table 3 lists the
alternative capital structure theories we investigate, and the second column summarizes the
predicted signs for the variables we use in our tests.
Because managers and investors generally have differing information sets, investors must
undertake costly monitoring activities. Thus, agency theory makes a set of predictions for
optimal capital structure. Tangible assets acting as collateral for loans should be positively
related to debt use since they can be used to reduce agency costs of debt, such as risk-shifting
costs. We use fixed assets as a percent of total assets as a proxy for asset tangibility. (Committed
capital expenditures for the next 12 months as a percent of sales may also act as a proxy for asset
tangibility; the pair-wise correlation is 0.203.) Firms with greater growth opportunities should
use less debt to avoid under-investment costs related to debt-overhang problems as described by
Jensen and Meckling (1976) and Myers (1977). We use the market-to-book value of equity as a
measure of growth opportunities. Agency theory predicts the relation between profitability and
leverage depends on the effectiveness of the market for corporate control. If governance is
effective, Jensen (1986) predicts that profitable firms will use more leverage as a commitment
device for paying out free cashflow. Likewise, ineffective governance should motivate managers
to avoid the disciplinary incentives of higher leverage. Firm size may also be related to leverage
for agency reasons; to the extent that size proxies for the relative amount of information available
to outside investors, investors in large firms should prefer relatively more equity to debt.
Firms may be able to reduce agency costs of debt by credibly signaling their superior
quality via a foreign equity listing (e.g., via the issuance of ADRs or GDRs). In addition, firms
that list ADRs are required to comply with US GAAP accounting standards which may increase
19 Graham (1996a, 1996b) argues that an accurate estimate of a firm’s marginal tax rate that includes factors such as investment tax credits, loss carryforwards and carrybacks, and the alternative minimum tax is the appropriate measure for determining the tax advantage of debt. Unfortunately, data limitations prevent us from constructing such a firm-specific tax variable. As a robustness check, we examine alternatives to the average tax rate suggested in Graham (1996b), such as the statutory tax rate and a taxable income dummy; results are qualitatively similar to those reported for the average tax rate. 20 Using the local currency interest rate minus local inflation measures yields very similar findings so we report only the results using the interest rate differential to facilitate comparisons to subsequent results.

15
transparency. Such a listing is also correlated with higher firm-level corporate governance
standards and greater scrutiny by investors and can therefore increase the reputation capital of the
firm (see, for example, Diamond (1989), Klapper and Love (2002), and Lins et al. (2002)). Since
such a firm would have already paid any fixed costs associated with entering foreign capital
markets, this may also decrease the marginal cost of issuing FC debt. Together these imply a
greater debt capacity for firms with a foreign equity listing. Finally, prior research suggests that
family or group affiliation, which often includes an ownership or preferred relationship with a
related bank, may be a factor in determining total debt levels. Such a main-bank relationship has
been shown to improve a firm's access to external capital and promote investment (see Hoshi et
al. (1990) and Claessens et al. (2002)).
The pecking order hypothesis of Myers and Majluf (1984) suggests that firms will prefer
to finance with internally generated funds, then with external debt, and finally with external
equity. This theory predicts a negative relation between profitability and leverage since more
profitable firms will have less of a need to access lending markets. Contrary to the signaling
theory noted above, the pecking order hypothesis suggests that by revealed preference firms with
a foreign equity listing are likely to have obtained as much debt as desired and have moved down
the pecking order to raise additional external funds in the equity markets.
In a recent theoretical paper on the linkages between currency crisis and corporate capital
structure, Bris and Koskinen (2002) suggest that exporting firms can induce monetary authorities
to depreciate the local currency to their benefit by increasing leverage. Because of the debt
overhang problem, exporting firms with large debts will forgo some positive NPV investments.
A currency depreciation will reduce the debt overhang problem if costs are primarily in local
currency and sufficiently inelastic with respect to exchange rate fluctuations. We term this the
endogenous devaluation theory. A primary prediction of this theory is that exporting firms will
have higher leverage, thus we expect a positive relation between EBIT earned in foreign currency
and total leverage.
The aforementioned theories primarily envision firms with debt in a single currency.
Other theories that are more closely related to predicting the preferred currency for debt
(discussed in more detail in section 3.2.2) may also be important for determining total debt levels.
We propose a market depth hypothesis which predicts that if local currency debt markets are not
sufficiently large (deep) enough to satisfy the demands of borrowers, firms with access to foreign
currency lending will seek out such funds. Thus, firms that are not able to access foreign debt
markets will on average have lower total leverage. We also conjecture that firm size and
committed capital expenditures are proxies for the probability of exhausting LC lending markets.

16
Finally, risk management theory implies that if it is costly for firms to bear the exchange-rate risk
associated with foreign currency debt, then firms better able to manage these risks will use more
total debt. This derives from studies suggesting financial risk management increases debt
capacity (see Leland (1998) and Graham and Rogers (2002)). As proxies for firms managing
exchange rate risk we use measures of foreign EBIT and foreign cash holdings.21
Returning to Panel A of Table 2, we see that, similar to other studies, correlations
between some of these variables and total debt are consistent with predictions of capital structure
theory. For example, total leverage is positively correlated with size and negatively correlated
with the market-to-book ratio and operating margin.
Results from multivariate tests are reported in Table 4. Coefficients reported in column
(1) are consistent with findings in previous studies that total debt ratios are positively related to
firm size and the country-specific tax advantage and negatively related to the market-to-book
ratio and operating margin. Thus, these results support predictions made by the static trade-off
theory, agency costs theory, and the pecking order hypothesis. The negative coefficient for the
interest rate differential also supports the static trade-off theory. Yet, similar to Booth et al.
(2001), we find no significant relation between total debt level and either the average tax rate or
business risk. Asset tangibility is also not significantly related to the total debt ratio. This
suggests collateral may be less important in countries with weak bankruptcy laws and
repossession enforcement like the East Asian countries in our sample.22 On the other hand, if
committed capex is a better proxy for asset tangibility than fixed assets, the positive coefficient
on this variable supports the role of collateral in determining debt levels.
If a relation exists between a foreign equity listing and total debt levels, it appears to be
negative (the coefficient in the second equation is significant at the 10% level). This is consistent
with the pecking order hypothesis and inconsistent with the signaling theory. As predicted by the
endogenous devaluation and risk management theories, and consistent with empirical evidence in
Bris et al. (2001), foreign EBIT is significantly positively related to total debt levels. In contrast,
the level of foreign cash reserves is not related to total debt levels. Also unrelated to total debt is
a dummy variable signifying association with a family group. This is surprising given the
prevalence of results suggesting the important influence of family affiliation and main bank
relationships in EA corporate finance (see Lemmon and Lins (2001), among others). We also
include a dummy variable set equal to 1 if the firm has FC debt. The coefficient on this variable
21 Other factors associated with firms that are likely to manage financial risk, such as size and market-to-book, may also explain total debt levels indirectly. We examine this in more detail in section 3.2.4. 22 See Claessens et al. (2002) for a detailed description of creditor rights during bankruptcy in East Asian countries.

17
is positive which is consistent with the hypothesis that local debt markets are insufficiently deep
for at least some firms. The size of this effect is large. All else equal, firms with FC debt have a
debt-to-value ratio about 0.10 greater than firms without FC debt.
Coefficients on 1-digit SIC dummies show no significant industry effects in our sample
that cannot be explained by other factors. Column 2 shows that, with the exception of size, the
results are robust to the inclusion of country dummies instead of country-specific variables, and
that only Korean firms have significantly more debt after accounting for firm-specific factors.
Finally, we note the high explanatory power of these regressions as measured by adjusted R-
squared of 52.1% and 82.5% for the specifications with country-specific and country-dummy
variables, respectively.
While the above tests enhance our understanding on aggregate capital structure choice
among EA firms, they do not help us understand how managers make capital structure decisions
at a disaggregate level, how these decisions on the alternative types of debt are linked, and how
these, in turn, affect aggregate capital structure. We now turn to these questions.
3.2 Natural Local, Synthetic Local, and Foreign Currency Debt
3.2.1 An Example of a Foreign and Synthetic Local Currency Debt User
Because of the unique nature of our foreign currency debt data, it is instructive to
consider an example of a specific firm. Banpu Public Company Limited of Thailand is a
producer of coal, industrial minerals, and electricity. In 1996, the company employed about
1,300 workers and had 5.67 billion Baht (225 million USD) in total revenues, putting it slightly
below the median firm in our sample in both categories. Banpu has limited foreign operations: It
is developing a coal mine in Indonesia and has a joint venture for producing ball clay in Vietnam.
Foreign sales (and consequently foreign EBIT) are negligible. However, Banpu uses a substantial
amount of foreign currency debt. For example, in June 1997 at the onset of the Asian crisis,
Banpu had about $310 million (USD equivalent) in long-term foreign debt (primarily convertible
debentures). According to the 1997 annual report,
“The company had to borrow foreign currencies in funding its investment, thus becoming more exposed to foreign exchange fluctuations. … The company has always been searching for low cost funding sources while controlling [sic] appropriate debt to equity ratio. The company has a policy to balance timely foreign exchange risk coverages and competitive all-in costs of funds to assure acceptable returns on projects.”

18
Banpu is also an extensive user of currency swaps. Just prior to the crisis (June 1997),
the company had approximately 162 million USD (equivalent notional principal) in Baht-based
cross-currency swaps. For example, the 1997 annual report notes,
“The company has entered into cross currency swaps with financial institutions as the following: … A ten-year cross-currency swap contract of USD 41.96 million has been swapped into Baht 1,065.88 million. The interest rate in USD is 5.95% per annum when swapped into Thai Baht, interest rate becomes approximately 8.00%-9.00% per annum for the period from August 15, 1996 to February 15, 2007…”
Clearly, Banpu is not using FC debt as a hedge for existing foreign currency exposure,
nor is it using swaps for a purpose other than hedging the currency exposure created by FC debt,
or in our terms, creating synthetic local currency debt.
3.2.2 Theory and Hypotheses on Currency Debt Type
Financial theory suggests that a firm’s operating and financial decisions are often
interdependent. Foreign operations and the availability of foreign capital markets adds
complexity to the process of determining optimal operating and financing policy. For example,
when a firm considers opportunities outside of its home country, it must explicitly consider
operating decisions such as what markets to expand into, the location of its suppliers and
competition, as well as financial considerations such as access to capital markets both domestic
and foreign. Because our data do not allow us to investigate firms’ foreign operating decisions in
detail, we concentrate on firms’ financial decisions.23 While theories noted earlier suggest
determinants of total debt, additional insights are needed to further explain the allocation between
natural local, synthetic local, and foreign currency debt.24 Fortunately, existing financial theory
and evidence provides a framework for developing testable hypotheses. In this section we
discuss the predictions of existing capital structure theory and also present some new hypotheses
based on related theory and prior evidence. We note that Table 3 (third through seventh columns)
provides a summary of the predictions for debt type and mix. In these columns we detail the
23 Although we have considered foreign EBIT as an exogenous variable while examining the determination of the alternative types of debt, we also attempt to understand a firm’s decision on the mix of local and foreign currency cash flow. As one would suspect, firms with a high percentage of foreign EBIT also tend to have a large percentage of foreign sales. In addition, such firms are more likely to be audited by a big 5 accounting firm, a variable, which potentially proxies for a firm’s reputation. Also, firms from the finance and real estate (SIC 6) and transportation (SIC 4) industries are less likely to have high foreign EBIT. Finally, for about half of our sample we have detailed foreign ownership data and we find a significant positive relation between the percentage of equity owned by foreigners and the percent of foreign EBIT. 24 In our subsequent analysis, we easily reject the null hypothesis that the factors determining each type of debt use are identical.

19
predictions for those variables which differ across debt types or which differ from the predictions
for total debt.
The static trade-off theory makes predictions about the preferred currency denomination
of debt. For example, direct costs of debt issuance are likely to vary across markets. The most
obvious of these costs is the level of (perceived) real interest rates in the local relative to foreign
borrowing markets. Kim and Stulz (1988) suggest that clientele effects can lead to differences in
borrowing costs across markets. Miller and Puthenpurackal (2000) find evidence that foreign
firms tend to issue in the Yankee market when the relative interest cost is low. Graham and
Harvey (2001) find that 44% of firms responding to their survey report that lower foreign interest
rates are “important or very important” in the decision to use foreign debt. We hypothesize that
the difference between local and foreign interest rates should be positively associated with the use
of FC debt and negatively related to the use of local currency (NLC and SLC) debt.25 Likewise,
the interest rate differential should be negatively related to both the ratio of local currency (NLC
and SLC) debt to total debt and the ratio of SLC debt to all LC debt.
The trade-off between foreign versus local debt could also be motivated by differences in
tax treatment (see Hodder and Senbet (1990)). Several studies have examined the use of foreign
debt by US multinationals as it relates to international tax issues. For example, Newberry and
Dhaliwal (2001) find that debt location is determined in part by jurisdiction-specific tax-loss
carry forwards and limitations on foreign tax credits. Foreign debt may also allow for income
shifting between multinational subsidiaries. Graham (2001) provides a summary of the
incentives for US multinationals to use foreign debt. It is difficult to identify variables which
would be directly related to potential tax benefits of foreign currency debt since we do not have
detailed information on the debt’s currency, whether it is directly a liability of the firm or instead
a liability of a foreign subsidiary, or the availability of foreign tax credits. Furthermore, since
some of the debt could be foreign currency debt issued in the local market (e.g., by local or
foreign branch banks), these issues may not even be relevant to some firms in our sample that are
identified as FC debt users. Lastly, we are not aware of any significant special tax treatment of
foreign debt in our East Asian countries, yet it may be that firms can undertake some type of tax
arbitrage that we have not been able to identify. If this is the case, a specific prediction is again
difficult since firms with greater potential tax liabilities (rates) may seek additional tax arbitrage
opportunities with foreign debt and therefore report lower actual taxes paid (i.e., have a lower
25 The use of derivatives in perfect capital markets converts foreign currency (risk-free) interest rates back to local currency (risk-free) interest rates. If there exists differences in credit spreads across markets that are not priced into derivative contracts, then there can still be differences in real borrowing costs between NLC and SLC debt. Unfortunately, we do not have access to data on credit spreads.

20
average tax rate).26 For these reasons, we resort to using the average tax rate and Miller’s gains-
to-leverage as proxies for the tax advantages of debt.
Firms must undertake an additional costly transaction in the derivatives market in order
to create SLC debt. We therefore predict that proxies rela ted to the costs of derivatives such as
bid-ask spreads and market liquidity should affect the usage of SLC debt. Anecdotal evidence
also suggests that firms with a family affiliation may have closer relationships with dealers or a
family member bank that facilitates access to the derivatives market, implying more SLC debt for
such firms.
Agency theory and the need for lender monitoring may also determine the preferred level
of foreign debt. The arguments of Diamond (1984) imply that if local lenders can gather
information on local firms at a relatively low cost, firms with high monitoring costs should
borrow relatively more locally. Foreign lenders may be headquartered in a very different market
environment with a different language, culture, regulatory structure, and so forth. These market
differences make it costly to gather and process locally-based relationship information.
Anecdotal evidence suggests that foreign lenders prefer loans associated with hard assets because
of the high costs of monitoring EA borrowers. Consequently, we predict a positive relation
between asset tangibility (and perhaps committed capital expenditures) and the level of FC debt.
Likewise, asset tangibility should be negatively related to the ratio of LC debt to total debt. If
information asymmetries, and therefore potential agency costs, are larger for firms with greater
growth potential, the market-to-book ratio should also determine the mix between local and
foreign borrowing. Specifically, we predict that firms with high market-to-book ratios will get
relatively better terms from local lenders.
Prior studies by Brailsford et al. (2001) and Wiwattanakantang (1999) find a significantly
positive relation between large block shareholders, such as family or group ownership, and higher
leverage in Australia and Thailand, respectively. These studies support the theory that large
shareholders have more incentive to monitor management thereby lowering agency conflicts.
Therefore, we expect that family affiliated firms across East Asia should have a higher level and
proportion of FC debt.
Agency costs of debt can also lead to a signaling explanation for the use of foreign debt.
Extending the logic of Ross (1977), if it is costly for a firm to use foreign capital in terms of
increased regulatory scrutiny or distress costs, then firms can credibly signal their
creditworthiness by accepting these potential costs. A related signaling theory by Titman and
26 Other research into tax motivations for debt use has identified similar potential problems; see, for example, Graham (1996a).

21
Trueman (1986) implies that a firm may choose to obtain debt from a high quality, possibly
foreign, lender to signal firm quality to outside investors. For this reason, we expect that firms
which have agreed to additional scrutiny and developed a reputation in foreign markets via a
foreign equity listing are also more likely to use FC debt.
The pecking order hypothesis of Myers and Majluf (1984) may extend to the preferred
currency denomination of financing if local investors have better information than foreign
investors. For example, firms would first choose LC debt then FC debt. Once debt markets are
exhausted, firms would turn to local equity markets and then finally to foreign equity markets.
This suggests that the relation between profitability and leverage should be strongest for LC debt,
and that profitability should be negatively related to the ratio of LC debt to total debt. Similarly,
firms with foreign equity may have already moved down the pecking order and therefore be
expected to have lower levels of local and foreign currency debt. It is difficult to make
predictions about the placement of SLC debt in the pecking order since creation of SLC debt may
be a decision that managers can make independent of the borrowing decision. Yet in some cases,
lenders require firms to hedge currency risk or hold cash reserves as part of the loan agreement,
and firms may find this added constraint costly. As a consequence, SLC debt is likely below FC
debt in the pecking order and we predict a negative relation between a foreign equity listing and
the ratio of SLC debt to all LC debt. Perhaps the most direct implication of the pecking order
hypothesis is that FC debt will appear as a complement to local debt (unlike the prediction of the
trade-off theory that implies it is a substitute) since firms will use FC debt only after exhausting
LC debt. Recall the evidence in Tables 2 and 4 indicates that on average firms with FC debt have
greater leverage.
As suggested by the cases of CP Intertrade and Banpu, a popular explanation for FC and
SLC debt use by EA firms is that local debt markets are insufficiently deep.27 For example, in
East Asia local bond markets are often illiquid and banks typically limit the amounts they will
allow individual firms to borrow. This suggests that larger firms and firms with large investment
funding needs may require access to foreign borrowing markets to obtain the desired level of debt
financing. We term this the market depth hypothesis. As previously noted, the log of total sales
in USD is our proxy for firm size and committed capex is a proxy for the preferred level of
investment.
Another aspect of the choice regarding currency denomination is the role of preferred
maturity structure. Generally, EA public debt markets have a very limited number of issues with
an original maturity greater than 5 years which suggests the costs of issuing local long-term debt
27 See also “The Overseas Option,” AsiaRISK, February 1997, p. 19.

22
are high. Still, firms may prefer long-term debt for a variety of reasons.28 This suggests firms
may have an incentive to use FC debt as a mechanism for obtaining long-term debt. Ideally, we
would like to analyze the maturity structure of NLC, FC, and SLC debt. Unfortunately, precise
data concerning the effective maturity of derivative contracts is not available. Even if these data
were available, it may not be possible to accurately describe the intentions of managers, since
anecdotes suggest many firms intended to hedge currency risk associated with long-term debt by
rolling over short-term derivative positions. However, we are careful to control for the maturity
structure of debt to ensure that the effects we measure are not driven by factors that motivate
maturity structure instead of currency preference.29 We examine two control variables for
maturity structure. First, we calculate the percentage of total debt that is long-term (more than
one year to maturity). We predict that firms with long-term debt will have more FC debt.
Second, we take the difference between the percentage of debt originally denominated in FC that
is long-term minus the percentage of debt originally denominated in local currency that is long-
term.30 We predict this variable to be negatively related to NLC debt levels and positively related
to FC debt levels.
A very important aspect of foreign currency debt is the exposure it creates to exchange
rate fluctuations. We hypothesize that firms which can mitigate exchange rate risk or bear it at a
low cost use more FC debt. Specifically, firms with higher foreign EBIT will use more FC debt
since foreign cashflow provides a natural exchange-rate hedge. Likewise, firms could keep cash
reserves in foreign currency as a buffer against exchange rate movements, hence we hypothesize
a positive relation between foreign cash holdings and FC debt levels.31 Firms with other
motivations for using foreign currency debt, but without significant foreign EBIT or cash
holdings, should be more likely to hedge out the currency risk with derivatives (i.e., use SLC
debt). Corporate risk management theory also suggests that certain types of firms are more likely
to manage foreign exchange risk with derivatives (see Smith and Stulz (1985) and Froot et al.
28 See Barclay and Smith (1995) for a detailed discussion and tests concerning the maturity structure of debt for US firms. 29 We thank the referee for pointing out this possibility. 30 Intuitively this variable measures the difference in maturity between foreign and local currency debt. For firms without any original issue foreign currency debt we set the variable equal to zero. Consistent with the hypothesis that firms use FC debt to obtain more long-term debt the variable has a mean value of 0.15. We are concerned about including this variable in the specification in Tables 5 and 6 because the long-term debt percent is likely to be determined jointly with the dependent variables and is correlated with other explanatory variables. Therefore, we only report results with the second control variable in these tables. In the performance analysis we use the percentage of long-term debt. With the exception of the implications for asset tangibility (which has been shown by prior studies to be closely related to debt maturity structure) the results are unchanged. Complete tables with both control variables are available on request. 31 For a detailed discussion of alternative risk management practices see, Géczy et al. (2000) and Petersen and Thiagarajan (2000). Opler et al. (1999) discusses the relation between cash reserves and financial risk.

23
(1993), among others). For example, smaller firms have greater proportional costs of financial
distress, and less profitable firms have higher probability of encountering financial distress. High
growth firms should be more likely to manage financial risk in an attempt to guarantee that funds
are available for investment. On the other hand, larger firms should be more likely to use
derivatives in the presence of significant fixed costs of hedging.
Finally, we investigate a theory of optimal risk sharing by lenders. If local EA lenders
are prevented from making loans to foreigner borrowers because of high costs or regulation, then
an optimal risk-sharing incentive will determine which firms are more likely to use foreign debt.
Specifically, local lenders will prefer “higher quality” firms with less country-specific risk since
their loan portfolios will be restricted to local borrowers. We use a firm’s operating margin as a
proxy for firm quality. 32 As such, this theory predicts a positive (negative) relation between
operating margin and local (foreign) debt use. Note that this prediction is distinct from the
prediction made by the pecking-order hypothesis which suggests a negative relation between
operating margin and all types of debt use. We also consider the standard deviation of operating
margin as a measure of business risk and predict a negative (positive) relation between this
measure and NLC (FC) debt use. If lenders are choosing borrowers based on their own risk-
sharing incentives, firms may not have the optimal currency mix of debt. In this case, firms more
likely to use FC debt are also more likely to change the currency mix of their debt with
derivatives and thus have a higher proportion of SLC to all LC debt.
3.2.3 Univariate Results
Panel B of Table 2 reports summary statistics for FC debt users and non-users by country.
Since these univariate statistics only compare FC debt users with non-users, we discuss them here
briefly and defer a more detailed discussion to the multivariate analysis.
In our entire sample of 327 firms, 202 (61.8%) use foreign debt in 1996. FC debt usage
rates vary considerably between countries from a low of 29.3% (12 out of 41) for Malaysian
firms to 100% (35 out of 35) for South Korean firms. For FC debt users, there is also variation in
the percentage of total debt that is denominated in foreign currency (not tabled); 14.8% of foreign
debt users have less than 20% of their total debt in foreign currency, and 10.9% have all of their
debt in foreign currency. However, this dispersion is not explained just by home country. In all
countries, FC debt users have an average of more than 30% of their debt denominated in foreign
32 While ideally we would like to use a measure of the country risk inherent in a firm’s assets, the only feasible way of doing this with our data is to estimate an equity beta and then adjust for leverage to get an “asset beta.” Since this calculation requires both the use of debt to calculate an explanatory variable and an assumption of the appropriate model for de-levering, we do not pursue this approach.

24
currency. Overall, FC debt is used more frequently by firms in the middle -income countries
(73.0% of firms versus 47.2% of firms in high-income countries). On average, FC debt makes up
about 33.2% of EA firms’ total debt. SLC debt makes up another 8.6%. If we look only at firms
with foreign debt the numbers are, of course, higher; 41.7% of total debt is foreign and 10.7% is
synthetic local debt. Hence, together these types of debt make up roughly half of EA firms’ total
debt.
The most immediate result in Panel B of Table 2 is the higher total debt levels of FC debt
users. For each individual country and all countries combined, FC debt users have significantly
more total debt. Note, this result is consistent with the significant positive coefficient on the FC
debt dummy variable reported in Table 4. The differences are typically economically significant.
Total debt ratios for the all-country and middle -income averages are more than twice as large for
firms with FC debt: 0.345 for FC debt users versus 0.146 for nonusers across all countries. NLC
debt ratios are not significantly lower for FC debt users in most countries and are actually
significantly higher in Malaysia and Thailand. Foreign debt users also have a higher percentage
of long-term debt in all countries (though in Indonesia the difference is not statistically
significant). For all countries, 66.1% of debt is long-term for foreign debt users, whereas only
42.7% is long-term for non-users. Together, these facts provide support for the market depth
hypothesis.
Foreign debt users are consistently larger and differences are statistically significant for
middle-income, high-income, and all-country aggregates as well as for Hong Kong / China,
Taiwan, and Thailand individually. FC debt users also have significantly higher committed
capital expenditures in many countries and in aggregate. These findings are also consistent with
the market depth hypothesis. The univariate results do not support the risk-sharing theory of debt
type. In general, there is no consistent difference in operating margin or business risk between
FC debt users and non-users. Only for all high-income countries together is there a significantly
greater amount of business risk for foreign debt users. Consistent with the prediction of agency
theory FC debt users have more tangible assets in nearly all countries and significantly lower
market-to-book ratios though only the aggregates are reliably different. The evidence in Table 2
also reveals that FC debt users have higher levels of foreign EBIT and cash reserves, consistent
with risk management theory.33 These results are significant at the aggregate level but vary
considerably from country to country.
33 We are concerned that higher levels of foreign cash could be from proceeds of foreign bond offerings that have not been utilized or converted to local currency. Anecdotal evidence suggests that the majority of the FC debt was bank debt, which is likely to be immediately utilized, making this less of a concern.

25
Finally, average tax rates are modestly lower for foreign debt users. However, in this
univariate analysis it is not possible to determine if this is the result of a successful tax arbitrage
strategy using foreign debt or simply the result of lower taxable income (due to a greater debt tax
shield from higher debt levels) resulting in a lower average tax bracket.
Overall, these results are generally consistent (or at least not inconsistent) with the
predictions of agency theory and costly monitoring, the market depth hypothesis and the risk
management theory. We now turn to a multivariate analysis, which should more precisely
identify specific determinants of each type of debt.
3.2.4 Multivariate Results
For the multivariate analysis, we utilize a TOBIT specification with debt-to-value ratios
as the dependent variables because not all firms issue all types of debt (i.e., we have a point mass
at zero for each type of debt). We estimate two types of regressions. The first set, discussed
here, are from a one-step analysis and include only variables assumed exogenous. The second is
a simultaneous-equations TOBIT model similar to that of Nelson and Olson (1978) addressing
endogeneity related to the debt-to-value ratios. Details of this specifications and some results are
presented in Appendix B. In general, the results presented in the appendix are similar to the
results from the simpler analysis presented subsequently. Because of the strong assumptions
needed for inference with simultaneous-equation TOBIT models, we discuss them here only
where they add additional insight or differ significantly from the one-step specification.
Table 5 reports results from estimating the one-step TOBIT regressions.34 The first
column shows coefficient estimates for the specification with natural local currency debt as the
dependent variable. Several of the explanatory variables are significant predictors of NLC debt
levels. Firm size is positively related to local debt levels. Both operating margin and the market-
to-book ratio have strongly significant negative coefficients. These results are generally
consistent with the findings of other studies (Rajan and Zingales (1995) and Booth et al. (2001))
of total debt ratios and are consistent with the static trade-off, pecking-order, and agency cost
theories of total capital structure.
Other results provide additional support for the static trade-off theory. As predicted, the
interest rate differential between the local currency and LIBOR has a significant negative
coefficient. The country-specific variable representing Miller’s gains-to-leverage is positive and
34 Although we do not include country dummy variables in these regressions so that we can examine the impact of alternative country-specific variables (e.g., Miller gains-to-leverage, interest rate differential etc.), we standardize firm-specific explanatory variables by subtracting their respective country medians. In alternative specifications we have also employed country dummies without significant qualitative changes in our results (results not reported, but briefly discussed in text).

26
significant suggesting that EA companies consider the tax-advantages of local debt. (However,
the coefficient is no longer significant in the alternative specification reported in Appendix B).
Evidence that firms seek foreign lending markets to extend the maturity structure is
provided by the negative coefficient on the variable measuring the difference between foreign and
local long-term debt percentages. Specifically, firms with more long-term foreign debt use less
NLC debt. The role of FC debt as it relates to local debt use is more directly addressed by the
specification reported in Appendix B. In this specification, we find that FC debt levels do not
explain NLC debt levels, yet there is a strong negative relation between SLC and NLC debt
indicating that SLC debt and NLC debt are substitutes. We also note that, controlling for the
extent of FC debt usage reduces the effect of variables that we predict would primarily affect FC
debt usage such as foreign cash and differences in maturity.
There are not significant industry effects for NLC debt levels. The coefficient on the
financial services and real estate (SIC6) dummy is somewhat larger than others but not
statistically different at conventional levels.35 We also re-estimate the model using country
dummies instead of the country-specific variables. In this specification, Korean firms use
significantly more local debt. While most coefficient estimates are very similar in value and
significance, this reduces the coefficient on sales so that it is no longer statistically significant
suggesting that size effects are at least partially country-specific. In sum, we note that the most
important factors for NLC debt are also important factors for total debt.
Table 5, column 2 reports results on the determinants of FC debt. Overall, the results
support several of the theoretical arguments for FC debt use. Direct costs of debt issuance are
also an important determinant of foreign debt, as suggested by the significant positive coefficient
on the interest rate differentia l. The positive coefficient for asset tangibility is consistent with
agency theory.36 The highly significant and positive coefficients on size, committed capital
expenditures, and long-term debt percent all support the market depth hypothesis. Similar to the
results for NLC debt, the market-to-book ratio is negatively related to FC debt levels. As
predicted by the risk management theory, both foreign EBIT and foreign cash reserves are
significantly positively related to foreign debt levels. Access to foreign equity markets, as
measured by the foreign listing dummy variable, is negatively related to foreign debt levels.
Recall that this may be a revealed preference for equity as suggested by the extended pecking
35 In all there are 35 firms in our sample that are classified as SIC6. Because some of these firms might be considered financial (e.g., real estate management and financing) we have also estimated all equations excluding these firms and the results are nearly identical. 36 Several pieces of evidence presented here suggest that firms using foreign debt are less informationally opaque. This is consistent with Berger et al. (2001), which finds that foreign-owned banks in Argentina are less likely to lend to informationally opaque small businesses than domestically-owned banks.

27
order hypothesis. Not significantly related to FC debt levels are the average tax rate, business
risk, operating margin, family affiliation, and the country’s tax gains to leverage.
As is the case for NLC debt, there are not significant industry effects except for financial
services and real esta te firms (SIC6) which use somewhat less FC debt. Inclusion of country
dummies (not reported) reveals that Indonesian and Thai firms use significantly more FC debt but
leaves the sign and approximate significance of most other coefficients unchanged (the exception
being the foreign equity listing dummy variable, which is no longer statistically significant).
Using broader country classifications based on middle versus high income suggests a slightly
higher use of FC debt by middle-income countries, consistent with the univariate results reported
earlier. Results correcting for endogeneity (reported in Appendix B and Table A) show similar
relations, though there are minor differences.37 Both NLC and SLC debt are positively related to
FC debt levels, again suggesting that local debt (both natural and synthetic) and foreign debt are
complements.
The third column of Table 5 shows estimation results for SLC debt. We limit the sample
used in this estimation to firms with foreign debt since this is a precondition for having SLC debt
and we also exclude South Korean firms.38 The statistically significant results are limited and
seem to only support the static trade-off theory and risk management theory. The negative
coefficient for the interest rate differential suggests that firms will use less SLC debt as the
(perceived) effective interest rate on SLC debt increases relative to that for FC debt. Foreign
EBIT is negatively related to SLC debt use suggesting that firms less able to service FC debt with
foreign cashflows use more SLC debt (i.e., are more likely to hedge). The negative coefficient on
sales is consistent with smaller firms more actively managing foreign exchange risk.
Wholesale trade and retailing firms (SIC5) use significantly more SLC debt than firms in
most other industries. Replacing the country-specific variables with country dummies reveals
that Philippine firms have significantly less synthetic local debt than similar firms in the region.
Correcting for endogeneity (Appendix B) shows that NLC debt levels do not explain SLC debt
levels but that there is a positive effect of foreign debt levels on SLC debt use. This suggests that
the more foreign debt a firm uses, the more likely it is to convert some of it to SLC debt. The
only additional result in this specification is the negative coefficient on long-term debt percent.
37 For example, in this specification the average tax rate becomes statistically significant. This provides some evidence that FC debt users may be able to undertake a tax arbitrage (hence the negative coefficient on the average tax rate). Finally, in this specification, asset tangibility is no longer statistically greater than zero. 38 Recall Korean firms are prevented by law from using foreign currency derivatives to hedge foreign debt exposure. Together these cut our sample size roughly in half which, of course, leads to lower power for inference.

28
Other research (see, e.g., Johnson et al. (2000)), as well as our own hypotheses, suggest
that additional country factors could be important in explaining cross-country differences in EA
firm financial factors. We examine a large set of country factors such as creditor rights, judicial
efficiency, legal origin, GDP per capita, international country risk, percentage of family-related
businesses, and foreign bank presence (results not reported). These variables do not have
additional explanatory power for our sample beyond that provided by the interest rate differential
and the Miller tax gains-to-leverage. We also examined factors related specifically to the
derivatives market such as measures of the spread on near-term FX forward contracts and
derivative market trading volume in 1996. These also do not provide additional explanatory
power even for the use of SLC debt.
All told, the results from in Table 5 confirm the need to examine capital structure choice
at a disaggregate level, as we are able to identify factors that uniquely determine each type of debt
in addition to factors common across multiple types of debt.
We also test the predictions regarding the ratios of certain types of debt. Examining
ratios is important for two reasons. First, it is possible that the analysis in levels confounds
identification of factors that affect the mix of debt differently than the level of debt (such as size,
operating margin, and market-to-book). Second, there may be factors related to the extent of debt
use that are not modeled and cause the debt-to-value equations to be misspecified. Examining
debt ratios can mitigate these problems and more accurately reveal factors that affect a firm’s
choices concerning the mix of debt types.
Table 6 shows results from TOBIT regressions on the determinants of (1) all local
currency debt (i.e., NLC plus SLC) as a percent of total debt and (2) SLC debt as a percent of all
local currency debt. Recall that the last two columns of Table 3 summarize the predictions for
these tests. The results and conclusions are generally consistent with those from Table 5. In the
first column, the negative coefficients on sales and committed capex and the posit ive coefficient
on long-term debt percent (FC-LC) support the market depth hypothesis. Consistent with costly
monitoring and agency cost theory are the negative coefficient on asset tangibility and the
positive coefficient on market-to-book. The significant negative coefficients on foreign EBIT
and foreign cash support the risk management theory.
The second column of Table 6 presents additional evidence in support of the risk
management orientation of synthetic local debt. As predicted by risk management theory, the
coefficient on sales is negative and the coefficient on market-to-book is positive. The coefficients
on foreign EBIT and foreign cash reserves are still negative, although not significant, in this
specification. Although the specific variables that are significant here and in Table 5 differ

29
somewhat, in both specifications the results are supportive of risk management theory. The
negative coefficient on the interest rate differential again suggests that the trade-off between
financial risk and financing costs motivates use of SLC debt.
Given the results from prior research, it is surprising that the family affiliation dummy
variable is nowhere a significant predictor of debt use.39 More detailed ownership data are
available for a subsample (242 of 327) of our firms. In alternative specifications (not reported),
we also include the percent of each company owned by the 5 largest shareholders and a dummy
variable equal to 1 for a pyramid ownership structure. However, the results do not provide
additional insights.
Overall, the results in Tables 5 and 6 paint a clear and consistent picture of the use of
NLC, SLC and FC debt use by EA firms. NLC debt use is generally determined by the same
factors that explain total debt use consistent with existing theories of capital structure. EA firms
with significant capital needs (because they are large or have capital intensive projects) use more
foreign currency debt because local currency debt markets are not sufficiently deep. Likewise,
FC debt use may be motivated by better availability of long-term debt. The ability to manage
financial risk is also an important determinant of FC and SLC debt use. Firms appear to use
foreign cashflows and cash holdings as natural hedges for exchange-rate risk associated with FC
debt. Factors explaining SLC debt usage are similar to factors predicted by risk management
theory for explaining derivative use. In addition, many firms apparently seek lower borrowing
costs in foreign currency though it is clear that FC debt is not a substitute for NLC debt. Firms’
use of foreign currency debt is also related to proxies for agency costs. For example, asset
tangibility is positively related to FC debt use. We find no evidence supporting the optimal risk-
sharing theory.
4 Debt Type and Firm Performance During the Asian Crisis
4.1 Financial and Operating performance
Except for Hong Kong and China, all of the countries in our sample experienced
exchange rate depreciations during the 1997 Asian financial crisis. For this reason, our sample
offers a unique opportunity to examine the relative risks of different types of debt during a
financial crisis. Specifically, we seek to disentangle the relative influence of debt type on
financial and operating performance during the crisis. For example, if firms had unwisely used
excessive amounts of foreign debt prior to the currency crisis, as Krugman (1999) and Aghion et
al. (2001) suggest, then these firms should perform relatively worse during or after the exchange
39 See, for example, Claessens et al. (2002), Claessens et al. (2000), and Hoshi et al. (1990).

30
rate depreciation. On the other hand, if SLC debt is used as a hedge against foreign debt
exposure, as our results in the previous section suggest, then one might expect a significantly less
negative relation between SLC debt use and firm performance. Some existing anecdotal evidence
is suggestive of such a relation for EA firms.40 Finally, because our data include estimates of the
net financial exposure related to foreign debt (i.e., unhedged foreign debt minus foreign cash
reserves), we can calculate the part of the change in a firm’s equity value that is directly the result
of an increase in foreign financial liabilities (or rarely, assets). This calculation provides some
insights into whether or not the equity markets overreacted as some observers have suggested. 41
We break performance measures into two groups, one measuring financial performance
and a second describing operating performance. Financial performance measures include the
excess equity return during the crisis period, the interest coverage ratio in the post-crisis period,
and the modified Altman’s Z-score (see Altman (2000)) in the post-crisis period. Operating
performance measures include the changes from fiscal years 1996 to 1998 in the logarithm of
sales, operating margin and net property, plant, and equipment (PPE) standardized by sales.
On average, the equity market performance of an EA firm should be adversely affected
by all types of debt during the financial crisis. This negative relation is expected simply due to
the “leverage effect” of debt (see Modigliani and Miller (1958)) and the negative equity returns
experienced during the crisis. Market performance is measured by calculating a firm’s total stock
market return during the crisis period less the local market index return during the same period.
This is a measure of relative firm performance as we correct for overall country returns. The
interest coverage ratio (total EBIT divided by total interest expense) is widely used as a measure
of financial condition in the financial distress literature (see Andrade and Kaplan (1998) for a
discussion). Altman et al. (1995) find a modified version of the Altman (1968) Z-score useful in
predicting financial distress among Mexican firms that had issued Eurobonds denominated in US
dollars. Details of the calculation are provided in Appendix A. We use 1998 financial data to
calculate the interest coverage ratio and Z-score since the full impact of the crisis was not
reflected in 1997 financial statements. We concentrate on interest coverage and the Z-score
because of the extensive prior evidence relating these variables to financial distress.
To analyze the effect of the various types of debt on financial performance, we estimate
regressions with performance measures as dependent variables and the debt components as
40 See, “Lessons Not Learned,” AsiaRISK, December 1999, p. 5. See also Allayannis and Weston (2001) for evidence suggesting a positive relationship between the use of FX derivatives and firm value in a sample of US multinationals exposed to FX risk. 41 Several commentators, including US Federal Reserve Chairman Greenspan, suggested that the crisis was due at least in part to a “panic” by investors.

31
predetermined independent variables. We also include other independent variables to control for
additional factors that may affect performance such as the percentage of debt that is long-term,
foreign EBIT and cash, firm size, a foreign equity listing, and country and industry dummy
variables (not reported). The first column of Table 7 shows results of the estimation using excess
equity returns during the crisis year as the dependent variable. As expected, debt levels, regardless
of type, have a significant negative effect on a firm’s equity return during the crisis. Of more
interest is the relative magnitude of the regression coefficients on the debt variables. Contrary to
the conclusions of prior research, FC debt use is not related to significantly larger declines in
equity value than those associated with NLC debt (i.e., the coefficient of -0.415 for FC debt is not
significantly different than the coefficient of -0.343 for NLC debt).
A surprising result reported in the first column of Table 7 is the large negative coefficient
on synthetic local currency debt. The value of -1.202 is significantly more negative than either
the coefficient for NLC or FC debt at the 5% level. Contrary to our expectations, this suggests
that foreign debt hedged with currency derivatives (i.e., SLC debt) is associated with a
substantially greater decline in market value than either natural local currency or unhedged FC
debt. This counterintuitive result is likely due to developments in the derivatives market for EA
currencies during the crisis. Anecdotal evidence indicates that liquidity in the foreign exchange
derivatives market dried up during the currency crisis.42 For example, several EA countries went
so far as to temporarily discourage or prohibit the writing of derivative contracts to deter attacks
by speculators. If risk from foreign currency debt is hedged by factors such as foreign EBIT and
foreign cash reserves (as suggested by our prior results), the synthetic local currency debt likely
represents the foreign debt that is exposed to a currency depreciation before hedging with
derivatives. In this sense, SLC debt may measure the marginal exchange rate exposure of foreign
debt if firms were unable to keep their hedges in place. The inability to rollover hedges
effectively converted the synthetic local currency debt back into foreign currency debt. The
collapse of the derivatives market was public knowledge, hence it could easily have affected
equity prices during the crisis.
Some hard evidence also suggests that the breakdown of the derivatives market during
the crisis affected the ability of firms to roll-over their derivative positions. Bank for
International Settlements (1999) data show that countries in EA had virtually no swap
42 For example, the TMA Journal, Sept/Oct 1999, reported: “During periods of extreme volatility, liquidity in Asian currencies evaporated, making the cost of hedging astronomically high…liquidity dropped to record low levels, as indicated by the widening of the bid-offer spread. For the Rupiah, the spread widened to 40 percent, from pre-crisis level of 1 percent, pointing to the existence of a one-sided market (as everyone rushed to hedge against the depreciating Asian currencies).” See also, “Currency Special Report:

32
transactions in 1998 with maturities greater than one year. However, 73% of firms’ foreign
currency debt had a maturity of greater than one year in 1997. This highlights the probable
maturity mismatch between foreign currency debt and available derivative products, which would
expose firms unable to rollover their hedges during the crisis. Data on the actual hedging
practices of our sample firms are also consistent with this conclusion. For 1997, data are
available for 67 of the 70 firms that hedged in 1996. Of these 25 (37%) decrease their percent
hedged and 7 (11%) increase their percent hedged; the average percent of foreign debt hedged
falls from 65.8% to 49.1%. For 1998 we have data on 39 of the 70 firms that hedged in 1996: 32
(82%) decrease their percent hedged and 3 (8%) increase their percent hedged; the average
percent hedged falls drastically from 58.6% to 14.9%.
Table 7 (column 1) also shows that firms with more foreign EBIT,43 larger firms, and
firms with a foreign equity listing perform significantly better during the crisis. This last result is
consistent with the findings of Mitton (2002) regarding the affect of ADRs on returns. Finally,
there are not significant differences across countries or industries after taking into account the
firm-specific explanatory variables.44
This evidence is generally consistent with equity markets reacting rationally to the
currency depreciations, in so far as factors expected to influence returns frequently do and the
signs are as predicted. However, the analysis of returns does not allow us to determine if the
magnitude of the market decline was appropriate given the change in exchange rates. We
investigate this in the next subsection.
The second and third columns of Table 7 report results with interest coverage ratio and Z-
score as the dependent variables. Qualitatively the results are similar to those for equity returns:
Each type of debt has a significant negative influence and foreign EBIT has a significant positive
effect. One difference is that firms with a higher percentage of long-term debt tend to have lower
Asia Gets Older and Wiser,” AsiaRISK, October 1999, p. 23. Finally, our discussions with dealers confirm the lack of a liquid currency derivatives market during the crisis. 43 Several explanations can account for this. First, the previously noted risk management benefits that foreign EBIT provides to foreign currency debt users should increase a firm’s ability to weather the crisis. Second, foreign currency cashflow from outside EA appreciated in local currency terms, so even firms without FC debt could benefit from a high percentage of foreign EBIT. Finally, firms with significant export business became more competitive (when compared to non-EA firms) after the currency depreciations. The first two arguments also suggest that foreign cash reserves should be positively related to equity returns, yet the coefficient is not statistically different from zero. This could be interpreted as indicating that foreign cash reserves are not as effective a risk management tool as foreign EBIT or indirect evidence that the positive performance related to foreign EBIT is due primarily to increased competitiveness of EA exporters. 44 Our market return measure already adjusts for the country aggregate market return, so country dummy variables only capture differences in our sample firms relative to the whole market.

33
interest coverage ratios and Z-scores. The overall fit of these regressions is quite good with
adjusted R-squareds of 55.1% and 69.2%, respectively.
For both regressions, the magnitudes of the coefficients on debt type are statistically
indistinguishable suggesting that each debt type had a similar impact on financial performance.
This result has two important implications. First, the result for synthetic local debt contrasts with
the previous result using equity returns as the dependent variable. Ostensibly, this could be
interpreted as the equity market over-estimating the impact of the derivative market failure on the
financial performance of firms with SLC debt. However, there may again be a rational
explanation related to exchange rate changes and foreign currency derivatives. It was widely
believed by market participants in the beginning of 1998 that further currency depreciations could
lead to a spread of the political unrest seen in Indonesia and a further weakening of equity
markets. Since derivative markets were a less viable alternative for hedging against exchange-
rate movements, equity prices most likely adjusted to include a risk premium related to the
chance of additional currency declines.45 Yet in the post-crisis period, the depreciation of
currencies stopped, exchange rate volatilities declined significantly, and equity markets
rebounded (see Figure 1 and Table 1). Further support for this argument is provided by the
somewhat higher equity returns for firms with synthetic local debt in the post-crisis period
(results not reported). Hence, the fact that equity returns, but not financial performance, were
affected significantly more by SLC debt need not be attributed to market over-reaction but instead
could be due to an increase in the risk premium associated with FX risk.
Second, and perhaps more surprising, these results do not support both anecdotal
evidence and conclusions of prior research indicating excessive use of foreign debt as a primary
culprit in the Asian financial crisis (at least for non-financial firms). To the contrary, the
evidence suggests that foreign debt had roughly the same impact as local debt on market and
financial performance. Implicitly, firms appear to have done reasonably well in determining
appropriate levels of FC debt relative to local debt by considering risk management tools such as
foreign EBIT and cash reserves.
It is also important to examine if and how the operations of firms were affected by each
type of debt. For example, prior research finds that financially distressed firms lose customers,
get less favorable terms from suppliers, are forced to discount products, and reduce new
investment to below the optimal level (see Altman (1984), and Opler and Titman (1994), among
others). Following prior researchers, we conjecture that changes in sales reflect changes in the
customer base. Changes in the operating margin capture less favorable terms from suppliers or a

34
need to discount products. Finally, changes in net property, plant, and equipment reveal changes
in investment policy.
Table 8 reports results from tests examining the effects of each debt type on different
aspects of operating performance. These regressions also include industry and country dummy
variables, but the coefficients are not reported to conserve space. In general, the impact of debt
on operating performance appears rather limited. Results in the first column suggest that firms
with relatively more FC debt tended to experience an increase in sales during the Asian crisis. As
with the findings reported in Table 7, this is contrary to suggestions that FC debt was associated
with under-performance. Instead, the positive relation between FC debt and the change in sales
supports the prediction of Bris and Koskinen (2002) that the firms most likely to benefit from a
depreciation (i.e., exporting firms), will use more debt. The positive coefficient on foreign EBIT
is also consistent with this theory. However, the negative coefficient for SLC debt (significant at
the 10% level) is consistent with the financial distress hypothesis and the prior evidence
suggesting that SLC debt had a differential adverse effect on performance.
The second column of Table 8 repeats the analysis using changes in operating margin
around the crisis as the dependent variable. In this case, the only significant relation is the weak
negative effect of SLC debt (again consistent with the prior findings). Results in the third column
of Table 8 reveal a positive relation between FC debt and changes in net PPE, our proxy for
changes in investment. This finding also supports the theory of Bris and Koskinen (2002) which
predicts that prior to a depreciation exporting firms will underinvest due to the debt overhang
problem, but once a depreciation occurs these highly levered firms will undertake the foregone
investments. Overall, the results in Table 8 are consistent with findings of Andrade and Kaplan
(1998) that financial distress costs are relatively small even for highly levered firms.
To make sure the results presented in this section are robust we also try other
specifications not reported here. As noted, we use fiscal year 1997 instead of 1998 accounting
data. In general, we feel that 1998 data are better because the full operating impact of the crisis is
not felt until the latter half of 1997, and for most firms, financial conditions continue to
deteriorate in 1998. Nevertheless, it is possible that firms accounting results are significantly
different for 1997, but then reversed in 1998. Repeating the tests in Tables 7 and 8 using
dependent variables calculated using 1997 data leads to similar conclusions. We also examine
additional measures of financial performance, such as the current ratio and quick ratio, and find
similar results. In only one additional test have we found a significantly larger affect for FC debt:
As the dependent variable we use a dummy variable that identifies firms with an interest coverage
45 In the countries that had devalued their currencies during the crisis, equity returns were highly correlated

35
ratio greater than 1.0 in 1996 and less than 1.0 in 1998. In a LOGIT estimation, levels of FC debt
were significantly better than levels of natural local debt at identifying these firms. Assuming
this finding is not the result of data snooping, it provides evidence that firms with FC debt were
more likely to go from not distressed pre-crisis to distressed post-crisis. However, this result
could also be due to the generally higher levels of total debt documented for FC debt users.
Another concern, especially regarding the performance results for SLC debt, is
endogeneity. Specifically, firms with a higher chance of distress or greater exposure to exchange
rates, regardless of the mix of debt type, might tend toward SLC debt use. For example,
managers may know financial distress is relatively costlier for their firm (in a dimension we do
not measure) and so hedge exchange-rate risk, or FC lenders identify high-exposure firms and
require the bundling of exchange-rate derivatives with a FC loan. We conduct two types of tests
assessing if endogeneity drives our performance results. To conserve space, the results of these
tests are not tabled but are available from the authors upon request.
First, we examine univariate statistics for 1996 to determine if variables related to
financial exposure are significantly different for SLC users and non-users. We inspect our
measures of business risk, size, growth opportunities (market-to-book), asset tangibility, the
modified Z-score, interest coverage ratio, current ratio, quick ratio, and percentage of long-term
debt. To measure exchange-rate exposure more directly, we also examine an estimate of equity
price exposure to exchange rates (see Appendix A) during the crisis period. When comparing
SLC debt users to all non-users, the only differences (significant at the 5% level) are that SLC
debt users have more long-term debt and more tangible assets. When we compare SLC debt
users only to other firms with foreign currency debt, SLC debt users have significantly higher
market-to-book ratios, modified Z-scores, interest coverage ratios, and long-term debt (all at
about the 5% confidence level). With the exception of the difference in market-to-book ratio,
these findings suggest that SLC debt users likely have a lower unconditional probability and costs
of financial distress and typically are less financially constrained than non-users prior to the
crisis. Yet, this latter result may also be endogenous if riskier firms with higher expected costs of
distress allow for additional financial slack.
As a second and more rigorous test, we control for endogeneity in the performance
regressions by employing a two-stage least squares technique. Instead of using the actual debt
levels as explanatory variables, we use the predicted levels from the simultaneous equation
estimation described in Appendix B. With some minor exceptions the results from this process
with changes in exchange rates during the post-crisis period (see Gerard and Thanyalakpark (2000)).
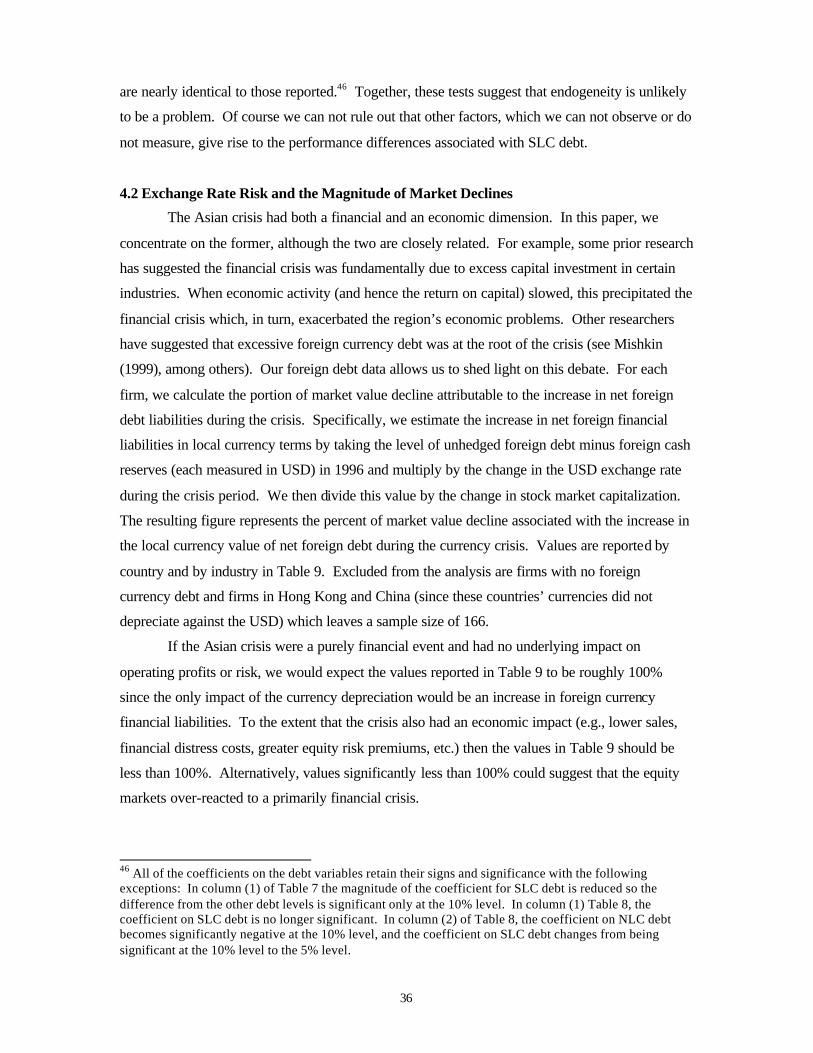
36
are nearly identical to those reported.46 Together, these tests suggest that endogeneity is unlikely
to be a problem. Of course we can not rule out that other factors, which we can not observe or do
not measure, give rise to the performance differences associated with SLC debt.
4.2 Exchange Rate Risk and the Magnitude of Market Declines
The Asian crisis had both a financial and an economic dimension. In this paper, we
concentrate on the former, although the two are closely related. For example, some prior research
has suggested the financial crisis was fundamentally due to excess capital investment in certain
industries. When economic activity (and hence the return on capital) slowed, this precipitated the
financial crisis which, in turn, exacerbated the region’s economic problems. Other researchers
have suggested that excessive foreign currency debt was at the root of the crisis (see Mishkin
(1999), among others). Our foreign debt data allows us to shed light on this debate. For each
firm, we calculate the portion of market value decline attributable to the increase in net foreign
debt liabilities during the crisis. Specifically, we estimate the increase in net foreign financial
liabilities in local currency terms by taking the level of unhedged foreign debt minus foreign cash
reserves (each measured in USD) in 1996 and multiply by the change in the USD exchange rate
during the crisis period. We then divide this value by the change in stock market capitalization.
The resulting figure represents the percent of market value decline associated with the increase in
the local currency value of net foreign debt during the currency crisis. Values are reported by
country and by industry in Table 9. Excluded from the analysis are firms with no foreign
currency debt and firms in Hong Kong and China (since these countries’ currencies did not
depreciate against the USD) which leaves a sample size of 166.
If the Asian crisis were a purely financial event and had no underlying impact on
operating profits or risk, we would expect the values reported in Table 9 to be roughly 100%
since the only impact of the currency depreciation would be an increase in foreign currency
financial liabilities. To the extent that the crisis also had an economic impact (e.g., lower sales,
financial distress costs, greater equity risk premiums, etc.) then the values in Table 9 should be
less than 100%. Alternatively, values significantly less than 100% could suggest that the equity
markets over-reacted to a primarily financial crisis.
46 All of the coefficients on the debt variables retain their signs and significance with the following exceptions: In column (1) of Table 7 the magnitude of the coefficient for SLC debt is reduced so the difference from the other debt levels is significant only at the 10% level. In column (1) Table 8, the coefficient on SLC debt is no longer significant. In column (2) of Table 8, the coefficient on NLC debt becomes significantly negative at the 10% level, and the coefficient on SLC debt changes from being significant at the 10% level to the 5% level.

37
On average, we find that the increase in net foreign financial liabilities accounts for
37.0% of the decline in equity market value of EA firms. Hence, the majority of the decline in
market value of EA foreign debt users can not be directly attributed to an increase in net foreign
financial liabilities. Furthermore, these values probably overestimate the contributions to
declines since we do not attempt to correct for the increase in the present value of subsequent
cashflows in foreign currency (i.e., foreign EBIT). However, values vary significantly across
countries. For the two high-income countries, Singapore and Taiwan, the value is low, averaging
only 10.9%. Recall, Singapore firms had low levels of FC debt and high levels of foreign cash
reserves and foreign EBIT (see Table 2). Taiwanese firms also had low levels of FC debt and
higher than average levels of foreign EBIT but low levels of foreign cash. In addition, the
Singapore and Taiwan dollars depreciated less than 20% against the USD.
In the middle-income countries, the average reported value is 42.9% though the values
range from a low of 6.8% in the Philippines to 80.5% in Indonesia. The large value for
Indonesian firms may be related to the high level of foreign debt in 1996 and the Rupiah
experiencing the greatest decline against the USD of any of the EA currencies. In addition,
Indonesian firms with FC debt had less than average foreign EBIT and the highest levels of SLC
debt of any EA country. South Korea, which had the highest level of foreign debt, has a
considerably lower ratio (45.9%). This may be explained by Korean manufacturers’ substantial
exports to North America and Europe as evidenced by the high proportion of foreign EBIT
(29.0%). The small values reported for the Philippines and Malaysia are surprising since foreign
debt users in these countries have less than average foreign EBIT and foreign cash reserves.
However, one feature these countries have in common is low average levels of SLC debt. Recall
from Table 7 that high levels of SLC debt are associated with larger declines in market value.
Panel B of Table 9 reports values by industry. EA firms in the wholesale and retail trade
industries and basic materials industries have the largest percent of market value decline
attributable to net foreign debt. Average market returns for these industries are only slightly
larger than average and the percentage of foreign EBIT is close to values for all foreign debt
users.47
It is interesting to note that not all EA firms with FC debt have a net exposure to a
depreciating local currency. Of the 166 firms with foreign debt, 12 (7.3%) have foreign cash
reserves exceeding the value of unhedged foreign currency debt. By including a rough estimate
47 To explain variation in these values we also estimate a regression with a variety of explanatory variables including foreign EBIT and levels of SLC debt as well as other variables used in the analysis above and industry/country dummy variables (results not reported). Surprisingly, the only explanatory variable

38
of the increase in the present value of foreign EBIT,48 the number of firms with an effective long
position in foreign currency increases to 62 (37.3%). We have also repeated the analysis in Table
9 excluding the few (11) firms with positive market returns. This results in values slightly larger
(9.1% on average) than those reported in Table 9, but the relations discussed above are
unchanged. Overall, we conclude from this analysis that the majority of the decline in market
value of EA firms during the Asian crisis was due to factors beyond the increase in foreign
financial liabilities. This result is consistent with our prior findings in the multivariate
performance analysis that FC debt was not significantly more likely to lead to market or financial
underperformance than local currency debt.
An alternative method for calculating expected declines in market values due to the
currency crisis would be to estimate a foreign exchange sensitivity for each firm and examine
whether changes in market value during the crisis are consistent with the magnitude of the
predicted exposure. Unfortunately, given the currency pegs that prevailed in the region pre-crisis
(see Figure 1), we cannot estimate reliable exchange-rate exposures prior to the crisis.
In general, this section yields two broad and complementary conclusions. First, there is
no evidence that FC debt, as compared to NLC debt, made East Asian firms more susceptible to
poor financial or operating performance during the crisis. Second, synthetic local debt seems to
be associated with lower market returns and possibly worse operating performance but probably
as a result of the derivatives market failing.
5 Conclusions
In this study we analyze the use of different types of debt for a large sample of East Asian
non-financial corporations. Our analysis concentrates on two general questions. First, what firm-
specific, country-specific, and industry-specific characteristics determine the use of local and
foreign currency debt? We find several unique factors, as well as some common factors, that
determine the use of different types of debt. On the whole, the results are consistent with the
limited extant evidence and some financial theories. For example, proxies for the (perceived)
lower cost of foreign currency debt and the need for accessing deeper foreign capital markets
consistently explain the type of debt used by EA firms. In addition, the use of foreign currency
debt is tempered by the ability to manage the associated currency risk with risk management tools
such as foreign cashflow and cash reserves. Asset type is also important for the use of FC debt,
consistent with an agency theory of costly monitoring. Finally, synthetic local currency debt use
significantly different from zero is the foreign listing dummy which is less than zero at the 1% level. The coefficient on foreign EBIT, while negative, is not statistically different from zero. 48 We capitalize future foreign EBIT assuming zero growth from 1996 and a 10% discount rate.

39
appears to be motivated by a different set of factors than natural local currency debt. These results
are also consistent with risk management theory.
The second question that we address in this paper concerns the relation between type of
debt and performance during the Asian crisis. Contrary to the conclusions of prior research, we
find no evidence that unhedged foreign currency debt led to worse financial or operating
performance than natural local currency debt. If a differential effect exists, firms with more FC
debt increased sales and investment relative to other firms during the Asian crisis. However,
firms’ use of synthetic local (i.e., hedged foreign) currency debt is associated with significantly
worse stock market (and perhaps operating) performance—a result explained by evidence related
to derivatives market illiquidity during the crisis which forced some firms to leave their positions
largely unhedged. Our final result shows that, on average, only 37% percent of the change in
firms’ stock values during the crisis is due to a change in net foreign liabilities. This suggests that
the economic aspects of the Asian crisis were significant and likely larger than the purely
financial impact of increased foreign liabilities or alternatively, that equity markets significantly
over-reacted during the crisis period.
Our findings have several important implications. First, the evidence suggests that non-
financial firms with adequate risk management tools may be able to support substantial levels of
foreign currency debt even when there exists a significant risk of a currency crisis. In a similar
vein, local and global financial institutions (e.g., central banks, the IMF, etc.) should construct
emergency plans for stabilizing the foreign exchange derivatives market in times of crisis. While
it is debatable whether or not equity markets over-reacted to the Asian crisis, the declines in firm
value greatly exceeded the increase in net foreign financial liabilities resulting from the
devaluation. This implies that policy makers’ efforts are well-placed when concentrating on
structural economic issues as opposed to considering purely financial remedies. Our results can
also help international borrowers and lenders understand the role different types of debt play in
overall capital structure and potentially facilitate the process of financial intermediation in the
foreign currency debt market.
Finally, we propose a couple avenues for future research suggested by our analysis. First,
other researchers such as Leland (1998) have modeled the relations between agency costs, risk
management and capital structure. Our results suggest that this framework could be expanded to
include a choice of debt currency type and constraints (or differential costs) on local currency
lending markets. In particular, the relation between financial (traded) and business (non-traded)
risk in local and foreign markets could be formalized to make more precise predictions. This
could help unify the theories we propose with existing theories of capital structure. Second,

40
while we are careful to control for potential effects related to debt maturity, the theoretical and
empirical relations between currency denomination of debt and optimal maturity structure are
largely unexplored.

41
References
Aghion, Philippe, Philippe Bachetta, and Abhijit Banerjee, 2001, Currency Crises and Monetary Policy in an Economy with Credit Constraints, European Economic Review 45, 1121-1150.
Allayannis, George, and James Weston, 2001, The Use of Foreign Currency Derivatives and Firm
Market Value, Review of Financial Studies 14, 243-276. Altman, Edward, 1968, Financial Ratios, Discriminant Analysis and the Prediction of Corporate
Bankruptcy, Journal of Finance 23, 589-609. Altman, Edward, 1984, A Further Empirical Investigation of the Bankruptcy Cost Question,
Journal of Finance 39, 1067-1089. Altman, Edward, 2000, Predicting Financial Distress of Companies: Revisiting the Z-score and
Zeta Models, New York University Working Paper. Altman, Edward, John Hartzell, and Mathew Peck, 1995, Emerging Markets Corporate Bonds: A
Scoring System, Salomon Brothers Inc., New York. Altshuler, Rosanne and Harry Grubert, 2000, Repatriation Taxes, Repatriation Strategies and
Multinational Financial Policy, Rutgers University Working Paper. Amemiya, Takeshi, 1974, Multivariate Regression and Simultaneous Equation Models when the
Dependent Variables Are Truncated Normal, Econometrica 42, 999-1012. Amemiya, Takeshi, 1979, The Estimation of a Simultaneous-Equation Tobit Model, International
Economic Review 20, 169-181. Andrade, Gregor, and Steven Kaplan, 1998, How Costly is Financial (Not Economic) Distress?
Evidence from Highly Levered Transactions that Became Distressed, Journal of Finance 53, 1443-1493.
Bank for International Settlements (BIS), 1999, Triennial Central Bank Survey of Foreign
Exchange and Derivatives Market Activity. Barclay, Michael, and Clifford Smith, 1995, The Maturity Structure of Corporate Debt, Journal
of Finance 50, 609-631. Berger, Allen, Leora Klapper, and Greg Udell, 2001, The Ability of Banks to Lend to
Informationally Opaque Small Businesses, Journal of Banking and Finance 25, forthcoming.
Booth, Laurence, Varouj Aivazian, Asli Demirguc-Kunt, and Vojislav Maksimovic, 2001,
Capital Structures in Developing Countries, Journal of Finance 56, 87-120. Brailsford, Timothy, Barry Oliver and Sandra Pua, 2001, Theory and Evidence on the
Relationship Between Ownership Structure and Capital Structure, Australian National University Working Paper.

42
Bris, Arturo, and Yrjo Koskinen, 2002, Corporate Leverage and Currency Crises, Journal of Financial Economics 63, 275-310.
Bris, Arturo, Yrjo Koskinen, and Vicente Pons, 2001, Corporate Financial Policies and
Performance Around Currency Crises, Yale School of Management Working Paper. Chang, Roberto, and Andres Velasco, 1999, The Asian Liquidity Crisis, NBER Working Paper
No. W6796. Chaplinsky, Susan, and Latha Ramchand, 2000, The Impact of Global Equity Offerings, Journal
of Finance 55, 2767-2790. Chaplinsky, Susan, and Latha Ramchand, 2001, The Impact of SEC Rule 144A on Corporate
Debt Issuance by Foreign Firms, University of Virginia (Darden Graduate School of Business) Working Paper.
Claessens, Stijn, Simeon Djankov, and Giovanni Ferri, 1999, Corporate Distress in East Asia,
Public Policy for the Private Sector (The World Bank Group), No. 172, January. Claessens, Stijn, Simeon Djankov, and Larry Lang, 2000, The Separation of Ownership and
Control in East Asia, Journal of Financial Economics 58, 82-112. Claessens, Stijn, Simeon Djankov, and Leora Klapper, 2002, Resolution of Corporate Distress in
East Asia, Journal of Empirical Finance, forthcoming. Corsetti, Giancarlo, Paolo Pesenti, and Nouriel Roubini, 1998, What Caused the Asian Currency
and Financial Crisis? New York University Working Paper. Demirguc-Kunt, Asli, and Vojislav Maksimovic, 1999, Institutions, Financial Markets, and Firm
Debt Maturity, Journal of Financial Economics 54, 295-336. Diamond, Douglas, 1984, Financial Intermediation and Delegated Monitoring, Review of
Economic Studies 51, 393-414. Diamond, Douglas, 1989, Reputation Acquisition in Debt Markets, Journal of Political Economy
97, 828-862. Doidge, Craig, Andrew Karolyi and René Stulz, 2001, Why Are Foreign Firms Listed in the US
Worth More?, NBER Working Paper No. W8538. Eichengreen, Barry, and Ricardo Hausmann, 1999, Exchange Rates and Financial Fragility,
NBER Working Paper 7418. Flood, Lennart, and Ali Tasiran, 1990, A Monte Carlo Comparison of System TOBIT Estimators,
Economics Letters 33, 249-254. Foerster, Stephen, and G. Andrew Karolyi, 1999, The Effects of Market Segmentation and
Investor Recognition on Asset Prices: Evidence from Foreign Stocks Listing in the United States, The Journal of Finance 54, 981-1013.

43
Froot, Kenneth, and James Hines, Jr., 1995, Interest Allocation Rules, Financing Patterns, and the Operations of U.S. Multinationals, in Martin Feldstein, James Hines Jr., and R. Glenn Hubbard, (eds.), The Effects of Taxation on Multinational Corporations , University of Chicago Press.
Froot, Kenneth, David Scharfstein, and Jeremy Stein, 1993, Risk Management: Coordinating
Corporate Investment and Financing Policies, The Journal of Finance 48, 1629-1658. Géczy, Christopher, Bernadette Minton, and Catherine Schrand, 1997, Why Firms Use Currency
Derivatives, Journal of Finance 52, 1323-1354. Géczy, Christopher, Bernadette Minton, and Catherine Schrand, 2000, Choices Among
Alternative Risk Management Strategies: Evidence from the Natural Gas Industry, Ohio State University (Fisher College of Business) Working Paper.
Gerard, Bruno, and Yui Thanyalajpark, 2000, Equity Returns and Contagion During the East Asia
Crisis, University of Michigan Business School Working Paper. Graham, John, 1996a, Debt and the Marginal Tax Rate, Journal of Financial Economics 41, 41-
74. Graham, John, 1996b, Proxies for the Marginal Tax Rate, Journal of Financial Economics 42,
187-221. Graham, John, 2001, Taxes and Corporate Finance: A Review, Duke University Working Paper. Graham, John, and Campbell Harvey, 2001, The Theory and Practice of Corporate Finance:
Evidence from the Field, Journal of Financial Economics 60, 187-243. Graham, John, and Daniel Rogers, 2002, Do Firms Hedge in Response to Tax Incentives?,
Journal of Finance 57, 815-839. Greene, William, 2000, Econometric Analysis: Fourth Edition, Prentice Hall, Upper Saddle
River, NJ. Harris, Milton and Artur Raviv, 1988, Corporate Control Contests and Capital Structure, Journal
of Financial Economics 20, 55¯86. Harris, Milton and Artur Raviv, 1991, The Theory of Capital Structure, Journal of Finance 46,
297-355. Harvey, Campbell, and Andrew Roper, 1999, The Asian Bet, in Alison Harwood, Robert E. Litan
and Michael Pomerleano, Eds., in The Crisis in Emerging Financial Markets, Brookings Institution Press, 29-115.
Harvey, Campbell, Karl Lins, and Andrew Roper, 2001, The Effect of Capital Structure when
Expected Agency Costs are Extreme, Duke University Working Paper. Heckman, James, 1976, The Common Structure of Statistical Models of Truncation, Sample
Selection, and Limited Dependent Variables and a Simple Estimator for Such Models, Annals of Economic and Social Measurement 5, 475-492.

44
Hodder, James, and Lemma Senbet, 1990, International Capital Structure Equilibrium, Journal of
Finance 45, 1495-1516. Hoshi, Takeo, Anil Kashyap, and David Scharfstein, 1990, The Role of Banks in Reducing the
Costs of Financial Distress in Japan, Journal of Financial Economics 27, 67-88. Jensen, Michael, and William Meckling, 1976, Theory of the Firm: Managerial Behavior, Agency
Costs and Ownership Structure, Journal of Financial Economics 3, 305-360. Johnson, Simon, Peter Boone, Alasdair Breach, and Eric Friedman, 2000, Corporate Governance
in the Asian Financial Crisis, Journal of Financial Economics 58, 141-186. Kedia, Simi, and Abon Mozumdar, 2001, Foreign Currency Denominated Debt: An Empirical
Examination, Journal of Business, forthcoming. Kim, Yong, and René Stulz, 1988, The Eurobond Market and Corporate Financial Policy: A Test
of the Clientele Hypothesis, Journal of Financial Economics 22, 189-206. Klapper, Leora and Inessa Love, 2002, Corporate Governance, Investor Protection and
Performance in Emerging Markets, World Bank Working Paper. Krugman, Paul, 1999, Balance Sheets, The Transfer Problem, and Financial Crises, in Isard, P.,
Razin, A., Rose, A. (Eds.), International Finance and Financial Crises, Essays in Honor of Robert P. Flood.
Leland, Hayne, 1998, Agency Costs, Risk Management, and Capital Structure, Journal of
Finance 53, 1213-1243. Lemmon, Michael, and Karl Lins, 2001, Ownership Structure, Corporate Governance, and Firm
Value: Evidence from the East Asian Financial Crisis, University of Utah Working Paper. Lins, Karl, Mark Lang and Darius Miller, 2002, ADRs, Analysts, and Accuracy: Does Cross
Listing in the US Improve a Firm's Information Environment and Increase Market Value?, University of Utah Working Paper.
Miller, Darius, 1999, The Market Reaction to International Cross-listings: Evidence from
Depositary Receipts, Journal of Financial Economics 51, 103-124. Miller, Darius, and John Puthenpurackal, 2000, The Costs, Weath Effects, and Determinants of
International Capital Raising: Evidence from Public Yankee Bonds, Texas A&M University Working Paper.
Miller, Merton, 1977, Debt and Taxes, Journal of Finance 32, 261-275. Mishkin, Frederic, 1999, Global Financial Instability: Framework, Events, Issues, Journal of
Economic Perspectives 13, 3-20. Mitton, Todd, 2002, A Cross-Country Analysis of the Impact of Corporate Governance on the
East Asian Financial Crisis, Journal of Financial Economics, forthcoming.

45
Modigliani, Franco, and Merton Miller, 1958, The Cost of Capital, Corporate Finance, and the Theory of Investment, American Economic Review 30, 261-297.
Myers, Stewart, 1977, The Determinants of Corporate Borrowing, Journal of Financial
Economics 5, 147-175. Nelson, Forrest, and Lawrence Olson, 1978, Specification and Estimation of a Simultaneous-
Equation Model with Limited Dependent Variables, International Economic Review 19, 695-709.
Newberry, Kaye, 1998, Foreign Tax Credit Limitations and Capital Structure Decisions, Journal
of Accounting Research (Spring), 157-66. Newberry, Kaye, and Dan Dhaliwal, 2001, Cross-Jurisdictional Income Shifting by U.S.
Multinationals : Evidence from International Bond Offerings, Journal of Accounting Research 39, 643-662.
Opler, Tim, Lee Pinkowitz, René Stulz, and Rohan Williamson, 1999, The Determinants and
Implications of Corporate Cash Holdings, Journal of Financial Economics 52, 3-46. Opler, Tim, and Sheridan Titman, 1994, Financial Distress and Corporate Performance, Journal
of Finance 49, 1015-1040. Pearl, Carleton, Darin Aprati, and Brian Moore, 1999, The Evolution of Currency and Interest
Rate Risk Management at McDonald’s Corporation, in Corporate Risk: Strategies and Management: Eds. Gregory Brown and Donald Chew, (Risk Publications, London, England).
Petersen, Mitchell, and Ramu Thiagarajan, 2000, Risk Management and Hedging: With and
Without Derivatives, Financial Management 29, 5-30. Pomerleano, Michael, 1998, The East Asia Crisis and Corporate Finances: The Untold Micro
Story, World Bank Working Paper No. 1990. Rajan, Raghuram, and Luigi Zingales, 1995, What Do We Know About Capital Structure? Some
Evidence from International Data, Journal of Finance 50, 1421-1460. Ross, Stephen, 1977, The Determination of Financial Structure: The Incentive-Signalling
Approach, Bell Journal of Economics 8, 23-40. Smith, Clifford, and René Stulz, 1985, The Determinants of Firms’ Hedging Policies, Journal of
Financial and Quantitative Analysis 20, 391-402. Titman, Sheridan, and Brett Trueman, 1986, Information Quality and the Valuation of New
Issues, Journal of Accounting and Economics 8, 159-172. Titman, Sheridan, and Robert Wessels, 1988, The Determinants of Capital Structure Choice,
Journal of Finance 43, 1-19. Wiwattanakantang, Yupana, 1999, An Empirical Study on the Determinants of the Capital
Structure of Thai Firms, Pacific-Basin Finance Journal 7, 371-403.

46
Appendix A. Definition of Variables
Much of the data is acquired from SBC Warburg Dillon Reed (SBC-WDR) from the
Valuation Issues—Reality Check series published by the Asian equity research group. The
primary purpose of the reports we use is to determine the foreign currency debt exposure of East
Asian corporations. Some of these data are collected by direct contact with the firms in the
sample. The studies’ authors note that,
“We also highlight that for Asian corporates in general disclosure is poor and transparency low. It is difficult to be confident as to the level of hedging of foreign debt that has been undertaken. Where in doubt we have taken the view to record the debt as still unhedged, which we think is an appropriate and conservative approach.”
The following reports variable definitions, the primary data source for the variable or its
underlying factors, and any other relevant considerations for all variables reported in one of the
tables.
Variables: Asset Tangibility – Total assets minus current assets standardized by total assets. Assets values
are from WorldScope. We have also utilized an alternative measure for asset tangibility defined as net plant and equipment divided by total assets. This alternative is highly correlated (Pearson correlation coefficient of 0.642) and yields very similar results to those reported using the primary measure.
Average Tax Rate – Income tax paid divided by pre-tax income. For negative or extreme values,
we truncate the variable at zero (6.4% of observations) and 0.5 (4.3% of observations) Business Risk – Defined as the standard deviation of operating margin in the years 1996-1998.
As alternative measures we used the standard deviation of sales (indexed to 1996 levels) in the years 1996-1998 and the change in the operating margin from 1996 to 1998. These measures also lead to generally insignificant coefficients for Business Risk and had little effect on other results.
Committed Capital Expenditures – As reported by SBC-WDR for the next 12 months. Each
value is standardized by dividing by Sales as reported by WorldScope. Current Ratio – Data are from WorldScope. Calculated as total current assets divided by total
current liabilities. Debt-to-Value – Total debt in USD as reported SBC-WDR divided by firm value. Equity Market Index Returns – As reported by DataStream including distributions for primary
local equity indices: Hong Kong / China – Hang Seng Index; Indonesia – Jakarta Composite; Malaysia – KLSE Composite; Philippines – PSE Composite; Singapore – Strait Times Index; South Korea – Seoul Composite; Thailand – SET Composite; Taiwan – Taiwan Weighted Index.

47
Excess Equity Returns and Exchange Rate Sensitivities – Excess equity returns are simple holding period returns minus equity market index returns. Exchange rate sensitivities are estimated coefficients from weekly regressions during the crisis period with weekly exchange rate changes against the US Dollar (USD) measured in USD per foreign currency unit (FCU) and the orthogonalized equity index returns as explanatory variables. The equity index returns are orthogonalized by taking the residuals from a regression of weekly exchange rate percent changes on the equity index returns, since these two variables are highly correlated during the crisis and post-crisis periods. Since the Hong Kong Dollar retained its peg against the US Dollar, the exchange rate data used for Hong Kong / China is an equal-weighted average of the USD against the Thai Baht, Indonesian Rupiah, Singapore Dollar, Taiwan Dollar, and South Korean Won.
Family Affiliation (Dummy) – Variable is set to a value of 1 (zero otherwise) if the company is
identified as affiliated with a family-related cross-holding structure. Firm Value – Calculated as market value of common stock plus market value of preferred stock
plus book value of total debt (in USD or local currency as specified). Foreign Cash – As reported by SBC-WDR. Cash held in foreign currency measured in USD.
Also used as a percentage of firm value. Foreign Currency Debt – Total foreign debt as reported by SBC-WDR times one minus Hedge
(%). Value is standardized using firm value. Foreign EBIT – As reported by SBC-WDR. Total earnings before interest and taxes (EBIT)
earned in foreign currency (measured in USD). Also used as a percentage of firm value. Foreign Equity Listing (Dummy) – Variable equals 1 if the firm trades on a stock exchange not in
its country of incorporation and 0 otherwise. This includes firms with American Depository Receipts (ADRs) and Global Depository Receipts (GDRs).
Foreign Sales (%) – As reported by the Asian Company Handbook for 1996. Many of the firms
in our sample are not listed in the Asian Company Handbook. For these firms we collected geographical segment data when available. If a firm did not report geographical segment data or reported geographical segment data for only its home country we set the variable equal to zero. Consequently, our measure of foreign sales may underestimate the actual level of foreign sales.
Hedge (%) – As reported by SBC-WDR. The percentage of foreign debt hedged with foreign
currency derivatives. The SBC-WDR reports do not give a detailed explanation of this variable. From our discussions with the individuals responsible for collecting the data, this value represents a best estimate of the notional value of all foreign currency derivatives used to hedge foreign debt regardless of type or maturity. As discussed in the main text long-term debt was frequently hedged by rolling-over short-term derivative positions.
Industry Dummies – SIC codes are as reported by WorldScope for 1996. Dummy variables are
set to a value of 1 if the first digit of the primary SIC code corresponds to the respective dummy variable.

48
Interest Coverage – Data are from WorldScope. Calculated as total EBIT divided by interest expense. Because some firms have very low interest expense or negative EBIT, we truncate the series at 0 and 10. For the full sample in the years 1996 to 1998, 10.3% of observations are truncated at zero and 17.8% are truncated at 10.
Interest Rate Differential – The difference between local short-term lending rates as reported by
the World Bank and LIBOR in December 1996. Long-term Debt Percent [(FC-LC)] – Nominal debt values for local and foreign currency and
short-term and long-term (greater than 1 year to maturity) debt are from SBC-WDR. To calculate the ratio of long-term debt to total debt, we use the exchange rate provided by SBC-WDR to convert all debt to local currency terms and then sum by maturity type. To calculate the difference in long-term debt percent [FC-LC], we first calculate the ratio of long-term debt to total debt for local and foreign currency separately, then take the difference between these values. For firms without any foreign currency debt, we set this variable equal to zero. Alternatively, for firms without foreign debt, setting the variable equal to the mean for firms with foreign currency debt does not significantly effect our results.
Natural Local Currency Debt – Local currency debt values are from SBC-WDR. Value is
standardized using firm value. Market-to-Book – Market value of equity divided by book value of common shareholders’ equity
defined as total assets less total liabilities less outstanding preferred stock. Data are from WorldScope. We truncate this variable at 10 due to 2 outlying observations (0.6% of sample).
Miller Gains-to-Leverage – Defined as 1-(1-Corporate Tax Rate)*(1-Equity Income Tax
Rate)/(1-Interest Income Tax Rate). Tax rates are obtained from the International Tax Summaries: A Guide for Planning and Decisions, Coopers & Lybrand International Tax Network, George J. Yost, III, Editor. We use the highest marginal capital gains rate as the Equity Income Tax rate. Values for the countries in our sample are as follows: Hong Kong, -0.044; Singapore, -0.043; Taiwan, -0.250; Indonesia, 0.350; South Korea, 0.595; Malaysia, -0.030; Philippines, 0.350; Thailand, -0.111.
Change in Net PPE / Sales – Data are from WorldScope. Calculated as the difference in net
property, plant and equipment in 1998 from 1996 divided by sales in 1998. Operating Margin – Operating income divided by sales as reported by WorldScope. When used
in changes, we take the 1998 value minus the 1996 value. Percent of Market Value Change Due to Net Foreign Debt – The values are estimated by
calculating foreign debt exposed to currency risk then multiplying this by the change in currency value against the USD during the crisis period and finally, dividing this quantity by the change in market value of equity during the crisis period. Foreign debt exposed to currency risk is defined as unhedged foreign currency debt minus foreign cash. This value is negative for 13 firms because these firms had foreign cash in excess of foreign debt. We exclude Hong Kong and Chinese firms since the Hong Kong Dollar did not depreciate against the USD. Estimates are truncated at -100% and +200% because of a few outliers.

49
Quick Ratio – Data are from WorldScope. Calculated as quick assets divided by current liabilit ies. Quick assets are defined as cash plus net accounts receivable.
Sales – Total revenues as reported by WorldScope. When reported in USD we use the exchange
rate from WorldScope. When used in changes, we take the log-difference from 1996 to 1998.
Synthetic Local Currency Debt – Calculated as total foreign debt multiplied by Hedge (%) which
are both from SBC-WDR. Standardized using firm value. Z-Score – Calculated using the formula provided by Altman (2000):
Z-Score = 6.56*X1 + 3.26*X2 + 6.72*X3 + 1.05*X4 where
X1 = (working capital)/(total assets) X2 = (retained earnings)/(total assets) X3 = EBIT/(total assets) X4 = (book value of equity)/(book value of total liabilities).

50
Appendix B. Technical Issues and a Simultaneous Equations Specification for Debt Type
The specification of tests for the determinants of debt type are complicated by two
general factors. The first relates to debt-to-value ratios having a point mass at zero for firms with
no debt of a given type. The second, and more challenging issue, is the endogenous variables
problem related to the various types of debt.
To address the limited dependent variable problem we choose a TOBIT specification.
The primary alternative to this one-step estimation is a two-step procedure (see Heckman (1976))
with separate equations for the decision to issue a debt type (e.g., a PROBIT) and the extent of
use of a debt type for only those firms using that form of debt (e.g., OLS). The log-likelihood
specification test for choosing between these two models generally favors the TOBIT
specification. One limitation of the TOBIT model is the relatively strong assumptions needed to
obtain consistent estimates. We test the assumptions of normally distributed underlying
disturbances and heteroskedastic ity using Langrange multiplier statistics (see Greene (2000)). In
the results reported in Table 5, and subsequently in this appendix, we can not reject null
hypotheses of homoskedasticity and normality at the 5% level.
We examine the more important issue of endogeneity by considering simultaneous-
equation specifications which include other types of debt as determinants. However, even
stronger assumptions are needed for this analysis. For example, we assume that all other non-
debt variables are exogenous to the system. While this is probably not the case (for example
anecdotal evidence suggests committed capital expenditures could depend on obtaining foreign
currency funding), it is unwieldy to treat more of the variables examined as endogenous.
Similarly, if we extend the analysis to some non-debt variables, it is not obvious which should be
included in this set. An additional challenge comes from choosing the appropriate specification
and estimation technique for a simultaneous-equation systems with limited dependent variables.
We chose to estimate a simultaneous-equation TOBIT model using the two-stage estimation
procedure suggested by Nelson and Olson (1978). We are cautious about results from these
estimations and inference, since the finite sample properties are not well known in the presence of
various types of model misspecification, and an analysis of these properties is beyond the scope
of this paper (see Amemiya (1974, 1979) and Flood and Tasiran (1990)). An encouraging result
is that different specifications do not seem to have a strong effect on the size or significance of
most of the estimated coefficients.
We present here results from the simultaneous-equation estimation first, so that we can
discuss the relations between different types of debt, and second, as a robustness check for our
results reported in Table 5. In the natural local currency debt equation we find a significant

51
negative relation with synthetic local currency debt. This confirms, as intuition suggests, that the
two types of debt are likely substitutes. The use of FC debt does not explain the use of NLC debt.
In this specification, the significant negative coefficients on operating margin and market-to-book
are preserved. However, the coefficients on size, foreign cash, the Miller gains-to-leverage, and
long-term debt percent are no longer significant at conventional levels. This suggests the
previously estimated relations for these variables may be spurious and instead related to the use
of other types of debt.
In the foreign currency debt equation, we find significant positive coefficients for both
NLC and SLC debt. These are consistent with the theory and prior evidence that FC debt users
are constrained by local currency capital markets and use FC debt as a complement to LC debt.
Other coefficient estimates are largely similar to those in Table 5 with a few exceptions. In this
specification the coefficient on the average tax rate is positive and significant at the 10% level.
Asset tangibility is not significant in this specification, and the significance of the coefficient on
the foreign equity listing dummy variable falls from the 1% level to the 5% level.
In the synthetic local currency debt equation, the coefficient on FC debt is positive and
significant. This is generally consistent with risk management theories suggesting that firms with
more foreign currency debt are, ceteris paribus, more likely to need to hedge the foreign
exchange risk associated with that debt. Otherwise coefficient estimates are again similar to
those reported in Table 5. One exception is the negative coefficient on long-term debt percent
(FC-LC).

Figure 1USD Exchange Rates
US Dollars per foreign currency unit; weekly data; indexed to week ending July 5, 1996 = 100.
0
25
50
75
100
125
7/5/
96
9/5/
96
11/5
/96
1/5/
97
3/5/
97
5/5/
97
7/5/
97
9/5/
97
11/5
/97
1/5/
98
3/5/
98
5/5/
98
7/5/
98
9/5/
98
11/5
/98
1/5/
99
3/5/
99
5/5/
99
7/5/
99
Pre-Crisis Crisis Post-Crisis
Hong Kong
Singapore
Malaysia
Indonesia
South Korea
Taiwan
Philippines
Thailand

Table 1Exchange Rate Volatility & Market Returns
Panel A: Exchange-Rate Volatility
Pre-Crisis Crisis Post-Crisis
All Countries 2.7% 35.1% 11.3% High Income 1.2% 8.4% 4.0% Hong Kong 0.3% 0.4% 0.2% Singapore 2.2% 14.6% 6.6% Taiwan 1.1% 10.3% 5.0% Middle Income 3.6% 51.1% 16.8% Indonesia 2.0% 109.5% 35.9% Malaysia 2.7% 33.7% NA Philippines 0.4% 27.7% 8.6% South Korea 3.9% 50.8% 13.3% Thailand 9.1% 33.6% 9.3%memo: Japan 10.0% 14.6% 20.1%
Panel B: Equity Market Index Returns
Pre-Crisis Crisis Post-Crisis
All Countries -6.1% -51.5% 75.4% High Income 16.0% -38.9% 50.2% Hong Kong 39.8% -52.8% 48.3% Singapore -16.7% -38.0% 85.1% Taiwan 24.9% -25.9% 17.3% Middle Income -19.4% -59.1% 90.6% Indonesia 14.8% -55.4% 50.1% Malaysia -9.9% -67.4% 65.9% Philippines -18.9% -44.5% 38.8% South Korea -20.1% -62.8% 192.2% Thailand -62.9% -65.4% 105.8%
Panel A reports the annualized standard deviation of weekly percent changes in foreign exchange rates versus the USD. Panel B reports average holding-period equity index returns as reported by DataStream for the major domestic market index. The pre-crisis period is from June 29, 1996 to June 27, 1997. The crisis period is from June 28, 1997 to June 26, 1998. The post-crisis period is from June 27, 1998 to June 25, 1999. Each subperiod contains 52 weeks. Middle Income and High Income are as defined by the IMF. Aggregates are equal-weighted arithmetic means of individual countries. In Panel A, the post-crisis values exclude Malaysia because during the post-crisis period Malaysia instituted foreign exchange controls thus making the value for post-crisis volatility uninformative.

Table 2Summary Statistics of Sample Firms in East Asia, 1996
Panel A
Obs. Total Natural Foreign Synthetic Long-term Interest Sales Committed Operating Business Asset Market- Foreign Foreign AverageDebt Local Debt Debt Local Debt Debt Coverage (USD Capex Margin Risk Tangibility to-book EBIT Cash Tax
/ Value / Value / Value / Value Percent Ratio millions) (% Sales) (%) Ratio (%) (%) Rate
All Countries 327 0.268 0.157 0.089 0.023 57.1% 7.90 1,487.8 32.1% 20.6% 0.082 0.611 2.43 20.1% 10.5% 20.6%
High Income 142 0.201 0.141 0.039 0.021 59.0% 8.74 1,049.2 29.9% 20.7% 0.073 0.628 2.28 25.2% 10.5% 16.5%
Hong Kong / China 62 0.233 0.148 0.056 0.029 62.9% 7.54 1,269.3 48.1% 28.1% 0.089 0.662 2.09 17.6% 12.5% 15.3%
Singapore 40 0.215 0.158 0.031 0.026 53.1% 11.01 722.4 11.5% 17.8% 0.080 0.608 2.33 31.8% 15.3% 24.4%
Taiwan 40 0.135 0.112 0.021 0.002 58.7% 8.25 1,040.3 20.5% 12.1% 0.044 0.596 2.55 30.5% 2.5% 10.6%
Middle Income 185 0.320 0.169 0.126 0.024 55.7% 7.27 1,821.5 33.8% 20.5% 0.088 0.597 2.54 16.2% 10.4% 23.6%
Indonesia 40 0.286 0.041 0.177 0.068 60.6% 5.88 615.0 38.7% 21.9% 0.119 0.578 2.22 18.9% 20.8% 20.3%
Malaysia 41 0.165 0.131 0.029 0.006 50.0% 10.76 1,045.6 17.7% 20.3% 0.059 0.602 3.48 6.8% 1.9% 27.3%
Philippines 40 0.223 0.141 0.076 0.006 54.4% 10.91 411.1 56.9% 29.7% 0.136 0.592 2.94 7.8% 7.2% 23.0%
South Korea 35 0.677 0.464 0.213 0.000 50.8% 1.26 6,875.5 11.0% 6.1% 0.033 0.576 0.93 29.0% 10.0% 25.4%
Thailand 29 0.300 0.094 0.163 0.044 64.6% 6.31 602.9 44.7% 23.3% 0.083 0.647 3.03 22.0% 12.7% 21.8%
CorrelationsNatural LC Debt / Value 0.773Foreign Debt / Value 0.590 0.011Synthetic LC Debt / Value 0.145 -0.132 -0.009Long-term Debt Percent 0.107 -0.071 0.216 0.149Interest Coverage Ratio -0.574 -0.406 -0.345 -0.185 -0.319Sales (USD millions) 0.387 0.327 0.223 -0.019 0.012 -0.220Committed Capex (% Sales) 0.072 -0.035 0.184 -0.029 0.223 -0.037 -0.106Opperating Margin -0.224 -0.204 -0.101 -0.008 0.179 0.247 -0.218 0.218Business Risk 0.058 0.080 -0.017 0.017 0.009 0.026 -0.126 0.076 0.354Asset Tangibility 0.089 0.014 0.118 0.032 0.383 -0.202 -0.028 0.203 0.229 0.101Market-to-Book Ratio -0.507 -0.404 -0.285 -0.078 -0.104 0.441 -0.195 0.017 0.145 -0.074 -0.229Foreign EBIT (%) 0.077 -0.055 0.217 -0.019 0.013 -0.015 0.100 0.010 -0.155 -0.048 -0.183 -0.001Foreign Cash (%) 0.061 -0.159 0.193 0.298 0.095 -0.091 0.069 -0.046 -0.062 -0.040 -0.067 0.031 0.110Average Tax Rate 0.070 0.130 -0.062 0.006 -0.151 0.053 0.170 -0.139 -0.057 0.056 -0.179 0.057 -0.171 -0.105
This table reports mean values for some of the variables used in the subsequent analysis. In Panel B firms are separated by foreign debt issuance. Data are for 1996. Variables are defined in detail in Appendix A. Firms included in the sample are those identified by SBC Warburg Dillon Read as among the largest in their respective home countries. Aggregate measures are provided for High Income and Middle Income countries (as defined by the IMF) and for all countries. Chinese "Red Chip" companies are included with Hong Kong Companies. In Panel A correlations with an absolute value greater than 0.09 are significantly different from zero at the 5% level. In Panel B bold text denotes a value statistically greater than the opposing value at the 5% level for a Wilcoxon two-sample test.

Panel B
Foreign Obs. Total Natural Foreign Synthetic Long-term Interest Sales Committed Operating Business Asset Market- Foreign Foreign AverageDebt Debt Local Debt Debt Local Debt Debt Coverage (USD Capex Margin Risk Tangibility to-book EBIT Cash Tax
/ Value / Value / Value / Value Percent Ratio millions) (%Sales) (%) Ratio (%) (%) Rate
All Countries No 125 0.146 0.146 42.7% 11.85 685.7 18.6% 21.0% 0.072 0.563 2.84 16.7% 3.4% 21.9%Yes 202 0.345 0.164 0.144 0.037 66.1% 5.48 1,985.2 40.5% 20.3% 0.088 0.641 2.18 22.2% 14.8% 19.7%
High Income No 75 0.152 0.152 49.1% 11.01 709.1 22.0% 19.7% 0.058 0.577 2.48 24.3% 3.6% 18.3%Yes 67 0.255 0.128 0.084 0.044 70.0% 6.22 1,430.6 38.8% 21.7% 0.091 0.686 2.06 26.3% 18.2% 14.6%
Hong Kong / China No 26 0.181 0.181 45.8% 10.84 588.5 37.1% 26.9% 0.084 0.590 2.33 16.2% 3.7% 16.9%Yes 36 0.270 0.125 0.096 0.049 75.3% 5.33 1,742.0 55.7% 28.9% 0.092 0.712 1.92 18.6% 18.9% 14.1%
Singapore No 25 0.169 0.169 49.3% 12.25 717.9 12.0% 18.7% 0.047 0.589 2.38 25.2% 5.6% 26.9%Yes 15 0.291 0.140 0.082 0.069 59.6% 8.95 729.8 10.8% 16.4% 0.129 0.639 2.25 42.7% 31.4% 20.3%
Taiwan No 24 0.105 0.105 52.5% 9.88 825.6 16.7% 13.6% 0.040 0.549 2.76 32.0% 1.5% 10.9%Yes 16 0.184 0.123 0.056 0.005 68.1% 5.63 1,383.9 26.4% 9.7% 0.050 0.670 2.22 28.2% 4.2% 10.2%
Middle Income No 50 0.136 0.136 33.0% 13.08 650.9 13.6% 22.9% 0.093 0.542 3.38 5.3% 3.2% 27.3%Yes 135 0.389 0.182 0.174 0.033 64.1% 5.11 2,258.3 41.4% 19.6% 0.086 0.618 2.24 20.2% 13.1% 22.3%
Indonesia No 2 0.002 0.002 43.8% 18.25 438.7 29.7% 29.6% 0.020 0.549 3.19 7.5% 32.7% 19.9%Yes 38 0.301 0.043 0.187 0.071 61.5% 5.23 624.3 39.2% 21.5% 0.124 0.579 2.17 19.5% 20.2% 20.4%
Malaysia No 29 0.120 0.120 35.7% 12.36 971.0 9.7% 20.1% 0.052 0.557 3.71 5.0% 0.0% 29.0%Yes 12 0.277 0.158 0.099 0.019 84.6% 6.89 1,225.9 37.2% 20.7% 0.074 0.711 2.92 11.3% 6.4% 23.3%
Philippines No 16 0.205 0.205 33.1% 12.79 175.3 20.6% 26.2% 0.177 0.565 2.52 0.4% 0.0% 26.4%Yes 24 0.235 0.099 0.126 0.011 68.6% 9.67 568.3 81.2% 31.9% 0.109 0.613 3.21 12.7% 12.1% 20.7%
South Korea No 0Yes 35 0.677 0.464 0.213 50.8% 1.26 6,875.5 11.0% 6.1% 0.033 0.576 0.93 29.0% 10.0% 25.4%
Thailand No 3 0.021 0.021 0.0% 18.23 235.8 4.0% 29.4% 0.082 0.266 4.59 33.7% 30.2% 21.8%Yes 26 0.332 0.102 0.181 0.049 72.1% 4.93 645.3 49.4% 22.6% 0.083 0.691 2.85 20.7% 10.7% 21.8%

Table 3Summary of Theoretical Predictions
Total Debt-to-Value Debt-to-Value Predictions (Table 5)Theory (Table 4) NLC Debt FC Debt SLC Debt LC / Total Debt SLC / All LC Debt
Static Trade-off Theory
Operating Margin (+) Business Risk (-) Sales (+) Average Tax Rate (+) Miller Gains-to-Leverage (+) Interest Rate Diff. (-)
Interest Rate Diff. (-) Interest Rate Diff. (+) Interest Rate Diff. (-) Family Affiliation (+)
Interest Rate Diff (-) Business Risk (+)
Interest Rate Diff (-) Family Affiliation (+)
Costly Monitoring and Agency Theory
Asset Tangibility (+) Market-to-book (-) Committed Capex (+) Operating Margin (+/-) Sales(-) Foreign Equity Listing (+) Family Affiliation (+)
Asset Tangibility (+/-) Market-to-book (+) Foreign Equity Listing (-)
Asset Tangibility (+) Market-to-book (-) Foreign Equity Listing (+) Family Affiliation (+)
Asset Tangibility (-) Market-to-book (+) Family Affiliation (-) Foreign Equity Listing (-)
Pecking Order Hypothesis
Operating Margin (-) Foreign Equity Listing (-)
Operating Margin (-) Foreign Equity Listing (-) Operating Margin (-) Foreign Equity Listing (+)
Foreign Equity Listing (-)
Endogenous Devaluation
Foreign EBIT (+)
Market Depth Hypothesis
Foreign Currency Debt (+) Sales (-)
LT Debt % [FC-LC] (-) Sales (+) Committed Capex (+) Foreign Equity Listing (+) LT Debt % [FC-LC] (+)
Sales (+) Committed Capex (+) Foreign Equity Listing (+)
Sales (-) Committed Capex (-) Foreign Equity Listing (-) LT Debt % [FC-LC] (-)
Sales (+) Committed Capex (+) Foreign Equity Listing (+)
Risk Management Foreign EBIT (+) Foreign Cash (+)
Foreign EBIT (+) Foreign Cash (+)
Foreign EBIT (-) Foreign Cash (-) Sales (+/-) Operating Margin (-) Market-to-Book (+)
Foreign EBIT (-) Foreign Cash (-)
Foreign EBIT (-) Foreign Cash (-) Sales (+/-) Operating Margin (-) Market-to-Book (+)
Optimal Risk Sharing Business Risk (-) Operating Margin (+)
Business Risk (+) Operating Margin (-)
Business Risk (-) Operating Margin (+)
Business Risk (+) Operating Margin (-)
Debt Ratio Predictions (Table 6)
This table summarizes theoretical predictions discussed in the text. The second column summarizes predictions for total debt ratios analyzed in Table 4. The next three columns summarize predictions for debt-to-value measures for each type of debt analyzed in Table 4. Since the predictions for total debt levels in the second column often apply to each type of debt, only specific differences or additional insights are summarized in the these columns (see main text). The last two columns summarize prediction for local currency to total debt ratios (LC / Total Debt) and synthetic local currency debt to all local currency debt ratios (SLC / All LC Debt).

Table 4Determinants of Total Debt
(1) (2)Variable Coef. SE Coef. SE
Average Tax Rate 0.047 0.077 0.017 0.076Asset Tangibility -0.002 0.052 -0.005 0.048Business Risk -0.022 0.071 0.001 0.066Sales (log, USD) 0.019 ** 0.009 0.002 0.009Operating Margin -0.227 *** 0.066 -0.175 *** 0.063Market-to-Book -0.049 *** 0.006 -0.047 *** 0.006Foreign Equity Listing (Dummy) -0.029 0.020 -0.033 * 0.020Committed CapEx / Sales 0.040 *** 0.015 0.037 *** 0.014Foreign EBIT (% Value) 0.528 ** 0.229 0.469 ** 0.214Foreign Cash (% Value) -0.058 0.178 0.033 0.169Family Affiliation (Dummy) -0.016 0.022 -0.017 0.021Foreign Currency Debt (Dummy) 0.114 *** 0.022 0.096 *** 0.022Miller Gains-to-Leverage 0.395 *** 0.068Interest Rate Differential -1.116 *** 0.423Intercept 0.111 0.122
Control Variables Country Dummies Hong Kong / China 0.290 ** 0.121 Singapore 0.292 ** 0.121 Taiwan 0.212 * 0.124 Indonesia 0.290 ** 0.118 South Korea 0.612 *** 0.135 Malaysia 0.299 ** 0.126 Philippines 0.289 *** 0.116 Thailand 0.358 *** 0.119 Industry Dummies SIC2 - Basic Materials 0.006 0.039 0.035 0.036 SIC3 - Manufacturing -0.024 0.039 -0.017 0.037 SIC4 - Transportation & Utilities 0.012 0.041 0.025 0.039 SIC5 - Wholesale and Retail Trade -0.023 0.045 0.036 0.043 SIC6 - Fin. Services & Real Estate -0.015 0.046 0.008 0.044 SIC78 - Other Services -0.002 0.050 0.005 0.047
Number of Observations 315 315R-Squared 52.1% 82.5%
Dependent Variable: Total Debt-to-Value Ratio
This table presents results from OLS regressions using all sample firms with sufficient data. The dependent variable is total debt divided by firm value in 1996. Independent variables are defined in detail in Appendix A. Coefficients (Coef.) and heteroskedasticity consistent standard errors (SE) are reported. Results from the first estimation in column (1) include two country specific variables, the Miller Gains-to-Leverage and the Interest Rate Differential. Results in column (2) include country dummy variables for all countries (in place of a constant) instead of the country specific variables. Asterisks (***, **, *) denote significance in a two-tailed test at the 1%, 5%, and 10% level, respectively, against a null of 0.0.

Table 5Determinants of Debt Type
Dependent Variable: Debt-to-Value Ratio(1) (2) (3)
Natural Local Foreign Synthetic LocalCurrency Debt Currency Debt Currency Debt
Variable Coef. SE Coef. SE Coef. SE
Average Tax Rate 0.030 0.077 -0.062 0.083 0.095 0.117Asset Tangibility -0.014 0.052 0.136 ** 0.059 0.080 0.077Business Risk 0.000 0.070 0.100 0.077 -0.008 0.077Sales (log, USD) 0.017 ** 0.008 0.041 *** 0.009 -0.024 * 0.014Operating Margin -0.271 *** 0.066 -0.005 0.075 0.080 0.095Market-to-Book -0.034 *** 0.006 -0.035 *** 0.007 0.004 0.009Foreign Equity Listing (Dummy) 0.015 0.020 -0.058 *** 0.023 0.003 0.030Committed CapEx / Sales 0.013 0.015 0.053 *** 0.014 -0.016 0.020Foreign EBIT (% Value) 0.284 0.227 0.721 *** 0.260 -1.398 ** 0.666Foreign Cash (% Value) -0.310 * 0.175 0.590 *** 0.179 -0.130 0.236Family Affiliation (Dummy) -0.026 0.022 -0.003 0.024 0.003 0.031Long-term Debt Percent (FC-LC) -0.081 *** 0.029 0.152 *** 0.029 -0.023 0.036Miller Gains-to-Leverage 0.356 *** 0.068 0.020 0.075 0.140 0.122Interest Rate Differential -1.209 *** 0.420 1.505 *** 0.484 -1.639 ** 0.696Intercept 0.102 0.120 -0.603 0.143 0.217 0.057
Industry Dummies SIC2 - Basic Materials -0.019 0.039 0.024 0.044 0.051 0.057 SIC3 - Manufacturing -0.049 0.039 0.008 0.043 0.088 0.060 SIC4 - Transportation & Utilities -0.007 0.042 0.053 0.047 -0.040 0.060 SIC5 - Wholesale and Retail Trade -0.053 0.045 -0.037 0.050 0.193 *** 0.065 SIC6 - Fin. Services & Real Estate 0.023 0.046 -0.094 * 0.054 0.003 0.067 SIC78 - Other Services -0.053 0.051 -0.005 0.061 -0.023 0.081
Number of Observations 315 315 162 Left Censored 34 138 96
This table presents results from TOBIT regressions using all sample firms with sufficient data. The dependent variable is the value of the type of debt described divided by firm value in 1996. Independent variables are defined in detail in Appendix A. Coefficients (Coef.) and standard errors (SE) are reported. Asterisks (***, **, *) denote significance in a two-tailed test at the 1%, 5%, and 10% level, respectively, using a Wald chi-squared test against a null of 0.0. The estimation for synthetic local currency debt (column 3) includes only firms with foreign debt since this is a precondition for synthetic local currency debt and excludes South Korean firms that are prevented by law from using derivatives (and therefore SLC debt).

Table 6Debt Ratios
(1) (2)Local Currency Debt to Synthetic Local Debt to
All Debt Ratio All Local Debt RatioVariable Coef. SE Coef. SE
Average Tax Rate 0.311 0.235 0.180 0.546Asset Tangibility -0.446 *** 0.167 0.549 0.360Business Risk -0.311 0.221 -0.169 0.353Sales (log, USD) -0.079 *** 0.026 -0.117 ** 0.064Operating Margin -0.074 0.214 0.622 0.432Market-to-Book 0.038 ** 0.019 0.076 ** 0.042Foreign Equity Listing (Dummy) 0.121 * 0.064 -0.078 0.139Committed CapEx / Sales -0.137 *** 0.045 -0.012 0.100Foreign EBIT (% Value) -1.701 ** 0.720 -2.123 3.019Foreign Cash (% Value) -1.539 *** 0.505 -0.366 1.026Family Affiliation (Dummy) -0.028 0.070 0.085 0.141Long-term Debt Percent (FC-LC) -0.597 *** 0.086 0.165 0.175Miller Gains-to-Leverage 0.136 0.208 0.369 0.548Interest Rate Differential -4.503 *** 1.358 -6.395 ** 3.127Intercept 2.283 *** 0.400 0.957 0.955
Industry Dummies SIC2 - Basic Materials 0.040 0.122 0.127 0.276 SIC3 - Manufacturing 0.091 0.121 0.159 0.287 SIC4 - Transportation & Utilities -0.021 0.130 -0.345 0.288 SIC5 - Wholesale and Retail Trade 0.197 0.141 0.737 ** 0.306 SIC6 - Fin. Services & Real Estate 0.341 ** 0.152 -0.076 0.316 SIC78 - Other Services -0.019 0.172 -0.075 0.416
Number of Observations 302 145 Left Censored 17 79 Right Censored 125 4
This table presents results from TOBIT regressions using all sample firms with sufficient data. In column (1) the dependent variable is the ratio of the value of local debt to all debt in 1996. In column (2) the dependent variable is the ratio of the value of synthetic local debt to all local debt. Independent variables are defined in detail in Appendix A. Coefficients (Coef.) and standard errors (SE) are reported. Asterisks (***, **, *) denote significance in a two-tailed test at the 1%, 5%, and 10% level, respectively, using a Wald chi-squared test against a null of 0.0. The estimation for synthetic local currency (column 2) includes only firms with foreign debt since this is a precondition for synthetic local currency debt and excludes South Korean firms that are prevented by law from using derivatives (and therefore synthetic local debt). Fewer observations are available for this analysis as compared to Table 4 since some firms have either no debt or no local currency debt.

Table 7Financial Performance Around the Asian Crisis
(1) (2) (3)
Variable Coef. SE Coef. SE Coef. SE
Natural Local Currency Debt -0.343 ** 0.150 -13.514 *** 2.221 -8.391 *** 1.159Foreign Currency Debt -0.415 ** 0.200 -12.940 *** 2.967 -8.786 *** 1.470Synthetic Local Currency Debt -1.202 *** 0.410 -17.576 *** 6.127 -12.478 *** 3.047Long-term Debt Percent -0.040 0.072 -5.455 *** 1.084 -1.547 *** 0.549Foreign EBIT (% Value) 1.295 *** 0.521 26.613 *** 7.815 9.102 ** 3.846Foreign Cash (% Value) -0.078 0.420 5.337 6.298 4.244 3.178Sales (log, USD) 0.070 *** 0.021 -0.005 0.311 -0.029 0.155Foreign Equity Listing 0.118 ** 0.050 0.381 0.745 0.184 0.369Family Affiliation (Dummy) 0.083 0.052 -1.266 0.780 -0.125 0.389
Number of Observations 316 318 310Adjusted R2 17.2% 55.1% 69.2%
This table reports results from OLS regressions with measures of equity market and financial performance as the dependent variables. Excess equity return (column 1) is defined as the holding period return for each company in the sample minus the domestic market index holding return. The equation is estimated for the crisis period (June 28, 1997 to June 26, 1998). The second column (2) shows results from using interest coverage in 1998 as the dependent variable. The third column (3) shows results from using the Altman modified Z-score in 1998. Independent variables included as levels are for 1996. Debt variables are the (predetermined) debt-to-value ratios. Dummy variables are included for all countries (in place of a constant) and for 1-digit SIC industries but not reported to conserve space. Independent variables are defined in detail in Appendix A. Coefficients (Coef.) and heteroskedasticity consistent standard errors (SE) are reported. Asterisks (***, **, *) denote significance in a two-tailed test at the 1%, 5%, and 10% level, respectively, against a null of 0.0.
Dependent Variable = Interest Coverage
(1998)
Dependent Variable = Excess Equity Return
(6/1997 to 6/1998)
Dependent Variable = Modified Z-Score
(1998)

Table 8Operating Performance Around the Asian Crisis
(1) (2) (3)
Variable Coef. SE Coef. SE Coef. SE
Natural Local Currency Debt 0.000 0.187 -0.069 0.056 0.008 0.178Foreign Currency Debt 0.541 ** 0.250 -0.028 0.075 0.655 *** 0.237Synthetic Local Currency Debt -0.869 * 0.515 -0.268 * 0.155 0.309 0.490Long-term Debt Percent 0.125 0.091 -0.015 0.027 0.074 0.086Foreign EBIT (% Value) 1.189 * 0.657 0.149 0.198 -0.832 0.624Foreign Cash (% Value) -0.313 0.530 -0.101 0.159 0.104 0.504Sales (log, USD) -0.109 *** 0.026 0.006 0.008 -0.069 *** 0.025Foreign Equity Listing 0.090 0.063 -0.003 0.019 0.024 0.059Family Affiliation (Dummy) 0.018 0.066 -0.004 0.020 -0.045 0.062
Number of Observations 318 318 317Adjusted R2 30.3% 19.7% 32.8%
This table reports results from OLS regressions with measures of operating performance as the dependent variables. The change in log sales (column 1) is defined as the difference between 1996 and 1998 in the log of sales measured in US Dollars. The second column (2) shows results with the change in operating margin between 1996 and 1998 as the dependent variable. The third column (3) shows results from changes in net investment from 1996 to 1998 using net property, plant, and equipment (standardized by sales in 1998) as the dependent variable. Independent variables included as levels are for 1996. Debt variables are the (predetermined) debt-to-value ratios. The variables representing changes in sales and operating margin are calculated as differences from 1996 to 1998. Dummy variables are included for all countries (in place of a constant) and for 1-digit SIC industries but not reported to conserve space. Independent variables are defined in detail in Appendix A. Coefficients (Coef.) and heteroskedasticity consistent standard errors (SE) are reported. Asterisks (***, **, *) denote significance in a two-tailed test at the 1%, 5%, and 10% level, respectively, against a null of 0.0.
Dependent Variable = Change in PPE / Sales
(1998-1996)
Dependent Variable = Change in log Sales
(1998-1996)
Dependent Variable = Change in Operating Margin (1998-1996)

% of Market Value Change ForeignCountry Due to Net Foreign Debt EBIT (%)
All Countries (excluding HK / China) 37.0% 23.0%
High Income (excluding HK / China) 10.9% 35.9%
Singapore 4.8% 42.7%
Taiwan 16.6% 28.9%
Middle Income 42.9% 20.2%
Indonesia 80.5% 19.5%
Malaysia 15.3% 11.3%
Philippines 6.8% 12.7%
South Korea 45.9% 29.0%
Thailand 30.4% 20.7%
% of Market Value Change ForeignIndustry Due to Net Foreign Debt EBIT (%)
SIC1 - Agriculture, Mining, Building 17.2% 34.2%
SIC2 - Basic Materials 45.3% 22.7%
SIC3 - Manufacturing 36.1% 36.2%
SIC4 - Transportation & Utilities 30.9% 10.4%
SIC5 - Wholesale and Retail Trade 52.2% 15.6%
SIC6 - Fin. Services & Real Estate 24.9% 1.1%
SIC78 - Other Services 4.1% 22.6%
Table 9Direct Value Loss from Exposed Foreign Debt
Panel A
Panel B
This table reports estimates of the percent of market value decline directly attributable to the increase in the local currency value of net foreign debt during the Asian currency crisis. Panel A reports values by country and panel B reports values by industry. The values are estimated by calculating foreign debt exposed to currency risk then multiplying this by the change in currency value against the USD during the crisis period and finally dividing this quantity by the change in market value of equity during the crisis period. Foreign debt exposed to currency risk is defined as unhedged foreign debt minus foreign cash reserves. This value is negative for 13 firms because these firms had foreign cash reserves in excess of foreign debt. We exclude Hong Kong and Chinese firms since the Hong Kong Dollar did not depreciate against the USD. Estimates are truncated at -100% and +200% because of a few outliers.

Table ADeterminants of Debt Type (Simultaneous Equation Estimation)
Dependent Variable: Debt-to-Value Ratio(1) (2) (3)
Natural Local Foreign Synthetic LocalCurrency Debt Currency Debt Currency Debt
Variable Coef. SE Coef. SE Coef. SE
Natural Local Currency Debt 0.781 * 0.444 -0.298 0.529Foreign Currency Debt 0.071 0.133 0.654 *** 0.263Synthetic Local Currency Debt -0.351 *** 0.045 0.407 ** 0.189
Average Tax Rate 0.087 0.074 -0.156 * 0.096 0.193 0.120Asset Tangibility 0.031 0.051 0.014 0.084 -0.022 0.106Business Risk 0.032 0.064 -0.076 0.121 -0.010 0.138Sales (log, USD) -0.002 0.009 0.045 *** 0.010 -0.034 ** 0.014Operating Margin -0.131 ** 0.064 0.065 0.099 0.068 0.135Market-to-Book -0.030 *** 0.005 -0.036 *** 0.007 0.008 0.009Foreign Equity Listing (Dummy) -0.005 0.019 -0.055 ** 0.023 0.038 0.031Committed CapEx / Sales 0.008 0.013 0.054 *** 0.014 -0.011 0.021Foreign EBIT (% Value) 0.143 0.205 0.781 *** 0.261 -1.294 ** 0.645Foreign Cash (% Value) -0.083 0.162 0.484 *** 0.181 -0.232 0.250Family Affiliation (Dummy) -0.022 0.020 0.001 0.024 0.008 0.031Long-term Debt Percent (FC-LC) -0.035 0.033 0.160 *** 0.032 -0.131 *** 0.049Miller Gains-to-Leverage -0.025 0.083 0.155 0.096 0.123 0.128Interest Rate Differential -0.657 * 0.402 1.703 *** 0.539 -3.175 *** 0.931Intercept 0.175 0.125 -0.591 0.143 0.457 0.055
Industry Dummies SIC2 - Basic Materials 0.020 0.036 0.001 0.044 0.030 0.055 SIC3 - Manufacturing -0.030 0.035 0.015 0.044 0.054 0.059 SIC4 - Transportation & Utilities 0.004 0.039 0.067 0.047 -0.084 0.061 SIC5 - Wholesale and Retail Trade 0.080 * 0.045 -0.143 ** 0.068 0.205 *** 0.063 SIC6 - Fin. Services & Real Estate 0.053 0.043 -0.145 ** 0.060 0.067 0.070 SIC78 - Other Services -0.040 0.046 0.048 0.068 -0.026 0.084
Number of Observations 315 315 162 Left Censored 34 138 96
This table presents results from a two-stage simultaneous-equation analysis discussed in Appendix B. The dependent variable is the value of the type of debt described divided by firm value in 1996. Fitted values of other debt types from a first stage estimation are inluded in the estimation. Other independent variables are defined in detail in Appendix A. Coefficients (Coef.) and standard errors (SE) are reported. Asterisks (***, **, *) denote significance in a two-tailed test at the 1%, 5%, and 10% level, respectively using a Wald chi-squared test against a null of 0.0. The estimation for synthetic local currency (column 3) includes only firms with foreign debt since this is a precondition for synthetic local currency debt and excludes South Korean firms that are prevented by law from using derivatives (and therefore synthetic local currency debt).


![[Bai Dich] Capital Tructure - A Review](https://img.pdfslide.net/doc/110x75/55cf96fc550346d0338f1724/bai-dich-capital-tructure-a-review.jpg)