Embed Size (px)
Citation preview

APM Spring 2012 Solutions Page 1
APM Model Solutions Spring 2012
1. Learning Objectives:
8. The candidate will understand the behavior characteristics of individual and firms and be able to identify and apply concepts of behavioral finance.
Learning Outcomes: (8a) Explain how behavioral characteristics of individuals or firms affect the
investment or capital management process. (8c) Identify and apply the concepts of behavioral finance with respect to individual
investors, institutional investors, portfolio managers, fiduciaries and corporate managers.
Sources: Byrne & Brooks, “Behavioral Finance: Theory and Evidence” V-C172-09: Managing the Credit Cycle: A Behavioral Risk Interpretation, by J. Rizzi, Commercial Lending Review, January 2006 V-C119-07: From Efficient Market Theory to Behavioral Finance, by R. Shiller, Journal of Economic Perspectives, Winter 2003 Commentary on Question: The question was about inefficient markets, limits to arbitrage as well as governance and committee decision making. This was a relatively difficult question (especially part (e)) and not many candidates were able to correctly identify all points that should have been addressed. Solution: (a) Describe an arbitrage strategy that attempts to profit from this opportunity in the
short term. Purchase the undervalued bond from company XYZ and take a short position on bonds from other companies with equivalent risk profile.
(b) Identify and explain theoretical and practical limitations to this arbitrage strategy.
APM Spring 2012 Solutions Page 2
1. Continued
Theoretical limitations: • With the Efficient Market Theory, speculative asset prices always incorporate
the best information about fundamental values. • There may be a lack of fairly priced close substitute. Then arbitrageurs are
faced with fundamental risk in that they are unable to effectively hedge their position.
Practical limitations: • Price equals the optimal forecast or there should be no under pricing of assets; • Noise trader risk - Trading by uninformed investors may cause the mispricing
to increase before it corrects; • High implementation costs; • Short position may be scarce, expensive, difficult, or impossible.
(c) Explain the behavioral biases that may influence Peter’s recommendation.
Agency problem: Managers are rewarded for relative performance and coming out of a recent recession, managers can try to stand out by taking inappropriate cyclical risk to win advancement. Overconfidence: Peter may overestimate his ability and the accuracy of the information he has. Representativeness: Due to the strong economic recovery, company XYZ may appear to be doing well, however, the underlying probability of default and correlation with the economy may not be understood well. Availability Bias: The signs of strong economic recovery are fresh in memory and the probability of default or financial distress seems unlikely. Frame Dependence and Anchoring: In the past, it is possible that Peter has discovered investment opportunities in a similar fashion and causes him to form biased beliefs.
(d) Give a rationale why the Investment Committee might accept and a rationale why
they might reject his recommendation if:
(i) Peter’s compensation is dependent on the projected long term performance of the company.
Accept because incentive is properly aligned.

APM Spring 2012 Solutions Page 3
1. Continued Reject because “SleepWell” payoffs require making comfortable decisions that reduce the risk of regret. This is achieved by making safe, conventional choices.
(ii) Peter’s long term track record shows below market gains, but his short
term track record shows above market gains.
Accept because Peter’s recent track record shows above market returns. Reject in order to avoid availability bias: Peter’s recent track record shows above market returns, but the long term performance is below market returns.
(e) Critique whether this arbitrage strategy would be appropriate for Wonka’s
Guaranteed Investment Contract product line.
Immediate capital gains may help Wonka meeting the guarantee value in the GIC. However, it may be subject to reinvestment risk as capital gains have to be reinvested in a low interest rate environment. There is an increase in default risk due to concentration in XYZ bonds. Wonka may also be subject to foreign exchange (currency) risk as some of these liabilities are denominated in Euros.

APM Spring 2012 Solutions Page 4
2. Learning Objectives: 1. Candidate will understand and be able to follow the investment management
process for insurance companies, pension funds and other financial intermediaries.
Learning Outcomes: (1c) Determine how a client’s objectives, needs and constraints affect the selection of
an investment strategy or the construction of a portfolio. Considerations include: • Funding objective • Risk-return trade-off • Regulatory and rating agency requirements • Risk appetite • Liquidity constraints • Capital, tax and accounting considerations
Sources: V-C127-09: Liability-Relative Strategic Asset Allocation Policies V-C138-09: Managing Your Advisor: A Guide to Getting the Most Out of the Portfolio Management Process Commentary on Question: This question addressed topics related to strategic asset allocation policy of a pension plan. The performance by the candidates on this question was moderate. Solution: (a) List and describe your role and responsibilities as an investment actuary.
The role and responsibilities of an investment actuary consist in: • Helping the product actuaries and senior management set realistic investment
objective, adjust product design to take advantage of different investment strategies;
• Adjusting expected yields for expected default risk, convexity risk, and investment expenses, plan for and explain variations in investment income and capital gains;
• Developing corporate policy for liquidity, Asset/Liability Management, investment and derivatives;
• Providing product information to the investment advisor; • Helping set initial and renewal credited interest rates; • Coordinating cash levels with the Treasury department; • Advising the portfolio manager about accounting and product constraints on
specific trades; • Reviewing how new securities purchases are allocated between asset
segments; • Leading asset/liability modeling;
APM Spring 2012 Solutions Page 5
2. Continued
• Coordinating how investment returns affect financial statements and policyholder values.
(b) Justify the role of equities in the pension plan.
Hedging: Although the liability is dominantly bond-like, any market-related model of the liability that includes future accruals has to have some small component of equities to model the market-related risk in those future values. Factors such as the health of the company, the size of the workforce, and the size of the pay package are all related to economic factors that are best modeled as equity-life exposure. Leverage: The plan is currently underfunded. Equities will be necessary to get the plan up to a higher asset beta. Return: Wonka may have made a conscious decision to seek more equity exposure than the minimum variance level in order to achieve higher return.
(c)
(i) Compute the expected liability-relative return on surplus.
RS (L) = ((A0/L0)*RA)-RL L0 = $340,200,000 A0 = $321,400,000 RL = 5.5% RA = 8.0% RS (L) = 2.1%
(ii) Compute the expected asset return and estimate the asset duration required
for a Minimum-Surplus-Variance (MSV) portfolio.
RS (L) = 0 because an MSV portfolio optimized using the above definition of the return of surplus would ideally have no change in the surplus from period to period. RA = RL*(L0/A0) RA = 5.8% Duration matching strategy can be interpreted as approximations to the MSV portfolio on the surplus efficient frontier.

APM Spring 2012 Solutions Page 6
2. Continued The liability duration is 17.1, hence asset duration of 18.1 (17.1*L0/A0) is required for a MSV portfolio. This is achieved by matching dollar duration.
(d) Recommend how you will change the current asset portfolio to minimize surplus
variance.
Current fixed income duration is 5.1; we need to increase the duration of portfolio to 17.1. The retired lives, inactive lives and the accrued portion of the active lives are very bond-like. Current allocation to fixed income is only 20%, hence we may want to increase exposure on fixed income. Invest in long-term bonds and TIPS in the asset portfolio. Wonka Life has 55% allocation to equity; we need to reduce exposure to equities.
(e) Explain why you might make investment decisions based on the surplus efficient
frontier.
Making decision using the surplus frontiers allows Wonka to understand the financial characteristics of the liability. By understanding the beta risk of the liability, Wonka can incorporate appropriate assets into the asset portfolio to hedge the liability risk. Once the surplus efficient frontier has been determined, Wonka has a benchmark against which to measure the plan’s risk aversion and risk tolerance. With a surplus frontier, at least Wonka can measure the plan’s risk exposure by reference to the MSV point that ties the asset beta to the liability beta. In contrast, the asset-only frontier does not offer a reference point from which one can understand how much risk is being taken.

APM Spring 2012 Solutions Page 7
3. Learning Objectives: 2. The candidate will understand the variety of financial instruments available to
managed portfolios. 4. The candidate will understand and apply quantitative techniques for portfolio
management. Learning Outcomes: (2a) Compare and select specialized financial instruments that can be used in the
construction of an asset portfolio supporting financial institutions and pension plan liabilities.
(4e) Describe, contrast and assess techniques to measure liquidity risk. Sources: Liquidity Risk Measurement, CIA Educational Note Liquidity Risk Measurement and Management Chapters 2 and 3 When Safe Proved Risky: Commercial Paper During the Financial Crisis of 2007-2009 Commentary on Question: The purpose of this question was to test whether the candidate understands the many sources of liquidity risk that can come from both sides of the balance sheet. The candidate was expected to show this by performing a liquidity risk measurement calculation and critiquing the method used. They were also asked to recall qualitative considerations when measuring liquidity risk and describe how cash inflows from the sales of assets should be determined. Lastly they had to identify risks of investing in asset-backed commercial paper and how it might impact the company’s liquidity profile. The performance by the candidates on this question was quite strong. Solution: (a) Calculate the Liquidity Ratio under both the Normal and Panic Scenarios.
Liquidity Ratio = Cash & Short Term Assets / Projected Demand Liabilities Cash & Short Term Assets = 355,000 + 400,000 = 755,000 Normal Scenario Projected Liabilities = (300,000*15% + 400,000*10% + 1,500,000*15% + 700,000*0% + 1,500,000*8% + 630,800*0%) = 430,000 Panic Scenario Projected Liabilities = (300,000*90% + 400,000*60% + 1,500,000*90% + 700,000*0% + 1,500,000*48% + 630,800*0%) = 2,580,000 Normal Scenario Liquidity Ratio = 755,000 / 430,000 = 1.76

APM Spring 2012 Solutions Page 8
3. Continued Panic Scenario Liquidity Ratio = 755,000 / 2,580,000 = 0.29
(b) Identify three shortcomings of the liquidity measurement framework mentioned
above.
The Liquidity Ratio should be examined over multiple time horizons; uncertain here what the time frame is. The projected demand liabilities should use cash surrender value, net of any surrender charges and market value adjustments. Only realizable market value of assets should be considered, book values are irrelevant.
(c) List key qualitative questions to address when assessing liquidity risk.
Are diversified funding sources established, in use and back-tested? What is the current long/short term rating and what is the outlook? Is there a board-approved liquidity policy in place with fixed standards on responsibilities, methodologies, limit system and reporting? Has the bank implemented an IT-infrastructure that allows for daily quantitative assessment of liquidity risk? Does the bank measure liquidity risk under different environments, including stress levels? Does the bank only consider fixed cash flows or does it model cash flows by taking into account behavioral adjustments? Does a liquidity contingency plan exist that addresses responsibilities of each unit and the measures to be taken? Has the bank established an internal transfer pricing system for liquidity risk?
(d) List the steps necessary to forecast the quantity of stand-by liquidity available in a
given scenario.
Determine what sources are available in each scenario. Determine the order in which each source will be accessed.

APM Spring 2012 Solutions Page 9
3. Continued Forecast how long it will take to convert each source to cash. Determine how much cash can be obtained accounting for haircuts for “marketable securities.”
(e) Describe the risks involved with asset-backed commercial paper.
Although commercial paper has long been viewed as highly liquid and low risk, asset-backed commercial paper can be risky because conduits (issuers) are exposed to significant roll-over/liquidity risk. The reason for roll-over risk is that conduits are invested in long-term, securitized assets. There is maturity mismatch between the assets backing the commercial paper and the maturity of the commercial paper. If all investors stop refinancing, issuer can have a hard time selling off its asset to repay investors. One of the lessons learned from the financial crisis is that the liquidity of the collateralized assets in the secondary market could suddenly disappear.
(f) Critique the CIO’s suggestion.
It is not advisable to move the entire cash position into ABCP. In a panic scenario the market for ABCP could dry up and the assets would no longer be considered a liquid. The new panic scenario liquidity ratio would be 400,000/2,580,000 = 0.16. This would put the company at risk of being downgraded from A- to B+ rating with Byrd.
APM Spring 2012 Solutions Page 10
4. Learning Objectives: 4. The candidate will understand and apply quantitative techniques for portfolio
management. Learning Outcomes: (4d) Describe, contrast and assess techniques to measure foreign exchange risk. (4f) Describe, contrast and assess techniques for risk aggregation and diversification. Sources: “Foregn Exchange Rate Risk: Institutional Issues and Stochastic Modeling” by R. Gorvett, CAS “Developments in Modeling Risk Aggregation” – Basel October 2010 Commentary on Question: This question tested comprehension of foreign exchange risks and how to hedge them, as well as understanding risk aggregation techniques. The candidates did relatively well on this question. Solution: (a) Explain the foreign exchange (FX) risk exposures your company may have from
this business.
A list of exposures and a brief description were expected. Transaction risk – the risk that exchange rates would have changed between premium being received and claims paid. Translation risk – converting from the foreign currency to the home currency to present results for financial reporting.
(b) Explain why your company might want to manage its FX exposure.
Explain the negative impacts if FX is not hedged. If taxes are graduated, fluctuations up and down may result in higher overall taxes. Volatile earnings may produce financial uncertainty. Funding for investments may be disrupted.

APM Spring 2012 Solutions Page 11
4. Continued (c) Explain the theoretical basis, and calculate the implied 1-year forward foreign
exchange rate for each of the following assumptions: (i) Full interest rate parity (ii) Full purchasing power parity Commentary on Question: The candidate is expected to comment on the theoretical basis, show a formula, and provide a solution. Interest rate parity – based on the observation that first exchanging then investing is risk free assets and exchanging the proceeds back should produce equivalent results to investing in the original currency at a risk free rate. SF/U x (1+rF) / (1+rH) = fF/U fF/U = 1.235 Full purchasing power parity – exchange rate futures should reflect anticipated inflation SF/U x (1+iF) / (1+iH) = fF/U fF/U = 1.223
(d) Identify and describe three different instruments that your company could use to
hedge FX risk.
Commentary on Question: Candidates are expected to list and describe three financial instruments Forwards and futures Swaps Options
(e) Assess the Chief Actuary’s suggestion.
Commentary on Question: Candidates are expected to provide pros and cons for the linear correlation model. Pros: Already in use in the organization and is simple.
APM Spring 2012 Solutions Page 12
4. Continued Cons; The simple dependency may not be adequate because risks are interdependent. Difficult to incorporate management actions or structural / legal impediments.
(f) Contrast alternative approaches to the approach in (e) for aggregating FX and
morbidity risks, identifying advantages and disadvantages.
Commentary on Question: Candidate should identify copulas and scenarios with some pros and cons of each. Copulas Pros: Direct control over the loss distributions Allows the dependencies to be specified in different areas of the loss distribution Uses the entire distribution Computationally easy Cons: No closed form solutions Difficult for a non-expert to interpret Difficult to fit parameters Scenario Testing Pros: Produces a deep understanding of risk drivers Easy to understand Can incorporate management actions Cons: Requires judgment and expertise Difficult to attach probabilities to outcomes
(g) Identify the possible challenges you may face when validating the suggested risk
aggregation method.
Back testing would require lots of data that may not be available. Benchmarking is difficult as business differ and some assumptions are undisclosed. Difficult to validate expert opinion. There may be areas where deliberate conservatism was added.
APM Spring 2012 Solutions Page 13
5. Learning Objectives: 5. The candidate will understand the specific considerations relative to managing an
equity and/or alternative asset portfolio within an asset allocation framework. Learning Outcomes: (5a) Explain how an investment policy affects the selection of an investment strategy
or the selection of an optimal portfolio. (5b) Assess a portfolio position against portfolio management objectives using
qualitative and quantitative techniques. (5d) Recommend an investment strategy for a given situation:
• Portfolio policy and objectives • Asset selection criteria • Capital market expectations • Risk management strategy • Portfolio rebalancing strategy
Sources: Maginn and Tuttle, Chapter 8 (M & T) Secular and cyclic Determinants of Capitalization Rates: The Role of property Fundamentals, Macroeconomic Factors and “Structural Changes,” Seguei Chervachidze Et. Al. (SC) Byrne & Brooks, “Behavioral Finance: Theory and Evidence” (BFTE) V-C119-07: From Efficient Market Theory to Behavioral Finance, by R. Shiller, Journal of Economic Perspectives, Winter 2003 Commentary on Question: This question tests candidates’ understanding of direct and indirect real estate and the role it plays in a portfolio. The question additionally tests the candidates’ understanding of the determinants of real estate capitalization rates and why actual observations of real estate prices may differ from theory. Solution: (a) Identify issues with direct equity real estate investing from the perspective of the
university’s endowment. • Illiquidity, large sizes, immobility, hard to divide into small pieces • High information costs • High transaction costs • High maintenance costs and requires management expertise • Exposed to neighborhood deterioration
APM Spring 2012 Solutions Page 14
5. Continued (b) Recommend Proposal 1 or Proposal 2 for the endowment and justify your
recommendation. Required Return = (1+spending rate) (1 + inflation) – 1 = (1.04) (1.015) – 1 = 5.56% Sharpe Ratio for Proposal 1 = (5.4% - 3%) / 9.5% = 0.256 Sharpe Ratio for Proposal 2 = (5.7% - 3%)/11.5% = 0.235 Proposal 1 has a higher Sharpe Ratio than Proposal 2, but Proposal 2 meets the overall investment objective to preserve the inflation-adjusted value of the assets after spending. Proposal 1 falls short of meeting the overall investment objective.
(c) Compare the features of direct property markets and REIT public markets.
Direct property market • Individual assets are directly traded • Longer to reflect value implications of news • Low liquidity • Higher transaction costs • High due diligence costs REIT public markets • Physical assets do not trade • Responds quickly to relevant news • High liquidity • More informationally efficient
(d) Explain with which part of the trustee’s statement you would agree or disagree.
“We should not be considering direct real estate.” • Disagree because university can exercise control and invest, for example, in
housing expansions to recruit more students while at the same time making decisions to support property appreciation. There are also tax advantages and greater leverage permissible.
REITS offer “substantially more liquidity.” • Agree with REIT providing more liquidity.

APM Spring 2012 Solutions Page 15
5. Continued
REITS “provide risk diversification comparable to direct real estate.” • Disagree because direct real estate’s correlations with U.S. equities and U.S.
bonds are lower than REITs’ correlations, making direct real estate a stronger diversifier when added to a portfolio of stocks and bonds.
(e) Explain whether it is reasonable to have negative coefficients for the ,log( )j tRRI
and tRTB variables.
Log(RRI) could have a negative coefficient if people are backward looking. If they think higher rental prices will continue then they will project these into the future and will bid up asset values, leading to lower capitalization rates. RTB should not have a negative coefficient. The capitalization rates should be positively correlated with the prevailing real levels of the risk-free rates.
(f) Identify one additional variable that could enhance the success of the model in
explaining capitalization rates.
Commentary on Question: Three variables were provided in the reading. The candidate would get full credit by describing any one of these three variables.
• Risk Premium - Higher risk premium would correspond to a higher expected
capitalization rate (positive coefficient) • Availability of debt in the economy or debt flows - Greater availability of debt
is associated with lower capitalization rates (negative coefficient) • Structural Changes / Investor sentiment or preference toward real estate as an
asset class - One could add a structural change dummy variable to the specification like a time dummy variable.
(g) Describe, using behavioral finance theory, two explanations for this observation.
Commentary on Question: The candidate need only provide two explanations to get full credit, but examples of appropriate explanations would include:
• The observation could be explained by the feedback model. This is when
prices increase, giving success to some investors and attracting public attention. This increases demand, which further increases real estate prices.

APM Spring 2012 Solutions Page 16
5. Continued
• The observation could be the result of overconfidence and excessive optimism where investors may be overconfident in their expectation of the return of real estate leading them to drive the prices up.
• The observation could be the result of conservatism where investors cling to prior beliefs in the face of new information.
• The observation may be attributable to availability bias where investors overstate the probabilities of recently observed or experienced events.
APM Spring 2012 Solutions Page 17
6. Learning Objectives: 2. The candidate will understand the variety of financial instruments available to
managed portfolios. Learning Outcomes: (2a) Compare and select specialized financial instruments that can be used in the
construction of an asset portfolio supporting financial institutions and pension plan liabilities.
Sources: Frank Fabozzi & Steven Mann, Handbook of Fixed Income Securities, 7th Edition, 2005, Chapter 16 Floating-Rate Securities, Page 374, Floater Coupon Formula and pages 379 – 380 Factors Affecting Floater’s Price John Brynjolfsson, Handbook of Fixed Income Securities, 7th Edition, 2005, chapter 15 Inflation-Linked Bonds, page 353 How TIPS Works, Page 354 CPI, page 356 Strategic Use – Inflation Hedge, page 368 Investor Type and page 372 Deflation Protection V-C154-09: Robert G. Bertram, Balancing the Opportunities in Real Return Investments, 2007, Page 49 Inflation and Deflationary Environments Commentary on Question: This question focuses on inflation-linked bonds and floaters. Candidates could generally produce the list in part (a). Part (b) was very well done. Part (c), most candidates did not know that in TIPS the principal would not be reduced below its value at issue. Consequently, with this lack of understanding only a handful of candidates got part (d). Solution: (a) List three factors that affect a floater’s price.
Time remaining to the next coupon reset date Changes in the market’s required margin Whether or not the cap or floor is reached
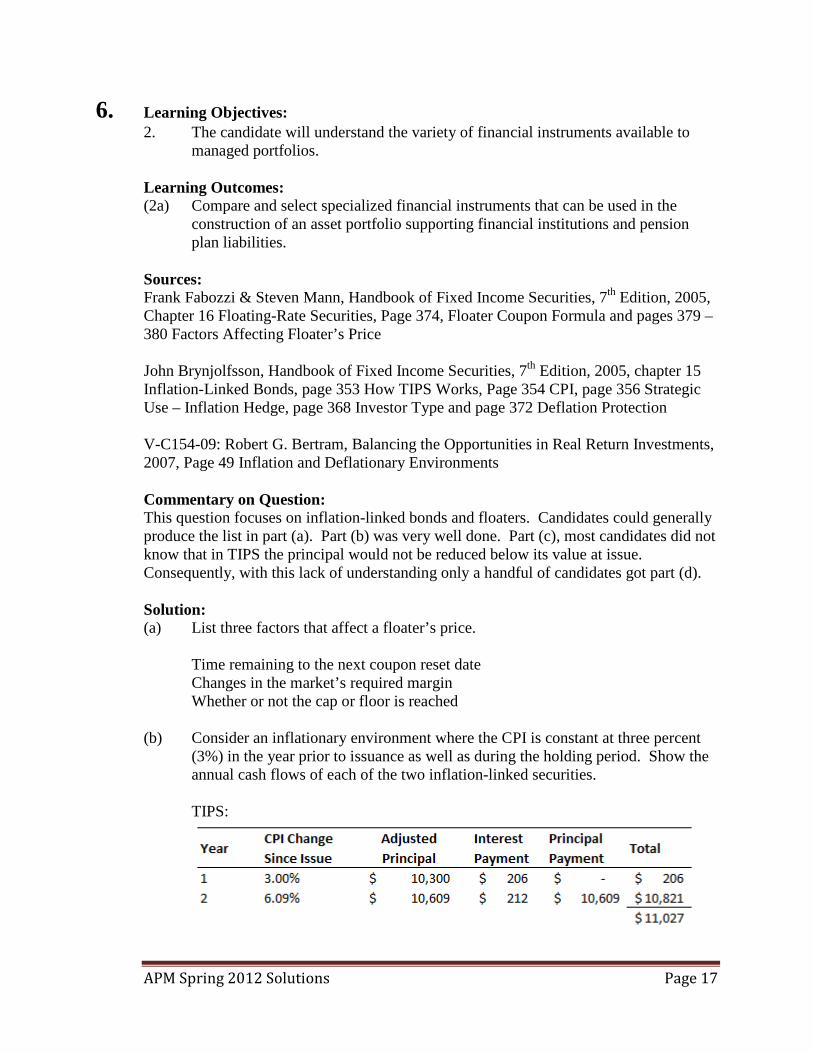
(b) Consider an inflationary environment where the CPI is constant at three percent
(3%) in the year prior to issuance as well as during the holding period. Show the annual cash flows of each of the two inflation-linked securities. TIPS:

APM Spring 2012 Solutions Page 18
6. Continued Inflation Floater:
Note that the TIPS pays an inflation adjusted principal and the Inflation Floater does not.
(c) Consider a deflationary environment where the CPI is constant at negative three
percent (-3%) in the year prior to issuance as well as during the holding period. Show the annual cash flows of each of the two inflation-linked securities.
TIPS: TIPS pays out the greater of the face principal or the inflation adjusted principal.
Floater: Floater interest payments are floored at 0.
(d) Design a two-year inflation scenario in which the sum of the cash flows for the inflation-floater security would be larger than that for the TIPS.
Commentary on Question: This is an open-ended question and could have been solved from first principles using equations, but a quicker approach would have been to leverage the solutions from part (b) and (c) above.

APM Spring 2012 Solutions Page 19
6. Continued
Year 1 CPI = 3%; Year 2 CPI = -3% TIPS CF Year 1 = 206 TIPS CF Year 2 = 200 + 1000 = 1200 Total TIPS CF = 1406 IF CF Year 1 = 500 IF CF Year 2 = 0 + 1000 = 1000 Total IF CF = 1500 IF CF > TIPS CF

APM Spring 2012 Solutions Page 20
7. Learning Objectives: 6. The candidate will understand the specific considerations relative to managing a
fixed income portfolio within an asset allocation framework. Learning Outcomes: (6f) Demonstrate how to apply funding and portfolio management strategies to control
interest rate and credit risk, including key rate risks. Sources: Fabozzi, HFIS, Chapter 47 Commentary on Question: This question tests candidates’ understanding of immunization strategies. The candidates’ performance on this question was relatively strong. Solution: (a) Describe the advantages and disadvantages of the following potential investment
strategies for assets backing this GIC.
(i) Zero coupon government bond with maturity in 30 months and 3.00%
Pros – no reinvestment risk; no credit risk; Cons – Insufficient yield.
(ii) 3-year BB-rated corporate bond with 5.8% yield to maturity
Pros – YTM higher than GIC crediting rate (positive spread); Cons – Reinvestment risk;
Uncertainty of value at time of GIC maturity; Below investment grade holding, so has credit risk.
(b) Demonstrate that this portfolio meets the requirements for single period
immunization for the recently issued GIC.
Criteria for meeting the requirements of single period immunization: • Duration Asset = Duration Liability; • PV Asset > PV Liabilities; • Dispersion Asset > Dispersion Liabilities.
Portfolio Asset Duration = ((2.8 x 5,282,000) + (1.9 x 4,257,000))/ (5,282,000 + 4,257,000) ≈ 2.4

APM Spring 2012 Solutions Page 21
7. Continued Liability Duration = 2.4 (from stem), so equal. PV assets = (5,282,000 + 4,257,000) = 9,539,000 > 9,350,000 = 10,000,000 * .935 = PV Liability Dispersion of assets = .35 > 0, dispersion of liability (zero coupon bond having a dispersion of 0).

APM Spring 2012 Solutions Page 22
8. Learning Objectives: 7. The candidate will understand the purposes and methods of portfolio performance
measurement. Learning Outcomes: (7a) Describe and assess performance measurement methodologies for investment
portfolios. (7c) Recommend a benchmark for a given portfolio or portfolio management style. (7d) Recommend a performance measurement methodology. Sources: Maginn & Tuttle, Managing Investment Portfolios: A Dynamic Process, Third Edition, Chapter 12, “Evaluating Portfolio Performance,” by Bailey, Richards, & Tierney Commentary on Question: The purpose of this question was to test whether the candidate could apply the properties of a valid benchmark to an uncommon scenario and to assess the pros and cons of applying something different that a traditional index fund. Candidates did well on this question. In parts (a) and (b) the candidates did not really understand that MWR overweights and underweights the returns of certain periods. For part (c) many did not stop to think why an absolute return figure is meaningless aside from saying that it needs to be compared to a benchmark. Solution: (a) Calculate the monthly time-weighted return and the money-weighted return for
portfolio Q. Explain why the two returns are not the same. For TWR: In the first period the return is (900 – 1000)/1000 = -10% In the second period the return is (400-300)/300 = 33.33% Monthly twr = [(1+r1)(1+r2)]^0.5 – 1 = [(1-10%)(1+33.33%)]^0.5 – 1 = 9.5% For MWR: 1M*(1+IRR)^2 – 600k*(1+RR) = 400 Clearly one solution to the above is IRR = 0% The MWR and TWR are not the same. TWR equally weights the returns in all time periods. MWR overweights the low returns of the first time period because the portfolio value is higher at the start of the projection.
(b) Recommend either the time-weighted or money-weighted return calculation
methodology for the purpose of assessing Mr Krang’s performance. Justify your recommendation.
APM Spring 2012 Solutions Page 23
8. Continued
I would suggest the TWR. The cash withdrawal in May was a surprise and Krang had no control over this cash-flow. The MWR would overweight or underweight certain periods depending on the cash-flow. If Krang could control the cash-flow then MWR would capture the timing benefits. But Krang cannot control the cash-flows. TWR equally weights all time periods and is insensitive to external cash-flows.
(c) Several years have passed and Mr. Krang has been replaced with a new
investment manager Ms. Bijou. In the first year of managing portfolio Q, Ms. Bijou achieved a return of 20%. In the second year the portfolio’s return was
5%− . Explain why the performance of Ms. Bijou cannot be evaluated based on these return figures alone.
We cannot evaluate her performance on return metrics alone, because we don’t know what the performance is like compared relative to other potential portfolios created with the same investment style. A return metric should be compared to a suitable benchmark. There are other issues: • We don’t know the nature of the risk in her portfolio. • We shouldn’t be using historical returns to solely evaluate a manager. • Qualitative elements should also be employed. • Two historical points are hardly indicative of anything.
(d) Recommend either the median-based benchmark or the current custom-security
based benchmarks to be used for individual managers. Justify your answer.
Use the custom based benchmark, it satisfies all the criteria for being a valid benchmark (e.g. Investable, specifiable, etc.). Median Benchmark is not advisable because: • Survivorship Bias - The best managers under the median benchmark may be
the ones who take on the most risk and gamble; having lucked out initially they stick around.
• Not specifiable in advance. • Benchmark is not investable and therefore cannot be owned. • Different portfolio managers take different risks/styles, and this benchmark
does not consider this.

APM Spring 2012 Solutions Page 24
8. Continued (e) Ms. Bijou has started adding derivatives to her portfolio.
Assess whether it is appropriate to continue using the same benchmark.
The benchmark needs to be altered. The benchmark risk and behavior should line up with the portfolio in order to be appropriate. Change the benchmark by adding a derivatives benchmark to the current benchmark.

APM Spring 2012 Solutions Page 25
9. Learning Objectives: 5. The candidate will understand the specific considerations relative to managing an
equity and/or alternative asset portfolio within an asset allocation framework. 7. The candidate will understand the purposes and methods of portfolio performance
measurement. Learning Outcomes: (5c) Evaluate situations associated with the presence of embedded options and hedging
strategies. (5d) Recommend an investment strategy for a given situation:
• Portfolio policy and objectives • Asset selection criteria • Capital market expectations • Risk management strategy • Portfolio rebalancing strategy
(7b) Describe and assess techniques that can be used to select or build a benchmark for
a given portfolio or portfolio management style.
Sources: Maginn and Tuttle, Chapters 8 and 12 Litterman, Modern Investment Management: An Equilibrium Approach, 2003, Chapter 26, Strategic Asset Allocation and Hedge Funds Commentary on Question: This question tests candidates’ understanding of hedge funds, the role they play in a portfolio, and how their performance could be measured and assessed. The question also tests candidates’ understanding of the qualities of a valid benchmark and the appropriateness of applying proposed benchmarks to assess hedge fund performance. Many candidates did well on this question. Solution: (a) While researching relative value hedge fund strategies you come across the
following strategies:
(i) Equity market neutral
(ii) Convertible arbitrage
(iii) Fixed income arbitrage
Describe each strategy.
APM Spring 2012 Solutions Page 26
9. Continued (i) Equity Market Neutral
Managers attempt to sell overvalued and buy undervalued securities while neutralizing the portfolio's exposure to market risk by combining the long and short positions.
(ii) Convertible Arbitrage
Convertible Arbitrage strategies attempt to exploit anomalies in the prices of corporate convertible securities, such as convertible bonds, warrants, and convertible preferred stock while hedging part or all of the associated risks. For example, buy an undervalued convertible bond while shorting the equity of the same company.
(iii) Fixed Income Arbitrage
Managers dealing in fixed-income arbitrage attempt to identify overvalued and undervalued fixed-income securities primarily on the basis of expectations of changes in the term structure of interest rates or the credit quality of various related issues or market sectors.
(b) Describe considerations in assigning weights to the three hedge fund strategies in
your hedge fund portfolio.
• Consider the expected returns of each strategy. • Consider the risk of the three hedge fund strategies when assigning weights.
Must ensure investor is comfortable with the risks. • Allocate weights to those hedge fund strategies that the investor thinks will
offer the best opportunities to enhance risk-adjusted performance.
(c) Compare qualitatively the overall portfolio volatility under the three proposals and explain the differences.
Portfolio 2 will have the lowest volatility and Portfolio 3 will have the highest volatility. Portfolio 1 will have a volatility in between Portfolios 2 and 3. In Portfolio 2 we are funding the hedge fund allocation out of the current equity allocation, which effectively substitutes an asset with low volatility (i.e. the hedge fund portfolio that has bondlike volatility) for one with higher volatility (the equity portfolio). In addition, the hedge fund portfolio is not perfectly correlated with the equity portfolio. In Portfolio 3 the potential to reduce total volatility when funding out of the fixed income allocation is much smaller since the hedge fund has bondlike volatility.
APM Spring 2012 Solutions Page 27
9. Continued (d)
(i) Critique Fred’s statement on assessing hedge fund programs; and
Fred’s statement is simplistic. Hedge fund returns are unique and are driven more by human skills (alpha) than by long-only indexes. For a given portfolio of assets investors should assess the impact of a hedge fund allocation on the level and distribution of risk and calculate the implied hurdle rate relative to cash of alternative hedge fund allocations, and finally determine whether a specific hedge fund program can achieve those hurdle rates.
(ii) Describe shortcomings of his proposal.
The existing hedge fund indexes available do not typically pass the tests required for them to be considered benchmarks. For example, many indexes are not transparent (i.e. either constituents or constituent weights are not known in advance) and some contain funds in which investors cannot place capital (not investible). Hedge fund indexes are also subject to the following biases: survivorship, backfill, incorrect fund categorization, frequency of reporting, leverage measurement, constituent weightings and completeness.
(e)
(i) Identify the type of benchmark,
Factor-based benchmark / Return-based benchmark (ii) Interpret the coefficients of the above equation; and
0.4% represents the systematic expected return that is unrelated to changes in the indices 0.4, 0.3, 0.1 are the sensitivities of the return to a change in each of the three indices (large-cap growth (LG), large-cap value (LV) and small-cap (S))
(iii) Assess whether it meets the qualities of a valid benchmark.
Properties of a valid benchmark: • Investible • Specified in advance • Owned

APM Spring 2012 Solutions Page 28
9. Continued
• Measurable • Appropriate • Unambiguous • Reflective of current investment options
The proposed benchmark meets all the above properties except Appropriateness. The benchmark may not be appropriate for hedge fund performance, which are unique and may have risks/exposures not captured by the benchmark.
APM Spring 2012 Solutions Page 29
10. Learning Objectives: 3. The candidate will understand the importance of the techniques and theory behind
portfolio asset allocation. Learning Outcomes: (3a) Explain the importance of asset allocation, relative to a particular situation. (3b) Critique and propose asset allocation strategies that can be used to construct an
asset portfolio. (3d) Demonstrate how to include risk management principles in the establishment of
investment policy and strategy including asset allocation. Sources: Litterman, Modern Investment Management: An Equilibrium Approach, 2003, Chapter 9 Issues in Strategic Asset Allocation FE-183-11: Goldman Sachs Asset Management White Paper, Revisiting the Role of Insurance Company ALM Within a Risk Management Framework V-C195-12: Xiong and Idzorek, The Impact of Skewness and Fat Tails on the Asset Allocation Decision Commentary on Question: This question was testing candidates’ understanding of the shortcomings of Markowitz mean-variance optimization and the impact of skewness and fat tails on mean-conditional value-at-risk (M-CVaR) optimization. The candidates’ performance on this question was satisfactory. Solution: (a) Identify four shortcomings in using Markowitz MVO for strategic asset
allocation.
The potential for extreme portfolio positions, e.g. extreme weights allocated to some particular asset classes, because optimal asset allocations are quite sensitive to small changes in expected return assumptions. Sensitivity of historical returns to the choice of historical time period. The choice of time period used for estimating returns has dramatic consequences for the optimal portfolio weights. Practitioners often find it is often hard to develop an intuition about the portfolio allocation.
APM Spring 2012 Solutions Page 30
10. Continued MVO does not allow for consistent advice giving across clientele types, because of the extreme portfolio positions, and because of different clients choosing their own set of constraints. Difficulty in estimating the required inputs – returns, standard deviations, and correlations. Does not incorporate the current market views. Only reflect historical returns, standard deviations and correlations. Future returns may drastically deviate from historical returns. Does not incorporate higher moments such as skewness and kurtosis, which are important statistics in measuring the downside risk. Assumption on asset class return being normally distributed, but asset class return distributions are not normally distributed, particularly in times of a financial crisis. Does not consider other risk measures such as Economic capital, Value-at-Risk (VaR), Conditional VaR, or drawdown risk. Viewing the optimal asset allocation under a single risk metric does not provide a complete picture.
(b) Estimate the portfolio VaR and CVaR for Strategy Y at the same confidence
level:
(i) For Scenario 1 based on MVO For Strategy X, the portfolio standard deviation is 11.25% Because of the normal distribution assumption under Scenario 1, both VaR and CVaR can be estimated by using the mean and standard deviation.
We are told that the portfolio VaR and CVaR at a certain confidence level are -11.5% and -16.1%, respectively. Plug in these numbers, we back out the adjustment factors for VaR and CVaR to be 1.65 and 2.06, respectively. -11.5% = 7% – z 11.25% -16.1% = 7% – Z 11.25%
(1.64)

APM Spring 2012 Solutions Page 31
10. Continued
(2.05) For Strategy Y, the portfolio standard deviation is 18.44%. Plug in the expected return and standard deviation to the formulas, we have
= 10% - 1.65*18.44% = -20.3% C = 10% - 2.06*18.44% = -27.9%
(ii) For Scenario 1 based on M-CVaR optimization
Because of the normal distribution assumption under Scenario 1, the MVO and the M-CVaR optimization should lead to very similar asset allocations and similar VaR and CVaR.
20.3%
27.9%p
p
VaRCVaR
= −
= −
(c) Given the risk free rate of 2%:
(i) Determine which of strategies X or Y is more efficient if the Sharpe ratio is used as the criterion for Scenario 1.
The Sharpe ratios can be calculated: For X: SR= (7-2)/11.25 = 0.44 For Y: SR = (10-2)/18.44 = 0.43 Strategy X is more efficient, if the Sharpe ratio is used as the criterion. OR Strategies X and Y are about the same, if the Sharpe ratio is used as the criterion.
(ii) Determine which of strategies X or Y is more efficient if the CVaR ratio is
used as the criterion for Scenario 1.
The CVaR ratio for Strategy X = = 0.31 Thus, comparing with Strategy Y whose CVaR ratio stands at
Strategy X is more efficient, if the CVaR ratio is used as the criterion.
(d) Describe changes between the M-CVaR allocations and the MVO allocations for
Scenario 2. Justify your answer.

APM Spring 2012 Solutions Page 32
10. Continued
The M-CVaR optimization will lower allocations to Asset C – the only fat-tailed asset in this scenario than do the MVO allocation
(e) Describe changes between the M-CVaR allocations and the MVO allocations for
Scenario 3. Justify your answer.
The M-CVaR optimization will decrease allocations to Asset B than do the MVO allocations. When kurtosis is controlled, which is the case where all three assets have the same kurtosis value of 6, the M-CVaR optimization tends to avoid the negatively skewed assets in order to minimize the CVaR.
(f) Describe two key ingredients that are necessary to apply the Black-Litterman
model.
1. Must identify a suitable market portfolio, i.e., determining the market value of all assets on a regular basis.
2. Must be able to determine or estimate volatility and correlation of asset returns in the market portfolio. They can be estimated from historical data as they are not nearly as sensitive as expected returns. In this particular scenario, we can use the market capitalization-based weights to back out the expected returns and then shift the location of historical return distributions by either adding or subtracting a constant to or from each historical return. As such, the volatility and correlation will remain the same as those of the historical returns.
APM Spring 2012 Solutions Page 33
11. Learning Objectives: 6. The candidate will understand the specific considerations relative to managing a
fixed income portfolio within an asset allocation framework. Learning Outcomes: (6b) Assess a portfolio position against portfolio management objectives using
qualitative and quantitative techniques. Sources: V-C164-09: Dynkin, L., J. Hyman, and W. Wu, Value of Security Selection Versus Asset Allocation in Credit Markets: Part II – An Imperfect Foresight Study, Lehman Bros., June 2000 Commentary on Question: This question deals with evaluating fixed income managers’ skills. Generally, the candidates’ performance on this question was poor. Solution: (a) Define a skillful manager and compare and contrast the ability to choose any
winning sector versus the best sector.
A manager who consistently outperforms the index is considered skillful (Or the views of a successful manager are correct more often than random selection). The winning sector is any sector with a return greater than the index return. The best sector is the one with highest return.
(b) Calculate each manager’s outperformance of the index.
Overall index return = 30%*0.15+5%*0.2+50%*(-0.02)+15%*0.1 = 0.06 Manager A: Outperformance % = 27%*(0.18-0.16)+30%*(0.2-0.16)+15%*(-0.06-0.06)+27.6%*(0.16-0.06) =0.084 Manager B: Outperformance % = 27%*(0.15-0.16)+30%*(0.16-0.16)+15%*(-0.06)+27.6%*(0.16-0.06) =0.079
(c) Calculate each manager’s skill at choosing the winning sector.
Let manager A’s skill % be x Nw=3 Nl=1 Pi= (3+x)/(3*(3+1))=(3+x)/12 Pl= (1-x)/(3+1)=(1-x)/4 =pi*0.12+pi*0.14-pl*0.12+pi*0.10=0.084 Solve for x, x=40%

APM Spring 2012 Solutions Page 34
11. Continued Let manager B’s skill % be y Nw=3 Nl=1
Pi= (3+y)/(1*(3+1))=(3+y)/12 Pl= (1-y)/(3+1)=(1-y)/4 =pi*0.10+pi*0.10-pl*0.06+pi*0.10=0.084 Solve for y, y=60%
(d) Recommend which manager should be selected and justify your recommendation.
Based on outperformance, one would pick manager A over manager B as A has higher outperformance percentage. Alternative: Based on skill level, one would pick manager B over A as B’s skill level is higher than A’s.
APM Spring 2012 Solutions Page 35
12. Learning Objectives: 1. Candidate will understand and be able to follow the investment management
process for insurance companies, pension funds and other financial intermediaries.
2. The candidate will understand the variety of financial instruments available to
managed portfolios. 4. The candidate will understand and apply quantitative techniques for portfolio
management. 6. The candidate will understand the specific considerations relative to managing a
fixed income portfolio within an asset allocation framework. Learning Outcomes: (1d) Identify and describe the impact on investment policy of financial and non-
financial risks including but not limited to: Currency risk, credit risk, spread risk, liquidity risk, interest rate risk, equity risk, product risk, operational risk, legal risk and political risk.
(2a) Compare and select specialized financial instruments that can be used in the
construction of an asset portfolio supporting financial institutions and pension plan liabilities.
(4a) Describe, contrast and assess techniques to measure credit risk, including spread
risk. (6i) Explain and recommend best practices in credit risk management, including:
• Credit and underwriting policies • Comprehensive due diligence • Diversification requirements and aggregate counter-party exposure limits • Use of credit derivatives and credit support agreements
Sources: Bohn and Stein, Wiley Finance, 2009, Active Credit Portfolio Management in Practice • Chapter 3 Structural Models, Pages 93, 95 and 171 • Chapter 5 Loss Given Default, Pages 255 – 256 • Chapter 6 Reduced Form Models, Pages 295 and 353 Frank Fabozzi, Handbook of Fixed Income Securities, 7th Edition, 2005 • Chapter 9 and 10, General Concepts on Fixed Income Financial Instruments on
Corporate Bonds and US Treasuries • Chapter 10, Page 274 • Chapter 15, Page 355

APM Spring 2012 Solutions Page 36
12. Continued Bluhm, Overbeck and Wagner, Introduction to Credit Risk Modeling, Concepts of Expected Loss, LGD, PD and EAD, Pages 1 – 3, 6-Calibration of Default Probabilities from Market Data, and page 15 V-C181-10: McNeil, Frey and Embrechts, Quantitative Riske Management, 2005, Chapter 9 Dynamic Credit Risk Models and Credit Derivatives, Pages 401 and 406 – 407 – Default, Non-Default: Evaluate Bond Price Using Default, Non-Default Tree Commentary on Question: This question tested the candidates’ knowledge of approaches to credit risk modeling. It also tested the candidates’ understanding of impacts of two different methods of recapitalizing a balance sheet of a company, using either an equity/debt swap or more debt. Additional commentary listed underneath question component. Solution: (a) Compare and contrast the following key features of the structural approach (e.g.
KMV) and the reduced-form approach (e.g. DSL) in credit risk modeling.
Commentary on Question: Most of the candidates did fairly well on this part.
(i) General Methodology
Structural approach: Generally draw on options pricing theory to link specific variables for a firm within a causal structure to the firm’s specific probability of default. (Source: B&H, pages 93, 95) Reduced Form: In contrast, reduced-form models assume that the time of default is unpredictable and uses a Poisson-like process to describe default. The timing of default is assumed to take the debt holders “by surprise.” (Source: B&H, pages 93, 94)
(ii) Credit events being modeled Structural: Default probabilities Reduced Form: Default
(iii) Risk drivers Structural: Asset values
APM Spring 2012 Solutions Page 37
12. Continued Reduced Form: Hazard rate (default intensity)
(iv) Strengths of models Structural: • Offer elegant descriptions of firm behavior and default. • Interpretive power: can produce output intuitive for users to interpret
and diagnose. • Flexibility for supporting corporate transaction analysis. • Can perform well when given appropriate practical modifications. • Can be used for modeling risk of large portfolios of credit exposures.
(Source: B&H, pages 95, 171) Reduced Form: • Models are simpler. • Model parameters can be estimated econometrically. • Can be important tools for extracting information from traded
securities without worrying too much about fundamental or intrinsic value. (Source: B&H, page 295, 353)
(v) Weaknesses of models
Structural: • Unrealistic or oversimplified model assumptions. • Model parameters such as market value of assets, asset volatility, etc.
can be difficult to observe directly. • In times of market turmoil, structural-model-based values will likely
differ substantially from observed market values. • May not be appropriate for certain pricing applications in difficult and
illiquid markets. (Source: B&H, page 93)
Reduced Form: • Relative parameter instability. • Relative lack of obvious theoretical underpinnings. • Computational difficulty in estimation for multifactor models. • Less suitable for large portfolio risk modeling.
(Source: B&H, pages 295, 300-301, 353) (b) In the Equity/Debt Swap program, suppose that ABC Ltd. issues $10 million of
equity to repurchase $10 million of debt.

APM Spring 2012 Solutions Page 38
12. Continued
(i) Calculate the debt value after the swap using the Black-Scholes-Merton model.
Commentary on Question: Most of the candidates had trouble applying the Black-Scholes-Merton model in this real situation. They just wrote down the general formulas without making the connections to the specifics of the problems, such as finding the market values of the debt and assets before the swap. Calculation problems that are novel demand real and deep understanding and candidates who feel not fully prepared often choose to skip so as to save time for other types of problems. Candidates who think deeply and practice similar calculations before exams try harder and do relatively better.
Equity can be viewed as a call option on the underlying firm’s assets and debt can be computed as the value of a risk-free security (like Treasury bond) minus a put option on the firm’s assets struck at the debt value. The debt value, therefore, can be written as:
Before the Equity/Debt swap, the market values of the debt and the assets are:
Thus, plugging in the asset volatility and all other numbers, we have the new debt value:
where d1 and d2 are
Source: Bohn and Stein. Pages 101, 102, 109, 134, 137.

APM Spring 2012 Solutions Page 39
12. Continued
(ii) Calculate the impact of the swap on the company’s credit spread.
Commentary on Question: Most of the candidates had trouble figuring out a way to measure the credit spreads before and after the swap. Some tried to use credit default swaps (CDS) but gave up eventually due to the lack of information. A few candidates used their intuition and concluded, correctly, that the credit spread would decrease due to the nature of the equity-for-debt swap. Partial credits were awarded for this intuition, even though no calculation was done by the candidates.
Before the swap, the yield to maturity on the bond is:
= 3.05% After the swap, the yield to maturity on the bond is:
% Before the swap, the credit spread is about 5 basis points (3.05% - 3%). After the swap, the credit spread is about 3 basis points (3.03% - 3.0%)
The recapitalization would therefore reduce the company’s credit spread by only about 2 basis points. Clearly, the numbers are just made up because no company (even AAA-rated) would have a credit spread in the single digit.
(c) In the More Debt Issuance program, suppose that the new bond has a maturity of
30 years, pays no coupons, and is senior to the first issue. The expected loss given default (LGD) for the new bond and for the old bond is 5% and 20%, respectively.
Commentary on Question: Most of the candidates did poorly, partly because this part depends on the previous part which they struggled to solve, and partly because candidates do not know where to start with and what materials to dump from their memory. This problem is tough, because it requires candidates to do some real analytic work, rather than memorization, under the heat of exam pressure. Candidates are generally well-prepared to regurgitate but under-prepared to analyze.

APM Spring 2012 Solutions Page 40
12. Continued
(i) Calculate the default intensity using the reduced-form approach.
The loss given default (LGD) is equivalent to 1 – recovery rate. Thus, the recovery rates for the new bond and the old bond are 95% and 80%, respectively. (This is not surprising, because the new issuance is senior to the old zero bond.) Let λ be the default intensity in the next 30 years. Applying the reduced form approach, we have the formula.
(ii) Calculate the credit spread on the new debt issuance. With the solved default intensity λ, we can use the same formula once more to come up with the market price of the new debt issue, assuming the face value of the bond is $1000.
The yield to maturity on the new issue is:
%
Thus, the credit spread is about 1 basis point (3.01% - 3%). Again, the numbers are just made up because no company (even AAA-rated) would have a credit spread in the single digit.
APM Spring 2012 Solutions Page 41
13. Learning Objectives: 6. The candidate will understand the specific considerations relative to managing a
fixed income portfolio within an asset allocation framework. Learning Outcomes: (6b) Assess a portfolio position against portfolio management objectives using
qualitative and quantitative techniques. (6f) Demonstrate how to apply funding and portfolio management strategies to control
interest rate and credit risk, including key rate risks. (6g) Explain how derivatives, synthetic securities, and financial contracting may be
used to manage risk and recommend appropriate ones for a given situation. Sources: V-C185-11: Mind the Gap: Using Derivative Overlays to Hedge Pension Duration, Financial Analysis Journal, Volume 65, #4, CFA Institute Commentary on Question: This question addressed hedging interest rate risk for a pension plan. In general, candidates did well on parts (a) thru (b)(ii). For part (b)(iii), many candidates neglected to consider the other assumptions in valuing the pension liabilities (e.g. salary increase assumption) that could affect model risk. For part (c)(ii), candidates could have done better in explaining the different scenarios and consequent payoffs for each of the two swaptions used in the collar strategy. Solution: (a) Explain the expected effect of falling interest rates on the pension plan funded
ratio.
There is a duration mismatch between the pension plan assets and its liabilities. Negative duration gap of 9.5 (15-5.5 =9.5) The pension plan is exposed to a drop in market interest rates since a decrease in interest rates will increase liabilities more than it increases assets.
(b) The plan sponsor chooses to match the duration of assets and liabilities using the
following interest rate swap:
(i) Explain qualitatively how a swap hedges the impact of changes in interest rates on the funded ratio.
1. Fort Pension Plan can close the negative duration gap using a pay-
floating, receive fixed interest rate swap.
APM Spring 2012 Solutions Page 42
13. Continued 2. The initial market value of the swap is zero, if interest rates rise,
the value of the receive-fixed swap will fall. If interest rates fall, the value of the swap will become positive, thus offsetting some of the losses that would have been sustained due to the negative duration gap.
(ii) Recommend a specific trade to hedge the plan liabilities using this swap.
Show your work.
Notional Principal = Market Value of Portfolio * (Target Duration – Portfolio Duration)/Swap Duration Notional Principal = 100 * (15-5.5)/8.5 = 111.76 million
(iii) Explain potential risks and implementation challenges.
1. There is ‘model risk’ due to the following reasons:
• The duration measure normally assumes parallel shifts in the yield curve, while in reality, the yield curve can also steepen/flatten.
• There is inherent uncertainty in determining the pension liabilities, which requires forward-looking assumptions (e.g. Salary increases, inflation).
2. There is a learning curve to adapting derivative contracts to hedge
liabilities. In addition, all stakeholders (sponsor, regulator, auditors, employees) will need to be brought on board in understanding the strategy.
(c) Describe how you would use the following derivatives in hedging interest rate
risk for the pension plan and compare the relative advantages of the two strategies:
(i) Interest rate swaption
Hedging using an interest swaption • Pay a premium for the option to enter into a receive-fixed swap at a
determined amount of notional principal, term and exercise date.
• At the exercise date, if the fixed swap rates are lower than the strike, the pension plan can either choose to enter into the swap and receive a higher fixed rate or to close out the swaption and collect a gain equal to present value of the notional principal multiplied by the difference between the strike rate and the current swap rate.

APM Spring 2012 Solutions Page 43
13. Continued
(ii) Two separate interest rate swaptions in a collar strategy
Hedging using two interest swaptions in a collar strategy • The benefit of using this strategy over using a single interest swaption
is the reduction/elimination of the up-front expense. The plan can buy a receive-fixed swaption paying x bps fixed rate and sell another which pays a higher bps fixed rate.
• At the exercise date, if the fixed rate is between x bps and the higher
rate on the sold swaption, then both options expire out-of-the-money. If the rate is below x bps, the gain on the receive x bps fixed swap will partly offset the increase in pension plan liability. If the rate is above that of the sold swaption, then the loss on the sale is partly offset by the decrease in pension plan liability.

APM Spring 2012 Solutions Page 44
14. Learning Objectives: 1. Candidate will understand and be able to follow the investment management
process for insurance companies, pension funds and other financial intermediaries.
3. The candidate will understand the importance of the techniques and theory behind
portfolio asset allocation. 4. The candidate will understand and apply quantitative techniques for portfolio
management. 5. The candidate will understand the specific considerations relative to managing an
equity and/or alternative asset portfolio within an asset allocation framework. 6. The candidate will understand the specific considerations relative to managing a
fixed income portfolio within an asset allocation framework. Learning Outcomes: (1c) Determine how a client’s objectives, needs and constraints affect the selection of
an investment strategy or the construction of a portfolio. Considerations include: • Funding objective • Risk-return trade-off • Regulatory and rating agency requirements • Risk appetite • Liquidity constraints • Capital, tax and accounting considerations
(3a) Explain the importance of asset allocation, relative to a particular situation. (3b) Critique and propose asset allocation strategies that can be used to construct an
asset portfolio. (3d) Demonstrate how to include risk management principles in the establishment of
investment policy and strategy including asset allocation. (4f) Describe, contrast and assess techniques for risk aggregation and diversification. (5b) Assess a portfolio position against portfolio management objectives using
qualitative and quantitative techniques. (6b) Assess a portfolio position against portfolio management objectives using
qualitative and quantitative techniques. Sources: Chapter 5 “Asset Allocation,” by Sharpe, Chen, Pinto and McLeavey

APM Spring 2012 Solutions Page 45
14. Continued Commentary on Question: This question is testing how asset classes are categorized in a portfolio and the strategy to include new asset class into existing portfolio. Besides listing the criteria of asset classes grouping, to receive maximum points, the candidate needs to explain why the existing group do not meet the criteria and how the criteria is applied in the new grouping. Please refer to the comment in each part regarding the areas where candidates did well or not. Solution: (a) Critique the analyst grouping of the asset classes.
Commentary on Question: This part is fairly easy. Many candidates get full points on “homogeneous” and “mutually exclusive.” Fewer candidates hit the points on “diversifying.”
Assets within the asset classes are not homogeneous. Within US Equities asset class, US public equities and real estate has close to no correlation of 0.15. Within Fixed income asset class, public bond and mortgage are even negatively correlated of -0.5. Asset classes are not mutually exclusive. Having a world public equities asset class, which already includes the US public equities subset is overlapping. This would reduce the effectiveness of strategic asset allocation in controlling risk and introduce problems in developing asset-class return expectations. Asset classed are not diversified enough. U.S. equities and world public equities assets classes contain assets that are highly correlated. The two classes included asset class redundant in portfolio and duplicate risk exposures already present.
(b) Recommend a new grouping and provide the rationale.
Commentary on Question: Some people grouped mortgage and real estate together while others separated every asset class instead of grouping them.
Group 1: Public Equities, inclusive of US, Asia, and Europe public equities
As it has similar attributes, correlations and homogeneous.

APM Spring 2012 Solutions Page 46
14. Continued
Group 2: Public Bond As not particular high correlation with all other assets.
Group 3: Real Estate Group 4: Mortgage
(c) Calculate the minimum yield requirement for the new asset class to be added to the existing portfolio. Commentary on Question: This is an easy calculation which tests that the threshold for a new asset class to be added is to have a higher sharp ratio in the new portfolio. Candidates did well on this part and many got full points. Partial credits are given if the final number is not right. It is important to explain why the calculation is done a certain way and list the formulas to earn partial credits. Adding asset class to portfolio is optimal when: Existing Portfolio Sharpe ratio = (portfolio return - risk free rate)/standard deviation Risk free rate = 7% - 0.5*10% = 2%. New asset class Sharpe Ratio must exceed the product of the existing portfolio’s Sharpe Ratio and the correlation. (E(Rnew) – Rf) / st. dev new > ((E(Rp) – Rf) / st. dev p) * Corr(Rnew, Rp) (E(Rnew) – 2%) / 15% > ((7% – 2%) / 10%) * 70% E(Rnew) > 7.25% So, the minimum yield requirements for the new asset class is 7.25%

APM Spring 2012 Solutions Page 47
15. Learning Objectives: 2. The candidate will understand the variety of financial instruments available to
managed portfolios. Learning Outcomes: (2a) Compare and select specialized financial instruments that can be used in the
construction of an asset portfolio supporting financial institutions and pension plan liabilities.
Sources: V-C143-09: Hedge Funds: Past, Present, and Future, R. Stulz, Journal of Economic Perspectives, Spring 2007 V-C174-09: Anson, The Handbook of Alternative assets, Second Edition, 2006, Chapter 20 and 22 Commentary on Question: This question is testing the regulation’s concern on hedge fund. It is also trying to test if candidates understand the concepts of different alternative assets including leverage buy out, venture capital, hedge fund, and private equity. In general, candidates did poorly on this question, especially part (c). Only one candidate received the maximum points on part (c); many received zero. Please refer to each part to see the comment on the considerations for receiving maximum points. Solution: (a) Describe the risks that the regulators are concerned about and the validity of their
concerns.
Commentary on Question: To receive the maximum credits, candidates need to list all the regulatory concerns, explain why regulatory has such a concern, and explain why it is a valid concern or not. Candidates did OK on this part. Most of them listed and explained the concerns.
Hedge fund risks are concerned by the regulators: 1. Investor protection
• This is a concern to the SEC due to the lack of transparency and the potential large losses associated with highly leverage hedge funds.
2. Risk to financial institutions • Hedge funds create credit exposures for financial institutions in the
following ways: they borrow, make securities transactions, and are often counterparties in derivatives trades.
APM Spring 2012 Solutions Page 48
15. Continued
• If a hedge fund is large enough, its collapse could possibly lead to a chain reaction of collapses in the financial system.
3. Liquidity risk • If too many funds set up the same trades, they may have liquidity
issues in the presence of a market shock, which can cause a chain of overreactions that ultimately forces hedge funds to contract and make distress sales of securities.
4. Excess volatility risks • Hedge funds could lead prices to overreact by making trades that push
prices away from fundamental values and create excess volatilities. Assess the above risk: 5. Investor protection – should not be a big concern to the SEC (1 pt)
• Small investors who are supposedly the focus of the SEC are already not allowed to invest in hedge funds.
• The hedge fund investors are savvy investors who also have legal protections against acts of fraud.
6. Risk to financial institutions – this risk is not really a hedge fund issue, but rather involves the regulation of financial institutions. • Many of the financial institutions have greatly improved their systems
to evaluate their exposures to hedge funds so this risk is manageable. 7. Liquidity risk – this is a serious issue.
• Banks needs to do a better job in monitoring their concentration risks to prevent liquidity problems in the presence of a market shock.
8. Excess volatility risks - this is a potentially valid concern but so far there has not been sufficient real experiences to support it.
(b) With respect to the private equity fund, your CIO heard that leveraged buy-outs
(LBOs) offer a better risk-return tradeoff than venture capital.
(i) Explain the arguments behind this assertion
Commentary on Question: This part wants candidates to compare LBO and venture capital. In order to receive maximum credits, candidates need not only list LBO has less concentration risk and business risk, but also discuss those risks for both LBO and venture capital.
1. LBO has less business risks than venture capital funds.
• LBOs buy out established operating divisions of public companies. They are typically successful but undervalued companies.
APM Spring 2012 Solutions Page 49
15. Continued
• Venture Capital invests in early stage startup companies so they have a much higher chance of failing than public companies.
1. LBO has less concentration risks than venture capital funds. • Venture capital firms have become more specialized and tend
to concentrate on companies in a single industry. • There is also no public market for trading venture capital
interests due to the tailored nature of a venture capitalists portfolio.
• LBOs tend to be more eclectic in their choices of targeted companies and tend to have greater diversification than their venture capital counterparts.
2. Historical data shows that LBO has a symmetrical return pattern with a volatility that is much lower than that for venture capital. • LBO has a higher Sharp Ratio than venture capital, which
illustrates a better risk return tradeoff than for venture capital.
(ii) Assess why the conclusion in (i) might not be correct.
Commentary on Question: Most of candidates answered that venture capital has positive skew. Almost no candidates consider venture capital as a tool to diversify the whole portfolio. No candidates mentioned that the Sharpe ratio may not be a valid measurement.
• Historical data show that venture capital returns have a large positive
skew and a large kurtosis compared to the slightly negative (almost zero) skew/kurtosis for the LBOs. This is a demonstration of better company selection skills of venture capitalists.
• Venture capital asset class also has a much lower correlation with traditional asset classes than LBO does. Depending on the mix of the existing portfolio, investing in a venture capital funds can better diversify the existing portfolio than investing in LBO funds.
• The dominance of LBO measured by the Sharpe Ratio may not hold over all the periods of time.
(c) Explain why hedge funds have a competitive advantage over private equity firms
when bidding for operating assets.
Commentary on Question: Almost all candidates failed this part except for one candidate. Many candidates wrote why a hedge fund has an advantage over a regular mutual fund, but such an answer did not earn any points.

APM Spring 2012 Solutions Page 50
15. Continued
1. Hedge funds have more favorable deal terms than private equity funds. • Hedge funds are another source of fund raising and fee generation. • Hedge fund incentive fees are front-loaded. • Hedge fund incentive fees are based on changes in net asset value, not
realized profits like private equity funds. • Hedge fund incentive fees are collected on a regular basis, either
quarterly or semiannually. • Investor capital does not need to be first returned first to collect
incentive fees. • Management fees do not need to be recouped before incentive fees are
paid. • Hedge funds have no provisions for the claw back of management or
incentive fees. 2. Hedge funds have lower hurdle rates than private equity funds.
• This allows hedge funds to bid more aggressively than private equity funds.
APM Spring 2012 Solutions Page 51
16. Learning Objectives: 5. The candidate will understand the specific considerations relative to managing an
equity and/or alternative asset portfolio within an asset allocation framework. Learning Outcomes: (5d) Recommend an investment strategy for a given situation:
• Portfolio policy and objectives • Asset selection criteria • Capital market expectations • Risk management strategy • Portfolio rebalancing strategy
Sources: Maginn and Tuttle, 3rd Edition, Chapter 7 Commentary on Question: This question was about approaches to equity investing. In particular, it tested the candidates’ understanding of index stock-weighting methods. The candidates’ performance was satisfactory. Additional commentary listed underneath question components. Solution: (a) Explain the views on equity market informational efficiency that are consistent
with each of the three approaches. Active Markets are not information efficient. An investment manager can use active management for enhanced returns. Semi-Active Markets are slightly inefficient. Can earn enhanced returns, but they are not large after considering transaction costs and expenses. Passive Markets are information efficient. Nothing, net of expenses, will be gained from active management.
(b) Identify four factors that determine characteristics of an equity index.
1. Boundaries of investment universe 2. Inclusion Criteria
a. How to select securities for the index 3. Weighting Schemes
a. Price, Value, Equal

APM Spring 2012 Solutions Page 52
16. Continued
4. Return Calculation Methodology a. Total return, price only
(c) Calculate the index return for the period between 12/31/2010 and 12/31/2011
under the price-weighted method.
Commentary on Question: A common candidate mistake involved misinterpreting the stock split, and not calculating the return from 1/1/2011.
Need to adjust for stock split: Index @ 12/31/2010: (50+10+78)/3 = 46.00 Index @ 1/1/2011: (25+10+78)/Divisor = 46.00 Divisor = 2.46 Index @ 12/31/2011: (28+32+73)/2.46 = 54.14 Index Return = (54.14 – 46.00)/46.00 = 18%
(d) Identify the stock that had the most significant contribution to the index return in
2011 for each method. Stock A Return = $28/$25 = 12.0% Price Weighted
Stock Price Weight Return Contribution = Weight * Return A 25 22.1% 12.0% 2.7% B 10 8.8% 220.0% (Given) 19.5% C 78 69.0% -6.4% (Given) -4.4% Total 113 100.0%
Stock B has the largest contribution to the return. Equal Weighted
Stock Weight Return Contribution = Weight * Return A 33.3% 12.0% 4.0% B 33.3% 220.0% (Given) 73.3% C 33.3% -6.4% (Given) -2.1% Total 100.0%

APM Spring 2012 Solutions Page 53
16. Continued Stock B has the largest contribution to the return. Value Weighted
Stock Weight Return Contribution = Weight * Return
A 23.7% (Given) 12.0% 2.8% B 2.4% (Given) 220.0% (Given) 5.3% C 73.9% (Given) -6.4% (Given) -4.7% Total 100.0% Stock B has the largest contribution to the return.
(e) Describe the advantages and disadvantages of each index stock weighting
method, using details from the previous calculation to illustrate.
Commentary on Question: The best candidate papers used details from the previous calculation to illustrate.
Price Weighted Advantages
• Simple Calculation Disadvantages
• Biased to high stock prices o E.g. Stock C has 69.0% share, even though stock A has most
shares • Does not self correct for stock splits, dividends, etc.
o Had to adjust for stock A split Value Weighted Advantages
• Self corrects for stock splits, etc. Disadvantages
• Bias to large capitalization stocks o E.g., Stock C has largest share of index at 73.9%, but Stock B has
largest change • Largest market capitalizations are mature companies and possibly
overvalued companies • Less diversified because index may be concentrated in relatively few
issues o Infeasible to invest in large portions of some stocks

APM Spring 2012 Solutions Page 54
16. Continued Equal Weighted Advantages
• The rebalancing sells winners and buys losers; works if markets mean revert
Disadvantages
• Biased to small companies • Frequent rebalancing to maintain weighting • High transaction costs • May need to hold illiquid positions to satisfy index
(f) Recommend an index stock-weighting method that would be most appropriate for
the passive investing approach.
I would recommend a value weighted index. • It is self rebalancing for stock splits, share purchases, and dividends. • It will save a large amount of transaction costs.
(g) On 12/31/2011 a new company D is listed with a market capitalization of $100
million and a stock price of $1,000.
(i) Evaluate under which index stock-weighting method the inclusion of stock D will have the least impact on the index weights for A, B and C.
Two solutions: A reasonable description (see below), or a mechanical calculation to determine the best approach. The solution below is the description. A mechanical calculation would have been accepted as well, and is worth the same amount of points.
Market Cap Stock A = 28 * 200,000 = 5.6 million Market Cap Stock B = 32 * 50,000 = 1.6 million Market Cap Stock C = 73 * 200,000 = 14.6 million A $100M market cap for stock D will highly bias a value-weighted index. A $1000 price for stock D is significantly higher than those of A, B, C, which will bias a price weight index. The price or market cap of stock D will not impact the weights for an equal weighted index. Equal weighted index has the least influence.

APM Spring 2012 Solutions Page 55
16. Continued
(ii) Explain whether the inclusion of stock D would change your recommendation in (f) above.
Yes, use an equal weighted index. Stock D will totally overwhelm a value-weighted index. This will reduce diversification. Equal weighted indexing will balance the large company proportionally, and will eliminate the bias.
APM Spring 2012 Solutions Page 56
17. Learning Objectives: 2. The candidate will understand the variety of financial instruments available to
managed portfolios. Learning Outcomes: (2a) Compare and select specialized financial instruments that can be used in the
construction of an asset portfolio supporting financial institutions and pension plan liabilities.
Sources: Fabozzi, Handbook of Fixed Income Securities, 7th Edition, 2005, Chapter 20, Emerging Market Debt Commentary on Question: This question tests the candidates’ understanding of a specialized financial instrument – emerging market debt – that can be used in the construction of an asset portfolio supporting financial institutions and pension plan liabilities. The question was relatively easy. Solution: (a) Define Brady bonds and explain the motivation behind the creation of Brady
bonds. Brady bonds refer to a series of sovereign bonds issued by developing countries in exchange for their rescheduled bank loans. Brady bonds provided debtor emerging counties with debt relief through restructuring their commercial bank debt at lower interest rates or allowing them to write it down, enabling them to exchange that debt for tradable fixed income securities. In return, the developing countries agreed to adopt macroeconomic reforms.
(b) Compare the characteristics of Brady bonds and other emerging market bonds.
• The yields of Brady bonds always have been higher than non-Brady bonds • Some Brady bond issues were extremely large and liquid • Every Brady bond had at least several combinations of features (e.g. step-up
coupons, floating-rate coupons, amortizations, capitalizations)
(c) Explain the motivation to invest in emerging market debt.
• Higher expected returns • Diversification - Emerging market debt has had a low correlation with
traditional asset classes • Liquidity is relatively high