Embed Size (px)
Citation preview
8/13/2019 App Performance Problems
http://slidepdf.com/reader/full/app-performance-problems 1/5
Network World
* Application Performance
Don’t Let App PerformanceProblems Drag You Down:
Get ProactiveSeventy-three percent of enterprises are losingproductivity due to poor application performance.
A vicious circle
See if this scenario sounds familiar: Frustrated
users complain about poor application
performance, saying it’s killing productivity
and morale. IT is barraged with calls and help
desk tickets from these unhappy users. But IT
often doesn’t have the tools to easily and clearly
identify where the problems come from and thus
spends a lot of time trying to solve them. So IT
also becomes frustrated and unhappy. Business
executives are breathing down the collective
necks of users and IT, demanding solutions. All of
this is taking a toll on customer satisfaction and,
ultimately, the success of the business.
Such scenarios have direct costs in terms
of lost time, money, well-being and customer
satisfaction. A recent survey of both IT managers
and business users conducted by IDG Research
for Ipanema proves that case. In terms of its effect
on the business, lost productivity is the most
SPONSORED BY:
often-cited consequence (73% of respondents)
of poor application performance in the IDG
Research survey. It is followed by lower customer
satisfaction, limiting business success, lower
employee morale and hampering the ability to
innovate. (See Figure 1.)
This is far from an isolated problem, as
79% of user organizations report they suffer
from application performance problems either
frequently or occasionally, according to a
2013 survey of some 650 IT professionals by
the research rm Vanson Bourne on behalf of
Ipanema.
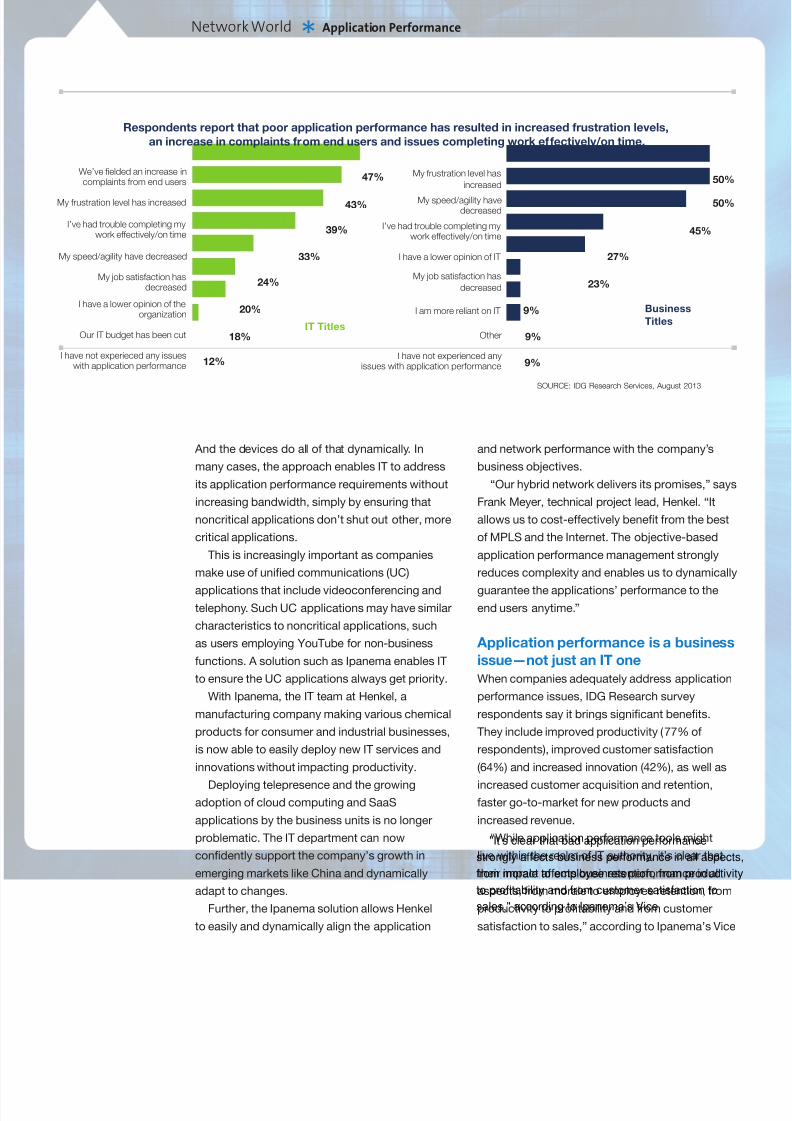
The IDG Research survey shows the far-
reaching impact of poor application performance.
Asked how it affects the IT organization, nearly
half say it means dealing with more end-user
complaints, while 43% report increased frustration
levels and 39% say they have trouble completing
their work on time. Nearly a quarter say it leads to
decreased job satisfaction.
Falling short on app performance
The IDG Research survey shows there’s plenty of
room for improvement with respect to application
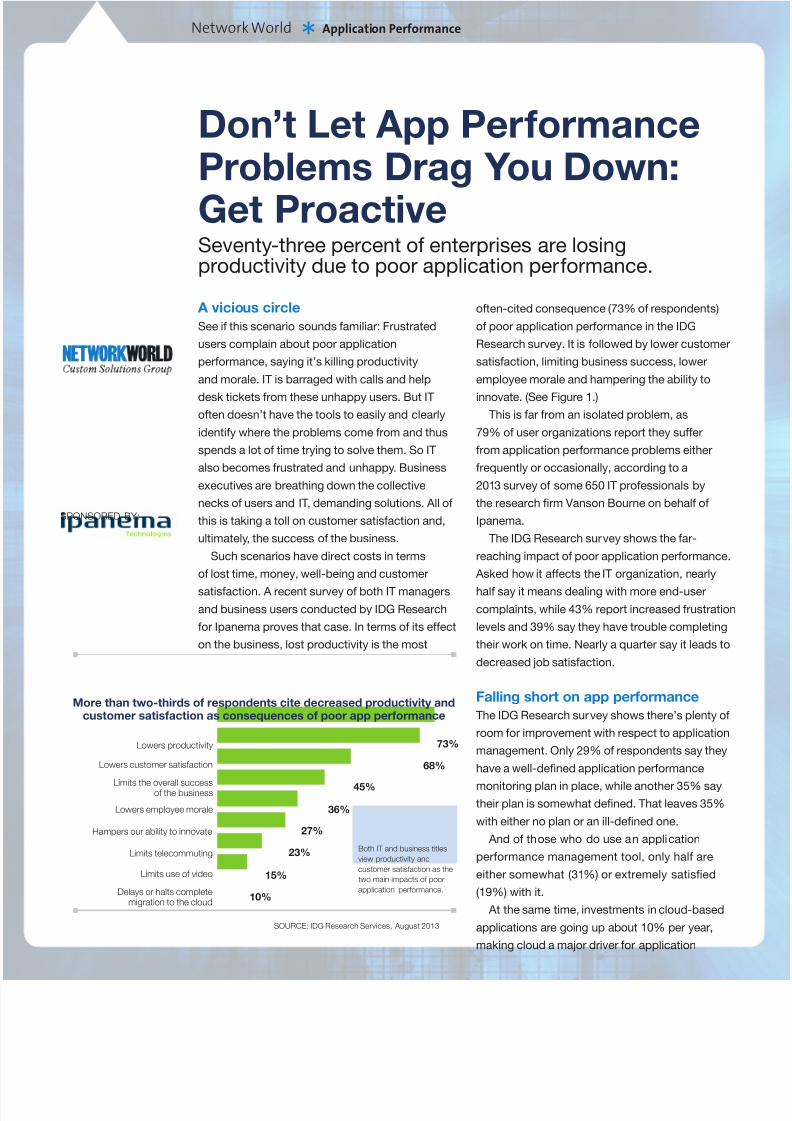
management. Only 29% of respondents say they
have a well-dened application performance
monitoring plan in place, while another 35% saytheir plan is somewhat dened. That leaves 35%
with either no plan or an ill-dened one.
And of those who do use an application
performance management tool, only half are
either somewhat (31%) or extremely satised
(19%) with it.
At the same time, investments in cloud-based
applications are going up about 10% per year,
making cloud a major driver for application
SOURCE: IDG Research Services, August 2013
More than two-thirds of respondents cite decreased productivity andcustomer satisfaction as consequences of poor app performance
Lowers productivity
Lowers customer satisfaction
Limits the overall successof the business
Lowers employee morale
Hampers our ability to innovate
Limits telecommuting
Limits use of video
Delays or halts completemigration to the cloud
73%
68%
45%
27%
23%
15%
36%
10%
Both IT and business titles
view productivity and
customer satisfaction as the
two main impacts of poor
application performance.
8/13/2019 App Performance Problems
http://slidepdf.com/reader/full/app-performance-problems 2/5
Network World
* Application Performance
performance monitoring tools. Indeed, in IDG’s
2013 cloud study, half of respondents say cloud is
increasing the demand for new applications, and
with that, demand for performance monitoring.
DeVry Inc., a large for-prot higher education
company, has a tool that automates and reports
on various overnight batch processing jobs,
says Jason Olsen, senior manager of network
systems for the company and one of the survey
respondents. But otherwise, he only knows about
performance problems “when users start to
complain.”
Reactive techniques show the
money’s already lost
Clearly, these organizations need a better way
to deal with application performance issues.
Rather than react after the fact to issues, they
need a way to proactively manage application
performance, so they can address issues before
users experience them, and guarantee good
performance for the applications employees need
and use most. In short, they need Ipanema.
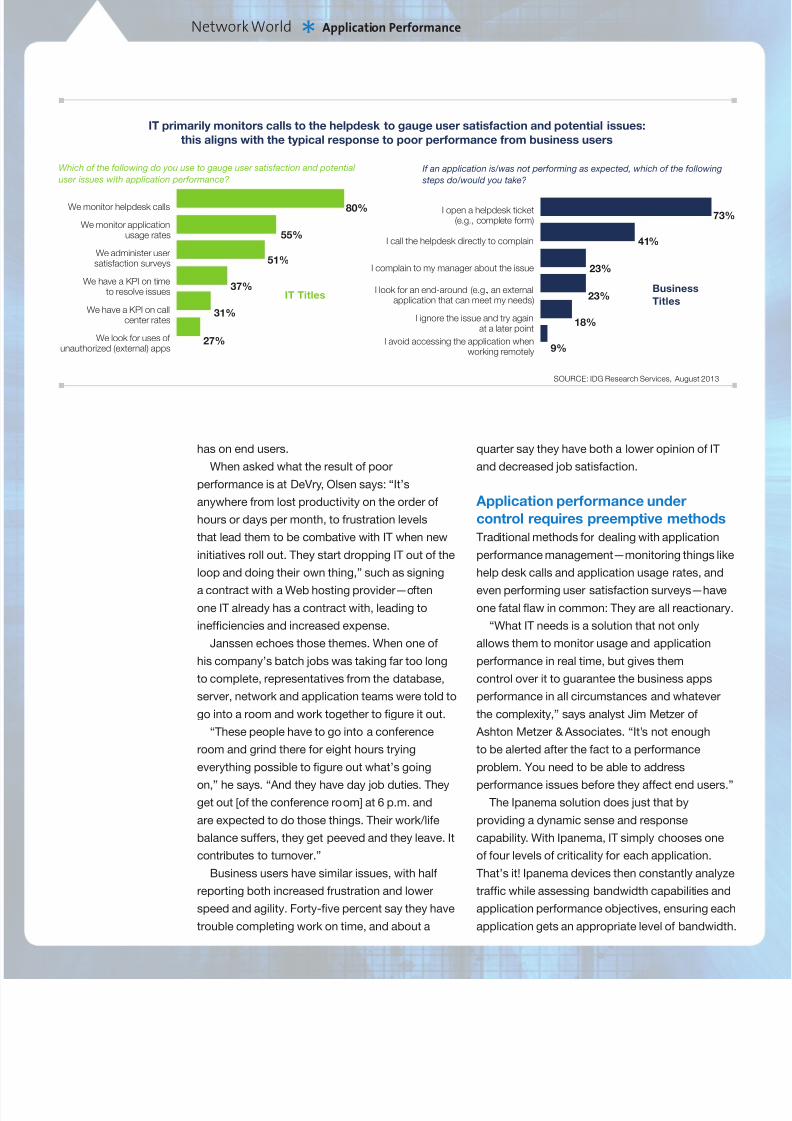
Olsen is one of the 80% of IDG Research surveyrespondents who say they gauge user satisfaction
with application performance by monitoring help
desk calls, by far the top response. Only about
half issue user satisfaction surveys, while just over
one-third have key performance indicators (KPIs)
based on time to resolve issues.
Take the example of Rob Janssen, manager
of global infrastructure & QRC at Marel, the
leading global provider of advanced equipment,
systems and services to the sh, meat and poultry
industries.
The organization decided to deploy MS Lync
to reduce travel costs and improve employee
collaboration and communication with customers.
Achieving these expected benets means
delivering guaranteed end-user experience. In the
case of issues, the ability to understand where the
problems come from in order to solve them before
they impact the end users is key for Marel.
“With Ipanema, we strongly reduced our
MTTI [Mean Time to Innocence] and therefore the
service delivered to end users. Thanks to a better
control of new applications on network resources
and business applications, we are more agile and
can easily manage new usages without impacting
business apps performance and business
productivity,” says Janssen.
On the ip side of the equation, IDG Research
asked respondents with business titles what
steps they take when an application is performing
poorly. Nearly three-quarters say they open a
help desk ticket. Many issue some sort ofcomplaint, either to the help desk (41%) or
their manager (23%).
Perhaps worse, another 23% look for an
end-around the issue, such as an external
application, while 18% simply give up and
try later and 9% avoid the application when
working remotely. Given that, it’s not hard to
predict the effect poor application performance
Fewer than one-third of respondents say they have a well-dened
application performance monitoring plan in place
SOURCE: IDG Research Services, August 2013
29%
35%
29%
6% Well dened: We have a monitoring solution in place that clearly denes great
application performance, and monitors and guarantees application performance,
along with a user-satisfaction survey that we administer to our employees.
Somewhat dened: We have metrics that we track (e.g., KPIs), and informally
monitor application performance and downtime. We occasionally ask our end
users for feedback, but don’t have any formal satisfaction sur vey in place.
Not well dened: We occasionally review application performance and have some
ideas of where the pain po ints are, but don’t have any metrics that we track.
Not at all dened: We have a limited or non-existent view of application performance.
“With Ipanema, we strongly reduced our MTTI
[Mean Time to Innocence] and therefore increase th
8/13/2019 App Performance Problems
http://slidepdf.com/reader/full/app-performance-problems 3/5
Network World
* Application Performance
has on end users.
When asked what the result of poor
performance is at DeVry, Olsen says: “It’s
anywhere from lost productivity on the order of
hours or days per month, to frustration levels
that lead them to be combative with IT when new
initiatives roll out. They start dropping IT out of the
loop and doing their own thing,” such as signing
a contract with a Web hosting provider—often
one IT already has a contract with, leading to
inefciencies and increased expense.
Janssen echoes those themes. When one of
his company’s batch jobs was taking far too long
to complete, representatives from the database,
server, network and application teams were told to
go into a room and work together to gure it out.
“These people have to go into a conference
room and grind there for eight hours trying
everything possible to gure out what’s going
on,” he says. “And they have day job duties. Theyget out [of the conference room] at 6 p.m. and
are expected to do those things. Their work/life
balance suffers, they get peeved and they leave. It
contributes to turnover.”
Business users have similar issues, with half
reporting both increased frustration and lower
speed and agility. Forty-ve percent say they have
trouble completing work on time, and about a
quarter say they have both a lower opinion of IT
and decreased job satisfaction.
Application performance under
control requires preemptive methods
Traditional methods for dealing with application
performance management—monitoring things like
help desk calls and application usage rates, and
even performing user satisfaction surveys—have
one fatal aw in common: They are all reactionary.
“What IT needs is a solution that not only
allows them to monitor usage and application
performance in real time, but gives them
control over it to guarantee the business apps
performance in all circumstances and whatever
the complexity,” says analyst Jim Metzer of
Ashton Metzer & Associates. “It’s not enough
to be alerted after the fact to a performance
problem. You need to be able to address
performance issues before they affect end users.”The Ipanema solution does just that by
providing a dynamic sense and response
capability. With Ipanema, IT simply chooses one
of four levels of criticality for each application.
That’s it! Ipanema devices then constantly analyze
trafc while assessing bandwidth capabilities and
application performance objectives, ensuring each
application gets an appropriate level of bandwidth.
SOURCE: IDG Research Services, August 2013
IT primarily monitors calls to the helpdesk to gauge user satisfaction and potential issues:
this aligns with the typical response to poor performance from business users
We monitor helpdesk calls
We monitor applicationusage rates
We administer usersatisfaction surveys
We have a KPI on timeto resolve issues
We have a KPI on callcenter rates
We look for uses ofunauthorized (external) apps
I open a helpdesk ticket (e.g., complete form)
I call the helpdesk directly to complain
I complain to my manager about the issue
I look for an end-around (e.g., an externalapplication that can meet my needs)
I ignore the issue and try againat a later point
I avoid accessing the application whenworking remotely
80%
55%
51%
31%
27%
37%
73%
41%
23%
18%
9%
23%
Which of the following do you use to gauge user satisfaction and potential
user issues with application performance?
If an application is/was not performing as expected, which of the following
steps do/would you take?
IT TitlesBusiness
Titles
8/13/2019 App Performance Problems
http://slidepdf.com/reader/full/app-performance-problems 4/5
Network World
* Application Performance
And the devices do all of that dynamically. In
many cases, the approach enables IT to address
its application performance requirements without
increasing bandwidth, simply by ensuring that
noncritical applications don’t shut out other, more
critical applications.
This is increasingly important as companies
make use of unied communications (UC)
applications that include videoconferencing and
telephony. Such UC applications may have similar
characteristics to noncritical applications, such
as users employing YouTube for non-business
functions. A solution such as Ipanema enables IT
to ensure the UC applications always get priority.
With Ipanema, the IT team at Henkel, a
manufacturing company making various chemical
products for consumer and industrial businesses,
is now able to easily deploy new IT services and
innovations without impacting productivity.
Deploying telepresence and the growingadoption of cloud computing and SaaS
applications by the business units is no longer
problematic. The IT department can now
condently support the company’s growth in
emerging markets like China and dynamically
adapt to changes.
Further, the Ipanema solution allows Henkel
to easily and dynamically align the application
and network performance with the company’s
business objectives.
“Our hybrid network delivers its promises,” says
Frank Meyer, technical project lead, Henkel. “It
allows us to cost-effectively benet from the best
of MPLS and the Internet. The objective-based
application performance management strongly
reduces complexity and enables us to dynamically
guarantee the applications’ performance to the
end users anytime.”
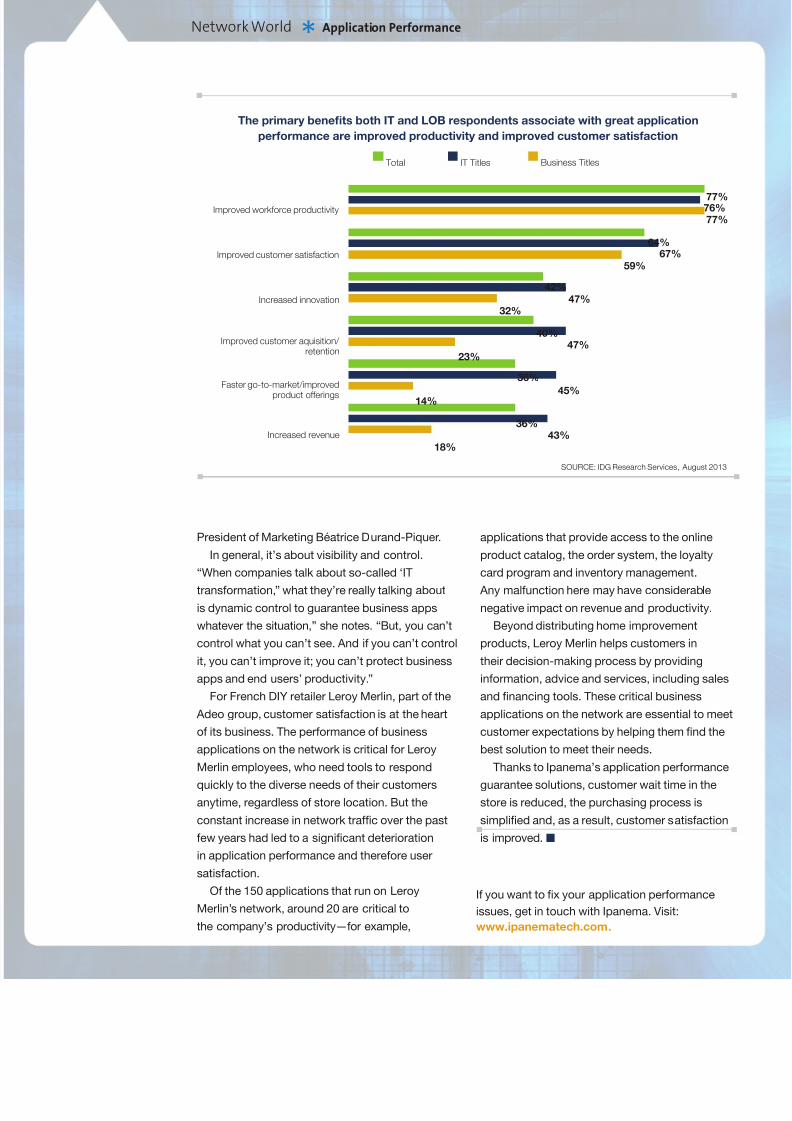
Application performance is a business
issue—not just an IT one
When companies adequately address application
performance issues, IDG Research survey
respondents say it brings signicant benets.
They include improved productivity (77% of
respondents), improved customer satisfaction
(64%) and increased innovation (42%), as well as
increased customer acquisition and retention,faster go-to-market for new products and
increased revenue.
“While application performance tools might
live within the realm of IT authority, it’s clear that
their impact affects business performance in all
aspects, from morale to employee retention, from
productivity to protability and from customer
satisfaction to sales,” according to Ipanema’s Vice
SOURCE: IDG Research Services, August 2013
Respondents report that poor application performance has resulted in increased frustration levels,
an increase in complaints from end users and issues completing work effectively/on time.
We’ve elded an increase incomplaints from end users
My frustration level has increased
I’ve had trouble completing mywork effectively/on time
My speed/agility have decreased
My job satisfaction hasdecreased
I have a lower opinion of theorganization
Our IT budget has been cut
I have not experieced any issueswith application performance
My frustration level has
increased
My speed/agility havedecreased
I’ve had trouble completing mywork effectively/on time
I have a lower opinion of IT
My job satisfaction has
decreased
I am more reliant on IT
Other
I have not experienced anyissues with application performance
47%
43%
39%
24%
20%
18%
12%
33%
50%
50%
45%
23%
9%
9%
9%
27%
IT Titles
Business
Titles
"It’s clear that bad application performance
strongly affects business performance in all aspects
from morale to employee retention, from productivity
to profitability and from customer satisfaction to
sales," according to Ipanema’s Vice
8/13/2019 App Performance Problems
http://slidepdf.com/reader/full/app-performance-problems 5/5
Network World
* Application Performance
President of Marketing Béatrice Durand-Piquer.
In general, it’s about visibility and control.
“When companies talk about so-called ‘IT
transformation,” what they’re really talking about
is dynamic control to guarantee business apps
whatever the situation,” she notes. “But, you can’t
control what you can’t see. And if you can’t control
it, you can’t improve it; you can’t protect business
apps and end users’ productivity.”
For French DIY retailer Leroy Merlin, part of the
Adeo group, customer satisfaction is at the heart
of its business. The performance of business
applications on the network is critical for Leroy
Merlin employees, who need tools to respond
quickly to the diverse needs of their customersanytime, regardless of store location. But the
constant increase in network trafc over the past
few years had led to a signicant deterioration
in application performance and therefore user
satisfaction.
Of the 150 applications that run on Leroy
Merlin’s network, around 20 are critical to
the company’s productivity—for example,
applications that provide access to the online
product catalog, the order system, the loyalty
card program and inventory management.
Any malfunction here may have considerable
negative impact on revenue and productivity.
Beyond distributing home improvement
products, Leroy Merlin helps customers in
their decision-making process by providing
information, advice and services, including sales
and nancing tools. These critical business
applications on the network are essential to meet
customer expectations by helping them nd the
best solution to meet their needs.
Thanks to Ipanema’s application performance
guarantee solutions, customer wait time in thestore is reduced, the purchasing process is
simplied and, as a result, customer satisfaction
is improved. ■
SOURCE: IDG Research Services, August 2013
The primary benets both IT and LOB respondents associate with great application
performance are improved productivity and improved customer satisfaction
Improved workforce productivity
Improved customer satisfaction
Increased innovation
Improved customer aquisition/ retention
Faster go-to-market/improved
product offerings
Increased revenue
77%76%77%
67%
59%
42%
64%
47%32%
40%47%
23%
36%
45%14%
36%43%
18%
Total IT Titles Business Titles
If you want to x your application performance
issues, get in touch with Ipanema. Visit:
www.ipanematech.com.


![Performance Monitoring of Database Operationseprints.uni-kiel.de/29307/1/msc_czi_thesis.pdf · 2011]. Therefore, handling performance problems is an important task. Performance problems](https://img.pdfslide.net/doc/110x75/5fbf8807067094074e1e61ad/performance-monitoring-of-database-2011-therefore-handling-performance-problems.jpg)