Embed Size (px)
Citation preview
United States Patent [19] Coates
[54] APPARATUS AND METHOD FOR DETERMINING CHARACTERISTICS OF _ SUBSURFACE FORMATIONS
[75] Inventor:
[73] Assignee: George R. Coates, Houston, Tex. Schlumberger Technology Corporation, New York, NY.
[21] Appl. No.: 3,186
[22] Filed: Jan. 15, 1979
Related US. Application Data
[63] Continuation-impart of Ser. No. 842,005, Oct. 7, 1977, abandoned.
[51] Int. Cl.3 ............................................ .. E21B 49/00
[52] [53] Field of Search ..................... .. 73/152, 151; 324/1
[56] References Cited U.S. PATENT DOCUMENTS
2,689,329 9/1954 Zimmerman . 3,778,706 12/1973 Thompson ....................... .. 324/61 R 3,895,289 7/1975 Rickey et a1. . . . . . . . . . . .. 324/1
4,015,195 37/1977 _ Hoyer et a1. ............ .. 324/1
OTHER PUBLICATIONS
Porosity-resistivity Cross—plots Can Help to Evaluate Formations, William H. Lang, Jr., The Oil and Gas Journal, Nov. 29, 1976. ' Dielectric Constant of Rocks As A Petrophysical Parame ter, W. A. Hoyer et al., SPWLA Seventeenth Annual Logging Symposium, Jun. 9-12, 1976. Low Porosity Gas Sand Analysis Using Cation Exchange and Dielectric Constant Data, J. W. Kern et al., SPWLA Seventeenth Annual Logging Symposium, Jun. 9-12, 1976. '
Electrical Conductivities in Shaly Sands, Monroe H. Waxman et al., Society of Petroleum Engineers of AIME, 1972. Electrical Conductivites in Shaly Sands, Monroe H. Wax
[11] 4,233,839 [45] NOV. 18, 1980
man et al., Journal of Petroleum Technology, Feb., 1974. Electrical Conductivities in 0il—Bearing Shaly Sands, Monroe Waxman et al., Society of Petroleum Engineers Journal, Jun., 1968.
Primary Examiner——Anthony V. Ciarlante Attorney, Agent, or Firm—Martin M. Novack; Kenneth Olsen; Henry N. Garrana
[57] ABSTRACT The determination of a “composite” parameter of the formation water in formations surrounding a borehole, for example the composite conductivity of the forma tion water, is used in the disclosure to obtain a relatively accurate determination of formation characteristics, such as water saturation. The determined values are meaningful even in shaly regions of the formations. In contrast to past approaches which attempted to deter mine the volume and distribution type of shale or clay present in the formations and then introduce appropri ate factors which often involve substantial guesswork, the disclosed technique determines a composite water parameter, for example a composite water conductivity, which represents the conductivity of the bulk water in the formations, including both free water and bound water. Bound water trapped in shales is accounted for in this determination so unlike prior techniques, the shales can be considered as having a porosity. Having deter mined the composite water conductivity, water satura tion can be directly obtained using relatively straight forward relationships which do not require estimates of the volume of shale in the formations. Shale effects are accounted for by the different conductivities (or other parameter such as capture cross sections) of the forma tion water constituents (free and bound) which make up the total water.
62 Claims, 14 Drawing Figures
‘5.
r1115»? 54? COMPUTER
S.
US
US. Patent Nov. 18, 1980 Sheet 1 of? 4,233,839
COMPUTING r5/O F’ MODULE
FIG 1 60/ ' _ COMPOSITE WATER
0T ' COND. COMPUTER
’ ‘ L , f 3 $0 0500 K '= (P b i V 70
gt.) I! II J
K——- g 8%» _ WET COND. y/_. g a}. T COMPUTER ( ‘ Lu Z,‘ I
' g __._OFMP 05 80 f T ‘E,
' it“? WéTER m C MPuTER 51/ m J I 96 I 5w @—— — —- “j: 90
32 33 I > 31 > } ~ _ __ I L: RECORDER
W \g \W‘ |____ N i.
”% R1 a / :19 Q E 00 (PM
"55/41 L l 51/ m C: _— /
i237/42 EOROS. COMRT 425/. E \T/42A " ‘J
g. FIG. 5 E —/n43 _ °‘ C SOUAR/NG
435/ g ins/1 CK? I g /"44 (pi? lOE‘CO &, /“45
T5‘ )47 70% MULT. CKT. 2
?_ Tgzi'46
US. Patent Nov. 18, 1980 Sheet 3 of7 4,233,839
m .wI
US. Patent Nov. 18, 1980 Sheet 5 of7 4,233,839
UEMP £9:
W1
(Eb
FIG. 10
a“ mg!) 1 '26 )
Wm‘——> 6'” iv MULT CKT I27 I28 129
v { RATIO "*F SUM S SP/KW 01mm CKT + on vb
US. Patent Nov. 18, 1980 Sheet 7 of7 4,233,839
m i GEE
$8.. it E
r A
>3 qzmE S: 9.38
4,233,839 1
APPARATUS AND METHOD FOR DETERMINING CHARACTERISTICS OF SUBSURFACE
FORMATIONS
BACKGROUND OF THE INVENTION This is a continuation-in-part of US. application Ser.
No. 842,005 which was ?led on Oct. 7, 1977 now aban doned. '
This invention relates to an apparatus and method for investigating subsurface formations and, more particu larly, to an apparatus and method for determining a composite parameter of the formation water in forma tions surrounding a borehole, for example the compos ite conductivity of the formation water. Using the com posite parameter, other useful information, for example a determination of water saturation, can be accurately made, even in shaly formations. The amount of oil or gas contained in a unit volume
of a subsurface reservoir is a product of its porosity and its hydrocarbon saturation. The total porosity of a for mation, designated 4);, is the fraction of the formation unit volume occupied by pore spaces. Hydrocarbon saturation, designated 8],, is the fraction of the pore volume ?lled with hydrocarbons. In addition to the porosity and hydrocarbon saturation, two other factors are necessary to determine whether a reservoir has commercial potential; viz., the volume of the reservoir and its producibility. In evaluating produqibility, it is important to know how easily fluid can flow through the pore system. This depends upon the manner in which the pores are interconnected and is' a property known as permeability. To determine the amount of producible hydrocar
bons in a formation, it is useful to obtain a measure of the bulk volume fraction of hydrocarbons displaced in invasion of the drilling mud during the drilling opera tion. During drilling, the mud in the borehole is usually conditioned so that the hydrostatic pressure of the mud column is greater than the pore pressure of the forma tions. The differential pressure forces mud ?ltrate into the permeable formations. Very close to the borehole, virtually all of the formation water and some of the formation hydrocarbons, if present, are flushed away by the mud ?ltrate. This region is known as the “?ushed zone”. The bulk volume fraction of hydrocarbons dis placed by invasion in the ?ushed zone is an indication of the amount of “movable” hydrocarbons in the particu lar portion of the formations. This bulk volume fraction of the hydrocarbons displaced by invasion can be ex pressed as ¢,(S;,—S;,,), where S;,, is the residual hydro-, carbon saturation in the ?ushed zone (i.e., the saturation of hydrocarbons which were not ?ushed away by the mud ?ltrate and generally considered as immovable). The saturation of the mud ?ltrate,_designated as Sm, can ‘be represented as
Sxo=(1—Shr) (1)
The saturation of hydrocarbons in the uninvaded for mations, designated S;,, can be expressed as
Sh=(1—Sw) (2)
where SW is the water saturation of the formations; i.e., the fraction of the pore spaces ?lled with water. From the equations (1) and (2), it can be seen that the previ ously set forth expression for the bulk volume fraction
20
25
35
45
60
65
2 of oil displaced by invasion, ¢t(Sh—Sh,), can be ex pressed as
¢KSh—Shr)=¢r(Sxo-Sw) (3)
Generally, relatively accurate determinations of d), can be obtained using known logging techniques, so accu rate determinations of S m and Sw are highly useful, inter alia, for determining the bulk volume fraction of hydro carbons displaced by invasion and, therefore, the frac tion of producible hydrocarbons for particular forma tions surrounding the borehole.
Classical prior art techniques exist for determining water saturation and/or related parameters. It has been established that the resistivity of a clean formation (i.e., one containing no appreciable amount of clay), fully saturated with water, is proportional to the resistivity of the water. The constant of proportionality, designated F, is called the formation factor. Thus we have
F=R,,/Rw (4)
where R0 is the resistivity of the formation 100% satu rated with water of resistivity Rw. Formation factor is a function of porosity, and can be expressed as
F=a/¢,m (5)
where a and m are generally taken to be 1 and 2, respec tively. Using these values, the true resistivity, desig nated R,, of a clean formation containing hydrocarbons is expressed as
R,=Rw/sw"4>,2 (6)
where n, the saturation exponent, is generally taken to be 2. Using the classical equation set forth, one conven tional prior art technique computes a value, designated R,’ which is a computed “wet” resistivity value and assumes that the formation is fully saturated with water; i.e., SW: 1. From relationship (6), it can be seen that
R0'=Rw/4>,2 (1)
In this computation, qb, may be obtained from logging information, for example from neutron and/or density log readings, and Rw may be obtained from local knowl edge of connate water resistivity or, for example, from a clean water-bearing section of a resistivity log. The computed value of R0’ is compared with a measured value of resistivity, designated R,, obtained, for exam ple, from a deep investigation resistivity or induction log. In clean zones having no hydrocarbons R,’ will track R,, but when R0’ is less than R‘, there is an indica tion of the presence of hydrocarbons. Thus, by overly ing the computed wet resistivity (R,,’) and the measured resistivity (Rt), potential hydrocarbon bearing zones can be identi?ed. From equations (6) and (7), it is seen that another way of using this information is to obtain a ‘computed value of apparent water saturation, desig nated SW’, from the relationship
Substantial deviations of 8,,’ from unity also indicate potential hydrocarbon bearing zones.
(3) Sw'
4,233,839 3
The described types of techniques are effective in relatively clean formations, but in shaly formations the shales contribute to the conductivity, and the usual resistivity relationships, as set forth, do not apply. Ac cordingly, and for example, the previously described overlay or R0’ and R, can lead to incorrect conclusions in a shale section of the formations, and the overlay in these sections (as well as the determination of water saturation taken therefrom) is generally, of necessity, ignored. In addition to the results being less useful than they might be, this consequence can tend to diminish the credibility of the entire computed log comparison and is ‘a disadvantage when attempting to commercially exploit the resultant information. Accurate determina tion of Sw can also be dif?cult in shaly sections. Of course, these are just limited examples of how shaliness can interfere with measurement interpretation, but simi lar problems with shaliness arise in other situations, > such as when invaded zone characteristics (like S m) are to be determined or when interrupting readings from thermal decay time logs in cased boreholes. A number of techniques, of varying complexity, are
in existence for aiding in the interpretation of results obtained in shaly formations. The manner in which shaliness affects a log reading depends on the propor tion of shale and its physical properties. It may also depend upon the way the shale is distributed in the formations. It is generally believed that the shaly mate rial is distributed in shaly sands in three possible ways; i.e., “laminar shale” where the shale exists in the form of laminae bet-ween which are layers of sand, “structural shale” where the shale exists as grains or nodules in the formation matrix, and “dispersed shale” where the shaly material is dispersed throughout the sand partially ?lling the intergranular interstices. Shaly~sand evalua tions are typically made by assuming a particular type of shale distribution model and incorporating into the model information which indicates the volume of shale or the like. For example, in a laminated sand-shale sim pli?ed model, an equation of the form of equation (6) is set forth, but includes a second term which is a function of the bulk-volume fraction of shale in the laminae. The same is true for another known model wherein a term is developed which depends upon the volume fraction of shale as determined from a total clay indicator. In a dispersed shale simpli?ed model, values are developed for an “intermatrix porosity” which includes all the space occupied by ?uids and dispersed shale and an other value is developed representing the fraction of that porosity occupied by the shale. Still another ap proach relates the conductivity contribution of the shale to its cation exchange capacity, this capacity being determined, inter alia, from the volume of clay. The described prior art techniques, which require
either a determination of the volume of shale or clay, or similar information, have been satisfactory in some ap plications. However, in addition to the dif?culty of accurately obtaining information concerning the vol ume and composition of shale or clay and its conductiv ity, a further problem with prior art simpli?ed models is that various forms of shale may occur simultaneously in the same formation. Reliable techniques, some of which use extensive statistical treatment of data, do exist and generally yield good results, but tend to be relatively complex and may require either powerful computing equipment and/or substantial processing time.
It is one object of the present invention to provide a solution to the indicated prior art problems and to set
40
45
. 1.4
forth techniques which are effective even in shaly for mations, but which are ‘not unduly complex or dif?cult to implement; '
SUMMARY OF THE INVENTION
Applicant has discovered that determination of a “composite” parameter of the formation water in for mations surrounding a borehole, for example the com posite conductivity of the formation water, allows a relatively accurate determination of formation charac teristics, such as water saturation, the determined values being meaningful even in shaly regions of the forma tions. In contrast to past approaches which attempted to determine the volume of shale or clay present in the formations and then introduce appropriate factors which often involve substantial guesswork, applicants’ technique determines a composite water parameter, for example a composite water conductivity, which repre sents the conductivity of the bulk water in the forma tions, including both free water and bound water. Bound water trapped in shales is accounted for in this determination, so unlike prior techniques, the shales can be considered as having a porosity. Having determined, at each depth level, the composite water conductivity, water saturationwcan be directly obtained using rela tively straightforward relationships which do not re quire estimates of the volume of shale in the formations. Shale effects are accounted for in the present invention by the different conductivities (or other parameter such as capture cross sections) of the formation water con stituents (free and bound) which make up the total wa ter. As used herein, “free water” is generally intended to mean water that is reasonably free to be moved under normal reservoir dynamics, whereas “bound water” is generally intended to mean water that is not reasonably free to be moved'under normal reservoir dynamics.
In accordance with an embodiment of the invention, there is provided an apparatus for determining, at each depth level, a composite parameter (such as the com posite conductivity or the composite capture cross sec tion) of the formation water in formations surrounding a borehole. Means are provided for deriving a ?rst quantity representative of the parameter attributable to the free water in the formations. Means are also pro vided for deriving a second quantity representative of the fraction of bound water in the formations. (As will
_ become clear, the second quantity could alternatively
65
be obtained indirectly from the fraction of free water). Further means are provided for deriving a third quan tity representative of the parameter attributable to the bound water in the formations. The composite parame ter is then determined as a function of the ?rst, second and third quantities.
In one form of the invention, a fourth quantity is derived, as the difference between the third and ?rst quantities. The composite parameter is then determined as the sum of the ?rst quantity and the product of the second and fourth quantites.
In an embodiment of the present invention the com posite water conductivity, designated crwc’, is expressed by the following relationship
(9)
where o'wfis the conductivity of the free water in the formations, o'wb is the conductivity of the bound water
4,233,839 5
in the formations, Sw is the water saturation of the for mations (which equals ¢w/ (in), and SW1, is the saturation of the bound water in the formations (which equals ¢wb/¢,). The expression (9) apportions the composite water conductivity as between the conductivity of the free water (the above-indicated ?rst quantity) and the conductivity of a difference term which expresses the difference between the conductivities of the bound water and the free water (the above-indicated fourth quantity). Mathematical manipulation shows that an other form of expression (9) is
(Sw — Swb)
Sw I
“we
In this form, the composite water conductivity can be viewed as the sum of a ?rst term, which represents the fraction of free water times the conductivity of the free water, plus a second term which represents the fraction of bound water times the conductivity of the bound water. As implied above, the fraction of free water, Swf/Sw, (which is the unity complement of the bound water fraction—since the total water volume consists of the free water volume plus the bound water volume) could alternately be used in expressions (9) or (10). For example, the form of expression (10) would then be
(10a)
which can be seen to be equivalent to (10) since Sw=Swf+Swb. Accordingly, when the term “fraction of bound water”, or the like, is used in this context, it will be understood that its complement (the fraction of free water) could alternatively be employed in appropriate form.
In another embodiment of the invention, the compos ite parameter of the formation water is the composite water capture cross section, designated 2W6’. As is shown in the art, capture cross section is a measure of the fraction of thermal neutrons absorbed per unit time, and is typically measured using a thermal neutron decay time (“NDT”) logging device of the type described, for example, in US. Pat. No. RE 28,477. The composite water capture cross section, Ewe’, is expressed herein as
Sw
which is similar to expression (9), but where zwflS the capture cross section of the free water in the formations and EM, is the capture cross section of the bound water in the formations.
In accordance with a further feature of the invention, a value of water saturation is generated and provides meaningful information even in shaly regions. This obviates the prior art technique of estimating an appro priate “cementation” exponent for shaly formations.
In accordance with still further features of the inven tion, relationships similar to (9) ,or (10) can be set forth in terms of a generalized parameter, “P”, and utilized to obtain a free, a bound, or a composite water parameter, depending on what information is desired and what information is measurable or deriveable. In particular, if it is desired to obtain a parameter of the free water, one
25
30
40
45
50
60
65
6 can set forth the following generalized relationship which is similar in form to relationship (9) above
where Pwc is a composite water parameter, PW], is a bound water parameter, and PM is the free water pa rameter to be determined. In an embodiment of the invention, the free water parameter to be determined is in the form of a variable (pwctwf, de?ned as the signal attenuation attributable to formations when assuming that substantially all of the water therein is free water. Means are provided for deriving a function representa tive of the parameter (attenuation in this case) in at least one region of the formations (typically a clean sand region) in which substantially all of the water present is free water. Means are also provided for deriving a quan tity representative of water content in the formations surrounding a particular depth location in the borehole. This quantity may be tpl, the travel time of microwave electromagnetic energy in the formations, which is dependent on water content. The free water parameter (in the form of the variable ¢wawf in this case) at the particular depth level is then determined from the de rived function and the water content representative quantity. Measurements of attenuation and travel time are typically obtained using an “EMP” microwave electromagnetic propagation logging device.
In terms of the attenuation, a, the relationship (9a) can be expressed as
(9b) Swb awc = awf+ SW (awb — awj)
where awb is the bound water conterpart of awf, and awC is a “composite” attenuation for the actual formation water.
As will be described further hereinbelow, the “appor tionment” of attenuation, as between the free end bound water which is indicated by expression (9b) leads to a technique for determining the fraction of bound water, Swb/Sw once the values of a, awf and (1W1, have been established. In particular, Swb/Sw can be determined from
(9c)
which follows directly from relationship (9b). Further features and advantages of the invention will
become more readily apparent from the following de_ tailed description when taken in conjunction with the accompanying drawings.
BRIEF DESCRIPTION OF THE DRAWINGS
FIG. 1 is a simpli?ed block diagram of an apparatus in accordance with an embodiment of the invention. FIG. 2 is a block diagram of the computing module
60 of FIG. 1. FIG. 3 is a block diagram of the computing module
70 of FIG. 1. FIG. 4 is a block diagram of the computing module
80 of FIG. 1. "
FIG. 5 is a frequency cross-plot useful in obtaining subsurface characteristic values that can be utilized in the present invention.
4,233,839 ‘ 7
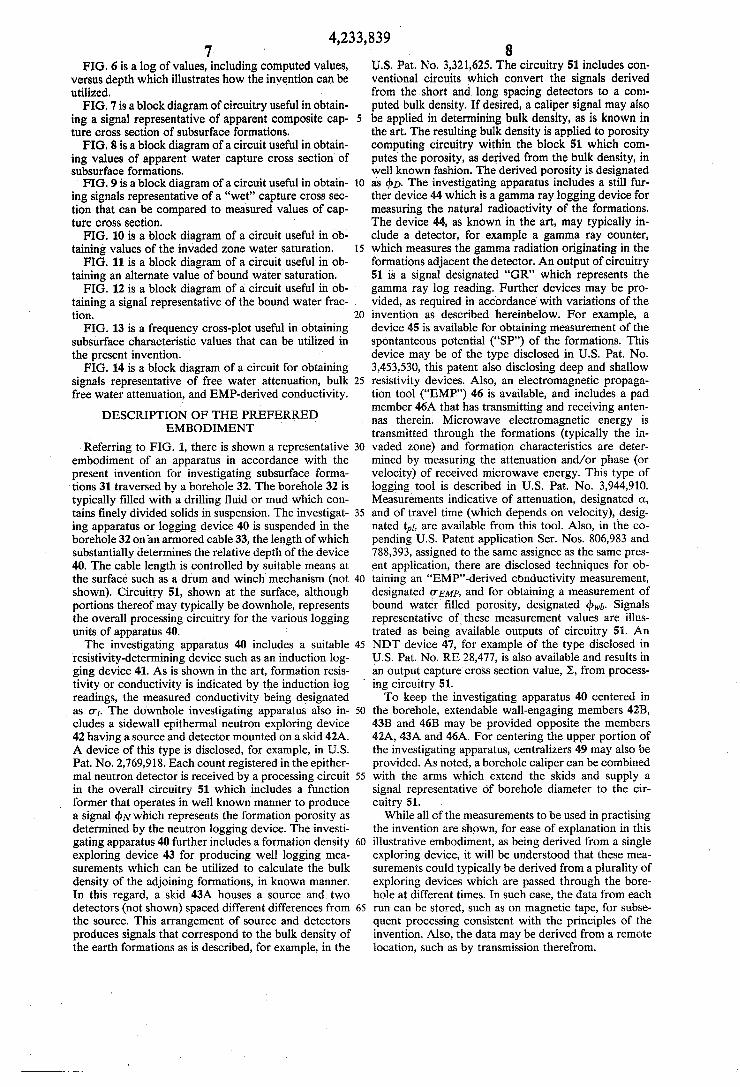
FIG. 6 is a log of values, including computed values, versus depth which illustrates how the invention can be utilized. FIG. 7 is a block diagram of circuitry useful in obtain
ing a signal representative of apparent composite cap ture cross section of subsurface formations.
FIG. 8 is a block diagram of a circuit useful in obtain ing values of apparent water capture cross section of‘ subsurface formations. FIG. 9 is a block diagram of a circuit useful in obtain
ing signals representative of a “wet” capture cross sec tion that can be compared to measured values of cap ture cross section. ‘
FIG. 10 is a block diagram of a circuit useful in ob taining values of the invaded zone water saturation. FIG. 11 is a block diagram of a circuit useful in ob
taining an alternate value of bound water saturation. FIG. 12 is a block diagram of a circuit useful in ob- '
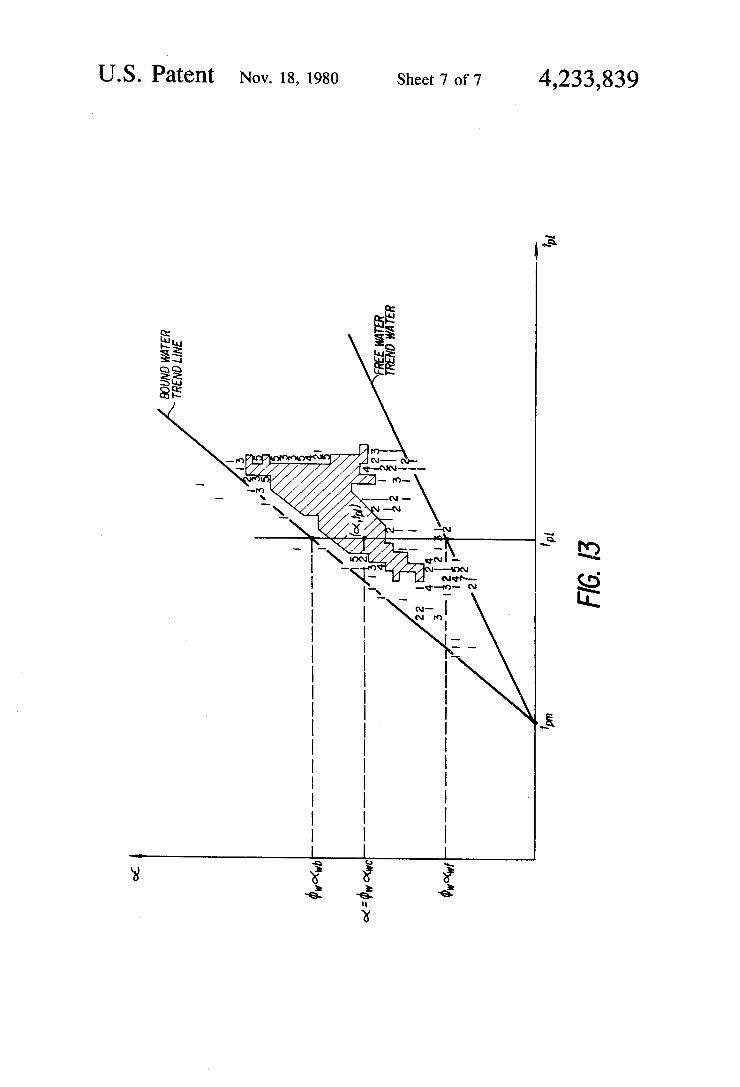
taining a signal representative of the bound water frac tion. FIG. 13 is a frequency cross-plot useful in obtaining
subsurface characteristic values that can be utilized in the present invention. FIG. 14 is a block diagram of a circuit for obtaining
signals representative of free I water attenuation, bulk free water attenuation, and EMP-derived conductivity.
DESCRIPTION OF THE PREFERRED EMBODIMENT
Referring to FIG. 1, there is shown a representative embodiment of an apparatus in accordance with the present invention for investigating subsurface forma tions 31 traversed by a borehole 32. The borehole 32 is typically ?lled with a drilling ?uid or mud which con tains ?nely divided solids in suspension. The investigat ing apparatus or logging device 40 is suspended in the borehole 32 on ‘an armored cable 33, the length of which substantially determines the relative depth of the device 40. The cable length is controlled by suitable means at the surface such as a drum and winch mechanism (not shown). Circuitry 51, shown at the surface, although portions thereof may typically be downhole, represents the overall processing circuitry for the various logging units of apparatus 40. The investigating apparatus 40 includes a suitable
resistivity-determining device such as an induction log ging device 41. As is shown in the art, formation resis tivity or conductivity is indicated by the induction log readings, the measured conductivity being designated as 0-,. The downhole investigating apparatus also in cludes a sidewall epithermal neutron exploring device 42 having a source and detector mounted on a skid 42A. A device of this type is disclosed, for example, in U.S. Pat. No. 2,769,918. Each count registered in the epithet mal neutron detector is received by a processing circuit in the overall circuitry 51 which includes a function former that operates in well known manner to produce a signal 4w which represents the formation porosity as determined by the neutron logging device. The investi gating apparatus 40 further includes a formation density exploring device 43 for producing well logging mea surements which can be utilized to calculate the bulk density of the adjoining formations, in known manner. In this regard, a skid 43A houses a source and two detectors (not shown) spaced different differences from the source. This arrangement of source and detectors produces signals that correspond to the bulk density of the earth formations as is described, for example, in the
20
25
45
8 U.S. Pat. No. 3,321,625. The circuitry 51 includes con ventional circuits which convert the signals derived from the short and long spacing detectors to a com puted bulk density. If desired, a caliper signal may also be applied in determining bulk density, as is known in the art. The resulting bulk density is applied to porosity computing circuitry within the block 51 which com putes the porosity, as derived from the bulk density, in well known fashion. The derived porosity is designated as (1)9. The investigating apparatus includes a still fur ther device 44 which is a gamma ray logging device for measuring the natural radioactivity of the formations. The device 44, as known in the art, may typically in clude a detector, for example a gamma ray counter, which measures the gamma radiation originating in the formations adjacent the detector. An output of circuitry 51 is a signal designated “GR” which represents the gamma ray log reading. Further devices may be pro vided, as required in accordance with variations of the invention as described hereinbelow. For example, a device 45 is available for obtaining measurement of the spontanteous potential (“SP”) of the formations. This device may be of the type disclosed in U.S. Pat. No. 3,453,530, this patent also disclosing deep and shallow resistivity devices. Also, an electromagnetic propaga tion tool (“EMP”) 46 is available, and includes a pad member 46A that has transmitting and receiving anten nas therein. Microwave electromagnetic energy is transmitted through the formations (typically the in vaded zone) and formation characteristics are deter mined by measuring the attenuation and/or phase (or velocity) of received microwave energy. This type of logging tool is described in U.S. Pat. No. 3,944,910. Measurements indicative of attenuation, designated a, and of travel time (which depends on velocity), desig nated tpl, are available from this tool. Also, in the co pending U.S. Patent application Ser. Nos. 806,983 and 788,393, assigned to the same assignee as the same pres ent application, there are disclosed techniques for ob taining an “EMP”-derived conductivity measurement, designated cm”, and for obtaining a measurement of bound water-?lled porosity, designated qbwb. Signals representative of , these‘ measurement values are illus trated as being available outputs of circuitry 51. An NDT device 47, for example of the type disclosed in U.S. Pat. No. RE 28,477, is also available and results in an output capture cross section value, 2, from process
“ ing circuitry 51.
60
To keep the investigating apparatus 40 centered in the borehole, extendable wall-engaging members 42B, 43B and 46B may be provided opposite the members 42A, 43A and 46A. For centering the upper portion of the investigating apparatus, centralizers 49 may also be provided. As noted, a borehole caliper can be combined with the arms which extend the skids and supply a signal representative of borehole diameter to the cir cuitry 51.
While all of the measurements to be used in practising the invention are shown, for ease of explanation in this illustrative embodiment, as being derived from a single exploring device, it will be understood that these mea surements could typically be derived from a plurality of exploring devices which are passed through the bore hole at different times. In such case, the data from each run can be stored, such as on magnetic tape, for subse quent processing consistent with the principles of the invention. Also, the data may be derived from a remote location, such as by transmission therefrom.
4,233,839 9
One or more of the signal outputs of block 51 are illustrated in FIG. 1 as being available to computing modules 60, 70, 80 and 510. In the embodiment of FIG. 1, the computing module 60 generates a signal represen tative of an apparent composite water conductivity, designated a'wm', consistent with the relationship (9). The computing module 70 is responsive to the signal representative of am’, and to the signals from block 51 (in particular a porosity-indicative signal), to generate a “wet” conductivity signal, 0-0’. The computing module 80 generates a computed value of water saturation, Sw', in accordance with a relationship to be set forth. The computing module 510 is utilized in the generation of free and bound water attenuation values and a signal representative of the bound water fraction. These sig-' nals, along with some or all of the outputs of circuitry 51, are recorded as a function of depth on recorder 90.
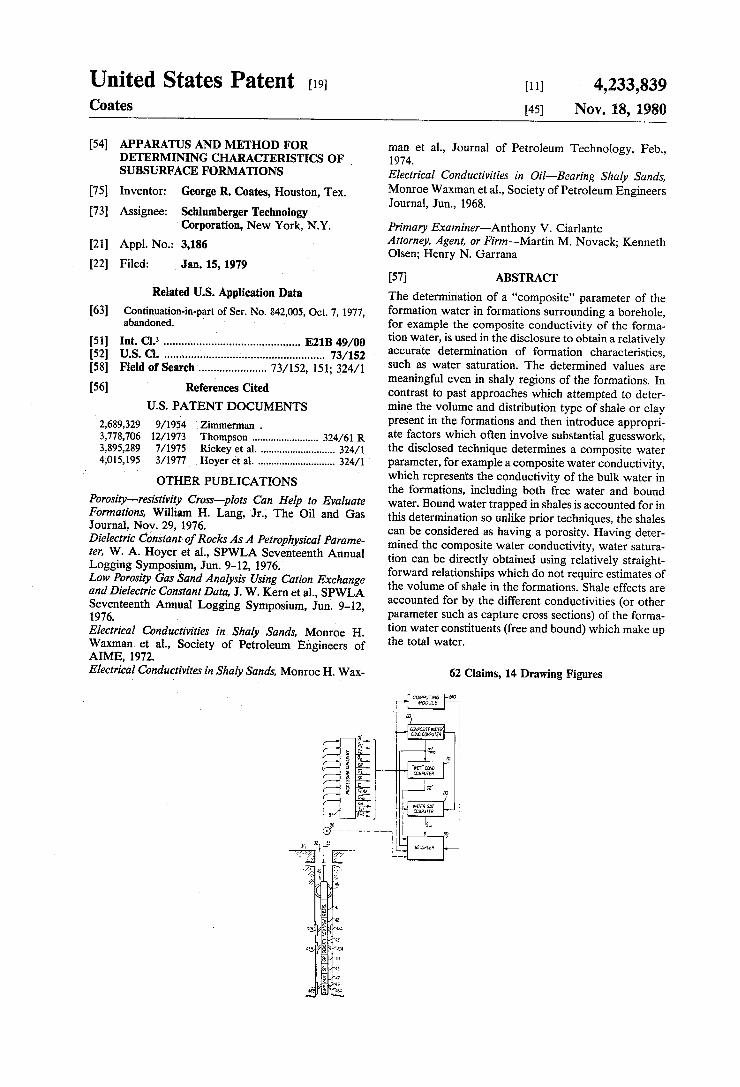
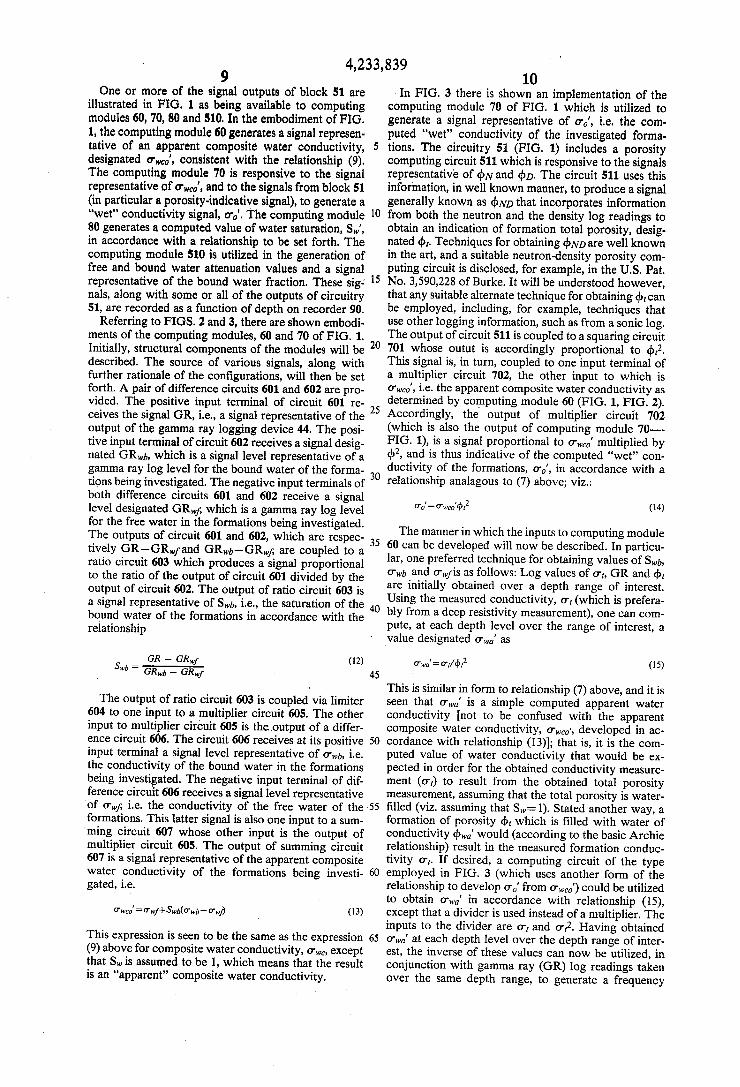
Referring to FIGS. 2 and 3, there are shown embodi ments of the computing modules, 60 and 70 of FIG. 1. Initially, structural components of the modules will be described. The source of various signals, along with further rationale of the con?gurations, will then be set forth. A pair of difference circuits 601 and 602 are pro vided. The positive input terminal of circuit 601 re ceives the signal GR, i.e., a signal representative of the output of the gamma ray logging device 44. The posi tive input terminal of circuit 602 receives a signal desig nated GRwb, which is a signal level representative of a gamma ray log level for the bound water of the forma tions being investigated. The negative input terminals of both difference circuits 601 and 602 receive a signal level designated GRwf; which is a gamma ray log level for the free water in the formations being investigated. The outputs of circuit 601 and 602, which are respec tively GR-—GR,.fand GRwb—GRwf; are coupled to a ratio circuit 603 which produces a signal proportional to the ratio of the output of circuit 601 divided by the output of circuit 602. The output of ratio circuit 603 is a signal representative of Swb, i.e., the saturation of the bound water of the formations in accordance with the relationship
(12) GR. 1,, - GRwf
The output of ratio circuit 603 is coupled via limiter 604 to one input to a multiplier circuit 605. The other input to multiplier circuit 605 is the .output of a differ ence circuit 606. The circuit 606 receives at its positive input terminal a signal level representative of 0%, i.e. the conductivity of the bound water in the formations being investigated. The negative input terminal of dif ference circuit 606 receives a signal level representative of o-wf, i.e. the conductivity of the free water of the formations. This latter signal is also one input to a sum ming circuit 607 whose other input is the output of multiplier circuit 605. The output of summing circuit 607 is a signal representative of the apparent composite water conductivity of the formations being investi gated, i.e.
Uwco'=0'wf+Swb(°'wb_¢7'w/) (13)
This expression is seen to be the same as the expression (9) above for composite water conductivity, o-wc, except that SW is assumed to be 1, which means that the result is an “apparent” composite water conductivity.
15
20
25
45
55
60
65
10 In FIG. 3 there is shown an implementation of the
computing module 70 of FIG. 1 which is utilized to generate a signal representative of 0-0’, i.e. the com puted “wet” conductivity of the investigated forma tions. The circuitry 51 (FIG. 1) includes a porosity computing circuit 511 which is responsive to the signals representative of (luv and am. The circuit 511 uses this information, in well known manner, to produce a signal generally known as ¢ND that incorporates information from both the neutron and the density log readings to obtain an indication of formation total porosity, desig nated dn. Techniques for obtaining (1WD are well known in the art, and a suitable neutron-density porosity com puting circuit is disclosed, for example, in the US. Pat. No. 3,590,228 of Burke. It will be understood however, that any suitable alternate technique for obtaining ¢tcan be employed, including, for example, techniques that use other logging information, such as from a sonic log. The output of circuit 511 is coupled to a squaring circuit 701 whose outut is accordingly proportional to ¢,2. This signal is, in turn, coupled to one input terminal of a multiplier circuit 702, the other input to which is a-ww’, i.e. the apparent composite water conductivity as determined by computing module 60 (FIG. 1, FIG. 2). Accordingly, the output of multiplier circuit 702 (which is also the output of computing module 70—— FIG. 1), is a signal proportional to am,’ multiplied by (1)2, and is thus indicative of the computed “wet” con ductivity of the formations, 0-0’, in accordance with a relationship analagous to (7) above; viz.:
0'0’ = o-WC0'¢I2 (14)
The manner in which the inputs to computing module 60 can be developed will now be described. In particu lar, one preferred technique for obtaining values of Swb, owl, and O'wflS as follows: Log values of 0-,, GR and do, are initially obtained over a depth range of interest. Using the measured conductivity, 0-, (which is prefera bly from a deep resistivity measurement), one can com pute, at each depth level over the range of interest, a value designated am,’ as
0'wa'=0'l/¢I2 (15)
This is similar in form to relationship (7) above, and it is seen that own’ is a simple computed apparent water conductivity [not to be confused with the apparent composite water conductivity, o'ww', developed in ac cordance with relationship (13)]; that is, it is the com puted value of water conductivity that would be ex pected in order for the obtained conductivity measure ment (0-,) to result from the obtained total porosity measurement, assuming that the total porosity is water ?lled (viz. assuming that SW: 1). Stated another way, a formation of porosity d), which is ?lled with water of conductivity ¢w,,’ would (according to the basic Archie relationship) result in the measured formation conduc tivity 0-,. If desired, a computing circuit of the type employed in FIG. 3 (which uses another form of the relationship to develop 0-0’ from o-ww') could be utilized to obtain mm’ in accordance with relationship (15), except that a divider is used instead of a multiplier. The inputs to the divider are 0-, and 03. Having obtained mm’ at each depth level over the depth range of inter est, the inverse of these values can now be utilized, in conjunction with gamma ray (GR) log readings taken over the same depth range, to generate a frequency
4,233,839 11
cross-plot of the type illustrated in FIG. 5. Frequency cross-plots are commonly used in the well logging art (see, for example, Schlumberger “Log Interpretation Volume II”, 1974 Edition). At each depth level, the values of l/o'wa' and GR result in a point on the cross plot. When all points have been plotted, the number of points which fall within each small elemental area (of a selected size) on the plot are summed and presented numerically. The resultant plot is as shown in FIG. 5, with the numbers thereon representative of the fre quency of occurrence of points at each particular ele mental area on the plot. In the illustrated example, the region designated by enclosure 501 contained the high est concentration of points (i.e. more than ?ve points at each elemental area), so the frequencies of occurrence within this region are omitted for clarity of illustration. The position on the GR axis designated as GRwfis indi cated by the line of lowest gamma ray readings on the plot, as shown in dashed line. The position on the GR axis designated as GRwb is indicated by the GR value at which increasing GR no longer results in increasing values of l/o-wa’. This means that at GRwb essentially all the water in the formations is bound (typically by what ever shaliness in present). Any further shaliness or in— creases in the volume of clay would mean an increase in GR toward GRmax (FIG. 5), but would not increase the bound water fraction since essentially all water present was indicated as bound at the GRwl, line. The fraction of bound water is then determined by interpolation be tween the reference lines GRwfand GRwb, that is, as
GR — GRwf (16)
M = m
The line on the l/o'w,,’ axis at which l/o'wa’ no longer varies substantially with GR (beyond GR,,.;,) is indica tive of l /o'w1,, since, as previously noted, at this point on the plot essentially all of the formation water is bound. Accordingly o'wb is derived from the dashed line la belled with this designation. Applicant has found that o'wb is substantially a constant and has a value of about 7 mhos/m at 75° C. It is not, however, considereda universal constant and may vary somewhat in different regions. In any event, it is determinable from e.g. the cross-plot of FIG. 5. The value of the free water con ductivity o-wf, can be obtained, for example, from the free water dashed line on the FIG. 5 plot. Alternatively, as is known in the art, o-wfcan be obtained from a clean sand section of a resistivity log or from local knowl edge. It will be'understood that alternate techniques can be utilized to obtain at least some of the values consid ered herein. With values of GRwf, GRwb, o'wf, and o'wb having
been established for the depth range of interest, corre sponding signal levels can be input to the computing module 60 (FIG. 2). Now, log values of GR (as a func tion of depth can be input to module 60 and own,’ can be output and recorded (if desired) on a dynamic basis. At the same time, the computing module 70 (FIG. 3) gener ates o'o' as an output to recorder 90. This signal can now be overlayed with 0-,, to great advantage in identifying potential hydrocarbon bearing zones. FIG. 6 illustrates the nature of the signals which can
be recorded by the recorder 90 in the embodiment of FIG. 1. The vertical axis represents depth. The middle track shows the inverses of 0-0’ (dashed line) and a, (solid line); i.e., the computed “wet” resistivity and the measured deep resistivity, respectively. The regions of
40
45
12 divergenceof these curves, for example the regions designated 2 and 3,_indicate that the measured deep resistivity is substantially greater than the computed “wet” resistivity (or, conversely,..-that the measured deep conductivity is substantially less than the com puted “wet” conductivity), thereby indicating that they are potential hydrocarbon bearing zones. The left hand track illustrates the output of a spontaneous potential (SP) log over the same depth range. Relatively stable values of the SP, for example in thezregions designated 4 and 5 are at the “shale baseline” and characteristic of shaly regions. It is seen that the resistivity curves gener ally track each other even in the shaly zones, as should be the case for water-bearing shale regions. This contin uous tracking of the measured and derived resistivity signals is an important advantage of the present inven tion since comparable prior art techniques are generally unreliable in shaly regions, as discussed in the Back ground section hereof. The determination of a computed value of water
saturation, Sw’, will now be considered. Relation (9) above indicated that the composite water conductivity, am, is expressed as:
Swb (9) 0-,“- = u'wf+ TW (O'wb -- U’w?
From equation (6) we‘ can write
m= wswzw (11)
where 0-", is the (unknown) actual conductivity of the formation ‘water. Substituting the expression for com posite water conductivity (o'wc) for aw in (17) gives:
The apparent water conductivity own’ (as described in conjunction with FIG. 5) is equal to (rt/(b3. Substi tuting into (18) gives
55
65
This quadradic equation can be solved for Sw to obtain:
(21)
From relationship (21) it is seen that a value of water saturation, obtained using the composite (free and bound) water technique of the present invention, can provide meaningful information even in shaly regions, since the effects of the shales in binding a portion of the formation waters is accountedfor in the relationship.
> Accordingly, the prior art technique of estimating an appropriate “cementation” exponentlforv shaly forma tions is obviated.
4,233,839 13
FIG. 4 illustrates an implementation of the computing module 80 utilized to generate a signal representative of computed water saturation, designated S,,,', in accor dance with relationship (21). The signal representative of “true” or measured resistivity, rr,(FIG. 1), is one input to a ratio circuit 811. The other input to ratio circuit is the output of a squaring circuit 812 whose input is a signal representative of 4),. Accordingly, the output of ratio circuit 811 is proportional to m/dnz, which equals the apparent formation conductivity, o-wa'. This signal is, in turn, coupled as one input to a multiplier circuit 805 whose other input is a signal rep resentative of 0'"; The output of multiplier 805 is cou pled, with a weighting factor of 4, to one input of a summing circuit 804. The signal o'wfis also coupled to the negative input terminal of a difference circuit 801, the positive input terminal of which receives a signal representative of 0%. The output of difference circuit 801 is one input to a multiplier 802. The other input to multiplier 802 is a signal representative of Swb, which may be derived, for example, from the output of the limiter 604 of FIG. 2. Accordingly, the output of multi plier 802 is a signal representative of Swb(0'w1,—crw/). This signal is coupled to a squaring circuit 803 and to the negative input terminal of a difference circuit 807. The output of squaring circuit 803 is coupled to the other input terminal of summing circuit 804 whose out put is, in turn, coupled to a square root circuit 806. The output of the square root circuit 806 is coupled to the positive input terminal of difference circuit 807. The output of difference circuit 807 is coupled to one input of a ratio circuit 808, the other input of which receives the signal representative of cwf, this signal being af forded a weighting factor of 2. The output of ratio circuit 808 is the desired signal representative of SW’, in accordance with relationship (21). The right track of FIG. 6 illustrates the recorded values of the computed water saturation, Sw'. The determination of a composite conductivity and
determination of water saturation, in accordance with the principles of the invention, applies equally well in the invaded zone of the formations. In the relationships (9) and (18) for example, the quantity 034 would be replaced by (Tmf (i.e. the conductivity of the invading mud ?ltrate) and the water saturation 8,, would be re placed by the invaded zone saturation SXO. The EMP logging device referred to above measures characteris tics of the invaded zone. In the abovereferenced US. Patent application Ser. No. 788,393, a technique is dis closed for measuring dawb using an EMP logging device. This technique can be utilized as an alternate herein for obtaining Swb from Swb=o'wb/o-,. In another aboverefe renced US Patent application Ser. No. 806,983 it is disclosed that conductivity as measured using an EMP device, and designated a'EMp, is related to the conduc tivity of the formation water, o'w, as a linear function of water-?lled porosity, (kw, i.e.:
(TEMP: O'w¢w (22)
Since Sw=¢w/¢, and (M: ¢,Sw, relationship (22) can be expressed as: ->
U'EMP=¢rSw0'w (23)
Substituting the expression (9) composite water conduc tivity for crw into (23) gives:
40
45
55
65
(24)
Substituting o'mffor a'wfand Sm’ for Sw and solving for Sm’ yields
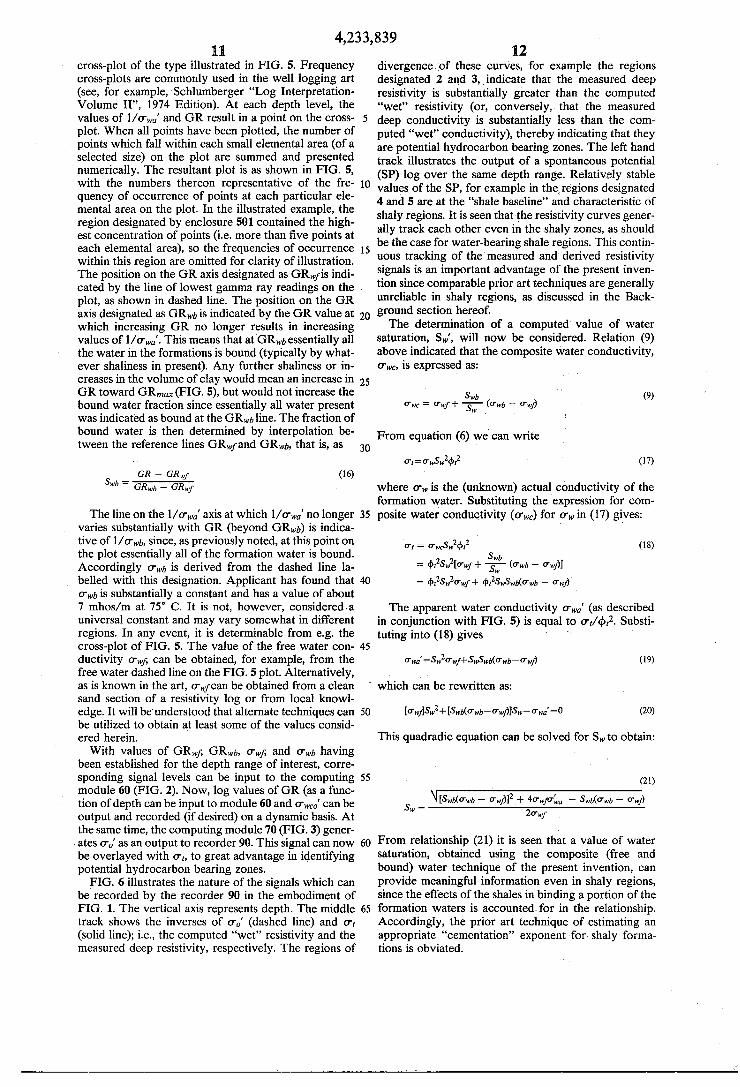
Referring to FIG. 10, there is shown a block diagram of a computing module 80' suitable for obtaining a sig nal which represents the computed invaded zone water saturation, Sm’, in accordance with relationship (25). A ratio circuit 111 receives as one input a signal represen tative of (TEMP, and as its other input a signal represen tative of (in. The signal (TEMP may be derived from the EMP device 46 (FIG. 1) by using processing circuitry 51 as disclosed, for example, in the above referenced copending US. Patent application Ser. No. 806,983. Another ratio circuit 112 receives as one input a signal representative of qbwb, and as its other input the signal representative of total porosity, (1),. As noted just above, (M), can be derived from the measurements taken with an EMP logging device and, in this example, is utilized, in conjunction with (in, to obtain SW1, (the output of ratio circuit 112). It will be understood, however, that SW1, can be obtained using alternate techniques, such as those described herein. A difference circuit 113 receives as its input the signals representative of o-wb (which may be obtained as indicated above and is typically, al though not necessarily, about 7 mhos/m at 75° C.) and ?'mf. The outputs of ratio circuit 112 and difference circuit 113 are coupled to a multiplier circuit 114 whose output is therefore Swb(0'wb—a'mf). The output of ratio‘ circuit 111 and multiplier circuit 114 are coupled to still another difference circuit 115. The output of'difference circuit 115 is therefore seen to represent the numerator in expression (25). This output, and the signal represen tative of o'mf, are the inputs to another ratio circuit 116, whose output is seen to be representative of Sm’, in accordance with expression (25). This signal can be recorded, in the manner of the illustration in FIG. 5. The spontaneous potential measurements from SP
device 45 (FIG. 1) can also be used, for example, as an alternate technique for obtaining values of Swb. The SP measurement can be expressed as
(26)
where K is a constant dependent upon absolute temper ature and o'mf’ is a composite conductivity for the in vaded zone mud ?ltrate, similar in form to owe’ as ex pressed by relationship (9). Using relationship (9) as a basis, we have:
Substituting (27) and (28) into (26) and rearranging gives:
4,233,839 .
In a water-bearing region of the formations where Sx0=Sw relationship (29) reduces to:
(30) where v =
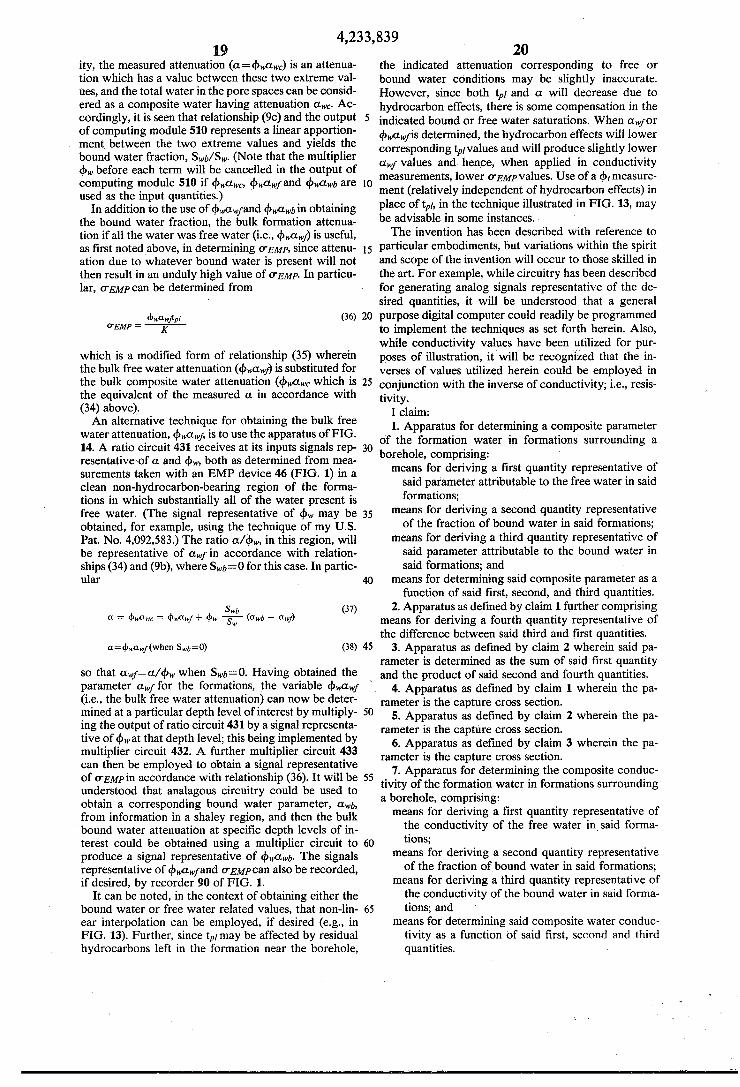
Therefore, the relationship (30) can be utilized (taking SP from a water-bearing region) as an alternate tech nique for obtaining Swb. FIG. 11 illustrates circuitry that
5
can be utilized to obtain a signal representative of SW1, in , accordance with relationship (30). The combination of ratio circuit 121, antilog circuit 122, ‘difference circuit 124 and multiplier 126 are used to obtain the numerator, while ratio circuit 123, antilog circuit 122, and differ ence circuit 125 are used to obtain the denominator of v. The ratio circuit 127 then yields v and summing circuit 128 and inverter 129 are used to obtain a signal repre sentative of Swb.
In the previously described embodiments, the deter mined composite parameter of the formations has been the composite conductivity (or resistivity). Another composite parameter which can be determined is the composite capture cross section, as obtained using an NDT log plus inputs corresponding to those indicated above. As is well known, the NDT is particularly useful in cased holes where resistivity logs cannot be used. In such case, the relationship (11) as set forth above is:
An apparent composite capture cross section, desig nated 2W0’, can be obtained in the same manner that mm’ was developed above, and by using the computing module 60' illustrated in FIG. 7. In FIG. 7, the multi plier 705, difference circuit 706, and summing circuit 707 operate in the same fashion as the corresponding units 605, 606 and 607 of FIG. 2. Suitable values of EWf, EM, and SW1, can be obtained by cross-plotting 2 against GR in the manner described in conjunction with FIG. 5. The only difference is that instead of using relation ship (15) to obtain a computed apparent water conduc tivity, an apparent water capture cross section, 2%’, to be plotted against GR, is obtained from the known
. relationship
+ Ema
where Ema is the matrix capture cross section for the particular lithology encountered. The circuitry of FIG. 8, including difference circuit 881, ratio circuit 882 and summing circuit 883, can be employed to obtain 2M,’ in accordance with relationship (31). After plotting 2W’ against GR, EWfand 2W1, can be determined, for exam ple, as indicated in conjunction with FIG. 5. SW1, can be obtained using the arrangement of circuits 601, 602, 603, 604, of FIG. 2, as described in conjunction therewith. Having determined 2W0’, one can now compute a
30
35
. 16
“wet” capture cross section (analagous to 0-,,’ obtained using relationship (14) above) from:
‘ 20'=(l>!2wco"l'(1"(1)0211": (32)
The circuitry of FIG. 9, including difference circuit 901, multipliers 902 and 903, and summing circuit 904, can be utilized to generate a signal representative of 20’. This signal can then be overlayed with the measured log value, 2, in the manner illustrated in the central rack of FIG. 5, to reveal potential hydrocarbon bearing zones. A further composite parameter which can be ex
pressed by the generalized relationship (9a) is attenua tion, a, i.e. the relative attenuation (typically corrected for temperature and spreading loss) measured by the microwave electromagnetic propagation tool (“EMP” 46 of FIG. 1). The relationship for this parameter is set forth above (9b), and will be considered momentarily. First, and consistent with the teachings of my US. Pat. No. 4,092,583, consider that the measured attenuation of the bulk formation (designated a) can be expressed as
a=¢wawc+(l_¢w)am (33)
where awc is the attenuation attributable to the forma tion water (i.e., its composite water, in accordance with the teachings hereof) and am is the attenuation attributa ble to the formation matrix. Since am is very small com pared to aw, one can write
a=¢w<1wc (34)
This relationship expresses that the bulk formation at tenuation is volumetrically “adjusted” by a factor d>w to take account of the fact that loss is essentially only occurring in that fraction of the bulk formation occu pied by the water. Returning, now, to relationship (9b), we have
Swb (9b) aw: = awf+ T (0% — awf)
where awf is the attenuation attributable to the free water (i.e. the attenuation which one would measure with the “EMP” logging device in a theoretical envi ronment consisting exclusively of the formation free water), (1W1, is the attenuation attributable to the bound
\ water (i.e. the attenuation which one would measure
55
60
with the “EMP” logging device in a theoretical envi ronment consisting exclusively of the formation bound water), and awc is the attenuation attributable to the composite water (i.e. the attenuation which one would measure with a “EMP” logging device in a theoretical environment consisting exclusively of the actual forma tion water).
Solving relationship (9b) for the bound water frac tion, Swb/Sw, yields the relationship (90) ?rst set forth above:
(98) awe — awf
awb — clwf
In the form of the present invention, awfand cot-b (or these parameters multiplied by water ?lled porosity, (1).”, to obtain “bulk” variables (paw; and qbawb) are deter mined using attenuation and travel time (or velocity) measurements taken with an electromagnetic propaga tion logging device such as “EMP” 46 of FIG. 1. The
17 conductivity (generally of the formation invaded zone) obtained using the “EMP” device, designated o-EMp, can be expressed as
0EMp=alP[/K (35) 5
where K is a constant, tp1 is the measured travel time through the formations, and a is the bulk attenuation determined from the measured attenuation corrected for spreading loss and temperature, a being cbwawc (rela tionship (34) above). While the relationship (35) for conductivity is expected to hold substantially indepen-' dent of the salinity of the formation water, it has been observed that frequently o-EMp exceeds the conductiv ity measured from other tools. An explanation for the observed differences in conductivity is that not all of the losses represented'by the bulk attenuation measure ment or are due to the conductivity or salinity of the formation water. Extraordinary losses are believed to occur in the presence of bound water, these losses being more dielectric than conductive in nature. Applicant has discovered that treating bound water losses separate from the ordinary expected free water losses resolves the problem and produces more realistic values of o-EMp. In accordance with a feature of the invention, and as will be described, an attenuation representative variable is determined that is, inter alia, more appropri ate for use in obtaining o'EMp. In the example below, this attenuation representative variable is the free water variable ¢wawf. The determined variable is also useful in conjunction with other techniques where attenuation is utilized as an input or a correction.
Referring to FIG. 12, there is shown implementation of the computing module 510 of FIG. 1 which is utilized to generate a signal representative of the bound water fraction, Swb/Sw. A pair of difference circuits 501 and 502 are provided. The positive input terminal of circuit 501 receives a signal representative of the quantity awc and the negative input terminal of circuit 501 receives a signal representative of the quantity aw]. vThe positive input terminal of circuit 502 receives a signal represen tative of the quantity awb, and the negative input termi nal of circuit 502 receives the signal representative of the quantity awf. The outputs of difference circuits 501 and 502 are respectively coupled to a ratio circuit 503 which produces a signal proportional to the ratio of the output of circuit 501 divided by the output of circuit 502. The output of ratio circuit 503 is accordingly a signal representative of the bound water fraction, Swb/Sw, in accordance with relationship (90). In actual ity, and as will be clari?ed shortly, the inputs to com puting module 510 may each have a common multiplier, ¢w~ The manner in which the inputs to computing module
510 can be developed will now be described. In particu lar, one preferred technique for deriving values of (lwf 55 and awb (or, of related bulk attenuation variables rbwawf
15
25
40
45
‘and ¢wawb) is as follows: Log values of a (attenuation) and tp1 (travel time) are initially obtained over a range of depth levels of interest (e.g., using EMP device 46 of FIG. 1—these outputs being indicated as being avail able from processing circuitry 51). The obtained values of a and tpl are cross plotted, as shown in the frequency cross plot of FIG. 13. The values of a may ?rst be corrected for temperature and for spreading loss. The cross plot of FIG. 13 can be initially understood by recognizing that higher porosity generally results in higher values of both attenuation and travel time (at least, when that porosity contains water). This is be
4,233, 839 18
cause the water is much lossier than the rock matrix (thus: greater attenuation) and the velocity of the elec tromagnetic energy through water is lower than through the matrix (thus: greater travel time). Accord ingly, increasing values of t,,/ and a on the cross plot generally correspond to increasing values of porosity. It can be noted that a could alternatively be cross-plotted against other non-conductivity related measurements reflecting total porosity, (1),, such as (imp, previously described. The point designated tpm on the tp1 axis represents the
travel time through the formation matrix. Two trend lines, designated as the “free water trend line” and the “bound water trend line” are constructed by starting at the point tpm and drawing lines through the approximate bottom and top edges of the main cluster of points on the cross plot. These trend lines can be understood in the following terms: In those portions of the formations containing substantially only free water, both t,,] and a will increase with porosity, with the increase in travel time being dependent upon the volume of water and the increase in attenuation being dependent upon both the volume of water and its conductivity. Accordingly, the slope of the free water trend line will depend upon the conductivity or lossiness associated with the free water. The same will generally be true of those portions of the formations in which substantially all of the water is bound water. However, in this case, attenuation will be a function of not only the volume of water and its con ductivity, but also of the generally higher losses, in cluded dipolar losses, associated with the’ bound water. Accordingly, the bound water trend line usually has substantially greater slope than the free water trend line. It will be understood that these trends representing the relationships between attenuation and travel time in a substantially free water region (such as a clean sand) and a bound water region (such as a shale) could be determined initially from logs taken in such formation regions. Also, it will be understood that these relation ships are determinable functions which need not neces sarily be linear, but are illustrated as being linear in the graph of FIG. 13. Having established free water and bound water trend
lines (or functions), one can now, at each depth level of interest, obtain a free water attenuation quantity repre sentative of the attenuation attributable to the forma tions (surrounding the depth level of interest) as if sub stantially all of the water in the formations was free Water. Similarly, one can derive a bound water attenua tion quantity representative of the attenuation attributa ble to said formations (surrounding the depth level of interest) as if substantially all of the water in the forma tions was bound water. Using these quantities, in con junction with the measured attenuation at the depth level of interest, one can then determine the bound water fraction in the formations surrounding the partic ular depth level. With reference to FIG. 13, consider the illustrated individual point (a, tpl) and the vertical line drawn therethrough. At the particular measured value of tpl, the intersection with free water trend line indicates the attenuation value that one would have measured if the water in the pore spaces of this particu lar formation contained exclusively free- water (i.e., ¢,,,awf) whereas the intersection with the bound water trend line indicates the attenuation that would have been measured if the pore spaces of this formation con tained exclusively bound water (i.e., ¢wawb). In actual
4,233,839 19
ity, the measured attenuation (a=¢wawC) is an attenua tion which has a value between these two extreme val ties, and the total water in the pore spaces can be consid ered as a composite water having attenuation awc. Ac cordingly, it is seen that relationship (90) and the output of computing module 510 represents a linear apportion
. ment between the two extreme values and yields the bound water fraction, Swb/Sw. (Note that the multiplier qbw before each term will be cancelled in the output of computing module 510 if qbwawc, ¢wawfand ¢wawb are used as the input quantities.)
In addition to the use of ¢wawfand ¢wawb in obtaining the bound water fraction, the bulk formation attenua tion if all the water was free water (i.e., ¢wawf) is useful, as ?rst noted above, in determining o'EMp, since attenu ation due to whatever bound water is present will not
10
then result in an unduly high value of o-EMP. In particu lar, o'EMp can be determined from
(36) (TEMP = K
which is a modi?ed form of relationship (35) wherein the bulk free water attenuation (qbwawf) is substituted for the bulk composite water attenuation (¢wawc which is the equivalent of the measured a in accordance with (34) above). An alternative technique for obtaining the bulk free
water attenuation, ¢wawf, is to use the apparatus of FIG. 14. A ratio circuit 431 receives at its inputs signals rep resentativeof a and 4% both as determined from mea surements taken with an EMP device 46 (FIG. 1) in a clean non-hydrocarbon-bearing region of the forma tions in which substantially all of the water present is free water. (The signal representative of qbw may be obtained, for example, using the technique of my US. Pat. No. 4,092,583.) The ratio a/<bw, in this region, will be representative of awf in accordance with relation ships (34) and (9b), where Swb=O for this case. In partic ular
a=¢w¢1wf(when Swb=0) (38)
so that awFa/cbw when Swb=0. Having obtained the parameter awf for the formations, the variable dawawf (i.e., the bulk free water attenuation) can now be deter mined at a particular depth level of interest by multiply ing the output of ratio circuit 431 by a signal representa tive of (1)", at that depth level; this being implemented by multiplier circuit 432. A further multiplier circuit 433 can then be employed to obtain a signal representative of o'EMp in accordance with relationship (36). It will be understood that analagous circuitry could be used to obtain a corresponding bound water parameter, awb, from information in a shaley region, and then the bulk bound water attenuation at speci?c depth levels of in terest could be obtained using a multiplier circuit to produce a signal representative of ¢waw1,. The signals representative of dawawfand 0544;) can also be recorded, if desired, by recorder 90 of FIG. 1.
It can be noted, in the context of obtaining either the bound water or free water related values, that non-lin ear interpolation can be employed, if desired (e.g., in FIG. 13). Further, since tpl may be affected by residual hydrocarbons left in the formation near the borehole,
45
20 the indicated attenuation corresponding to free or bound water conditions may be slightly inaccurate. However, since both t,,[ and a will decrease due to hydrocarbon effects, there is some compensation in the indicated bound or free water saturations. When awfor ¢wawfis determined, the hydrocarbon effects will lower corresponding tp/ values and will produce slightly lower my values and hence, when applied in conductivity measurements, lower o'EMp values. Use of a dnmeasure ment (relatively independent of hydrocarbon effects) in place of tpl, in the technique illustrated in FIG. 13, may be advisable in some instances. The invention has been described with reference to
particular embodiments, but variations within the spirit and scope of the invention will occur to those skilled in the art. For example, while circuitry has been described for generating analog signals representative of the de sired quantities, it will be understood that a general purpose digital computer could readily be programmed to implement the techniques as set forth herein. Also, while conductivity values have been utilized for pur poses of illustration, it will be recognized that the in verses of values utilized herein could be employed in conjunction with. the inverse of conductivity; i.e., resis tivity.
I claim: 1. Apparatus for determining a composite parameter
of the formation water in formations surrounding a borehole, comprising:
means for deriving a ?rst quantity representative of said parameter attributable to the free water in said formations;
means for deriving a second quantity representative of the fraction of bound water in said formations;
means for deriving a third quantity representative of said parameter attributable to the bound water in said formations; and
means for determining said composite parameter as a function of said ?rst, second, and third quantities.
2. Apparatus as de?ned by claim 1 further comprising means for deriving a fourth quantity representative of the difference between said third and ?rst quantities.
3. Apparatus as de?ned by claim 2 wherein said pa rameter is determined as the sum of said ?rst quantity
‘ and the product of said second and fourth quantities.
50
65
4. Apparatus as de?ned by claim 1 wherein the pa rameter is the capture cross section.
5. Apparatus as de?ned by claim 2 wherein the pa rameter is the capture cross section.
6. Apparatus as de?ned by claim 3 wherein the pa rameter is the capture cross section.
7. Apparatus for determining the composite conduc tivity of the formationwater in formations surrounding a borehole, comprising: means for deriving a ?rst quantity representative of
the conductivity of the free water in_said forma tions;
means for deriving a second quantity representative of the fraction of bound water in said formations;
means forderiving a third quantity representative of the conductivity of the bound water in said forma tions; and ‘ .
means for determining said composite water conduc tivity as a function of said ?rst, second and third quantities.
4,233,839 21
8. Apparatus as de?ned by claim 7 further comprising means for deriving a fourth quantity representative of the difference between said third and ?rst quantities.
9. Apparatus as de?ned by claim 8 wherein said com posite water conductivity is determined as the sum of said ?rst quantity and the product of said second and fourth quantities.
10. Apparatus as de?ned by claim 7 further compris ing means for deriving a ?fth quantity representative of the fraction of free water in said formations, and wherein said composite water conductivity is deter mined as the sum of ?rst and second products, the ?rst product being said ?fth quantity times said ?rst quantity and the second product being said second quantity times said third quantity.
11. Apparatus as de?ned by claim 7 wherein said composite conductivity, o'wc', is determined as
where O'wflS the conductivity of the free water in said formations, (ml, is the conductivity of the bound water in said formations, SW1, is the bound water saturation in said formations, and S,,, is the water saturation in said formations.
12. Apparatus as de?ned by claim 7 wherein said composite conductivity is an apparent composite water conductivity, mm’, and is determined as
where O'wflS the conductivity of the free water in said formations, (TM, is the conductivity of the bound water in said formations, and SW1, is the bound water saturation in said formations. .
13. Apparatus as de?ned by claim 12 further compris ing means for determining a computed “wet” conduc tivity of said formations, 0-0’, as
where gb, is the total porosity of said formations. 14. Apparatus for determining the water saturation of
formations surrounding a borehole, comprising: means for deriving a ?rst quantity representative of
the conductivity of the free water in said forma tions;
means for deriving a second quantity representative of the fraction of bound water in said formations;
means for deriving a third quantity representative of the conductivity of the bound water in said forma tions;
means for deriving a quantity representative of the measured conductivity of the formations; and
means for determining the water saturation of the formations as a function of said ?rst, second and third quantities and said measured conductivity representative quantity.
15. Apparatus as de?ned by claim 14 further compris ing means for deriving a quantity representative of the porosity of said formations, and wherein said water saturation determination is also a function of said poros ity representative quantity. __
16. Apparatus as de?ned by "claim 15 wherein said means for determining water saturation comprises means responsive to said measured conductivity repre sentative quantity and said porosity representative quantity for deriving a quantity representative of the
15
20
25
30
35
45
22 apparent water conductivity of said formations, the water saturation determination then being a function of said ?rst, second, and third quantities and said apparent water conductivity representative quantity.
17. Apparatus as de?ned by claim 16 wherein said water saturation is determined as
S _ \l lSwb(°'wb '— o'w?]2 'l' ‘tan/(Tim _ Swb(0'wb _ a'wf) w _ 20wf
where O'wflS the conductivity of the free water in said formations, 0-,”, is the conductivity of the bound water in said formations, SW1, is the bound water saturation in said formations, and own’ is the apparent water conduc tivity of said formations.
18. Apparatus as de?ned by claim 14 wherein the determined water saturation is the water saturation of the invaded zone of said formations.
19. Apparatus as de?ned by claim 18 wherein said ?rst quantity is representative of the conductivity of the mud ?ltrate in the invaded zone of said formations.
20. Apparatus as de?ned by claim 19 wherein said quantity representative of measured conductivity is a conductivity as derived from a microwave electromag netic propagation logging device.
21. Apparatus as de?ned by claim 20 wherein said saturation of the invaded zone of said formation, Sm’, is determined as
where o'mfis the conductivity of the mud ?ltrate invad ing said ‘formations, o'wb is the conductivity of the bound water in said formations, SW1, is the bound water satura tion in said formations, 4), is the total porosity of said formations, and o'EMpis the conductivity of the invaded formation as determined by an microwave electromag netic propagation logging device.
22. A method for determining a composite parameter of the formation water in formations surrounding a borehole, comprising the steps of:
deriving a ?rst quantity representative of said param eter attributable to the free water in said forma tions;
deriving a second quantity representative of the frac tion of bound water in said formations;
deriving a third quantity representative of said pa rameter attributable to the bound water in said formations; and
determining said composite parameter as a function of said ?rst, second, and third quantities.
23. The method as de?ned by claim 22 further com prising the step of deriving a fourth quantity representa tive of the difference between said third and ?rst quanti ties.
24. The method as de?ned by claim 23 wherein said parameter is determined as the sum of said ?rst quantity and the product of said second and fourth quantities.
25. The method as de?ned by claim 22 wherein the parameter is the capture cross section.
26. The method as de?ned by claim 23 wherein the parameter is the capture cross section.
27. Apparatus as de?ned by claim 24 wherein the parameter is the capture cross section.
4,233,839 23
‘28. A method for determining the composite conduc tivity of the formation water in formations surrounding a borehole, comprising the steps of: Y '
deriving a ?rst quantity representative of the conduc tivity of the free water in said formations;
deriving a second quantity representative of the frac tion of bound water in said formations;
deriving a third quantity representative of the con ductivity of the bound water in said formations; and
determining said composite water conductivity as a function of said ?rst, second and third quantities.
29. The method as de?ned by claim 28 further com prising the step of deriving a fourth quantity representa tive of the difference between said third and ?rst ‘quanti ties. ' .
30. The method as de?ned by claim 29 wherein said composite water conductivity is determined as the sum - of said ?rst quantity and the product of said second and fourth quantities.
31. The method as de?ned by claim 28 further com prising means for deriving a ?fth quantity representa tive of the fraction of free water in said formations, and wherein said composite water conductivity is deter mined as the sum of ?rst and second products, the ?rst product being said ?fth quantity times said ?rst quantity and the second product being said 7 second quantity times said third quantity. ' '
32. The method as de?ned by claim 28 wherein said composite conductivity, o'wc’, is determined as
where O'wflS the conductivity of the free water in'said formations, owl, is the conductivity of the bound water in said formations, SW1, is the bound water saturation in said formations, and 8,, is the water saturation in said formations.
33. The method as de?ned by claim 28 wherein said composite conductivity is an apparent composite water conductivity, (rwm’, and is determined as ' ‘
where o-wfis the conductivity of the free water in said formations, crwb is the conductivity of the bound water in said formations, and SW1, is the bound water saturation in said formations. '
34. The method as de?ned by claim 33 further com prising the step of determining a computed “wet” con ductivity of said formations, 0'0’, as '
where ¢~, is the total porosity of said formations. 35. A method for determining the water saturation of
formations surrounding a borehole, comprising the steps of:
deriving a ?rst quantity representative of the conduc tivity of the free water in said formations;
deriving a second quantity representative of the frac tion of bound water in said formations; '
deriving a third quantity representative of the con ductivity of the bound water in said formations;
deriving a quantity representative of the measured conductivity of the formations; and
determining the water saturation of the formations as a function of said ?rst, second and third quantities
3O
40
45
24 and ‘said measured conductivity representative quantity.
36. The method as de?ned by claim 35 further com prising the step of deriving a quantity representative of the porosity of said formations, and wherein said water saturation determination is also a function of said poros
-ity representative quantity. 37. The method as de?ned by claim 36 wherein said
step of determining water saturation comprises deriving a quantity representative of the apparent water conduc tivity of said formations in response to said measured conductivity representative quantity and said porosity representative quantity, the water saturation determina tion then being a function of said ?rst, second, and third quantities and said apparent water conductivity repre sentative quantity.
38. The method as‘de?ned by claim 37 wherein said water saturation is determined as
where O‘wflS the conductivity of the free water in said formations, o'wb is the conductivity of the bound water in said formations, SW1, is the bound water saturation in said formations, and mm’ is the apparent water conduc tivity of said formations.
39. The method as de?ned by claim 35 wherein the determined water saturation is the water saturation of the invaded zone of said formations.
40. The method as de?ned by claim 39 wherein said ?rst quantity is representative of the conductivity of the mud ?ltrate in. the invaded zone of said formations.
41. The method as de?ned by claim 40 wherein said quantity representative of measured conductivity is a conductivity as derived from a microwave electromag netic propagation logging device.
42. The method as defined by claim 41 wherein said saturation of the invaded zone of said formation, Sm’, is determined as
\ where o'mfis the conductivity of the mud ?ltrate invad
55
65
ing said formations, (TM, is the conductivity of the bound water in said formations, Swb is the bound water satura tion in said formations, d), is the total porosity of said formations, and (TEMP is the conductivity of the invaded formation as determined by an microwave electromag netic propagation logging device.
43. Apparatus for determining a free water variable of formations surrounding a borehole, comprising: means for deriving a function representative of said
variable in at least one region of said formations in which substantially all of the water present is free water;
means for deriving a quantity representative of water content in said formations; and
means for determining said free water variable from vsaid function and said quantity.
44. Apparatus as de?ned by claim 43 wherein said quantity representative of water content is derived from at least one measurement taken in the formations sur rounding a particular depth location in said borehole.