Embed Size (px)
Citation preview

APPENDICES
GRI Standards Index 95
Sustainability Performance 88
Independent Assurance Statement 98
GHG Verification Statement 100
Previous Sustainability Reports 101
Financial Performance 86

SAMSUNG SDI Sustainability Report 2019
APPENDICES86 87Financial Performance
Financial Performance
Consolidated Statements of Financial Position Consolidated Statement of Comprehensive Income
Item End of 50th End of 49th End of 48th
Assets
Current assets 5,181,414,896,890 5,519,342,209,666 3,584,576,077,532
Cash and cash equivalents 1,156,295,420,684 1,516,585,546,977 1,209,015,663,790
Account receivables and other receivables 2,015,345,598,328 1,851,185,858,690 1,230,256,403,435
Inventories 1,707,920,528,827 1,745,650,833,399 966,571,644,365
Other investments 147,307,932,765 150,531,067,707 113,795,179,915
Other current assets 154,545,416,286 198,560,107,177 64,937,186,027
Non-current assets held for sale - 56,828,795,716 -
Non-current assets 14,670,681,551,114 13,830,378,974,263 12,157,129,300,725
Account receivables and other receivables 27,812,097,927 23,168,938,800 3,379,614,318
Investments in associates 6,763,177,128,524 6,554,633,768,115 6,219,349,912,456
Property, plant and equipment 5,426,843,174,367 4,608,333,985,853 2,930,339,325,646
Intangible assets 831,370,661,521 866,271,119,300 897,447,247,322
Investment property 153,656,745,607 149,725,014,028 149,914,778,172
Deferred tax assets 85,799,169,237 51,799,609,019 41,407,873,779
Other investments 1,268,769,438,700 1,495,631,279,112 1,785,846,776,491
Other non-current assets 113,253,135,231 80,815,260,036 129,443,772,541
Total assets 19,852,096,448,004 19,349,721,183,929 15,741,705,378,257
Liabilities
Current liabilities 3,741,522,650,216 4,012,822,498,262 2,664,061,476,102
Account payables and other payables 1,835,800,150,659 2,145,075,054,015 1,485,918,600,167
Income taxes payable 72,873,576,031 35,623,226,493 20,807,947,629
Advance received 60,860,323,805 69,598,588,790 44,172,530,214
Unearned revenue 5,513,614,118 6,304,689,548 33,857,200,178
Short-term borrowings 1,766,474,985,603 1,739,389,710,470 1,079,305,197,914
Derivative liabilities - 15,202,782,348 -
Non-current liabilities held for sale - 1,628,446,598 -
Non-current liabilities 3,450,228,602,652 3,111,679,469,477 1,625,644,404,713
Account payables and other payables 338,467,511,795 291,312,664,392 181,119,003,713
Long-term unearned revenue 5,259,529,488 27,083,906,195 44,139,747,984
Long-term borrowings 1,801,994,890,105 1,514,282,000,856 345,303,351,571
Employee benefit liabilities 61,489,160,231 70,146,754,408 25,621,629,290
Derivative liabilities 2,420,075,456 29,866,610,049 20,220,577,592
Deferred tax liabilities 1,240,597,435,577 1,178,987,533,577 1,009,240,094,563
Total liabilities 7,191,751,252,868 7,124,501,967,739 4,289,705,880,815
Total shareholders’ equity
Equity attributable to owners of the Parent Company 12,324,936,720,467 11,934,022,744,253 11,257,301,680,704
Capital stock 356,712,130,000 356,712,130,000 356,712,130,000
Capital surplus 5,001,974,693,202 5,037,936,783,944 5,042,698,139,239
Other capital items -345,131,583,767 -345,131,583,767 -345,131,583,767
Accumulated other comprehensive income 404,513,003,532 271,989,660,350 602,435,774,875
Retained earnings 6,906,868,477,500 6,612,515,753,726 5,600,587,220,357
Non-controlling interests 335,408,474,669 291,196,471,937 194,697,816,738
Total stockholders’ equity 12,660,345,195,136 12,225,219,216,190 11,451,999,497,442
Total liabilities and equity 19,852,096,448,004 19,349,721,183,929 15,741,705,378,257
Item End of 50th End of 49th End of 48th
Revenue 10,097,426,164,132 9,158,272,454,945 6,346,606,593,493
Cost of sales 7,882,255,450,606 7,118,188,528,425 5,180,761,473,455
Gross profit 2,215,170,713,526 2,040,083,926,520 1,165,845,120,038
Selling, general and administrative expenses 1,752,994,251,257 1,325,113,320,369 1,048,950,333,520
Operating income 462,176,462,269 714,970,606,151 116,894,786,518
Other income 82,720,339,943 127,102,697,630 196,226,647,012
Other expenses 89,624,717,352 193,470,665,337 183,023,147,146
Finance income 314,411,076,884 384,164,315,917 250,012,082,221
Finance costs 383,670,661,559 338,715,140,922 251,450,264,219
Share of profit of equity accounted investees 178,629,731,183 342,181,823,994 695,404,774,170
Profit before income taxes 564,642,231,368 1,036,233,637,433 824,064,878,556
Income tax expenses 162,275,801,799 291,184,451,986 180,871,015,592
Profit for the year 402,366,429,569 745,049,185,447 643,193,862,964
Other comprehensive income 138,715,909,426 51,278,320,541 -6,154,449,821
Items that will never be reclassified to profit or loss 36,230,016,544 36,023,582,593 16,421,113,526
Remeasurements of defined benefit liability 5,897,603,445 -29,815,080,893 21,529,601,753
Unrealized net changes in fair value of FVOCI financial assets 41,532,379,368 77,282,456,975 -
Related tax -11,199,966,269 -11,443,793,489 -5,108,488,227
Items that are or may be reclassified to profit or loss 102,485,892,882 15,254,737,948 -22,575,563,347
Gain/Loss on valuation of available-for-sale financial assets - - 171,461,576,116
Change in equity of equity-method accounted investees 21,850,440,243 -6,897,968,336 -1,625,771,441
Effective portion of unrealized changes in fair values of cash flow hedges 28,819,436,259 -25,658,003,955 -
Change in gain on translation of foreign operations 60,421,135,318 39,557,923,656 -156,923,295,181
Related tax -8,605,118,938 8,252,786,583 -35,488,072,841
Total comprehensive income 541,082,338,995 796,327,505,988 637,039,413,143
Profit attributable to: Owners of the Parent Company 356,548,860,592 701,166,336,925 657,236,340,934
Non-controlling interests 45,817,568,977 43,882,848,522 -14,042,477,970
Total comprehensive income attributable to:
Owners of the Parent Company 493,820,676,756 748,427,028,644 685,105,833,682
Non-controlling interests 47,261,662,239 47,900,477,344 -48,066,420,539
Earnings per share
Ordinary share - Basic earnings per share (unit: KRW) 5,331 10,484 9,824
Preferred share – Basic earnings per share (unit: KRW) 5,381 10,534 9,874
50th as of Dec. 31, 2019 49th as of Dec. 31, 2018 48th as of Dec. 31, 2017
(unit: KRW)
50th as of Dec. 31, 2019 49th as of Dec. 31, 2018 48th as of Dec. 31, 2017
(unit: KRW)
Category 50th 49th 48th
Energy Solution 77,193 69,542 43,324
Electronic Materials 23,781 22,041 20,142
Total 100,974 91,583 63,466
Sales by Business Division (on a consolidated basis, unit: KRW 100 million)
SAMSUNG SDI Sustainability Report 2019
APPENDICES88 89Sustainability Performance
Sustainability Performance
Economic Performance
Production
Category Unit 2017 2018 2019
Energy Solution Small-sized battery Million 1,158 1,514 1,505
Electronic Materials EMC Ton 6,236 6,341 4,085
Polarizing film 1,000 m2 66,046 84,874 91,055
GHG Emissions
Category Unit 2017 2018 2019
Total emissions tCO2e 919,382 1,129,564 1,275,165
Direct/indirect emissions
Direct emissions tCO2e 143,581 154,704 162,873
Indirect emissions tCO2e 775,801 974,860 1,112,292
Direct/indirect emission intensity tCO2e/KRW 100 million 14.49 12.33 12.63
Other emissions Employees’ business travel tCO2e 4,331 4,385 5,529
Product transport tCO2e 516 562 574
By region Domestic tCO2e 438,399 511,379 536,928
Overseas tCO2e 480,983 618,185 738,237
By business division
Battery Business tCO2e 467,140 566,356 667,370
Automotive & ESS Business tCO2e 221,133 331,027 371,585
Electronic Materials Business tCO2e 197,008 189,661 190,291
R&D and others tCO2e 34,101 42,520 45,919
Environmental Performance
Energy Consumption
Category Unit 2017 2018 2019
Company-wide consumption TJ 14,988 18,947 21,297
- Domestic consumption TJ 8,609 10,509 11,145
- Overseas consumption TJ 6,379 8,438 10,152
Company-wide consumption intensity TJ/KRW 100 million 0.24 0.21 0.21
Water Resources Consumption
Category Unit 2017 2018 2019
Company-wide consumption Kiloton 6,408 7,927 7,385
- Domestic consumption Kiloton 3,484 3,485 3,370
- Overseas consumption Kiloton 2,924 4,442 4,015
Company-wide consumption intensity Kiloton/KRW 100 million 0.10 0.09 0.07
Effluent Discharge
Category Unit 2017 2018 2019
Company-wide discharge Kiloton 3,020 3,465 3,269
- Domestic discharge Kiloton 1,960 2,324 2,113
- Overseas discharge Kiloton 1,060 1,141 1,156
Company-wide discharge intensity Kiloton/KRW 100 million 0.05 0.04 0.03
Waste Treatment in 2019
Category Unit 2019
Incineration Ton 17,797
Landfill Ton 2,534
Recycling Ton 105,223
Total Ton 125,554
Waste Generation and Recycling
Category Unit 2017 2018 2019
Company-wide generation Ton 72,730 106,712 123,422
- Domestic generation Ton 46,705 68,746 58,246
- Overseas generation Ton 26,025 37,966 65,176
Company-wide generation intensity Ton/KRW 100 million 1.15 1.17 1.22
Generation of designated waste Ton 25,225 39,682 55,512
Domestic Recycling % 99 93.3 92.7
Landfill % 1 6.7 7.3
Overseas Recycling % 92 92.9 85.1
Landfill % 8 7.1 14.9
Generation of Pollutants (domestic)
Category Unit 2017 2018 2019
Water pollutant discharge intensity
BOD kg/KRW 100 million 0.12 0.06 0.08
COD kg/KRW 100 million 0.41 0.20 0.16
SS kg/KRW 100 million 0.36 0.24 0.23
Air pollutant emission intensity
NOx kg/KRW 100 million 0.14 0.21 0.24
SOx kg/KRW 100 million 0.02 0.11 0.08
Dust kg/KRW 100 million 0.09 0.19 0.20
Ozone depleting substances
Company-wide emissions kgCFC11eq 52.5 352.6 379.1
- Domestic emissions kgCFC11eq 52.2 239.5 235.2
- Overseas emissions kgCFC11eq 0.3 113.1 143.9
Company-wide emission intensity kgCFC11eq/KRW 100 million 0.001 0.004 0.004
Taxes Paid by Country and Continent
Category Unit 2017 2018 2019
Korea KRW 8,824,497,593 141,334,370,420 16,712,913,854
Japan KRW 290,658,958 296,685,442 419,806,405
Americas and Europe KRW 12,894,296,835 28,867,605,982 25,575,647,189
China and Southeast Asia KRW 7,728,617,834 38,368,707,784 18,667,713,476
Latin America KRW 73,937,862 4,338,053,536 30,445,256
Hong Kong KRW 1,306,399,754 2,059,600,327 1,866,373,510
Samsung SDI complies with tax laws in countries where it operates and faithfully fulfills its tax filing and payment obligations. We assess tax risks from multiple aspects, and review our global worksites and respective business partners to prevent tax-related risks. To respond to regulations intended to prevent tax avoidance and tax evasion, we constantly monitor how tax authorities respond at the country and regional level and reflect their responses in our tax policy.
Market Share
Category Unit 2017 2018 2019
Energy Solution
Small-sized battery* % 19 19 19
- Cylindrical % 22 24 25
- Prismatic % 24 20 15
- Polymer % 14 12 10
Automotive battery* % 7 5 5
ESS** % 35 46 29
Electronic Materials EMC*** % 7 6 7
Source: * B3 Annual Report, ** SNE research , *** Samsung SDI forecasts
Hazardous Chemicals Consumption
Category Unit 2017 2018 2019
Company-wide consumption Ton 26,097 47,103 70,043
- Domestic consumption Ton 24,228 41,338 41,040
- Overseas consumption Ton 1,869 5,764 29,004
Company-wide consumption intensity Ton/KRW 100 million 0.41 0.51 0.69
Annotations on Environmental Performance* The scope of data collection includes all production facilities in Korea and abroad, the Headquarters, and the R&D Center, excluding sales bases and offices (including those production facilities only that have production records for 2019). * Intensity figures were calculated based on consolidated sales. * Hazardous chemicals data was based on the substances regulated by Korea’s Hazardous Chemicals Control Act.
SAMSUNG SDI Sustainability Report 2019
APPENDICES90 91
Sustainability Performance
Social Performance
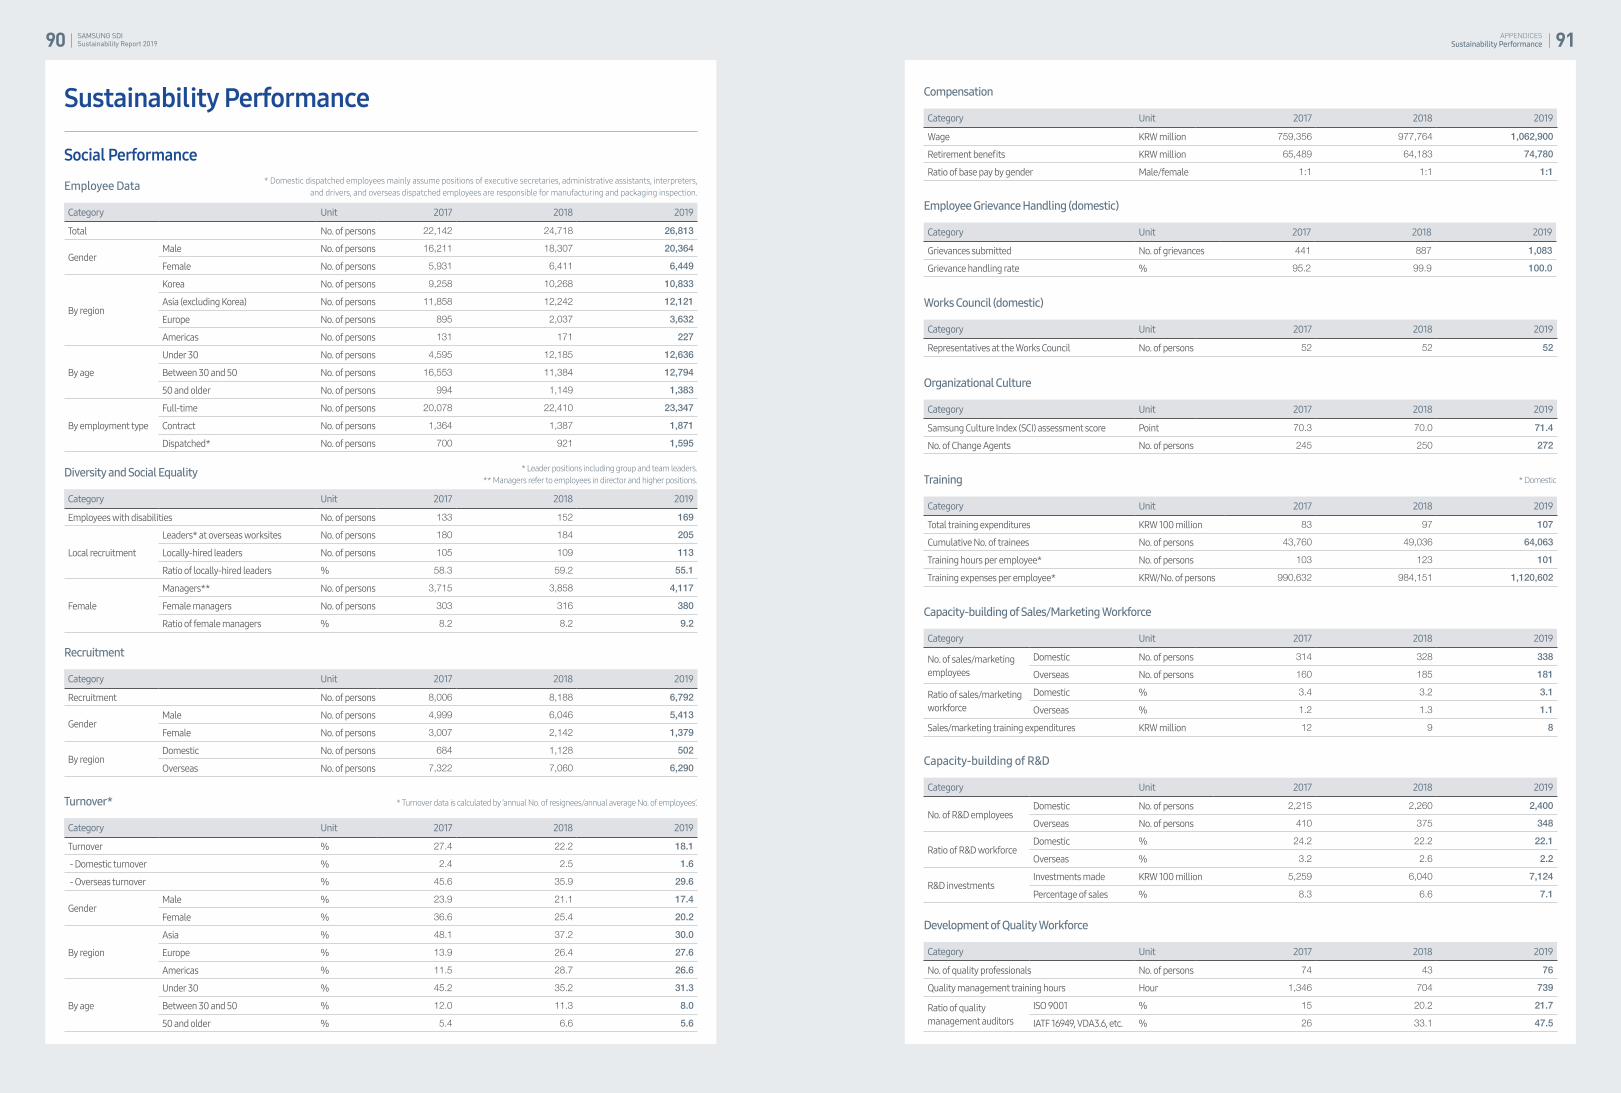
Compensation
Category Unit 2017 2018 2019
Wage KRW million 759,356 977,764 1,062,900
Retirement benefits KRW million 65,489 64,183 74,780
Ratio of base pay by gender Male/female 1:1 1:1 1:1
Capacity-building of Sales/Marketing Workforce
Category Unit 2017 2018 2019
No. of sales/marketing employees
Domestic No. of persons 314 328 338
Overseas No. of persons 160 185 181
Ratio of sales/marketing workforce
Domestic % 3.4 3.2 3.1
Overseas % 1.2 1.3 1.1
Sales/marketing training expenditures KRW million 12 9 8
Capacity-building of R&D
Category Unit 2017 2018 2019
No. of R&D employees Domestic No. of persons 2,215 2,260 2,400
Overseas No. of persons 410 375 348
Ratio of R&D workforce Domestic % 24.2 22.2 22.1
Overseas % 3.2 2.6 2.2
R&D investments Investments made KRW 100 million 5,259 6,040 7,124
Percentage of sales % 8.3 6.6 7.1
Development of Quality Workforce
Category Unit 2017 2018 2019
No. of quality professionals No. of persons 74 43 76
Quality management training hours Hour 1,346 704 739
Ratio of quality management auditors
ISO 9001 % 15 20.2 21.7
IATF 16949, VDA3.6, etc. % 26 33.1 47.5
Diversity and Social Equality
Category Unit 2017 2018 2019
Employees with disabilities No. of persons 133 152 169
Local recruitment
Leaders* at overseas worksites No. of persons 180 184 205
Locally-hired leaders No. of persons 105 109 113
Ratio of locally-hired leaders % 58.3 59.2 55.1
Female
Managers** No. of persons 3,715 3,858 4,117
Female managers No. of persons 303 316 380
Ratio of female managers % 8.2 8.2 9.2
Recruitment
Category Unit 2017 2018 2019
Recruitment No. of persons 8,006 8,188 6,792
Gender Male No. of persons 4,999 6,046 5,413
Female No. of persons 3,007 2,142 1,379
By region Domestic No. of persons 684 1,128 502
Overseas No. of persons 7,322 7,060 6,290
Employee Data
Category Unit 2017 2018 2019
Total No. of persons 22,142 24,718 26,813
Gender Male No. of persons 16,211 18,307 20,364
Female No. of persons 5,931 6,411 6,449
By region
Korea No. of persons 9,258 10,268 10,833
Asia (excluding Korea) No. of persons 11,858 12,242 12,121
Europe No. of persons 895 2,037 3,632
Americas No. of persons 131 171 227
By age
Under 30 No. of persons 4,595 12,185 12,636
Between 30 and 50 No. of persons 16,553 11,384 12,794
50 and older No. of persons 994 1,149 1,383
By employment type
Full-time No. of persons 20,078 22,410 23,347
Contract No. of persons 1,364 1,387 1,871
Dispatched* No. of persons 700 921 1,595
* Domestic dispatched employees mainly assume positions of executive secretaries, administrative assistants, interpreters, and drivers, and overseas dispatched employees are responsible for manufacturing and packaging inspection.
Turnover*
Category Unit 2017 2018 2019
Turnover % 27.4 22.2 18.1
- Domestic turnover % 2.4 2.5 1.6
- Overseas turnover % 45.6 35.9 29.6
Gender Male % 23.9 21.1 17.4
Female % 36.6 25.4 20.2
By region
Asia % 48.1 37.2 30.0
Europe % 13.9 26.4 27.6
Americas % 11.5 28.7 26.6
By age
Under 30 % 45.2 35.2 31.3
Between 30 and 50 % 12.0 11.3 8.0
50 and older % 5.4 6.6 5.6
* Turnover data is calculated by ‘annual No. of resignees/annual average No. of employees’.
* Leader positions including group and team leaders.** Managers refer to employees in director and higher positions.
Employee Grievance Handling (domestic)
Category Unit 2017 2018 2019
Grievances submitted No. of grievances 441 887 1,083
Grievance handling rate % 95.2 99.9 100.0
Works Council (domestic)
Category Unit 2017 2018 2019
Representatives at the Works Council No. of persons 52 52 52
Organizational Culture
Category Unit 2017 2018 2019
Samsung Culture Index (SCI) assessment score Point 70.3 70.0 71.4
No. of Change Agents No. of persons 245 250 272
Sustainability Performance
Training
Category Unit 2017 2018 2019
Total training expenditures KRW 100 million 83 97 107
Cumulative No. of trainees No. of persons 43,760 49,036 64,063
Training hours per employee* No. of persons 103 123 101
Training expenses per employee* KRW/No. of persons 990,632 984,151 1,120,602
* Domestic
SAMSUNG SDI Sustainability Report 2019
APPENDICES92 93
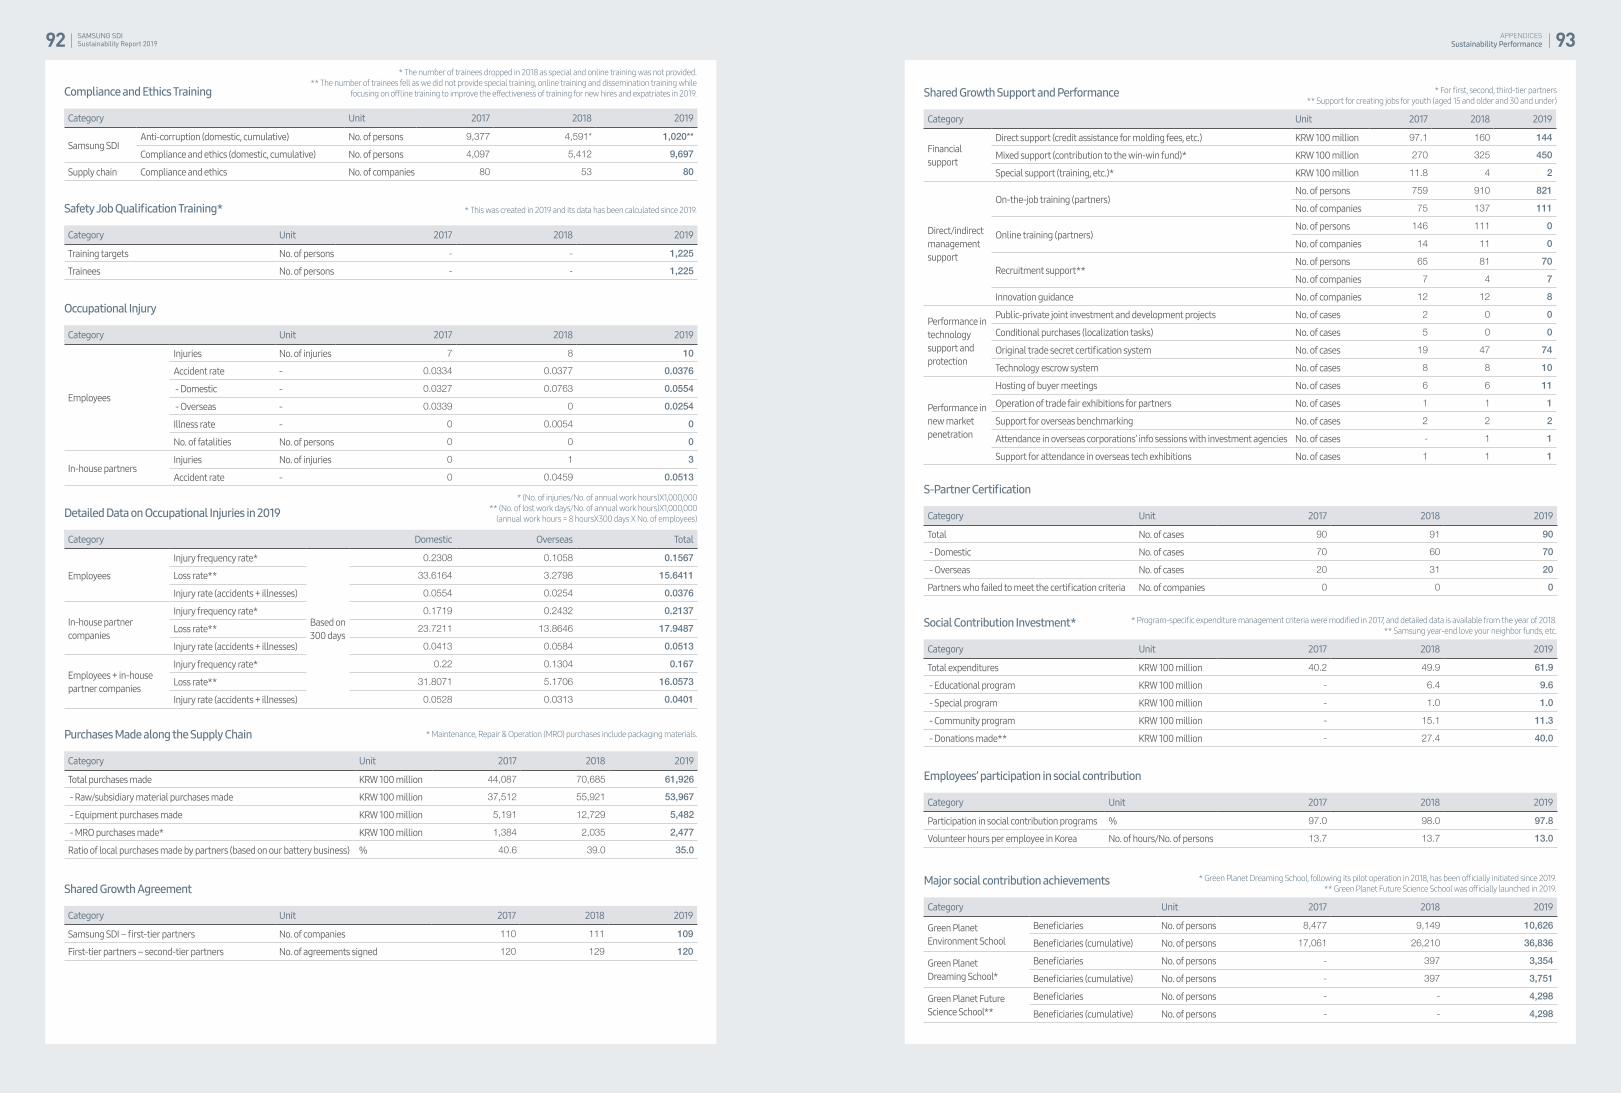
Shared Growth Support and Performance
Category Unit 2017 2018 2019
Financial support
Direct support (credit assistance for molding fees, etc.) KRW 100 million 97.1 160 144
Mixed support (contribution to the win-win fund)* KRW 100 million 270 325 450
Special support (training, etc.)* KRW 100 million 11.8 4 2
Direct/indirect management support
On-the-job training (partners) No. of persons 759 910 821
No. of companies 75 137 111
Online training (partners) No. of persons 146 111 0
No. of companies 14 11 0
Recruitment support**No. of persons 65 81 70
No. of companies 7 4 7
Innovation guidance No. of companies 12 12 8
Performance in technology support and protection
Public-private joint investment and development projects No. of cases 2 0 0
Conditional purchases (localization tasks) No. of cases 5 0 0
Original trade secret certification system No. of cases 19 47 74
Technology escrow system No. of cases 8 8 10
Performance in new market penetration
Hosting of buyer meetings No. of cases 6 6 11
Operation of trade fair exhibitions for partners No. of cases 1 1 1
Support for overseas benchmarking No. of cases 2 2 2
Attendance in overseas corporations’ info sessions with investment agencies No. of cases - 1 1
Support for attendance in overseas tech exhibitions No. of cases 1 1 1
* For first, second, third-tier partners** Support for creating jobs for youth (aged 15 and older and 30 and under)
Employees’ participation in social contribution
Category Unit 2017 2018 2019
Participation in social contribution programs % 97.0 98.0 97.8
Volunteer hours per employee in Korea No. of hours/No. of persons 13.7 13.7 13.0
Shared Growth Agreement
Category Unit 2017 2018 2019
Samsung SDI – first-tier partners No. of companies 110 111 109
First-tier partners – second-tier partners No. of agreements signed 120 129 120
S-Partner Certification
Category Unit 2017 2018 2019
Total No. of cases 90 91 90
- Domestic No. of cases 70 60 70
- Overseas No. of cases 20 31 20
Partners who failed to meet the certification criteria No. of companies 0 0 0
Social Contribution Investment*
Category Unit 2017 2018 2019
Total expenditures KRW 100 million 40.2 49.9 61.9
- Educational program KRW 100 million - 6.4 9.6
- Special program KRW 100 million - 1.0 1.0
- Community program KRW 100 million - 15.1 11.3
- Donations made** KRW 100 million - 27.4 40.0
* Program-specific expenditure management criteria were modified in 2017, and detailed data is available from the year of 2018.** Samsung year-end love your neighbor funds, etc.
Purchases Made along the Supply Chain
Category Unit 2017 2018 2019
Total purchases made KRW 100 million 44,087 70,685 61,926
- Raw/subsidiary material purchases made KRW 100 million 37,512 55,921 53,967
- Equipment purchases made KRW 100 million 5,191 12,729 5,482
- MRO purchases made* KRW 100 million 1,384 2,035 2,477
Ratio of local purchases made by partners (based on our battery business) % 40.6 39.0 35.0
* Maintenance, Repair & Operation (MRO) purchases include packaging materials.
Sustainability Performance
Compliance and Ethics Training
Category Unit 2017 2018 2019
Samsung SDI Anti-corruption (domestic, cumulative) No. of persons 9,377 4,591* 1,020**
Compliance and ethics (domestic, cumulative) No. of persons 4,097 5,412 9,697
Supply chain Compliance and ethics No. of companies 80 53 80
* The number of trainees dropped in 2018 as special and online training was not provided. ** The number of trainees fell as we did not provide special training, online training and dissemination training while
focusing on offline training to improve the effectiveness of training for new hires and expatriates in 2019.
Occupational Injury
Category Unit 2017 2018 2019
Employees
Injuries No. of injuries 7 8 10
Accident rate - 0.0334 0.0377 0.0376
- Domestic - 0.0327 0.0763 0.0554
- Overseas - 0.0339 0 0.0254
Illness rate - 0 0.0054 0
No. of fatalities No. of persons 0 0 0
In-house partners Injuries No. of injuries 0 1 3
Accident rate - 0 0.0459 0.0513
Detailed Data on Occupational Injuries in 2019
Category Domestic Overseas Total
Employees
Injury frequency rate*
Based on 300 days
0.2308 0.1058 0.1567
Loss rate** 33.6164 3.2798 15.6411
Injury rate (accidents + illnesses) 0.0554 0.0254 0.0376
In-house partner companies
Injury frequency rate* 0.1719 0.2432 0.2137
Loss rate** 23.7211 13.8646 17.9487
Injury rate (accidents + illnesses) 0.0413 0.0584 0.0513
Employees + in-house partner companies
Injury frequency rate* 0.22 0.1304 0.167
Loss rate** 31.8071 5.1706 16.0573
Injury rate (accidents + illnesses) 0.0528 0.0313 0.0401
Safety Job Qualification Training*
Category Unit 2017 2018 2019
Training targets No. of persons - - 1,225
Trainees No. of persons - - 1,225
* This was created in 2019 and its data has been calculated since 2019.
Major social contribution achievements
Category Unit 2017 2018 2019
Green Planet Environment School
Beneficiaries No. of persons 8,477 9,149 10,626
Beneficiaries (cumulative) No. of persons 17,061 26,210 36,836
Green Planet Dreaming School*
Beneficiaries No. of persons - 397 3,354
Beneficiaries (cumulative) No. of persons - 397 3,751
Green Planet Future Science School**
Beneficiaries No. of persons - - 4,298
Beneficiaries (cumulative) No. of persons - - 4,298
* Green Planet Dreaming School, following its pilot operation in 2018, has been officially initiated since 2019. ** Green Planet Future Science School was officially launched in 2019.
* (No. of injuries/No. of annual work hours)X1,000,000 ** (No. of lost work days/No. of annual work hours)X1,000,000
(annual work hours = 8 hoursX300 days X No. of employees)
SAMSUNG SDI Sustainability Report 2019
APPENDICES94 95Sustainability Performance / GRI Standards Index
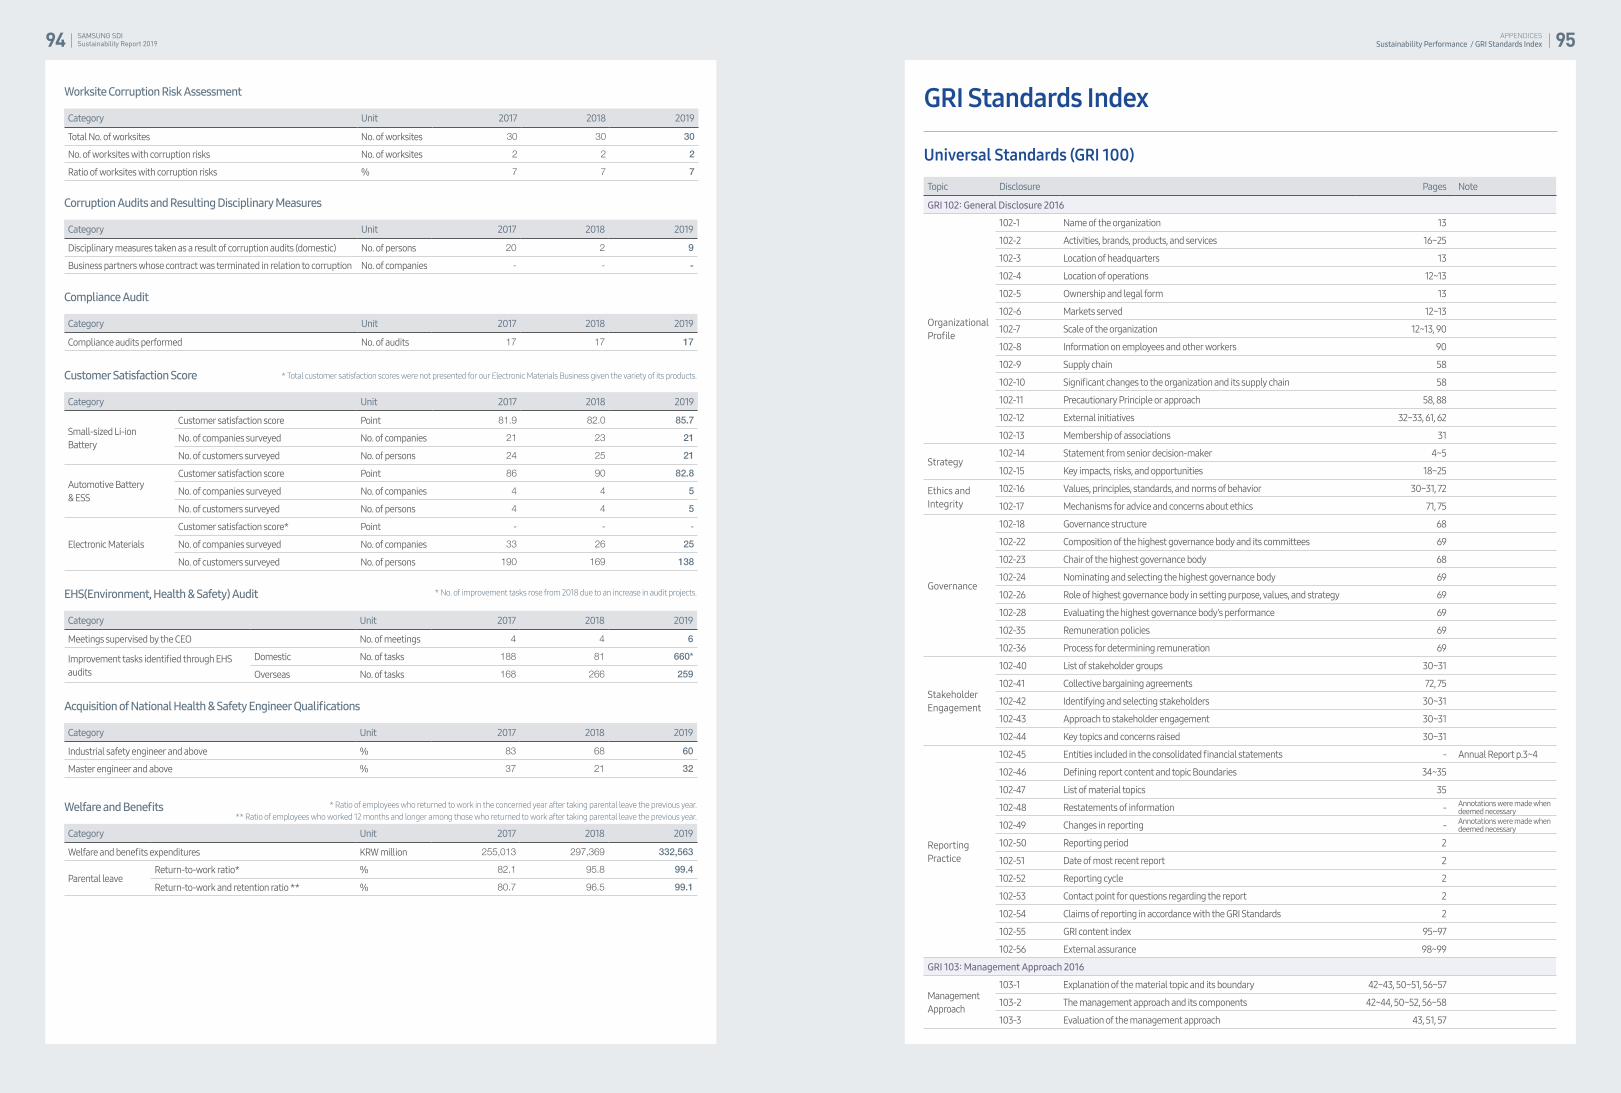
GRI Standards Index
Universal Standards (GRI 100)
Topic Disclosure Pages Note
GRI 102: General Disclosure 2016
Organizational Profile
102-1 Name of the organization 13
102-2 Activities, brands, products, and services 16~25
102-3 Location of headquarters 13
102-4 Location of operations 12~13
102-5 Ownership and legal form 13
102-6 Markets served 12~13
102-7 Scale of the organization 12~13, 90
102-8 Information on employees and other workers 90
102-9 Supply chain 58
102-10 Significant changes to the organization and its supply chain 58
102-11 Precautionary Principle or approach 58, 88
102-12 External initiatives 32~33, 61, 62
102-13 Membership of associations 31
Strategy102-14 Statement from senior decision-maker 4~5
102-15 Key impacts, risks, and opportunities 18~25
Ethics and Integrity
102-16 Values, principles, standards, and norms of behavior 30~31, 72
102-17 Mechanisms for advice and concerns about ethics 71, 75
Governance
102-18 Governance structure 68
102-22 Composition of the highest governance body and its committees 69
102-23 Chair of the highest governance body 68
102-24 Nominating and selecting the highest governance body 69
102-26 Role of highest governance body in setting purpose, values, and strategy 69
102-28 Evaluating the highest governance body’s performance 69
102-35 Remuneration policies 69
102-36 Process for determining remuneration 69
Stakeholder Engagement
102-40 List of stakeholder groups 30~31
102-41 Collective bargaining agreements 72, 75
102-42 Identifying and selecting stakeholders 30~31
102-43 Approach to stakeholder engagement 30~31
102-44 Key topics and concerns raised 30~31
Reporting Practice
102-45 Entities included in the consolidated financial statements - Annual Report p.3~4
102-46 Defining report content and topic Boundaries 34~35
102-47 List of material topics 35
102-48 Restatements of information - Annotations were made when deemed necessary
102-49 Changes in reporting - Annotations were made when deemed necessary
102-50 Reporting period 2
102-51 Date of most recent report 2
102-52 Reporting cycle 2
102-53 Contact point for questions regarding the report 2
102-54 Claims of reporting in accordance with the GRI Standards 2
102-55 GRI content index 95~97
102-56 External assurance 98~99
GRI 103: Management Approach 2016
Management Approach
103-1 Explanation of the material topic and its boundary 42~43, 50~51, 56~57
103-2 The management approach and its components 42~44, 50~52, 56~58
103-3 Evaluation of the management approach 43, 51, 57
Worksite Corruption Risk Assessment
Category Unit 2017 2018 2019
Total No. of worksites No. of worksites 30 30 30
No. of worksites with corruption risks No. of worksites 2 2 2
Ratio of worksites with corruption risks % 7 7 7
Corruption Audits and Resulting Disciplinary Measures
Category Unit 2017 2018 2019
Disciplinary measures taken as a result of corruption audits (domestic) No. of persons 20 2 9
Business partners whose contract was terminated in relation to corruption No. of companies - - -
Compliance Audit
Category Unit 2017 2018 2019
Compliance audits performed No. of audits 17 17 17
Acquisition of National Health & Safety Engineer Qualifications
Category Unit 2017 2018 2019
Industrial safety engineer and above % 83 68 60
Master engineer and above % 37 21 32
Welfare and Benefits
Category Unit 2017 2018 2019
Welfare and benefits expenditures KRW million 255,013 297,369 332,563
Parental leave Return-to-work ratio* % 82.1 95.8 99.4
Return-to-work and retention ratio ** % 80.7 96.5 99.1
EHS(Environment, Health & Safety) Audit
Category Unit 2017 2018 2019
Meetings supervised by the CEO No. of meetings 4 4 6
Improvement tasks identified through EHS audits
Domestic No. of tasks 188 81 660*
Overseas No. of tasks 168 266 259
Customer Satisfaction Score
Category Unit 2017 2018 2019
Small-sized Li-ion Battery
Customer satisfaction score Point 81.9 82.0 85.7
No. of companies surveyed No. of companies 21 23 21
No. of customers surveyed No. of persons 24 25 21
Automotive Battery& ESS
Customer satisfaction score Point 86 90 82.8
No. of companies surveyed No. of companies 4 4 5
No. of customers surveyed No. of persons 4 4 5
Electronic Materials
Customer satisfaction score* Point - - -
No. of companies surveyed No. of companies 33 26 25
No. of customers surveyed No. of persons 190 169 138
* Total customer satisfaction scores were not presented for our Electronic Materials Business given the variety of its products.
* Ratio of employees who returned to work in the concerned year after taking parental leave the previous year. ** Ratio of employees who worked 12 months and longer among those who returned to work after taking parental leave the previous year.
* No. of improvement tasks rose from 2018 due to an increase in audit projects.

SAMSUNG SDI Sustainability Report 2019
APPENDICES96 97GRI Standards Index
Social Performance (GRI 400)
Topic Disclosure Pages Note
GRI 401: Employment 2016
401-1 New employee hires and employee turnover 90
401-2Benefits provided to full-time employees that are not provided to temporary or part-time employees
75
401-3 Parental leave 94
GRI 402: Labor/Management Relations 2016
402-1 Minimum notice periods regarding operational changes 75
GRI 403: OccupationalHealth and Safety 2018
403-1 Occupational health and safety management system 78
403-2 Hazard identification, risk assessment, and incident investigation 78~81
403-5 Worker training on occupational health and safety 80, 92
403-6 Promotion of worker health 81
403-9 Work-related injuries 92
403-10 Work-related ill health 92
GRI 404: Training and Education 2016
404-1 Average hours of training per year per employee 91
404-2Programs for upgrading employee skills and transition assistance programs
73~74
GRI 405: Diversity and Equal Opportunity 2016
405-1 Diversity of governance bodies and employees 68~69
405-2 Ratio of basic salary and remuneration of women to men 91
GRI 406: Non-discrimination 2016
406-1 Incidents of discrimination and corrective actions taken -no such case
GRI 412: Human Rights Assessment 2016
412-1Operations that have been subject to human rights reviews or impact assessments
72
412-2 Employee training on human rights policies or procedures 72
GRI 413: Local Communities 2016
413-1Operations with local community engagement, impact assessments, and development programs
76~77
GRI 414: Supplier Social Assessment 2016
414-1 New suppliers that were screened using social criteria 60
414-2 Negative social impacts in the supply chain and actions taken 60
GRI 415: Public Policy 2016
415-1 Political contributions -
No political donations were made in accordance with Article 31 of the Political Fund Act.
GRI 416: Customer Health and Safety 2016
416-1Assessment of the health and safety impacts of product and service categories
52~53
416-2Incidents of non-compliance concerning the health and safety impacts of products and services
- no such case
GRI 417: Marketing and Labeling 2016
417-2Incidents of non-compliance concerning product and service information and labeling
- no such case
417-3 Incidents of non-compliance concerning marketing communications - no such case
GRI 418: Customer Privacy 2016
418-1Substantiated complaints concerning breaches of customer privacy and losses of customer data
- no such case
GRI 419: Socioeconomic Compliance 2016
419-1Non-compliance with laws and regulations in the social and economic area
- no such case
Economic Performance (GRI 200)
Topic Disclosure Pages Note
GRI 201: Economic Performance 2016
201-1 Direct economic value generated and distributed 30~31
201-2Financial implications and other risks and opportunities due to climate change
48~49
201-3 Defined benefit plan obligations and other retirement plans 91
GRI 202: Market Presence 2016 202-2 Proportion of senior management hired from the local community 90
GRI 203: Indirect Economic Impacts 2016
203-1 Infrastructure investments and services supported 93
203-2 Significant indirect economic impacts 36~39
GRI 204: Procurement Practices 2016
204-1 Proportion of spending on local suppliers 92
GRI 205: Anti-corruption 2016
205-1 Operations assessed for risks related to corruption 94
205-2Communication and training about anti-corruption policies and procedures
70~71
205-3 Confirmed incidents of corruption and actions taken - no such case
GRI 206: Anti-competitive Behavior 2016
206-1Legal actions for anti-competitive behavior, anti-trust, and monopoly practices
- no such case
Environmental Performance (GRI 300)
Topic Disclosure Pages Note
GRI 301: Materials 2016 301-2 Recycled input materials used 47
GRI 302: Energy 2016
302-1 Energy consumption within the organization 88
302-3 Energy intensity 88
302-4 Reduction of energy consumption 45
GRI 303: Water and Effluents 2018
303-1 Interactions with water as a shared resource 82
303-2 Management of water discharge-related impacts 82
303-5 Water consumption 89
GRI 305: Emissions 2016
305-1 Direct (Scope 1) GHG emissions 88
305-2 Energy indirect (Scope 2) GHG emissions 88
305-3 Other indirect (Scope 3) GHG emissions 88
305-4 GHG emissions intensity 88
305-5 Reduction of GHG emissions 44
305-6 Emissions of ozone-depleting substances (ODS) 89
305-7Nitrogen oxides (NOx), sulfur oxides (SOx), and other significant air emissions
89
GRI 306: Effluents and Waste 2016
306-1 Water discharge by quality and destination 89
306-2 Waste by type and disposal method 89
306-3 Significant spills - no such case
306-5 Water bodies affected by water discharges and/or runoff 82
GRI 307: Environmental Compliance 2016
307-1 Non-compliance with environmental laws and regulations -no such case
GRI 308: Supplier Environmental Assessment 2016
308-1 New suppliers that were screened using environmental criteria 60
308-2Negative environmental impacts in the supply chain and actions taken
60
GRI Standards Index

SAMSUNG SDI Sustainability Report 2019
APPENDICES98 99Independent Assurance Statement
Independent Assurance Statement
Third Party’s Assurance Statement
To the Readers of 2019 SAMSUNG SDI Sustainability Report:
Foreword Korea Management Registrar Inc. (hereinafter “KMR”) has been requested by of SAMSUNG SDI to verify the contents of its 2019 SAMSUNG SDI Sustainability Report (Hereby referred to as “the Report”). SAMSUNG SDI is responsible for the collection and presentation of information included in the Report. KMR’s responsibility is to carry out assurance engagement on specific data and information in the assurance scope stipulated below.
Scope and standardSAMSUNG SDI describes its efforts and achievements of the corporate social responsibility activities in the Report. KMR performed a type2, moderate level of assurance using AA1000AS (2008) and SRV1000 from KMR Global Sustainability Committee as assurance standards. KMR’s assurance team(hereinafter “the team”) evaluated the adherence to Principles of Inclusivity, Materiality and Responsiveness, and the reliability of the selected GRI Standards indices as below, where professional judgment of the team was exercised as materiality criteria.
The team checked whether the Report has been prepared in accordance with the ‘Core Option’ of GRI Standards which covers the followings.
◆ GRI Standards Reporting Principles◆ Universal Standards◆ Topic Specific Standards
- Economic Performance : 201-1, 201-2, 201-3
- Market Presence : 202-2
- Indirect Economic Impacts : 203-1, 203-2
- Procurement Practices : 204-1
- Anti-Corruption : 205-1, 205-2, 205-3
- Anti-Competitive Behavior : 206-1
- Materials : 301-2
- Energy : 302-1, 302-3, 302-4
- Water and Wastewater : 303-1, 303-2, 303-3, 303-4, 303-5
- Emissions : 305-1, 305-2, 305-3, 305-4, 305-5, 305-7
- Waste : 306-1, 306-2, 306-3, 306-5
- Environmental Compliance : 307-1
- Supplier Environmental Assessment : 308-1, 308-2
- Employment : 401-1, 401-2, 401-3
This Report excludes data sand information of joint corporate, contractor etc. which is outside of the organization, i.e. SAMSUNG SDI, among report boundaries.
Our approachIn order to verify the contents of the Report within an agreed scope of assurance in accordance with the assurance standard, the team has carried out an assurance engagement as follows:
◆ Reviewed overall report◆ Reviewed materiality test process and methodology ◆ Reviewed sustainability management strategies and targets◆ Reviewed stakeholder engagement activities◆ Interviewed people in charge of preparing the Report
Our conclusionBased on the results we have obtained from material reviews and interviews, we had several discussions with SAMSUNG SDI on the revision of the Report. We reviewed the Report’s final version in order to confirm that our recommendations for improvement and our revisions have been reflected. When reviewing the results of the assurance, the assurance team could not find any inappropriate contents in the Report to the compliance with the principles stipulated below. Nothing has come to our attention that causes us to believe that the data included in the verification scope are not presented appropriately.
◆ InclusivityInclusivity is the participation of stakeholders in developing and achieving an accountable and strategic response to sustainability- SAMSUNG SDI is developing and maintaining stakeholder communication channels in various forms and levels in order to make a commitment
to be responsible for the stakeholders. The assurance team could not find any critical stakeholder SAMSUNG SDI left out during this procedure.
◆ Materiality Materiality is determining the relevance and significance of an issue to an organization and its stakeholders. A material issue is an issue that will influence the decisions, actions, and performance of an organization or its stakeholders.- SAMSUNG SDI is determining the materiality of issues found out through stakeholder communication channels through its own materiality
evaluation process, and the assurance team could not find any critical issues left out in this process.
◆ Responsiveness Responsiveness is an organization’s response to stakeholder issues that affect its sustainability performance and is realized through decisions, actions, and performance, as well as communication with stakeholders.- The assurance team could not find any evidence that SAMSUNG SDI’s counter measures to critical stakeholder issues were inappropriately
recorded in the Report.
We could not find any evidence the Report was not prepared in accordance with the ‘Core Option’ of GRI standards.
Recommendation for improvementWe hope the Report is actively used as a communication tool with stakeholders and we recommend the following for continuous improvements.
◆ Samsung SDI recognized “climate change”, “product safety”, and “sustainable supply chain”, global issues for energy and advanced materials industries, as key sustainability initiatives and provided a detailed report on them. In addition, it presented demand forecasts and future directions of individual businesses, faithfully communicating the company’s growth potential to stakeholders. It sought to enhance transparency by disclosing the social and environmental performance of overseas operations and the results of the supply chain assessment including elements to be improved. The company is advised to enhance the related management system in the future. Furthermore, the company can gain more trust from stakeholders by developing mid- to long-term ESG strategies and goals at the company level and including them in the report.
Our independenceWith the exception of providing third party assurance services, KMR is not involved in any other SAMSUNG SDI’s business operations that are aimed at making profit in order to avoid any conflicts of interest and to maintain independence.
May, 25th, 2020
- Labor/Management Relations : 402-1
- Occupational Health and Safety : 403-1, 403-2, 403-9, 403-10
- Training and Education : 404-1, 404-2
- Diversity and Equal Opportunity : 405-1, 405-2
- Non-Discrimination : 406-1
- Human Rights Assessment : 412-1, 412-2
- Local Communities : 413-1
- Supplier Social Impact Assessment : 414-1, 414-2
- Public Policy : 415-1
- Customer Health and Safety : 416-1, 416-2
- Product and Service Labeling : 417-2, 417-3
- Customer Privacy : 418-1
- Social Environment Compliance : 419-1
CEO
APPENDICES 101100 SAMSUNG SDI Sustainability Report 2019 GHG Verification Statement / Previous Sustainability Reports
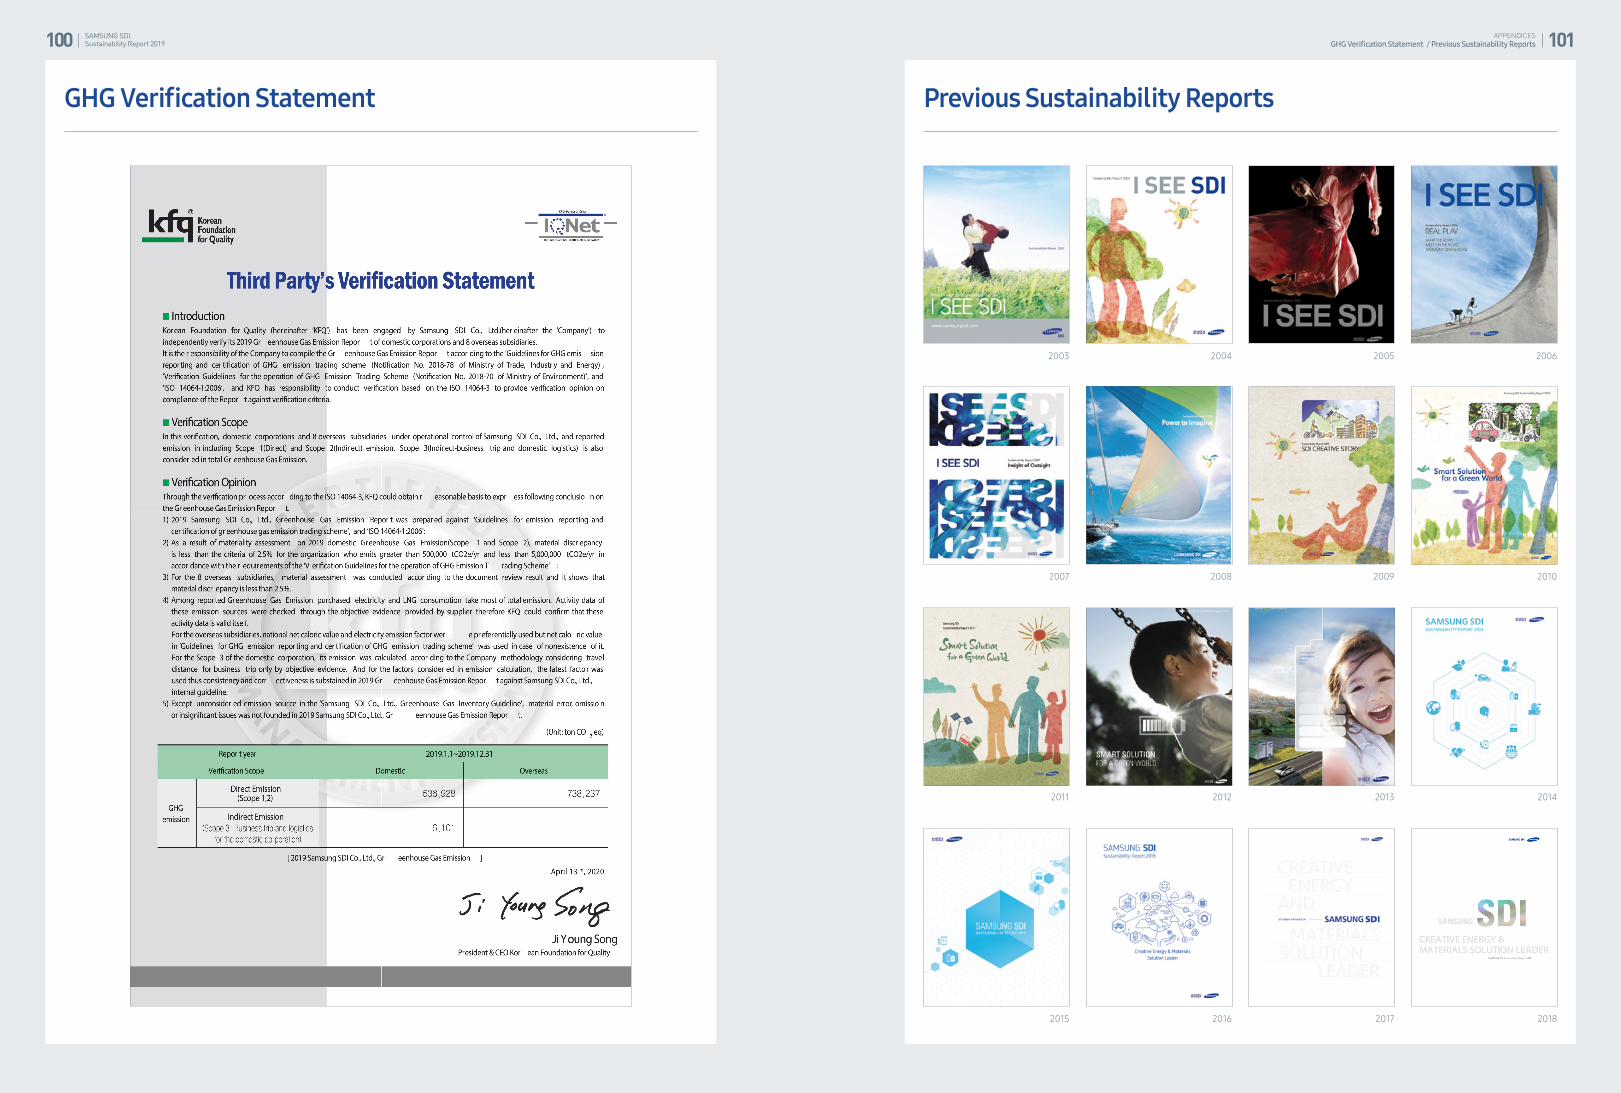
GHG Verification Statement Previous Sustainability Reports
2003 2004 2005 2006
2007 2008 2009 2010
2011 2012 2013 2014
2015 2016 2017 2018


![KiaBodyshop Appendices v07 CLEAN - Fusion...Kia Approved Bodyshop Standards, 2014 – version 01 [APPENDICES] 1 | Page © Kia Motors (UK) Ltd and Fusion Management Support Ltd, 2014](https://img.pdfslide.net/doc/110x75/5edc4cf0ad6a402d6666e936/kiabodyshop-appendices-v07-clean-kia-approved-bodyshop-standards-2014-a.jpg)