Embed Size (px)
Citation preview
�
��� �����

��
Appendix A: School Selection Criteria
The Middle Level Task Force, with the assistance of the Office of Superintendent of PublicInstruction, identified 32 middle and junior high schools with high or improving WASL scoresfrom spring 1998 to spring 2000, when compared to other schools with similar demograph-ics. Schools that were selected to participate were chosen from a group of schools that metone or more of the following sets of criteria.
• 1) Above average WASL scores in each of the three years (1998, 1999, 2000) for mathand reading with continuous improvement in both subjects, and 2) at least a 15-pointgain in the percentage of students meeting the math standard from 1998 to 2000, and3) at least a 10-point gain in the percentage of students meeting the reading standardfrom 1998 to 2000.
• 1) Above average WASL scores in each of the three years (1998, 1999, 2000) for mathand writing with continuous improvement in both subjects, and 2) at least a 15-pointgain in the percentage of students meeting the math standard from 1998 to 2000, and 3)at least a 17-point gain in the percentage of students meeting the writing standard from1998 to 2000.
• 1) Above average WASL scores in each of the three years (1998, 1999, 2000) for mathand reading with continuous improvement in both subjects, and 2) above state averagepercentage of free/reduced price lunch population (24.7%).
• 1) Above average WASL scores in each of the three years (1998, 1999, 2000) for mathand writing with continuous improvement in both subjects, and 2) above state averagepercentage of free/reduced price lunch population (24.7%).
• 1) At least 40% of students eligible for free/reduced price lunch, and 2) at least one-halfthe statewide average meeting the math and reading standard in 2000; and 3) at leastthe statewide average improvement in both subjects from 1998 to 2000.
• 1) At least 40% of students eligible for free/reduced price lunch, and 2) at least one-halfthe statewide average meeting the math and writing standard in 2000, and 3) at leastthe statewide average improvement in both subjects from 1998 to 2000.
• 1) At least a 10-point improvement in the percentage of students in Level 1 math from1998 to 2000, and 2) at least a 5-point improvement in the percentage of students inLevel 1 reading from 1998 to 2000.
Note: Only schools that had at least 50 students tested in 2000 were considered in order toensure valid inference of our results (i.e., to ensure that the increase in test scores could beattributed to instructional interventions and not to statistical fluctuations normally attributed tofew students tested).

��
Appendix B: Interview “Framing Questions”
Patterns of successful strategies have emerged from studies of schools across the nation.We aim to discover how successful Washington middle level schools are implementingthese strategies, and what other practices are helping them succeed. We recognize thereare factors beyond a school’s control that make a difference (positive or negative), and werecognize that factors in addition to “best practices” in classroom instruction make a differ-ence. We want as complete a story as you can give about how your school has achievedsuccess.
Preliminary Questions:
• Paint a picture of the success of your school. What has made it happen?
• From each of the three categories below, what factors do you believe have had thegreatest impact on your success?
Main Framing Questions
1. How do successful Washington state middle level schools implement standards?
2. How do successful Washington state middle level schools focus on and respond tostudent needs?
3. How are successful Washington state middle level schools organized?
Each of these three framing questions refers to a variety of characteristics of success (manyother characteristics not on the lists also make for success). Please address any or all thatapply:
1. How do successful Washington state middle level schools implement standards?
a. Understanding the standards and reconciling the standards with your program
b. Effective teacher preparation, support and delivery of instruction (includingdealing with reluctant staff members)
c. Alignment, communication and collaboration across grades and subject areas(including articulation with elementary and high school programs)
d. Linking curriculum, instruction and assessment
e. Using validated instructional strategies (what are they, and what are studentsdoing differently than they were before reform was implemented?)

��
f. Maintaining high expectations
g. Using student performance data (test scores, writing samples, etc.)
2. How do successful Washington state middle level schools focus on and respond tostudent needs?
a. Recognizing success
b. Supporting students not yet to standard
c. Differentiating for diversity (learning style, culture, etc.)
d. Applying other middle level characteristics
e. Using data about students and their views
3. How are successful Washington state middle level schools organized?
a. Strategic use of time and resources
b. Sharing vision and purpose
c. Maintaining positive attitude
d. Instructional leadership
e. Teamwork
f. The role of building governance and teacher leadership
g. Focused, in-depth professional development
h. Strong community interface
i. Using school performance data (achievement, program implementation, perceptions,demographics)
j. Reconciling time devoted to tested subjects (e.g., language arts and math) with thatdevoted to exploratory and elective programs
4. What other observations and reflections can you share about the success of yourschool?
5. What are your biggest challenges or obstacles to further improvement?
��
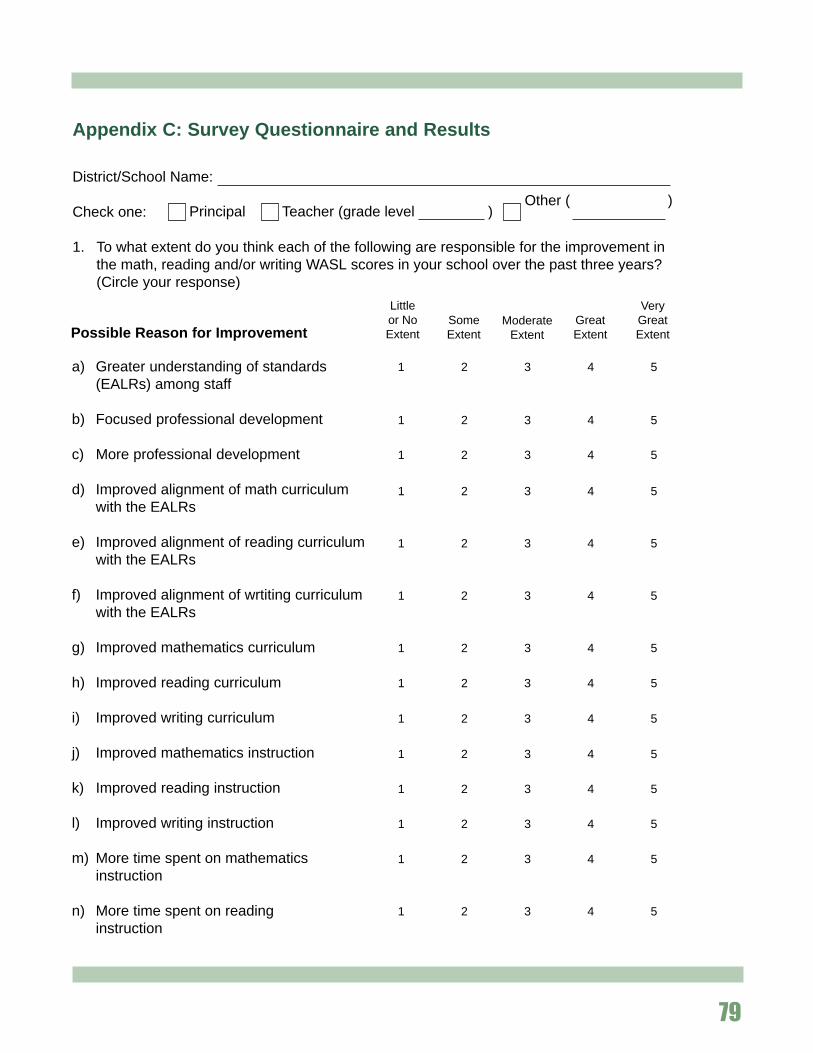
Appendix C: Survey Questionnaire and Results
District/School Name:
Check one:
1. To what extent do you think each of the following are responsible for the improvement inthe math, reading and/or writing WASL scores in your school over the past three years?(Circle your response)
Principal Teacher (grade level )Other ( )
a) Greater understanding of standards(EALRs) among staff
b) Focused professional development
c) More professional development
d) Improved alignment of math curriculumwith the EALRs
e) Improved alignment of reading curriculumwith the EALRs
f) Improved alignment of wrtiting curriculumwith the EALRs
g) Improved mathematics curriculum
h) Improved reading curriculum
i) Improved writing curriculum
j) Improved mathematics instruction
k) Improved reading instruction
l) Improved writing instruction
m) More time spent on mathematicsinstruction
n) More time spent on readinginstruction
ModerateExtent
GreatExtent
VeryGreatExtent
SomeExtent
Littleor NoExtent
1 2 3 4 5
Possible Reason for Improvement
1 2 3 4 5
1 2 3 4 5
1 2 3 4 5
1 2 3 4 5
1 2 3 4 5
1 2 3 4 5
1 2 3 4 5
1 2 3 4 5
1 2 3 4 5
1 2 3 4 5
1 2 3 4 5
1 2 3 4 5
1 2 3 4 5

o) More time spent on writinginstruction
p) Teamwork/collaboration among7th grade math staff
q) Collaboration among math staff in allgrades
r) Collaboration among 7th gradelanguage arts staff
s) Collaboration among language arts staffin all grades
t) Collaboration among 7th grade staffacross subject areas
u) Collaboration in all grades acrosssubject areas
v) Collaboration with elementary schoolstaff in the district
w) Collaboration with high school staff inthe district
x) Articulation with elementary programs inthe district
y) Articulation with high school programs inthe district
z) Class time spent preparing for WASLcontent
aa) Class time spent on test-taking strategiesfor the WASL
bb) Instructional leadership in your subjectarea
cc) Unified vision/purpose aimed at improvingWASL scores
ModerateExtent
GreatExtent
VeryGreatExtent
SomeExtent
Littleor NoExtent
1 2 3 4 5
Possible Reason for Improvement
1 2 3 4 5
1 2 3 4 5
1 2 3 4 5
1 2 3 4 5
1 2 3 4 5
1 2 3 4 5
1 2 3 4 5
1 2 3 4 5
1 2 3 4 5
1 2 3 4 5
1 2 3 4 5
��
1 2 3 4 5
1 2 3 4 5
1 2 3 4 5

��
dd) Improved staff attitudes toward thestandards and WASL
ee) Use of WASL assessment data to modifycurriculum
ff) Use of WASL assessment data to modifyinstruction
gg) Use of classroom-based data to modifycurriculum
hh) Use of classroom-based data to modifyinstruction
ii) Extended instructional hours (e.g., before/after school)
jj) Focused instruction on lower-performingstudents
kk) High expectations among staff for studentachievement
ll) Support for students not yet meetingWASL standards
mm) Support for special needs students notmeeting standards
nn) Recognition of student success on theWASL
oo) Individualized instruction (e.g., based onlearning styles
pp) Students are more motivated
qq) Increased parent involvement at school(e.g., tutoring)
rr) Increased community involvement(e.g., partnerships)
ModerateExtent
GreatExtent
VeryGreatExtent
SomeExtent
Littleor NoExtent
1 2 3 4 5
Possible Reason for Improvement
1 2 3 4 5
1 2 3 4 5
1 2 3 4 5
1 2 3 4 5
1 2 3 4 5
1 2 3 4 5
1 2 3 4 5
1 2 3 4 5
1 2 3 4 5
1 2 3 4 5
1 2 3 4 5
1 2 3 4 5
1 2 3 4 5
1 2 3 4 5

ss) Better student demographic profile
tt) Better cohort of students
uu) Fewer number of students “not tested”
vv) Increase in the number of “exempted”students
ww) Change in type of students enrolled(e.g., new gifted class)
xx) Other possible reasons for WASL scoreimprovements (Please explain below.)
ModerateExtent
GreatExtent
VeryGreatExtent
SomeExtent
Littleor NoExtent
1 2 3 4 5
Possible Reason for Improvement
1 2 3 4 5
1 2 3 4 5
1 2 3 4 5
1 2 3 4 5
1 2 3 4 5
��
2. Please describe the biggest challenges or obstacles to further improvement in WASLscores in your school.
3. To what extent are you familiar with the EALRs for the 7th grade in your subject area?(Check one)
Not familiar at all Slightly familiar Moderately familiar Very familiar
4. To what extent are you familiar with the EALRs for the 7th grade in other subject areas?(Check one)
Not familiar at all Slightly familiar Moderately familiar Very familiar

��
5. To what extent are you familiar with the EALRs for other grades in your subject area?(Check one)
Not familiar at all Slightly familiar Moderately familiar Very familiar
6. To what extent are you familiar with the EALRs for other grades in other subject areas?(Check one)
Not familiar at all Slightly familiar Moderately familiar Very familiar
7. To what extent have you received training on instruction related to the EALRs in yoursubject area during the past 3 years? (Check one)
Little or no training Some training A lot of training A very great amount of training
8. To what extent have you received training on instruction related to the EALRs in othersubject areas during the past 3 years? (Check one)
Little or no training Some training A lot of training A very great amount of training

Survey Results (in descending order of % responding “great” or “very great”)
To what extent do you think each of the following areresponsible for the improvement in the math, reading,and/or writing WASL scores in your school over the pastthree years?
��
% Greator VeryGreatExtent
Mean * StandardDeviation
High expectations among staff for student performance
Unified vision aimed at improving WASL scores
Improved writing instruction
Improved alignment of writing curriculum with the EALRs
Improved alignment of math curriculum with the EALRs
Class time spent preparing for WASL content
Improved math instruction
Improved writing curriculum
Improved reading instruction
Improved alignment of reading curriculum with the EALRs
Class time spent on test-taking strategies for the WASL
Collaboration among 7th grade math staff
Collaboration among 7th grade language arts staff
Improved math curriculum
More time on writing instruction
Collaboration among math staff in all grades
Improved reading curriculum
Greater understanding of the EALRs
Use of WASL data to modify instruction
Collaboration among language arts staff in all grades
Improved staff attitudes toward EALRs and WASL
Use of WASL data to modify curriculum
Collaboration among 7th grade staff across all subjects
More time on reading instruction
Focused professional development
More time on math instruction
Instructional leadership in your subject area
Use of classroom-based data to modify instruction
Use of classroom-based data to modify curriculum
Collaboration among staff in all grades across all subjects
Focused instruction on lower-performing students
71.0
67.3
67.0
66.6
64.9
64.1
62.7
61.3
60.8
60.2
58.5
58.3
58.2
53.3
52.7
51.6
51.5
51.1
49.5
49.5
48.7
48.3
47.9
46.6
46.5
44.1
43.8
42.8
39.3
38.4
37.9
3.96
3.80
3.78
3.74
3.70
3.76
3.69
3.64
3.61
3.63
3.69
3.59
3.62
3.50
3.45
3.42
3.42
3.43
3.39
3.37
3.31
3.33
3.32
3.26
3.31
3.14
3.24
3.21
3.16
3.08
3.07
.98
1.04
.94
.96
.96
1.05
.96
.96
1.02
.99
1.01
1.20
1.14
.99
1.13
1.16
1.04
.96
1.12
1.20
1.19
1.12
1.25
1.23
1.04
1.27
1.15
1.05
1.04
1.25
1.17

�
Survey Results (continued)
To what extent do you think each of the following areresponsible for the improvement in the math, reading,and/or writing WASL scores in your school over the pastthree years?
% Greator VeryGreatExtent
Mean * StandardDeviation
Support for students not meeting standards
More professional development
Recognition for student success on the WASL
Support for special needs students not meeting standards
Extended instructional hours
Students are more motivated
Individualized instruction
Increased parental involvement
Increased community involvement
Better student demographic profile
Better cohort of students
Collaboration with high school staff in the district
Articulation with high school programs in the district
Collaboration with elementary school staff in the district
Articulation with elementary programs in the district
Change in the type of students enrolled
Fewer students not tested
More students exempted from the WASL
37.7
36.1
35.8
35.6
30.1
30.0
27.6
20.6
19.5
19.0
17.6
15.7
11.7
11.7
9.8
9.1
8.7
6.6
3.05
3.15
2.90
2.96
2.68
2.89
2.79
2.44
2.38
2.32
2.30
2.19
2.16
2.13
2.11
1.84
1.86
1.76
1.20
1.00
1.35
1.20
1.37
1.15
1.15
1.18
1.19
1.25
1.20
1.15
1.07
1.10
1.04
1.10
1.06
.99
* Scale of 1 to 5
1 = Little or no extent2 = Some extent3 = Moderate extent4 = Great extent5 = Very great extent
��
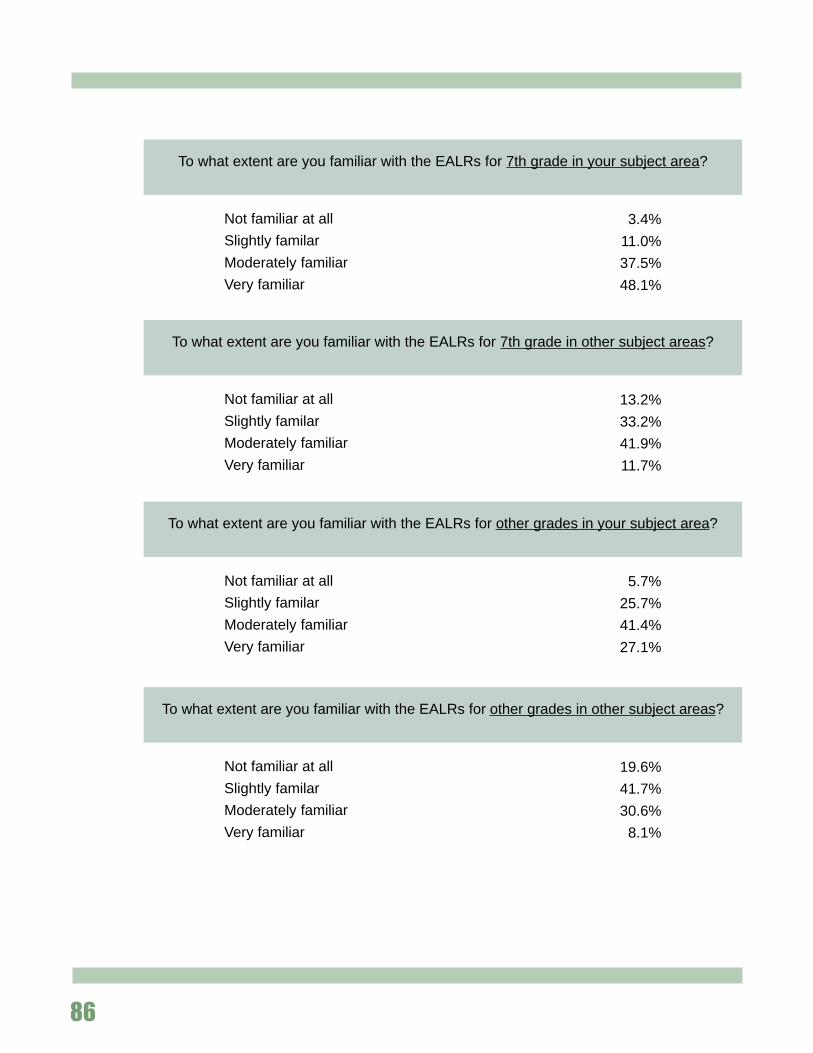
To what extent are you familiar with the EALRs for 7th grade in your subject area?
Not familiar at all
Slightly familar
Moderately familiar
Very familiar
3.4%
11.0%
37.5%
48.1%
To what extent are you familiar with the EALRs for 7th grade in other subject areas?
Not familiar at all
Slightly familar
Moderately familiar
Very familiar
13.2%
33.2%
41.9%
11.7%
To what extent are you familiar with the EALRs for other grades in your subject area?
Not familiar at all
Slightly familar
Moderately familiar
Very familiar
5.7%
25.7%
41.4%
27.1%
To what extent are you familiar with the EALRs for other grades in other subject areas?
Not familiar at all
Slightly familar
Moderately familiar
Very familiar
19.6%
41.7%
30.6%
8.1%

��
To what extent have you received training on instruction related to the EALRsin your subject area during the past 3 years?
Received little or no training
Received some training
Received a lot of training
Received a very great amount of training
17.9%
45.7%
26.8%
9.6%
To what extent have you received training on instruction related to the EALRsin other subject areas during the past 3 years?
Received little or no training
Received some training
Received a lot of training
Received a very great amount of training
40.0%
45.9%
11.0%
3.1%

��
Appendix D: Contact and Demographic Information for Featured Schools
School/District
Contact: Principal name,email address &phone number
Enroll-ment
Gradesserved Ethnicity %
% Freelunch
Blue HeronMiddle School
Port TownsendSchool District
407 6-8 AsianAmInBlackHispWhite
2.02.21.51.0
93.4
36.6
Brier TerraceMiddle School
Edmonds SchoolDistrict
Barbara [email protected]
688 7-8 AsianAmInBlackHispWhite
11.02.32.94.2
79.5
17.3
Cascade MiddleSchool
Longview SchoolDistrict
Bruce [email protected]
6-8 AsianAmInBlackHispWhite
3.32.11.54.5
88.7
32.7823
Cedar HeightsJunior High
Kent School District
Gary [email protected]
7-9 AsianAmInBlackHispWhite
1.90.84.12.8
90.4
17.61000
Cedar RiverMiddle School
Tahoma SchoolDistrict
7-8 AsianAmInBlackHispWhite
2.50.72.01.5
93.3
8.3714
College PlaceMiddle School
Edmonds SchoolDistrict
Andy [email protected]
7-8 AsianAmInBlackHispWhite
10.83.23.95.9
76.2
28.4622
Covington MiddleSchool
Evergreen SchoolDistrict
Byron [email protected]
6-8 AsianAmInBlackHispWhite
4.60.93.94.5
86.2
34.5918

��
School/District
Contact: Principal name,email address &phone number
Enroll-ment
Gradesserved Ethnicity %
% Freelunch
Desert HillsMiddle School
KennewickSchool District
Steve [email protected]
799 6-8 AsianAmInBlackHispWhite
1.50.12.46.8
89.2
12.1
Ephrata MiddleSchool
Edmonds SchoolDistrict
Rick [email protected]
392 7-8 AsianAmInBlackHispWhite
1.01.30.8
13.583.4
38.4
Finley Middle School
Finley School District
6-8 AsianAmInBlackHispWhite
1.50.40.08.9
89.3
41.0270
Hanford MiddleSchool
Richland SchoolDistrict
Mary [email protected]
6-8 AsianAmInBlackHispWhite
4.80.51.85.7
87.2
27.0732
Hawkins MiddleSchool
North MasonSchool District
Mary B. [email protected]
7-8 AsianAmInBlackHispWhite
5.31.52.33.0
87.9
28.9398
Horse Heaven HillsMiddle School
Kennewick SchoolDistrict
6-8 AsianAmInBlackHispWhite
1.70.01.7
14.981.7
25.8826
Jason LeeMiddle School
Tacoma SchoolDistrict
Terry [email protected]
6-8 AsianAmInBlackHispWhite
13.02.0
34.64.3
46.1
72.7653
Leota JuniorHigh School
Northshore SchoolDistrict
Sharon [email protected]
7-9 AsianAmInBlackHispWhite
5.7.9
1.84.8
86.8
8.1705

��
School/District
Contact: Principal name,email address &phone number
Enroll-ment
Gradesserved Ethnicity %
% Freelunch
Lucille UmbargerElementary School
Burlington-EdisonSchool District
Shawn [email protected]
526 K-8 AsianAmInBlackHispWhite
2.11.11.1
21.174.5
34.2
Madison MiddleSchool
Seattle School District
Jill [email protected]
890 6-8 AsianAmInBlackHispWhite
30.92.6
10.712.243.6
41.3
Mt. Baker MiddleSchool
Auburn School District
Mark [email protected]
6-8 AsianAmInBlackHispWhite
6.72.14.07.1
80.0
39.8745
Royal Middle School
Royal School District
P. Kent [email protected]
6-8 AsianAmInBlackHispWhite
0.30.00.3
61.437.9
72.4290
Salk Middle School
Spokane SchoolDistrict
Dr. Mark [email protected]
7-8 AsianAmInBlackHispWhite
2.13.21.22.3
91.2
31.4751
Showalter MiddleSchool
Tukwila SchoolDistrict
Dr. Cinda [email protected]
6-8 AsianAmInBlackHispWhite
15.12.4
22.515.644.4
63.3635
Snoqualmie MiddleSchool
Snoqualmie ValleySchool District
Jack [email protected]
6-8 AsianAmInBlackHispWhite
2.12.51.21.4
92.8
15.9515
Wapato Middle School
Wapato SchoolDistrict
Kelly [email protected]
6-8 AsianAmInBlackHispWhite
2.828.5
0.458.010.3
80.2738

��
Appendix E: WASL Performance Data for Featured Schools, 1998 - 2000
School District% met
Math Standard% met
Reading Standard% met
Writing Standard
Blue HeronMiddle School
Port Townsend 1998 23.01999 23.52000 36.9
1998 42.11999 43.92000 51.2
1998 33.61999 28.82000 35.0
Brier TerraceMiddle School
Edmonds 1998 31.21999 37.32000 41.8
1998 55.61999 59.12000 65.8
1998 36.71999 32.62000 39.4
Cascade MiddleSchool
Longview 1998 16.61999 29.12000 32.7
1998 41.21999 49.12000 49.3
1998 32.21999 42.52000 49.8
Cedar HeightsJunior High
Kent 1998 20.41999 31.52000 38.0
1998 37.11999 44.72000 49.8
1998 25.61999 39.02000 48.9
Cedar RiverMiddle School
Tahoma 1998 24.11999 44.02000 35.5
1998 29.51999 47.72000 49.6
1998 43.91999 49.32000 58.0
College PlaceMiddle School
Edmonds 1998 18.01999 22.02000 37.7
1998 44.61999 40.02000 47.7
1998 28.71999 41.62000 49.5
CovingtonMiddle School
Evergreen 1998 4.01999 20.32000 31.7
1998 17.31999 29.32000 35.3
1998 17.71999 31.22000 22.1
Desert HillsMiddle School
Kennewick 1998 29.51999 36.22000 48.9
1998 42.91999 51.72000 58.8
1998 43.61999 41.02000 59.9
Ephrata MiddleSchool
Ephrata 1998 20.11999 21.62000 28.4
1998 33.51999 43.12000 43.7
1998 32.11999 32.52000 35.8
Finley MiddleSchool
Finley 1998 1.01999 18.42000 30.0
1998 16.31999 38.22000 29.5
1998 20.41999 24.52000 24.4
Hanford MiddleSchool
Richland 1998 27.11999 35.62000 46.9
1998 45.51999 45.52000 46.9
1998 32.91999 38.62000 51.2
Hawkins MiddleSchool
North Mason 1998 12.91999 22.42000 36.4
1998 44.41999 38.62000 40.1
1998 33.11999 37.22000 50.2

��
School District% met
Math Standard% met
Reading Standard% met
Writing Standard
Horse HeavenHills Middle School
Kennewick 1998 22.21999 21.62000 35.1
1998 34.61999 46.92000 51.2
1998 32.21999 42.82000 46.4
Jason LeeMiddle School
Tacoma 1998 6.01999 1.52000 20.8
1998 12.91999 13.22000 19.5
1998 8.51999 10.22000 26.8
Leota JuniorHigh School
Northshore 1998 30.61999 48.22000 53.5
1998 58.11999 65.52000 58.3
1998 42.31999 46.82000 67.6
Lucille UmbargerElementary
Burlington-Edison
1998 13.21999 35.12000 42.6
1998 47.21999 50.92000 63.0
1998 49.11999 40.42000 57.4
Madison MiddleSchool
Seattle 1998 11.31999 19.82000 29.7
1998 22.21999 37.42000 34.5
1998 33.81999 34.42000 43.2
Mt. BakerMiddle School
Auburn 1998 27.61999 32.22000 39.0
1998 42.11999 55.12000 47.3
1998 27.21999 39.72000 58.5
Royal MiddleSchool
Royal 1998 8.91999 8.62000 19.8
1998 16.71999 12.72000 29.1
1998 16.71999 29.52000 22.1
Salk Middle School Spokane 1998 28.01999 28.52000 37.8
1998 49.91999 51.52000 54.3
1998 38.01999 41.52000 53.2
Showalter MiddleSchool
Tukwila 1998 4.61999 13.62000 21.4
1998 14.81999 38.22000 33.9
1998 15.91999 31.42000 34.9
Snoqualmie MiddleSchool
SnoqualmieValley
1998 27.81999 24.12000 42.2
1998 45.51999 33.12000 61.8
1998 49.41999 31.92000 55.5
Wapato MiddleSchool
Wapato 1998 3.91999 11.62000 8.6
1998 3.91999 12.12000 11.3
1998 4.91999 17.02000 20.8
��
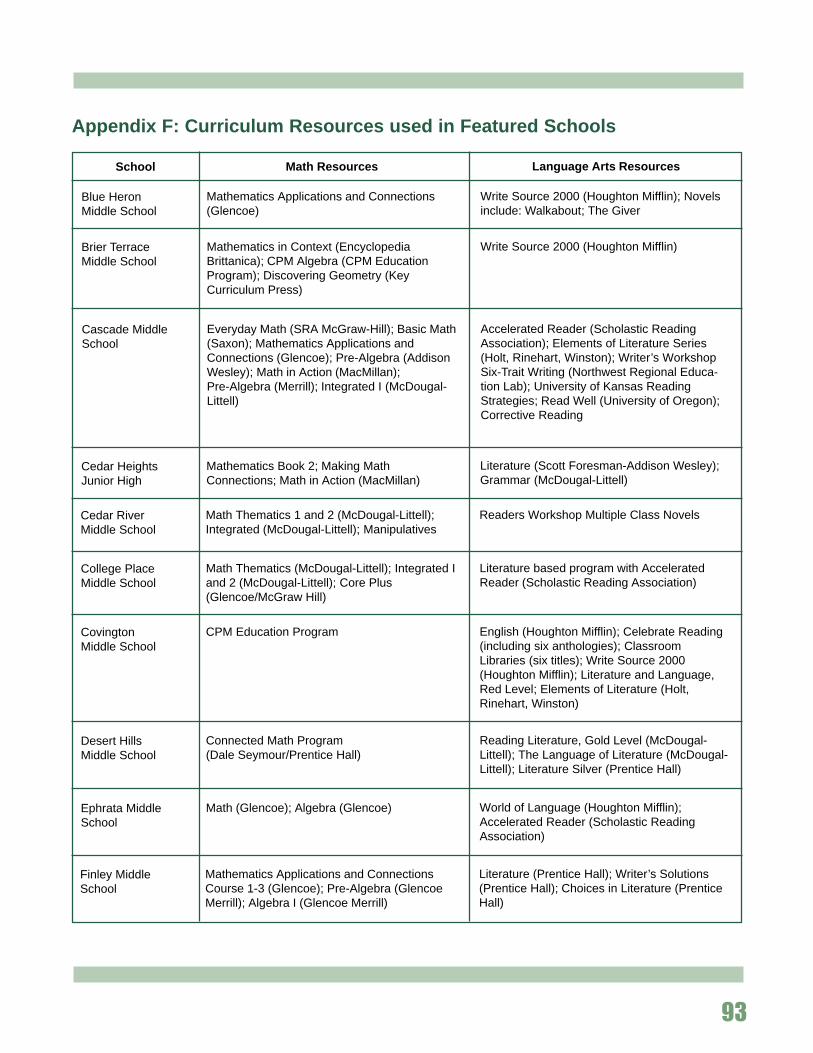
Appendix F: Curriculum Resources used in Featured Schools
School Math Resources Language Arts Resources
Blue HeronMiddle School
Mathematics Applications and Connections(Glencoe)
Write Source 2000 (Houghton Mifflin); Novelsinclude: Walkabout; The Giver
Brier TerraceMiddle School
Mathematics in Context (EncyclopediaBrittanica); CPM Algebra (CPM EducationProgram); Discovering Geometry (KeyCurriculum Press)
Write Source 2000 (Houghton Mifflin)
Cascade MiddleSchool
Everyday Math (SRA McGraw-Hill); Basic Math(Saxon); Mathematics Applications andConnections (Glencoe); Pre-Algebra (AddisonWesley); Math in Action (MacMillan);Pre-Algebra (Merrill); Integrated I (McDougal-Littell)
Accelerated Reader (Scholastic ReadingAssociation); Elements of Literature Series(Holt, Rinehart, Winston); Writer’s WorkshopSix-Trait Writing (Northwest Regional Educa-tion Lab); University of Kansas ReadingStrategies; Read Well (University of Oregon);Corrective Reading
Cedar HeightsJunior High
Mathematics Book 2; Making MathConnections; Math in Action (MacMillan)
Literature (Scott Foresman-Addison Wesley);Grammar (McDougal-Littell)
Cedar RiverMiddle School
Math Thematics 1 and 2 (McDougal-Littell);Integrated (McDougal-Littell); Manipulatives
Readers Workshop Multiple Class Novels
College PlaceMiddle School
Math Thematics (McDougal-Littell); Integrated Iand 2 (McDougal-Littell); Core Plus(Glencoe/McGraw Hill)
Literature based program with AcceleratedReader (Scholastic Reading Association)
CovingtonMiddle School
CPM Education Program English (Houghton Mifflin); Celebrate Reading(including six anthologies); ClassroomLibraries (six titles); Write Source 2000(Houghton Mifflin); Literature and Language,Red Level; Elements of Literature (Holt,Rinehart, Winston)
Desert HillsMiddle School
Connected Math Program(Dale Seymour/Prentice Hall)
Reading Literature, Gold Level (McDougal-Littell); The Language of Literature (McDougal-Littell); Literature Silver (Prentice Hall)
Ephrata MiddleSchool
Math (Glencoe); Algebra (Glencoe) World of Language (Houghton Mifflin);Accelerated Reader (Scholastic ReadingAssociation)
Finley MiddleSchool
Mathematics Applications and ConnectionsCourse 1-3 (Glencoe); Pre-Algebra (GlencoeMerrill); Algebra I (Glencoe Merrill)
Literature (Prentice Hall); Writer’s Solutions(Prentice Hall); Choices in Literature (PrenticeHall)

��
School Math Resources Language Arts Resources
Hanford MiddleSchool
Algebra (Addison Wesley); Mathematics(Addison Wesley); Transition Mathematics(Scott Foresman-Addison Wesley); Pre-Algebra (Houghton Mifflin); Math In Action(MacMillan)
The Writer’s Craft (McDougal-Littell); Elementsof Literature (Holt, Rinehart, Winston)
Hawkins MiddleSchool
Chicago Math Series (Scott Foresman-AddisonWesley)
Write Source 2000 (Houghton Mifflin)
Horse Heaven HillsMiddle School
Middle School Math (Scott Foresman-AddisonWesley)
Language of Literature (McDougal-Littell); TheWriter’s Craft (McDougal-Littell)
Jason LeeMiddle School
Mathematics Applications and Connections(Glencoe); The Problem Solver (CreativePublications); About Teaching Mathematics(Marilyn Burns, Math Solutions Publications);The I Hate Mathematics Book (Marilyn Burns,Little, Brown & Co.); WASL Example TestGrade 7 (Riverside Press); Successful TestTaking (WASL Math 7 Leadership Resources)
Writer’s Companion Middle Grades (PrenticeHall); Literature: Timeless Voices, TimelessThemes (Prentice Hall); World Regions:Adventures in Time and Place(MacMillan/McGraw-Hill)
Leota JuniorHigh
Mathematics Applications and Connections(Glencoe); Mathematics Structures andMethods (Houghton Mifflin)
Language of Literature (McDougal-Littell);Write Source 2000 (Houghton Mifflin)
Lucille UmbargerElementary
Investigations (Scott Foresman-AddisonWesley); Connected Math Program (DaleSeymour/Prentice Hall)
Literature: Bronze Edition (Prentice Hall)
Madison MiddleSchool
Connected Math Program (Dale Seymour/Prentice Hall)
Introduction to Literature (Holt, Rinehart,Winston); Elements of Literature 1st and 2ndCourse (Holt, Rinehart, Winston)
Mt. BakerMiddle School
Passports (McDougal-Littell); Connected MathProgram (Dale Seymour/Prentice Hall)
Literature: Bronze Edition (Prentice Hall)
Royal MiddleSchool
Mathematics Applications and Connections(Glencoe); Transition Mathematics (ScottForesman-Addison Wesley)
Writer’s Choice (Prentice Hall)
Salk MiddleSchool
Math Thematics 2 and 3 (McDougal-Littell) Language of Literature (McDougal-Littell)

�
School Math Resources Language Arts Resources
Showalter MiddleSchool
Mathematics Applications and Connections(Glencoe)
Literature: Bronze and Silver Editions (PrenticeHall); The World Past/Present, East/West(MacMillan); American Nation (Prentice Hall);History of US (Oxford); Thematicteacher-made materials
Snoqualmie MiddleSchool
Math Thematics (McDougal-Littell) Elements of Writing (Holt, Rinehart, Winston)
Wapato MiddleSchool
Glencoe/McGraw-Hill Literature Based Reading

Appendix G: Tips for Using this Report
This report has been designed for use by teachers, parents and administrators involved inschool improvement efforts. Some suggested activities for use in your building arepresented below.
1. Administer the survey at a staff meeting and compare your results with the results of theschools in this report. (See Appendix C for a copy of the survey and results).
2. Examine the seven recommendations in “Turning Points 2000.” How many of them arepresent in your school? (The recommendations are summarized on page 11 of thisreport and in the publication, “Turning Points 2000” on page 23).
3. Form study groups to analyze the six areas of focus around which the profiles andvignettes in this report are organized. Use the profiles and vignettes for ideas on whatmight work at your school.
4. Use the findings and conclusions from this report as the basis for a retreat or series ofstaff meetings. What are your school’s strengths and growth areas?
5. Use the findings and conclusions from this report to focus staff on the development of amission statement for your school.
6. Analyze your school learning plan. How does it compare to the findings and conclusionsof this report or to the recommendations in “Turning Points 2000”?
7. Read the profiles and vignettes for schools in this report that are similar to your school interms of student demographics and building characteristics. What strategies might yourschool be able to adopt or adapt? (See appendices D and E for student demographics,school characteristics and WASL results from 1998 to 2000.)
8. Form inquiry groups in your school to review the additional resources and research onmiddle level schools and middle level reform presented in appendix H.
9. Use this report to stimulate conversation and action with your learning improvementteam, site council or parent groups.
We also want to hear from you. Please take a moment to send an email to Alan Burke,MiddleLevel Task Force Chair, with feedback and additional ideas for using the report.([email protected])
��

��
Appendix H: Middle Level Research and Resources
Websites:
www.middleschool.com – The website for the Middle School Partnership. The Partnershipenables schools to become high-performance learning communities through staff develop-ment, to ensure success and enhance the quality of life for every middle school student. Acomprehensive site with links to many resources.
www.middleweb.com – A site that explores the challenges of middle school reform, brimmingwith resources for educators and parents. This is a great “gateway” to other middle schoolresources. The site also includes an electronic “clipping service” that is updated daily withmiddle school stories from the nation’s newspapers.
www.edweek.com – America’s newspaper of record for education. Find the most currentstories or sign up for weekly email updates sent right to your home or office computer.
www.accesseric.org – Educational Resources Information Center is a comprehensiveclearinghouse for publications, resources and digests pertaining to education.
www.ed.gov – The website for the U.S. Department of Education. This site offers a range ofinformation about the USDE including initiatives and priorities, grant opportunities, publica-tions, and research and statistics. By clicking on “other sites” you can access the websitesfor every state department of education in the U.S.
Media:
The following news media provide features on education. You can also search their on-linearchives for reports of interest.
• CNN (www.cnn.com)• MSNBC (www.msnbc.com)• ABC News On Line (www.abcnews.com)• Washington Post (www.washingtonpost.com)• New York Times (www.nyt.com)• USA Today (www.usatoday.com)
Self-Study Processes:
• Northwest Association of Schools and Colleges (www.boisestate.edu/nasc)• Northwest Regional Education Laboratory (www.nwrel.org)• Office of the Superintendent of Public Instruction (www.k12.wa.us). Coming soon! An
on-line school improvement tool to assist schools and districts in the development of acomprehensive school improvement plan.
��
Books, Articles and Reports:
In addition to the references cited in this report (see the “References” section), the followingbooks, reports and articles provide information and insights related to educational reform ingeneral and middle school reform in particular.
Briggs, T. H. (1920). The junior high school. Boston: Houghton Mifflin.
Elmore, R. (December 2000). Leadership for effective middle school practice: Conclusion.Phi Delta Kappan, 82(4), pp. 291-292.
Epstein, J. L. and D. J. Mac Iver (1990). Education in the middle grades: National practicesand trends. Columbus, OH: National Middle School Association.
Fashola, O. and R. Slavin (1997). Promising programs for elementary and middle schools:Evidence of effectiveness and replicability. Journal of Education for Students Placed at Risk2(3), pp. 251-307.
Fouts, J. (1999). School restructuring and student achievement in Washington state: Re-search findings on the effects of House Bill 1209 and school restructuring on WesternWashington schools. Seattle, WA: Seattle Pacific University, School of Education.
Gruhn, W. T. and H. R. Douglass (1947). The modern junior high school. New York: TheRonald Press Company.
Hopping, L. (2000). Multi-age teaming: A real-life approach to the middle school. Phi DeltaKappan 82(4), pp. 270-272.
Koos, L. V. (1927). The junior high school. Boston: Ginn.
Lipsitz, J. A. and R. D. Felner (1997). (Eds.) Middle grades research: A Phi Delta KappanSpecial Report. Phi Delta Kappan 78(7), pp. 517-556.
Lipsitz, J. (1984). Successful schools for young adolescents. New Brunswick, NJ:Transaction.
McElroy, C. (2000). Middle school programs that work. Phi Delta Kappan 82(4), pp. 277-279.
McKewin, C. K., T. S. Dickinson, and D. M. Jenkins (1996). America’s middle schools:Practices and progress – A 25 year perspective. Columbus, OH: National Middle SchoolAssociation.
McLaughlin, H. J., C. Watts and M. Beard (2000). Just because it’s happening doesn’t meanit’s working: Using action research to improve practice in middle schools. Phi Delta Kappan82(4), pp. 284-290.

��
National Association of Secondary School Principals Task Force on Secondary Schools in aChanging Society (1975). This we believe: A statement on secondary education. Reston,VA: National Association of Secondary School Principals.
Norton, J. (June, 2000). Important developments in middle-grades reform. Phi Delta KappanOn-line Articles, 81(10) pp. K1-K4 www.pdkintl.org/kappanklew0006.htm
Norton, J. and A. C. Lewis (2000). Middle grades reform: A Kappan special report. Phi DeltaKappan, 81(10), pp. K1-K20.
Oakes, J., K. H. Quartz, S. Ryan and M. Lipton (2000). Becoming good American schools:The struggle for civic virtue in education reform. San Francisco: Jossey Bass.
Toepfer, C. F. (1982). Junior high and middle school education. Encyclopedia of educationalresearch: Fifth edition. New York: Free Press.
Wheelock, A. (1998). Safe to be smart: Building a culture for standards-based reform in themiddle grades. Columbus, Ohio: National Middle School Association.


![Superintendent of Public Instruction mtRil111t/ttt ttut]pnttue:ceaa · 2020-02-18 · Superintendent of Public Instruction PARTM ENT O.F EDUCATION Wrlrhin1j ... Prior written approval](https://img.pdfslide.net/doc/110x75/5e9d79880ab64c7184663532/superintendent-of-public-instruction-mtril111tttt-ttutpnttueceaa-2020-02-18.jpg)