Embed Size (px)
Citation preview
APPENDICES
Ambient Air Monitoring for Chloropicrin and
Breakdown Products of Metam Sodium in Monterey and Santa Cruz Counties - Fall 2001
Prepared by Operations Planning and Assessment Section
Quality Management Branch Monitoring and Laboratory Division
Project No. POI-004
December 23,2003
TABLE OF CONTENTS (Appendices)
Appendix.. . . . . . . . . / . . . . . . . a
I Protocol for the Ambient Air Monitoring for Methyl Bromide, 1,3-Dichloropropene, Chlororpicrin and Breakdown Products of Metam Sodium in Kern, Monterey and Santa Cruz Counties During Summary/Fall, 2001 .............................................. 1-1 2
II Air Sampling Cartridge Method Development and Analytical Results for Ambient Monitoring in Monterey and Santa Cruz Counties ............................................ 13-68
Ill Field Data Sheets for MIC ................................................................................ 69-84
IV Field Data Sheets for Chloropicrin .................................................................... 85-99
V Field Data Sheets for MlTC and 1,3-Dichloropropene ................................. 100-1 14
VI Pesticide Ambient Sampling Procedures for Adsorbent Tubes .................... 1 15-1 17
VI1 Use information and Air Monitoring Recommendations for Field Fumigations with the Pesticide Active Ingredients 1,3-Dichloropropene, Chloropicrin, Metam Sodium, and Methly Bromide .. ....... .............................................................. 1 18-1 63
Vlll 1,3-Dichloropropene Cartridge Results ........................................................ 164-1 77
APPENDIX I
Protocol for the Ambient Air Monitoring For Methyl Bromide, 1,3-Dichloropropene, Chloropicrin and
Breakdown Products of Metam Sodium In Kern, Monterey and Santa Cruz Counties
During Summary/Fall, 2001
State of California California Environmental Protection Agency
AIR RESOURCES BOARD
Protocol for the Ambient Air Monitoring for Methyl Bromide, I ,3-Dichloropropene, Chloropicrin and
Breakdown Products of Metam Sodium In Kern, Monterey and Santa Cruz Counties
During'SummerlFall, 2001
Prepared by. Operations Planning and Assessment Section
Quality Management Branch Monitoring and Laboratory Division
Date: June 26, 2001
APPROVED:
Quality.Management Branch
n Micxael Poore, Chief Northern Laboratory Branch
Monitoring and Labora&@hvision
Air Quality Surveillance Branch
gnbtte Brooks,%ief Measures Branch Source Division
This protocol has been reviewed by the staff of the California Air Resources Board and approved for publication. Approval does not signify that the contents necessarily reflect the views and policies of the Air Resources Board, nor does mention of trade names or commercial products constitute endorsement or recommendation for use.
000001
TABLE OF CONTENTS
I.
II.
Ill.
IV.
V.
I.
I I .
I l l .
IV.
V.
INTRODUCTION ...................................................................................................... 1
SAMPLING ............................................................................................................... 2
CHLOROPICRIN, MIC AND MITC SAMPLING ........................................................ 2
METHYL BROMIDE AND I ,3-DICHLOROPROPENE .SAMPLING .......................... 3
AMBIENT MONITORING .......................................................................................... 4
ANALYSIS ................................................................................................................ 5
QUALITY ASSURANCE ........................................................................................... 6
PERSONNEL ............................................................................................................ 7
ATTACHMENTS
QUALITY ASSURANCE PLAN FOR PESTICIDE AIR MONITORING
STANDARD OPERATING PROCEDURE FOR THE SAMPLING AND ANALYSIS OF BROMOMETHANE, AND TELONE BY GClMS USING A VARIAN CRYOGENIC SAMPLER AND SILCOTM 6 LITER CANISTERS
STANDARD OPERATING PROCEDURE, SAMPLING AND ANALYSIS OF BROMOMETHANE IN SlLCO CANISTERS
STANDARD OPERATING PROCEDURE, SAMPLING AND ANALYSIS OF
(MITC) IN APPLICATION AND AMBIENT AIR USING GAS CHROMATOGRAPHYlMASS SELECTIVE DETECTOR
1,3-DICHLOROPROPENE (TELONE) AND METHYL ISOTHIOCYANATE
STANDARD OPERATING PROCEDURE SAMPLING AND ANALYSIS OF METHYL ISOCYANATE IN APPLICATION AND AMBIENT AIR USING HIGH PERFORMANCE LIQUID CHROMATOGRAPHY WITH A FLUORESCENCE DETECTOR
i
000002

VI. STANDARD OPERATING PROCEDURE SAMPLING AND ANALYSIS OF TRICHLORONITROMETHANE (CHLOROPICRIN) IN APPLICATION AND AMBIENT AIR USING GAS CHROMATOGRAPHYlMASS SELECTIVE DETECTOR
VII. PESTICIDE AMBIENT SAMPLING PROCEDURES FOR CANISTERS
VIII. PESTICIDE AMBIENT SAMPLING PROCEDURES FOR ADSORBENT TUBES
IX. CANISTER FIELD-LOG SHEET AND CANISTER FIELD DATA SHEET
X. ADSORBENT TUBE SAMPLING FIELD LOG SHEET
11 ..
Protocol for the Ambient Air Monitoring for Methyl Bromide, I ,3-Dichloropropene, Chloropicrin and
Breakdown Products of Metam Sodium In Kern, Monterey and Santa Cruz Counties
During SummerlFall, 2001
I. ‘Introduction
At the request of the California Department of Pesticide Regulation (DPR) (June 28,2000 Memorandum, Helliker to Lloyd), the Air Resources Board (ARB) staff will conduct ambient air monitoring for the pesticides methyl bromide, 1,3-dichloropropene (Telone), chloropicrin and two breakdown products of metam sodium (methyl isothiocyanate and methyl isocyanate). Monitoring will occur in Kern County over an eight week ambient monitoring period, tentatively scheduled from June 30, 2001 to August 30, 2001 and also in Monterey and Santa Cruz Counties over an eight week ambient monitoring period, tentatively scheduled from September I O , 2001 to November 8,2001. This is the second consecutive year the DPR has requested monitoring for methyl bromide and 1,3-dichloropropene at these locations. This monitoring will be done to fulfill the requirements of AB I80713219 (Food and Agricultural Code, Division 7, Chapter 3, Article 1.5) which requires the ARB ”to document the level of airborne emissions.. .of pesticides which may be determined to pose a present or potential hazard ...” when requested by the DPR. Monitoring is being conducted to coincide with the primary use of these fumigants prior to planting carrots in Kern County and prior to planting strawberries in Monterey and Santa Cruz Counties.
The sampling and analysis will follow the procedures outlined in this protocol as well as the quality assurance guidelines described in the “Quality Assurance Plan for Pesticide Air Monitoring” (May 11 , 1999 version)(Attachment I).
The draft method, ‘Standard Operating Procedures for the Sampling and Analysis of Bromomethane and Telone by GC1MS using a Varian Cryogenic Sampler and SilcoTM Canisters,” is included as Attachment II (May 2001 Version). This method will be used as the primary analysis method for methyl bromide (bromomethane) and 1,3- dichloropropene. Samples with concentrations above the calibration range of the primary method will be analyzed on a secondary method, “Standard Operating Procedure Sampling and Analysis of Bromomethane In Silco Canisters”, included as Attachment 111.
The draft ARB method, “Standard Operating Procedure, Sampling and Analysis of 1,3-dichloropropene (Telone) and Methyl lsothiocyanate (MITC) in Application and Ambient Air using Gas Chromatography/Mass Selective Detector (06/25101 Version),” is enclosed as Attachment IV.
The draft ARB method, “Standard Operating Procedure, Sampling and Analysis of
1
Methyl Isocyanate in Application and Ambient Air using High Performance Liquid Chromatography with a Fluorescence Detector (06/25/01 Version),” is enclosed as Attachment V.
The draft ARB method, “Standard Operating Procedure, Sampling and Analysis of Trichloronitromethane (Chloropicrin) in Application and Ambient Air using Gas ChromatographylMass Selective Detector (06/25/01 Version),’’ is enclosed as Attachment VI.
I I. Samplinq
The collection media used for monitoring of methyl bromide and I ,3-dichloropropene will’involve SilcosteelB canister sampling. The media used for chloropicrin will be XAD-4 sampling cartridges. The media used for methyl isocyanate (MIC) will be XAD-7’ sampling cartridges. The media used for methyl isothiocyanate (MITC) will be charcoal sampling cartridges (1,3-dichloropropene results from the charcoal samples will also be reported). Individual samples will be ,collected for 24-hour periods. For pesticide ambient monitoring conducted in 2000, 24-hour samples were collected four days per week, Monday through Friday. However, for the 2001 monitoring the DPR has requested that: “At each site, 4 samples per week should be collected randomly over the full seven-day week during the sampling period”. To accommodate this request the sampling schedule will be arranged, generally in groups of four consecutive sampling periods separated by one, two or three off-days, to add sampling days during most of the weekends during the eight week monitoring studies.
Caution should be used during field monitoring, transportation, storage, and lab analysis to minimize exposure of samples to sunlight in order to prevent photo degradation of chloropicrin, MIC and MITC.
Chloropicrin, MIC and MITC Sampling:
The sampling methods for three of the compounds require passing measured quantities of ambient air through adsorbent sampling tubes. For chloroticrin, the tubes are 8 mm x 150 mm, XAD-4, with 400 mg in the primary section, and 200 mg.in the secondary section (SKC special order). For MIC, the tubes are 6 mm x 90 mm, XAD-7, 1-(2-pyridyl)piperazine coated, with 80 mg in the primary section, and 40 mg in the secondary section (Supelco special order). Two tubes will be used in sequence for the MIC sampling. For MITC, the tubes are 8 mm x 110 mm, coconut shell charcoal with 400 mg in the primary section, and 200 mg in the secondary section (SKC catalogue #226-09). (The coconut base charcoal tube samples will also be analyzed for 1,3-dichloropropene to be compared with the canister results).
Sample collection for chloropicrin is at a flow rate of 90 standard cubic centimeters per
2
000005
minute (sccpm); at 75 sccpm for MIC; and at 2.5 standard liters per minute (slpm) for MITC. All samples are 24 hours in duration. Subsequent to sampling, the tubes are capped, labeled, placed in a culture tube and stored and transported to the ARB laboratory in Sacramento in an insulated container with dry ice. The DPR recommended target 24-hour estimated quantitation limits (EQLs) were 0.1 ug/m3 , 0.05 ug/m3 and 0.5 ug/m3 for chloropicrin, MIC, and MITC, respectively. The ARB 24-hour EQLs are 0.15 ug/m3, 0.42 ug/m3 and 0.18 ug/m3 for chloropicrin, MIC, and MITC, respectively. The MIC EQL is approximately 8 times higher than requested. The DPR directed that the monitoring for MIC should be conducted as planned even with the higher than requested quantitation limit.
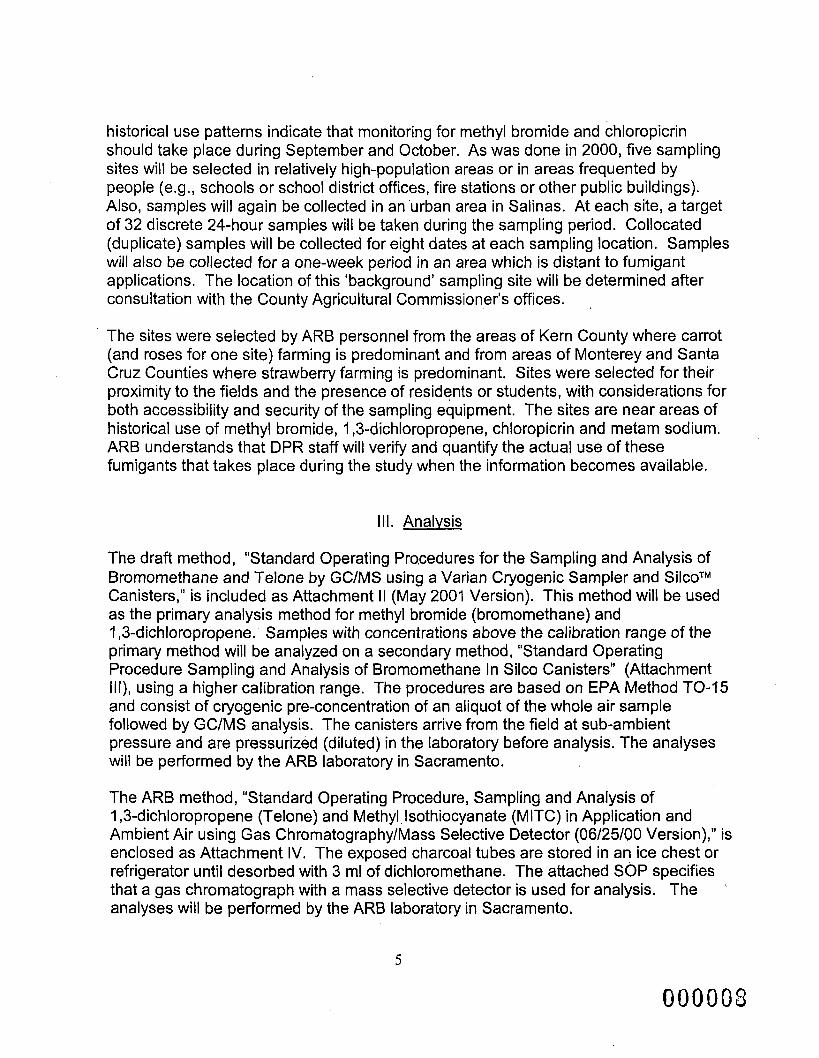
Each sample train consists of an adsorbent tube, Teflon fittings and tubing, rainlsun shield, rotameter, train support and a 115 volt AC vacuum pump (Figure 1). Tubes are prepared for use by breaking off the sealed glass end and immediately inserting the tube into the Teflon fitting. The tubes are oriented in the sample train according to a small arrow printed on the side indicating the direction of flow. A 0-5 Ipm rotameter is used to control sample flow for the MITC sampling and 0-240 ccpm rotameters will be used to control the flow for the chloropicrin and MIC sampling. The flow rates will be set using a calibrated digital mass flow meter (MFM) before the start of each sampling period. A MFM scaled from 0-5 slpm is used for MITC and a 0-100 sccpm MFM is used for the chloropicrin and MIC samplers. The flow rate is also checked and recorded, using the MFM, at the end of each sampling period. Samplers will be leak checked prior to each sampling period with the sampling tubes installed. Any change in flow rates will be recorded in the field'logbook. The pesticide ambient sampling procedures for adsorbent tubes are attached as Attachment VIII. The adsorbent tube sampling field log sheet is enclosed as Attachment X.
Methyl Bromide (MeBr) and 1,3-Dichloropropene Sampling
Integrated ambient air samples will be collected using passive air sampling into evacuated six liter, SilcosteelB canisters (from Restec Corporation). The flow rate of 3 sccpm will be set using a battery operated mass flow meter. The sampling system will be operated continuously for 24 hours with the exact operating interval recorded on the log and field data sheets (see Attachment IX). The canister vacuum reading will be recorded at the start and end of each sampling period using the -30 to 0 inHg gauge on the passive sampler. The start and end canister vacuum readings will be approximately -30 inHg and -8 inHg, respectively. The canister vacuum reading will also be measured using a more accurate gauge in the lab before and after transport to/from the field. The laboratory gauge readings will be used to calculate the sample volume collected. The 3 sccpm sampling rate will yield a sample volume of 4.32 liters over the 24 hour sampling period. The EQL for MeBr is 0.036 ug/m3 (target EQL was 0.4 ug/m3) and the EQLs for cis and trans 1,3-dichloropro ene are 0.01 5 and 0.03 ug/m3, respectively (target EQL for Telone was 0.01 uglm ). P
3
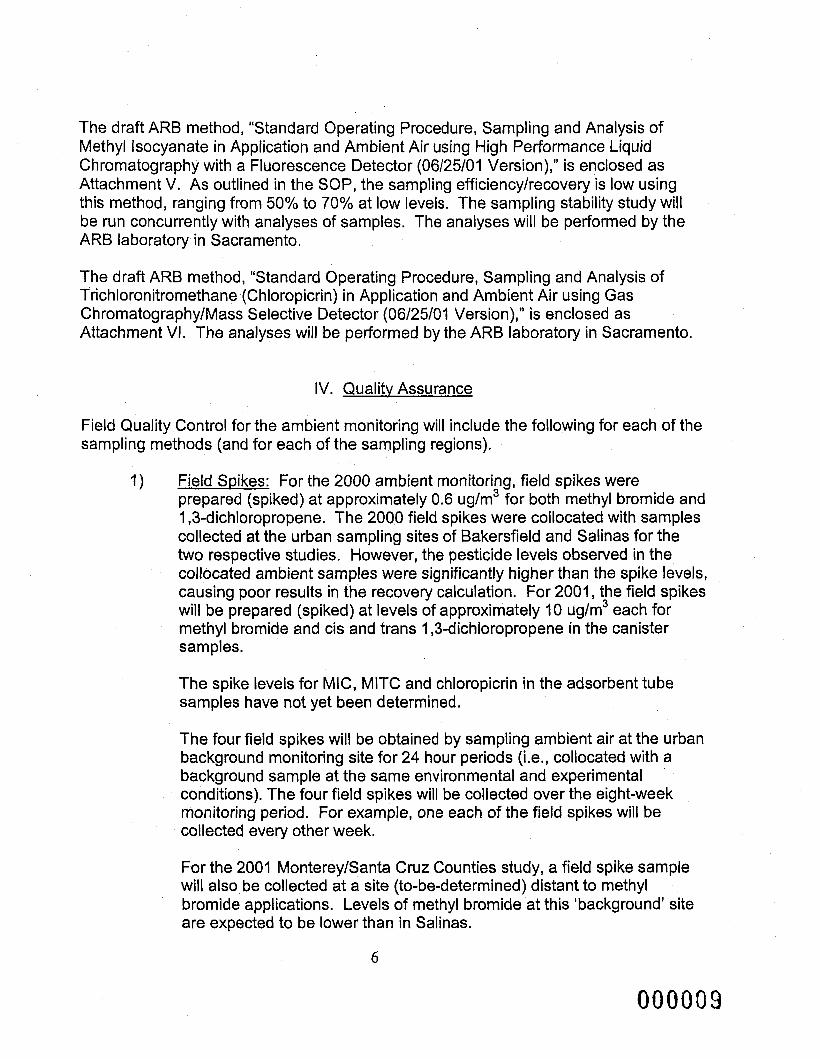
The critical orifice flow controllers (Silcosteel treated Veriflo SC423XL) will be attached to the valve fitting on the canister using a Silcosteel treated swagelock connector (Figure 2). A six foot section of 1/8 inch O.D, Silcosteel tubing will be attached to the inlet end of an in-line, 7 micron filter, which will be attached to the inlet end of the flow controller. The inlet end of the tubing will be bent into a U shape (to prevent rain from entering) and supported about six feet above the building roof tops for the'ambient monitoring. At the end of each sampling period, the canisters will be placed in shipping contai,ners, with a sample identificationlchain of custody sheet, and will be shipped as soon as reasonably possible to the ARB Monitoring and Laboratory Division laboratory for analysis. The samples will be stored at ambient laboratory temperature prior to analysis.
When using a critical orifice flow restrictor for passive integrated sampling, the potential decrease in flow rate as the vacuum in the canister changes must be taken into account. This condition is resolved by using the Veriflo SC423XL flow controller. The controller uses a metal diaphram downstream of the critical orifice to regulate the flow as the pressure the canister changes. It is capable of maintaining a continuous low flow with vacuum ranges from -29.9 to approximately -5 inHg. The in-line filter prevents particles from entering the critical orifice of the flow controller, which could clog the critical orifice and affect the flow through the controller. The outside temperature can also affect the flow rate. For example, there could be an approximately six percent flow drop when the temperature changes from 80 OF to 125 O F (according to manufacturer's specifications).
The pesticide ambient sampling procedures for canisters are enclosed as Attachment VII. The canister sampling field log sheet and canister data sheet are enclosed as Attachment IX. These forms will be used to record start and stop times, start and stop vacuum readings, sample identifications, weather conditions, sampler's initials and any other significant data.
Ambient Monitoring
The DPR has directed that monitoring site selection in Kern County should focus on 1,3-dichloropropene and metam sodium, but that samples be collected and analyzed for all five compounds. The historical use patterns for 1,3-dichloropropene and metam sodium suggest that monitoring should occur over a two-month period during July and August in Kern County. As was done in 2000, five sampling sites will be selected in relatively high-population areas or in areas frequented by people. At each site, a target of 32 discrete 24-hour sampling periods will be monitored during the study. Collocated (field duplicate) samples will be collected for I day/week at each sampling location.
The DPR has directed that monitoring site selection in Monterey and Santa Cruz Counties should focus on methyl bromide and chloropicrin, but that samples be collected and analyzed for all five compounds. In Monterey and Santa Cruz Counties,
' 4
OOOOQ"?
historical use patterns indicate that monitoring for methyl bromide and chloropicrin should take place during September and October. As was done in 2000, five sampling sites will be selected in relatively high-population areas or in areas frequented by people (e.g., schools or school district offices, fire stations or other public buildings). Also, samples will again be collected in an ‘urban area in Salinas. At each site, a target of 32 discrete 24-hour samples will be taken during the sampling period. Collocated (duplicate) samples will be collected for eight dates at each sampling location. Samples will also be collected for a one-week period in an area which is distant to fumigant applications. The location of this ‘background’ sampling site will be determined after consultation with the County Agricultural Commissioner’s offices.
The sites were selected by ARB personnel from the areas of Kern County where carrot (and roses for one site) farming is predominant and from areas of Monterey and Santa Cruz Counties where strawberry farming is predominant. Sites were selected for their proximity to the fields and the presence of residents or students, with considerations for both accessibility and security of the sampling equipment. The sites are near areas of historical use of methyl bromide, 1 ,3-dichloropropene, chloropicrin and metam sodium. ARB understands that DPR staff will verify and quantify the actual use of these fumigants that takes place during the study when the information becomes available.
I I I . Analvsis
The draft method, “Standard Operating Procedures for the Sampling and Analysis of Bromomethane and Telone by GC/MS using a Varian Cryogenic Sampler and SilcoTM Canisters,” is included as Attachment II (May 2001 Version). This method will be used as the primary analysis method for methyl bromide (bromomethane) and 1,3-dichloropropene. Samples with concentrations above the calibration range of the primary method will be analyzed on a secondary method, “Standard Operating Procedure Sampling and Analysis of Bromomethane In Silco Canisters” (Attachment Ill), using a higher calibration range. The procedures are based on EPA Method TO-I5 and consist of cryogenic pre-concentration of an aliquot of the whole air sample followed by GClMS analysis. The canisters arrive from the field at sub-ambient pressure and are pressurized (diluted) in the laboratory before analysis. The analyses will be performed by the ARB laboratory in Sacramento.
The ARB method, “Standard Operating Procedure, Sampling and Analysis of 1,3-dichloropropene (Telone) and Methyl lsothiocyanate (MITC) in Application and Ambient Air using Gas ChromatographylMass Selective Detector (06/25/00 Version),” is enclosed as Attachment IV. The exposed charcoal tubes are stored in an ice chest or refrigerator until desorbed with 3 ml of dichloromethane. The attached SOP specifies that a gas chromatograph with a mass selective detector is used for analysis. The analyses will be performed by the ARB laboratory in Sacramento.
5
The draft ARB method, “Standard Operating Procedure, Sampling and Analysis of Methyl Isocyanate in Application and Ambient Air using High Performance Liquid Chromatography with a Fluorescence Detector (06/25/01 Version),” is enclosed as Attachment V. As outlined in the SOP, the sampling efficiencylrecovery is low using this method, ranging from 50% to 70% at low levels. The sampling stability study will be run concurrently with analyses of samples. The analyses will be performed by the ARB laboratory in Sacramento.
The draft ARB method, “Standard Operating Procedure, Sampling and Analysis of Trichloronitromethane.(Chloropicrin) in Application and Ambient Air using Gas ChromatographylMass Selective Detector (06125101 Version),” is enclosed as Attachment VI. The analyses will be performed by the ARB laboratory in Sacramento.
IV. Qualitv Assurance
Field Quality Control for the ambient monitoring will include the following for each of the sampling methods (and for each of the sampling regions).
1) Field Spikes: For the 2000 ambient monitoring, field spikes were prepared (spiked) at approximately 0.6 ug/m3 for both methyl bromide and 1,3-dichloropropene. The 2000 field spikes were collocated with samples collected at the urban sampling sites of Bakersfield and Salinas for the two respective studies. However, the pesticide levels observed in the collocated ambient samples were significantly higher than the spike levels, causing poor results in the recovery calculation. For 2001, the field spikes will be prepared (spiked) at levels of approximately I O uglm3 each for methyl bromide and cis and trans 1,3-dichloropropene in the canister samples.
The spike levels for MIC, MlTC and chloropicrin in the adsorbent tube samples have not yet been determined.
The four field spikes will be obtained by sampling ambient air at the urban background monitoring site for 24 hour periods (i.e., collocated with a background sample at the same environmental and experimental conditions). The four field spikes will be collected over the eight-week monitoring period. For example, one each of the field spikes will be collected every other week.
For the 2001 MontereylSanta Cruz Counties study, a field spike sample will also be collected at a site (to-be-determined) distant to methyl bromide applications. Levels of methyl bromide at this ‘background’ site are expected to be lower than in Salinas.
6
000003

Four trip spikes will be prepared at the same level as the field spikes. A trip spike will be transported and analyzed along with each of the field spikes.
Four lab spikes will be prepared at the same level as the field and trip spikes. A lab spike will be analyzed along with each of the field and trip spike sets.
Collocated samples will be taken for eight dates at each sampling location.
A trip blank will be obtained each week of sampling.
V. Personnel
ARB sampling personnel will consist of staff from the ARB Air Quality Surveillance Branch. Laboratory personnel will consist of staff from the ARB Northern Laboratory Branch.
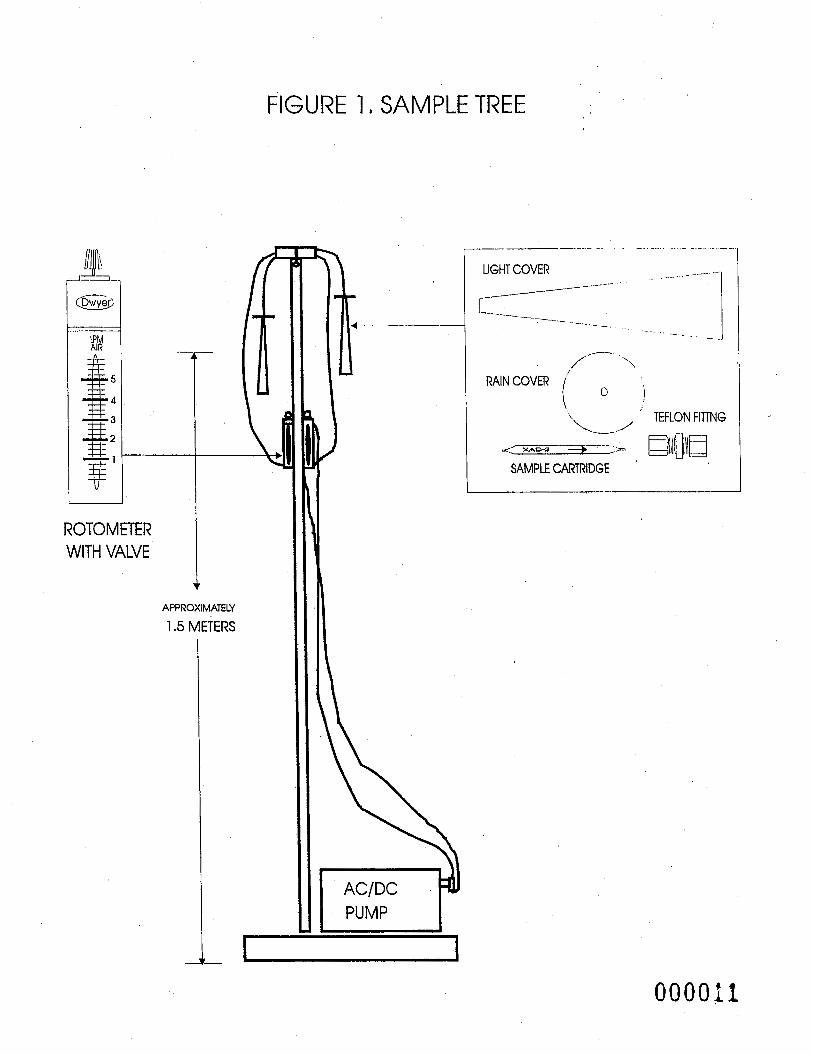
FIGURE 1 I SAMPLE TREE
I
ROTOMETER WITH VALVE
4
I .5 METERS APPROXIMATELY
I PUMP
LIGHT COVER _ _ . -. . .
7. /-----.------ 1 /- ,
'\
\,
RAIN COVER ( (3 'i
'\ , TEFLON FlTTNG
SAMPLE CARTRIDGE
OOOOil
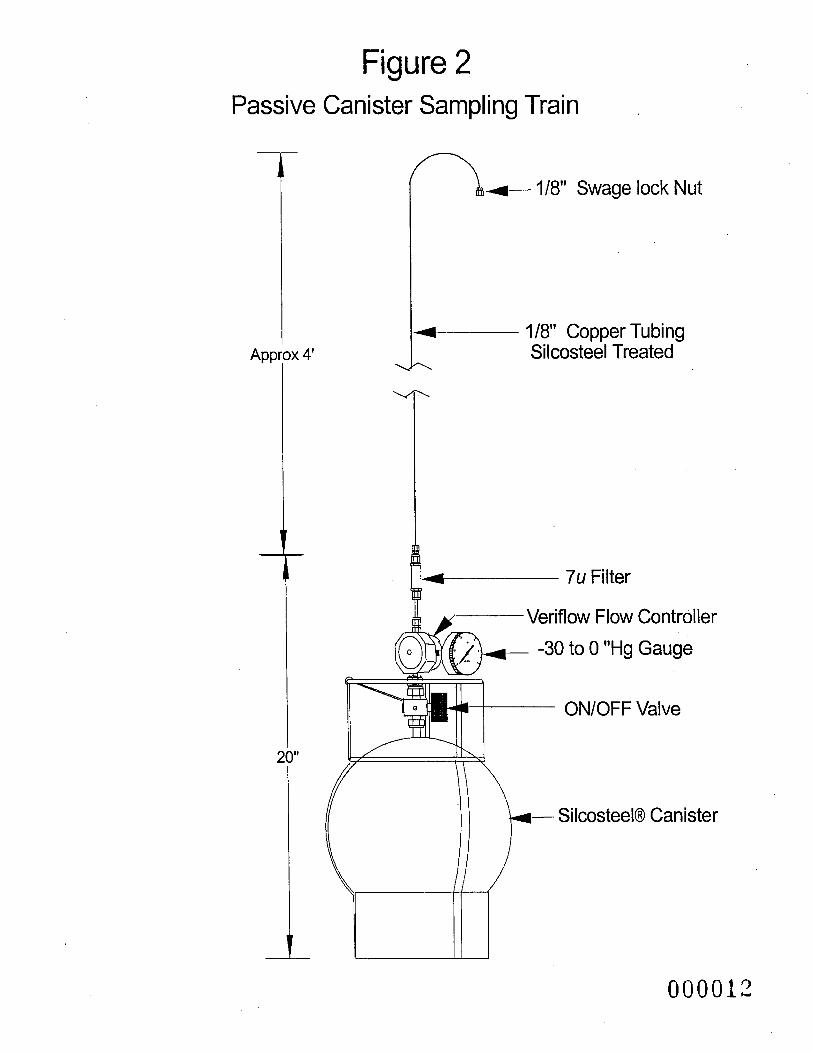
Figure 2 Passive Canister Sampling Train
rex 4' I
I
I
0 4- 1/8" Swage lock Nut
1/8" Copper Tubing Silcosteel Treated
7u Filter
Veriflow Flow Controller
-30 to 0 "Hg Gauge
ONlOFF Valve
- SilcosteelB Canister
000012
APPENDIX II
Laboratory Report for Air Sampling Cartridge Method Development and Analytical Results for Ambient Monitoring in Monterey and Santa Cruz Counties
California Environmental Protection Agency
0 s A i r Resources Board -
Air Sampling Cartridge Method Development and Analytical Results for Ambient Monitoring in Monterey and Santa Gruz Counties
DATE: January 1,2002
Prepared by T.E. Houston, Ph.D.
Air Pollution Specialist Special Analysis Section
Northern Laboratory Branch Monitoring and Laboratory Division
Reviewed and Approved by
Russell Grace, Manager Special Analysis Section
Project Number: P-01-004
This report has been reviewed by staff of the California Air Resources Board and approved for publication. Approval does not signify that the contents necessarily reflect the views and policies of the Air Resources Board, nor does mention of trade names of commercial products constitute endorsement or recommendation for use.
000013
Table of Contents
1.0 INTRODUCTION ....................................................................................................................................... 1
2.0 METHOD DEVELOPMENT AND STANDARD OPERATING PROCEDURE ......................................... 1
2.1 OVERVIEW ............................................................................................................................................... i 2.2 INSTRUMENT REPRODUCIBILITY ................................................................................................................ i 2.3 CALIBRATION ........................................................................................................................................... 2 2.4. MINIMUM DETECTION LIMIT (MDL) AND ESTIMATED QUANTITATION LIMITS (EQL) ....................................... 2 2.5. COLLECTION AND EXTRACTION EFFICIENCY (RECOVERY) ............................................................................ 2 2.6. STORAGE STABILITY ................................................................................................................................. 3 2.7. BREAKTHROUGH ........ : ............................................................................................................................. 3
3.0 AMBIENT AIR MONITORING SAMPLE RESULTS ................................................................................ 4
4.0 ANALYTICAL QUALITY CONTROL SAMPLES ..................................................................................... 4
4.1 LABORATORY SOLVENT BLANKS ................................................................................................................. 4
4.3 LABORATORY METHOD BLANKS ................................................................................................................. 4 4.4 LABORATORY CONTROL SAMPLES ............................................................................................................... 5
4.2 LABORATORY SPIKING SOLUTIONS ............................................................................................................. 4
4.5 CALIBRATION CHECK STANDARDS .............................................................................................................. 5
5.0 FIELD, TRIP, AND LABORATORY SPIKES AND TRIP BLANKS ......................................................... 5
5.1 FIELD SPIKES ........................................................................................................................................... 5 5.2 TRIP SPIKES ............................................................................................................................................. 5
5.4 TRIP BLANKS ............................................................................................................................................ 6
6.0 DISCUSSION ............................................................................................................................................. 6
5.3 LABORATORY SPIKES ................................................................................................................................ 5
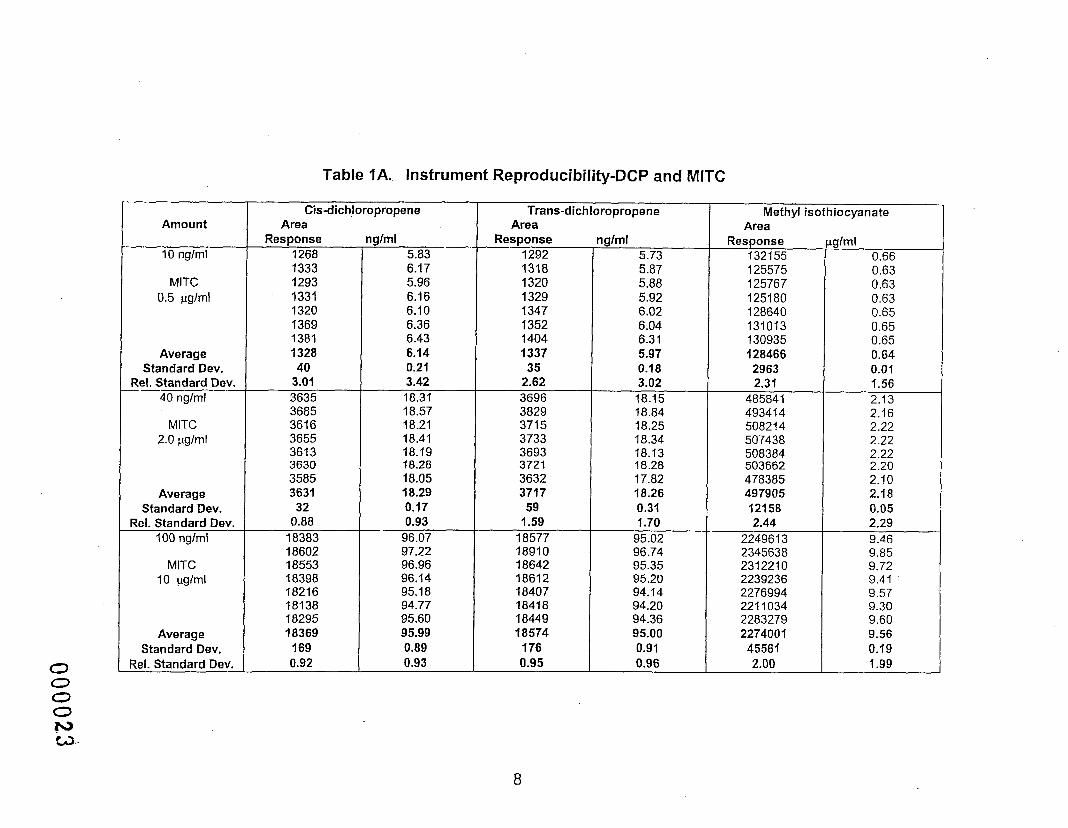
TABLE 1A . INSTRUMENT REPRODUCIBILITY-DCP AND MITC ................................................................. 8
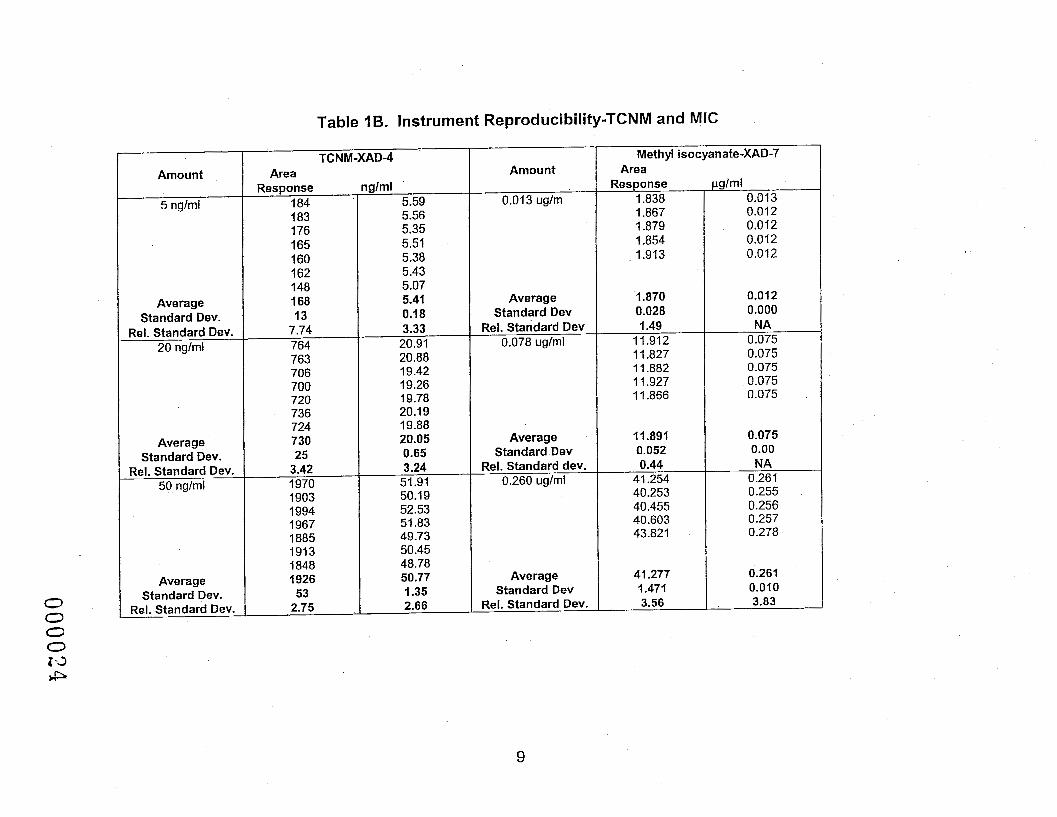
TABLE I B . INSTRUMENT REPRODUCIBILITY-TCNM AND MIC ................................................................. 9
TABLE 2 . AMBIENT MONITORING RESULTS OF CIS AND TRANS-DCP AND MITC ............................... 10
TABLE 3 . AMBIENT MONITORING RESULTS OF TCNM ............................................................................ 16
TABLE 4 . AMBIENT MONITORING RESULTS OF MIC ................................................................................ 22
TABLE 5: LABORATORY SPIKING SOLUTIONS RESULTS ....................................................................... 29
TABLE 6: LABORATORY METHOD BLANK RESULTS ............................................................................... 30
TABLE 7: LABORATORY CONTROL SAMPLE RESULTS .......................................................................... 31
TABLE 8: FIELD SPlKES ................................................................................................................................ 32
TABLE 9: TRIP SPIKES .................................................................................................................................. 33
TABLE I O : LABORATORY SPIKES ....................................... ...................................................................... 34'
TABLE 11: TRIP BLANKS .............................................................................................................................. 35
i 000014
APPENDIX A: STANDARD OPERATING PROCEDURE FOR DCP AND MlTC ANALYSIS ........................ 36
APPENDIX B: STANDARD OPERATING PROCEDURE FOR TCNM ANALYSIS ........................................ 42
APPENDIX C: STANDARD OPERATING PROCEDURE FOR MIC ANALYSIS ............................................ 48
i i

I .O INTRODUCTION
The Department of Pesticide Regulation (DPR) requested the Air Resources Board (ARB) to conduct ambient air monitoring for Telone (1,3-dichloropropene), chloropicrin (trichloronitromethane), and the breakdown products of metam-sodium, methyl isothiocyanate (MITC) and methyl isocyanate (MIC). I ,3-Dichloropropene (DCP) is present as a mixture of the cis and trans isomer. This report covers the method development, analytical, and quality assurance results for the: charcoal cartridge analysis of both cis and trans isomers of DCP and MITC; XAD-4 cartridge analysis of trichloronitromethane (TCNM); and derivatized XAD-7 cartridge analysis of MIC. DPR’s requested estimated quantiation limits (EQL) are: DCP, 0.01 micrograms per cubic meter (pg/m3 ); MITC, 0.5 pg/m3; TCNM, 0.1 pg/m3; and MIC, 0.05pg/m3.
DPR’s request for the ambient air analysis of several fumigant pesticides concurrently necessitates methodology that would optimize sample analysis with minimizing field sampling requirements. For the 2001 monitoring, staff maximized the analytical methods in two ways. One, the method was developed to include the most analytes while minimizing procedural variation, Two, by minimizing the number of cartridges required by the field sampling team.
2.0 METHOD DEVELOPMENT AND STANDARD OPERATING PROCEDURE.
2.7 Overview
Staff modified the DCP method from the year 2000. The 2001 pesticide analysis uses a column that optimizes chromatographic separation of the’ cis and trans-DCP isomers, MITC, and TCNM. The DCP, MITC, and TCNM extraction used 3 milliliters (ml) of dichloromethane (DCM). The instrument analysis was on a gas chromatograph/mass selective detector (GCIMSD) operating in the selected ion monitoring (SIM) mode. MIC collection was on derivatized XAD-7 and extraction with 3ml of acetonitrile (ACN). MIC instrumental analysis was on a high performance liquid chromatograph (HPLC) with a fluorescence detector.
2.2 Instrument Reproducibility
Instrumental reproducibility on the GC/MS used seven individual injections of I pl each of the DCP, MITC and TCNM at three concentrations. Table I A shows the results and area responses for DCP and MITC with the average and standard deviation of the determined value at IO, 40, and I 0 0 nanogramslml (ngIm1) for DCP and 0.5, 2.0 and 10.0 pglml for MITC. Table I B shows the results and area responses for TCNM and MIC with the average and standard deviation of the determined values at 5, 20, and 50 nglml and 0.013, 0.078, and 0.260 pg/ml, respectively.
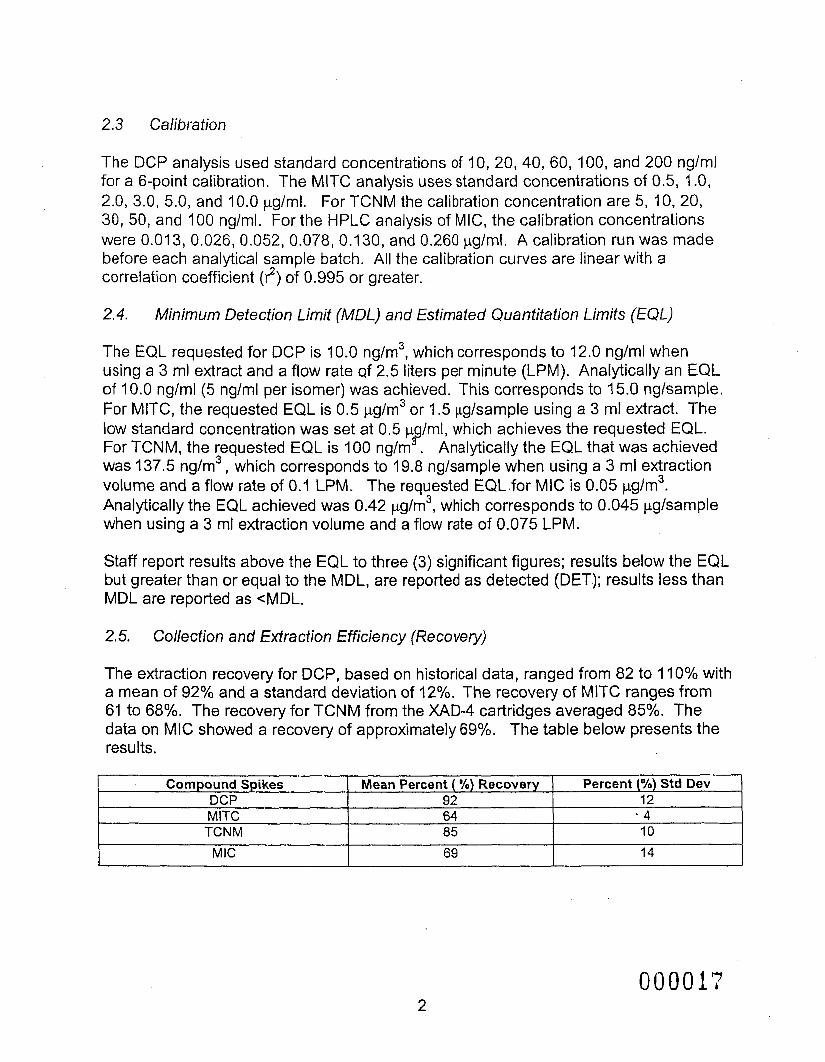
2.3 Calibration
The DCP analysis used standard concentrations of I O , 20, 40, 60, 100, and 200 nglml for a 6-point calibration. The MlTC analysis uses standard concentrations of 0.5, 'I .O, 2.0, 3.0, 5.0, and 10.0 pg/ml. For TCNM the calibration concentration are 5 , I O , 20, 30, 50, and I 0 0 nglml. For the HPLC analysis of MIC, the calibration concentrations were 0.013, 0.026, 0.052, 0.078, 0.130, and 0.260 pglml. A calibration run was made before each analytical sample batch. All the calibration curves are linear with a correlation coefficient (12) of 0.995 or greater.
2.4. Minimum Detection Limit (MDL) and Estimated Quantitation Limits (EQL)
The EQL requested for DCP is 10.0 ng/m3, which corresponds to 12.0 ng/ml when using a 3 ml extract and a flow rate qf 2.5 liters per minute (LPM). Analytically an EQL of 10.0 nglml (5 nglml per isomer) was achieved. This corresponds to 15.0 nglsample. For MITC, the requested EQL is 0.5 pg/rn3 or I .5 Fglsample using a 3 ml extract. The low standard concentration was set at 0.5 p Iml, which achieves the requested EQL. For TCNM, the requested EQL is I 00 nglm . Analytically the EQL that was achieved was 137.5 ng/m3, which corresponds to 19.8 nglsample when using a 3 ml extraction volume and a flow rate of 0.1 LPM. The requested EQL.for MIC is 0.05 pg/m3. Analytically the EQL achieved was 0.42 pg/m3, which corresponds to 0.045 pglsample when using a 3 ml extraction volume and a flow rate of 0.075 LPM.
B
Staff report results above the EQL to three (3) significant figures; results below the EQL but greater than or equal to the MDL, are reported as detected (DET.); results less than MDL are reported as cMDL.
2.5. Collection and Extraction Efficiency (Recovery)
The extraction recovery for DCP, based on historical data, ranged from 82 to 110% with a mean of 92% and a standard deviation of 12%. The recovery of MITC ranges from 61 to 68%. The recovery for TCNM from the XAD-4 cartridges averaged 85%. The data on MIC showed a recovery of approximately 69%. The table below presents the results.
Compound Spikes Percent (YO) Std Dev Mean Percent ( YO) Recovery DCP
10 a5 TCNM . 4 64 MlTC 12 92
I I MIC 14 69
2
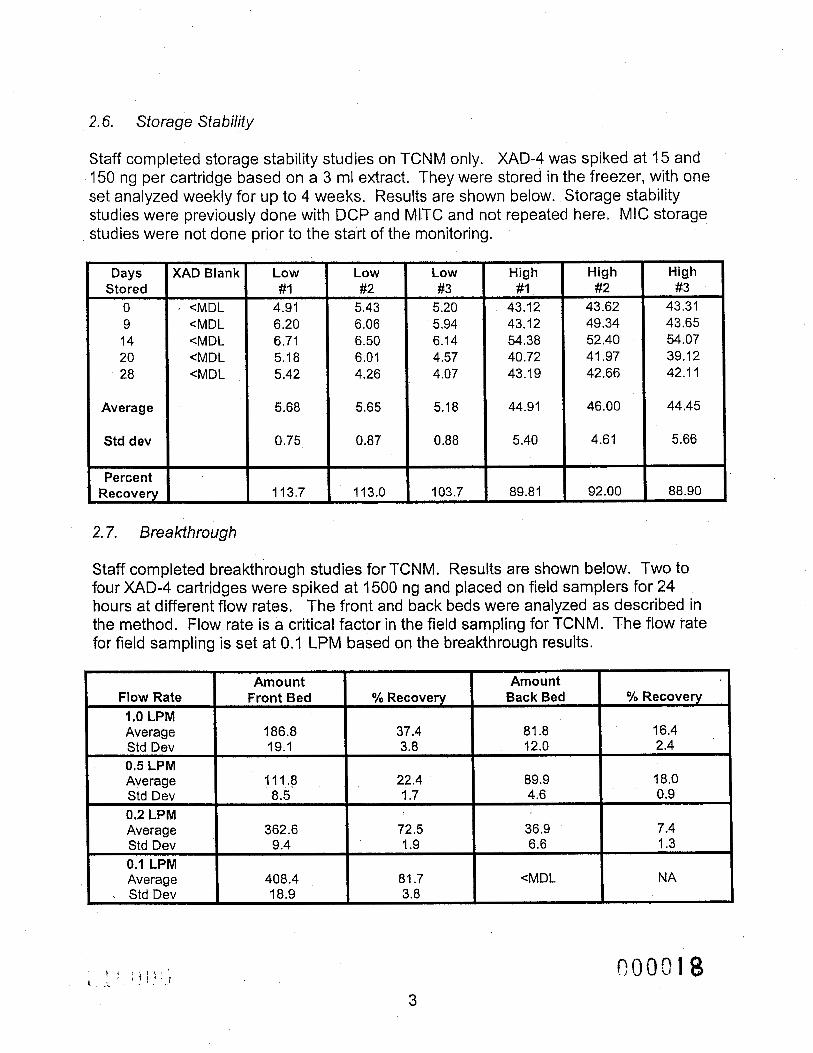
2.6. Storage Stability
Staff completed storage stability studies on TCNM only. XAD-4 was spiked at 15 and 150 ng per cartridge based on a 3 ml extract. They were stored in the freezer, with one set analyzed weekly for up to 4 weeks. Results are shown below. Storage stability studies were previously done with DCP and MlTC and not repeated here. MIC storage studies were not done prior to the start of the monitoring.
Days XAD Blank
0 ' <MDL 9
CMDL 28 <MDL 20 cMDL 14 <MDL
Stored
Average
Std dev
Percent Recoverv
Low #I
4.91 6.20 6.71 5.18 5.42
5.68
0.75
113.7
Low #2
5.43 6.06 6.50 6.01 4.26
5.65
0.87
1 13.0
Low #3
5.20 5.94 6.14 4.57 4.07
5.1 8
0.88
103.7
High # I
43.12 43.12 54.38 40.72 43.19
44.91
5.40
89.81
High
42.1 1 42.66 39.12 41 -97 54.07 52.40 43.65 49.34 43.3 1 43.62
#3 #2 High
46.00 44.45
4.61 5.66
92.00 I 88.90
2.7. Breakthrough
Staff completed breakthrough studies for TCNM. Results are shown below. Two to four XAD-4 cartridges were spiked at 1500 ng and placed on field samplers for 24 hours at different flow rates. The front and back beds were analyzed as described in the method. Flow rate is a critical factor in the field sampling for TCNM. The flow rate for field sampling is set at 0.1 LPM based on the breakthrough results.
Amount Yo Recovery Back Bed % Recovery Front Bed Flow Rate
Amount
1 .O LPM Average
2.4 12.0 3.8 19.1 Std Dev 16.4 81.8 37.4 186.8
0.5 LPM Average 111.8 22.4 89.9
0.9 4.6 1.7 8.5 Std Dev 18.0
0.2 LPM Average 362.6 72.5 36.9 7.4 Std Dev 9.4 1.9 6.6 1.3 0.1 LPM Average 408.4 81.7 cMDL NA
.. Std Dev 3.8 18.9
3
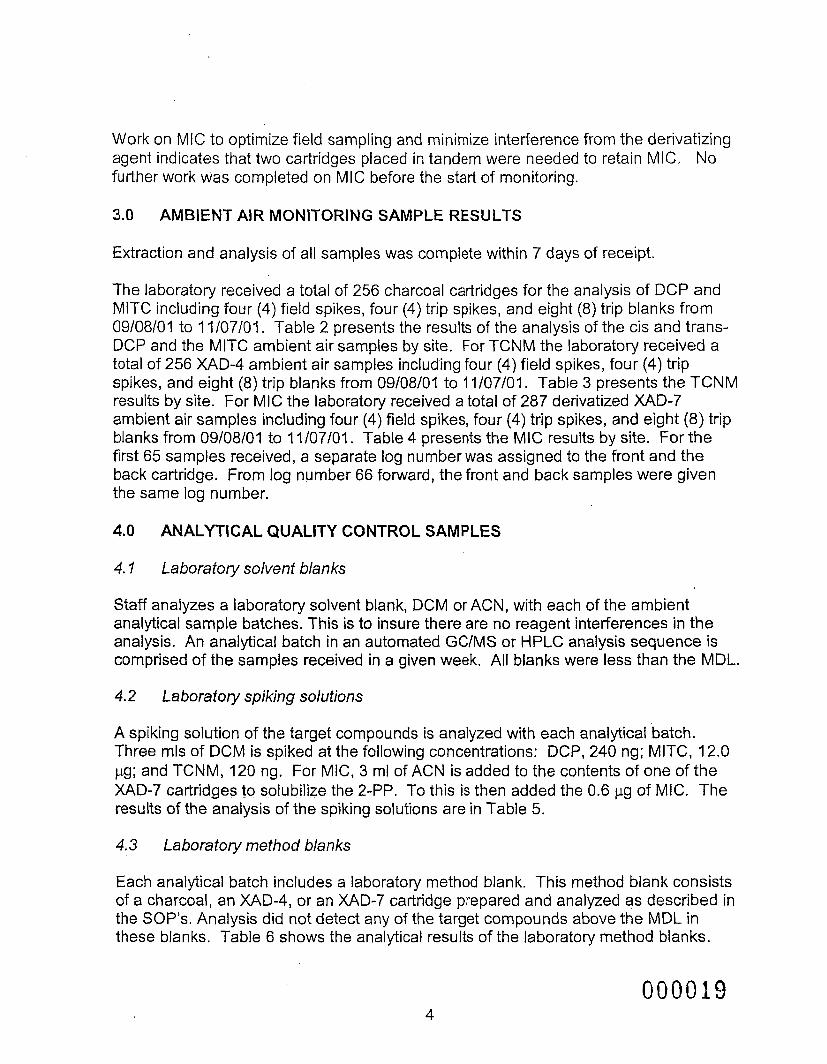
Work on MIC to optimize field sampling and minimize interference from the derivatizing agent indicates that two cartridges placed in tandem were needed to retain MIC. No further work was completed on MIC before the start of monitoring.
3.0 AMBIENT AIR MONITORING SAMPLE RESULTS
Extraction and analysis of all samples was complete within 7 days of receipt.
The laboratory received a total of 256 charcoal cartridges for the analysis of DCP and MITC including four (4) field spikes, four (4) trip spikes, and eight (8) trip blanks from 09/08/01 to 11/07/01. Table 2 presents the results of the analysis of the cis and trans- DCP and the MlTC ambient air samples by site. For TCNM the laboratory received a total of 256 XAD-4 ambient air samples includ'ing four (4) field spikes, four (4) trip spikes, and eight (8) trip blanks from 09/08/01 to 11/07/01. Table 3 presents the TCNM results by site. For MIC the laboratory received a total of 287 derivatized XAD-7 ambient air samples including four (4) field spikes, four (4) trip spikes, and eight (8) trip blanks from 09/08/01 to 11/07/01. Table 4 presents the MIC results by site. For the first 65 samples received, a separate log number was assigned to the front and the back cartridge. From log number 66 forward, the front and back samples were given the same log number.
4.0 ANALYTICAL QUALITY CONTROL SAMPLES
4. I Laboratory solvent blanks
Staff analyzes a laboratory solvent blank, DCM or ACN, with each of the ambient analytical sample batches. This is to insure there are no reagent interferences in the analysis. An analytical batch in an automated GUMS or HPLC analysis sequence is comprised of the samples received in a given week. All blanks were less than the MDL.
4.2 Laboratory spiking solutions
A spiking solution of the target compounds is analyzed with each analytical 'batch. Three mls of DCM is spiked at the following concentrations: DCP, 240 ng; MITC, 12.0 pg; and TCNM, 120 ng. For MIC, 3 ml of ACN is added to the contents of one of the XAD-7 cartridges to solubilize the 2-PP. To this is then added the 0.6 pg of MIC. The results of the analysis of the spiking solutions are in Table 5.
4.3 Laboratory method blanks
Each analytical batch includes a laboratory method blank. This method blank consists of a charcoal, an XAD-4, or an XAD-7 cartridge prepared and analyzed as described in the SOP'S. Analysis did not detect any of the target compounds above the MDL in these blanks. Table 6 shows the analytical results of the laboratory method blanks.
000019 4
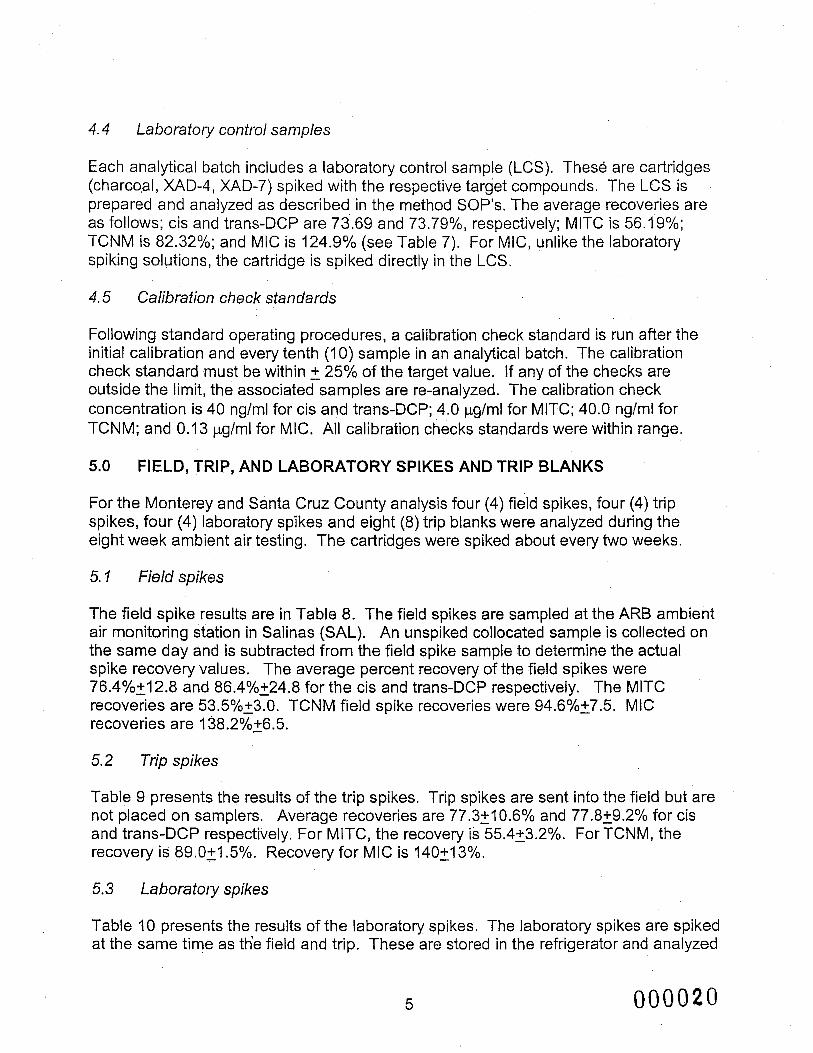
4.4 Laboratory control samples
Each analytical batch includes a laboratory control sample (LCS). These are cartridges (charco,aI, XAD-4, XAD-7) spiked with the respective target compounds. The LCS is prepared and analyzed as described in the method SOP’S. The average recoveries are as follows; cis and trans-DCP are 73.69 and 73.79%, respectively; MlTC is 56.19%; TCNM is 82.32%; and MIC is 124.9% (see Table 7). For MIC, unlike the laboratory spiking solutions, the cartridge is spiked directly in the LCS.
4.5 Calibration check standards
Following standard operating procedures, a calibration check standard is run after the initial calibration and every tenth (IO) sample in an analytical batch. The calibration check standard must be within 5 25% of the target value. If any of the checks are outside the limit, the associated samples are re-analyzed. The calibration check concentration is 40 ng/ml for cis and trans-DCP; 4.0 pg/ml for MITC; 40.0 nglml for TCNM; and 0.13 pglml for MIC. All calibration checks standards were within range.
5.0 FIELD, TRIP, AND LABORATORY SPIKES AND TRIP BLANKS
For the Monterey and Santa Cruz County analysis four (4) field spikes, four (4) trip spikes, four (4) laboratory spikes and eight (8) trip blanks were analyzed during the eight week ambient air testing. The cartridges were spiked about every two weeks.
5.7 Field spikes
The field spike results are in Table 8. The field spikes are sampled at the ARB ambient air monitoring station in Salinas (SAL). An unspiked collocated sample is collected on the same day and is subtracted from the field spike sample to determine the actual spike recovery values. The average percent recovery of the field spikes were 76.4%+12.8 and 86.4%+24.8 for the cis and trans-DCP respectively. The MlTC recoveries are 53.5%+3.0. TCNM field spike recoveries were 94.6%+7.5. MIC recoveries are 138.2%26.5.
5.2 Trip spikes
Table 9 presents the results of the trip spikes. Trip spikes are sent into the field but are not placed on samplers. Average recoveries are 77.3210.6% and 77.8+9.2% for cis and trans-DCP respectively. For MITC, the recovery is 55.4532%. For TCNM, the recovery i s 89.021 -5%. Recovery for MIC is 140+13%.
5.3 Laboratoly spikes
Table 10 presents the results of the laboratory spikes. The laboratory spikes are spiked at the same time as th’e field and trip. These are stored in the refrigerator and analyzed
5 000020

with the respective field and trip spike for that week. The recoveries for cis and trans- DCP were 83.3+4.2% and 82.923.0% respectively. For MlTC recovery is 55.726.0%. For TCNM recovery is 85.6+10.3%. Recovery for MIC is 146+18%.
5.4 Trip blanks
Table 11 shows the analytical results for the trip blanks. During each week of monitoring, a cartridge is sent back to the lab as a designated blank. This cartridge is treated and analyzed as for the samples. All of the trip blank results are less than the MDL for the target compounds.
6.0 DISCUSSION
Staff looked at sampling methods to optimize the target compound analysis on the gas chromatograph/ mass selective detector (GC/MSD). The ARB 2000 air monitoring of DCP in Kern and Monterey counties showed MlTC present. To optimize the separation of DCP, MITC, and TCNM the GClMSD column was replaced with an Rtx-200. In the selective ion monitoring (SIM) mode, the target compounds are well resolved. Spikes of all the compounds made on charcoal cartridges and extracted with DCM showed that TCNM was not extractable from these cartridges. Analysis of the compounds on XAD-4 showed poor extraction recovery of the DCP. If DCP and MlTC were to be analyzed on the charcoal, then the MlTC had to be retained using the flow rate of at least 3 LPM designated for DCP. Field sampling analysis for breakthrough at this flow rate showed no MlTC detected in the back bed. The field sampling flow rate for the charcoal cartridge was set at 2.5 LPM (3.6m3 for 24 hour sampling). This meets the requested EQL for DCP corresponding to 12.0 nglml and for M I X at 0.6 pg/ml.
The DCP laboratory spike recoveries for the analytical batches are 83.3% and 82.9% for the cis and trans isomer, respectively. The field spikes recovery after subtracting the collocated background is 76.4% and 86.4% respectively for the cisltrans isomers. The chromatographs indicate that there may be some interference near the retention time of the cis isomer. This is particularly noticeable at a lower concentration. The interference maybe a contributing ion from the sampling. The average cis and trans concentrations are 804 and 635 nglsample, respectively. The median concentration is 331 and 289 ng/sample for the cis/trans isomers, respectively. The maximum concentration observed is at the MESI 0, log #78 with a concentration of 15.5 and 10.8 pglsample for the cis and trans. Sample PMS2C#l6 has a concentration about three times higher than its collocated site (PMS2#15). This difference may be a result of sample evaporation during extraction since the volume of PMS2C#l6 was noticeably less than the extract volume from PMST2#15.
MlTC was quantitated in only one of the Monterey samples, SES18 log #I48 at 1.56 pg/ml. MITC is present as a DET in a few of the samples (SESl8C, log #149, SES19 log #155, and SES20, log #161). The recovery of MITC for this method averages 58%. Using a different solvent may help improve average recovery, but would necessitate
6
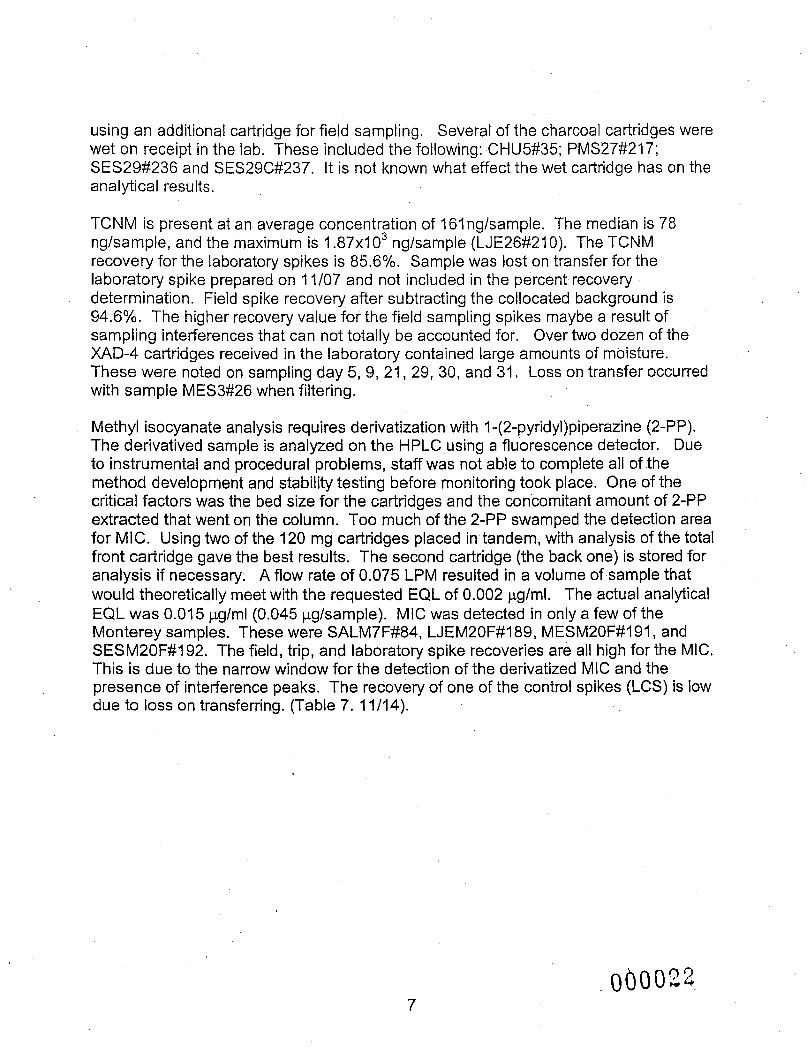
using an additional cartridge for field sampling. Several of the charcoal cartridges were wet on receipt in the lab. These included the following: CHU5#35; PMS27#217; SES29#236 and SES29C#237. It is not known what effect the wet cartridge has on the analytical results.
TCNM is present at an average concentration of 16lng/sample. The median is 78 ngjsample, and the maximum is I .87xl O3 ng/sample (LJE26#210). The TCNM recovery for the laboratory spikes is 85.6%. Sample was lost on transfer for the laboratory spike prepared on 11/07 and not included in the percent recovery determination. Field spike recovery after subtracting the collocated background is 94.6%. The higher recovery value for the field sampling spikes maybe a result of sampling interferences that can not totally be accounted for. Over two dozen of the XAD-4 cartridges received in the laboratory contained large amounts of moisture. These were noted on sampling day 5, 9, 21, 29, 30, and 31, Loss on transfer occurred with sample MES3#26 when filtering.
Methyl isocyanate analysis requires derivatization with I -(2-pyridyl)piperazine (2-PP). The derivatived sample is analyzed on the HPLC using a fluorescence detector. Due to instrumental and procedural problems, staff was not able to complete all of the method development and stability testing before monitoring took place. One of the critical factors was the bed size for the cartridges and the concomitant amount of 2-PP extracted that went on the column. Too much of the 2-PP swamped the detection area for MIC. Using two of the 120 mg cartridges placed in tandem, with analysis of the total front cartridge gave the best results. The second. cartridge (the back one) is stored for analysis if necessary. A flow rate of 0.075 LPM resulted in a volume of sample that would theoretically meet with the requested EQL of 0.002 pg/ml. The actual analytical EQL was 0.01 5 pg/ml (0.045 pglsample). MIC was detected in only a few of the Monterey samples. These were SALM7F#84, LJEM20F#,l89, MESM20F#19It and SESM2OF#l92. The field, trip, and laboratory spike recoveries are all high for the MIC. This is due to the narrow window for the detection of the derivatized MIC and the presence of interference peaks. The recovery of one of the control spikes (LCS) is low due to loss on transferring. (Table 7. 11/14).
7
Amount T 10 nglml
MlTC 0.5 pg/ml
Average Standard Dev.
Rel. Standard Dev. 40 ng/ml
MlTC 2.0 pg/ml
Average Standard Dev.
Rel. Standard Dev. 100 nglml
MlTC 10 vglml
Average Standard Dev.
Rel. Standard Dev.
Table 1A. Instrument Reproducibility-DCP and MlTC
Cis-dichloropropene Area
Response nglrnl 1268 1333 1293 1331 1320 1369 1381 1328 40
3.01 3635 3685 361 6 3655 3613 3630 3585 3631 32
0.88 I 8383 18602 18553 18398 18216 181 38 18295 18369 169 0.92
6.17 5.96 6.16 6.10 6.36 6.43 6.14 0.21 3.42 18.31 18.57 18.21
18.19 18.28 18.05 18.29 0.17 0.93 96.07 97.22 96.96 96.14 95.18 94.77 95.60 95.99 0.89 0.93
18.41
T 1318 1320 1329 1347 1352 1404 1337 35
2.62 3696 3829 371 5 3733 3693 3721 3632 3717 59 I .59
18577 18910 18642 1861 2 18407 1841 8 18449 18574
176 0.95
Trans-dichloropropene Area
Response nglrnl 1292 5.73
5.87 5.88 5.92 6.02 6.04 6.31 5.97 0.18 3.02
18.84 18.25 18.34 18.13 18.28 17.82 18.26 0.31 I .70
95.02 96.74 95.35 95.20 94.14 94.20 94.36 95.00 0.91 0.96
18.15
T Methyl isothiocyanate Area
Response 132155 125575 125767 1251 80 128640 131013 130935 128466 2963 2.31
485841 49341 4 508214 507438 508384 503662
497905 12158 2.44
22496 13 2345638 2312210 2239236 2276994 221 1034 2283279 2274001
45561 2.00
478385
rglrnl 0.66 0.63 0.63 0.63 0.65 0.65 0.65 0.64 0.01 I .56 2.1 3 2.16 2.22 2.22 2.22 2.20 2.10 2.1 8 0.05 2.29 9.46 9.85 9.72 9.41 9.57 9.30 9.60 9.56 0.19 1.99
8
Amount
5 nglml
Average Standard Dev.
Rei. Standard Dev. 20 nglml
Average Standard Dev.
Rei. Standard Dev. 50 nglml
Average Standard Dev.
Rel. Standard Dev.
Table 1 B. Instrument Reproducibility-TCNM and MIC
TCNM-XAD4 Area
Response 184 183 176 165 160 162 148 168 13
7.74 764 763 706 700 720 736 724 730 25
3.42 1970 1903 1994 1967 1885 1913 1848 1926 53
2.75
lglml 5.59 5.56 5.35 5.51 5.38 5.43 5.07 5.41 0.18 3.33 20.91 20.88 1 9.42 19.26 19.78 20.19 19.88 20.05 0.65 3.24 51.91 50.19 52.53 51.83 49.73 50.45 48.78 50.77 I .35 2.66
Amount
0.013 uglm r
Average Standard Dev
Rel. Standard De1 0.078 ug/ml
Average Standard Dev
Rei. Standard dev. 0.260 ugh1
Average Standard Dev
Rel. Standard Dev.
Methyl isocyanate-XAD-7 Area
Response 1.838 1.867 1.879 1.854 1.913
I .870 0.028 I .49
11.912 1 1.827 11.882 11.927 1 1.866
I I .891 0.052 0.44
41.254 40.253 40.455 40.603 43.821
41.277 I .471 3.56
lglml 0.013 0.012 0.012 0.012 0.012
0.012 0.000
NA 0.075 0.075 0.075 0.075 0.075
0.075 0.00 NA
0.261 0.255 0.256 0.257 0.278
0.261 0.010 3.83
9
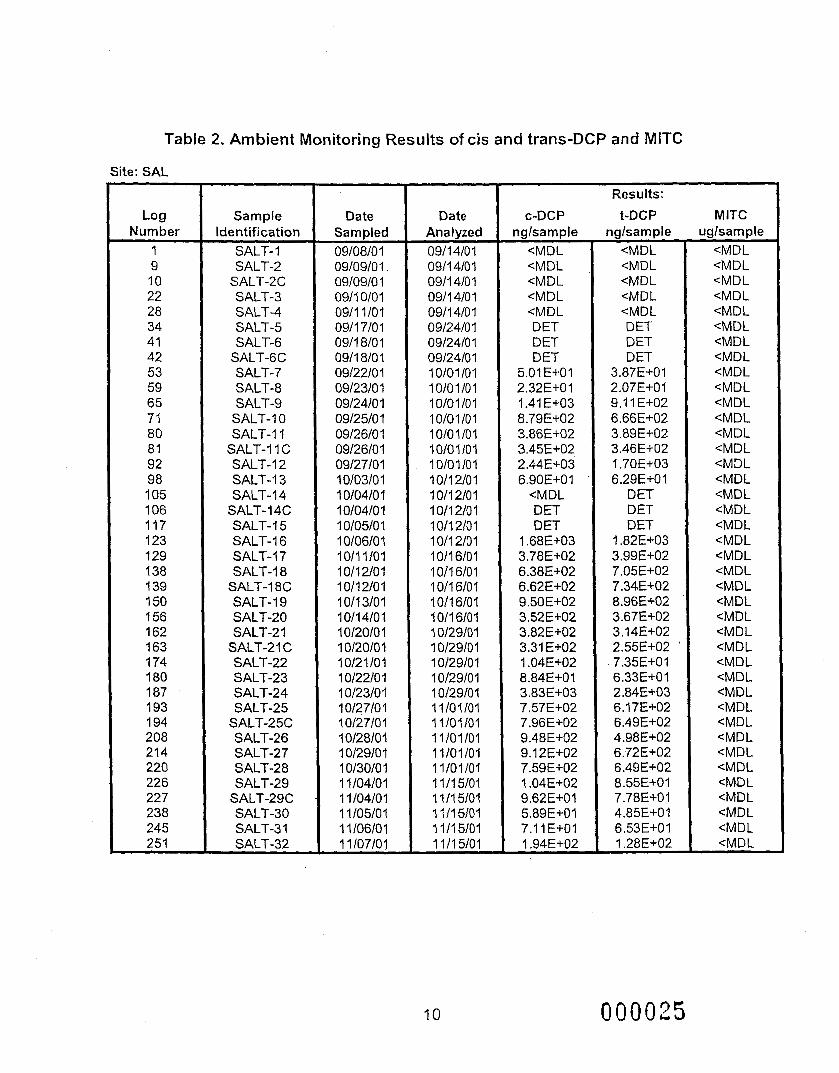
Table 2. Ambient Monitoring Results of cis and trans-DCP and MITC
Site: SAL
Log Number
I 9 10 22 28 34 41 42 53 59 65 71 80 81 92 98 105 106 117 123 129 138 139 150 156 162 163 174 180 187 193 194 208 214 220 226 227 238 245 251
Sample Identification
SALT- 1 SALT-2
SALT-2C SALT-3 SALT-4 SALT-5 SALT-6
SALT-6C SALT-7 SALTS SALT-9
SALT- 1 0 SALT-11
SALT-11 C SALT- 1 2 SALT-? 3 SALT-14
SALT-14C SALT-I 5 SALT-I 6 SALT-I 7 SALT-I 8
SALT-18C SALT- 1 9 SALT-20 SALT-2 1
SALT-21 C SALT-22 SALT-23 ,SALT-24 SALT-25
SALT-25C SALT-26 SALT-27 SALT-28 SALT-29
SALT-29C SALT-30 SALT-3 1 SALT-32
~~ ~
Date Sampled 09/08/01 09/09/01 09/09/01 091 1 010 1 0911 1/01 0911 7/01 09/18/01 0911 810 1 09/22/01 09/23/01 09/24/0 1 09/25/01 09/26/01 09/26/0 1 09/27/01 10/03101 I 0/04/0 1 1 Ol04lO 1 10/05/01 10/06/01 1011 1/01 1011 2/01 10/12/01 10/13/01 I 011 410 1 1 0/20/0 1 I 0/20/0 1 10/21/01 1 0/22/0 1 1 0/23/0 1 1 0/27/0 1 10/27/01 1 0/28/01 1 0/29/0 1 1 0/30/0 I 1 1 /04/01 1 1 /04/0 1 1 1 10510 1 I 1 /06/01 1 1 /07/01
~ ~~~ ~~~~
Date Analyzed 0911 410 1 0911 4/01 0911 4/01 0911 4/01 0911 4/01 09/24/0 I 09/24/01 09/24/01 1OlO1 101 10/01/01 10/01/01 10/01/01 10/01101 10101/01 10101/01 10/12/01 1011 2/01 1 011 210 1 1011 2/01 1011 2/01 10/16/01 I 011 6/01 1 0/16/0 1 loll 6/01 1011 6/01 10/29/01 1 0129101 1 012910 1 1 0/29/0 1 10/29/01 11/01/01 11/01/01 11/01/01 11/01/01 11/01/01 1111 5/01 1 111 5/01 I 1 I1 5/01 1 1 / I 5/01 1111 5101
10
C-DCP nglsample
<MDL <MDL <MDL <MDL <MDL D ET DET DET
5.01 E+OI 2.32E+01 1.41 E+03 8.79E+02 3.86E+02 3.45E+02 2.44E+03 6.90E+01
CMDL DET DET
I .68E+03 3.78E+02 6.38E+02 6.62E+02 9.50E+02 3.52E+02 3.82E+02 3.31 E+02 1.04E+02 8.84E+01 3.83E+03 7.57E+02 7.96E+02 9.48E+02 9.12E+02 7.59E+02 1.04E+02 9.62E+01 5.89E+01 7.1 1 E+01 1.94E+02
Results:
t-DCP nglsample
<MDL <MDL <MDL <MDL <MDL D ET DET DET
3.87E+01 2.07E+OI 9.1 1 E+02 6.66E+02 3.89Et02 3.46E+02 1.70E+03 6.29E+01
DET DET DET
1.82E+03 3.99E+02 7.05E+02 7.34E+02 8.96E+02 3.67E+02 3.14E+02 2.55E+02 ' 7.35E+01 6.33E+01 2.84E+03 6.17E+02 6.49E+02 4.98E+02
6.49E+02 8.55E+01 7.78E+01 4.85E+01 6.53E+01
6.72E+02
1.28E+02
000025
MITC uglsample
<MDL <MDL <MDL <MDL <MDL <MDL cMDL <MDL <MDL cMDL <MDL cMDL cMDL <MDL <MDL <MDL cMDL cMDL CMDL CMDL
CMDL cMDL
cMDL <MDL cMDL cMDL CMDL cMDL <MDL CMDL cMDL <MDL <MDL <MDL cMDL cM.DL cMDL cMDL cMDL <MDL

Table 2. Ambient Monitoring Results of cis and trans-DCP and MlTC
Site: CHU
Log Number
3 11 12 23
. 29 35 43 44 54 60 66 75 82 83 93 . 100 107 108 118 Q 24 133 140 141 151 157 164 165 175 181 188 195 196 209 215 22 1 228 229 240 246 252
Sample identification
CHUT-1 C H UT-2
CHUT-2C CHUT-3 C H UT-4 CHUT-5 C H UT-6
CHUT-6C CHUT-7 C H UT-8 C H UT-9
CHUT-I 0 CHUT-11
CHUT-I I C CHUT-12 CHUT-13 CHUT-14
CHUT-14C CHUT-15 CHUT-16 CHUT-17 CHUT-18
CHUT-I 8C CHUT-19 CHUT-20 CHUT-21
CHUT-21 C CHUT-22 CHUT-23 C H UT-24 CHUT-25
CHUT-25C C H UT-26 CHUT-27 C H UT-28 CHUT-29
C H UT-29C CHUT-30 CHUT-31 CHUT-32
Date Sampled
09/08/01 09/09/01 09/09/01 0911 0101 0911 1/01 0911 7/01 09/18/01 09/18/0 1 09/22/01 09/23/01 09/24/01 09/25/01 09/26/01 09/26/0 1 09/27/01 1 0/03/0 1 1 010410 1 1 010410 I 10105/01 1 0/06/0 1 10/11/01 10/12/01 1011 2/01 1011 3/01 I011 410 1 10/20/01 10/20/0 1 10/21/01 1 0/22/0 1 10/23/01 1 0/27/0 1 1 0/27/0 1 1 0/28/0 1 1 0/29/01 1 0/30/0 1 1 1/04/0 1 1 I /04/0 1 1 1 /05/0 1 I 1 /06/0 1 I 1/07/01
Date Analyzed
0911 4/01 09/14/01 09/14/01 09/14/01 09/14/01 09/24/01 09/24/01 09/24/0 1 10/01/01 1 o/o 1 101 10/01/01 10/01/01 10/01/01 10/01/01 10/01/01 1 011 210 1 1011 2/01 I 011 210 I 1011 2/01 10/12/01 1 011 6/0 1 10/16101 1 011 610 1 1011 6/01 1011 6/01 1 0/29/0 1 10129101 1 0/29/0 1 1 0/29/0 1 10/29/01 11/01/01 11/01/01 11/01/01 11/01/01 11/01/01 11/15/01 11/15/01 1 ? / I 5/01 1111 5/01 1111 5/01
C-DCP nglsample
<MDL <MDL <MDL <MDL <MDL D ET D ET D ET
6.83E+01 4.18E+01 7.63E+02
5.00E+02 4.05E+02 2.89E+02 1,63E+02 3.20E+02 3.31 E+02 6.23E+02 3.68Ea02
2.49E+02 2.52E+02 7.45E+02 3.42E+02 6.53E+02 6.10E+02 2.42E+02 I .23E+02 2.97E+02 8.55E+02 8.96E+02 3.75E+02
4.87E+03 2.48E+02 2.51 E+02 4.35E+01 3.67E+01 1.23E+02
1.93E+02
1.52E+02
2.71 E+03
Results: t-DCP
nglsampie
<MDL <MDL cMDL <MDL <MDL D ET D ET D ET
7.97E+01 5.03E+01 5.00E+02 1.4 1 E+02 3.08E+02 2.31 E+02 1.97E+02
2.52E+02 1.27E+02
2.62E+02 4.20E+02
1.68E+02 2.85E+02
3.20E+02
2.91 E+02 3.87E+02
5.40E+02 4.99E+02
1.05E+02
6.94E+02
3.33E+02 1.85E+03 4.05E+03 3.16E+02 3.22E+02 4.60E+01 3.75E+01 1.09E+02
2.1 5E+02
1.44E+02,
2.42E+02
7.35E+02
M ITC uglsampie
<MDL <MDL <MDL <MDL CMDL <MDL <MDL <MDL <MDL
<MDL cMDL
<MDL
CMDL <MDL CMDL <MDL CMDL CMDL CMDL CMDL
CMDL CMDL CMDL
CMDL CMDL CMDL CMDL
<MDL CMDL CMDL
CMDL
cMDL
cMDL
cMDL
cMDL
<MDL <MDL
cMDL CMDL
<MDL
11 0 0 0 0 ~ 6
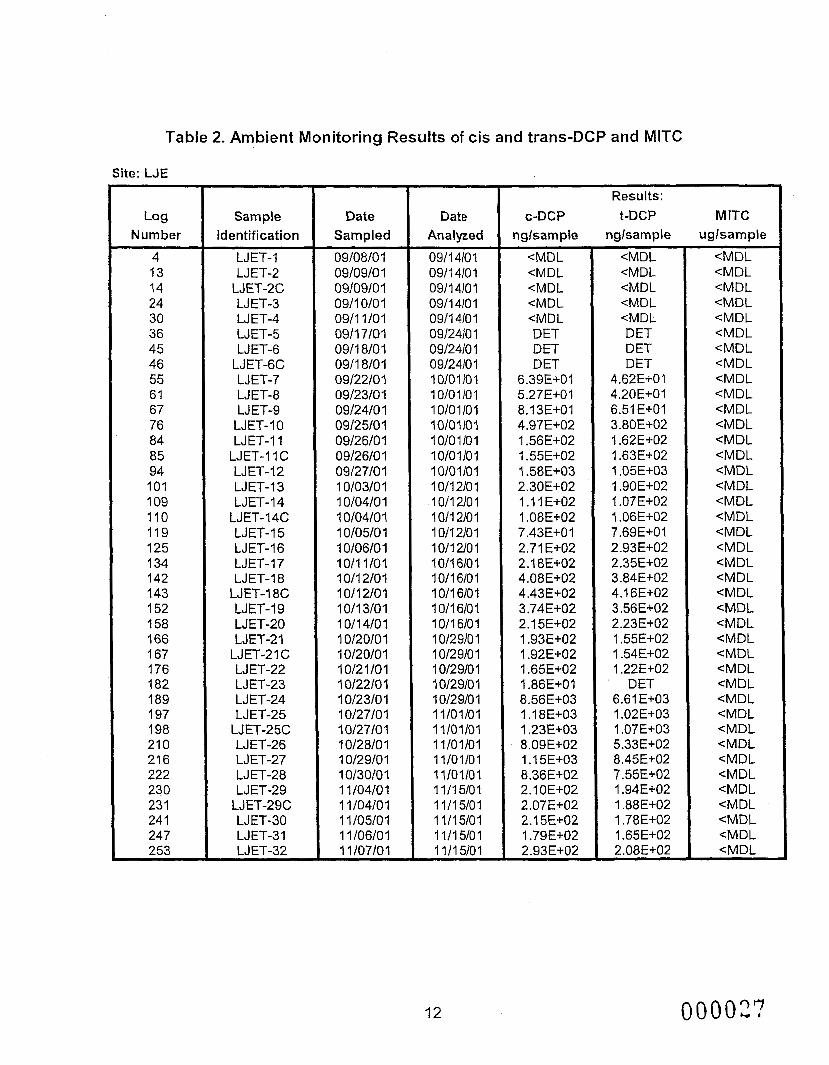
Table 2. Ambient Monitoring Results of cis and trans-DCP and MITC
Site: LJE
Log Number
4 13 14 24 30 36 45 46 55 61 67 76 84 85 94 101 109 110 119 125 134 142 143 152 158 166 167 176 182 189 197 198 210 21 6 222 230 23 1 24 1 247 253
Sample Identification
LJET-1 LJ ET-2
LJET-2C LJET-3 LJET-4 LJET-5 LJET-6
LJET-6C LJET-7 LJET-8 LJ ET-9
LJ ET- 10 LJET-11
LJET-11 C LJET-I2 LJET-13 LJET-14
LJET-14C LJET-15 LJET-16 LJET-17 LJET-18
LJET-18C LJET-I 9 LJET-20 LJET-21
LJ ET-2 1 C LJET-22 LJET-23 LJET-24 LJET-25
LJET-25C LJET-26 LJET-27 LJET-28 LJET-29
LJET-29C LJET-30 LJET-31 LJET-32
Date Sampled 09/08/0 1 09/09/01 09/09/0 1 09/10/01 09/11/01 0911 7/01 0911 8/01 09/18/01 09/22/01 09/23/01 09/24/01 09/25/01 09/26/01 09/26/01 09/27/01 1 0/03/0 1 1 0/04/0 1 1 0/04/0 1 10/05/01 10/06/01 I011 1 /01 10/12/01 10/12/01 10/13/01 1 0/14/0 1 10/20/01 10/20/01 10/21/01 10/22/01 I 0/23/0 1 1 0/27/0 1 10/27/01 1 0/28/0 1 1 0/29/0 1 10/30101 1 1 /04/0 1 I 1/04/0 1 1 1 /05/0 1 1 1 /06/01 1 1/07/01
Date Analyzed 09/14/01 09/14/01 0911 4101 09/14/0 1 09/14/01 09/24101 09/24/0 1 09/24/0 1 10/01101 10/01/0l 10/01/01 10/01101 10/01/01 10/01101 10/01101 1 0/12/0 1 1 0/12/0 1 10/12~01 1 0/1210 1 10/12/01 1011 6/01 1 0/16/0 1 1 0/16/0 1 1011 610 1 1 0/16/0 1 10/29/0 I 1 0/2 9/0 1 1 0/2 9/0 1 10/29/01 10/29/0 1 11/01/01 11/01/01 11/01/01 11/01/01 11/01/01 11/15/01 11/15/01 11/15/01 11/15/01 1111 5101
C-DCP nglsampie
<MDL <MDL <MDL cMDL <MDL DET DET D ET
6.39E+01 5.27E+01 8.13E+01 4.97E+02 1.56E+02 1.55E+02
2.30E+02 1 .I 1 E+02 1.08E+02 7.43E+01 2.71 E+02 2.1 8E+02 4.08E+02 4.43E+02
2.15E+02 1.93E+02 1.92E+02 1.65E+02 1.86E+01 8.56E+03 1 .18E+03 1.23E+03 8.09E+02 1 .I 5E+03 8.36E+02
2.07E+02
1.79E+02 2.93E+02
1.58E+03
3.74E+02
2.10E+02
2.1 5E+02
Results: t-DCP
nglsample €MDL <MDL cMDL <MDL <MDL DET DET D ET
4.62E+O1 4.20E+01 6.51 E+01 3.80E+02 I .62E+02 1.63E+02 1.05E+03 1.90E+02 1,07E+02 1.06E+02 7.69E+01 2.93E+02 2.35E+02 3.84E+02 4.1 6E+02 3.56E+02 2.23E+02 1.55E+02 1.54E+02 I .22E+02
6.61 E+03 1.02E+03 1.07E+03 5.33E+02 8.45E+02
1.94E+02 1.88E+02 1.78E+02 1.65E+02 2.08E+02
' DET
7.55E+02
M ITC uglsample
<MDL <MDL <MDL <MDL <MDL <MDL <MDL <MDL <MDL <MDL <MDL <MDL <MDL <MDL <MDL <MDL <MDL <MDL cMDL <MDL <MDL <MDL <MDL <MDL <MDL <MDL <MDL <MDL <MDL <MDL <MDL <MDL <MDL <MDL <MDL <MDL <MDL <MDL <MDL <MDL
12 OOOO"k?

Table 2. Ambient Monitoring Results of cis and trans-DCP and MlTC
Site: PMS
Log Number
5 15 16 25 31 37 47 48 56 62 68 77 86 87 95 102 111 112 120 126 135 144 145 1 53 159 168 169 177 183 I90 199 200 21 1 21 7 223 232 233 242 248 254
Sample Identification
PMST-1 PMST-2
PMST-2C PMST-3 PMST-4 PMST-5 PMST-6
PMST-6C P M ST-7 PMST-8 PMST-9
' PMST-10 PMST-I 1
PMST-1 I C PMST-12 PMST-13 PMST-14
PMST-14C PMST-15 PMST-16 PMST-17 PMST-18
PMST-18C PMST-19 PMST-20 P M ST-2 1
PMST-21 C PMST-22 PMST-23
. PMST-24 PMST-25
PMST-25C PMST-26 PMST-27 PMST-28 PMST-29
PMST-29C PMST-30 PMST-31 PMST-32
Date Sampled
09/08/0 1 09/09/01 09/09/01 0911 0/01 0911 1 /o 1 0911 7/01 09/18/01 09/18/01 09/22/01 09/23/01 09/24/01 09/25/01 09/26/0 1 09/26/01 09/27/01 1 0/03/0 1 10/04/01 10/04/01 1 0/05/0 1 1 0/06/0 1 10/11/01 10/12/01 10/12/01 10/13/01 10/14/01 10/20/01 10/20/01 10/21/01 10/22/01 1 0/23/0 1 1 0/27/0 1 1 0/27/0 1 10/28/01 1 0/29/0 1 1 0/30/0 1 1 1 10410 1 1 I /04/0 1 I 1 /05/0 1 1 1 /06/01 1 1 /07/01
Date Analyzed
09/14/01 0911 4/01 09/14/01 0911 410 1 09/14/01 09/24/01 09/24/01 09/24/01 10/01/01 1 010 I /01 10/01/01 10/01/01 10/01/01 10/01/01 10/01/01 1011 2/01 1011 2/01 1011 2/01 1011 2/01 I 0/12/01 1011 6/01 10/16/01 1011 6/01 1011 6101 10/16/01 10/29/01 10/29101 10/29/01 10/29/01 10/29101 11/01/01 11/01/01 11/01/01 11/01/01 11/01/01 1 1 / I 5/01 1111 5/01 1111 5/01 1 1 / I 5/01 1 1 I1 5/01
13
C-DCP nglsample
CMDL 9.24E+01 3.24E+02 2.01 E+02 1.66E+02 3.30E+02 3.87E+02 3.77E+02 2.67E+02 3.55E+02 1.94E+03 8.24E+03 I .41 E+03 I .34E+03 2.91 E+03
cMDL
2.22E4-02 2.97E+02 3.64E+02 7.78E+02 1.92E+03 1.82E+03
2.08E+02
1.01 E+03 7.1 1 E+02 3.57E+02 3.55E+02 2.40E+02 3.33E+02 6.53E+02 1.60E+02 1.64E+02 9.30E+01 3.76E+03 2.45E+02 1.82E+02
2.43E+02 4.27E+02
1.70E+-02
4.49E+02
Results: t-DCP M ITC
nglsample. uglsample
<MDL 8.75E+01 3.03E.tO2 I .73E+02 1.40E+02 2.58E+02. 3.18E+02 3.10E+02 2.26E+02 2.90E+02 1.41 E+03 6.03E+03
1.08E+03 I .I 7E+03
2.29E+03 cMDL I .79E+02 1.90E+02 2.89E-t-02 3.37E+02 6.90E+02 I .52E+03 I .44E+03 8.55E+02 6.66E+02 3.25E+02 3.10E+02 1.78E+02 2.72E+02 5.96E+02 1.64%+02 I .68E+02 9.99E+Ol 2.68E+03 2.06E+02 1.61 E+02 I 5 1 E+02 1.87Et02
3.19E+02 2.92E+02
<MDL <MDL
CMDL CMDL <MDL
CMDL
cMDL
cMDL
<MDL CMDL <MDL CMDL
CMDL cMDL
<MDL cMDL <MDL <MDL <MDL cMDL
CMDL
cMDL
CMDL
<MDL <MDL CMDL CMDL CMDL cMDL CMDL <MDL CMDL CMDL CMDL
CMDL
CMDL
CMDL
CMDL
CMDL
CMDL
0 0 0 0 ~ 8
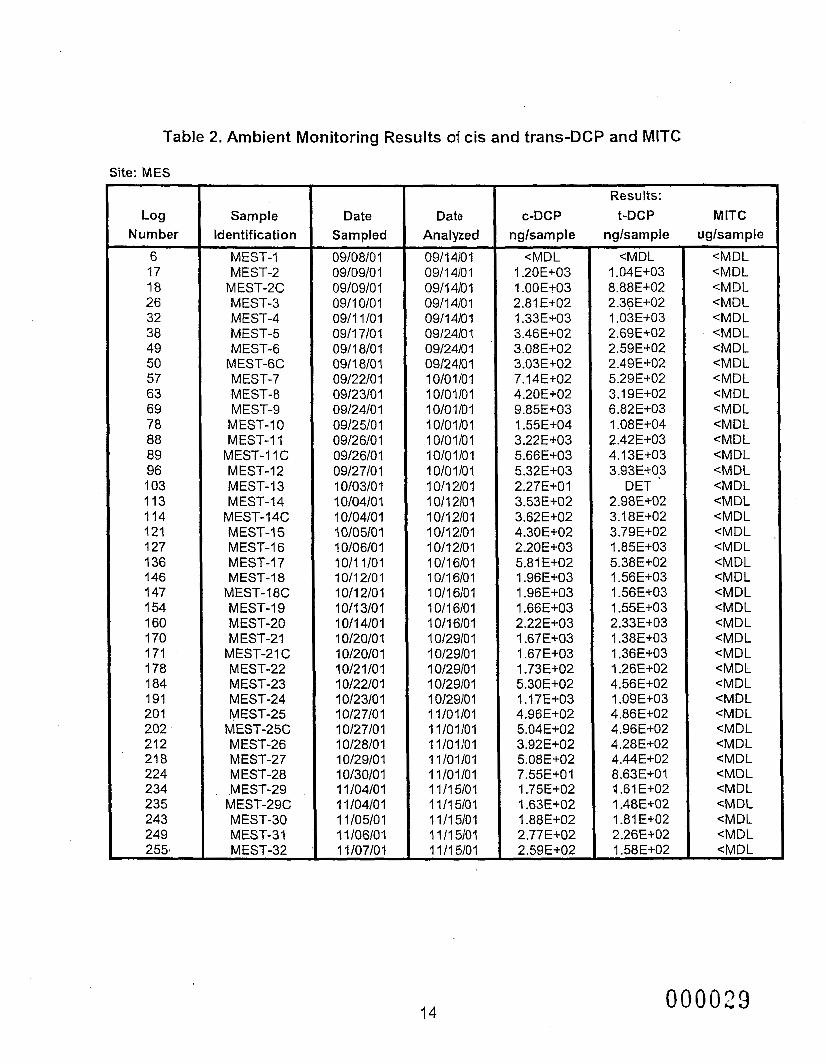
Table 2. Ambient Monitoring Results of cis and trans-DCP and MlTC
Site: MES
Log Number
6 17 18 26 32 38 49 50 57 63 69 78 88 89 96 103 113 114 121 127 136 146 147 154 160 170 171 178 184 191 20 1 202 212 21 8 224 234 235 243 249 255,
Sample Identification
MEST-1 MEST-2
MEST-2C MEST-3 MEST-4 MEST-5 MEST-6
MEST-6C MEST-7 MEST-8 MEST-9
MEST-10 MEST-11
MEST-11 C MEST-12 MEST-13 MEST-14
MEST-14C MEST-I 5 MEST-16 MEST-17 M EST-I 8
MEST-18C MEST-19 MEST-20 M EST-21
MEST-21 C MEST-22 M EST-23 MEST-24 MEST-25
MEST-25C MEST-26 MEST-27 M EST-28 .MEST-29 MEST-29C MEST-30 MEST-31 MEST-32
Date Sampled
09/08/0 1 09/09/0 1 09/09/01 091 1 010 1 0911 1/01 0911 7/01 0911 8/01 0911 810 1 09122lO 1 09/23/0 1 09/24/0 1 09/25/01 09/26/01 09/26/01 09/27/01 1 0/03/0 1 10/04/0 I 1 0/04/0 1 10/05/01 10106101 1011 1/01 1 011 210 1 1011 2/01 1 011 310 1 10/14/01 1 0/2010 1 1 0/20/0 1 10/21/01 1 0/22/01 10/23/01 10/27/0 1 10/27/0 1 1 012810 1 1 0/29/0 1 1 0/30/0 1 1 1 /04/01 1 I l04/01 11/05/01 1 1 106101 1 1 /07/0 1
Date Analyzed
09/14/01 0911 4/01 09114101 091 1 410 1 09/14/01 09/24/01 09/24/01 09/24/01 10101/01 10/01/01 10/01/01 10101101 10101/01 10/01/01 10/01/01 10/12/01 10/12/01 1 011 210 1 I011 2/01 1011 2/01 1011 6/01 1011 6/01 1 011 610 1 1011 6/01 10/16/01 1 Ol29101 1 0/29/0 1 1 012910 1 1 012910 1 1 0/29/0 1 11/01/01 11/01/01 11/01/01 11/01/01 11/01/01 1111 5/01 1 1 / I 5/01 1 1 / I 5/01 1 1 / I 5/01 1111 5/01
C-DCP nglsample
<MDL 1.20E+03 1.00Et03 2.81 E+02 1.33E+03 3.46E+02 3.08E+02 3.03E+02 7.14E+02 4.20E+02 9.85E+03 1.55E+04 3.22E+03 5.66E+03 5.32E+03 2.27E+01 3.53E+02 3.62E+02 4.30E+02 2.20E+03 5.81 E+02 1.96E+03 1.96E+03 1.66E+03 2.22E+03 1 .67E+03 1.67E+03 1.73E+02 5.30E+02 1.17E+03 4.96E+02 5.04E+02 3.92E+02 5.08E+02 7.55E+01 1.75E+02 1.63E+02 I .88E+02 2.77E+02 2.59E+02
Results: t-DCP
nglsample
<MDL 1.04E+03 8.88E+02 2.36E+02 I .03E+03 2.69E+02 2.59E+02 2.49E+02 5.29E+02 3.19E+02 6.82E+03 1.08E+04 2.42E+03 4.13E+03 3.93E+03
D ET 2.98E+02 3.18E+02 3.79E+02 1.85E+03 5.38E+02 1.56Et-03 1.56E+03 1.55E+03 2.33E+03 1.38E+03 1.36E+03 1.26E-t-02 4.56E+02 1.09E+03 4.86E+02 4.96E+02 4.28E+02 4.44Et.02 8.63E+01 3.61 E+02 I .48E+02 1.81 E+02 2.26E302 1.58E+02
M ITC uglsample
<MDL <MDL <MDL <MDL <MDL <MDL <MDL <MDL <MDL <MDL <MDL <MDL <MDL <MDL <MDL <MDL <MDL <MDL <MDL <MDL CMDL CMDL <MDL <MDL <MDL <MDL <MDL CMDL <MDL <MDL <MDL <MDL <MDL eMDL <MDL <MDL <MDL <MDL <MDL <MDL
14 000029
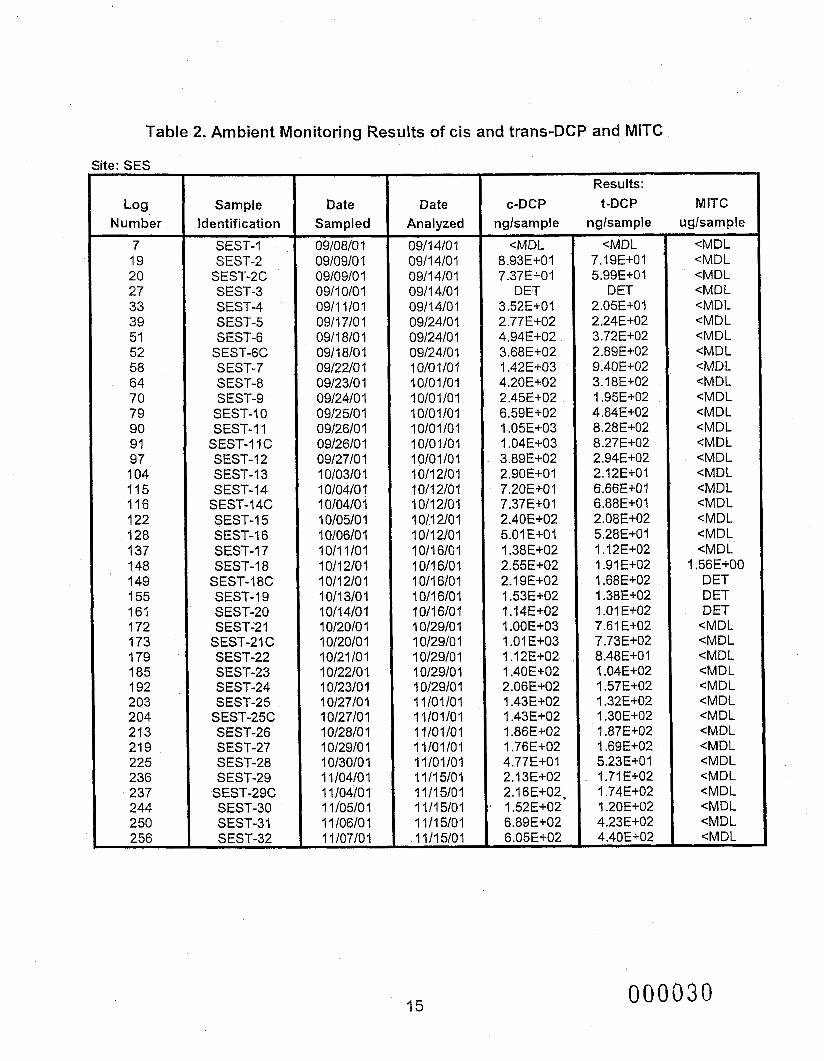
Table 2. Ambient Monitoring Results of cis and trans-DCP and MlTC
Site: SES
Log Number
7 19 20 27 33 39 51 52 58 64 70 79 90 91 97 104 115 116 122 128 137 148 149 155 161 172 173 179 185 192 203 204 213 21 9 225 236 237 244 250 256
I
Sample Identification
SEST-1 SEST-2
SEST-2C SEST-3 SEST-4 SEST-5 SEST-6
SEST-6C SEST-7 SEST-8 SEST-9
SEST-I 0 SEST-1 I
SEST-11 C SEST-12 SEST-13 S EST- 14
SEST-14C SEST-15 SEST-16 SEST-I 7 SEST-18
SEST-18C SEST-19 SEST-20 SEST-21
S EST-2 I C SEST-22 SEST-23 SEST-24 SEST-25
SEST-25C SEST-26 SEST-27 SEST-28 SEST-29
SEST-29C SEST-30 SEST-31 SEST-32
Date Sampled 0910810 1 0910910 I 09/09/0 1 09/10/01 0911 1/01 0911 7/0 I 0911 8/0 1 09/18/01 09/22/0 1 09/23/01 09/24/0 1 09/25/01 09/26/0 1 09/26/01 09/27/0 1 10/03/0 I 1 0/04/0 1 I 010410 I I 010510 1 10/06/01 10/11/01 10/12/01 1 011 210 1 1 011 3/0 1 I 011 410 I 1 0/20/0 1 10/20/0 1 10/21 /o 1 I 0/22/0 1 I 0/23/0 1 10/27/0 I 10/27/01 10/28/0 1 10/29/0 1 10/30/01 1 1 /04/0 1 1 1 /04/0 1 1 1 /05/0 1 I 1 /06/0 1 1 110710 1
Date Analyzed 09/14/0 1 091 1 4/0 1 09/14/01 09/14/01 09/14/01 0912410 1 09/24/01 09/24/01 10/01/01 10/01/01 10/01/01 10/01/01 10/01/01 10/01/01 10/01/01 10/12/01 10/12/01 1011 2/01 1 011 210 1 1 011 210 1 1011 6/01 1 0/16/0 1 1 0/16/0 1 10/16/01 1011 6/01 1 0/29/0 1 1 0/29/0 1 I 0/29/0 1 I 0/29/0 1 I 0/29/0 I 11/01/01 11/01/01 11/01/01 11/01/01 11/01/01 11/15/01 11/15/01 1111 5/01 1111 5/01 1 I/l 5/01
C-DCP nglsample
<MDL 8.93E+01 7.37E+OI
DET 3.52E+01 2.77E+02 4.94E+02 3.68E+02 1.42E+03 4.20E+02 2.45E+02 6.59E+02 1.05E+03 1.04E+03 3.89E+02 2.9OE+Ol
7.37E+01
5.01 E+O1
7.20E+01
2.40E+02
I .38E+02 2.55E+02 2.1 9E+02 1.53E+02
1 .OOE+03
1 .12E+02
I .14E+02
1.01 E+03
1.40E+02 2.06E+02 1.43E+02 1.43E+02 1.86E+02 1.76E+02 4.77E+01 2.13E+02 2.16E+02, 1.52E+02 6.89E+02 6.05E+02
Results: t-DCP
nglsample <MDL
7.19E+01 5.99E+01
D ET 2.05E+01 2.24E+02 3.72E+02 2.89E+02 9.40E+02 3.18E+02 1.95E+02 4.84E+02 8.2a~+o2 a.27~+02 2.94E+02 2.12E+OI 6.66E+01 6.88E+01 2.08E+02
I .12E+02 1.91 E+02 1.68E+02 1.38E+02 1.01 E+02 7.61 E+02 7.73E+02 8.48E+OI 1.04E+02 1.57E+02 1.32E+02 1.30E+02 1.87E+02 I .69E+02
1.71 E+02 1.74E+02 1.20E+02
5.28E+01
5.23E+01
4.23E+02 4.40E+02
MITC uglsample
<MDL <MDL <MDL <MDL <MDL cMDL <MDL CMDL CMDL cMDL <MDL cMDL <MDL <MDL cMDL <MDL cMDL cMDL cMDL cMDL cMDL
1.56E+00 D ET D ET DET
CMDL CMDL <MDL cMDL cMDL cMDL cMDL CMDL <MDL cMDL cMDL CMDL CMDL cMDL cMDL
15 000030
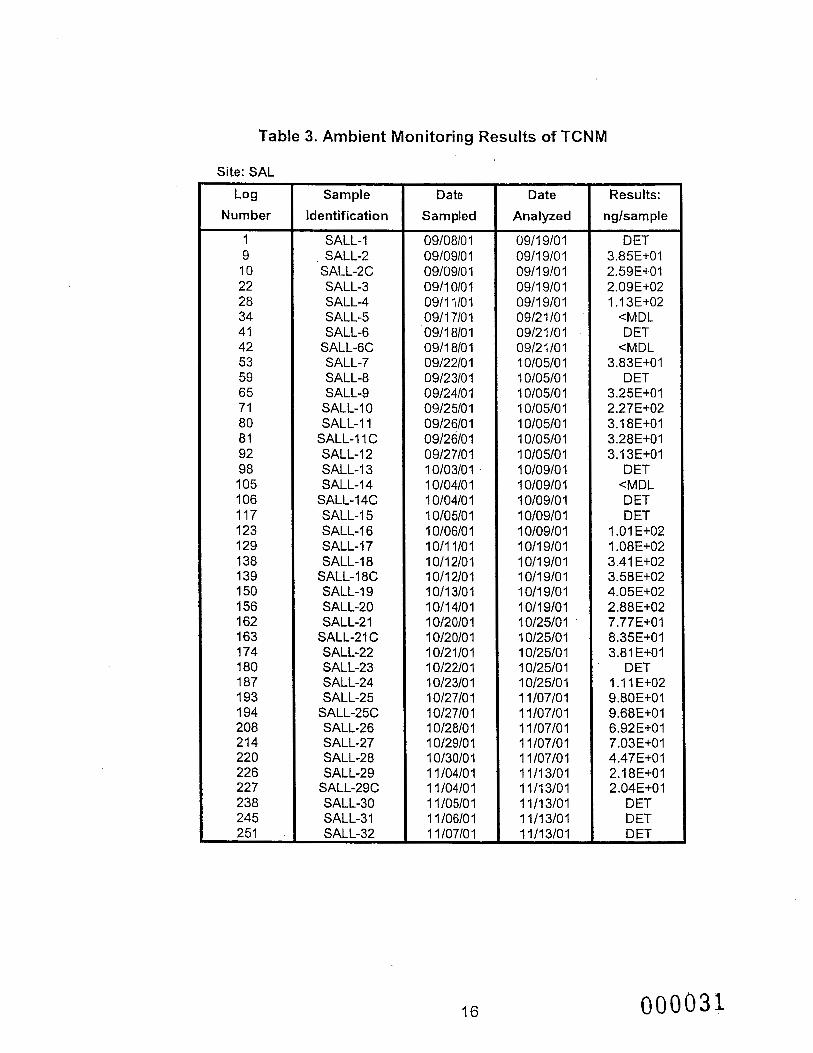
Table 3. Ambient Monitoring Results of TCNM
Site: SAL
Log Number
1 9 10 22 28 34 41 42 53 59 65 71 80 81 92 98 105 106 117 123 129 138 139 150 156 162 163 174 180 187 193 194 208 214 220 226 227 238 245 251 .
Sample
Identification
SALL-1 , SALL-2 SALL-2C SALL-3 SALL-4 SALL-5 SALL-6
SALL-6C SALL-7 SALL-8 SALL-9
SALL-10 SALL-11
SALL-11 C SALL-12 SALL-13 SALL-14
SALL-14C SALL-15 SALL-16 SALL-17 SALL-18
SALL-18C SALL-19 SALL-20 SALL-2 1
SALL-21 C SALL-22 SALL-23 SALL-24 SALL-25
SALL-2% SALL-26 SALL-27 SALL-28 SALL-29
SALL-29C SALL-30 SALL-3 1 SALL-32
Date
Sampled
09/08/0 1 09/09/0 1 09/09/01 09/10/01 09/11/01 09/17/01 09/18/01 09/18/01 09/22/01 09/23/01 09/24/0 1 09/2 510 1 09/26/01 09/26/0 1 09/27/01 1 0/03/0 1 1 0/04/0 1 10/04/01 1 0/0 510 1 10/06101 10/11/01 10/12101 10/12/01 10/13/01 10/14/01 1 0/2010 1 1 0/2010 I 10/21/01 1 0/2210 1 1 0/23/0 I 1 0/27/0 1 1 0/27/0 1 1 0/28/0 1 1 0/29/0 1 1 0/30/0 1 1 1 /04/0 1 1 I /04/0 1 1 1 /05/0 1 1 1 /0610 1 1 1 /07/0 1
Date
Analyzed
09/19/01 09/19/01 09/19/0 1 09/19/01 09/19/01 09/21/01 09/2 110 1 09/2 1 /O 1 1 0/05/0 1 1 0/05/0 1 1 0/05/0 1 1 010510 1 1 010510 1 1 0/05/0 1 I 010510 1 1 0/09/0 I 10/09/01 10/09/01 1 010910 1 1 0/09/0 1 10/19/01 10/19/01 1 011 9/0 1 1011 9/01 1011 9/01 1 0/25/0 1 I 0/25/0 1 1 0/25/0 1 '1 0/25/0 I 1 0/25/0 1 1 1 /07/0 1 1 I /07/0 1 1 1 /07/0 1 1 1 /07/01 1 1 /07/01 11/13/01 11/13/01 1 1 /I 3/01 11/13/01 11/13/01
Results:
nglsample
D ET 3.85E+01 2.59E+01 2.09E+02 1.1 3E+02
<MDL D ET
cMDL 3.83E+01
D ET 3.25E+01 2.27E+02 3.18E+01 3.28E+01 3.13E+01
<MDL DET
D ET DET
I .01 E+O2 1.08E+02 3.41 E+02 3.58E+02 4.05E+02 2.88E+02 7.77E+01 8.35E+01 3.81 E+01
D ET 1 .I 1 E+02 9.80E+01 9.68E+01 6.92E+01 7.03E+OI 4.47E+01 2.18E+01 2.04E+01
D ET DET D ET
16 000031
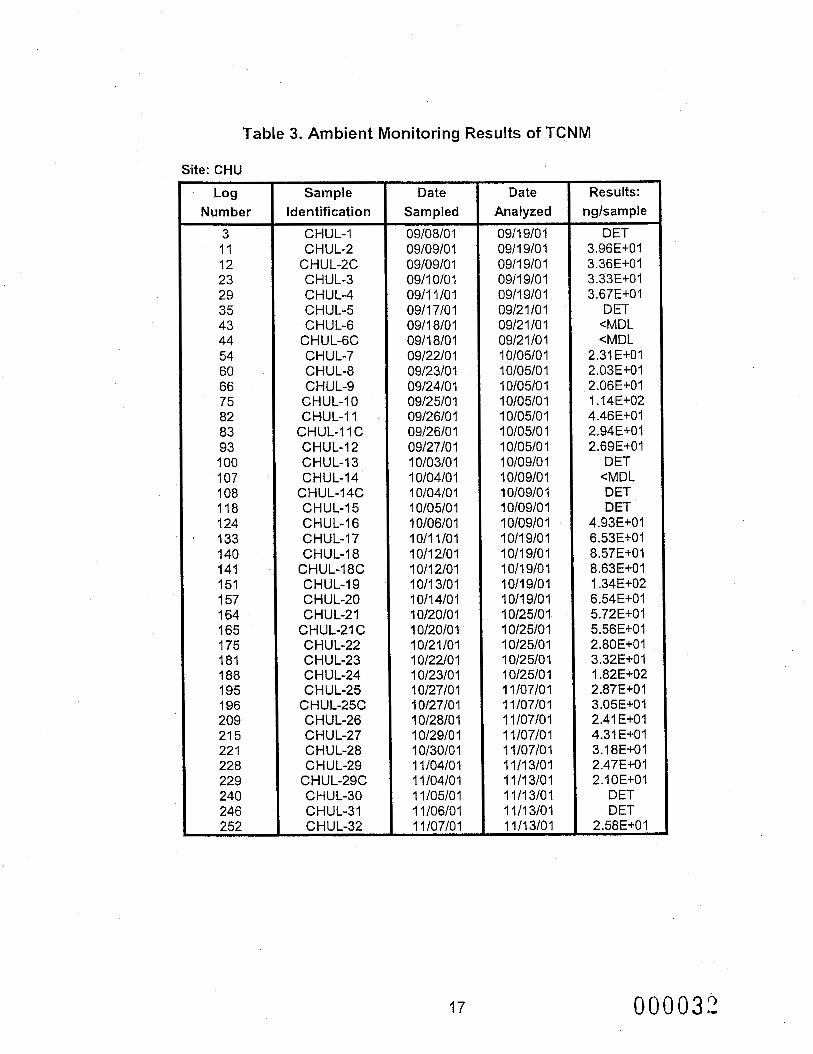
Table 3. Ambient Monitoring Results of TCNM
Site: CHU
Log Number
3 11 12 23 29 35 43 44 54 60 66 75 82 83 93 100 107 108 118 124
' 133 140 141 151 157 164 165 175 181 188 195 196 209 21 5 22 1 228 229 240 246 252
Sample Identification
CHUL-1 CHUL-2
CHUL-2C CHUL-3 CHUL-4 CHUL-5 CHUL-6
CHUL-6C CHUL-7 CHUL-8 CHUL-9
CHUL-10 CH,UL-I 1
CHUL-11 C CHUL-12 CHUL-I3 CHUL-14
CHUL-14C CHUL-I5 CHUL-16 CHUL-17 CHUL-18
CHUL-18C CHUL-19 CHUL-20 CHUL-21
CHUL-21 C CHUL-22 C H U L-23 C H U L-24 CHUL-25
CHUL-25C CHUL-26 CHUL-27 CHUL-28 CHUL-29
CHUL-29C C H U L-30 CHUL-31 CHUL-32
Date Sampled
09/08/01 09/09/01 09/09/01 09/10/01 09/11 /01 09/17/01 09/18/01 09/18/01 09/22/01 09/23/0 1 09/24/01 09/25/01 09/26/01 09/26/0 1 09/27/01 10/03/01 10/04/01 1 0/04/0 I 10/05/01 10/06/01 10/11/01 1011 2/01 1 O/I 2101 10/13/01 10/14/01 10/20/01 1 0120/0 1 10/21/01 1 0/22/0 1 1 0/23/0 1 1 0127101 10/27/01 10/28101 1 0/29/0 1 10/30/01 1 1 /04/0 1 1 1 /04/0 I 1 1/05/01 I 1 /06/0 1 1 1 /07/01
17
Date Analyzed
0911 9/0 1 0911 9/0 1 0911 9/01 0911 9/0 1 09/19/0 1 09/2 1 10 1 09/2 110 1 09/2 1 /O 1 1 010510 1 10/05/0 1 1 0/05/'0 1 1 0/05/0 1 1 010510 1 1 0/05/0 I 10/05/0 1 1 0/09/0 1 1 0/09/0 1 1 0/09/0 1 10/09/0 1 1 0109/0 1 1011 9/01 1 011 910 1 1 011 9/0 1 1 011 9/0 1 1011 9/01 1 0/25/0 1 1 0/25/0 1 1 0/25/0 1 1 0/25/0 1 1 0/25/0 1 1 1 /07/0 1 I 1 /07/0 1 1 110710 1 1 I /07/0 1 1 1 /07/0 1 11/13/01 11/13/01 11/13/01 11/13/01 1 1 / I 3/01
Results: nglsample
D ET 3.96E+01 3.36E+Ol 3.33E+01 3.67E+01
DET cMDL <MDL
2.31 E+01 2.03E+01 2.06E+01 1 .14E+02 4.46Et01 2.94E+01
DET
DET D ET
4.93E+01 6.53E+01 8.57E+01 8.63E+01 1.34E+02 6.54E+01
5.56E+01 2.80E+01 3.32E+01 1.82E+02 2.87E+01 3.05E+O1 2.41 E+01 4.31 E+01 3.18E+01 2.47E+01
DET DET
2.69E+01
<MDL
5.72E+01
2.10E+01
2.58E+01
000033

Table 3. Ambient Monitoring Results of TCNM
Site: LJE . Log
Number 4 13 14 24 30 36 45 46 55 61 67 76 84 85 94 101 109 1 I O 119 125 134 142 143 152 158 166 167 176 182 189 197 198 21 0 21 6 222 230 231 24 1 247 253
Sample Identification
LJEL-1 LJEL-2
LJEL-2C LJEL-3 LJ EL-4 LJEL-5 LJEL-6
LJEL-6C LJ EL-7 LJEL-8 LJEL-9 LJEL-10 LJEL-11
LJEL-11 C LJEL-12 LJEL-I3 LJEL-14
LJEL-14C LJEL-15 LJEL-16 ' LJEL-17 LJEL-18
LJEL-18C LJEL-19 LJEL-20 LJEL-21
LJEL-21 C L J EL-22 LJEL-23 LJEL-24 LJEL-25
LJEL-25C LJEL-26 LJEL-27 LJEL-28 LJEL-29
LJEL-29C LJ EL-30 LJEL-31 LJEL-32
Date Sampled 0910810 1 09/09/0 1 09/09/0 1 09/10/01 09/11/01 09/17/01 091'1 810 1 09/18/01 09/2aO 1 09/23/01 09/24/01 09/25/01 09/26/01 0 9/26/0 1 09/27/01 I 0/03/0 1 1 0/04/0 1 1 0/04/0 1 1 0/05/0 1 1 0/06/O 1 10/11/01 1 0/12/0 1 10/12/01 I011 3/01 10/14/01 1 0/20/0 1 10/20/01 1 0/2 1/01 1 0/22/0 1 10/23/01 10/27/01 10/27/01 1 0/28/0 1 1 0/29/0 1 10/30/01 1 1 /04/0 1 1 1 /04/0 1 1 1 /05/0 1 1 1 /06/0 1 I 1 /07/01
Date Analyzed 09/19/01 09/19/01 09/19/01 09/19/01 09/19/01 09/2 1 /O 1 0912 1 /O 1 09/21/01 10/05/01 1 0/05/0 1 I 0/05/0 1 1 0/0 5/0 I 1 0/0 5/0 I 1 0/05/0 1 I 0/05/0 1 10/09/01 1 0/09/0 1 1 0/09/0 1 1 0/09/0 1 1 0/09/0 1 10/19/01 10/19/01 10/19/01 1011 9/01 10/19/01 I 0/25/0 1 1 0/25/0 1 1 0/25/0 1 1 0/25/0 1 1 0/25/0 1 I 1 /07/0 1 I I /07/0 1 1 1 /07/0 1 1 1 /07/0 1 1 1 /07/0 1 11/13/01 11/13/01 11/13/01 11/13/01 11/13/01
Results: nglsample
<MDL 2.44E+02 2.64E+02 1.02E+02 4.66E+OI
D ET D ET DET
7.65E+01 4.40E+01 5.32E+01 7.48E+01 2.66E+01
D ET D ET
2.10E+01 DET DET DET
7.61E+01
3.32E+02
3.38E+OI
3.15E+02
1 .I OE+03 4.94E+02 1.54E+02 1 .I 5E+02 3.45E+01
' DET 4.90E+02 2.17E+02 2.28E+02 1.87E+03 8.75E+02 2.26E+02 2.87E+01 2.69E+01 1.99E+01
DET DET
18 000033
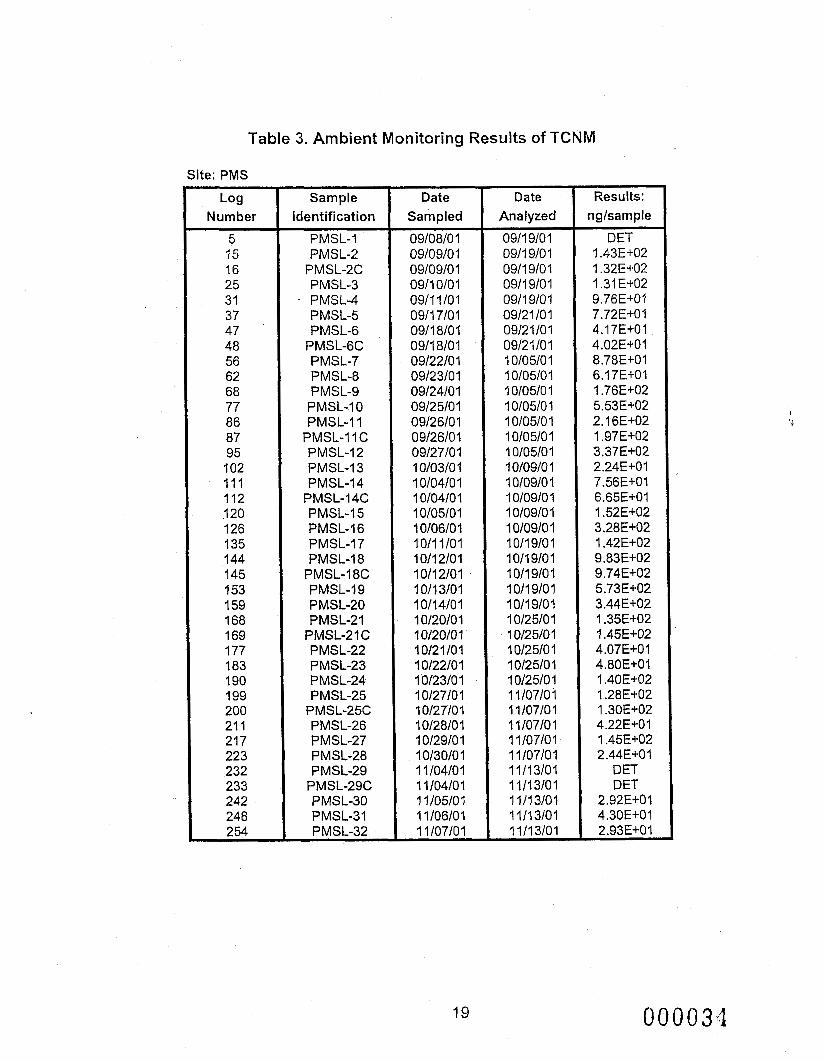
Table 3. Ambient Monitoring Results of TCNM
Site: PMS
Log Number
5 15 16 25 31 37 47 48 56 62 68 77 86 87 95 102 111 112 120 126 135 144 145 153 159 168 169 177 183 190 199 200
I 211 21 7 223 232 233 242 248 254
Sample Identification
PMSL-1 PMSL-2
PMSL-2C PMSL-3
’ PMSL-4 PMSL-5 PMSLS
PMSL-6C PMSL-7 PMSL-8 PMSL-9 PMSL-10 PMSL-11
PMSL-11 C PMSL-I 2 PMSL-13 PMSL-14
PMSL-14C PMSL-15 PMSL-16 PMSL-I 7 PMSL-18
PMSL-18C PMSL-I 9 PMSL-20 PMSL-21
PMSL-21 C PMSL-22 PMSL-23 PMSL-24 PMSL-25
PMSL-25C PMSL-26 PMSL-27 PMSL-28 PMSL-29
PMSL-29C PMSL-30 PMSL-31 PMSL-32
Date Sampled
0910810 1 09/09/01 09/09/01 09/10/01 09/11 /o 1 09/17/01 0911 8/01 0911 8/01 09/22/01 09/23/01 09/24/01 09/25/01 09/26/01 09/26/01 09/27/01 10/03/0 1 1 0/04/0 I 1 0/04/0 1 10/05/01 10/06/01 10/11/01 1011 2/01 I011 2/01 10/13/01 10/14/01 I 012010 1 I 0/20/0 1 10121101 1 0122/01 1 0/23/0 1 1 0/27/0 1 10/27/01 1 0/28/0 1 1 0/29/0 1 10/30/0 1 1 1 /04/0 1 1 1/04/0 1 1 1 /05/0 1 1 1 /06/0 1 1 1 /07/01
Date Analyzed
0911 9/01 09/19/01 0911 9/01 09/19/01 09/19/0 1 09/21 /O 1 09/2 110 1 0912 1 /O 1 1 010510 1 1 0/05/0 I I 0/05/0 1 1 0/05/0 1 1 0/05/0 1 1 0/05/0 1 I 0105/0 1 10/09/0 I I 0/09/0 1 I 0/09/0 1 1 0/09/0 I 1 0/09/0 I 1 011 910 1 1 011 910 1 1 011 910 I 1 011 9/0 I 1 011 9/0 1 I 0/25/0 I 1 0/25/0 1 I 0/25IO 1 10/25/0 I 10/25/0 1 I 1 /07/0 I 1 I10710 1 I 1 /07/0 1 1 1 /07/0 1 1 1 /07/0 I 11/13/01 11/13/01 11/13/01 11/13/01 11/13/01
Results: nglsample
D ET 1.43E+02 I .32E+02 1.31 E+02 9.76E+01 7.72E+01 4.17E+01 4.02E+01 8.78E+01 6.17E+01 1.76E+02 5.53E+02 2.16E+02 1.97E+02 3.37E+02 2.24E+01 7.56E+01 6.65E+01 1.52E+02 3.28E+02 1.42E+02 9.83E+02 9.74E+02 5.73E+02 3.44E+02 1.35E+02 1.45E+02 4.07E+01 4.80E+01 1.40E+02 1.28E+02 1.30E+02 4.22E+01 1.45E+02 2.44E+01
DET DET
2.92E+01 4.30E+01 2.93E+01
I 9 000034

Table 3. Ambient Monitoring Results of TCNM
Site: MES
Log Number
6 17 18 26 32
49 50 57 63 69 78 88 89 96 103 113 114 121 127 136 146 147 154 160 170 171 178 184 191 201 202 21 2 21 8 224 234 235 243 249 255
38
Sample Identification
MESL-1 MESL-2
MESL-2C MESL-3 MESL-4 MESL-5 MESL-6
M ESL-6C MESL-7 M ESL-8 MESL-9
MESL-10 MESL-11
MESL-11 C MESL-12 MESL-13 MESL-14
MESL-14C MESL-15 MESL-16 MESL-17 MESL-18
MESL-18C MESL-I 9 M ESL-20 MESL-21
MESL-21 C MESL-22 MESL-23 M ESL-24 MESL-25
MESL-25C M ESL-26 MESL-27 MESL-28 M ESL-29
MESL-29C MESL-30 MESL-31 MESL-32
Date Sampled
09/08/01 09/09/0 I 09/09/01 09/10/01 0911 1/01 09/17/01 0911 810 1 09/18/01 09/22/0 1 09/23/01 09/24/01 09/25/01 09/26/01 09/26/0 1 09/27/01 10103101 1 010410 1 1 010410 1 1 010510 1 1 0/06/0 1 10/11/01 1 0/12/01 1011 2/01 1011 3/01 1 011 410 1 1 0/20/0 1 1 0/20/0 1 10/21/01 1 0/22/0 1 1 0/23/0 1 I 012710 I 1 012710 1 1 0/28/0 1 1 0/29/0 1 1 0/30/0 1 1 1104/0 1 1 1 10410 1 1 I /05/01 1 110610 1 11/07/01
Date Analyzed
09/19/01 09/19/01 0911 9/01 09/19/01 0911 9/01 0912 1 10 1 0912 1 /O 1 09/2 1 /O 1 1 010510 1 10/05/01 1 0/05/0 1 1 0105/01 10105/01 1 0/05/0 1 1 0/05/0 1 1 010910 1 1 0/0910 1 1 0/09/0 I 1 0/09/0 1 1 0/09/0 1 1 011 9/0 1 I 011 9/0 1 1 011 910 1 1011 9/01 1 011 910 1 1 012510 1 1 0/25/0 1 1 0/25/0 1 1 0/25/0 1 1 0/25/0 1 1 1 /07/0 1 1 1 /07/0 1 1 1 107101 1 1 /07/0 I 1 I 10710 I 1 1 I1 3/01 11/13/01 1 1 /I 3/01 11/13/01 1 1 / I 3/01
Results: nglsample
<MDL 6.76E+01 6.33E+01
NA 1.24E+02 4.64E+01 2.1 6E+01 3.53E+01 6.55E+01 4.88E+01 5.58E+02 I .O 1 E+03 4.09E+02 4.40E+02 5.25E+02
DET 9.87E+01 9.20E+01 1.48E+02 8.72E+02 3.03E+02 3.70E+02 4.12E+02 2.82E+02 1.65E+02 4.65E+02 4.50E+02 4.10E+01 7.72E+Ol 1.98E+02 1.82E+02 2.01 E+02 1.89E+02 2.36E+02 5.81 E+01
DET DET
6.23E+01 6.84E+01 3.38E+01
20 000035
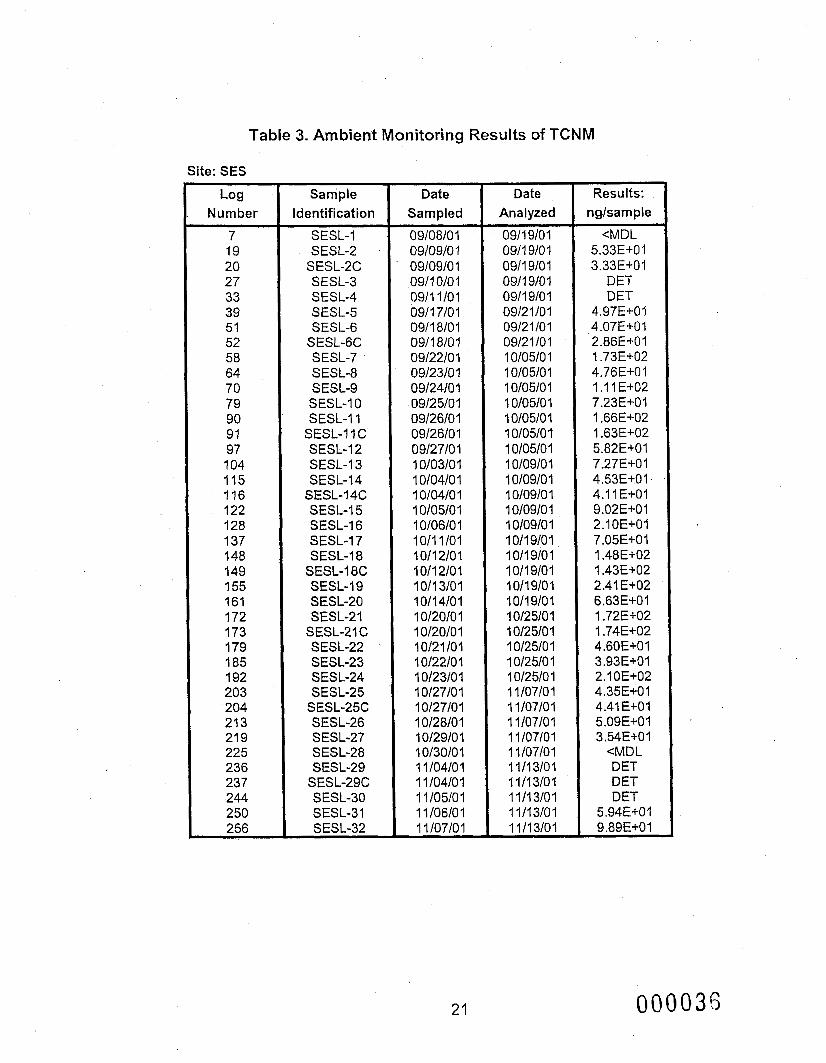
Table 3. Ambient Monitoring Results of TCNM
Site: SES
Log Number
7 19 20 27 33 39 51 52 58 64 70 79 90 91 97 104 115 116 122 128 137 148 149 155 161 172 173 179 185 192 203 204 21 3 21 9 225 236 237 244 250 256
Sample Identification
SESL-1 SESL-2 '
SE.SL-2C SESL-3 SESL-4 SESL-5 SESL-6
SESL-6C SESL-7 S ES L-8 SESL-9 SESL-10 SESL-11
SESL-1 IC SESL-12 SESL-13 SESL-14
SESL-14C SESL-15 SESL-16 SESL-17 SESL-18
SESL-I 8C SESL-19 SESL-20 SESL-21
SESL-21 C SESL-22 '
SESL-23 SESL-24 SESL-25
SESL-25C SESL-26 SESL-27 SESL-28 SESL-29
SESL-29C SESL-30 SESL-31 SESL-32
Date Sampled 09108101 09109/01 09/0910 I ~09/10/01 0911 1/01 091 1 7/0 1 0911 8/01 0911 8/01 09/22/01 09/23/01 09124101 09/25/01 09/26/01 09126101 09/27/01 10/03/01 1 010410 1 1 0/04/01 1 OI05/0 1 1 0/0610 1 10111101 10/12101 1011 2101 10/1 3/01 10114101 10120101 10120101 10121101 1 012210 1 I 012310 1 1 012710 1 1 0/27/0 I 1 012810 1 10/29101 10130101 I 1 10410 1 1 1 10410 1 1 I 10510 1 1 1 10610 1 1 1 10710 1
Date Analyzed 0911 9/01 0911 9/01 0911 910 1 0911 9/01 09/1910 1 0912 1 IO 1 09/21/01 0912 1 /o 1 1 0/05IO 1 1 0/05/0 1 1 010510 1 1 0/05/01 10105/01 1 OI05/0 1 10105101 10/09/01 1 010910 1 I 010910 1 10109101 1 010910 1 10/19101 1011 9/01 1011 9101 1011 9101 1 011 910 1 1 0/25/0 1 1 0/25/0 1 1 0/25/0 1 1 012510 1 1 012510 1 1 1 10710 1 I 1 /07/0 I I I l07/0 1 1 110710 1 1 1/07/0 I 11113101 11/13101 11/13101 11/13/01 11/13101
Results: nglsample
CMDL 5.33E+01 3.33E+01
DET D ET
4.97E+01 4.07E+01 2.86E-1.01 1.73E+02 4.76E+01 1 .I I E+02 7.23E+01 1.66E+02 1.63E+02 5.82E+01 7.27E+01 4.53E+01 4.1 1 E+01 9.02E+01 2.10E+01 7.05E+O I 1.48E+02 1.43E+02 2.41 E+02 6.63E+01 1.72E+02 1.74E+02 4.60E+01 3.93E+OI 2.1 OE+02 4.35E+01 4.41 E+OI 5.09E+OI 3.54E+01
cMDL DET D ET D E I
9,89E+01 5.94E+01
21 000035

Table 4. Ambient Monitoring Results of MIC
Site: SAL
Number
1 16 18 41 53 65 72 73 84 90 96 102 111 112 123 129 1 36 137 148 154 160 169 170 181 187 193 194 205 21 1 218 224 225 239 245 251 257 258 269 276 282
Sample identification
SALM-1 F SALM-2F
SALM-2FC SALM-3F SALM-4F SALM5FB SALM6FB
SALMGCFB SALM7FB SALMBFB SALM9FB
SALMI OFB SALMI 1 FB
SALM 1 1 CFB SALM 12FB SALM 13FB SALM 14FB
SALMl4CFB SALMl5FB SALMI 6FB SALM 17FB SALMI 8FB
SALMISCFB SALMI 9FB SALM20FB SALM21 FB
SALM2 1 CFB SALM22FB SALM23FB SALM24FB SALM25FB
SALM25CFB SALM26FB SALM27FB SALM28FB SALM29FB
SALM29CFB SALM30FB SALM31 FB SALM32FB
Date
Sampled
09/08/01 09/09/01 09/09/01 0911 0101 0911 1/01 09117101 0911 8/01 0911 8/01 09/22/0 1 09/23/01 09/24/01 0 912 510 1 09/26/0 1 09/26/01 09/27/01 1 0/03/0 1 1 0/04/0 1 1 0104101 1 0/05/0 1 10/06/01 1011 1 I01 10/12/01 10/12/01 1 011 310 1 1 011 4/0 1 1 0/20/0 1 1 0/20/0 1 1 0121 10 I 1 0/22/0 1 10/23/01 1 0/27/0 1 1 0/27101 1 0/28/0 1 I 0/29/0 1 1 0/30/01 1 1 /04/0 1 1 1 10410 1 I I /05/0 1 1 1 /06/01 1 1 /07/0 1
Date Results:
Analyzed
0911 710 1 09/17/01 0911 7101 09/17/01 0911 7/01 09/20/01 09/20/01 09/20/01 1 0/0310 I 1 0/03/0 1 10/03101 1 0/03/0 1 1 0/04/0 1 1 0/04/0 1 1 0/04/0 1 1 011 010 I 1011 O/OI 1011 0101 1 011 010 1 1 011 010 I 10/2210 1 10/22/0 1 I 0/22/0 I 1 0/22/0 1 1 0/22/0 1 1 0/26/0 1 1 0/26/0 1 1 0/26/0 1 1 0/26/0 1 10126101 1 1/05/0 1 1 1 /05/0 1 1 1/05/0 1 1 1/05/0 1 1 110510 I 11/14/01 11/14/01 1 111 4/01 1 1 / I 4/01 11/14/01
uglsample
<MDL <MDL <MDL <MDL <MDL <MDL <MDL <MDL D ET
<MDL <MDL <MDL <MDL <MDL <MDL <MDL <MDL
<MDL <MDL <MDL <MDL
<MDL
CMDL <MDL <MDL <MDL <MDL cMDL <MDL <MDL cMDL <MDL cMDL <MDL <MDL <MDL <MDL cMDL cMDL <MDL
22
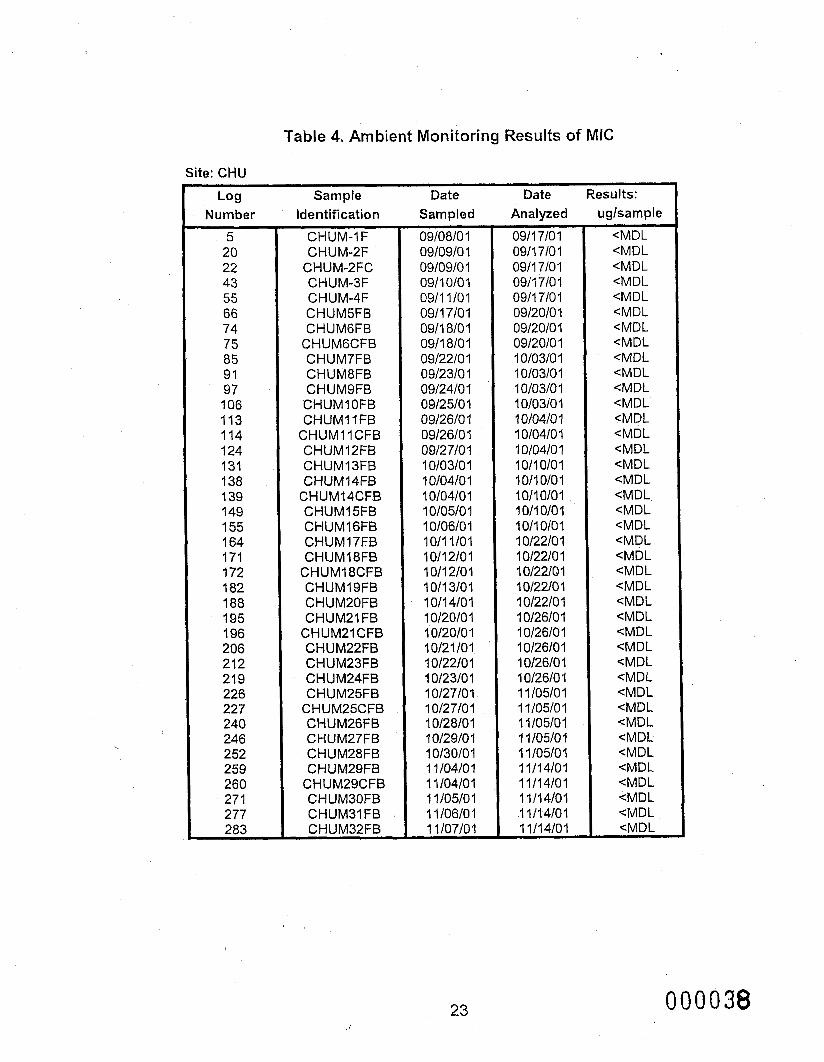
Table 4. Ambient Monitoring Results of MIC
Site: CHU
t o g Number
5 20 22 43 55 66 74 75 85 91 97 1 OG 113 114 124 131 138 139 149 155 164 171 172 182 188 195 196 206 212 21 9 226 227 240 246 252 259 260 27 1 277 283
Sample identification
CHUM-1 F CHUM-2F
CHUM-2FC CHUM-3F CHUM-4F CHUM5FB CHUM6FB
CHUMGCFB CHUM7FB CHUM8FB CHUM9FB
'CHUM1 OFB CHUMl 1 FB
CHUM1 ICFB CHUM12FB CHUM1 3FB CHUM14FB
CHUM14CF.B CHUMl 5FB CHUMl6FB CHUM17EB CHUMl8FB
CHUMl8CFB CHUMISFB CHUM20FB CHUM21 FB
CHUM21CFB CHUM22FB CHUM23FB CHUM24FB CHUM25FB
CHUM25CFB CHUM26FB CHUM27FB CHUM28FB CHUM29FB
CHUM29CFB CHUM30FB CHUM31 FB CHUM32FB
Date Sampled
0910810 1 0910910 1 0910910 1 0911 0101 0911 110 1 0911 710 I 0911 810 1 0911 8/01 09/22/0 1 0912310 1 09/24101 09125101 0912610 I 0912610 1 09/27/01 10103101 I 0/04/0 1 10/04/01 I 0/05/0 1 10/06/0 1 1011 1101 1011 210 1 1 011 210 1 I 011 310 1 10/14/01 10120101 10120101 10121101 1 012210 1 10/23/0 I 10127101 1 012 710 I 1 012810 I 10/29/0 1 10130101 I 1 /04/0 I 1 I /04/0 1 1 1 /05/0 1 1 I 10610 1 1 I l07/0 I
Date Results: Analyzed
0911 710 1 0911 7101 0911 7/01 0911 7101 0911 7101 0912010 1 09/20/01 09/20/01 1 0/0310 I 10103101 1 0/03/0 1 1 010310 I I 0/04/0 I 10104101 1 010410 1 1011 0101 ,I 011 0101 1011 0/01 I 011 010 1 1011 0101 1 012210 1 1 012210 1 10122101 1012210 1 1 012210 1 1 012610 1 I 012610 1 1 012610 1 1 012610 1 10/26/01 1 110510 I 1 1 10510 1 11/05/01 1 1 10510 1 1 I I0510 1 11/14/01 11l14/01 11/14/01 .I ll14/01 11/14/01
uglsample
<MDL <MDL <MDL CMDL <MDL cMDL cMDL <MDL <MDL cMDL <MDL cMDL <MDL CMDL CMDL CMDL CMDL <MDL CMDL <MDL CMDL CMDL
CMDL cMDL
<MDL <MDL <MDL <MDL cMDL <MDL cMDL <MDL <MDL <MDL eMDL cMDL eMDL cMDL eMDL cMDL
23 000038
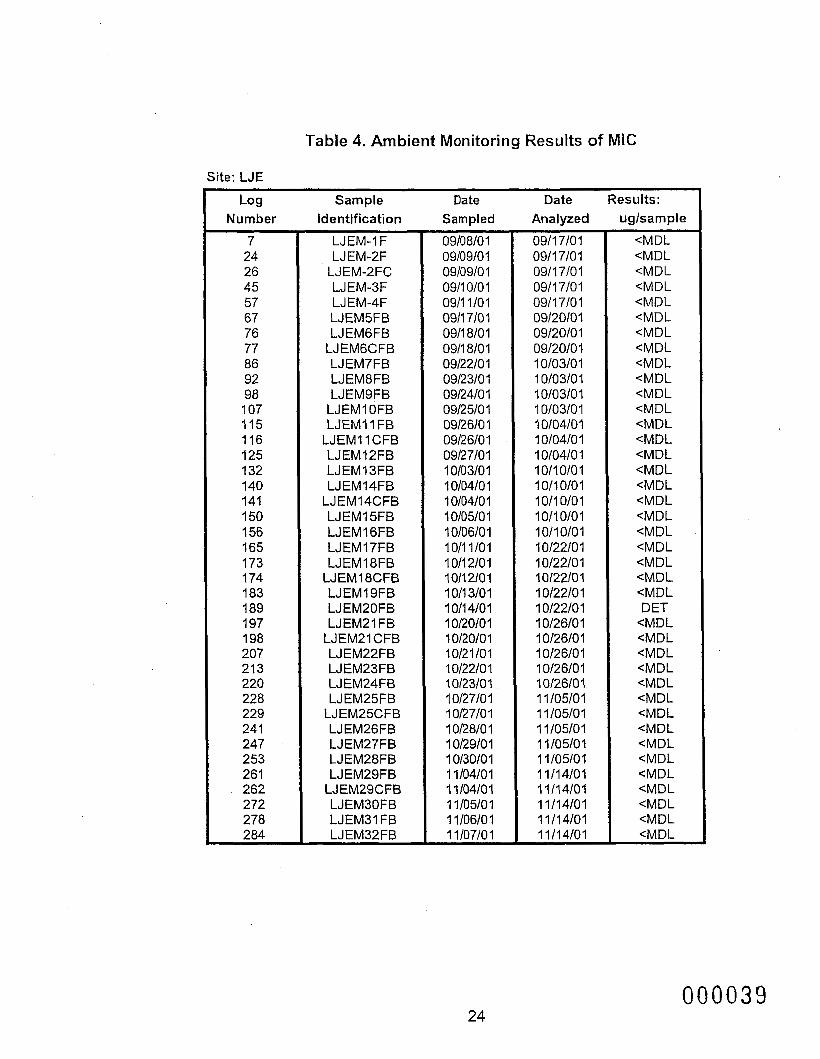
Table 4. Ambient Monitoring Results of MIC
Site: LJE
Sample Identification
LJEM-1 F LJEM-2F
LJEM-2FC LJEM-3F LJEM-4F LJEM5FB LJEMGFB
LJ EM6CFB LJEM7FB LJEM8FB LJEM9FB
LJEMI OFB LJEMI 1 FB
LJEMI 1 CFB LJEM12FB LJEMl3FB LJEMl4FB
LJEM 14CFB LJEMl5FB LJEM 16FB LJEMl7FB LJEM 18FB
LJEM18CFB LJEM19FB LJEM20FB LJEM21 FB
LJEM21 CFB LJEM22FB LJEM23FB LJEM24FB LJEM25FB
LJEM25CFB LJEM26FB LJEM27FB LJEM28FB LJEM29FB
LJEM29CFB LJEM30FB LJEM31 FB LJEM32FB
Date Sampled
09/08/01 09/09/01 09/09/01 0911 o/o 1 0911 1/01 0911 7/01 09/18/0 1 0911 8/0 1 09/22/0 1 09/23/01 09/24/0 1 09/25/01 09/26/0 1 09/26/01 09/27/01 I 0/03/0 1 1 0/04/0 1 1 0/04/0 1 I 0/05/0 I I O/D6/0 1 10/11/01 1 0/12/0 1 1 O/I 210 1 1 011 3/0 1 I 011 4/0 1 1 0/20/0 1 1 0/20/0 1 10/21/01 1 0/22/0 1 10/23/0 I 1 0/27/0 1 1 0/27/0 1 1 0/28/0 1 1 0/29/0 1 1 0/30/0 1 1 1 /04/0 1 I I /04/0 1 1 1 /05/0 1 1 110610 1 1 110710 1
Date Results: Analyzed
09/17/01 0911 7/0 1 0911 7/0 I 0911 7/01 09/17/01 09/20/01 09/20/01 09/20/01 1 0/03/0 1 1 0/03/0 1 1 0/03/0 1 1 0/03/0 1 10/04/01 1 0/04/0 1 1 0/04/0 1 10/10/01 1011 0101 1011 0/01 10/10/01 1011 0101 1 0/22/0 1 I 012210 1 I 012210 1 10/22/01 10/22/01 1 0/26/0 1 10/26/01 1 0/26/0 1 1 0/26/0 1 10/26/01 1 1 /05/0 1 1 I /05/0 1 1 1/05/0 1 1 1 /05/0 I 1 1 /05/0 1 11/14/01 11/l4/01 11/14/01 11/14/01 1 1 / I 4/01
uglsample
<MDL <MDL <MDL <MDL <MDL <MDL <MDL <MDL
<MDL <MDL
<MDL <MDL
<MDL <MDL <MDL <MDL <MDL
<MDL <MDL
<MDL
D ET <MDL <MDL <MDL <MDL <MDL <MDL <MDL
<MDL <MDL <MDL <MDL <MDL
<MDL
<MDL
<MDL
<MDL
<MDL
<MDL
<MDL
000039 24
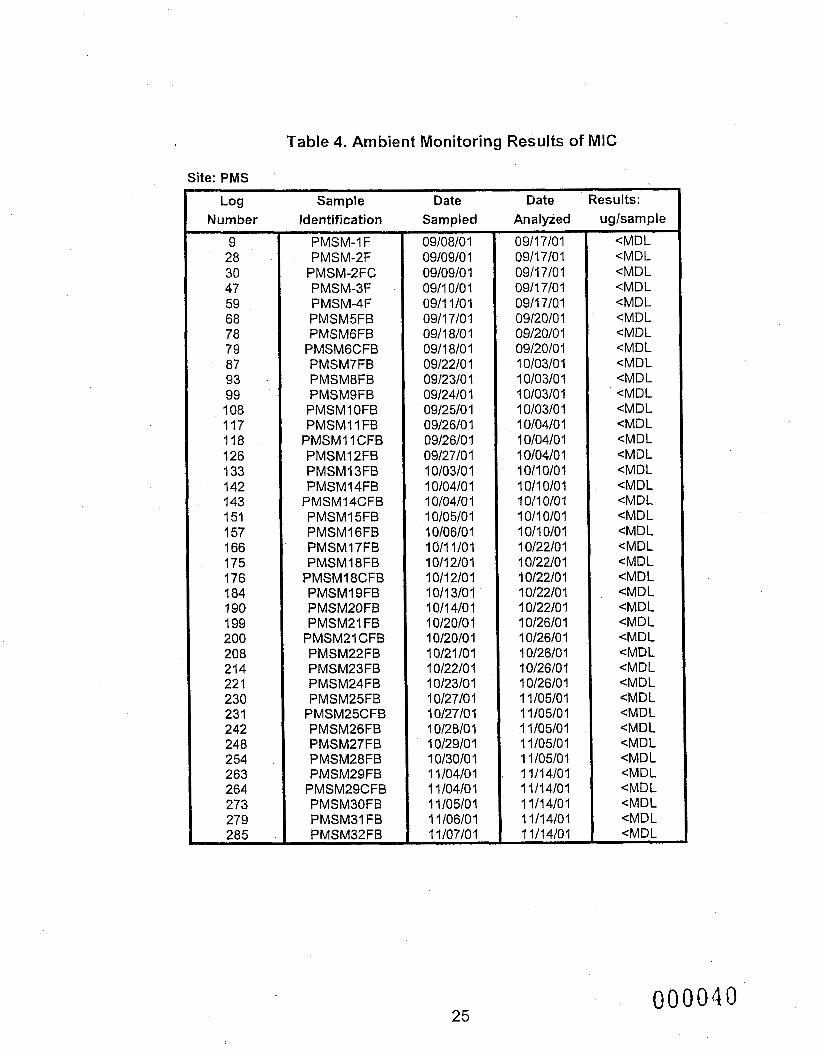
Table 4. Ambient Monitoring Results of MIC
Site: PMS
Log Number
9 28 30 47 59 68 78 79 87 93 '
99 108 117
126 133 142 143 151 1 57 166 175 176 184 190 199 200 208 214 22 1 230 23 1 242
254 263 264 273 279 285
118
248
Sample Identification
PMSM-1 F PMSM-2F
PMSM-2FC PMSM-3F PMSM-4F PMSM5FB PMSMGFB
PMSMGCFB PMSM7FB PMSM8FB PMSMSFB PMSMI OFB PMSMI 1 FB
PMSMI 1 CFB PMSM12FB PMSMI 3FB PMSMl4FB
PMSM14CFB PMSMl5FB PMSMIGFB PMSMl7FB PMSMI 8FB
PMSMI 8CFB PMSM19FB PMSM20FB PMSM21 FB
PMSM21CFB PMSM22FB PMSM23FB PMSM24FB PMSM25FB
PMSM25CFB PMSM26FB PMSM27FB PMSM28FB PMSM29FB
PMSM29CFB PMSM30FB PMSM31 FB PMSM32FB
Date Sampled 09/08/01 09/09/0 1 09/09/01 0911 010 1 0911 1/01 09/17/01 0911 810 1 0911 8/01 09/22/0 1 09/23/01 09/24/0 I 09/25/01 09/26/01 09/26/01 09/27/0 1 1 0/03/0 1 1 010410 I 1 0/04/0 1 1 0/05/0 1 10/06/0 1 1011 1/01 10/12/01 1011 2/01 1 011 310 1 1011 4/01 I 0/20/0 1 1 0/20/0 1 10/21/01 10/22/01 I 0/23/0 I 1 012710 1 1 0/27/0 1 1 0/28/0 1 1 012910 I 1 0/30/0 1 1 1 IO410 1 1 1 /04/0 1 11/05/01 1 1/06/0 1 11/07/01
Date Results: Analyzed 0911 7/01 0911 7/01 0911 7/0 1 0911 7/01 09/17/01 09/20/01 09/20/01 09/20/01 10/03/01 10/03/01 1 0/03/0 1 1 0/03/0 1 I 0/04/01 1 0/04/0 1 I 0/04/0 1 10/10/01 1011 0101 1 0/10/0 1 1 011 o/o 1 1011 0101 1 0/22/0 1 1 0/22/0 1 I OI2210 1 I 0/22/0 I 1 0/22/0 I 10/26/01 10126/01 1 0/26/0 1 10/26/0 1 1 0/26/0 1 1 1 /05/0 1 11/05/01 1 110510 1 1 1/05/0 1 I 1/05/0 1 11/14/01 11/14/01 11/14/01 11/14/01 11/14/01
uglsample
<MDL <MDL <MDL <MDL <MDL <MDL <MDL <MDL <MDL eMDL <MDL <MDL <MDL <MDL <MDL CMDL <MDL cMDL <MDL eMDL <MDL cMDL cMDL cMDL cMDL <MDL cMDL <MDL cMDL <MDL <MDL <MDL <MDL <MDL <MDL <MDL <MDL <MDL <MDL <MDL
25 000040

Table 4. Ambient Monitoring Results of MIC
Site: MES
Log Number
I 1 32 34 49 61 69 80 81 88 94 1 00 109 119 120 127 134 144 145 152 158 167 177 178 185 191 20 I 202 209 215 222 232 233 243 249 255 265 266 274 280 286
Sample Identification
MESM-1 F ' MESM-2F
MESM-2FC MESM-3F MESM4F MESM5FB MESMGFB
MESMGCFB MESM7FB MESM8FB MESM9FB MESMIOFB MESMI I FB
MESMI ICFB MESM12FB MESM13FB MESM14FB
MESM14CFB MESMI 5FB MESMl6FB MESM17FB MESMl8FB
MESM18CFB MESM19FB MESM20FB MESM21 FB
MESM21 CFB MESM22FB MESM23FB MESM24FB MESM25FB
MESM25CFB MESM26FB MESM27FB MESM28FB MESM29FB
MESM29CFB MESM30FB MESM31 FB MESM32FB
Date Sampled
09108/01 09/09/01 09/09/0 1 0911 0101 0911 110 1 0911 7/0 1 09/18/0 I 0911 8/01 09/22/0 1 09/23/01 09/24/0 1 09/25/01 09/26/01 , 09/26/01 09/27/01 10/03/01 1 0/04/0 1 1 0104/0 1 I 0/05/0 1 10/06/01 10/11/01 1011 2101 1 011 2/0 1 1 011 3/0 1 1 011 4/0 I 1 0/20/0 1 1 0/2 o/o 1 10/21/01 1 0/22/0 1 1 0123101 1 0/27/0 1 1 0/27/0 1 1 0/28/0 I I 0/29/01 1 0/30/0 1
1 1 /04/0 1
1 1 l06/0 I 1 1 /07/01
1 I 10410 I
I I /05Io I
Date Results: Analyzed
0911 7/01 09/17/01
0911 7/01 0911 7/01 09/20/01 09/20/0 1 09/20/01 1 0/03/0 I I 0/03/0 I 1 0/03/0 1 1 0/03/0 1 10104/01 1 0/04/0 1 I 0/04/0 1 1011 0/01 10/10/01 1 011 o/o 1 1 0/1 o/o 1 1 0/1 o/o 1 1 0/22/0 1 10122/01 1 0/22/0 1 1 0/22/0 1 10/22/01 1 0/2 6/0 1 1 0/26/0 1 1 0/26/01 1 0/26/0 1 1 0/26101 1 1 /05/0 1 1 1 /05/0 1 t 1/05/01 1 I /05/0 1 1 1 /05/01 1 I I1 4/01 11/14/01 11/14/01 I 1 I1 4/01 11/14/01
. 09/17/01
uglsample
<MDL <MDL <MDL <MDL <MDL <MDL <MDL cMDL <MDL <MDL <MDL <MDL <MDL <MDL <MDL <MDL <MDL <MDL <MDL <MDL <MDL <MDL <MDL cMDL DET
<MDL CMDL cMDL <MDL <MDL <MDL <MDL <MDL <MDL cMDL <MDL <MDL
<MDL <MDL
CMDL
26 000041

Table 4. Ambient Monitoring Results of MIC
Site: SES
122 128 135 146 147 153 159 168 179 180 186 192 203 204 210 21 6 223 234 235 244 250 256 267 268 275 28 1 287
Sample identification
SESM-1 F SESM-2F
SESM-2FC SESM-3F SESM-4F SESM5FB SESM6FB
SESMGCFB SESM7FB SESM8FB SESM9FB
SESMl OFB SESMI 1 FB
SESMI I CFB SESMl2FB SESM 13FB SESMl4FB
SESM14CFB SESM156B SESMl6FB SESMl7FB SESM18FB
SESMI 8CFB SESM19FB SESM20FB SESM21 FB
SESM21 CFB SESM22FB SESM23FB SESM24FB SESM25FB
SESM25CFB SESM26FB SESM27FB SESM28FB SESM29FB
SESM29CFB SESM30FB SESM31 FB SESM32FB
Date Sampled
09/08/01 09/09/01 09/09/01 09/10/01 09/11/0 I 09/17/01 0911 8/01 0911 8/0 1 09/22/01 09/23/0 1 09/24/0 1 09/25/01 09/26/01 09/26/01 09/27/01 10/03/01 1 010410 I 1 0/04/0 1 10/05/01 1 0/06/0 I 1011 1/01 1 011 210 1 1011 2/01 1 011 310 1 1011 4/0 I I 0/20/0 1 1 0/20/0 1 10/21/01 1 0/22/0 1 1 0/23/0 1 10/27/0 1 1 012710 1 I 0/28/0 1 1012910 1 10/30/0 1 1 1 /04/0 1 I 1 /04/0 I 1 I /05/0 1 1 1 /06/0 1 1 1 /07/0 I
Date Results: Analyzed
09/17/01 0911 7/01 09/17/01 09/17/01 0911 7/01 09/20/01 09120/01 09/20/01 10/03/01 10/03/01 1 0/03/0 1 10/03/01 I 0/04/0 1 1 0/04/0 1 10/04/01 1 0/10/0 1 1'0/10/01 1 0/10/0 1 1 0/1 o/o 1 I 011 010 1 1 0/22/0 1 1 0/2210 1 10/22/01 1 0/22/0 1 10/22/01 1 0/26/0 1 1 0/26/0 I 10/26/01 I 0/26/0 1 1 0/26/0 1 1 1/05/0 1 11/05/01 I 1 /05/0 1 I 1 /05/0 I 1 1 /05/0 1 11/14/01 11/14/01 11/14/01 11/14/01 1 1 / I 4/01
uglsample
cMDL
cMDL <MDL <MDL <MDL <MDL <MDL <MDL <MDL <MDL <MDL <MDL <MDL <MDL <MDL <MDL <MDL <MDL
<MDL <MDL <MDL <MDL DET
<MDL <MDL
<MDL <MDL <MDL <MDL <MDL <MDL <MDL <MDL cMDL
.<MDL
<MDL
<MDL
<MDL <MDL cMDL
27

Ambient Monitoring Notes
If analysis result is 2 MDL and < EQL it is reported in the table as detected (DET). Levels 2 EQL are reported as the actual measured value and are reported to three significant figures.
Site location i.d.: SAL: APCD monitoring site in Salinas CHU: Chualar School LJE: La Joya Elementary School PMS: Pajaro Middle School MES: Mac Quiddy Elementary School SES: Salsipuedes Elementary School
C: Represents the collocated site T: Represents the charcoal cartridges L: Represents the XAD-4 cartridges M: Represents the XAD-7 cartridges
28 000043

Table 5: Laboratory Spiking Solutions Results
;piking Solution: 80 nglml total DCP
Date
9/14 9/25 1 O/l
10/12 10/16 101’29 11/1 11/15
berage 3 d Dev
cDCP - 23.90 36.49 37.56 30.39 31.66 31.82 37.30 34.97
33.01 4.60
%Rec.
59.75 9 I .23 93.90 75.98 79.1 5 79.55 93.25 87.43
-
82.53 11.50
tDCP
25.51 36.26 37.69 30.53 32.84 31.67 37.31 34.58
33.30 4.09
%Rec.
63.78 90.65 94.23 76.33 82.1 0 79.18 93.28 . 86.45
-
~~
83.25 10.22
4 ug/rnl
MlTC - 3.17 3.35 3.55 3.04 3.1 1 3.1 0 3.42 3.51
3.28 0.20
%Rec.
79.25 83.75 88.75 76.00 77.75 77.50 85.50 87.75
82.03 5.01
Date
9/20 912 I IO15 10/9
10/19 10/25 11/7 11/13
40 nglml
TC NM
27.55 27.71 3 1.40 30.89 34.02 31.70 32.07 32.01
30.92 2.22
%Rec.
68.88 69.28 78.50 77.23 85.05 79.25 80.1 8 80.03
77.30 5.56
Date
9/17 9/20 1 0/3 IO14
1011 0 10/22 10/29 11/5
11/14
0.20 uglml
MIC
0.30 0.27 0.27 0.28 0.24 0.30 0.19 0.24 0.13
0.25 0.04
%Rec.
148.00 136.00 133.00 140.50 121.50 150.00 96.50 1 17.50 66.00
123.22 d7.84
0 0 0 0 b b
a 29

I Date I cDCP
911 4 9125 10/1 10/12 1011 6 10129 11/1
cMDL cMDL <MDL <MDL cMDL <MDL cMDL
I I <MDL
Table 6: Laboratory Method Blank Results
tDCP
<MDL CMDL
Date TC NM Date MlTC
911 7 <MDL 9/20 cMDL
1115 CMDL 11/13 cMDL <MDL 10129 <MDL I117 <MDL cMDL IO122 <MDL 10/25 cMDL cMDL 1011 0 <MDL 1011 9 <MDL cMDL 1014 <MDL. 1019 cMDL <MDL 1013 CMDL I 015 cMDL <MDL 9/20 cMDL 912 1 cMDL
11/14
MIC
cMDL cMDL <MDL <MDL cMDL <MDL <MDL <MDL cMDL
30

Table 7: Laboratory Control Sample Results
Cartridge Spikes: 80 nglml total DCP
Date
911 4 9/25 1011
1011 2 1011 6 10129 1 Ill 11/15
Average Std Dev
cDCP
24.72 30.45 32.33 28.93 29.05 31.54 29.73 29.06
29.48 2.29
%Rec.
61.80 76.13 80.83 72.33 72.63 78.85 74.33 72.65
73.69 5.72
-
-
tDCP - 25.35 30.34 32.57 29.22 29.04 31.82 29.38 28.41
29.52 2.21
%Rec.
63.38 75.85 81.43 73.05 72.60 79.55 73.45 71.03
73.79 5.53
4 uglml
MlTC - 2.1 6 2.54 2.33 1.97 2.16 2.28 2.1 5 2.39
2.25 0.1 8
%Rec.
54.00 63.50 58.25 49.25 54.00 57.00 53.75 59.75
56.19 4.39
Date
9/20 912 1 10/5 1 019 10/19 10125 4117 11/13
40 nglml
TC NM
26.61 28.98 35.77 28.04 37.54 35.05 37.55 33.88
32.93 4.40
%Rec.
66.53 72.45 89.43 70.10 93.85 87.63 93.88 84.70
82.32 11 .oo
Date
911 7 9/20 1 013. 1014 10/10 10/22 IO129 1115
11/14
0.20 uglm I
MIC
0.29 0.28 0.25 0.26 0.25 0.28 0.23 0.25 0.1 7 0.25 0.02
%Ret.
146.00 137.50 124.50 130.50 123.50 139.50 I 1 5.50 122.50 84.50 124.89 10.29
a 0 0 0
ct3
. 31

Table 8: Field Spikes
I I cDCP tDCP I MlTC Date Sample ID Log
40 nglml %Recovery 40 nglml %Recovery 4 ugfml
911 4
2.02 81.25 32.50 89.00 35.60 207 SALT-26FS 1 1/1 2.27 66.00 . 26.40 73.95 29.58 132 SALT-17FS I 0/16 2.21 122.50 49.00 83.00 33.20 72 SALT-IOFS lO/l 2.06 75.95 30.38 59.45 23.78 2 SALT-1 FS
Average 2.14 86.43 34.57 76.35 30.54 Std Dev 0.12 24.87 9.95 12.85 5.14 i
&Recovery
I 51.50 55.25
sub SALTI#I
subSALT17#129 56.75 sub SALTIO#71
**
50.50 subSALT26#208
2.98 I
Date
subSALL10#71 94.35 37.74 SALL-I OFS 72 10/5 subSALLl#l 101.38 40.55 SALL-I FS 2 9120
%Recovery 40 nglml Sample ID Log
1011 9 subSALLl7#129 98.58 39.43 SALL-17FS 132 I 1/7 subSALL26#208 84.25 33.70 SALL-26FS 207
Average 94.64 37.86
I I Std Dev 3.00 7.50 I I MIC
Date
6.46 0.01 Std Dev 138.25 0.28 Average 131 .OO 0.26 SALM26FS 238 1115 135.50 140.50 0.28 SALMI OFSFB 103 1 0/3 146.00
%Recovery 0.2 uglml Sample ID Log 911 7
10122
0.29 SALM-1 FSF. 3
0.27 SALM 17FS 163
32
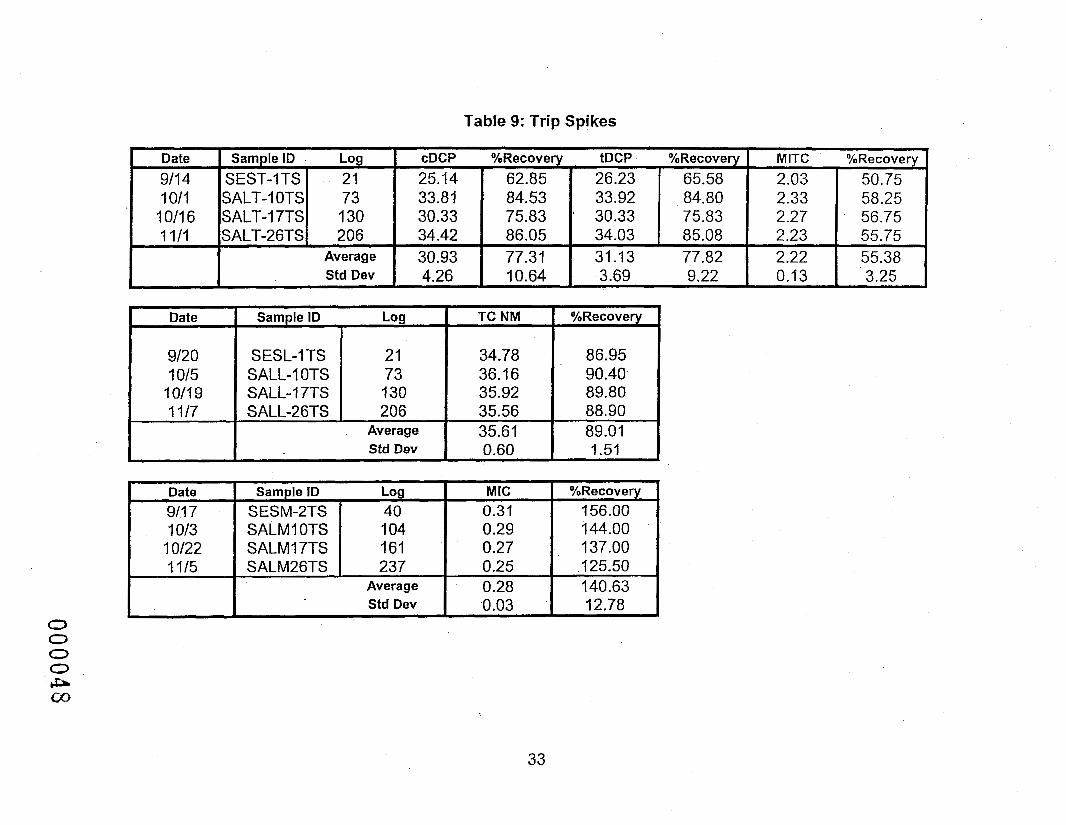
Table 9: Trip Spikes
Date M ITC %Recovery cDCP %Recovery tDCP %Recovery Sample ID Log 9/14
55.75 2.23 85.08 34.03 86.05 34.42 206 SALT-26TS 1 111 56.75 2.27 75.83 ' 30.33 75.83 30.33 130 SALT-17TS 10/16 58.25 2.33 84.80 33.92 84.53 33.81 73 SALT-1 OTS I011 50.75 2.03 65.58 26.23 62.85 25.14 21 SEST-ITS
Average 55.38 2.22 31 . I3 77.82 77.3 1 30.93 I I Std Dev I 4.26 I 10.64 I 3.69 9.22 I 0.13 I 3.25 I
1 10/19
Sample ID Log %Recovery TC NM
I SESL-ITS SALL-1 OTS SALL-I 7TS SALL-26TS 206
Average Std Dev
34.78 36.1 6 35.92 35.56 35.61 0.60
86.95 90.40 89.80
89.01 1.51
88.90
Date %Recovery MIC Sample ID Log 9/17 156.00 0.31 SESM-2TS 1 40
1115 140.63 0.28 Average 125.50 0.25 SALM26TS I 237
0 0 0 0 b b
c.0
33

Table I O : Laboratory Spikes
Date MlTC %Rec. tDCP %Rec. cDCP
9/14 32.49
2.49 83.1 5 33.26 83.40 33.36 1 1/1 2.10 80.75 32.30 79.45 31.78 10/16 2.36 87.05 34.82 89.23 35.69 lO/ l 1.96 80.78 32.31 81.23
Average 33.33 83.33 33.17 82.93 2.23
I -q 52.50 10/19
I Std Dev I 1.70 4.25 1 . I9 2.97 I 0.24 6.03 I
TC NM
32.34 3 1.40 38.99 19.12 30.46
I - %Ret.
80.85 78.50 97.48
47.80** 85.61 10.34
- 8.28
80 ng/ml DCP(40 ng/rnl each isomer) and 4.0 pg/ml MlTC 40.0 ng/ml TCNM 0.12 pg/ml MIC
** Poor spikelsample loss, this value is not included in the average percent recovery,
~~ ~
Date
9/17 I 0/3
10/22 11/5
%Rec.
161.50
0.29 146.88 0.04 18.18
34
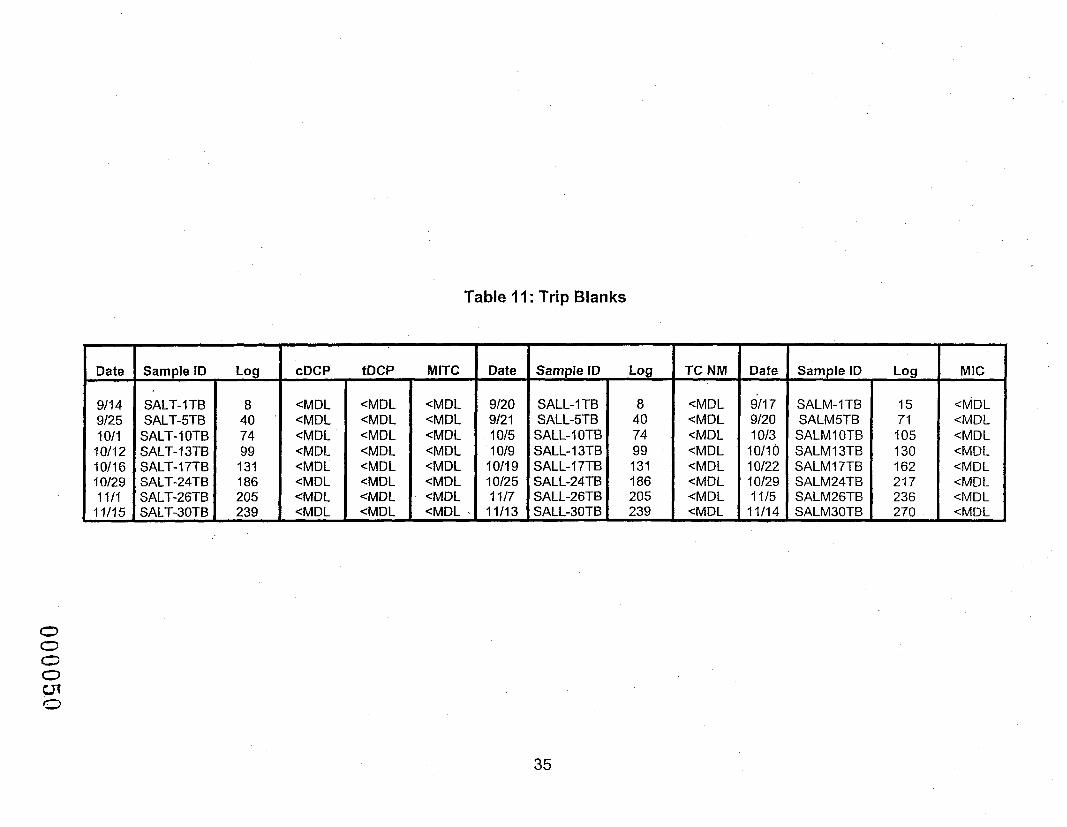
Table 1 I : Trip Blanks
Date
9/14 912 5 1011 1011 2 10/16 10129 1 111 11/15
-
-
0 c 0 0
Q
Sample ID Log
SALT-? TB
239 SALT-30TB 205 SALT-26TB 186 SALT-24TB 131 SALT-17TB 99 SALT-13TB 74 SALT-1 OTB 40 SALTdTB 8
<MDL
cMD1
tDCP
<MDL
<MDL cMDL cMDL cMDL <MDL <MDL
CMDL
MlTC
<MDL <MDL CMDL <MDL <MDL <MDL
. CMDL <MDL % -
' Date
9120 912 1 1015 1019
1011 9 10125 11/7 11/13
-
-
Sample ID Log
SALL-1 TB
239 SALL30TB 205 SALL-26TB 186 SALL-24TB 131 SALL-17TB 99 SALL-13TB 74 SALL-1 OTB 40 SALL-5TB 8
35
<MDL CMDL <MDL <MDL
Date Sample ID Log
9/17 SALM-1 TB
270 SALM30TB 1 1/14 236 SALM26TB I l l 5 21 7 SALM24TB 10129 162 SALM17TB 10122 130 SALMISTB 10110 105 SALMIOTB 10/3 71 SALM5TB 9/20 15 <MDL
<MDL <MDL <MDL <MDL
Appendix A:
Standard Operating Procedure for DCP and MlTC Analysis
36 000051.
California Environmental Protection Agency
0EAir Resowces Board -
Standard Operating Procedure Sampling and Analysis of I ,3-dichloropropene (Telone)
and Methyl lsothiocyanate (MITC) in Application and Ambient Air using Gas ChromatographylMass Selective
Detector
Special Analysis Section Northern Laboratory Branch
Monitoring and Laboratory Division
06/25/01 version
Approved by:
Russell Grace, Manager Special Analysis Section
37
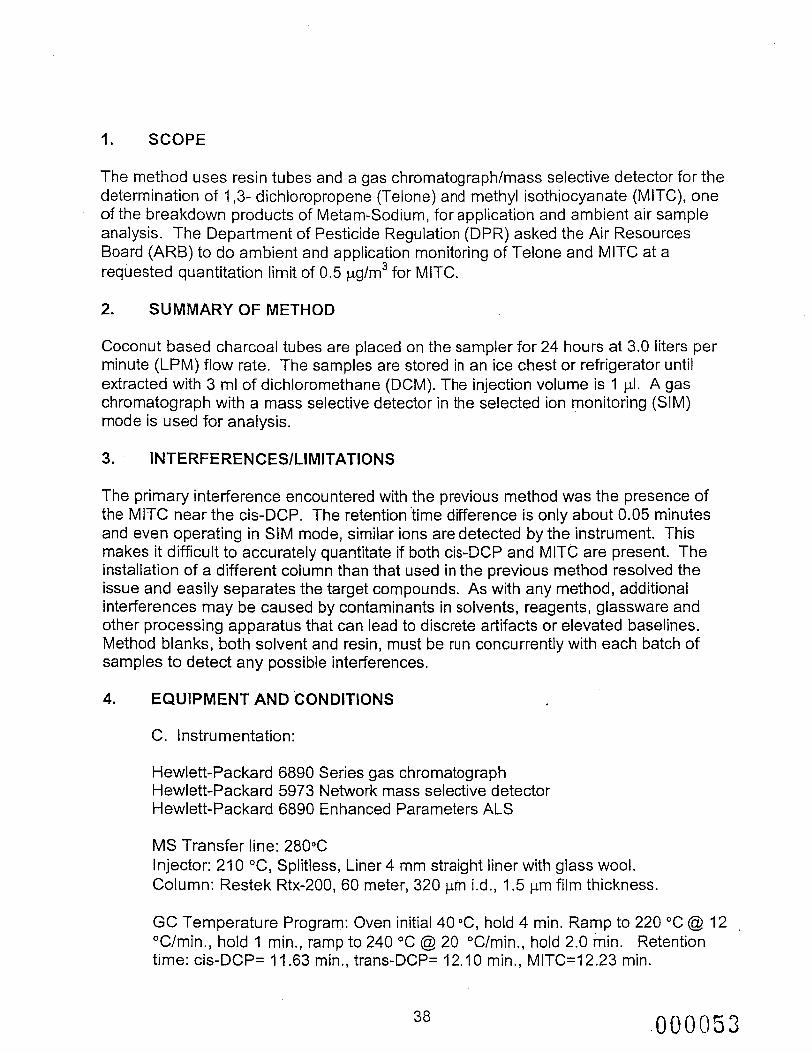
I. SCOPE
The method uses resin tubes and a gas chromatographlmass selective detector for the determination of I ,3- dichloropropene (Telone) and methyl isothiocyanate (MITC), one of the breakdown products of Metam-Sodium, for application and ambient air sample analysis. The Department of Pesticide Regulation (DPR) asked the Air Resources Board (ARB) to do ambient and application monitoring of Telone and MITC at a requested quantitation limit of 0.5 pg/m3 for MITC.
2. SUMMARY OF METHOD
Coconut based charcoal tubes are placed on the sampler for 24 hours at 3.0 liters per minute (LPM) flow rate. The samptes are stored in an ice chest,or refrigerator until extracted with 3 mi of dichloromethane (DCM). The injection volume is I pl. A gas chromatograph with a mass selective detector in the selected ion monitoring (SIM) mode is used for analysis.
3. INTERFERENCESlLlMlTATlONS
The primary interference encountered with the previous method was the presence of the MITC near the cis-DCP. The retention time difference is only about 0.05 minutes and even operating in SIM mode, similar ions are detected by the instrument. This makes it difficult to accurately quantitate if both cis-DCP and MITC are present. The installation of a different column than that used in the previous method resolved the issue and easily separates the target compounds. As with any method, additional interferences may be caused by contaminants in solvents, reagents, glassware and other processing apparatus that can lead to discrete artifacts or elevated baselines. Method blanks, both solvent and resin, must be run concurrently with each batch of samples to detect any possible interferences.
4. EQUIPMENT AND CONDITIONS
C. Instrumentation:
Hewlett-Packard 6890 Series gas chromatograph Hewlett-Packard 5973 Network mass selective detector Hewlett-Packard 6890 Enhanced Parameters ALS
MS Transfer line: 280°C Injector: 210 "C, Splitless, Liner 4 mm straight liner with glass wool. Column: Restek Rtx-200, 60 meter, 320 pm i.d., I .5 pm film thickness.
GC Temperature Program: Oven initial 40 C , hold 4 min. Ramp to 220 "C @ 12 "Clmin., hold I min., ramp to 240 "C @ 20 "Clmin., hold 2.0 min. Retention time: cis-DCP= 11.63 min., trans-DCP= 12.10 min., MITC=12.23 min.
38
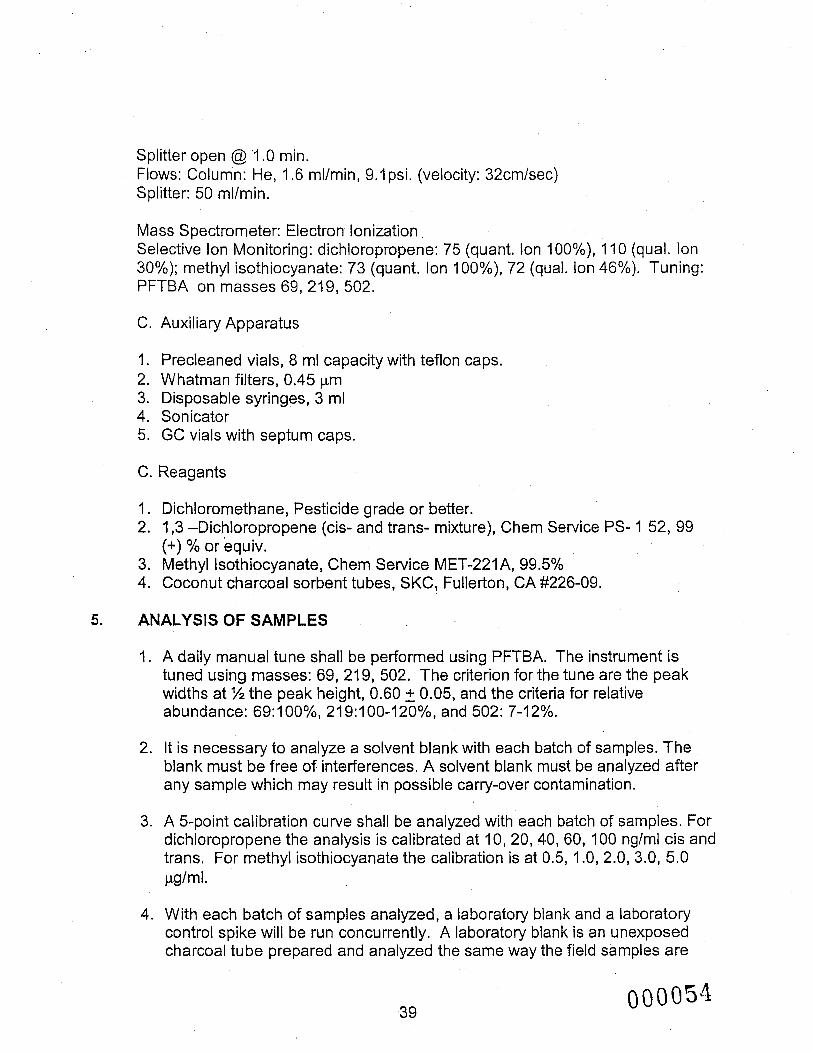
Splitter open @ 'I .O min. Flows: Column: He, I .6 mllmin, 9.1 psi. (velocity: 32cmlsec) Splitter: 50 mllmin.
Mass Spectrometer: Electron Ionization Selective Ion Monitoring:'dichloropropene: 75 (quant. Ion loo%), I10 (qual. Ion 30%); methyl isothiocyanate: 73 (quant. Ion IOOYO), 72 (qual. Ion 46%). Tuning: PFTBA on masses 69,219,502.
C. Auxiliary Apparatus
1. Precleaned vials, 8 mi capacity with teflon caps. 2. Whatman filters, 0.45 pm 3. Disposable syringes, 3 ml 4. Sonicator 5. GC vials with septum caps.
C. Reagants
1. Dichloromethane, Pesticide grade or better. 2. 1,3 -Dichloropropene (cis- and trans- mixture), Chem Service PS- 1 52, 99
3. Methyl Isothiocyanate, Chem Service MET-221A1 99.5% 4. Coconut charcoal sorbent tubes, SKC, Fullerton, CA #226-09.
(+) % or equiv.
5. ANALYSIS OF SAMPLES
I. A daily manual tune shall be performed using PFTBA. The instrument is tuned using masses: 69, 219, 502. The criterion for the tune are the peak widths at %the peak height, 0.60 2 0.05, and the criteria for relative abundance: 69:l OO%, 21 9:lOO-120%, and 502: 7-1 2%.
2. It is necessary to analyze a solvent blank with each batch of samples. The blank must be free of. interferences. A solvent blank must be analyzed after any sample which may result in possible carry-over contamination.
3. A 5-point calibration curve shall be analyzed with each batch of samples. For dichloropropene the analysis is calibrated at I O , 20,40, 60, 100 ng/ml cis and trans. For methyl isothiocyanate the calibration is at 0.5, 1 .O, 2.0, 3.0, 5.0 pg/ml.
4. With each batch of samples analyzed, a laboratory blank and a laboratory control spike will be run concurrently. A laboratory blank is an unexposed charcoal t u b e prepared and analyzed the same way the field samples are
39
analyzed. A laboratory control spike is a charcoal tube spiked with a known amount of standard. The control sample is prepared and analyzed the same way as the field samples. Laboratory check samples should have recoveries that are at least 70% of the theoretical spiked value.
5. A DCP calibration check sample of I O nglml is run after the calibration and every IO samples and at the end of each sample batch. The calibration check for MlTC is 0.75 pg/ml. The value of the check must be within +30 (the standard deviation) or + IO% of the expected value, whichever is greater. If the calibration check is outside the limit, then those samples in the batch after the last calibration check that was within the limit need to be reanalyzed.
6. Score and snap the sample tube, transfer the charcoal into a 8 ml vial. (Save the back-up bed for future analysis if necessary.) Rinse the tube with 3.0 ml of DCM into the extraction vial. Cap and place the vial in the sonicator for I hour.
7. Filter the samples using a 3 ml syringe and 0.45 pm filter directly into a GC vial and cap securely.
8. The atmospheric concentration is calculated according to:
Conc (ng/m3) = Extract Conc (nglml) X 3 ml / Air Volume Sampled (m3)
6. QUALITY ASSURANCE
A. Instrument Reproducibility
The reproducibility of the instrument and analytical method was established by analyzing five(5) I .O pl injections of dichloropropene and methyl isothiocyanate standard at three concentrations (low, mid, and high range). The low, mid and high concentrations of dichloropropene were I O , 40 and 100 nglml, respectively. The low, mid and high concentrations of methyl isothiocyanate were 0.5, 2.0 and 5.0 pg/ml, respectively.
B. Calibration
The five-point calibration curve is constructed for each compound using linear regression analysis. A curve cannot be used if its correlation coefficient is less than 0.995.
C. Calibration Check
A calibration check control is run after the calibration and every I O samples and at the end of the sample batch to verify the system is in calibration. The value of
40 000055
the check must be within 230 (the standard deviation) or +I 0% of the expected value, whichever is greater. If the calibration check is outside the limit, then those samples preceding the out of limit check need to be reanalyzed.
D. Minimum Detection Limit
Detection limits are based on US EPA MDL calculation. Using the analysis of seven (7) replicates of a low-level matrix spike, the method detection limit (MDL) and the estimated quantitation limit (EQL) for I ,3-dichloropropene is calculated by: MDL = 3.14*(std dev values), where std dev = the standard deviation of the concentration calculated for the seven replicate spikes. For d,ichloropropene, the MDL is 2.0 ng/ml for each isomer. EQL, defined as 5*MDL, is I O ng/ml based on a 3 ml extraction volume. For methyl isothiocyanate, the MDL is 0.04 pglml with an EQL of 0.22 pg/ml. Results above the EQL are reported to 3 significant figures. Results below EQL but a.bove the MDL are reported as D E I (detected) and results less than the MDL are ND (nondetect).
E. Collection and Extraction Efficiency (Recovery)
The target compounds at a low and high level are spiked on charcoal tubes (3 at each concentration). The spiked tubes are placed on field samplers with airflows of 3 LPM for 24 hours. The samples are extracted with DCM and prepared as described in section 5, #6-7. The average percent recovery should be 5 20% of the expected value. Normal recoveries for DCP were found to be greater than 90%. Normal recoveries for MlTC are greater than 85%.
F. Storage Stability
Storage stability studies were completed in the previous analysis and not continued further here. All analyses are to be completed within 4 days of receipt.
G. Breakthrough
No breakthrough analysis was done for DCP. The breakthrough was checked for MlTC since the field sampling flow rate was set to 3 LPM. The recovery of charcoal tubes spiked at 5.0 pg/ml was greater than 85% with no MlTC detected in the secondary beds.
H. Safety
This procedure does not address all of the safety concerns associated with chemical analysis. It is the responsibility of the analyst to establish appropriate safety and health practices. For hazard information and guidance refer to the material safety data sheets (MSDS) of any chemicals used in this procedure.
41 000056
Appendix B:
Skmdard Operating Procedure for TCNM Analysis
42 00005?

California Environmental Protection Agency
0gA i r Resources Board -
Standard Operating Procedure Sampling and Analysis of Trichloronitromethane
(Chloropicrin) in Application and Ambient Air using Gas ChromatographylMass Selective Detector
Special Analysis Section Northern Laboratory Branch
Monitoring and Laboratory Division
06/25/01 version
Approved by: ,
Russell Grace, Manager Special Analysis Section
43 000053

I. SCOPE
The current method is for the analysis of trichloronitromethane (TCNM) using a gas chromatographlmass selective detector. The procedure is for the analysis of application and ambient air monitoring of TCNM using XAD-4 resin tubes. The Department of Pesticide Regulation (DPR) asked the Air Resources Board (ARB) to analyze for TCNM during agricuItural/structural application with a requested quantitation limit of 1 .O pg/m3 and ambient monitoring with a quantitation limit of 0.1 pg/m3.
2. SUMMARY OF METHOD
Resin tubes, XAD-4, are placed on the sampler for 24 hours at a flowrate of 0.1 liters per minute (LPM or I00 mLP,M). The samples are stored in an ice chest or refrigerator until extracted with 3 ml of dichloromethane (DCM). The injection volume is 1 pl. A gas chromatograph with a mass selective detector in the selected ion monitoring (SIM) mode is used for analysis.
3. INTERFERENCESlLlMiTATlONS
Interferences may be caused by contaminants in solvents, reagents, glassware and other processing apparatus that can lead to discrete artifacts or elevated baselines. A method blank, including both solvent and resin, must be analyzed with each batch of samples to detect any possible interferences.
4. EQUIPMENT AND CONDITIONS
A. Instrumentation:
Hewlett-Packard 6890 Series gas chromatograph Hewlett-Packard 5973 Network mass selective detector Hewlett-Packard 6890 Enhanced Parameters ALS
MS Transfer line: 280C Injector: 21 O°C, Splitless, Liner 4 mm straight liner with glass wool. Column: Restek Rtx-200, 60 meter, 320 prn i.d., I .5 pn film thickness.
GC Temperature Program: Oven initial 40aC, hold 4 min. Ramp to 220°C @ 12"C/min., hold I min., ramp to 240°C @ 2O0C/min., hold 2.0 min. Retention time: TCNM 1 I .93 min.
Splitter open @ 1 .O min. Flows: Column: He, 1.6 ml/min, 9.lpsi. (velocity: 32cm/sec) Splitter: 50 ml/min. Mass Spectrometer: Electron Ionization
44 000059
Selective Ion Monitoring: trichloronitromethane: I 17 (quant. ion I OO%), 1 I 9 (qual. ion 98%); Tuning: PFTBA on masses 69, 219, 502.
B. Auxiliary Apparatus
1 Precleaned vials, 8 ml capacity with teflon caps. 2 Whatman filters, '0.45 pm 3 Disposable syringes, 3 ml 4 Sonicator 5 GC vials with septum caps.
C. Reagants
I Dichloromethane, Pesticide grade or better. 2 Trichloronitromethane, Chem Service PS-4, 98.8% 3 XAD-4 resin sorbent tubes, 400/200mg. SKC, Fullerton, CA.
5. ANALYSIS OF SAMPLES
I A daily manual tune shall be performed using PFTBA. The instrument is tuned using masses: 69, 219, 502. The criterion for the tune are the peak widths at % the peak height, 0.60 5 0.05, and the criteria for relative abundance; 69:100%, 219:lOO-120%, and 502: 7-12%.
2 It is necessary to analyze a solvent blank with each batch of samples. The blank must be free of interferences. A solvent blank must be analyzed after any sample which may result in possible carry-over contamination. '
3 A 5-point calibration curve shall be analyzed with each batch of samples. For the ambient studies the calibration will be 0.5-50.0 ng/mL and for the application studies 50.0-500 ng/mL.
4 A calibration check sample of 7.5 ng/ml is run after the calibration and every I O samples and at the end of the sample batch. The value of the calibration check must be within 530 (the standard deviation) or +IO% of the expected value whichever is greater. If the calibration check is outside this limit, then those samples in the batch after the last calibration check that was within limits need to be reanalyzed.
5 With each batch of samples analyzed, a laboratory blank and a laboratory control spike will be run concurrently. A laboratory blank is XAD-4 extracted and analyzed the same way as the samples. A laboratory control spike is XAD-4 spiked with a known amount of standard. The laboratory control sample is extracted and analyzed the same way as the samples. Laboratory
45

control samples should have recoveries that are greater than or equal to 70% of the theoretical spiked value.
6 Score and snap the sample resin tube, transfer the front bed of the resin tube into a 8 ml vial. (Save the back-up bed for future analysis if necessary.) Rinse the tube with 3.0 ml of DCM into the extraction vial. Cap and place the vial in the sonicator for 1 hour.
a GC vial and cap securely. 7 Filter the samples using 0.45 pm filter attached to a 3 ml syringe directly into
I 8 The atmospheric concentration is calculated according to:
Conc (ng/m3) = Extract Conc (nglml) X 3 ml / Air Volume Sampled (m3)
6. QUALITY ASSURANCE
A. Instrument Reproducibility
The reproducibility of the instrument and analytical method was established by .
analyzing five (5) I .O pl injections of trichloronitromethane standard at three concentrations (low, mid, and high), The low, mid and high concentrations were 5, 20 and 50 ng/ml, respectively.
B. Calibration
A five-point calibration curve is made ranging from 5.0 ng/ml to 50.0 ng/ml for ambient and 50 ng/ml to 500 ng/ml for application.
C. Calibration Check
A calibration check sample is run after the calibration, after every I O samples and at the end of the sample batch to verify the system is in calibration. The value of the check must be within 230 (the standard deviation) or +IO% of the expected value whichever is larger. If the calibration check is outside the limit, then those samples in the batch after the last calibration check that was within the limit need to be reanalyzed.
D. Minimum Detection Limit
' The detection limit is based on US EPA MDL calculation. Using the analysis of seven (7) replicates of a low-level matrix spike, the method detection limit (MDL) and the estimated quantitation limit (EQL) for trichloronitromethane is calculated by:'MDL = 3.14*(std dev values) where std dev = the standard deviation of the concentration calculated for the seven replicate spikes. For TCNM the MDL is 3.96 ng/sample (I .32 ng/mL). EQL, defined as S*MDL, is 19.8 ng/sample (6.60
46
ng/mL) based on a 3 ml extraction volume. Results 4are reported to 3 significant figures. Results below EQL but above the MDL are reported as DET (detected) and results less than the MDL are reported as ND (nondetect).
E. Collection and Extraction Efficiency (Recovery)
Trichloronitromethane at a low and high level are spiked on XAD-4 tubes (3 at each concentration). The spiked tubes are placed on field samplers with airflows of I 00 mLpm for 24 hours. The samples are extracted with DCM and prepared as described in section 5, #6-7. The average percent recovery of trichloronitromethane should be 2 20% of the expected value. The recoveries both for the low and high levels are greater than 80.0%.
F. Storage Stability
Storage stability was set up for a 4-week study. Three (3) XAD-4 tubes each were spiked at the low and high-end concentrations. The tubes were stored in the freezer until analyzed. At the low-end concentrations (5 nglml), the recovery for the three spikes averaged 106.8 percent, ranging from 103.68 to 113.68 percent. The average percent recovery peaked after fourteen days and was at the lowest after 28 days. At the high end (50 ng/ml), the recovery for the three spikes averaged 90.237 percent, ranging from 88.904 to 91.996 percent. The average percent recovery peaked at 14 days and was at the lowest at 20 days.
H. Breakthrough
The previous analysis of trichloronitromethane (ARB #A5-I 69-43) was for 4 hour sampling at I .O LPM in September/October, 1986. The current study for ambient monitoring for 24 hours will require a low sample flow rate to meet the requested EQL. A breakthrough analysis study was conducted. The flow rates tested were 1 .O, 0.5, 0.2 and 0.1 Lpm. To meet the EQL and minimize breakthrough possibility, the flow rate for the field sampling will be at I00 mLpm.
H. Safety
This procedure does not address all of the safety concerns associated with chemical analysis. It is the responsibility of the analyst to establish appropriate safety and health practices. For hazard information and guidance refer to the material safety data sheets (MSDS) of any chemicals used in this procedure.
47
Appendix C:
Standard Operating Procedure for MIC Analysis
000063 48
California Environmental Protection Agency
@=Air Resources Board '-
Standard Operating Procedure Sampling and Analysis of Methyl Isocyanate in
Application and Ambient Air using High Performance Liquid Chromatography with a Fluorescence Detector
Special Analysis Section Northern Laboratory Branch
Monitoring and Laboratory Division
06/25/01 version
Approved by:
Russell Grace, Manager Special Analysis Section
49 000064
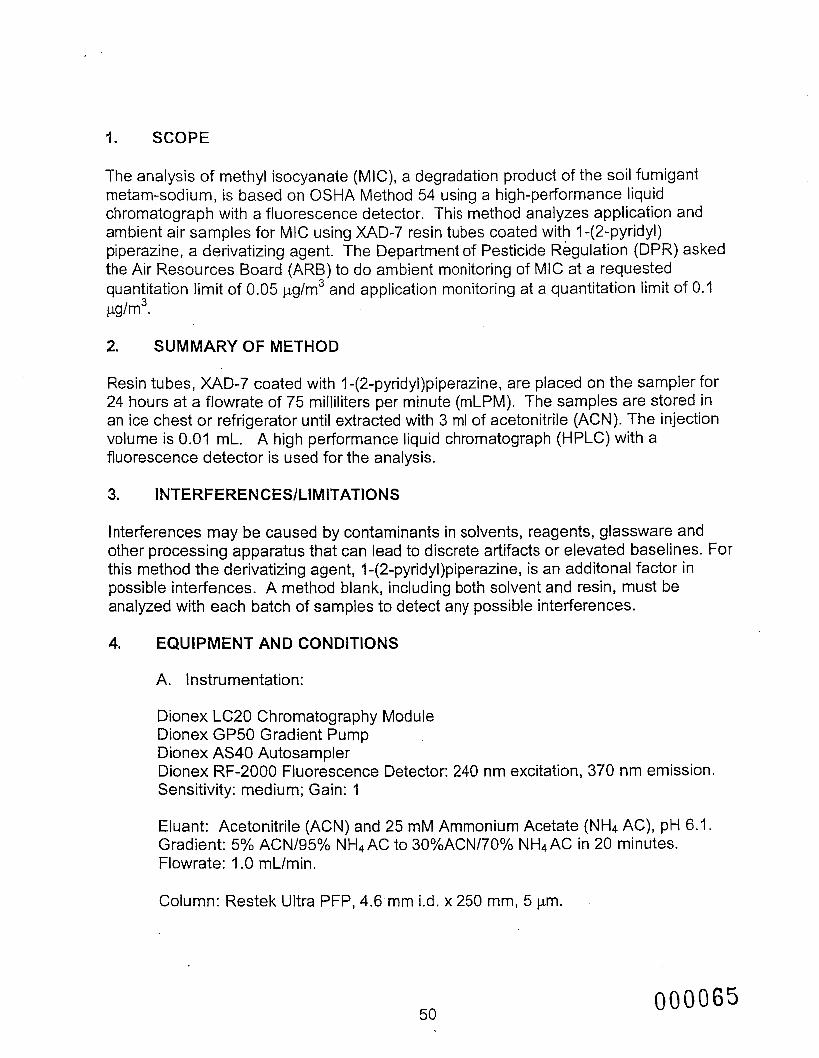
I. SCOPE
The analysis of methyl isocyanate (MIC), a degradation product of the soil fumigant metam-sodium, is based on OSHA Method 54 using a high-performance liquid chromatograph with a fluorescence detector. This method analyzes application and ambient air samples for MIC using XAD-7 resin tubes coated with 1-(2-pyridyl) piperazine, a derivatizing agent. The Department of Pesticide Regulation (DPR) asked the Air Resources Board (ARB) to do ambient monitoring of MIC at a requested quantitation limit of 0.05 pg/m3 and application monitoring at a quantitation limit of 0.1 pg/m3.
2. SUMMARY OF METHOD
Resin tubes, XAD-7 coated with I -(2-pyridyl)piperazine, are placed on the sampler for 24 hours at a flowrate of 75 milliliters per minute (mLPM). The samples are stored in an ice chest or refrigerator until extracted with 3 ml of acetonitrile (ACN). The injection volume is 0.01 mL. A high performance liquid chromatograph (HPLC) with a fluorescence detector is used for the analysis.
3. INTERFERENCESlLlMlTATlONS
Interferences may be caused by contaminants in solvents, reagents, glassware and other processing apparatus that can lead to discrete artifacts or elevated baselines. For this method the derivatizing agent, 1-(2-pyridyl)piperazineI is an additonal factor in possible interfences. A method blank, including both solvent and resin, must be analyzed with each batch of samples to detect any possible interferences.
4. EQUIPMENT AND CONDITIONS
A. Instrumentation:
Dionex LC20 Chromatography Module Dionex GP50 Gradient Pump Dionex AS40 Autosampler Dionex RF-2000 Fluorescence Detector: 240 nm excitation, 370 nm emission. Sensitivity: medium; Gain: 1
Eluant: Acetonitrile (ACN) and 25 mM Ammonium Acetate (NH4 AC), pH 6.1. Gradient: 5% ACN/95% NH4AC to 30%ACN/70% NH4AC in 20 minutes. Flowrate: 1 .O mLlmin.
Column: Restek Ultra PFP, 4.6 mm i.d. x 250 mm, 5 p.m.
50 000065
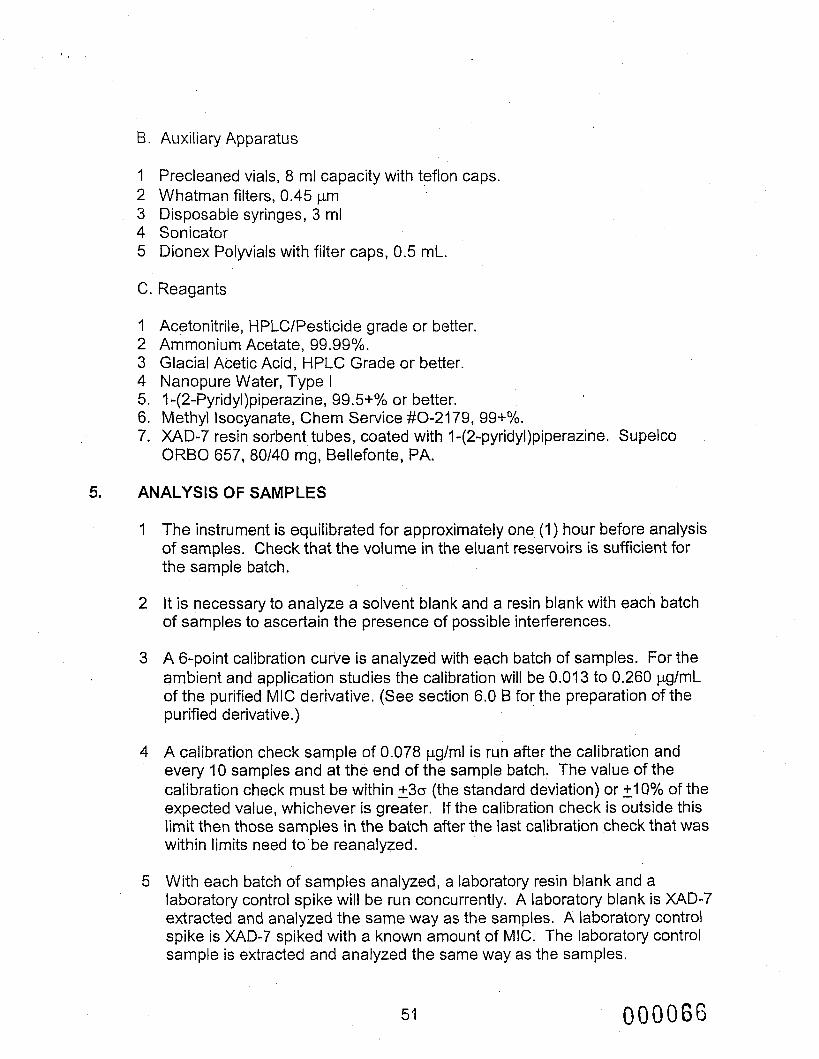
B. Auxiliary Apparatus
1 Precleaned vials, 8 ml capacity with teflon caps. 2 Whatman filters, 0.45 pm 3 Disposable syringes, 3 ml 4 Sonicator 5 Dionex Polyvials with filter caps, 0.5 mL.
C. Reagants
I Acetonitrile, HPLClPesticide grade or better. 2 Ammonium Acetate, 99.99%. 3 Glacial Acetic Acid, HPLC Grade or better. 4 Nanopure Water, Type I 5. 1-(2-PyridyI)piperazine, 99.5+% or better. 6. Methyl Isocyanate, Chem Service #0-2179, 99+%. 7. XAD-7 resin sorbent tubes, coated with 1-(2-pyridyI)piperazine. Supelco
ORB0 657, 80/40 mg, Bellefonte, PA.
5. ANALYSIS OF SAMPLES
I The instrument is equilibrated for approximately one (I) hour before analysis of samples. Check that the volume in the eluant reservoirs is sufficient for the sample batch.
2 It is necessary to analyze a solvent blank and a resin blank with each batch of samples to ascertain the presence of possible interferences.
3 A 6-point calibration cuWe is analyzed with each batch of samples. For the ambient and application studies the calibration will be 0.013 to 0.260 pg/mL of the purified MIC derivative. (See section 6.0 B for the preparation of the purified derivative.)
4 A calibration check sample of 0.078 pg/ml is run after the calibration and every I O samples and at the end of the sample batch. The value of the calibration check must be within 530 (the standard deviation) or + IO% of the expected value, whichever is greater. If the calibration check is outside this limit then those samples in the batch after the last calibration check that was within limits need to'be reanalyzed.
5 With each batch of samples analyzed, a laboratory resin blank and a laboratory control spike will be run concurrently. A laboratory blank is XAD-7 extracted and analyzed the same way as the samples. A laboratory control spike is XAD-7 spiked with a known amount of MIC. The laboratory control sample is extracted and analyzed the same way as the samples.
51 O O O O G G
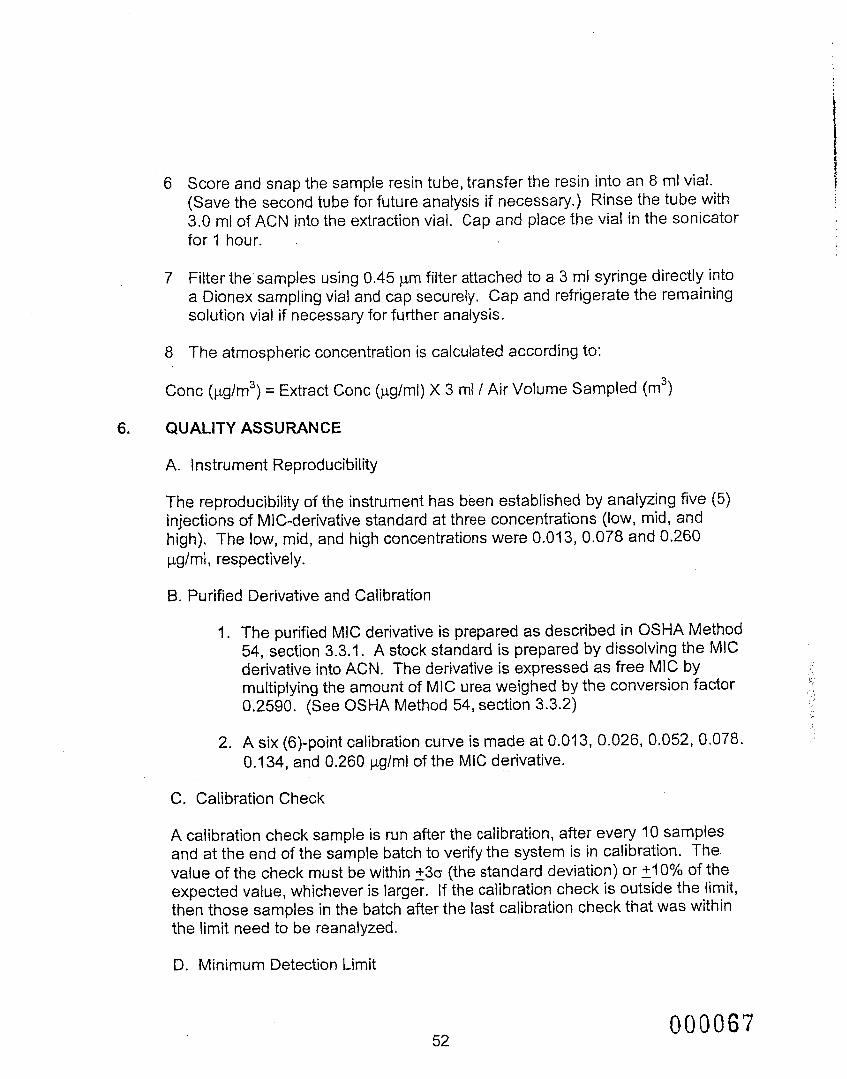
6 Score and snap the sample resin tube, transfer the resin into an 8 ml vial. (Save the second tube for future analysis if necessary.) Rinse the tube with 3.0 ml of ACN into the extraction vial. Cap and place the vial in the sonicator for 1 hour.
7 Filter the samples using 0.45 pm filter attached to a 3 ml syringe directly into a Dionex sampling vial and cap securely, Cap and refrigerate the remaining solution vial if necessary for further analysis.
8 The atmospheric concentration is calculated according to:
Conc (pg/m3) = Extract Conc (pglml) X 3 ml I Air Volume Sampled (m3)
6. QUALITY ASSURANCE
A. instrument Reproducibility
The reproducibility of the instrument has been established by analyzing five (5) injections of MIC-derivative standard at three concentrations (low, mid, and high). The low, mid, and high concentrations were 0.013, 0.078 and 0.260 pglrnl, respectively.
6. Purified Derivative and Calibration
1. The purified MIC derivative is prepared as described in OSHA Method 54, section 3.3.1. A stock standard is prepared by dissolving the MIC derivative into ACN. The derivative is expressed as free MIC by multiplying the amount of MIC urea weighed by the conversion factor 0.2590. (See OSHA Method 54, section 3.3.2)
2. A six (6)-point calibration curve is made at 0.01 3, 0.026, 0.052, 0.078. 0.134, and 0.260 pglml of the MIC derivative.
C. Calibration Check
A calibration check sample is run after the calibration, after every 10 samples and at the end of the sample batch to verify the system is in calibration. The value of the check must be within 330 (the standard deviation) or + I O % of the expected value, whichever is larger. If the calibration check is outside the limit, then those samples in the batch after the last calibration check that was within the limit need to be reanalyzed.
D. Minimum Detection Limit
52 000067

The detection limit is based on US EPA MDL calculation. The method detection limit (MDL) and the estimated quantitation limit (EQL) for methyl isocyanate is calculated by the analysis of seven (7) replicates of a low-level matrix spike. The MDL = 3.14*(std dev values), where std dev = the standard deviation of the concentration calculated for the seven replicate spikes. For MIC the MDL is 0.009 pg/sample (0.003 pglmL). EQL, defined as 5*MDL, is 0.045 kglsample (0.015 pg/mL) based on a 3 ml extraction.volume. Results above the EQL are reported to 3 significant figures. Results below EQL but above the MDL are reported as DET (detected) and results less than.the MDL are reported as ND (nondetect).
E.' Collection and Extraction Efficiency (Recovery)
Methyl isocyanate at a low and high level are spiked on XAD-7 tubes. The spiked tubes are placed on field samplers with airflows of 75 mLpm for 24 hours. The samples are extracted with ACN and prepared as described in section 5, #6- 7. The recovery of MIC for this method is low, ranging 50% to 70%. At concentrations above I .O pglmL the recovery is greater than 70%.
F. Storage Stability
Storage stability will be run concurrent with analysis of samples.
I . Breakthrough
A low sample flow rate is required for this method and optimization of the bed weights with the derivatizing agent is necessary to capture the MIC and minimize interference.
H. Safety
This procedure does not address all of the safety concerns associated with chemical analysis. It is the responsibility of the analyst to establish appropriate safety and health practices. For hazard information and guidance refer to the material safety data sheets (MSDS) of any chemicals used in this procedure.
53 0000G3
APPENDIX Ill
Field Data Sheets for MIC

CARTRIDGE FIELD LOG SHEET .
Proiect: MIC Ambient Air Monitoring in Monterey 81 Santa Cruz Counties
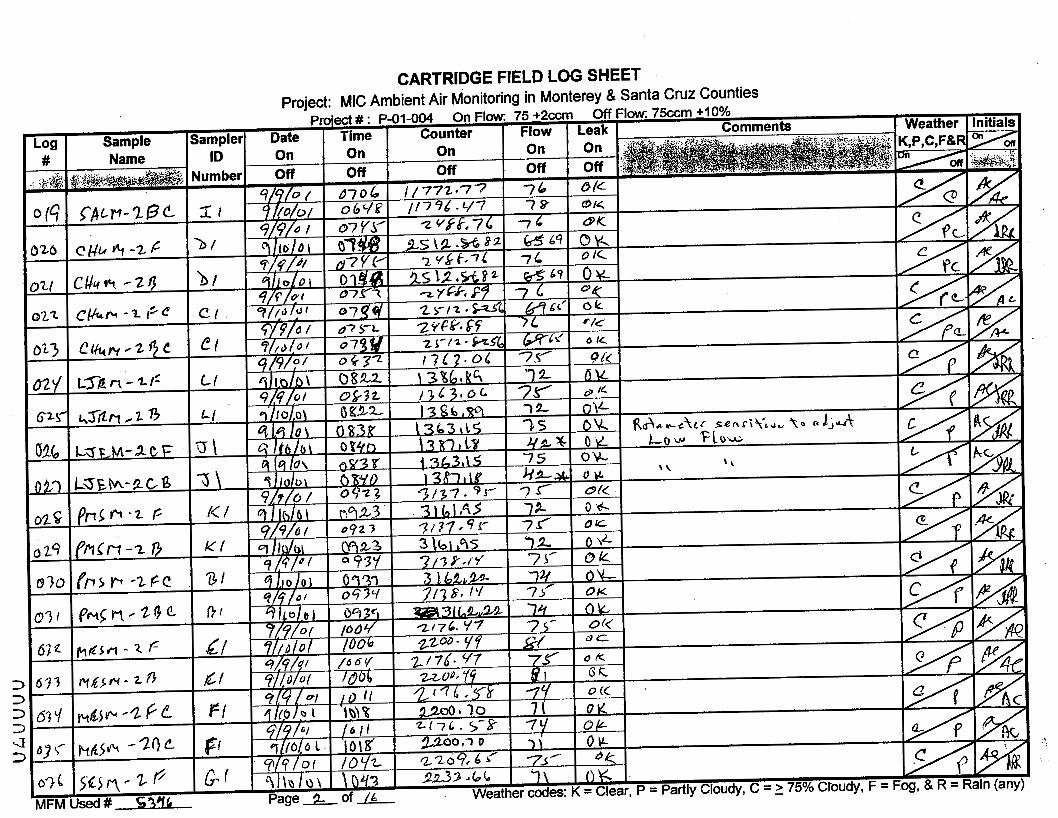
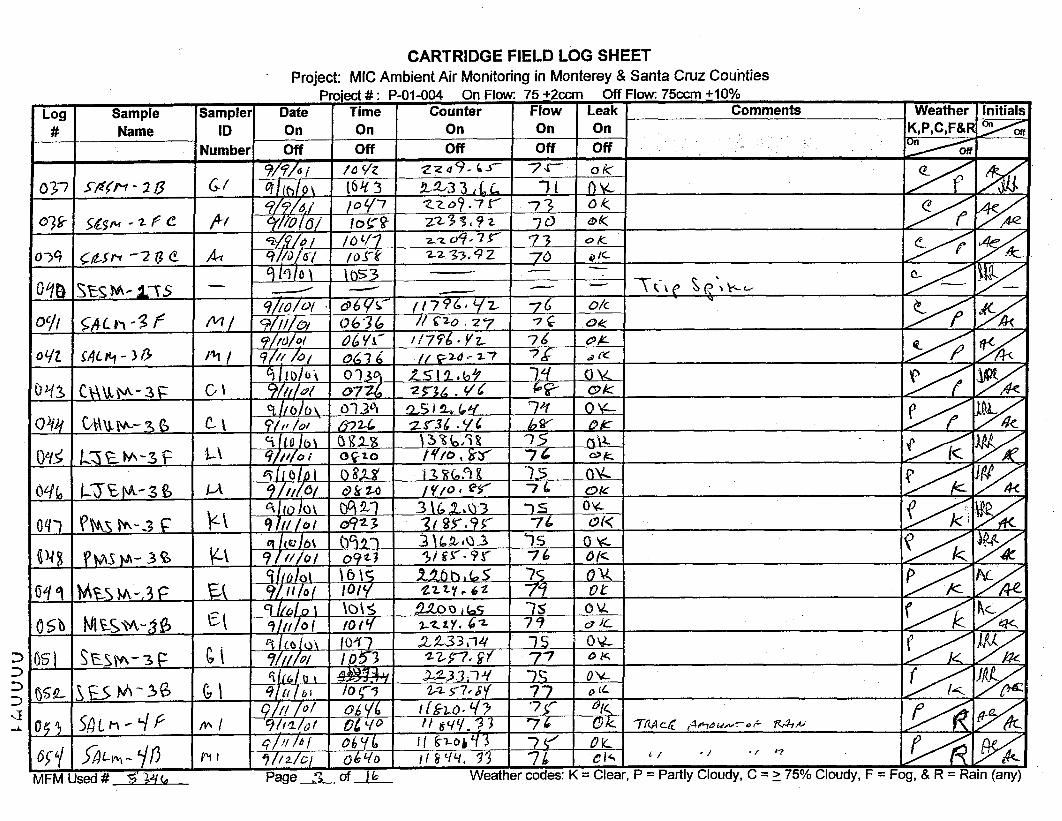
P
P C C C C

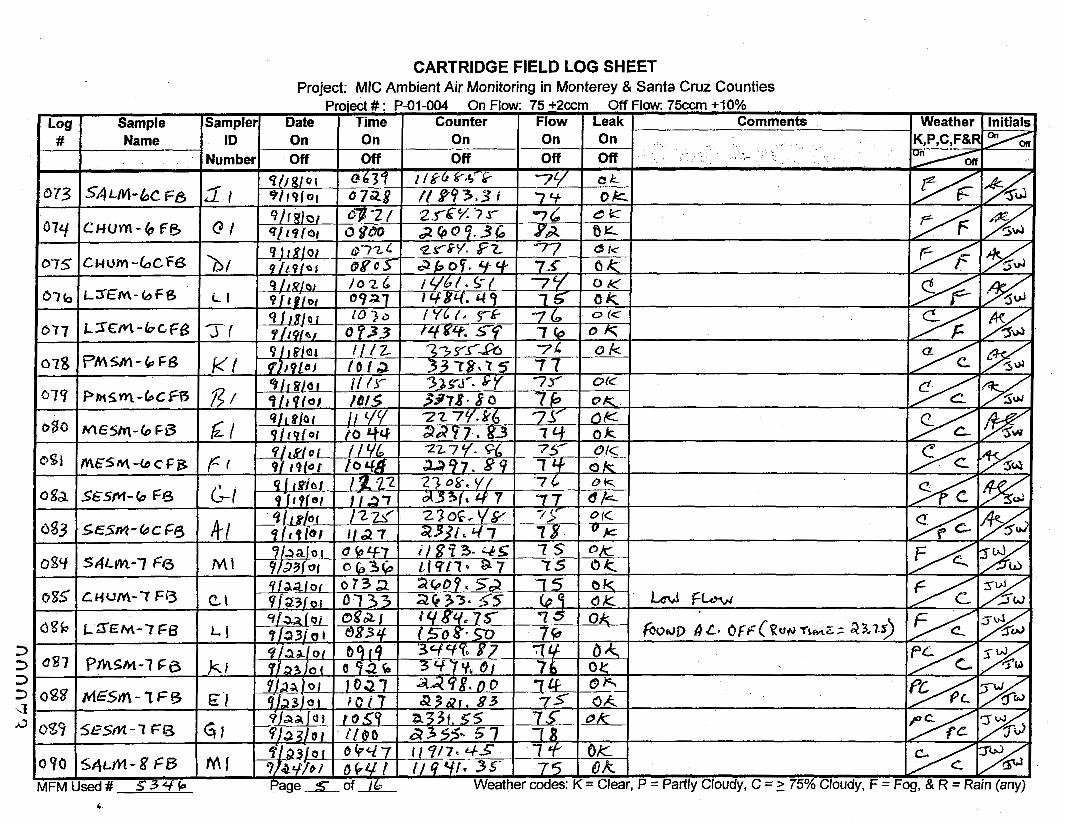
cy f: C C C C
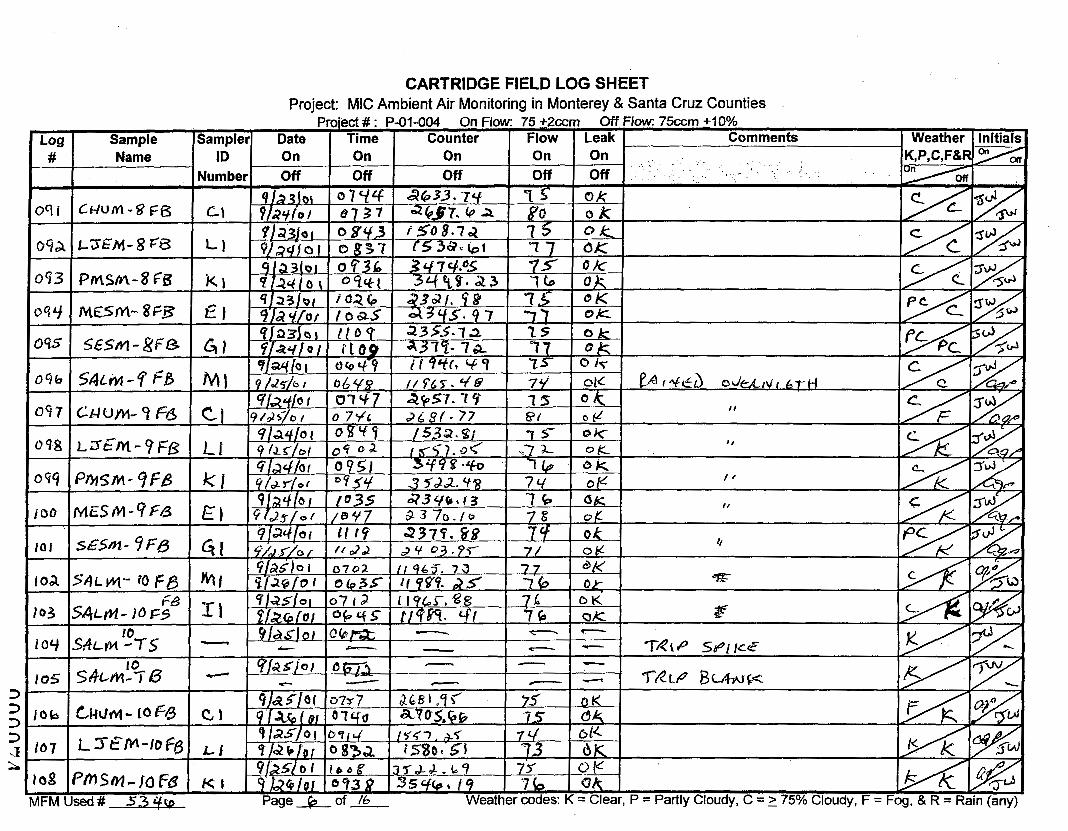
CARTRIDGE FIELD LOG SHEET Proiect: MIC Ambient Air Monitoring in Monterey & Santa Cruz Counties
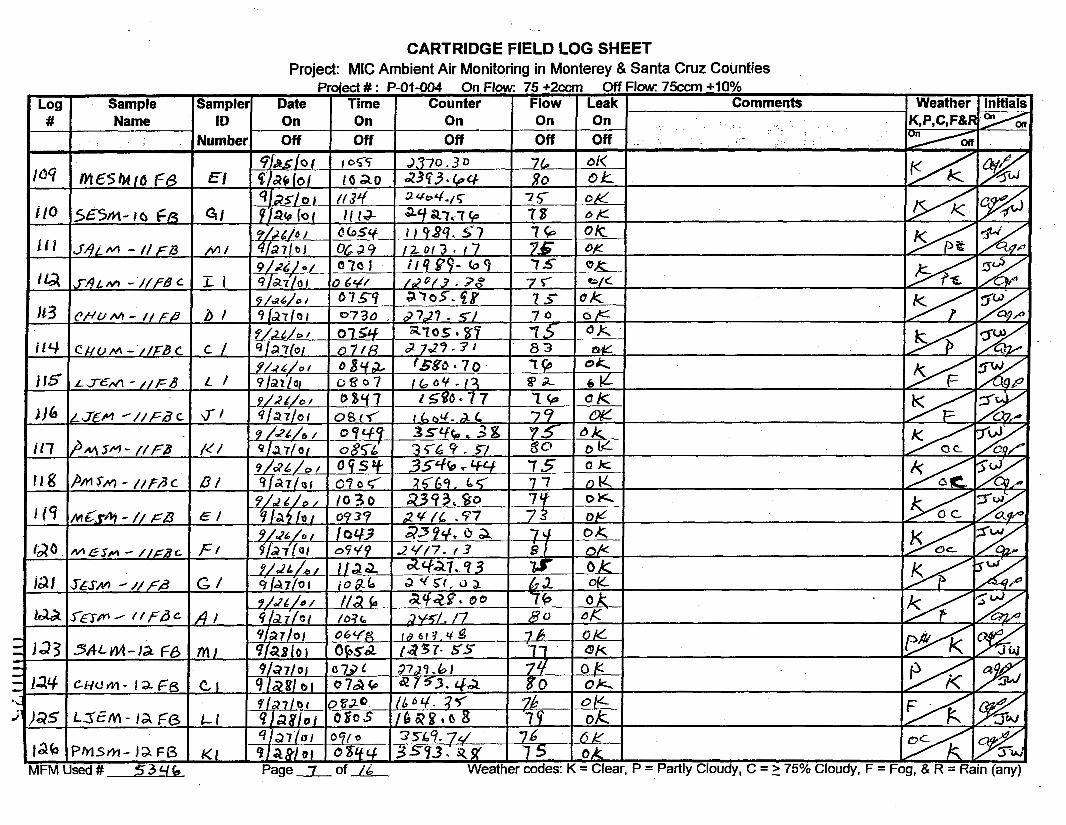
..
CARTRIDGE FIELD LOG SHEET Project: MIC Ambient Air Monitoring in Monterey & Santa Cruz Counties
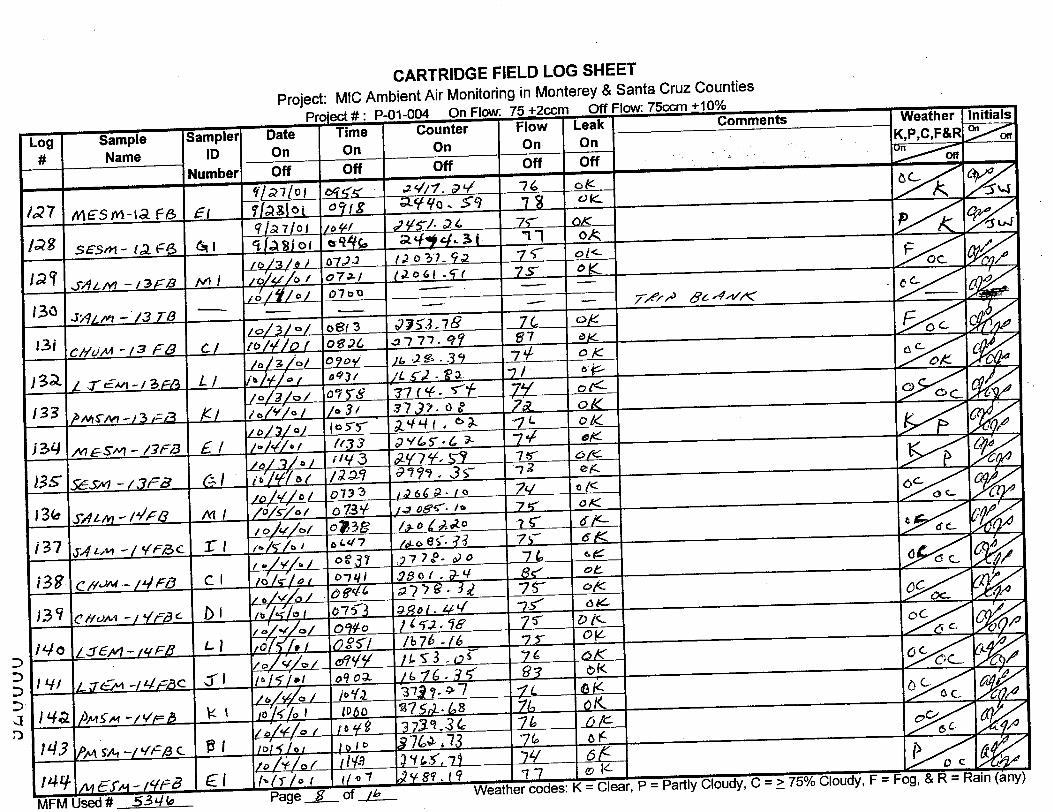

CARTRIDGE FIELD LOG SHEET Project: MIC Ambient Air Monitoring in Monterey & Santa Crur Counties
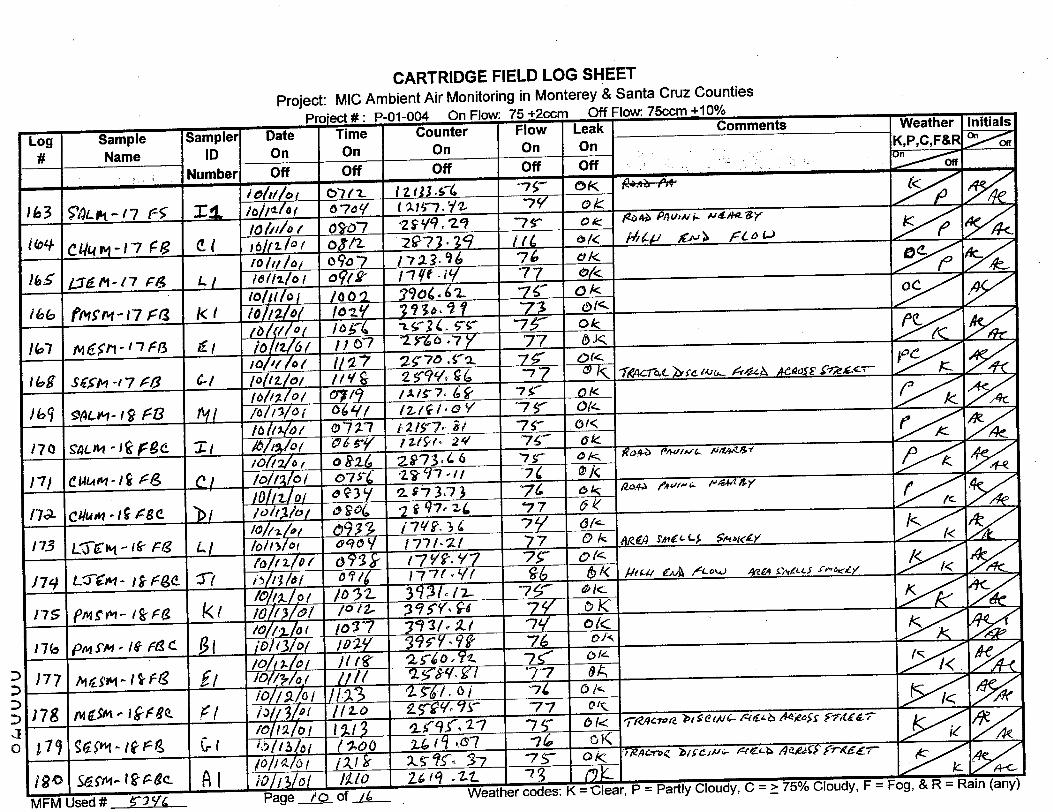
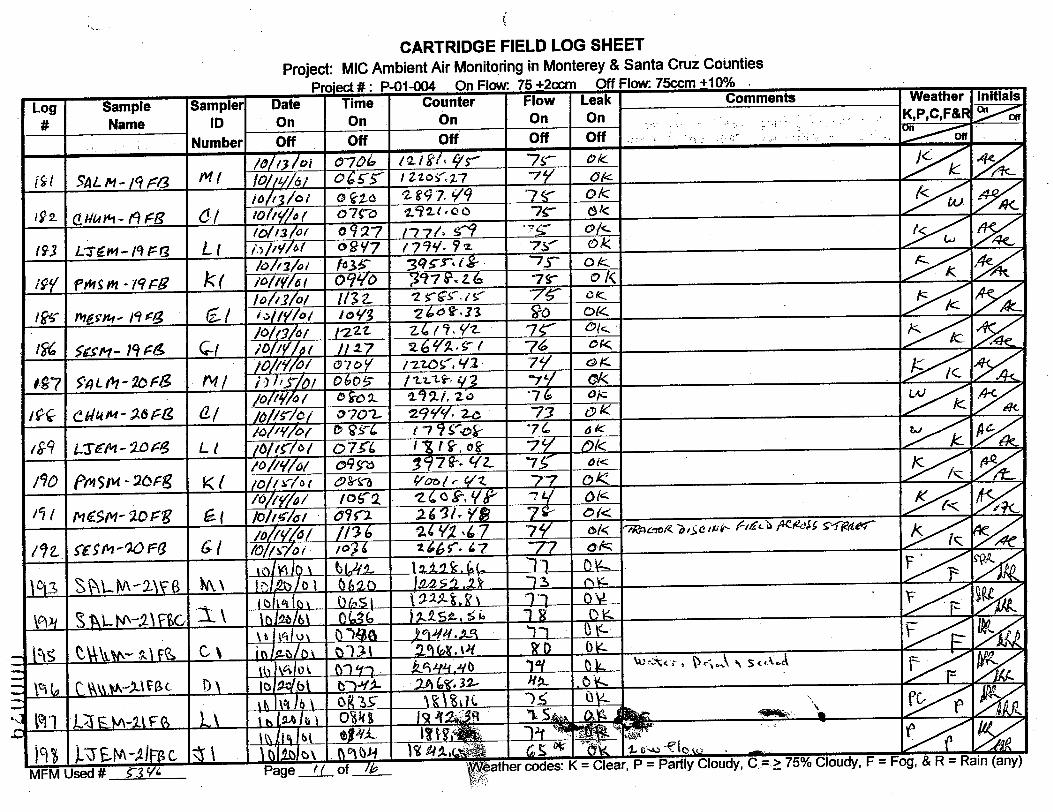
I
I I r

i
m a, II a
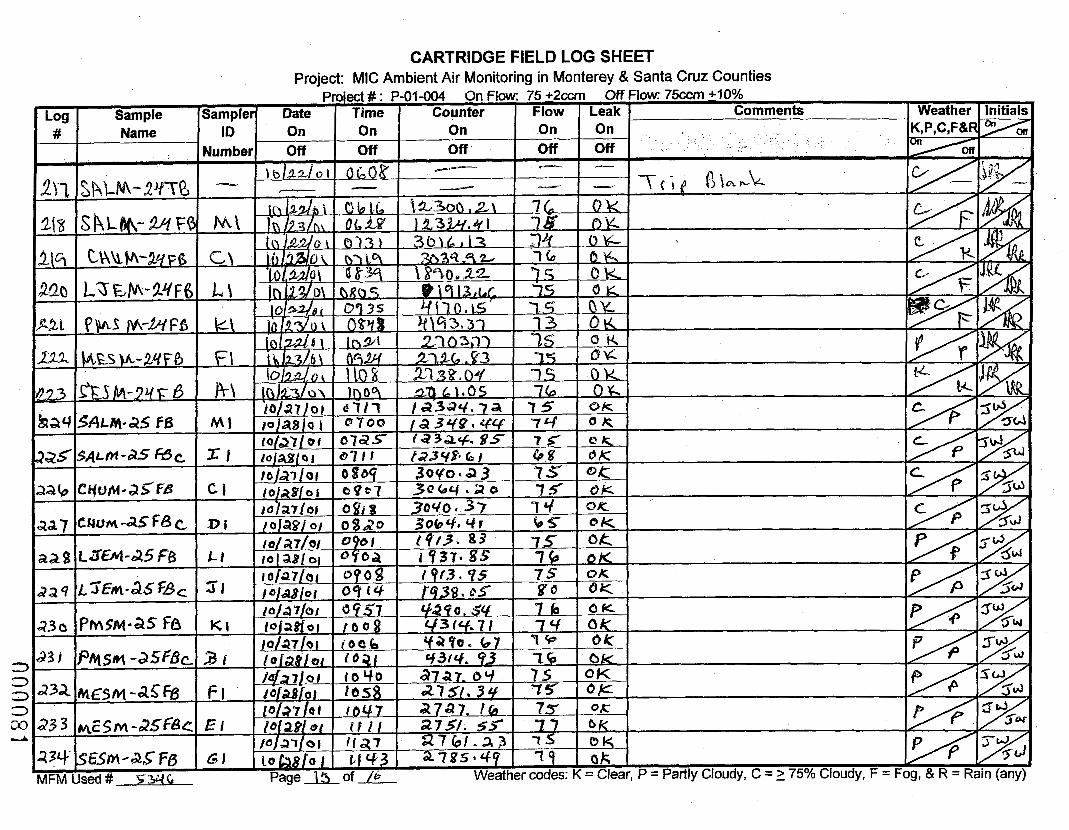
CARTRIDGE FIELD LOG SHEET Project: MIC Ambient Air Monitoring in Monterey & Santa Cruz Counties
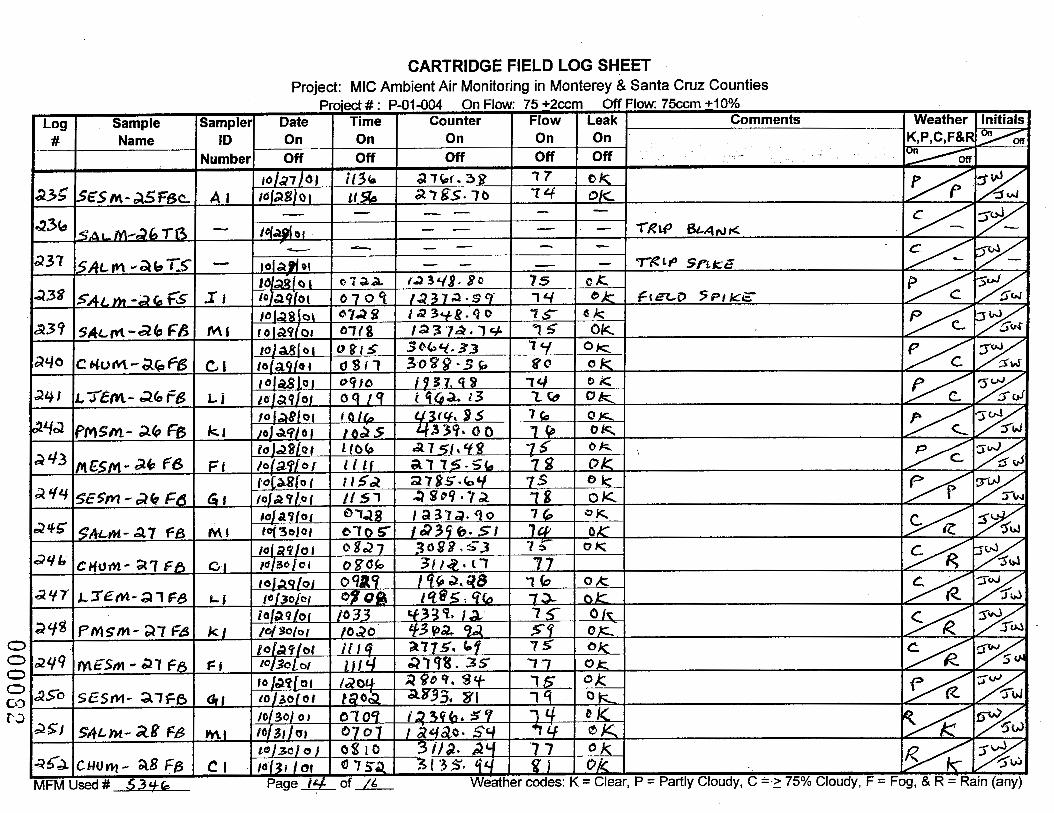
CARTRIDGE FIELD LOG SHEET Proiect: MIC Ambient Air Monitoring in Monterey & Santa Cruz Counties
project # : P-01-004 On Flow: 75 +2ccm Off Flow: 75ccm +lo% !r Date. Time Counter Flow Leak Comments Weather Initials
On On On On On K , P , C , F B R ~ ofr D n riff I off I Off I off I off I
i
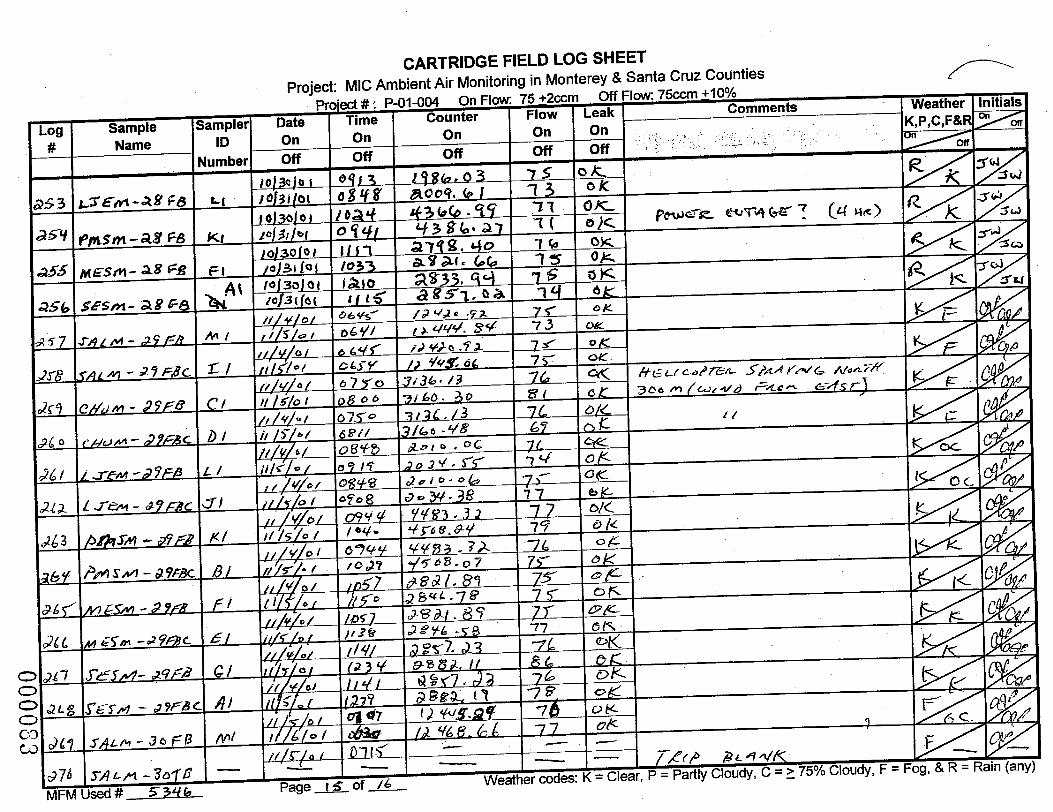
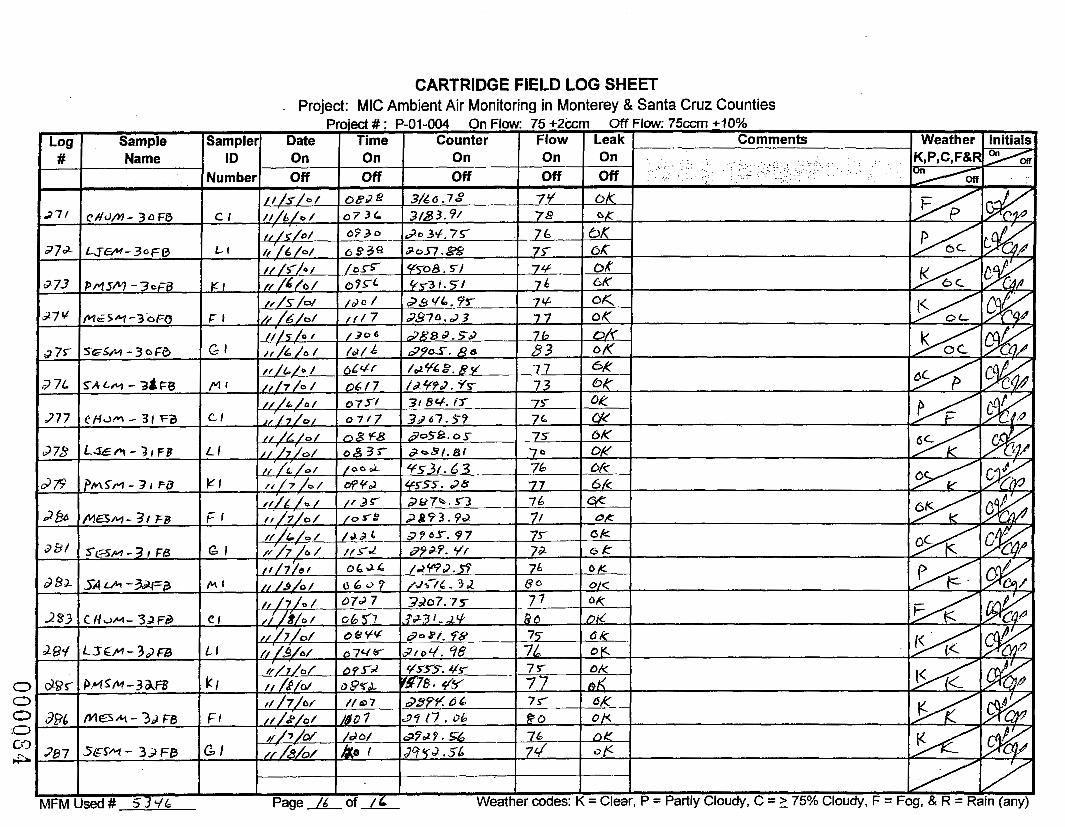
0 0 C G G7
CARTRIDGE FIELD LOG SHEET . Project: MIC Ambient Air Monitoring in Monterey & Santa Cruz Counties
Weather I initials

APPENDIX IV
Field Data Sheets for Chloropicrin
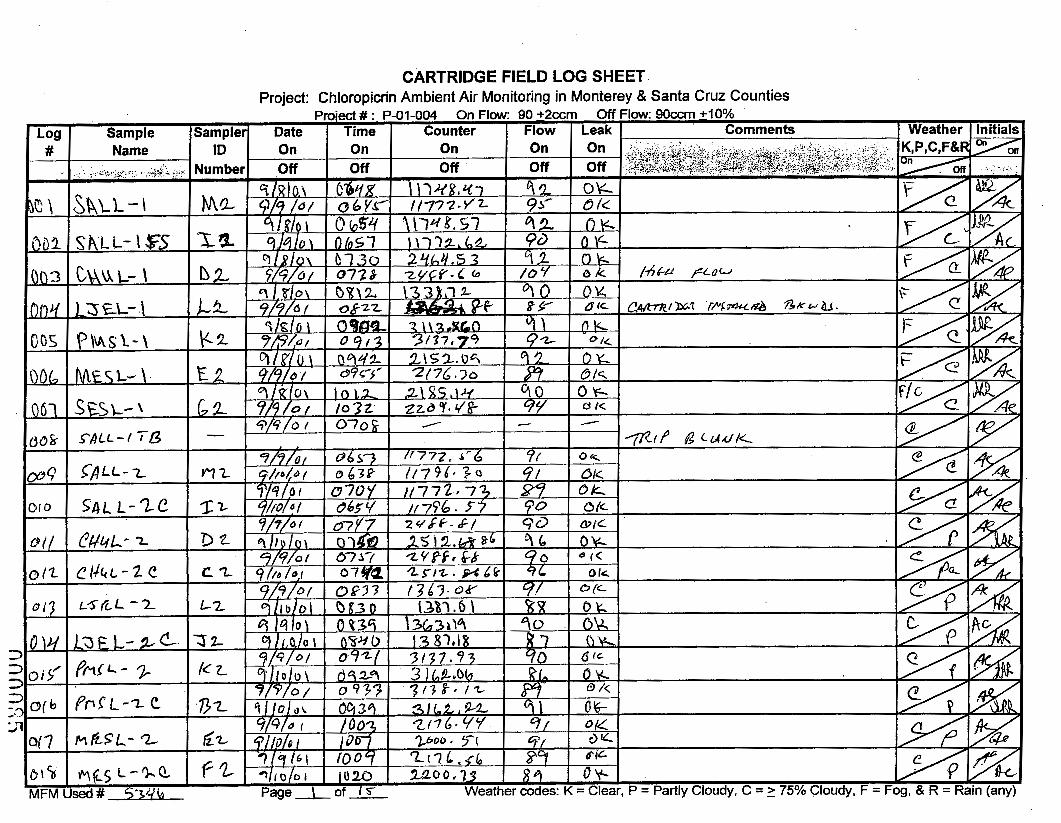
CARTRIDGE FIELD LOG SHEET
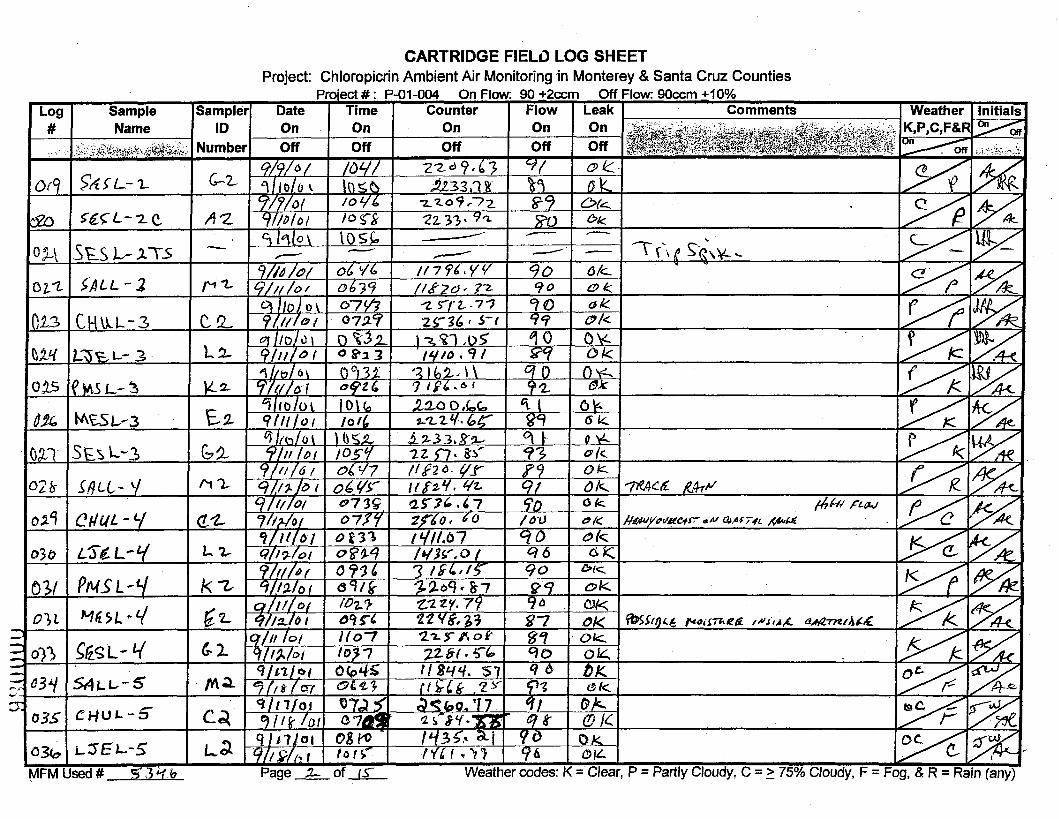
CARTRIDGE FIELD LOG SHEET Project: Chloropicrin Ambient Air Monitoring in Monterey & Santa Cnrz Counties

CARTRIDGE FIELD LOG SHEET Proiect: Chloropicrin Ambient Air Monitoring in Monterey & Santa Cruz Counties
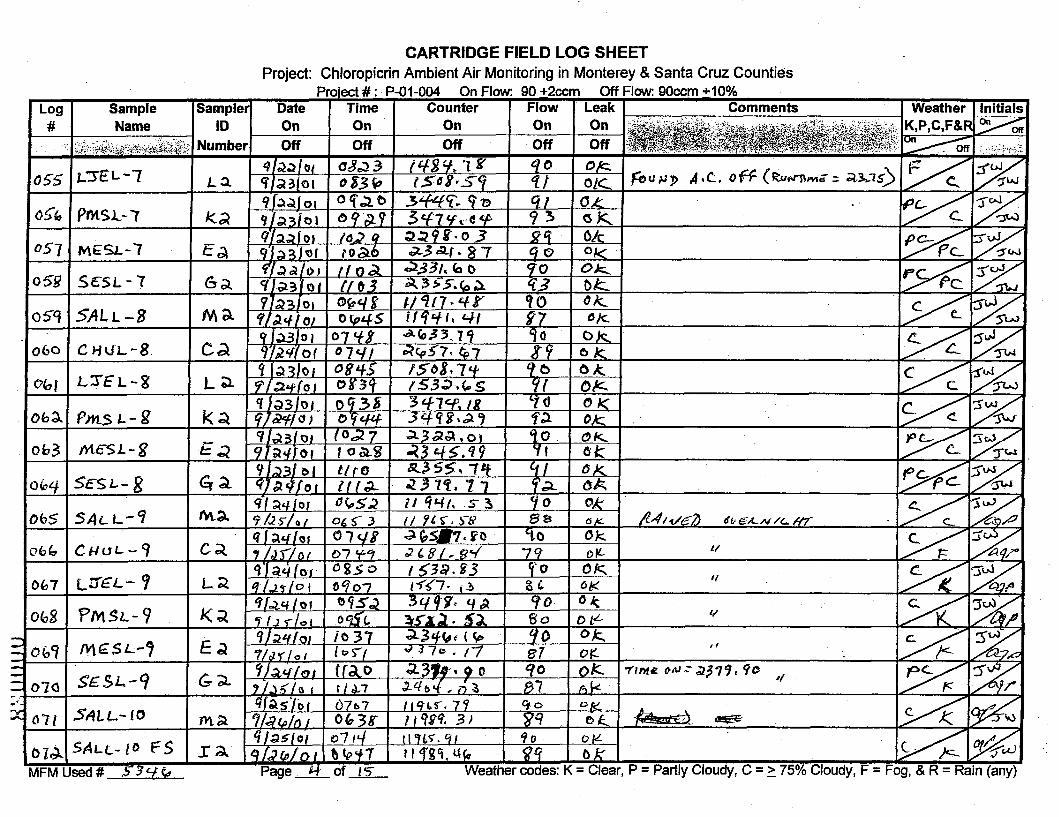
CARTRIDGE FIELD LOG SHEET Project: Chloropicrin Ambient Air Monitoring in Monterey & Santa Cruz Counties
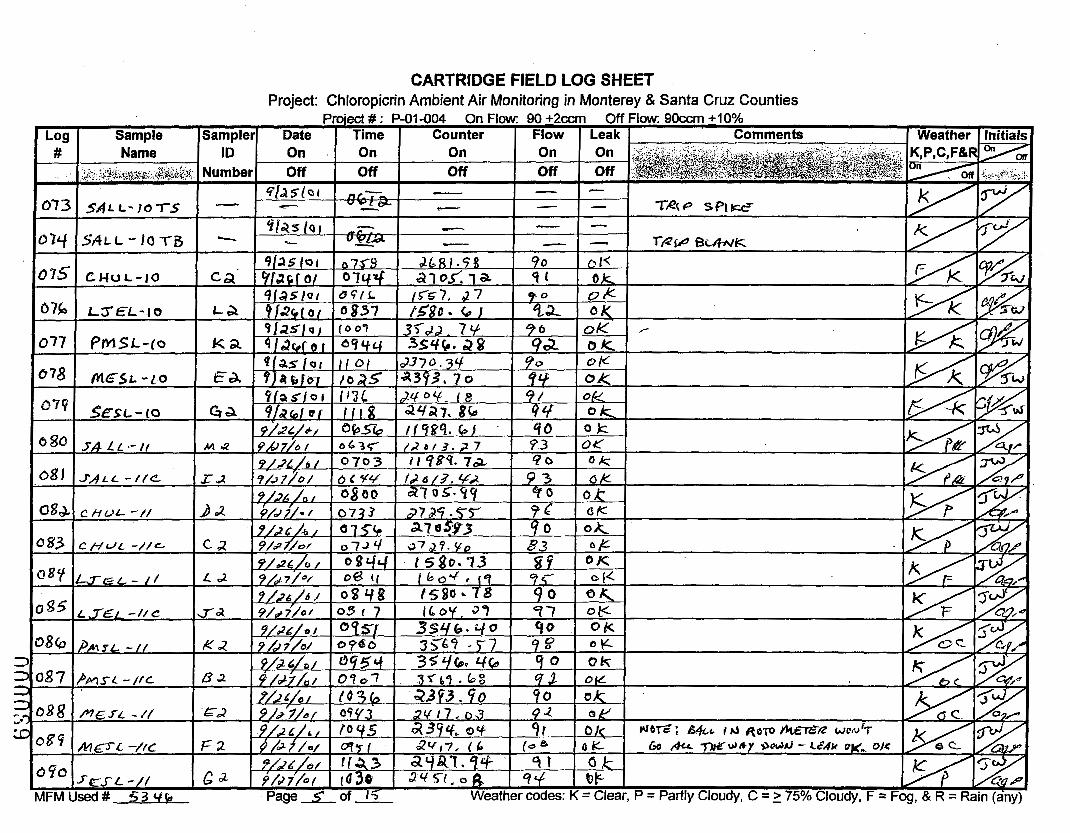
CARTRIDGE FIELD LOG SHEET Project: Chloropicrin Ambient Air Monitoring in Monterey & Santa Cruz Counties
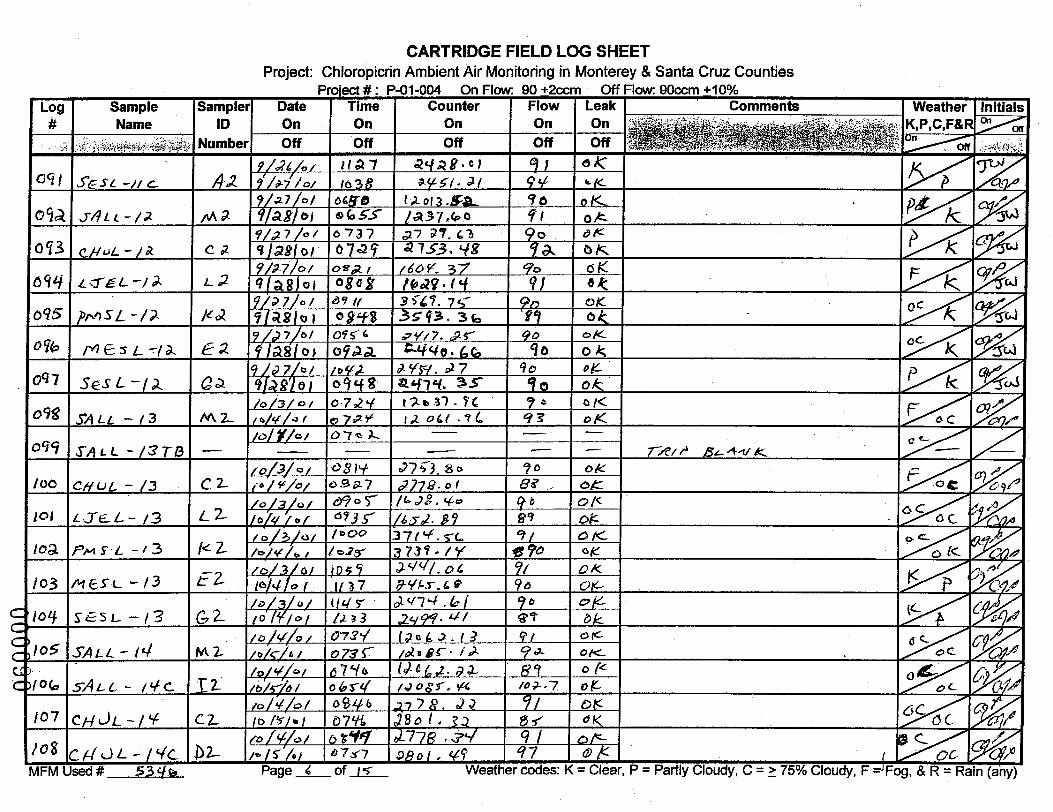
tn a, .-
u I
t +
I d c
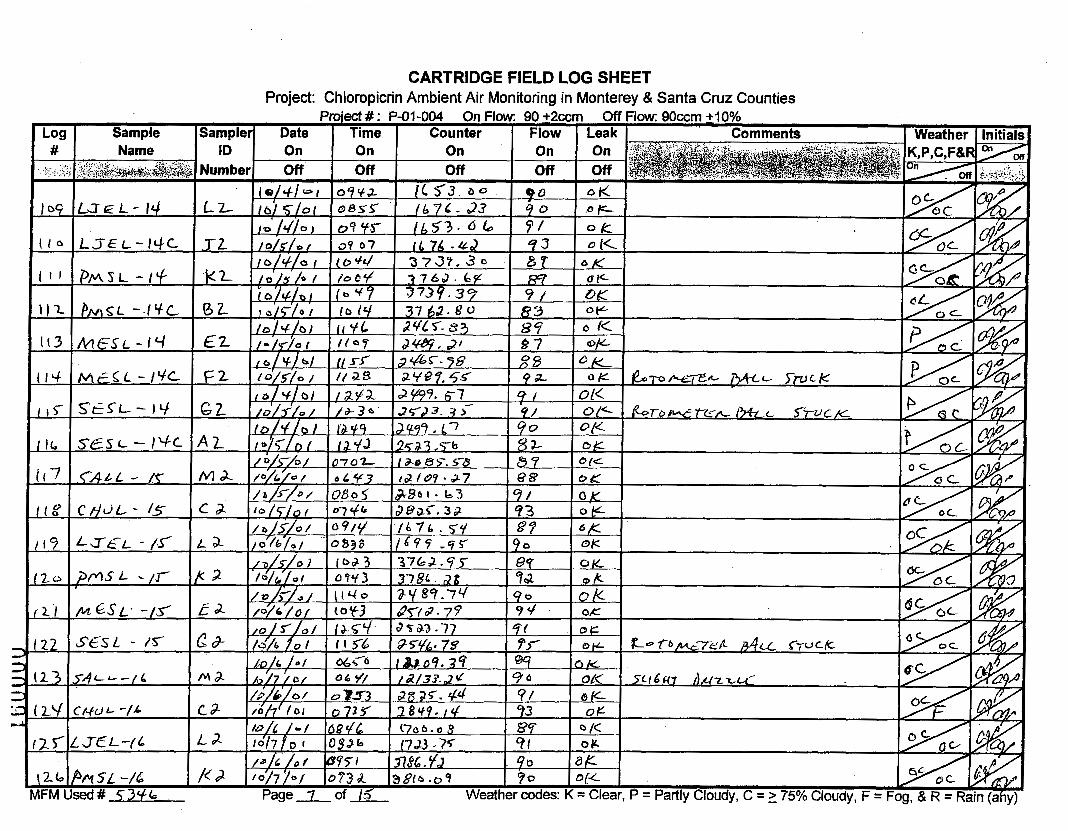
CARTRIDGE FIELD LOG SHEET Project: Chloropicrin Ambient Air Monitoring in Monterey & Santa Cruz Counties
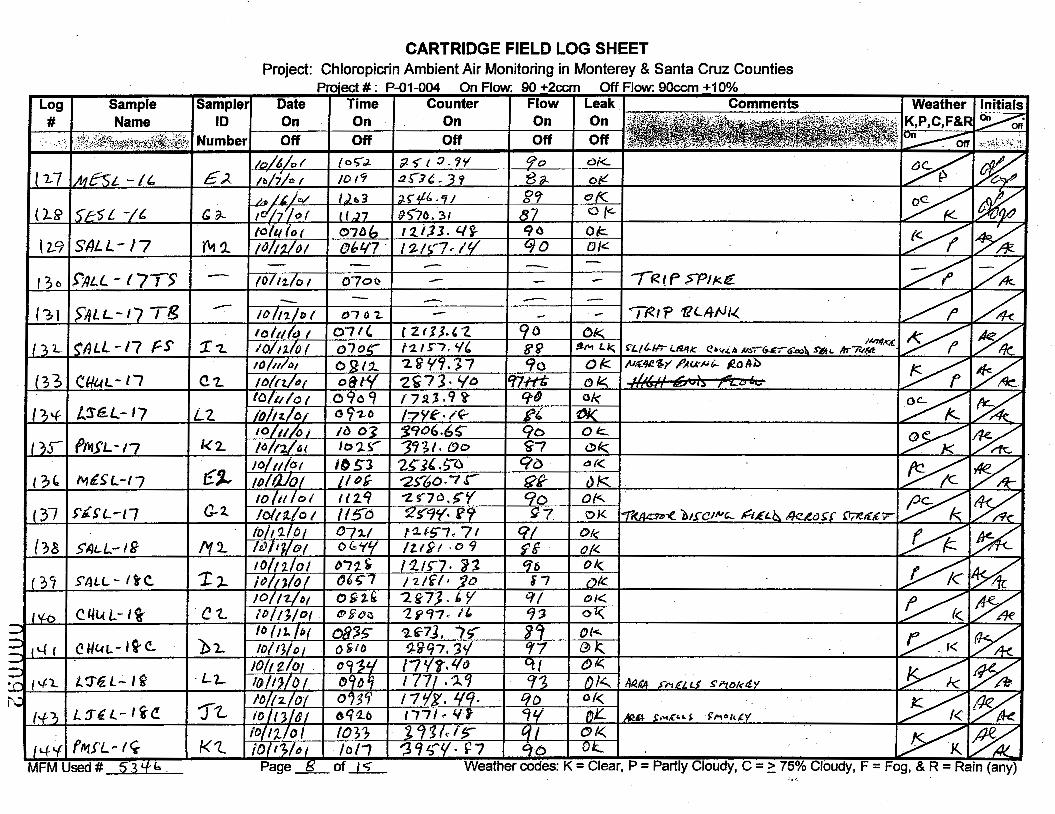
CARTRIDGE FIELD LOG SHEET Project: Chloropicrin Ambient Air Monitoring in Monterey & Santa Cruz Counties
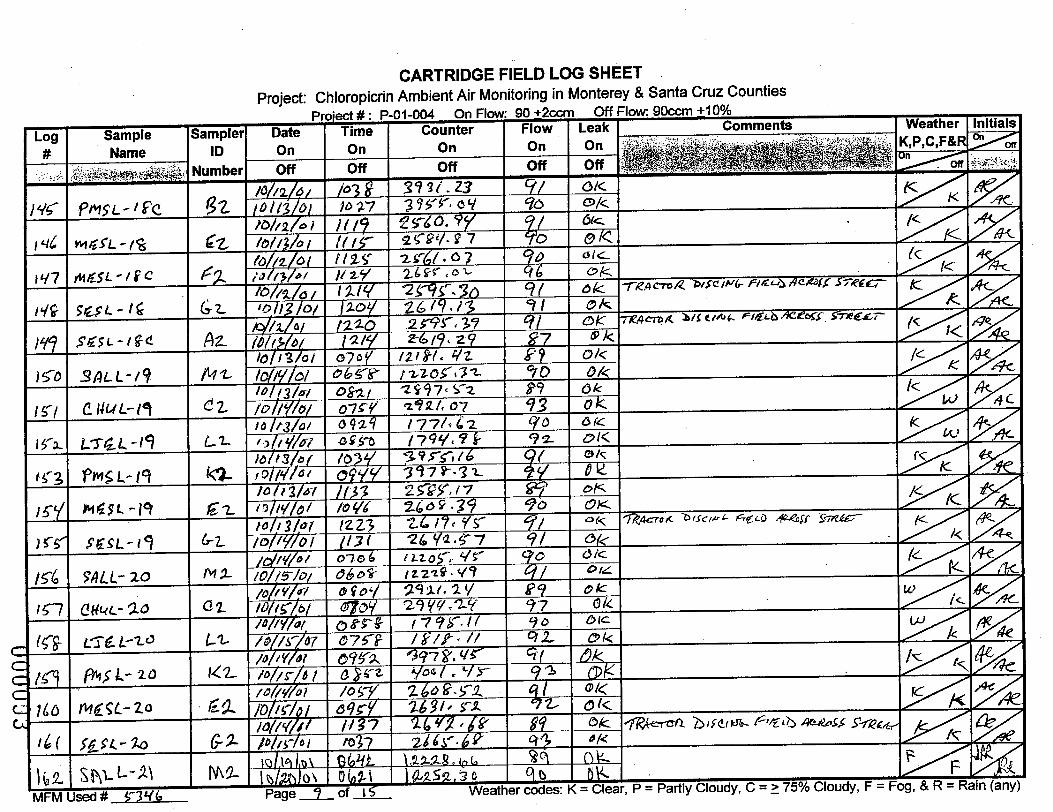
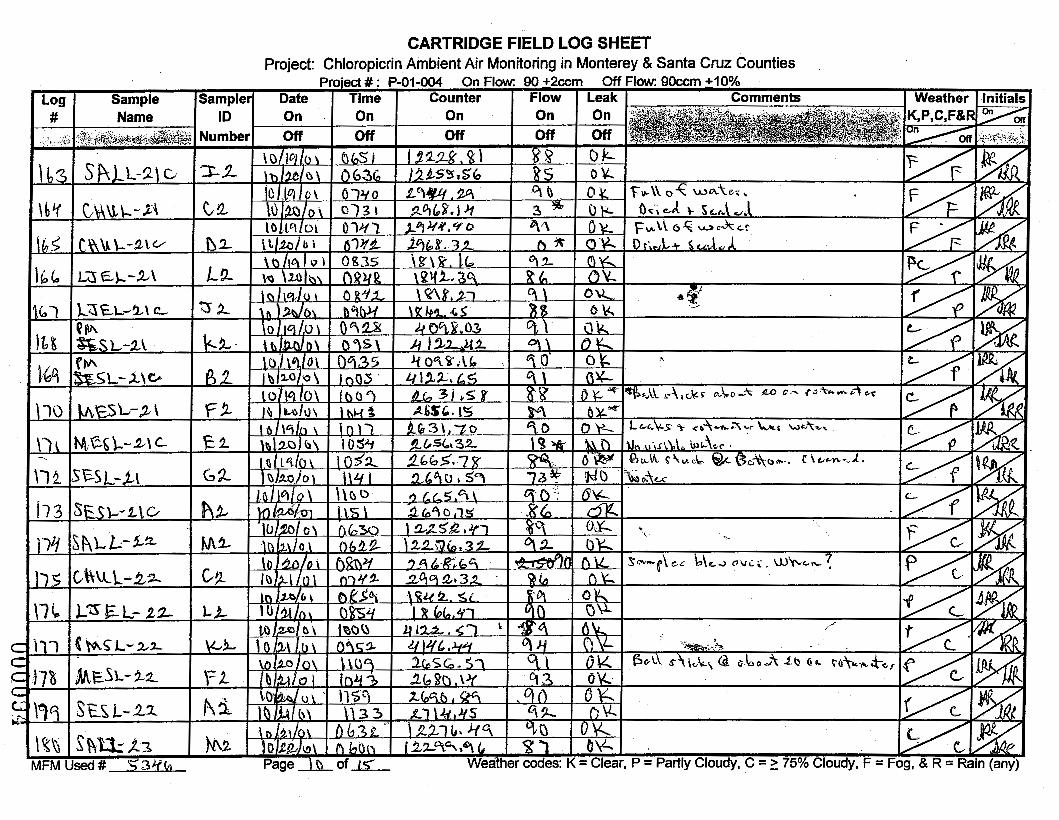
CARTRIDGE FIELD LOG SHEET Proiect: Chloropicrin Ambient Air Monitoring in Monterey & Santa Cruz Counties


CARTRIDGE FIELD LOG SHEET Project: Chloropicrin Ambient Air Monitoring in Monterey & Santa Cruz Counties
,


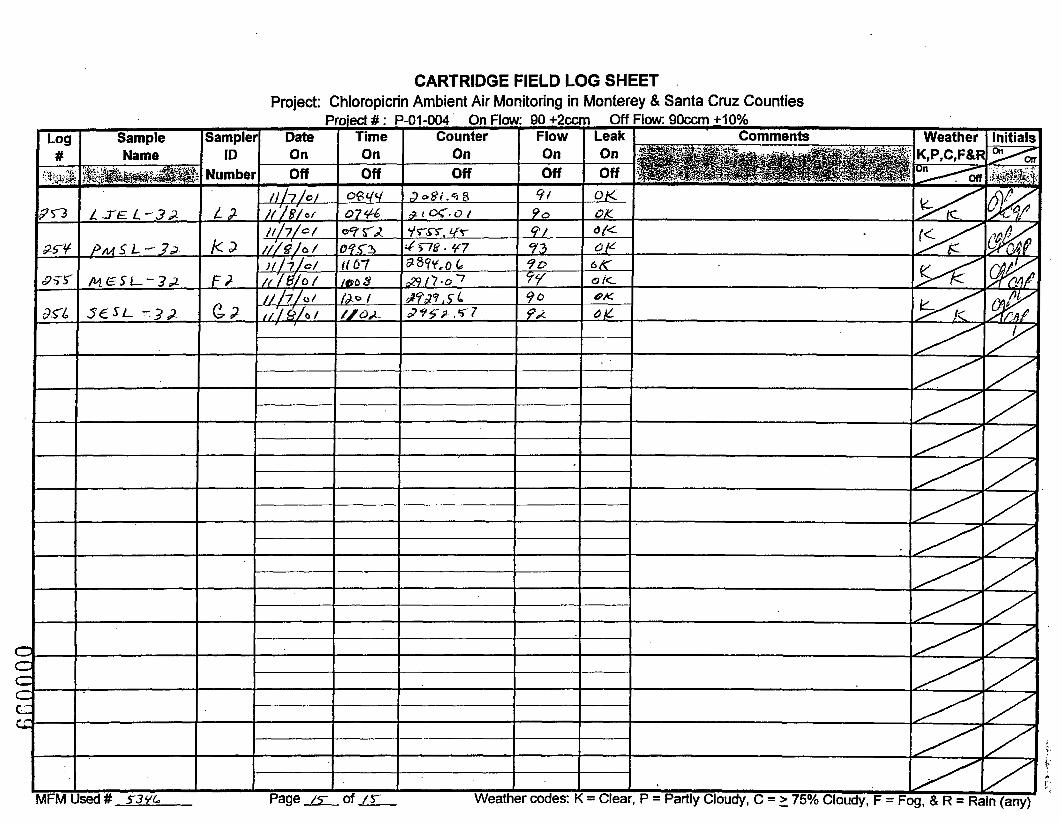
CARTRIDGE FIELD LOG SHEET Project: Chloropicrin Ambient Air Monitoring in Monterey & Santa Cruz Counties
C C C C c ii
APPENDIX V
Field Data Sheets for MlTC and 1,3-Dichloropropene'
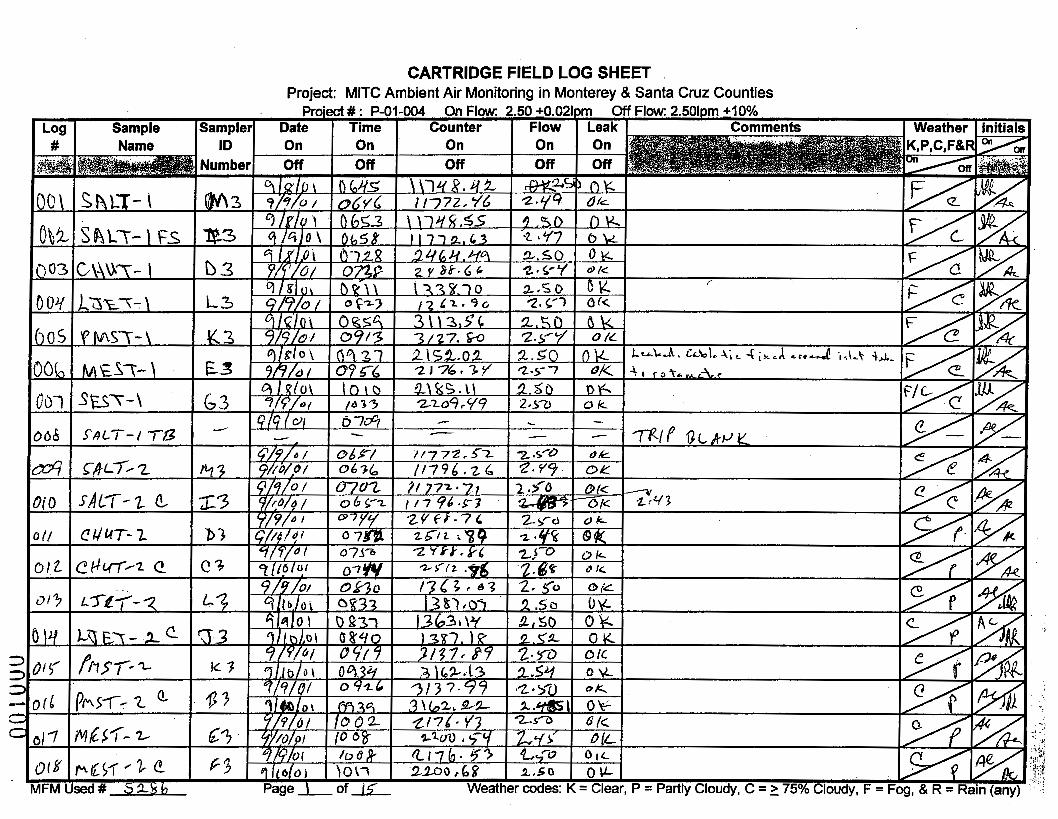
CARTRIDGE FIELD LOG SHEET Project: MlTC Ambient Air Monitoring in Monterey & Santa Cruz Counties

I # I Name
CARTRIDGE FIELD LOG SHEET Project: MlTC Ambient Air Monitoring in Monterey & Santa Crur Counties
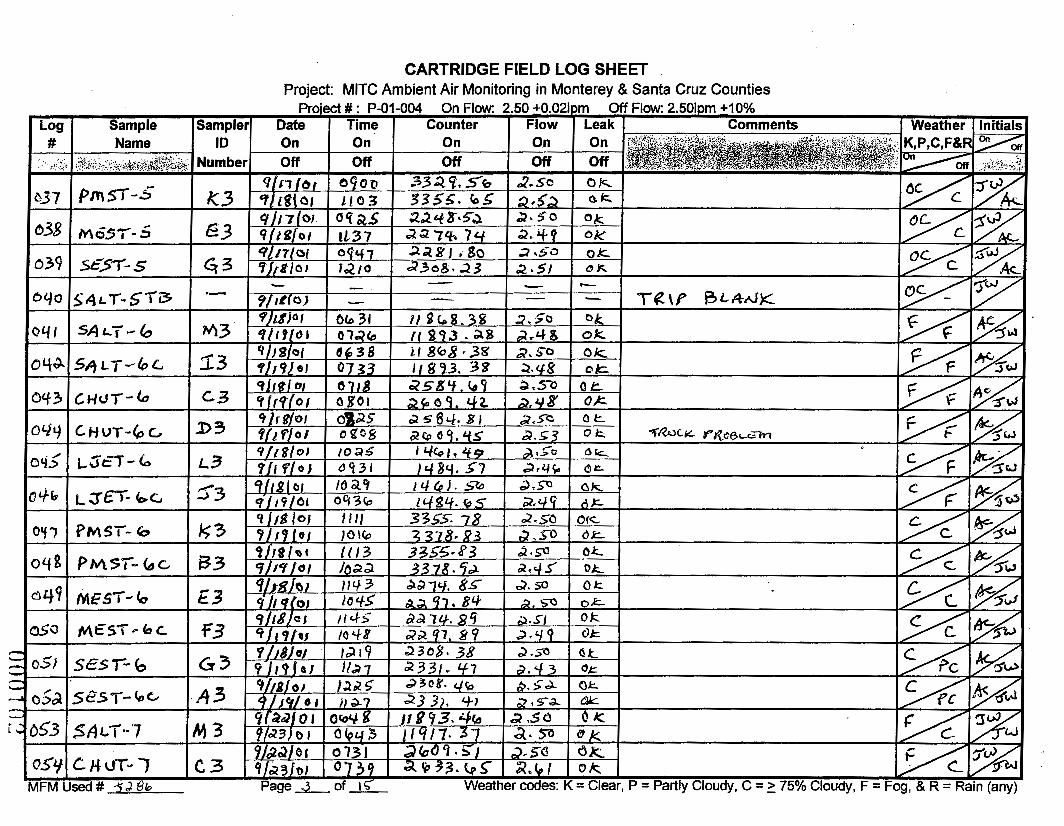
CARTRIDGE FIELD LOG SHEET Proiect: MlTC Ambient Air Monitoring in Monterey & Santa Cruz Counties

CARTRIDGE FIELD LOG SHEET Project: MlTC Ambient Air Monitoring in Monterey & Santa Cruz Counties

CARTRIDGE FIELD LOG SHEET

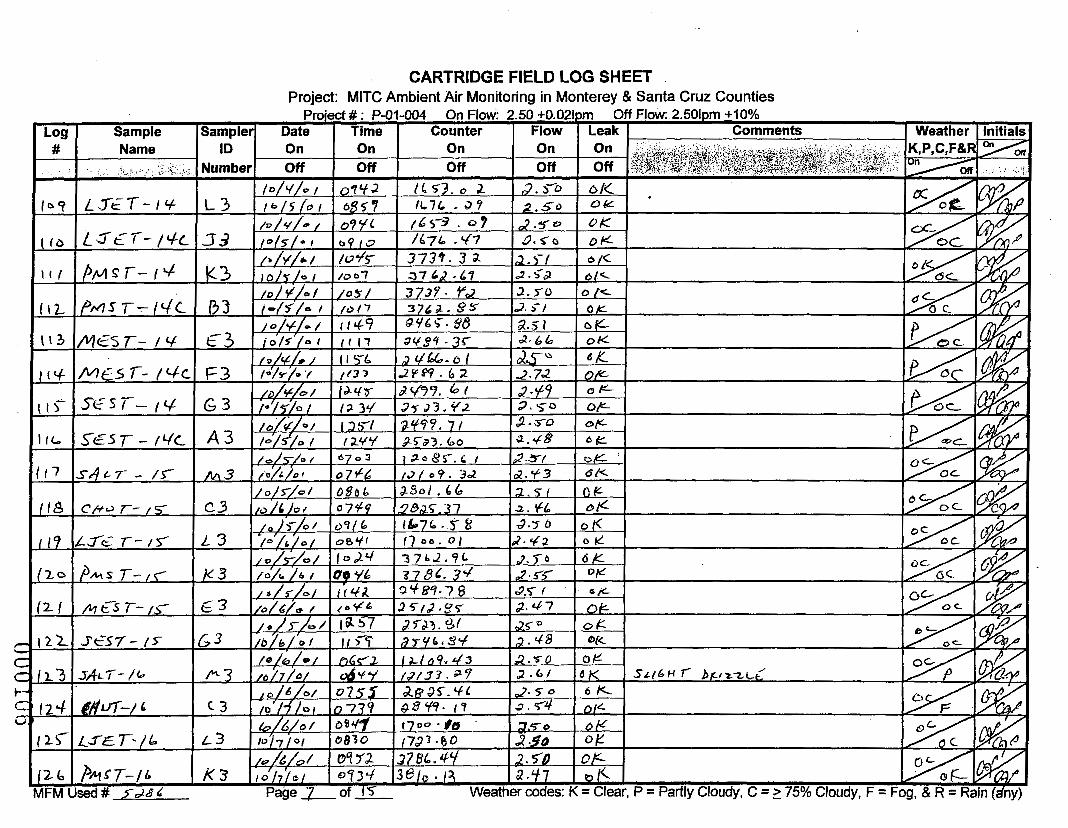
CARTRIDGE FIELD LOG SHEET Proiect: MlTC Ambient Air Monitoring in Monterey & Santa Cruz Counties
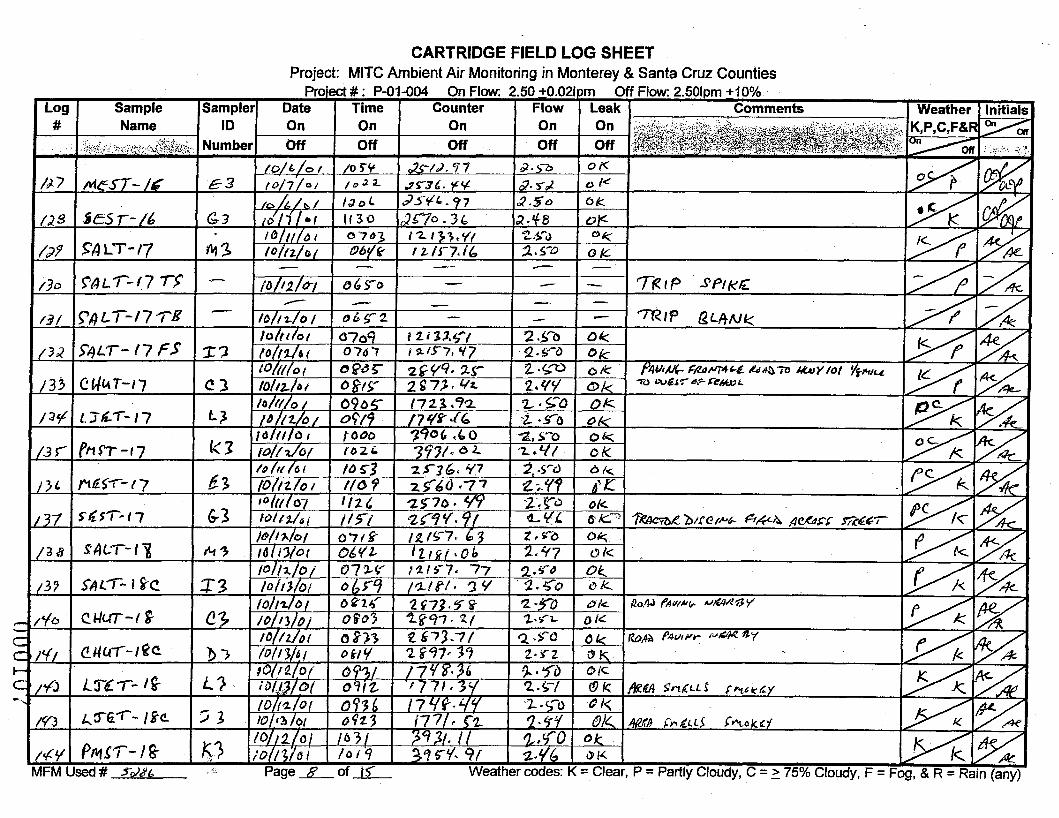
CARTRIDGE FIELD LOG SHEET Project: MlTC Ambient Air Monitoring in Monterey & Santa Cruz Counties
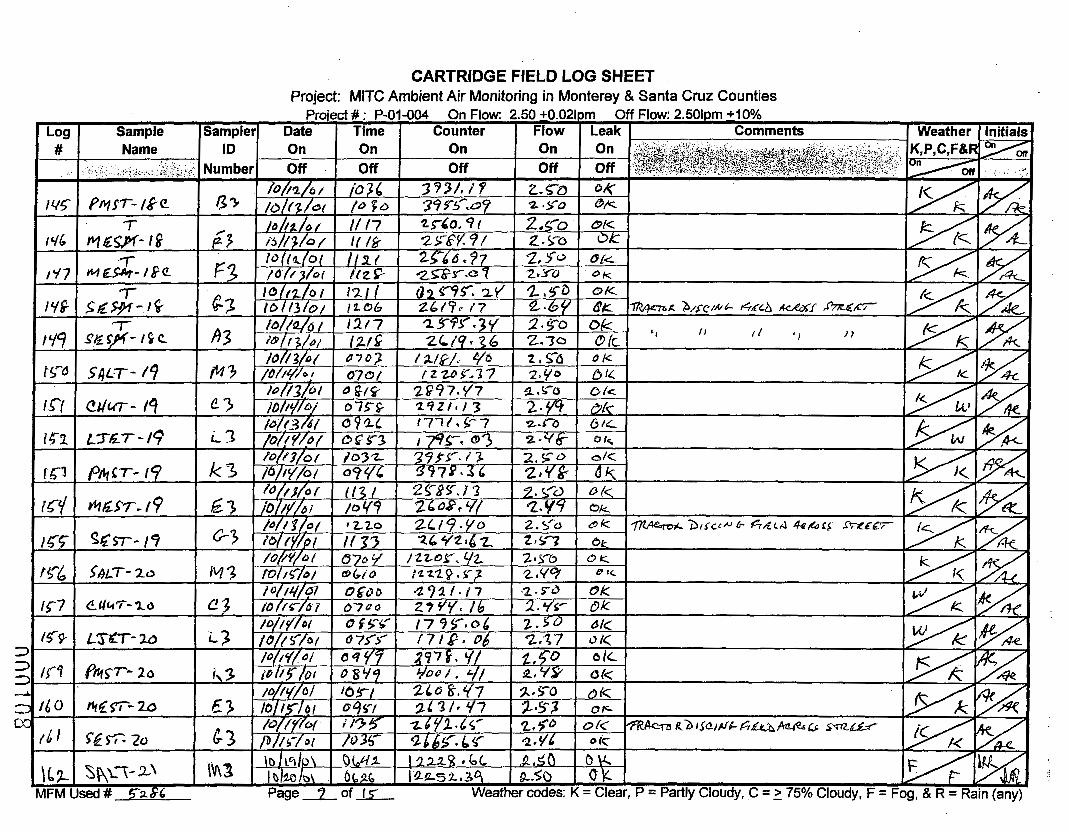
CARTRIDGE FIELD LOG SHEET Project: MITC Ambient Air Monitoring in Monterey & Santa Cruz Counties
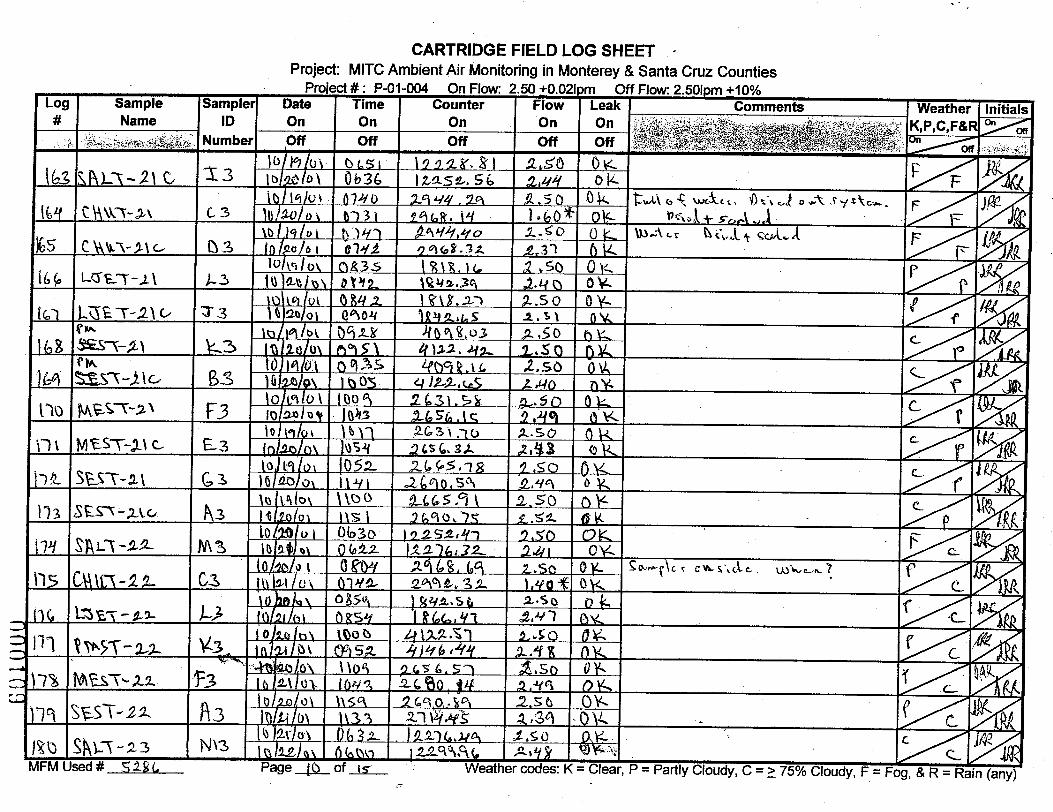
fi

CARTRIDGE FIELD LOG SHEET Proiect: MlTC Ambient Air Monitoring in Monterey & Santa Cruz Counties
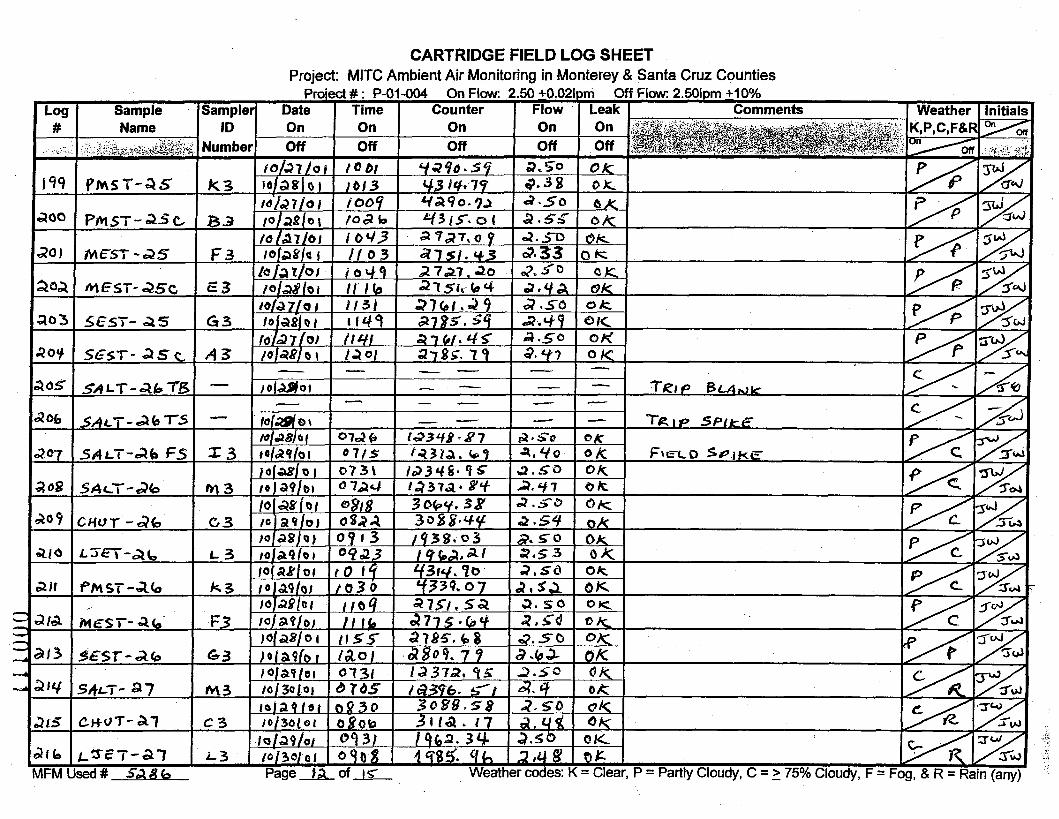
CARTRIDGE FIELD LOG SHEET Project: MlTC Ambient Air Monitoring in Monterey & Santa Cruz Counties
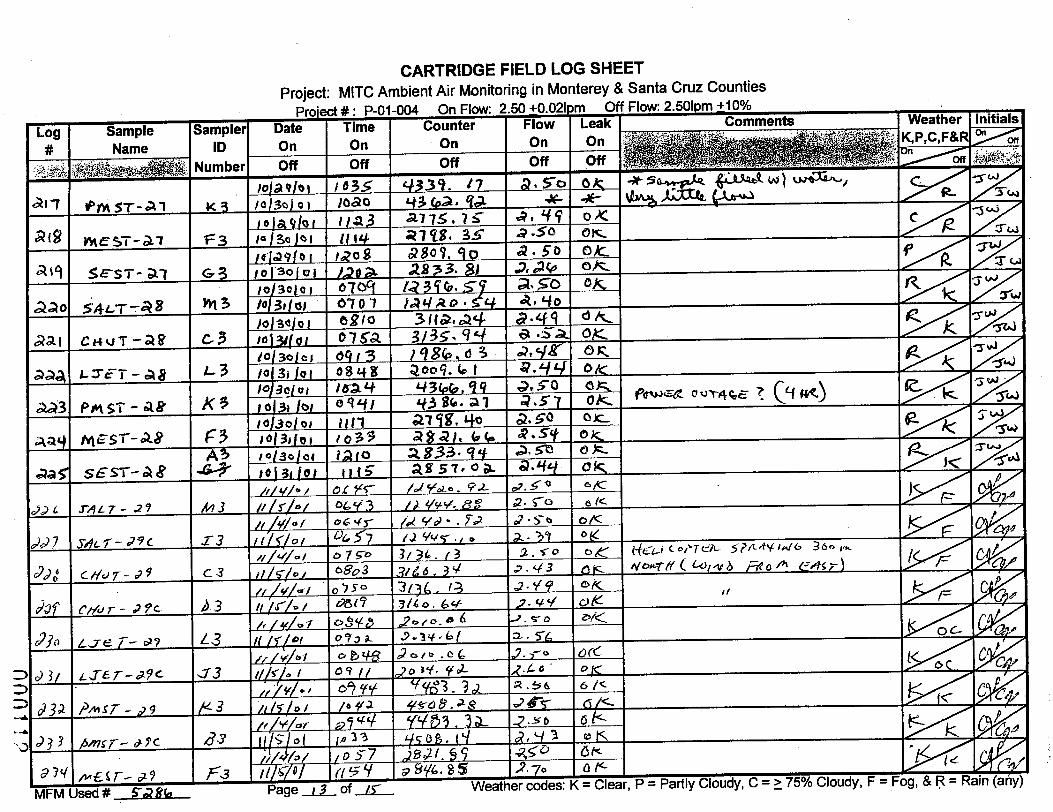

CARTRIDGE FIELD LOG SHEET Project: MlTC Ambient Air Monitoring in Monterey & Santa Cruz Counties
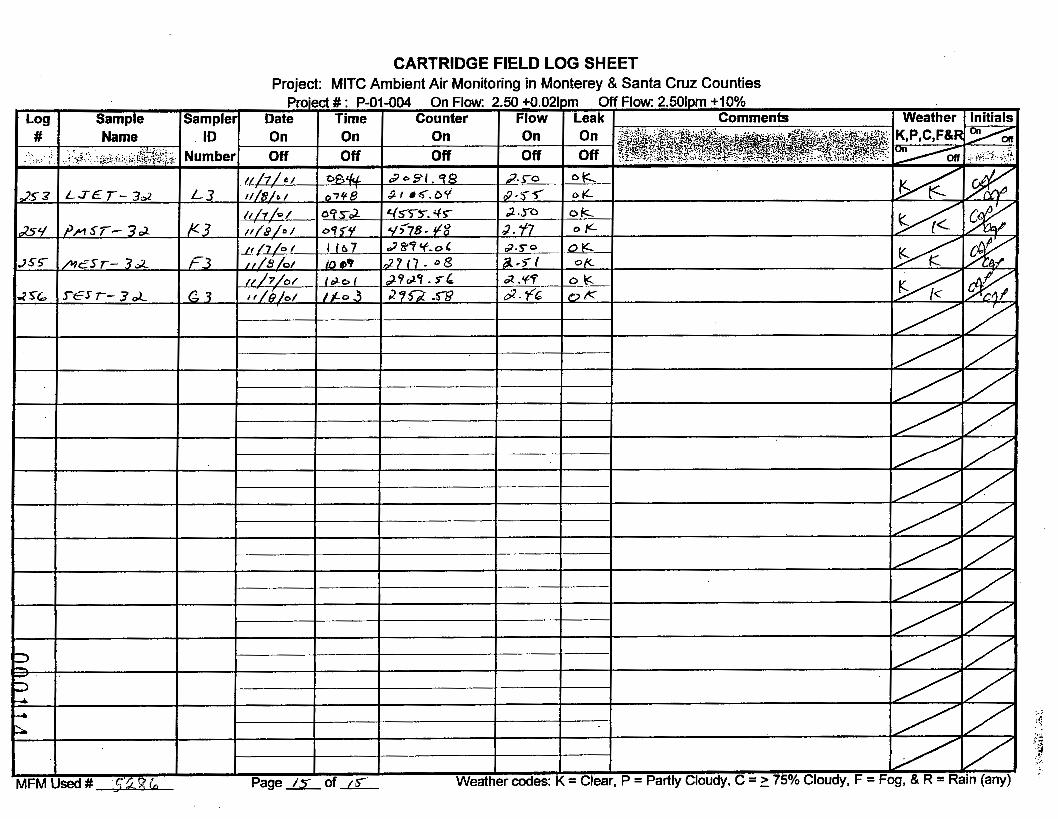
CARTRIDGE FIELD LOG SHEET Proiect: MlTC Ambient Air Monitoring in Monterey & Santa Cruz Counties
Project # : P-01-004 On Flow ; Sampler1 Date I Time I Counter
I I I
Page i y of /d Weatl
I / I /
er codes: K = Clear, P = Partly Cloudy, C = 2 75% Cloudy, F = F
Appendix VI
Pesticide Ambient Sampling Procedures for Adsorbent Tubes
Pesticide Ambient Sampling Procedures For Adsorbent Tubes
Overview: -Collect samples for 24 hour periods; Four sampling periods per week per site; Five sampling sites plus an urban background site (e.g., ARB Bakersfield station).
-Collect a collocated sample from each site on the second or third sampling period per week.
-Submit 1 trip blank per week, per cartridge type.
-With the trip blank there normally will be 31 samples shipped per week, per cartridge type.
-4 field spikes will be run at the ARB site (time collocated exactly with the ambient sample. The field spikes will be distributed over the monitoring period (e.g., 1 per week every other week). A trip spike will also accompany each field spike. These field and trip spikes will be logged in and shipped along with the regular samples. The field and trip spikes will be kept on dry ice during transport to and storage in the field.
-All samples are stored either in an ice-chest on dry ice or in a freezer.
-The field log sheet is filled out as the sampling is conducted, The originals stay in the field binder. Please include a copy with sample shipments. All QA samples must be logged onto the log sheet.
-The chain of custody (COC) forms are filled out prior to sample shipment; the originals are shipped with the samples; make and retain copies if desired (not necessary).
-(Disregard if samples are driven back to Sacramento) The samples are shipped by UPS, next day delivery, to 13'h and T. This is normally done each Monday. The original chain of custody sheets must accompany the samples. The samples are shipped on 5 pounds of dry ice. Review the COCs and log sheet to insure that all documentation is correct and that the appropriate QA samples have been included.
Sampling Procedure: Materials that will be needed on the roof to conduct the sampling include:
-Clip board with log sheets -pencils/pens -sample labels -sample cartridges -end caps -plastic test tubes -0 to 100 ccpm mass flow meter (MFM) with battery -0 to 5 Lpm mass flow meter (MFM) with battery
Figure out your route for sampling the six locations and try to keep this the same throughout the study. In general, try to make each sampling period 24 hours; e.g., if start time is 1l:lO then end time should be 11:lO. (round off to the nearest 5 minutes.) The sample period may not always be exactly 24 hours; but that is the target time frame.
Preparation and Set-up On the way to the first site, plug the MFMs into the batteries. It takes the MFMs about 10 minutes to warm up before they can be used. Leave the MFMs plugged in until the last sample for the day is taken; then unplug for the night to minimize drop in battery charge. Recharge the batteries once per week to be on the safe side.
Upon arrival at the site, check in if needed. Fill out the sample labels for that site. I suggest a backpack and/or fannypacks to carry the stuff to the roof.
Securely attach one adsorbent sample cartridge to the sampling tree. MAKE SURE THE ARROW ON THE CARTRIDGE IS POINTING TOWARDS THE SAMPLE LINE.
Set the rotameter roughly to the appropriate flow rate. Perform the leak check on each sample line by placing a plastic tube cap over the inlet of the cartridge (with the pump on). The rotameter ball should fall to zero. The leak check should be performed before setting the flows with the MFMs.
Using the MFMs set the flow rates exactly to 2.5 Lpm, 90 ccpm and 75 ccpm for the different cartridges.
Make sure that the rain/sun cover is pulled down over the sample tube.
Fill out the log sheet, including: log #, start date, time, start counter reading, leak check OK, any comments and the weather conditions.
Sample collection and Shipment Measure (do not re-set) the flow rates at the end of the sampling period with the MFMs; leak check the sample lines; record the end data on the log sheet.
Remove the sample cartridge and cap the ends. Attach the sample label like a flag on the secondary end of the tube. Make sure that the label does not cover the glass wool separating the primary and secondary beds in the cartridge.
Place the cartridge in the plastic test tube shipping container.
Place all the samples for each day (6) in a zip-lock bag and place on drv ice in a cooler or in a freezer. While driving the route the collected samples need to be kept on dry ice.
Collect the collocated (duplicate) samples from each site on the second or third sampling period per week. These should be started and stopped at the same times as the regular samples.
Collect a trip blank (TB) for each method, once per week, while at one of the field sites. It doesn’t matter which site (or which day) but note it in the comment section of the log
sheet. The TB is collected by breaking the ends off of a tube, capping and labeling as usual and storing along with the rest of the samples. Log the TB into the log sheet.

APPENDIX VI1
Use Information and Air Monitoring Recommendations for Field Fumigations with the Pesticide Active Ingredients 1,3-Dichloropropene, Chloropicrin, Metam Sodium and
Methyl Bromide
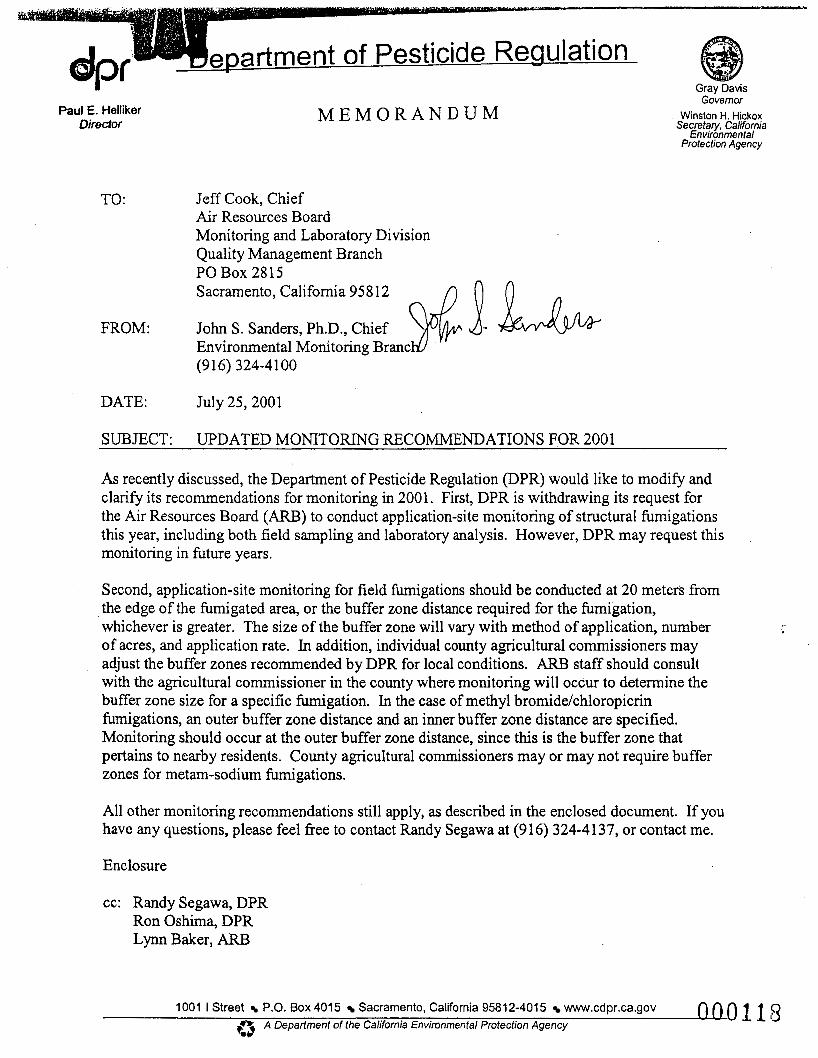
Gray Davis
Paul E. Helliker Diredor M E M O R A N D U M
Governor
Secretary, Cahfornra Winston H. Hickox
Protection Agency Envrronmental
TO: Jeff Cook, Chief Air Resources Board Monitoring and Laboratory Division Quality Management Branch PO Box 2815 Sacramento, California 95812
FROM: John S. Sanders, Ph.D., Chief Environmental Monitoring Branc (916) 324-4100
DATE: July 25,2001
SUBJECT: UPDATED MONITORING RECOMMENDATIONS FOR 2001
As recently discussed, the Department of Pesticide Regulation (DPR) would like to modify and clarify its reconmendations for monitoring in 2001. First, DPR is withdrawing its request for the Air Resources Board (ARB) to conduct application-site monitoring of structural fumigations this year, including both field sampling and laboratory analysis. However, DPR may request this monitoring in future years.
Second, application-site monitoring for field fiunigations should be conducted at 20 meters from the edge of the fumigated area, or the buffer zone distance required for the fumigation, whichever is greater. The size of the buffer zone will vary with method of application, number of acres, and application rate. In addition, individual county agricultural commissioners may adjust the buffer zones recommended by DPR for local conditions. ARB staff should consult with the agricultural commissioner in the county where monitoring will occur to determine the buffer zone size for a specific fiunigation. In the case of methyl bromide/chloropicrin higat ions, an outer buffer zone distance and an inner buffer zone distance are specified. Monitoring should occur at the outer buffer zone distance, since this is the buffer zone that pertains to nearby residents. County agricultural commissioners may or may not require buffer zones for metam-sodium fumigations.
All other monitoring recommendations still apply, as described in the enclosed document. If you have any questions, please feel free to contact Randy Segawa at (916) 324-4137, or contact me.
Enclosure
cc: Randy Segawa, DPR Ron Oshima, DPR Lynn Baker, ARB
1001 I Street P.O. Box4015 Sacramento, California 95812-4015 www.cdpr.ca.gov W.01.18 w *m A Depadment of the California Environmental Protecfion Agency
Staff Report
Use Information and Air Monitoring Recommendations for Field Fumigations with the Pesticide Active Ingredients 1,3=Dichloropropene,
Chloropicrin, Metam Sodium, and Methyl Bromide
May 2001
BY Johanna Walters
Environmental Research Scientist, and
Pam Wales Associate Information Systems Analyst
California Department of dpf Pesticide Regulation Environmental Monitoring and Pest Management Branch
ENVIRONMENTAL HAZARDS ASSESSMENT PROGRAM
STATE OF CALIFORNIA Environmental Protection Agency
Department of Pesticide Regulation Environmental Monitoring Branch
1001 I Street Sacramento, Californla, 95814
1 0 o o . m
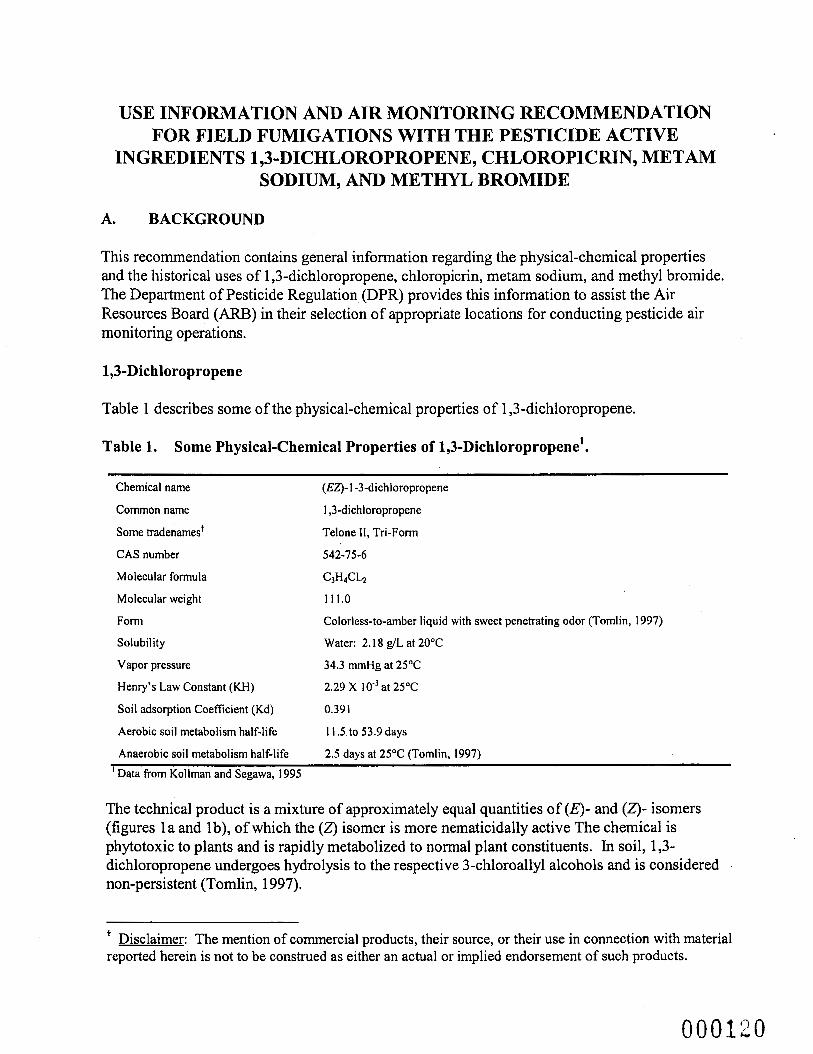
USE INFORMATION AND AIR MONITORING RECOMMENDATION FOR FIELD FUMIGATIONS WITH THE PESTICIDE ACTIVE
SODIUM, AND METHYL BROMIDE INGREDIENTS 1,3-DICHLOROPROPENEY CHLOROPICRIN, METAM
A. BACKGROUND
This recommendation contains general information regarding the physical-chemical properties and the historical uses of 1,3-dichloropropene, chloropicrin, metam sodium, and methyl bromide. The Department of Pesticide Regulation (DPR) provides this information to assist the Air Resources Board (ARB) in their selection of appropriate locations for conducting pesticide air monitoring operations.
1,3-Dichloropropene
Table 1 describes some of the physical-chemical properties of 1,3-dichloropropene.
Table 1. Some Physical-Chemical Properties of 1,3-Dichloropropene1.
Chemical name (EZ)- 1 -3-dichloropropene
Common name 1,3-dichloropropene
Some tradenamest Telone 11, Tri-Form
CAS number
Molecular formula
Molecular weight 1 1 1.0
Form Colorless-to-amber liquid with sweet penetrating odor (Tomlin, 1997)
Solubility Water: 2.18 g/L at 2OoC
Vapor pressure 34.3 mmHg at 25OC
Henry’s Law Constant (KH) 2.29 X IO‘’ at 25°C
Soil adsorption Coefficient (Kd) 0.39 1
Aerobic soil metabolism half-life 11.5 to 53.9 days
Anaerobic soil metabolism half-life 2.5 days at 25OC (Tomlin, 1997)
’ Data from Kollman and Segawa, 1995
The technical product is a mixture of approximately equal quantities of ( E ) - and (2)- isomers (figures l a and lb), of which the (2) isomer is more nematicidally active The chemical is phytotoxic to plants and is rapidly metabolized to normal plant constituents. In soil, 1,3- dichloropropene undergoes hydrolysis to the respective 3-chloroallyl alcohols and is considered non-persistent (Tomlin, 1997).
Disclaimer: The mention of commercial products, their source, or their use in connection with material reported herein is not to be construed as either an actual or implied endorsement of such products.
000120

1,3-Dichloropropene, Chloropicrin, Metam Sodium, and Methyl Bromide Monitoring Recommendation
Figure 1. The Chemical Structures of the 1,3-Dichloropropene Isomers.
May 2001
(a) E-1-3-dichloropropene (b) 2-1 -3-dichloropropene
1,3- Dichloropropene is reported to hydrolyze to 3-chloro-2-propen-l-ol, which may be biologically oxidized to 3-chloropropenoic acid (Montgomery, 1997). Breakdown of this chemical eventually yields carbon dioxide (Connors et al., 1990). Chloroacetaldehyde, formyl chloride, and chloroacetic acid are formed fi-om the ozoneation of 1,3-dichloropropene at 25°C and 730 mmHg (Tuazon et al., 1984).
1,3-Dichloropropene has an LC50 (96 hour) of 3.9 mg/L for rainbow trout and 7.1 mg/L bluegill sunfish and an oral and contact LD50 (90 hour) of 6.6 pg/bee (Tomlin, 1994).
Chloropicrin
Table 2 describes some of the physical-chemical properties of chloropicrin.
Table 2. Some Physical-Chemical Properties of Chloropicrin'.
Chemical name trichloronitromethane
Common name Chloropicrin
Some tradenames Chlor-0-Pic
CAS number 76-06-2
Molecular formula CCI3N02
Molecular weight 164.4
Form Colorless liquid with a lachrymatory action (Tomlin, 1997).
Solubility Water: 2.00 g/L at 25°C
Vapor pressure 23.8 mmHg at 25°C
Henry's Law Constant (KH) 2 .51 '~ 10" at 25°C
Soil adsorption Coefficient (Kd) 0.139- 0.31 1
Aerobic soil metabolism half-life .374- 5.13 days ' Data from Koliman and Segawa, 1995
3 00012f
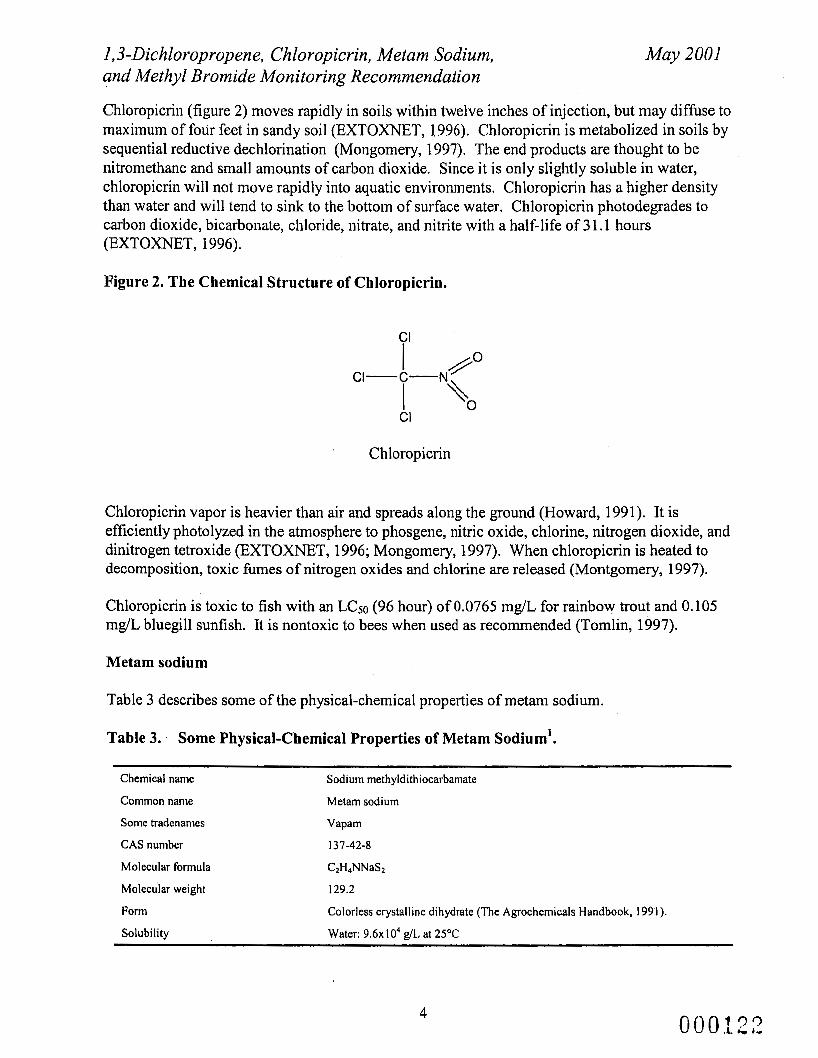
1,3-Dichloropropene, Chloropicrin, Metam Sodium, and Methyl Bromide Monitoring Recommendation
May 2001
Chloropicrin (figure 2) moves rapidly in soils within twelve inches of injection, but may diffuse to maximum of four feet in sandy soil (EXTOXNET, 1996). Chloropicrin is metabolized in soils by sequential reductive dechlorination (Mongomery, 1997). The end products are thought to be nitromethane and small amounts of carbon dioxide. Since it is only slightly soluble in water, chloropicrin will not move rapidly into aquatic environments. Chloropicrin has a higher density than water and will tend to sink to the bottom of surface water. Chloropicrin photodegrades to carbon dioxide, bicarbonate, chloride, nitrate, and nitrite with a half-life of 3 1.1 hours (EXTOXNET, 1996).
Figure 2. The Chemical Structure of Chloropicrin.
CI
CI
' Chloropicrin
Chloropicrin vapor is heavier than air and spreads along the ground (Howard, 1991). It is efficiently photolyzed in the atmosphere to phosgene, nitric oxide, chlorine, nitrogen dioxide, and dinitrogen tetroxide (EXTOXNET, 1996; Mongomery, 1997). When chloropicrin is heated to decomposition, toxic fumes of nitrogen oxides and chlorine are released (Montgomery, 1997).
Chloropicrin is toxic to fish with an LC50 (96 hour) of 0.0765 mg/L for rainbow trout and 0.105 mg/L bluegill sunfish. It is nontoxic to bees when used as recommended (Tomlin, 1997).
Metam sodium
Table 3 describes some of the physical-chemical properties of metam sodium.
Table 3. . Some Physical-Chemical Properties of Metam Sodium'.
Chemical name
Common name
Some tradenames
CAS number
Molecular formula
Molecular weight
Form
Solubility
Sodium methyldithiocarbamate
Metam sodium
Vapam
131-42-8
C2H4NNaS2
129.2
Colorless crystalline dihydrate (The Agrochemici
Water: 9 . 6 ~ 1 0 ~ g/L at 25°C
11s Handbook, 199.1 ).
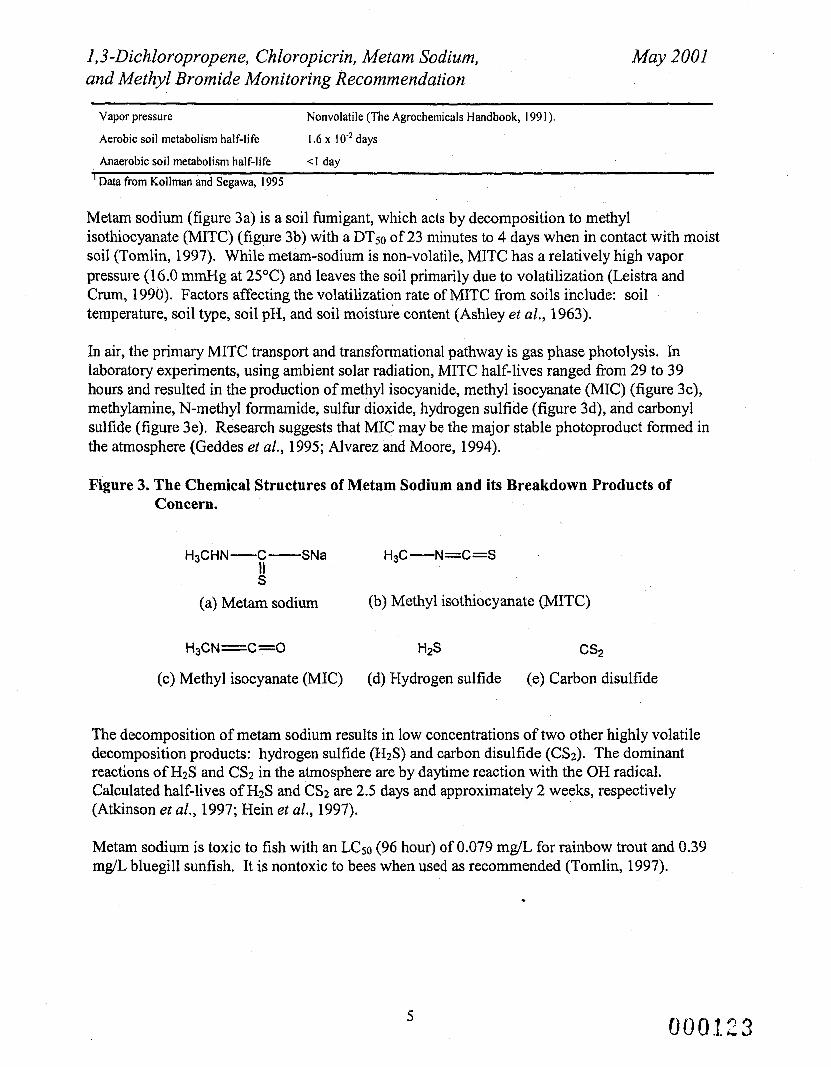
1,3-Dichloropropene, Chloropicrin, Metam Sodium, and Methyl Bromide Monitoring Recommendation
May 2001
Vapor pressure Nonvolatile (The Agrochemicals Handbook, 1991).
Aerobic soil metabolism half-life I .6 x 10.’ days
Anaerobic soil metabolism half-life < I day ’ Data From Kollman and Segawa, 1995
Metam sodium (figure 3a) is a soil fumigant, which acts by decomposition to methyl isothiocyanate (MITC) (figure 3b) with a DTso of 23 minutes to 4 days when in contact with moist soil (Tomlin, 1997). While metam-sodium is non-volatile, MITC has a relatively high vapor pressure (16.0 mmHg at 25°C) and leaves the soil primarily due to volatilization (Leistra and Crum, 1990). Factors affecting the volatilization rate of MITC from soils include: soil temperature, soil type, soil pH, and soil moisture content (Ashley et al., 1963).
In air, the primary MITC transport and transformational pathway is gas phase photolysis. In laboratory experiments, using ambient solar radiation, MITC half-lives ranged from 29 to 39 hours and resulted in the production of methyl isocyanide, methyl isocyanate (MIC) (figure 3c), methylamine, N-methyl formamide, sulfur dioxide, hydrogen sulfide (figure 3d), and carbonyl sulfide (figure 3e). Research suggests that MIC may be the major stable photoproduct formed in the atmosphere (Geddes et al., 1995; Alvarez and Moore, 1994).
Figure 3. The Chemical Structures of Metam Sodium and its Breakdown Products of Concern.
H3CHN-C- SNa H3C-N=C=S I1 S
(a) Metam sodium (b) Methyl isothiocyanate (MITC)
H3CN=C=O H2S CS2
(c) Methyl isocyanate (MIC) (d) Hydrogen sulfide (e) Carbon disulfide
The decomposition of metam sodium results in low concentrations of two other highly volatile decomposition products: hydrogen sulfide (H2S) and carbon disulfide (CS2). The dominant reactions of H2S and CS2 in the atmosphere are by daytime reaction with the OH radical. Calculated half-lives of H2S and CS2 are 2.5 days and approximately 2 weeks, respectively (Atkinson et al., 1997; Hein et al., 1997).
Metam sodium is toxic to fish with an LC50 (96 hour) of 0.079 mg/L for rainbow trout and 0.39 mg/L bluegill sunfish. It is nontoxic to bees when used as recommended (Tomlin, 1997).
.
5

1,3-Dichloropropene, Chloropicrin, Metam Sodium, and Methyl Bromide Monitoring Recommendation
Methyl Bromide
Table 4 describes some of the physical-chemical properties of methyl bromide.
Table 4. Some Physical-Chemical Properties of Methyl Bromide’.
May 2001
Chemical name Bromomethane
Common name
Some tradenames
CAS number
Methyl bromide
Metabrom, Ten-0-Gas 75
74-83-9
Molecular formula CH3Br
Molecular weight 94.9
Form Non-flammable, colorless, odorless gas at room temperature (Tomlin, 1997).
Solubility Water: 13.4 g/L at 25OC
Vapor pressure 1 . 7 ~ 1 O3 mmHg
Henry’s Law Constant (KH) 1 . 5 9 ~ 1 0-2 (calculated value)
Soil adsorption Coefficient (Kd) 3.45- 9.4
Aerobic soil metabolism half-life .15- 17 days
Anaerobic soil metabolism half-life 1.63- 6.0 days
’ Data from Kollman and Segawa, 1995
Methyl bromide (figure 4) readily evaporates at temperatures normally encountered during fumigation, but some of the chemical may become entrapped in soil microspores following application (EXTOXNET, 1996). Transformation of methyl bromide to bromide increases as the amount of organic matter in the soil increases. Methyl bromide hydrolyzes in water forming methane and hydrobromic acid with an estimated hydrolysis half-life of 20 days at a water temperature of 25°C and pH 7 (Montgomery, 1997).
Figure 4. The Chemical Structure of Methyl Bromide.
H3C-Br
methyl bromide
Methyl bromide is moderately toxic to fish with an LC50 (96 hour) of 3.9 mg/L. It is nontoxic to bees when used as recommended (Tomlin, 1997).
6 00Qf24
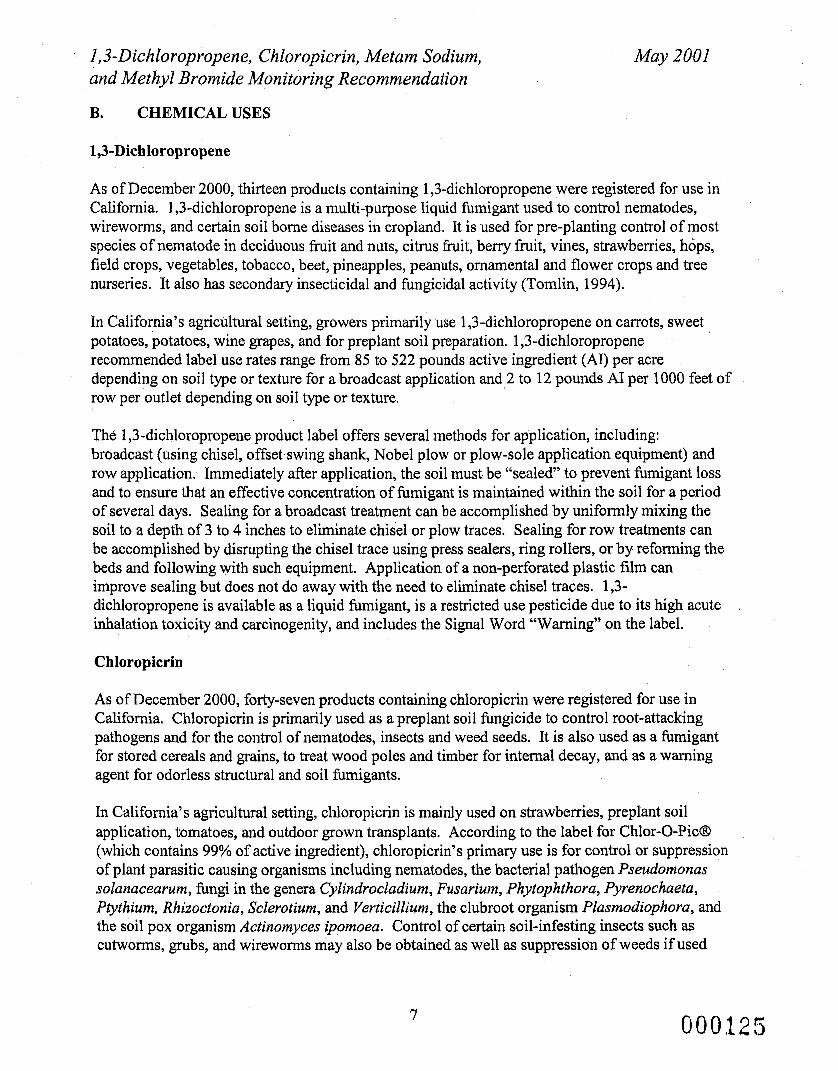
1,3-Dichloropropene, Chloropicrin, Metam Sodium, and Methyl Bromide Monitoring Recommendation
May 2001
B. CHEMICAL USES
1,3-Dichloropropene
As of December 2000, thirteen products containing 1,3-dichloropropene were registered for use in California. 1,3-dichloropropene is a multi-purpose liquid fumigant used to control nematodes, wireworms, and certain soil borne diseases in cropland. It is used for pre-planting control of most species of nematode in deciduous h i t and nuts, citrus h i t , berry fruit, vines, strawberries, hops, field crops, vegetables, tobacco, beet, pineapples, peanuts, ornamental and flower crops and tree nurseries. It also has secondary insecticidal and fungicidal activity (Tomlin, 1994).
In California’s agricultural setting, growers primarily use 1,3-dichloropropene on carrots, sweet potatoes, potatoes, wine grapes, and for preplant soil preparation. 1,3-dichloropropene recommended label use rates range from 85 to 522 pounds active ingredient (AI) per acre depending on soil type or texture for a broadcast application and 2 to 12 pounds AI per 1000 feet of row per outlet depending on soil type or texture.
The 1,3-dichloropropene product label offers several methods for application, including: broadcast (using chisel, offset.swing shank, Nobel plow or plow-sole application equipment) and row application. Immediately after application, the soil must. be “sealed” to prevent fumigant loss and to ensure that an effective concentration of fumigant is maintained within the soil for a period of several days. Sealing for a broadcast treatment can be accomplished by uniformly mixing the soil to a depth of 3 to 4 inches to eliminate chisel or plow traces. Sealing for row treatments can be accomplished by disrupting the chisel trace using press sealers, ring rollers, or by reforming the beds and following with such equipment. Application of a non-perforated plastic film can improve sealing but does not do away with the need to eliminate chisel traces. 1,3- dichloropropene is available as a liquid fumigant, is a restricted use pesticide due to its high acute inhalation toxicity and carcinogenity, and includes the Signal Word “Warning” on the label.
Chloropicrin
As of December 2000, forty-seven products containing chloropicrin were registered for use in California. Chloropicrin is primarily used as a preplant soil fungicide to control root-attacking pathogens and,for the control of nematodes, insects and weed seeds. It is also used as a fumigant for stored cereals and grains, to treat wood poles and timber for internal decay, and as a warning agent for odorless structural and soil hmigants.
In California’s agricultural setting, chloropicrin is mainly used on strawberries, preplant soil application, tomatoes, and outdoor grown transplants. According to the label for Chlor-0-Pic@ (which contains 99% of active ingredient), chloropicrin’s primary use is for control or suppression of plant parasitic causing organisms including nematodes, the bacterial pathogen Pseudomonas solanacearunz, fungi in the genera Cylindrocladium, Fusarium, Phytophthora, Pyrenochaeta, Ptythium, Rhizoctonia, Sclerotium, and Verticillium, the clubroot organism Plasmodiophora, and the soil pox organism Actinomyces ipomoea. Control of certain soil-infesting insects such as cutworms, grubs, and Wireworms may also be obtained as well as suppression of weeds if used
7 OOQS25

1,3-Dichloropropene, Chloropicrin, Metam Sodium, and Methyl Bromide Monitoring Recommendation
May 2001
with a tarpaulin. The label gives soil fumigation rates of 148.5 to 495 pounds AI per acre depending on soil and crop; dosage is reduced by 33% if area is covered by a plastic tarp immediately after application. Fumigations should take place at least 14 days prior to planting whenever soil conditions are suitable. Soil should be tilled to a fine, loose condition with a temperature between 60°F and 85°F for best results. For space fumigations the label suggests rates of 0.35 to 0.69 pounds AI per 1000 cubic feet for empty potato cellars, houses, and storages, and 2 to 4 pounds AI per 1000 square feet for empty grain bins.
The chloropicrin product label offers several methods for application including: overall field treatment using a chisel type applicator, row or bed treatment, and probe type point injection for small areas or volumes. The label recommends sealing the field with a plastic tarp or by the use of drag, cultipacker, roller, or float to firm the soil surface immediately behind chisels. Chloropicrin is a restricted use pesticide due to its acute toxicity and includes the Signal Word “Danger” on the label.
Metam Sodium
As of December 2000, twenty-six products containing metam sodium were registered for use in California. Metam sodium is a soil fumigant that acts by decomposition to methyl isothiocyanate, which is phytotoxic to all green plants (The Agrochemicals Handbook, 1991). It is used as a soil sterilant that is applied prior to planting edible crops and controls soil fungi, nematodes, weed seeds, and soil insects.
Metam sodium is used in California mainly on carrots, processinglcanning tomatoes, potatoes, and cotton. It is recommended for the suppression or control of soil-borne pests that attack ornamental, food, and fiber crops, weeds and germinating weed seeds such as chickweed, dandelions, pigweed, etc., and soil-borne diseases such as Rhizoctonia, Pythiurn, Phytophthora, etc. Nematode suppression is achieved when metam sodium converts to MITC and makes contact with active forms of the nematode, preferable juveniles. The label suggests that pre-irrigation may induce some species eggs to hatch and enhance overall performance. Metam sodium recommended label use rates range from 159 to 3 18 pounds AI per acre depending on crop, target pest, and soil properties. The metam sodium product label recommends sealing the soil at the time of application. Sealing methods include applying a water seal by sprinkler irrigation, tarping, or packing soil with a roller drag, or press wheel.
The metam sodium product label offers several methods for application, including: chemigation (using only those sprinkler systems which deliver large water droplets to prevent excessive loss), soil injection (using shanks, blades, fertilizer wheels, plows, etc.), and by use of rotary tiller or power mulcher. Metam sodium is available as a water-soluble liquid and includes the Signal Word “Danger” on the label.
Methyl Bromide
As of December 2000, fifty-four products containing methyl bromide were registered for use in California. Methyl bromide is a multi purpose fumigant used for insecticidal, acaricidal, and
8 000126
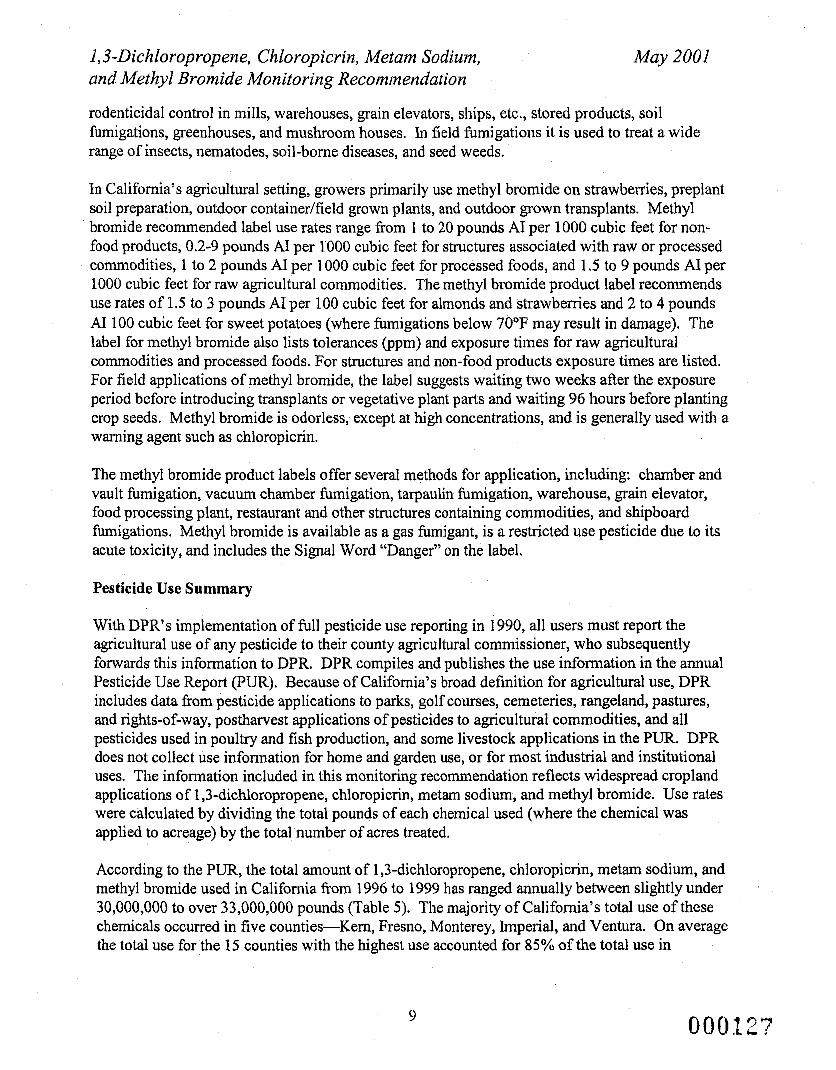
1,3-Dichloropropene, Chloropicrin, Metam Sodium, and Methyl Bromide Monitoring Recommendation
May 2001
rodenticidal control in mills, warehouses, grain elevators, ships, etc., stored products, soil fumigations, greenhouses, and mushroom houses. In field fumigations it is used to treat a wide range of insects, nematodes, soil-borne diseases, and seed weeds.
In California’s agricultural setting, growers primarily use methyl bromide on strawberries, preplant soil preparation, outdoor containedfield grown plants, and outdoor grown transplants. Methyl bromide recommended label use rates range from 1 to 20 pounds AI per 1000 cubic feet for non- food products, 0.2-9 pounds AI per 1000 cubic feet for structures associated with raw or processed commodities, 1 to 2 pounds AI per 1000 cubic feet for processed foods, and 1.5 to 9 pounds AI per 1000 cubic feet for raw agricultural commodities. The methyl bromide product label recommends use rates of 1.5 to 3 pounds AI per 100 cubic feet for almonds and strawberries and 2 to 4 pounds AI 100 cubic feet for sweet potatoes (where fumigations below 70°F may result in damage). The label for methyl bromide also lists tolerances (ppm) and exposure times for raw agricultural commodities and processed foods. For structures and non-food products exposure times are listed. For field applications of methyl bromide, the label suggests waiting two weeks after the exposure period before introducing transplants or vegetative plant parts and waiting 96 hours before planting crop seeds. Methyl bromide is odorless, except at high concentrations, and is generally used with a warning agent such as chloropicrin.
The methyl bromide product labels offer several methods for application, including: chamber and vault fumigation, vacuum chamber fumigation, tarpaulin fumigation, warehouse, grain elevator, food processing plant, restaurant and other structures containing commodities, and shipboard fumigations. Methyl bromide is available as a gas fumigant, is a restricted use pesticide due to its acute toxicity, and includes the Signal Word “Danger” on the label.
Pesticide Use Summary
With DPR’s implementation of full pesticide use reporting in 1990, all users must report the agricultural use of any pesticide to their county agricultural commissioner, who subsequently forwards this information to DPR. DPR compiles and publishes the use information in the annual
. Pesticide Use Report (PUR). Because of California’s broad definition for agricultural use, DPR includes data from pesticide applications to parks, golf courses, cemeteries, rangeland, pastures, and rights-of-way, postharvest applications of pesticides to agricultural commodities, and all pesticides used in poultry and fish production, and some livestock applications in the PUR. DPR does not collect use infomation for home and garden use, or for most industrial and institutional uses. The information included in this monitoring recommendation reflects widespread cropland applications of 1,3-dichloropropene, chloropicrin, metam sodium, and methyl bromide. Use rates were calculated by dividing the total pounds of each chemical used (where the chemical was applied to acreage) by the total number of acres treated,
According to the PUR, the total amount of 1,3-dichloropropene, chloropicrin, metam sodium, and methyl bromide used in California from 1996 to 1999 has ranged annually between slightly under 30,000,000 to over 33,000,000 pounds (Table 5). The majority of California’s total use of these chemicals occurred in five counties-Kern, Fresno, Monterey, Imperial, and Ventura. On average the total use for the 15 counties with the highest use accounted for 85% of the total use in
9
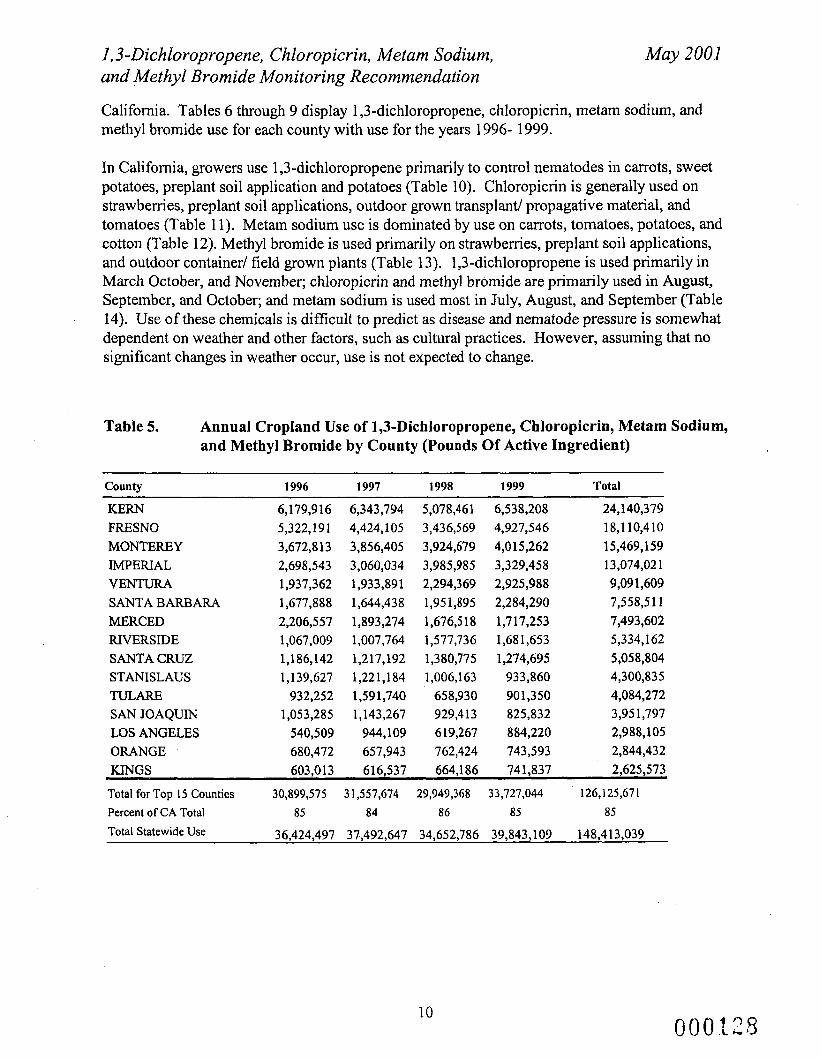
I,3-Dichloropropene, Chloropicrin, Metam Sodium, and Methyl Bromide Monitoring Recommendation
May 2001
California. Tables 6 through 9 display 1,3-dichloropropene, chloropicrin, metam sodium, and methyl bromide use for each county with use for the years 1996- 1999.
In California, growers use 1,3-dichloropropene primarily to control nematodes in carrots, sweet potatoes, preplant soil application and potatoes (Table 10). Chloropicrin is generally used on strawberries, preplant soil applications, outdoor grown transplant/ propagative material, and tomatoes (Table 11). Metam sodium use is dominated by use on carrots, tomatoes, potatoes, and cotton (Table 12). Methyl bromide is used primarily on strawberries, preplant soil applications, and outdoor container/ field grown plants (Table 13). 1,3-dichloropropene is used primarily in March October, and November; chloropicrin and methyl bromide are primarily used in August, September, and October; and metam sodium is used most in July, August, and September (Table 14). Use of these chemicals is difficult to predict as disease and nematode pressure is somewhat dependent on weather and other factors, such as cultural practices. However, assuming that no significant changes in weather occur, use is not expected to change.
Table 5. Annual Cropland Use of 1,3-Dichloropropene, Chloropicrin, Metam Sodium, and Methyl Bromide by County (Pounds Of Active Ingredient)
County 1996 1997 1998 1999 Total
KERN 6,179,916 6,343,794 5,078,461 6,538,208 24,140,379 FRESNO 5,322,191 4,424,105 3,436,569 4,927,546 18,110,410 MONTEREY 3,672,813 3,856,405 3,924,679 4,015,262 15,469,159 IMPERIAL 2,698,543 3,060,034 3,985,985 3,329,458 13,074,02 1 VENTURA 1,937,362 1,933,891 2,294,369 2,925,988 9,091,609 SANTA BARBARA 1,677,888 1,644,438 1,95 1,895 2,284,290 7,558,511 MERCED 2,206,557 1,893,274 1,676,518 1,717,253 7,493,602 RIVERSIDE 1,067,009 1,007,764 1,577,736 1,681,653 5,334,162 SANTA CRUZ 1,186,142 1,217,192 1,380,775 1,274,695 5,058,804 STANISLAUS 1,139,627 1,221,184 1,006,163 933,860 4,300,835 TULARE 932,252 1,591,740 658,930 901,350 4,084,272 SAN JOAQUIN 1,053,285 1,143,267 929,413 825,832 3,951,797 LOS ANGELES 540,509 944,109 619,267 884,220 2,988,105 ORANGE 680,472 657,943 762,424 743,593 2,844,432 KINGS 603,013 616,537 664,186 741,837 2,625,573
Total for Top 15 Counties 30,899,575 3 1,557,674 29,949,368 33,727,044 126,125,671 Percent of CA Total 85 84 86 85 85
Total Statewide Use 36,424,497 37.,492,647 34,652,786 39,843,109 148,413,039
10

1,3-Dichloropropene, Chloropicrin, Metam Sodium, and Methyl Bromide Monitoring Recommendation
May 2001
Table 6. 1J-Dichloropropene Use by County for the Years 1996-1999
COUNTY ALAMEDA AMADOR BUTTE COLUSA DEL NORTE EL DORADO FRESNO GLENN HUMBOLDT IMPERIAL KERN KINGS M S ANGELES MADERA MAFUN MENDOClNO MERCED MODOC MONO MONTEREY ORANGE PLACER RIVERSIDE SACRAMENTO SAN BENITO SAN DIEGO' SAN FRANCISCO SAN JOAQUIN SAN LUIS OBISPO SAN MATE0 SANTA BARBARA SANTA CLAM SANTA CRUZ SHASTA SISKIYOU SOLAN0 SONOMA STANlSLAUS SUTTER TEHAMA TIJLARE VENTURA YOLO YUBA
JAN FED MARCH APRlL MAY JUNE JULY AUG SEPT OCT NOV DEC 1,498
5,256 4,580 3,766 5,111 31,828 9,037 21,953 5,642
4,381 6,967 86,982
5 43,007 75,950 1 13,535 27,590 13,833 21,374 8,774 31,820 98,265 174,382 371,827 42,808
2,522 248 11,279
149,875 36,382 25,195 11,986 38,980 335,458 350,040 97,612 75,791 103,715 302,427 126,199 36,105 24,765 126,468 723,419 330,359 28,453 268,253 433,043 220,902
13,692 27,816 9,719 52,702 1 1,476 19,113 18,247 5,343 33 300 214 6 19
24,637 41,270 208,790 8,736 9,125 70,258 14,694 12
2 17,310 14,968 210,787 120,867 61,943 117 7,254 22,753 238,342 133,959
45,362 558
89,811 68,411 76,629 145,516 247,023 133,280 67,073 31,337 53,952 132,997 242,415 77,919 1 396 400 278
5,783 13,821 5,913 23,211 3,066 6 3 2,046 14,874 3,344 706 15,457 5,071 22,927
6,339 7,235 3,460 3,043 4.987 8,972 2,428 161 2,623 18,014 37,671 5,277
6 1,820 3 403 2 1,017 4 1 613 2 9
368 20,325 20,373 71,359 42,899 73,571 11,778 11 1 7,542 80,485 127,232 10,447 3,076 39,153 806 721 3,038 502 1,480 19,453 2,705
1,951 19,489 5,859 717 158 22,733 28,162 10,090 39,079 21,326 4 19,046 2 580 225 6,106
5,323 518 233 2,537 4,341 12,738 963 4,041 27,016 101,754 31,710 3,449 6,360 5,530 3,638 4,606 1,251
5,970 590 115,464 6,037 3,129 560 5,692 7,023
967 30 512 474 32 8,629 9,345 5 6,970
18,404 6,730 21,670 42,115 38,327 4,988 26,925 40,598 153,663 261,430 47,774 10,588 6,358 2,578 3,916 5,073 49,900 58,195 2,456
1,497 4,265 27,143 3,936 7,385 11,863 54,682 157,153 146,275 36,403
1,591 11,507 43,212 30,858 30,752 3,476 1,397 22,074 1,663 1,074 11,094 5 91 52 1,146 1,490 25,687 10
2,418 17,676 10,819
11 000129
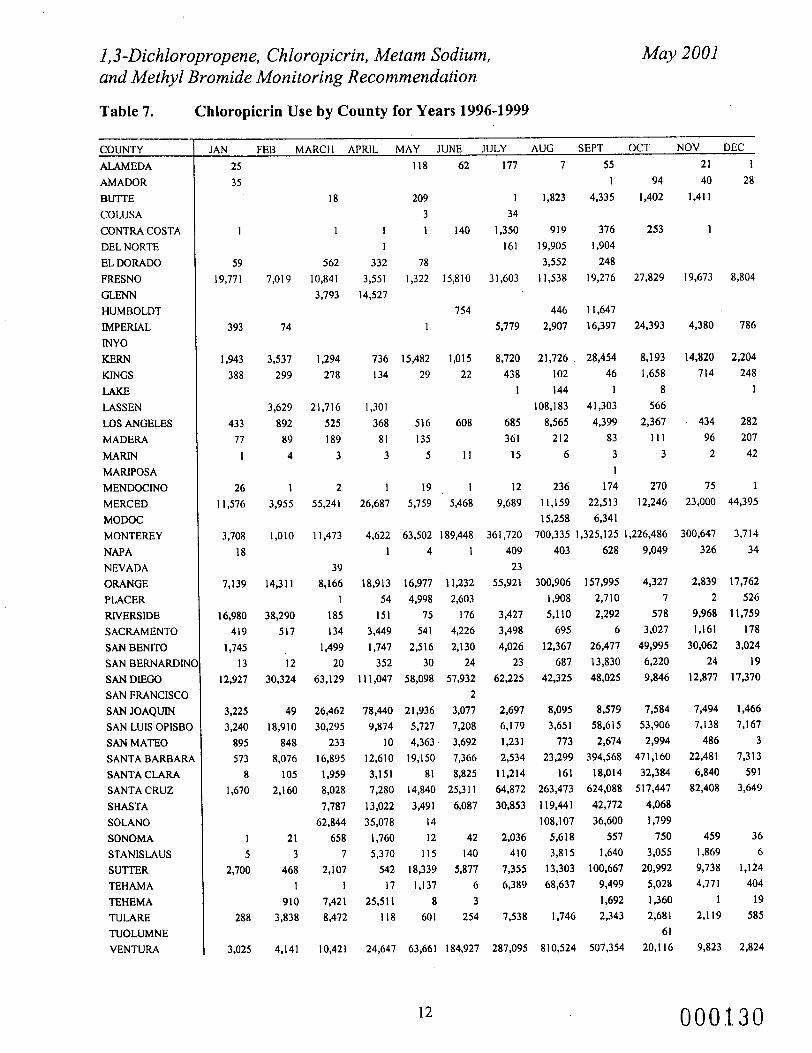
I,3-Dichloropropene, Chloropicrin, Metam Sodium, and Methyl Bromide Monitoring Recommendation
May 2001
Table 7.
COUNTY ALAMEDA AMADOR BUTTE COLUSA CONTRA COSTA DEL NORTE EL DORAW FRESNO GLENN HUMBOLDT IMPERIAL lNYO KERN KINGS LAKE LASSEN LOS ANGELES MADERA MARIN MARIPOSA MENDOCINO MERCED MODOC MONTEREY NAPA NEVADA ORANGE PLACER RIVERSIDE SACRAMENTO SAN BENITO SAN BERNARDlNl SAN. DIEGO SAN FRANCISCO SAN JOAQUIN SAN LUIS OPISBC SAN MATE0 SANTA BARBARf SANTA CLARA SANTA CRUZ SHASTA SOLAN0 SONOMA STANISLAUS SUTTER TEHAMA TEHEMA TULARE TUOLUMNE VENTURA
Chloropicrin Use by County for Years 1996-1999
JAN FEB MARCH APRIL MAY JUNE JULY AUG SEPT OCT NOV DEC 25 35
1
59 19,77 1
393
1,943 388
433 77
1
26 I 1,576
3,708 18
7,139
16,980 419
1,745 13
12.927
3,225 3,240
895 573
8 1,670
1 5
2,700
288
3,025
18
1
562 7,019 10,841
3,793
74
3,537 1,294 299 278
3,629 21,716 892 525 89 189 4 3
1 2 3,955 55,241
1,010 11,473
39 14.31 1 8,166
1 38,290 185
517 I34 1,499
12 20 30,324 63.129 1
49 26,462 18,9 10 30,295
848 233 8,076 16,895
105 1,959 2,160 8,028
7,787 62,844
21 658 3 7
468 2,107 1 I
910 7,421 3,838 8,472
4,141 10,421
118 62
209 3
1 1 140 1
332 78 3,551 1,322 15,810
14,527 754
1
736 15,482 1,015 134 29 22
1,301 368 516 608 81 135 3 5 1 1
1 '9 1 26,687 5,759 5,468
4,622 63.502 189,448 1 4 1
18,913 16,977 11,232 54 4,998 2,603
151 75 176 3,449 541 4,226 1,747 2,516 2,130
352 30 24 1 1 1,047 58,098 57,932
2 78,440 21,936 3,077 9,874 5,727 7,208
IO 4,363 3,692 12,610 19;150 7,366 3,151 81 8,825 7,280 14,840 25,311
13,022 3,491 6,087 35,078 14
1,760 12 42 5,370 115 140
542 18,339 5,877 17 1,137 6
253 1 1 8 3 118 601 254
24,647 63,661 184,927
12
177 7 55 1 94
1 1,823 4,335 1,402 34
1,350 919 376 253 161 19,905 1,904
3,552 248 31,603 1 1,538 19,276 27,829
446 1 1,647 5,779 2,907 16,397 24,393
8,720 21,726 28,454 8,193 438 102 46 1,658
1 144 1 8
108,183 41,303 566 685 8,565 4,399 2.367 361 212 83 1 1 1
15 6 3 3 1
12 236 174 270 9,689 11,159 22,513 12,246
15,258 6,34 1 361,720 700.335 1,325,125 1,226,486
409 403 628 9.049 23
55,921 300.906 157,995 4,327 1,908 2,7 I O 7
3,427 5,110 2,292 578 3,498 695 6 3,027 4,026 12,367 26,477 49,995
23 687 13,830 6,220 62.225 42,325 48,025 9,846
2,697 8,095 8,579 7,584 6,179 3,651 58,615 53,906 1.231 773 2,674 2,994 2,534 23,299 394,568 471,160
11,214 161 18,014 32,384 64,872 263,473 624,088 517,447 30.853 119,441 42,772 4,068
108,107 36,600 1,799 2,036 5,618 557 750
410 3,815 1,640 3,055 7,355 13,303 100,667 20,992 6,389 68,637 9,499 5,028
1,692 1,360 7,538 1,746 2,343 2,681
61 287,095 810,524 507,354 20,116
21 1 40 28
1,411
1
19,673 8,804
4,380 786
14,820 2,204 714 248
1
. 434 282 96 207
2 42
75 1
23,000 44,395
300,647 3,714 326 34
2,839 17,762 2 526
9,968 11,759 1,161 178
30,062 3,024 24 19
12,877 17,370
1,494 1,466 7,138 7,167
486 3 22,481 7,313 6,840 591
82,408 3,649
459 36 1,869 6 9,738 1 ,124 4,771 404
1 19 2,119 585
9,823 2,824
000.130
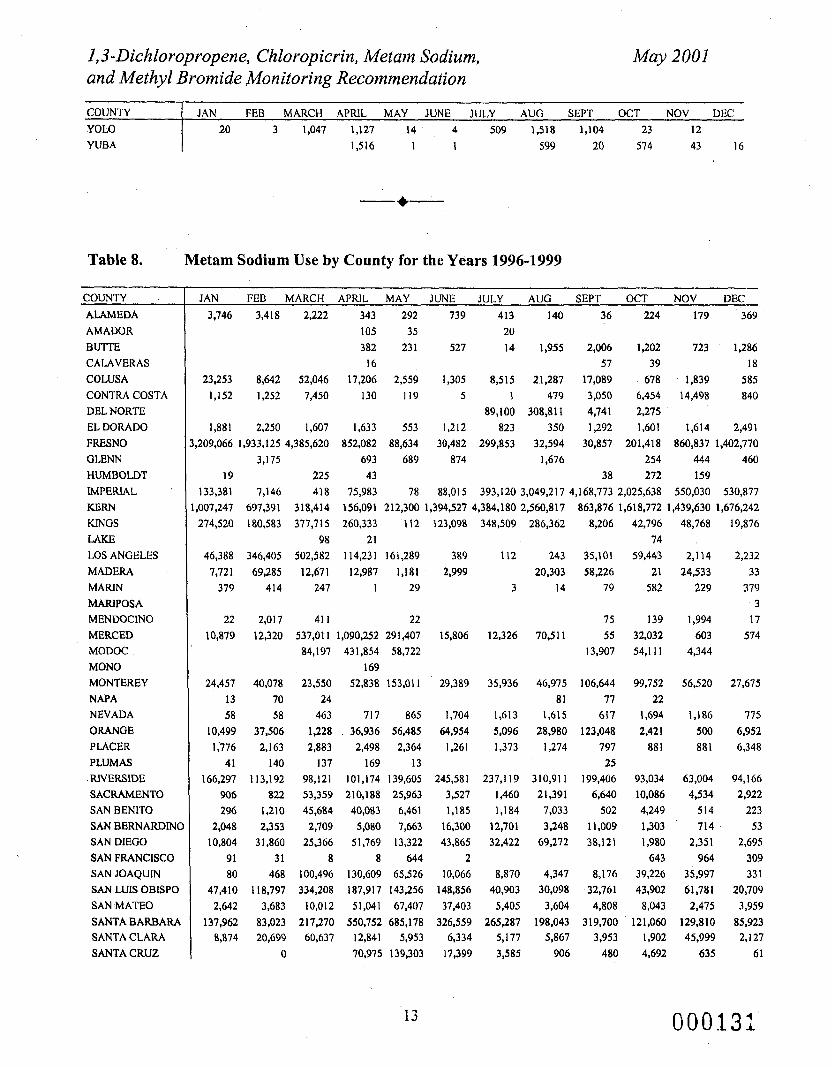
I,3-Dichloropropene, Chloropicrin, Metam Sodium, and Methyl Bromide Monitoring Recommendation
May 2001
COUNTY JAN FEB MARCH APRlL MAY JUNE JULY AUG SEPT OCT NOV DEC ~ ~ ~ ~
Y O M 20 3 1,047 1,127 14 4 509 1,518 1,104 23 12 YUBA 1,516 1 1 599 20 574 43 16
Table 8. Metam Sodium Use by County for the Years 1996-1999
COUNTY .
ALAMEDA AMADOR BUTTE CALAVERAS COLUSA CONTRA COSTA DEL NORTE EL DORADO FRESNO GLENN HUMBOLDT IMPERlAL KERN KINGS LAKE LOS ANGELES MADERA MARlN MARIPOSA MENWCINO MERCED MODOC MONO MONTEREY NAPA NEVADA ORANGE PLACER PLUMAS RlVERSIDE SACRAMENTO SAN BENlTO SAN BERNARDINC SAN DlEGO SAN FRANCISCO SAN JOAQUIN S A N LUIS OBlSPO SAN MATE0 SANTA BARBARA SANTA CLARA SANTA CRUZ
JAN FEB MARCH APRIL MAY JUNE JULY AUG SEPT OCT NOV DEC 3,746 3,418 2,222 343 292 739 413 140 36 224 179 369
105 35 20 382 231 527 14 1,955 2,006 1,202 723 1.286
16 57 39 18
23,253 8,642 52,046 17,206 2,559 1,305 8,515 21,287 17,089 678 1,839 585 1,152 1,252 7,450 130 119 5 1 479 3,050 6,454 14,498 840
89,100 308,811 4,741 2,275 1,881 2,250 1,607 1,633 553 1,212 823 350 1,292 1,601 1,614 2,491
,209,066 1,933,125 4,385,620 852,082 88,634 30,482 299,853 32,594 30,857 201,418 860,837 1,402,770 3,175 693 689 874 1,676 254 444 460
19 225 43 38 272 159 133,381 7,146 418 75,983 78 88,015 393,120 3,049,217 4,168,773 2,025,638 550,030 530,877 ,007,247 697,391 318,414 156,091 212,300 1,394,527 4,384,180 2,560,817 863,876 1,618,772 1,439,630 1,676,242 274,520 180,583 377,715 260,333 112 123,098 348,509 286,362 8,206 42,796 48,768 19,876
98 21 74 46,388 346,405 502,582 114,231 161,289 389 112 243 35,101 59,443 2,114 2,232
7,721 69,285 12,671 12,987 1,181 2,999 20,303 58,226 21 24,533 33 379 414 247 I 29 3 14 79 582 229 379
3 22 2,017 41 1 22 75 139 1,994 17
10,879 12,320 537,011 1,090,252 291,407 15.806 12,326 70,511 55 32,032 603 574 84,197 431,854 58,722 13,907 54,111 4,344
169 24,457 40,078 23,550 52,838 153,011 29,389 35,936 46,975 106,644 99,752 56,520 27,675
13 70 24 81 77 22 58 58 463 717 865 1,704 1,613 1,615 617 1,694 1,186 775
10,499 37,506 1,228 36,936 56,485 64,954 5,096 28,980 123,048 2,421 500 6,952 1,776 2,163 2,883 2,498 2,364 1,261 1,373 1,274 797 88 1 881 6,348
41 140 137 169 13 25 166,297 113,192 98,121 101,174 139,605 245,581 237,119 310,911 199,406 93,034 63,004 94,166
906 822 53,359 210,188 25,963 3,527 1,460 21,391 6,640 10,086 4,534 2,922 296 1,210 45,684 40,083 6,461 1,185 1,184 7,033 502 4,249 514 223
2,048 2,353 2,709 5,080 7,663 16,300 12,701 3,248 11,009 1,303 714 53 10,804 31,860 25,366 51,769 13,322 43,865 32,422 69,272 38,121 1,980 2,351 2,695
91 31 8 8 644 2 643 964 309 80 468 100,496 130,609 65,526 10,066 8,870 4,347 8,176 39,226 35,997 33 1
47,410 118,797 334,208 187,917 143,256 148,856 40,903 30,098 32,761 43,902 61,781 20,709 2,642 3,683 10,012 51,041 67,407 37,403 5,405 3,604 4,808 8,043 2,475 3,959
137,962 83,023 217,270 550.752 685,178 326,559 265,287 198,043 319,700 121,060 129,810 85,923 8,874 20,699 60,637 12,841 5,953 6,334 5,177 5,867 3,953 1,902 45,999 2,127
0 70,915 139,303 17,399 3,585 906 480 4,692 635 61
13 000131'
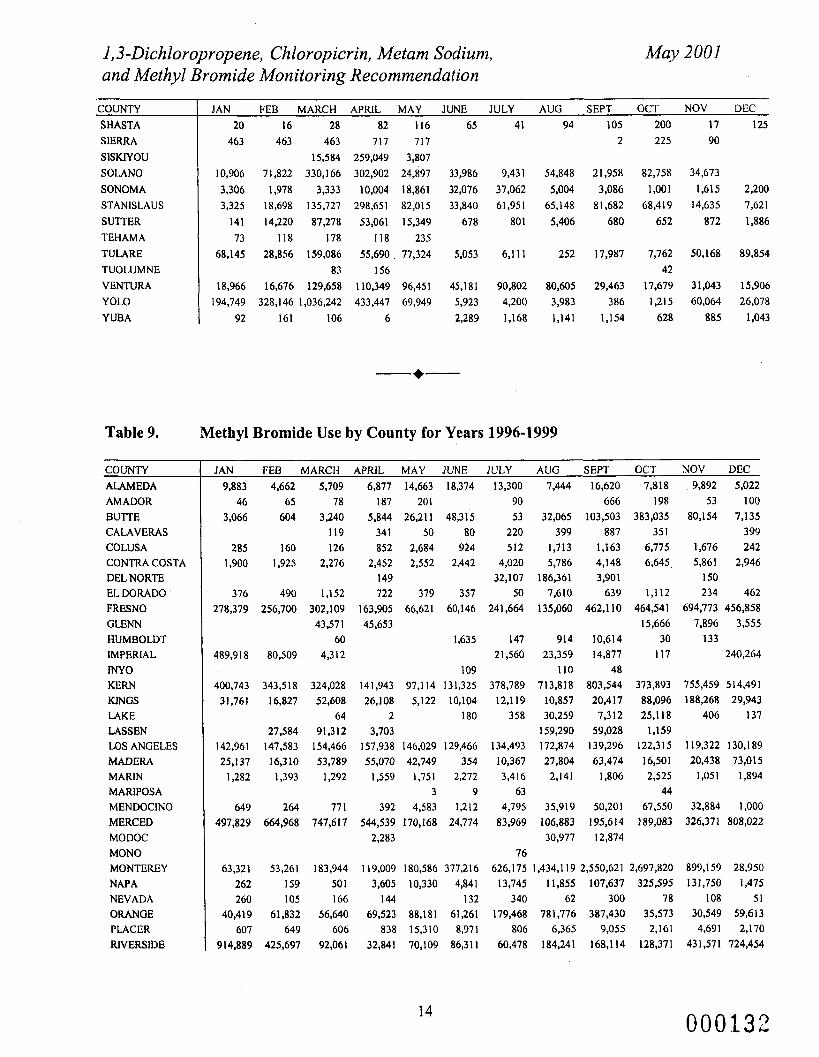
1,3-Dichloropropene, Chloropicrin, Metam Sodium, and Methyl Bromide Monitoring Recommendation
May 2001
COUNTY SHASTA SIERRA s 1 s K R 0 u SOLAN0 SONOMA STANISLAUS SUlTER TEHAMA TULARE TUOLUMNE VENTURA YOLO YUBA
JAN FEB MARCH APRIL MAY JUNE JULY AUG SEPT OCT NOV DEC 20 16 28 82 116 65 41 94 105 200 17 125 463 463 463 717 717 2 225 90
15,584 259,049 3,807 10,906 71,822 330,166 302,902 24,897 33,986 9,431 54,848 21,958 82,758 34,673 3,306 1,978 3,333 10,004 18,861 32,076 37,062 5,004 3,086 1,001 1,615 2,200 3,325 18,698 135,727 298,651 82,015 33,840 61,951 65,148 81,682 68,419 14,635 7,621 141 14,220 87,278 53,061 15,349 678 801 5.406 680 652 872 1,886 73 1 I8 178 118 235
68,145 28,856 159,086 55,690 77,324 5,053 6,111 252 17,987 7,762 50,168 89,854 83 156 42
1 18,966 16,676 129,658 110,349 96,451 45,181 90,802 80,605 29,463 17,679 31,043 15,906 194,749 328,146 1,036,242 433,447 69,949 5,923 4,200 3,983 386 1,215 60,064 26,078
1 92 161 106 6 2,289 1,168 1,141 1,154 628 885 1,043
- +-
Table 9. Methyl Bromide Use by County for Years 1996-1999
COUNTY ALAMEDA A M A W R BUTTE CALAVERAS COLUSA CONTRA COSTA DEL NORTE EL W R A D O FRESNO GLENN HUMBOLDT IMPERlAL INYO KERN KINGS LAKE LASSEN LOS ANGELES MADERA MARIN MARIPOSA MENDOCINO MERCED MODOC MONO MONTEREY NAPA NEVADA ORANGE PLACER RIVERSIDE
JAN 9,883
46 3,066
285 1,900
376 278,379
489,918
400,743 31,761
142,961
FEB MARCH APRIL MAY JUNE 4.662 5,709 6,877 14,663 18,374
65 78 187 201 604 3,240 5,844 26,211 48,315
119 34 1 50 80 160 126 852 2,684 924
1,925 2,276 2,452 2,552 2,442 149
490 1,152 722 379 357 256,700 302,109 163,905 66,621 60,146
43,571 45,653 60 1,635
80,509 4,312 109
343,518 324,028 141,943 97,114 131,325 16,827 52,608 26,108 5,122 10,104
64 2 180 27,584 91,312 3,703 147,583 154,466 157,938 146,029 129,466
JULY 13,300
90 53 220 512
4,020 32,107
50 241,664
147 2 1,560
378,789 12,119 358
134,493
AUG SEPT 7,444 16,620
666 32,065 103,503
399 887 1,713 1,163 5,786 4,148
186,361 3,901 7,610 639
135,060 462,l IO
914 10,614 23,359 14,877
110 48 713,818 803,544 10,857 20,4 17 30,259 7,3 12 159,290 59,028 172,874 139,296
25,137 16,310 53,789 55,070 42,749 354 10,367 27,804 63,474 1,282 1,393 1,292 1,559 1,751 2,272 3,416 2,141 1,806
3 9 63 649 264 77 1 392 4,583 1,212 4,795 35,919 50,201
497,829 664,968 747,617 544,539 170,168 24,774 83,969 106,883 195,614 2,283 30,977 12,874
76 63,321 53,261 183,944 119,009 180,586 377,216 626,175 1,434,119 2,550,621
OCT NOV DEC 7,818 9,892 5,022 198 53 100
383,035 80,154 7,135 35 1 399
6,775 1,676 242 6,645, 5,861 2,946
1,112 234 462 464,541 694,773 456,858 15,666 7,896 3,555
150
30 133 1 I7 240,264
373,893 755,459 514,491 88,096 188,268 29,943 25,118 406 137 1,159
122.3 15 1 19,322 130,189 16,501 20,438 73,015 2,525 1,051 1,894 44
67,550 32,884 1,000 189,083 326,371 808,022
2,697,820 899,159 28,950 262 159 501 3,605 10,330 4,841 13,745 11,855 107,637 325,595 131,750 1,475 260 I05 166 144 132 340 62 300 78 108 51
40,419 61,832 56,640 69,523 88,181 61,261 179,468 781,776 387,430 35,573 30,549 59,613 607 649 606 838 15,310 8,971 806 6,365 9,055 2,161 4,691 2,170
914,889 425,697 92,061 32,841 70,109 86,311 60,478 184,241 168,114 128,371 431,571 724,454
14 000.132
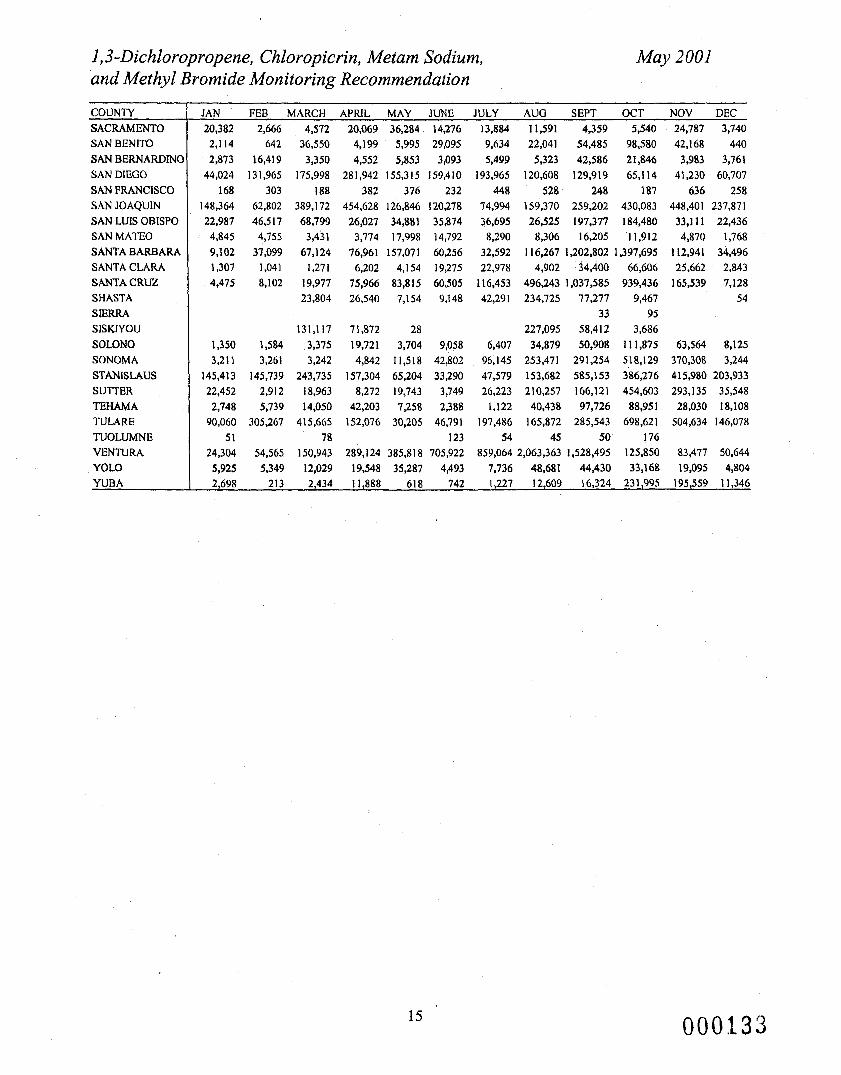
I,3-Dichloropropene, Chloropicrin, Metam Sodium, and Methyl Bromide Monitoring Recommendation
May 2001
COUNTY SACRAMENTO SAN BENlTO SAN BERNARDMC SAN DlEGO SAN FRANClSCO SAN JOAQUIN SAN LUIS OBISPO SAN MATE0 SANTA BARBARA SANTA CLARA SANTA CRUZ SHASTA SIERRA SISKIYOU SOLONO SONOMA STANISLAUS SUTTER TEHAMA TULARE TUOLUMNE VENTURA Y O M YUBA
JAN FEB MARCH APRIL MAY JUNE JULY AUG SEPT OCT NOV DEC 20,382 2,,666 4,572 20,069 36,284 14,276 13,884 11,591 4,359 5,540 24,787 3,740 2,114 2,873
44,024 168
148,364 22,987 4,845 9,102 1,307 4,475
1,350 3,211
145,413 22,452 2,748
90,060 51
24,304 5,925 2,698
642 16,419
13 1,965 303
62,802 46,s 17 4,755
37,099 1,041 8,102
1,584 3,261
145,739 2,912 5,739
305,267
54,565 5,349
213
36,550 3,350
175,998 188
389,172 68,799
3,431 67,124
1,271 19,977 23,804
131,117 3,375 3,242
243,735 18,963 14,050
41 5,665 78
150,943 12,029 2 434 d
4,199 5,995 29,095 4,552 5,853 3,093
281,942 155,3 15 159,4 10 382 376 232
454,628 126,846 120,278 26,027 34,881 35,874 3,774 17,998 14,792
76,961 157,071 60,256 6,202 4,154 19,275
75,966 83,815 60,505 26,540 7,154 9,148
71,872 28 19.721 3,704 9,058 4,842 11,518 42,802
157,304 65,204 33,290 8,272 19,743 3,749
42,203 7,258 2,388 152,076 30,205 46,791
123 289,124 385,818 705,922
19,548 35.287 4,493 11,888 618 742
9,634 22,041 54,485 98,580 5,499 5,323 42,586 21,846
193,965 120,608 129.919 65,114 448 528 248 187
74,994 159,370 259,202 430,083 36,695 26,525 197,377 184,480 8,290 8,306 16,205 11,912
32,592 1 16,267 1,202,802 1,397,695 22,978 4,902 34,400 66,606
116,453 496,243 1,037,585 939,436 42,291 234,725 17,277 9,461
33 95 227,095 58,412 3,686
6,407 34,879 50,908 11 1,875 96,145 253,471 291,254 518,129 47,579 153,682 585,153 386,276 26,223 210,257 166,121 454,603
1,122 40,438 97,726 88,951 197,486 165,872 285,543 698,621
54 45 50 176 859,064 2,063,363 1,528,495 125,850
7,736 48,681 44,430 33.168 1,227 12,609 16,324 231,995
42,168 440 3,983 3,761
41,230 60,707 536 258
448,401 237,871 33.1 11 22,436 4,870 1,768
112,941 34,496 25,662 2,843
165,539 7,128 54
63,564 8,125 370,308 3,244 415.980 203,933 293,135 35,548 28,030 18,108
504,634 146,018
83,477 50,644 19,095 4,804
195,559 1 1,346
15 000S.33
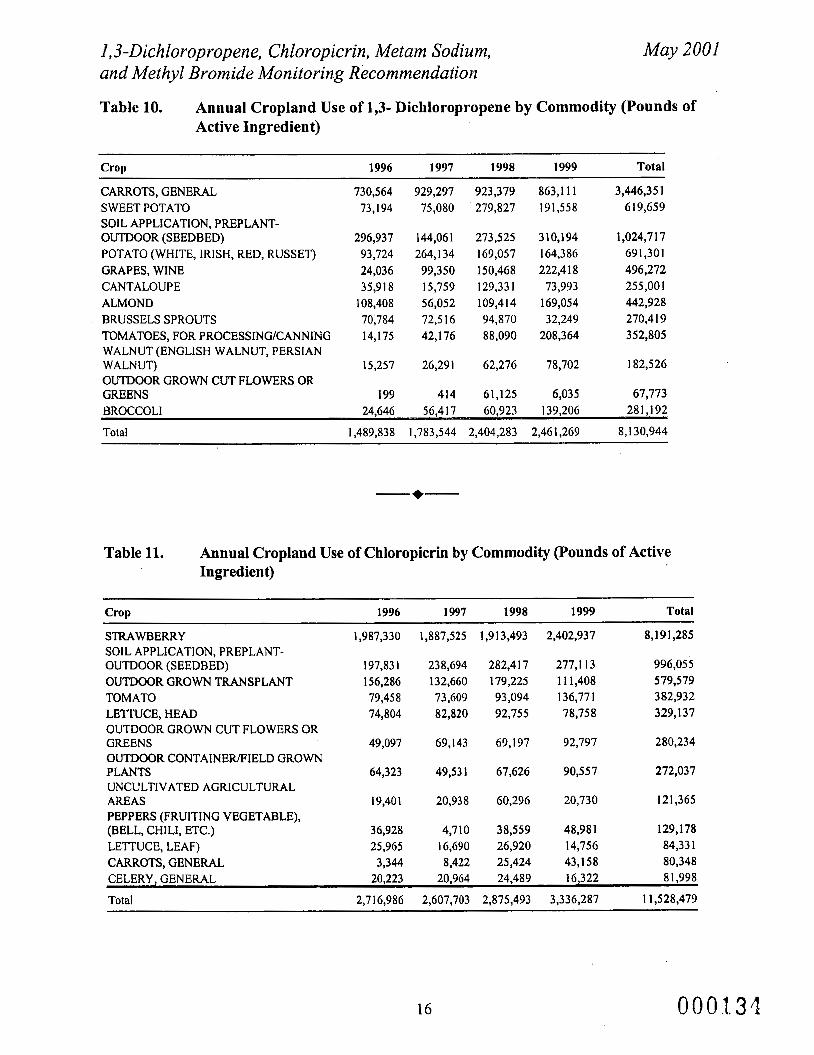
I,3-Dichloropropene, Chloropicrin, Metam Sodium, and Methyl Bromide Monitoring Recommendation
May 2001
Table 10. Annual Cropland Use of 1,3- Dichloropropene by Commodity (Pounds of Active Ingredient)
Crop 1996 1997 1998 1999 Total
CARROTS, GENERAL SWEET POTATO
OUTDOOR (SEEDBED) POTATO (WHITE, IRISH, RED, RUSSET) GRAPES, WINE CANTALOUPE ALMOND BRUSSELS SPROUTS TOMATOES, FOR PROCESSMGKANNMG WALNUT (ENGLISH WALNUT, PERSIAN WALNUT) OUTDOOR GROWN CUT FLOWERS OR GREENS
SOIL APPLICATION, PREPLANT-
730,564 73,194
296,937 93,724 24,036 35,918
108,408 70;784 14,175
15,257
199
929,297 75,080
1 4 , 0 6 1 264, I34 99,350 15,759 56,052 723 16 42,176
26,29 1
414
923,379 279,827
273,525 169,057 150,468 129,33 1 109,4 14 94,870 88,090
62,276
61,125
863,ll I 191,558
310,194 164,386 222,418
73,993 169,054 32,249
208,364
78,702
6,035
3,446,35 1 6 19,659
1,024,7 17 691,301 496,272 255,001 442,928 270,4 19 352,805
182,526
67,773 BROCCOLI 24,646 56,417 60,923 139,206 281,192
Total 1,489,838 1,783,544 2,404,283 2,461,269 8,130,944
Table 11. Annual Cropland Use of Chloropicrin by Commodity (Pounds of Active Ingredient)
Crop 1996 1997 1998 1999 Total
STRAWBERRY 1,987,330 1,887,525 1,913,493 2,402,937 8,191,285
OUTDOOR (SEEDBED) 19733 1 238,694 282,417 277,l 13 996,055 OUTDOOR GROWN TRANSPLANT 156,286 132,660 179,225 11 1,408 579,579 TOMATO 79,458 73,609 93,094 136,77 1 382,932 LETTUCE, HEAD 74,804 82,820 92,755 78,758 329,137 OUTDOOR GROWN CUT FLOWERS OR GREENS 49,097 69,143 69,197 92,797 280,234 OUTDOOR CONTAINER/FIELD GROWN PLANTS 64,323 49.53 1 67,626 90,557 272,037 UNCULTIVATED AGRICULTURAL AREAS 19,40 1 20,938 60,296 20,730 121,365 PEPPERS (FRUITING VEGETABLE), (BELL, CHlLI, ETC.) 36,928 4,710 38,559 48,98 1 129,178 LETTUCE, LEAF) 25,965 16,690 26,920 14,756 84,33 1 CARROTS, GENER4L 3,344 8,422 25,424 43,158 80,348 CELERY, GENERAL 20,223 20,964 24,489 16,322 8 1,998
Total 2,716,986 2,607,703 2,875,493 3,336,287 11,528,479
SOIL APPLICATION, PREPLANT-
16 0001.34
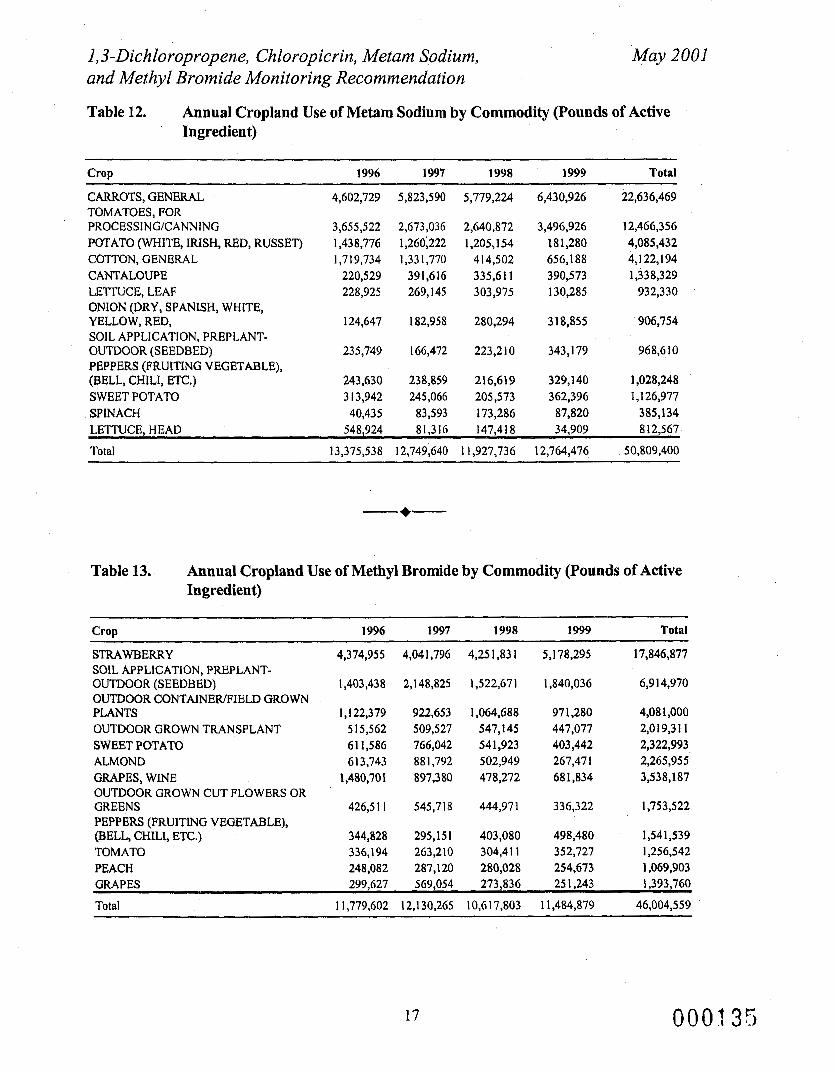
I , 3-DichloropropeneJ Chloropicrin, Metam Sodium, and Methyl Bromide Monitoring Recommendation
May 2001
Table 12. Annual Cropland Use of Metam Sodium by Commodity (Pounds of Active Ingredient)
Crop 1996 1997 1998 1999 Total
CARROTS, GENERAL 4,602,729 5,823,590 5,779,224 6,430,926 22,636,469
PROCESSING/CANNING 3,655,522 2,673,036 2,640,872 3,496,926 12,466,356 POTATO (WHITE, WSH, RED, RUSSET) 1,438,776 1,260;222 1 , 2 0 5 ~ 54 181,280 4,085,432 COTTON, GENERAL 1,719,734 1,331,770 414,502 656,188 4,122,194 CANTALOUPE 220,529 391,616 335,611 390,573 1,338,329 LETTUCE, LEAF 228,925 269,145 303,975 130,285 932,330 ONION (DRY, SPANISH, WHITE, YELLOW, RED, 124,647 182,958 280,294 318,855 906,754 SOIL APPLICATION, PREPLANT- OUTDOOR (SEEDBED) 235,749 166,472 223,2 10 343,179 968,G 10 PEPPERS (FRUITING VEGETABLE), (BELL, CHILI, ETC.) 243,630 238,859 216,619 329,140 1,028,248 SWEET POTATO 313,942 245,066 205,573 362,396 1 , I 26,977 SPINACH 40,435 83,593 173,286 87,820 385,134 LETTUCE, HEAD 548,924 81,316 147,418 34,909 8 12,567
Total 13,375,538 12,749,640 1 1,927,736 12,764,476 50,809,400
TOMATOES, FOR
+-
Crop 1996 1997 1998 1999 Total
STRAWBERRY 4,374,955 4,041,796 4,251,83 1 5,178,295 17,846,877
OUTDOOR (SEEDBED) 1,403,438 2,148,825 1,522,671 1,840,036 6,9 14,970 OUTDOOR CONTAINEWFIELD GROWN PLANTS 1,122,379 922,653 1,064,688 97 1,280 4,08 1,000 OUTDOOR GROWN TRANSPLANT 5 15,562 509,527 547,145 447,077 2,o 19,3 I I SWEET POTATO 6 1 1,586 766,042 54 1,923 403,442 2,322,993 ALMOND 61 3,743 88 1,792 502,949 267,47 I 2,265,955 GRAPES, WINE 1,480,701 897,380 478,272 68 I ,834 3,538,187 OUTDOOR GROWN CUT FLOWERS OR GREENS 4263 1 1 545,7 18 444,97 1 336,322 1,753,522 PEPPERS (FRUITING VEGETABLE), (BELL, CHLLL, ETC.) 344,828 295,151 403,080 498,480 1,54 1,539 TOMATO 336,194 263,210 304,411 352,727 1,256,542 PEACH 248,082 287,120 280,028 254,673 1,069,903 GRAPES 299,627 569,054 273,836 25 1,243 1,393,760
Total 1 1,779,602 12,130,265 10,617,803 1 1,484,879 46,004,559
SOIL APPLICATION, PREPLANT-
17 0001 35
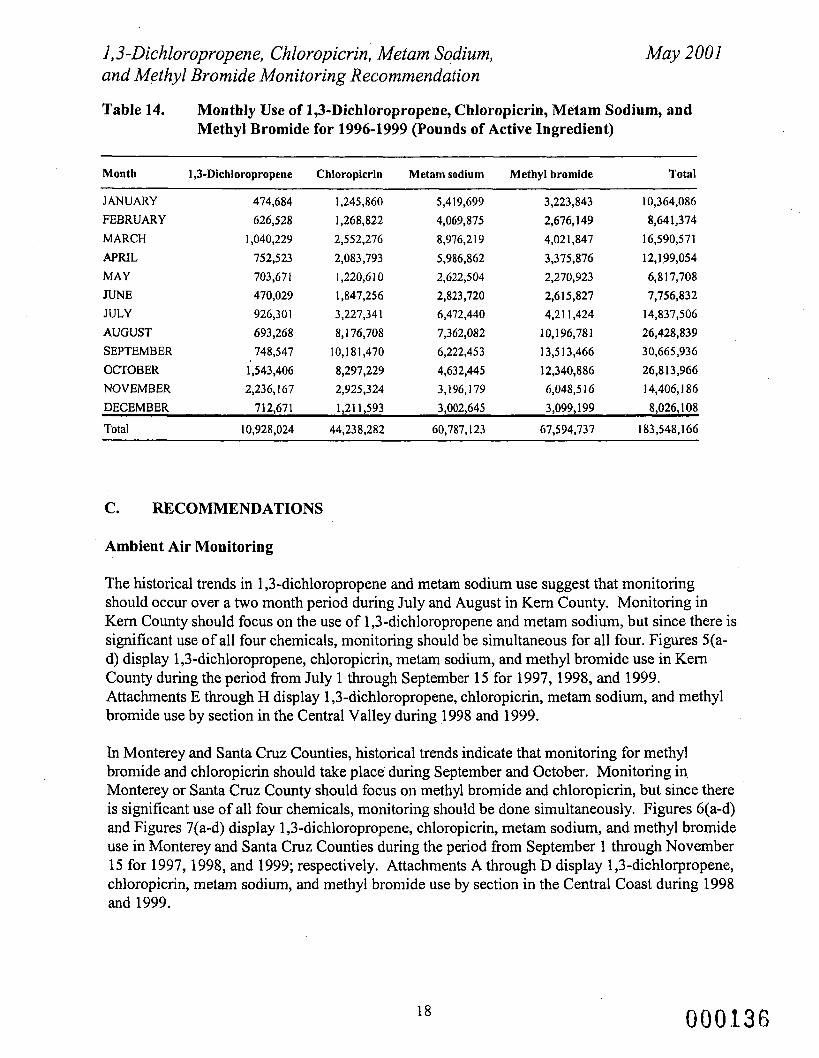
1,3-Dichloropropene, Chloropicrin, Metam Sodium, and Methyl Bromide Monitoring Recommendation
May 2001
Table 14. Monthly Use of 1,3-Dichloropropene, Chloropicrin, Metam Sodium, and Methyl Bromide for 1996-1999 (Pounds of Active Ingredient)
Month 1,f-Dichloropropene Chloropicrin Metam sodium Methyl bromide Total
JANUARY 474,684 1,245,860 5,419,699 3,223,843 10,364,086 FEBRUARY 626,528 1,268,822 4,069,875 2,676,149 8,641,374 MARCH 1,040,229 2,552,276 8,976,2 1 9 4,021,847 16,59037 1 APRIL 752,523 2,083,793 5,986,862 3,375,876 12,199,054
JUNE 470,029 1,847,256 2,823,720 2.6 15,827 7,756,832
MAY 703,67 1 1,220,6 I O 2,622,504 2,270,923 6,8 17,708
JULY 926,301 3,227,341 6,472,440 4,2 1 1,424 14,837,506 AUGUST 693,268 8,176,708 7,362,082 10,196,781 26,428,839 SEPTEMBER 748,547 10,18 1,470 6,222,453 13,5 13,466 30,665,936 OCTOBER 1,543,406 8,297,229 4,632,445 12,340,886 26,813,966 NOVEMBER 2,236,167 2,925,324 3,196,179 6,048,s I6 14,406, I 86 DECEMBER 712,671 1,211,593 3,002,645 3,099,199 8,026,108 Total 10,928,024 44,238,282 60,787,123 67,594,737 183,548,166
C. RECOMMENDATIONS
Ambient Air Monitoring
The historical trends in 1,3-dichloropropene and metam sodium use suggest that monitoring should occur over a two month period during July and August in Kern County. Monitoring in Kern County should focus on the use of 1,3-dichloropropene and metam sodium, but since there is significant use of all four chemicals, monitoring should be simultaneous for all four. Figures 5(a- d) display 1,3-dichloropropene, chloropicrin, metam sodium, and methyl bromide use in Kern County during the period from July 1 through September 15 for 1997,1998, and 1999. Attachments E through H display 1 ,3-dichloropropeneY chloropicrin, metam sodium, and methyl bromide use by section in the Central Valley during 1998 and 1999.
In Monterey and Santa Cruz Counties, historical trends indicate that monitoring for methyl bromide and chloropicrin should take place during September and October. Monitoring in Monterey or Santa Cruz County should focus on methyl bromide and chloropicrin, but since there is significant use of all four chemicals, monitoring should be done simultaneously. Figures 6(a-d) and Figures 7(a-d) display 1,3-dichloropropene, chloropicrin, metam sodium, and methyl bromide use in Monterey and Santa Cruz Counties during the period from September 1 through November 15 for 1997, 1998, and 1999; respectively. Attachments A through D display 1 ,3-dichlorpropeneY chloropicrin, metam sodium, and methyl bromide use by section in the Central Coast during 1998 and 1999.
18 000136
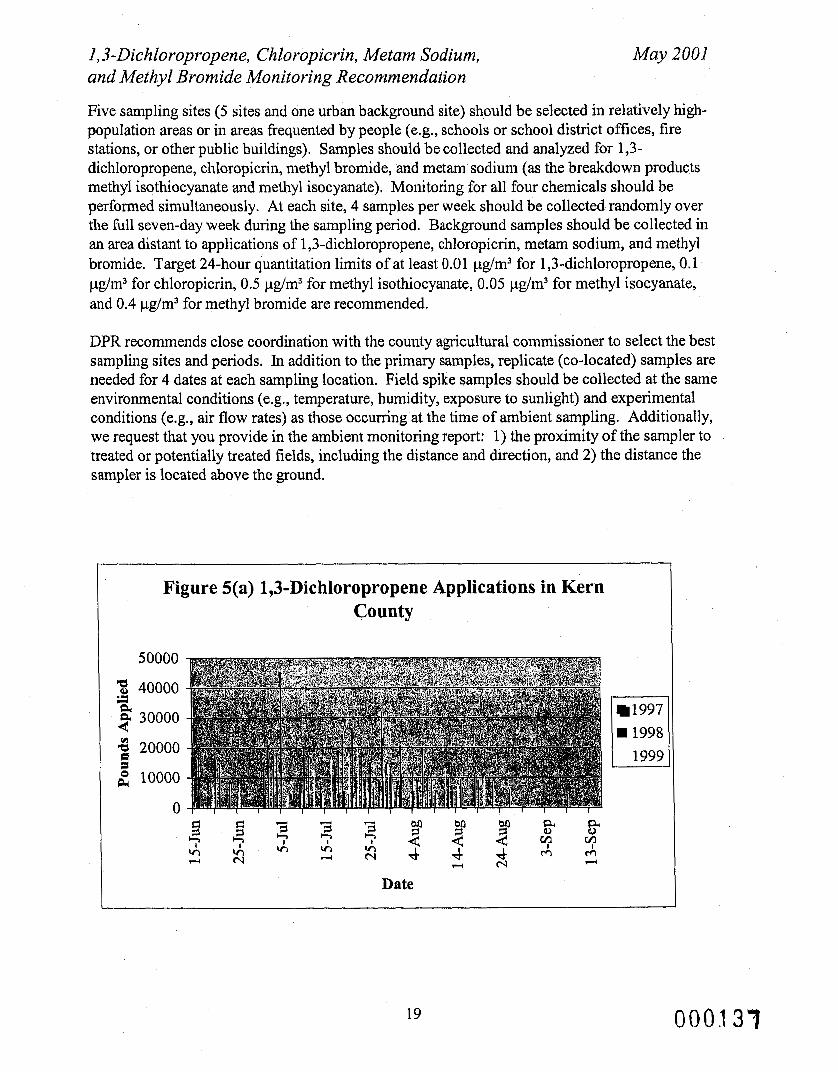
I,3-Dichloropropene, Chloropicrin, Metam Sodium, and Methyl Bromide Monitoring Recommendation
May 2001
Five sampling sites (5 sites and one urban background site) should be selected in relatively high- population areas or in areas frequented by people (e.g., schools or school district offices, fire stations, or other public buildings). Samples should be collected and analyzed for 1,3- dichloropropene, chloropicrin, methyl bromide, and metam sodium (as the breakdown products methyl isothiocyanate and methyl isocyanate). Monitoring for all four chemicals should be perfomled simultaneously. At each site, 4 samples per week should be collected randomly over the full seven-day week during the sampling period. Background samples should be collected in an area distant to applications of 1,3-dichloropropene, chloropicrin, metam sodium, and methyl bromide. Target 24-hour quantitation limits of at least 0.01 pg/m3 for 1,3-dichloropropene, 0.1 pg/m3 for chloropicrin, 0.5 pg/m3 for methyl isothiocyanate, 0.05 pg/m3 for methyl isocyanate, and 0.4 pg/m3 for methyl bromide are recommended.
DPR recommends close coordination with the county agricultural commissioner to select the best sampling sites and periods. In addition to the primary samples, replicate (co-located) samples are needed for 4 dates at each sampling location. Field spike samples should be collected at the same environmental conditions (e.g., temperature, humidity, exposure to sunlight) and experimental conditions (e.g., air flow rates) as those occurring at the time of ambient sampling. Additionally, we request that you provide in the ambient monitoring report: 1) the proximity of the sampler to treated or potentially treated fields, including the distance and direction, and 2) the distance the sampler is located above the ground.
Figure 5(a) 1,3-Dichloropropene Applications in Kern County
1997 4 1998
1999
Date
19 0001 37
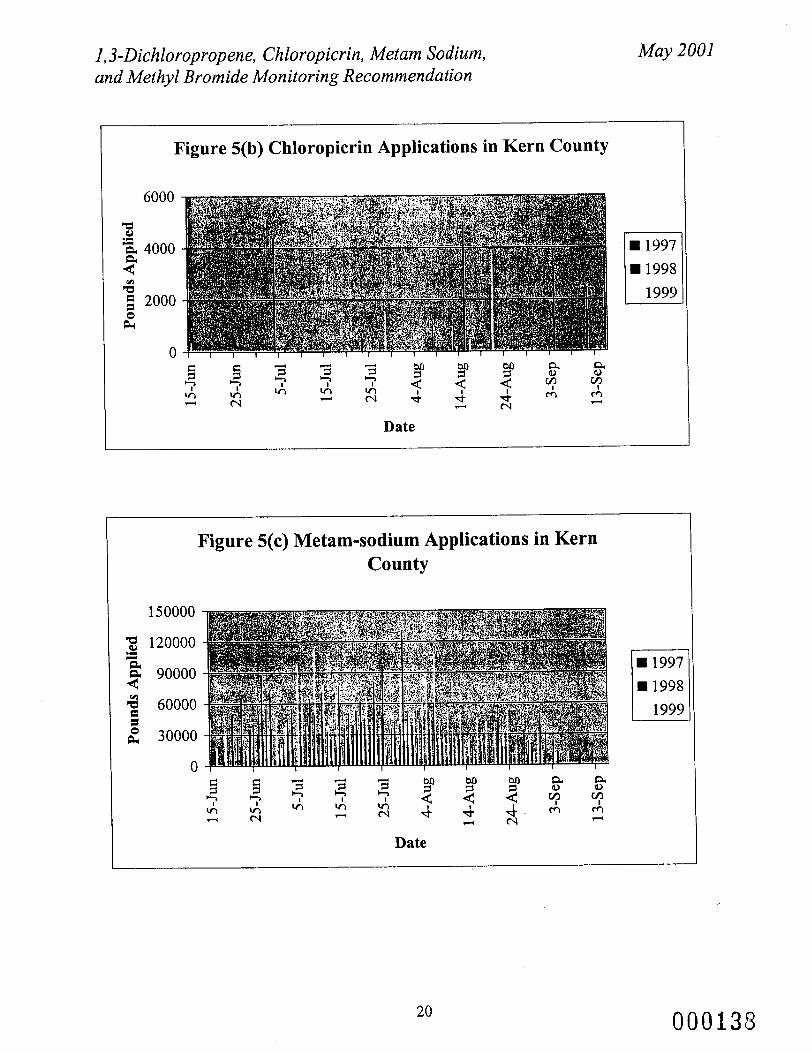
1,3-Dichloropropene, Chloropicrin, Metam Sodium, and Methyl Bromide Monitoring Recommendation
6000
z .I "a 4000 a 4 .;3 5 2000
0
May 2001
Figure 5(b) Chloropicrin Applications in Kern County
1997 1998 1999
Date I
Figure 5(c) Metam-sodium Applications in Kern County
150000
2 120000 .- c1 a q 90000
4 60000 z 2 30000
1997 W 1998
1999
Date
20 000138
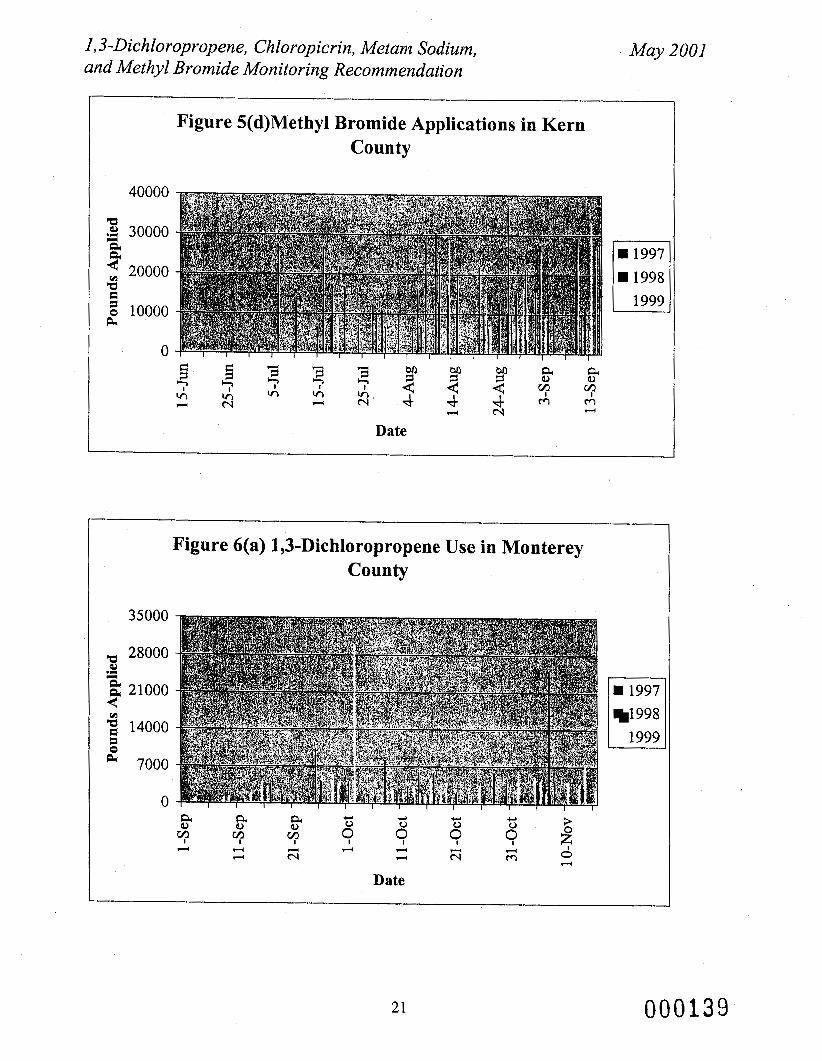
I,3-Dichloropropene, Chloropicrin, Metam Sodium, and Methyl Bromide Monitoring Recommendation
May 2001
35000
28000
2 1000
14000
7000
0
1997 1998 1999
Date
21 000139
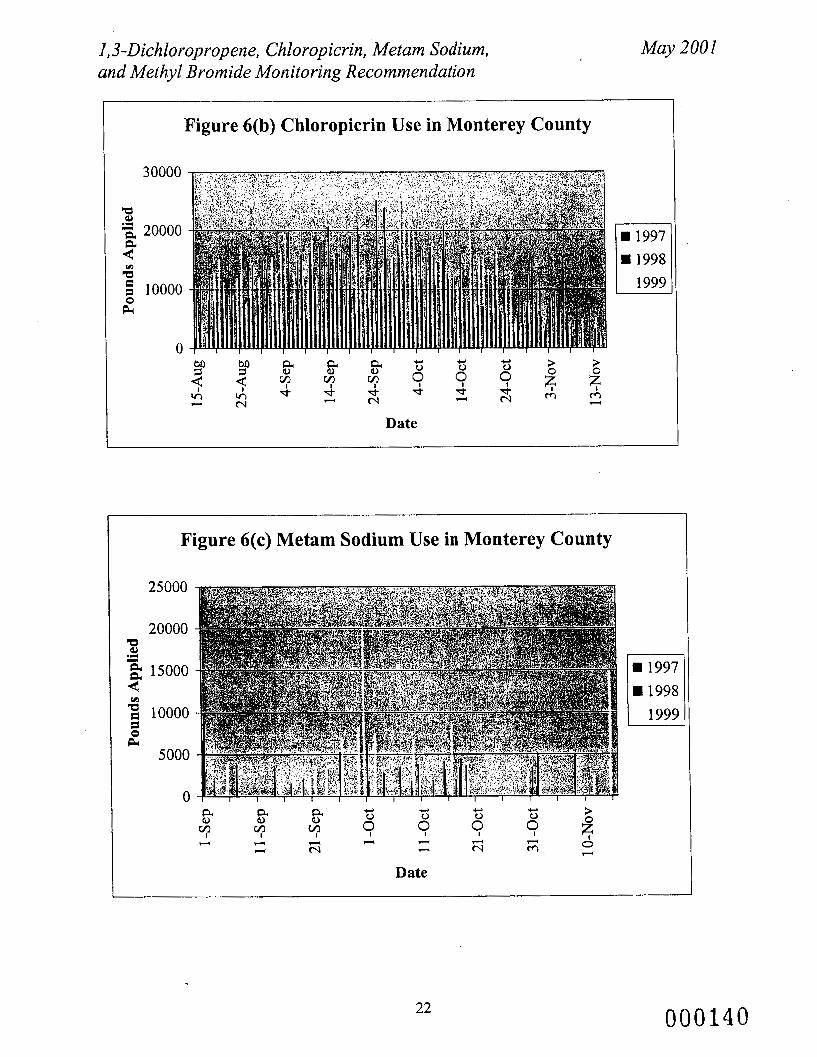
I,3-Dichloropropene1 Chloropicrin, Metam Sodium, and Methyl Bromide Monitoring Recommendation
May 2001
Figure 6(b) Chloropicrin Use in Monterey County
W 1997 W 1998
1999
Date
Figure 6(c) Metam Sodium Use in Monterey County
25000
20000
4 10000 3
5000
0
Date
22 000140
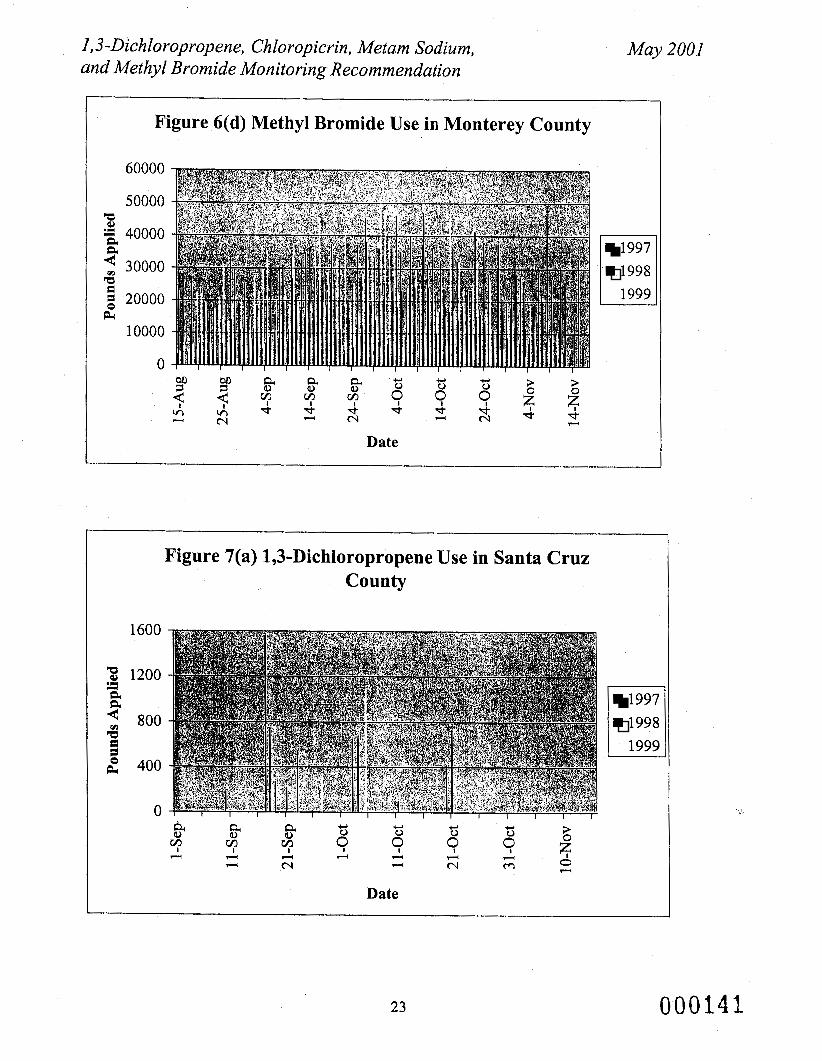
1,3-Dichloropropene, Chloropicrin, Metam Sodium, and Methyl Bromide Monitoring Recommendation
May 2001
Figure 6(d) Methyl Bromide Use in Monterey County
60000
50000
40000
30000
20000
10000
0
1997 1998
Date
1600
1200
800
400
0
1997 1998 1999
Date
23 000146
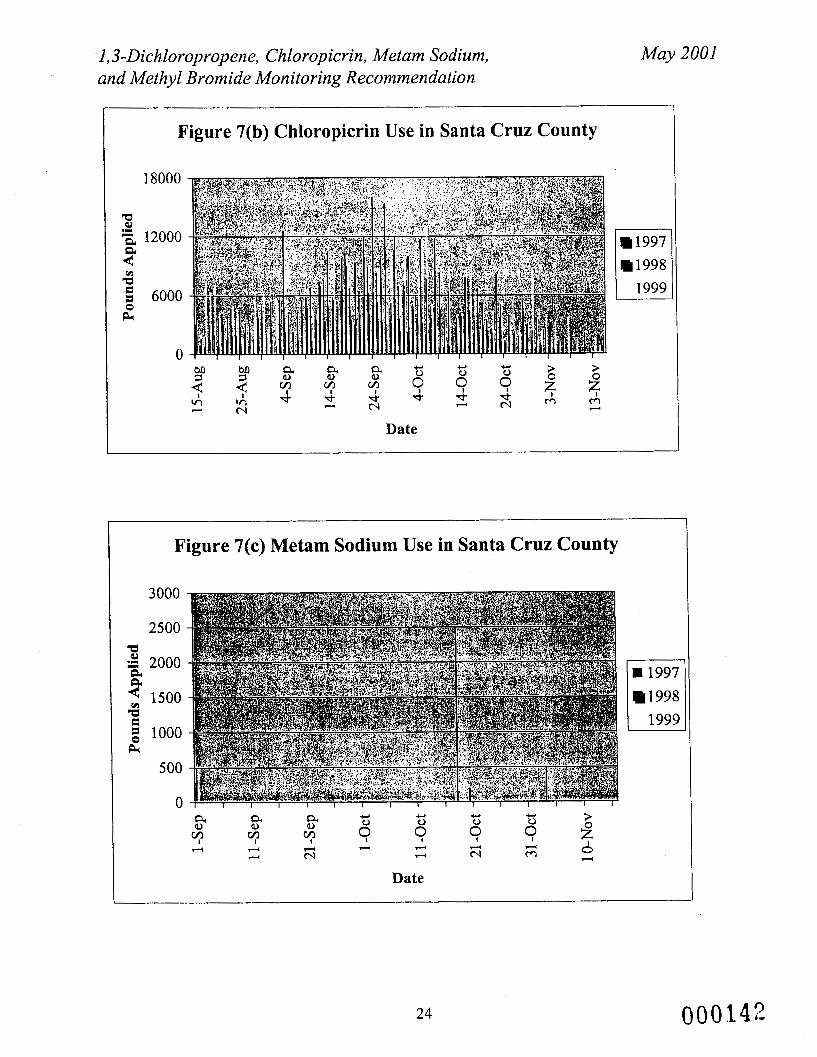
I,3-Dichloropropene, Chloropicrin, Metam Sodium, May 2001 and Methyl Bromide Monitoring Recommendation
Figure 7(b) Chloropicrin Use in Santa Cruz County
I 1999
1997 1998
Date
Figure 7(c) Metam Sodium Use in Santa Cruz County
3000
2500
3 2000 a 1500
.I3 g 1000 a
PC 5 00
0
1 1999
1997 1998
Date
24 000142
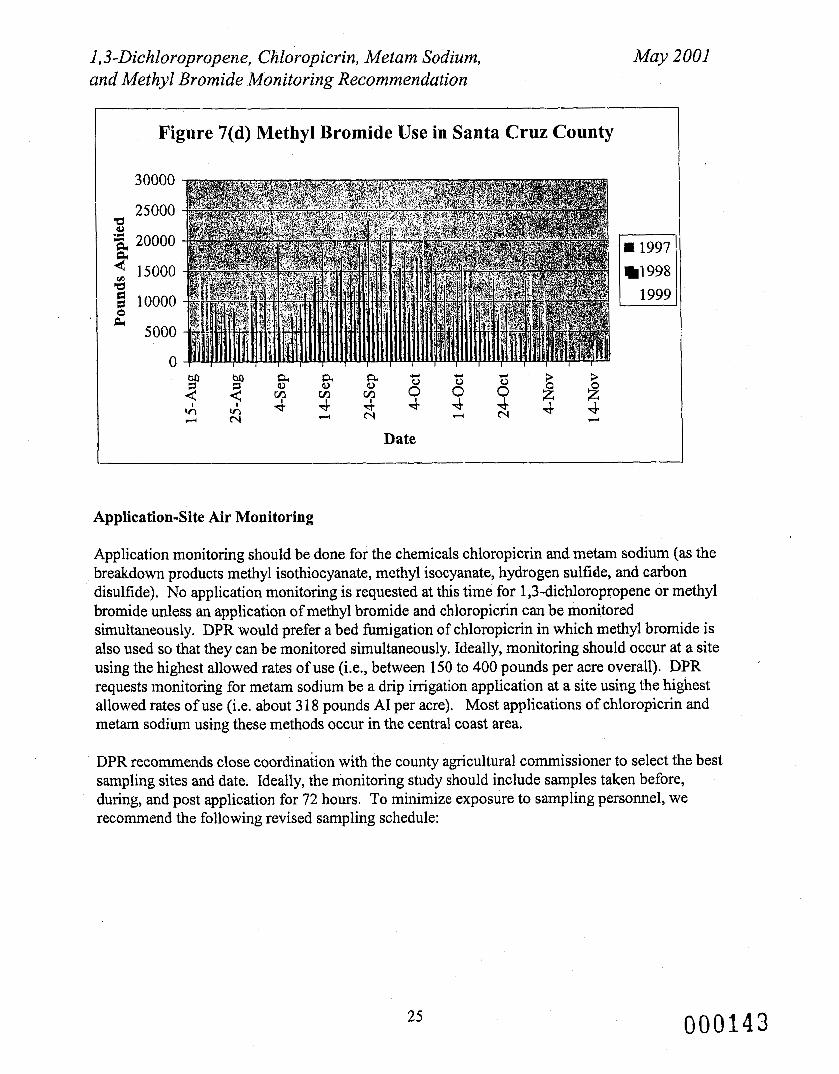
1,3-Dichloropropene, Chloropicrin, Metam Sodium, May 2001 and Methyl Bromide Monitoring Recommendation
Figure 7(d) Methyl Bromide Use in Santa Cruz County
30000
25000 z 2 20000
g 10000 z ' 15000 3
5000
0
I 1997 1998
Date
Application-Site Air Monitoring
Application monitoring should be done for the chemicals chloropicrin and metam sodium (as the breakdown products methyl isothiocyanate, methyl isocyanate, hydrogen sulfide, and carbon disulfide). No application monitoring is requested at this time for 1,3-dichloropropene or methyl bromide unless an application of methyl bromide and chloropicrin can be monitored simultaneously. DPR would prefer a bed fumigation of chloropicrin in which methyl bromide is also used so that they can be monitored simultaneously. Ideally, monitoring should occur at a site using the highest allowed rates of use (Le., between 150 to 400 pounds per acre overall). DPR requests monitoring for metam sodium be a drip irrigation application at a site using the highest allowed rates of use (i.e. about 3 18 pounds AI per acre). Most applications of chloropicrin and metam sodium using these methods occur in the central coast area.
DPR recommends close coordination with the county agricultural commissioner to select the best sampling sites and date. Ideally, the monitoring study should include samples taken before, during, and post application for 72 hours. To minimize exposure to sampling personnel, we recommend the following revised sampling schedule:
25 000143
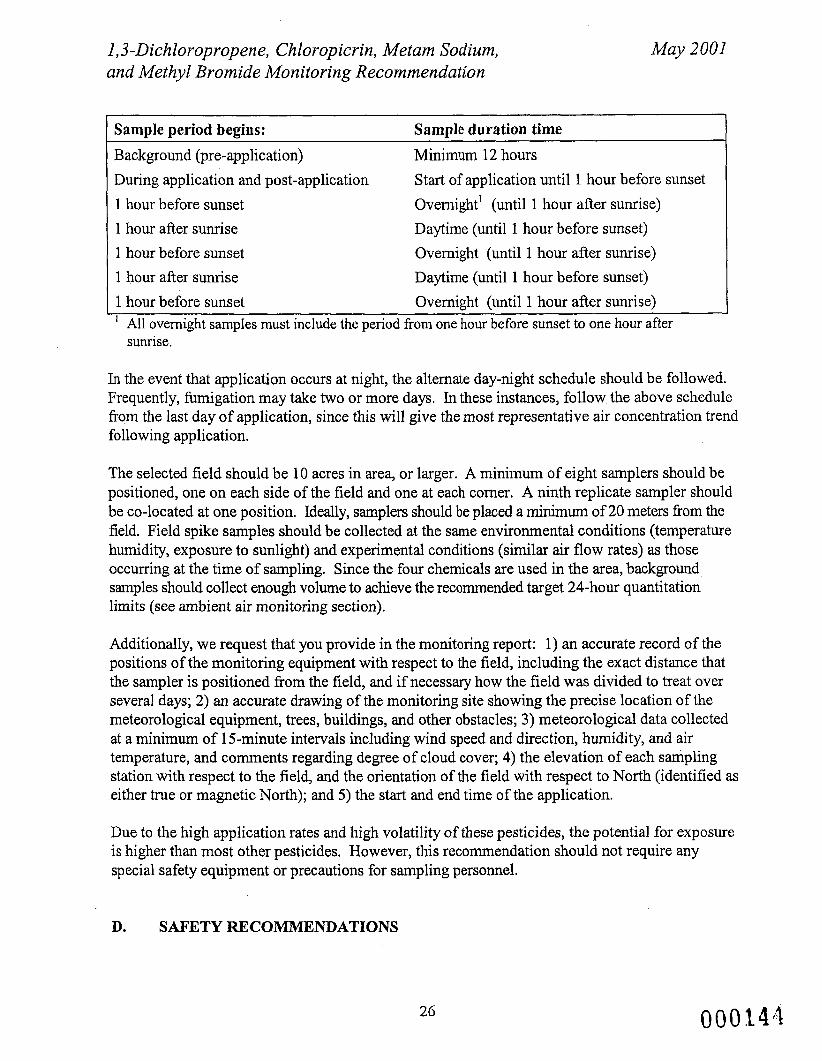
1,3-Dichloropropene, Chloropicrin, Metam Sodium, and Methyl Bromide Monitoring Recommendation
May 2001
Sample period begins: Background (pre-application) Minimum 12 hours During application and post-application Start of application until 1 hour before sunset 1 hour before sunset Overnight' (until 1 hour after sunrise) 1 hour after sunrise Daytime (until 1 hour before sunset) 1 hour before sunset Overnight (until 1 hour after sunrise) 1 hour after sunrise Daytime (until 1 hour before sunset) 1 hour before sunset Overnight (until 1 hour after sunrise)
~~ ~~ ~~ ~
Sample duration time
All overnight samples must include the period from one hour before sunset to one hour after sunrise.
In the event that application occurs at night, the alternate day-night schedule should be followed. Frequently, fbmigation may take two or more days. In these instances, follow the above schedule from the last day of application, since this will give the most representative air concentration trend following application.
The selected field should be 10 acres in area, or larger. A minimum of eight samplers should be positioned, one on each side of the field and one at each corner. A ninth replicate sampler should be co-located at one position. Ideally, samplers should be placed a minimum of 20 meters from the field. Field spike samples should be collected at the same environmental conditions (temperature humidity, exposure to sunlight) and experimental conditions (similar air flow rates) as those occurring at the time of sampling. Since the four chemicals are used in the area, background sarnples should collect enough volume to achieve the recommended target 24-hour quantitation limits (see ambient air monitoring section).
Additionally, we request that you provide in the monitoring report: 1) an accurate record of the positions of the monitoring equipment with respect to the field, including the exact distance that the sampler is positioned from the field, and if necessary how the field was divided to treat over several days; 2) an accurate drawing of the monitoring site showing the precise location of the meteorological equipment, trees, buildings, and other obstacles; 3) meteorological data collected at a minimum of 15-minute intervals including wind speed and direction, humidity, and air temperature, and comments regarding degree of cloud cover; 4) the elevation of each sampling station with respect to the field, and the orientation of the field with respect to North (identified as either true or magnetic North); and 5) the start and end time of the application.
Due to the high application rates and high volatility of these pesticides, the potential for exposure is higher than most other pesticides. However, this recommendation should not require any special safety equipment or precautions for sampling personnel.
D. SAFETY RECOMMENDATIONS
26 000141.2
1,3-Dichloropropene, Chloropicrin, Metam Sodium, and Methyl Bromide Monitoring Recommendation
May 2001
Most of the following safety precautions pertain to applicators. The sampling schedule is arranged so that sampling personnel do not need to be near the field during application, so these precautions are not necessary.
1,3-Dichloropropene
The 1,3-dichloropropene product labels warn that 1,3-dichloropropene may cause substantial, but temporary, eye injury if the product gets into the eyes. The product may cause skin irritation, skin bums, allergic skin reaction and be fatal if absorbed through the skin. The vapor may be fatal if inhaled and may cause lung, liver, and kidney damage and respiratory system irritation upon prolonged contact.
Monitoring personnel should use proper protective equipment to prevent exposure to the dust, vapors or spray mist. According to the product labels, proper protective equipment for applicators making direct contact or for applicators outside an enclosed cab includes coveralls, chemical- resistant gloves and footwear plus socks, face sealing goggles, chemical resistant headgear (for overhead exposure) and apron, and a respirator with an organic-vapor removing cartridge. Monitoring personnel should refer to the label of the actual product used for further precautions.
Chloropicrin
The chloropicrin product labels warn that chloropicrin is a poisonous liquid and vapor and is readily identifiable by smell. Inhalation of vapors may be fatal and exposures to low' concentrations of vapor will cause irritation of the eyes, nose, and throat. Exposure to high concentrations or for a prolonged period of time may cause painful irritation to the eyes or temporary blindness. Contact with the liquid will cause chemical burns to the skin or eyes and is hannful or fatal if swallowed.
The acceptable air concentration for persons exposed to chloropicrin is 0.1 ppm. If air concentrations exceed 0.1 ppm, an air purifying respirator must be worn; if air concentrations exceed 4 ppm, an air supplying respirator must be worn. The highest concentrations of chloropicrin at 20 m from the field should not exceed 0.05 to 0.08 ppm. The label states that the applicator and other handlers must wear: loose fitting, log-sleeve shirt and long pants, shoes and socks, and full-face shield or safety glasses with brow and temple shields. Monitoring personnel should refer to the label of the product used and should use proper protective equipment to prevent exposure to the dust, vapors, or spray mist,
Metam sodium
The metam sodium product labels warn that metam sodium causes skin damage and may be fatal if absorbed through the skin. Prolonged or fkequent contact may cause an allergic reaction, Metam sodium is harmful if inhaled or swallowed and is irritating to eyes, nose, and throat.
Monitoring personnel should use proper protective equipment to prevent exposure to the vapors or spray mist and refer to the label of the actual product used for further precautions. According to
27
1,3-Dichloropropene, Chloropicrin, Metam Sodium, and Methyl Bromide Monitoring Recommendation
May 2001
the product labels, proper protective equipment for applicators making direct contact or for applicators outside an enclosed cab includes coveralls, waterproof gloves, chemical resistant footwear plus socks, face sealing goggles, chemical resistant headgear (for overhead exposure) and apron, and a respirator with an organic-vapor removing cartridge. Concentrations should not exceed 0.5 ppm for any of the sampling intervals at the 60 foot sampling distance from the field.
Methyl bromide
According to the product labels for methyl bromide, it is an extremely hazardous liquid and vapor under pressure. Inhalation may be fatal or cause serious acute illness or delayed lung or nervous system injury. Liquid or vapor may cause skin or eye injury. Methyl bromide vapor is odorless and non-irritating to skin and eyes during exposure and toxic levels may occur without warning or detection.
The acceptable air concentration for persons exposed to methyl bromide is 5 ppm, except for those in residential or commercial structures. A respirator is required if air concentrations exceed 5 ppm at any time. According to the label, proper protective equipment for applicators include loose fitting or well-ventilated long-sleeved shirt and long pants, shoes and socks, full-face shield or safety glasses with brow and temple shields. Monitoring personnel should refer to the label of the actual product used for fbrther precautions. Methyl bromide concentrations at the buffer zone distance should not exceed 1 ppm at any time.
28 000146
I , 3-Dichloropropene, Chloropicrin, Metam Sodium, and Methyl Bromide Monitoring Recommendation
May 2001
E. REFERENCES
Alvarez, R.A. and C. B. Moore. 1994. Quantum yield for the production of CH3NC in the photolysis of CH3NCS. Science 263:205-207.
Ashley, M.G., B.L. Leigh and L.S. Lloyd. 1963. The action of metam-sodium in soil. II. Factors affecting the removal of methyl isothiocyanate residues. Journal of the Science of Food and Agriculture 14:153-161.
Atkinson, R., D.L. Baulch, R.A. Cox, R.F. Hampsom, Jr., J.A. Kerr, M.J. Rossi, and J. Troe. 1997. Evaluated kinetic and photochemical data for atmospheric chemistry: supplement VI. Journal of Physical Chemistry Ref. Data, 26: 1329-1499.
Sacramento, California. DPR. 1996-1999. Annual Pesticide Use Reports. California Department of Pesticide Regulation,
DPR. 2000. Pesticide Label Database. California Department of Pesticide Regulation, Sacramento, California.
EXTOXNET. 2000. Extension Toxicology Network, Pestcide Information Profiles. [Online] Available : http://ace.orst.edu/info/extoxnet/pips
Geddes, J.D., G.C. Miller and G.E. Taylor, Jr. 1995. Gas phase photolysis of methyl isothiocyanate. Environmental Science and Toxicology 29:2590-2594.
global atmospheric methane cycle. Global Biogeochemical Cycles 11 :43-76. Howard, Philip P. 1991, Handbook of Environmental Fate and Exposure Data for Organic
Chemicals, Volume ID, Pesticides. Lewis Publishers, New York, New York.
Hein, R., P.J. Crutzen, and M. Heinmann. 1997. An inverse modeling approach to investigate the
Kollman, W. and R. Segawa. 1995. Interim report of the pesticide chemistry database. Report No. EH 95-04. Department of Pesticide Regulation. Sacramento, California.
Leistra, M. and S.J.H. Crum. 1990. Emission of methyl isothiocyanate to the air after application of metham-sodium to greenhouse soil. Water, Air, and Soil Pollution 50: 109-121.
Mongomery, John H. 1997. Agrochemicals Desk Reference. 2’ld Edition. Lewis Publishers, New York, New York.
The Agrochemicals Handbook, 3‘d edition. 1991. Royal Society of Chemistry , Information Services.
Tomlin, C. (ed) 1997. The Pesticide Manual: Eleventh Edition. Crop Protection Publications, British Crop Protection Council and the Royal Society of Chemistry. United Kingdom.
Tuazon, E.C., R. Atkinson, A.M. Winer, and J.N. Pitts, Jr. 1984. “A Study of the Atmospheric Reactions of 1,3-Dichloropropene and Other Selected Organochlorine Compounds.”Arch. Environ. Contam. Toxicol., 13(6):691-700.
29 000147
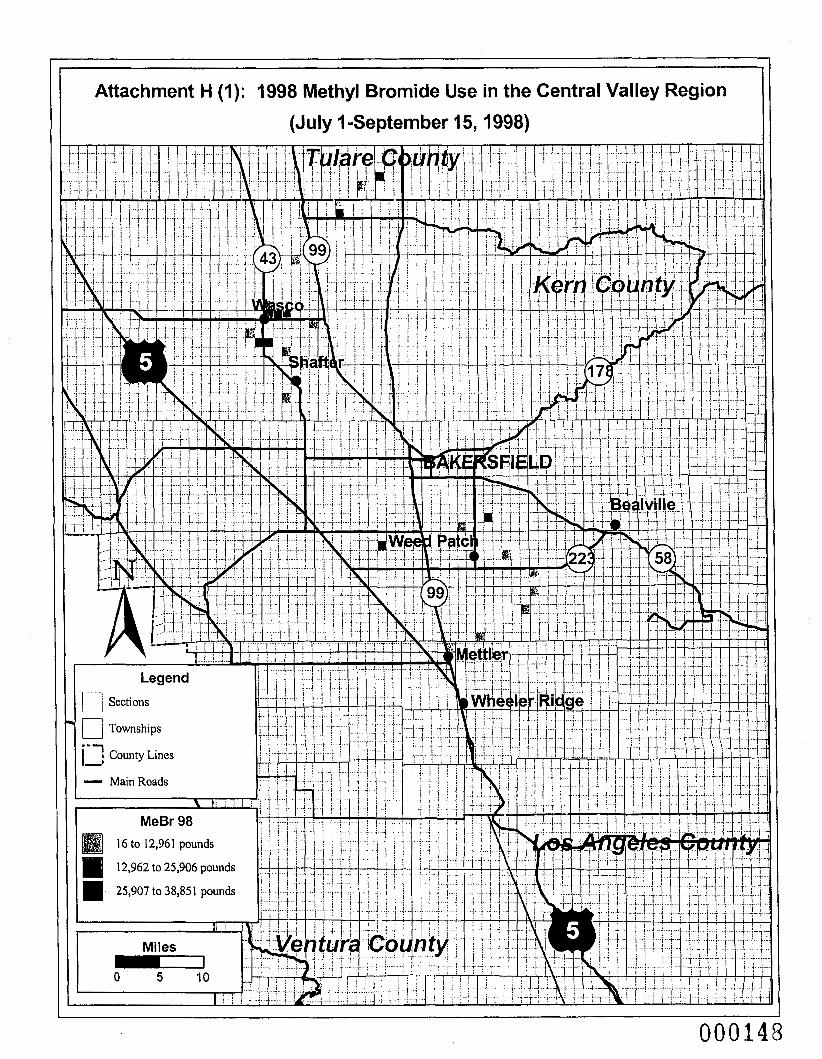
Attachment H (I): 1998 Methyl Bromide Use in the Central Valley Region
(July +September 15,1998)
I
000148
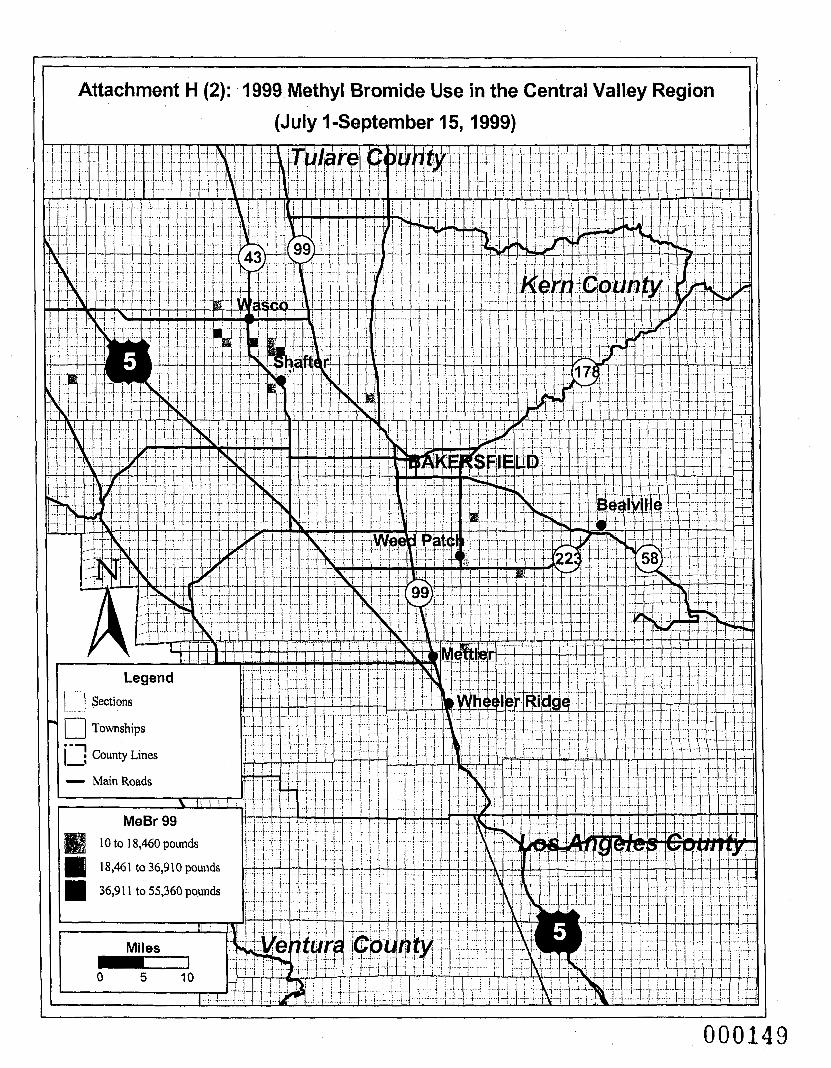
Attachment H (2): 1999 Methyl Bromide Use in the Central Vall.ey Region
(July I-September 15, 1999)
000149
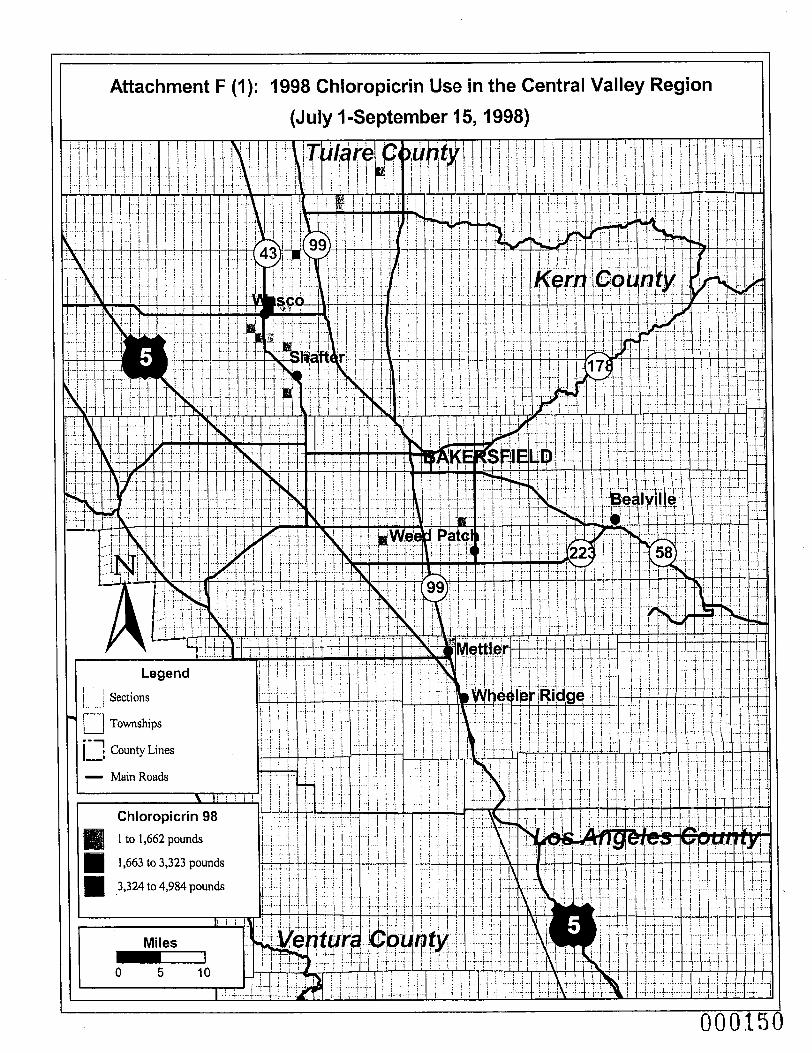
Attachment F (I): 1998 Chloropicrin Use in the Central Valley Region
(July I-September 15,1998)
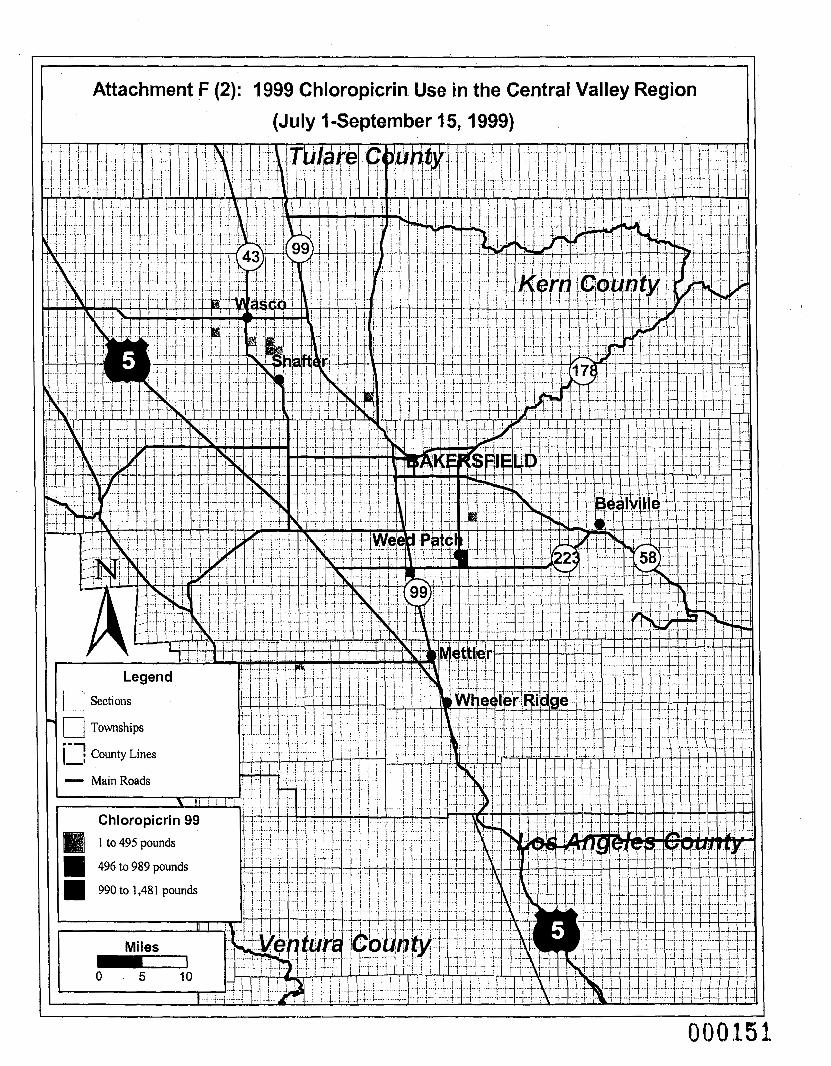
I I I
Attachment F (2): I999 Chloropicrin Use in the Central Valley Region
(July I-September 15,1999)
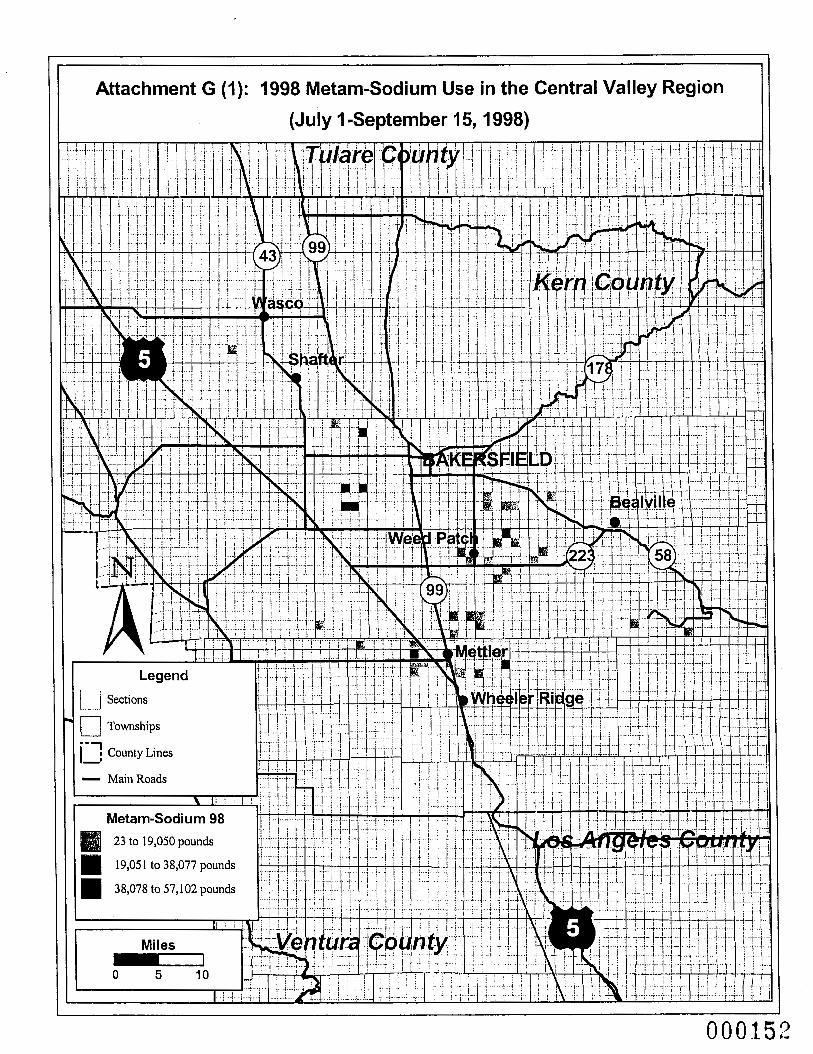
Attachment G (1): 1998 Metam-Sodium Use in the Central Valley Region
(July ?-September 15,1998) !
000151
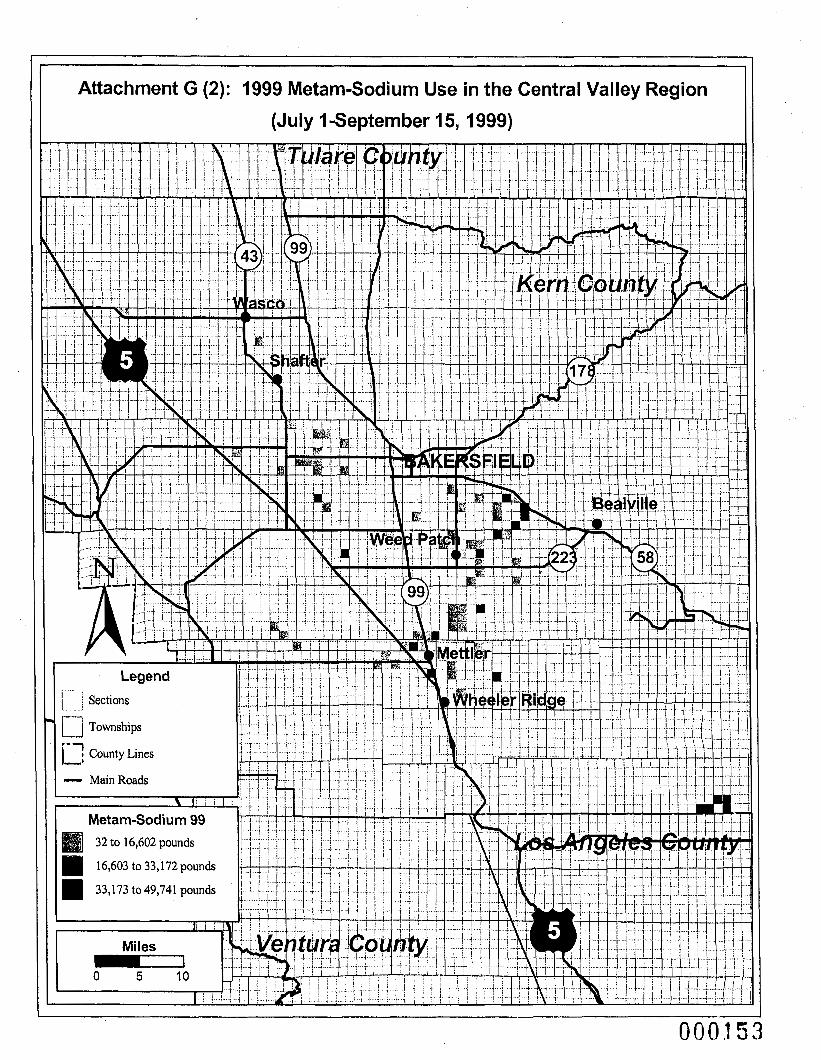
r 11 Attachment G (2): I999 Metam-Sodium Use in the Central Valley Region
(July I -September 15, 1999)
000.1 53
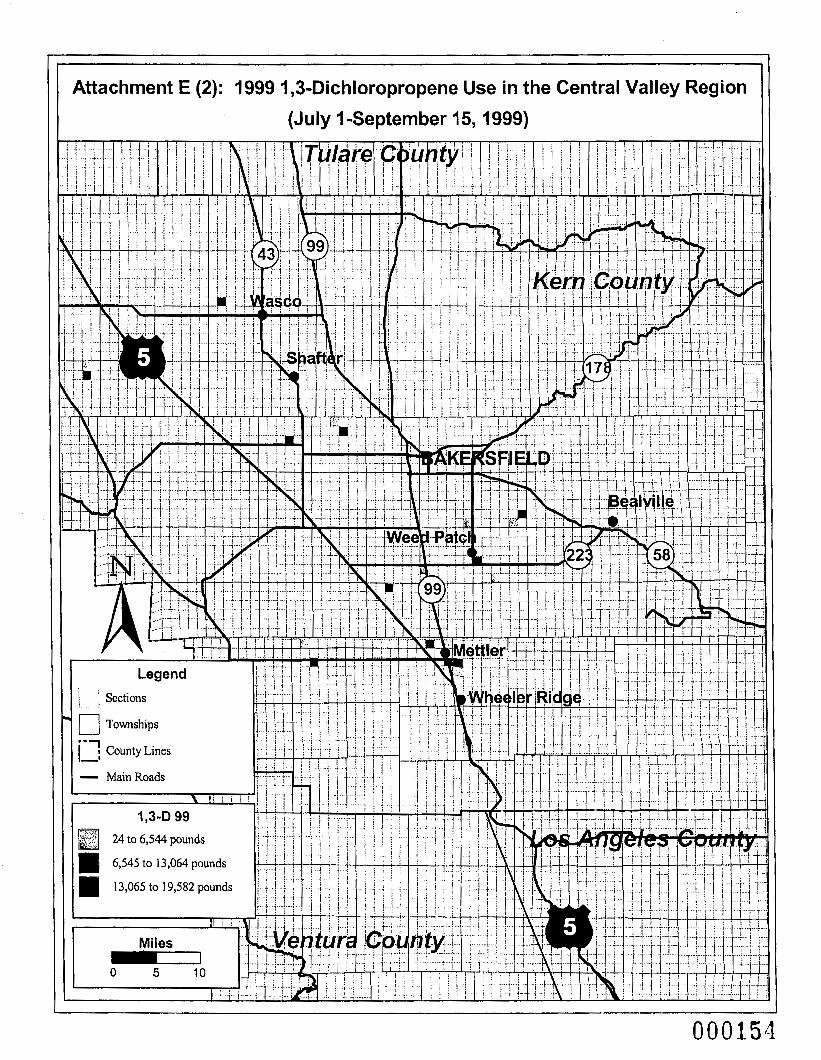
Attachment E (2): 1999 I ,3-Dichloropropene Use in the Central Valley Region
(July I-September 15, 1999)
000151

i 1 1 Attachment E (I): 1998 1,3-Dichloropropene Use in the Central Valley Region
(July I-September 15, 1998)

I
000.1.56
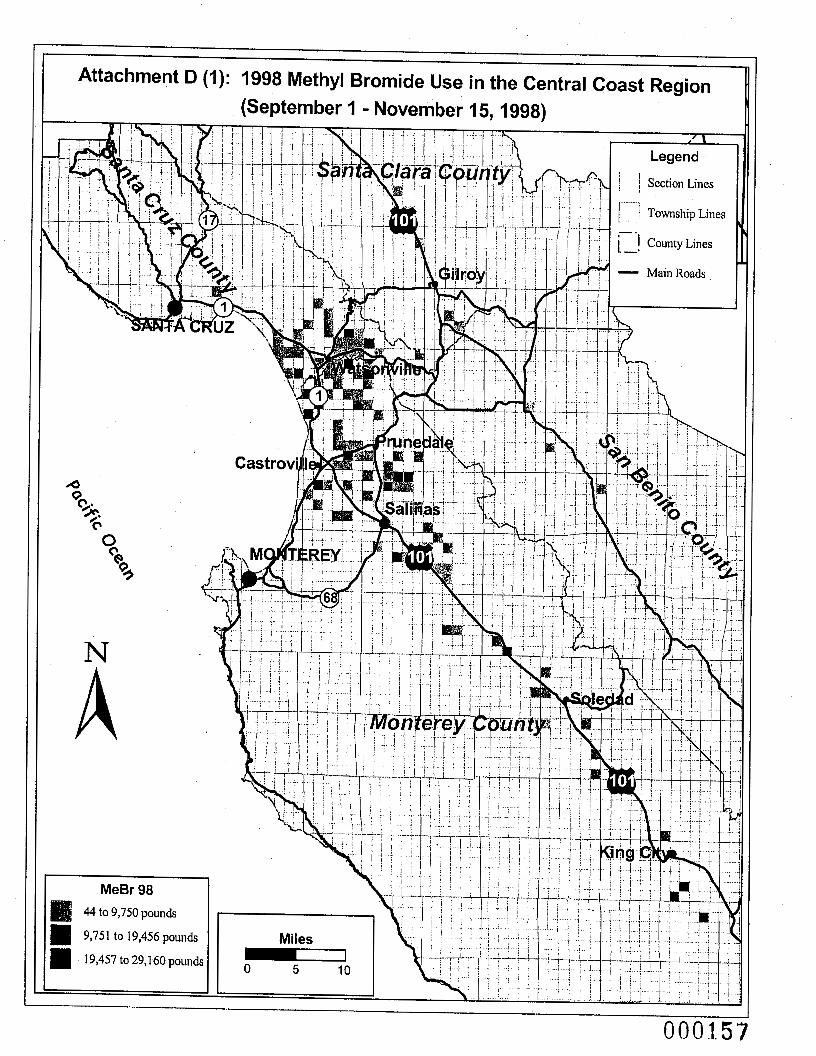
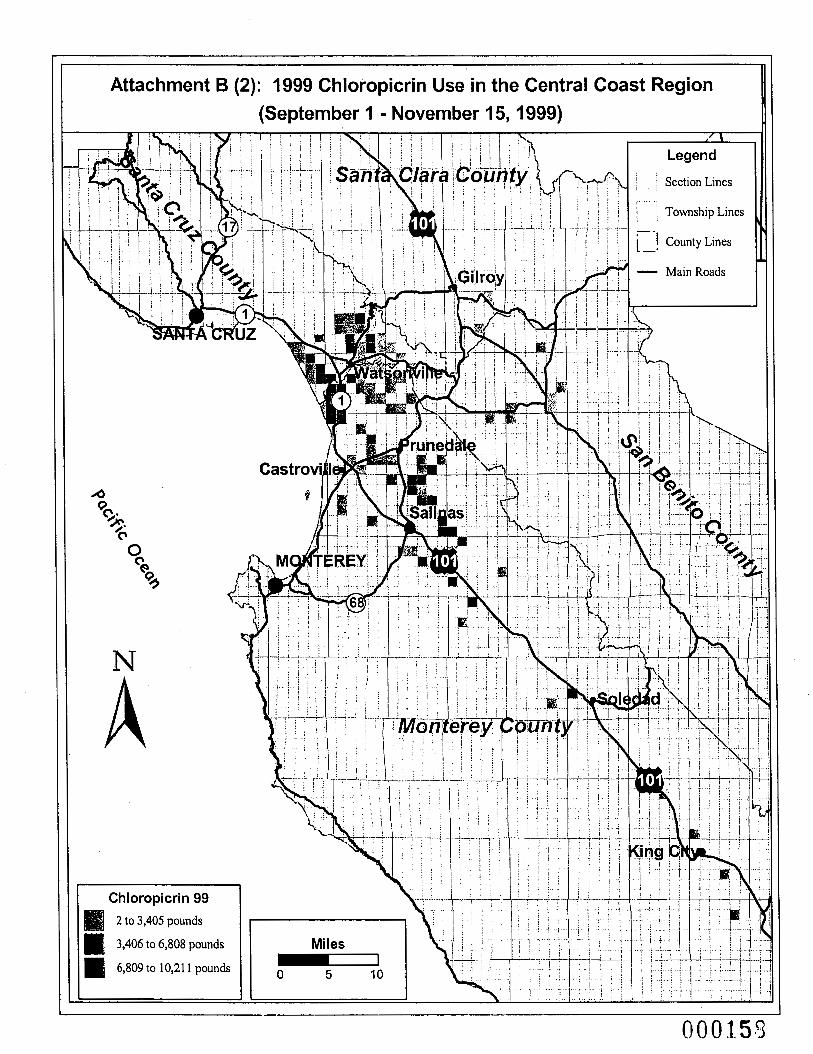
Attachment B (2): I999 Chloropicrin Use in the Central Coast Region (September I - November 15,1999)
000.158

Attachment B (I): 1998 Chloropicrin Use in the Central Coast Region H
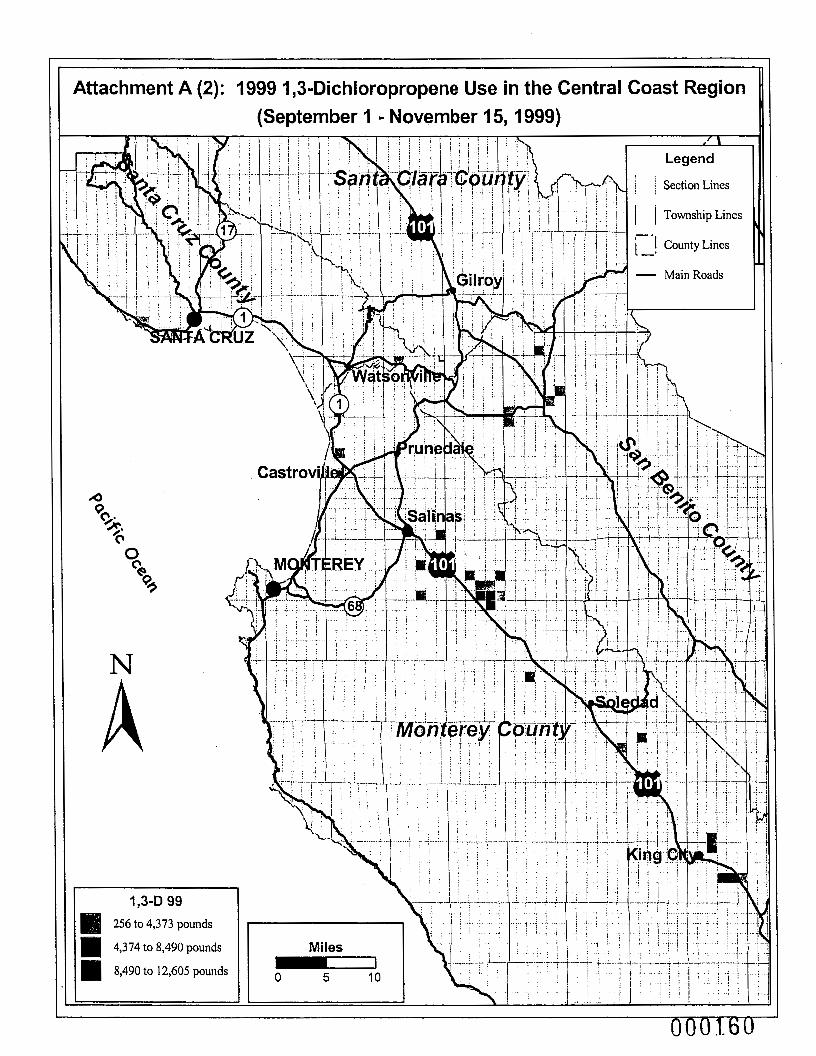
Attachment A (2): I999 1,3-DichIoropropene Use in the Central Coast Region (September I - November 15,1999)
I
0001.60 ’
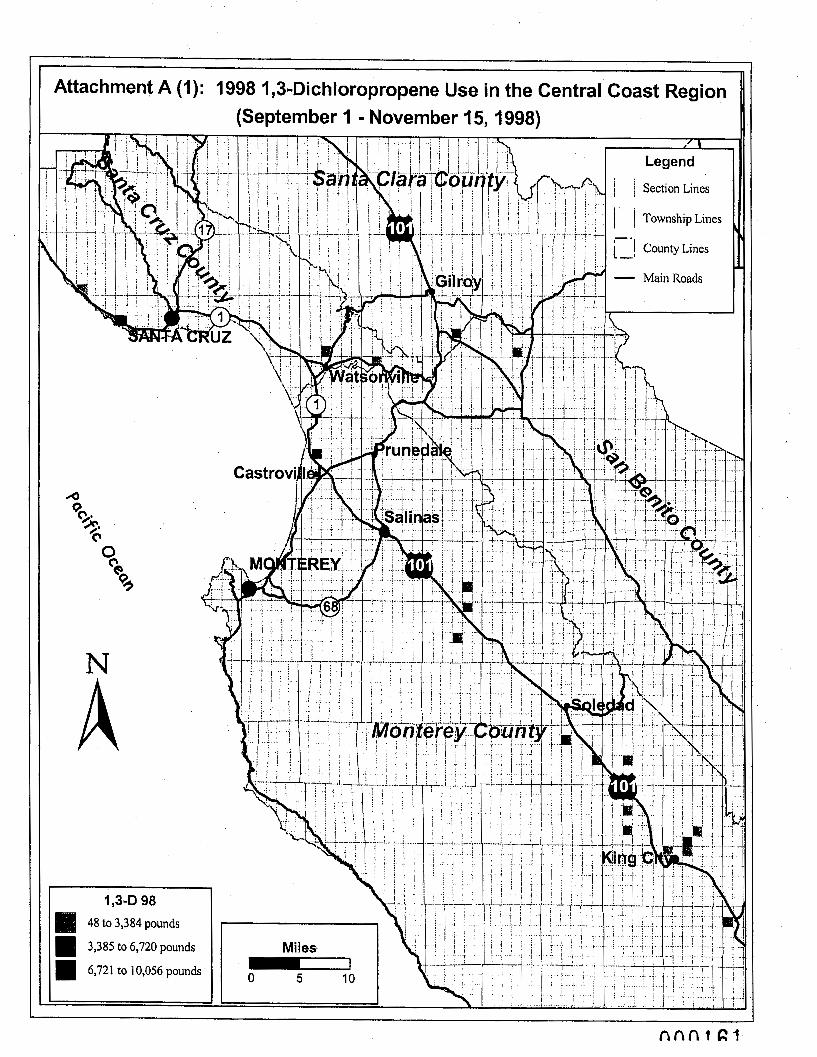
Attachment A (1): 1998 1,3-DichIoropropene Use in the Central Coast Region
(September I - November 15,1998)

Attachment C (I): 1998 Metam-Sodium Use in the Central Coast Region (September I - November 15,1998)
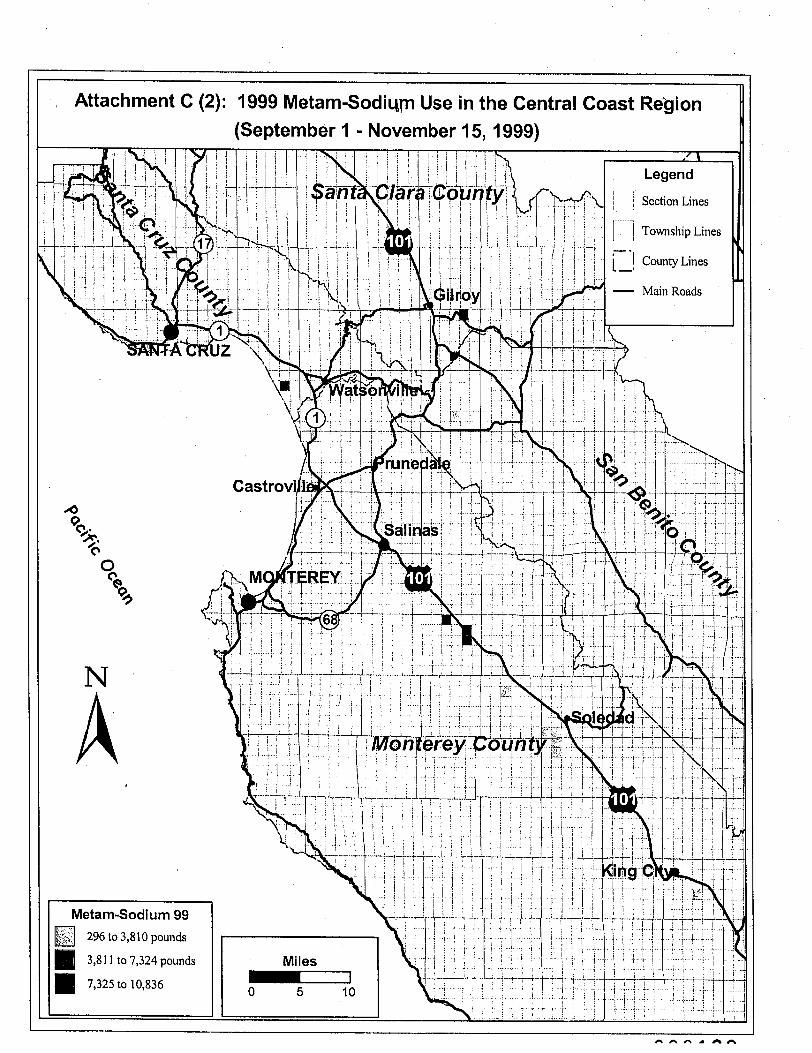
, Attachment C (2): 1999 Metam-Sodiyp Use in the Central Coast Region (September I - November 15, 1999) I


Con
cent
rati
on (
nglm
3)
Con
cent
ratio
n (n
glrn
3)
8 2
z 8
2
2
2
0
0
0
0
i\,
b
0
rn
rn
rn
rn
0
0
0
0
0
0
N
N
N
W
W
W
0
0
rn
rn
rn
0
0
0 T
0
0
N
09/0
8/01
1
I ,
09/1
0/01
09/1
2/01
r 09
/14/
01
0911
6/01
09/1
8/01
09/2
0/01
1 09
/22/
01
1
09/2
4/01
09/2
6/01
1
1
09/2
8/01
09/3
0/01
10/0
2/01
10/0
4/01
3 10
/06/
01
z
3'
10/0
8/01
0)
rn In
10/1
0/01
10/1
2/01
0
==I
10/1
4/01
3
1 011
610
1
1011
8/01
10/2
0/01
10/2
2/01
-. ,
._ .
I
5
I
10/2
6/01
10/3
0/01
11/0
1/01
+
11/0
3/01
* 11
/07/
01
09/0
8/01
09/1
0/01
09/1
2/01
09/1
4/01
09/1
6/01
09/1
8/01
09/2
0/01
2
8 2
z 8
0
rn
0
0
0
0
0
0
N
0
0
0
0
rn
rn
rn
rn
rn
0
0
N
0
h)
N
W
w
W
0
0
09/2
2/01
09/2
4/01
09/2
6/01
I
09/2
8/01
09/3
0/01
1 0/0
2/0 1
10/0
4/01
I
10/0
6/01
'0
- 5' 1
0/08
/01
i
1 I I
=1
I ,
, .
,, ,
~~
1
I
1 0
/16/
0 1
1011
8/01

Table 1 1,3-Dichloropropene Ambient Monitoring Results (Cartridge) for Monterey and Santa Cruz Counties 2001
I End Time Time Volume Total 1,3-Dichloropropene trans-I ,3-DCP cis-I ,3-DCP 1'7 I Sample ID I Datefrime Datenime I (min) I (hours) I (m3) (nnlsamde) I (nglm3) I "'(PPtv) (nnlsample) (nslsamole)
MDL=3.0 ng/sample for each 1,3-dichloropropene isomer DET=Value was below the EQL of 15 ng/sample but 2 MDL (''pptv at 1 atm and 25OC -5-
= sample loss on extraction ** = cartridge wet
INVALID - invalid due to unstable flow rate

Table 1 1,3-Dichloropropene Ambient Monitoring Results (Cartridge) for Monterey and Santa Cruz Counties 2001
MDL=3.0 nglsample for each 1,3-dichloropropene isomer DET=Value was below the EQL of 15 ngkample but 2 MDL "'pptv at 1 atm and 25OC -6-
* = sample loss on extraction ** = cartridge wet
., INVALID - invalid due to unstable flow rate .>

Table 1 I ,3-Dichloropropene Ambient Monitoring Results (Cartridge) for Monterey and Santa Cruz Counties 2001
MDL=3.0 ngkample for each 1,3-dichloropropene isomer DET=Value was below the EQL of 15 ngkample but >_ MDL (''pptv at 1 atm and 25OC -7-
* = sample loss on extraction ** = cartridge wet
INVALID - invalid due to unstable flow rate

Table I 1,3-Dichloropropene Ambient Monitoring Results (Cartridge) for Monterey and Santa Cruz Counties 2001
MDL=3.0 ng/sample for each 1,3-dichloropropene isomer DET=Value was below the EQL of 15 ng/sample but MDL "'pptv at 1 atm and 25OC -8-
* = sample loss on extraction
INVALID - invalid due to unstable flow rate .I ** = cartridge wet

Table 1 I ,3-Dichloropropene Ambient Monitoring Results (Cartridge) for Monterey and Santa Cruz Counties 2001
MDL=3.0 ngkample for each 1,3-dichloropropene isomer DET=Value was below the EQL of 15 nglsample but 2 MDL ("pptv at 1 atm and 25'C -9-
* = sample loss on extraction ** = cartridge wet
Y.. INVALID - invalid due to unstable flow rate

Table 1 1,3-Dichloropropene Ambient Monitoring Results (Cartridge) for Monterey and Santa Cruz Counties 2001
MDL=3.0 ng/sample for each 1,3-dichloropropene isomer DET=Value was below the EQL of 15 ng/sample but 2 MDL ("pptv at 1 atm and 25OC -1 0-
* = sample loss on extraction ** = cartridge wet - - . INVALID - invalid due to unstable flow rate
. .

Table I 1,3-Dichloropropene Ambient Monitoring Results (Cartridge) for Monterey and Santa Cruz Counties 2001
MDL=3.0 ngkample for each 1,3-dichloropropene isomer DET=Value was below the EQL of 15 ngkample but 2 MDL "'pptv at 1 atm and 25OC -1 1-
* = sample loss on extraction ** = cartridge wet
INVALID - invalid due to unstable flow rate

Table 2 Summary of Cartridge Results for 1,3-Dichloropropene (nglm3) in Monterey and Santa Cruz Counties 2001
PMST I SALT I SEST MEST <MDL <MDL <MDL
4.95E+01 <MDL 1 4.43E+01 6.21 E+02 9/9/2001 <MDL <MDL 9/10/2001 <MDL <MDL 1.04E+02 1 <MDL I DET 9/11/2001 <MDL <MDL 9/17/2001 D ET D ET
8.61 E+01 <MDL 1.58E+01 1.51 E+02 DET 1.26E+02
1 9/18/2001 D ET D ET ~ 9/22/2001 4.09E+01 3.02E+01
2.04E+02 DET 2.49E+02 1.36E+02 2.47E+OI 6.54E+02
9/26/2001 2.29E+02 9.04E+01 9/27/2001 1.36E+02 7.36E+02
2.82E+03 2.63E+03
D ET 10/3/2001 I 7.98E+01 1 1.14E+02 10/4/2001 1.71 E+02 6.25E+01 10/5/2001 2.93E+02 4.30E+01
1.17E+02 DET DET 1.67E+02 DET 1.30E+02
10/6/2001 1.93E+02 1.59E+02 10/11/2001 8.84E+01 1.25E+02
1.97E+02 9.78E+02 2.93E+01 4.01 E+02 2.1 8E+02 6.84E+01
10/12/2001 1.53E+02 2.41 E+02 10/13/2001 3.1 9E+02 2.08E+02
1.21 E+03 8.68E+02
10/14/2001 1 1.61 E+02 I 1.27E+02 1.32E+03 3.99E+02 1 2.07E+02 1 6.2%+01 10/20/2001 3.09E+02 9.63E+01 10/21/2001 INVALID 8.00E+01
1.86E+02 1.96E+02 4.79E+02 1 .I 7E+02 4.95E+01 5.56E+01
10/22/2001 6.50E+01 DET 10/23/2001 1.51 E+02 4.32E+03
1.72E+02 4.31 E+01 7.01 E+01 3.59E+02 1.84E+03 1.05E+02
10/27/2001 4.52E+02 6.36E+02 10/28/2001 DET 3.70E+02
2.66E+02 INVALID I 4.48E+02 1 9.61E+01 10/30/2001 2.51 E+03 4.50E+02 11/4/2001 1.56E+02 1 .I 1 E+02 11/5/2001 2.57E+01 1.13E+02 11/6/2001 2.1 1 E+01 9.63E+01 11/7/2001 I 6.58E+01 I 1.45E+02 1.21 E+02
I Maximum1 2.51E+03 I 4.32E+03 1 7.50E+03
31 29 I 24 29 I 32 I 32
I
I # D E T ~ 3 I 3 I I 0 1 4 1 2 1 I # < M D L ~ 4 I 4 I I 2 1 4 1 1 1
Only the higher value of each collocated pair was listed in the table. <MDL results were factored in as MDL/2=0.42 ng/m3 DET results were factored in as (EQL+MDL)/2=2.5 ng/m3
-1 2-

Table 3 2001 Collocated Results for 1,3-Dichloropropene Cartridge Samples in Monterey and Santa Cruz Counties
Sample Total I ,3-Dichloropropene ID Rel. Diff. Average nglm3
SALT-2 <MDL SALT-2C <MDL <MDL <MDL
<MDL
O E T I 19%
CHUTB DET CHUT-6C DET D ET DET
LJET-6 DET
Sample
I SEST-6C* I 1.90E+02 I 2.20E+02 I 27% I I SEST-21C I4.79E+02 I 4.76E+02 I 1% I
-1 3-

Table 4. Total 1,3-Dichloropropene (Cartridge) Lab Spike Results
cis-I ,3-Dichloropropene trans-l,3-Dichloropropene Expected Actual Percent Expected Actual Percent
iamnle ID (ngkample) (ngkample) Recovery (nglsample) (nglsample) Recovery
ISDike 2 I 1201 91.41 76%1 1201 91.021 76%1 [Spike 3 1201 Spike 4 I 1201 86.81 72' ,
Spike 5 1201 87.21 73%1 Spike 6
71 % 85.23 120 73% 87.2 120 Spike 8 73% 88.14 120 74% 89.2 120 Spike 7 80% 95.46 120 79% 94.6 120
Ave.= 74% Ave.= 74%
Table 5. Total 1,3-Dichloropropene (Cartridge) Trip Spike Results
cis-l,3-Dichloropropene I I I I I
trans-l,3-Dichloropropene
Expected Percent Actual Expected Percent Actual Sample ID Recovery (nglsample) (nglsample) Recovery (nglsample) (nglsample)
SEST-1 TS
85% 102.1 120.0 86% 103.3 120.0 SALT-26TS 76% 91 .o 120.0 76% 91 .o 120.0 SALT-17TS 85% 101.8 120.0 85% 101.4 120.0 SALT-1 OTS 66% 78.7 120.0 63% 75.4 120.0
Ave.= 78% Ave.= 77% I I 1 I
Table 6. Total 1,3-Dichloropropene (Cartridge) Field Spike Results
cis-l,3-Dichloropropene Percent Actual Expected Percent Actual Expected
trans-l,3-Dichloropropene
Sample ID Recovery (ng/sample)* (ngkample) Recovery (ng/sample)* (nglsample) SALT-1 FS
81 % 97.5 120.0 89% 106.8 120.0 SALT-26FS 66% 79.2 120.0 74 % 88.7 120.0 SALT- 1 7 FS
123% 147 120.0 83% 99.6 120.0 SALT-1 OFS 76% 91 . I4 120.0 59% 71.3 120.0
Ave.=l 76%1 Ave.=l 86%1
*Corrected by subtracting the concentration found in the corresponding collocated sample.
-14-