Embed Size (px)
Citation preview

Appendix 1-E: Major Rd. Segment V/C and Flow Tables
Draft Report – February 2016

Page intentionally left blank

I-26 Fixed Guideway Alternatives Analysis Davis & Floyd, Inc. Existing Conditions February 2016 Appendix 1-E: Traffic V/C and Flow Tables Page i
Table of Contents
1. Major Road Segment Traffic V/C and Flow Tables ........................................... 1
List of Tables
Table 1: Inventory of Major North-South Roadways in Study Area ............................................................................... 2
Table 2: Inventory of Major East-West Roadways in Study Area .................................................................................. 3
Table 3: I-26 Corridor V/C and Traffic Flow Data (2035) .............................................................................................. 4
Table 4: V/C and Traffic Flow Data – SUB AREA 1 (2035) ............................................................................................ 5
Table 5: V/C and Traffic Flow Data – SUB AREA 2 (2035) ............................................................................................ 7
Table 6: V/C and Traffic Flow Data – SUB AREA 3 (2035)........................................................................................... 8
Table 7: V/C and Traffic Flow Data – SUB AREA 4 (2035) .......................................................................................... 10
Table 8: V/C and Traffic Flow Data – SUB AREA 5 (2035) ......................................................................................... 12
Table 9: V/C and Traffic Flow Data – SUB AREA 6 (2035) ......................................................................................... 14
Table 10: V/C and Traffic Flow Data – SUB AREA 7 (2035) ........................................................................................ 18

I-26 Fixed Guideway Alternatives Analysis Davis & Floyd, Inc. Existing Conditions February 2016 Appendix 1-E: Traffic V/C and Flow Tables Page 1
Major Road Segment Traffic V/C and Flow Tables
The following tables provide the 2035 AM, PM, and Daily Total flows and Volume-over-Capacity (V/C) ratios for
select segments along the major roadways identified in the study area. Tables are organized by Sub Areas (1-7).
The I-26 Corridor traffic statistics are provided in a separate table to provide continuity of data along the extent of
the corridor for both east and west bound traffic.

I-26 Fixed Guideway Alternatives Analysis Davis & Floyd, Inc. Existing Conditions February 2016 Appendix 1-E: Traffic V/C and Flow Tables Page 2
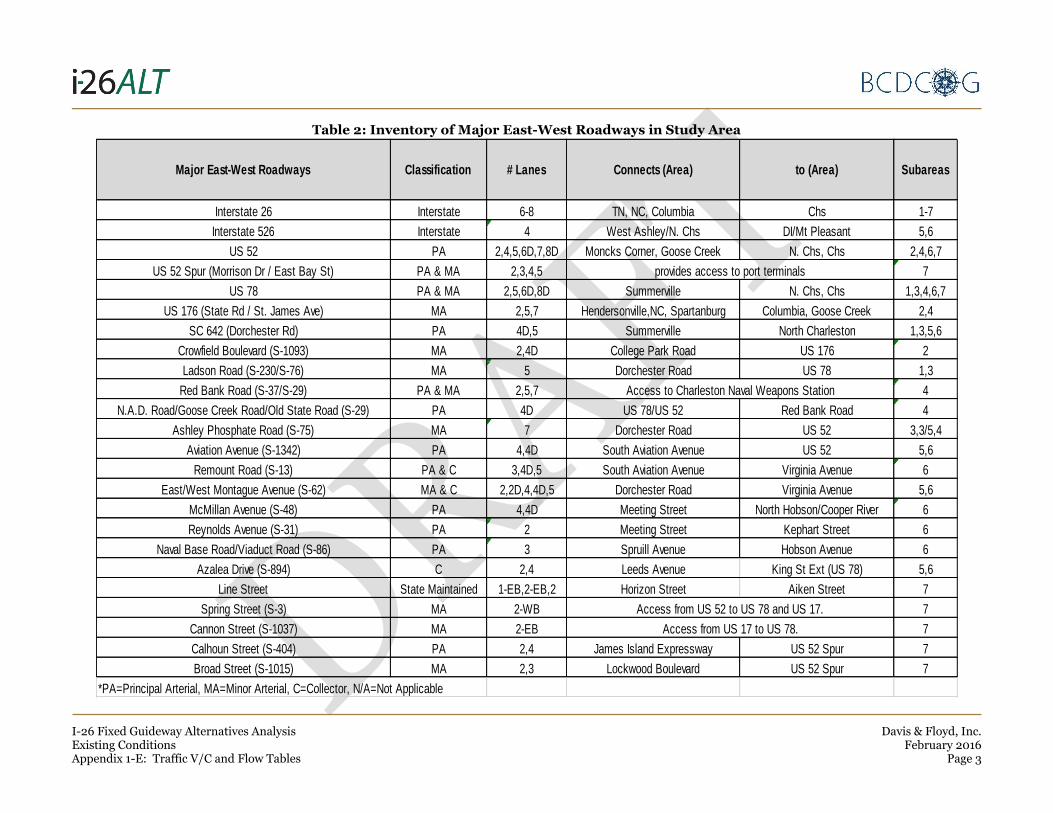
Table 1: Inventory of Major North-South Roadways in Study Area
US 17 PA 6-8 West Ashley/N. Chs Mt. Pleasant 7
US 17 Alternate PA & MA 2,5,6D Summerville Moncks Corner 1,2
SC 7 (Cosgrove Ave) PA 4 West Ashley North Charleston 6
SC 165 (Berlin G Myers Parkway/Bacon Bridge Rd) PA & MA 2,4,5 US 17 in Ravenel US 17 Alt in Summerville 1
Orangeburg Road (S-22) MA 2 US 78 Dorchester Rd 1
College Park Road (S-62) MA & C 2,5 Ladson US 17 Alt in Sangaree 1,2
Old Trolley Road (S-199) MA 5 Bacons Bridge Rd Dorchester Rd 1
Palmetto Commerce Parkway N/A 4D Ladson Rd Ashley Phosphate Road 3
Patriot Boulevard N/A 2,2D,4D,5 Dorchester Road Palmetto Commerce Pkwy 3
Cross County Road (S-2028) C 3 Dorchester Road Ashley Phosphate Road 5
North Rhett Avenue/Henry E Brown Jr Boulevard (S-60/S-136) MA & C 4,4D,5 North Charleston/Hanahan Goose Creek 4,6
Virginia Avenue (S-58) PA & C 2,4D,5 Remount Road McMillan Avenue 6
Spruill Avenue (S-32) PA & MA 3 Charleston North Charleston 6,7
Meeting Street (S-107) PA & MA 2,4 Chs peninsula southern edge US 52 7
King Street (S-104) PA & C 1-SB,2-SB,2 Chs peninsula southern edge US 78 7
Rutledge Avenue (S-46) MA 2-SB, 2 Chs peninsula southern edge I-26 7
Ashley Avenue (S-103) MA & C 2-NB, 2 7
Lockwood Drive/Boulevard (S-1194) PA & MA & C 4,4D 7
*PA=Principal Arterial, MA=Minor Arterial, C=Collector, N/A=Not Applicable
Subareasto (Area)Connects (Area)ClassificationMajor North-South Roadways
Provides northbound access in Chs peninsula
Access to US 17 and James Island Expressway
# Lanes
I-26 Fixed Guideway Alternatives Analysis Davis & Floyd, Inc. Existing Conditions February 2016 Appendix 1-E: Traffic V/C and Flow Tables Page 3
Table 2: Inventory of Major East-West Roadways in Study Area
Interstate 26 Interstate 6-8 TN, NC, Columbia Chs 1-7
Interstate 526 Interstate 4 West Ashley/N. Chs DI/Mt Pleasant 5,6
US 52 PA 2,4,5,6D,7,8D Moncks Corner, Goose Creek N. Chs, Chs 2,4,6,7
US 52 Spur (Morrison Dr / East Bay St) PA & MA 2,3,4,5 7
US 78 PA & MA 2,5,6D,8D Summerville N. Chs, Chs 1,3,4,6,7
US 176 (State Rd / St. James Ave) MA 2,5,7 Hendersonville,NC, Spartanburg Columbia, Goose Creek 2,4
SC 642 (Dorchester Rd) PA 4D,5 Summerville North Charleston 1,3,5,6
Crowfield Boulevard (S-1093) MA 2,4D College Park Road US 176 2
Ladson Road (S-230/S-76) MA 5 Dorchester Road US 78 1,3
Red Bank Road (S-37/S-29) PA & MA 2,5,7 4
N.A.D. Road/Goose Creek Road/Old State Road (S-29) PA 4D US 78/US 52 Red Bank Road 4
Ashley Phosphate Road (S-75) MA 7 Dorchester Road US 52 3,3/5,4
Aviation Avenue (S-1342) PA 4,4D South Aviation Avenue US 52 5,6
Remount Road (S-13) PA & C 3,4D,5 South Aviation Avenue Virginia Avenue 6
East/West Montague Avenue (S-62) MA & C 2,2D,4,4D,5 Dorchester Road Virginia Avenue 5,6
McMillan Avenue (S-48) PA 4,4D Meeting Street North Hobson/Cooper River 6
Reynolds Avenue (S-31) PA 2 Meeting Street Kephart Street 6
Naval Base Road/Viaduct Road (S-86) PA 3 Spruill Avenue Hobson Avenue 6
Azalea Drive (S-894) C 2,4 Leeds Avenue King St Ext (US 78) 5,6
Line Street State Maintained 1-EB,2-EB,2 Horizon Street Aiken Street 7
Spring Street (S-3) MA 2-WB 7
Cannon Street (S-1037) MA 2-EB 7
Calhoun Street (S-404) PA 2,4 James Island Expressway US 52 Spur 7
Broad Street (S-1015) MA 2,3 Lockwood Boulevard US 52 Spur 7
*PA=Principal Arterial, MA=Minor Arterial, C=Collector, N/A=Not Applicable
Access from US 52 to US 78 and US 17.
Access from US 17 to US 78.
Connects (Area) to (Area) SubareasClassification # LanesMajor East-West Roadways
provides access to port terminals
Access to Charleston Naval Weapons Station

I-26 Fixed Guideway Alternatives Analysis Davis & Floyd, Inc. Existing Conditions February 2016 Appendix 1-E: Traffic V/C and Flow Tables Page 4
Table 3: I-26 Corridor V/C and Traffic Flow Data (2035)
From To
I-26 (EB) 1,2 Berkley US 17A 0.5661 0.8697 0.73 5300.18 8260.54 29035.3
I-26 (WB) US 17A Berkley 0.8411 0.7467 0.79 8158.77 7161.65 31396.73
I-26 (EB) 1,2 US 17A College Park 0.4621 0.8028 0.66 6912.18 11748.69 41116.37
I-26 (WB) College Park US 17A 0.6974 0.6231 0.65 10270.04 9243.86 40595.94
I-26 (EB) 2,3,4 College Park US 78 0.494 0.9621 0.78 7493.86 13923.43 48814.32
I-26 (WB) US 78 College Park 0.9414 0.6937 0.78 13472.99 10337.49 48683.98
I-26 (EB) 3,4 US 78 Ashley Phosphate 0.5513 1.0811 0.92 8601.65 15834.13 57772.68
I-26 (WB) Ashley Phosphate US 78 1.0743 0.7792 0.94 15492.33 11861.15 59019.83
I-26 (EB) 4,5,6 Ashley Phosphate Aviation 0.6607 1.1366 1.02 13548.45 22178.82 85292.16
I-26 (WB) Aviation Ashley Phosphate 1.0702 0.8252 0.96 20458.5 16578.63 80069.79
I-26 (EB) 5,6 Aviation Remount 0.7245 1.1667 1.08 14693.72 22771.31 90629.29
I-26 (WB) Remount Aviation 1.0281 0.8548 0.96 19411.4 16637.39 79942.45
I-26 (EB) 5,6 Remount I-526 0.5992 0.9686 0.88 15125.89 23518.47 92369.89
I-26 (WB) I-526 Remount 0.8676 0.725 0.8 20413.19 17568.07 83993.34
I-26 (EB) 5 I-526 Montague 0.5874 0.9912 0.83 8541.43 13784.67 51866.54
I-26 (WB) Montague I-526 0.9779 0.7977 0.83 13361.4 11323.25 52308.76
I-26 (EB) 5,6 Montague Dorchester 0.6849 0.9096 0.79 9746.33 12734.01 49462.16
I-26 (WB) Dorchester Montague 0.8623 0.8728 0.82 12001.8 12381.84 51652.98
I-26 (EB) 6 Dorchester Cosgrove 0.665 0.877 0.76 9490.44 12312.08 47617.07
I-26 (WB) Cosgrove Dorchester 0.8319 0.8499 0.77 11498.08 11930.15 48493.34
I-26 (EB) 6,7 Cosgrove Meeting St Ex 0.7273 0.9732 0.87 9850.77 12915.89 51232.13
I-26 (WB) Meeting St Ex Cosgrove 0.8691 0.8544 0.79 11222.99 11252.32 46408.53
I-26 (EB) 7 Meeting St Ex Morrison Dr Ex 0.9193 1.1621 1.04 11018.37 13835.57 54788.27
I-26 (WB) Morrison Dr Ex Meeting St Ex 1.0042 1.0069 0.96 11768.18 11989.37 50314.74
I-26 (EB) 7 Morrison Drive Ex US 17 0.7071 0.8595 0.8 8547.55 10369.95 42327.66
I-26 (WB) US 17 Morrison Drive Ex 0.7544 0.7885 0.77 9010.77 9540.22 40481.25
CorridorDaily Total
FlowSub Area
Segment AM Peak
VOC
PM Peak
VOCDaily VOC
AM Peak
Flow
PM Peak
Flow

I-26 Fixed Guideway Alternatives Analysis Davis & Floyd, Inc. Existing Conditions February 2016 Appendix 1-E: Traffic V/C and Flow Tables Page 5
Table 4: V/C and Traffic Flow Data – SUB AREA 1 (2035)
From To
College Park Road (S-62) I-26 Wimberly 1.2449 1.5043 1.11 8876.68 10745.95 40697.42
Wimbley US 78 1.2333 1.4906 1.1 8825.37 10668.42 40430.81
US 78 Ladson 1.5663 1.618 1.39 5197.51 5738.18 23514.12
Old Trolley Road (S-199) Bacons Bridge Miles Jamison 0.8964 1.0206 0.8 6840.48 7763.01 29384.41
Miles Jamison Summercourt 0.8277 0.9516 0.76 6293.25 7279.48 27694.13
Summercourt Crestview 0.9344 1.1314 0.88 7251.12 8437.6 32128.72
Crestview Savannah 1.0556 1.2186 0.82 7043.23 8209.81 30192.07
Savannah Round Midland 1.1159 1.2407 0.8 6979.75 8051.08 29449.18
Midland Travelers 0.5347 0.5898 0.47 3716.47 4232.04 17063.93
Travelers Dorchester 0.6054 0.6718 0.55 4317.53 4927.51 19956.31
SC 642 (Dorchester Road) Bacons Bridge Shady 0.8672 0.979 0.84 8135.67 9538.13 39239.89
Shady Old Trolley 0.9316 1.0082 0.82 7937.33 9299.89 38206.82
Old Trolley Ladson 1.5383 1.6527 1.33 10781.8 12408.52 50732.48
Ladson Road (S-230/S-76) US 78 College Park 1.14 1.1516 1.04 7463.16 8752.62 36626.69
College Park Lincolnville 1.7596 1.8818 1.71 12660.68 14490.8 60140.81
Lincolnville Hamburg 1.7326 1.9239 1.68 12810.71 14553.65 59104.66
Hamburg Palmetto Commerce1.6395 1.7339 1.5 11570.9 13047.8 52629.21
Palmetto Commerce Jamison Road 2.1548 2.2184 1.46 11750 13521.41 51369.83
Jamison Limehouse 1.7417 1.8342 1.19 8880.46 10331.24 38734.67
Limehouse Summer 1.6435 1.7478 1.09 8290.69 9747.61 35183.77
Summer Oakmont 1.4041 1.5525 1 4772.07 9062.56 32489.53
Oakmont Midland 1.3077 1.4712 0.97 7429.04 8814.02 31581.4
Midland Dorchester 0.6477 0.6836 0.52 3780.8 4354.41 17003.53
US 78 Maple Bryan 1.0605 1.3432 1.22 4250.27 5114.29 22203.62
Bryan Palmetto 0.9635 1.1718 1.14 3813.17 4530.97 20122.23
Palmetto Cedar 1.0009 1.1278 1.21 4037.62 4535.96 21469.72
Cedar US 17A 0.9965 1.213 1.13 3806.17 4466.1 19927.98
US 17A Gum 0.4081 0.4247 0.49 1469.58 1722.4 8689.25
Gum Berlin G. Myers 0.4463 0.4823 0.52 1543.28 1842.79 9150.11
Daily Total
Flow
AM Peak
Flow
PM Peak
FlowCorridor
Segment AM Peak
VOC
PM Peak
VOCDaily VOC

I-26 Fixed Guideway Alternatives Analysis Davis & Floyd, Inc. Existing Conditions February 2016 Appendix 1-E: Traffic V/C and Flow Tables Page 6
Table 4 continued
From To
Berlin G. Myers South Pointe 0.7116 0.8376 0.67 2612.33 3160.21 11821.15
South Pointe Bellwright 0.6832 0.8193 0.66 2582.26 3131.02 11602.97
Bellwright Von Ohsen 0.9311 1.0786 0.83 3222.91 3865.09 14599.34
Von Ohsen Heaton 0.921 0.9889 0.76 2887.75 3336.57 13531.64
Heaton Perimeter 1.1436 1.2043 0.97 4010.9 4482.78 18030.89
Perimeter College Park 0.5286 0.5598 0.45 4043.65 4522.73 18181.54
College Park Ladson 0.5238 0.7115 0.51 3868.22 5182.95 20618.8
Daily Total
Flow
AM Peak
Flow
PM Peak
FlowCorridor
Segment AM Peak
VOC
PM Peak
VOCDaily VOC

I-26 Fixed Guideway Alternatives Analysis Davis & Floyd, Inc. Existing Conditions February 2016 Appendix 1-E: Traffic V/C and Flow Tables Page 7
Table 5: V/C and Traffic Flow Data – SUB AREA 2 (2035)
From To
US 17 Alternate Varns US 176 0.6935 0.8058 0.62 5447.56 6487.72 24313.44
US 176 Myers 0.6347 0.7351 0.6 4760.89 5792.25 22811.22
Myers College Park 1.0907 1.2379 0.97 7976 9597.17 36980.55
College Park Royle 0.8278 0.9974 0.68 5908.48 7333.06 25803.49
Royle Beauregard 0.8048 0.9283 0.63 5454.78 6720.12 23912.08
Beauregard Farmington 0.9701 1.2065 0.78 6667.72 8236.96 29877.5
Farmington I-26 Ramp 0.9863 1.2701 0.84 6842.36 8919.05 32017.23
College Park Road (S-62) US 17A Remi 0.9757 0.9675 1.01 3071.08 3271.34 15362.13
Remi Crowfield 2.0456 1.9501 1.67 5249.57 5660.27 25359.3
Crowfield George McCrackin 1.2966 1.3289 1.11 8638 9567.93 40481.07
George McCrakin Gailmoor 1.6386 1.683 1.3 10265.91 11341.87 47546
Gailmoor I-26 1.8023 1.8651 1.44 11395.28 7369.66 52892.7
US 176 (State Road/St. James) Alexander US 17A 1.5582 1.5642 1.1 4900.52 5671.63 22466.16
US 17A Myers 0.8398 0.8584 0.56 4802 5566.08 20654.64
Myers Devon 1.0893 1.1164 0.74 6272.5 7288.07 27038.62
Devon Road Davenport 1.3957 1.4099 0.9 7641.8 8837.51 32993.55
Davenport Vixen 1.1986 1.2282 0.75 6517.15 7673.6 27464.62
Vixen Cherry Hill 1.3818 1.4535 0.97 8010.09 9573.97 35394.08
Cherry Hill Old Moncks Corner 1.3907 1.4183 0.96 8080.3 9372.64 34972.54
Crowfield Boulevard (S-1093) College Park Centennial 1.2111 1.3914 1.13 3939.19 4504.53 17718.96
Centennial Bridgecreek 0.7858 0.8923 0.68 2416.94 2805.38 10716.6
Bridgecreek US 176/St. James 0.477 0.5085 0.37 3542.6 3894.47 14933.82
AM Peak
Flow
PM Peak
Flow
Daily Total
FlowCorridor
Segment AM Peak
VOC
PM Peak
VOCDaily VOC

I-26 Fixed Guideway Alternatives Analysis Davis & Floyd, Inc. Existing Conditions February 2016 Appendix 1-E: Traffic V/C and Flow Tables Page 8
Table 6: V/C and Traffic Flow Data – SUB AREA 3 (2035)
From To
Palmetto Commerce Parkway Ladson Carolina Commerce 1.1615 1.2597 0.64 7443.21 8911.63 28925.97
Carolina Commerce Patriots 1.1339 1.2624 0.64 7409.19 9024.34 29002.69
Patriots Link (1) 1.0921 1.2572 0.62 7066.62 8684.15 28161.59
Link (1) Link (2) 0.7943 0.9714 0.44 5377.16 6828.92 19813.77
Link (2) Ashley Phosphate 0.8339 1.0079 0.42 5510.93 6993.46 19118.4
Patriot Boulevard Palmetto Commerce Link 1.5857 1.759 1.39 4562.11 4947.48 19163.72
Link Meeting Oaks 1.2168 1.103 0.78 3680.97 4291.24 16136.16
Meeting Oaks Westcott 0.6967 0.7316 0.62 2586.96 2778.33 12788.81
Westcott Sunshine 1.0649 1.2317 0.71 3551.51 3896.84 14311.05
Sunshine Appian 0.5813 0.7016 0.35 1742.52 2068.88 6975.25
Appian Ashley Phosphate 1.284 1.2921 0.84 5647.71 6490.24 24752.88
Ashley Phosphate Dorchester 0.5201 0.5693 0.36 2373.55 2827.6 10458.01
US 78 Ladson Koa 1.4792 1.5476 1.38 10983.37 12550.9 55512.66
Koa Shipley 1.0364 1.058 1.02 7914.65 8874.5 40970.87
Shipley I-26 1.3343 1.4325 1.4 11225.62 12739.37 55954.2
SC 642 (Dorchester Road) Ladson Parlor/Old Fort Ext 1.25 1.3469 1.15 9172.96 10356.77 43774.15
Parlor/Old Fort Ext Beacon Hill 1.1653 1.2494 1.06 8497.09 9556.89 40648.37
Beacon Hill Wescott 0.9982 1.0702 0.91 8497.09 9556.89 40648.37
Wescott Kensington 0.9571 1.0493 0.95 8630.37 9725.54 42269.28
Kensington Appian Way 1.1097 1.1427 0.95 8772.25 9743.79 42399.13
Appian Way Ashley Phosphate 1.0485 1.045 0.86 8000.84 8710.38 38212.04
Ashley Phosphate Indigo Fields 1.0647 1.0792 0.87 8453.85 9450.94 38698
Indigo Fields Patriot 0.9157 0.9293 0.73 6766.17 7784.11 32542.08
Patriot Ruff 1.202 1.2589 0.95 8934.59 10432.19 42287.78
AM Peak
Flow
PM Peak
Flow
Daily Total
FlowCorridor
Segment AM Peak
VOC
PM Peak
VOCDaily VOC

I-26 Fixed Guideway Alternatives Analysis Davis & Floyd, Inc. Existing Conditions February 2016 Appendix 1-E: Traffic V/C and Flow Tables Page 9
Table 6 continued
From To
Ladson Road (S-230/S-76) US 78 College Park 1.14 1.1516 1.04 7463.16 8752.62 36626.69
College Park Lincolnville 1.7596 1.8818 1.71 12660.68 14490.8 60140.81
Lincolnville Hamburg 1.7326 1.9239 1.68 12810.71 14553.65 59104.66
Hamburg Palmetto Commerce 1.6395 1.7339 1.5 11570.9 13047.8 52629.21
Palmetto Commerce Jamison 2.1548 2.2184 1.46 11750 13521.41 51369.83
Jamison Limehouse 1.7417 1.8342 1.19 8880.46 10331.24 38734.67
Limehouse Summer 1.6435 1.7478 1.09 8290.69 9747.61 35183.77
Summer Oakmont 1.4041 1.5525 1 4772.07 9062.56 32489.53
Oakmont Midland 1.3077 1.4712 0.97 7429.04 8814.02 31581.4
Midland Dorchester 0.6477 0.6836 0.52 3780.8 4354.41 17003.53
Ashley Phosphate Road (S-75) Dorchester Patriot 0.4081 0.4582 0.36 4599.49 5087.82 20797.39
Patriot Tanglewood 0.7476 0.7719 0.58 7272.25 8092.98 33135.17
Tanglewood Windsor Hill 0.7719 0.8173 0.64 7921.38 8907.38 36467.71
Windsor Hill Hunters Ridge 0.8775 0.9135 0.69 8489.06 9522.71 39398.57
Hunters Ridge Peppermill 0.8775 0.9135 0.69 8489.06 9522.71 39398.57
Peppermill Cross County 1.0153 1.0543 0.82 9745.73 11017.17 47065.76
Cross County Palmetto Commerce 1.052 1.1432 1.03 12051.4 13547.69 58947.84
Palmetto Commerce Stall 1.5162 1.7356 1.25 15313.84 18183.64 71733.78
Stall I-26 1.3493 1.5697 1.32 14912.69 17249 75453.76
AM Peak
Flow
PM Peak
Flow
Daily Total
FlowCorridor
Segment AM Peak
VOC
PM Peak
VOCDaily VOC

I-26 Fixed Guideway Alternatives Analysis Davis & Floyd, Inc. Existing Conditions February 2016 Appendix 1-E: Traffic V/C and Flow Tables Page 10
Table 7: V/C and Traffic Flow Data – SUB AREA 4 (2035)
From To
North Rhett Avenue/Henry E
Brown Jr Boulevard (S-60/S-136) Williams Tanner Ford 1.3609 1.4342 0.95 9614.34 11369.9 42733.27
Tanner Ford Yeamans Hall 1.9021 1.9176 1.21 12627.87 14524.16 54737.39
US 52 US 176 Rivers 1.5268 1.4535 1.26 10776.08 11915.83 52389.36
US 78 I-26 Elms Plantation 1.1243 1.3342 1.21 9846.54 11673.34 48699.75
Elms Plantation Elms Center 1.1291 1.2614 1.12 9278.48 10723.53 45014.48
Elms Center Fernwood 0.8817 0.9599 0.84 7160.94 8191.88 33511.65
Fernwood NAD 0.8882 1.0229 0.84 7484 8684.96 33817.7
NAD Rivers 0.6322 0.3609 0.36 1560.5 918.41 4360.48
US 52/US 78/Rivers Ave NAD US 78 1.2539 0.8544 0.47 8350.82 5950.87 29406.01
US 78 Otranto 1.4966 1.5546 1.1 14583.19 17296.59 68515.02
Otranto Link 1.6638 1.7204 1.26 16440.8 19300.95 78928.37
Link Greenridge 1.6638 1.0928 1.25 11102.25 7673.5 39097.25
Greenridge US 52 Conn. 1.5989 1.1178 1.24 11439.65 8369.24 41579.28
US 52 Conn. Eagle Landing 0.996 1.1511 0.7 94.68.07 10880.91 43739.53
Eagle Landing Easy 0.9001 1.2255 0.89 10675.34 13780.77 55841.04
Easy Ashley Phosphate 0.9071 1.267 0.96 11465.91 14851.28 60191.82
Ashley Phosphate Hayne 1.0027 1.0332 0.72 10066.72 12260.74 46102.06
Hayne Midland Park 0.8574 0.9406 0.68 9523.4 11728.51 43818.61
Midland Park Tipson 0.8812 0.929 0.68 9423.56 11452.56 43632.06
Tipson Eagle 0.874 0.9241 0.68 9421.05 11461.34 43547.02
Eagle Hanahan 0.973 1.0418 0.74 10316.46 12657.87 47298.75
US 176 (St. James Avenue) Old Moncks Corner Central 1.0846 1.0988 0.73 9413.86 10740.2 40316.57
Central Liberty Hill 1.2678 1.2981 0.9 11179.57 12906.79 49180.91
Liberty Hill US 52 1.2506 1.2611 0.85 10627.91 12268.68 46845.35
AM Peak
Flow
PM Peak
Flow
Daily Total
FlowCorridor
Segment AM Peak
VOC
PM Peak
VOCDaily VOC

I-26 Fixed Guideway Alternatives Analysis Davis & Floyd, Inc. Existing Conditions February 2016 Appendix 1-E: Traffic V/C and Flow Tables Page 11
Table 7 continued
From To
Red Bank Road (S-37/S-29) US 52 Middleton 1.3184 1.4716 0.8 7223.77 8901.22 29208.96
Middleton Old Black River 1.2809 1.4383 0.78 7080.02 8758.06 28680.92
Old Black River Howe Hall 0.8726 0.9213 0.59 5052.09 6007.86 21657.18
Howe Hall Snake 0.7177 0.8074 0.59 7809.05 9263.57 34016.48
Snake Harbour Lake 0.7679 0.8182 0.61 8136.7 9482.14 34759.74
N.A.D. Road/Goose Creek
Road/Old State Road (S-29) US 78 US 52 0.8613 0.8597 0.72 5586.21 6226.89 25569.4
US 52 Snake 1.2812 1.4458 0.89 7178.84 8706.58 31630.53
Snake US 176 1.0547 1.1853 0.65 5651.7 692465 23172.03
Ashley Phosphate Road (S-75) I-26 Northwoods 1.3404 1.5429 1.16 13745.65 16340.42 66781.65
Northwoods Rivers Avenue 1.1867 1.0076 0.83 10106.94 11426.28 47799.29
AM Peak
Flow
PM Peak
Flow
Daily Total
FlowCorridor
Segment AM Peak
VOC
PM Peak
VOCDaily VOC

I-26 Fixed Guideway Alternatives Analysis Davis & Floyd, Inc. Existing Conditions February 2016 Appendix 1-E: Traffic V/C and Flow Tables Page 12
Table 8: V/C and Traffic Flow Data – SUB AREA 5 (2035)
From To
Ashley Phosphate Road (S-75) Dorchester Patriot 0.4081 0.4582 0.36 4599.49 5087.82 20797.39
Patriot Tanglewood 0.7476 0.7719 0.58 7272.25 8092.98 33135.17
Tanglewood Windsor Hill 0.7719 0.8173 0.64 7921.38 8907.38 36467.71
Windsor Hill Hunters Ridge 0.8775 0.9135 0.69 8489.06 9522.71 39398.57
Hunters Ridge Peppermill 0.8775 0.9135 0.69 8489.06 9522.71 39398.57
Peppermill Cross County 1.0153 1.0543 0.82 9745.73 11017.17 47065.76
Cross County Palmetto Commerce 1.052 1.1432 1.03 12051.4 13547.69 58947.84
Palmetto Commerce Stall 1.5162 1.7356 1.25 15313.84 18183.64 71733.78
Stall I-26 1.3493 1.5697 1.32 14912.69 17249 75453.76
S. Aviation Avenue (S-1342) Midland Park Alston 1.1455 1.2249 0.79 2357.72 2877.48 10397.58
Alston Aviation 0.8654 0.9479 0.57 2049.11 2568.93 7584.54
Aviation I-26 0.2782 0.366 0.18 1939.68 3497.25 7273.89
Aviation Remount 0.6772 0.8905 0.26 1275.44 1394.3 3407.7
Remount Link 0.9279 1.0538 0.65 2210.51 2633.8 8640.34
Link Airframe 0.8491 0.94 0.38 1441.19 1733.12 5046.12
Airframe International 0.4245 0.47 0.19 1441.19 1733.12 5046.12
West Montague Avenue (S-62) I-26 Thomasina Gilliard 1.4892 2.3429 1.34 9942.73 13907.24 48956.24
Thomasina Gilliard International 1.1608 1.3663 0.91 7678.19 9205.27 33205.12
International Calvin 0.5365 0.5142 0.37 3496.24 3844.92 13470.8
Calvin I-26 1.027 1.0162 0.69 5790.73 7019.17 25361.96
I-26 Seiberling 0.7059 0.6705 0.39 3564.18 4097.69 14113.54
Seiberling Dorchester 0.7234 0.6692 0.37 3527.42 4001.07 13632.19
East Montague Avenue (S-62) I-26 Mall Dr 0.672 0.9904 0.6 5708.22 7465.04 26018.29
Mall Dr Rich 0.659 0.8427 0.4 4040.12 5464.16 17055.08
Azalea Drive (S-894) Leeds Industrial 0.7965 0.885 0.67 3807.66 4910.84 18279.37
Industrial Rourk 0.8674 0.9497 0.66 3967.59 5104.2 18084
Rourk Woodlawn 0.9135 0.9561 0.67 4051.73 5167.18 18336.96
Woodlawn I-26 0.8999 0.9566 0.72 4258.1 5308.18 19614.37
AM Peak
Flow
PM Peak
Flow
Daily Total
FlowCorridor
Segment AM Peak
VOC
PM Peak
VOCDaily VOC

I-26 Fixed Guideway Alternatives Analysis Davis & Floyd, Inc. Existing Conditions February 2016 Appendix 1-E: Traffic V/C and Flow Tables Page 13
Table 8 continued
From To
Cross County Road (S-2028) Ashley Phosphate Capital 2.0613 2.1539 1.65 4571.23 5367.71 22851.99
Capital Dorchester 1.3707 1.4372 1.01 3022.53 3562.35 14025.24
SC 642 (Dorchester Road) Ruff Cross County 1.4957 1.5341 1.11 8997.1 10476.14 42474.51
Cross County Maryland 1.4181 1.5485 1.19 9506.41 11392.19 45640.59
Maryland Hill Blvd 1.4464 1.5758 1.2 9548.75 11459.67 45873.49
Hill Blvd Whitwil 1.3045 1.4267 1.11 8807.02 10488.79 42386.8
Whitwil Link 1.2624 1.3685 1.02 9572 11400.59 45567.48
Link Michaux 1.3101 1.4129 1.04 9828.34 11691.04 46570.73
Michaux Andrews 0.9936 1.111 0.8 6671.04 8165.59 30705.92
Andrews Gwinnett 1.096 1.197 0.82 6983.76 8499.98 31315.94
Gwinnett W. Montague 1.0053 1.0892 0.74 6412.01 7797.61 28237.82
W. Montague Larchmont 0.9562 1.0698 0.74 6251.06 7762.83 28223.17
Larchmont W. Montague 1.2469 1.3435 0.9 7672.86 9354.51 34450.19
W. Montague I-526 0.8652 1.0123 0.75 6092.17 7465.22 28735.86
I-526 Paramount 0.8595 1.0472 0.7 5768.97 7207.46 24708.04
Paramount Oscar Johnson 0.9145 1.1033 0.73 6048.83 7540.65 26004.09
Oscar Johnson Leeds 0.8562 1.0451 0.69 5771.62 7214.08 24610.25
Leeds Industrial 0.3523 0.4167 0.33 2610.52 2978.19 11824.07
Industrial Ranger 0.3949 0.462 0.36 2858.05 3240.9 12741.25
Ranger Bonds 0.4387 0.5255 0.38 3069.94 3496.03 13439.83
Bonds Madden 0.4719 0.5684 0.43 3453.2 3934.87 15118.95
Madden Woodlawn 0.4382 0.5467 0.41 3302.9 3788.41 14534.44
Woodlawn I-26 0.5402 0.6371 0.5 3970.65 4516.2 17560.25
I-26 Ramp 0.8417 1.0931 0.82 3021.66 3662.32 14583.36
Ramp Kent 0.6493 0.7815 0.72 2541.77 2915.65 12804.96
AM Peak
Flow
PM Peak
Flow
Daily Total
FlowCorridor
Segment AM Peak
VOC
PM Peak
VOCDaily VOC

I-26 Fixed Guideway Alternatives Analysis Davis & Floyd, Inc. Existing Conditions February 2016 Appendix 1-E: Traffic V/C and Flow Tables Page 14
Table 9: V/C and Traffic Flow Data – SUB AREA 6 (2035)
From To
SC 7 (Cosgrove Avenue) Spruill Osceola 0.5019 0.6859 0.54 4915.81 5889.25 24264.72
Osceola Rivers 0.5255 0.7224 0.59 5242.78 6313.45 26114.75
Rivers Commanche 0.5515 0.6174 0.61 5311.57 5800.22 27178.2
Commanche King 0.5895 0.6338 0.64 5548.92 6039.42 28416.58
King Accabee 0.669 0.7689 0.65 5961.31 7130.72 28868.42
Accabee Azalea 0.6125 0.7051 0.61 5490.82 6581.33 27008.66
North Rhett Avenue (S-60/S-136) Yeamans Hall Bankton 1.6452 1.6791 1.06 10941.26 12641.21 47755.66
Bankton Commerce 2.1899 2.235 1.41 10941.26 12641.21 47755.66
Commerce Remount 2.372 2.4235 1.56 12103.65 14016.81 52810.22
Remount Sumner 2.128 2.2515 1.62 12970.4 15122.05 59198.67
Sumner I-526 2.1678 2.312 1.64 13273.24 15583.31 60002.29
I-526 Braddock 1.223 1.3905 0.8 7110.08 8662.61 29473.87
Braddock North 0.8917 0.9762 0.63 5242.56 6346.37 22916.07
North Park Circle 0.8796 0.9474 0.61 5056.58 6209.86 22151.53
Park Circle Chesterfield 0.5536 0.4899 0.26 971.76 1099.14 3602.48
Chesterfield Bexley 0.5709 0.4534 0.23 943.19 1006.29 3144.43
Bexley Helm 0.2074 0.3137 0.19 525.09 727.3 2642.31
Virginia Avenue (S-58) Remount Mill 0.10681 1.1063 0.84 2864.7 3281 12395.84
Mill I-526 0.7721 0.8713 0.75 2504.49 2940.18 11040.35
I-526 E. Montague 0.3988 0.4436 0.4 2613.92 3038.49 11658.73
E. Montague Avenue C 0.4118 0.4926 0.41 2697.28 3238.07 12000.23
US 78 (King Street Ex) Carner/Rivers Azalea 0.3293 0.472 0.21 934.99 1269.16 3536.28
Azalea Hackermann 0.7161 0.8801 0.56 2286.61 2758.19 9528.94
Hackemann Summerville 0.675 0.8387 0.54 2210.41 2660.67 9138.36
US 52 (Carner Avenue) Rivers Clements 0.4271 0.4134 0.14 801.99 1403.35 2524.8
Clements Meeting 0.4156 0.4015 0.14 778.21 1376.34 2457.13
AM Peak
Flow
PM Peak
Flow
Daily Total
FlowCorridor
Segment AM Peak
VOC
PM Peak
VOCDaily VOC

I-26 Fixed Guideway Alternatives Analysis Davis & Floyd, Inc. Existing Conditions February 2016 Appendix 1-E: Traffic V/C and Flow Tables Page 15
Table 9 continued
From To
Spruill Avenue (S-32) E. Montague Buist 0.2467 0.6041 0.18 1553.15 2340.26 6106.13
Buist Bexley 0.6008 0.9293 0.5 4002.33 5359.18 18445.35
Bexley McMillan 0.84 1.0329 0.66 5648.55 6929.76 24231.02
McMillan Cosgrove 1.0725 1.3637 0.85 6601.6 8269.98 28927.9
Cosgrove Reynolds 0.7309 0.7349 0.47 4050.98 4476.87 15853.88
Reynolds Baxter 0.4905 0.4869 0.28 2967.9 3418.84 10760.69
Baxter Norwood 0.9403 0.6645 0.44 4290.45 4955.68 16949.57
Norwood Viaduct 0.6244 0.6473 0.42 4091.39 4744.38 15986.4
Viaduct Stromboli 0.6972 0.7337 0.49 4360.91 5068.05 17166.3
Stromboli Riverview 0.6746 0.7226 0.49 4358.57 5004.38 17321.67
US 52/US 78/Rivers Hanahan Aichele 1.0305 1.0867 0.72 10312.29 12719.1 46011.15
Aichele Aviation 1.0696 1.1406 0.78 11130.08 13667.1 50181.41
Aviation Gumwood 0.8127 0.9494 0.55 8641.55 .10819.26 34954.54
Gumwood Remount 0.7971 0.9332 0.55 8768.45 10912.97 35303.76
Remount Sabal 0.8478 0.7954 0.58 8606.02 10614.05 36918.7
Sabal I-526 0.8437 0.804 0.59 8789.41 10932.18 37913.57
I-526 Mall Dr 0.4775 0.5912 0.3 4727.14 6432.92 20230.33
Mall Dr E. Montague 0.3629 0.5063 0.25 3829.17 5431.72 16665.64
E. Montague Piggly Wiggly 0.2661 0.3477 0.21 3189.78 4308.74 14277.22
Piggly Wiggly Durant 0.3387 0.4696 0.28 2839.66 3931.89 12446.36
Durant Columbia 0.3623 0.4409 0.25 2477.34 3210.64 9576.48
Columbia Helm 0.3598 0.4369 0.24 2388.35 3108.32 9106.17
Helm Whipper Barony 0.3725 0.4719 0.24 2361.68 3182.18 9106.71
Whipper Barony McMillan 0.3175 0.4035 0.18 1947.59 2734.57 7058.83
McMillan Commander 0.3597 0.4096 0.22 2113.85 2841.79 8453.81
Commander Cosgrove 0.3761 0.3943 0.23 2332.91 2960.09 8704.25
Cosgrove Reynolds 0.3184 0.3857 0.13 1499.14 2453.02 5110.84
Reynolds Carner 0.3266 0.3875 0.14 1553.51 0.3875 5404.28
Carner Meeting 0.1288 0.1961 0.08 751.52 1077.14 2879.47
AM Peak
Flow
PM Peak
Flow
Daily Total
FlowCorridor
Segment AM Peak
VOC
PM Peak
VOCDaily VOC

I-26 Fixed Guideway Alternatives Analysis Davis & Floyd, Inc. Existing Conditions February 2016 Appendix 1-E: Traffic V/C and Flow Tables Page 16
Table 9 continued
From To
US 52 (Meeting Street) Rivers Macon 0.3798 0.4652 0.23 791.52 1141.06 3123.47
Macon Helm 0.2427 0.3134 0.11 478.47 757.88 1549.59
Helm McMillan 0.3077 0.4283 0.24 800.14 1100.81 3242.83
McMillan Dorchester 0.3074 0.4276 0.24 799.16 1098.95 3236.38
Dorchester Cosgrove 0.7336 0.7992 0.86 2251.38 2459.06 11674.88
Cosgrove Reynolds 0.4051 0.4172 0.3 888.09 1245.17 4128.82
Reynolds King 0.3468 0.3593 0.25 784.7 1028.54 3351.11
King Carner 0.2276 0.2263 0.15 487.45 613.98 2090.65
SC 642 (Dorchester Road) Kent Meeting 0.6058 0.7072 0.66 2340.99 2655.97 11686.18
Meeting Admiral 0.2518 0.3361 0.2 829.15 1158.67 3584
Admiral Rivers 0.1821 0.3474 0.13 590.85 1027.95 2279.93
Aviation Avenue (S-1342) I-26 Rivers 0.9238 1.1657 0.79 6042.59 8781.34 31656.18
Remount Road (S-13) Aviation Ave Core Rd 0.4795 0.7067 0.47 1924.29 2251.95 8234.82
Core I-26 Ramp 0.8559 0.9106 0.74 2894.84 3405.98 13106.32
I-26 Ramp I-26 0.7713 0.9569 0.89 4828.33 5644.21 24196.06
I-26 Rivers 1.2231 1.4288 1.39 7259.88 7941.43 37733.68
Rivers Craig Rd 0.9872 1.0851 0.98 7722.41 8678.29 37345.76
Craig Yeamans Hall 0.9689 1.0525 0.94 7496.81 8430.14 36040.88
Yeamans Hall Dickson 0.5458 0.6201 0.58 4615.78 5252.99 22307.31
Dickson Attaway 0.496 0.5588 0.52 4156.06 4766.7 19827.74
Attaway Buskirk 0.5136 0.6101 0.51 4179.6 4902.43 19462.52
Buskirk Murray 0.4412 0.5065 0.45 3627.22 4264.98 17044.32
Murray Rhett 0.5654 0.6223 0.51 4224.63 4931.52 19329.85
Rhett Perimeter 0.9098 0.9141 0.73 6095.63 6826.35 28041.88
Perimeter Virginia 0.8262 0.8295 0.72 5796.92 6419.42 27491.69
AM Peak
Flow
PM Peak
Flow
Daily Total
FlowCorridor
Segment AM Peak
VOC
PM Peak
VOCDaily VOC

I-26 Fixed Guideway Alternatives Analysis Davis & Floyd, Inc. Existing Conditions February 2016 Appendix 1-E: Traffic V/C and Flow Tables Page 17
Table 9 continued
From To
East Montague Avenue (S-62) Rich Piedmont 0.659 0.8427 0.4 4040.12 5464.16 17055.08
Piedmont Hassell 0.5979 0.6712 0.39 3450.62 4180.23 14316.57
Hassell Mixson 0.5481 0.623 0.32 2889.29 3724.04 11775.78
Mixson Churchhill 0.3337 0.2121 0.17 1631.95 1574.47 6205.2
Churchhill Park Circle 0.3102 0.2035 0.15 1497.39 1427.15 5571.01
Park Circle Spruill 0.3926 0.9178 0.3 122.86 2309.87 6550.7
Spruill Jenkins 0.3757 0.1623 0.14 1208.13 762.27 0.14
McMillan Avenue (S-48) Meeting Rivers 0.0003 0.0004 0 0.98 1.86 6.45
Rivers Spruill 0.0755 0.1574 0.06 539.18 995.02 2246.07
Spruill Avenue E 0.169 0.2351 0.13 984.22 1416.83 4526.29
Avenue E Noisette 0.1338 0.1429 0.11 833.23 1040.38 3798.88
Reynolds Avenue (S-31) Meeting Rivers 0.0097 0.1263 0.02 28 256.32 320.58
Rivers Spruill 0.0392 0.1855 0.06 103.75 320.08 745.66
Spruill Hobson 0.3871 0.4256 0.33 899.09 1049.59 4478.68
Naval Base Road/Viaduct Road (S-86)Spruill Hobson 0.0867 0.1118 0.08 548.39 784.03 2765.48
Azalea Drive (S-894) Rourk Woodlawn 0.9135 0.9561 0.67 4051.73 5167.18 18336.96
Woodlawn I-26 0.8999 0.9566 0.72 4258.1 5308.18 19614.37
I-26 Kent 0.8999 0.9566 0.72 4258.1 5308.18 19614.37
Kent Cosgrove 0.9224 0.9787 0.74 4408.98 5486.69 20002.18
Cosgrove Meridian 0.3734 0.4044 0.34 1949.9 2248.32 9363.31
Meridian Elegans 0.7468 0.8087 0.69 1949.9 2248.32 9363.31
Elegans Baker Hospital 0.7227 0.794 0.65 1885.42 2185.65 8896.7
Baker Hospital King 0.5296 0.6535 0.51 1486.16 1885.44 6972.41
AM Peak
Flow
PM Peak
Flow
Daily Total
FlowCorridor
Segment AM Peak
VOC
PM Peak
VOCDaily VOC

I-26 Fixed Guideway Alternatives Analysis Davis & Floyd, Inc. Existing Conditions February 2016 Appendix 1-E: Traffic V/C and Flow Tables Page 18
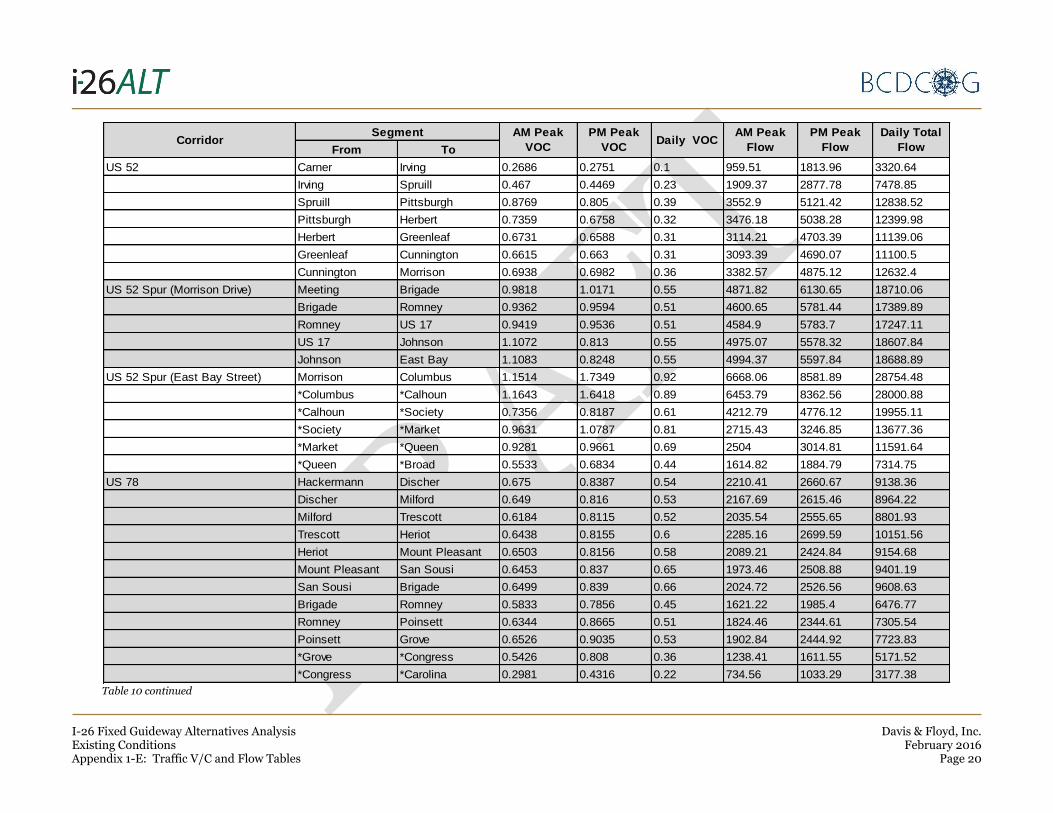
Table 10: V/C and Traffic Flow Data – SUB AREA 7 (2035)
From To
Spruill Avenue (S-32) Riverview Groveland 0.6746 0.7226 0.49 4358.57 5004.38 17321.67
Groveland Irving 0.6918 0.7436 0.51 4493.29 5161.88 17943.4
Irving Meeting 0.3913 0.3443 0.16 1733.02 2341.44 5783.98
Meeting Street (S-107) Morrison Brigade 0.4419 0.5794 0.41 1497.55 1995.2 6892.3
Brigade Romney 0.3478 0.4934 0.23 791.44 1123.43 3788.05
Romney *US 17 0.5463 0.6536 0.4 1444.75 1934.25 7105.98
US 17 Hager 1.1471 1.7434 1.09 4125.89 5124.38 19249.57
Hager Harris 0.8256 1.3055 0.68 2384.69 3285.11 11987.68
Harris *Sheppard 0.8175 1.2928 0.67 2263.3 3166.23 11826.85
*Sheppard *Spring 1.4659 1.1837 0.99 7029.22 7036.95 32382.76
*Spring *Mary 1.0922 0.9029 0.88 5754.5 6297.42 28818.82
*Mary *Calhoun 1.1345 0.9229 0.89 5843.65 6746.15 29209.04
*Calhoun * Wentworth 0.9725 1.1909 0.84 5572.83 7228.15 28551.49
Wentworth Hayne 0.7932 1.1781 0.73 4946.64 6716.52 24640.03
Hayne *Broad 0.6097 0.9655 0.59 4024.15 5485.75 19845.66
King Street (S-104) *Carolina *Line 1.0487 1.187 0.64 1367.37 1664.68 5477.01
*Line *Spring 1.3173 1.0904 0.77 1533.97 1634.89 6587.06
Spring Cannon 0.8834 0.9444 0.67 1440.99 1491.05 5774.22
*Cannon *Mary 1.0197 0.8026 0.6 1211.84 1353.68 5108.25
*Mary * Calhoun 0.8392 0.701 0.51 1084.5 1220.31 4361.06
* Calhoun *Beaufain 0.7987 0.7838 0.45 811.52 818.82 3856.08
*Beaufain *Market 1.2698 0.9746 0.55 1164.82 923.27 4683.2
*Market *Queen 0.8128 0.929 0.47 776.04 888.83 4064.55
*Queen *Broad 0.3212 0.3967 0.32 2227.58 2816.74 10937.37
AM Peak
Flow
PM Peak
Flow
Daily Total
FlowCorridor
Segment AM Peak
VOC
PM Peak
VOCDaily VOC

I-26 Fixed Guideway Alternatives Analysis Davis & Floyd, Inc. Existing Conditions February 2016 Appendix 1-E: Traffic V/C and Flow Tables Page 19
Table 10 continued
From To
Rutledge Avenue (S-46) Heriot Mount Pleasant 0.5882 0.7611 0.45 1971.96 2404.03 7219.32
Mount Pleasant San Souci 0.4727 0.6747 0.37 1524.23 1980.36 5990.78
San Souci Cypress 0.4727 0.6747 0.37 1524.23 1980.36 5990.78
*Cypress *Grove 0.5063 0.8729 0.47 1710.59 2406.99 7587.14
Grove Cleavland 0.5743 0.8357 0.48 1833.33 2582.76 7686.31
*Cleavland *Sumter 0.6717 0.8471 0.59 2130.39 2622.51 9552.52
*Sumter *US 17 0.6991 0.9353 0.6 2258.07 2760.01 9684.39
*US 17 *Spring 1.3276 1.2128 0.65 1331.25 1248.6 5808
Spring Cannon 1.2335 0.9459 0.57 1237.19 997.87 5146.19
*Cannon *Radcliffe 1.6831 1.2477 0.7 1641.84 1270.03 6321.6
*Radcliffe *Calhoun 1.2604 1.1173 0.59 1240.32 1128.04 5292.37
*Calhoun *Beaufain 0.3606 0.4043 0.28 507.53 685.31 2555.34
Beaufain Queen 0.5088 0.5911 0.46 671.67 860.58 4140.69
*Queen *Broad 0.1173 0.5609 0.16 204.28 582.45 1467.01
Ashley Avenue (S-103) Moultrie *US 17 0.1121 0.2139 0.1 208.7 393.25 883.32
*US 17 Spring 1.0983 1.5342 0.87 1346.71 1814.16 7799.67
Spring Cannon 1.2158 1.7479 0.96 143.9 2031.57 8650.43
*Cannon *Calhoun 1.1355 1.7327 1.04 1522.19 2197.25 9533.45
*Calhoun *Beaufain 0.6778 0.6975 0.67 929.28 1209.23 5477.01
*Beaufain *Broad 0.3922 0.4316 0.34 497.93 686.77 2775.37
Lockwood Drive/Boulevard (S-1194) Barre Beaufain 1.288 0.9812 0.68 3025.64 3983.18 14709.15
Beaufain Wentworth 0.8985 1.0394 0.71 4234.55 5284.25 20566.37
Wentworth Calhoun 1.0701 1.0415 0.74 6264.26 7440.94 28441.64
Calhoun Bee 1.2803 1.4587 1.19 9493.53 11027.68 45344.39
Bee Cannon 1.2166 1.5493 1.09 8371.97 10868.18 41528.95
Cannon Spring 0.8403 1.1889 0.99 6966.59 9689.52 37966.59
Spring Fishburne 0.3756 0.5721 0.32 0.3756 0.5721 0.32
AM Peak
Flow
PM Peak
Flow
Daily Total
FlowCorridor
Segment AM Peak
VOC
PM Peak
VOCDaily VOC
I-26 Fixed Guideway Alternatives Analysis Davis & Floyd, Inc. Existing Conditions February 2016 Appendix 1-E: Traffic V/C and Flow Tables Page 20
Table 10 continued
From To
US 52 Carner Irving 0.2686 0.2751 0.1 959.51 1813.96 3320.64
Irving Spruill 0.467 0.4469 0.23 1909.37 2877.78 7478.85
Spruill Pittsburgh 0.8769 0.805 0.39 3552.9 5121.42 12838.52
Pittsburgh Herbert 0.7359 0.6758 0.32 3476.18 5038.28 12399.98
Herbert Greenleaf 0.6731 0.6588 0.31 3114.21 4703.39 11139.06
Greenleaf Cunnington 0.6615 0.663 0.31 3093.39 4690.07 11100.5
Cunnington Morrison 0.6938 0.6982 0.36 3382.57 4875.12 12632.4
US 52 Spur (Morrison Drive) Meeting Brigade 0.9818 1.0171 0.55 4871.82 6130.65 18710.06
Brigade Romney 0.9362 0.9594 0.51 4600.65 5781.44 17389.89
Romney US 17 0.9419 0.9536 0.51 4584.9 5783.7 17247.11
US 17 Johnson 1.1072 0.813 0.55 4975.07 5578.32 18607.84
Johnson East Bay 1.1083 0.8248 0.55 4994.37 5597.84 18688.89
US 52 Spur (East Bay Street) Morrison Columbus 1.1514 1.7349 0.92 6668.06 8581.89 28754.48
*Columbus *Calhoun 1.1643 1.6418 0.89 6453.79 8362.56 28000.88
*Calhoun *Society 0.7356 0.8187 0.61 4212.79 4776.12 19955.11
*Society *Market 0.9631 1.0787 0.81 2715.43 3246.85 13677.36
*Market *Queen 0.9281 0.9661 0.69 2504 3014.81 11591.64
*Queen *Broad 0.5533 0.6834 0.44 1614.82 1884.79 7314.75
US 78 Hackermann Discher 0.675 0.8387 0.54 2210.41 2660.67 9138.36
Discher Milford 0.649 0.816 0.53 2167.69 2615.46 8964.22
Milford Trescott 0.6184 0.8115 0.52 2035.54 2555.65 8801.93
Trescott Heriot 0.6438 0.8155 0.6 2285.16 2699.59 10151.56
Heriot Mount Pleasant 0.6503 0.8156 0.58 2089.21 2424.84 9154.68
Mount Pleasant San Sousi 0.6453 0.837 0.65 1973.46 2508.88 9401.19
San Sousi Brigade 0.6499 0.839 0.66 2024.72 2526.56 9608.63
Brigade Romney 0.5833 0.7856 0.45 1621.22 1985.4 6476.77
Romney Poinsett 0.6344 0.8665 0.51 1824.46 2344.61 7305.54
Poinsett Grove 0.6526 0.9035 0.53 1902.84 2444.92 7723.83
*Grove *Congress 0.5426 0.808 0.36 1238.41 1611.55 5171.52
*Congress *Carolina 0.2981 0.4316 0.22 734.56 1033.29 3177.38
AM Peak
Flow
PM Peak
Flow
Daily Total
FlowCorridor
Segment AM Peak
VOC
PM Peak
VOCDaily VOC

I-26 Fixed Guideway Alternatives Analysis Davis & Floyd, Inc. Existing Conditions February 2016 Appendix 1-E: Traffic V/C and Flow Tables Page 21
From To
Line Street Meeting King 0.051 0.069 0.07 83.18 109.53 411.89
King St Philip 0.2685 0.4938 0.1 192.78 346.85 713.87
Spring Street (S-3) Meeting King 0.6636 0.7404 0.44 957.51 1147.86 3907.32
King St Philip 0.5131 0.4224 0.26 546.45 472.55 2486.76
St Philip Coming 0.7105 1.311 0.55 671.31 1187.64 4647.52
Coming Rutledge 0.7216 1.2913 0.52 696.41 1190.39 4396.34
Rutledge Ashley 0.7725 1.2515 0.52 736.87 1154.33 4366.82
Ashley President 0.9655 1.4994 0.64 924.16 1392.33 5371.24
President Courtney 0.8924 1.1715 1.02 6836.32 8816.68 34295.4
Courtney Hagood 1.0861 1.4106 1.32 6190.06 7898.15 32443.57
Hagood Lockwood 0.6344 0.7564 0.82 3980.71 4694.81 20198.13
Cannon Street (S-1037) King Saint Philip 0.5131 0.4224 0.26 546.45 472.55 2486.76
Saint Philip Coming 0.9513 0.791 0.48 984.04 848.08 4572.53
Coming Smith 1.1818 1.0226 0.6 1228.07 1098.07 5633.65
Smith Rutledge 1.0877 1.0423 0.59 1140.72 1118.17 5574.56
Rutledge Ashley 1.4174 1.2451 0.67 1447.85 1304.44 6348.5
Ashley President 1.3182 1.1317 0.58 1339.27 1179.53 5461.7
President Courtney 1.2496 1.0236 0.59 1366.24 1.0236 5578.48
Calhoun Street (S-404) East Bay Alexander 0.2956 0.6222 0.26 1873.81 2945.82 7969.4
Alexander Meeting 0.3406 0.6801 0.32 2214.58 3375.38 9818.04
Meeting King 0.5764 0.7354 0.53 3411.92 4369.21 16615.58
King Saint Philip 0.5883 0.6628 0.56 3358.71 3996.77 16041.27
Saint Philip Coming 0.6143 0.8502 0.68 3708.82 4573.77 19576.18
Coming Pitt 0.6312 0.7124 0.61 3408.17 4264.58 17596.29
Pitt Smith 0.6361 0.7337 0.63 3476.75 4377.64 18036.58
Smith Rutledge 0.6107 0.7246 0.64 3455.54 4335.98 18329.67
Rutledge Ashley 0.803 0.9646 0.72 4179.75 4660.26 20526.11
Ashley Jonathan Lucas 1.4404 1.485 1.62 4788.28 5145.4 27299.19
Jonathan Lucas Halsey 1.8772 1.984 1.7 5528.71 6250.42 28638.99
Halsey Courtenay 1.916 2.2273 1.77 5747.62 6755.65 29797.74
AM Peak
Flow
PM Peak
Flow
Daily Total
FlowCorridor
Segment AM Peak
VOC
PM Peak
VOCDaily VOC

I-26 Fixed Guideway Alternatives Analysis Davis & Floyd, Inc. Existing Conditions February 2016 Appendix 1-E: Traffic V/C and Flow Tables Page 22
Table 10 continued

I-26 Fixed Guideway Alternatives Analysis Davis & Floyd, Inc. Existing Conditions February 2016 Appendix 1-E: Traffic V/C and Flow Tables Page 23
Table 10 continued
From To
Broad Street (S-1015) East Bay State 0.4028 0.3159 0.24 879.45 942.95 4015.96
State Church 0.5078 0.4017 0.32 1133.05 1256.15 5289.71
Church Meeting 0.5952 0.4846 0.41 1380.98 1581.9 6769.12
Meeting Court House Sq 0.8449 0.8146 0.66 2177.43 2698.08 10804.89
Court House Sq King 0.9879 0.9626 0.77 2540.76 3139 12635.11
King Logan 0.9902 1.164 0.81 2639.26 3315.01 13249.34
Logan Rutledge 0.9494 1.1449 0.8 2604.88 3242.74 13121.83
Rutledge Ashley 1.8516 1.545 0.92 2970.87 3967.79 14906.6
Ashley Barre 1.7347 1.2951 0.87 2870.38 3821.58 14003.22
AM Peak
Flow
PM Peak
Flow
Daily Total
Flow
*For multiple congruent roadway links with little varience in V/C and flow levels, segments are gouped and the link with the highest V/C and flow levels are
indicated
CorridorSegment AM Peak
VOC
PM Peak
VOCDaily VOC