Embed Size (px)
Citation preview

2012 South Florida Environmental Report Appendix 4-2
App. 4-2-1
Appendix 4-2: Annual Permit Report for Taylor
Creek Stormwater Treatment Area Permit Report (May 1, 2010–April 30, 2011)
Permit Number: 0194485
Odi Villapando
Contributors: Trish Burke, Pat Fricano, Brian Garrett, Guy Germain, Binhe Gu, Boyd Gunsalus, Lisa Kreiger,
Adnan Mirza, Richard Pfeuffer and Laura Reilly
SUMMARY
Based on Florida Department of Environmental Protection (FDEP) permit reporting guidelines, Table 1 lists key permit-related information associated with this report. Table 2 lists the attachments included with this report. Table A-1 in Attachment A lists the specific pages, tables, graphs, and attachments where project status and annual reporting requirements are addressed. This annual report satisfies the reporting requirements specified in the permit for the Taylor Creek Stormwater Treatment Area Project.
Table 1. Key permit-related information.
Project Name: Taylor Creek Stormwater Treatment Area
Permit Number: 0194485
Issue and Expiration Date:
Issue: September 15, 2003 Expiration: September 15, 2011
Project Phase: Initial Operational Monitoring and Testing (Discharge Phase)
Permit Condition Requiring Annual
Monitoring Report: Specific Condition 19
Relevant Period of Record:
May 1, 2010 – April 30, 2011
Report Generator: Odi Villapando
[email protected] (561) 682-2936
Permit Coordinator: Laura Reilly
[email protected] (561) 681-2563 x3704

Appendix 4-2 Volume III: Annual Permit Reports
App. 4-2-2
Table 2. Attachments included with this report.
Attachment Title
A Specific Conditions and Cross-References B Raw Water Quality Monitoring Data
INTRODUCTION
The Taylor Creek Stormwater Treatment Area (TC-STA) Permit No. 0194485-001-GL was issued to the U. S. Army Corps of Engineers (USACE), on September 15, 2003, under the authority of the Lake Okeechobee Protection Act (LOPA), Chapter 373.4595, Florida Statutes (F.S.); Title 62, Florida Administrative Code (F.A.C.); and pursuant to Section 373. 4595(9) of the LOPA, the FDEP’s authority under Chapters 373 and 403, F.S. In 2007, LOPA was subsumed by the Northern Everglades and Estuaries Protection Program (NEEPP). This original permit to the USACE, the federal sponsor of the project, was for construction and preliminary operations of the TC-STA. As the local project sponsor and contractor to the USACE, the South Florida Water Management District (SFWMD or District) was responsible for operation and maintenance of the facility until the project was transferred to the SFWMD on May 5, 2011. Upon transfer to the SFWMD, the FDEP issued an operations permit (Permit No. 0194485-002-GL) to the SFWMD to operate and maintain the facility. This appendix summarizes TC-STA performance, operation and maintenance and permit compliance efforts during Water Year 2011 (WY2011) (May 1, 2010–April 30, 2011) in accordance with Specific Condition 19, Annual Monitoring Reports, of Permit No. 0194485-001-GL, which was in effect for the water year.
The Taylor Creek STA is one of the two pilot-scale STAs being implemented north of Lake Okeechobee as part of Phase I of the Lake Okeechobee Watershed Construction Project. Constructed in April 2006, the Taylor Creek STA is a long, narrow enclosure located about two miles north of the City of Okeechobee in central Okeechobee County. It is bordered on the east by U.S. Highway 441 and by Taylor Creek on the west. The STA is approximately 142 acres, with an effective treatment area of 118 acres. An inflow pump station lifts water from Taylor Creek at the north end of the STA. Treatment occurs through natural biogeochemical processes as the water slowly flows by gravity southeasterly through the 41-acre Cell 1 and subsequently through the 77-acre Cell 2 before being discharged back into Taylor Creek, just upstream of the U.S. Highway 441 bridge that spans Taylor Creek. Water levels and flow rates through the treatment cells are controlled by individual gated structures located at the southerly end of each cell (Figure 1). The predominant grade within the STA creates flow northwest to southeast, but the general slope of each cell is from east to west, making the water on the west side of the cells deeper than on the east. Deep zone trenches at the inflow and outflow of each cell are designed to help distribute flow evenly throughout the cell. Overall, the goal of the STA is to capture and treat stormwater from the Taylor Creek basin, upstream of the STA, prior to discharge back into Taylor Creek and eventually into Lake Okeechobee. The STA was projected to remove an average of 2.02 metric tons (mt) of TP per year or about 9 percent of the phosphorus load of Taylor Creek at the project location (Stanley Consultants, Inc., 2003).
Flow-through operations at Taylor Creek STA were initiated on June 26, 2008. After that time, the facility continued operating in a discharge mode until February 24, 2009, when pumping and discharge activities were suspended due to culvert failure at the outfall structure (S-392). Construction repairs to the failed culvert kept the STA out of flow-through operations for almost 20 months. Following completion of the repairs on August 23, 2010, and a demonstration of compliance with pre-discharge requirements, flow-through operations at Taylor Creek STA were

2012 South Florida Environmental Report Appendix 4-2
App. 4-2-3
resumed on September 8, 2010. Based on the monitoring data collected during the first three months of flow-through operations (SFWMD, 2010), the FDEP determined the facility to be in compliance with the above-referenced permit on April 7, 2011. With the transfer of the project to the SFWMD by the USACE on May 5, 2011, the Taylor Creek STA moved into the stabilization phase. While this report covers monitoring activities performed during WY2011, the evaluation of STA permit compliance and project performance is based mainly on flow-through data collected from September 8, 2010–April 30, 2011.
Figure 1. Schematic of Taylor Creek Stormwater Treatment Area (TC-STA), showing structures, flow and water quality monitoring stations
(WS - water stage sensor; WQ - water quality sample station; S-390 and S-392 are the permitted stations).

Appendix 4-2 Volume III: Annual Permit Reports
App. 4-2-4
OPERATIONS AND MAINTENANCE
OPERATIONS
During the first four months of WY2011 (May–August 2010), pumping and discharge activities remained suspended at the TC-STA while construction repairs to the failed culvert at the discharge structure (S-392) were being completed. Following the completion of repairs, flow-through operations resumed on September 8, 2010. A tracer study to assess the hydraulic characteristics of the STA was conducted from September 15–October 19, 2010. A steady flow of approximately 14 cubic feet per second (cfs) was maintained for the duration of the tracer study. Following completion of the study, flow and stage measurements were taken to develop rating curves for the internal structure (S-391) between Cells 1 and 2 and the S-392 outflow structure. The work was initiated on September 21, 2010, with the installation of flow meters at both S-391 and S-392 and concluded on January 19, 2011, with the removal of the flow meters. In order to accommodate development of the rating curves, water levels in the STA were temporarily raised above the normal operating range, as shown in the stage hydrograph for Taylor Creek STA (Figure 2). For the remainder of WY2011, average water depths in the STA for both Cells 1 and 2 averaged about 1.6 feet, with two of the four pumps operating continuously. During WY2011, pumps were operated for 235 out of 365 days and delivered 6,988 acre-feet (ac-ft) of water into the STA.
Operational challenges during WY2011 included monitoring water levels in the STA to maintain healthy vegetation while the outflow culvert was being repaired. The tailwater stilling well (in Taylor Creek) at S-392 also needed to be unclogged and required the use of divers. During this time, the tailwater elevation at S-392 was estimated using the upstream headwater elevation of S-390. In June 2010, nests of protected avian species were observed in the STA and their presence continued for the remainder of WY2011. During this time, no actions were taken to actively increase water levels in the STA. Average water depths within the STA were maintained at approximately 1.6 ft.
15.0017.0019.0021.0023.0025.0027.00
1‐M
ay‐10
1‐Jun‐10
1‐Jul‐10
1‐Aug‐10
1‐Sep
‐10
1‐Oct‐10
1‐Nov‐10
1‐Dec‐10
1‐Jan
‐11
1‐Feb
‐11
1‐M
ar‐11
1‐Apr‐11St
age (feet‐NGVD)
Date
Cell 1 Cell 2 Taylor Creek
Figure 2. Daily stage (feet National Geodetic Vertical Datum, or ft NGVD) in Cells 1 and 2 of the TC-STA in relation to Taylor Creek during
Water Year 2011 (WY2011) (May 1, 2010–April 30, 2011).

2012 South Florida Environmental Report Appendix 4-2
App. 4-2-5
VEGETATION MANAGEMENT
During WY2011, vegetation management activities for the TC-STA focused on maintenance and expansion of a healthy mixed marsh with desirable wetland plants. In September 2008, several open areas in Cell 2 were planted with wetland species including bulrush (Scirpus californicus), spikerush (Eleocharis interstincta), and pickerelweed (Pontederia cordata). By the end of WY2009, it was estimated that over 60 percent of Cell 2 had been converted into a mixed marsh. During WY2011, the areas that were planted in September 2008 have increased in size (Figure 3) by controlling cattail (Typha spp.) encroachment into the planted areas, allowing additional expansion of the desirable vegetation. The seven planted areas can now serve as a donor site to transplant desirable vegetation to other areas within the STA (Figure 3.)
For this reporting period, vegetation management associated with Cell 1 focused on the
control or eradication of undesirable vegetation, such as water lettuce (Pistia stratiotes) and torpedograss (Panicum repens), with herbicides. To date, there have been no additional plantings in Cell 1, although existing desirable vegetation has expanded significantly by controlling undesirable plants adjacent to those areas. Future vegetation management for Cell 1 will consider additional strategic plantings to achieve a more uniform distribution of flow through Cell 1.
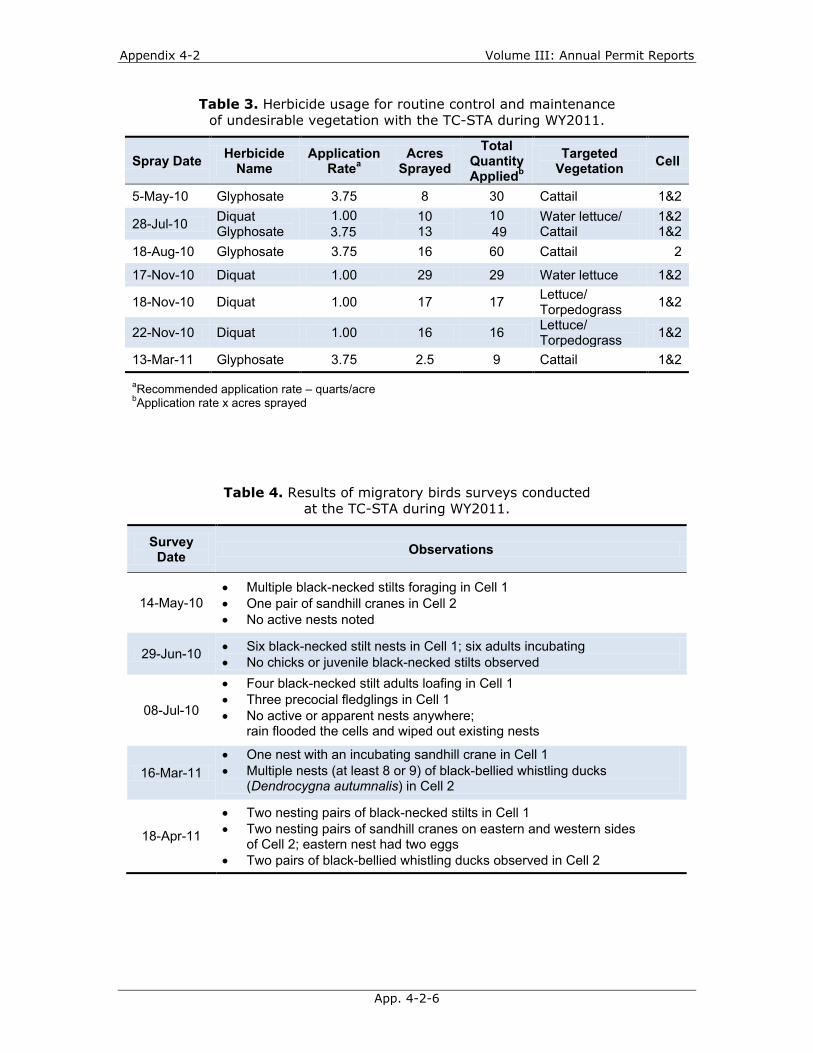
In accordance with Specific Condition 19D of the permit, this annual report provides information on herbicides application to eliminate undesirable vegetation in the treatment cells. During WY2011, the SFWMD treated 112 acres and applied 37 gallons of glyphosate to control cattail in Cells 1 and 2, and 18 gallons of diquat to eradicate mostly water lettuce and torpedograss in both cells (Table 3), using ground-based equipment.
WILDLIFE ISSUES
The TC-STA was surveyed for wildlife activities within the treatment cells during WY2011. Surveys were conducted in order to protect migratory birds that typically nest from early spring to mid-July in the area. Active nests of black-necked stilts (Himantopus mexicanus) were first spotted in June 2010 and their presence continued through the end of WY2011 (Table 4). Nests of other avian species, such as sandhill cranes (Grus canadensis) and black-bellied whistling ducks (Dendrocygna autumnalis), were also observed. While bird surveys are done to help guide STA operations during the 2011 breeding season, no operational changes were required in response to wildlife presence. Water depth in the STA was maintained at approximately 1.6 ft.
Figure 3. Cell 2 in early WY2011 showing planted areas from 2008 surrounded by adjacent cattails (left) and in late WY2011 showing open water areas to be planted with desirable vegetation (right) (photos by the SFWMD).
Appendix 4-2 Volume III: Annual Permit Reports
App. 4-2-6
Table 3. Herbicide usage for routine control and maintenance of undesirable vegetation with the TC-STA during WY2011.
Spray Date Herbicide Name
Application Ratea
Acres Sprayed
Total Quantity Appliedb
Targeted Vegetation Cell
5-May-10 Glyphosate 3.75 8 30 Cattail 1&2
28-Jul-10 Diquat Glyphosate
1.00 3.75
10 13
10 49
Water lettuce/ Cattail
1&21&2
18-Aug-10 Glyphosate 3.75 16 60 Cattail 2
17-Nov-10 Diquat 1.00 29 29 Water lettuce 1&2
18-Nov-10 Diquat 1.00 17 17 Lettuce/ Torpedograss 1&2
22-Nov-10 Diquat 1.00 16 16 Lettuce/ Torpedograss 1&2
13-Mar-11 Glyphosate 3.75 2.5 9 Cattail 1&2
aRecommended application rate – quarts/acre bApplication rate x acres sprayed
Table 4. Results of migratory birds surveys conducted at the TC-STA during WY2011.
Survey Date Observations
14-May-10 • Multiple black-necked stilts foraging in Cell 1 • One pair of sandhill cranes in Cell 2 • No active nests noted
29-Jun-10 • Six black-necked stilt nests in Cell 1; six adults incubating • No chicks or juvenile black-necked stilts observed
08-Jul-10
• Four black-necked stilt adults loafing in Cell 1 • Three precocial fledglings in Cell 1 • No active or apparent nests anywhere;
rain flooded the cells and wiped out existing nests
16-Mar-11 • One nest with an incubating sandhill crane in Cell 1 • Multiple nests (at least 8 or 9) of black-bellied whistling ducks
(Dendrocygna autumnalis) in Cell 2
18-Apr-11
• Two nesting pairs of black-necked stilts in Cell 1 • Two nesting pairs of sandhill cranes on eastern and western sides
of Cell 2; eastern nest had two eggs • Two pairs of black-bellied whistling ducks observed in Cell 2

2012 South Florida Environmental Report Appendix 4-2
App. 4-2-7
PERMIT MONITORING REQUIREMENTS AND COMPLIANCE
The original permit issued to the USACE required various monitoring activities both during construction and preliminary operations. The project’s Initial Operational Testing and Monitoring Period included pre-discharge and discharge (flow-through) activities (Specific Condition 13). For the TC-STA, compliance with pre-discharge requirements for total phosphorus, mercury, and pesticides, per Specific Condition 14 of Permit No. 0194485-001-GL, was achieved on April 30, 2008. This section summarizes results of monitoring activities conducted during WY2011 and evaluates compliance with discharge requirements specified in Specific Condition 15 in the above-referenced permit. It also includes monitoring results for mercury and pesticides, as outlined in Specific Conditions 14B and C of the permit. All monitoring activities were performed in accordance with Chapter 62-160, F.A.C., and the approved Water Quality Monitoring Plan (SFWMD, 2006) per Specific Condition 19A of the permit.
TOTAL PHOSPHORUS (SPECIFIC CONDITION 15A)
Compliance with the above-referenced permit for total phosphorus (TP) concentrations measured at the inflow and outflow points of the TC-STA is evaluated as follows:
1. Calculate rolling three-month flow-weighted mean (FWM) TP concentrations at inflow and outflow structures of the STA
2. Compare FWM TP concentrations at inflow and outflow structures using Student’s t-test with a 95 percent confidence interval on log transformed data
3. If FWM TP outflow concentrations are lower than FWM TP inflow concentrations, then discharges from the project are deemed in compliance with this condition
The rolling, three-month inflow FWM TP concentrations show marked seasonal variation (Table 5). With no flow-through data collected during the first four months of WY2011, inflow FWM TP concentrations were highest (469 micrograms per liter, or µg/L) in July–September 2010 and remained in the 100–150 µg/L range for the remainder of WY2011. Seasonal variation in FWM TP concentrations at the outflow was less pronounced, with values ranging from 53–95 µg/L. During WY2011, inflow and outflow FWM TP concentrations were 167 and 68 µg/L, respectively, representing a 59.3 percent reduction in TP concentrations (Table 5).
Date S-390 S-392
May-2010–Jul-2010 0 0 Jun-2010–Aug-2010 0 0 Jul-2010–Sep-2010 469 95 Aug-2010–Oct-2010 297 72 Sep-2010–Nov-2010 232 63 Oct-2010–Dec-2010 109 46 Nov-2010–Jan-2011 93 53 Dec-2010–Feb-2011 119 66 Jan-2010–Mar-2011 148 79 Feb-2010–Apr-2011 156 83
Water Year 2011 167 68
Table 5. Rolling, three-month flow-weighted mean total phosphorus (TP) concentrations (micrograms per liter, or µg/L) at inflow (S-390)
and outflow (S-392) stations of the TC-STA.

Appendix 4-2 Volume III: Annual Permit Reports
App. 4-2-8
As required in the permit, a statistical comparison of the monthly FWM TP concentrations at the inflow and outflow structures of the STA was performed, using a Student’s t-test on log transformed data. The decision to use a t-test and the type of t-test to perform (one that assumes equal variances or one that does not make that assumption) was made after a test for normality using the Shapiro-Wilks test and an F-test for equality of variance confirmed that the datasets are normally distributed (p=0.47 which is greater than 0.05) with variances that are equal (p=0.08, F-stat=3.06). The results for a two-tailed test at 0.05 level of significance indicate that there is a statistically significant difference between monthly FWM TP concentrations at the inflow and outflow points of the TC-STA (t stat=3.402, p=0.004). This statistical difference verifies that the average outflow TP concentration was significantly lower than the average inflow TP concentration. According to Permit No. 0194485-001-GL, a statistically significant reduction in TP concentration from inflow to outflow indicates that the discharges from the TC-STA are in compliance with Specific Condition 15A of the permit.
DISSOLVED OXYGEN (SPECIFIC CONDITION 15B)
Dissolved oxygen (DO) concentrations monitored at the permitted inflow (S-390) and outflow (S-392) points and at the downstream location (TC_DO) for the TC-STA during WY2011 are shown in Figure 4. DO levels differed markedly among stations and fluctuated over time. DO concentrations at the inflow and at the downstream locations were generally higher than DO concentrations at the outflow. The lowest DO concentrations were observed in September–October 2010, while the highest values were obtained from early November 2010–early January 2011, except for the one value recorded at the downstream location in March 2011. The range of DO values for the inflow, outflow, and downstream sites were 1.30-6.24 milligrams per liter (mg/L), 0.13-3.55 mg/L, and 1.45-8.77 mg/L, respectively.
Figure 4. Dissolved oxygen (DO) concentrations (milligrams per liter, or mg/L) measured at the inflow (S-390) and outflow (S-392) locations and the
downstream location (TC_DO) for TC-STA during WY2011.
0
1
2
3
4
5
6
7
8
9
10
Dis
solv
ed O
xyge
n, m
g/L
S-390 S-392 TC_DO

2012 South Florida Environmental Report Appendix 4-2
App. 4-2-9
Compliance with the above-referenced permit for DO is evaluated as follows: If flow-through discharges have been occurring for less than 12 months, but the USACE is preparing to turn the project over to the non-federal sponsor in accordance with Specific Condition 10, then an average for the outflow and inflow structures for the STA is calculated based on available data and evaluated according to the following criteria:
1. If average outflow concentration is not less than applicable criteria, then the STA is deemed in compliance with this condition
2. If average outflow concentration is less than applicable criteria but greater than or equal to average inflow concentration, then the STA is deemed in compliance with this condition
3. If average outflow concentration is less than applicable criteria and is not greater than average inflow concentration, but can be demonstrated that the project results in a net DO benefit in receiving waters as a result of decreased nutrients or oxygen demand, then the STA is deemed in compliance with this condition; or
4. If average outflow concentration is less than applicable criteria and is not greater than average inflow concentration, but the aforementioned demonstration cannot be made, then adaptive management measures (e.g., operational or structural modifications) should be taken to ensure that DO conditions are not degraded in receiving waters.
To determine whether or not the STA contributed to the degradation of oxygen in downstream receiving waters, DO concentrations measured at the three designated locations were compared using this four-part assessment. A box-and-whisker plot of the data was constructed to show differences in DO concentrations among locations for the following: smallest observation (sample minimum), lower quartile (Q1 or 25th percentile), median (Q2 or 50th percentile), upper quartile (Q3 or 75th percentile), and largest observation (sample maximum) (Figure 5).
Figure 5. Box-and-whisker plot showing DO concentrations measured at the TC-STA in WY2011. Bottom and top of box are 25th and 75th percentiles,
respectively, and line inside box is 50th percentile (median). Ends of whiskers represent minimum and maximum values; dashed line represents lower limit
of the Florida Class III criteria for predominantly fresh, surface water (5.0 mg/L) and solid red dots represent mean DO concentrations.

Appendix 4-2 Volume III: Annual Permit Reports
App. 4-2-10
Percentile values were highest at the downstream location, with 50 percent of the observations (the median or 50th percentile) having DO concentrations of 5.77 mg/L or greater. Compared to the downstream location, DO concentrations at the inflow structure were lower with 50 percent of the observations having DO concentrations of 5.06 mg/L or greater. DO concentrations at the outflow were much lower with a median value (50th percentile) of only 1.44 mg/L. Using the Mann-Whitney test, the nonparametric analogue to Student’s t-test, the median at the outflow was significantly lower than the median DO level at both the inflow (p=<0.001, z=-4.87) and downstream location (p=<0.001, z=5.57). The median DO concentration at the downstream location was higher than the median concentration at the inflow, but the difference was not significant (p=0.193, z=1.30). The calculated mean values (solid red dots in Figure 5) were slightly lower than the median for the inflow and downstream locations but higher than the median at the outflow site. Mean DO levels at the inflow (4.91 mg/L) and outflow (2.09 mg/L) points are below the lower limit of the Florida Class III criteria for predominantly fresh, surface water (5.0 mg/L, as specified in Section 62-302.530, F.A.C.; see Table 6) (red dashed line in Figure 5). This is consistent with the ambient DO levels in Taylor Creek source water, which are historically low. The reduction in DO levels from inflow to outflow can be attributed to periodic spraying of cattail in Cell 2 as part of an effort to establish a healthy mixed marsh and eradicate undesirable vegetation such as torpedograss and water lettuce. The subsequent decomposition of dead biomass could create a condition conducive to increased oxygen consumption. Similarly, low DO levels have been reported for macrophytic-dominated STAs south of the lake (Pietro et al., 2010).
DO levels at the downstream location in Taylor Creek, 400 ft south of the discharge structure, averaged 5.47 mg/L, which is well above the Class III freshwater criteria. While the inflow and outflow DO levels were not greater than the applicable criteria, DO levels at the downstream monitoring location (TC_DO) and the resulting reductions in TP concentrations put the TC-STA in compliance with Specific Condition 15B.
OTHER WATER QUALITY PARAMETERS (SPECIFIC CONDITION 15C)
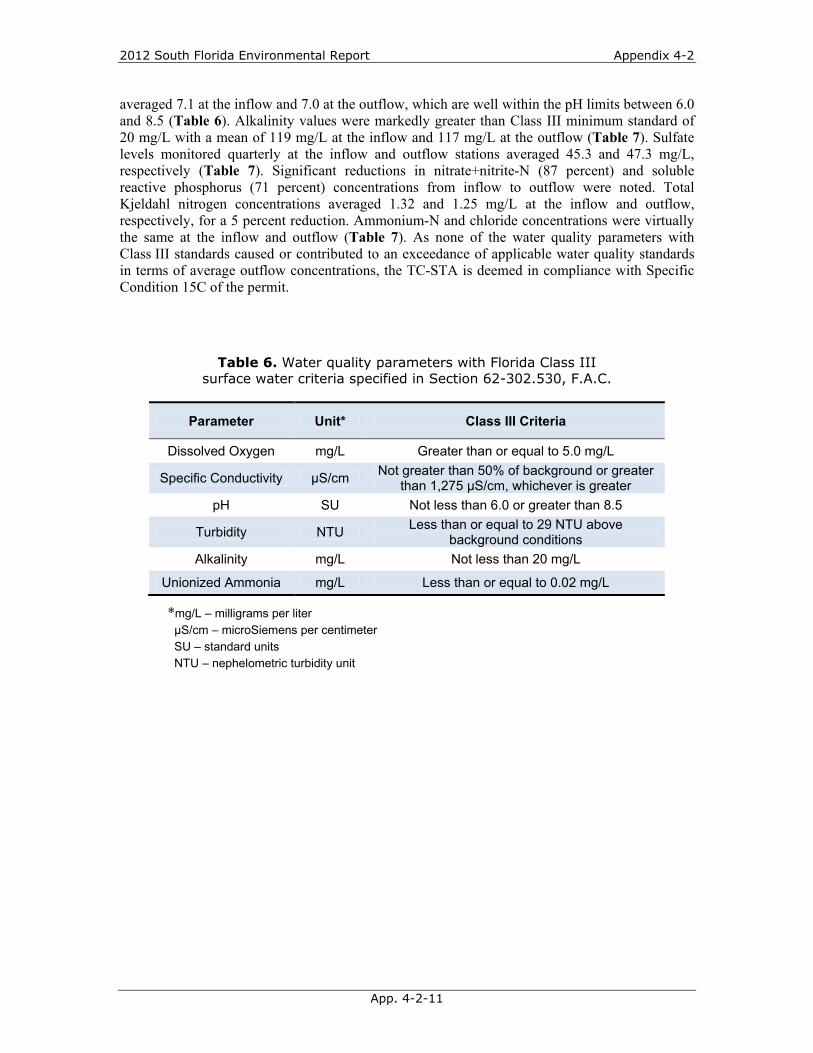
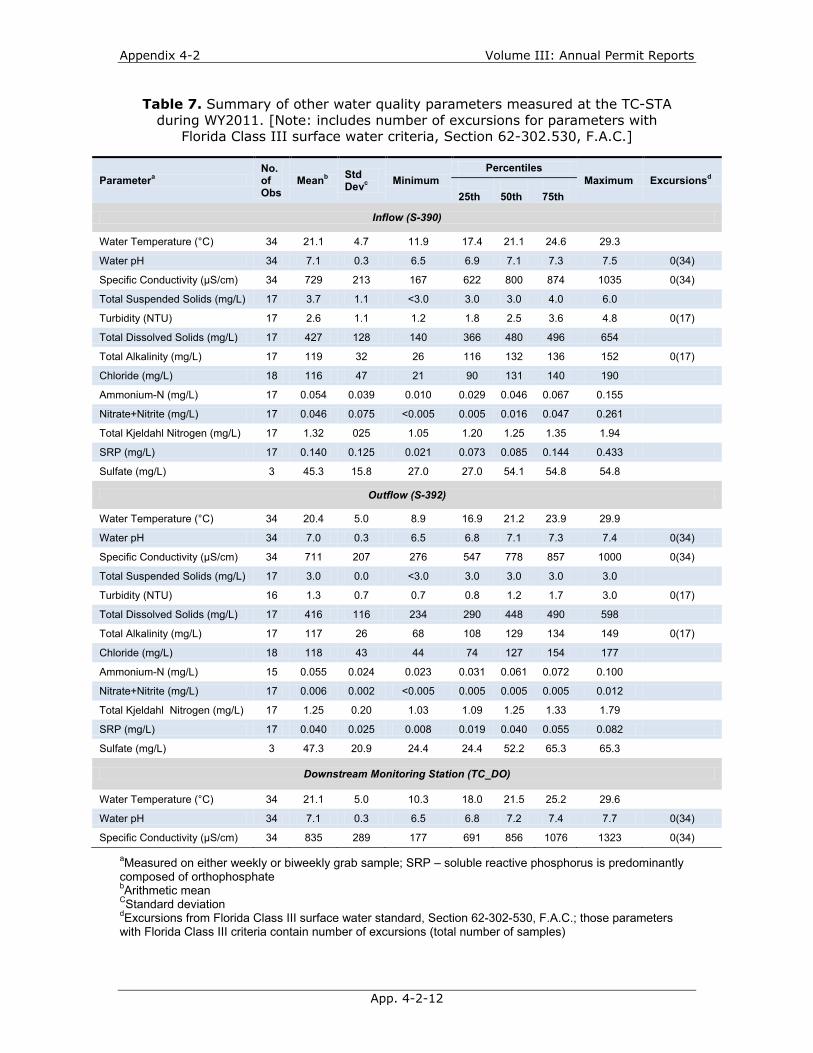
Water quality parameters other than TP and DO were monitored at the inflow and outflow stations of the TC-STA during WY2011 in accordance with Table 2 of Permit No. 0194485-001-GL. Monitoring results for all water quality parameters with and without Florida Class III standards are summarized in Table 6. Permit compliance for water quality parameters other than TP and DO was evaluated as follows:
1. If annual average outflow concentration does not cause or contribute to violations of applicable Class III water quality standards, then the STA is deemed in compliance;
2. If annual average concentration at outflow causes or contributes to violations of applicable Class III water quality standards but does not exceed or is equal to the annual average concentration at inflow, then the STA is be deemed in compliance;
3. If annual average concentration at outflow causes or contributes to violations of applicable Class III water quality standards and also exceeds the annual average concentration at inflow, then the STA is deemed out of compliance.
To determine whether or not the STA contributed to a violation for a specific parameter, the water year average inflow concentration was compared to the average outflow concentration. Average specific conductivity at the outflow (729 microsiemens per centimeter, or µS/cm) was slightly higher than the average conductivity value at the inflow (711 µS/cm) (Table 7) but both are well below the Florida Class III standard of 1,275 µS/cm (Table 6). Average turbidity values of 2.6 and 1.3 nephelometric turbidity units (NTUs) at the inflow and outflow stations, respectively, were several-fold lower than the threshold value of 29 NTUs (Table 6). Water pH
2012 South Florida Environmental Report Appendix 4-2
App. 4-2-11
averaged 7.1 at the inflow and 7.0 at the outflow, which are well within the pH limits between 6.0 and 8.5 (Table 6). Alkalinity values were markedly greater than Class III minimum standard of 20 mg/L with a mean of 119 mg/L at the inflow and 117 mg/L at the outflow (Table 7). Sulfate levels monitored quarterly at the inflow and outflow stations averaged 45.3 and 47.3 mg/L, respectively (Table 7). Significant reductions in nitrate+nitrite-N (87 percent) and soluble reactive phosphorus (71 percent) concentrations from inflow to outflow were noted. Total Kjeldahl nitrogen concentrations averaged 1.32 and 1.25 mg/L at the inflow and outflow, respectively, for a 5 percent reduction. Ammonium-N and chloride concentrations were virtually the same at the inflow and outflow (Table 7). As none of the water quality parameters with Class III standards caused or contributed to an exceedance of applicable water quality standards in terms of average outflow concentrations, the TC-STA is deemed in compliance with Specific Condition 15C of the permit.
Parameter Unit* Class III Criteria
Dissolved Oxygen mg/L Greater than or equal to 5.0 mg/L
Specific Conductivity µS/cm Not greater than 50% of background or greater than 1,275 µS/cm, whichever is greater
pH SU Not less than 6.0 or greater than 8.5
Turbidity NTU Less than or equal to 29 NTU above background conditions
Alkalinity mg/L Not less than 20 mg/L
Unionized Ammonia mg/L Less than or equal to 0.02 mg/L
*mg/L – milligrams per liter µS/cm – microSiemens per centimeter SU – standard units NTU – nephelometric turbidity unit
Table 6. Water quality parameters with Florida Class III surface water criteria specified in Section 62-302.530, F.A.C.
Appendix 4-2 Volume III: Annual Permit Reports
App. 4-2-12
Table 7. Summary of other water quality parameters measured at the TC-STA during WY2011. [Note: includes number of excursions for parameters with
Florida Class III surface water criteria, Section 62-302.530, F.A.C.]
Parametera No. of Obs
Meanb Std Devc Minimum
Percentiles Maximum Excursionsd
25th 50th
75th
Inflow (S-390)
Water Temperature (°C) 34 21.1 4.7 11.9 17.4 21.1 24.6 29.3
Water pH 34 7.1 0.3 6.5 6.9 7.1 7.3 7.5 0(34)
Specific Conductivity (µS/cm) 34 729 213 167 622 800 874 1035 0(34)
Total Suspended Solids (mg/L) 17 3.7 1.1 <3.0 3.0 3.0 4.0 6.0
Turbidity (NTU) 17 2.6 1.1 1.2 1.8 2.5 3.6 4.8 0(17)
Total Dissolved Solids (mg/L) 17 427 128 140 366 480 496 654
Total Alkalinity (mg/L) 17 119 32 26 116 132 136 152 0(17)
Chloride (mg/L) 18 116 47 21 90 131 140 190
Ammonium-N (mg/L) 17 0.054 0.039 0.010 0.029 0.046 0.067 0.155
Nitrate+Nitrite (mg/L) 17 0.046 0.075 <0.005 0.005 0.016 0.047 0.261
Total Kjeldahl Nitrogen (mg/L) 17 1.32 025 1.05 1.20 1.25 1.35 1.94
SRP (mg/L) 17 0.140 0.125 0.021 0.073 0.085 0.144 0.433
Sulfate (mg/L) 3 45.3 15.8 27.0 27.0 54.1 54.8 54.8
Outflow (S-392)
Water Temperature (°C) 34 20.4 5.0 8.9 16.9 21.2 23.9 29.9
Water pH 34 7.0 0.3 6.5 6.8 7.1 7.3 7.4 0(34)
Specific Conductivity (µS/cm) 34 711 207 276 547 778 857 1000 0(34)
Total Suspended Solids (mg/L) 17 3.0 0.0 <3.0 3.0 3.0 3.0 3.0
Turbidity (NTU) 16 1.3 0.7 0.7 0.8 1.2 1.7 3.0 0(17)
Total Dissolved Solids (mg/L) 17 416 116 234 290 448 490 598
Total Alkalinity (mg/L) 17 117 26 68 108 129 134 149 0(17)
Chloride (mg/L) 18 118 43 44 74 127 154 177
Ammonium-N (mg/L) 15 0.055 0.024 0.023 0.031 0.061 0.072 0.100
Nitrate+Nitrite (mg/L) 17 0.006 0.002 <0.005 0.005 0.005 0.005 0.012
Total Kjeldahl Nitrogen (mg/L) 17 1.25 0.20 1.03 1.09 1.25 1.33 1.79
SRP (mg/L) 17 0.040 0.025 0.008 0.019 0.040 0.055 0.082
Sulfate (mg/L) 3 47.3 20.9 24.4 24.4 52.2 65.3 65.3
Downstream Monitoring Station (TC_DO)
Water Temperature (°C) 34 21.1 5.0 10.3 18.0 21.5 25.2 29.6
Water pH 34 7.1 0.3 6.5 6.8 7.2 7.4 7.7 0(34)
Specific Conductivity (µS/cm) 34 835 289 177 691 856 1076 1323 0(34)
aMeasured on either weekly or biweekly grab sample; SRP – soluble reactive phosphorus is predominantly composed of orthophosphate bArithmetic mean CStandard deviation dExcursions from Florida Class III surface water standard, Section 62-302-530, F.A.C.; those parameters with Florida Class III criteria contain number of excursions (total number of samples)

2012 South Florida Environmental Report Appendix 4-2
App. 4-2-13
MERCURY (SPECIFIC CONDITION 14B)
In accordance with Specific Condition 14B of Taylor Creek Permit No. 0194485-001-GL, mercury concentrations in water and fish samples were monitored at designated locations in the TC-STA during WY2011. Surface water total mercury (THg) concentrations at the inflow (S-390) and outflow (S-392) points were generally very low. Averaged over two sampling events, THg concentrations at the inflow and outflow stations were 2.00 and 0.77 nanograms per liter (ng/L), respectively (Table 8a). These values are well below the United States Environmental Protection Agency (USEPA) Class III numerical water quality standard of 12 ng/L. Methylmercury (MeHg) levels were also very low with an average concentration of 0.51 ng/L at the inflow and 0.20 ng/L at the outflow. Both THg and MeHg levels showed a net reduction of about 60 percent from inflow to outflow.
Table 8a. Surface water mercury concentrations (nanograms per liter, or ng/L) at inflow (S-390) and outflow (S-392) stations of the TC-STA in WY2011.
Station ID Collection Date Parameter Value (ng/L)
S-390 05-Oct-10 26-Jan-11 05-Oct-10 26-Jan-11
Mercury, Total Mercury, Total
Methyl Mercury, Total Methyl Mercury, Total
2.30 1.70 0.69 0.33
S-392 05-Oct-10 26-Jan-11 05-Oct-10 26-Jan-11
Mercury, Total Mercury, Total
Methyl Mercury, Total Methyl Mercury, Total
0.84 0.70 0.24 0.15
Average THg concentrations for the different fish species were generally low (Table 8b). Total Hg concentrations in mosquitofish (Gambusia holbrooki) samples were 13 ng/g at the interior (TCSTAC) and 46 ng/g at the downstream site (TCDS). These values are considerably below the USEPA trophic level II limit for fish (77 ng/g) and do not exceed the 75th percentile concentration of 66 ng/g for the period of record for the Everglades Protection Area. Similarly, none of the THg concentrations in sunfish/bluegill (Lepomis spp.) samples from Cell 2 (TC2) and downstream location (TCSTAC) exceeded the USEPA trophic level II or III limit of 77 ng/g. Largemouth bass (Micropterus salmoides) samples collected at the downstream location (TCDS) showed THg concentration also below the USEPA recommended consumption limit of 346 ng/g. Total Hg concentrations in sunfish/bluegill and large-mouth bass did not exceed the 75th percentile concentrations of 242 and 690 ng/g, respectively, for the Everglades Protection Area. In summary, no violations of USEPA water quality standards for surface water and fish were recorded for the TC-STA during WY2011.
Table 8b. Total mercury concentrations (nanograms per gram, or ng/g) in fish samples monitored at the TC-STA in WY2011. Values are on a wet weight basis.
Station IDa Collection Date Fish Type Parameter Value (ng/g) TC2 08-Nov-10 Sunfish/Bluegill Mercury, Total 51b
TCDS 04-Oct-10 08-Nov-10 08-Nov-10
Mosquito fish Sunfish/Bluegill
Largemouth bass
Mercury, Total Mercury, Total Mercury, Total
46 58b
285c TCSTAC 14-Feb-11 Mosquitofish Mercury, Total 13
a TC2 – TC-STA Cell 2; TCDS – Taylor Creek downstream; TCSTAC – Composited mosquitofish sample from Cells 1 and 2 b Values recorded are arithmetic average of five samples c Average of two samples

Appendix 4-2 Volume III: Annual Permit Reports
App. 4-2-14
PESTICIDES (SPECIFIC CONDITION 14C)
Pesticide concentrations in surface water were all below detection limits, with the exception of hexazinone, which was detected at the permitted inflow and outflow points of the TC-STA on January 26, 2011 (Table 9). Hexazinone is a non-selective contact herbicide that inhibits photosynthesis (USDOE-BPA, 2000). Ecological effects data indicate that hexazinone is practically non-toxic to freshwater invertebrates and fish in acute exposures (USEPA, 1994). As such, the highest surface water concentration of 0.052 µg/L detected at the outflow station (S-392) is not expected to not have an acute or chronic detrimental effect on fish or aquatic invertebrates. Pesticide concentrations monitored in all fish samples collected at the interior and at the downstream location in the STA were below detection limits.
The SFWMD began pesticide monitoring at the TC-STA in 2005. Samples collected from eleven different sites from October 2005–January 2011 were analyzed for organophosphorus and organochlorine pesticides. All sediment, surface water, and fish tissue pesticide concentrations were below action levels.
Table 9. Pesticides monitoring results at the TC-STA during WY2011.
Station IDa Collection Date
Sample Type
Compound Detected Valueb Unit
S-390 05-Oct-10 26-Jan-11
Surface water Surface water
None Hexazinone
BDL 0.023
µg/L µg/L
S-392 05-Oct-10 26-Jan-11
Surface water Surface water
None Hexazinone
BDL 0.052
µg/L µg/L
TC2 08-Nov-10 Bluegill None BDL mg/kg
TCDS
04-Oct-10 08-Nov-10 08-Nov-10 14-Feb-11
Mosquitofish Bluegill Largemouth bass Mosquitofish
None None None None
BDL BDL BDL BDL
mg/kg mg/kg mg/kg mg/kg
TCSTAC 04-Oct-10 14-Feb-11
Mosquitofish Mosquitofish
None None
BDL BDL
mg/kg mg/kg
a S-390 (inflow); S-392 (outflow); TC2 – Cell 2; TCDS – Taylor Creek downstream; TCSTAC – Composited mosquito fish sample from Cells 1 and 2
b BDL – below detection limit

2012 South Florida Environmental Report Appendix 4-2
App. 4-2-15
STA PERFORMANCE ASSESSMENT
Using the Nutrient Load Program, the SFWMD’s standard program for calculating nutrient loads for the STAs (SFWMD, 2005), a monthly summary of flows, loads, and FWM concentrations at compliance points of the TC-STA was generated (Table 10). This information formed the basis for calculating key STA performance metrics, which were used to evaluate STA performance for the reporting period. During WY2011, the TC-STA captured and treated 6,988 ac-ft of runoff water from the Taylor Creek drainage basin through the S-390 structure (Table 10). This inflow loading for the eight-month flow-through period was equal to an average hydraulic load of 7.70 cm/d (Table 11). The volume of treated water discharged back into Taylor Creek during this period was 6,257 ac-ft. The difference in total inflow and outflow volumes reflects the net contributions of direct rainfall, seepage and evapotranspiration. Hydraulic retention time (HRT), the average length of time the runoff remained within the STA averaged 7.8 days (Table 11). Longer HRTs generally result in higher treatment efficiency but this would signify having less water in the STA available for treatment (reduced hydraulic loading rate).
Relative to TP concentrations previously measured at Taylor Creek, FWM TP concentrations recorded at the permit compliance locations during WY2011 were generally very low. Inflow FWM TP concentrations for the reporting period ranged from 64–469 µg/L, while outflow FWM TP concentrations ranged from 39–95 µg/L (Table 10). With the TC-STA out of operation over the first four months of WY2011 due to construction repairs to the failed culvert at discharge structure (S-392), the highest inflow FWM TP concentration was recorded in September 2010. During WY2011, FWM TP concentrations at the inflow and outflow averaged 167 and 68 µg/L, respectively (Table 10), with a TP concentration reduction of 53 percent (Table 11).
TP loading over the effective treatment area of the TC-STA averaged 0.014 g/m2/d over the eight-month period (Table 11). The low quantity of TP loaded into the STA was directly related to uncharacteristically low concentrations seen in Taylor Creek during WY2011. The average inflow TP concentration for the eight-month flow-through period was 167 µg/L, which is considerably lower than the average TP concentration of 393 µg/L recorded in WY09 (USACE, 2010). The historical concentration of TP in Taylor Creek source water was 492 µg/L (Goforth, 2005a). Low TP mass loading resulted in low TP load removal. TP loading to the system was 1.438 mt while the TP mass in the outflow was 0.524 mt, giving a net TP load removal of 0.914 mt (Table 10). Phosphorus treatment efficiency for WY2011 was almost 64 percent (Table 11). While the STA showed high efficiency in reducing both TP concentration and load, the actual TP load removed during WY2011 was much lower than the projected annual load reduction of 2.02 mt of TP per year. This is largely due to much lower TP concentrations in the source water during WY2011, which was an extremely dry year. Also, as the STA was not operational in early WY2011, there was no opportunity to capture and treat high TP runoff from the Taylor Creek drainage basin during these four months, which accounted for 63 percent of the total rainfall (45 inches) received by the region in WY2011 (Figure 6).
As of the end of WY2011, the TC-STA has had flow-through operations for 16 months. Combining TP load reduction obtained in WY2009 (June 2008–February 2009) (USACE, 2010) with the TP load removal obtained in WY2011, the TC-STA removed 2.26 mt of TP over the 16-month period. The facility will continue to operate in accordance with the Taylor Creek STA Operation Plan (Goforth, 2005b) and Water Control Plan (USACE, 2009). Planned enhancements to the TC-STA include strategic plantings in Cell 1 to divert some preferential flow from along the western levee towards the eastern levee to obtain a more uniform flow across the cell and to increase the density and coverage of more desirable vegetation.

Appendix 4-2 Volume III: Annual Permit Reports
App. 4-2-16
Table 10. Monthly flows (acre-feet, or ac-ft), TP loads (metric tons, or mt), and TP FWM concentrations (µg/L) for the TC-STA during WY2011.
Date
Flow (ac-ft)
S-390 Load (mt)
FWMC (µg/L)
Flow (ac-ft)
S-392 Load (mt)
FWMC (µg/L)
2010-May 0 0.000 0 0 0.000 0
2010-Jun 0 0.000 0 0 0.000 0
2010-Jul 0 0.000 0 0 0.000 0
2010-Aug 0 0.000 0 0 0.000 0
2010-Sep 767 0.444 469 663 0.077 94
2010-Oct 977 0.195 162 631 0.038 49
2010-Nov 855 0.105 99 949 0.059 51
2010-Dec 965 0.076 64 906 0.044 64
2011-Jan 898 0.131 118 846 0.073 39
2011-Feb 779 0.181 188 690 0.081 70
2011-Mar 888 0.155 142 812 0.075 95
2011-Apr 859 0.150 142 760 0.076 81
SUM 6,988 1.438 167 6,257 0.524 68
Table 11. Summary of calculated TC-STA operational parameters for WY2011.
[Note: Values are based on an eight-month flow-through period.]
Parameter Calculated
Value
Period of operation, d 235
Total inflow volume, ac-ft 6,988
Hydraulic loading rate, cm/d 7.70
FWM inflow TP conc., µg/L 167
Total inflow TP load, mt 1.438
TP mass loading rate, g/m2/d 0.014
Total outflow volume, acre-ft 6,257
FWM outflow TP conc., µg/L 68
Total outflow TP load, mt 0.524
Hydraulic residence time, d 7.75
TP load removed, mt 0.914
TP concentration reduction, % 59.3
TP load reduction, % 63.6

2012 South Florida Environmental Report Appendix 4-2
App. 4-2-17
Figure 6. Daily rainfall (inches) recorded at Mobley weather station in WY2011.

Appendix 4-2 Volume III: Annual Permit Reports
App. 4-2-18
LITERATURE CITED
SFWMD. 2005. ERA LOAD PROGRAM. User’s Manual. Program for Retrieving Flow and Water Quality Data and Calculating Loads and Flow-Weighted Means. South Florida Water Management District, West Palm Beach, FL.
SFWMD. 2006. Water Quality Monitoring Plan for the Taylor Creek STA. South Florida Water Management District, West Palm Beach, FL.
Goforth, G. 2005a. Performance Plan for the Taylor Creek Stormwater Treatment Area. Prepared under Contract Number PC P501811 to the South Florida Water Management District, West Palm Beach, FL.
Goforth, G. 2005b. Vegetation Management Plan for the Taylor Creek Stormwater Treatment Area. Prepared under Contract Number PC P501811 to the South Florida Water Management District, West Palm Beach, FL.
Pietro, K., R. Bearzotti, G. Germain and N. Iricanin. 2010. Chapter 5: Performance and Optimization of the Everglades Stormwater Treatment Areas. In: 2010 South Florida Environmental Report – Volume I, South Florida Water Management District, West Palm Beach, FL.
Stanley Consultants, Inc., 2003. Lake Okeechobee Water Retention/Phosphorus Removal Project, Final Design Analysis Submittal. Prepared under Contract DACW 17-00-R-0013 to the U.S. Army Corps of Engineers Jacksonville District, Jacksonville, FL.
USACE. 2009. Water Control Plan for the Taylor Creek Stormwater Treatment Area. U.S. Army Corps of Engineers, Jacksonville, FL.
USACE. 2010. Taylor Creek Stormwater Treatment Area Annual Report. U.S. Army Corps of Engineers, Jacksonville, FL.
USDOE-BPA. 2000. Hexazinone – Herbicide Fact Sheet, March 2000. U.S. Department of Energy, Bonneville Power Administration. Portland, OR. Available on-line at http://efw.bpa.gov/environmental_services/Document_Library/Vegetation_Management/EIS/appenH.pdf
USEPA. 1994. Office of Pesticide Programs, Reregistration Eligibility Decision, Hexazinone, EPA-738-R-94-022, September 1994. U.S. Environmental Protection Agency, Washington, D.C.
2012 South Florida Environmental Report Appendix 4-2
App. 4-2-19
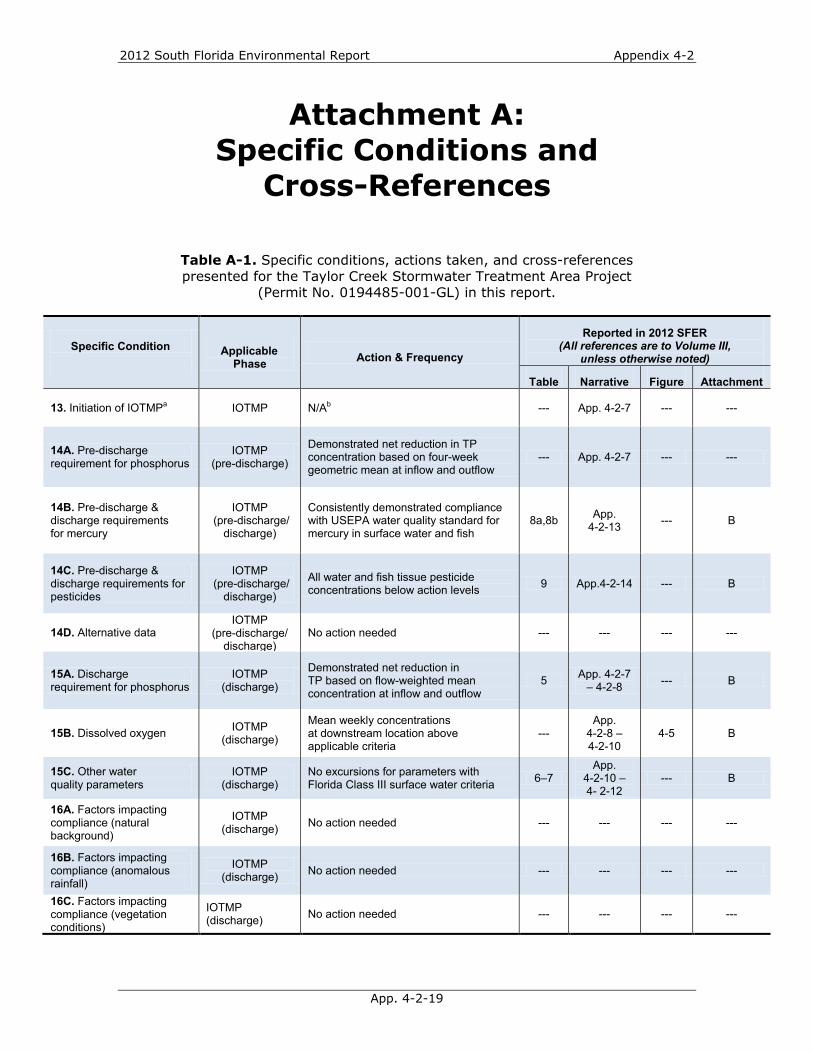
Attachment A: Specific Conditions and
Cross-References
Specific Condition
Applicable
Phase Action & Frequency
Reported in 2012 SFER (All references are to Volume III,
unless otherwise noted)
Table Narrative Figure Attachment
13. Initiation of IOTMPa IOTMP N/Ab --- App. 4-2-7 --- ---
14A. Pre-discharge requirement for phosphorus
IOTMP (pre-discharge)
Demonstrated net reduction in TP concentration based on four-week geometric mean at inflow and outflow
--- App. 4-2-7 --- ---
14B. Pre-discharge & discharge requirements for mercury
IOTMP (pre-discharge/
discharge)
Consistently demonstrated compliance with USEPA water quality standard for mercury in surface water and fish
8a,8b App. 4-2-13 --- B
14C. Pre-discharge & discharge requirements for pesticides
IOTMP (pre-discharge/
discharge)
All water and fish tissue pesticide concentrations below action levels 9 App.4-2-14 --- B
14D. Alternative data IOTMP
(pre-discharge/ discharge)
No action needed --- --- --- ---
15A. Discharge requirement for phosphorus
IOTMP (discharge)
Demonstrated net reduction in TP based on flow-weighted mean concentration at inflow and outflow
5 App. 4-2-7 – 4-2-8 --- B
15B. Dissolved oxygen IOTMP (discharge)
Mean weekly concentrations at downstream location above applicable criteria
--- App.
4-2-8 – 4-2-10
4-5 B
15C. Other water quality parameters
IOTMP (discharge)
No excursions for parameters with Florida Class III surface water criteria 6–7
App. 4-2-10 – 4- 2-12
--- B
16A. Factors impacting compliance (natural background)
IOTMP (discharge) No action needed --- --- --- ---
16B. Factors impacting compliance (anomalous rainfall)
IOTMP (discharge) No action needed --- --- --- ---
16C. Factors impacting compliance (vegetation conditions)
IOTMP (discharge) No action needed --- --- --- ---
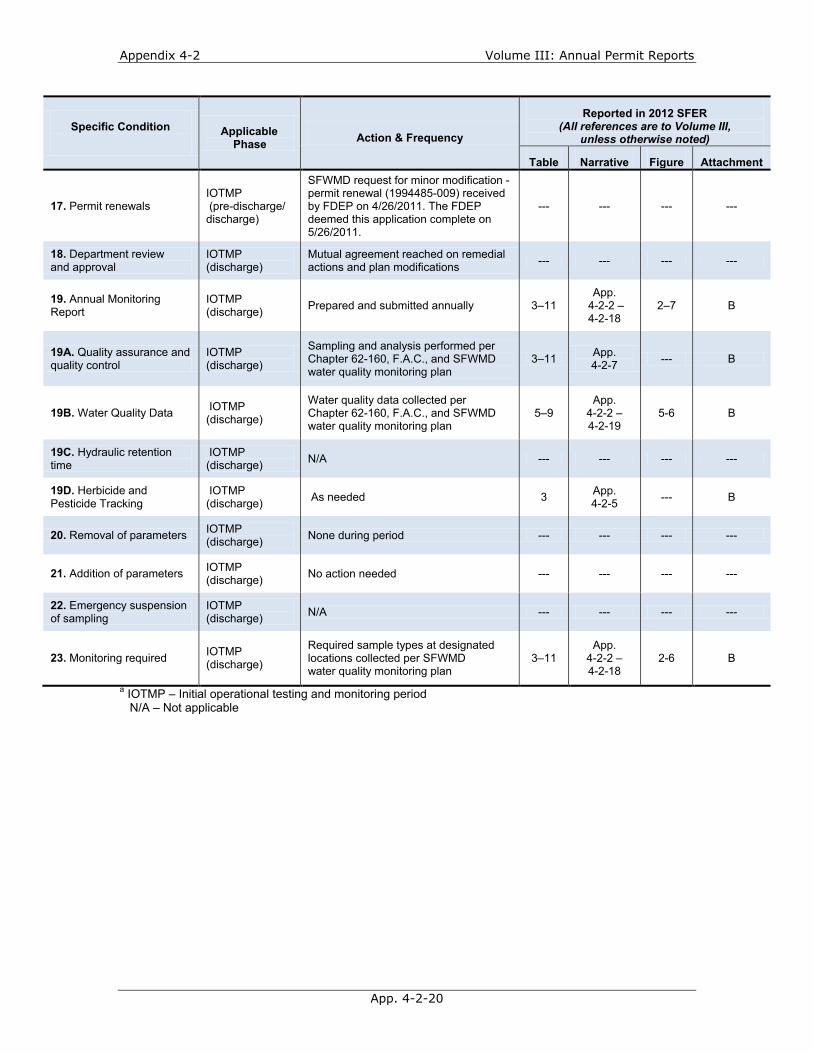
Table A-1. Specific conditions, actions taken, and cross-references presented for the Taylor Creek Stormwater Treatment Area Project
(Permit No. 0194485-001-GL) in this report.
Appendix 4-2 Volume III: Annual Permit Reports
App. 4-2-20
Specific Condition
Applicable
Phase Action & Frequency
Reported in 2012 SFER (All references are to Volume III,
unless otherwise noted)
Table Narrative Figure Attachment
17. Permit renewals IOTMP (pre-discharge/ discharge)
SFWMD request for minor modification - permit renewal (1994485-009) received by FDEP on 4/26/2011. The FDEP deemed this application complete on 5/26/2011.
--- --- --- ---
18. Department review and approval
IOTMP (discharge)
Mutual agreement reached on remedial actions and plan modifications --- --- --- ---
19. Annual Monitoring Report
IOTMP (discharge) Prepared and submitted annually 3–11
App. 4-2-2 – 4-2-18
2–7 B
19A. Quality assurance and quality control
IOTMP (discharge)
Sampling and analysis performed per Chapter 62-160, F.A.C., and SFWMD water quality monitoring plan
3–11 App. 4-2-7 --- B
19B. Water Quality Data IOTMP (discharge)
Water quality data collected per Chapter 62-160, F.A.C., and SFWMD water quality monitoring plan
5–9 App.
4-2-2 – 4-2-19
5-6 B
19C. Hydraulic retention time
IOTMP (discharge) N/A --- --- --- ---
19D. Herbicide and Pesticide Tracking
IOTMP (discharge) As needed 3 App.
4-2-5 --- B
20. Removal of parameters IOTMP (discharge) None during period --- --- --- ---
21. Addition of parameters IOTMP (discharge) No action needed --- --- --- ---
22. Emergency suspension of sampling
IOTMP (discharge) N/A --- --- --- ---
23. Monitoring required IOTMP (discharge)
Required sample types at designated locations collected per SFWMD water quality monitoring plan
3–11 App.
4-2-2 – 4-2-18
2-6 B
a IOTMP – Initial operational testing and monitoring period N/A – Not applicable
2012 South Florida Environmental Report Appendix 4-2
App. 4-2-21
Attachment B: Water Quality Data
This project information is required by Specific Conditions 19A and 19B of the Taylor Creek STA Permit No. 0194485-001-GL, and is available upon request.


![BASEPHESSU ={EAI' H ATTP&2']SFER ±S.SCF TEE '.' …...Tabulated heat transfer and pressure d_a__are not _oresented -_r,_ this report; they may be obtained as sho_m in Appendix A](https://img.pdfslide.net/doc/110x75/5e55e2aaebca547bfb68f0b2/basephessu-eai-h-attp2sfer-sscf-tee-tabulated-heat-transfer.jpg)