Embed Size (px)
Citation preview

Ansell Limited and SubsidiariesAppendix 4E
Preliminary Final Report for the year ended 30 June 2017
Appendix 4E
Preliminary Final Report
For the year ended 30 June 2017
Ansell Limited and Subsidiaries
ACN 004 085 330
Results for Announcement to the MarketUS$m
Revenue from ordinary activities from continuing operations 1,374.5 Revenue from ordinary activities from discontinued operations 225.2
Total revenue from ordinary activities up/(down) 1.7% to 1,599.7
Operating profit after tax attributable to members up/(down) (7.2)% to 147.7
Net profit for the period attributable to members up/(down) (7.2)% to 147.7
Dividends (distributions) Franked amount pershare
Dividend 23.75 ¢ Nil
Record date for determining entitlements to the dividend
Dividend Reinvestment Plan election cut off date
Dividend payment date
Net Tangible Asset backing2017 2016
US$m US$m
Shareholders' Equity attributable to Ansell Limited shareholders 1,210.9 1,121.0Less Intangible Assets 1,049.8 1,077.3Net Tangible Assets 161.1 43.7
No. Shares No. SharesTotal fully paid ordinary shares on issue (millions) 147.3 147.7Net tangible asset backing per ordinary share $1.09 $0.30
Refer to the accompanying Operating and Financial Review, ASX Announcement and Investor Presentation for commentary on the figures reported above.
Amount per share
21 August 2017
8 September 2017
22 August 2017
Appendix 4E - Page 1
For
per
sona
l use
onl
y

Ansell Limited and SubsidiariesAppendix 4E
Preliminary Final Report for the year ended 30 June 2017
Compliance statement
1 This report has been prepared in accordance with AASB Standards, other AASB authoritative pronouncements and Urgent Issues Group Consensus Views or other standards acceptable to the ASX.
2 This report, and the accounts upon which the report is based, use the same accounting policies.
3 This report does give a true and fair view of the matters disclosed.
4 This report is based on accounts which have been audited.
5 The entity has a formally constituted audit committee.
Signed: .................................................................................. Date 14 August, 2017.Company Secretary
Name: C. Stribley
Appendix 4E - Page 2
For
per
sona
l use
onl
y

PROTECTION REIMAGINED
Appendix 4E for the year ended
30 June 2017
For
per
sona
l use
onl
y

Map Key
Corporate offices
Operating facilities
Manufacturing and distribution facilities
Research and development facilities
Asia Pacific
Europe,Middle East and Africa
North America
Latin America and Caribbean
Operating and Financial Review
The World of Ansell
The world’s need for better protection never stops, so we are constantly researching, developing and investing to stay on the cutting edge of product innovation and new technologies. With our global presence, we are a market leader that continues to grow, through new-product development, acquisitions and the expansion of our footprint in emerging markets. Customers in 100 countries around the world trust Ansell and our protection solutions.
02
For
per
sona
l use
onl
y

Map Key
Corporate offices
Operating facilities
Manufacturing and distribution facilities
Research and development facilities
Asia Pacific
Europe,Middle East and Africa
North America
Latin America and Caribbean
Head office:Metro Park, New Jersey
Revenue
$628mAssets
$224m
North America
Head office:São Paulo, Brazil
Revenue
$94mAssets
$49m
Latin America and Caribbean (LAC)
Head office:Melbourne, Australia and Cyberjaya, Malaysia
Revenue
$168mAssets
$313m
Asia Pacific (APAC)
Head office:Brussels, Belgium
Revenue
$485mAssets
$180m
Europe, Middle East and Africa (EMEA)
Operating and Financial Review continued
03
For
per
sona
l use
onl
y

Organic Growth
Capital Deployment
Profitability & Cash Flow
Strategy & Focus
In-sourcing key materials
and technology
Strategic, disciplined
M&A
Lean Manufacturing
Operating and Financial Review continued
Innovate and grow new product sales
Grow share in emerging
markets
Build strong global brands
Develop stronger channel partnerships in focus verticals
Leverage core processes
for improved customer
service
Rationalising brands, SKUs, legal entities,
sites
Consistent dividend growth
High return capex enabling
growth and productivity
04
For
per
sona
l use
onl
y

StrategyAnsell has the global market leading position in single and multi-use hand protection for industrial end-users and in surgical gloves. We also have fast-growing positions in Industrial body protection products, safety solutions to the surgical operating room and an expanded offering in clean room laboratory environments.
The markets we focus on provide attractive long term sources of growth. Demand for improved protection of workers, whether in medical or industrial environments, is often driven by increased regulatory requirements or government initiatives to improve worker safety. This helps drive demand for advanced protection equipment in developed and emerging markets.
Ansell’s ability to build and maintain its leading positions in attractive markets arises from the following:
• The breadth and performance of our unmatched product range. Through our focus on R&D and innovation, we created many of these product categories and continue to lead the industry in product performance.
• Our unique material science capability allows us to provide solutions to the needs of protection with a product that is comfortable to use and improves worker productivity. Many of these capabilities are patent protected. For example, some products maximise protection whilst also reducing the risk of skin irritation and allergic reaction. Our commitment to maintaining optimum comfort and dexterity means that many products are unique in their field in having ergonomic certification. We also lead our industry in providing high cut protection from light weight yarns.
• We have invested over many years in our patented Guardian® technology (tools that provide comprehensive advice to end users on the right products to use for optimal safety and productivity) and so built strong relationships with end users.
• We are uniquely positioned to provide global solutions as the only industry participant with leading market positions in all our product ranges in all regions.
• Through a disciplined acquisition strategy we have:
– strengthened our core market positions,
– increased our ability to differentiate in material science, and
– added near adjacent product portfolios which we are demonstrating we can grow rapidly on a global basis.
Our business priorities for advancing our strategic goals in FY17 were oriented around the following main objectives:
• New product development.
• Grow emerging market footprint.
• Stronger brands, by expanding existing growth brands such as HyFlex® as well as recently acquired product ranges such as Microflex® and Microgard® globally.
• Build stronger and deeper partnerships with our key distributor partners.
• As capacity constraints are resolved in Medical, work to resume growth of our leading synthetic surgical range and reduce wastage levels in our key manufacturing plants.
• Continue improvement in service and quality metrics to ensure Ansell is the leading company globally on these criteria as well as in product performance.
• Ongoing productivity savings stemming from our past capex investments.
• Engage in a portfolio review of the core business, focusing on the longer term future of the SW business as well as evaluating growth opportunities within our business framework.
• Strategic and disciplined acquisition evaluation.
Our progress on these goals are detailed on the following pages.
Review of OperationsFinancial Reporting Presentation – Held for SaleAs a result of the announcement of the divestiture of our Sexual Wellness business (‘SW’) for $600 million, our reported results have been split between:
• Discontinued Operations – SW held for sale
• Continuing Operations
The sale also has implications for the reported results of the Continuing Operations as the central costs previously absorbed by SW have been allocated to the continuing GBU’s. In readiness for the SW sale, the group announced a transformational agenda for FY18 and beyond, which is expected to yield significant benefits from a simplified corporate structure as well as the implementation of other initiatives. These are discussed further in the outlook section and are expected to ensure that the higher cost allocation to Continuing Operations will only be temporary with the transformation program targeting cost savings that will more than offset this impact.
At Ansell, we believe in providing the necessary information to our investors to ensure that our financial statement commentary is meaningful and at all times provides relevant year over year comparatives. Given the above, commentary on the results will be on the group including the SW business, with commentary on EBIT generally on the GBU EBIT before corporate cost allocations as these provide the best like for like comparisons for the year.
Operating and Financial Review continued
05
For
per
sona
l use
onl
y

FY16
1,572.8
FX
13.2
NetAcquired/Exited4
15.0
FY16Pro-forma
1,544.6
Constant Currency (CC1) Growth 2.6%
SUIM2
GrowthBrands3
62.6
SUIMAll Other
16.4
SW2
8.8
FY17
1,599.7
Organic Constant Currency Growth 3.6%
Financial Summary
US$ millions FY16 FY17 % Change % CC Change1
Sales 1,573 1,600 +1.7% +2.6%
Profit before interest and tax (EBIT)4 237 218 -8.0% -6.0%
Profit for the period attributable to Ansell Ltd shareholders 159 148 -7.2% -5.0%
EPS (US ¢) 105.1 100.1 -4.8% -2.4%
EPS excluding portfolio review cost2 101.7 -3.2% -0.9%
Operating Cash Flow3 144.8 146.0 +0.8%
Dividend (US ¢) 43.5 44.0
1. CC denotes Constant Currency – compares FY17 to FY16 results restated at FY17 average FX rates and excludes the value of FX gains or losses in both periods. As such, it is non-IFRS financial information. The Board believes that this provides greater insight into the financial performance of the business by the removal of year on year foreign exchange volatility. The principles of constant currency reporting and its implementation are subject to oversight by the Audit and Compliance Committee of the Board.
2. Portfolio review costs are described in the Group EBIT commentary on the following page.
3. Operating Cash Flow, is Net cash provided by operating activities per the Consolidated Statement of Cash Flows adjusted for net expenditure on property, plant equipment, intangible assets and net interest.
4. EBIT is after corporate costs have been allocated.
Group Sales Commentary• Sales revenue was 1.7% higher as reported; this reflected an improved rate of organic revenue growth of 3.6% calculated after
excluding the negative effect of changes in currency rates on revenue (-0.9%) and divestments and acquisitions (-1%).
• Industrial achieved particularly strong results through the success of Growth Brands3. This was achieved through the rapid growth of new products and market share gains through our strengthened partnership with key distributors.
• Medical sales benefited from improved surgical glove revenue, with the business quickly returning to growth following the resolution of the manufacturing issues that limited product availability last year. Our leading synthetic surgical range grew 22%. This was offset somewhat by a decline in sales of lower margin examination gloves in less differentiated end markets.
• Our continued efforts on service and quality delivered a significant improvement in the service metrics important to our customers. We were pleased to see this recognised in a number of customer awards and it has been important to our strengthened strategic customer partnerships.
• The Sexual Wellness division continued its recent track record of strong growth, overcoming the uncertainty caused by the announcement of the portfolio review at the beginning of the year and the subsequent sale process.
• The year over year sales performance is summarised below.
Group Sales Bridge
Operating and Financial Review continued
1. CC denotes Constant Currency – which compares FY17 results to FY16, restated at FY17 average exchange rates and excluding the value of Foreign Currency gains and losses in both periods.
2. SUIM means Single Use, Industrial and Medical GBU. SW means Sexual Wellness GBU.
3. Growth brands composed of Industrial – HyFlex®, ActivArmr®, AlphaTec®, SolVex®, Edge®; Single Use – Microflex®, TouchNTuff®; Medical – GAMMEX®, ENCORE®, MEDIGRIP®, SANDEL®.
4. Net Acquired/Exited refers to the net impact of the FY17 acquisition of Nitritex less the FY16 disposal/exit of the Onguard, French retail and military businesses.
06
For
per
sona
l use
onl
y

Group EBIT CommentaryEBIT was down 7.5% from $237 million to $218 million for the year. A number of factors explain the decline in EBIT:
1. The net effect of acquisitions and divestments reduced EBIT by $10.7 million against a prior year result that included an $8 million gain recorded on the sale of the OnGuard business in May 2016.
2. Portfolio review costs of $3 million were incurred during FY17. These were one-off costs arising as a result of activities with a particular focus on identifying the optimal strategy for the continuing business and leading to the transformation program subsequently announced.
3. The Group saw significant raw material price increases that adversely affected profitability by $11.8 million. Price increases have now been implemented and are expected to offset this effect in FY18, however they had limited benefit to the current year.
4. Finally, our accrual for short-term and long-term employee incentives increased in comparison to FY16. The FY16 incentive expenses were lower on reduced STI achievement and the reduction in provisions for current and future year expected LTI achievement. Furthermore, the FY17 incentive expense increased on improved STI achievement. The LTI plan vesting in FY17 did not meet threshold, however provisions were made for expected future LTI vesting.
Excluding these factors, the business achieved profit growth arising from manufacturing process improvements, organic sales growth and strong cost control. These represent the majority of the Other column shown below.
A graphical summary of the key profit drivers is shown below.
Borrowing Costs and TaxesNet interest costs were up $0.5 million or 2.2%. The increase largely reflected the funding of the Nitritex acquisition for $56.1 million during the second half of the year.
Taxation expense of $44.9 million reflected an effective tax rate of 23%, slightly below the 24.5% rate from the prior year. The reduction in the effective rate was largely due to the significant tax expense incurred on the sale of the OnGuard business in FY16.
Cash Flow CommentaryFY17 demonstrated the continued strong cash generation profile of the Group. Net cash provided from operating activities at $216.2 million was lower, however this was more than offset by reduced capital expenditure against FY16. Other factors influencing cash flow included:
• Higher Tax payments as a result of the timing of taxation payments, a large part of which related to the one-off gain on sale of the Onguard business from FY16.
• Lower net receipts from operations, due in part to increased inventory levels in anticipation of higher go forward sales and also in support of desired customer service levels.
Cash outlays on investing activities were higher than FY16 despite lower expenditure on property, plant and equipment. The main increase related to the $56.1 million outlay for the acquisition of the Nitritex business, which completed in January 2017.
FY16Reported
236.7
FX
4.9
Incentive CashExpense Change
11.0
IncentiveProvisionChange
11.5
NetAcquired/Exited
10.7
FY16Pro-forma
198.7
Constant Currency Growth -6.0%
Raw MaterialInflation
11.8
PortfolioReviewCosts
3.0
EBIT Benefitfrom Sales
Growth
33.9
FY17Reported
217.8
FY17ex Portfolio
Review Costs
220.8
EBIT Benefit of Sale Growth less RM Inflation 11.2%
Operating and Financial Review continued
07
For
per
sona
l use
onl
y

Industrial – Global Business Unit +5%
Sales (organic constant currency)
0%Reported sales
% change
+4%EBIT before
corporate costs
-10%Reported EBIT
% change
08
For
per
sona
l use
onl
y

Industrial – Global Business Unit
Brands
Operating and Financial Review continued
The Industrial GBU manufactures and markets high-performance, hand and body protection solutions for a wide-range of Industrial applications. Ansell protects workers in almost every industry including Automotive, Chemical, Metal Fabrication, Machinery & Equipment, Food, Construction, Mining, and First Responders.
Sales PerformanceSales performance has been impacted by the sale of the OnGuardTM business in the prior year. Organic sales grew 5.2% after adjusting for OnGuardTM and constant currency.
• Growth Brands were up 13% on the back of strong gains in HyFlex® and AlphaTec®, whilst Edge® also made strong inroads, particularly in the emerging markets.
• New products grew 37% assisted by our innovative core technology platforms of INTERCEPTTM and FORTIXTM.
• Global channel partnership program continues to gain strength and momentum.
EBIT PerformanceEBIT was down 10.3% on the prior year as a result of an increased corporate cost allocation including a portion of the costs previously allocated to SW. EBIT before corporate costs was up 4%, with improved margins on the success of new products more than offsetting the negative impact of divestments and exits.
Record new product sales delivered +$128m
Almost 20 new HyFlex® products launched, including a series of the worlds thinnest cut plus oil protection products HyFlex® 11-93X Series.
Record core brand growth in addition to HyFlex®
HyFlex® sales up 10%
$235m
Edge® up 80%
AlphaTec® sales up 16%
$21m $13m
FY16 FY17 % change CC%
Sales 654.8 655.9 +0.2% +1.0%
EBIT 89.0 79.8 -10.3% -8.4%
EBIT/Sales 13.6% 12.2%
09
For
per
sona
l use
onl
y

Medical – Global Business Unit
Brands
Operating and Financial Review continued
The Medical GBU manufactures and markets surgical and examination gloves together with a range of healthcare safety devices such as disposable scalpels and antimicrobial surgical theater consumables. Its customer base includes Acute Care Hospitals, Emergency Services, Alternate Care, Dentistry & Veterinary clinics.
Sales PerformanceSignificant capacity was added to the production facilities for synthetic and powder-free surgical production lines over the past two years. These investments have seen:
• Surgical gloves up 6% with synthetic surgical gloves up 22%.
• New products grew 17% assisted by the US FDA ban on powdered gloves and growth in the SENSOPRENE® brand of 65%.
• Significant declines observed again in low-margin exam glove sales, particularly in the highly competitive acute vertical.
EBIT PerformanceEBIT was down 10.1% on the prior year as a result of an increased corporate cost allocation including a portion of the costs previously allocated to SW. EBIT performance benefited from the plant performance improvements and cost reduction initiatives stemming from the SmartPak packaging improvements. Furthermore, the business continued to effectively control its overheads with discretionary expenditures curtailed wherever possible. Unfortunately, higher raw material costs offset these improvements and EBIT before corporate costs level with last year.
Core growth brand sales +7%
New product sales
ENCORE®GAMMEX®
+10% +27%
New products growing 17%
+$75m
FY16 FY17 % change CC%
Sales 396.3 399.6 +0.8% +1.1%
EBIT 52.3 47.0 -10.1% -15.4%
EBIT/Sales 13.2% 11.8%
10
For
per
sona
l use
onl
y

+1%Sales (organic
constant currency)
+1%Reported
sales growth
0%EBIT before
corporate costs
-10%Reported
EBIT
Medical – Global Business Unit
11
For
per
sona
l use
onl
y

Single Use – Global Business Unit
+3%Sales (organic
constant currency)
+6%Reported
sales growth
-2%EBIT before
corporate costs
-2%Reported EBIT
% change
12
For
per
sona
l use
onl
y

Single Use – Global Business Unit
Brands
Operating and Financial Review continued
The Single Use GBU has the market leading range of high-performance single-use gloves used in a broad variety of applications including Chemical, Food Services, Life Sciences, Electronics, and Automotive After Market. The GBU was created subsequent to the acquisition of BarrierSafe Solutions International (BSSI) in January 2014.
Sales PerformanceSales were up 6.7% in constant currency terms, however this included the benefit of the Nitritex acquisition. Underlying organic growth was 3% for the year, with 8% year over year growth in the second half.
Key drivers of the growth included:
• Ongoing global expansion outside of North America. The new Microflex® global expansion products grew 19%.
• New products growing 25%, primarily on the back of the Microflex® global expansion and the new High Chem® launch.
• Emerging markets sales are accelerating strongly with 18% growth over the last three years.
EBIT PerformanceEBIT was down 2.3% on the prior year as a result of an increased corporate cost allocation including a portion of the costs previously allocated to SW. Furthermore, higher raw material costs and price reductions implemented earlier in the year also affected the EBIT result. Price increases have been communicated to customers and will begin to go into effect from July 2017.
Expanding Single Use internationally
Developing life sciences platform
Sales outside of North America
+19% growth
Emerging markets
+18% growth
New products
High Chem launch
Ansell global life sciences
$100m sales
FY16 FY17 % change CC%
Sales 301.7 319.0 +5.7% +6.7%
EBIT 64.6 63.1 -2.3% +0.2%
EBIT/Sales 21.4% 19.8%
13
For
per
sona
l use
onl
y

Sexual Wellness – Global Business Unit
Operating and Financial Review continued
The Sexual Wellness GBU (SW) manufactures, sells and markets a range of branded condoms, lubricants, devices and fragrances globally. It sells through retail outlets and also supplies condoms to public health programs globally. As discussed above, Ansell has reached an agreement to divest the SW business to a consortium consisting of Humanwell and CITIC Capital for $600 million. The sale is anticipated to settle by the end September 2017.
Sales PerformanceThe SW business once again delivered solid organic growth of 4.1% on a constant currency basis. Key drivers of growth included:
• Emerging markets growing at 7% with China and Brazil leading the way.
• Growth in China was assisted by e-commerce growth.
• Lubricant products growth under the already successful SKYN brand.
• New product sales growth at 22%.
EBIT PerformanceEBIT was up 29% on the prior year, which included the impact of the SW corporate allocation referred to earlier. EBIT before corporate costs was up 10.4% on the back of higher sales, however trading margins also improved due to the on-going focus on increasing high margin products coupled with strong cost control.
Brands
Lubricant sales up 8%
China – SKYN® and e-commerce
+30% growth
Strong demand in Brazil for SKYN®
post the Olympics
+21% growth
SKYN® is the No.1 non latex condom
in the world
No.1
FY16 FY17 % change CC%
Sales 220.0 225.2 2.4% 4.1%
EBIT 31.0 40.0 29.0% 33.3%
EBIT/Sales 14.1% 17.8%
14
For
per
sona
l use
onl
y

Material Business RisksAnsell has established controls and procedures that are focused on safeguarding the Group’s assets and the integrity of its reporting. The Group’s internal control processes cover accounting, financial reporting, safety and sustainability, fraud, delegations of authority and other control points. The risk management framework below summarises the Group’s approach to managing risk, including the identification, definition or establishment of risk appetite and monitoring of risks to that appetite.
Risk Management Framework
• Management establishes risk appetite (goals, metrics)
• Risk Committee and Board oversight
• Cascades through the organisation
Risk Appetite
• Identify major risks
• Risk mitigation process
• Risk appetite updated after feedback
Organisational Alignment
• Adherence to risk appetite
• Supports risk culture to ensure they are within acceptable tolerances
Resource and Adherence
• Organisational communication of strategies and objectives
• Clear communication of how much risk organisation will accept
Communication
Operating and Financial Review continued
15
For
per
sona
l use
onl
y

Material Risks – Description and Mitigation Actions
Risk Nature of Risk Mitigation Actions
Global markets instability The Group's presence in over 30 countries globally and its growing presence in emerging markets exposes the Company to geopolitical, regulatory and other factors beyond the Group's control.
• Continually monitor the Group's exposure to these risks through our local presence.
• Geographic diversification provides protection in itself.
Systems and technology Ansell relies on Information Technology (IT) platforms. Interruption, compromise to or failure of these platforms could affect Ansell's ability to service its customers effectively.
• Modern ERP systems are in place in the largest regions of North America and EMEA whilst also managing our supply chain. Disaster recovery plans are in place and tested regularly.
• These systems are progressively being deployed through the rest of the group.
• The Group has an active cyber risk management program, including conducting tests on the vulnerability of key systems and ongoing training to employees on their responsibility for mitigating cyber fraud risk.
Major incident at a significant manufacturing site or warehouse
The Group has a number of materially sized manufacturing sites and warehouses. These are vital to the business and financial losses from natural disasters, civil or labour unrest, terrorism, major fire or other incidence are possible.
• The Group has business continuity and disaster recovery plans for all major sites.
• Insurance coverage including business interruption cover.
• The Group monitors its overall exposure to individual sites and seeks to limit its dependence on any one site through dual sourcing strategies.
• Ongoing safety, fire preparedness and local country economic reviews are conducted.
Transformation change management The Group has announced a series of initiatives designed to improve the performance of the continuing business. With any change of this nature there is a risk of business disruption.
• A dedicated project management office has been established reporting to the CEO.
• Detailed communication plans are under way to ensure affected staff are clear on new roles and responsibilities.
• Contingency and risk management plans have been developed.
Foreign exchange risk Around half of the Group's revenues and costs are in currencies other than the US$. With volatile foreign exchange markets, significant changes can occur in foreign exchange rates and result in a significant impact on US$ earnings.
• The Group's foreign exchange risks and management strategies are detailed in Note 15 to the financial statements.
Product quality and reputational risk As a manufacturer, quality is paramount to the Group and failures in this area can have a significant negative effect on results and customer relationships.
• Investment in quality assurance and governance practices, including systematic quality assurance testing during and after the manufacturing and procurement process.
• Dedicated team of quality and regulatory staff monitor this.
Loss of a key supplier Raw materials purchased for manufacturing purposes and buying finished goods exposes the group to the risk of the failure of a supplier to perform leaving the Company short of a vital ingredient or product.
• Utilise dual sourcing strategy wherever feasible.
• In recent years there has also been a strategy of vertical integration which reduces dependency on third parties.
Operating and Financial Review continued
16
For
per
sona
l use
onl
y

OutlookAnsell organises its strategic priorities under the most important drivers for long-term shareholder value, being organic revenue growth, profitability and cash flow generation and successful deployment of capital.
Organic GrowthThe Group expects to build on the momentum seen in organic growth particularly in the second half of FY17, through a continuation of its existing growth strategy. New product launches at the end of FY17 and those planned for this year have been well received by customers and the Company expects to build on the success of its innovative Intercept yarn technology while also growing the unique chemically resistant single-use range. Continued growth in synthetic surgical gloves is also a priority.
Continued development and broadening of the distributor channel partnership program is expected to contribute to market share gains, particularly in developed markets. In emerging markets we will continue to increase our sales resource while also launching new products dedicated to emerging market customers.
Successful delivery of announced price increases is a further important objective to offset the impact of higher raw material costs.
Profitability and Cash Flow – Transformation AgendaThe primary driver to strengthened profitability and cash flow performance in the coming years is expected to be successful accomplishment of the transformation plan objectives.
The Group announced a streamlined organisation structure in which the Group would be organised around two Global Business Units (GBUs) being Industrial and Healthcare. Healthcare has been formed through the merger of the former Single Use and Medical GBUs. The simpler GBU structure will enable productivity gains in support functions and in the regional sales organisations while also improving the organisation’s agility and responsiveness to customers’ demands.
The Group will continue to target strong cash flow performance. A key priority of the transformational agenda is improved supply chain effectiveness, with a new global supply chain function bringing together all sales and operations planning, transportation, and distribution into a single global function. The objectives include further improvements in customer service, reduced distribution cost and cash flow benefits in excess of $30 million from higher inventory turnover.
The Group will seek to optimise its 13 global plants and more closely link them under the two GBU reporting lines. Site productivity initiatives will be implemented and the realignment of product manufacturing locations will ultimately lead to lower costs and improved flexibility and further enhance Ansell’s leadership in product performance and quality.
The Group will also accelerate its investments in technology and automation to support its fastest-growing and most innovative products. Step change improvements in manufacturing efficiencies will be implemented while creating the capacity to support continued market share gains in key target market verticals.
The total expenditure on the transformational program will be in the vicinity of $70 million to $100 million. Between $40 million to $50 million of this is targeted towards cost reduction initiatives and these are anticipated to yield annualised benefits of $30 million by FY20. Savings of approximately $5 million to $7 million are expected to be realised in FY18. Non-cash asset write-downs of $20 million to $30 million are also expected in the coming 30 months as older, less productive manufacturing lines are decommissioned. The balance of the investment will be on increased capital expenditure with benefits to be seen primarily in continued rapid growth arising from the Group’s product innovation strategy.
Capital DeploymentThe Group anticipates that the SW sale will be finalised by 30 September 2017, with net after-tax proceeds estimated to be $529 million. In addition to reducing the net interest expense for Ansell, the proceeds will also be used towards a $265 million share buy-back program that was announced in May 2017.
Furthermore, the Group will continue to carefully evaluate acquisition opportunities, with a number already in the pipeline for consideration.
Shareholder Value Creation
Capital Deployment
Organic Growth
Profitability & Cash flow
Operating and Financial Review continued
17
For
per
sona
l use
onl
y

This Report by the Directors of Ansell Limited (‘the Company’) is made for the year ended 30 June 2017. The information set out below is to be read in conjunction with the:
• Remuneration Report appearing on pages 25 to 58.
• Notes 20 and 21 to the financial statements, accompanying this Report.
Directors and SecretaryThe names and details of each person who has been a Director of the Company during or since the end of the financial year are:
• Glenn L L Barnes (Chairman)
• Magnus R Nicolin (Managing Director and Chief Executive Officer)
• John A Bevan (Deputy Chairman)
• Ronald J S Bell
• L Dale Crandall
• W Peter Day
• Leslie A Desjardins
• Marissa T Peterson
Particulars of the qualifications, experience and special responsibilities of each Director, as at the date of this Report, and of their other directorships, are set out on pages 23 and 24.
Details of meetings of the Company’s Directors (including meetings of Directors) and each Director’s attendance are also set out on page 19.
The Company Secretary was Alistair Grant, BA/LLB, LL. M, FGIA until his resignation effective 5 May 2017. Mr Grant was appointed to that position in October 2013. Mr Grant joined the Company in 2009, and has a legal background. He has held senior positions in the Corporate Head Office, including the position of Asia Pacific Regional Legal Counsel. Catherine Stribley, B.Com/LLB (Hons), was appointed as Company Secretary on 18 April 2017. Ms Stribley first joined the Company in 2010, and has held legal positions in both Australia and the United States, including Senior Counsel and Senior Counsel, IP.
Principal ActivitiesThe activities of Ansell Limited and its subsidiaries (‘the Group’) principally involve the development, manufacturing and sourcing, distribution and sale of gloves and protective personal equipment in the industrial and medical gloves market, as well as the sexual wellness category worldwide. In FY17, Ansell operated in four main business segments: Medical, Industrial, Single Use and Sexual Wellness.
Operating and Financial ReviewThe Operating and Financial Review for the Group for the financial year is set out on pages 2 to 17, and forms part of this Report.
State of AffairsDuring the year the Group continued to progress the strategies that have been identified to accelerate growth and create increased shareholder value. The Operating and Financial Review provides additional information on the Group’s growth strategies. Other than set out in the Operating and Financial Review, no significant changes occurred in the state of affairs of the Group during the financial year.
Likely DevelopmentsLikely developments in the operations of the Group are referred to on page 17 of this Report. In the opinion of the Directors, the disclosure of any further information about likely developments in the operations of the Group has not been included in the Report because disclosure of this information would likely result in unreasonable prejudice to the Group.
Significant Events Since Balance DateThe Directors are not aware of any significant matters or circumstances that have arisen since the end of the financial year that has affected or may affect the operations of the Group, the results of those operations or the state of affairs of the Group in subsequent financial years.
Report by the Directors
18
For
per
sona
l use
onl
y

Dividends and Share IssueThe final dividend of US 23.5 cents per share (unfranked) in respect of the year ended 30 June 2016 was paid to shareholders on 8 September 2016. An interim dividend of US 20.25 cents per share (unfranked) in respect of the half-year ended 31 December 2016 was paid to shareholders on 10 March 2017. A final dividend of US23.75 cents per share (unfranked) in respect of the year ended 30 June 2017 is payable on 8 September 2017 to shareholders registered on 21 August 2017. The financial effect of this dividend has not been brought to account in the financial statements for the year ended 30 June 2017 and will be recognised in subsequent financial reports. On 19 July 2016 the Company issued 4,000 shares; and on 29 June 2017 the Company issued 1,000 shares, each such issue being in respect of the conversion of partly-paid shares to fully paid shares under the Executive Share Plan. On 9 September 2016, the Company issued 132,678 shares under its Dividend Reinvestment Plan. On 10 March 2016, the Company issued 104,391 shares under its Dividend Reinvestment Plan. Details of unissued shares under option at the date of this Report and shares issued during or since the end of the financial year as a result of the exercise of options are set out in Note 13 to the financial statements, which accompany this Report.
Interests in the Shares of the CompanyThe relevant interests of each Director in the share capital of the Company, as at the date of this Report, as notified to the ASX Limited pursuant to the Listing Rules and Section 205G of the Corporations Act 2001, were:
G L L Barnes 63,478^
J A Bevan 18,728^
R J S Bell 18,740
L D Crandall 22,077
W P Day 28,838^
L A Desjardins 4,230
M T Peterson 23,647
M R Nicolin 251,783^
^ Beneficially held in own name or in the name of a trust, nominee company or private company.
Directors’ MeetingsThe following table sets out the number of Directors’ meetings (including meetings of Board Committees) held during the financial year and the number of meetings attended by each Director.
BoardAudit and Compliance
CommitteeRisk
CommitteeHuman Resources
CommitteeGovernance Committee
Held Attended Held Attended Held Attended Held Attended Held Attended
G L L Barnes 7 7 6 6 3 3
R J S Bell1,2,3 7 7 1 1 1 1 4 4 2 2
J A Bevan 7 7 4 4 6 6 3 3
L D Crandall 7 7 4 4 4 4
W P Day 7 7 4 4 4 4
L Desjardins4,5 7 7 4 4 3 3 2 2 1 1
M T Peterson6,7 7 7 3 3 4 4 2 2
M R Nicolin 7 7
Held – Indicates the number of meetings held while each Director was a member of the Board or Committee.
Attended – Indicates the number of meetings attended during the period that each Director was a member of the Board or Committee.
In February 2017, the Board made changes to the Chairs and Members of the Board Committees for the purposes of both planning for the future and refreshing the Committees. The above table incorporates these changes.
1. Mr Bell was Chair of the Human Resources Committee and remained a member until 10 February 2017.
2. Mr Bell was appointed Chair of the Risk Committee and a member of the Audit & Compliance Committee on 10 February 2017.
3. Mr Bell was a member of the Governance Committee until 10 February 2017.
4. Mrs Desjardins was a member of the Risk Committee until 10 February 2017.
5. Mrs Desjardins was appointed to the Human Resources Committee and the Governance Committee on 10 February 2017.
6. Mrs Peterson was Chair of the Risk Committee and a member of the Audit & Compliance Committee until 10 February 2017.
7. Mrs Peterson was appointed Chair of the Human Resources Committee on 10 February 2017.
In June 2016, the Board resolved to form a Sub-Committee of the Board lead by Mr John Bevan and comprised of Mr Glenn Barnes, Mrs Leslie Desjardins, Mr Dale Crandall and Mr Magnus Nicolin to review M&A and divestment opportunities – including related business transformation. This Sub-Committee met 12 times during FY17. All M&A Sub-Committees are excluded from the number of meetings noted above.
Audit and Compliance Committee, Risk Committee and Human Resources Committee meetings were attended by all Directors.
Report by the Directors continued
19
For
per
sona
l use
onl
y

Corporate GovernanceThe Board of Ansell Limited believes that a strong corporate governance framework helps to underpin a strong company. Ansell’s corporate governance policies and practices are set out in the Corporate Governance Statement. We have provided a summary of the Company’s Corporate Governance practices in the Annual Report, and the full Statement, which sets out the extent to which Ansell’s policies and practices comply with the requirements of the ASX Corporate Governance Council’s Corporate Governance Principles and Recommendations, can be found at www.ansell.com.
Performance in Relation to Environmental RegulationsGroup entities are subject to environmental regulation in the jurisdictions in which they operate. The Group has risk management programs in place to address the requirements of the various regulations. From time to time, Group entities receive notices from relevant authorities pursuant to local environmental legislation. On receiving such notices, the Group evaluates potential remediation or other options, associated costs relating to the matters raised and, where appropriate, makes provision for such costs. The Directors are not aware of any material breaches of Australian or international environmental regulations during the year.
The Board monitors compliance with the Group’s environmental policies and practices, and believes that any outstanding environmental issues are well understood and are being actively managed. At the date of this Report, any costs associated with remediation or changes to comply with regulations in the jurisdictions in which Group entities operate are not considered material.
IndemnityUpon their appointment to the Board, each Director enters into a Deed of Access, Indemnity and Insurance with the Ansell Group. These Deeds provide for indemnification of the Directors to the maximum extent permitted under law. They do not indemnify for any liability involving a lack of good faith. No Director or officer of the Group has received the benefit of an indemnity from the Group during or since the end of the year. Rule 61 of Ansell’s Constitution also provides an indemnity in favour of officers (including the Directors and Company Secretary) of the Group against liabilities incurred while acting as such officers to the extent permitted by law. In accordance with the powers set out in the Constitution, the Group maintains a Directors’ and Officers’ insurance policy. Due to confidentiality obligations and undertakings of the policy, no further details in respect of the premium or the policy can be disclosed.
Report by the Directors continued
20
For
per
sona
l use
onl
y

Lead Auditor’s Independence Declaration under Section 307C of the Corporations Act 2001
To the Directors of Ansell Limited
I declare that, to the best of my knowledge and belief, in relation to the audit of Ansell Limited for the financial year ended 30 June 2017 there have been:
(i.) no contraventions of the auditor independence requirements as set out in the Corporations Act 2001 in relation to the audit; and
(ii.) no contraventions of any applicable code of professional conduct in relation to the audit.
KPMG
Alison KitchenPartner
Melbourne14 August 2017
Auditor Independence
Liability limited by a scheme approved under Professional Standards Legislation.
KPMG, an Australian partnership and a member firm of the KPMG network of independent member firms affiliated with KPMG International, a Swiss Cooperative.
Report by the Directors continued
21
For
per
sona
l use
onl
y

Non-audit Services
During the year, the Group’s auditor, KPMG, was paid the following amounts in relation to non-audit services provided by KPMG:
Advisory services $132,016
Taxation and other services $6,647
Other audit and assurance services $2,140
The Directors are satisfied that the provision of such non-audit services is compatible with the general standards of independence for auditors imposed by, and do not compromise the auditor independence requirements of, the Corporations Act 2001 in view of both the amount and the nature of the services provided and that all non-audit services were subject to the corporate governance procedures adopted by the Group and have been reviewed by the Audit and Compliance Committee to ensure they do not impact the integrity and objectivity of the Auditor.
RoundingThe Group is a company of the kind referred to in Australian Securities and Investments Commission Instrument 2016/191 dated 31 March 2016 and, in accordance with that Instrument, unless otherwise shown, amounts in this Report and the accompanying financial statements have been rounded off to the nearest one hundred thousand dollars.
This Report is made in accordance with a resolution of the Board of Directors made pursuant to Section 298(2) of the Corporations Act 2001 and is signed for and on behalf of the Directors.
G L L BarnesDirector
M R NicolinDirector
Dated in Melbourne this 14 day of August 2017
Report by the Directors continued
22
For
per
sona
l use
onl
y
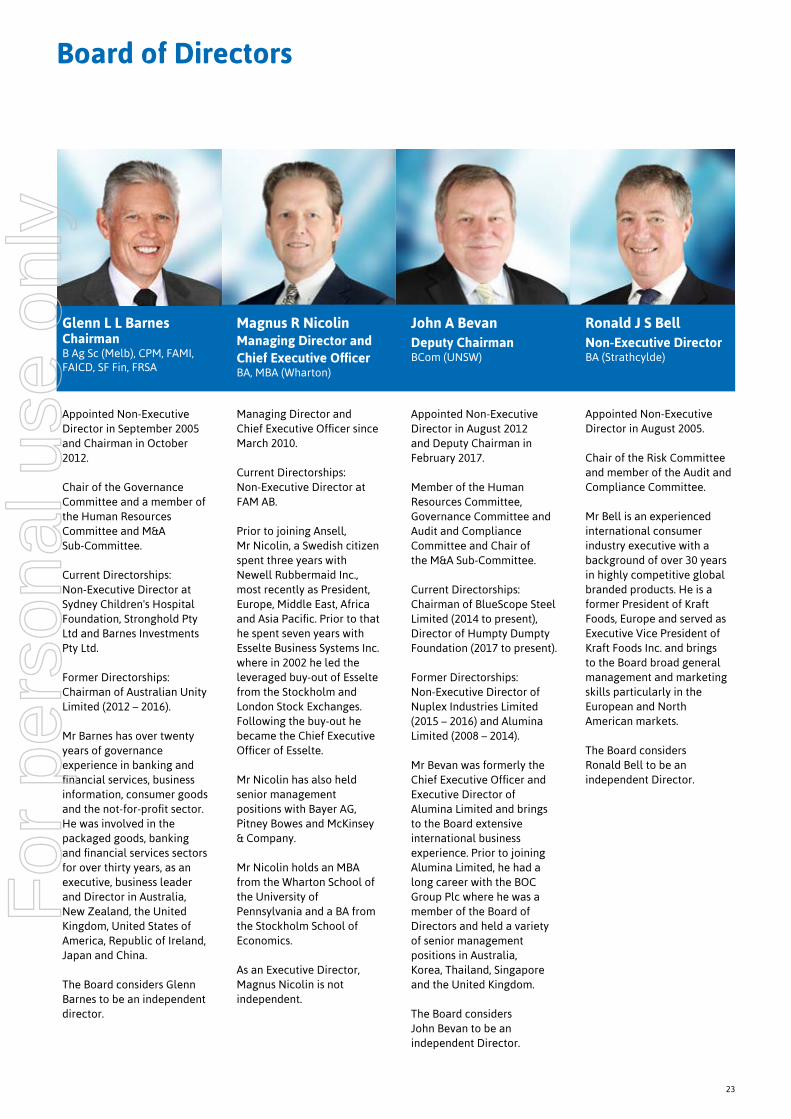
Board of Directors
Glenn L L Barnes ChairmanB Ag Sc (Melb), CPM, FAMI, FAICD, SF Fin, FRSA
Magnus R Nicolin Managing Director and Chief Executive OfficerBA, MBA (Wharton)
Ronald J S Bell Non-Executive DirectorBA (Strathcylde)
Appointed Non-Executive Director in September 2005 and Chairman in October 2012.
Chair of the Governance Committee and a member of the Human Resources Committee and M&A Sub-Committee.
Current Directorships: Non-Executive Director at Sydney Children's Hospital Foundation, Stronghold Pty Ltd and Barnes Investments Pty Ltd.
Former Directorships: Chairman of Australian Unity Limited (2012 – 2016).
Mr Barnes has over twenty years of governance experience in banking and financial services, business information, consumer goods and the not-for-profit sector. He was involved in the packaged goods, banking and financial services sectors for over thirty years, as an executive, business leader and Director in Australia, New Zealand, the United Kingdom, United States of America, Republic of Ireland, Japan and China.
The Board considers Glenn Barnes to be an independent director.
Managing Director and Chief Executive Officer since March 2010.
Current Directorships: Non-Executive Director at FAM AB.
Prior to joining Ansell, Mr Nicolin, a Swedish citizen spent three years with Newell Rubbermaid Inc., most recently as President, Europe, Middle East, Africa and Asia Pacific. Prior to that he spent seven years with Esselte Business Systems Inc. where in 2002 he led the leveraged buy-out of Esselte from the Stockholm and London Stock Exchanges. Following the buy-out he became the Chief Executive Officer of Esselte.
Mr Nicolin has also held senior management positions with Bayer AG, Pitney Bowes and McKinsey & Company.
Mr Nicolin holds an MBA from the Wharton School of the University of Pennsylvania and a BA from the Stockholm School of Economics.
As an Executive Director, Magnus Nicolin is not independent.
Appointed Non-Executive Director in August 2005.
Chair of the Risk Committee and member of the Audit and Compliance Committee.
Mr Bell is an experienced international consumer industry executive with a background of over 30 years in highly competitive global branded products. He is a former President of Kraft Foods, Europe and served as Executive Vice President of Kraft Foods Inc. and brings to the Board broad general management and marketing skills particularly in the European and North American markets.
The Board considers Ronald Bell to be an independent Director.
John A Bevan Deputy ChairmanBCom (UNSW)
Appointed Non-Executive Director in August 2012 and Deputy Chairman in February 2017.
Member of the Human Resources Committee, Governance Committee and Audit and Compliance Committee and Chair of the M&A Sub-Committee.
Current Directorships: Chairman of BlueScope Steel Limited (2014 to present), Director of Humpty Dumpty Foundation (2017 to present).
Former Directorships: Non-Executive Director of Nuplex Industries Limited (2015 – 2016) and Alumina Limited (2008 – 2014).
Mr Bevan was formerly the Chief Executive Officer and Executive Director of Alumina Limited and brings to the Board extensive international business experience. Prior to joining Alumina Limited, he had a long career with the BOC Group Plc where he was a member of the Board of Directors and held a variety of senior management positions in Australia, Korea, Thailand, Singapore and the United Kingdom.
The Board considers John Bevan to be an independent Director.
23
For
per
sona
l use
onl
y

Leslie A DesjardinsNon-Executive DirectorB. Industrial Admin (Kettering), MS (MIT)
L Dale CrandallNon-Executive DirectorCPA, MBA (UC Berkeley)
W Peter Day Non-Executive DirectorLLB (Hons), MBA (Monash), FCPA, FCA, FAICD
Appointed Non-Executive Director in November 2015.
Member of the Audit and Compliance Committee, Human Resources Committee, Governance Committee and M&A Sub-Committee.
Former Directorships: Aptar Group (2012 – 2015) Mrs Desjardins is an experienced international finance executive with a focus on business performance and growth. Mrs Desjardins was formerly a Director of Aptar Group and Chief Financial Officer for Amcor Limited. Mrs Desjardins held various executive roles at General Motors Corporation, including Chief Financial Officer, General Motors Holden and Controller for General Motors North America. She has extensive experience in finance, strategy, government relations and global operations. Mrs Desjardins currently serves on the Terry Fox Cancer Foundation Audit Committee.
The Board considers Leslie Desjardins to be an independent Director.
Appointed Non-Executive Director in November 2002.
Member of the Audit and Compliance Committee, Risk Committee and M&A Sub-Committee. Special Advisor for mergers and acquisitions.
Current Directorships: Director of Bridgepoint Education Inc. (2008 to present) and Endurance International Group, Inc (2013 to present).
Mr Crandall has a background in accounting and finance, and is a former Group Managing Partner for Southern California for Price Waterhouse. He was formerly President and Chief Operating Officer of Kaiser Foundation Health Plan and Hospitals in the United States and lead trustee of The Dodge and Cox Mutual Funds.
The Board considers Dale Crandall to be an independent Director.
Appointed Non-Executive Director in August 2007.
Chair of the Audit and Compliance Committee and member of the Risk Committee.
Current Directorships: Alumina Limited (2014 to present), Australian Unity Investment Real Estate Limited (2015 to present), Boart Longyear Limited (2014 to present).
Former Directorships: SAI Global Limited (2008 – 2016), Orbital Corporation Limited (2007 – 2014), Centro Retail and Federation Centres (2009 – 2014).
Mr Day was formerly Chief Financial Officer of Amcor Limited for seven years, and Chief Financial Officer and Executive Director Finance of Bonlac Foods Limited. He also has held senior office and executive positions in the Australian Securities Commission (Deputy Chair), Rio Tinto, CRA and Comalco. He is also involved with disability services and education initiatives. He has a background in finance and general management across diverse and international industries.
The Board considers Peter Day to be an independent Director.
Marissa T Peterson Non-Executive DirectorBSc (MECH), MBA (Harvard), Hon Doctorate (MGMT)
Appointed Non-Executive Director in August 2006.
Chair of the Human Resources Committee and member of the Risk Committee.
Current Directorships: Chair of Oclaro Inc. (2011 to present) and Director of Humana Inc. (2008 to present) Mrs Peterson currently runs Mission Peak Executive Consulting, an executive coaching and consulting firm specialising in helping develop, grow and scale leaders in the high technology space. Mrs Peterson retired from full-time executive roles in 2006, having spent 18 years with Sun Microsystems in senior executive positions. She has extensive experience in supply chain management, manufacturing and quality, logistics, information technologies, customer advocacy and leadership development.
The Board considers Marissa Peterson to be an independent Director.
Board of Directors
24
For
per
sona
l use
onl
y

Remuneration Report
Contents1. At a Glance
2. Remuneration Governance
3. Remuneration Policy
Philosophy and Strategy
Framework
Remuneration Mix
4. Group Performance and Remuneration Outcomes
Group Performance
Realised Pay
Remuneration Policy and How it was Operated for FY17
5. Statutory Information
Executive Service Agreements
Mandatory Shareholding Guidelines
Share Trading Policy
Executive Director Statutory Remuneration
6. Executive Director Equity Instruments
Non-Executive Directors
Non-Executive Director’s Fees
Non-Executive Directors Statutory Remuneration
Non-Executive Directors Shares
7. Glossary
25
For
per
sona
l use
onl
y

Remuneration Report
Chairman’s letter
Dear Shareholders
On behalf of the Board of Directors, we are pleased to present Ansell’s Remuneration Report for the financial year ended 30 June 2017.
The remuneration of Ansell’s Key Management Personnel (KMP) for FY17 is detailed in the following pages.
Looking Back on the Changes Made in the 2017 Financial YearLast year we announced a number of important changes to Ansell’s remuneration policy. The objectives of these changes were to:
• better align incentives with our strategic objectives;
• have a remuneration framework that operates and is competitive in the global environment;
• continue to attract, retain and reward our executive team; and
• take into account feedback from our shareholders.
These changes included:
• deferral of a portion of STI awards into equity restricted for two years – ensuring that the short term performance that resulted in the STI outcomes was achieved in a sustainable manner;
• more challenging vesting schedules for the STI and LTI plans where vesting reward levels of performance now starts at 0% of base salary;
• all LTI awards being delivered in equity for all Executive KMP participants to provide greater alignment with shareholders;
• the introduction of new LTI performance measures and a revised performance gateway more focused and aligned with our long term goals; and
• the assessment of performance measures on a constant currency basis to not reward or unduly penalise for currency fluctuations that may otherwise mask underlying performance.
These changes were successfully implemented in FY17.
Company Performance and Remuneration in the 2017 Financial YearThe Ansell Board is committed to transparency around our remuneration practices and ensuring that shareholders are made fully aware of the link between financial results, performance against our long term strategic goals and executive remuneration outcomes.
Despite a continued uneven economic backdrop across our global markets and continued political uncertainties, the Ansell business has continued to make significant strategic progress and has recorded solid business results.
The outcomes of our FY17 STI program for our executive KMP reflected our performance against targets set for performance on sales, EBIT, Profit Attributable, Inventory turns and Operating Cash Flow. Recognising that the proceeds from selling the Sexual Wellness (SW) business will not be recorded until FY18 and in order to not unfairly penalise management, transaction costs related to the portfolio review and SW sale that were incurred in 2017 have been excluded from the financial measures (as applicable) used to determine the STI outcomes this year. Disappointingly our earnings per share growth over the past three years did not meet the threshold of the FY15 LTI grant targets, and accordingly executives will receive no payout from that grant.
26
For
per
sona
l use
onl
y

Structural Change in the Size and Profile of the Group and its Effect on RemunerationThe 2017 financial year was a significant one in terms of the direction of Ansell. The following major announcements were made:
• in May 2017, Ansell announced that it has executed a binding agreement for the sale of its SW business for US$600 million to Humanwell Healthcare (Group) Co. Ltd. and CITIC Capital China. We expect to conclude the transaction by September 2017;
• the acquisition of Nitritex in January 2017 for approximately $56 million.
As a first step in business transformation, the company announced on 20 July 2017 a new organisational and operational structure that will create the necessary focus on key drivers of growth and profitability while also reducing overhead cost and redirecting resources towards the most important priorities.
It should be noted that the divestment is expected to generate a sizeable statutory profit in FY18 which is of significant benefit to our shareholders. The Board could, had it determined remuneration outcomes in an unadjusted manner, provided management with a sizeable windfall gain in terms of the assessment of performance. While management have successfully sold this one hundred year old business, its value is attributable to all of the hard work of Ansell employees over the past century and it seemed unfair to allow the last Ansell management team to oversee this business, to benefit from that sizeable profit.
The Board have therefore determined that the gain will be excluded from the assessment of the FY18 incentive awards.
The Board has however, determined that the plans on foot, being the FY16 and FY17 grants, be adjusted to reflect the planned divestment of the SW business. This is explained in detail on page 44.
Ansell – An Australian Listed, Global OrganisationIn reading our report, we encourage our shareholders to remember that Ansell is one of a small group of ASX listed companies that is highly global in its structure and operations and its executive remuneration framework must take this into account. While Australian listed:
• Ansell has four management hubs in the United States, Belgium, Malaysia and Australia;
• Ansell operates in local currencies, reports in US dollars and usually remunerates executives in the local currencies in which the Executive is located (exposing Ansell and its executives to international currency fluctuations); and
• Consistent with the fact that 95% of Ansell revenue and all products are manufactured outside Australia, all of Ansell’s Executive KMP are located outside of Australia, as are nearly all our employees and our operations.
Ansell's performance is affected by global (in addition to Australian) economic conditions including currency fluctuations. Attracting, motivating and retaining a talented global workforce requires our remuneration practices to be globally competitive, regionally appropriate and flexible.
We hope that you find this year’s remuneration report informative and we encourage you to open a dialogue with us where you require further clarification on anything in the report.
On behalf of the Directors, we look forward to welcoming you to the 2017 AGM.
Marissa PetersonChairman of the HR CommitteeAnsell Limited
Remuneration Report continued
27
For
per
sona
l use
onl
y

Section 1 – At a GlanceAnsell’s Remuneration Practice for FY17The table below sets out how the pay policy was operated during FY17
Element of pay Objective How we implemented policy for FY17
Base salary Provide market-competitive base salaries, which reflect the skills and experience of the individual.
Increases in the range of 0% to 5% were made effective October 2016.
Retirement and other benefits Provide cost-effective retirement provisions and other benefits which reflect the market norms in the jurisdiction in which the individual is based.
Contributions to relevant pension plans. Benefits vary depending on location and the circumstances of the individual.
STI Incentivise and reward for the delivery of annual performance goals.
Based on financial measures; Sales, EBIT, Operating Cash Flow, Profit Attributable Inventory targets and individual objectives.
Part payable in cash with the remainder deferred into shares, with restrictions for two years.
LTI Incentivise and reward for long-term, sustained performance, aids retention and aligns participants with shareholders.
Three year performance period, subject to three performance measures; EPS, (with ROCE gateway) Organic Growth, and ROCE. The LTI is payable in shares.
Shareholding requirements Align interests with shareholders and encourage long-term thinking.
Progress towards targets is monitored.
FY17 STI Performance Measures and Weights
Other KMP
Sales 35%
Individual 10%
InventoryTurns 20%
EBIT 35%
CEO & CFO
Sales 35%
Individual 10%
Profit Attributable 10%
OperatingCash Flow 10%
EBIT 35%
Remuneration Report continuedRemuneration Report continued
28
For
per
sona
l use
onl
y

FY17 STI Outcomes
Metric Performance FY17 STI Payout Realised
Sales (all KMP) Magnus R Nicolin 67% of max
Neil Salmon 65% of max
Peter Dobbelsteijn 52% of max
Steve Genzer 53% of max
Jeyan Heper 55% of max
Joe Kubicek 52% of max
Anthony Lopez 51% of max
Mark Nicholls 52% of max
EBIT (all KMP)
Operating Cash Flow (CEO & CFO only)
Profit Attributable (CEO & CFO only)
Inventory Turns (KMP excluding CEO & CFO)
Performance Outcomes Under the FY15 LTI (Performance Measured FY15-17)Awards granted in FY15, were subject to a three-year EPS growth measure, which was assessed based on performance ended FY17. Based on the EPS performance of the Group for FY17, nothing is deemed to be payable under this award and it therefore lapses for all participants.
Mid
0% Max
Mid
0% Max
Mid
0% Max
Mid
0% Max
Mid
0% Max
Mid
0% Max
Mid
0% Max
Mid
0% Max
Mid
0% Max
Mid
0% Max
Mid
0% Max
Mid
0% Max
Remuneration Report continued
29
For
per
sona
l use
onl
y

Section 2 – Remuneration governanceIntroductionThe Directors of Ansell Limited (Ansell) present the Remuneration Report (Report) prepared in accordance with Section 300A of the Corporations Act for the Group for the financial year ended 30 June 2017. This Report, which has been audited by KPMG, forms part of the Report of the Directors.
The Report outlines the remuneration arrangements in place for the Non-Executive Directors and Executive KMP of Ansell being those executives who have authority and responsibility for planning, directing and controlling the activities of the Group. In this Report, ‘Executives’ refers to members of the Group Executive team identified as KMP.
Role of the Human Resources CommitteeAnsell’s approach to Executive remuneration is founded on the principle that rewards should reflect Group performance. The Human Resources Committee (HRC) is responsible for ensuring that our Executive remuneration philosophy, strategy and policies are designed with this objective in mind.
Our governance framework for determining executive remuneration is outlined below:
BoardThe Board is responsible for:
• defining Ansell’s remuneration strategy
• determining the structure and quantum of remuneration for the CEO and Other Executives that support and drive the achievement of Ansell’s strategic objectives.
The Board has an overarching discretion with respect to the awards given under Ansell’s incentive plans.
Consultation with Shareholders and Other Stakeholders
Remuneration Consultants and Other External Advisors
• Management may seek its own independent advice with respect to information and recommendations relevant to remuneration decisions.
Remuneration Consultants and Other External Advisors
• Provide independent advice, information and recommendations relevant to remuneration decisions.
• In performing its duties and making recommendations to the Board, the Chairman of the HRC seeks independent advice from external advisors on various remuneration related matters.
• Any advice provided by external advisers are used to assist the Board – they do not substitute for the Board and HRC process.
HRCThe HRC is delegated responsibility by the Board to review and make recommendations on the remuneration policy, strategy and structure for Ansell’s Board members and Executives.
The HRC has in place a process of engaging and seeking independent advice from external remuneration advisors and ensures remuneration recommendations are free from undue influence by management.
ManagementProvides information relevant to remuneration decisions and makes recommendations to the HRC.
Obtains remuneration information from external advisors to assist the HRC (i.e. market data, legal advice, accounting advice, tax advice).
Remuneration Report continuedRemuneration Report continued
30
For
per
sona
l use
onl
y

KMPs Comprising The Board of Directors and ExecutivesThe following table details Ansell’s Board of Directors and KMP during FY17:
Non-Executive Directors Location of Board Member Role
Glenn L L Barnes Australia Chairman, Independent Non-Executive Director
John Bevan Australia Deputy Chairman, Independent Non-Executive Director
Ronald J S Bell United Kingdom Independent Non-Executive Director
L Dale Crandall 1 United States Independent Non-Executive Director
W Peter Day Australia Independent Non-Executive Director
Leslie A Desjardins United States Independent Non-Executive Director
Marissa T Peterson United States Independent Non-Executive Director
Executive Director Location of Executive Role
Magnus R Nicolin Belgium Managing Director (MD) and Chief Executive Officer (CEO)
Other KMPs Location of Executive Role
Neil Salmon Belgium Chief Financial Officer (Finance and IT)
Peter Dobbelsteijn Belgium Chief Commercial Officer EMEA and APAC Region and Ansell Global Guardian
Steve Genzer United States President and General Manager Industrial Solutions GBU
Jeyan Heper Belgium President and General Manager Sexual Wellness GBU
Joe Kubicek United States President and General Manager Single Use GBU
Anthony Lopez United States/Belgium President and General Manager Medical GBU
Mark Nicholls United States Chief Commercial Officer Americas
1. Will retire on 20 October 2017.
External consultantsFrom time to time during the financial year ended 30 June 2017, the Group engaged external consultants to provide insights on remuneration trends, regulatory and governance updates and market data in relation to the remuneration of Non-Executive Directors, the CEO and Other Executives. During the year the HRC engaged 3 Degrees to provide independent advice on the overall pay policy, advice on the drafting of the Remuneration Report and ad-hoc advice on market practice and regulatory trends.
3 Degrees was acquired by KPMG, the Group's external auditor, effective April 2017. The Board considered the independence of 3 Degrees (now KPMG) and the potential for any conflict and determined there was no compromise of audit independence.
Shareholder engagementThe HRC maintains a regular dialogue with major shareholders and relevant institutional investor bodies. The views and opinions expressed are considered when determining remuneration. The HRC monitors trends and developments in corporate governance and market practice to ensure the structure of executive remuneration remains appropriate. The HRC would undertake a consultation process in advance of any material changes to the remuneration policy.
Remuneration Report continued
31
For
per
sona
l use
onl
y

Section 3 – Remuneration policyPhilosophy and strategyOur remuneration philosophy links the achievement of our strategic objectives and corporate plans with appropriate and measured rewards for our Executives.
Our governing principles are summarised below:
Offer competitive levels of remuneration in the relevant employment marketplace in which the employee is based to attract and retain the best talent available. These remuneration arrangements are truly global, not those traditionally adopted by most of our predominantly Australian operating ASX peers.
Support high performance culture by setting appropriately challenging performance objectives that drive the generation of shareholder value and link rewards to the achievement of those objectives and provide the largest part of the remuneration package ‘at risk’.
Balance the reward for superior performance against short-term goals with rewards that are delivered in a manner that supports generation of superior, sustainable shareholder returns over the longer term.
Apply a pay-for-performance philosophy that directly links Executive reward to the achievement of Ansell and business unit operating results and performance against strategic goals both annually and over the longer term.
Provide a portion of total remuneration in the form of Ansell equity and maintain market leading shareholding guidelines to support alignment with shareholders and encourage long-term thinking.
Ensure competitiveness in base salary and total salary package
Support a performance culture
Balance short and long term performance
Link rewards to business results
Significant equity component to align with shareholders
ANSELL’S EXECUTIVE KMP REMUNERATION
Remuneration Report continuedRemuneration Report continued
32
For
per
sona
l use
onl
y

The remuneration design and quantum for our Executives is determined by fit for purpose contemporary criteria as well as reviewing what is generally paid for similar roles in similar businesses in the relevant geographic locations – the locations where the Executives reside and work. While Ansell is publicly listed on the ASX, it generates returns across many currencies and reports in US dollars, more than 95% of its revenue is derived outside of Australia and it is active in a diverse range of geographies. None of our Executives are based in Australia, with their locations being our Global Hubs in the United States and Belgium. As such, the mix of remuneration for individual Executives aims to be reflective of prevailing best practice and market conditions in the region in which the Executive is based. When setting the appropriate pay structure and quantum the Board will consider data from multiple sources covering different geographies (including Australia, Europe and the US). On occasion this may result in packages which have a higher potential quantum than those in a purely Australian focused company of a similar size, but the Board considers that this is both necessary and appropriate to recruit, retain and motivate high caliber individuals in the markets in which Ansell operates.
The policy set out on the following pages is cascaded to other members of the senior management team as appropriate. For those operating in individual units, there will be some reference to regional or business unit financial performance, but they will retain a link to Group level results. The LTI is targeted at those key individuals who have the potential to influence Group level performance.
Our Remuneration Policy and Strategy document is available on our website at the following link www.ansell.com/en/About/Investor-Center/Corporate-Governance-and-Corporate-Governance-Statement.aspx.
Remuneration framework componentsOur executive remuneration framework which was used for FY17 and will be followed for FY18 consists of the following components:
• base salary, pension contributions and other employment benefits, collectively known as Fixed Annual Remuneration (FAR);
• a Short Term Incentive (STI) plan; and
• a Long Term Incentive (LTI) plan.
The diagram on the following page outlines the link between the components of remuneration for Executives, the relevant performance conditions and the strategic objectives of Ansell which these components were designed to achieve. Further information on each of these components can be found in Section 4.
Section 3 – Remuneration policyPhilosophy and strategyOur remuneration philosophy links the achievement of our strategic objectives and corporate plans with appropriate and measured rewards for our Executives.
Our governing principles are summarised below:
Offer competitive levels of remuneration in the relevant employment marketplace in which the employee is based to attract and retain the best talent available. These remuneration arrangements are truly global, not those traditionally adopted by most of our predominantly Australian operating ASX peers.
Support high performance culture by setting appropriately challenging performance objectives that drive the generation of shareholder value and link rewards to the achievement of those objectives and provide the largest part of the remuneration package ‘at risk’.
Balance the reward for superior performance against short-term goals with rewards that are delivered in a manner that supports generation of superior, sustainable shareholder returns over the longer term.
Apply a pay-for-performance philosophy that directly links Executive reward to the achievement of Ansell and business unit operating results and performance against strategic goals both annually and over the longer term.
Provide a portion of total remuneration in the form of Ansell equity and maintain market leading shareholding guidelines to support alignment with shareholders and encourage long-term thinking.
Ensure competitiveness in base salary and total salary package
Support a performance culture
Balance short and long term performance
Link rewards to business results
Significant equity component to align with shareholders
ANSELL’S EXECUTIVE KMP REMUNERATION
Remuneration Report continued
33
For
per
sona
l use
onl
y

Fixed Annual Remuneration (FAR)Base salary plus contributions to retirement plans and other benefits.
Base salary takes into account responsibilities, qualifications, experience, performance, location and market rate for a comparable role (similarly sized companies, operating in similar jurisdictions).
Pension, statutory and other benefit provisions which reflect local market cultural norms and relevant legislation.
Based on a combination of financial and non-financial performance metrics, set each year to reflect the key priorities of the business.
Performance will be weighted more towards performance against stated financial KPIs (not less than 80% of the award).
The Board will use performance measures (both financial and non-financial) which are appropriately aligned with the Group’s short-term objectives of delivering profitable growth and improving shareholder return. Executives have a clear line of sight to the targets and are able to affect results through their actions.Deferring part of the award in shares ensures that there is no incentive to exceed short term target at the expense of longer term sustainable performance.
3 year performance and vesting period.
Performance to be assessed based on a combination of key financial and shareholder value measures.
The total remuneration mix is designed to attract, retain and motivate a highly capable executive team, encourage and drive leadership performance that reinforces Ansell’s short and long term strategic objectives and provide a common interest between Executives and shareholders by linking the rewards that accrue to Executives to the creation of value for shareholders.
STIAwards granted as cash and, for above mid-point performance, shares in Ansell which will be restricted from trading for two years from date of grant.
LTIAwards granted as rights to receive fully paid ordinary shares in Ansell which will vest subject to achieving pre-set performance conditions.
TOTAL REMUNERATION
ComponentStrategic Objective/
Performance LinkOperation and Performance
Measure
FAR set at competitive levels in the market to attract, retain and engage talented executives to achieve results (including being competitive internationally for talent).
The broad aim is to position base pay +/-10% of the relevant benchmark median.
Increases are linked to the performance of the individual, the organisation he/she leads and, indirectly, the overall business.
The Board will select the performance measures at the start of each award based on the key priorities at that time. Measures used will be chosen on the basis they provide:
• a relevant indicator of increases in shareholder value; and
• a target that provides a suitable line of sight to encourage and motivate executive performance.
A performance gateway is used to ensure reasonable outcomes.
Remuneration Report continued
34
For
per
sona
l use
onl
y

Remuneration MixAnsell’s mix of fixed and at risk pay components is shown in the table below, based on an assumed mid-point level of performance and at maximum levels based on remuneration potential for FY17. The balance of remuneration paid in cash (or near cash equivalent for FAR) and equity is also shown.
FAR %
STI %
LTI %
Total %
Cash %
Equity %
Total %
CEO Mid-point 33 26 41 100 59 41 100
Max 20 31 49 100 35 65 100
CFO Mid-point 38 21 41 100 59 41 100
Max 24 25 51 100 36 64 100
Average other KMP Mid-point 56 15 30 100 70 30 100
Max 39 20 41 100 49 51 100
Remuneration Report continued
35
For
per
sona
l use
onl
y

Section 4 – Group performance and remuneration outcomesGroup performanceThe five year performance history of the Group shows progression in top line sales and underlying profitability from FY13 to FY15, before a decline in FY16 and subsequent return to growth in FY17. The primary reasons for the decline in FY16 were the adverse impact of foreign currency translation, a sluggish world economy and an increased tax rate for the Group. Furthermore, manufacturing issues in our medical division temporarily increased costs and affected supply. During FY17, the group returned to top line growth, but profitability fell due to increased raw material costs and non recurring FY16 gains (due to asset sales and incentive write-backs).
1. During FY14, the Group acquired BSSI and restructured its business, which involved significant non-cash write-downs as well as cash expenses total $122 million. The underlying results exclude this charge.
2. Dividends have been declared in US$ since Ansell adopted the US$ as reporting currency in FY14.
3. Cumulative Total Shareholder Return (TSR) is the cumulative financial return which an investor received from holding shares in Ansell, assuming dividends paid are reinvested in Ansell shares. It is expressed as a cumulative percentage change from a starting value at 1 July 2012 and finishing on 30 June 2017.
4. CC denotes Constant Currency.
5. The FY17 results include both continuing and discontinued operations as per note 2 – segment information of the Financial Statements.
Table 4.1(b) – Cumulative Total Shareholder Return (TSR)3
1.0
0.9
0.8
0.7
0.6
0.5
0.4
0.3
0.2
0.1
0
120%
100%
80%
60%
40%
20%
0%
June 12 June 13 June 14 June 15 June 17June 16
Cumulative TSR – A$
Remuneration Report continuedRemuneration Report continued
2014 20172013 Underlying1 2015 2016 2017 vs 2016
US$m US$m US$m US$m US$m5 CC%4
Income Statement
Sales 1,372.8 1,590.2 1,645.1 1,572.8 1,599.7 +2.6%
EBIT 170.5 206.5 245.3 236.7 217.8 -6.0%
Profit for the period attributable to Ansell shareholders 139.2 156.9 187.5 159.1 147.7 -5.0%
Share information
Basic earnings per share ($US cents) 106.5 110.0 122.5 105.1 100.1 -2.4%
Dividends per share2 (A$ or $US cents) A38.0 US39.0 US43.0 US43.5 US44.0 +1.1%
Ansell Share Price (A$) 17.63 19.83 24.09 18.17 22.68
Ratios
Return on average shareholders’ equity (%) 19.1 15.7 16.4 14.1 12.7
CEO incentive outcomes FY13 FY14 FY15 FY16 FY17
STI (% of Maximum) 32% 49% 36% 29% 67%
LTI grant (% of Maximum) 100% 82% 50% 0% 0%
STI/LTI payouts as percentage of maximum
36
For
per
sona
l use
onl
y

Realised pay (Non-Statutory Remuneration Disclosure)The table in this section uses non-IFRS financial information to detail realised pay earned by the CEO and Other Executives during FY17. This is a voluntary disclosure and is supplemental information to the statutory remuneration disclosure prepared in accordance with statutory requirements and accounting standards as detailed in Section 5 of this Remuneration Report. A description of how to calculate the non-IFRS financial information is set out below and in the footnotes to the tables. Realised pay includes cash salary and fees, retirement benefits, non-cash benefits paid/payable in relation to the FY17 year and the full value of incentive payments earned in relation to the performance period ended 30 June 2017. This differs from the statutory amount as it excludes accruals and estimations and is thus a closer measure of "take home pay" received in respect of the current year.
Our reporting currency is US$ and the CEO and a number of members of the KMP are paid in US$. For other executives the reported numbers in the statutory and realised pay tables are subject to translation differences from year to year.
Table 4 a) – Realised Pay Summary (all shown in US$)
2017 STI4 2016 SIP5 LTI
US$ Name YearBase
salary ($)1 Retirement
Benefits ($)2 Other ($)3 Cash ($)Restricted shares ($)
Restricted shares ($)
Cash ($)
PSRs6 ($)
Total Earnings ($)
Executive Director
Magnus R Nicolin 2017 1,059,500 312,171 152,627 1,199,251 400,749 - - - 3,124,298
2016 1,030,000 367,842 95,156 600,000 - 499,200 - - 2,592,198
Other Executives
Neil Salmon7 2017 497,277 48,597 149,191 373,188 111,210 - - - 1,179,463
2016 490,738 76,718 108,450 196,682 - 150,645 - - 1,023,233
Peter Dobbelsteijn8 2017 384,174 37,977 401,525 192,206 8,265 - - - 1,024,147
2016 385,114 38,456 458,240 124,141 - 93,105 - - 1,099,056
Steve Genzer 2017 414,732 44,115 2,000 207,366 13,064 - - - 681,277
2016 412,699 74,818 2,222 119,443 - 99,536 - - 708,718
Jeyan Heper 2017 293,222 28,444 52,256 148,467 15,292 - - - 537,681
2016 277,446 27,500 26,736 127,512 - n/a n/a n/a 459,194
Joe Kubicek 2017 391,000 37,645 21,113 195,500 8,407 - - - 653,665
2016 378,250 66,475 10,137 125,120 - 78,200 - - 658,182
Anthony Lopez9 2017 378,420 42,712 765,712 189,210 4,352 - - - 1,380,406
2016 376,565 70,693 134,899 108,985 - 90,821 - - 781,963
Mark Nicholls10 2017 350,000 39,542 1,871 175,000 7,525 - - - 573,938
2016 175,000 34,221 563 56,000 - n/a n/a n/a 265,784
Total 2017 3,768,325 591,202 1,546,295 2,680,188 568,864 - - - 9,154,875
2016 3,525,812 756,723 836,403 1,457,883 - 1,011,507 - - 7,588,328
1. Base salary includes all of the base salary earned by the individual in FY17. The increases in Base salary for Executives are based on external benchmarking of similar positions in the jurisdictions in which the executives are based. As a result, whilst the CEO increase was 2.5% with effect from 1 October 2016, increases for Other Executives’ pay were either lower or higher depending upon their benchmarking of similar positions as well as by reference to their performance against their personal objectives in their respective role, but ranged from 0% to 5%.
2. Retirement Benefits includes all of the retirement benefits earned by the individual in FY17.
3. Other includes the cost to the company of cash benefits such as motor vehicle, executive expatriation and relocation allowances, executive insurance, expat tax equalisation payments and other amounts. Significant year over year variations in other benefits above are detailed below.
4. 2017 STI represents amounts payable under the 2017 STI plan.
5. 2016 SIP represents amounts payable under the one-off SIP – refer to 2016 Remuneration Report. These were awarded as restricted shares, which are bought on market by the Group with recipients being unable to sell the shares for a period of two years from the issue date.
6. The PSR's relate to the FY15 grant, for which nothing is deemed to be payable given the FY17 results.
7. Mr Salmon relocated to Belgium during FY16 and his other benefits include relocation expenses.
8. Mr Dobblesteijn is Chief Commercial Officer for EMEA and APAC and so is required to travel extensively in his role. As a result he is potentially exposed to various complex income tax issues. During FY16, and following a review by relevant authorities of his previous tax returns, Mr Dobblesteijn was assessed to owe additional tax liabilities to the Belgian authorities. These were reimbursed by Ansell pursuant to the terms of his employment agreement. These amounts have been included in the other benefits category above.
9. Mr Lopez re-located to Belgium during FY15 and FY16 before returning to the USA in FY17. Relocation and tax equalisation costs were incurred as a result. These represent the majority of the higher Other benefits paid or payable in FY17.
10. Mr Nicholls was appointed as a KMP on 1 January 2016. Mr Nicholls was not a participant of the FY14 LTI grant. As such, he was not entitled to participate in the 2016 SIP. His pay details for FY16 represent the 6 months of realised pay for his time following his commencement as KMP.
Remuneration Report continued
37
For
per
sona
l use
onl
y

How the remuneration policy was operated for FY17During FY16 the HRC engaged extensively with stakeholders and made a number of significant changes to the policy in response to those discussions.
For FY17 the HRC reviewed the revised policy and determined that on the whole it was working appropriately and therefore did not require material changes. As such, the HRC has approved only minor changes to the operation of the policy for FY18.
Set out below are the details of how the policy works in practice, how it was operated for FY17 and any proposed changes for FY18:
Element of pay How the policy was operated for FY17 and any changes for FY18
Base salary The HRC will normally review base salaries annually. During FY17, the Board approved salary increases for the KMP ranging from 0% to 5%. When making these increases, the HRC considered a number of reference points including internal relativities, changes in scope of responsibilities, local market inflation and the wider macro-economic environment. External market data was sourced during the year but was used for reference only.
As a result of the increases the base salaries for the KMP, effective 1 October 2016 were:
Executive Base Salary Increase
Magnus R Nicolin $1,066,000 2.5%
Neil Salmon €456,500 0%
Peter Dobbelsteijn €352,671 0%
Steve Genzer $414,732 0%
Jeyan Heper €272,041 5%
Joe Kubicek $391,000 0%
Anthony Lopez $378,420 0%
Mark Nicholls $350,000 0%
The CEO’s base salary was set at a level which reflects the skills, experience and performance of the individual in the role. As a global company, the HRC feels it is important to be competitive across the jurisdictions in which it operates, not just against Australian focused ASX listed companies of a similar size, to attract and retain the best talent.
Our incentive plan quantum is based on a percentage of base salary (not a percentage of FAR).
FY18The next Base Pay review is due in September 2017.
Retirement provisions Retirement plan benefits include contributions to US benefit or non-qualified pension plans and to an Australian superannuation fund as applicable.
FY18 – No changes proposed.
Remuneration Report continuedRemuneration Report continued
38
For
per
sona
l use
onl
y

Other benefits The provision of other benefits may vary between executives, depending on their local market and their particular circumstances. Where necessary the company will make provision for benefits such as motor vehicle, executive expatriation/ repatriation and relocation allowances, executive insurance, expat tax equalisation payments and other amounts.
The level and type of benefits will reflect the Company’s overall policy on international mobility which is regularly reviewed to ensure it complies with best practice.
FY18 – No changes proposed.
STI – structure and quantum All Executives may participate in the plan whereby they have the opportunity to earn an annual award payable part in cash and part in restricted shares. This remuneration is ‘at risk’ as it requires the achievement of pre-set performance targets directly linked to Ansell’s business strategy.
How the STI is determined:
Base Salary
Business Performance
Metrics (90%)
Maximum Incentive
(% of Salary)
Individual Performance
(10%)
STI Outcome
The table below shows the maximum award potential and the weighting of performance measures for the FY17 STI. The measures were chosen to provide a balanced view of overall Group performance that was aligned to our objective to deliver profitable growth and improve shareholder returns.
Performance measures and relative contribution to STI
Executive
Opportunity Range
(% of Salary) Sales EBITInventory
Turns
Operating Cash Flow
After Capex Pre Tax
Profit Attributable
Individual Objectives Total
CEO 0% – 225% 35% 35% - 10% 10% 10% 100%
CFO 0% –150% 35% 35% - 10% 10% 10% 100%
Other Executives 0% – 100% 35% 35% 20% - - 10% 100%
The financial performance measures were chosen to reflect the key financial priorities including profitability, cash generation and Inventory efficiency. The individual objectives include metrics on safety and customer satisfaction which are reflective of broader non-financial measures of corporate performance.
To help provide a longer-term focus, any part of the STI award above the mid-point will be deferred in the form of restricted shares. Restricted shares are awarded in place of cash to place a part of the reward at continued risk against future share price movements. The restriction will see the shares held for a minimum period of two years from when the shares are granted.
FY18There are no proposed changes to the structure or quantum of the STI for the CEO or CFO for FY18.As a result of the recalibration of the KMP for FY18 and the additional scope and responsibilities of Steve Genzer and Joe Kubicek, these Executives will have a maximum STI opportunity of 130% of base salary for FY18. The HRC believes that this change is important to recognise the importance of these roles in driving group performance.
Remuneration Report continued
39
For
per
sona
l use
onl
y

STI – performance conditions and outcomes
Hurdles are set by the Board at the start of each financial year. The target setting process considers the prior year base figure (adjusted to exclude divestments and other one-off items and restated at constant currency) and then determines growth targets for Sales and EBIT with reference to external growth benchmarks and specific Ansell initiatives including a requirement for adequate returns on key investments made or planned. Generally this is consistent with a 'top down' approach where hurdles are driven by the Board’s target setting process. Performance is measured on a Constant Currency basis. Non-financial hurdles are assessed against quantitative data where possible, but by their nature, may require a more subjective qualitative assessment.
Performance was assessed during August following the completion of the audit of the financial statements.
The performance outcomes reflect the following:
• Sales were $1,599.7 million and were up 3.6% in organic constant currency terms, which exceeded the Target.
• EBIT was $217.8 million, down on the prior year FY16, with the prior year EBIT benefiting from the gain on sale of Onguard and reduced incentive provisions. These items were adjusted for when setting the original targets for FY17. Against the target expectation, EBIT performance benefited from the organic revenue growth noted and improving operating margins on improved manufacturing efficiencies that more than offset the impact of higher raw material costs.
• Operating Cash flow after Capex and Interest was $146 million and exceeded FY16 by 0.8% and was above target (CEO/CFO only).
• Inventory turns were 2.6 times and were below the threshold targets (executive KMP excluding the CEO and CFO.)
• Profit Attributable (for CEO/CFO only) was $147.7million, which was above the minimum but below the mid point performance targets.
The final outcomes above have been adjusted for constant currency, divestitures, one-off gains and losses, net foreign exchange/losses as well as normalistion of employee incentives. When considering adjustments to actual numbers, the Board is guided by an established policy to ensure any use of discretion is applied appropriately and consistently. The Board is satisfied that the adjustments noted above are in line with the policy and provide a fair reflection of the performance outcomes in the year.
Individual objectives were set based on broad topics but were then tailored to each role as appropriate.
For other executives, the CEO will make an assessment of the individual’s performance and this is reviewed and approved by the Board. If objectives are fully met, this element of the bonus is paid in full. If partially met, then a sliding scale will be used as appropriate. For the CEO, the performance assessment is made by the Board.
The HRC considered individual performance against objectives at the August 2017 committee meeting and following a comprehensive review approved the assessments noted below.
Magnus R Nicolin • Exceeded agreed objectives in all five agreed focus areas; Transformation, People Development, Operations, Quality and Supply Chain.
Neil Salmon • Managed outstanding result while executing Sexual Wellness divestiture & work on transformation.
Peter Dobbelsteijn • Affected strong recovery in EMEA-APAC while pushing through price-increases across the board.
Steve Genzer • Drove 5% YoY organic growth through innovation led acceleration.
Jeyan Heper • Strong leadership in execution of business goals despite the challenges of the divestiture process.
Joe Kubicek • Delivered on all three strategic priorities for the SU GBU; Core brand, emerging markets and International sales acceleration.
Anthony Lopez • Solid progress in improving quality, supply and profitability in the medical business.
Mark Nicholls • Took North America back to growth while expanding the LAC region by more than 20%.
Remuneration Report continued
40
For
per
sona
l use
onl
y

STI – performance conditions and outcomes continued
For the FY17 STI the Board approved the following payments to the KMP:
Maximum Targets FY17 Actual Outcome
ExecutiveFinancial
(90%)Individual
(10%)Total
(100%) STI
PayableCash
Payable1
Restricted Shares2
Magnus R Nicolin 2,158,652 239,850 2,398,502 1,600,000 1,199,251 400,749
Neil Salmon 671,323 74,591 745,915 484,398 373,188 111,210
Peter Dobbelsteijn 345,757 38,417 384,174 200,471 192,206 8,265
Steve Genzer 373,259 41,473 414,732 220,430 207,366 13,064
Jeyan Heper 263,899 29,322 293,222 163,759 148,467 15,292
Joe Kubicek 351,900 39,100 391,000 203,907 195,500 8,407
Anthony Lopez 340,578 37,842 378,420 193,562 189,210 4,352
Mark Nicholls 315,000 35,000 350,000 182,525 175,000 7,525
Total 4,820,369 574,696 5,355,965 3,249,052 2,680,188 568,864
1. The 2017 STI was determined in conjunction with the finalisation of the FY17 results. Cash amounts will be paid in September 2017.
2. Restricted shares will be granted in August/ September 2017 and are subject to a two year sale restriction. Awards are subject to clawback in the event of fraud or dishonesty.
The Board may adjust incentive outcomes to ensure they are aligned to the shareholder experience. The Board is satisfied that the outcomes noted above fairly reflect performance delivered in the year.
In October 2016, the HRC approved a retention plan for selected members of the Sexual Wellness team, which included Jeyan Heper. The plan was intended to focus leadership on driving business performance during a time of disruption and uncertainty, following the portfolio review. The plan is contingent on a successful completion of a sale of the Sexual Wellness business. On the basis that any sale is not expected to complete until FY18, there was no additional bonus to be paid in relation to FY17. The total amount payable in FY18 is expected to be US$108,000, equivalent to five month’s salary.
FY18No changes are proposed to the performance measures to be used for FY18.
The same target setting process as outlined above will be used and performance hurdles will be disclosed in next year’s report.
LTI – awards granted during the year
All KMP Executives are eligible to participate in the LTI Plan. Awards that are granted will vest after three years subject to the achievement of the performance conditions and continued service. Our LTI awards are entirely in the form of Performance Share Rights (PSRs). The HRC believes that equity based awards of this type help align the interests of Executives and shareholders and promote a focus on long-term, sustainable performance.
Remuneration Report continued
41
For
per
sona
l use
onl
y

How awards are granted:
Base Salary
Share Price at Grant
Maximum Award
(% of Salary)
Number of Awards Granted
How awards will vest:
Number of Awards Granted
Share Price on Vesting
Business Performance
Value of awards
on vesting
For FY17 the LTI maximum was based on a percentage of salary. The actual amount payable will be calculated on a sliding scale, with 0% payable for Minimum target performance, rising on a straight-line basis to the maximum potential set out in the table below:
Executive Minimum LTI (% of Salary) Maximum LTI (% of Salary)
CEO 0% 360%
CFO 0% 300%
Other Executives 0% 200%
The scale is significantly more challenging than Australian norms which typically provide for 50% of target to vest at threshold. This is consistent with our pay for performance culture. Participants are prohibited from hedging against awards.
Performance measures for FY17 awards
Performance Measure* Weight Minimum Maximum
EPS Growth 33.3% of AwardAlso subject to gateway
condition being ROCE in year 3 >=15%
12.5% growth by year 3 (4% Compound Average
Growth Rate – CAGR)
33.1% growth by year 3 (10% CAGR)
Organic Revenue Growth
33.3% of Award 6.1% Growth by year 3 (2% CAGR)
15.8% growth by year 3 (5% CAGR)
ROCE (Return on Capital Employed)
33.4% of Award 15% in year 3 16.5% in year 3
* EPS, Organic Revenue Growth and ROCE as defined in the Glossary on page 57.
Remuneration Report continued
42
For
per
sona
l use
onl
y

As Ansell has continued to invest capital in acquiring businesses which we believe complement or augment our existing businesses, we have used multiple measures to give a broader focus on long-term financial performance and value creation.
As communicated previously, the Board believes Ansell’s specific characteristics (in terms of being Australian listed but a global company, not having many global listed competitors and being of a different size to many of them), prevent us identifying an appropriate comparator group for use in a relative TSR measure. The Board is still of this view but will keep the matter under review for future years if it is possible to construct a relevant peer group.
Approach to setting performance hurdles
Performance hurdle ranges, which determine the minimum to maximum incentive range for EPS, Organic Growth and ROCE, are set each year with reference to expected economic conditions and strategic priorities of the business.
The hurdle range has been set on a challenging, yet realistic, basis. The lower end of the range should be considered attainable in the current environment, but the upper end would require excellent performance. Achieving full vesting against all three measures would be considered an exceptional achievement.
The hurdle range is set using constant currency to eliminate the impact of currency fluctuations. The HRC is of the view that the use of constant currency is appropriate in light of the global nature of the business to prevent management from being favoured or penalised as the result of fluctuations outside of their control.
In line with standard practice, the HRC has discretion to make adjustments in calculating the applicable performance conditions to:
• exclude matters that are beyond the reasonable control or foresight of management; and
• include matters that are within management control or should reasonably have been foreseen to ensure no unfair advantage or penalty in incentive outcomes when viewed in light of shareholder value creation.
Remuneration Report continued
43
For
per
sona
l use
onl
y

FY18No changes are proposed to the structure or quantum for FY18. However, the Board will recalibrate the LTI performance measures of organic growth, EPS and ROCE to recognise the new organisational structure due to the expected sale of the SW business and the resulting dilution. The intention is to use the same performance measures for awards granted in FY18, albeit with performance hurdles reflective of the current market environment. The HRC believes that the hurdles set below are as equally challenging as those set previously when taking into account the current growth prospects of the business.
Adjustments to current LTI plansThe successful divestment of the SW business, expected to complete by the end of September 2017, will result in the company’s new profile being focused on its core Industrial and Healthcare businesses. In anticipation of this significant change, it is necessary to make adjustments to calculation of performance against target for the calculation of payment outcomes against the LTI plans that will be tested for vesting at the end of FY18 and FY19.
The Committee has decided to follow the approach described below in calculating performance against existing plan targets. The intent of this approach is to neutralise the impact of the one off divestment and to require operating performance consistent with the original business portfolio targets, so as to permit an appropriate achievement opportunity for incentive outcomes. The expected gain on sale of the business will also be excluded from calculation of incentive outcomes. The original growth targets for EPS were expressed as an EPS CAGR against a base period EPS. To facilitate performance measurement, this target has now been converted into the equivalent EPS Growth in cents, with performance then measured against the required EPS growth target as below.
Performance will be assessed as follows:• The period up to end of FY17 will be judged as normal on the total business portfolio including the
actual operating performance of SW.
• The previously agreed adjustments to EPS for LTI performance measurement will continue to be applied as in past years
• See Table 4 b) for the calculation to end FY17 of ‘Achieved EPS growth’.
For performance from FY18 and beyond this will be assessed in two components:• The continuing business will be measured on its actual performance against the restated FY17
continuing business EPS as disclosed in the annual accounts.
• In addition, the forecast growth of the SW business as contained in the projections formally shared with buyers as part of the sale process, will also be added to the calculation of performance achieved in FY18 and FY19, the ‘SW Growth Projection’.
The Committee believes that as the Ansell shareholder benefited from the expected future performance of the business through the mechanism of the selling price achieved for the business, management should benefit accordingly in their potential LTI incentive outcomes, via the performance achieved in actual performance to date and the forecast targets now effectively realised through the SW sale process.
For the benefit of Shareholders, Table 4 c) shows the calculation of the required performance in the remaining years of the existing plans. This is shown as the ‘to go EPS Growth’ that would be required to reach minimum and maximum performance levels as set originally for these plans.
As noted above achievement against the remaining ‘to go’ target will be measured for the continuing business only against the FY17 continuing business results as disclosed in the FY17 Financial Statements.
For the FY17-19 LTI plan, the Committee also addressed the measurement of performance against the organic revenue growth and ROCE performance measures.
For organic revenue, this will continue to be measured in each year excluding the effects of acquisitions and divestments and the combined 3 year performance on this basis measured against the original performance range for organic revenue CAGR of 2% at minimum and 5% at maximum.
For ROCE, the Committee recognised that the Sale of SW will be dilutive to ROCE and therefore the ROCE measure should be adjusted down by the expected effect of the SW divestment which is a reduction to Ansell ROCE of 180 basis points in the vesting year. The targeted ROCE range has therefore been adjusted down by 180 basis points to a minimum of 13.2% and a maximum of 14.7% for ROCE in FY19.
Remuneration Report continued
44
For
per
sona
l use
onl
y

Table 4 b) – Calculating EPS Growth on Total Portfolio (Including SW) for Existing LTI Plans
FY16 FY17Prior year reported 122.5 105.1Prior year EPS at Constant Currency (CC) 106.7 a 103.3 cCurrent year EPS 105.1 b 100.1 d
Prior year EPS at CC after prior year LTI Adjustments 102.5 h=(a+e) 99.2 j=(c+f)Current year EPS after current year LTI Adjustments 101.0 i=(b+f) 101.1 k=(d+g)
‘Achieved EPS Growth’ for LTI Measurement -1.5 l=(i-h) 1.9 m=(k-j)
LTI AdjustmentsAdjustments – EPS impact FY15 FY16 FY17Shah Alam Sale: Note 1 -10.3Restructuring FY15: Note 3 8.9 -3.0 -3.0Exclude gain/loss on Australian c/f tax loss accounting: Note 4 -2.3 0.5 3.3Previously deducted DTAs expensed in current year 1.1Other: Note 2 -1.6 -1.6 -1.6Exclude net FX gain/loss in reported EPS: Note 5 0.7Exclude portfolio review costs: Note 6 1.6EPS impact total adjustments -4.2 e -4.1 f 1.0 g
0.1 5.1
Notes on LTI Adjustments
1. Refers to target set for the gain on the sale of the Shah Alam property in Malaysia that was initiated as part of the FY14 restructuring program. The targeted gain served to reduce the targeted net cost of the FY14 restructuring program. With the gain having now been realized in FY15, the targeted gain has been excluded from FY15 EPS for LTI calculation purposes.
2. Includes the agreed amortisation of the post-tax cost of the cash related elements of the FY14 restructuring program, consistent with the treatment described for these items in the FY14 annual report.
3. Excludes the post-tax cost in FY15 of the restructuring program announced in June 2015. And in subsequent years includes an adjustment to EPS for LTI calculation purposes representing an amortisation of the restructuring cost over the next three years beginning in FY16.
4. Consistent with prior practice, the impact of carried forward Australian tax losses has been excluded from EPS for LTI purposes, including the recognition of the DTA asset up until end FY15 and from FY16 on the effect of recording a tax charge on Australian income following full recognition of the tax losses.
5. Consistent with the policy to measure performance for incentive plans on a constant currency basis, P&L gains or losses arising from FX movements are also excluded from reported EPS
6. As detailed elsewhere in this report, the Board has elected to exclude the costs of the portfolio review to be consistent with the exclusion of the gain on sale on divestment of Sexual Wellness, anticipated in FY18
Table 4 c)
FY16 – FY18 LTI Plan Threshold Target Stretch FY17 – FY19 LTI Plan Min Max
EPS Growth CAGR 7% 8% 12% EPS Growth CAGR 4% 10%
(1) CC EPS Growth (cents) 26.6 30.7 47.9 EPS Growth Total 12.5% 33.1%
(1) CC EPS Growth (cents) 13.1 34.8
(2) FY16 – FY17 2 year ‘achieved growth’ 0.4 0.4 0.4
(2) 17 1 year achieved growth 1.9 1.9
(3) FY18 ‘SW Growth Projection’ 1.5 1.5 1.5
(3) FY18 – FY19 ‘SW Growth Projection’ 4.5 4.5
‘To Go’ EPS Growth (cents) = (1-2-3) 24.7 28.8 46.0
‘To Go’ EPS Growth (cents) = (1-2-3) 6.7 28.4
Note: 2 year achieved growth is sum of l+m from table 4 b)
Note: 1 year achieved growth is labelled m from table 4 b)
Remuneration Report continued
45
For
per
sona
l use
onl
y

Performance measures for FY18 awards
Performance measure and weightingMinimum Hurdle
(0% Vesting)Maximum Hurdle
(100% Vesting)
Organic Growth (one-third) 2% 5%
EPS (one-third) 4% 10%
ROCE (one-third) 14% 15.5%
LTI outcomes under the FY15 LTI grant
In FY15, the CEO was granted PSRs, which was approved at the Company’s 2014 Annual General Meeting (AGM). Senior Executives were granted an equal proportion of cash and PSRs. The remainder of the management team participating in the LTI Plan were granted cash-based awards. The awards were subject to the achievement of a ROE gateway and a three year earnings growth target based on EPS performance.
The gateway condition was calculated at 1.5 times the Company’s WACC when the plan vests. The ROE gateway condition, calculated at 1.5x WACC was 11.2%. The Company’s actual ROE for FY17 was 12.7%, exceeding the gateway condition.
The performance hurdle is based on growth in the Company’s EPS over the three year performance period to 30 June 2017.
EPS Growth PSRs and Cash Award Grant that Vest (%)
Threshold (7% p.a. CAGR) 25%
Target (8% p.a. CAGR) 50%
Stretch (12% p.a. CAGR) 100%
Awards vest on a sliding scale between each point
As previously disclosed, the Board selected US 105 cents EPS (being the underlying EPS for FY14 excluding the impact of deferred tax asset adjustments and non-operational tax items) as the base EPS for FY14 (Base Point). Accordingly, the targets are US 128.0 cents (Threshold), US 132.3 cents (Target) and US 147.5 cents (Stretch).
For the FY15 LTI Grant, the Board has excluded the effect of net changes in capital when measuring EPS performance.
On this basis the actual FY17 EPS of US 100 cents means that 0% of these awards will vest.
The outcome for each executive is shown in the table below:
NameDate Award
Granted
Maximum Cash
Opportunity (US$)
Maximum Value
of PSRs Granted
(US$)
Cash Award Vested
(US$)
Number of PSRs Vested
(Shares)
Amount of Cash
Forfeited (US$)
Number of PSRs
Forfeited (Shares)
Executive Director
Magnus R Nicolin 14-Aug-14 0 1,870,000 0 0 0 225,986
Other Executives
Neil Salmon 14-Aug-14 440,000 660,000 0 0 440,000 39,867
Peter Dobbelsteijn 14-Aug-14 435,200 435,200 0 0 320,000 26,202
Steve Genzer 14-Aug-14 380,000 380,000 0 0 380,000 22,954
Jeyan Heper 14-Aug-14 306,000 306,000 0 0 225,000 18,424
Joe Kubicek 14-Aug-14 340,000 340,000 0 0 340,000 20,538
Anthony Lopez 14-Aug-14 350,000 350,000 0 0 350,000 21,142
Mark Nicholls 14-Aug-14 110,000 110,000 0 0 110,000 6,645
Awards continue to be subject to clawback in accordance with the rules of the plan, but typically related to acts of fraud, dishonesty or serious breach of obligations.
Remuneration Report continued
46
For
per
sona
l use
onl
y

Board discretion Exercise of discretion by the Board
Our remuneration policy aims to link management incentive outcomes to performance against strategic objectives that drive long term shareholder value creation.
In certain circumstances, events or accounting rules (such as the recognition of previously unrecognised tax losses as deferred tax assets) can create a favourable or unfavourable effect on earnings for a single year that may cause a misalignment between incentive outcomes and shareholder value creation. Similarly, changes in accounting policy as recommended by the Audit and Compliance Committee and approved by the Board may be subject to discretionary exclusion. In these circumstances the Board retains its discretion to incorporate adjustments to the calculation of incentive outcomes.
The HRC has developed a policy that will guide it in applying this discretion and that will be applied consistently. The policy covers individually material items including restructuring charges, acquisitions and divestments and equity capital issuance and repurchase.
For FY17, the Board exercised discretion to exclude costs related to the portfolio review.
The HRC will continue its practice of clearly explaining in its annual remuneration report the basis and calculation of any adjustments made that have influenced incentive outcomes.
Change of control On a change of control, the Board has discretion to vest some or all of the LTI awards but, unless it uses its discretion, awards will vest as if the applicable performance condition has met the target level of performance (and without time pro-rating). In exercising this discretion, the Board will consider all relevant circumstances, including performance against the various measures and conditions for the part period up to the change of control event and the portion of the performance period which has expired. Any restricted shares under the STI will be converted into ordinary shares, unless the Board determines otherwise.
Clawback From FY18, the recovering and withholding provisions will be broadened and will now be applied consistently across both the STI and LTI. The Board will have the ability to clawback incentives for a period of up to three years from the date of payment/vesting and will cover the following events:
• Material misstatement of the financial statements
• Misconduct
• Error in calculation of the performance condition
• Serious reputational damage to the Group
Leaver treatment If an Executive ceases his or her employment with Ansell at any time prior to the end of the performance period, the Executive shall not be entitled to any STI payment. However, the HRC may, in its sole discretion, pay a pro-rated award in certain circumstances (such as death, disablement, retirement, or other approved situations).
If an Executive ceases his or her employment with Ansell at any time prior to the end of the vesting period, the Executive shall not be entitled to any LTI award. However, the Board may, in its sole discretion, pay a pro-rated award in certain circumstances such as death, disability, retirement or any other reason approved by the Board.
Section 5 – Statutory InformationExecutive Service AgreementsThe remuneration and other terms of employment for Executives are covered in formal agreements or letters of offer.
Chief Executive OfficerThe CEO, M Nicolin, was recruited as a US based executive and his contract reflects this. He has subsequently relocated to Belgium and there has been no substantial change to the terms and conditions of his contract. He is engaged by the Group under an agreement which:
• does not specify a fixed term of engagement;
• provides that the Group may terminate the CEO’s engagement upon giving 12 months’ notice or payment in lieu, and may terminate immediately in the case of willful misconduct;
• provides that in certain circumstances, such as a material diminution of responsibility or the CEO ceasing to be the most Senior Executive of Ansell, the CEO may be entitled to a payment equivalent to 12 months’ base salary;
Remuneration Report continued
47
For
per
sona
l use
onl
y

• requires the CEO to give the Group at least six months’ notice of termination of services; and
• in order to protect the Group’s business interests, prohibits the CEO from engaging in any activity that would compete with the Group for a period of 12 months following termination of his engagement for any reason.
The agreement entered into with the CEO has been drafted to comply with the Corporations Act regarding the payment of benefits on termination.
Other ExecutivesN Salmon was recruited as a US based executive and his contract reflects this. He has subsequently relocated to Belgium and there has been no substantial change to the terms and conditions of his contract. His services are engaged by the Group for an unlimited duration. He is entitled to a separation fee upon termination by the Group (other than for gross misconduct) equal to 12 months’ base salary plus certain other contractual entitlements. He is required to give the Group six months’ prior notice of termination of services.
S Genzer and M Nicholls, who are based in the United States, and A Lopez, who was seconded to the Group’s office in Brussels (returning to the US in FY17), are employed ‘at will’ and as such, their service agreement does not specify a fixed term of employment. These executives are entitled to a severance fee equal to 12 month’s base salary assuming a termination for any reason other than resignation, performance issues or cause.
P Dobbelsteijn manages the sales and marketing operations of three major geographies being Europe, Middle East and Africa and Asia Pacific. His services are engaged by the Group for an unlimited duration. He is entitled to a separation fee upon termination by the Group (other than for gross misconduct) equal to 12 months’ base salary plus STI and LTI awards pro-rated according to the applicable performance period and subject to final approval by the Board. He is required to give the Group three months’ prior notice of resignation.
J Heper is a Belgium based executive who is employed by the Group for an unlimited duration. He is eligible for 10 week severance benefits upon termination by the Group in accordance with applicable Belgian laws and regulations. He is required to give 5 weeks’ notice to the Group if he wishes to resign.
J Kubicek was employed under agreements entered into at the time of Ansell’s acquisition of the BarrierSafe Solutions International business in January 2014. These employment agreements have a fixed two-year term through 2 January 2016. As this period has now passed, employment continues on an ‘at-will’ basis.
Mandatory Shareholding PolicyAnsell has, for some years, been committed to encouraging strong alignment with shareholder interests. To encourage such alignment, the Company has adopted a mandatory shareholding policy, known as the Share Purchasing Policy, which requires Directors and Executives to purchase a multiple of their Director’s fees/base salary in Ansell shares over a set period.
The current level of mandatory shareholding requirement (applicable from FY17) are:
• CEO – 3 x base salary
• Executives – 1 x base salary
• Non-Executive Directors – 2 x annual Director’s fees
Executive and Non-Executive Directors are expected to achieve the above shareholdings within 10 years from its inception in 2013 or within 10 years of becoming a KMP if after 2013.
Vested but unexercised awards (such as restricted shares granted under the FY17 STI and FY16 SIP which are subject to holding requirements) will be included in assessing whether an Executive meets the mandatory shareholding targets. Unvested equity rights held pursuant to the incentive plans are not included in the target assessment.
Ansell has developed a mechanism to enable Directors and Executives to regularly purchase Ansell shares, known as the Voluntary Share Purchasing Plan (VSPP). While optional, the VSPP facilitates compliance with the Share Purchasing Policy, while complying with ASX trading rules and the restrictions of the Share Trading Policy (detailed below).
Under the VSPP, a pre-agreed amount of Ansell shares (by value) are acquired monthly on the ASX through a trustee company at the prevailing market price and are transferred into the name of the applicable Executive/Director, but are subject to a restriction on dealing until the Executive/Director ceases to hold office.
Share Trading PolicyAnsell has a Share Trading Policy which prohibits certain individuals within the Company, including KMP, from trading Ansell shares other than during specified trading windows or in accordance with the VSPP. All KMP are required to declare to either the CEO (for Other Executives) or the Chairman (for the CEO and Non-executive Directors) and the Company Secretary any share trades into which they enter during trading windows for the purpose of disclosure on the ASX.
Remuneration Report continued
48
For
per
sona
l use
onl
y

The movement in the number of shares held by each KMP and the progress of each KMP during FY17 in achieving their respective share ownership goals is as follows:
Table 5 a)
Held at 1 July Purchases
Granted Under
Awards
Net Movement
Due to Other Changes
Held at 30 June
% of Share Ownership Goals Met3
Target Year to Comply
Target Year Projected to
ComplyNon-Executive DirectorsGlenn L L BarnesFY17 61,748 1,730 n/a 0 63,478 162% 2023 COMPLYFY16 41,509 20,239 n/a 0 61,748 129% 2023Ronald J S Bell FY17 15,429 3,311 n/a 0 18,740 99% 2023 2018FY16 10,568 4,861 n/a 0 15,429 69% 2023John BevanFY17 17,402 1,326 n/a 0 18,728 98% 2023 2018FY16 11,320 6,082 n/a 0 17,402 78% 2023L Dale Crandall FY17 20,680 1,397 n/a 0 22,077 113% 2023 COMPLYFY16 18,585 2,095 n/a 0 20,680 86% 2023W Peter Day FY17 27,540 1,298 n/a 0 28,838 142% 2023 COMPLYFY16 17,361 10,179 n/a 0 27,540 111% 2023Leslie A Desjardins1
FY17 1,961 2,269 n/a 0 4,230 23% 2025 2025FY16 0 1,961 n/a 0 1,961 9% 2025Marissa T PetersonFY17 20,133 3,514 n/a 0 23,647 119% 2023 COMPLYFY16 14,896 5,237 n/a 0 20,133 84% 2023Executive DirectorMagnus R Nicolin2
FY17 229,030 0 22,753 0 251,783 135% 2023 COMPLYFY16 65,665 0 233,897 (70,532) 229,030 78% 2023Other ExecutivesNeil SalmonFY17 30,130 0 5,559 0 35,689 123% 2023 COMPLYFY16 14,917 0 15,213 0 30,130 43% 2023Peter DobbelsteijnFY17 13,627 0 4,969 0 18,596 83% 2023 2018FY16 5,308 1,480 10,151 (3,312) 13,627 25% 2023Steve GenzerFY17 15,648 0 4,537 0 20,185 83% 2023 2018FY16 6,493 1,151 12,702 (4,698) 15,648 27% 2023Jeyan HeperFY17 0 1,500 0 0 1,500 9% 2024 2028FY16 0 0 0 0 0 0% 2024Joe KubicekFY17 66,981 0 3,565 0 70,546 308% 2024 COMPLYFY16 30,000 10,000 26,981 0 66,981 124% 2024Anthony LopezFY17 12,373 0 4,140 0 16,513 75% 2023 2019FY16 2,885 1,360 12,898 (4,770) 12,373 23% 2023Mark NichollsFY17 12,000 0 1,097 0 13,097 64% 2026 2024FY16 0 12,000 0 0 12,000 24% 2026
1. Leslie Desjardins was appointed as a Non-Executive Director on 30 November 2015, and in accordance with the policy, is required to be compliant with the policy within a 10 year period.
2. In FY16 Magnus Nicolin sought leave to sell a portion of his shareholdings to pay for tax liabilities on past PSR awards and the Board authorised the sale in accordance with the Group’s share trading policies.
3. The percentage of ownership goals met are based upon a multiple of an individual’s base pay or directors fees (as applicable).
Remuneration Report continued
49
For
per
sona
l use
onl
y

Executive statutory remunerationTable 5 b)
Short Term Employee benefits Post-employment Benefits Share Based Payment Expense5 Cash6
Base Salary1 Share Based STI2 Cash Based STI Other Benefits3 Retirement Plan Benefits4 LTI LTI SIP7 Total
US$ FY $ $ $ $ $ $ $ $
Executive Director
Magnus R Nicolin 2017 1,059,500 400,749 1,199,251 152,627 312,171 669,705 - - 3,794,002
2016 1,030,000 - 600,000 95,156 367,842 (1,042,559) 0 499,200 1,549,639
Other Executives
Neil Salmon 2017 497,277 111,210 373,188 149,191 48,597 268,275 - - 1,447,739
2016 490,738 - 196,682 108,450 76,718 (154,445) (132,987) 150,645 735,801
Peter Dobbelsteijn 2017 384,174 8,265 192,206 401,525 37,977 138,138 - - 1,162,285
2016 385,114 - 124,141 458,240 38,456 (56,182) (55,725) 93,105 987,149
Steve Genzer 2017 414,732 13,064 207,366 2,000 44,115 144,733 - - 826,010
2016 412,699 - 119,443 2,222 74,818 (105,021) (110,609) 99,536 493,088
Jeyan Heper 2017 293,222 15,292 148,467 52,256 28,444 101,482 - - 639,162
2016 277,446 - 127,512 26,736 27,500 (24,611) (24,341) 0 410,242
Joe Kubicek 2017 391,000 8,407 195,500 21,113 37,645 136,450 - - 790,114
2016 378,250 - 125,120 10,137 66,475 66,110 (63,890) 78,200 660,402
Anthony Lopez 2017 378,420 4,352 189,210 765,712 42,712 132,060 - - 1,512,466
2016 376,565 - 108,985 134,899 70,693 (101,208) (106,360) 90,821 574,395
Mark Nicholls 2017 350,000 7,525 175,000 1,871 39,542 122,142 - - 696,080
2016 175,000 - 56,000 563 34,221 0 0 0 265,784
Total Executive Remuneration 2017 3,768,325 568,864 2,680,188 1,546,295 591,202 1,712,984 - - 10,867,860
2016 3,525,812 - 1,457,883 836,403 756,723 (1,417,916) (493,912) 1,011,507 5,676,500
1. Base Salary includes the base salary earned by the individual in FY17. The increases in base salary for Executives are made following a broad review which considered pay increases in each jurisdiction, external benchmarking data and wider economic considerations. Increases for FY17 were 2.5% for the CEO and 0% to 5% for other executives.
2. STI represents amounts payable under the 2017 Short Term Incentive Plan.
3. Other includes benefits such as motor vehicle, executive expatriation and relocation allowances, executive insurance, expat tax equalisation payments and other amounts.
4. Retirement benefits includes retirement benefits earned by the individual in FY17.
5. Share based payment expenses includes amounts provided in respect of the Group’s shared based LTI Plan. Primarily as a result of the cancellation of the FY14 grant, the Group reversed previously expensed amounts relating to these plans in FY16. As such, these reversals are being reflected in the negative amounts shown above for FY16, even though such amounts are not receivable from the participants.
6. Cash based payment expenses includes amounts provided in respect of the Groups cash based LTI Plans. The negative amounts shown are due to the same factors as note 5) above (share based LTI). Based on the FY17 results, nothing is considered payable under the remaining cash based LTI grants.
7. SIP represents amounts payable under the one-off Special Incentive Plan – which was explained in detail in the 2016 Remuneration Report.
Remuneration Report continued
50
For
per
sona
l use
onl
y

Executive statutory remunerationTable 5 b)
Short Term Employee benefits Post-employment Benefits Share Based Payment Expense5 Cash6
Base Salary1 Share Based STI2 Cash Based STI Other Benefits3 Retirement Plan Benefits4 LTI LTI SIP7 Total
US$ FY $ $ $ $ $ $ $ $
Executive Director
Magnus R Nicolin 2017 1,059,500 400,749 1,199,251 152,627 312,171 669,705 - - 3,794,002
2016 1,030,000 - 600,000 95,156 367,842 (1,042,559) 0 499,200 1,549,639
Other Executives
Neil Salmon 2017 497,277 111,210 373,188 149,191 48,597 268,275 - - 1,447,739
2016 490,738 - 196,682 108,450 76,718 (154,445) (132,987) 150,645 735,801
Peter Dobbelsteijn 2017 384,174 8,265 192,206 401,525 37,977 138,138 - - 1,162,285
2016 385,114 - 124,141 458,240 38,456 (56,182) (55,725) 93,105 987,149
Steve Genzer 2017 414,732 13,064 207,366 2,000 44,115 144,733 - - 826,010
2016 412,699 - 119,443 2,222 74,818 (105,021) (110,609) 99,536 493,088
Jeyan Heper 2017 293,222 15,292 148,467 52,256 28,444 101,482 - - 639,162
2016 277,446 - 127,512 26,736 27,500 (24,611) (24,341) 0 410,242
Joe Kubicek 2017 391,000 8,407 195,500 21,113 37,645 136,450 - - 790,114
2016 378,250 - 125,120 10,137 66,475 66,110 (63,890) 78,200 660,402
Anthony Lopez 2017 378,420 4,352 189,210 765,712 42,712 132,060 - - 1,512,466
2016 376,565 - 108,985 134,899 70,693 (101,208) (106,360) 90,821 574,395
Mark Nicholls 2017 350,000 7,525 175,000 1,871 39,542 122,142 - - 696,080
2016 175,000 - 56,000 563 34,221 0 0 0 265,784
Total Executive Remuneration 2017 3,768,325 568,864 2,680,188 1,546,295 591,202 1,712,984 - - 10,867,860
2016 3,525,812 - 1,457,883 836,403 756,723 (1,417,916) (493,912) 1,011,507 5,676,500
1. Base Salary includes the base salary earned by the individual in FY17. The increases in base salary for Executives are made following a broad review which considered pay increases in each jurisdiction, external benchmarking data and wider economic considerations. Increases for FY17 were 2.5% for the CEO and 0% to 5% for other executives.
2. STI represents amounts payable under the 2017 Short Term Incentive Plan.
3. Other includes benefits such as motor vehicle, executive expatriation and relocation allowances, executive insurance, expat tax equalisation payments and other amounts.
4. Retirement benefits includes retirement benefits earned by the individual in FY17.
5. Share based payment expenses includes amounts provided in respect of the Group’s shared based LTI Plan. Primarily as a result of the cancellation of the FY14 grant, the Group reversed previously expensed amounts relating to these plans in FY16. As such, these reversals are being reflected in the negative amounts shown above for FY16, even though such amounts are not receivable from the participants.
6. Cash based payment expenses includes amounts provided in respect of the Groups cash based LTI Plans. The negative amounts shown are due to the same factors as note 5) above (share based LTI). Based on the FY17 results, nothing is considered payable under the remaining cash based LTI grants.
7. SIP represents amounts payable under the one-off Special Incentive Plan – which was explained in detail in the 2016 Remuneration Report.
Remuneration Report continued
51
For
per
sona
l use
onl
y

Equity instrumentsThe below table details the movement in the number of Performance Rights (PRs) and PSRs over ordinary shares of Ansell Limited by the CEO and Other Executives during the 2017 financial year.
Table 5 c)
Held at 1 July 2016 or Date Appointed
PSRs Granted during the Year
PRs/PSRs Vested During the Year
PRs/PSRs Lapsed/Forfeited During the Year
Held at 30 June 2017
Performance Rights
Magnus R Nicolin
2017 0 0 0 0 0
2016 104,357 0 -104,357 0 0
Neil Salmon
2017 0 0 0 0 0
2016 15,213 0 -15,213 0 0
Joe Kubicek
2017 0 0 0 0 0
2016 26,981 0 -26981 0 0
Performance Share Rights
Magnus Nicolin
2017 435,230 296,834 0 0 732,064
2016 701,136 209,244 -129,540 -345,610 435,230
Neil Salmon
2017 76,400 118,908 0 0 195,308
2016 67,830 36,532 0 -27,962 76,400
Peter Dobbelsteijn
2017 46,144 61,228 0 0 107,372
2016 64,624 19,942 -10,151 -28,271 46,144
Steve Genzer
2017 44,388 64,150 0 0 108,538
2016 69,966 21,434 -12,702 -34,310 44,388
Jeyan Heper
2017 31,528 44,980 0 0 76,508
2016 18,424 13,104 0 0 31,528
Joe Kubicek
2017 38,462 60,480 0 0 98,942
2016 38,495 17,924 0 -17,957 38,462
Anthony Lopez
2017 40,700 58,534 0 0 99,234
2016 68,544 19,558 -12,898 -34,504 40,700
Mark Nicholls
2017 13,038 54,138 0 0 67,176
2016 6,644 6,394 0 0 13,038
1. PSR’s were granted during FY17 pursuant to the FY17 LTIP. The Fair Values and factors and assumptions used in the determining the fair values of the PSRs applicable for FY17 are summarised in Table 5d) below.
Remuneration Report continued
52
For
per
sona
l use
onl
y

Table 5 d) – PSR Fair Values at Grant Date
Grant Date Vesting Date Fair ValueShare Price on
Grant DateRisk Free
Interest Rate Dividend Yield
FY15 LTIp PSRs 14/8/2014 30/6/2017 A$17.73 A$19.05 n/a 2.5%
FY16 LTIp PSRs 13/8/2015 30/6/2018 A$18.53 A$20.20 n/a 3.0%
FY17 LTIp PSRs 11/8/2016 30/6/2019 A$17.95 A$19.49 n/a 2.9%
Awards that do not vest as at Vesting date automatically lapse.
Section 6 – Non-Executive DirectorsPolicy and approach to setting fees
Overview of policy Reflecting the Board’s focus on long term strategic direction and corporate performance rather than short term results, remuneration for the Chairman and other Non-Executive Directors is structured with a fixed fee component only. Fees are not linked to the performance of Ansell so that independence and impartiality is maintained.
To reflect the global representation that exists in the composition of the current Board (which includes Australian, US and UK resident directors), Directors fees are payable in US dollars, however Directors may elect to be paid in their local currency of choice. Thus Directors may be subject to currency fluctuations as their payment is done by converting their US dollar fees into their local currency using the applicable monthly spot exchange rates at the time of payment.
Board and Committee fees are set by reference to a number of relevant considerations including:
• responsibilities and accountabilities attaching to the role of Director;
• time commitment expected of Directors;
• fees paid by peer companies;
• independent advice received from external advisors;
• the global nature of our businesses (to ensure that the Directors’ fee attracts and retains the best international Directors); and
• the requirement to travel internationally to familiarise oneself with international operations and for required meetings.
Aggregate fees approved by shareholders The current aggregate fee pool for Non-Executive Directors of US$1,600,000 was approved by shareholders at the 2014 AGM. The fee pool in US$ reflects the fact the vast majority of business operations are run from outside Australia.
Remuneration Report continued
53
For
per
sona
l use
onl
y

Base fees for 2017 The Board periodically reviews its approach to Non-Executive Director remuneration to ensure it remains in line with general industry practice and best practice principles of corporate governance.
Fees for Non-Executive Directors during FY17 were as follows:
Base fees (Board)
Non-Executive Chairman US$320,000
Non-Executive Deputy Chairman US$160,000
Non-Executive Director US$116,500
Committee fees Committee Chair (Pre-February 2017)
Committee ChairPost-February 2017)
Committee member
Audit and Compliance Committee US$30,000 US$30,000 US$12,000
HR Committee US$24,000 US$30,000 US$12,000
Risk Committee US$24,000 US$30,000 US$12,000
The Board resolved, effective February 2017, that the appropriate fee for each Chair role was $30,000. This reflects the time commitment and level of responsibility now associated with these roles.
Directors are permitted to be paid additional fees for special duties, including fees paid for serving on ad hoc projects or transaction-focused committees.
In addition, Directors are also entitled to be reimbursed for all business-related expenses, including travel expenses as may be incurred in the discharge of their duties.
A travel allowance of US$15,000 per annum is paid to each Non-Executive Director, which is in addition to the above fees.
Superannuation contributions are made on behalf of the Non-Executive Directors at a rate of 9.5% as required by Australian law. For non-Australian based Directors, these payments are pro-rated for the period of time spent in Australia. The Directors fees above are inclusive of any Superannuation payments payable by law.
FY18The fees noted above will remain in place for FY18.
Remuneration Report continued
54
For
per
sona
l use
onl
y

Non-Executive Directors’ statutory remunerationDetails of Non-Executive Directors’ remuneration are set out in the following table:
Table 5 e)
Directors Fees1 Superannuation2 Total
Non-Executive Directors Year $ $ $
G LL Barnes (Chairman) 2017 335,000 0 335,000
2016 335,000 0 335,000
J A Bevan (Deputy Chairman)3 2017 148,664 14,441 163,105
2016 143,311 12,189 155,500
R J S Bell 2017 160,401 2,119 162,520
2016 153,685 1,815 155,500
L D Crandall 2017 165,326 2,174 167,500
2016 165,722 1,778 167,500
W P Day 2017 158,138 15,362 173,500
2016 159,749 13,751 173,500
L A Desjardins4 2017 153,401 2,099 155,500
2016 90,708 0 90,708
A H Lo5 2017 n/a n/a n/a
2016 64,054 738 64,792
M T Peterson 2017 167,353 2,487 169,840
2016 165,722 1,778 167,500
Total Non-Executive Directors’ Remuneration 2017 1,288,283 38,682 1,326,965
2016 1,277,951 32,049 1,310,000
1. Directors Fees include Base and Committee Fees plus travel allowances less Superannuation (see footnote (2) below). All Fees are expressed in US$. Due to changes to Committee Fees (as documented on page 54), the Fees have changed as compared with the prior year. The methodology of converting the Fees into the base currency of the Directors has not changed.
2. Superannuation contributions are made on behalf of the Non-Executive Directors at a rate of 9.5% as required by Australian law. For non-Australian based Directors, these payments are pro-rated for the period of time spent in Australia.
3. Following his appointment as Deputy Chairman on 10 February 2017, the Board resolved to pay Mr J Bevan a fee equivalent to half the Chairman’s fee. This fee, plus travel allowances, represents the entire Board and Committee fees earned by Mr J Bevan.
4. Mrs L Desjardins was appointed on 30 November 2015 and her Directors fees and associated entitlements reflects a part year entitlement in FY16 from her appointment.
5. Mrs A Lo retired from the Board on 30 November 2015 and her Directors fees and associated entitlements reflects a part year entitlement up to her retirement date in FY16.
The Composition of the Committees is summarised in the Report by the Directors.
Remuneration Report continued
55
For
per
sona
l use
onl
y

Non-Executive Directors’ Shares As noted above, the Non-Executive Directors are expected to invest an appropriate percentage of their gross fees in acquiring Ansell shares on market to achieve a shareholding worth two times’ annual Non-Executive Directors’ fees within a 10-year period from the earlier of 2013 or their start date. Under the Voluntary Share Purchasing Plan, a pre-agreed amount of Ansell shares (by value) are acquired monthly on the ASX through a trustee company at the prevailing market price and are transferred into the name of the Director, but are subject to a restriction on dealing until the Director ceases to hold office.
Shares were purchased on market (at no discount) on behalf of the Directors throughout FY17 pursuant to the Voluntary Share Purchasing Plan at the following prices per share. The second table shows the total number of shares purchased by the directors, both under the Voluntary Share Purchasing Plan and individual purchases in compliance with the Share Trading Policy.
Month Share Price Director Total Purchased in FY17
July 2016 19.40 Glenn L L Barnes 1,730
August 2016 22.46 Ronald J S Bell 3,311
September 2016 23.15 John Bevan 1,326
October 2016 21.62 L Dale Crandall 1,397
November 2016 22.63 W Peter Day 1,298
December 2016 24.76 Leslie A Desjardins 2,269
January 2017 23.79 Marissa Peterson 3,514
February 2017 21.24
March 2017 24.16
April 2017 n/a*
May 2017 n/a*
June 2017 n/a*
* Voluntary Share Purchasing Plan suspended in compliance with continuous disclosure obligations.
Remuneration Report continued
56
For
per
sona
l use
onl
y

Section 7 – GlossaryBoard means the Board of Directors of Ansell Limited.
Capex is an abbreviation for Capital Expenditure and means the Payments for property, plant, equipment (PP&E) and intangibles less the proceeds from sale of PP&E.
Constant Currency financial reporting is supplemental information. It is provided using the best estimate of the prior year results translated at the foreign currency exchange rates applicable to the current period and compared to the financial performance for the current year. As such, it is non-IFRS financial information.
CAGR means Compound Average Growth Rate which as used in this document measures the average year-over-year growth rate of a financial metric over the specified time period.
Corporations Act means the Corporations Act 2001 (Cth).
EBIT means all profits of Ansell before taking into account interest payments and income taxes.
EBITDA means EBIT before Depreciation and Amortisation.
EMEA means Europe, Middle East and Africa.
EPS means Earnings Per Share which means the portion of Ansell’s profit which is allocated to each outstanding ordinary fully-paid share.
Executive or Group Executive in this report refers to the CEO and Other Executive KMP.
FY16 means the 2016 financial year commencing on 1 July 2015 and ending on 30 June 2016.
FY17 means the 2017 financial year commencing on 1 July 2016 and ending on 30 June 2017.
FY18 means the 2018 financial year commencing on 1 July 2017 and ending on 30 June 2018.
FY19 means the 2019 financial year commencing on 1 July 2018 and ending on 30 June 2019.
HRC means the Human Resources Committee of the Board.
KMP means the Key Management Personnel of Ansell, which comprises all Directors (executive and non-executive) and those executives who have authority and responsibility for planning, directing and controlling the activities of the Group.
Long Term Incentive (LTI) means the Ansell Long Term Incentive Plan which is subject to the rules of the Ansell Long Term Incentive Plan as periodically approved by the Board.
Operating Cash Flow as referred to in the Remuneration Report, means net receipts from customers per the Consolidated Statement of Cash Flows adjusted for Capex (see above), and Interest received and paid (Net Interest).
Remuneration Report continued
57
For
per
sona
l use
onl
y

Other Executives means the group of people who are KMP but are not Non-executive Directors or the CEO.
Organic Growth means the change in total revenue achieved by normal business activities such as customer base expansion or new product development. It excludes the effects of corporate developments such as mergers, acquisitions, divestments and exiting lines of business.
PSRs means Performance Share Rights.
Profit Attributable means those profits of the Company which are available to the shareholders for distribution.
Realised Pay means the pay actually received/receivable by the executive during the financial year, including salary, benefits, STI in relation to the relevant financial year and any equity incentives which vested in relation to the completion of the relevant financial year.
ROCE means Return on Capital Employed which is the amount of EBIT returned as a percentage of the average funds that are employed (both equity and debt used in the business).
ROE Gateway means the return on equity required for the successful achievement of the relevant award.
Short Term Incentive Plan (STI) or (STIP) means the Ansell Short Term Incentive Plan which is subject to the rules of the Ansell Short Term Incentive Plan as periodically approved by the Board.
TSR means Total Shareholder Return which means the total financial return which an investor receives from holding shares in Ansell, assuming dividends paid are reinvested in Ansell shares.
TSR (A$) means Total Shareholder Return calculated in Australian dollars.
Working Capital is the balance as defined in Note 7 to the Financial Statements.
Underlying means, in connection with Underlying EPS and Underlying Profit Attributable, the respective EPS or Profit Attributable which is adjusted to exclude certain items (which might relate to one-off or extraordinary items). The exclusion of any items from the underlying result is approved by Ansell’s Board. The underlying measure may also be used in connection with the calculation of the vesting of the LTI Plan.
WACC means the Weighted Average Cost of Capital which is a calculation of the average cost to Ansell of the debt and equity capital employed in the business.
Remuneration Report continued
58
For
per
sona
l use
onl
y

Consolidated Income Statementof Ansell Limited and Subsidiaries for the year ended 30 June 2017
2016^
Note2017
US$mRestated
US$m
Continuing operations
Revenue
Sales revenue 1,374.5 1,352.8
Expenses
Cost of goods sold (833.3) (827.9)
Distribution (60.7) (60.9)
Selling, general and administration (302.7) (258.3)
Total expenses, excluding financing costs (1,196.7) (1,147.1)
Net financing costs 3 (22.7) (22.2)
Profit before income tax 155.1 183.5
Income tax expense 4(a) (33.9) (43.5)
Profit from continuing operations 121.2 140.0
Discontinued operations
Profit from discontinued operations, net of tax 18(b) 29.0 21.9
Profit for the period 150.2 161.9
Profit for the period is attributable to:
Ansell Limited shareholders 147.7 159.1
Non-controlling interests 2.5 2.8
Profit for the period 150.2 161.9
2017 US cents
2016 US cents
Earnings per share from continuing operations:
Basic Earnings Per Share 5 81.0 91.5
Diluted Earnings Per Share 5 80.0 91.0
Earnings per share from discontinued operations:
Basic Earnings Per Share 5 19.1 13.6
Diluted Earnings Per Share 5 18.9 13.5
^ In accordance with AASB 5 Non-current Assets Held for Sale and Discontinued Operations prior year comparatives have been restated to be consistent with disclosures for 30 June 2017. Refer to Note 18(b) Disposal Group held for sale.
The above Consolidated Income Statement should be read in conjunction with the accompanying notes.
59
For
per
sona
l use
onl
y

2017US$m
2016
US$m
Profit for the period 150.2 161.9
Other comprehensive income
Items that will not be reclassified to the Income Statement:
Retained earnings
Remeasurement of defined benefit superannuation/post retirement health benefit plans 2.9 (3.8)
Tax (expense)/benefit on items that will not be reclassified to the Income Statement (1.5) 1.3
Total items that will not be reclassified to the Income Statement 1.4 (2.5)
Items that may subsequently be reclassified to the Income Statement:
Foreign currency translation reserve
Net exchange differences on translation of financial statements of foreign subsidiaries 5.0 (30.9)
Hedging reserve
Net movement in effective hedges for year 0.4 (6.4)
Tax expense on items that may subsequently be reclassified to the Income Statement (0.3) (0.5)
Total items that may subsequently be reclassified to the Income Statement 5.1 (37.8)
Other comprehensive income for the period, net of tax 6.5 (40.3)
Total comprehensive income for the period 156.7 121.6
Attributable to:
Ansell Limited shareholders 154.1 119.7
Non-controlling interests 2.6 1.9
Total comprehensive income for the period 156.7 121.6
Attributable to Ansell Limited shareholders:
From continuing operations 124.6 104.1
From discontinued operations 29.5 15.6
Total comprehensive income for the period, attributable to Ansell Limited shareholders 154.1 119.7
The above Consolidated Statement of Comprehensive Income should be read in conjunction with the accompanying notes.
Consolidated Statement of Comprehensive Incomeof Ansell Limited and Subsidiaries for the year ended 30 June 2017
60
For
per
sona
l use
onl
y

2017 2016*Note US$m US$m
Current assets
Cash and cash equivalents 6(a) 316.6 272.7
Trade and other receivables 7(a) 189.9 223.5
Derivative financial instruments 15(c) 4.6 8.2
Inventories 7(b) 331.9 322.8
Other current assets 16.8 19.4
Assets held for sale 18(b) 200.9 –
Total current assets 1,060.7 846.6
Non-current assets
Trade and other receivables 2.7 2.6
Derivative financial instruments 15(c) 4.0 4.9
Property, plant and equipment 8 217.9 245.0
Intangible assets 9 1,049.8 1,077.3
Deferred tax assets 4(b) 88.5 90.6
Other non-current assets 26.9 23.6
Total non-current assets 1,389.8 1,444.0
Total assets 2,450.5 2,290.6
Current liabilities
Trade and other payables 7(c) 222.5 235.2
Derivative financial instruments 15(d) 7.9 5.8
Interest bearing liabilities 10 3.8 5.0
Provisions 11 56.7 48.8
Current tax liabilities 29.0 19.9
Liabilities held for sale 18(b) 42.8 –
Total current liabilities 362.7 314.7
Non-current liabilities
Trade and other payables 1.3 4.1
Derivative financial instruments 15(d) 0.8 5.0
Interest bearing liabilities 10 716.7 686.6
Provisions 11 8.2 10.6
Retirement benefit obligations 12(a) 19.0 23.1
Deferred tax liabilities 4(c) 89.9 89.5
Other non-current liabilities 23.2 20.3
Total non-current liabilities 859.1 839.2
Total liabilities 1,221.8 1,153.9
Net assets 1,228.7 1,136.7
Equity
Issued capital 13(a) 1,142.2 1,146.9
Reserves (78.2) (88.3)
Retained profits 146.9 62.4
Total equity attributable to Ansell Limited shareholders 1,210.9 1,121.0
Non-controlling interests 17.8 15.7
Total equity 1,228.7 1,136.7
* In accordance with AASB 5 Non-current Assets held for Sale and Discontinued Operations prior year comparatives have not been restated for the impact of the Disposal Group held for sale. Refer to Note 18(b) Disposal Group held for sale.
The above Consolidated Balance Sheet should be read in conjunction with the accompanying notes.
Consolidated Balance Sheetof Ansell Limited and Subsidiaries for the year ended 30 June 2017
61
For
per
sona
l use
onl
y

Consolidated Statement of Changes in Equityof Ansell Limited and Subsidiaries for the year ended 30 June 2017
2017US$m
2016US$m
Total equity
Balance at the beginning of the financial year 1,136.7 1,166.6
Total comprehensive income for the period attributable to:
Ansell Limited shareholders 154.1 119.7
Non-controlling interests 2.6 1.9
Transactions with owners attributable to Ansell Limited shareholders:
Shares issued under Dividend Reinvestment Plan 4.0 5.4
Share buy-back (8.7) (88.1)
Share-based payments reserve 4.7 (2.2)
Dividends (64.3) (65.6)
Transactions with owners attributable to non-controlling interests:
Dividends (0.4) (1.0)
Total equity at the end of the financial year 1,228.7 1,136.7
Share capital
Balance at the beginning of the financial year 1,146.9 1,229.6
Transactions with owners as owners:
Shares issued under Dividend Reinvestment Plan 4.0 5.4
Share buy-back (8.7) (88.1)
Balance at the end of the financial year 1,142.2 1,146.9
The above Consolidated Statement of Changes in Equity should be read in conjunction with the accompanying notes.
62
For
per
sona
l use
onl
y

2017US$m
2016US$m
Reserves
Share-based payments reserve
Balance at the beginning of the financial year 43.0 45.2
Transactions with owners as owners:
Charge/(credit) to the Income Statement 4.7 (2.2)
Balance at the end of the financial year 47.7 43.0
Hedging reserve
Balance at the beginning of the financial year (2.2) 4.7
Comprehensive income for the period:
Net movement in effective hedges 0.1 (6.9)
Balance at the end of the financial year (2.1) (2.2)
General reserve
Balance at the beginning of the financial year 11.7 11.6
Transfer from retained profits 0.3 0.1
Balance at the end of the financial year 12.0 11.7
Foreign currency translation reserve
Balance at the beginning of the financial year (132.5) (102.5)
Comprehensive income for the period:
Net exchange differences on translation of financial statements of foreign subsidiaries 5.0 (30.0)
Balance at the end of the financial year (127.5) (132.5)
Transactions with non-controlling interests
Balance at the beginning of the financial year (10.9) (10.9)
Balance at the end of the financial year (10.9) (10.9)
Fair value reserve
Balance at the beginning of the financial year 2.6 2.6
Balance at the end of the financial year 2.6 2.6
Total reserves at the end of the financial year (78.2) (88.3)
Retained profits
Balance at the beginning of the financial year 62.4 (28.5)
Transfer to reserves (0.3) (0.1)
Comprehensive income for the period:
Net profit attributable to Ansell Limited shareholders 147.7 159.1
Remeasurement of defined benefit superannuation/post retirement health benefit plans net of tax 1.4 (2.5)
Dividends paid (64.3) (65.6)
Balance at the end of the financial year 146.9 62.4
The above Consolidated Statement of Changes in Equity should be read in conjunction with the accompanying notes.
Consolidated Statement of Changes in Equity continuedof Ansell Limited and Subsidiaries for the year ended 30 June 2017
63
For
per
sona
l use
onl
y
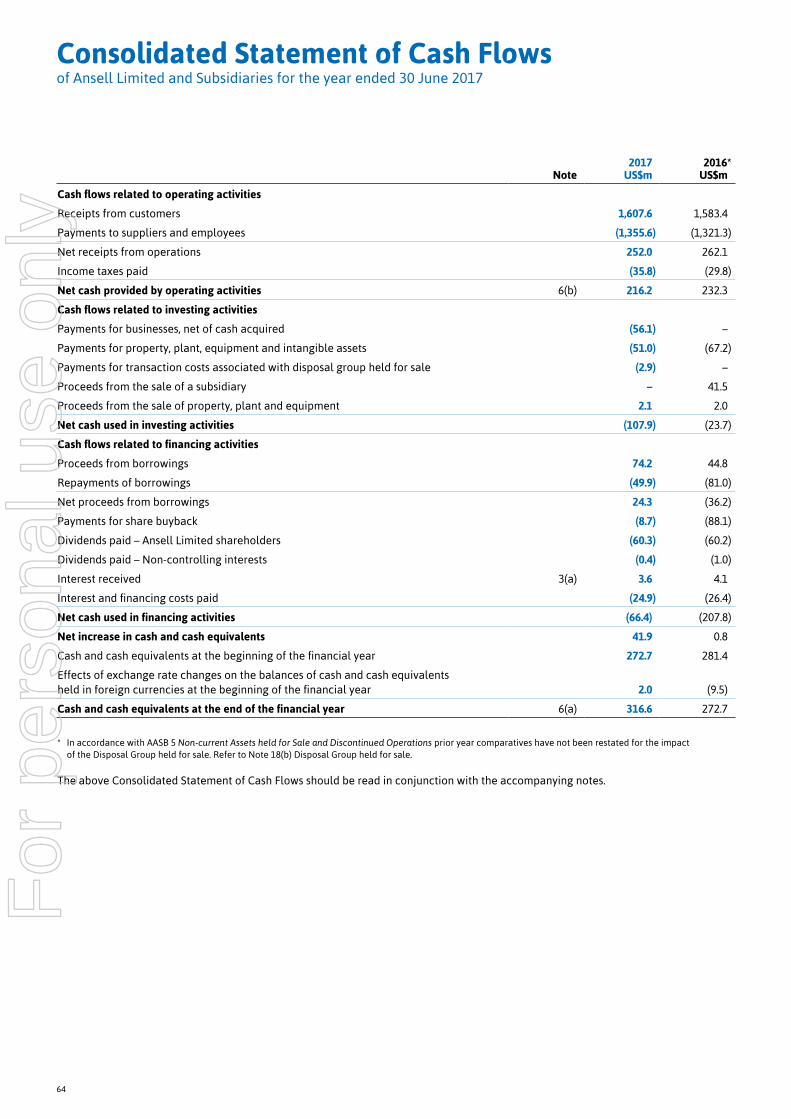
Consolidated Statement of Cash Flowsof Ansell Limited and Subsidiaries for the year ended 30 June 2017
2017 2016*Note US$m US$m
Cash flows related to operating activities
Receipts from customers 1,607.6 1,583.4
Payments to suppliers and employees (1,355.6) (1,321.3)
Net receipts from operations 252.0 262.1
Income taxes paid (35.8) (29.8)
Net cash provided by operating activities 6(b) 216.2 232.3
Cash flows related to investing activities
Payments for businesses, net of cash acquired (56.1) –
Payments for property, plant, equipment and intangible assets (51.0) (67.2)
Payments for transaction costs associated with disposal group held for sale (2.9) –
Proceeds from the sale of a subsidiary – 41.5
Proceeds from the sale of property, plant and equipment 2.1 2.0
Net cash used in investing activities (107.9) (23.7)
Cash flows related to financing activities
Proceeds from borrowings 74.2 44.8
Repayments of borrowings (49.9) (81.0)
Net proceeds from borrowings 24.3 (36.2)
Payments for share buyback (8.7) (88.1)
Dividends paid – Ansell Limited shareholders (60.3) (60.2)
Dividends paid – Non-controlling interests (0.4) (1.0)
Interest received 3(a) 3.6 4.1
Interest and financing costs paid (24.9) (26.4)
Net cash used in financing activities (66.4) (207.8)
Net increase in cash and cash equivalents 41.9 0.8
Cash and cash equivalents at the beginning of the financial year 272.7 281.4
Effects of exchange rate changes on the balances of cash and cash equivalents held in foreign currencies at the beginning of the financial year 2.0 (9.5)
Cash and cash equivalents at the end of the financial year 6(a) 316.6 272.7
* In accordance with AASB 5 Non-current Assets held for Sale and Discontinued Operations prior year comparatives have not been restated for the impact of the Disposal Group held for sale. Refer to Note 18(b) Disposal Group held for sale.
The above Consolidated Statement of Cash Flows should be read in conjunction with the accompanying notes.
64
For
per
sona
l use
onl
y

Notes to the Financial Statements
1. Summary of Significant Accounting PoliciesGeneralAnsell Limited (‘the Company’) is a Company domiciled in Australia. The Company and its subsidiaries (together referred to as the ‘Group’) is a global leader in protection solutions. The Group is a for-profit entity and designs, develops and manufactures a wide range of hand and arm protection solutions and clothing and is organised around three Global Business Units ('GBUs') as detailed in Note 2:
• Industrial GBU;
• Medical GBU; and
• Single Use GBU.
As a result of the execution of a binding agreement for the sale of the Sexual Wellness business the results of this business are reported as a Discontinued Operation. Refer to Note 18(b) Disposal Group held for sale.
Statement of complianceThe Financial Report is a general purpose financial report which has been prepared in accordance with Australian Accounting Standards adopted by the Australian Accounting Standards Board (AASB) and the Corporations Act 2001. The Financial Report of the Group also complies with International Financial Reporting Standards and interpretations adopted by the International Accounting Standards Board.
The consolidated financial statements were authorised for issue by the Board of Directors on 14 August 2017.
Basis of accountingThe Financial Report is presented in United States dollars and on the historical cost basis except that assets and liabilities in respect of derivative financial instruments and available-for-sale financial assets are stated at their fair value.
The Company is of a kind referred to in ASIC Corporations (Rounding in Financial/Directors’ Reports) Instrument 2016/191 dated 31 March 2016 and in accordance with the Instrument, amounts in the Financial Report and Directors’ Report have been rounded off to the nearest hundred thousand dollars, unless otherwise stated.
A summary of the significant accounting policies of the Group are disclosed below. The accounting policies have been applied consistently by all entities in the Group.
There has been no change to the Group’s accounting policies during the financial year.
New accounting standards issued but not yet appliedIFRS 15/AASB 15 Revenue from Contracts with Customers establishes a comprehensive framework for determining whether, how much, and when revenue is recognised. It replaces existing revenue recognition guidance, including IAS 18/AASB 118 Revenue, IAS 11/AASB 111 Construction contracts, and IFRIC 13/Australian Interpretations 13 Customer Loyalty Programmes. IFRS 15/AASB 15 is effective for annual reporting periods beginning on or after 1 January 2018 (financial year commencing 1 July 2018 for the Group), with early adoption permitted. The Group has assessed the impact on its consolidated financial statements resulting from the application of IFRS 15/AASB 15 and has determined that this will have no material impact.
IFRS 16/AASB 16 Leases removes the classification of leases as either operating leases or finance leases. IFRS 16/AASB 16 introduces a single lessee accounting model and requires a lessee to recognise a right-of-use asset representing its right to use the underlying leased asset and a lease liability representing its obligations to make lease payments. Short-term leases (less than 12 months) and leases of low-value assets (such as personal computers) are exempt from the lease accounting requirements. There are also changes in accounting over the life of the lease. In particular, companies will now recognise a front-loaded pattern of expense for most leases, even when they pay constant annual rentals. IFRS 16/AASB 16 is effective for annual reporting periods beginning on or after 1 January 2019 (financial year commencing 1 July 2019 for the Group), with early adoption permitted. The Group is assessing the potential impact on its consolidated financial statements resulting from the application of IFRS 16/AASB 16.
65
For
per
sona
l use
onl
y

Notes to the Financial Statements continued
Principles of consolidationThe financial statements of the Group include the Company being the parent entity, and its subsidiaries.
The financial statements incorporate the assets and liabilities of all subsidiaries of the Company as at balance date and the results of all subsidiaries for the year then ended. Subsidiaries are entities controlled by the Company. Control exists when the Company is exposed to, or has rights to variable returns from its involvement with the entity and has the ability to affect those returns through its power over the entity. Results of subsidiaries are included in the Income Statement from the date on which control commences and continue to be included until the date control ceases to exist.
The effects of all transactions between entities in the Group are eliminated in full. Non-controlling interests in the results and equity of subsidiaries are shown separately in the Income Statement and Balance Sheet respectively.
Foreign currencyTransactions
Transactions in foreign currencies are recorded at the rate of exchange ruling on the date of each transaction. At balance date, amounts payable and receivable in foreign currencies are converted at the rates of exchange ruling at that date with any resultant gain or loss recognised in the Income Statement except when deferred in equity as qualifying cash flow hedges or qualifying net investment hedges.
Translation
The financial statements of overseas subsidiaries are maintained in their functional currencies and are converted to the Group’s presentation currency as follows:
• assets and liabilities are translated at the rate of exchange as at balance date;
• income statements are translated at average exchange rates for the reporting period which approximate the rates ruling at the dates of the transactions; and
• all resultant exchange differences are recorded in the foreign currency translation reserve.
On consolidation, exchange differences arising from borrowings and any other currency instruments designated as hedges of investments in overseas subsidiaries, are transferred to the foreign currency translation reserve. When an overseas subsidiary is sold the cumulative amount recognised the foreign currency translation reserve relating to the subsidiary is recognised in the income statement as part of the gain or loss on sale.
Recoverable amount of non-current assets valued on the cost basisThe carrying amounts of non-current assets valued on the cost basis are reviewed to determine whether they are in excess of their recoverable amount at balance date. An impairment loss is recognised whenever the carrying amount of a non-current asset exceeds its recoverable amount. The impairment loss is recognised as an expense in the Income Statement in the reporting period in which it occurs.
The recoverable amount of a non-current asset is the higher of an asset’s fair value less costs of disposal and value in use. In assessing value in use, the estimated future cash flows are discounted to their present value using a post-tax discount rate that reflects current market assessments of the time value of money and the risks specific to the asset. For an asset that does not generate largely independent cash flows, the recoverable amount is determined for the Cash Generating Unit (CGU) to which the asset belongs.
Impairment losses, other than those in respect of goodwill, are reversed through the Income Statement when there is an indication that the impairment loss may no longer exist.
1. Summary of Significant Accounting Policies continued
66
For
per
sona
l use
onl
y

Accounting estimates and judgementsThe preparation of consolidated financial statements in conformity with Australian generally accepted accounting principles requires management to make estimates and assumptions that affect the reported amounts of assets and liabilities and disclosure of contingent assets and liabilities at the date of the consolidated financial statements and the reported amounts of revenues and expenses during the reported period. The estimates and associated assumptions are based on historical experience and various factors that are believed to be reasonable under the circumstances and are reviewed on an ongoing basis. Actual results could differ from these estimates.
Revisions to accounting estimates are recognised in the period in which the estimate is revised if the revision affects only that period, or in the period of the revision and future periods if the revision affects both current and future periods.
The key estimates and assumptions that may have a significant impact on the financial statements are as follows:
Business combinations
A business acquisition requires judgement with respect to the determination of the fair value of purchase consideration given and the fair value of identifiable assets and liabilities acquired. Many of these assets and liabilities either given up or acquired are not normally traded in active markets, and thus management judgement is required in determining their fair values. Management judgement is also required in ascertaining the assets and liabilities, which should be recognised, in particular with respect to intangible assets such as brand names, customer relationships, patents and trademarks and contingent liabilities.
Current asset provisions
In the course of normal trading activities, management uses its judgement in establishing the net realisable value of various elements of working capital – principally inventory and accounts receivable. Provisions are established for obsolete or slow moving inventories and bad or doubtful receivables. The actual level of obsolete or slow moving inventories and bad or doubtful receivables in future periods may be different from the provisions established and any such differences would affect future earnings of the Group.
Property, plant and equipment and definite life intangible assets
The Group’s property, plant and equipment and intangible assets, other than indefinite life intangible assets, are depreciated/amortised on a straight-line basis over their useful economic lives. Management reviews the appropriateness of useful economic lives of assets at least annually and any changes to useful economic lives may affect prospective depreciation rates and asset carrying values.
Impairment of goodwill and brand names
The Group tests whether goodwill and brand names are impaired at least annually, or more frequently if events or changes in circumstances indicate that their carrying values may be impaired, in accordance with the accounting policy on intangible assets. The policy requires the use of assumptions in assessing the carrying values of CGUs. These assumptions are detailed in Note 9.
Income tax
The Group operates in a number of tax jurisdictions and needs to consider their varying complexities, differing tax rules and the changing tax environments. The Group has processes to assess and manage these issues including the use of external tax advisors.
The reviews undertaken to determine whether a deferred tax asset should be recognised in jurisdictions where unbooked tax losses exist and in assessing the recoverability of booked tax losses, involve the use of judgement and estimates in assessing the projected future trading performances of relevant operations. These judgements and estimates are subject to risk and uncertainty hence there is a possibility that changes in circumstances will alter expectations, which may impact on the amount of the deferred tax asset in respect of tax losses recognised on the Balance Sheet. In such circumstances the carrying amount of this asset may require adjustment resulting in a corresponding credit or charge to the Income Statement.
Defined benefit superannuation plans
Various actuarial assumptions are utilised in the determination of the Group’s defined benefit superannuation plan obligations. These assumptions are detailed in Note 12.
Other accounting policies Other accounting policies that summarise the measurement basis used and are relevant to an understanding of the financial statements are provided throughout the notes to the financial statements.
Notes to the Financial Statements continued
67
For
per
sona
l use
onl
y

2. Segment InformationThe Group comprises the following main operating segments:
Industrial GBU: multi-use hand, foot and body protection solutions for industrial worker environments and specialty applications.
Medical GBU: surgical and examination gloves, healthcare safety devices and active infection prevention products for healthcare professionals and patients.
Single Use GBU: single use industrial application gloves.
As a result of the execution of a binding agreement for the sale of the Sexual Wellness business the results of this business are reported as a Discontinued Operation. Refer to Note 18(b) Disposal Group held for sale.
Operating Segments
2017Industrial
US$mMedical
US$mSingle Use
US$mCorporate
US$m
Continuing Operations
US$m
Discontinued Operations
US$m
Total GroupUS$m
Sales revenue 655.9 399.6 319.0 – 1,374.5 225.2 1,599.7
Profit/(loss) before net financing costs and income tax expense1 79.8 47.0 63.1 (12.1) 177.8 40.0 217.8
Net financing costs (22.7) (22.7) – (22.7)
Profit before income tax expense 79.8 47.0 63.1 (34.8) 155.1 40.0 195.1
Income tax expense (33.9) (11.0) (44.9)
Profit after income tax 121.2 29.0 150.2
Non-controlling interests (1.7) (0.8) (2.5)
Net profit attributable to Ansell Limited shareholders 119.5 28.2 147.7
Segment assets 735.2 480.8 552.2 481.4 2,249.6 200.9 2,450.5
Segment liabilities 119.8 74.0 40.4 944.8 1,179.0 42.8 1,221.8
Segment depreciation and amortisation 19.5 10.4 4.5 6.4 40.8 4.1 44.9
Segment capital expenditure 29.6 14.3 1.6 0.8 46.3 4.7 51.0
1. The current year’s results of continuing operating segments have been impacted by the absorption of corporate costs that were allocated to the Sexual Wellness (Discontinued) operating segment in the prior year.
20162
Sales revenue 654.8 396.3 301.7 – 1,352.8 220.0 1,572.8
Profit/(loss) before gain sale of a subsidiary and net financing costs and income tax expense 89.0 52.3 64.6 (8.3) 197.6 31.0 228.6
Gain on sale of a subsidiary – – – 8.1 8.1 – 8.1
Net financing costs (22.2) (22.2) – (22.2)
Profit before income tax expense 89.0 52.3 64.6 (22.4) 183.5 31.0 214.5
Income tax expense (43.5) (9.1) (52.6)
Profit after income tax 140.0 21.9 161.9
Non-controlling interests (1.5) (1.3) (2.8)
Net profit attributable to Ansell Limited shareholders 138.5 20.6 159.1
Segment assets 704.8 468.7 474.8 437.8 2,086.1 204.5 2,290.6
Segment liabilities 107.6 78.7 28.0 889.7 1,104.0 49.9 1,153.9
Segment depreciation and amortisation 16.1 8.9 4.2 4.9 34.1 3.9 38.0
Segment capital expenditure 25.2 22.5 3.5 7.2 58.4 8.8 67.2
2. In accordance with AASB 5 Non-current Assets Held for Sale and Discontinued Operations prior year comparatives have been restated to be consistent with disclosures for 30 June 2017. Refer to Note 18(b) Disposal Group held for sale.
Notes to the Financial Statements continued
68
For
per
sona
l use
onl
y

Regional informationSales Revenue is disclosed in the four geographical regions based on where the products are sold to external customers.
Assets (excluding goodwill and brand names) are allocated to the geographical regions in which the assets are located.
Asia Pacific: manufacturing facilities in Malaysia, Thailand, India, Sri Lanka, South Korea, China and Vietnam.
Europe, Middle East and Africa: manufacturing facilities in Lithuania and Portugal.
Latin America and Caribbean: manufacturing facilities in Brazil.
North America: manufacturing facilities in USA and Mexico.
The table set out below summarises:
(i) Regional sales revenue from continuing operations.
(ii) Regional assets related to continuing operations at 30 June 2017 and all operations at 30 June 2016.
Sales Revenue Regional Assets
2016^
2017 US$m
Restated US$m
2017 US$m
2016 US$m
Regions
Asia Pacific 168.4 159.6 312.8 376.4
Europe, Middle East and Africa 485.0 484.1 180.4 187.8
Latin America and Caribbean 93.6 75.8 49.4 49.4
North America 627.5 633.3 223.8 213.2
Total Regions 1,374.5 1,352.8 766.4 826.8
Country of domicileThe Company's country of domicile is Australia. The Sales Revenue and Assets for the Australian trading operations (reported within the Asia Pacific region) are as follows:
(i) Sales revenue from continuing operations.
(ii) Assets related to continuing operations at 30 June 2017 and all operations at 30 June 2016.
2016^
2017 US$m
Restated US$m
2017 US$m
2016 US$m
Sales Revenue 116.6 96.3
Assets 47.4 47.6
3. Profit Before Income TaxThis table summarises expenses by nature from continuing operations:
2016^
2017 US$m
Restated US$m
(a) Profit before income tax has been arrived at after charging/(crediting) the following items:
Interest expense 23.3 23.7Other financing costs 3.0 2.6 Interest income (3.6) (4.1)Net financing costs 22.7 22.2
Research and development costs expensed as incurred 11.0 10.5 Previously capitalised development costs written off 0.2 0.9 Research and development costs 11.2 11.4
Bad debts written off – 0.1 Provision for impairment of trade receivables – recognised – 0.1 Net bad debts expense and provision for impairment of trade debtors – 0.2
^ In accordance with AASB 5 Non-current Assets Held for Sale and Discontinued Operations prior year comparatives have been restated to be consistent with disclosures for 30 June 2017. Refer to Note 18(b) Disposal Group held for sale.
Notes to the Financial Statements continued
69
For
per
sona
l use
onl
y

2016^
2017 US$m
Restated US$m
Wages and salaries 222.7 202.4
Increase in provision for employee entitlements 11.3 12.3
Defined contribution superannuation plan expense 13.7 13.0
Defined benefit superannuation plan expense 0.3 2.8
Equity settled share-based payments expense 4.7 (2.2)
Employee benefits expense 252.7 228.3
Net foreign exchange loss/(gain) 1.2 (0.7)
Loss/(profit) on the sale of property, plant and equipment 0.1 (1.1)
Gain on the sale of a subsidiary – (8.1)
Operating lease rentals 24.7 23.5
Write-down in value of inventories 4.9 5.9
^ In accordance with AASB 5 Non-current Assets Held for Sale and Discontinued Operations prior year comparatives have been restated to be consistent with disclosures for 30 June 2017. Refer to Note 18(b) Disposal Group held for sale.
(b) Recognition and measurementSales revenueSales revenue is measured at the fair value of the consideration received or receivable, net of returns, trade discounts and allowances. External sales are recognised when the significant risks and rewards of ownership of the goods have been transferred to the buyer and can be measured reliably.
Notes to the Financial Statements continued
3. Profit Before Income Tax continued
70
For
per
sona
l use
onl
y

4. Income Tax
2016^
2017 US$m
Restated US$m
(a) Income tax expense
Prima facie income tax calculated at 30% (2016: 30%) on profit before income tax 46.5 55.1
Reduced taxation arising from:
Investment and export incentive allowances (9.3) (8.9)
Net (lower)/higher overseas tax rates (0.4) 0.8
Utilisation/recognition of previously unbooked tax losses (2.6) (7.3)
Other permanent differences (0.3) 3.8
Income tax expense attributable to profit before income tax 33.9 43.5
Income tax expense attributable to profit before income tax is made up of:
Current year income tax 35.4 27.7
Deferred income tax attributable to:
Increase in deferred tax liability 0.4 4.5
(Increase)/decrease in deferred tax asset (1.9) 11.3
33.9 43.5
^ In accordance with AASB 5 Non-current Assets Held for Sale and Discontinued Operations prior year comparatives have been restated to be consistent with disclosures for 30 June 2017. Refer to Note 18(b) Disposal Group held for sale.
2017 US$m
2016 US$m
Income tax benefit/(expense) recognised in other comprehensive income
Remeasurement of defined benefit superannuation/post retirement health benefit plans 1.5 (1.3)
Movement in effective hedges for year 0.3 0.5
1.8 (0.8)
Notes to the Financial Statements continued
71
For
per
sona
l use
onl
y

The following summarises deferred tax assets and liabilities related to continuing operations at 30 June 2017 and all operations at 30 June 2016:
2017US$m
2016US$m
(b) Deferred tax assets
Deferred tax assets arising from:
Deductible temporary differences 51.8 45.2
Accumulated tax losses 36.7 45.4
88.5 90.6
Deferred tax assets are attributable to the following:
Trading stock tax adjustments 5.9 6.4
Provisions 19.6 19.9
Accruals 7.1 6.0
Amortisation of intangible assets 11.5 12.9
Assets/liabilities held for sale 7.7 –
Accumulated tax losses 36.7 45.4
Total deferred tax assets 88.5 90.6
Details of the movement in the balance of deferred tax assets are as follows:
Balance at the beginning of the financial year 90.6 101.2
(Over)/under provision of prior year balance (0.1) 1.6
Amount charged to the Income Statement 1.9 (11.3)
Amount (charged)/credited to other comprehensive income (1.8) 0.8
Reclassification to assets held for sale (4.1) –
Net exchange differences on translation of foreign subsidiaries 2.0 (1.7)
Balance at the end of the financial year 88.5 90.6
(c) Deferred tax liabilities
Deferred tax liabilities are attributable to the following:
Depreciation on plant and equipment 4.2 3.8
Amortisation of intangible assets 85.7 85.2
Other – 0.5
Total deferred tax liabilities 89.9 89.5
Details of the movement in the balance of deferred tax liabilities are as follows:
Balance at the beginning of the financial year 89.5 84.4
Under provision of prior year balance 0.7 1.0
Amount charged to the Income Statement 0.4 4.5
Reclassification to liabilities held for sale (0.6) –
Net exchange differences on translation of foreign subsidiaries (0.1) (0.4)
Balance at the end of the financial year 89.9 89.5
Notes to the Financial Statements continued
4. Income Tax continued
72
For
per
sona
l use
onl
y

(d) Recognition and measurementCurrent taxIncome tax on the profit or loss for the financial year comprises current and deferred tax and is recognised in the Income Statement. Current tax is the expected tax payable or receivable on taxable income for the financial year, using tax rates enacted or substantively enacted at reporting date, and any adjustments to tax payable or receivable in respect of previous years.
Deferred taxDeferred tax balances are determined using the Balance Sheet method which calculates temporary differences based on the carrying amounts of an entity’s assets and liabilities in the Balance Sheet and their associated tax bases. The amount of deferred tax provided is based on the expected manner of realisation of the asset or settlement of the liability, using tax rates enacted or substantively enacted at reporting date. In jurisdictions where unbooked tax losses exist, regular reviews are undertaken of the past trading history and projected future trading performance of the operations in these jurisdictions as part of the determination of the value of any deferred tax asset that should be reflected in the accounts in respect of such losses. A deferred tax asset is recognised only to the extent that it is probable that future taxable profits will be available against which the asset can be utilised. Deferred tax assets are reduced to the extent it is no longer probable that the related tax benefit will be realised.
The Group has not recognised the tax value of deferred tax assets in respect of trading tax losses of $13.8 million (2016: $14.3 million) and $54.8 million of capital losses (2016: $113.4 million). The reduction in unbooked capital losses during the year was due to the tax attributes of the expected sale of the Sexual Wellness business. Deferred tax assets in respect of these unbooked losses have not been recognised as it is not probable that future taxable profits will be available against which these losses can be utilised.
Current and deferred tax is recognised in profit or loss, except to the extent that it relates to items recognised in other comprehensive income. In this case, the associated tax is also recognised in other comprehensive income.
5. Earnings Per Share2017
US$m 2016
US$m
Earnings reconciliation
Profit for the period 150.2 161.9
Less profit for the period attributable to non-controlling interests (2.5) (2.8)
Basic earnings 147.7 159.1
From continuing operations 119.5 138.5 From discontinued operations 28.2 20.6
147.7 159.1
Diluted earnings 147.7 159.1
From continuing operations 119.5 138.5
From discontinued operations 28.2 20.6
147.7 159.1
Number of Shares (Millions)
Weighted average number of ordinary shares used as the denominator
Number of ordinary shares for basic Earnings Per Share 147.5 151.4
Effect of partly paid Executive Plan shares and Performance Share Rights (PSRs) 1.8 0.8
Number of ordinary shares for diluted Earnings Per Share 149.3 152.2
US Cents US Cents
Earnings per share from continuing operations
Basic earnings per share 81.0 91.5
Diluted earnings per share 80.0 91.0
Earnings per share from discontinued operations
Basic earnings per share 19.1 13.6
Diluted earnings per share 18.9 13.5
Notes to the Financial Statements continued
73
For
per
sona
l use
onl
y

5. Earnings Per Share continuedRecognition and measurement
Earnings per share (EPS) is the amount of profit attributable to each share. Basic EPS is calculated on the Group's profit for the year attributable to equity shareholders divided by the weighted average number of shares on issue during the year. Diluted EPS reflects any commitments the Group has to issue shares in the future. Partly paid Executive Plan shares and PSRs have been included in diluted earnings per share.
6. Cash and Cash Equivalents
2017US$m
2016US$m
(a) Cash and cash equivalentsCash on hand 0.2 0.2
Cash at bank 144.7 87.2
Short-term deposits 168.7 182.4
313.6 269.8
Restricted deposits 3.0 2.9
Total cash and cash equivalents 316.6 272.7
(b) Reconciliation of net profit after tax to net cash provided by operating activitiesProfit for the period 150.2 161.9
Add/(less) non-cash items:
Depreciation 30.7 29.0
Amortisation 14.2 9.0
Impairment/(impairment reversal) – trade receivables (0.6) 0.4
Share-based payments expense 4.7 (2.2)
Add/(less) items classified as investing/financing activities:
Interest received (3.6) (4.1)
Interest and financing costs paid 26.3 26.4
Gain/loss on the sale of property, plant and equipment (0.5) (1.1)
Gain on the sale of a subsidiary – (8.1)
Net cash provided by operating activities before change in assets and liabilities 221.4 211.2
Change in assets and liabilities net of effect from acquisitions and disposals of businesses and subsidiaries:
Decrease in trade and other receivables 8.2 14.3
(Increase)/decrease in inventories (38.0) 0.7
Increase in other assets (2.1) (2.4)
Increase in trade and other payables 8.4 –
Increase/(decrease) in provisions/other liabilities 10.4 (15.8)
(Decrease)/increase in retirement benefit obligations (1.1) 1.4
Increase in provision for deferred income tax 0.4 6.6
(Increase)/decrease in deferred tax asset (1.3) 10.3
Increase in provision for income tax 9.9 5.5
Other non-cash items (including foreign currency impact) – 0.5
Net cash provided by operating activities 216.2 232.3
(c) Recognition and measurementCash at bank and on depositCash and cash equivalents includes cash on hand and at banks and investments in money market instruments, net of outstanding bank overdrafts.
Restricted depositsRestricted deposits represent cash set aside (under Court orders) to cover the provisions established to address any remaining liability of members of the Group for claims arising with respect to the Accufix Pacing Lead (refer Note 11 Provisions – Other Provisions).
Notes to the Financial Statements continued
74
For
per
sona
l use
onl
y

7. Working CapitalThis table summarises working capital related to continuing operations at 30 June 2017 and all operations at 30 June 2016:
2017US$m
2016US$m
Working capital comprises:
Net trade receivables 174.6 219.0
Inventories 331.9 322.8
Trade payables (197.8) (199.9)
Total working capital 308.7 341.9
(a) Current trade and other receivablesThis table summarises current trade and other receivables related to continuing operations at 30 June 2017 and all operations at 30 June 2016:
Trade receivables 218.5 263.1
Allowance for impairment (4.5) (8.2)
Provision for rebates and allowances (39.4) (35.9)
Net trade receivables 174.6 219.0
Other amounts receivable 15.3 4.5
Total current trade and other receivables 189.9 223.5
Movements in the allowance for impairment of trade receivables:This table summarises the allowance for impairment of trade receivables related to continuing operations at 30 June 2017 and all operations at 30 June 2016:
Balance at the beginning of the financial year 8.2 8.6
Amounts charged to the Income Statement – 0.4
Amounts utilised for intended purposes (0.1) (0.4)
Reclassification to assets held for sale (3.7) –
Net exchange differences on translation of foreign subsidiaries 0.1 (0.4)
Balance at the end of the financial year 4.5 8.2
Gross Trade Receivables Allowance for Impairment
2017US$m
2016US$m
2017US$m
2016US$m
Ageing of trade receivables:
Within agreed terms 189.0 213.3 – –
Past due 0 – 60 days 26.0 33.8 2.1 1.9
Past due 61 – 90 days 1.5 1.7 0.6 0.3
Past due 91 days or more 2.0 14.3 1.8 6.0
Total 218.5 263.1 4.5 8.2
Notes to the Financial Statements continued
75
For
per
sona
l use
onl
y

(b) InventoriesThis table summarises inventories related to continuing operations at 30 June 2017 and all operations at 30 June 2016:
2017US$m
2016US$m
Raw materials 35.7 40.1
Work in progress 15.2 19.0
Finished goods 281.0 263.7
Total inventories 331.9 322.8
2016^
2017 US$m
Restated US$m
Inventories recognised as an expense 794.9 791.2
^ In accordance with AASB 5 Non-current Assets Held for Sale and Discontinued Operations prior year comparatives have been restated to be consistent with disclosures for 30 June 2017. Refer to Note 18(b) Disposal Group held for sale.
(c) Current trade and other payablesThis table summarises current trade and other payables related to continuing operations at 30 June 2017 and all operations at 30 June 2016:
2017US$m
2016US$m
Current
Trade payables 197.8 199.9
Other payables 24.7 35.3
Total current trade and other payables 222.5 235.2
(d) Recognition and measurementTrade receivablesTrade receivables are carried at amounts due. Receivables that are not past due and not impaired are considered recoverable. Trade receivables are recognised initially at the value of the invoice sent to the customer and subsequently at the amount considered recoverable. Customer trading terms are generally between 30 – 60 days.
Allowance for impairment of trade receivablesThe collectability of trade receivables is assessed continuously and at balance date specific allowances are made for any doubtful trade receivables based on a review of all outstanding amounts at year end. Bad debts are written off during the year in which they are identified. The following basis have been used to assess the allowance for doubtful trade receivables:
• individual account by account assessment based on past credit history;
• prior knowledge of debtor insolvency;
• high risk customers’ assessments based on continuous analysis of customers’ payment trends and monitoring of the political and economic climates particularly for those customers who are located in emerging market countries; and
• customer accounts which have been referred to a collection agency.
InventoriesInventories are valued at the lower of cost and net realisable value. The net realisable value of inventories is the estimated selling price in the ordinary course of business less estimated costs to sell. The cost of inventories is based on the first-in, first-out principle. In the case of manufactured inventories and work in progress, cost includes an appropriate share of the production overheads as applicable.
Allowances are established for obsolete or slow moving inventories taking into consideration the ageing or seasonal profile of inventories, the nature of inventories, discontinued lines, sell through history and forecast sales.
Trade and other payablesTrade payables are normally settled within 30 days from invoice date or within the agreed payment terms with the supplier.
Notes to the Financial Statements continued
7. Working Capital continued
76
For
per
sona
l use
onl
y

8. Property, Plant and EquipmentThis table summarises property, plant and equipment related to continuing operations at 30 June 2017 and all operations at 30 June 2016:
Year ended 30 June 2017
Freehold Land
US$m
Freehold Buildings
US$m
Leasehold Land and Buildings
US$m
Plant and Equipment
US$m
Buildings and Plant Under
ConstructionUS$m
TotalUS$m
Cost 7.0 32.5 57.0 436.8 13.0 546.3
Accumulated depreciation – (16.8) (19.5) (292.1) – (328.4)
7.0 15.7 37.5 144.7 13.0 217.9
Movement
Balance at the beginning of the financial year 9.3 21.2 46.1 140.2 28.2 245.0
Additions – 1.3 0.1 3.9 36.0 41.3
Additions through entities/businesses acquired – 0.5 – 1.0 – 1.5
Disposals/scrappings – (0.1) (0.1) (0.7) (0.1) (1.0)
Reclassification to assets held for sale (2.8) (7.3) (8.0) (19.9) (1.9) (39.9)
Transfer from buildings and plant under construction 0.3 0.5 2.7 45.2 (48.7) –
Depreciation – (0.8) (2.2) (26.2) – (29.2)
Net exchange differences on translation of foreign subsidiaries 0.2 0.4 (1.1) 1.2 (0.5) 0.2
Balance at the end of the financial year 7.0 15.7 37.5 144.7 13.0 217.9
Year ended 30 June 2016
Freehold Land
US$m
Freehold Buildings
US$m
Leasehold Land and Buildings
US$m
Plant and Equipment
US$m
Buildings and Plant Under
ConstructionUS$m
TotalUS$m
Cost 9.3 53.6 64.2 451.2 28.2 606.5
Accumulated depreciation – (32.4) (18.1) (311.0) – (361.5)
9.3 21.2 46.1 140.2 28.2 245.0
Movement
Balance at the beginning of the financial year 10.2 22.9 34.4 136.8 26.9 231.2
Additions – 0.2 – 6.4 48.6 55.2
Disposal of entities – – (0.2) (1.5) (0.3) (2.0)
Disposals/scrappings (0.5) (0.5) (0.3) (0.2) – (1.5)
Transfer from buildings and plant under construction – 1.4 14.1 29.6 (45.1) –
Depreciation – (2.2) (1.8) (25.0) – (29.0)
Net exchange differences on translation of foreign subsidiaries (0.4) (0.6) (0.1) (5.9) (1.9) (8.9)
Balance at the end of the financial year 9.3 21.2 46.1 140.2 28.2 245.0
Notes to the Financial Statements continued
77
For
per
sona
l use
onl
y
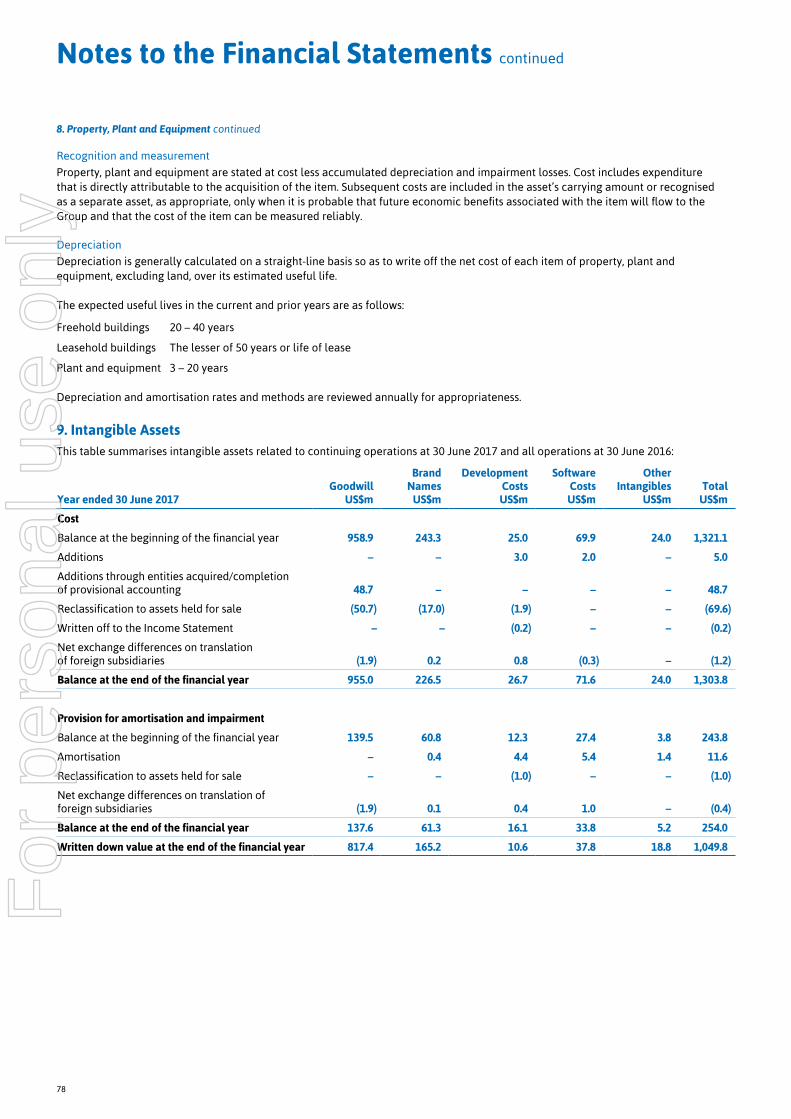
Recognition and measurement
Property, plant and equipment are stated at cost less accumulated depreciation and impairment losses. Cost includes expenditure that is directly attributable to the acquisition of the item. Subsequent costs are included in the asset’s carrying amount or recognised as a separate asset, as appropriate, only when it is probable that future economic benefits associated with the item will flow to the Group and that the cost of the item can be measured reliably.
Depreciation
Depreciation is generally calculated on a straight-line basis so as to write off the net cost of each item of property, plant and equipment, excluding land, over its estimated useful life.
The expected useful lives in the current and prior years are as follows:
Freehold buildings 20 – 40 years
Leasehold buildings The lesser of 50 years or life of lease
Plant and equipment 3 – 20 years
Depreciation and amortisation rates and methods are reviewed annually for appropriateness.
9. Intangible AssetsThis table summarises intangible assets related to continuing operations at 30 June 2017 and all operations at 30 June 2016:
Year ended 30 June 2017Goodwill
US$m
Brand Names
US$m
Development CostsUS$m
Software CostsUS$m
Other Intangibles
US$mTotal
US$m
Cost
Balance at the beginning of the financial year 958.9 243.3 25.0 69.9 24.0 1,321.1
Additions – – 3.0 2.0 – 5.0
Additions through entities acquired/completion of provisional accounting 48.7 – – – – 48.7
Reclassification to assets held for sale (50.7) (17.0) (1.9) – – (69.6)
Written off to the Income Statement – – (0.2) – – (0.2)
Net exchange differences on translation of foreign subsidiaries (1.9) 0.2 0.8 (0.3) – (1.2)
Balance at the end of the financial year 955.0 226.5 26.7 71.6 24.0 1,303.8
Provision for amortisation and impairment
Balance at the beginning of the financial year 139.5 60.8 12.3 27.4 3.8 243.8
Amortisation – 0.4 4.4 5.4 1.4 11.6
Reclassification to assets held for sale – – (1.0) – – (1.0)
Net exchange differences on translation of foreign subsidiaries (1.9) 0.1 0.4 1.0 – (0.4)
Balance at the end of the financial year 137.6 61.3 16.1 33.8 5.2 254.0
Written down value at the end of the financial year 817.4 165.2 10.6 37.8 18.8 1,049.8
Notes to the Financial Statements continued
8. Property, Plant and Equipment continued
78
For
per
sona
l use
onl
y

Year ended 30 June 2016Goodwill
US$m
Brand Names
US$m
Development CostsUS$m
Software CostsUS$m
Other Intangibles
US$mTotal
US$m
Cost
Balance at the beginning of the financial year 999.0 245.6 22.5 63.6 25.7 1,356.4
Additions – – 4.0 8.0 – 12.0
Additions through entities acquired/completion of provisional accounting (10.4) 11.3 – – – 0.9
Amounts related to businesses disposed of (13.3) (8.4) – – (1.7) (23.4)
Written off to the Income Statement – – (0.9) – – (0.9)
Net exchange differences on translation of foreign subsidiaries (16.4) (5.2) (0.6) (1.7) – (23.9)
Balance at the end of the financial year 958.9 243.3 25.0 69.9 24.0 1,321.1
Provision for amortisation and impairment
Balance at the beginning of the financial year 140.1 64.5 8.3 25.0 2.5 240.4
Amortisation – 0.1 4.2 3.2 1.5 9.0
Amounts related to businesses disposed of – – – – (0.2) (0.2)
Net exchange differences on translation of foreign subsidiaries (0.6) (3.8) (0.2) (0.8) – (5.4)
Balance at the end of the financial year 139.5 60.8 12.3 27.4 3.8 243.8
Written down value at the end of the financial year 819.4 182.5 12.7 42.5 20.2 1,077.3
Carrying amount of goodwill and brand names allocated to each of the CGUs related to continuing operations at 30 June 2017 and all operations at 30 June 2016:
2017 US$m
2016 US$m
Industrial 311.3 314.1
Medical 256.7 256.3
Single Use 414.6 363.8
Sexual Wellness – 67.7
982.6 1,001.9
Recognition and measurementGoodwill and brand names
Goodwill on acquisition is measured at cost being the excess of the cost of the acquisition over the fair value of the Group’s share of the net identifiable assets acquired. Goodwill is not amortised. Brand names are initially recorded at cost based on independent valuation at acquisition date, which equates to fair value. Based on the nature of the major brand names acquired by the Group, which are international brands that benefit from competitive advantages due to technology, innovation and product development, it is not possible to make an arbitrary assessment that these brand names have a finite useful life, quantifiable in terms of years except where such brands are subject to licensing agreements covering a finite period or where management intends to phase out the use of a brand. Brand names subject to a licensing arrangement are amortised over the life of the arrangement. Brand names that are intended to be phased out are amortised over the period management anticipates that this process will take. The amortisation of brand names, development and software costs and other intangibles are recognised in selling, general and administration costs in the Income Statement. No amortisation is provided against the carrying value of those brand names not subject to a licensing arrangement or phase out process as the Group believes that the lives of such assets are indefinite at this point.
Notes to the Financial Statements continued
79
For
per
sona
l use
onl
y

Development and software costs
Capitalised development and software costs are amortised over a 3 to 10 year period.
Other intangible assets
Other intangible assets that are acquired by the Group and have finite useful lives are initially recorded at cost based on independent valuation at acquisition date, which equates to fair value. These assets include patents which are amortised on a straight-line basis over the legal life of the patent and customer and distributor relationships, which are amortised on a straight-line basis over their estimated useful lives, which range from 6 to 20 years.
Impairment
Goodwill and indefinite life intangible assets are tested for impairment as part of the year end reporting process. These assets are also reviewed as part of the interim reporting process to determine whether there are any indicators of impairment.
The carrying amount of other non-current assets, excluding any defined benefit fund assets, deferred tax assets and financial assets are reviewed at each reporting date to determine whether there are any indicators of impairment.
If such indicators exist, the asset is tested for impairment by comparing its recoverable amount to its carrying amount. The recoverable amount of an asset is determined as the higher of fair value less costs of disposal and value in use.
The recoverable amount of the CGUs has been determined based on a value in use calculation utilising five-year cash flow projections with the exception of the Sexual Wellness CGU. As the assets and liabilities of the Sexual Wellness CGU have been classified as held for sale their recoverable amount has been calculated using fair value less costs of disposal.
The base for each CGU subject to a value in use calculation is the budget for the 2018 financial year as approved by the Board. Specific growth and after tax WACC rates have been used for each CGU in developing internal forecasts for financial years ending June 2019 to 2022 and for the terminal year. Factors such as country risk, forecasting risk and country specific growth and tax rates have been taken into consideration in arriving at these rates.
Cash flows used for value in use calculations are estimated for the asset in its present condition and therefore do not include cash inflows or outflows that improve or enhance the asset’s performance or that may arise from future restructuring.
The post-tax discount rate used for a value in use calculation is derived based on an internal assessment of the Group's post-tax weighted average cost of capital in conjunction with risk specific factors to the countries in which the CGU operates.
The average annual sales revenue growth rates applied in the discounted cash flow models range between 3% and 5% (2016: 2% and 4%) while the growth in the terminal year was between 2% and 3% (2016: between 2% and 3%). The post tax discount rates applied range between 8% and 9% (2016: 8% and 9%).
An impairment loss is recognised whenever the carrying amount of an asset or its CGU exceeds its recoverable amount. Impairment losses are recognised in the Income Statement as part of cost of goods sold and selling, general and administration expenses. Impairment losses recognised in respect of CGUs are allocated first to reduce the carrying amount of any goodwill allocated to CGUs and then to reduce the carrying amount of the other assets in the unit.
An impairment loss is reversed if the subsequent increase in recoverable amount can be related objectively to an event occurring after the impairment loss was recognised. An impairment loss in respect of goodwill or other indefinite life intangible assets is not reversed. An impairment loss in other circumstances is reversed only to the extent that the asset’s carrying amount does not exceed the carrying amount that would have been determined, net of depreciation or amortisation, if no impairment loss had been recognised.
Notes to the Financial Statements continued
9. Intangible Assets continued
80
For
per
sona
l use
onl
y

10. Interest Bearing Liabilities
This table summarises interest bearing liabilities related to continuing operations at 30 June 2017 and all operations at 30 June 2016:
2017US$m
2016US$m
Current
Loans repayable in:
Canadian dollars 3.8 3.9
Indian rupees – 1.1
Total current 3.8 5.0
Non-current
Loans repayable in:
Euros 144.7 149.7
United States dollars 437.0 474.0
United Kingdom pounds 135.0 62.9
Total non-current 716.7 686.6
Total interest bearing liabilities 720.5 691.6
The Group has a syndicated borrowing facility of US$500 million (US$167 million and GBP 103.8 million drawn down at 30 June 2017)maturing in June 2019, a Euro 50 million revolving credit facility (Euro 25 million drawn down at 30 June 2017) maturing in January 2021 and Senior Notes to the equivalent of US$386.1 million. The Senior Notes of US$270 million and Euro 101.5 million mature betweenJune 2020 and April 2026. These facilities can be accessed by certain Australian, US, UK and European subsidiaries.
There are a number of financial covenants attaching to the bank and note facilities including restrictions on the level of borrowings of non-guarantor subsidiaries and ensuring certain financial ratios are maintained. If any breaches of these covenants occur all monies outstanding under the facility become immediately due and payable. The Company is in compliance with all covenants. The interest rates for these facilities are determined based on market rates at the time amounts are drawn down.
2017US$m
2016US$m
Net interest bearing debt
Current interest bearing liabilities 3.8 5.0
Non-current interest bearing liabilities 716.7 686.6
Cash at bank and short-term deposits (313.4) (269.6)
Net interest bearing debt 407.1 422.0
Recognition and measurementInterest bearing liabilities are initially recognised at fair value less attributable transaction costs. Subsequent to initial recognition interest bearing liabilities are stated at amortised cost. Any difference between the cost and redemption value is recognised in the Income Statement over the period of the liability using the effective interest method.
Notes to the Financial Statements continued
81
For
per
sona
l use
onl
y

This table summarises interest bearing liabilities related to continuing operations at 30 June 2017 and all operations at 30 June 2016:
Nature and Currency of Borrowing
Effective Interest Rate
% p.a.
Financial Year of Debt
Maturity2017
US$m
Bank loans Canadian dollars 2.23 2018 3.8
Euros 1.07 2021 28.6
United Kingdom pounds 1.38 2019 135.0
United States dollars 2.83 2019 20.0
United States dollars 2.91 2019 15.0
United States dollars 3.83 2019 10.0
United States dollars 3.43 2019 10.0
United States dollars 3.21 2019 20.0
United States dollars 3.87 2019 35.0
United States dollars 2.26 2019 30.0
United States dollars 2.45 2019 17.0
United States dollars 2.67 2019 10.0
Other loans Euros 3.37 2020 34.3
Euros 3.52 2022 40.9
Euros 1.63 2023 40.9
United States dollars 3.75 2020 20.0
United States dollars 3.91 2021 50.0
United States dollars 4.70 2024 100.0
United States dollars 4.05 2025 50.0
United States dollars 4.68 2026 50.0
Total interest bearing liabilities 720.5
Notes to the Financial Statements continued
10. Interest Bearing Liabilities continued
82
For
per
sona
l use
onl
y

Nature and Currency of Borrowing
Effective Interest Rate
% p.a.
Financial Year of Debt
Maturity2016
US$m
Bank loans Canadian dollars 2.19 2017 3.9
Euros 1.08 2018 3.3
Euros 1.11 2018 5.6
Euros 1.20 2018 27.8
Indian rupees 9.90 2017 1.1
United Kingdom pounds 1.96 2019 62.9
United States dollars 2.01 2019 15.0
United States dollars 2.83 2019 20.0
United States dollars 2.91 2019 15.0
United States dollars 3.83 2019 10.0
United States dollars 3.43 2019 10.0
United States dollars 3.21 2019 20.0
United States dollars 3.87 2019 35.0
United States dollars 2.26 2019 30.0
United States dollars 1.91 2019 35.0
United States dollars 2.01 2019 6.0
United States dollars 1.82 2019 8.0
Other loans Euros 3.37 2020 33.4
Euros 3.52 2022 39.8
Euros 1.74 2023 39.8
United States dollars 2.62 2020 20.0
United States dollars 3.91 2021 50.0
United States dollars 4.70 2024 100.0
United States dollars 4.05 2025 50.0
United States dollars 4.68 2026 50.0
Total interest bearing liabilities 691.6
Notes to the Financial Statements continued
83
For
per
sona
l use
onl
y

11. Provisions
This table summarises provisions related to continuing operations at 30 June 2017 and all operations at 30 June 2016:
2017US$m
2016US$m
Current
Provision for employee entitlements 49.3 38.0
Provision for rationalisation and restructuring costs 3.5 6.9
Other provisions 3.9 3.9
Total current 56.7 48.8
Non-current
Provision for employee entitlements 8.2 10.6
Total non-current 8.2 10.6
Total provisions 64.9 59.4
Reconciliations of the carrying amount of each class of provision, except for employee entitlements, are set out below:
Provision for rationalisation and restructuring costs
Balance at the beginning of the financial year 6.9 16.1
Amounts credited to the Income Statement (0.2) (2.4)
Payments made (3.2) (6.4)
Net exchange differences on translation of foreign subsidiaries – (0.4)
Balance at the end of the financial year 3.5 6.9
Other provisions
Balance at the beginning of the financial year 3.9 4.2
Payments made (0.1) (0.2)
Net exchange differences on translation of foreign subsidiaries 0.1 (0.1)
Balance at the end of the financial year 3.9 3.9
Recognition and measurementA provision is recognised when there is a legal, equitable or constructive obligation as a result of a past event and it is probable that a future sacrifice of economic benefits will be required to settle the obligation, the timing or amount of which is uncertain.
A provision is determined by discounting the expected future cash flows required to settle the obligation at a pre-tax rate that reflects current market assessments of the time value of money and the risks specific to the liability.
Employee entitlementsWages, salaries and annual leave
Liabilities for employee entitlements to wages, salaries and annual leave represent the amount which members of the Group have a present obligation to pay resulting from employees’ services provided up to the balance date calculated at undiscounted amounts based on expected wage and salary rates that will be paid when the obligation is settled and include related on-costs.
Long service leave and post-retirement health benefits
The liability for employee entitlements to long service leave represents the present value of the estimated future cash outflows to be made by the Group resulting from employees’ services provided in the current and prior periods. Post retirement health benefits are subject to annual actuarial reviews.
The liability is calculated using estimated future increases in wage and salary rates including related on-costs, expected settlement dates based on turnover history and medical cost trends and is discounted using corporate bond rates, which most closely match the terms of maturity of the related liabilities.
Notes to the Financial Statements continued
84
For
per
sona
l use
onl
y

Provision for rationalisation and restructuring costs
Provisions for rationalisation and restructuring are only recognised when a detailed plan has been approved and the restructuring has either commenced or been publicly announced, or firm contracts related to the restructuring have been entered into. Costs related to ongoing activities are not provided for.
Other Provisions
Other provisions are recognised to cover specifically identified or obligated costs relating to Accufix Pacing Lead and insurance claims. The Accufix Pacing Lead related expenses include costs of patients associated with the monitoring and (where appropriate) explanation of the leads and for legal costs in defence of claims made in respect of the Accufix Pacing Lead. This provision is covered by cash required to be set aside by the Courts (refer to Note 6 – Cash and Cash Equivalents – Restricted deposits).
12. Retirement Benefit ObligationsCertain members of the Group contribute to defined benefit and defined contribution superannuation plans maintained to provide superannuation benefits for employees. They are obliged to contribute to the various superannuation plans as a consequence of legislation or Trust Deeds. Legal enforceability is dependent on the terms of the legislation or the Trust Deeds.
(a) Defined benefit superannuation plansFunding for post-employment benefits is carried out in accordance with the requirements of the Trust Deed for the Fund and the advice of the Fund’s actuarial adviser. Plan assets are held in trusts, which are subject to supervision by prudential regulators. Responsibility for governance of the plan, including investment decisions and plan rules, rests solely with the Board of trustees of the plan.
The amounts recognised in the balance sheet related to continuing operations at 30 June 2017 and all operations at 30 June 2016 are determined as follows:
2017US$m
2016US$m
Present value of accumulated defined benefit obligations 58.4 62.6
Fair value of defined benefit plan assets (39.4) (39.5)
Net defined benefit liability recognised in the Balance Sheet 19.0 23.1
The principal actuarial assumptions used (expressed as a weighted average) to calculate the net defined benefit liability were as follows:
2017 2016
Discount rate 2.5% 2.5%
Future salary increases 1.6% 2.3%
The movements in the net defined liability during the year are outlined below:2017
US$m2016
US$m
Balance at the beginning of the financial year 23.1 18.1
Actuarial losses1 (2.9) 3.8
Current service cost2 0.2 2.5
Net interest cost2 0.4 0.3
Settlement gains2 (0.3) –
Employer contributions3 (1.8) (1.4)
Reclassification to liabilities held for sale (0.1) –
Net exchange differences on translation of foreign subsidiaries 0.4 (0.2)
Balance at the end of the financial year 19.0 23.1
1. Actuarial gains and losses are recorded in other comprehensive income.
2. Current service cost, interest cost and settlement gains are recorded in the Consolidated Income Statement as part of selling, general and administration expenses.
3. Employer contributions are a cash payment and are recorded as part of payments to suppliers and employees in the Consolidated Statement of Cash Flows.
Notes to the Financial Statements continued
85
For
per
sona
l use
onl
y

The Group expects $1.8 million in contributions to be paid to its defined benefit plans during the year ending 30 June 2018.
The major categories of plan assets as a percentage of the fair value of total plan assets are as follows:
2017 2016
Equity securities 29% 29%
Fixed interest securities 63% 63%
Property 2% 3%
Other 6% 5%
(b) Defined contribution superannuation plans2017
US$m2016
US$m
Contributions to defined contribution plans during the year 13.7 13.0
13. Issued Capital and Reserves(a) Issued capital
2017US$m
2016US$m
Issued capital
147,328,462 (2016: 147,660,815) ordinary shares, fully paid 1,142.2 1,146.9
53,900 (2016: 58,900) Executive Share Plan shares, paid to A$0.05 – –
Total issued capital 1,142.2 1,146.9
Number of Shares
2017 2016
Movement in shares on issue
Ordinary shares
Balance at the beginning of the financial year 147,660,815 153,154,841
Issue of new shares under Dividend Reinvestment Plan 237,069 383,322
Conversion of PSRs and PRs – 488,735
Conversion of Executive Share Plan shares to fully paid 5,000 –
Buy-back/cancellation of shares (574,422) (6,366,083)
Balance at the end of the financial year 147,328,462 147,660,815
Executive Share Plan shares
Balance at the beginning of the financial year 58,900 58,900
Conversion of Executive Share Plan shares to fully paid (5,000) –
Balance at the end of the financial year 53,900 58,900
Notes to the Financial Statements continued
12. Retirement Benefit Obligations continued
86
For
per
sona
l use
onl
y

Issued capital
Ordinary shares are classified as equity. Incremental costs directly attributable to the issue of new shares are shown in equity as a deduction, net of tax where applicable, from the proceeds. When shares are repurchased, the amount of the consideration paid, including directly attributable costs, is recognised as a deduction from equity.
Ordinary shares are fully paid and do not have authorised capital or par value. They carry one vote per share and the right to dividends as declared from time to time. In the event of winding up of the Company ordinary shareholders rank after all other shareholders and creditors and are fully entitled to any proceeds of liquidation.
Dividend Reinvestment Plan
The Company operates a dividend reinvestment plan which is open to all shareholders. Under this plan 237,069 were issued during the year (2016: 383,322).
Executive Share Plan
During the financial year, 5,000 Executive Plan shares were paid (2016: nil). Shares allotted under the Pacific Dunlop Executive Share Plan (which was discontinued in 1996) have been paid to A$0.05 per share. Refer to Note 21 Ownership-based Remuneration Schemes for details of the price payable for shares issued under this plan.
Options
As at the date of this Report, there are nil (2016: nil) unissued shares in the Company remain under option.
Share-based payments
The fair value of PSRs granted to the Managing Director and Chief Executive Officer (CEO), Chief Financial Officer (CFO) and other Senior Executives on their appointments and PSRs granted to the CEO, CFO and other Senior Executives under the Long Term Incentive Plans is recognised as an employee benefit expense with a corresponding increase in equity over the vesting period.
(b) Nature and purpose of reservesShare-based payments reserve
This reserve is used to record the value of equity benefits provided to employees as part of their remuneration under various Long Term Incentive Plans. Refer to Note 21 Ownership-based Remuneration Schemes for further details of these plans.
Hedging reserve
This reserve records the portion of the unrealised gains or losses on cash flow hedges that are deemed to be effective.
General reserve
In certain jurisdictions regulatory requirements result in appropriations being made to a general reserve. The amount in the general reserve is available for release to retained profits.
Foreign currency translation reserve
The foreign currency translation reserve records the foreign currency differences arising from the translation of the financial statements of foreign subsidiaries where their functional currency is different to the presentation currency of the Group, as well as the translation of borrowings or any other currency instruments that hedge the Company’s net investment in foreign subsidiaries. Refer to Note 1 Summary of Significant Accounting Policies.
Transactions with non-controlling interests
Represents the excess paid over the fair value of assets acquired as a result of the purchase of additional equity in non-wholly-owned subsidiaries.
Fair value reserve
This reserve records the cumulative net change in the fair value of financial assets.
Notes to the Financial Statements continued
87
For
per
sona
l use
onl
y
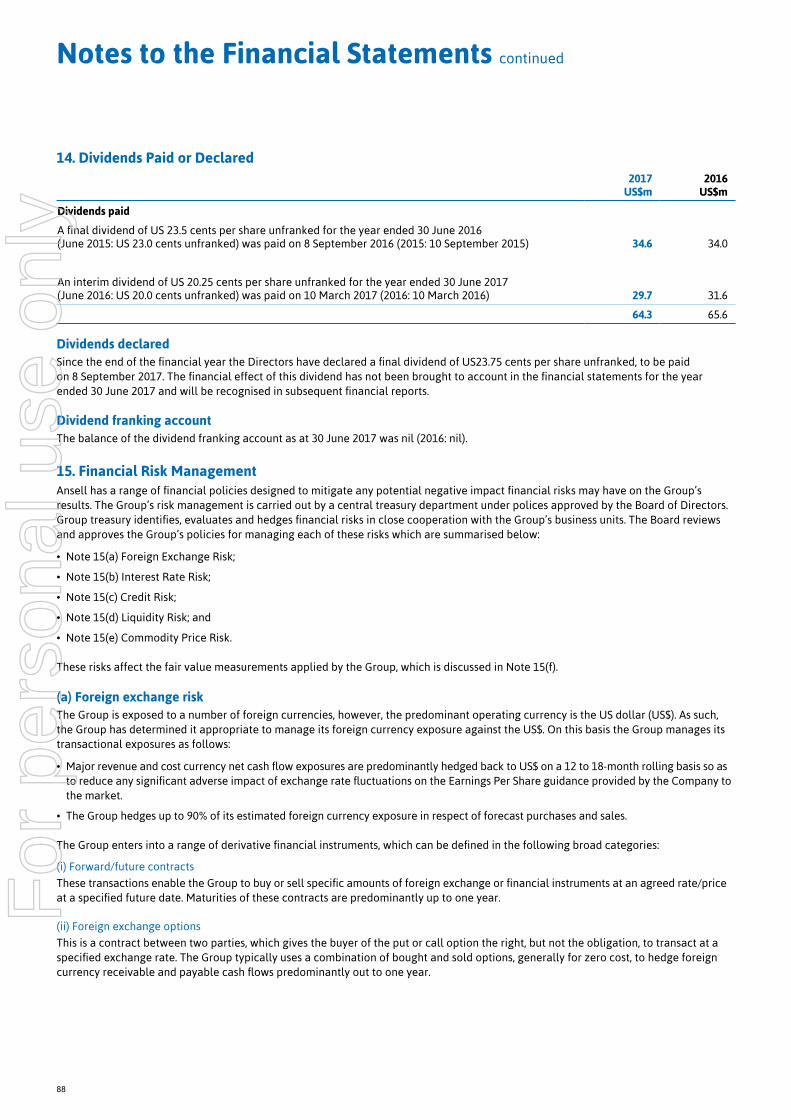
14. Dividends Paid or Declared2017
US$m2016
US$m
Dividends paid
A final dividend of US 23.5 cents per share unfranked for the year ended 30 June 2016 (June 2015: US 23.0 cents unfranked) was paid on 8 September 2016 (2015: 10 September 2015) 34.6 34.0
An interim dividend of US 20.25 cents per share unfranked for the year ended 30 June 2017 (June 2016: US 20.0 cents unfranked) was paid on 10 March 2017 (2016: 10 March 2016) 29.7 31.6
64.3 65.6
Dividends declaredSince the end of the financial year the Directors have declared a final dividend of US23.75 cents per share unfranked, to be paid on 8 September 2017. The financial effect of this dividend has not been brought to account in the financial statements for the year ended 30 June 2017 and will be recognised in subsequent financial reports.
Dividend franking accountThe balance of the dividend franking account as at 30 June 2017 was nil (2016: nil).
15. Financial Risk ManagementAnsell has a range of financial policies designed to mitigate any potential negative impact financial risks may have on the Group’s results. The Group’s risk management is carried out by a central treasury department under polices approved by the Board of Directors. Group treasury identifies, evaluates and hedges financial risks in close cooperation with the Group’s business units. The Board reviews and approves the Group’s policies for managing each of these risks which are summarised below:
• Note 15(a) Foreign Exchange Risk;
• Note 15(b) Interest Rate Risk;
• Note 15(c) Credit Risk;
• Note 15(d) Liquidity Risk; and
• Note 15(e) Commodity Price Risk.
These risks affect the fair value measurements applied by the Group, which is discussed in Note 15(f).
(a) Foreign exchange riskThe Group is exposed to a number of foreign currencies, however, the predominant operating currency is the US dollar (US$). As such, the Group has determined it appropriate to manage its foreign currency exposure against the US$. On this basis the Group manages its transactional exposures as follows:
• Major revenue and cost currency net cash flow exposures are predominantly hedged back to US$ on a 12 to 18-month rolling basis so as to reduce any significant adverse impact of exchange rate fluctuations on the Earnings Per Share guidance provided by the Company to the market.
• The Group hedges up to 90% of its estimated foreign currency exposure in respect of forecast purchases and sales.
The Group enters into a range of derivative financial instruments, which can be defined in the following broad categories:
(i) Forward/future contracts
These transactions enable the Group to buy or sell specific amounts of foreign exchange or financial instruments at an agreed rate/price at a specified future date. Maturities of these contracts are predominantly up to one year.
(ii) Foreign exchange options
This is a contract between two parties, which gives the buyer of the put or call option the right, but not the obligation, to transact at a specified exchange rate. The Group typically uses a combination of bought and sold options, generally for zero cost, to hedge foreign currency receivable and payable cash flows predominantly out to one year.
Notes to the Financial Statements continued
88
For
per
sona
l use
onl
y

As at 30 June the exposure to foreign currency risk from the Group’s primary trading currency (US$) is:
Net Receivable
2017US$m
2016US$m
Net receivable in non-US$ reporting entities 21.5 28.2
The following table demonstrates the estimated sensitivity in the valuation of outstanding forward contracts and foreign exchange options to a 10% increase/decrease in the US$ exchange rate, with all other variables held constant, on profit for the period and equity.
Profit for the Period Equity
2017US$m
2016US$m
2017US$m
2016US$m
With all other variables held constant:
10% increase in US$ exchange rate – – 4.6 3.9
10% decrease in US$ exchange rate – – (1.2) 1.4
(b) Interest rate riskThe Group has a broad aim of managing interest rate risk on its debt by setting a minimum level of interest rate risk days (the weighted average term of all interest rates in the portfolio) and a minimum fixed/floating interest rate ratio. The Group enters into interest rate swaps that enables parties to swap interest rates (from or to a fixed or floating basis) for a defined period of time. Maturities of the contracts are principally between 1 and 10 years.
Prior to the beginning of each year, the Group calculates its financial budget for the upcoming year using an updated set of financial assumptions and management’s view of the marketplace in the coming financial year. The Group forecasts interest rates for all debt repricing and new financing.
In this context interest rate risk is the risk that the Group will, as a result of adverse movements in interest rates, experience:
• unacceptable variations to the cost of debt in the review period for which the financial budget has been finalised; and
• unacceptable variations in interest expense from year to year.
It is recognised that movements in interest rates may be beneficial to the Group. Within the context of the Group’s operations, interest rate exposure occurs from the amount of debt repricing that occurs in any one year.
The exposure to interest rate risk and the effective weighted average interest rate for interest bearing financial liabilities are set out below:
Fixed Interest Repricing in
Weighted Average Effective
Interest Rate %Floating
US$m
1 Year or Less US$m
1 to 2 Years US$m
2 to 5 Years US$m
> 5 Years US$m
Total US$m
2017
Bank and other loans 3.2 334.4 – – 145.2 240.9 720.5
Effect of interest rate swaps1 0.1 (185.7) 28.6 15.0 183.0 (40.9) –
148.7 28.6 15.0 328.2 200.0 720.5
2016
Bank and other loans 3.1 307.5 1.1 – 103.4 279.6 691.6
Effect of interest rate swaps1 0.1 (108.0) – 37.8 110.0 (39.8) –
199.5 1.1 37.8 213.4 239.8 691.6
1. Represents notional amount of interest rate swaps.
A separate analysis of debt by currency can be found at Note 10 Interest Bearing Liabilities.
Notes to the Financial Statements continued
89
For
per
sona
l use
onl
y

The table below shows the effect on profit for the period and equity, if interest rates had been 10% higher or lower with all other variables held constant, taking into account all underlying exposures and related hedges. A sensitivity of 10% has been selected as this is considered reasonable given the current level of both short-term and long-term US$ interest rates.
Profit for the Period Equity
2017US$m
2016US$m
2017US$m
2016US$m
With all other variables held constant:
If interest rates were 10% higher – – 1.1 0.4
If interest rates were 10% lower – – (1.2) (0.4)
(c) Credit riskThe credit risk on financial assets (excluding investments) of the Group, is the carrying amount, net of any provision for impairment, which has been recognised on the Balance Sheet. The Group is exposed to credit risk from its operating activities, primarily from customer receivables and from its financing activities, including deposits with financial institutions, foreign exchange transactions and other financial instruments.
The carrying amount of the Group’s financial assets represents the maximum credit exposure. The Group does not hold any collateral over any of the receivables.
(i) Credit risk – cash and cash equivalents
The Group held cash and cash equivalents of US$316.6 million at 30 June 2017 (2016: $272.7 million). The material cash and cash equivalent balances are held with bank and financial institution counterparties which are rated A3 or above by Moody's Investor Service.
(ii) Credit risk – trade receivables
Customer credit risk is managed by each Region subject to established policies, procedures and controls relating to customer credit risk management. The Group trades with recognised, creditworthy third parties, and also minimises concentrations of credit risk by undertaking transactions with a large number of customers and counterparties in various countries. Customers who wish to trade on credit terms are subject to credit verification procedures including an assessment of their independent credit rating, financial position, past experience and industry reputation. In addition receivable balances are monitored on an ongoing basis. The Group is not materially exposed to any individual customer. An ageing of trade receivables past due is included in Note 7.
The Group's maximum exposure to credit risk at the reporting date related to continuing operations at 30 June 2017 and all operations at 30 June 2016 was:
Carrying Amount
2017US$m
2016US$m
Net trade receivables 174.6 219.0
Individual trade receivables which are known to be uncollectible are written off by reducing the carrying amount directly. Other trade receivables are assessed where there is objective evidence that an impairment has been incurred but not yet recognised. For these receivables, the estimated impairment losses are recognised as an allowance for impairment. Receivables for which an impairment provision was recognised are written off against the provision where there is no expectation of recovering additional cash. Allowances for impairment are recognised in the Income Statement. Subsequent recoveries of amounts previously written off are credited to the Income Statement. Movements in the allowance for impairment and the ageing of trade receivables are included in Note 7.
Notes to the Financial Statements continued
15. Financial Risk Management continued
90
For
per
sona
l use
onl
y

(iii) Credit risk by maturity
Based on the policy of not having material overnight exposures to an entity rated lower than A3 by Moody’s Investors Service, the risk to the Group of counterparty default loss is not considered material. The following table indicates the value of amounts owing by counterparties by maturity.
Foreign Exchange Related Contracts
Interest Rate Contracts
Foreign Exchange Options Total
2017US$m
2016US$m
2017US$m
2016US$m
2017US$m
2016US$m
2017US$m
2016US$m
Term:
0–6 months 0.6 1.3 – – 1.6 3.1 2.2 4.4
6–12 months 0.2 0.4 – – 2.2 3.4 2.4 3.8
1– 2 years – – – – – – – –
2– 5 years – – 0.9 0.7 – – 0.9 0.7
> 5 years – – 3.1 4.2 – – 3.1 4.2
Total 0.8 1.7 4.0 4.9 3.8 6.5 8.6 13.1
(d) Liquidity riskLiquidity risk is the risk that the Group will encounter difficulty in meeting the obligations associated with its financial liabilities that are settled by delivering cash or another financial asset. The Group's approach to managing liquidity is to ensure, as far as possible, that itwill have sufficient liquidity to meet its obligations when they are due.
The Group manages liquidity risk by:
(a) maintaining adequate levels of undrawn committed facilities that can be drawn down upon at short notice;
(b) retaining appropriate levels of cash and cash equivalents;
(c) spreading the maturity dates of long term debt facilities between financial years (to the extent practicable);
(d) regular monitoring of cash balances and cash requirement forecasts.
The following table sets out the contractual maturities of the Group’s financial liabilities related to continuing operations at 30 June 2017 and all operations at 30 June 2016 into relevant maturity groupings based on the remaining period at the reporting date to the contractual maturity date. The amounts disclosed in the table are the contractual undiscounted cash flows comprising principal and interest repayments.
CarryingAmount
Total ContractualCash Flows Contractual Maturity (Years)
US$m US$m0–1
US$m1–2
US$m2–5
US$m> 5
US$m
2017
Trade and other payables 223.8 223.8 222.5 1.3 - -
Bank and other loans 720.5 826.2 26.1 324.2 212.0 263.9
Derivative financial instruments 8.7 8.7 7.9 0.2 0.6 –
Total 953.0 1,058.7 256.5 325.7 212.6 263.9
2016
Trade and other payables 239.3 239.3 235.2 4.1 – –
Bank and other loans 691.6 819.0 27.4 59.1 419.8 312.7
Derivative financial instruments 10.8 10.8 5.8 1.9 3.1 –
Total 941.7 1,069.1 268.4 65.1 422.9 312.7
Notes to the Financial Statements continued
91
For
per
sona
l use
onl
y

(e) Commodity price riskAnsell is a significant buyer of natural rubber latex and a range of synthetic latex products. It purchases these products in a number of countries in Asia, predominately Malaysia, Thailand and Sri Lanka. The Group is not active in hedging its purchases on rubber exchanges but may, from time to time, buy from suppliers or brokers at a fixed price for up to several months into the future. To the extent that any increases in these costs cannot be passed through to customers in a timely manner, the Group’s profit after income tax and shareholder’s equity could be impacted adversely.
(f) Fair valueThe Group considers that the carrying amount of recognised financial assets and financial liabilities approximates their net fair value. Derivative financial instruments are carried at their fair value.
The following table displays:
(i) Nominal/face value
This is the contract’s value upon which a market rate is applied to produce a gain or loss which becomes the settlement value of the derivative financial instrument.
(ii) Credit risk (derivative financial instruments)
This is the maximum exposure to the Group in the event that all counterparties who have amounts outstanding to the Group under derivative financial instruments, fail to honor their side of the contracts. The Group’s exposure is almost entirely to banks. Amounts owed by the Group under derivative financial instruments are not included.
(iii) Net fair value
This is the amount at which the instrument could be realised between willing parties in a normal market in other than a liquidation or forced sale environment. The net amount owing (to)/by financial institutions under all derivative financial instruments would have been ($0.1) million (2016: $2.3 million) if all contracts were closed out on 30 June 2017.
Nominal/Face Value Credit Risk Net Fair Value
2017US$m
2016US$m
2017US$m
2016US$m
2017US$m
2016US$m
Foreign exchange contracts
Purchase/sale contracts
– United States dollars 51.7 50.5 – 0.6 (1.1) 0.5
– Australian dollars 13.2 13.7 0.3 0.1 0.3 –
– Malaysian ringgits 20.8 6.3 0.1 – 0.1 (0.2)
– Thai baht – 5.7 – – – –
– Sri Lankan rupees 34.2 33.3 – 0.1 (0.2) (0.2)
– Euros 12.5 21.2 0.1 0.4 0.1 0.3
– Other currencies 31.5 27.1 0.3 0.5 – 0.3
Foreign exchange options
– Euros/United States dollars 135.8 123.1 0.7 2.3 (3.8) 0.4
– Australian dollars/United States dollars 3.8 4.6 – – – –
– Canadian dollars/United States dollars 6.1 15.1 – 0.1 – (0.2)
– United Kingdom pounds/United States dollars 14.2 5.2 0.2 0.5 (0.1) 0.5
– United States dollars/Mexican peso 17.1 15.5 0.8 0.2 0.7 (0.5)
– United States dollars/Malaysian ringgits 35.1 51.7 0.9 2.5 - 1.8
– United States dollars/Thai baht 39.1 51.8 0.9 0.8 0.8 0.5
– Other currencies 10.7 15.8 0.3 0.1 0.3 (0.8)
Interest rate contracts
Interest rate swaps
– GBP 78.0 – – – – –
– Euros 69.5 67.6 3.0 4.2 3.0 4.0
– United States dollars 285.0 235.0 1.0 0.7 (0.2) (4.1)
Total 858.3 743.2 8.6 13.1 (0.1) 2.3
Notes to the Financial Statements continued
15. Financial Risk Management continued
92
For
per
sona
l use
onl
y

(iv) Fair value hierarchy
The table below analyses financial assets and financial liabilities carried at fair value, including their levels in the fair value hierarchy as well as the valuation method. It does not include information for financial assets and financial liabilities not measured at fair value if the carrying amount is a reasonable approximation of fair value.
The different valuation methods have been defined as follows:
• Level 1: Quoted prices (unadjusted) in active markets for identical assets or liabilities;
• Level 2: Inputs other than quoted prices included within Level 1 that are observable for the asset or liability, either directly (i.e. as prices) or indirectly (i.e. derived from prices); and
• Level 3: Inputs for the asset or liability that are not based on observable market data (unobservable inputs).
The Group currently holds only Level 2 derivative financial instruments. In order to determine the fair value of the financial instruments, management used valuation techniques in which all significant inputs were based on observable market data.
Level 2
2017US$m
2016US$m
Derivative financial assets 8.6 13.1
Derivative financial liabilities 8.7 10.8
(g) Recognition and measurementDerivatives
The Group uses derivative financial instruments, principally foreign exchange and interest rate related, to reduce the exposure to foreign exchange rate and interest rate movements.
The Group has adopted certain principles in relation to derivative financial instruments:
• derivatives may be used to hedge underlying business exposures of the Group. Trading in derivatives is not undertaken;
• derivatives acquired must be able to be recorded in the Group’s treasury management systems, which contain extensive internal controls; and
• the Group predominantly does not deal with counterparties rated lower than A3 by Moody’s Investors Service.
The Group follows the same credit policies, legal processes, monitoring of market and operational risks in the area of derivative financial instruments, as it does in relation to other financial assets and liabilities on the Balance Sheet.
On a continuing basis, the Group monitors its future exposures and on some occasions hedges all or part of these exposures. The transactions which may be covered are future net cash flows of overseas subsidiaries, future foreign exchange requirements and interest rate positions.
These exposures are then monitored and may be modified from time to time. The foreign exchange hedge instruments are predominantly up to 12 months’ duration and are used to hedge operational transactions the Group expects to occur in this time frame. From time to time minor mismatches occur in the forward book, however, these mismatches are managed under guidelines, limits and internal controls. Interest rate derivative instruments can be for periods up to 10 years as the critical terms of the instruments are matched to the underlying borrowings.
Derivative financial instruments are recognised initially at fair value and subsequently remeasured to their fair value at each reporting date. The fair value of forward exchange contracts, foreign exchange options and interest rate swap contracts is determined by reference to current market rates for these instruments.
The method of recognising the resulting gain or loss depends on whether the derivative is designated as a hedging instrument and continues to satisfy the conditions for hedge accounting, and if so, the nature of the item being hedged. The Group designates certain derivatives as either; (1) hedges of the fair value of recognised assets or liabilities (fair value hedges); or (2) hedges of highly probable forecast transactions (cash flow hedges).
The Group documents at the inception of the transaction the relationship between hedging instruments and hedged items, as well as its risk management objective and strategy for undertaking various hedge transactions. The Group also documents its assessment, both at hedge inception and on an ongoing basis, of whether the derivatives that are used in hedging transactions have been and will continue to be highly effective in offsetting changes in fair values or cash flows of hedged items.
Notes to the Financial Statements continued
93
For
per
sona
l use
onl
y

Fair value hedge
Changes in the fair value of derivatives that are designated and qualify as fair value hedges are recorded in the Income Statement, together with any changes in the fair value of the hedged asset or liability that are attributable to the hedged risk.
Cash flow hedge
The effective portion of changes in the fair value of derivatives that are designated and qualify as cash flow hedges is recognised in equity in the hedging reserve. The gain or loss relating to the ineffective portion is recognised immediately in the Income Statement.
Gains or losses that are recognised in the hedging reserve are transferred to the Income Statement in the periods when the hedged item will affect profit or loss. However, when the forecast transaction that is hedged results in the recognition of a non-financial asset or a non-financial liability, the gains or losses previously deferred in equity are transferred from equity and included in the measurement of the initial cost or carrying amount of the asset or liability.
Hedge accounting is discontinued when the hedging instrument expires or is sold, terminated or exercised, or no longer meets the conditions for hedge accounting. At that point in time, any cumulative gain or loss on the hedging instrument recognised in equity remains in equity until the forecasted transaction is ultimately recognised in the Income Statement. When a hedged transaction is no longer expected to occur, the cumulative gain or loss that was reported in equity is immediately transferred to the Income Statement.
Derivatives that do not qualify for hedge accounting
Changes in the fair value of any derivative instrument that does not qualify for hedge accounting are recognised immediately in the Income Statement.
Hedge Effectiveness
The Group determines its economic exposure to unexpected movements in foreign currency rates and interest rates and ensures the hedging instruments entered into satisfactorily mitigate these risks. The Group ensures the changes in the fair value of the hedging instruments are highly correlated to the change in the fair value of the underlying hedged item and are therefore effective.
Potential sources of ineffectiveness include but are not limited to:
• the Group no longer having the economic exposure rendering the hedge instrument ineffective;
• hedging instrument expires or is sold, terminated or exercised; and
• changes in counterparty credit status.
16. Expenditure Commitments
2017US$m
2016US$m
(a) Capital expenditure commitmentsContracted but not provided for in the financial statements:
Plant and equipment 5.7 7.9
5.7 7.9
Payable within one year 5.7 7.9
(b) Operating lease commitmentsFuture operating lease commitments not provided for in the financial statements and payable:
Within one year 9.7 8.7
One year or later and no later than five years 23.1 20.2
Later than five years 4.0 2.2
36.8 31.1
The Group leases property under operating leases expiring from one to 15 years. Leases generally provide the Group with a right of renewal at which time all terms are renegotiated. Operating lease commitments refer to future undiscounted minimum rentals payable under non-cancellable operating leases not included within this Financial Report. Operating lease payments are recognised as an expense in the Income Statement on a straight-line basis over the lease term.
Notes to the Financial Statements continued
15. Financial Risk Management continued
94
For
per
sona
l use
onl
y

17. Particulars Relating to SubsidiariesBeneficial Interest
Country of Incorporation2017
%2016
%
Ansell Limited Australia
Ansell Healthcare Japan Co. Ltd. Japan* 100 100
BNG Battery Technologies Pty. Ltd. Australia 100 100
Corrvas Insurance Pty. Ltd. Australia 100 100
Dunlop Olympic Manufacturing Pty. Ltd. Australia 100 100
FGDP Pty. Ltd. Australia 100 100
Nucleus Ltd. Australia 100 100
Lifetec Project Pty. Ltd. Australia 100 100
Medical TPLC Pty. Ltd. Australia 100 100
N&T Pty. Ltd. Australia 100 100
Nucleus Trading Pte. Ltd. Singapore* 100 100
THLD Ltd. Australia 100 100
TNC Holdings Pte. Ltd. Singapore* 100 100
TPLC Pty. Ltd. Australia 100 100
Societe de Management Financier S.A. France* 100 100
Olympic General Products Pty. Ltd. Australia 100 100
Pacific Dunlop Finance Pty. Ltd. Australia 100 100
Pacific Dunlop Holdings (China) Co. Ltd. China* 100 100
Ansell (Shanghai) Commercial and Trading Co. Ltd. China* 100 100
P.D. Holdings Pty. Ltd. Australia 100 100
P.D. International Pty. Ltd. Australia 100 100
Ansell Canada Inc. Canada* 100 100
Ansell Commercial Mexico S.A. de C.V. Mexico* 100 100
Ansell Colombia SAS Colombia* 100 –
Ansell Global Trading Center (Malaysia) Sdn. Bhd. Malaysia* 100 100
Ansell Lanka (Pvt.) Ltd. Sri Lanka* 100 100
Ansell (Middle East) DMCC UAE* 100 100
Ansell Perry de Mexico S.A. de C.V. Mexico* 100 100
Ansell Protective Solutions Singapore Pte. Ltd. Singapore* 100 100
Ansell Services (Asia) Sdn. Bhd. Malaysia* 100 100
Ansell (Kulim) Sdn. Bhd. Malaysia* 100 100
Ansell N.P. Sdn. Bhd. Malaysia* 75 75
Ansell Malaysia Sdn. Bhd. Malaysia* 75 75
Ansell Shah Alam Sdn. Bhd. Malaysia* 100 100
Hercules Equipamentos de Protecao Ltda Brazil* 100 100
Ansell Textiles Lanka (Pvt.) Ltd. Sri Lanka* 100 100
Ansell (Thailand) Ltd. Thailand* 100 100
Ansell US Group Holdings Pty. Ltd. Australia 100 100
Ansell US Group Holdings (USA) LLC United States* 100 100
Ansell (USA) Inc. United States* 100 100
Ansell Brazil LTDA Brazil* 100 100
Ansell Edmont Industrial de Mexico S.A. de C.V. Mexico* 100 100
Notes to the Financial Statements continued
95
For
per
sona
l use
onl
y

Beneficial Interest
Country of Incorporation2017
%2016
%
Pacific Dunlop Holdings (USA) LLC United States* 100 100
Barriersafe Solutions International Inc. United States* 100 100
Microflex Corporation United States* 100 100
Ansell Healthcare Products LLC United States* 100 100
Ansell Sandel Medical Solutions LLC United States* 100 100
SXwell USA LLC United States*(i) 100 –
Ansell Hawkeye Inc. United States* 100 100
Pacific Chloride Inc. United States* 100 100
Pacific Dunlop Holdings Inc. United States* 100 100
TPLC Holdings Inc. United States* 100 100
Accufix Research Institute Inc. United States* 100 100
Cotac Corporation United States* 100 100
Pacific Dunlop Finance Company Inc. United States* 100 100
Comercializadora Ansell Chile Limitada Chile* 100 100
Corrvas Insurance (Singapore) Pte. Ltd. Singapore* 100 100
Fabrica de Artefatos de Latex Blowtex Ltda. Brazil*(i) 100 100
Medical Telectronics N.V. Netherlands Ant.* 100 100
Pacific Dunlop Holdings (Europe) Ltd. United Kingdom* 100 100
Ansell Healthcare Europe N.V. Belgium* 100 100
Ansell GmbH Germany* 100 100
Ansell Italy Srl Italy* 100 100
Ansell Medikal Urunler Ithalat Ihracat Uretim ve Ticaret A.S. Turkey* 100 100
Ansell Norway AS Norway* 100 100
Ansell Protective Solutions AB Sweden* 100 100
Ansell Protective Solutions Lithuania UAB Lithuania* 100 100
Ansell Rus LLC Russia* 100 100
Ansell S.A. France* 100 100
Ansell SW Europe SAS France*(i) 100 100
Ansell Services Poland Sp. z o.o. Poland* 100 –
Ansell Spain SL (Sociedad de Responsabilidad Limitada) Spain* 100 100
Comasec SAS France* 100 100
Ampelos International Malaysia Malaysia* 100 100
Ansell Industrial & Specialty Gloves Malaysia Sdn. Bhd. Malaysia* 100 100
Comasec Holdings Ltd. United Kingdom* 100 100
Marigold Industrial Ltd. United Kingdom* 100 100
Ansell Portugal – Industrial Gloves, Sociedade Unipessoal, Lda Portugal* 100 100
Unimil Sp. z o.o. Poland*(i) 100 100
Ansell UK Limited United Kingdom*(i) 100 100
Ansell Korea Co. Ltd. South Korea* 100 100
Ansell Vina Corporation Vietnam* 100 100
Ansell Microgard Ltd. United Kingdom* 100 100
Ansell Xiamen Limited China* 100 100
Ansell Microgard Xiamen Limited China* 100 100
17. Particulars Relating to Subsidiaries continued
Notes to the Financial Statements continued
96
For
per
sona
l use
onl
y

Beneficial Interest
Country of Incorporation2017
%2016
%
Nitritex Limited United Kingdom* 100 –
Nitritex (M) Sdn. Bhd. Malaysia* 100 –
Nitritex Canada Ltd. Canada* 100 –
Pacific Dunlop Holdings (Singapore) Pte. Ltd. Singapore* 100 100
Ansell India Protective Products Pvt Ltd. India* 100 –
JK Ansell Ltd. India* 50 50
Ansell (Hong Kong) Limted. Hong Kong* 100 100
PDOCB Pty. Ltd. Australia 100 100
Ansell Medical Products Pvt. Ltd. India* 100 100
Suretex Ltd. Thailand*(i) 100 100
Latex Investments Ltd. Mauritius*(i) 100 100
Suretex Prophylactics (India) Ltd. India*(i) 100 100
Wuhan Jissbon Sanitary Products Company Ltd. China*(i) 90(a) 90(a)
Guangzhou Kangwei Trading Co Ltd China*(i) 90 90
Shanghai Feidun Trading Company Ltd. China*(i) 90 90
Shenyang Yipeng Trading Company Ltd. China*(i) 90 90
PD Licensing Pty. Ltd. Australia 100 100
Siteprints Pty. Ltd. Australia 100 100
S.T.P. (Hong Kong) Ltd. Hong Kong* 100 100
Pacific Dunlop Holdings N.V. Netherlands Ant.* 100 100
Pacific Dunlop (Netherlands) B.V. Netherlands* 100 100
SXWELL Australia Pty. Ltd. Australia*(i) 100 –
The Distribution Group Holdings Pty. Ltd. Australia 100 100
The Distribution Group Pty. Ltd. Australia 100(a) 100(a)
The Distribution Trust Australia 100 100
Xelo Pty. Ltd. Australia 100 100
Xelo Sacof Pty. Ltd. Australia 100 100
* Subsidiaries incorporated outside Australia carry on business in those countries.
(a) Owned 49.2% by P.D. International Pty. Ltd. and 40.8% by Pacific Dunlop Holdings (China) Co. Ltd.
(b) The trustee of The Distribution Trust is The Distribution Group Pty. Ltd. The beneficiary of the trust is Ansell Limited.
(i) Subsidiaries forming part of the sale of the Sexual Wellness business.
The following subsidiaries were liquidated or merged with another subsidiary during the year:
• Ansell Ambi Sdn. Bhd.
• Ansell (Kedah) Sdn. Bhd.
• Ansell Germany GmbH
• STX Prophylactics S.A. (Pty.) Ltd.
Notes to the Financial Statements continued
97
For
per
sona
l use
onl
y

18. Acquisitions and Disposal Group Held for Sale(a) AcquisitionsNitritex Limited
Effective 1 February 2017, Ansell Limited acquired 100% of Nitritex Limited, a manufacturer of premium cleanroom life sciences consumables with head quarters in the United Kingdom. With approximately 250 employees, the Company specialises in a broad range of sterile and non sterile consumables including disposable gloves, garments, goggles, face masks and accessories. Nitritex Limited forms part of the Single Use GBU. The acquisition will provide an opportunity for the Group to better serve the needs of life sciences customers and accelerate growth. The Income Statement includes the results of Nitritex Limited from the acquisition date.
In the five months to 30 June 2017, Nitritex Limited contributed revenue of $12.0 million and profit of $2.8 million to the Group's result.
The goodwill recognised is primarily attributed to the expected synergies and other benefits from combining the assets and activities of Nitritex Limited with those of the Group. The goodwill is not deductible for income tax purposes.
The following fair values of the identifiable assets and liabilities of Nitritex Limited as at acquisition have been determined on a provisional basis:
US$m
Assets
Cash and cash equivalents 15.3
Trade and other receivables 4.0
Inventories 5.4
Property, plant and equipment 1.5
Other content assets 0.2
26.4
Liabilities
Trade and other payables 1.9
Provisions and other liabilities 1.8
3.7
Total identifiable net assets at fair value 22.7
Goodwill on acquisition 48.7
Consideration paid 71.4
Analysis of cash flows on acquisition
Net cash acquired 15.3
Cash paid (71.4)
Net cash outflow on acquisition (56.1)
If the acquisition of Nitritex Limited was completed effective 1 July 2016, estimated revenue for the Group for the 12 months to 30 June 2017 would have been $154.4 million for total continuing and discontinued operations.
Recognition and measurementBusiness combinations
The Group accounts for business combinations using the acquisition method. Identifiable assets acquired and liabilities and contingent liabilities assumed are measured at fair value. Any excess of the cost of acquisition over the fair values of the net identifiable assets acquired is recognised as goodwill. Transaction costs are expensed as incurred unless related to the issue of debt or equity securities.
Notes to the Financial Statements continued
98
For
per
sona
l use
onl
y
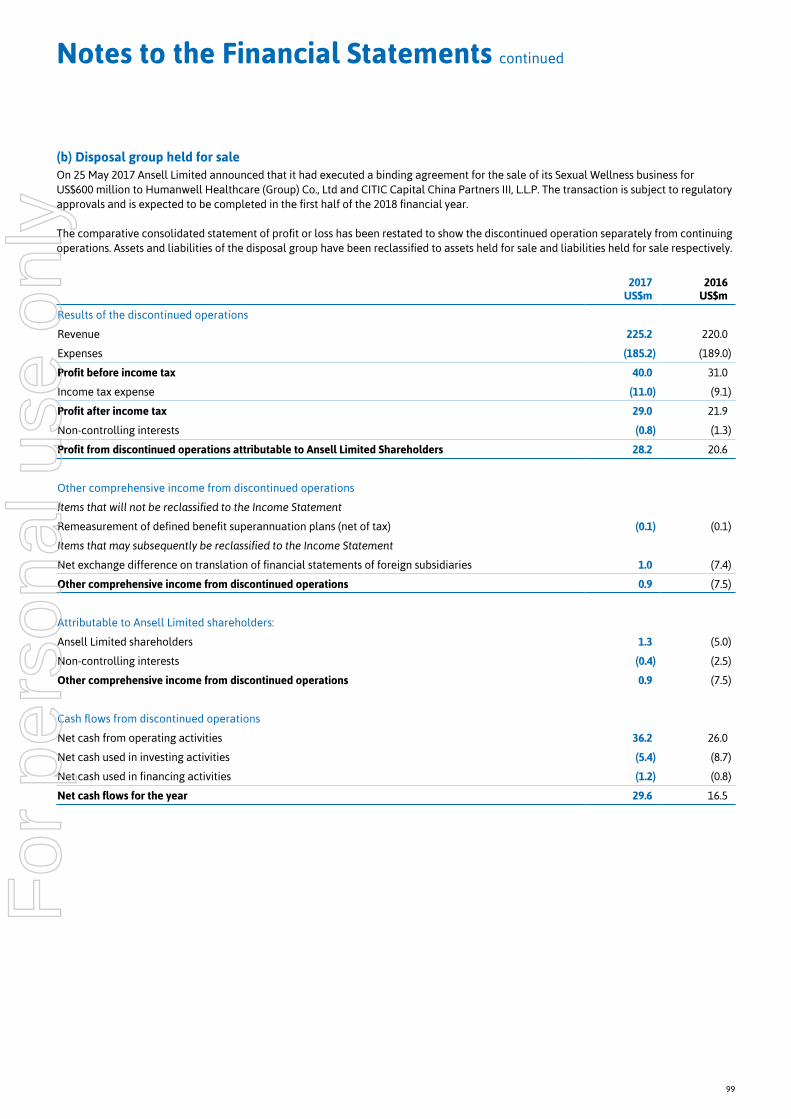
(b) Disposal group held for saleOn 25 May 2017 Ansell Limited announced that it had executed a binding agreement for the sale of its Sexual Wellness business for US$600 million to Humanwell Healthcare (Group) Co., Ltd and CITIC Capital China Partners III, L.L.P. The transaction is subject to regulatory approvals and is expected to be completed in the first half of the 2018 financial year.
The comparative consolidated statement of profit or loss has been restated to show the discontinued operation separately from continuing operations. Assets and liabilities of the disposal group have been reclassified to assets held for sale and liabilities held for sale respectively.
2017US$m
2016US$m
Results of the discontinued operations
Revenue 225.2 220.0
Expenses (185.2) (189.0)
Profit before income tax 40.0 31.0
Income tax expense (11.0) (9.1)
Profit after income tax 29.0 21.9
Non-controlling interests (0.8) (1.3)
Profit from discontinued operations attributable to Ansell Limited Shareholders 28.2 20.6
Other comprehensive income from discontinued operations
Items that will not be reclassified to the Income Statement
Remeasurement of defined benefit superannuation plans (net of tax) (0.1) (0.1)
Items that may subsequently be reclassified to the Income Statement
Net exchange difference on translation of financial statements of foreign subsidiaries 1.0 (7.4)
Other comprehensive income from discontinued operations 0.9 (7.5)
Attributable to Ansell Limited shareholders:
Ansell Limited shareholders 1.3 (5.0)
Non-controlling interests (0.4) (2.5)
Other comprehensive income from discontinued operations 0.9 (7.5)
Cash flows from discontinued operations
Net cash from operating activities 36.2 26.0
Net cash used in investing activities (5.4) (8.7)
Net cash used in financing activities (1.2) (0.8)
Net cash flows for the year 29.6 16.5
Notes to the Financial Statements continued
99
For
per
sona
l use
onl
y

Assets and liabilities of disposal group held for sale
As at 30 June 2017, the disposal group was stated at carrying value and comprised the following assets and liabilities:
2017 US$m
Trade and other receivables 51.4
Inventories 37.0
Property, plant and equipment 37.0
Intangible assets 70.1
Deferred tax assets 3.7
Other assets 1.7
Assets held for sale 200.9
Trade and other payables 33.7
Provisions 6.3
Current tax liabilities 2.8
Liabilities held for sale 42.8
Recognition and measurementDiscontinued operationsA discontinued operation is a component of the Group's business, the operations and cash flows of which can be clearly distinguished from the rest of the Group and which:
• represents a separate major line of business or geographic area of operations;
• is part of a single co-ordinated plan to dispose of a separate major line of business or geographic area of operations; or
• is a subsidiary acquired exclusively with a view to re-sale.
Classification as a discontinued operation occurs at the earlier of disposal or when the operation meets the criteria to be classified as held-for-sale. In accordance with AASB 5 Non-current Assets Held for Sale and Discontinued Operations when an operation is classified as a discontinued operation prior year comparatives in the Income Statement are restated as if the operation had been discontinued from the start of the comparative year.
Assets held for saleNon-current assets, or disposal groups comprising assets and liabilities, are classified as held for sale if it is highly probable that they will be recovered primarily through sale rather than through continuing use. Such assets, or disposal groups, are generally measured at the lower of their carrying amount and fair value less costs of disposal. Any impairment loss on a disposal group is allocated first to goodwill, and then to the remaining assets and liabilities on a pro rata basis, except that no loss is allocated to inventories, financial assets, deferred tax assets, or employee benefit assets which continue to be measured in accordance with the Group's other accounting policies. Impairment losses on initial classification as held-for-sale or held-for-distributions, and subsequent gains and losses on re-measurement are recognised in profit or loss.
In accordance with AASB 5 Non-current Assets Held for Sale and Discontinued Operations assets and liabilities held for sale are disclosed separately from other assets and liabilities in the Balance Sheet. Prior year comparatives in the Balance Sheet are not restated.
19. Parent Entity DisclosuresAs at the end of and throughout the financial year ending 30 June 2017, the parent company of the Group was Ansell Limited.
2016^2017
US$m Restated
US$m
Result of the parent entity
Profit for the period 16.1 66.0
Other comprehensive income (4.5) (5.9)
Total comprehensive income for the period, from continuing operations, net of income tax 11.6 60.1
^ In accordance with AASB 5 Non-current Assets Held for Sale and Discontinued Operations prior year comparatives have been restated to be consistent with disclosures for 30 June 2017. Refer to Note 18(b) Disposal Group held for sale.
Financial position of the parent entity at year end
This table summarises information related to continuing operations at 30 June 2017 and all operations at 30 June 2016:
Notes to the Financial Statements continued
18. Acquisitions and Disposal Group Held for Sale continued
100
For
per
sona
l use
onl
y

2017US$m
2016US$m
Current assets 684.7 653.1
Assets held for sale 18.5 –
Total assets 2,311.7 2,245.1
Current liabilities 1,100.1 1,024.5
Liabilities held for sale 0.4 –
Total liabilities 1,103.6 1,027.8
Total equity of the parent entity comprising:
Issued capital 1,142.2 1,146.9
Reserves (249.3) (289.7)
Retained profits 315.2 360.1
Total equity 1,208.1 1,217.3
The Group has a net current asset position of $698 million (2016: $531.9 million) which the parent company controls. As at 30 June 2017, the parent company has a net current liability position of $415.4 million (2016: $371.4 million). The Directors will ensure that the parent company has, at all times, sufficient funds available from the Group to meet its commitments.
Parent entity guaranteeThe parent entity guarantees the debts of certain subsidiaries that are guarantors under the Group’s revolving credit bank facility.
20. Related Party Disclosures(a) SubsidiariesAnsell Limited is the parent entity of all entities detailed in Note 17 Particulars Relating to Subsidiaries and from time to time has dealings on normal commercial terms and conditions with those entities, the effects of which are eliminated in these consolidated financial statements.
(b) Transactions with Key Management Personnel(i) Key Management Personnel remuneration
2017US$
2016US$
Short-term benefits 9,283,091 7,454,232
Post-employment benefits 629,885 878,829
Share-based payments 1,712,985 (1,466,068)
Long term cash-based incentives - (678,221)
Restricted share awards 568,864 1,146,709
Termination benefits - 11,512
12,194,825 7,346,993
(ii) Service agreements with Key Management Personnel
The Company has no service agreements with the Non-Executive Directors. Refer to Section 5 of the Remuneration Report for details of service agreements with the Managing Director and other Key Management Personnel.
Notes to the Financial Statements continued
101
For
per
sona
l use
onl
y

21. Ownership-based Remuneration SchemesLong Term Incentive PlansThe above plans involve the granting of Performance Share Rights (PSRs) to the Managing Director, other members of the Executive Leadership Team and other members of senior management.
In accordance with the disclosure requirements of Australian Accounting Standards remuneration includes a proportion of the fair value of PSRs granted or outstanding during the year. The fair value is determined as at grant date and is progressively allocated over the vesting period for these securities.
The fair value of PSRs is calculated at grant date. The fair values and the factors and assumptions used in determining the fair values of the PSRs applicable for the 2017 financial year are as follows:
InstrumentGrant Date
Vesting Date
Fair Value
Share Price on Grant Date
Risk Free Interest Rate
Dividend Yield
PSRs 13/8/2015 30/6/2018 A$18.53 A$20.20 N/A 3.00%
PSRs 11/8/2016 30/6/2019 A$17.95 A$19.49 N/A 2.85%
The PSRs are subject to a gateway condition and a performance condition as outlined in the Remuneration Report. As the hurdles within these conditions are all non-market based performance hurdles the valuation excludes the impact of performance hurdles.
Options
As at the date of this Report, there is no unissued ordinary shares in the Company that remain under option.
Executive Share Plan
The number of Executive Plan Shares (ordinary plan shares paid to A$0.05) as at balance date are shown in Note 13 Issued Capital and Reserves.
22. Auditors’ Remuneration
2017US$m
2016US$m
Audit and review of the financial reports:
Auditors of Ansell Limited and Australian entities – KPMG 1,572,490 1,282,622
Other member firms of KPMG (i) 960,200 1,135,575
2,532,690 2,418,197
Other services(ii):
Advisory services
Other member firms of KPMG 132,016 –
Other audit and assurance services
Other member firms of KPMG 2,140 4,646
Taxation and other services
Other member firms of KPMG 6,647 28,101
Total other services 140,803 32,747
Total auditors' remuneration 2,673,493 2,450,944
(i) Includes fees paid or payable for overseas subsidiaries’ local statutory lodgement purposes, group reporting, and other regulatory compliance requirements.
(ii) Other services primarily include assurance based engagements undertaken for compliance and internal governance purposes, tax and IT compliance. Other services provided by KPMG to the Group are subject to appropriate corporate governance procedures encompassing the selection of service providers and the setting of their remuneration.
Notes to the Financial Statements continued
102
For
per
sona
l use
onl
y

Directors’ Declaration
1. In the opinion of the Directors of Ansell Limited (‘the Company’):
(a) the consolidated financial statements and notes, set out on pages 59 to 102, and the Remuneration Report contained in the Report by the Directors, set out on pages 25 to 58, are in accordance with the Corporations Act 2001, including:
(i) giving a true and fair view of the Group’s financial position as at 30 June 2017 and of its performance, for the year ended on that date; and
(ii) complying with Australian Accounting Standards and the Corporations Regulations 2001;
(b) the consolidated financial statements and notes also comply with International Financial Reporting Standards as disclosed in Note 1;
(c) there are reasonable grounds to believe that the Company will be able to pay its debts as and when they become due and payable.
2. The directors have been given the declarations required by Section 295A of the Corporations Act 2001 from the Chief Executive Officer and the Chief Financial Officer for the financial year ended 30 June 2017.
Signed in accordance with a resolution of the Directors:
G L L Barnes Director
M R NicolinDirector
Dated in Melbourne this 14th day of August 2017.
103
For
per
sona
l use
onl
y

104
KPMG, an Australian partnership and a member firm of the KPMG network of independent member firms affiliated with KPMG International Cooperative (“KPMG International”), a Swiss entity.
Liability limited by a scheme approved under Professional Standards Legislation.
Independent Auditor’s Report
To the shareholders of Ansell Limited
Report on the audit of the Financial Report
Opinion
We have audited the Financial Report of Ansell Limited (the Company).
In our opinion, the accompanying Financial Report of the Company is in accordance with the Corporations Act 2001, including:
• giving a true and fair view of the Group’s financial position as at 30 June 2017 and of its financial performance for the year ended on that date; and
• complying with Australian Accounting Standards and the Corporations Regulations 2001.
The Financial Report comprises: • The consolidated balance sheet as at 30 June 2017;
• The consolidated income statement, consolidated statement of comprehensive income, consolidated statement of changes in equity, and consolidated statement of cash flows for the year then ended;
• Selected notes including a summary of significant accounting policies; and
• The Directors’ Declaration.
The Group consists of the Company and the entities it controlled at the year end or from time to time during the financial year.
Basis for opinion
We conducted our audit in accordance with Australian Auditing Standards. We believe that the audit evidence we have obtained is sufficient and appropriate to provide a basis for our opinion.
Our responsibilities under those standards are further described in the Auditor’s responsibilities for the audit of the Financial Report section of our report.
We are independent of the Group in accordance with the Corporations Act 2001 and the ethical requirements of the Accounting Professional and Ethical Standards Board’s APES 110 Code of Ethics for Professional Accountants (the Code) that are relevant to our audit of the Financial Report in Australia. We have fulfilled our other ethical responsibilities in accordance with the Code.
For
per
sona
l use
onl
y

105
Key Audit Matters
The Key Audit Matters we identified are:
• Valuation of goodwill and brand names; and
• Taxation.
Key Audit Matters are those matters that, in our professional judgement, were of most significance in our audit of the Financial Report of the current period.
These matters were addressed in the context of our audit of the Financial Report as a whole, and in forming our opinion thereon, and we do not provide a separate opinion on these matters.
Valuation of goodwill and brand names (USD$982.6m)
Refer to Note 9 to the Financial Report
The key audit matter How the matter was addressed in our audit
At 30 June 2017, the Group has $982.6m (40% of total assets) of goodwill and brand names. The sectors in which the Group operates experienced economic and currency volatility during the current period. In addition, one of the Group’s key strategic focuses is on organic growth through new product development. The inherent uncertainty in the performance of new products and the sector volatility increase the risk of impairment and also present challenges to the Group’s cash flow forecasting. Further, the Group’s cash generating units (CGUs) operate in different countries or regions which give rise to complexity in determining a discount rate specific to each CGU.
Valuation of goodwill and brand names is a key audit matter due to:
• the inherent complexity in auditing the forward-looking assumptions applied to the Group’s value in use (VIU) models for each CGU given the significant management judgement involved. The key assumptions in the cash flow models included the forecast revenue growth rate, in particular the estimated growth from the newly launched products, terminal growth rate, raw material prices, and margin percentages; and
• the significant judgements incorporated in the Group’s determination of discount rates used for each CGU and the challenges associated with auditing these discount rates to determine whether they reflected the specific risks of each business and the primary regions they operate in, subject to various weighting assumptions.
Our procedures included: • assessing the accuracy of prior period cash flow
forecasts of the Group by reference to actual performance, taking into account the significant judgements made by management, to inform our evaluation of current forecasts incorporated in VIU models;
• using our knowledge of the Group and industry, and involving our valuation specialists, to challenge the significant judgements and assumptions incorporated in the Group’s VIU models by: - assessing the relevant cash flow forecasts and
underlying assumptions against the latest Board approved long range plan (‘LRP’) and the new product strategy;
- challenging the Group’s forecast revenue growth rate, raw material prices and margin percentage assumptions by comparing against the Group’s current business performance and macroeconomic environment;
- considering the impact to future cash flows of
changes experienced during the year relating to the varying market conditions and expected volatility in the forecast period; and
- considering the appropriateness of the terminal
growth rates used by management by comparing to relevant Gross Domestic Product growth rates and industry trends.
For
per
sona
l use
onl
y

106
• involving our valuation specialists and assessing the reasonableness of the discount rate for each CGU by comparing the underlying weighting assumptions against the Group’s operation model, considering comparable market information, and evaluating the economic assumptions relating to cost of debt and cost of equity applicable to each of the CGUs in different countries and regions.
Taxation (Income Tax Expense USD$33.9m, Deferred Tax Assets ($88.5m), Deferred Tax Liabilities USD$89.9m, Current Tax Liabilities USD$29m)
Refer to Note 4 to the Financial Report
The key audit matter How the matter was addressed in our audit
The Group operates in a global tax environment across a number of tax jurisdictions. The corporate structure reflects the nature of the global operations and is driven by acquisitions, transactions and the execution of the Group’s continued global commercial strategy. This strategy includes:
• manufacturing in countries with access to raw materials (including Sri Lanka, Thailand, India, Mexico, Korea and Malaysia);
• managing sales and marketing on a regional basis. The key regional countries involved are the US, Belgium and Australia for the North America, EMEA and Asia Pacific regional structures respectively; and
• external sales across many countries.
Taxation is a key audit matter due to:
• the number of jurisdictions and the need to consider their varying tax complexities and differing tax rules within each key jurisdiction including US, Belgium and Australia;
• the nature of cross-border tax arrangements and our need to involve taxation specialists with significant cross border transactions experience and expertise in transfer pricing in key operational locations including; US, Belgium and Australia;
• the changing tax environment where there have been significant developments to improve the transparency of tax arrangements; and
• the heightened awareness of tax disclosures given the global focus on tax transparency.
Our procedures included:
• identifying key tax areas that impacted the Group by:
- considering the latest Board approved Group Tax Risk Management policy;
- attending regular meetings with Group management;
- considering any judgmental positions; and
- using our specialised knowledge of external developments in local jurisdictions and global tax environments.
• evaluating the treatment of key tax areas using our local tax specialists’ knowledge by comparing against the local jurisdiction tax rules and legislation;
• focusing on new transactions undertaken in the year and where there had been significant developments with local tax authorities;
• assessing the completeness of the tax provisions recorded by corroborating explanations from management using sources such as:
- communications from local tax authorities, including the status of recent and current tax authority audits and enquiries;
- the outcomes of previous tax audits/reviews by the local tax authorities; and
- transaction documentation.
• considering tax advice obtained by the Group from external tax advisors. We assessed the skills and competencies of external advisors; and
• evaluating the tax balances and potential exposures disclosure in the financial statements against accounting standards requirement.
For
per
sona
l use
onl
y

107
Other Information
Other Information is financial and non-financial information in Ansell Limited’s annual reporting which is provided in addition to the Financial Report and the Auditor's Report. The Directors are responsible for the Other Information.
The Other information we obtained prior to the date of this Auditor’s report was the Operating and Financial Review, Report by the Directors and Remuneration Report. The remaining Other Information, which includes About Ansell, Our Purpose and Vision, Our Values, Financial Summary, Global Business Units, Chairman’s Review, Chief Executive Officer’s Review, Five-Year Summary, Corporate Social Responsibility & Sustainability Report, Board of Directors, Executive Leadership Team, Shareholders and Shareholders Information is expected to be made available to us after the date of the Auditor’s report.
Our opinion on the Financial Report does not cover the Other Information and, accordingly, we do not and will not express an audit opinion or any form of assurance conclusion thereon, with the exception of the Remuneration Report and our related assurance opinion.
In connection with our audit of the Financial Report, our responsibility is to read the Other Information. In doing so, we consider whether the Other Information is materially inconsistent with the Financial Report or our knowledge obtained in the audit, or otherwise appears to be materially misstated.
We are required to report if we conclude that there is a material misstatement of this Other Information, and based on the work we have performed on the Other Information that we obtained prior to the date of this Auditor’s Report we have nothing to report.
Responsibilities of the Directors for the Financial Report
The Directors are responsible for:
• preparing the Financial Report that gives a true and fair view in accordance with Australian Accounting Standards and the Corporations Act 2001;
• implementing necessary internal controls to enable the preparation of a Financial Report that gives a true and fair view and is free from material misstatement, whether due to fraud or error; and
• assessing the Group’s ability to continue as a going concern. This includes disclosing, as applicable, matters related to going concern and using the going concern basis of accounting unless they either intend to liquidate the Group or to cease operations, or have no realistic alternative but to do so.
Auditor’s responsibilities for the audit of the Financial Report
Our objective is:
• to obtain reasonable assurance about whether the Financial Report as a whole is free from material misstatement, whether due to fraud or error; and
• to issue an Auditor’s Report that includes our opinion.
Reasonable assurance is a high level of assurance, but is not a guarantee that an audit conducted in accordance with Australian Auditing Standards will always detect a material misstatement when it exists.
Misstatements can arise from fraud or error. They are considered material if, individually or in the aggregate, they could reasonably be expected to influence the economic decisions of users taken on the basis of this Financial Report.
A further description of our responsibilities for the Audit of the Financial Report is located at the Auditing and Assurance Standards Board website at: http://www.auasb.gov.au/auditors_files/ar2.pdf. This description forms part of our Auditor’s Report.
For
per
sona
l use
onl
y

108
Report on the Remuneration Report
Opinion
In our opinion, the Remuneration Report of Ansell Limited for the year ended 30 June 2017 complies with Section 300A of the Corporations Act 2001.
Directors’ responsibilities
The Directors of the Company are responsible for the preparation and presentation of the Remuneration Report in accordance with Section 300A of the Corporations Act 2001.
Our responsibilities
We have audited the Remuneration Report included in the Directors’ report for the year ended 30 June 2017.
Our responsibility is to express an opinion on the Remuneration Report, based on our Audit conducted in accordance with Australian Auditing Standards.
KPMG
Alison Kitchen Partner
Suzanne Bell Partner
Melbourne 14 August 2017
For
per
sona
l use
onl
y