Embed Size (px)
Citation preview

CUMBERHEAD WEST WIND FARM
Appendix 7.3 Bat Survey Report

CUMBERHEAD WEST WIND FARM
This page is intentionally blank.

Cumberhead West Wind Farm
Bat Survey Report
Technical Appendix 7.3
Date: 8th October 2020
Tel: 0141 342 5404
Web: www.macarthurgreen.com
Address: 93 South Woodside Road | Glasgow | G20 6NT

i | P a g e
Document Quality Record
Version Status Person Responsible Date
0.1 Draft Leanne Cooke 22/09/2020
0.2 Reviewed Joanne Martindale 23/09/2020
0.3 Updated Joanne Martindale 23/09/2020
1 Internal Approval David H. MacArthur 10/10/2020
MacArthur Green is helping to combat the climate crisis through working within a carbon negative business model. Read more at www.macarthurgreen.com.

ii | P a g e
CONTENTS
1 INTRODUCTION .............................................................................................................................. 1
2 THE PROPOSED DEVELOPMENT SITE AND STUDY AREA ............................................................. 1
3 BATS AND WIND FARMS ............................................................................................................... 2
3.1 Policy and Guidance ............................................................................................................... 2
4 METHODS ....................................................................................................................................... 2
4.1 Desk-Based Study................................................................................................................... 2
4.2 Field Survey Methods ............................................................................................................ 2
4.3 Methods for Analysing Bat Activity Levels and Risks .......................................................... 4
5 BAT SURVEY LIMITATIONS ............................................................................................................ 8
6 SURVEY RESULTS & ANALYSIS ..................................................................................................... 9
6.1 Desk-Based Study................................................................................................................... 9
6.2 Preliminary Bat Roost Assessment ....................................................................................... 9
6.3 Automated Activity Surveys ................................................................................................ 10
7 REFERENCES ................................................................................................................................. 15
PROTECTED SPECIES LEGAL STATUS .......................................................................... 16
SURVEY TIMINGS & ANABAT LOCATIONS ................................................................. 18
INITIAL SITE RISK ASSESSMENT .................................................................................. 21
PRELIMINARY BAT ROOST ASSESSMENT .................................................................. 22
MONTHLY LOCATION SPECIFIC DATA ........................................................................ 23

iii | P a g e
LIST OF TABLES
Table 4-1: Percentile Score and Categorised Level of Bat Activity ...................................................... 5
Table 4-2: Vulnerability of Bat Species to Turbine Impact in the UK2. ................................................. 5
Table 4-3: Population Relative Abundance of Bats in Scotland2. ........................................................ 6
Table 4-4: Level of Potential Vulnerability of Populations of British Bat Species2. ............................ 6
Table 4-5: Initial Site Risk Assessment2. ................................................................................................ 7
Table 4-6: Overall Risk Assessment2. .................................................................................................... 7
Table 6-1 Total Number of Bat Passes for Each Species Across all Locations................................... 10
Table 6-2: Average Annual Site Activity Levels from 2019 (locations 1 to 13) and 2020 (locations 14
and 15) taken from Ecobat Analysis ..................................................................................................... 11
Chart 6-1: Average Annual Site Activity Levels 20193........................................................................... 12
Chart 6-2: Average Annual Site Activity Levels 20203 .......................................................................... 12
Table 6-3: Collision Risk, Population Relative Abundance and Potential Vulnerability. .................... 13
Table 6-4: Risk Assessment Scores Based on Median and Maximum Percentiles for High Collision
Risk Species (2019 and 2020) ............................................................................................................... 14
Table 6-5: The Percentage of Locations with High-Risk Assessment Scores based on Median
Percentiles for High Collision Risk Species ......................................................................................... 14
Table A-1 Legal and Conservation Status of all UK Bats ...................................................................... 17
Table B-1 Summary of Temporal Survey Effort ................................................................................... 18
Table B-2 Description of Anabat Locations ........................................................................................ 19
Table C-1 Initial Site Risk Assessment. .................................................................................................. 21
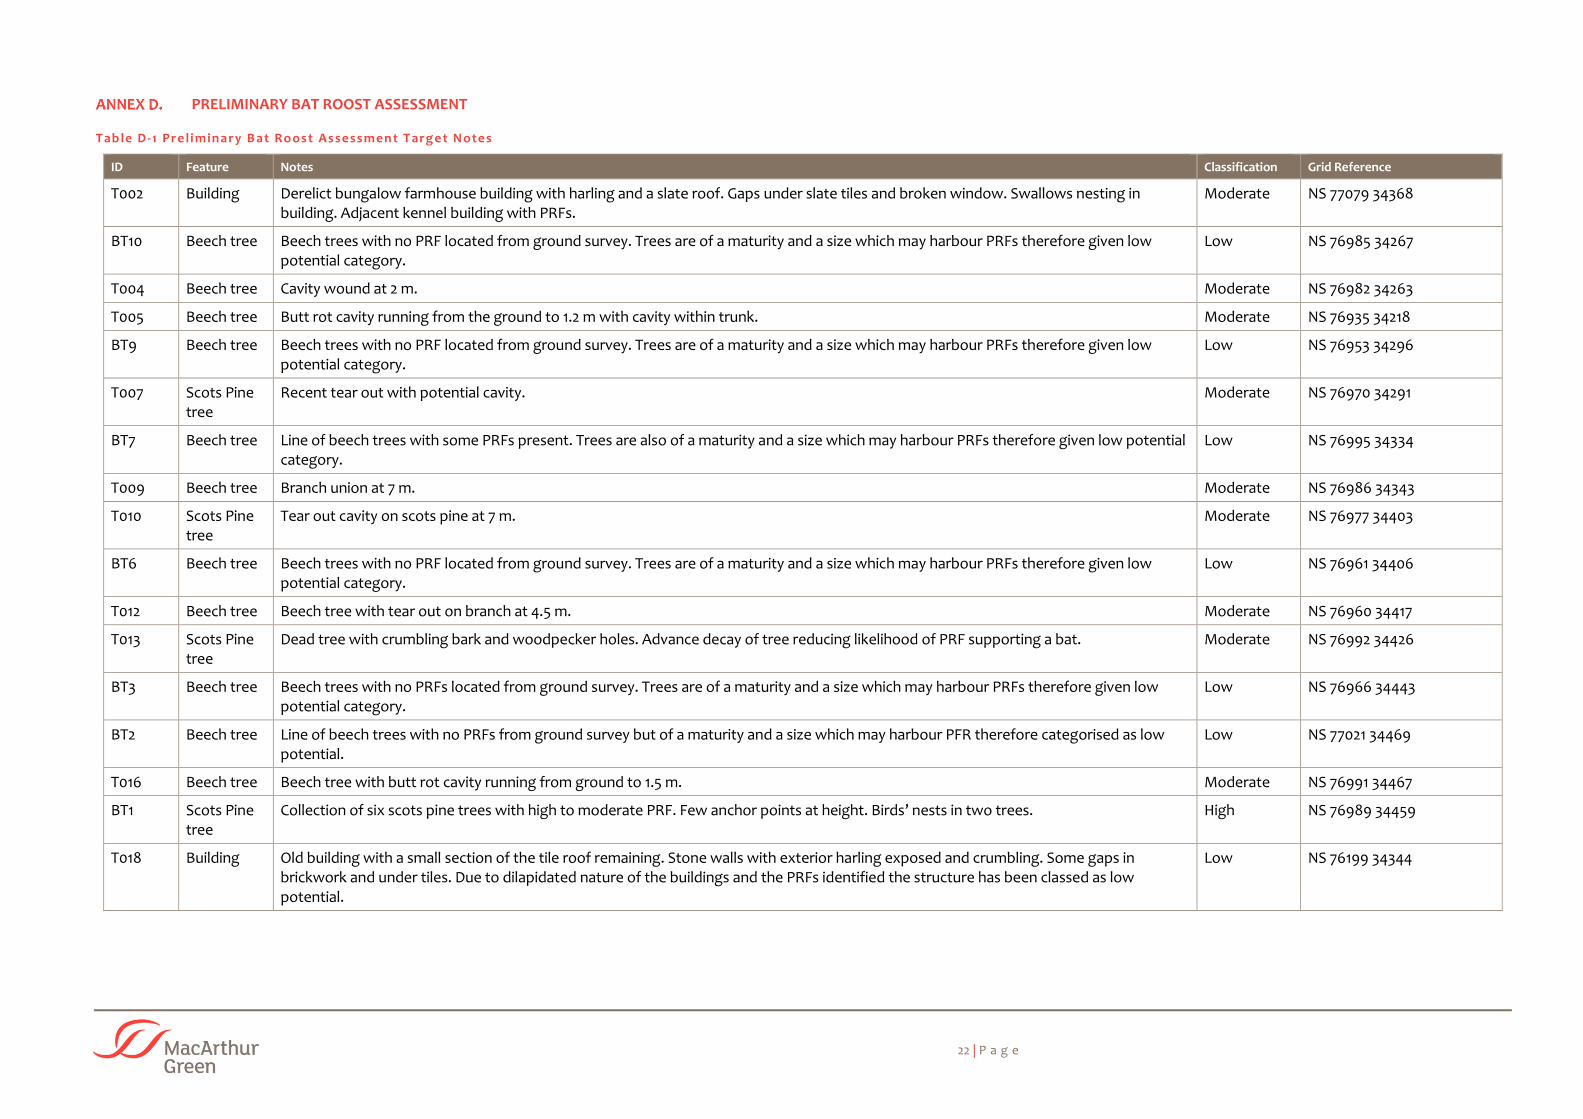
Table D-1 Preliminary Bat Roost Assessment Target Notes .............................................................. 22
Table E-1 Monthly Location Specific Data for High Collision Risk Species ........................................ 23
FIGURES
Figure 7.7 Bat Study Area
Figure 7.8 Preliminary Bat Roost Assessment Results
Figure 7.9 Overall Median Risk Assessment (June, July & August and September) for Common
Pipistrelle
Figure 7.10 Overall Median Risk Assessment (June, July & August and September) for Soprano
Pipistrelle
Figure 7.11 Overall Median Risk Assessment (June, July & August & September) for Nyctalus
spp.

1 | P a g e
1 INTRODUCTION
MacArthur Green was commissioned by the Applicant to carry out bat surveys for the Cumberhead
West Wind Farm, approximately 4 km to the west of Coalburn, South Lanarkshire (hereafter referred
to as the ‘Proposed Development’).
Bat surveys were undertaken to aid and inform the ecological impact assessment for the
Cumberhead West Wind Farm Environmental Impact Assessment Report (EIAR Volume 2, Chapter
7).
This report presents the results of the bat survey work undertaken between May to September 2019
and from July to August 2020 including preliminary ground level roost assessments (PRA). Surveys
were carried out within the Proposed Development site and study area which is shown in Figure 7.7
of the EIA Report.
Bat surveys included:
• Desk Study;
• A Preliminary Bat Roost Assessment (PRA); and
• Automated activity surveys.
The aim of the surveys was to quantify site usage and variation of activity levels within the site in
accordance with SNH et al. (2019).
2 THE PROPOSED DEVELOPMENT SITE AND STUDY AREA
The Proposed Development site (‘the site’) is located mainly within an area of active commercial
forestry within the larger Cumberhead Forest complex, west of Douglas, South Lanarkshire. The site
adjoins the existing cluster of operational and consented wind farms around Hagshaw Hill, known
as the ‘Hagshaw Cluster’.
The site extends over the existing Cumberhead Forest, consisting of commercial coniferous
plantation and existing forestry tracks. There is also a small area of enclosed fields around Black Hill
within the southeast of the site.
The site gradually rises from 320 m Above Ordnance Datum (AOD) in the north to 522 m AOD at the
summit of Nutberry Hill in the south of the site. A number of watercourses run through the site,
mainly Birkenhead Burn, Eaglin Burn, Long Burn, Logan Water and the River Nethan.
The surrounding land comprises open moorland to the west and south-west, farmland with some
scattered individual properties to the north and north-east, with further coniferous plantation to the
south and south-east.
The ‘study area’ in which bat surveys were undertaken covered the entirety of the site where new
infrastructure would be constructed. It therefore excludes the length of access track which would
be taken from the public road, using existing access track through Cumberhead Forest, because the
access would make use of existing tracks. The exception to this is a short stretch of track which
would be created for the Proposed Development if the proposed Douglas West Extension Wind

2 | P a g e
Farm is not built in advance. This 1.38 km section of new track has been assessed separately in
Appendix 3.3 of the EIA Report. The study area is shown in Figure 7.7 of the EIA Report.
3 BATS AND WIND FARMS
3.1 Policy and Guidance
All bat species are protected under the following legislation:
• The Habitats Directive 92/43/EEC (as amended);
• The Wildlife and Countryside Act 1981 (as amended); and
• The Conservation (Natural Habitats, &c.) Regulations 1994 (as amended).
Details pertaining to the legal status of bats are included within Annex A and in Table A-1.
In the UK and Europe, guidelines have been produced with regards to assessing the ecological
impact upon bats from wind farm developments. These guidelines help to inform survey and
mitigation strategies.
The following guidance documents have been used in the preparation of this report:
• Collins, J. (ed) (2016). Bat Surveys for Professional Ecologists: Good Practice Guidelines (3rd
edn). The Bat Conservation Trust, London; and
• Scottish Natural Heritage, Natural England, Natural Resources Wales, Renewable UK,
Scottish Power Renewables, Ecotricity Ltd, the University of Exeter & Bat Conservation Trust
(BCT). (2019). Bats and Onshore Wind Turbines: Survey Assessment and Mitigation.
4 METHODS
4.1 Desk-Based Study
A desk-based study was undertaken with regards to the presence of species of interest within the
site and its environs.
A National Biodiversity Network (NBN)1 Atlas Scotland search was completed to obtain bat records
from 2010 to 2020 within 10 km of the site.
South West Scotland Environmental Information Centre (SWSEIC) and Glasgow Museums Biological
Record Centre (GMBRC) were contacted to provide bat records within 10 km of the site.
4.2 Field Survey Methods
4.2.1 Preliminary Bat Roost Assessment
The PRA followed the assessment methodology as set out in Collins (2016), to identify any Potential
Roost Features (PRFs) in trees, buildings and structures, which could support roosting bats and to
search for evidence of roosting bats. Where PRFs were identified, they were assigned a value of low,
1 NBN Atlas occurrence download at https://nbnatlas.org accessed on Mon Feb 17 14:16:22 UTC 2020.

3 | P a g e
moderate or high suitability which indicates the likelihood of bats being present and informs the
requirement for further survey work, such as a climbing inspection and/or dusk and dawn bat activity
surveys.
The PRA was carried out within the study area, as shown in Figure 7.7.
4.2.2 Automated Activity Surveys
SNH et al. (2019) recommends that, “Where developments have more than ten turbines, detectors
should be placed within the developable area at ten potential turbine locations plus a third of additional
potential turbine sites up to a maximum of 40 detectors for the largest developments.”
The Proposed Development layout at the time of survey in 2019 included 19 proposed wind turbines.
A 19 turbine site requires 13 locations to be sampled. Detectors were placed at potential turbine
locations across the site. Where proposed turbine locations within plantation habitat could not be
reached, the nearest openings to these locations such as rides, tracks and clear-fell were sampled
instead. Sampling open habitats such as these also provides an indication of how bats will adapt to
and use new open habitats created through turbine construction. In 2020 two additional turbines
were added to the Proposed Development design and these the two locations were also sampled
from July to August in 2020. Detector locations are shown in Figure 7.7.
A total of three survey visits to the site were completed in June to July, July to August, and August
to September for all 13 locations (locations 1 to 13) in 2019 with locations not altered throughout the
survey period. Two turbine locations (locations 14 and 15) were added to the Proposed Development
site in 2020 with two detectors deployed at the additional proposed turbine locations from July to
August in 2020 for a total of 26 continuous nights. Detector locations are shown in Figure 7.7.
Anabat Express and Swift detectors recording zero-crossing files were deployed for a minimum
period of ten consecutive nights across the site as recommended by SNH et al. (2019), and were
positioned at a height of 2 m. Each detector recorded bats from dusk to dawn with detectors starting
30 minutes before dusk and finishing 30 minutes after dawn. Detector operating times are shown in
Table B-2 of Annex B with a description of the habitat type at each location shown in Table B-3 of
Annex B.
SNH et al. (2019) states that ‘full spectrum automatic detectors should be deployed, as a minimum’.
SNH was consulted on the 21st March 2019 regarding the requirement for full spectrum detectors,
following the publication of the new guidance. SNH advised that the use of zero-crossing detectors
would be permitted with a transition over time towards full spectrum detectors. They recommended
deploying a few full-spectrum detectors alongside the zero-crossing detectors at a subset of
locations, so that detectability can be calibrated; this was incorporated into the survey method for
the site. At location 9, an Anabat Express detector recording zero-crossing files was deployed
alongside an Anabat Swift (Location 9R) detector set to full spectrum. The Express detector was
deployed with a sensitive value of 8 (High). The full spectrum detector was deployed with the
following settings:
• Sensitively value of 14;
• Minimum frequency of 15 kHz;

4 | P a g e
• Maximum frequency of 250 kHz;
• Minimum event of -2 ms; and
• Sampling rate of 320 kHz.
Data was analysed using Kaleidoscope 4 Auto ID classifier which assigns a species label to a sound
file. To ensure that all non-Pipistrellus calls (excluding Nathusius’ pipistrelle calls) were identified
correctly by the software, they were manually reviewed by an experienced bat ecologist using
Kaleidoscope Viewer and AnalookW software. This method of analysis is in line with current
guidelines (Collins, 2016) for data analysis which recommends the manual checking of all non-
Pipistrellus calls when using automated methods. Sound files labelled as noise were not reviewed.
Guidance on call parameters was taken from Russ (2012).
For the purposed of this report and for Ecobat analysis, a single bat registration was classed as a
single labelled Kaleidoscope file containing a sequence of bat pulses.
In line with SNH et al. (2019), further analysis of bat data was carried out using the secure online tool
Ecobat (Mammal Society, 2017), to gain a measure of relative bat activity at the site. Ecobat data was
then evaluated in accordance with SNH et al. (2019) guidance tables to determine the overall site risk
level. The Ecobat analysis automatically analyses data per month and not per season. The results are
presented based on this analysis per month.
4.3 Methods for Analysing Bat Activity Levels and Risks
SNH et al. (2019) details the methodology for analysing bat activity levels. This method is summarised
below and involves the following steps:
1. Estimating bat activity levels;
2. Categorising collision risk of the relevant species;
3. Identifying population relevant abundance (size of the populations);
4. Categorising the potential vulnerability of bat populations by combining collision risk with
population abundance;
5. Categorising the site risk level;
6. Completing the overall risk assessment; and
7. An assessment of significance and mitigation.
The following sections outline the methods used in each step:
4.3.1 Step 1: Bat Activity Levels
A measure of relative bat activity was obtained using the secure online tool Ecobat (Mammal Society,
2017) for automated data. SNH et al. (2019) explains that, ‘‘The tool compares data entered by the user
with bat survey information collected from similar areas at the same time of year and in comparable
weather conditions…. Ecobat generates a percentile rank for each night of activity and provides a
numerical way of interpreting the levels of bat activity recorded at a site across regions in Britain’’. Table

5 | P a g e
4-1 below, taken from SNH et al. (2019) shows the five percentile categories for ease of reference.
Only static data from automated activity surveys was analysed with the Ecobat tool.
The reference range data set were stratified to include:
• Only records from within 30 days of the survey date;
• Only records from within 100 km2 of the survey location; and
• Records using any make/model of bat detector.
Table 4 -1 : Pe rcen ti le Score and Ca teg orised Le vel of B at Acti v ity 2
Percentile Score Bat Activity
81 to 100 High
61 to 80 Moderate to High
41 to 60 Moderate
21 to 40 Low to Moderate
0 to 20 Low
4.3.2 Step 2: Vulnerability to Collision
Annex 3 of SNH et al. (2019) presents a generic assessment of vulnerability to collision for UK species,
based on species behaviour and flight characteristics. Table 4-2Table 4-2 provides a summary of the
vulnerability of each bat species to collision.
Table 4 -2: Vu lne rabi l i ty of B at Spe cies to Tu rbi ne Impa ct in the U K 2 .
Risk of Turbine Impact (Collision Risk)
Low Risk Medium Risk High Risk
Myotis spp. Serotine Common pipistrelle
Long-eared bats Barbastelle Soprano pipistrelle
Horseshoe bats Noctule
Leisler’s bat
Nathusius’ pipistrelle
Habitat characteristics at the location of wind turbines can have an important influence on the
vulnerability of bat species to collision. For example, proximity to key feeding sites and commuting
routes such as water features and woodland edge habitats is known to increase the likelihood of bat
collision (SNH et al. 2019).
2 Table sourced from: Scottish Natural Heritage, Natural England, Natural Resources Wales, Renewable UK, Scottish Power Renewables, Ecotricity Ltd, the University of Exeter & Bat Conservation Trust (BCT). (2019). Bats and Onshore Wind Turbines: Survey Assessment and Mitigation.

6 | P a g e
4.3.3 Step 3: Population Relative Abundance
SNH et al. (2019) details the sensitivity of a bat species to impact based on their population’s relative
abundance in Scotland as detailed in Table 4-3. Species with the rarest relative abundance are more
susceptible to significant effects.
Table 4 -3 : Popu lat ion Rela tive Abund anc e of B ats in Scot land 2 .
Relative Abundance Species
Common Common pipistrelle
Soprano pipistrelle
Rarer
Brown long-eared bat
Daubenton's bat
Natterer's bat
Rarest
Whiskered bat
Brandt's bat
Nathusius' pipistrelle
Noctule bat
Leisler’s bat
4.3.4 Step 4: Potential Vulnerability of Bat Populations
Table 4-4 below, sourced from SNH et al. (2019), uses the measure of collision risk, in combination
with relative population abundance, to indicate the potential vulnerability of populations of British
bat species. The overall potential vulnerability of bat populations is identified as: low (yellow),
medium (orange), high (red).
Table 4 -4: Leve l of Potentia l V u lnerabi l i ty of P opu la ti ons of B rit i sh Bat Spe cies 2 .
Re
lati
ve A
bu
nd
ance
of
Bat
s in
Sco
tlan
d
Collision Risk
Low collision risk Medium collision risk High collision risk
Common species Common pipistrelle
Soprano pipistrelle
Rarer species
Brown long-eared bat
Daubenton’s bat
Natterer’s bat
Rarest species Whiskered bat
Brandt’s bat
Nathusius’ pipistrelle
Noctule bat
Leisler’s bat
4.3.5 Step 5: Categorise the Site Risk Level
The site risk level is categorised through a combination of habitat risk and project size which is then
entered into the table matrix as shown below in Table 4-5 to calculate the overall site risk level. The
full matrix table, as provided within the SNH et al. (2019), is shown in Annex C which includes
descriptions on how to determine the habitat risk and project size for the site.

7 | P a g e
Table 4 -5 : In i t ia l Si te Ri sk Asses smen t 2 .
Site Risk Level
(1-5) *
Project Size
Habitat Risk
Small Medium Large
Low 1 2 3
Moderate 2 3 4
High 3 4 5
Key: Green (1-2) – low/lowest site risk; Amber (3) – medium site risk; Red (4-5) – high/highest site risk
* Some sites could conceivably be assessed as being of no (0) risk to bats. This assessment is only likely to be valid in more extreme environments, such as above the known altitudinal range of bats, or outside the known geographical distribution of any resident British species.
4.3.6 Step 6: Risk Assessment
The overall risk assessment is undertaken for high collision risk species identified on-site and involves
combining site risk level (Section 4.3.5, Table 4-5) with the Ecobat activity level (Section 4.3.1, Table
4-1). The overall risk assessment matrix is shown in Table 4-6 below where Low site risk level (green)
is 0-4, Medium site risk level (amber) is 5-12, and High site risk level (red) is 15-25.
Table 4 -6: Ove ra l l Ris k Asse ss ment 2 .
Ecobat activity category (or equivalent justified categorisation)
Site Risk Level
Nil (0) Low (1) Low-Moderate (2)
Moderate (3)
Moderate-High (4)
High (5)
Lowest (1) 0 1 2 3 4 5
Low (2) 0 2 4 6 8 10
Medium (3) 0 3 6 9 12 15
High (4) 0 4 8 12 15 18
Highest (5) 0 5 10 15 20 25
4.3.7 Step 7: Assessment of Significance and Mitigation
The outputs of the risk assessment detailed in step 6 above are then used to assess the significance
of effect within the Ecological Impact Assessment. At this stage, other site-specific factors should be
considered such as habitat characteristics (and how they may change), behaviour of species at the
site, and location of the site regarding the natural range of the species and how this could affect
favourable conservation status.
Mitigation measures as detailed within SNH et al. (2019) are then considered where appropriate.

8 | P a g e
5 BAT SURVEY LIMITATIONS
The guidance recommends the minimum level of pre-application survey required for ground level
static detectors to be 10 nights of recordings in each of spring (April - May), summer (June to mid-
August) and autumn (Mid-August to October). In Scotland due to unfavourable weather conditions
and low activity levels for bats in April, ground-level automated activity surveys, typically commence
in May and are completed in September or mid-October (weather dependant). Surveys for the
Proposed Development in 2019 did not include ground-level static detector surveys in May, with two
survey visits completed in the summer (June to July and July to August) and one survey completed
in the Autumn (August to September). To account for the absence of data in the spring, the second
deployment period in the summer and the deployment period in autumn were increased beyond the
required 10 nights of recording with a total recording period of 568 nights collected for the site,
which is beyond the minimum number of nights recommended by SNH et al. (2019) for a site of this
size. The increased collection of data in the summer and autumn is considered to have enabled a
robust assessment of the bat activity on the site. The survey timings can be seen in Annex B, Tables
B-1 and B-2.
Two turbine locations were added to the Proposed Development in 2020 with two detectors
(locations 14 and 15) deployed at the proposed turbine locations from July to August for a total of 26
continuous nights, which captured the summer and autumn deployment periods. The minimum
number of nights required according to guidance for two locations for a seasonal deployment period
is 60 nights which was not achieved with only 52 nights recorded. The absence of data in the spring
means that bat activity during this period at locations 14 and 15 were not recorded . However, when
considering the number of locations in total sampled across the site (locations 1 to 15) and the overall
number of nights recorded, the small absence of data at these locations, is not considered to have
altered the overall assessment of risk for the site. The survey timings can be seen in Annex B, Tables
B-1 and B-2.
Due to unforeseen errors with the detectors, microphones or batteries, it was not always possible
to achieve ten consecutive nights of recordings recommended by SNH et al. (2019). As the majority
of locations recorded for more than ten nights, with a total of 568 nights recorded for the site, which
is beyond the minimum number of nights required for a site of this size, the small loss of data is not
considered to have materially altered the overall assessment of risk. The survey timings can be seen
in Annex B, Tables B-1 and B-2.
Some temporal calls were assigned an unknown value (NoID), due to the recording of a very faint
call or an incomplete call that could not be identified to species level on the spectrogram. These
were not considered further in the Ecobat analysis.
For some Myotis spp. calls it was only possible to identify the call to genus level. It is possible that for
Myotis spp. these recordings could represent species not identified in the analysis of the recorded
data. Myotis spp. bats are categorised as low collision risk species.
Anabat detectors are a commonly used bat detector for acoustic monitoring at wind farm sites,
however all bat detectors have limitations and will only monitor bat activity within a limited area,
which for Anabats is usually around 30 m, depending on a variety of environmental factors.
Furthermore, due to passive monitoring methodologies depending on sound reaching the

9 | P a g e
microphone, the detection rate of bat calls varies with a bias towards loud bat calls with quieter calls,
namely brown long-eared bats (Plecotus auritus), potentially being under-recorded.
An internal inspection was not carried out on the bungalow at Cumberhead or on the ruin at
Eaglinside for health and safety reasons including the unknown presence of asbestos and structural
stability of the buildings.
At location 9/9R, an Anabat Express detector recording zero-crossing files was deployed alongside
an Anabat Swift detector set to full spectrum. The Anabat Express detector recorded a total of 2,306
registrations while the Anabat Swift full spectrum detector recorded 1,887 registrations. The Anabat
Express detector recorded an additional species with a brown long-eared registration recorded. The
registration difference in detectors at the same location highlights the suite of variables affecting
how well bats are recorded including, whether the microphone gets wet, the difference in
detectability between microphones, how close the bat passes the microphone, the detector type,
and if a recording is filtered out as noise. As full spectrum detectors record bigger files, these
detectors can often be set at a lower sensitively than zero--crossing detectors.
6 SURVEY RESULTS & ANALYSIS
6.1 Desk-Based Study
NBN Atlas returned records of the following bat species within 10 km of the Proposed Development
site boundary:
• Common pipistrelle (Pipistrellus pipistrellus);
• Daubenton’s bat (Myotis daubentonii); and
• Nathusius’s pipistrelle (Pipistrellus nathusii).
SWSEIC returned records of the following bat species within 10 km of the Proposed Development
site boundary;
• Pipistrelle bat species; and
• Soprano pipistrelle (Pipistrellus pygmaeus).
GMBRC were asked to provide records of bats within 10 km of the site however, no response was
received.
6.2 Preliminary Bat Roost Assessment
Suitability for roosting bats was recorded within the study area at Cumberhead and Eaglinside
(Figure 7.8).
An old derelict bungalow at Cumberhead is located at the end of a farm track which is surrounded
by a rectangular block of mature broadleaved trees. The bungalow is constructed of brick and harling
with a pitched slate roof. A long section of the bungalow was used for storage and as a working area
with the doors to this section left open. At the back of the bungalow, there is a small kennel building
with brick walls and a pitched slate roof. An external inspection was carried out and evidence of
nesting swallows (Hirundo rustica) was seen but no evidence of bats was found. The bungalow and

10 | P a g e
the kennel were both assessed as having moderate summer and low winter bat roost suitability with
numerous PRFs found such as gaps under tiles and broken windows.
An old ruin was located at Eaglinside. The small stone building is missing most of the roof with only
a small section of the tile roof remaining with gaps under the tiles. The stone walls with exterior
harling are exposed and crumbling with gaps present between the bricks. Due to the dilapidated
nature of the building and its exposed nature, the old ruin was classified as having low suitability for
summer and winter roosting bats.
The old derelict bungalow at Cumberhead is surrounded by a rectangular block of mature tree which
are mainly composed of beech trees (Fagus sylvatica) with the occasional Scots pine (Pinus sylvestris).
Trees within this block of woodland were found to have PRFs of high, moderate and low suitability.
Due to the difficulty of identifying PRFs from the ground, especially when leaves are still on the trees
during the summer months, trees that were seen to have the maturity and the size to contain PRFs,
with no PRFs found at ground level, were given a precautionary classification of low suitability for
roosting bats. Tree roosts can be used both as summer and winter roosts.
The PRFs recorded are not within 300 m of a proposed turbine locations and do not require further
surveys.
PRF records are shown in Figure 7.8 with the results (target notes) listed in Table D-1, Annex D.
6.3 Automated Activity Surveys
MacArthur Green deployed detectors at 13 locations from June to September in 2019 with two
additional locations surveyed from July to August in 2020 (see Table B-2 and B-3 of Annex B and
Figure 7.8).
The survey results were processed using the Ecobat tool (Mammal Society, 2017) to gain a measure
of relative bat activity at the Proposed Development site. The results are presented in Steps 1 – 6
below.
Between June to September 2019, bats were detected on 48 nights, using 13 static bat detectors at
locations 1 to 13. A total of four bat species and two genus classifications were recorded for these
locations: soprano pipistrelle, common pipistrelle, Daubenton’s bat, brown long-eared bat, Myotis
spp. and Nyctalus spp Table 6-1.
Table 6-1 T ota l Number of B at Pa sses for E ach Specie s Across a l l Loca ti ons
Species/Species Group No of Registrations Percentage of total (%)
Soprano pipistrelle 10,910 46.60
Common pipistrelle 10,193 43.54
Nyctalus spp. 1,710 7.30
Myotis spp. 550 2.35
Daubenton’s 33 0.14
Brown long-eared 15 0.16
Total 23,411 100

11 | P a g e
6.3.1 Step 1: Bat Activity Levels
Average Annual Site Activity Levels
Table 6-2, Chart 6-1 and Chart 6-2 detail the average annual site activity levels calculated using the
Ecobat tool (Mammal Society, 2017).
Data on the monthly activity levels per location for 2019 and 2020 is provided in Table E-1 of Annex
E.
Table 6-2 : Average Ann ual Site Activ i ty Leve ls from 2 01 9 ( loca ti ons 1 to 1 3) a nd 202 0 ( loca ti ons 14 and 1 5) ta ken from Ecobat Ana ly sis 3
Species/ Group
Year Locations Median
Percentile Activity
Level 95% Cis*
Max Percentile
Activity Level
Nights Recorded
Pipistrellus pipistrellus
2019 1 – 13 69 Moderate – High
84.5 90.5
99 High 331
Pipistrellus pygmaeus
2019 1 – 13 69 Moderate – High
85.5 – 90.5
100 High 341
Nyctalus spp.
2019 1 – 13 44 Moderate 37 – 62.5
94 High 301
Myotis spp. 2019 1 – 13 1 Low 29+ - 57 88 High 165
Myotis Daubentonii
2019 1 – 13
1 Low 30 - 30 51 Moderate 22
Plecotus auritus
2019 1 - 13 1 Low 1 – 15.5 30 Low to Moderate
13
Pipistrellus pipistrellus
2020 14 - 15 47 Moderate 35 - 58 85 High 34
Pipistrellus pygmaeus
2020 14 - 15 40 Low – Moderate
31 – 54.5
76 Moderate to High
34
Nyctalus spp.
2020 14 - 15 33 Low – Moderate
17 – 44.5
66 Moderate to High
28
Myotis spp. 2020 14 - 15 1 Low 1 - 1 1 Low 5
*Cis: confidence intervals.
3 Taken from Ecobat analysis report created from automated activity data of the Proposed Development site in 2019 and 2020.

12 | P a g e
Chart 6-1 : Average Ann ual Site Activ i ty Leve ls 201 9 3
Chart 6-2 : Average Ann ual Site Activ i ty Leve ls 202 0 3

13 | P a g e
6.3.2 Step 2, 3 and 4: Collision Risk, Population Relative Abundance and Potential Vulnerability
Table 6-3 details the collision risk, population relative abundance and potential vulnerability of the
bat species recorded within the site.
Table 6- 3: C ol l i s i on Ris k, Popu lati on Relati ve Abunda nce and Potenti al Vu lnerabi l i ty .
Bat Species Collision Risk Population Relative Abundance
Potential Vulnerability
Common pipistrelle High Common Medium
Soprano pipistrelle High Common Medium
Nyctalus spp. High Rarest High
Daubenton’s Low Rarer Low
Myotis spp. Low Rarer Low
Brown long-eared Low Rarer Low
6.3.3 Step 5: Categorising Site Risk Level
The site risk level is determined by project size and habitat risk (see Table 4-5). The Proposed
Development consists of 21 turbines that are over 50 m in height, and so falls within the upper
category of ‘Medium’ project size which is between 10 to 40 turbines, as shown in Table 4-5 and
Table C-1 of Annex C.
In terms of habitat risk for bats, there are buildings and trees with low, moderate and high bat
roosting potential within the study area. There are burns of different sizes within the study area,
providing connectivity and foraging habitats throughout the site and the surrounding landscape. The
habitat consists of closed plantation with open habitats such as tracks rides and openings, which
could be used by foraging bats. The foraging, connectivity and roosting potential of the site results
in a habitat risk classification of ‘Moderate’, as shown in Table 4-5 and Table C-1 of Annex C.
According to Table 4-5 above and Table C-1 of Annex C, the ‘Medium’ project size combined with a
‘Moderate’ habitat risk level results in an overall site risk assessment of ‘Medium’ (3), in accordance
with Table 4-5 above and in Table C-1 of Annex C.
6.3.4 Step 6: Risk Assessment – High Collision Risk Species Only
The overall risk assessment is undertaken for high collision risk species which were identified within
the site. Low-risk species (Myotis spp. and Daubenton’s bat) have low collision risk, so the impact of
the Proposed Development on the local bat population would likely be negligible. The overall risk
assessment involves multiplying the site’s risk level (Section 4.3.5, Table 4-5) with the median and
the maximum Ecobat activity levels (Section 4.3.1,Table 4-1) to calculate both the typical site risk
level, and the maximum site risk level.
Table 6-4Table 6-2, details the overall level of risk for all high-risk species. The overall risk scores in
2019 for all high collision risk species was ‘Medium’ (9 - 12), while the overall site risk score based on
maximum Ecobat activity levels was ‘High’ (15). In 2020 the overall risk score was ‘Medium’ (6 - 9),

14 | P a g e
while the overall site risk score based on maximum Ecobat activity levels was ‘High’ (15) for common
pipistrelle and ‘Medium’ (12) for both soprano pipistrelle and Nyctalus spp.
Table 6-4: Ris k As sess ment Scores B ased on Median and Maxi mu m Percenti le s for High Col l is i on Ris k Spe cies (201 9 a nd 2 020)
Species Survey period
Risk Assessment Score based on
Median Percentile
Risk Assessment Score based on Max. Percentile
Common pipistrelle 2019 Medium (12) High (15)
Soprano pipistrelle 2019 Medium (12) High (15)
Nyctalus spp. 2019 Medium (9) High (15)
Common pipistrelle 2020 Medium (9) High (15)
Soprano pipistrelle 2020 Medium (6) Medium (12)
Nyctalus spp. 2020 Medium (6) Medium (12)
To provide an indication how activity varies across the year by species,
Table 6-5 shows the % of sample locations where a medium percentile ‘High’ risk assessment score
was recorded. Using this method, June, July and August appear to be the three months with greater
risk.
Figures 7.9 to 7.11 presents the overall median monthly risk assessment scores for high collision risk
bat species at the various sample locations.
Data on the monthly activity levels per location is also provided in Table E-1 of Annex E.
Table 6- 5: The Percen ta ge of Locati ons wi th Hi gh- Ris k As sess men t Score s based on Median Pe rcen ti les for High C ol l is i on Ris k Spe cies
Species June July August September
Median Percentile
Common pipistrelle 23% 23% 15% 8%
Soprano pipistrelle 15% 23% 23% 8%
Nyctalus spp. 8% 0% 0% 0%
Green - 0, Yellow - 1-33%, Amber 34-66%, Red - 67-100%

15 | P a g e
7 REFERENCES
Collins, J. (ed) (2016). Bat Surveys for Professional Ecologists: Good Practice Guidelines (3rd edn).
The Bat Conservation Trust, London.
Mammal Society (2017). Ecobat. Available at: http://www.mammal.org.uk/science-research/ecostat/
Russ, J. (2012). British Bat Calls: A Guide to species Identification. Pelagic Publishing.
Scottish Natural Heritage, Natural England, Natural Resources Wales, Renewable UK, Scottish Power
Renewables, Ecotricity Ltd, the University of Exeter & Bat Conservation Trust (BCT). (2019). Bats and
Onshore Wind Turbines: Survey Assessment and Mitigation.

16 | P a g e
PROTECTED SPECIES LEGAL STATUS
All bat species receive protection under the Conservation Regulations (1994) (as amended).
The information contained in this Annex is a summarised version of the legislation and should be read
in conjunction with the appropriate legislation.
It is an offence to:
• Deliberately or recklessly to capture, injure or kill a wild animal of a European protected
species;
• Deliberately or recklessly:
− Harass a wild animal or group of wild animals of a European protected species;
− Disturb such an animal while it is occupying a structure or place which it uses for
shelter or protection;
− Disturb such an animal while it is rearing or otherwise caring for its young;
− To obstruct access to a breeding site or resting place of such an animal, or otherwise
to deny the animal use of the breeding site or resting place (i.e. roost sites);
− To disturb such an animal in a manner that is, or in circumstances which are, likely to
significantly affect the local distribution or abundance of the species to which it
belongs; or
− To disturb such an animal in a manner that is, or in circumstances which are, likely to
impair its ability to survive, breed or reproduce, or rear or otherwise care for its
young;
• To damage or destroy a breeding site or resting place of such an animal.

17 | P a g e
Table A- 1 Lega l and C on serva ti on Sta tus of al l UK Ba ts 4
4 Source: Bat Conservation Trust http://www.bats.org.uk/pages/bats_and_the_law.html

18 | P a g e
SURVEY TIMINGS & ANABAT LOCATIONS
Table B -1 Summa ry of T empora l Survey E ffort
Survey Date Locations Total Number of Complete Nights
June 21/06/2019 – July 01/07/2019
1 10
2 10
3 10
4 10
5 10
6 10
7 10
8 10
9 10
9R* 10
10 10
11 10
12 10
13 10
July 24/07/19 – August 19/08/19
1 20
2 17
3 20
4 25
5 16
6 24
7 20
8 26
9 20
9R* 26
10 20
11 20
12 19
13 19
August 19/08/19 – September 02/09/19
1 14
2 14
3 6
4 14
5 12
6 14
7 14
8 14

19 | P a g e
Survey Date Locations Total Number of Complete Nights
9 14
9R* 14
10 14
11 14
12 14
13 14
Total - 618
July 31/07/2020 – August 26/08/2020 14 26
15 26
Total - 52
* Location 9R is not included in the total number of nights as this detector was at the same location as
location 98 and was used as a reference detector to determine the variability of detectability between
a zero-crossing detector (Express) and a full spectrum detector (Swift).
Table B -2 D escri pti on of Ana ba t Loca ti ons
Location Easting Northing Bearing Habitat
1 274622 632958 170 Open clear-fell
2 273781 633399 120 Open moorland
3 274562 633591 240 Immature plantation
4 275273 634020 130 Open clear-fell
5 273928 634053 120 Recent clear-fell
6 274900 634077
40 Plantation edge and immature planation
7 275348 634607
40 Near plantation edge, track and small pond
8 275197 635107 120 Open ride
9 275864 635264
160 Near path, open clear-fell
9R 275864 635264
160 Near path, open clear-fell
10 276233 634949 210 Clear-fell
11 276819 634861 200 Immature planation
12 277041 635562
280 Immature plantation, planation edge and track
13 276534 635629 200 Clear-fell

20 | P a g e
Location Easting Northing Bearing Habitat
14 276734 634310
90 Adjacent to immature plantation by <1m and grazing pasture
15 276762 633841
180 Immature plantation <1m away

21 | P a g e
INITIAL SITE RISK ASSESSMENT
Table C -1 In i t ia l S ite Ri sk Asses smen t 5.
Site Risk Level
(1-5)6 Project Size
Habitat Risk
Small Medium Large
Low 1 2 3
Moderate 2 3 4
High 3 4 5
Key: Green (1-2) – low/lowest site risk; Amber (3) – medium site risk; Red (4-5) – high/highest site risk
Habitat Risk Description
Low Small number of potential roost features, of low quality. Low-quality forging habitats that could be used by small numbers of foraging bats. Isolated site not connected to the wider landscape by prominent linear features.
Moderate
Buildings, trees or other structures with moderate-high potential as roost sites on or near the site.
Habitat could be used extensively by foraging bats.
Site is connected to the wider landscape by linear features such as scrub, tree lines and streams.
High
Numerous suitable buildings, trees (particularly mature ancient woodland) or other structures with moderate-high potential as roost sites on or near the site, and/or confirmed roosts present close to or on the site.
Extensive and diverse habitat mosaic of high quality for foraging bats.
Site is connected to the wider landscape by a network of strong liner features such as rivers, blocks of woodland and mature hedgerows.
At/near edge of range and or an important flyway.
Close to key roost and /or swarming.
Project Size Description
Small
Small scale development (<10 turbines). No other wind energy developments within 10km.
Comprising turbines <50m in height.
Medium
Larger developments (between 10 and 40). May have some other wind development within 5km.
Comprising turbines 50 – 100m in height.
Large
Largest developments (>40 turbines) with other wind energy developments within 5km.
Comprising turbines >100m in height.
5 Sourced from: Scottish Natural Heritage, Natural England, Natural Resources Wales, Renewable UK, Scottish Power Renewables, Ecotricity Ltd, the University of Exeter & Bat Conservation Trust (BCT). (2019). Bats and Onshore Wind Turbines: Survey Assessment and Mitigation. 6 Some sites could conceivably be assessed as being of no (0) risk to bats. This assessment is only likely to be valid in more extreme environments, such as above the known altitudinal range of bats, or outside the known geographical distribution of any resident British species.
22 | P a g e
PRELIMINARY BAT ROOST ASSESSMENT
Table D -1 Pre li mina ry B at Roos t As sess men t T arge t Notes
ID Feature Notes
Classification Grid Reference
T002 Building Derelict bungalow farmhouse building with harling and a slate roof. Gaps under slate tiles and broken window. Swallows nesting in building. Adjacent kennel building with PRFs.
Moderate NS 77079 34368
BT10 Beech tree Beech trees with no PRF located from ground survey. Trees are of a maturity and a size which may harbour PRFs therefore given low potential category.
Low NS 76985 34267
T004 Beech tree Cavity wound at 2 m. Moderate NS 76982 34263
T005 Beech tree Butt rot cavity running from the ground to 1.2 m with cavity within trunk. Moderate NS 76935 34218
BT9 Beech tree Beech trees with no PRF located from ground survey. Trees are of a maturity and a size which may harbour PRFs therefore given low potential category.
Low NS 76953 34296
T007 Scots Pine tree
Recent tear out with potential cavity. Moderate NS 76970 34291
BT7 Beech tree Line of beech trees with some PRFs present. Trees are also of a maturity and a size which may harbour PRFs therefore given low potential category.
Low NS 76995 34334
T009 Beech tree Branch union at 7 m. Moderate NS 76986 34343
T010 Scots Pine tree
Tear out cavity on scots pine at 7 m. Moderate NS 76977 34403
BT6 Beech tree Beech trees with no PRF located from ground survey. Trees are of a maturity and a size which may harbour PRFs therefore given low potential category.
Low NS 76961 34406
T012 Beech tree Beech tree with tear out on branch at 4.5 m. Moderate NS 76960 34417
T013 Scots Pine tree
Dead tree with crumbling bark and woodpecker holes. Advance decay of tree reducing likelihood of PRF supporting a bat. Moderate NS 76992 34426
BT3 Beech tree Beech trees with no PRFs located from ground survey. Trees are of a maturity and a size which may harbour PRFs therefore given low potential category.
Low NS 76966 34443
BT2 Beech tree Line of beech trees with no PRFs from ground survey but of a maturity and a size which may harbour PFR therefore categorised as low potential.
Low NS 77021 34469
T016 Beech tree Beech tree with butt rot cavity running from ground to 1.5 m. Moderate NS 76991 34467
BT1 Scots Pine tree
Collection of six scots pine trees with high to moderate PRF. Few anchor points at height. Birds’ nests in two trees. High NS 76989 34459
T018 Building Old building with a small section of the tile roof remaining. Stone walls with exterior harling exposed and crumbling. Some gaps in brickwork and under tiles. Due to dilapidated nature of the buildings and the PRFs identified the structure has been classed as low potential.
Low NS 76199 34344

23 | P a g e
MONTHLY LOCATION SPECIFIC DATA
Table E-1 M onthly Loca ti on Specif i c Da ta for High C ol l is i on Ris k Spe cies
Location
ID Species Month Median Percentile
Median
Activity Category (Taken from Table
4-1)
Maximum Percentile
Maximum
Activity Category (Taken from Table 4-1)
Site Risk
(Taken from Table 4-5)
Overall Median Category Score (Taken from Table 4-6)
Overall Median Category Score
Overall Maximum Category Score (Taken from Table 4-6)
Overall Maximum Category Score
1 Myotis Jun 16 Low 30 Low-Moderate 3 3 Low 6 Medium
1 Myotis Jul 30 Low-Moderate 30 Low-Moderate 3 6 Medium 6 Medium
1 Myotis Aug 1 Low 1 Low 3 3 Low 3 Low
1 Myotis daubentonii Jun 1 Low 1 Low 3 3 Low 3 Low
1 Nyctalus Jun 16 Low 30 Low-Moderate 3 3 Low 6 Medium
1 Nyctalus Jul 30 Low-Moderate 30 Low-Moderate 3 6 Medium 6 Medium
1 Nyctalus Aug 30 Low-Moderate 69 Moderate-High 3 6 Medium 12 Medium
1 Pipistrellus pipistrellus Jun 37 Low-Moderate 51 Moderate 3 6 Medium 9 Medium
1 Pipistrellus pipistrellus Jul 30 Low-Moderate 30 Low-Moderate 3 6 Medium 6 Medium
1 Pipistrellus pipistrellus Aug 51 Moderate 64 Moderate-High 3 9 Medium 12 Medium
1 Pipistrellus pygmaeus Jun 1 Low 30 Low-Moderate 3 3 Low 6 Medium
1 Pipistrellus pygmaeus Jul 1 Low 30 Low-Moderate 3 3 Low 6 Medium
1 Pipistrellus pygmaeus Aug 44 Moderate 70 Moderate-High 3 9 Medium 12 Medium
2 Myotis Aug 1 Low 1 Low 3 3 Low 3 Low
2 Nyctalus Jun 44 Moderate 44 Moderate 3 9 Medium 9 Medium
2 Nyctalus Jul 16 Low 30 Low-Moderate 3 3 Low 6 Medium
2 Nyctalus Aug 30 Low-Moderate 83 High 3 6 Medium 15 High
2 Pipistrellus pipistrellus Jun 26 Low-Moderate 51 Moderate 3 6 Medium 9 Medium
2 Pipistrellus pipistrellus Aug 16 Low 30 Low-Moderate 3 3 Low 6 Medium
2 Pipistrellus pygmaeus Jun 31 Low-Moderate 61 Moderate-High 3 6 Medium 12 Medium
2 Pipistrellus pygmaeus Jul 30 Low-Moderate 30 Low-Moderate 3 6 Medium 6 Medium
2 Pipistrellus pygmaeus Aug 1 Low 1 Low 3 3 Low 3 Low
3 Myotis Aug 1 Low 1 Low 3 3 Low 3 Low
3 Nyctalus Jul 1 Low 44 Moderate 3 3 Low 9 Medium
3 Nyctalus Aug 30 Low-Moderate 79 Moderate-High 3 6 Medium 12 Medium

24 | P a g e
Location
ID Species Month Median Percentile
Median
Activity Category (Taken from Table
4-1)
Maximum Percentile
Maximum
Activity Category (Taken from Table 4-1)
Site Risk
(Taken from Table 4-5)
Overall Median Category Score (Taken from Table 4-6)
Overall Median Category Score
Overall Maximum Category Score (Taken from Table 4-6)
Overall Maximum Category Score
3 Pipistrellus pipistrellus Jun 26 Low-Moderate 51 Moderate 3 6 Medium 9 Medium
3 Pipistrellus pipistrellus Jul 1 Low 1 Low 3 3 Low 3 Low
3 Pipistrellus pipistrellus Aug 1 Low 44 Moderate 3 3 Low 9 Medium
3 Pipistrellus pygmaeus Jun 23 Low-Moderate 44 Moderate 3 6 Medium 9 Medium
3 Pipistrellus pygmaeus Jul 1 Low 1 Low 3 3 Low 3 Low
3 Pipistrellus pygmaeus Aug 1 Low 30 Low-Moderate 3 3 Low 6 Medium
3 Plecotus auritus Aug 1 Low 1 Low 3 3 Low 3 Low
4 Myotis Jun 1 Low 1 Low 3 3 Low 3 Low
4 Myotis Aug 1 Low 30 Low-Moderate 3 3 Low 6 Medium
4 Myotis Sep 1 Low 1 Low 3 3 Low 3 Low
4 Nyctalus Jun 1 Low 1 Low 3 3 Low 3 Low
4 Nyctalus Jul 1 Low 30 Low-Moderate 3 3 Low 6 Medium
4 Nyctalus Aug 44 Moderate 75 Moderate-High 3 9 Medium 12 Medium
4 Pipistrellus pipistrellus Jun 44 Moderate 57 Moderate 3 9 Medium 9 Medium
4 Pipistrellus pipistrellus Jul 1 Low 57 Moderate 3 3 Low 9 Medium
4 Pipistrellus pipistrellus Aug 72 Moderate-High 99 High 3 12 Medium 15 High
4 Pipistrellus pygmaeus Jun 37 Low-Moderate 61 Moderate-High 3 6 Medium 12 Medium
4 Pipistrellus pygmaeus Jul 1 Low 1 Low 3 3 Low 3 Low
4 Pipistrellus pygmaeus Aug 80 High 100 High 3 15 High 15 High
5 Myotis Jun 1 Low 1 Low 3 3 Low 3 Low
5 Myotis Jul 1 Low 1 Low 3 3 Low 3 Low
5 Myotis Aug 1 Low 30 Low-Moderate 3 3 Low 6 Medium
5 Nyctalus Jun 1 Low 1 Low 3 3 Low 3 Low
5 Nyctalus Jul 30 Low-Moderate 44 Moderate 3 6 Medium 9 Medium
5 Nyctalus Aug 16 Low 80 Moderate-High 3 3 Low 12 Medium
5 Pipistrellus pipistrellus Jun 16 Low 57 Moderate 3 3 Low 9 Medium
5 Pipistrellus pipistrellus Jul 81 High 87 High 3 15 High 15 High

25 | P a g e
Location
ID Species Month Median Percentile
Median
Activity Category (Taken from Table
4-1)
Maximum Percentile
Maximum
Activity Category (Taken from Table 4-1)
Site Risk
(Taken from Table 4-5)
Overall Median Category Score (Taken from Table 4-6)
Overall Median Category Score
Overall Maximum Category Score (Taken from Table 4-6)
Overall Maximum Category Score
5 Pipistrellus pipistrellus Aug 37 Low-Moderate 70 Moderate-High 3 6 Medium 12 Medium
5 Pipistrellus pygmaeus Jun 23 Low-Moderate 67 Moderate-High 3 6 Medium 12 Medium
5 Pipistrellus pygmaeus Jul 83 High 89 High 3 15 High 15 High
5 Pipistrellus pygmaeus Aug 57 Moderate 81 High 3 9 Medium 15 High
6 Myotis Jun 1 Low 1 Low 3 3 Low 3 Low
6 Myotis Aug 1 Low 44 Moderate 3 3 Low 9 Medium
6 Myotis Sep 1 Low 1 Low 3 3 Low 3 Low
6 Nyctalus Jun 1 Low 1 Low 3 3 Low 3 Low
6 Nyctalus Jul 1 Low 51 Moderate 3 3 Low 9 Medium
6 Nyctalus Aug 30 Low-Moderate 76 Moderate-High 3 6 Medium 12 Medium
6 Pipistrellus pipistrellus Jun 16 Low 88 High 3 3 Low 15 High
6 Pipistrellus pipistrellus Jul 30 Low-Moderate 76 Moderate-High 3 6 Medium 12 Medium
6 Pipistrellus pipistrellus Aug 57 Moderate 83 High 3 9 Medium 15 High
6 Pipistrellus pygmaeus Jun 44 Moderate 78 Moderate-High 3 9 Medium 12 Medium
6 Pipistrellus pygmaeus Jul 62 Moderate-High 79 Moderate-High 3 12 Medium 12 Medium
6 Pipistrellus pygmaeus Aug 57 Moderate 86 High 3 9 Medium 15 High
6 Plecotus auritus Aug 1 Low 1 Low 3 3 Low 3 Low
7 Myotis Jun 1 Low 1 Low 3 3 Low 3 Low
7 Myotis Jul 1 Low 1 Low 3 3 Low 3 Low
7 Myotis Aug 1 Low 57 Moderate 3 3 Low 9 Medium
7 Nyctalus Jun 51 Moderate 51 Moderate 3 9 Medium 9 Medium
7 Nyctalus Jul 37 Low-Moderate 44 Moderate 3 6 Medium 9 Medium
7 Nyctalus Aug 44 Moderate 61 Moderate-High 3 9 Medium 12 Medium
7 Pipistrellus pipistrellus Jun 87 High 98 High 3 15 High 15 High
7 Pipistrellus pipistrellus Jul 67 Moderate-High 86 High 3 12 Medium 15 High
7 Pipistrellus pipistrellus Aug 76 Moderate-High 94 High 3 12 Medium 15 High
7 Pipistrellus pipistrellus Sep 69 Moderate-High 69 Moderate-High 3 12 Medium 12 Medium

26 | P a g e
Location
ID Species Month Median Percentile
Median
Activity Category (Taken from Table
4-1)
Maximum Percentile
Maximum
Activity Category (Taken from Table 4-1)
Site Risk
(Taken from Table 4-5)
Overall Median Category Score (Taken from Table 4-6)
Overall Median Category Score
Overall Maximum Category Score (Taken from Table 4-6)
Overall Maximum Category Score
7 Pipistrellus pygmaeus Jun 73 Moderate-High 91 High 3 12 Medium 15 High
7 Pipistrellus pygmaeus Jul 70 Moderate-High 90 High 3 12 Medium 15 High
7 Pipistrellus pygmaeus Aug 76 Moderate-High 96 High 3 12 Medium 15 High
7 Pipistrellus pygmaeus Sep 64 Moderate-High 64 Moderate-High 3 12 Medium 12 Medium
8 Myotis Jun 72 Moderate-High 76 Moderate-High 3 12 Medium 12 Medium
8 Myotis Jul 1 Low 1 Low 3 3 Low 3 Low
8 Myotis Aug 37 Low-Moderate 77 Moderate-High 3 6 Medium 12 Medium
8 Myotis Sep 1 Low 1 Low 3 3 Low 3 Low
8 Myotis daubentonii Jun 37 Low-Moderate 51 Moderate 3 6 Medium 9 Medium
8 Myotis daubentonii Jul 1 Low 1 Low 3 3 Low 3 Low
8 Myotis daubentonii Aug 16 Low 30 Low-Moderate 3 3 Low 6 Medium
8 Nyctalus Jun 1 Low 1 Low 3 3 Low 3 Low
8 Nyctalus Jul 37 Low-Moderate 44 Moderate 3 6 Medium 9 Medium
8 Nyctalus Aug 30 Low-Moderate 57 Moderate 3 6 Medium 9 Medium
8 Pipistrellus pipistrellus Jun 69 Moderate-High 82 High 3 12 Medium 15 High
8 Pipistrellus pipistrellus Jul 77 Moderate-High 87 High 3 12 Medium 15 High
8 Pipistrellus pipistrellus Aug 78 Moderate-High 98 High 3 12 Medium 15 High
8 Pipistrellus pipistrellus Sep 1 Low 1 Low 3 3 Low 3 Low
8 Pipistrellus pygmaeus Jun 64 Moderate-High 78 Moderate-High 3 12 Medium 12 Medium
8 Pipistrellus pygmaeus Jul 75 Moderate-High 82 High 3 12 Medium 15 High
8 Pipistrellus pygmaeus Aug 79 Moderate-High 98 High 3 12 Medium 15 High
8 Pipistrellus pygmaeus Sep 61 Moderate-High 61 Moderate-High 3 12 Medium 12 Medium
9 Myotis Jun 16 Low 30 Low-Moderate 3 3 Low 6 Medium
9 Myotis Jul 1 Low 1 Low 3 3 Low 3 Low
9 Myotis Aug 1 Low 44 Moderate 3 3 Low 9 Medium
9 Myotis daubentonii Jun 1 Low 1 Low 3 3 Low 3 Low
9 Myotis daubentonii Aug 1 Low 1 Low 3 3 Low 3 Low

27 | P a g e
Location
ID Species Month Median Percentile
Median
Activity Category (Taken from Table
4-1)
Maximum Percentile
Maximum
Activity Category (Taken from Table 4-1)
Site Risk
(Taken from Table 4-5)
Overall Median Category Score (Taken from Table 4-6)
Overall Median Category Score
Overall Maximum Category Score (Taken from Table 4-6)
Overall Maximum Category Score
9 Nyctalus Jun 48 Moderate 57 Moderate 3 9 Medium 9 Medium
9 Nyctalus Jul 30 Low-Moderate 51 Moderate 3 6 Medium 9 Medium
9 Nyctalus Aug 44 Moderate 64 Moderate-High 3 9 Medium 12 Medium
9 Nyctalus Sep 1 Low 1 Low 3 3 Low 3 Low
9 Pipistrellus pipistrellus Jun 65 Moderate-High 70 Moderate-High 3 12 Medium 12 Medium
9 Pipistrellus pipistrellus Jul 64 Moderate-High 64 Moderate-High 3 12 Medium 12 Medium
9 Pipistrellus pipistrellus Aug 69 Moderate-High 99 High 3 12 Medium 15 High
9 Pipistrellus pipistrellus Sep 1 Low 1 Low 3 3 Low 3 Low
9 Pipistrellus pygmaeus Jun 57 Moderate 76 Moderate-High 3 9 Medium 12 Medium
9 Pipistrellus pygmaeus Jul 57 Moderate 87 High 3 9 Medium 15 High
9 Pipistrellus pygmaeus Aug 76 Moderate-High 99 High 3 12 Medium 15 High
9 Pipistrellus pygmaeus Sep 44 Moderate 44 Moderate 3 9 Medium 9 Medium
9 Plecotus auritus Aug 1 Low 1 Low 3 3 Low 3 Low
10 Myotis Jun 44 Moderate 64 Moderate-High 3 9 Medium 12 Medium
10 Myotis Jul 1 Low 61 Moderate-High 3 3 Low 12 Medium
10 Myotis Aug 37 Low-Moderate 88 High 3 6 Medium 15 High
10 Myotis daubentonii Jun 30 Low-Moderate 30 Low-Moderate 3 6 Medium 6 Medium
10 Nyctalus Jun 56 Moderate 79 Moderate-High 3 9 Medium 12 Medium
10 Nyctalus Jul 61 Moderate-High 64 Moderate-High 3 12 Medium 12 Medium
10 Nyctalus Aug 51 Moderate 82 High 3 9 Medium 15 High
10 Pipistrellus pipistrellus Jun 90 High 96 High 3 15 High 15 High
10 Pipistrellus pipistrellus Jul 84 High 93 High 3 15 High 15 High
10 Pipistrellus pipistrellus Aug 91 High 98 High 3 15 High 15 High
10 Pipistrellus pipistrellus Sep 51 Moderate 51 Moderate 3 9 Medium 9 Medium
10 Pipistrellus pygmaeus Jun 81 High 93 High 3 15 High 15 High
10 Pipistrellus pygmaeus Jul 90 High 94 High 3 15 High 15 High
10 Pipistrellus pygmaeus Aug 90 High 99 High 3 15 High 15 High

28 | P a g e
Location
ID Species Month Median Percentile
Median
Activity Category (Taken from Table
4-1)
Maximum Percentile
Maximum
Activity Category (Taken from Table 4-1)
Site Risk
(Taken from Table 4-5)
Overall Median Category Score (Taken from Table 4-6)
Overall Median Category Score
Overall Maximum Category Score (Taken from Table 4-6)
Overall Maximum Category Score
10 Pipistrellus pygmaeus Sep 75 Moderate-High 75 Moderate-High 3 12 Medium 12 Medium
10 Plecotus auritus Jun 1 Low 1 Low 3 3 Low 3 Low
11 Myotis Jul 1 Low 44 Moderate 3 3 Low 9 Medium
11 Myotis Aug 1 Low 30 Low-Moderate 3 3 Low 6 Medium
11 Myotis daubentonii Jun 1 Low 1 Low 3 3 Low 3 Low
11 Nyctalus Jun 41 Moderate 51 Moderate 3 9 Medium 9 Medium
11 Nyctalus Jul 44 Moderate 51 Moderate 3 9 Medium 9 Medium
11 Nyctalus Aug 48 Moderate 90 High 3 9 Medium 15 High
11 Nyctalus Sep 1 Low 1 Low 3 3 Low 3 Low
11 Pipistrellus pipistrellus Jun 61 Moderate-High 73 Moderate-High 3 12 Medium 12 Medium
11 Pipistrellus pipistrellus Jul 70 Moderate-High 76 Moderate-High 3 12 Medium 12 Medium
11 Pipistrellus pipistrellus Aug 68 Moderate-High 92 High 3 12 Medium 15 High
11 Pipistrellus pipistrellus Sep 51 Moderate 51 Moderate 3 9 Medium 9 Medium
11 Pipistrellus pygmaeus Jun 30 Low-Moderate 57 Moderate 3 6 Medium 9 Medium
11 Pipistrellus pygmaeus Jul 30 Low-Moderate 67 Moderate-High 3 6 Medium 12 Medium
11 Pipistrellus pygmaeus Aug 67 Moderate-High 92 High 3 12 Medium 15 High
11 Pipistrellus pygmaeus Sep 1 Low 1 Low 3 3 Low 3 Low
11 Plecotus auritus Aug 1 Low 1 Low 3 3 Low 3 Low
12 Myotis Jul 30 Low-Moderate 30 Low-Moderate 3 6 Medium 6 Medium
12 Myotis Aug 30 Low-Moderate 51 Moderate 3 6 Medium 9 Medium
12 Myotis Sep 1 Low 1 Low 3 3 Low 3 Low
12 Nyctalus Jun 83 High 94 High 3 15 High 15 High
12 Nyctalus Jul 44 Moderate 67 Moderate-High 3 9 Medium 12 Medium
12 Nyctalus Aug 61 Moderate-High 73 Moderate-High 3 12 Medium 12 Medium
12 Nyctalus Sep 1 Low 1 Low 3 3 Low 3 Low
12 Pipistrellus pipistrellus Jun 1 Low 67 Moderate-High 3 3 Low 12 Medium
12 Pipistrellus pipistrellus Jul 30 Low-Moderate 64 Moderate-High 3 6 Medium 12 Medium

29 | P a g e
Location
ID Species Month Median Percentile
Median
Activity Category (Taken from Table
4-1)
Maximum Percentile
Maximum
Activity Category (Taken from Table 4-1)
Site Risk
(Taken from Table 4-5)
Overall Median Category Score (Taken from Table 4-6)
Overall Median Category Score
Overall Maximum Category Score (Taken from Table 4-6)
Overall Maximum Category Score
12 Pipistrellus pipistrellus Aug 48 Moderate 89 High 3 9 Medium 15 High
12 Pipistrellus pygmaeus Jun 51 Moderate 67 Moderate-High 3 9 Medium 12 Medium
12 Pipistrellus pygmaeus Jul 51 Moderate 61 Moderate-High 3 9 Medium 12 Medium
12 Pipistrellus pygmaeus Aug 67 Moderate-High 98 High 3 12 Medium 15 High
12 Pipistrellus pygmaeus Sep 30 Low-Moderate 30 Low-Moderate 3 6 Medium 6 Medium
13 Myotis Jun 1 Low 44 Moderate 3 3 Low 9 Medium
13 Myotis Jul 30 Low-Moderate 57 Moderate 3 6 Medium 9 Medium
13 Myotis Aug 48 Moderate 73 Moderate-High 3 9 Medium 12 Medium
13 Myotis Sep 64 Moderate-High 64 Moderate-High 3 12 Medium 12 Medium
13 Myotis daubentonii Jul 1 Low 1 Low 3 3 Low 3 Low
13 Myotis daubentonii Aug 1 Low 30 Low-Moderate 3 3 Low 6 Medium
13 Nyctalus Jun 72 Moderate-High 89 High 3 12 Medium 15 High
13 Nyctalus Jul 30 Low-Moderate 72 Moderate-High 3 6 Medium 12 Medium
13 Nyctalus Aug 51 Moderate 70 Moderate-High 3 9 Medium 12 Medium
13 Nyctalus Sep 57 Moderate 57 Moderate 3 9 Medium 9 Medium
13 Pipistrellus pipistrellus Jun 86 High 97 High 3 15 High 15 High
13 Pipistrellus pipistrellus Jul 90 High 99 High 3 15 High 15 High
13 Pipistrellus pipistrellus Aug 89 High 97 High 3 15 High 15 High
13 Pipistrellus pipistrellus Sep 83 High 83 High 3 15 High 15 High
13 Pipistrellus pygmaeus Jun 83 High 94 High 3 15 High 15 High
13 Pipistrellus pygmaeus Jul 90 High 97 High 3 15 High 15 High
13 Pipistrellus pygmaeus Aug 90 High 98 High 3 15 High 15 High
13 Pipistrellus pygmaeus Sep 82 High 82 High 3 15 High 15 High
13 Plecotus auritus Jun 1 Low 30 Low-Moderate 3 3 Low 6 Medium
13 Plecotus auritus Aug 1 Low 1 Low 3 3 Low 3 Low
14 Myotis Aug 1 Low 1 Low 3 3 Low 3 Low
14 Nyctalus Jul 33 Low-Moderate 33 Low-Moderate 3 6 Medium 6 Medium

30 | P a g e
Location
ID Species Month Median Percentile
Median
Activity Category (Taken from Table
4-1)
Maximum Percentile
Maximum
Activity Category (Taken from Table 4-1)
Site Risk
(Taken from Table 4-5)
Overall Median Category Score (Taken from Table 4-6)
Overall Median Category Score
Overall Maximum Category Score (Taken from Table 4-6)
Overall Maximum Category Score
14 Nyctalus Aug 33 Low-Moderate 66 Moderate-High 3 6 Medium 12 Medium
14 Pipistrellus pipistrellus Jul 33 Low-Moderate 33 Low-Moderate 3 6 Medium 6 Medium
14 Pipistrellus pipistrellus Aug 47 Moderate 85 High 3 9 Medium 15 High
14 Pipistrellus pygmaeus Aug 47 Moderate 76 Moderate-High 3 9 Medium 12 Medium
15 Myotis Aug 1 Low 1 Low 3 3 Low 3 Low
15 Nyctalus Aug 17 Low 47 Moderate 3 3 Low 9 Medium
15 Pipistrellus pipistrellus Aug 33 Low-Moderate 61 Moderate-High 3 6 Medium 12 Medium
15 Pipistrellus pygmaeus Aug 1 Low 56 Moderate 3 3 Low 9 Medium

CUMBERHEAD WEST WIND FARM