Embed Size (px)
Citation preview
DIAZINON A-1
APPENDIX A. ATSDR MINIMAL RISK LEVELS AND WORKSHEETS
The Comprehensive Environmental Response, Compensation, and Liability Act (CERCLA) [42 U.S.C.
9601 et seq.], as amended by the Superfund Amendments and Reauthorization Act (SARA) [Pub. L. 99–
499], requires that the Agency for Toxic Substances and Disease Registry (ATSDR) develop jointly with
the U.S. Environmental Protection Agency (EPA), in order of priority, a list of hazardous substances most
commonly found at facilities on the CERCLA National Priorities List (NPL); prepare toxicological
profiles for each substance included on the priority list of hazardous substances; and assure the initiation
of a research program to fill identified data needs associated with the substances.
The toxicological profiles include an examination, summary, and interpretation of available toxicological
information and epidemiologic evaluations of a hazardous substance. During the development of
toxicological profiles, Minimal Risk Levels (MRLs) are derived when reliable and sufficient data exist to
identify the target organ(s) of effect or the most sensitive health effect(s) for a specific duration for a
given route of exposure. An MRL is an estimate of the daily human exposure to a hazardous substance
that is likely to be without appreciable risk of adverse noncancer health effects over a specified duration
of exposure. MRLs are based on noncancer health effects only and are not based on a consideration of
cancer effects. These substance-specific estimates, which are intended to serve as screening levels, are
used by ATSDR health assessors to identify contaminants and potential health effects that may be of
concern at hazardous waste sites. It is important to note that MRLs are not intended to define clean-up or
action levels.
MRLs are derived for hazardous substances using the no-observed-adverse-effect level/uncertainty factor
approach. They are below levels that might cause adverse health effects in the people most sensitive to
such chemical-induced effects. MRLs are derived for acute (1–14 days), intermediate (15–364 days), and
chronic (365 days and longer) durations and for the oral and inhalation routes of exposure. Currently,
MRLs for the dermal route of exposure are not derived because ATSDR has not yet identified a method
suitable for this route of exposure. MRLs are generally based on the most sensitive chemical-induced end
point considered to be of relevance to humans. Serious health effects (such as irreparable damage to the
liver or kidneys, or birth defects) are not used as a basis for establishing MRLs. Exposure to a level
above the MRL does not mean that adverse health effects will occur.
MRLs are intended only to serve as a screening tool to help public health professionals decide where to
look more closely. They may also be viewed as a mechanism to identify those hazardous waste sites that
DIAZINON A-2
APPENDIX A
are not expected to cause adverse health effects. Most MRLs contain a degree of uncertainty because of
the lack of precise toxicological information on the people who might be most sensitive (e.g., infants,
elderly, nutritionally or immunologically compromised) to the effects of hazardous substances. ATSDR
uses a conservative (i.e., protective) approach to address this uncertainty consistent with the public health
principle of prevention. Although human data are preferred, MRLs often must be based on animal studies
because relevant human studies are lacking. In the absence of evidence to the contrary, ATSDR assumes
that humans are more sensitive to the effects of hazardous substance than animals and that certain persons
may be particularly sensitive. Thus, the resulting MRL may be as much as 100-fold below levels that
have been shown to be nontoxic in laboratory animals.
Proposed MRLs undergo a rigorous review process: Health Effects/MRL Workgroup reviews within the
Division of Toxicology and Environmental Medicine, expert panel peer reviews, and agency-wide MRL
Workgroup reviews, with participation from other federal agencies and comments from the public. They
are subject to change as new information becomes available concomitant with updating the toxicological
profiles. Thus, MRLs in the most recent toxicological profiles supersede previously published levels.
For additional information regarding MRLs, please contact the Division of Toxicology and
Environmental Medicine, Agency for Toxic Substances and Disease Registry, 1600 Clifton Road NE,
Mailstop F-32, Atlanta, Georgia 30333.
DIAZINON A-3
APPENDIX A
MINIMAL RISK LEVEL (MRL) WORKSHEET
Chemical Name: Diazinon CAS Numbers: 333-41-5 Date: June 2008 Profile Status: Final Draft Post-Public Comment Route: [X] Inhalation [ ] Oral Duration: [ ] Acute [X] Intermediate [ ] Chronic Graph Key: 5 Species: Rat
Minimal Risk Level: 0.01 [ ] mg/kg/day [X] mg/m3
Reference: Hartman HR. 1990. 21-Day repeated exposure inhalation toxicity in the rat. EPA guidelines no. 82-4. Laboratory study number 891205. Ciba-Geigy Corporation. Submitted to the U.S. Environmental Protection Agency. MRID41557402.
Experimental design: Four groups of albino rats (10/sex) were exposed (nose only) to aerosols of diazinon (in ethanol) at concentrations of 0, 0.05, 0.46, 1.57, or 11.6 mg/m3 for 6 hours/day, 5 days/week for 3 weeks. Particle size analysis was performed to ensure that the test aerosols were in the respirable range for the rat. Two control groups were used, one exposed to humidified filtered air only and the other to the carrier vehicle ethanol. The test substance was the liquid MG-8 formulation (88% diazinon). Exposure levels were monitored by gas chromatography. Clinical examinations included ophthalmology, body weight, food consumption, hematology, and blood chemistry (including plasma ChE and RBC AChE activity). At necropsy, organ weights and brain AChE activity were assessed and histopathological examinations were performed on nasal tissues and lungs from all groups and on the spleen, heart, liver, kidney, adrenal gland, and any tissue with gross lesions from the control and 11.6 mg/m3 groups.
Effect noted in study and corresponding doses: No deaths or changes in body weights or food consumption were observed. Piloerection was noted in most animals, particularly during the first week of exposure, the incidence gradually declining during weeks 2 and 3 of exposure. This sign was neither exposure- nor dose-related and no clinical signs of organophosphate toxicity were observed. No exposure-related ophthalmoscopic or histopathological lesions were found. There were no statistically significant exposure-related effects on hematological parameters, although minimally lower values for erythrocyte count, hemoglobin, and packed red cell volume were observed in female rats of the highest exposure level. A significantly higher lung-to-body weight ratio was observed in female rats of the 0.46 and 1.57 mg/m3 exposure levels, but not at the highest exposure level. The toxicological significance of this effect is uncertain because no histopathological evidence of exposure-related lung lesions was found. As shown in Table A-1, significant reductions in plasma ChE (marker for exposure) were seen in males at exposure levels ≥1.57 mg/m3 and females at exposure levels ≥0.46 mg/m3. Organophosphate-induced plasma ChE inhibition is typically observed at exposure levels lower than those inducing measurable RBC or brain AChE inhibition. Plasma ChE inhibition is used as an indicator of exposure, but does not serve as a reliable indicator of a neurotoxic effect. Therefore, plasma ChE inhibition was not considered relevant to the selection of the critical effect for diazinon. However, inhibition of RBC AChE and brain AChE represents a relevant neurological effect. In the principal study (Hartman 1990), significant reductions in RBC AChE activity (surrogate marker for neural AChE activity) were seen in male rats at 11.6 mg/m3 and in female rats at 1.57 and 11.6 mg/m3 (Table A-1). Treatment-related 20–59% RBC or brain AChE inhibition is considered to represent a less serious adverse effect in the absence of more clear indicators of neurotoxicity (Chou and Williams-Johnson 1998). The 10% RBC AChE inhibition observed in the 1.57 mg/m3 group of female rats is below the level of inhibition considered to represent an adverse effect. Therefore, the 1.57 mg/m3 exposure level is a
DIAZINON A-4
APPENDIX A
NOAEL and the highest exposure level (11.6 mg/m3) is the lowest-observed-adverse-effect level (LOAEL) for 36 and 39% RBC AChE inhibition in the male and female rats, respectively. There was no significant difference between brain AChE activity in any of the exposure groups of male rats and that of vehicle controls. All diazinon-exposed groups of female rats exhibited significantly decreased brain AChE activity, relative to vehicle controls. The report of significantly increased brain AChE inhibition in the female rats of all exposure levels is indicative of an inherent problem with the brain data set, perhaps related to tissue collection or quantitative analysis of enzymatic activity in the brain tissue of the female rats. Furthermore, results of repeated oral dosing (Singh 1988) indicate that the male and female rats are comparably sensitive to diazinon-induced effects on both RBC and brain AChE activity. Therefore, the report (Hartman 1990) of significant brain AChE inhibition in the female rats exposed to diazinon by inhalation at levels much lower than the LOAEL of 11.6 mg/m3 for RBC AChE inhibition is questionable and a clear LOAEL for brain AChE inhibition cannot be determined.
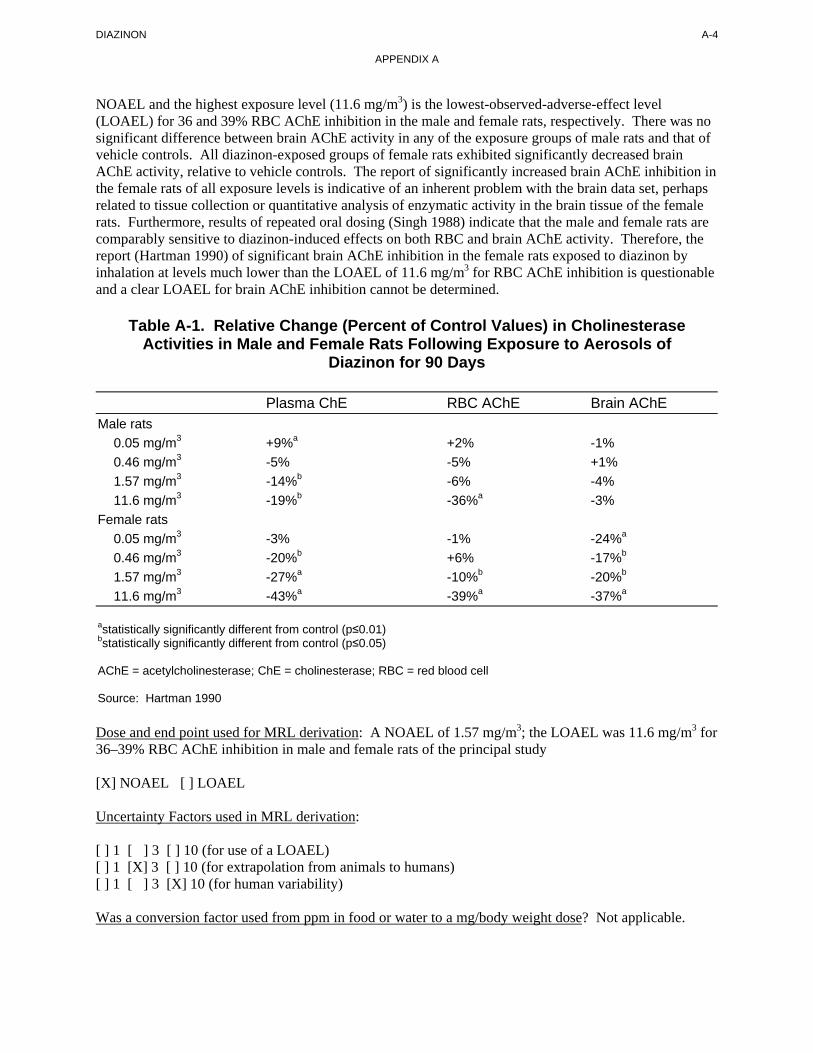
Table A-1. Relative Change (Percent of Control Values) in Cholinesterase Activities in Male and Female Rats Following Exposure to Aerosols of
Diazinon for 90 Days
Plasma ChE RBC AChE Brain AChE Male rats 0.05 mg/m3 +9%a +2% -1% 0.46 mg/m3 -5% -5% +1% 1.57 mg/m3 -14%b -6% -4% 11.6 mg/m3 -19%b -36%a -3% Female rats 0.05 mg/m3 -3% -1% -24%a
0.46 mg/m3 -20%b +6% -17%b
1.57 mg/m3 -27%a -10%b -20%b
11.6 mg/m3 -43%a -39%a -37%a
astatistically significantly different from control (p≤0.01) bstatistically significantly different from control (p≤0.05)
AChE = acetylcholinesterase; ChE = cholinesterase; RBC = red blood cell
Source: Hartman 1990
Dose and end point used for MRL derivation: A NOAEL of 1.57 mg/m3; the LOAEL was 11.6 mg/m3 for 36–39% RBC AChE inhibition in male and female rats of the principal study
[X] NOAEL [ ] LOAEL
Uncertainty Factors used in MRL derivation:
[ ] 1 [ ] 3 [ ] 10 (for use of a LOAEL)[ ] 1 [X] 3 [ ] 10 (for extrapolation from animals to humans) [ ] 1 [ ] 3 [X] 10 (for human variability)
Was a conversion factor used from ppm in food or water to a mg/body weight dose? Not applicable.
DIAZINON A-5
APPENDIX A
If an inhalation study in animals, list conversion factors used in determining human equivalent dose: The NOAEL of 1.57 mg/m3 was adjusted for intermittent exposure as follows:
NOAELADJ = 1.57 mg diazinon/m3 x 6 hours/24 hours x 5 days/7 days = 0.28 mg diazinon/m3
A regional deposited dose ratio (RDDRER) of 1.558 for extrarespiratory effects was used to extrapolate from rats to humans. The RDDRER was calculated using EPA’s software (Version 2.3) (EPA 1994b) for calculating RDDRs and the parameters listed in Table A-2.
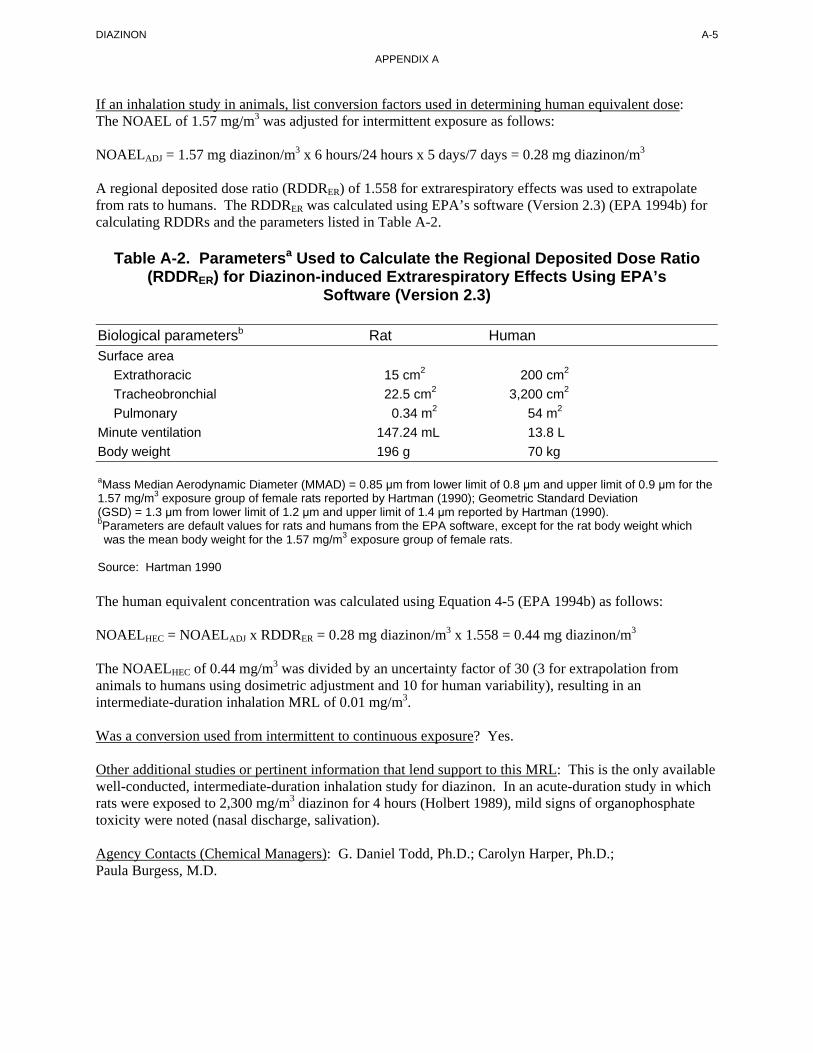
Table A-2. Parametersa Used to Calculate the Regional Deposited Dose Ratio (RDDRER) for Diazinon-induced Extrarespiratory Effects Using EPA’s
Software (Version 2.3)
Biological parametersb Rat Human Surface area Extrathoracic 15 cm2 200 cm2
Tracheobronchial 22.5 cm2 3,200 cm2
Pulmonary 0.34 m2 54 m2
Minute ventilation 147.24 mL 13.8 L Body weight 196 g 70 kg
aMass Median Aerodynamic Diameter (MMAD) = 0.85 μm from lower limit of 0.8 μm and upper limit of 0.9 μm for the 1.57 mg/m3 exposure group of female rats reported by Hartman (1990); Geometric Standard Deviation (GSD) = 1.3 μm from lower limit of 1.2 μm and upper limit of 1.4 μm reported by Hartman (1990). bParameters are default values for rats and humans from the EPA software, except for the rat body weight which was the mean body weight for the 1.57 mg/m3 exposure group of female rats.
Source: Hartman 1990
The human equivalent concentration was calculated using Equation 4-5 (EPA 1994b) as follows:
NOAELHEC = NOAELADJ x RDDRER = 0.28 mg diazinon/m3 x 1.558 = 0.44 mg diazinon/m3
The NOAELHEC of 0.44 mg/m3 was divided by an uncertainty factor of 30 (3 for extrapolation from animals to humans using dosimetric adjustment and 10 for human variability), resulting in an intermediate-duration inhalation MRL of 0.01 mg/m3.
Was a conversion used from intermittent to continuous exposure? Yes.
Other additional studies or pertinent information that lend support to this MRL: This is the only available well-conducted, intermediate-duration inhalation study for diazinon. In an acute-duration study in which rats were exposed to 2,300 mg/m3 diazinon for 4 hours (Holbert 1989), mild signs of organophosphate toxicity were noted (nasal discharge, salivation).
Agency Contacts (Chemical Managers): G. Daniel Todd, Ph.D.; Carolyn Harper, Ph.D.; Paula Burgess, M.D.
DIAZINON A-6
APPENDIX A
MINIMAL RISK LEVEL (MRL) WORKSHEET
Chemical Name: Diazinon CAS Numbers: 333-41-5 Date: June 2008 Profile Status: Final Draft Post-Public Comment Route: [ ] Inhalation [X] Oral Duration: [X] Acute [ ] Intermediate [ ] Chronic Graph Key: 23 Species: Rat
Minimal Risk Level: 0.006 [X] mg/kg/day [ ] mg/m3
Reference: Davies DB, Holub BJ. 1980a. Toxicological evaluation of dietary diazinon in the rat. Arch Environ Contam Toxicol 9(6):637-650.
Experimental design: Groups of female Wistar rats (50/group) were exposed to diazinon (99.2% purity) in the diet at concentrations of 0, 5, 10, or 15 ppm for 92 days. Interim assessments of neurological end points included treatment day 12 assessment, which represents acute-duration oral exposure. Blood samples were collected on treatment days 3, 8, and 12 from 10 rats/group for assessment of plasma ChE and RBC AChE activity. Other groups of similarly-treated rats were sacrificed (n=6) for assessment of brain AChE activity. All rats were assessed daily for clinical signs of neurotoxicity and body weights and food intake were monitored throughout the treatment period. The study authors reported starting mean body weight (0.139 kg), mean body weight gain (0.00163 kg/day), and mean food consumption (0.0178 kg/day) for all rats, and indicated that they did not significantly differ among treatment groups. Using the average body weight gain for 12 days (0.00163 kg/day x 12 days=0.02 kg), the average body weight for the 12-day period was equal to the starting body weight (0.139 kg) plus one-half the body weight gain during the 12-day period (0.5x0.02 kg)=0.149 kg. The diazinon dose equals the product of the diazinon concentration in food times the mean daily food consumption divided by the average body weight. Calculated in this manner, the doses to the 5-, 10-, and 15-ppm exposure groups were 0.6, 1.2, and 1.8 mg/kg/day, respectively.
Effect noted in study and corresponding doses: No clinical signs of toxicity were observed in any of the treated groups. Compared to controls, significant plasma ChE inhibition was observed in all diazinontreated groups at all timepoints (including treatment days 3, 8, and 12). At treatment day 12, treatment-related effects included 43, 70, and 73% plasma ChE inhibition and 5, 22, and 33% RBC AChE inhibition in the 0.6, 1.2, and 1.8 mg/kg/day dose groups, respectively. There was no significant effect on brain AChE activity. Plasma ChE inhibition is used as an indicator of exposure, but does not serve as a reliable indicator of a neurotoxic effect. Therefore, plasma ChE inhibition was not considered relevant to the selection of the critical effect for diazinon. However, inhibition of RBC AChE and brain AChE represents a relevant neurological effect. Treatment-related 20–59% RBC or brain AChE inhibition is considered to represent a less serious adverse effect in the absence of more clear indicators of neurotoxicity. The principal study (Davies and Holub 1980a) identified a NOAEL of 0.6 mg/kg/day and a LOAEL of 1.2 mg/kg/day for 22% RBC AChE inhibition at interim day 12 assessment of female rats administered diazinon in the diet for 92 days.
Dose and end point used for MRL derivation: A NOAEL of 0.6 mg/kg/day; the LOAEL was 1.2 mg/kg/day for 22% RBC AChE inhibition
[X] NOAEL [ ] LOAEL
DIAZINON A-7
APPENDIX A
Uncertainty Factors used in MRL derivation:
[ ] 1 [ ] 3 [ ] 10 (for use of a LOAEL)[ ] 1 [ ] 3 [X] 10 (for extrapolation from animals to humans) [ ] 1 [ ] 3 [X] 10 (for human variability)
Was a conversion factor used from ppm in food or water to a mg/body weight dose? Doses were calculated from reported mean values for initial body weight, food consumption, and body weight gain for the first 12 days of treatment.
If an inhalation study in animals, list conversion factors used in determining human equivalent dose: Not applicable.
Was a conversion used from intermittent to continuous exposure? Not applicable.
Other additional studies or pertinent information that lend support to this MRL: In an unpublished study (EPA 1996), male and female rats were administered diazinon in the diet for 28 days and assessed for cholinesterase inhibition at weeks 1, 2, and 4. A dose of 2.4 mg/kg/day resulted in 38–59% RBC AChE inhibition in both males and females, which was observed as early as week 1 and peaked at week 2. The next lower dose (0.02 mg/kg/day) represented a NOAEL. The principal study for deriving the acute-duration oral MRL for diazinon (Davies and Holub 1980a) was performed using only female rats. However, Davies and Holub (1980a) noted that dietary studies in their laboratory had demonstrated that female rats were more sensitive than male rats to diazinon induced plasma ChE and RBC and brain AChE inhibition. In light of this finding, the selection of RBC AChE inhibition in the female rats as the critical effect from the principal study that assessed the critical effect only in female rats (Davies and Holub 1980a) is appropriate.
Agency Contacts (Chemical Managers): G. Daniel Todd, Ph.D.; Carolyn Harper, Ph.D.; Paula Burgess, M.D.
DIAZINON A-8
APPENDIX A
MINIMAL RISK LEVEL (MRL) WORKSHEET
Chemical name: Diazinon CAS number(s): 333-41-5 Date: June 2008 Profile Status: Final Draft Post-Public Comment Route: [ ] Inhalation [X] Oral Duration: [ ] Acute [X] Intermediate [ ] Chronic Key to figure: 63 Species: Rat
Minimal Risk Level: 0.002 [X] mg/kg/day [ ] ppm [ ] mg/m3
Reference: Davies DB, Holub BJ. 1980a. Toxicological evaluation of dietary diazinon in the rat. Arch Environ Contam Toxicol 9(6):637-650.
Note: Available intermediate-duration oral (dietary) toxicity studies of diazinon include 10 studies in rats and 2 studies in dogs (see Table A-4, page A-14, for a summary of NOAELs and LOAELs for RBC and brain AChE inhibition identified in these studies). Although dose spacing is variable, and in some studies may be in excess of 100-fold for levels at or below identified LOAELs for AChE inhibition, these studies collectively indicate that the threshold for less serious AChE inhibition occurs in rats and dogs at repeated oral dose levels between 0.2 and 2 mg/kg/day. The report of Davies and Holub (1980a) includes results from separate 35-, 42-, and 92-day studies.
Experimental design: In the principal study, groups of female Wistar rats (16/group) were exposed to diazinon (99.2% purity) in the diet at concentrations of 0, 1, 2, 3, or 4 ppm for 42 days (Davies and Holub 1980a). Blood samples were collected periodically from 10 rats/group for assessment of plasma ChE and RBC AChE activity. Six rats per group were sacrificed on day 35 for assessment of brain AChE activity. All rats were assessed daily for clinical signs of neurotoxicity and body weights and food intake were monitored throughout the treatment period. The study authors stated that female rats were used in the study because they were noted to be more sensitive than male rats to the neurotoxic effects of diazinon. The study authors reported starting mean body weight (0.149 kg), mean body weight gain (0.00259 kg/day), and mean food consumption (0.0178 kg/day) for all rats, and indicated that they did not significantly differ among treatment groups. Using the average body weight gain for 42 days (0.00259 kg/day x 42 days=0.11 kg), the average body weight for the 42-day period was equal to the starting body weight (0.149 kg) plus one-half the body weight gain during the 42-day period (0.5x0.11 kg)=0.2 kg. The diazinon dose equals the product of the diazinon concentration in food times the mean daily food consumption divided by the average body weight. Calculated in this manner, the doses to the 1-, 2-, 3-, and 4-ppm exposure groups were 0.09, 0.18, 0.27, and 0.36 mg/kg/day.
Effects noted in study and corresponding doses: No clinical signs of toxicity were observed in any of the treated groups (Davies and Holub 1980a). Significant plasma ChE inhibition was observed at most timepoints in all diazinon-treated groups, relative to controls. The magnitude of inhibition in all treatment groups increased with time and appeared to peak around day 35, remaining near the peak level for the remaining 7 treatment days. Maximum plasma ChE inhibition in the 1, 2, 3, and 4 ppm treatment groups was approximately 35, 50, 55, and >60%, respectively. Plasma ChE inhibition is used as an indicator of exposure, but does not serve as a reliable indicator of a neurotoxic effect. Therefore, plasma ChE inhibition was not considered relevant to the selection of the critical effect for diazinon. Through treatment day 35, there was no significant treatment-related effect on RBC AChE activity in any of the treatment groups. However, on treatment day 42, significant RBC AChE inhibition was observed at
DIAZINON A-9
APPENDIX A
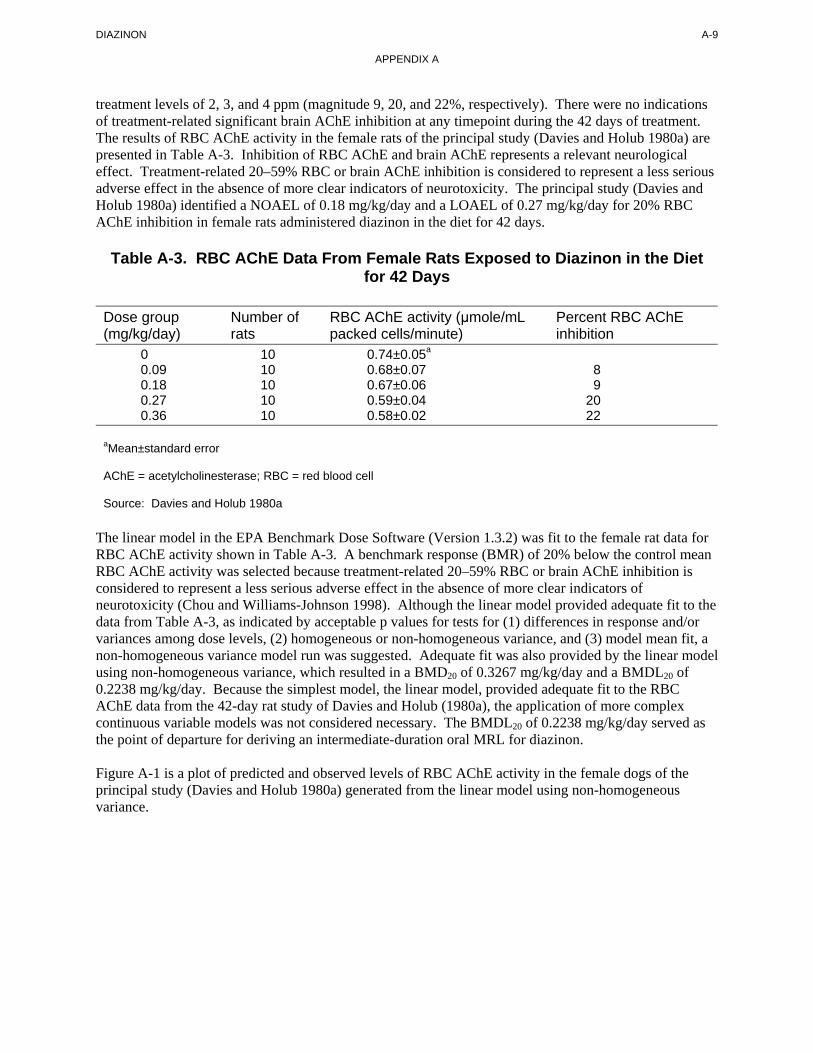
treatment levels of 2, 3, and 4 ppm (magnitude 9, 20, and 22%, respectively). There were no indications of treatment-related significant brain AChE inhibition at any timepoint during the 42 days of treatment. The results of RBC AChE activity in the female rats of the principal study (Davies and Holub 1980a) are presented in Table A-3. Inhibition of RBC AChE and brain AChE represents a relevant neurological effect. Treatment-related 20–59% RBC or brain AChE inhibition is considered to represent a less serious adverse effect in the absence of more clear indicators of neurotoxicity. The principal study (Davies and Holub 1980a) identified a NOAEL of 0.18 mg/kg/day and a LOAEL of 0.27 mg/kg/day for 20% RBC AChE inhibition in female rats administered diazinon in the diet for 42 days.
Table A-3. RBC AChE Data From Female Rats Exposed to Diazinon in the Diet for 42 Days
Dose group Number of RBC AChE activity (μmole/mL Percent RBC AChE (mg/kg/day) rats packed cells/minute) inhibition
0 10 0.74±0.05a
0.09 10 0.68±0.07 8 0.18 10 0.67±0.06 9 0.27 10 0.59±0.04 20 0.36 10 0.58±0.02 22
aMean±standard error
AChE = acetylcholinesterase; RBC = red blood cell
Source: Davies and Holub 1980a
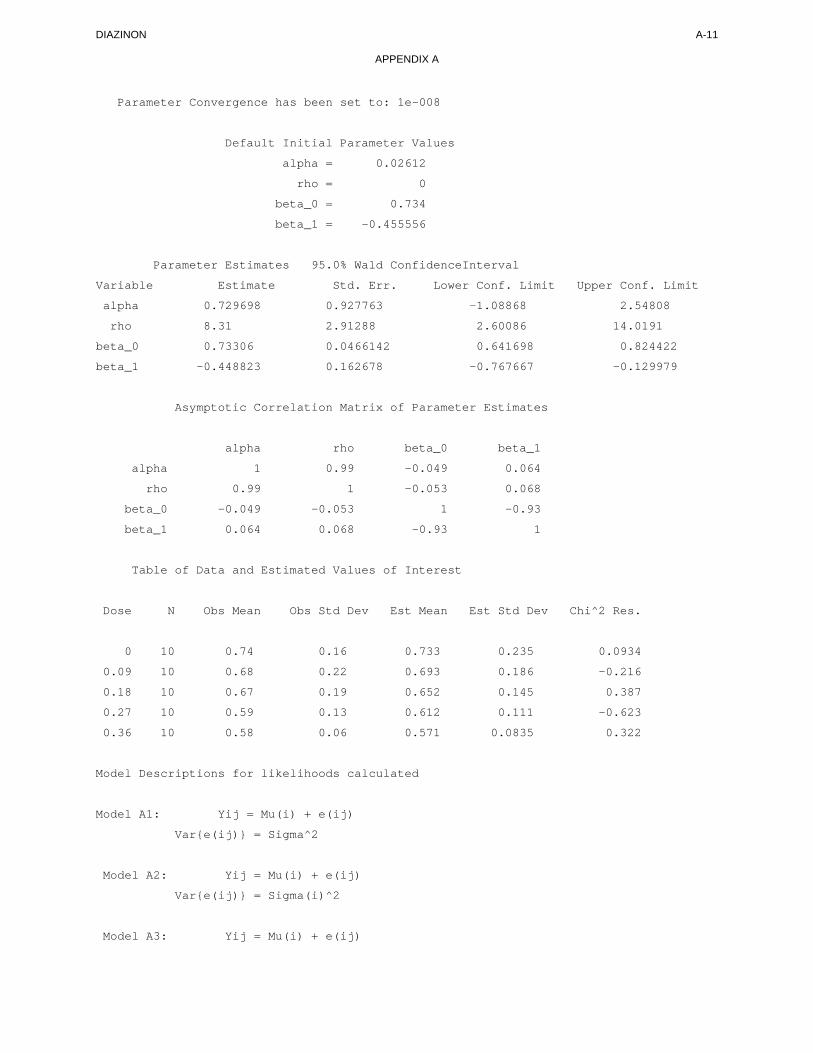
The linear model in the EPA Benchmark Dose Software (Version 1.3.2) was fit to the female rat data for RBC AChE activity shown in Table A-3. A benchmark response (BMR) of 20% below the control mean RBC AChE activity was selected because treatment-related 20–59% RBC or brain AChE inhibition is considered to represent a less serious adverse effect in the absence of more clear indicators of neurotoxicity (Chou and Williams-Johnson 1998). Although the linear model provided adequate fit to the data from Table A-3, as indicated by acceptable p values for tests for (1) differences in response and/or variances among dose levels, (2) homogeneous or non-homogeneous variance, and (3) model mean fit, a non-homogeneous variance model run was suggested. Adequate fit was also provided by the linear model using non-homogeneous variance, which resulted in a BMD20 of 0.3267 mg/kg/day and a BMDL20 of 0.2238 mg/kg/day. Because the simplest model, the linear model, provided adequate fit to the RBC AChE data from the 42-day rat study of Davies and Holub (1980a), the application of more complex continuous variable models was not considered necessary. The BMDL20 of 0.2238 mg/kg/day served as the point of departure for deriving an intermediate-duration oral MRL for diazinon.
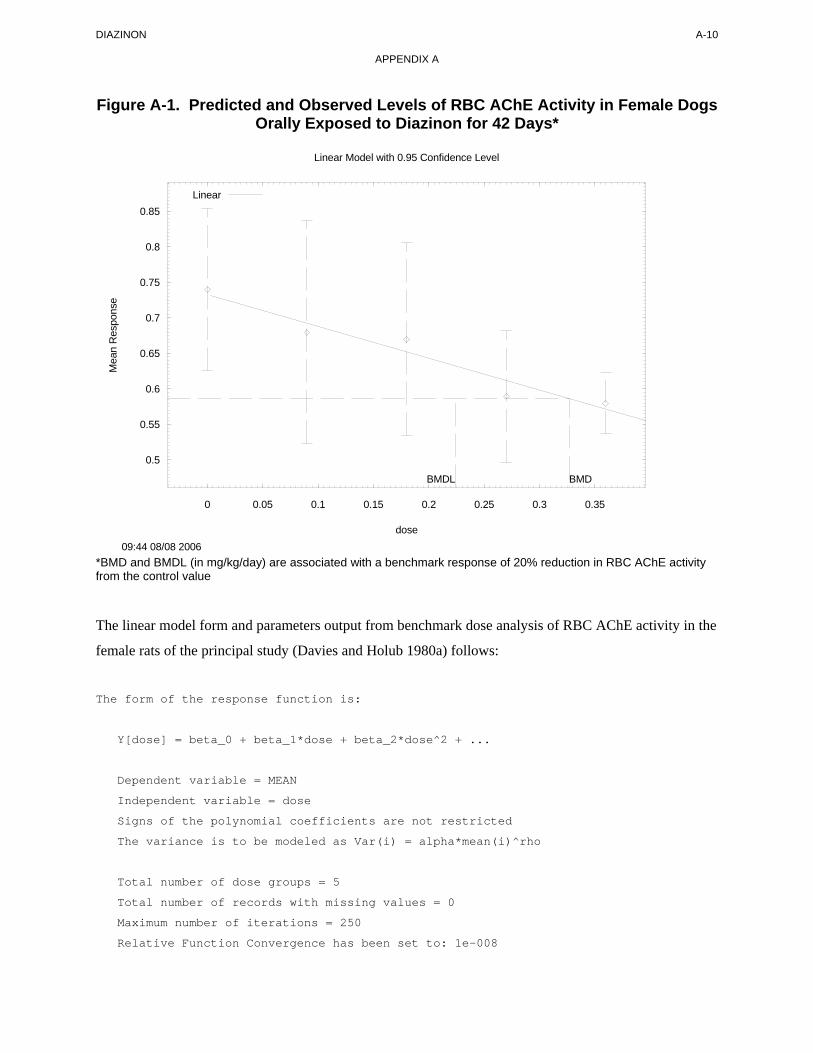
Figure A-1 is a plot of predicted and observed levels of RBC AChE activity in the female dogs of the principal study (Davies and Holub 1980a) generated from the linear model using non-homogeneous variance.
DIAZINON A-10
APPENDIX A
Figure A-1. Predicted and Observed Levels of RBC AChE Activity in Female Dogs Orally Exposed to Diazinon for 42 Days*
Linear Model with 0.95 Confidence Level
Mea
n R
espo
nse
0.85
0.8
0.75
0.7
0.65
0.6
0.55
0.5
0 0.05 0.1 0.15 0.2 0.25 0.3 0.35
BMD BMDL
Linear
dose 09:44 08/08 2006
*BMD and BMDL (in mg/kg/day) are associated with a benchmark response of 20% reduction in RBC AChE activity from the control value
The linear model form and parameters output from benchmark dose analysis of RBC AChE activity in the
female rats of the principal study (Davies and Holub 1980a) follows:
The form of the response function is:
Y[dose] = beta_0 + beta_1*dose + beta_2*dose^2 + ...
Dependent variable = MEAN
Independent variable = dose
Signs of the polynomial coefficients are not restricted
The variance is to be modeled as Var(i) = alpha*mean(i)^rho
Total number of dose groups = 5
Total number of records with missing values = 0
Maximum number of iterations = 250
Relative Function Convergence has been set to: 1e-008
DIAZINON A-11
APPENDIX A
Parameter Convergence has been set to: 1e-008
Default Initial Parameter Values
alpha = 0.02612
rho = 0
beta_0 = 0.734
beta_1 = -0.455556
Parameter Estimates 95.0% Wald ConfidenceInterval
Variable Estimate Std. Err. Lower Conf. Limit
alpha 0.729698 0.927763 -1.08868
rho 8.31 2.91288 2.60086
beta_0 0.73306 0.0466142 0.641698
beta_1 -0.448823 0.162678 -0.767667
Asymptotic Correlation Matrix of Parameter Estimates
alpha rho beta_0 beta_1
alpha 1 0.99 -0.049 0.064
rho 0.99 1 -0.053 0.068
beta_0 -0.049 -0.053 1 -0.93
beta_1 0.064 0.068 -0.93 1
Table of Data and Estimated Values of Interest
Upper Conf. Limit
2.54808
14.0191
0.824422
-0.129979
Chi^2 Res.
0.0934
-0.216
0.387
-0.623
0.322
Dose N Obs Mean Obs Std Dev Est Mean Est Std Dev
0 10 0.74 0.16 0.733 0.235
0.09 10 0.68 0.22 0.693 0.186
0.18 10 0.67 0.19 0.652 0.145
0.27 10 0.59 0.13 0.612 0.111
0.36 10 0.58 0.06 0.571 0.0835
Model Descriptions for likelihoods calculated
Model A1: Yij = Mu(i) + e(ij)
Var{e(ij)} = Sigma^2
Model A2: Yij = Mu(i) + e(ij)
Var{e(ij)} = Sigma(i)^2
Model A3: Yij = Mu(i) + e(ij)
DIAZINON A-12
APPENDIX A
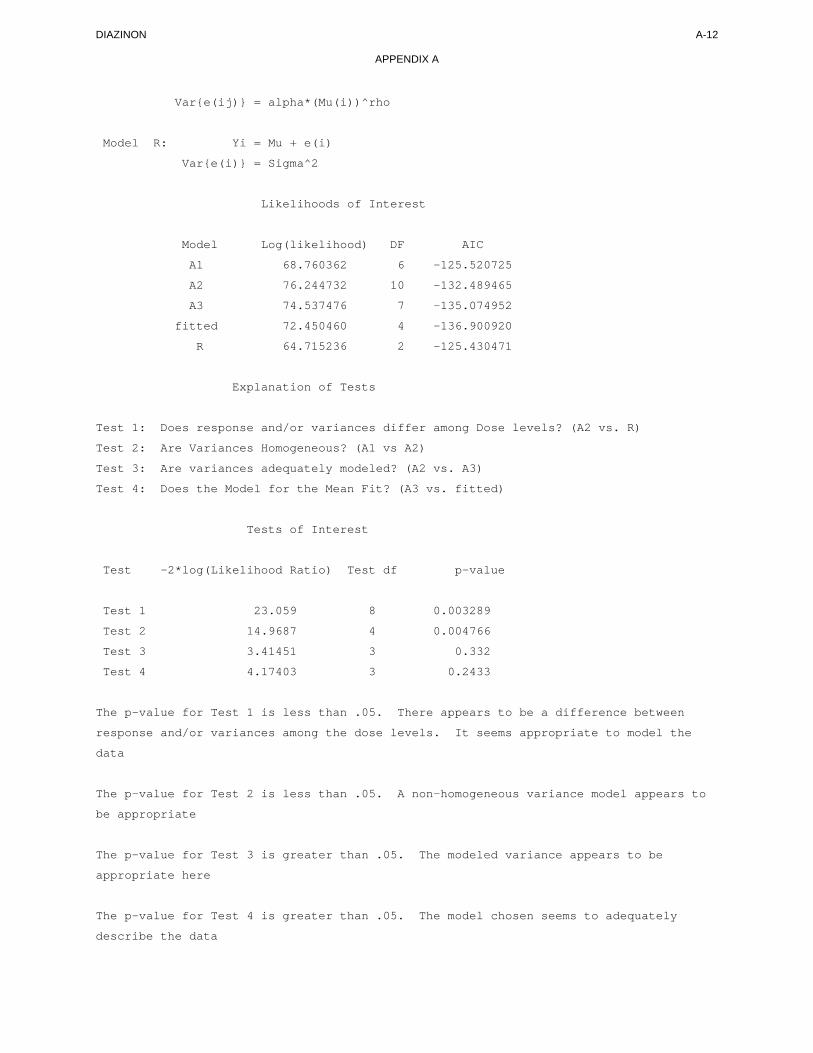
Var{e(ij)} = alpha*(Mu(i))^rho
Model R: Yi = Mu + e(i)
Var{e(i)} = Sigma^2
Likelihoods of Interest
Model Log(likelihood) DF AIC
A1 68.760362 6 -125.520725
A2 76.244732 10 -132.489465
A3 74.537476 7 -135.074952
fitted 72.450460 4 -136.900920
R 64.715236 2 -125.430471
Explanation of Tests
Test 1: Does response and/or variances differ among Dose levels? (A2 vs. R)
Test 2: Are Variances Homogeneous? (A1 vs A2)
Test 3: Are variances adequately modeled? (A2 vs. A3)
Test 4: Does the Model for the Mean Fit? (A3 vs. fitted)
Tests of Interest
Test -2*log(Likelihood Ratio) Test df p-value
Test 1 23.059 8 0.003289
Test 2 14.9687 4 0.004766
Test 3 3.41451 3 0.332
Test 4 4.17403 3 0.2433
The p-value for Test 1 is less than .05. There appears to be a difference between
response and/or variances among the dose levels. It seems appropriate to model the
data
The p-value for Test 2 is less than .05. A non-homogeneous variance model appears to
be appropriate
The p-value for Test 3 is greater than .05. The modeled variance appears to be
appropriate here
The p-value for Test 4 is greater than .05. The model chosen seems to adequately
describe the data
DIAZINON A-13
APPENDIX A
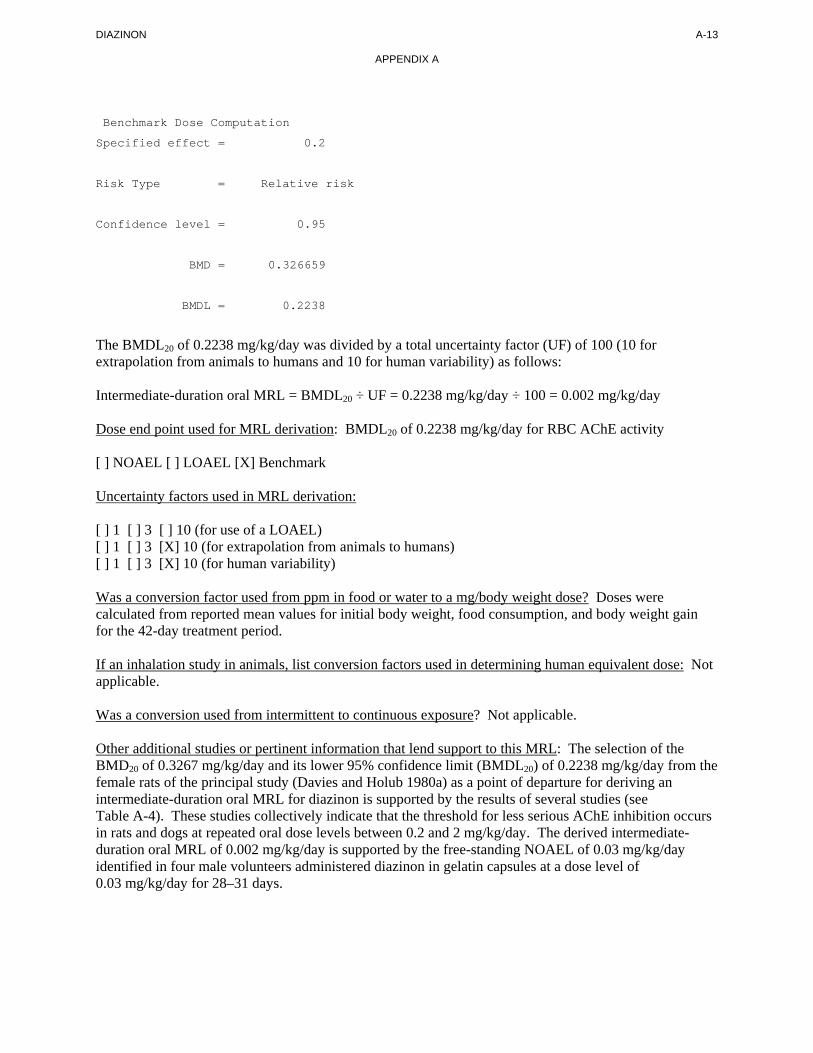
Benchmark Dose Computation
Specified effect = 0.2
Risk Type = Relative risk
Confidence level = 0.95
BMD = 0.326659
BMDL = 0.2238
The BMDL20 of 0.2238 mg/kg/day was divided by a total uncertainty factor (UF) of 100 (10 for extrapolation from animals to humans and 10 for human variability) as follows:
Intermediate-duration oral MRL = BMDL20 ÷ UF = 0.2238 mg/kg/day ÷ 100 = 0.002 mg/kg/day
Dose end point used for MRL derivation: BMDL20 of 0.2238 mg/kg/day for RBC AChE activity
[ ] NOAEL [ ] LOAEL [X] Benchmark
Uncertainty factors used in MRL derivation:
[ ] 1 [ ] 3 [ ] 10 (for use of a LOAEL)[ ] 1 [ ] 3 [X] 10 (for extrapolation from animals to humans) [ ] 1 [ ] 3 [X] 10 (for human variability)
Was a conversion factor used from ppm in food or water to a mg/body weight dose? Doses were calculated from reported mean values for initial body weight, food consumption, and body weight gain for the 42-day treatment period.
If an inhalation study in animals, list conversion factors used in determining human equivalent dose: Not applicable.
Was a conversion used from intermittent to continuous exposure? Not applicable.
Other additional studies or pertinent information that lend support to this MRL: The selection of the BMD20 of 0.3267 mg/kg/day and its lower 95% confidence limit (BMDL20) of 0.2238 mg/kg/day from the female rats of the principal study (Davies and Holub 1980a) as a point of departure for deriving an intermediate-duration oral MRL for diazinon is supported by the results of several studies (see Table A-4). These studies collectively indicate that the threshold for less serious AChE inhibition occurs in rats and dogs at repeated oral dose levels between 0.2 and 2 mg/kg/day. The derived intermediate-duration oral MRL of 0.002 mg/kg/day is supported by the free-standing NOAEL of 0.03 mg/kg/day identified in four male volunteers administered diazinon in gelatin capsules at a dose level of 0.03 mg/kg/day for 28–31 days.
DIAZINON A-14
APPENDIX A
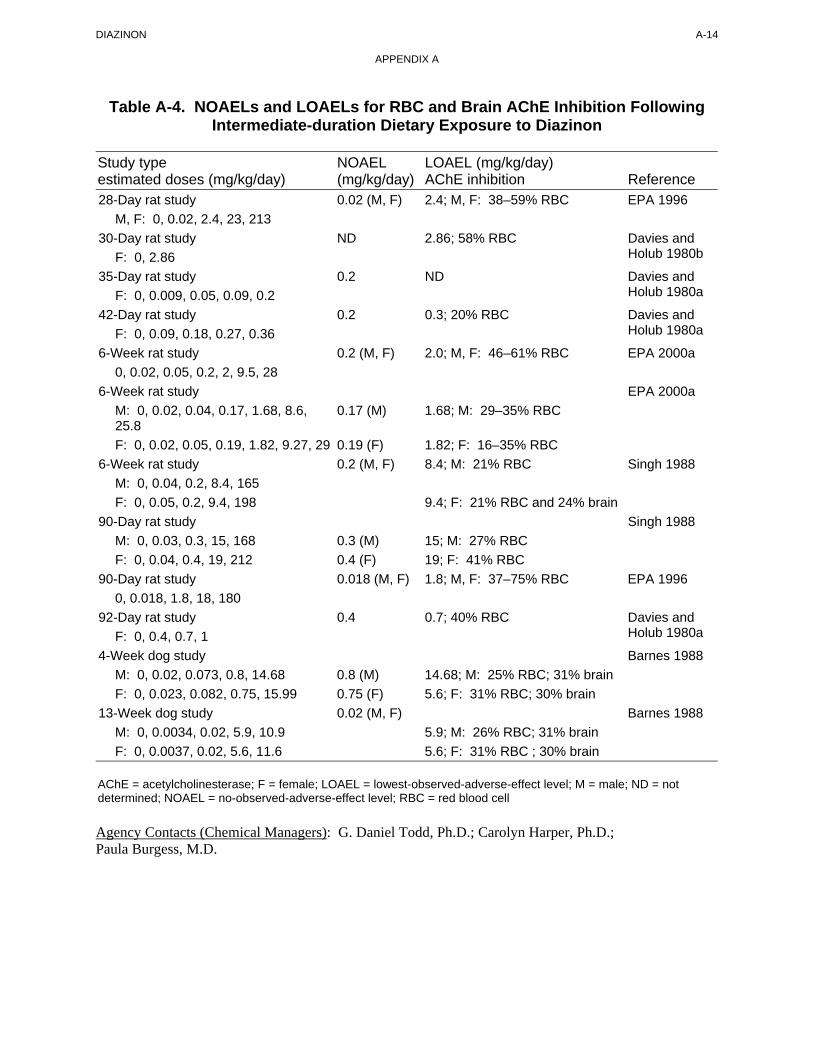
Table A-4. NOAELs and LOAELs for RBC and Brain AChE Inhibition Following Intermediate-duration Dietary Exposure to Diazinon
Study type NOAEL LOAEL (mg/kg/day) estimated doses (mg/kg/day) (mg/kg/day) AChE inhibition Reference 28-Day rat study 0.02 (M, F) 2.4; M, F: 38–59% RBC EPA 1996
M, F: 0, 0.02, 2.4, 23, 213 30-Day rat study ND 2.86; 58% RBC Davies and
F: 0, 2.86 Holub 1980b
35-Day rat study 0.2 ND Davies and F: 0, 0.009, 0.05, 0.09, 0.2 Holub 1980a
42-Day rat study 0.2 0.3; 20% RBC Davies and F: 0, 0.09, 0.18, 0.27, 0.36 Holub 1980a
6-Week rat study 0.2 (M, F) 2.0; M, F: 46–61% RBC EPA 2000a 0, 0.02, 0.05, 0.2, 2, 9.5, 28
6-Week rat study EPA 2000a M: 0, 0.02, 0.04, 0.17, 1.68, 8.6, 0.17 (M) 1.68; M: 29–35% RBC 25.8 F: 0, 0.02, 0.05, 0.19, 1.82, 9.27, 29 0.19 (F) 1.82; F: 16–35% RBC
6-Week rat study 0.2 (M, F) 8.4; M: 21% RBC Singh 1988 M: 0, 0.04, 0.2, 8.4, 165 F: 0, 0.05, 0.2, 9.4, 198 9.4; F: 21% RBC and 24% brain
90-Day rat study Singh 1988 M: 0, 0.03, 0.3, 15, 168 0.3 (M) 15; M: 27% RBC F: 0, 0.04, 0.4, 19, 212 0.4 (F) 19; F: 41% RBC
90-Day rat study 0.018 (M, F) 1.8; M, F: 37–75% RBC EPA 1996 0, 0.018, 1.8, 18, 180
92-Day rat study 0.4 0.7; 40% RBC Davies and F: 0, 0.4, 0.7, 1 Holub 1980a
4-Week dog study Barnes 1988 M: 0, 0.02, 0.073, 0.8, 14.68 0.8 (M) 14.68; M: 25% RBC; 31% brain F: 0, 0.023, 0.082, 0.75, 15.99 0.75 (F) 5.6; F: 31% RBC; 30% brain
13-Week dog study 0.02 (M, F) Barnes 1988 M: 0, 0.0034, 0.02, 5.9, 10.9 5.9; M: 26% RBC; 31% brain F: 0, 0.0037, 0.02, 5.6, 11.6 5.6; F: 31% RBC ; 30% brain
AChE = acetylcholinesterase; F = female; LOAEL = lowest-observed-adverse-effect level; M = male; ND = not determined; NOAEL = no-observed-adverse-effect level; RBC = red blood cell
Agency Contacts (Chemical Managers): G. Daniel Todd, Ph.D.; Carolyn Harper, Ph.D.; Paula Burgess, M.D.
DIAZINON A-15
APPENDIX A
MINIMAL RISK LEVEL (MRL) WORKSHEET
Chemical Name: Diazinon CAS Numbers: 333-41-5 Date: June 2008 Profile Status: Final Draft Post-Public Comment Route: [ ] Inhalation [X] Oral Duration: [ ] Acute [ ] Intermediate [X] Chronic Graph Key: 91 Species: Rat
Minimal Risk Level: 0.0007 [X] mg/kg/day [ ] mg/m3
Reference: Kirchner FR, McCormick GC, Arthur AT. 1991. One/two year oral toxicity study in rats. Ciba-Geigy Corporation. Submitted to the U.S. Environmental Protection Agency. MRID41942002.
Experimental design: (human study details or strain, number of animals per exposure/control group, sex, dose administration details): Diazinon MG-8 (purity 87.7%) was dissolved in acetone vehicle and added to the diet of male and female Sprague-Dawley rats at concentrations of 0, 0.1, 1.5, 125, or 250 ppm for up to 98 weeks. The study included both untreated and vehicle control groups. According to the study report, the corresponding doses were 0, 0.004, 0.06, 5, and 10 mg/kg/day for males and 0, 0.005, 0.07, 6, and 12 mg/kg/day for females). Averaged among male and female rats, the corresponding doses were 0, 0.0045, 0.065, 5.5, and 11 mg/kg/day. Twenty rats/sex/group were treated for the full 98 weeks. Ten rats/sex/group were treated for 52 weeks and sacrificed for interim assessment. Additional groups of 10 rats/sex were assigned to the untreated control, vehicle control, and 250 ppm groups and assessed for recovery 45 days following 52 weeks of treatment. Animals were observed daily for clinical signs of toxicity. Food consumption, water intake, and body weights were monitored. Ophthalmoscopic examinations were performed during weeks 2, 51, and 97 or 98. Blood was collected at several timepoints between days 88 and 684. Ten animals/sex/group from the 98-week treatment groups received clinical chemistry evaluation at treatment days 88, 181, 356, 390, 552, and 684. Urinalysis was performed on all surviving rats of the 98-week treatment groups at treatment days 81, 189, 350, 545, and 679. All rats were subjected to comprehensive gross and microscopic pathologic examination at death or sacrifice.
Effect noted in study and corresponding doses: There were no apparent treatment-related effects on survival, food or water consumption, body weights, or hematological or urinalysis parameters examined. Due to mortality in all groups including controls the study was terminated at 97 weeks. Ophthalmoscopic and gross and microscopic examinations did not reveal evidence of dose-related effects. The major findings of this study were those of dose-related decreased plasma ChE and RBC and brain AChE activity in both male and female rats. Significantly decreased plasma ChE activity (28–51% lower than controls) was noted in 0.065 mg/kg/day male rats at treatment days 88 and 684, but not at treatment days 181, 356, or 552 and in 0.065 mg/kg/day female rats (approximately 50% lower than controls) at most timepoints. High-dose male and female rats consistently exhibited significantly decreased plasma ChE activity, ranging from 80 to 97% lower than controls. In 0.065 mg/kg/day groups, RBC and brain AChE activity was not significantly decreased at any timepoint. The 5.5 mg/kg/day groups exhibited significantly decreased RBC AChE activity at all timepoints, ranging in magnitude from 15 to 28% and from 22 to 25% in males and females, respectively. At the 5.5 and 11 mg/kg/day levels, the magnitude of the effect did not appear to increase with either duration of treatment or increased dose. Following 52 weeks of treatment and 45 days of recovery, RBC AChE activity had returned to control levels in high-dose male rats and to within 7% of control levels in high-dose female rats. Brain AChE activity was significantly decreased in 5.5 and 11 mg/kg/day male and female rats. In 5.5 and 11 mg/kg/day males, the magnitude
DIAZINON A-16
APPENDIX A
of the effect was effect was 24 and 42%, respectively, after 684 days of treatment, but not significantly different from controls at 370 days. In 5.5 and 11 mg/kg/day female rats, the effect was noted at both 370- and 684-day timepoints; the magnitude of the effect was >24% at 5.5 mg/kg/day and >40% at 11 mg/kg/day. This study identified a NOAEL of 0.065 mg/kg/day (1.5 ppm of diazinon in the diet) and a LOAEL of 5.5 mg/kg/day (125 ppm of diazinon in the diet) for 22–28% decreased RBC AChE activity in male and female rats administered diazinon in the diet for up to 97 weeks, which is considered the critical effect. The effect was observed as early as day 88 of treatment and did not appear to increase in magnitude with duration of treatment.
Dose and end point used for MRL derivation: A NOAEL of 0.065 mg/kg/day; the LOAEL was 5.5 mg/kg/day for 22–28% decreased RBC AChE activity
[X] NOAEL [ ] LOAEL
Uncertainty Factors used in MRL derivation:
[ ] 1 [ ] 3 [ ] 10 (for use of a LOAEL)[ ] 1 [ ] 3 [X] 10 (for extrapolation from animals to humans) [ ] 1 [ ] 3 [X] 10 (for human variability)
Was a conversion factor used from ppm in food or water to a mg/body weight dose? Estimated doses were included in the original study.
If an inhalation study in animals, list conversion factors used in determining human equivalent dose: Not applicable.
Was a conversion used from intermittent to continuous exposure? Not applicable.
Other additional studies or pertinent information that lend support to this MRL: Groups of 5-month-old male and female Beagle dogs (4/sex/group) were administered diazinon MG-8 (87.7% purity) in the diet for 52 weeks at concentrations of 0, 0.1, 0.5, 150, or 300 ppm (Rudzki et al. 1991). The highest dose level was reduced to 225 ppm after 14 weeks due to the lack of body weight gain at the 300 ppm level. According to the study authors, the corresponding diazinon doses (adjusted for purity) were 0, 0.0032, 0.015, 4.7, and 7.7 mg/kg/day for the males and 0, 0.0037, 0.02, 4.5, and 9.1 mg/kg/day for the females. Averaged among male and female dogs, the corresponding doses were 0, 0.0034, 0.017, 4.6, and 7.9 mg/kg/day. Animals were observed daily for clinical signs of toxicity. Food consumption and body weights were monitored throughout the study. Physical, auditory, and ophthalmoscopic examinations were periodically performed. Blood and urine were collected 4 weeks prior to dosing and during treatment weeks 13, 26, 39, and 52 for hematological and clinical chemistry assessment and urinalysis. At death or scheduled sacrifice, organ weights were recorded and all animals were subjected to histological examination of all major organs and tissues. One high-dose male was sacrificed on test day 2 and one female in the 0.5 ppm group was found dead on test day 12. Both deaths were attributed to gastrointestinal infections and the animals were replaced. Clinical signs of toxicity were limited to a single high-dose male that exhibited signs of dehydration and emaciation. Although food consumption in all treatment groups of male and female dogs was lower than that of controls at most timepoints during the 52 weeks of treatment, there was no clear pattern of dose-related decreased food consumption. The 4.6 mg/kg/day dose level may represent a LOAEL for body weight gain in the males, but a clear effect level for body weight gain was not identified in females. Plasma ChE inhibition generally exceeded 20% in all dose groups of males and females, with the exception of the 0.0034 mg/kg/day groups. Significant RBC AChE inhibition (magnitude ranging from approximately 21 to 35%) was noted in treated males and females of the two highest exposure groups (4.6 and 7.9 mg/kg/day), but not at lower exposure levels.
DIAZINON A-17
APPENDIX A
Significant brain AChE inhibition was noted at 4.6 and 7.9 mg/kg/day in females (magnitude 25.5 and 34.7%, respectively). High-dose males exhibited 24.8% brain AChE inhibition (not statistically significant). Although serum amylase activity was generally increased in diazinon-treated male and female dogs at most timepoints, the only statistically significant increase occurred in 4.6 mg/kg/day males only at week 52. There were no other treatment-related effects on clinical chemistry parameters examined. Ophthalmoscopic examinations, hematology, and urinalysis did not reveal evidence of treatment-related effects. There were no apparent treatment-related effects on organ weights and extensive gross and microscopic examinations were unremarkable. This study identified a NOAEL of 0.5 ppm (0.017 mg/kg/day) and a LOAEL of 150 ppm (4.6 mg/kg/day) for RBC AChE inhibition of 20% or more in both male and female dogs.
Agency Contacts (Chemical Managers): G. Daniel Todd, Ph.D.; Carolyn Harper, Ph.D.; Paula Burgess, M.D.

DIAZINON A-18
APPENDIX A
This page is intentionally blank.
DIAZINON B-1
APPENDIX B. USER'S GUIDE
Chapter 1
Public Health Statement
This chapter of the profile is a health effects summary written in non-technical language. Its intended audience is the general public, especially people living in the vicinity of a hazardous waste site or chemical release. If the Public Health Statement were removed from the rest of the document, it would still communicate to the lay public essential information about the chemical.
The major headings in the Public Health Statement are useful to find specific topics of concern. The topics are written in a question and answer format. The answer to each question includes a sentence that will direct the reader to chapters in the profile that will provide more information on the given topic.
Chapter 2
Relevance to Public Health
This chapter provides a health effects summary based on evaluations of existing toxicologic, epidemiologic, and toxicokinetic information. This summary is designed to present interpretive, weight-of-evidence discussions for human health end points by addressing the following questions:
1. What effects are known to occur in humans?
2. What effects observed in animals are likely to be of concern to humans?
3. What exposure conditions are likely to be of concern to humans, especially around hazardous waste sites?
The chapter covers end points in the same order that they appear within the Discussion of Health Effects by Route of Exposure section, by route (inhalation, oral, and dermal) and within route by effect. Human data are presented first, then animal data. Both are organized by duration (acute, intermediate, chronic). In vitro data and data from parenteral routes (intramuscular, intravenous, subcutaneous, etc.) are also considered in this chapter.
The carcinogenic potential of the profiled substance is qualitatively evaluated, when appropriate, using existing toxicokinetic, genotoxic, and carcinogenic data. ATSDR does not currently assess cancer potency or perform cancer risk assessments. Minimal Risk Levels (MRLs) for noncancer end points (if derived) and the end points from which they were derived are indicated and discussed.
Limitations to existing scientific literature that prevent a satisfactory evaluation of the relevance to public health are identified in the Chapter 3 Data Needs section.
Interpretation of Minimal Risk Levels
Where sufficient toxicologic information is available, ATSDR has derived MRLs for inhalation and oral routes of entry at each duration of exposure (acute, intermediate, and chronic). These MRLs are not meant to support regulatory action, but to acquaint health professionals with exposure levels at which adverse health effects are not expected to occur in humans.
DIAZINON B-2
APPENDIX B
MRLs should help physicians and public health officials determine the safety of a community living near a chemical emission, given the concentration of a contaminant in air or the estimated daily dose in water. MRLs are based largely on toxicological studies in animals and on reports of human occupational exposure.
MRL users should be familiar with the toxicologic information on which the number is based. Chapter 2, "Relevance to Public Health," contains basic information known about the substance. Other sections such as Chapter 3 Section 3.9, "Interactions with Other Substances,” and Section 3.10, "Populations that are Unusually Susceptible" provide important supplemental information.
MRL users should also understand the MRL derivation methodology. MRLs are derived using a modified version of the risk assessment methodology that the Environmental Protection Agency (EPA) provides (Barnes and Dourson 1988) to determine reference doses (RfDs) for lifetime exposure.
To derive an MRL, ATSDR generally selects the most sensitive end point which, in its best judgement, represents the most sensitive human health effect for a given exposure route and duration. ATSDR cannot make this judgement or derive an MRL unless information (quantitative or qualitative) is available for all potential systemic, neurological, and developmental effects. If this information and reliable quantitative data on the chosen end point are available, ATSDR derives an MRL using the most sensitive species (when information from multiple species is available) with the highest no-observed-adverse-effect level (NOAEL) that does not exceed any adverse effect levels. When a NOAEL is not available, a lowest-observed-adverse-effect level (LOAEL) can be used to derive an MRL, and an uncertainty factor (UF) of 10 must be employed. Additional uncertainty factors of 10 must be used both for human variability to protect sensitive subpopulations (people who are most susceptible to the health effects caused by the substance) and for interspecies variability (extrapolation from animals to humans). In deriving an MRL, these individual uncertainty factors are multiplied together. The product is then divided into the inhalation concentration or oral dosage selected from the study. Uncertainty factors used in developing a substance-specific MRL are provided in the footnotes of the levels of significant exposure (LSE) tables.
Chapter 3
Health Effects
Tables and Figures for Levels of Significant Exposure (LSE)
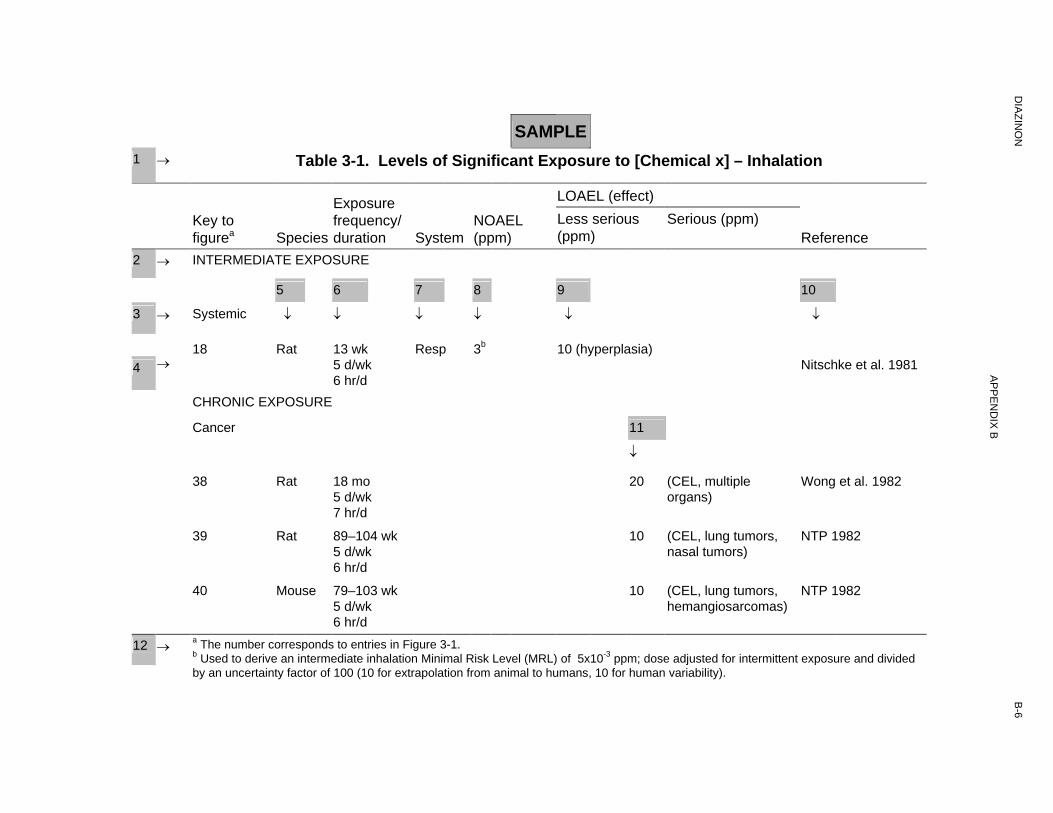
Tables and figures are used to summarize health effects and illustrate graphically levels of exposure associated with those effects. These levels cover health effects observed at increasing dose concentrations and durations, differences in response by species, MRLs to humans for noncancer end points, and EPA's estimated range associated with an upper- bound individual lifetime cancer risk of 1 in 10,000 to 1 in 10,000,000. Use the LSE tables and figures for a quick review of the health effects and to locate data for a specific exposure scenario. The LSE tables and figures should always be used in conjunction with the text. All entries in these tables and figures represent studies that provide reliable, quantitative estimates of NOAELs, LOAELs, or Cancer Effect Levels (CELs).
The legends presented below demonstrate the application of these tables and figures. Representative examples of LSE Table 3-1 and Figure 3-1 are shown. The numbers in the left column of the legends correspond to the numbers in the example table and figure.
DIAZINON B-3
APPENDIX B
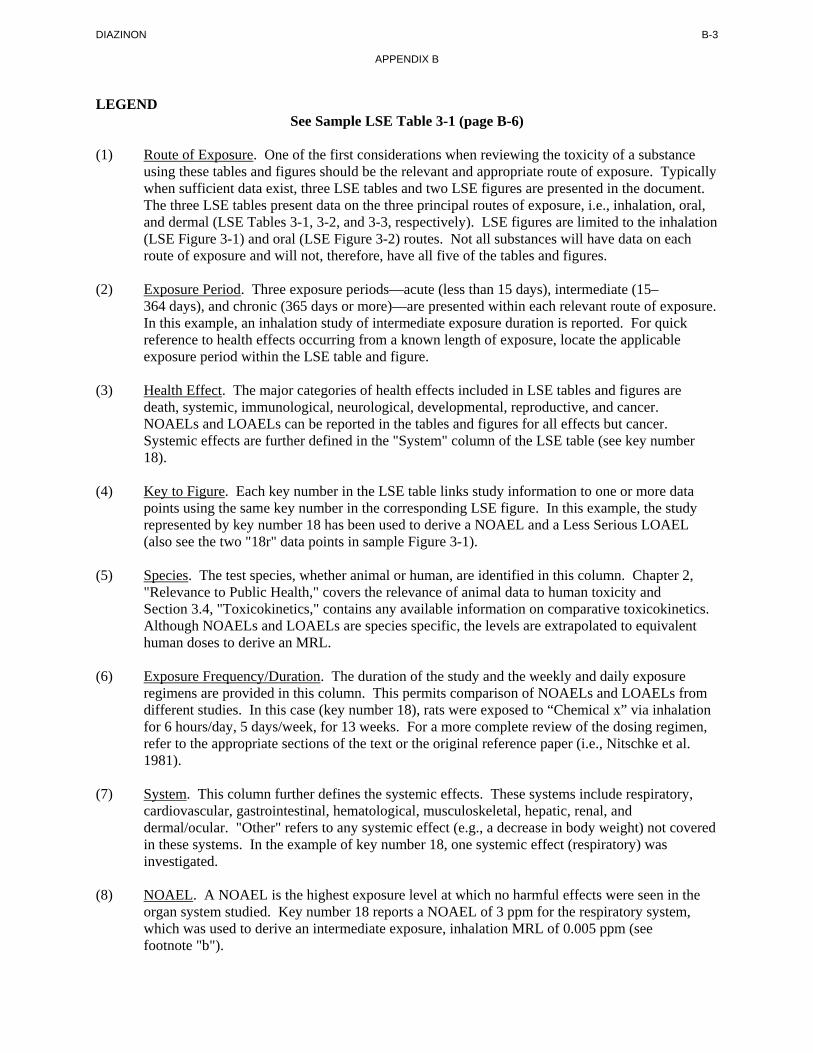
LEGEND See Sample LSE Table 3-1 (page B-6)
(1) Route of Exposure. One of the first considerations when reviewing the toxicity of a substance using these tables and figures should be the relevant and appropriate route of exposure. Typically when sufficient data exist, three LSE tables and two LSE figures are presented in the document. The three LSE tables present data on the three principal routes of exposure, i.e., inhalation, oral, and dermal (LSE Tables 3-1, 3-2, and 3-3, respectively). LSE figures are limited to the inhalation (LSE Figure 3-1) and oral (LSE Figure 3-2) routes. Not all substances will have data on each route of exposure and will not, therefore, have all five of the tables and figures.
(2) Exposure Period. Three exposure periods—acute (less than 15 days), intermediate (15– 364 days), and chronic (365 days or more)—are presented within each relevant route of exposure. In this example, an inhalation study of intermediate exposure duration is reported. For quick reference to health effects occurring from a known length of exposure, locate the applicable exposure period within the LSE table and figure.
(3) Health Effect. The major categories of health effects included in LSE tables and figures are death, systemic, immunological, neurological, developmental, reproductive, and cancer. NOAELs and LOAELs can be reported in the tables and figures for all effects but cancer. Systemic effects are further defined in the "System" column of the LSE table (see key number 18).
(4) Key to Figure. Each key number in the LSE table links study information to one or more data points using the same key number in the corresponding LSE figure. In this example, the study represented by key number 18 has been used to derive a NOAEL and a Less Serious LOAEL (also see the two "18r" data points in sample Figure 3-1).
(5) Species. The test species, whether animal or human, are identified in this column. Chapter 2, "Relevance to Public Health," covers the relevance of animal data to human toxicity and Section 3.4, "Toxicokinetics," contains any available information on comparative toxicokinetics. Although NOAELs and LOAELs are species specific, the levels are extrapolated to equivalent human doses to derive an MRL.
(6) Exposure Frequency/Duration. The duration of the study and the weekly and daily exposure regimens are provided in this column. This permits comparison of NOAELs and LOAELs from different studies. In this case (key number 18), rats were exposed to “Chemical x” via inhalation for 6 hours/day, 5 days/week, for 13 weeks. For a more complete review of the dosing regimen, refer to the appropriate sections of the text or the original reference paper (i.e., Nitschke et al. 1981).
(7) System. This column further defines the systemic effects. These systems include respiratory, cardiovascular, gastrointestinal, hematological, musculoskeletal, hepatic, renal, and dermal/ocular. "Other" refers to any systemic effect (e.g., a decrease in body weight) not covered in these systems. In the example of key number 18, one systemic effect (respiratory) was investigated.
(8) NOAEL. A NOAEL is the highest exposure level at which no harmful effects were seen in the organ system studied. Key number 18 reports a NOAEL of 3 ppm for the respiratory system, which was used to derive an intermediate exposure, inhalation MRL of 0.005 ppm (see footnote "b").
DIAZINON B-4
APPENDIX B
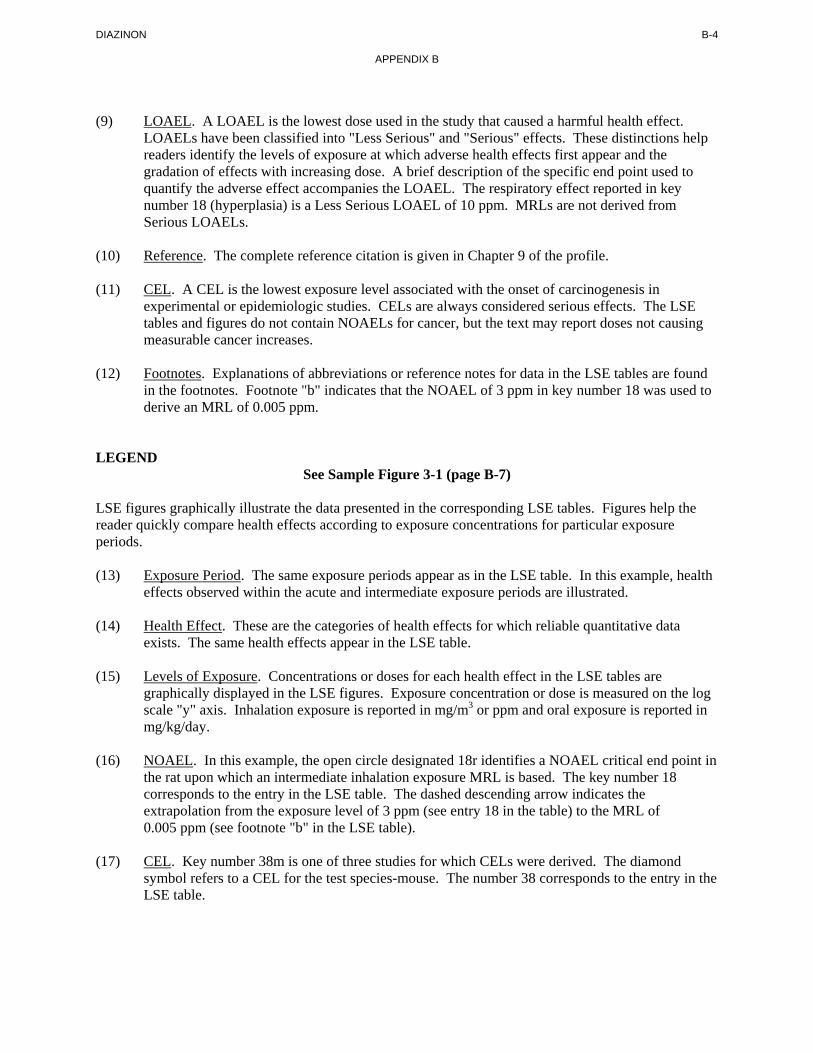
(9) LOAEL. A LOAEL is the lowest dose used in the study that caused a harmful health effect. LOAELs have been classified into "Less Serious" and "Serious" effects. These distinctions help readers identify the levels of exposure at which adverse health effects first appear and the gradation of effects with increasing dose. A brief description of the specific end point used to quantify the adverse effect accompanies the LOAEL. The respiratory effect reported in key number 18 (hyperplasia) is a Less Serious LOAEL of 10 ppm. MRLs are not derived from Serious LOAELs.
(10) Reference. The complete reference citation is given in Chapter 9 of the profile.
(11) CEL. A CEL is the lowest exposure level associated with the onset of carcinogenesis in experimental or epidemiologic studies. CELs are always considered serious effects. The LSE tables and figures do not contain NOAELs for cancer, but the text may report doses not causing measurable cancer increases.
(12) Footnotes. Explanations of abbreviations or reference notes for data in the LSE tables are found in the footnotes. Footnote "b" indicates that the NOAEL of 3 ppm in key number 18 was used to derive an MRL of 0.005 ppm.
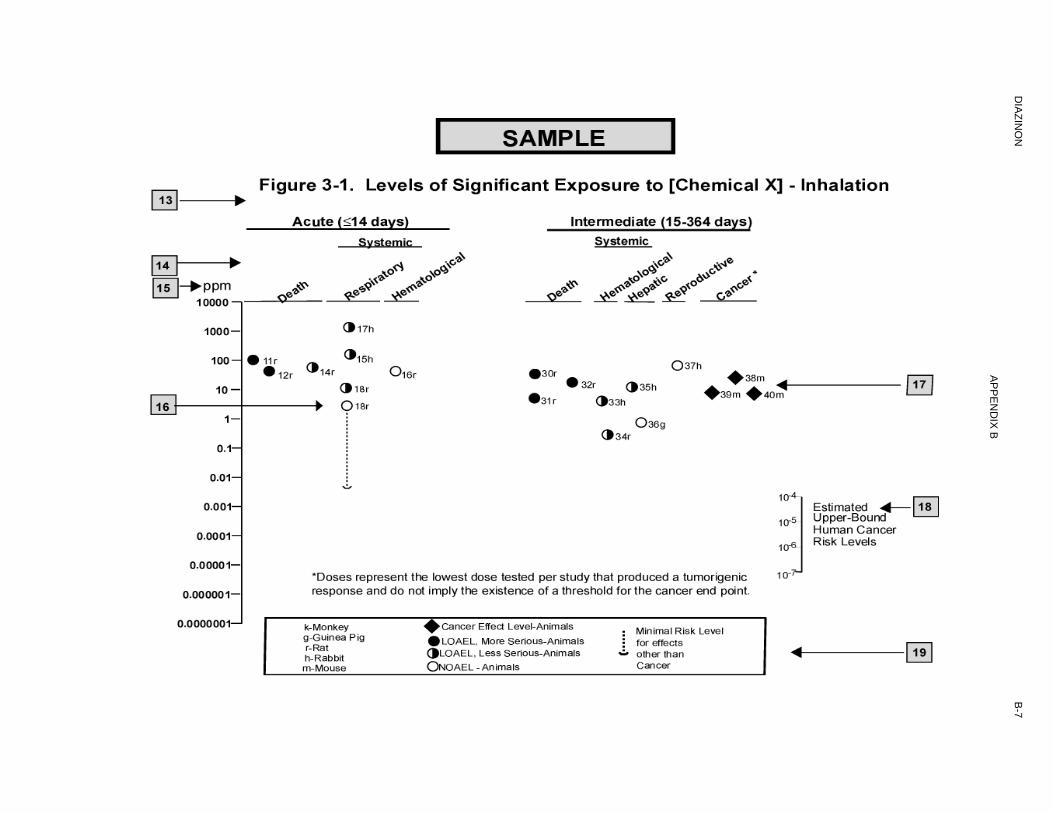
LEGEND See Sample Figure 3-1 (page B-7)
LSE figures graphically illustrate the data presented in the corresponding LSE tables. Figures help the reader quickly compare health effects according to exposure concentrations for particular exposure periods.
(13) Exposure Period. The same exposure periods appear as in the LSE table. In this example, health effects observed within the acute and intermediate exposure periods are illustrated.
(14) Health Effect. These are the categories of health effects for which reliable quantitative data exists. The same health effects appear in the LSE table.
(15) Levels of Exposure. Concentrations or doses for each health effect in the LSE tables are graphically displayed in the LSE figures. Exposure concentration or dose is measured on the log scale "y" axis. Inhalation exposure is reported in mg/m3 or ppm and oral exposure is reported in mg/kg/day.
(16) NOAEL. In this example, the open circle designated 18r identifies a NOAEL critical end point in the rat upon which an intermediate inhalation exposure MRL is based. The key number 18 corresponds to the entry in the LSE table. The dashed descending arrow indicates the extrapolation from the exposure level of 3 ppm (see entry 18 in the table) to the MRL of 0.005 ppm (see footnote "b" in the LSE table).
(17) CEL. Key number 38m is one of three studies for which CELs were derived. The diamond symbol refers to a CEL for the test species-mouse. The number 38 corresponds to the entry in the LSE table.
DIAZINON B-5
APPENDIX B
(18) Estimated Upper-Bound Human Cancer Risk Levels. This is the range associated with the upper-bound for lifetime cancer risk of 1 in 10,000 to 1 in 10,000,000. These risk levels are derived from the EPA's Human Health Assessment Group's upper-bound estimates of the slope of the cancer dose response curve at low dose levels (q1*).
(19) Key to LSE Figure. The Key explains the abbreviations and symbols used in the figure.
SAMPLE 1 → Table 3-1. Levels of Significant Exposure to [Chemical x] – Inhalation
Key to figurea
Exposure frequency/ durationSpecies System
NOAEL (ppm)
LOAEL (effect) Less serious (ppm)
Serious (ppm) Reference
→ INTERMEDIATE EXPOSURE 2
3
4
1098765
→ Systemic ↓ ↓ ↓ ↓ ↓ ↓
→ 13 wk 5 d/wk 6 hr/d
Rat18
CHRONIC EXPOSURE
Resp 3b 10 (hyperplasia) Nitschke et al. 1981
Cancer
↓
38
39
40
Rat
Rat
Mouse
18 mo 5 d/wk 7 hr/d
89–104 wk 5 d/wk 6 hr/d
79–103 wk 5 d/wk 6 hr/d
20
10
10
(CEL, multiple organs)
(CEL, lung tumors, nasal tumors)
(CEL, lung tumors, hemangiosarcomas)
Wong et al. 1982
NTP 1982
NTP 1982
11
12 →a The number corresponds to entries in Figure 3-1. b Used to derive an intermediate inhalation Minimal Risk Level (MRL) of 5x10⁻³ ppm; dose adjusted for intermittent exposure and divided by an uncertainty factor of 100 (10 for extrapolation from animal to humans, 10 for human variability).
DIA
ZINO
N
B-6
AP
PE
ND
IX B
DIA
ZINO
N
B-7
AP
PE
ND
IX B

DIAZINON B-8
APPENDIX B
This page is intentionally blank.

DIAZINON C-1
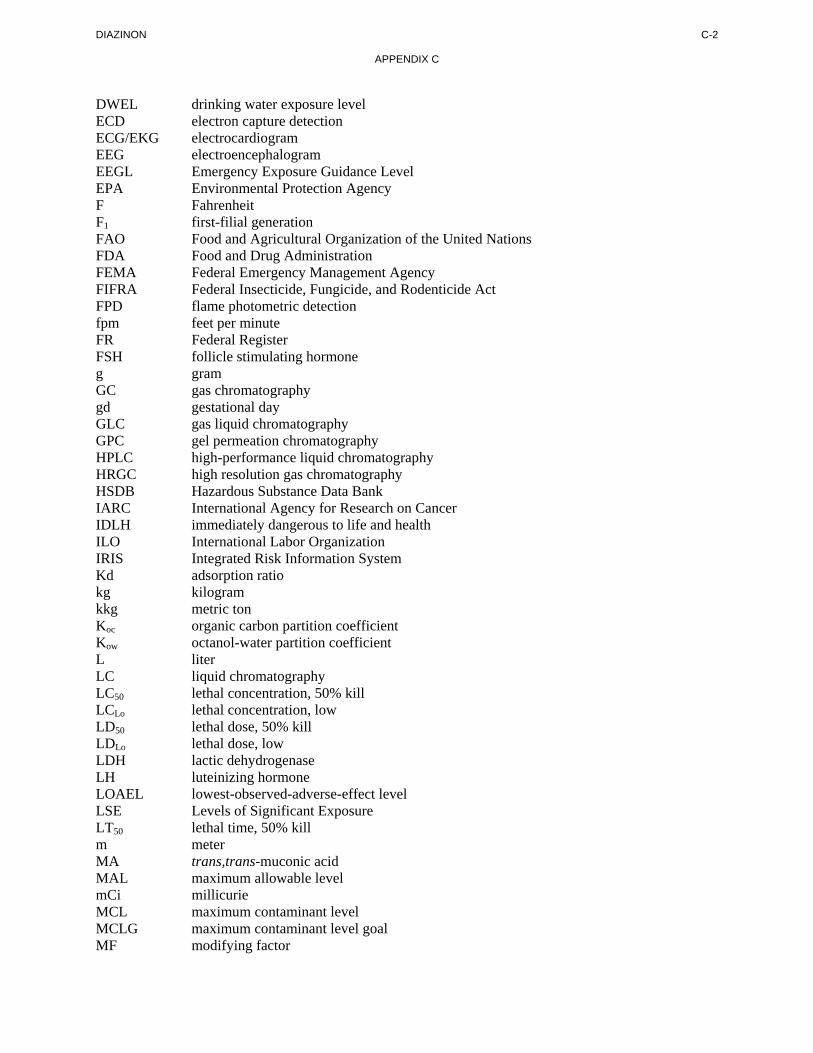
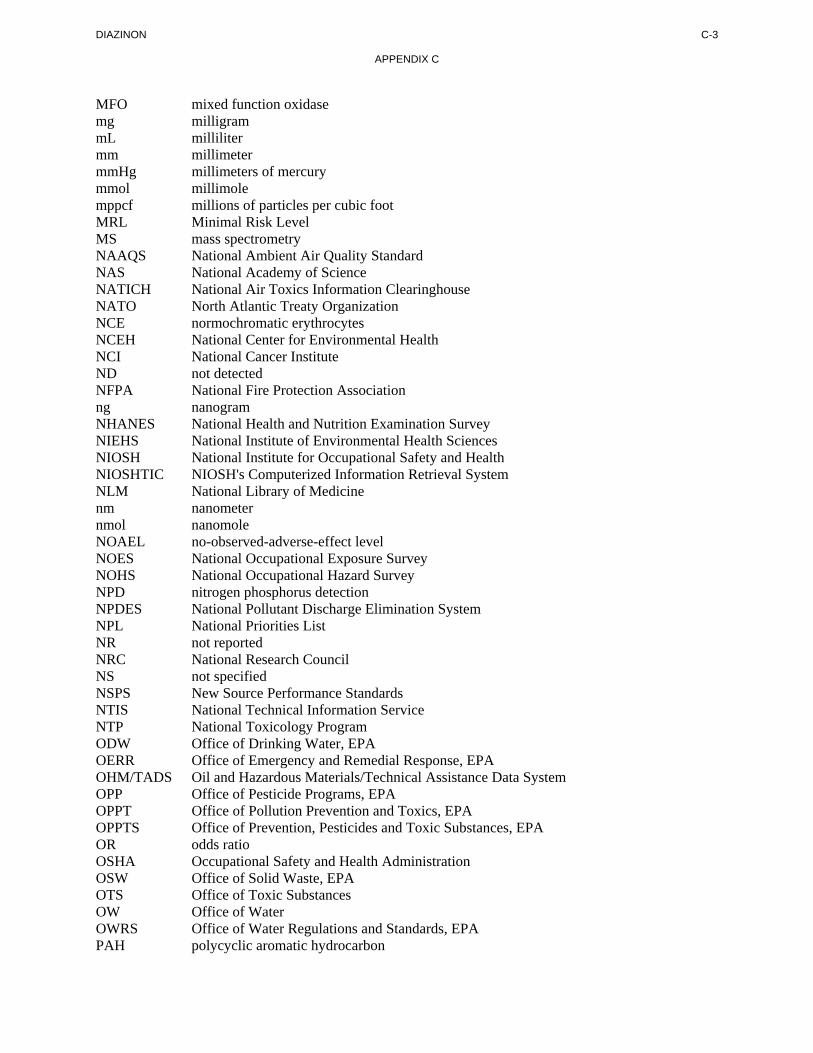
APPENDIX C. ACRONYMS, ABBREVIATIONS, AND SYMBOLS
ACGIH American Conference of Governmental Industrial Hygienists ACOEM American College of Occupational and Environmental Medicine ADI acceptable daily intake ADME absorption, distribution, metabolism, and excretion AED atomic emission detection AFID alkali flame ionization detector AFOSH Air Force Office of Safety and Health ALT alanine aminotransferase AML acute myeloid leukemia AOAC Association of Official Analytical Chemists AOEC Association of Occupational and Environmental Clinics AP alkaline phosphatase APHA American Public Health Association AST aspartate aminotransferase atm atmosphere ATSDR Agency for Toxic Substances and Disease Registry AWQC Ambient Water Quality Criteria BAT best available technology BCF bioconcentration factor BEI Biological Exposure Index BMD benchmark dose BMR benchmark response BSC Board of Scientific Counselors C centigrade CAA Clean Air Act CAG Cancer Assessment Group of the U.S. Environmental Protection Agency CAS Chemical Abstract Services CDC Centers for Disease Control and Prevention CEL cancer effect level CELDS Computer-Environmental Legislative Data System CERCLA Comprehensive Environmental Response, Compensation, and Liability Act CFR Code of Federal Regulations Ci curie CI confidence interval CL ceiling limit value CLP Contract Laboratory Program cm centimeter CML chronic myeloid leukemia CPSC Consumer Products Safety Commission CWA Clean Water Act DHEW Department of Health, Education, and Welfare DHHS Department of Health and Human Services DNA deoxyribonucleic acid DOD Department of Defense DOE Department of Energy DOL Department of Labor DOT Department of Transportation DOT/UN/ Department of Transportation/United Nations/
NA/IMCO North America/Intergovernmental Maritime Dangerous Goods Code
DIAZINON C-2
APPENDIX C
DWEL drinking water exposure level ECD electron capture detection ECG/EKG electrocardiogram EEG electroencephalogram EEGL Emergency Exposure Guidance Level EPA Environmental Protection Agency F Fahrenheit F1 first-filial generation FAO Food and Agricultural Organization of the United Nations FDA Food and Drug Administration FEMA Federal Emergency Management Agency FIFRA Federal Insecticide, Fungicide, and Rodenticide Act FPD flame photometric detection fpm feet per minute FR Federal Register FSH follicle stimulating hormone g gram GC gas chromatography gd gestational day GLC gas liquid chromatography GPC gel permeation chromatography HPLC high-performance liquid chromatography HRGC high resolution gas chromatography HSDB Hazardous Substance Data Bank IARC International Agency for Research on Cancer IDLH immediately dangerous to life and health ILO International Labor Organization IRIS Integrated Risk Information System Kd adsorption ratio kg kilogram kkg metric ton Koc organic carbon partition coefficient Kow octanol-water partition coefficient L liter LC liquid chromatography LC50 lethal concentration, 50% kill LCLo lethal concentration, low LD50 lethal dose, 50% kill LDLo lethal dose, low LDH lactic dehydrogenase LH luteinizing hormone LOAEL lowest-observed-adverse-effect level LSE Levels of Significant Exposure LT50 lethal time, 50% kill m meter MA trans,trans-muconic acid MAL maximum allowable level mCi millicurie MCL maximum contaminant level MCLG maximum contaminant level goal MF modifying factor
DIAZINON C-3
APPENDIX C
MFO mixed function oxidase mg milligram mL milliliter mm millimeter mmHg millimeters of mercury mmol millimole mppcf millions of particles per cubic foot MRL Minimal Risk Level MS mass spectrometry NAAQS National Ambient Air Quality Standard NAS National Academy of Science NATICH National Air Toxics Information Clearinghouse NATO North Atlantic Treaty Organization NCE normochromatic erythrocytes NCEH National Center for Environmental Health NCI National Cancer Institute ND not detected NFPA National Fire Protection Association ng nanogram NHANES National Health and Nutrition Examination Survey NIEHS National Institute of Environmental Health Sciences NIOSH National Institute for Occupational Safety and Health NIOSHTIC NIOSH's Computerized Information Retrieval System NLM National Library of Medicine nm nanometer nmol nanomole NOAEL no-observed-adverse-effect level NOES National Occupational Exposure Survey NOHS National Occupational Hazard Survey NPD nitrogen phosphorus detection NPDES National Pollutant Discharge Elimination System NPL National Priorities List NR not reported NRC National Research Council NS not specified NSPS New Source Performance Standards NTIS National Technical Information Service NTP National Toxicology Program ODW Office of Drinking Water, EPA OERR Office of Emergency and Remedial Response, EPA OHM/TADS Oil and Hazardous Materials/Technical Assistance Data System OPP Office of Pesticide Programs, EPA OPPT Office of Pollution Prevention and Toxics, EPA OPPTS Office of Prevention, Pesticides and Toxic Substances, EPA OR odds ratio OSHA Occupational Safety and Health Administration OSW Office of Solid Waste, EPA OTS Office of Toxic Substances OW Office of Water OWRS Office of Water Regulations and Standards, EPA PAH polycyclic aromatic hydrocarbon
DIAZINON C-4
APPENDIX C
PBPD physiologically based pharmacodynamic PBPK physiologically based pharmacokinetic PCE polychromatic erythrocytes PEL permissible exposure limit pg picogram PHS Public Health Service PID photo ionization detector pmol picomole PMR proportionate mortality ratio ppb parts per billion ppm parts per million ppt parts per trillion PSNS pretreatment standards for new sources RBC red blood cell REL recommended exposure level/limit RfC reference concentration RfD reference dose RNA ribonucleic acid RQ reportable quantity RTECS Registry of Toxic Effects of Chemical Substances SARA Superfund Amendments and Reauthorization Act SCE sister chromatid exchange SGOT serum glutamic oxaloacetic transaminase SGPT serum glutamic pyruvic transaminase SIC standard industrial classification SIM selected ion monitoring SMCL secondary maximum contaminant level SMR standardized mortality ratio SNARL suggested no adverse response level SPEGL Short-Term Public Emergency Guidance Level STEL short term exposure limit STORET Storage and Retrieval TD50 toxic dose, 50% specific toxic effect TLV threshold limit value TOC total organic carbon TPQ threshold planning quantity TRI Toxics Release Inventory TSCA Toxic Substances Control Act TWA time-weighted average UF uncertainty factor U.S. United States USDA United States Department of Agriculture USGS United States Geological Survey VOC volatile organic compound WBC white blood cell WHO World Health Organization
DIAZINON C-5
APPENDIX C
> greater than ≥ greater than or equal to = equal to < less than ≤ less than or equal to % percent α alpha β beta γ gamma δ delta μm micrometer μg microgram
* q1 cancer slope factor – negative + positive (+) weakly positive result (–) weakly negative result

DIAZINON C-6
APPENDIX C
This page is intentionally blank.
DIAZINON D-1
APPENDIX D. INDEX
2-isopropyl-4-methyl-6-hydroxypyrimidine (see IMHP) ......................................................................... 100absorbed dose.................................................................................................................................... 115, 120 acetylcholine ............................................................................................................. 10, 31, 38, 81, 108, 128 acetylcholinesterase (see AChE)......................................................... 5, 10, 15, 20, 25, 29, 31, 38, 201, 203AChE (see acetylcholinesterase)...................... 10, 11, 12, 13, 14, 15, 18, 19, 20, 21, 22, 24, 25, 26, 27, 28,
29, 31, 32, 38, 39, 41, 71, 81, 83, 84, 92, 95, 104, 106, 108, 114, 116, 117, 121, 123, 124, 125, 128, 130, 199
adipose tissue ...................................................................................................................................... 99, 170 adrenal gland......................................................................................................................................... 14, 37 adrenals ....................................................................................................................................................... 78 adsorbed .................................................................................................................................... 151, 158, 196 adsorption.................................................................................................................................. 153, 158, 194 aerobic....................................................................................................................................................... 143 alanine aminotransferase............................................................................................................................. 76 ambient air ................................................................................................ 147, 160, 162, 175, 179, 182, 199 anaerobic ................................................................................................................................... 143, 156, 158 anemia ......................................................................................................................................................... 75 aspartate aminotransferase (see AST)......................................................................................................... 76 AST (see aspartate aminotransferase)......................................................................................................... 77 atropine ............................................................................................................................. 31, 39, 41, 81, 120 benchmark dose (see BMD)...................................................................................................................... 201 bioavailability ................................................................................................................................... 159, 181 bioconcentration factor ..................................................................................................................... 145, 152 biodegradation....................................................................................................................... 9, 143, 156, 181 biomarker .................................................................................. 114, 115, 116, 129, 130, 132, 185, 198, 199 BMD (see benchmark dose)............................................................................ 14, 19, 21, 22, 24, 26, 28, 201 BMD analysis........................................................................................................ 19, 21, 22, 24, 26, 28, 201 body weight effects ....................................................................................................... 32, 37, 71, 79, 92, 93 brain acetylcholinesterase (see brain AChE) ............................................................................................ 199 brain AChE (see brain acetylcholinesterase) ............................................. 11, 12, 14, 15, 18, 19, 21, 22, 24,
27, 28, 84, 114, 118, 119, 132 breast milk................................................................................................................................... 10, 176, 183 butyrylcholinesterase ............................................................................................................................ 11, 81 cancer .............................................................................................................. 3, 12, 40, 88, 94, 95, 112, 125 carcinogen ......................................................................................................................................... 204, 205 carcinogenic .................................................................................................................... 12, 30, 89, 117, 125carcinogenicity...................................................................................................................... 12, 40, 125, 205 carcinomas .................................................................................................................................................. 89 cardiovascular ..................................................................................................... 29, 32, 71, 72, 92, 123, 124Cardiovascular Effects .................................................................................................................... 32, 72, 92 central nervous system............................................................................ 10, 31, 38, 107, 108, 109, 117, 120 ChE (see cholinesterase) .......................................................... 11, 12, 14, 15, 18, 21, 24, 27, 38, 81, 82, 84,
104, 106, 114, 116, 118, 119, 130, 199 cholinergic ........................................................... 10, 29, 31, 39, 41, 71, 73, 78, 82, 86, 87, 92, 94, 95, 100,
107, 108, 109, 113, 116, 118, 123, 124, 127, 128 cholinesterase (see ChE) ............................................... 5, 11, 12, 15, 18, 39, 81, 84, 95, 113, 116, 130, 177 cholinesterase inhibition ................................................................................... 12, 18, 84, 95, 113, 116, 177chromosomal aberrations .................................................................................................................... 96, 126 clearance ........................................................................................................................................... 118, 183
DIAZINON D-2
APPENDIX D
continuous variable ............................................................................................................................... 26, 28 death.................................................................................. 10, 11, 16, 27, 30, 31, 41, 42, 73, 80, 86, 89, 108 delayed neurotoxicity.................................................................................................................................. 39 deoxyribonucleic acid (see DNA)......................................................................................................... 97, 98 DEP (see diethylphosphate) ........................................ 38, 100, 101, 102, 103, 115, 129, 130, 186, 187, 199 dermal effects.................................................................................................................................. 32, 71, 93 DETP (see diethylthiophosphate) ..................................... 100, 101, 102, 103, 115, 129, 130, 186, 187, 199 diethylphosphate (see DEP)................................................................................................................ 38, 199 diethylthiophosphate (see DETP) ............................................................................................. 100, 137, 199 DNA (see deoxyribonucleic acid)................................................................................................. 97, 98, 115 elimination half-time................................................................................................................................. 100 endocrine................................................................................................................. 32, 71, 92, 110, 111, 123 endocrine effects ............................................................................................................................. 37, 78, 93 erythema...................................................................................................................................................... 93 estrogenic .................................................................................................................................................. 111 fasciculations................................................................................................................... 11, 81, 82, 108, 128 fetus........................................................................................................................... 4, 86, 87, 111, 113, 127 gastrointestinal effects .......................................................................................................................... 72, 92 general population......................................................................... 9, 114, 116, 145, 169, 172, 176, 179, 183 genotoxic............................................................................................................................................. 30, 126 genotoxicity................................................................................................................................... 12, 96, 126 groundwater .................................................. 9, 145, 149, 151, 153, 154, 155, 156, 166, 167, 169, 181, 182 half-life...................................................................... 102, 114, 120, 143, 145, 154, 155, 156, 157, 159, 181 hematological effects ...................................................................................................................... 32, 74, 92 hepatic effects ........................................................................................................................... 37, 74, 76, 92 human equivalent concentration ......................................................................................................... 16, 201 hydrolysis.............................................................. 9, 100, 118, 141, 143, 154, 156, 157, 158, 159, 181, 200 hydroxyl radical ........................................................................................................................ 143, 154, 181 IMHP (see 2 isopropyl-4 methyl-6 hydroxypyrimidine) ......................... 100, 101, 104, 106, 115, 129, 130,
143, 157, 158, 159, 198, 200 immunological .......................................................................................................................... 12, 30, 37, 81 Kow ............................................................................................................................................................ 135 LD50............................................................................................................................................... 42, 89, 124 lymphoreticular ..................................................................................................................... 37, 81, 124, 127 mass spectroscopy..................................................................................................................................... 185 metabolic effects ......................................................................................................................................... 80 micronuclei ................................................................................................................................................. 96 milk ............................................................................................................... 4, 102, 169, 178, 194, 198, 199 muscarinic ............................................................................................................... 10, 31, 38, 108, 120, 128 muscarinic receptor................................................................................................................................... 120 musculoskeletal effects ............................................................................................................................... 32 neonatal ............................................................................................................................................... 95, 113 neoplastic .................................................................................................................................................... 88 neurobehavioral......................................................................................................................................... 110 neurodevelopmental .............................................................................................................. 85, 95, 113, 127 neuromuscular................................................................................................. 10, 31, 87, 108, 113, 119, 130 neurophysiological ............................................................................................................................ 113, 131 neurotransmitter ........................................................................................................................................ 108 nicotinic .......................................................................................................................... 10, 31, 38, 121, 128 nicotinic receptor ........................................................................................................................................ 38 non-Hodgkin’s lymphoma .............................................................................................................. 12, 88, 95
DIAZINON D-3
APPENDIX D
nuclear......................................................................................................................................................... 77 ocular effects......................................................................................................................................... 78, 92 organophosphate ................................................................ 10, 13, 14, 38, 39, 71, 81, 93, 94, 108, 116, 117,
119, 120, 131, 132, 139, 155, 164, 165, 169 pharmacodynamic ............................................................................................................. 103, 104, 106, 131 pharmacokinetic................................................................................ 103, 104, 105, 106, 109, 112, 130, 131 photolysis .................................................................................................. 141, 143, 154, 155, 156, 158, 181 plasma ChE (see plasma cholinesterase) ................................. 11, 12, 14, 15, 18, 19, 21, 24, 27, 38, 39, 81,
82, 84, 94, 106, 113, 116, 118, 119, 130 plasma cholinesterase (see plasma ChE) ........................................................................................ 5, 38, 199 RBC (see red blood cell)...................... 11, 12, 13, 14, 15, 16, 18, 19, 20, 21, 22, 23, 24, 25, 26, 27, 28, 38,
39, 75, 81, 82, 83, 84, 106, 114, 116, 119, 124, 130, 131, 199, 201 RBC AChE ............................................................ 11, 12, 13, 15, 16, 18, 19, 21, 22, 23, 24, 25, 26, 27, 28,
38, 39, 81, 82, 83, 84, 106, 114, 116, 124, 130, 201 red blood cell (see RBC)................................................................................. 5, 11, 15, 20, 25, 75, 107, 203 renal effects........................................................................................................................................... 37, 77 retention ............................................................................................................................................ 191, 196 salivation ........................................................................................................... 11, 13, 39, 87, 108, 124, 128spermatozoa ........................................................................................................................................ 85, 111 thyroid......................................................................................................................................................... 78 toxicokinetic......................................................................................................................... 29, 124, 125,131 tremors ............................................................................................................................................ 10, 82, 83 vapor phase ............................................................................................................................... 143, 150, 154 vapor pressure ........................................................................................................................................... 150 volatility ................................................................................................................................ 10, 31, 146, 173 volatilization ..................................................................................................................... 143, 147, 151, 153


![APPENDIX A. ATSDR MINIMAL RISK LEVELS AND WORKSHEETS · 9601 et seq.], as amended by the Superfund Amendments and Reauthorization Act (SARA) [Pub. L. 99– 499], requires that the](https://img.pdfslide.net/doc/110x75/5f84d262c9837f0f723a5894/appendix-a-atsdr-minimal-risk-levels-and-worksheets-9601-et-seq-as-amended-by.jpg)