Embed Size (px)
Citation preview
August, 2009 - Page A-1
APPENDIX A
FIRE BEHAVIOR POTENTIAL
ANALYSIS METHODOLOGY
Purpose
The purpose of this document is to describe the methodology used to evaluate the threat represented by physical hazards such as fuels, weather and topography to values at risk in the study area, by modeling their effects on fire behavior potential.
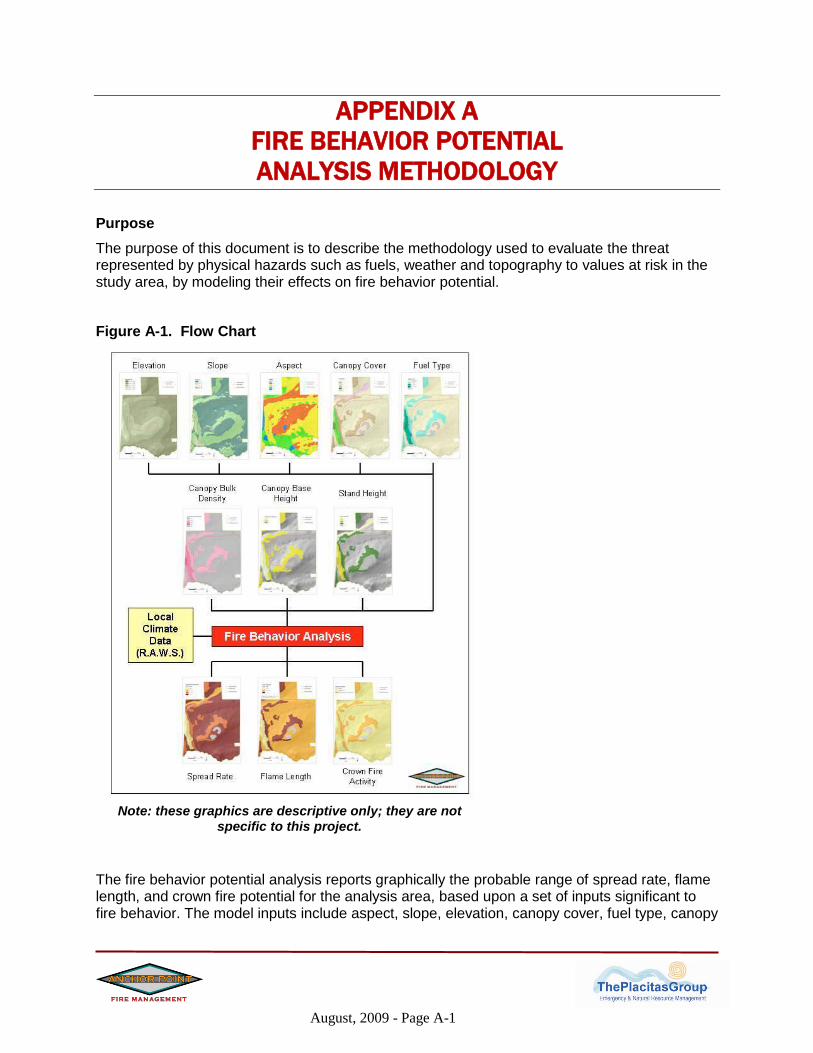
Figure A-1. Flow Chart
The fire behavior potential analysis reports graphically the probable range of spread rate, flame length, and crown fire potential for the analysis area, based upon a set of inputs significant to fire behavior. The model inputs include aspect, slope, elevation, canopy cover, fuel type, canopy
Note: these graphics are descriptive only; they are not specific to this project.

August, 2009 - Page A-2
bulk density, canopy base height, stand height, and climate data. The model outputs are determined using FlamMap1, which combines surface fire predictions with the potential for
crown fire development.
Anchor Point’s fire behavior modeling process for surface fire draws heavily from the BEHAVE2 fire behavior prediction and fuel modeling system. BEHAVE is a nationally recognized set of calculations used to estimate a surface fire’s intensity and rate of spread given certain conditions of topography, fuels, and weather.
The BEHAVE modeling system has been used for a variety of applications, including prediction of an ongoing fire, prescribed fire planning, fuel hazard assessment, initial attack dispatch, and fire prevention planning and training. Predictions of wildland surface fire behavior are made for a single point in time and space, given simple user-defined fuels, weather, and topography. Requested values depend on the modeling choices made by the user.
Assumptions of BEHAVE:
Fire is predicted at the flaming front (fire behavior is not modeled for the time after the flaming front of the fire has passed)
Fire is free burning (uncontrolled by suppression efforts)
Behavior is heavily weighted towards the fine fuels (grasses and small-diameter wood)
Fuels are continuous and uniform
Fires are considered to be surface fires (crown fire activity is modeled separately)
BEHAVE makes calculations at a single point. In order to make calculations for an entire landscape (important for pre-planning the effects of a wildfire at the community, district, or county scale), fire behavior is modeled using FlamMap which models surface fire predictions and the potential for crown fire development. Crown fire development modeling in FlamMap is based on the work of Van Wagner3, is not based on BEHAVE and is run separately from surface fire calculations.
Assumptions of FlamMap:
Each calculation in a given area is independent of calculations in any other area. Fire is not modeled dynamically across the landscape but statically as a series of individual calculations.
Weather inputs such as wind and fuel moistures do not change over time
1 Mark Finney, Stuart Brittain and Rob Seli., The Joint Fire Sciences Program of the Rocky Mountain Research
Station (USDA Forest Service, Missoula, Montana), the Bureau of Land Management and Systems for Environmental Management (Missoula, Montana).
2 Patricia L. Andrews, producer and designer, Collin D. Bevins, programmer and designer, The Joint Fire Sciences
Program of the Rocky Mountain Research Station (USDA Forest Service, Missoula, Montana) and Systems for Environmental Management (Missoula, Montana).
3 Van Wagner, C.E. 1977. Conditions for the start and spread of a crown fire. Canadian Journal of Forest Research.
7: 23-24.

August, 2009 - Page A-3
Fire behavior modeling calculations are performed in a series of uniform squares (“or pixels”) across the landscape. These pixels determine the level of detail and nothing smaller than a pixel (30m in most cases) will be included in the modeling.
FlamMap
Anchor Point used FlamMap 3.0 to evaluate the potential fire conditions in the fire behavior study area. The Angel Fire study area encompasses 18,429 acres (28.8 square miles). The study area for the fire behavior analysis covers approximately 37,563 acres (58.7 square miles). This area includes the study area and a 1-mile buffer in all directions. The inclusion of this buffer provides the user with an analysis of potential fire behavior on adjacent lands. From both a planning and tactical perspective, it is important to evaluate exposures beyond the area of interest.
The study area is broken down into grid cells of 30m per side inside each of which fire behavior is predicted based on input fuel, weather and topographic information. For the Angel Fire FlamMap run, existing data for surface fuels from the Landfire4 Program.
The final set of input data for the FlamMap model consist of reference weather and fuel moisture information summarized from a Remote Automated Weather Station (RAWS) site. See the section below for details on RAWS information.
Fire Behavior Inputs
The major factors influencing fire behavior are fuels (type and coverage), weather, and topography (aspect, slope and elevation). The following pages contain a brief explanation of each.
4 http://www.landfire.gov/

August, 2009 - Page A-4
Figure A-2. Percent Slope Slopes are shown here as percent (rise/run x100). Steeper slopes intensify fire behavior and thus will contribute to a higher wildfire hazard rating.

August, 2009 - Page A-5
Figure A-3. Aspect Aspects are shown as degrees from north ranging from 0 to 360 according to their orientation. Aspects are influential in the type and quantity of vegetative fuels. Fuels on south facing slopes tend to be drier and more lightly loaded than fuels on north facing slopes, when all other influences are equal. Aspect also has an influence on plant species dominance.
Classification North East South West
Range (degrees) 315-45 45-135 135-225 225-315

August, 2009 - Page A-6
Figure A-4. Elevation Elevations within the study area range from approximately 8,300′ to 11,000′. As elevation increases, environmental conditions, fuel species, and characteristics change.

August, 2009 - Page A-7
Reference Weather Used in the Fire Behavior Potential Evaluation
As stated above, climate and fuel moisture inputs for FlamMap were created by using data collected from a RAWS. The Cimarron RAWS was used to capture the climate for the project area because of its location and elevation.
Cimarron Site Information
Latitude (dd.ddddd) 36.60611 º N
Longitude (dd.ddddd) -105.12028 º W
Elevation (ft.) 8744
Weather observations for a six year period (2003-2009) from the Cimarron Remote Automated Weather Station (RAWS) were used to calculate these conditions. The moderate condition class (16th to 89th percentile) was calculated for each variable (1 hour, 10 hour, and 100 hour fuel moisture, woody fuel moisture, herbaceous fuel moisture, and wind speed) using Fire Family Plus. This weather condition class most closely represents an average fire season day. The extreme conditions class was calculated using 97th percentile weather data. In other words, the weather conditions on the most severe fire weather days (sorted by Spread Component) in each season for the six year period were used for this analysis. It is reasonable to assume that similar conditions exist on at least three to five days of the fire season during an average year. In fact, during extreme years such conditions may exist for significantly longer periods. Even these calculations may be conservative compared to observed fire behavior. A Southwest wind direction was used to best mimic the predominant direction during the summer months. The following values, derived from Fire Family Plus, were used as climate/fuel moisture inputs in FlamMap:
Moderate Weather Conditions Extreme Weather Conditions
Variable Value Variable Value
20 ft Wind Speed Upslope 9 mph 20 ft Wind Speed SW 14 mph
Herbaceous Fuel Moisture 59 % Herbaceous Fuel Moisture 52 %
Woody Fuel Moisture 126 % Woody Fuel Moisture 88 %
1-hr fuel moisture 6 % 1-hr Fuel Moisture 3 %
10-hr fuel moisture 7 % 10-hr Fuel Moisture 4 %
100-hr fuel moisture 13 % 100-hr Fuel Moisture 8 %
Note: Strong winds at 20 feet will feel significantly less noticeable at ground level due to friction with the surface.

August, 2009 - Page A-8
Dead Fuel Moisture
Dead fuel moisture responds solely to ambient environmental conditions and is critical in determining fire potential. Dead fuel moistures are classed by timelag. A fuel's timelag is proportional to its diameter and is loosely defined as the time it takes a fuel particle to reach two-thirds of its way to equilibrium with its local environment. Dead fuels in the National Fire Danger Rating System (NFDRS)5 fall into four classes: 1, 10, 100, and 1000 hour.
Live Fuel Moisture
Live fuel moisture is the amount of water in a fuel, expressed as a percent of the oven-dry weight of that fuel. Fuel moisture between 300% and 30% is considered live. Anything below 30% is considered dead fuel. Fuel moistures can exceed 100% because the living cells can expand beyond their normal size to hold more water when available.
5 U.S. National Fire Danger Rating System Overview: INT-GTR-367 - FIRES: Fire Information Retrieval
and Evaluation System - a Program for Fire Danger Rating Analysis
August, 2009 - Page A-9
Fuel Models and Fire Behavior
In the context of fire behavior modeling, “fuel models” are a set of numbers that describe fuels in terms that the fire behavior modeling equations can use directly. There are seven characteristics used to categorize fuel models:
Fuel Loading
Size and Shape
Compactness
Horizontal Continuity
Vertical Arrangement
Moisture Content
Chemical Content
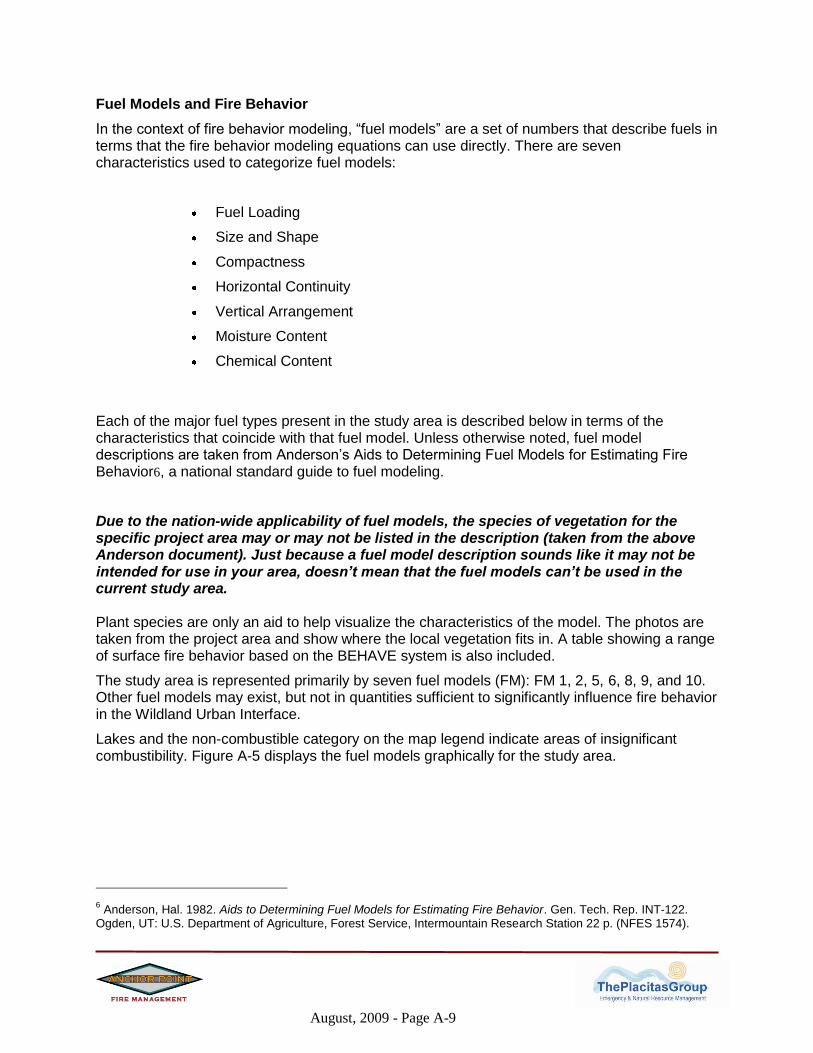
Each of the major fuel types present in the study area is described below in terms of the characteristics that coincide with that fuel model. Unless otherwise noted, fuel model descriptions are taken from Anderson’s Aids to Determining Fuel Models for Estimating Fire Behavior6, a national standard guide to fuel modeling.
Due to the nation-wide applicability of fuel models, the species of vegetation for the specific project area may or may not be listed in the description (taken from the above Anderson document). Just because a fuel model description sounds like it may not be intended for use in your area, doesn’t mean that the fuel models can’t be used in the current study area. Plant species are only an aid to help visualize the characteristics of the model. The photos are taken from the project area and show where the local vegetation fits in. A table showing a range of surface fire behavior based on the BEHAVE system is also included.
The study area is represented primarily by seven fuel models (FM): FM 1, 2, 5, 6, 8, 9, and 10. Other fuel models may exist, but not in quantities sufficient to significantly influence fire behavior in the Wildland Urban Interface.
Lakes and the non-combustible category on the map legend indicate areas of insignificant combustibility. Figure A-5 displays the fuel models graphically for the study area.
6 Anderson, Hal. 1982. Aids to Determining Fuel Models for Estimating Fire Behavior. Gen. Tech. Rep. INT-122.
Ogden, UT: U.S. Department of Agriculture, Forest Service, Intermountain Research Station 22 p. (NFES 1574).

August, 2009 - Page A-10
Figure A-5. Fire Fuel Models

August, 2009 - Page A-11
FUEL MODEL 1 Figure A-6. Short Grass
Characteristics
Grasslands and savanna are represented along with stubble, grass-tundra, and grass-shrub combinations.
Common Types/Species
Annual and perennial grasses are included in this fuel model.
Fire Behavior
Fire spread is governed by the fine, very porous, and continuous herbaceous fuels that have cured or are nearly cured. Fires in this fuel model are surface fires that move rapidly through the
cured grass and associated material. Very little shrub or timber is present generally less than one third of the area.
August, 2009 - Page A-12
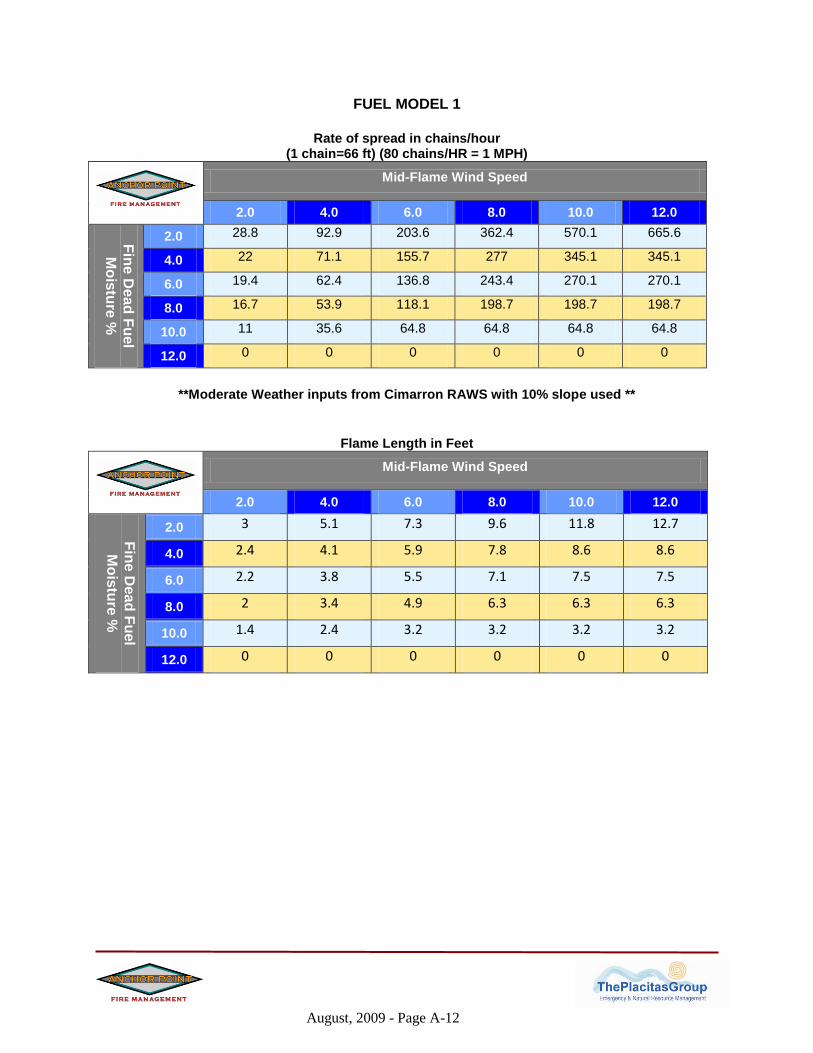
FUEL MODEL 1
Rate of spread in chains/hour
(1 chain=66 ft) (80 chains/HR = 1 MPH)
Mid-Flame Wind Speed
2.0 4.0 6.0 8.0 10.0 12.0
Fin
e D
ea
d F
uel
Mo
istu
re %
2.0 28.8 92.9 203.6 362.4 570.1 665.6
4.0 22 71.1 155.7 277 345.1 345.1
6.0 19.4 62.4 136.8 243.4 270.1 270.1
8.0 16.7 53.9 118.1 198.7 198.7 198.7
10.0 11 35.6 64.8 64.8 64.8 64.8
12.0 0 0 0 0 0 0
**Moderate Weather inputs from Cimarron RAWS with 10% slope used **
Flame Length in Feet
Mid-Flame Wind Speed
2.0 4.0 6.0 8.0 10.0 12.0
Fin
e D
ea
d F
uel
Mo
istu
re %
2.0 3 5.1 7.3 9.6 11.8 12.7
4.0 2.4 4.1 5.9 7.8 8.6 8.6
6.0 2.2 3.8 5.5 7.1 7.5 7.5
8.0 2 3.4 4.9 6.3 6.3 6.3
10.0 1.4 2.4 3.2 3.2 3.2 3.2
12.0 0 0 0 0 0 0
August, 2009 - Page A-13
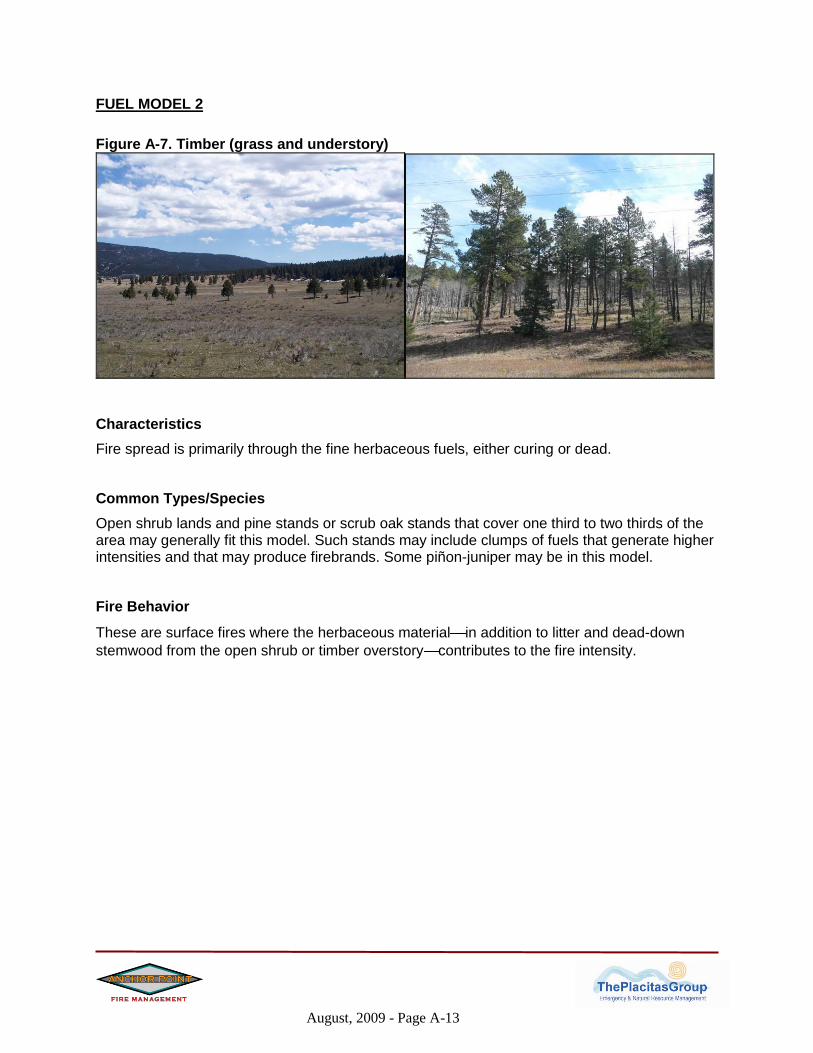
FUEL MODEL 2
Figure A-7. Timber (grass and understory)
Characteristics
Fire spread is primarily through the fine herbaceous fuels, either curing or dead.
Common Types/Species
Open shrub lands and pine stands or scrub oak stands that cover one third to two thirds of the area may generally fit this model. Such stands may include clumps of fuels that generate higher intensities and that may produce firebrands. Some piñon-juniper may be in this model.
Fire Behavior
These are surface fires where the herbaceous material in addition to litter and dead-down
stemwood from the open shrub or timber overstory contributes to the fire intensity.

August, 2009 - Page A-14
FUEL MODEL 2
Rate of spread in chains/hour (1 chain=66 ft) (80 chains/HR = 1 MPH)
Mid-Flame Wind Speed
2.0 4.0 6.0 8.0 10.0 12.0
Fin
e D
ea
d F
uel
Mo
istu
re %
2.0 14.3 39.4 77.9 128.8 191.5 265.6
4.0 11.7 32.3 63.8 105.5 156.8 217.5
6.0 10.4 28.7 56.6 93.6 139.2 193.1
8.0 9.6 26.4 52.1 86.1 128.1 177.7
10.0 8.6 23.6 46.6 77 114.5 158.8
12.0 6.8 18.7 37 61.1 90.9 126.1
**Moderate Weather inputs from Cimarron RAWS with 10% slope used **
Flame Length in Feet
Mid-Flame Wind Speed
2.0 4.0 6.0 8.0 10.0 12.0
Fin
e D
ea
d F
uel
Mo
istu
re %
2.0 4.6 7.4 10.1 12.7 15.2 17.7
4.0 3.9 6.3 8.6 10.8 13 15.1
6.0 3.6 5.8 7.9 9.9 11.9 13.9
8.0 3.4 5.5 7.5 9.4 11.3 13.2
10.0 3.2 5 6.9 8.7 10.4 12.1
12.0 2.6 4.2 5.7 7.2 8.6 10

August, 2009 - Page A-15
FUEL MODEL 5
Figure A-8. Brush (2 feet)
Characteristics
This model consists of continuous stands of low brush. Generally, heights do not exceed six feet. The stands will have a grass or scattered grass understory. Usually shrubs are short and almost totally cover the area.
Common Types/Species
Young, green stands with minimal dead wood would qualify: laurel, vine maple, alder, or even chaparral, manzanita, or chamise. Mountain grasses are also associated with this type.
Fire Behavior
The fires are generally not very intense because surface fuel loads are light, the shrubs are young with little dead material, and the foliage contains little volatile material. Fire is generally carried in the surface fuels that are made up of litter cast by the shrubs and the grasses or forbs in the understory. Cured leaves retained on shrubs can cause greater intensities.

August, 2009 - Page A-16
FUEL MODEL 5
Rate of spread in chains/hour (1 chain=66 ft) (80 chains/HR = 1 MPH)
Mid-Flame Wind Speed
2.0 4.0 6.0 8.0 10.0 12.0
Fin
e D
ea
d F
uel
Mo
istu
re %
2.0 7.3 17.1 29 42.6 57.7 74
4.0 5.7 13.2 22.4 33 44.6 57.2
6.0 3 6.9 11.7 17.2 23.3 29.9
8.0 2.4 5.6 9.5 13.9 18.8 19.7
10.0 2.3 5.4 9.1 13.4 18.2 18.4
12.0 2.2 5.2 8.8 12.9 17 17
**Moderate Weather inputs from Cimarron RAWS with 10% slope used **
Flame Length in Feet
Mid-Flame Wind Speed
2.0 4.0 6.0 8.0 10.0 12.0
Fin
e D
ea
d F
uel
Mo
istu
re %
2.0 3.6 5.3 6.8 8.1 9.4 10.5
4.0 2.9 4.2 5.4 6.5 7.4 8.3
6.0 1.6 2.3 3 3.6 4.1 4.6
8.0 1.3 1.9 2.5 2.9 3.4 3.4
10.0 1.3 1.9 2.4 2.9 3.3 3.3
12.0 1.2 1.8 2.3 2.8 3.1 3.1

August, 2009 - Page A-17
FUEL MODEL 6
Figure A-9. Shrub Stands
Characteristics
The shrubs are older but not as tall as the shrub types of model 4, nor do they contain as much fuel as model 4. A broad range of shrub conditions is covered by this model.
Common Types/Species
Fuel situations to be considered include intermediate stands of chamise, chaparral, oak brush, low pocosin, Alaskan spruce taiga, and shrub tundra. Even hardwood slash that has cured can be considered. Piñon-juniper shrub lands may be represented but may over predict rate of spread except at high winds, like 20 mi/h (32 km/h) at the 20-foot level.
Fire Behavior
Fires carry through the shrub layer where the foliage is more flammable than fuel model 5, but this requires moderate winds, greater than 8 mi/h (13 km/h) at mid-flame height. Fire will drop to the ground at low wind speeds or at openings in the stand.

August, 2009 - Page A-18
FUEL MODEL 6
Rate of spread in chains/hour (1 chain=66 ft) (80 chains/HR = 1 MPH)
Mid-Flame Wind Speed
2.0 4.0 6.0 8.0 10.0 12.0
Fin
e D
ea
d F
uel
Mo
istu
re %
2.0 16.9 37.7 62.7 90.7 121.1 153.8
4.0 13.7 30.7 50.9 73.6 98.4 124.9
6.0 11.6 25.9 43 62.2 83.2 105.6
8.0 10.2 22.8 37.8 54.7 73 92.7
10.0 9.2 20.6 34.2 49.5 66.2 84
12.0 8.5 19.1 31.7 45.8 61.2 77.7
**Moderate Weather inputs from Cimarron RAWS with 10% slope used **
Flame Length in Feet
Mid-Flame Wind Speed
2.0 4.0 6.0 8.0 10.0 12.0
Fin
e D
ea
d F
uel
Mo
istu
re %
2.0 4.9 7.1 9 10.7 12.2 13.6
4.0 4.2 6.1 7.7 9.1 10.4 11.7
6.0 3.7 5.4 6.8 8.1 9.2 10.3
8.0 3.4 4.9 6.2 7.4 8.5 9.4
10.0 3.2 4.6 5.9 7 7.9 8.9
12.0 3.1 4.4 5.6 6.6 7.6 8.5

August, 2009 - Page A-19
FUEL MODEL 8
Figure A-10. Closed Timber Litter
Characteristics This fuel model is represented by closed canopy stands of hardwoods, lodgepole pine, or ponderosa pine with little under growth. Hardwoods that have leafed out support fire in the compact litter layer. Amounts of needle and woody litter are also low.
Common Types/Species This fuel model is most often represented by lodgepole pine but ponderosa pine can be included. Hardwood species would include cottonwoods and willows. There are little or no understory plants.
Fire Behavior Fires in this fuel model are slow burning, low intensity fires burning in surface fuels. Fuels are mainly needles and woody litter. Heavier fuel loadings can cause flare-ups. Heavier fuel loads have the potential to develop crown fires in extreme burning conditions.
August, 2009 - Page A-20
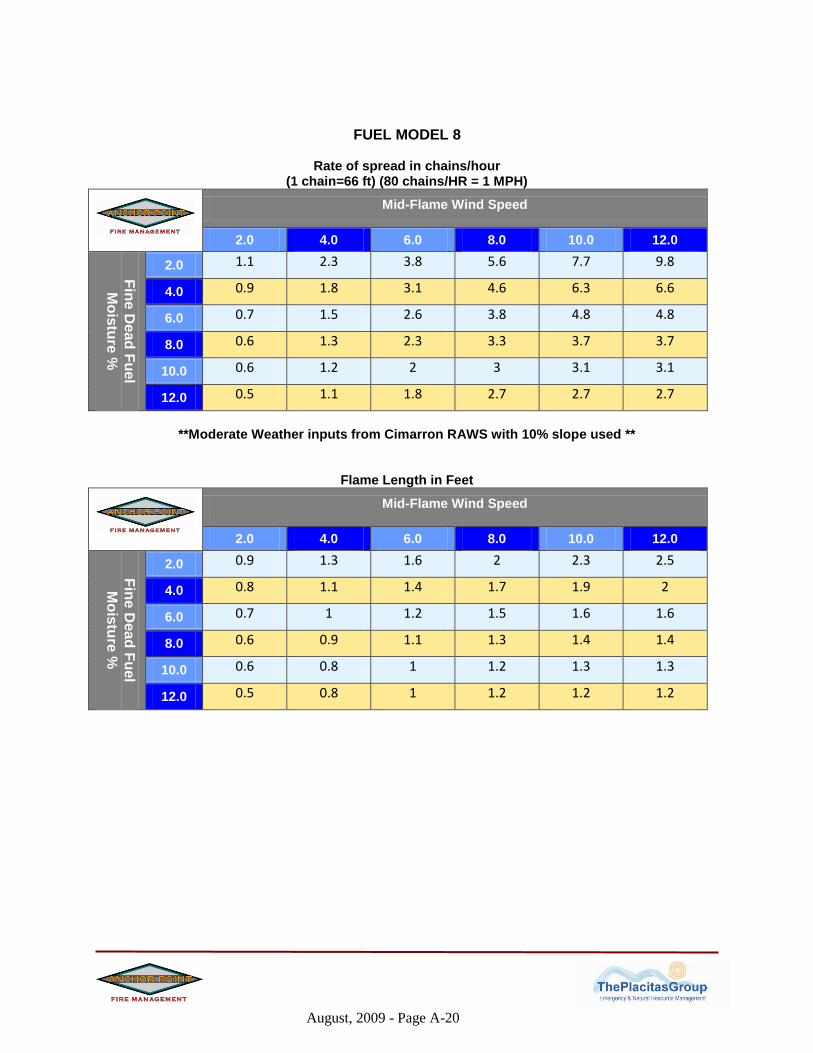
FUEL MODEL 8
Rate of spread in chains/hour (1 chain=66 ft) (80 chains/HR = 1 MPH)
Mid-Flame Wind Speed
2.0 4.0 6.0 8.0 10.0 12.0
Fin
e D
ea
d F
uel
Mo
istu
re %
2.0 1.1 2.3 3.8 5.6 7.7 9.8
4.0 0.9 1.8 3.1 4.6 6.3 6.6
6.0 0.7 1.5 2.6 3.8 4.8 4.8
8.0 0.6 1.3 2.3 3.3 3.7 3.7
10.0 0.6 1.2 2 3 3.1 3.1
12.0 0.5 1.1 1.8 2.7 2.7 2.7
**Moderate Weather inputs from Cimarron RAWS with 10% slope used **
Flame Length in Feet
Mid-Flame Wind Speed
2.0 4.0 6.0 8.0 10.0 12.0
Fin
e D
ea
d F
uel
Mo
istu
re %
2.0 0.9 1.3 1.6 2 2.3 2.5
4.0 0.8 1.1 1.4 1.7 1.9 2
6.0 0.7 1 1.2 1.5 1.6 1.6
8.0 0.6 0.9 1.1 1.3 1.4 1.4
10.0 0.6 0.8 1 1.2 1.3 1.3
12.0 0.5 0.8 1 1.2 1.2 1.2

August, 2009 - Page A-21
FUEL MODEL 9
Figure A-11. Mixed Conifer (light)
Characteristics Both long-needle conifer stands and hardwood stands, especially the oak-hickory types, are typical. Concentrations of dead-down woody material will contribute to possible torching out of trees, spotting, and crowning.
Common Types/Species Closed stands of long-needled pine like ponderosa, Jeffrey, and red pines, or southern pine plantations are grouped in this fuel model.
Fire Behavior Fires in this fuel model run through the surface litter faster than model 8 and have longer flame height. Fall fires in hardwoods are predictable, but high winds will actually cause higher rates of spread than predicted because of spotting caused by rolling and blowing leaves.

August, 2009 - Page A-22
FUEL MODEL 9
Rate of spread in chains/hour (1 chain=66 ft) (80 chains/HR = 1 MPH)
Mid-Flame Wind Speed
2.0 4.0 6.0 8.0 10.0 12.0
Fin
e D
ea
d F
uel
Mo
istu
re %
2.0 4 9.7 18.1 28.7 41.4 56.2
4.0 3.1 7.7 14.3 22.6 32.7 44.3
6.0 2.6 6.4 11.8 18.7 27.1 36.7
8.0 2.3 5.5 10.2 16.3 23.5 31.8
10.0 2 5 9.2 14.7 21.2 28.7
12.0 1.9 4.6 8.5 13.5 19.5 26.5
**Moderate Weather inputs from Cimarron RAWS with 10% slope used **
Flame Length in Feet
Mid-Flame Wind Speed
2.0 4.0 6.0 8.0 10.0 12.0
Fin
e D
ea
d F
uel
Mo
istu
re %
2.0 2.3 3.5 4.7 5.8 6.8 7.9
4.0 1.9 2.9 3.9 4.8 5.7 6.6
6.0 1.7 2.5 3.4 4.2 4.9 5.7
8.0 1.5 2.3 3.1 3.8 4.5 5.2
10.0 1.4 2.2 2.9 3.5 4.2 4.8
12.0 1.4 2.1 2.7 3.4 4 4.6

August, 2009 - Page A-23
Fuel Model 10
Figure A-12. Mixed Conifer (medium)
Characteristics This fuel model is represented by dense stands of over-mature ponderosa pine, lodgepole pine, mixed conifer and continuous stands of Douglas fir. In all stand types, heavy downed material is present. There is also a large amount of dead-down woody fuels. Reproduction of vegetation may be present, acting as ladder fuels. This fuel model includes stands of budworm- killed Douglas fir, and closed stands of ponderosa pine with large amounts of ladder and surface fuels. Stands of lodgepole pine with heavy loadings of downed trees are also present. This fuel model can occur from the foothills through the sub-alpine zone.
Common Types/Species All types of vegetation can occur in this fuel model, but primary species are Douglas fir, ponderosa pine and lodgepole pine.
Fire Behavior Fire intensities in this fuel model can be moderate to extreme. Fire moves through dead, downed woody material. Torching of trees and spot fires are more frequent. Crown fires are quite possible.

August, 2009 - Page A-24
FUEL MODEL 10
Rate of spread in chains/hour (1 chain=66 ft) (80 chains/HR = 1 MPH)
Mid-Flame Wind Speed
2.0 4.0 6.0 8.0 10.0 12.0
Fin
e D
ea
d F
uel
Mo
istu
re %
2.0 3.2 6.9 11.5 16.8 22.8 29.3
4.0 2.8 6.1 10.2 14.9 20.2 26
6.0 2.5 5.5 9.3 13.6 18.4 23.6
8.0 2.4 5.2 8.6 12.7 17.1 22
10.0 2.3 4.9 8.2 12 16.3 20.9
12.0 2.2 4.7 7.9 11.5 15.6 20.1
**Moderate Weather inputs from Cimarron RAWS with 10% slope used **
Flame Length in Feet
Mid-Flame Wind Speed
2.0 4.0 6.0 8.0 10.0 12.0
Fin
e D
ea
d F
uel
Mo
istu
re %
2.0 3.5 5 6.3 7.5 8.6 9.7
4.0 3.1 4.5 5.7 6.8 7.8 8.8
6.0 2.9 4.2 5.3 6.3 7.2 8.1
8.0 2.8 3.9 5 5.9 6.8 7.7
10.0 2.6 3.8 4.8 5.7 6.6 7.4
12.0 2.6 3.7 4.7 5.5 6.4 7.2
August, 2009 - Page A-25
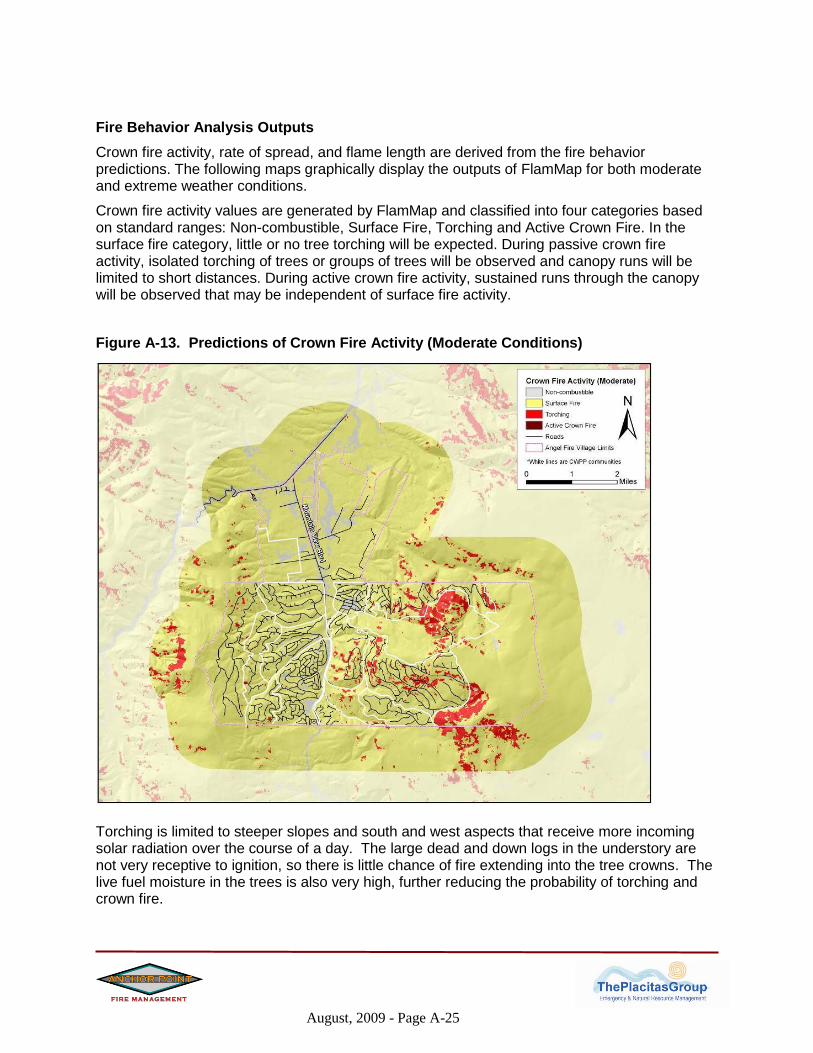
Fire Behavior Analysis Outputs
Crown fire activity, rate of spread, and flame length are derived from the fire behavior predictions. The following maps graphically display the outputs of FlamMap for both moderate and extreme weather conditions.
Crown fire activity values are generated by FlamMap and classified into four categories based on standard ranges: Non-combustible, Surface Fire, Torching and Active Crown Fire. In the surface fire category, little or no tree torching will be expected. During passive crown fire activity, isolated torching of trees or groups of trees will be observed and canopy runs will be limited to short distances. During active crown fire activity, sustained runs through the canopy will be observed that may be independent of surface fire activity.
Figure A-13. Predictions of Crown Fire Activity (Moderate Conditions)
Torching is limited to steeper slopes and south and west aspects that receive more incoming solar radiation over the course of a day. The large dead and down logs in the understory are not very receptive to ignition, so there is little chance of fire extending into the tree crowns. The live fuel moisture in the trees is also very high, further reducing the probability of torching and crown fire.

August, 2009 - Page A-26
Figure A-14. Predictions of Crown Fire Activity (Extreme Conditions)
Crown fire activity increases because in the extreme scenario because a stronger westerly wind was used in this modeled run. Higher winds create torching on the denser slopes (FM 9, 10) which are sheltered from the moderate winds. There is still minimal active crown fire. This is primarily due to the live fuel moistures being too high to support it. Because weather conditions at higher elevations are not likely to be hot and dry for long period of times, the understory fuels do not dry out enough to sustain surface fire and then transition into a crown fire.

August, 2009 - Page A-27
Rate of Spread (ROS) values are generated by FlamMap and are classified into four categories based on standard ranges: 0-20 ch/h (chains/hour), 20.1-40 ch/h, 40.1-60 ch/h, and greater than 60 ch/h. A chain is a logging measurement that is equal to 66 feet. One mile is equivalent to 80 chains. One ch/h equals approximately 1 foot/minute or 80 chains per hour equals 1 mile per hour. Figure A-15. Rate of Spread Predictions (Moderate Conditions)
Rate of spread in chains/hour (1 chain=66 ft) (80 chains/HR = 1 MPH)
Rate of spread is highest in the grasses (FM1). This is because grasses are unsheltered and are influenced by the full strength of the wind; however, this is also a limitation of the model: BEHAVE is known to over predict ROS in the lighter fuels.

August, 2009 - Page A-28
Figure A-16. Rate of Spread Predictions (Extreme Conditions)
Rate of spread in chains/hour
(1 chain=66 ft) (80 chains/HR = 1 MPH)
The greatest ROS values are again in the grasses during the modeled run using extreme conditions. The ROS also increased in the shrubs because the stronger wind is able to penetrate the shrub canopy now. There is also an increase in the wind speed where it aligns with the drainages. The forest stands are denser and will continue to reduce the wind speeds.

August, 2009 - Page A-29
Flame length values are generated by the FlamMap model and classified in four categories based on standard ranges: 0.1-4.0 feet, 4.1-8.0 feet, 8.1-12.0 feet and greater than 12.0 feet. Flame length is a direct measure of fireline intensity. Flame lengths of 4 feet and less are acceptable for direct attack by hand crews. Flame lengths of 8 feet and less are suitable for direct attack by machinery. With flame lengths of greater than 8 feet, indirect attack and aerial attack are the preferred methods of suppression.
Figure A-17. Flame Length Predictions (Moderate Conditions)
The higher flame lengths are a result of torching and high wind speeds in the grasses. Fire intensity is otherwise very low throughout the project area. The environmental conditions under the moderate scenario will not support intense fire.

August, 2009 - Page A-30
Figure A-18. Flame Length Predictions (Extreme Conditions)
A small increase in wind speed has a significant effect on flame length and therefore fireline intensity. The unsheltered areas, like the valley bottom, show an increase in fireline intensity, but they are limited by the height of the plants. In the forest stands, flame lengths increase as they begin to torch and engulf the entire tree.

August, 2009 - Page A-31
ASI relative physical hazard methodology
Instead of hazard and risk ratings, the ASIs are given relative physical hazard ratings. There are three categories: low, moderate, and high. These ratings are based on the mean fireline intensity (FLI) for the modeled area. FLI combines other fire behavior indicators such as rate of spread, flame length and heat per unit area. This gives a very good representation of the burning conditions for the area under the different weather scenarios. While it can be difficult to visualize the BTU/ft/sec, it can be quickly converted to flame length. It is important to note that these ratings are not equivalent to the community ratings because the methods used are not comparable.
Fireline intensity is the heat energy release per unit time from a one-foot (one-meter) wide section of the fuel bed extending from the front to the rear of the flaming zone. Fireline intensity is a function of rate of spread and heat per unit area, and is directly related to flame length7. (Reference BEHAVE Plus)
Figure A-19. Fire Characteristics Chart
7 Patricia L. Andrews, producer and designer, Collin D. Bevins, programmer and designer, The Joint Fire Sciences
Program of the Rocky Mountain Research Station (USDA Forest Service, Missoula, Montana) and Systems for Environmental Management (Missoula, Montana).

August, 2009 - Page A-32
Figure A-20. ASI-Relative Physical Hazard Ranking
Fire Behavior Interpretation and Limitations
This evaluation is a prediction of likely fire behavior, given a standardized set of conditions and a single point source ignition at every point. It does not consider cumulative impacts of increased fire intensity over time and space. The model does not calculate the probability that a wildfire will occur. It assumes an ignition occurrence for every 30m x 30m cell.
Weather conditions are extremely variable and all possible combinations cannot be accounted for. These outputs are best used for pre-planning and not as a stand-alone product for tactical planning. Whenever possible, fire behavior calculations should be done with actual weather observations during the fire. The most current Energy Release Component (ERC) values should also be calculated and distributed during the fire season to be used as a guideline for fire behavior potential.