Embed Size (px)
Citation preview
Volume�1:�Needs�and�Resource�Assessment�� 165��
APPENDIX�A:�MARKET�SEGMENTATION�–�TAPESTRY�REPORT�
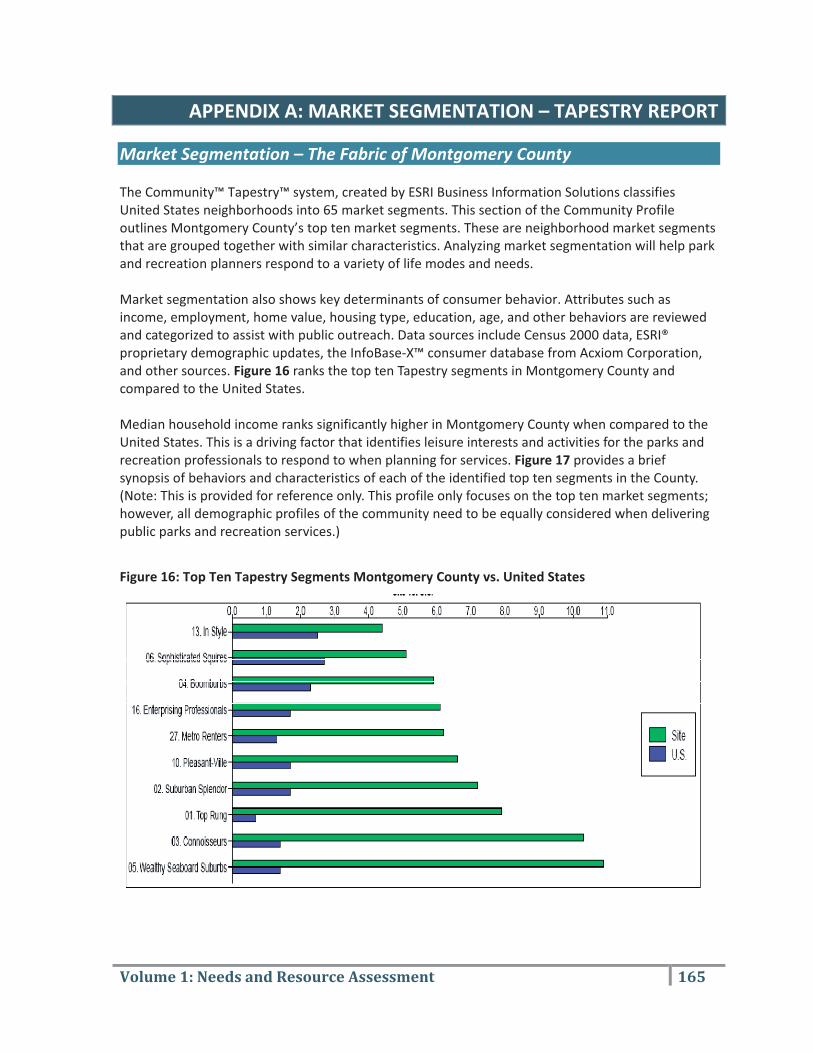
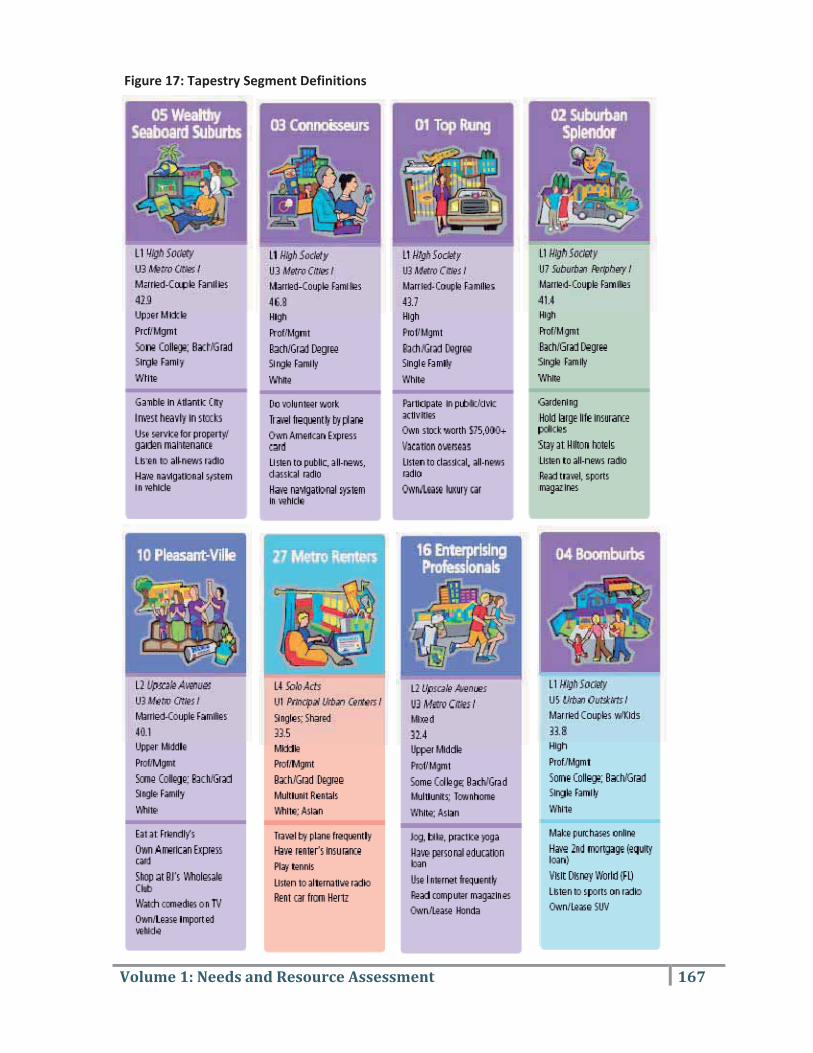
Market�Segmentation�–�The�Fabric�of�Montgomery�County��The�Community™�Tapestry™�system,�created�by�ESRI�Business�Information�Solutions�classifies�United�States�neighborhoods�into�65�market�segments.�This�section�of�the�Community�Profile�outlines�Montgomery�County’s�top�ten�market�segments.�These�are�neighborhood�market�segments�that�are�grouped�together�with�similar�characteristics.�Analyzing�market�segmentation�will�help�park�and�recreation�planners�respond�to�a�variety�of�life�modes�and�needs.���Market�segmentation�also�shows�key�determinants�of�consumer�behavior.�Attributes�such�as�income,�employment,�home�value,�housing�type,�education,�age,�and�other�behaviors�are�reviewed�and�categorized�to�assist�with�public�outreach.�Data�sources�include�Census�2000�data,�ESRI®�proprietary�demographic�updates,�the�InfoBase�X™�consumer�database�from�Acxiom�Corporation,�and�other�sources.�Figure�16�ranks�the�top�ten�Tapestry�segments�in�Montgomery�County�and�compared�to�the�United�States.���Median�household�income�ranks�significantly�higher�in�Montgomery�County�when�compared�to�the�United�States.�This�is�a�driving�factor�that�identifies�leisure�interests�and�activities�for�the�parks�and�recreation�professionals�to�respond�to�when�planning�for�services.�Figure�17�provides�a�brief�synopsis�of�behaviors�and�characteristics�of�each�of�the�identified�top�ten�segments�in�the�County.�(Note:�This�is�provided�for�reference�only.�This�profile�only�focuses�on�the�top�ten�market�segments;�however,�all�demographic�profiles�of�the�community�need�to�be�equally�considered�when�delivering�public�parks�and�recreation�services.)���
Figure�16:�Top�Ten�Tapestry�Segments�Montgomery�County�vs.�United�States�
����

166� � � � Montgomery�County,�Maryland�
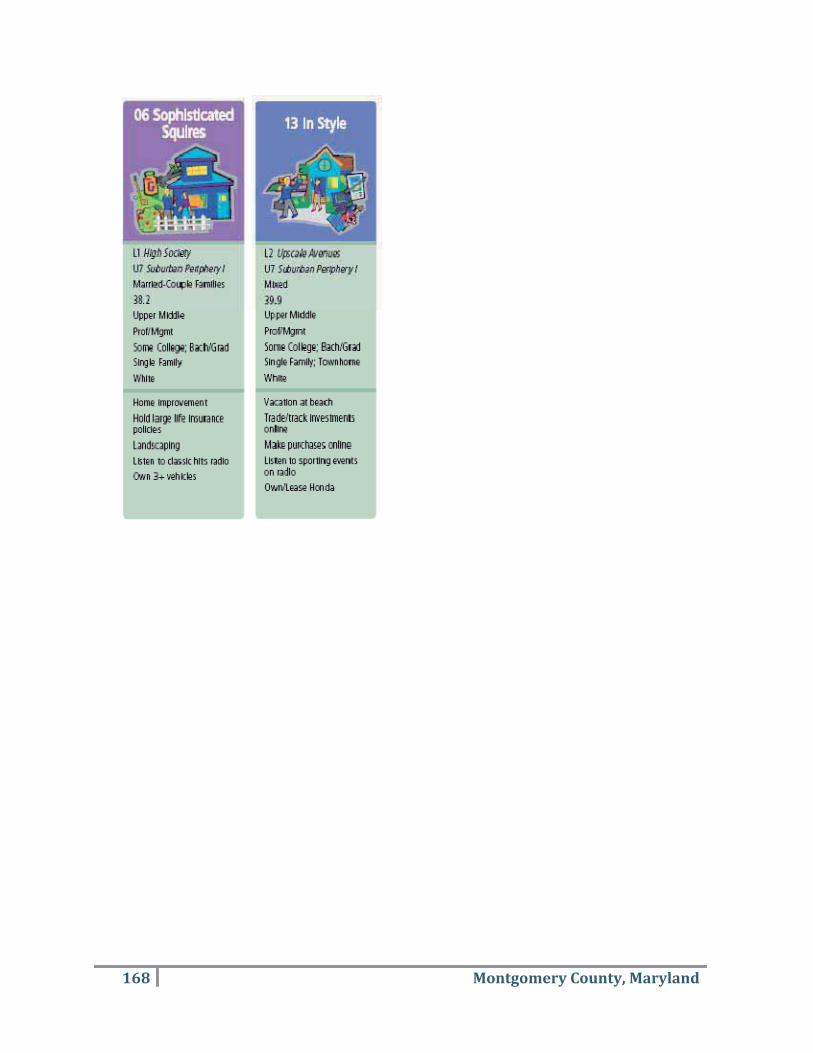
The�following�segment�definitions�shown�in�Figure�17�illustrate�key�characteristics�and�leisure�interests�for�the�fabric�of�Montgomery�County�according�to�the�Tapestry�Report.�“Life�modes”�for�the�majority�of�the�top�ten�market�segments�are�classified�as,�L1�High�Society.�Defined�by�ESRI’s�Tapestry�Segmentation,�L1�High�Society�represents�affluent,�well�educated,�married�couples,�and�homeowners.�While�three�of�the�segments�represent�L2�Upscale�Avenue�life�modes,�defined�as�prosperous�married�couple�homeowners�in�different�housing.�One�of�the�top�ten�market�segments�represents�life�mode,�L4�Solo�Acts,�defined�as�urban�young�singles�on�the�move.�It�should�be�recognized�that�when�compared�to�the�United�States,�Montgomery�County�has�a�higher�percentage�of�white�residents�making�above�the�national�average�household�incomes�and�holding�higher�education�degrees.����
Volume�1:�Needs�and�Resource�Assessment�� 167��
� � � �
Figure�17:�Tapestry�Segment�Definitions�
168� � � � Montgomery�County,�Maryland�
Volume�1:�Needs�and�Resource�Assessment�� 169��
APPENDIX�B:�PARKS�&�RECREATION�TRENDS��PARKS�&�RECREATION�TRENDS���A�challenge�of�parks�and�recreation�departments�is�to�continue�to�understand�and�respond�to�the�changing�characteristics�of�those�it�serves.�In�this�fast�paced�society�it�is�important�to�stay�on�top�of�current�trends�impacting�parks�and�recreation.�The�following�information�highlights�relevant�local,�regional,�and�national�parks�and�recreational�trends�from�various�sources.��
The�Montgomery�County�demographic�profile�shows�an�upward�trend�in�community�diversity.�Each�sub�area�will�need�to�plan�for�these�demographic�shifts.�The�County�will�see�more�seniors,�variety�of�ethnic�backgrounds,�young�families,�working�professionals,�and�single�people.�The�trends�listed�below�can�help�parks�and�recreation�professionals�respond�to�their�community�needs.��
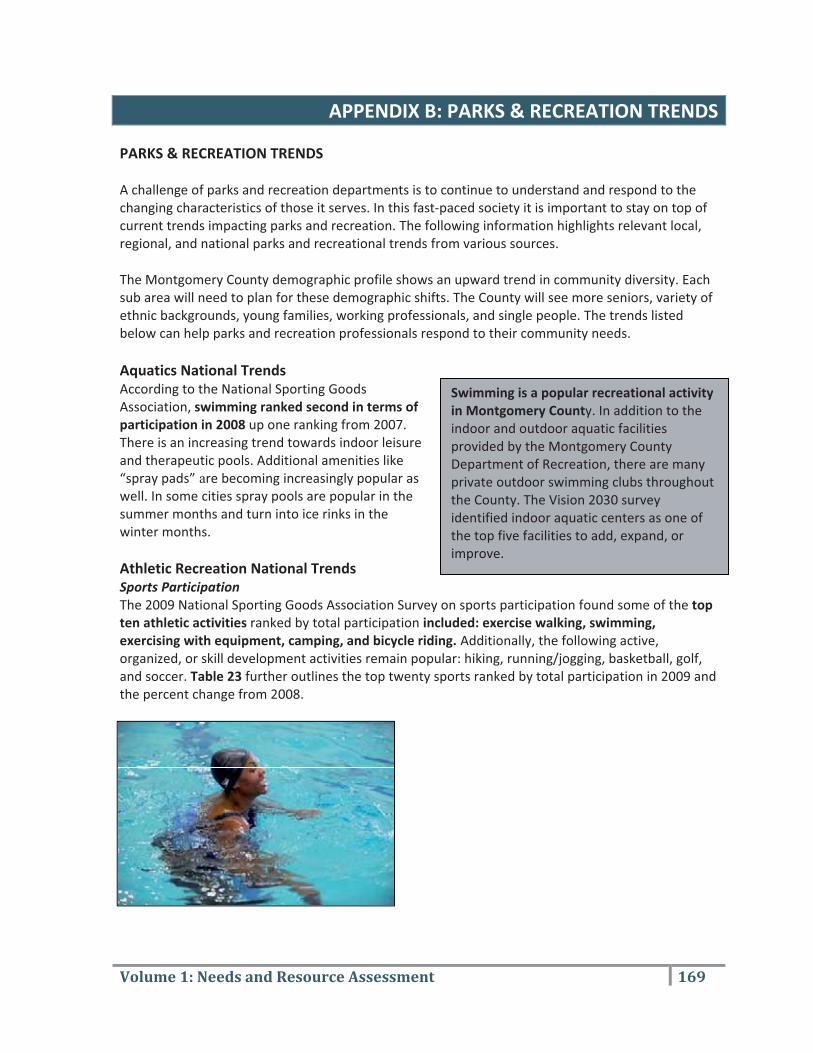
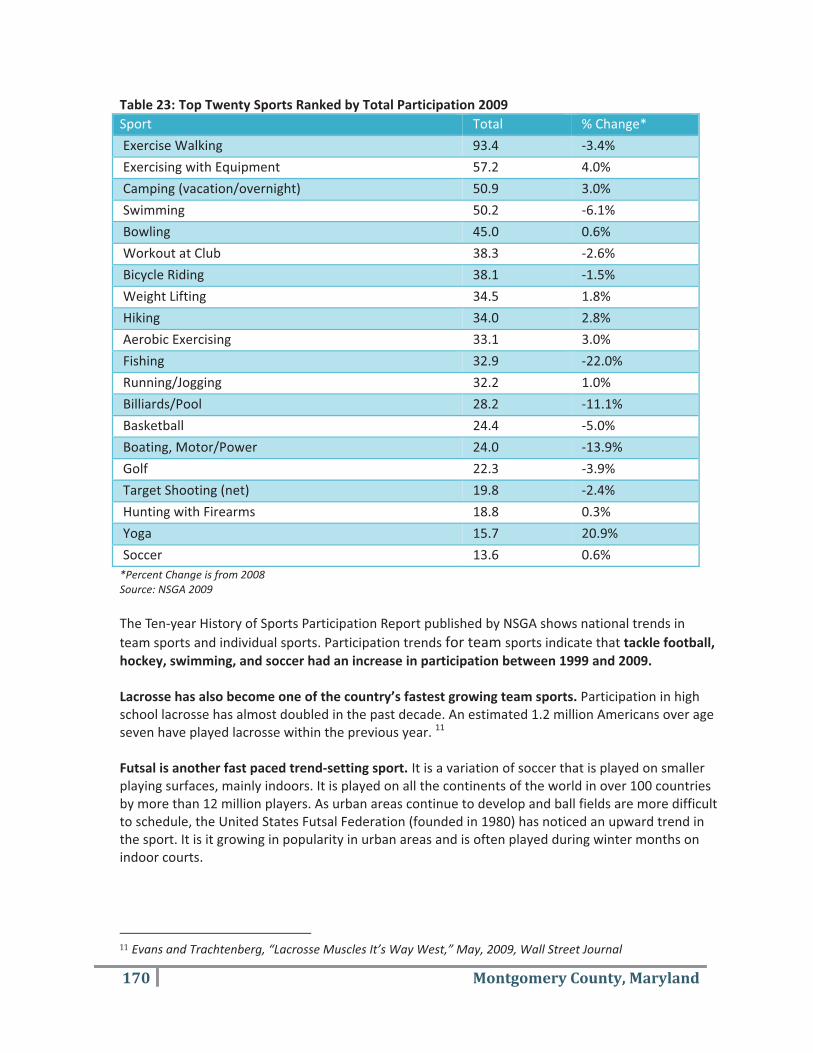
Aquatics�National�Trends�According�to�the�National�Sporting�Goods�Association,�swimming�ranked�second�in�terms�of�participation�in�2008�up�one�ranking�from�2007.�There�is�an�increasing�trend�towards�indoor�leisure�and�therapeutic�pools.�Additional�amenities�like�“spray�pads” are�becoming�increasingly�popular�as�well.�In�some�cities�spray�pools�are�popular�in�the�summer�months�and�turn�into�ice�rinks�in�the�winter�months.���Athletic�Recreation�National�Trends��Sports�Participation�The�2009�National�Sporting�Goods�Association�Survey�on�sports�participation�found�some�of�the�top�ten�athletic�activities�ranked�by�total�participation�included:�exercise�walking,�swimming,�exercising�with�equipment,�camping,�and�bicycle�riding. Additionally,�the�following�active,�organized,�or�skill�development�activities�remain�popular:�hiking,�running/jogging,�basketball,�golf,�and�soccer.�Table�23�further�outlines�the�top�twenty�sports�ranked�by�total�participation�in�2009�and�the�percent�change�from�2008.�
�� �
Swimming�is�a�popular�recreational�activity�in�Montgomery�County.�In�addition�to�the�indoor�and�outdoor�aquatic�facilities�provided�by�the�Montgomery�County�Department�of�Recreation,�there�are�many�private�outdoor�swimming�clubs�throughout�the�County.�The�Vision�2030�survey�identified�indoor�aquatic�centers�as�one�of�the�top�five�facilities�to�add,�expand,�or�improve.��
170� � � � Montgomery�County,�Maryland�
Table�23: Top�Twenty�Sports�Ranked�by�Total�Participation�2009�Sport�� �Total�� �%�Change*�
�Exercise�Walking�� �93.4�� ��3.4%��
�Exercising�with�Equipment�� �57.2�� �4.0%��
�Camping�(vacation/overnight)�� �50.9�� �3.0%��
�Swimming�� �50.2�� ��6.1%��
�Bowling�� �45.0�� �0.6%��
�Workout�at�Club�� �38.3�� ��2.6%��
�Bicycle�Riding�� �38.1�� ��1.5%��
�Weight�Lifting�� �34.5�� �1.8%��
�Hiking�� �34.0�� �2.8%��
�Aerobic�Exercising�� �33.1�� �3.0%��
�Fishing�� �32.9�� ��22.0%��
�Running/Jogging�� �32.2�� �1.0%��
�Billiards/Pool�� �28.2�� ��11.1%��
�Basketball�� �24.4�� ��5.0%��
�Boating,�Motor/Power�� �24.0�� ��13.9%��
�Golf�� �22.3�� ��3.9%��
�Target�Shooting�(net)�� �19.8�� ��2.4%��
�Hunting�with�Firearms�� �18.8�� �0.3%��
�Yoga�� �15.7�� �20.9%��
�Soccer�� �13.6�� �0.6%��*Percent�Change�is�from�2008�Source:�NSGA�2009��The�Ten�year�History�of�Sports�Participation�Report�published�by�NSGA�shows�national�trends�in�team�sports�and�individual�sports.�Participation�trends�for�team�sports�indicate�that�tackle�football,�hockey,�swimming,�and�soccer�had�an�increase�in�participation�between�1999�and�2009.���Lacrosse�has�also�become�one�of�the�country’s�fastest�growing�team�sports.�Participation�in�high�school�lacrosse�has�almost�doubled�in�the�past�decade.�An�estimated�1.2�million�Americans�over�age�seven�have�played�lacrosse�within�the�previous�year.�11���Futsal�is�another�fast�paced�trend�setting�sport.�It�is�a�variation�of�soccer�that�is�played�on�smaller�playing�surfaces,�mainly�indoors.�It�is�played�on�all�the�continents�of�the�world�in�over�100�countries�by�more�than�12�million�players.�As�urban�areas�continue�to�develop�and�ball�fields�are�more�difficult�to�schedule,�the�United�States�Futsal�Federation�(founded�in�1980)�has�noticed�an�upward�trend�in�the�sport.�It�is�it�growing�in�popularity�in�urban�areas�and�is�often�played�during�winter�months�on�indoor�courts.����
11 Evans�and�Trachtenberg,�“Lacrosse�Muscles�It’s�Way�West,”�May,�2009,�Wall�Street�Journal
Volume�1:�Needs�and�Resource�Assessment�� 171��
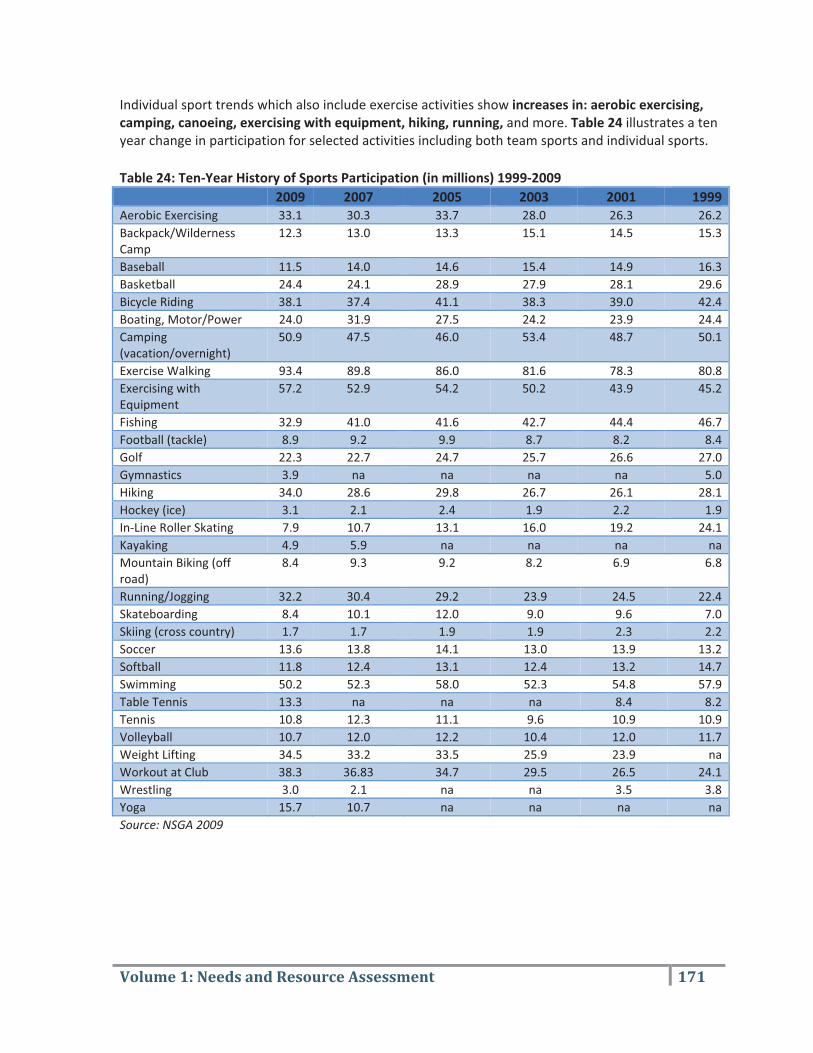
Individual�sport�trends�which�also�include�exercise�activities�show�increases�in:�aerobic�exercising,�camping,�canoeing,�exercising�with�equipment,�hiking,�running,�and�more.�Table�24�illustrates�a�ten�year�change�in�participation�for�selected�activities�including�both�team�sports�and�individual�sports.��
�Table�24:�Ten�Year�History�of�Sports�Participation�(in�millions)�1999�2009�� 2009�� 2007�� 2005�� 2003�� 2001�� 1999�Aerobic�Exercising�� 33.1�� 30.3� 33.7� 28.0� 26.3�� 26.2�Backpack/Wilderness�Camp��
12.3�� 13.0� 13.3� 15.1� 14.5�� 15.3�
Baseball�� 11.5�� 14.0� 14.6� 15.4� 14.9�� 16.3�Basketball�� 24.4�� 24.1� 28.9� 27.9� 28.1�� 29.6�Bicycle�Riding�� 38.1�� 37.4� 41.1� 38.3� 39.0�� 42.4�Boating,�Motor/Power� 24.0�� 31.9� 27.5� 24.2� 23.9�� 24.4�Camping�(vacation/overnight)��
50.9�� 47.5� 46.0� 53.4� 48.7�� 50.1�
Exercise�Walking�� 93.4�� 89.8� 86.0� 81.6� 78.3�� 80.8�Exercising�with�Equipment��
57.2�� 52.9� 54.2� 50.2� 43.9�� 45.2�
Fishing�� 32.9�� 41.0� 41.6� 42.7� 44.4�� 46.7�Football�(tackle)�� 8.9�� 9.2� 9.9� 8.7� 8.2�� 8.4�Golf�� 22.3�� 22.7� 24.7� 25.7� 26.6�� 27.0�Gymnastics�� 3.9�� na� na� na� na�� 5.0�Hiking�� 34.0�� 28.6� 29.8� 26.7� 26.1�� 28.1�Hockey�(ice)�� 3.1�� 2.1� 2.4� 1.9� 2.2�� 1.9�In�Line�Roller�Skating�� 7.9�� 10.7� 13.1� 16.0� 19.2�� 24.1�Kayaking�� 4.9�� 5.9� na� na� na�� na�Mountain�Biking�(off�road)��
8.4�� 9.3� 9.2� 8.2� 6.9�� 6.8�
Running/Jogging�� 32.2�� 30.4� 29.2� 23.9� 24.5�� 22.4�Skateboarding�� 8.4�� 10.1� 12.0� 9.0� 9.6�� 7.0�Skiing�(cross�country)�� 1.7�� 1.7� 1.9� 1.9� 2.3�� 2.2�Soccer�� 13.6�� 13.8� 14.1� 13.0� 13.9�� 13.2�Softball�� 11.8�� 12.4� 13.1� 12.4� 13.2�� 14.7�Swimming�� 50.2�� 52.3� 58.0� 52.3� 54.8�� 57.9�Table�Tennis�� 13.3�� na� na� na� 8.4�� 8.2�Tennis�� 10.8�� 12.3� 11.1� 9.6� 10.9�� 10.9�Volleyball�� 10.7�� 12.0� 12.2� 10.4� 12.0�� 11.7�Weight�Lifting�� 34.5�� 33.2� 33.5� 25.9� 23.9�� naWorkout�at�Club�� 38.3�� 36.83� 34.7� 29.5� 26.5�� 24.1�Wrestling�� 3.0�� 2.1� na� na� 3.5�� 3.8�Yoga�� 15.7�� 10.7� na� na� na�� na�Source:�NSGA�2009�
������ �
172� � � � Montgomery�County,�Maryland�
Youth�Sports�Specific�offerings�for�kids’�fitness�are�slowly�increasing�in�health�and�fitness�facilities.�Facilities�are�offering�more�youth�specific�exercise�equipment.�Individualized�youth�sports�training�opportunities�are�becoming�more�popular�as�well.�For�youth�ages�7�to�11,�bowling,�bicycle�riding,�and�fishing�had�the�highest�number�of�participants�in�2009;�however,�skateboarding,�snowboarding,�and�tackle�football�saw�the�highest�percent�of�increase�in�2009.12�It�is�important�to�note�that�of�the�six�sports�mentioned�above,�football�was�the�only�team�sport.�In�line�skating�experienced�the�largest�decrease�in�participation�followed�by�softball.��Another�noteworthy�trend�is�the�increase�in�‘pick�up’�play�in�team�sports.�In�recent�years,�the�Sporting�Goods�Manufacturers�Association�(SGMA)�noticed�that�participation�in�team�sports�has�been�driven�by�organized/sanctioned�play.�13�However,�in�2008,�there�were�seven�team�sports�where�‘casual/pick�up’�play�exceeded�organized/sanctioned�play.�Those�sports�were�basketball,�ice�hockey,�field�hockey,�touch�football,�lacrosse,�grass�volleyball,�and�beach�volleyball.�It�is�believed�that�this�is�the�result�of�athletes�and�their�families�feeling�the�pinch�of�the�economy.�Many�people�are�choosing�the�less�expensive�ways�to�play�sports�and�stay�active.���Racquet�Sports�Badminton,�racquetball,�squash,�table�tennis,�and�tennis�all�demonstrate�gains�in�participation.�According�to�the�Sporting�Goods�Manufacturer’s�Association�in�June�of�2008�tennis�participation�has�increased�by�31�percent�since�2000,�but�saw�a�drop�in�2009.��
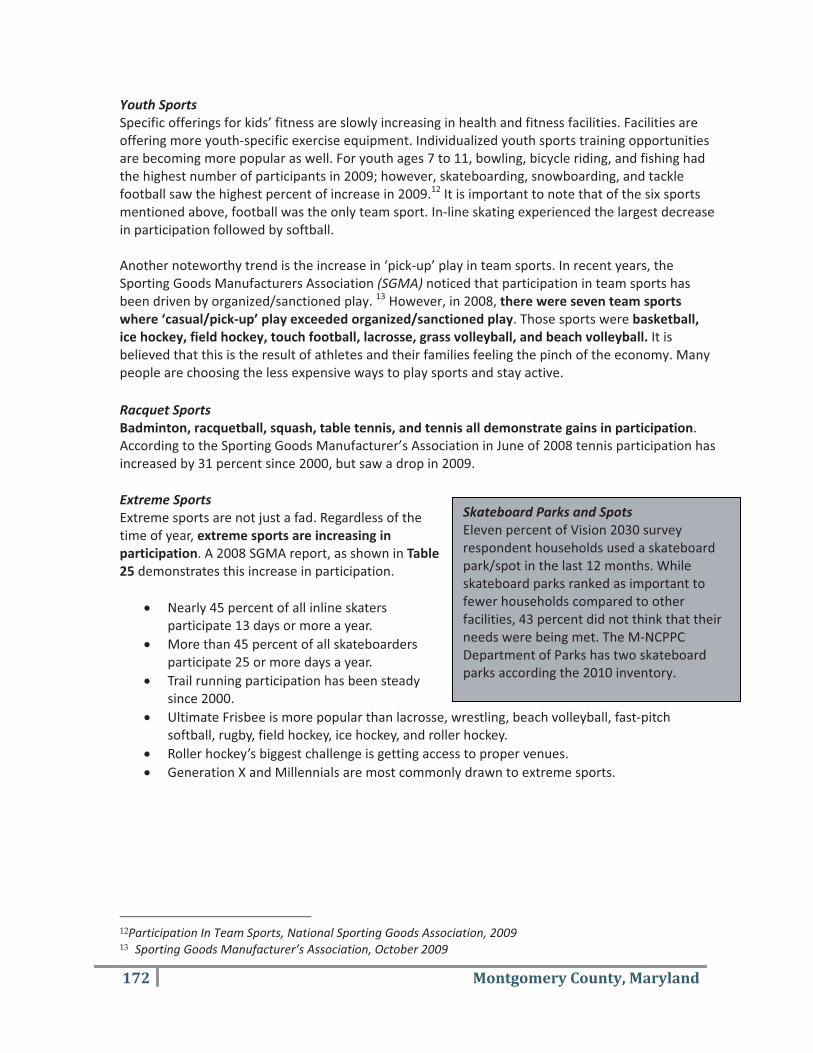
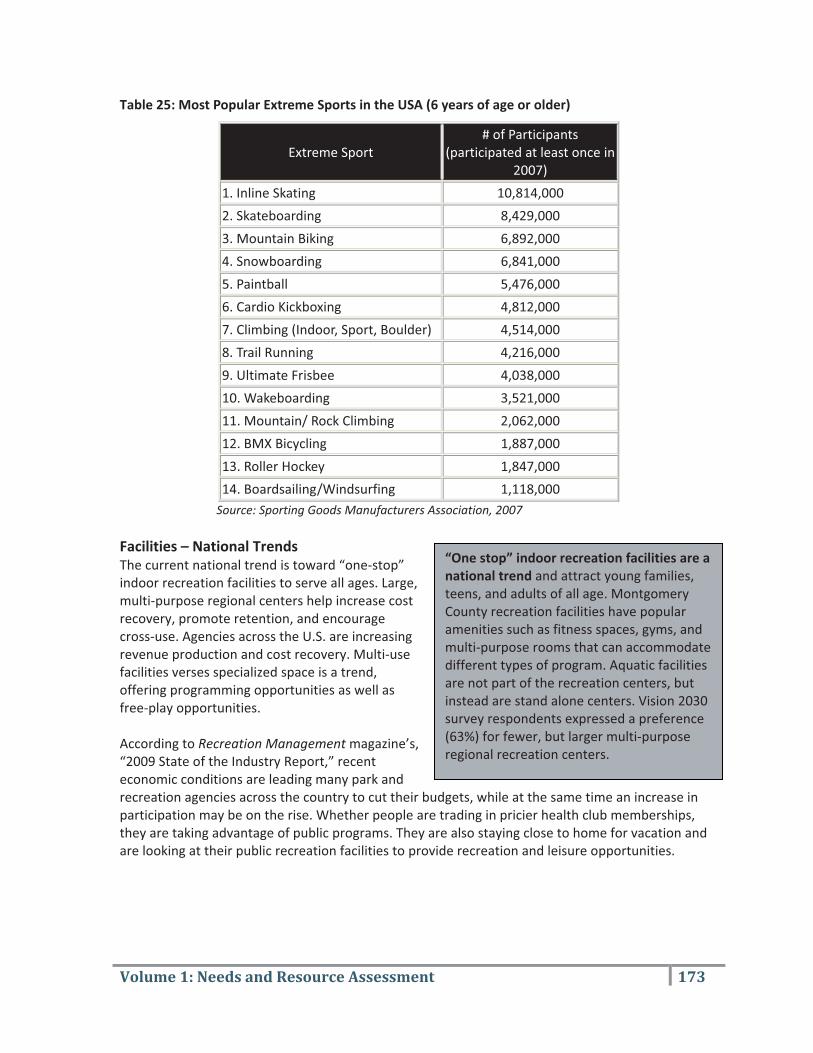
Extreme�Sports�Extreme�sports�are�not�just�a�fad.�Regardless�of�the�time�of�year,�extreme�sports�are�increasing�in�participation.�A�2008�SGMA�report,�as�shown�in�Table�25�demonstrates�this�increase�in�participation.��
� Nearly�45�percent�of�all�inline�skaters�participate�13�days�or�more�a�year.�
� More�than�45�percent�of�all�skateboarders�participate�25�or�more�days�a�year.�
� Trail�running�participation�has�been�steady�since�2000.�
� Ultimate�Frisbee�is�more�popular�than�lacrosse,�wrestling,�beach�volleyball,�fast�pitch�softball,�rugby,�field�hockey,�ice�hockey,�and�roller�hockey.�
� Roller�hockey’s�biggest�challenge�is�getting�access�to�proper�venues.�� Generation�X�and�Millennials�are�most�commonly�drawn�to�extreme�sports.�
� �
12Participation�In�Team�Sports,�National�Sporting�Goods�Association,�2009 13 Sporting�Goods�Manufacturer’s�Association,�October�2009
Skateboard�Parks�and�Spots�Eleven�percent�of�Vision�2030�survey�respondent�households�used�a�skateboard�park/spot�in�the�last�12�months.�While�skateboard�parks�ranked�as�important�to�fewer�households�compared�to�other�facilities,�43�percent�did�not�think�that�their�needs�were�being�met.�The�M�NCPPC�Department�of�Parks�has�two�skateboard�parks�according�the�2010�inventory.�
Volume�1:�Needs�and�Resource�Assessment�� 173��
Table�25:�Most�Popular�Extreme�Sports�in�the�USA�(6�years�of�age�or�older)�
Extreme�Sport�#�of�Participants�
(participated�at�least�once�in�2007)�
1.�Inline�Skating� 10,814,000�
2.�Skateboarding� 8,429,000�
3.�Mountain�Biking� 6,892,000�
4.�Snowboarding� 6,841,000�
5.�Paintball� 5,476,000�
6.�Cardio�Kickboxing� 4,812,000�
7.�Climbing�(Indoor,�Sport,�Boulder)� 4,514,000�
8.�Trail�Running� 4,216,000�
9.�Ultimate�Frisbee� 4,038,000�
10.�Wakeboarding� 3,521,000�
11.�Mountain/�Rock�Climbing� 2,062,000�
12.�BMX�Bicycling� 1,887,000�
13.�Roller�Hockey� 1,847,000�
14.�Boardsailing/Windsurfing� 1,118,000�� Source:�Sporting�Goods�Manufacturers�Association,�2007�
Facilities�–�National�Trends��The�current�national�trend�is�toward�“one�stop”�indoor�recreation�facilities�to�serve�all�ages.�Large,�multi�purpose�regional�centers�help�increase�cost�recovery,�promote�retention,�and�encourage�cross�use.�Agencies�across�the�U.S.�are�increasing�revenue�production�and�cost�recovery.�Multi�use�facilities�verses�specialized�space�is�a�trend,�offering�programming�opportunities�as�well�as�free�play�opportunities.���According�to�Recreation�Management�magazine’s,�“2009�State�of�the�Industry�Report,”�recent�economic�conditions�are�leading�many�park�and�recreation�agencies�across�the�country�to�cut�their�budgets,�while�at�the�same�time�an�increase�in�participation�may�be�on�the�rise.�Whether�people�are�trading�in�pricier�health�club�memberships,�they�are�taking�advantage�of�public�programs.�They�are�also�staying�close�to�home�for�vacation�and�are�looking�at�their�public�recreation�facilities�to�provide�recreation�and�leisure�opportunities.������
“One�stop”�indoor�recreation�facilities�are�a�national�trend�and�attract�young�families,�teens,�and�adults�of�all�age.�Montgomery�County�recreation�facilities�have�popular�amenities�such�as�fitness�spaces,�gyms,�and�multi�purpose�rooms�that�can�accommodate�different�types�of�program.�Aquatic�facilities�are�not�part�of�the�recreation�centers,�but�instead�are�stand�alone�centers.�Vision�2030�survey�respondents�expressed�a�preference�(63%)�for�fewer,�but�larger�multi�purpose�regional�recreation�centers.
174� � � � Montgomery�County,�Maryland�
The�report�also�summarized�a�survey�that�included�public,�private,�and�non�profit�agencies.�The�following�trends�were�highlighted�specific�to�facilities:��
� Despite�crunching�budgets,�respondents�were�slightly�more�likely�than�average�to�be�planning�to�build�new�facilities,�or�make�additions�and�renovations�to�their�existing�facilities.�Although�it�is�noted�that�percentages�are�slightly�lower�than�previous�years.��
� The�top�10�amenities�currently�to�be�included�in�park�facilities�are:��1. Playgrounds�(included�by�81.4�percent�of�
park�respondents).�2. Park�structures�like�restroom�buildings�
and�picnic�shelters�(80.6�percent).�3. Open�spaces�like�natural�areas�and�
gardens�(71.6�percent).�4. Outdoor�sports�courts�for�games�like�basketball�and�tennis�(70.6�percent).�5. Natural�turf�sports�fields�for�baseball�and�football�(70.6�percent).�6. Trails�(68.4�percent).�7. Bleachers�and�seating�(68.3�percent).�8. Concession�areas�(65.4�percent).�9. Classrooms�and�meeting�rooms�(53.7�percent).�10. Community�or�multipurpose�centers�(49.3�percent).�
�Amenities�and�specialty�parks�that�are�still�considered�“alternative”�but�increasing�in�popularity�include�the�following:��
� Climbing�walls.�� Cultural�art�facilities.�� Green�design�techniques�and�certifications�such�as�Leadership�in�Energy�and�Environmental�
Design�(LEED).�A�recent�Building�Commissioners�Association�(BCA)�survey�indicated�that�52�percent�of�the�recreation�industry�survey�respondents�indicated�they�were�willing�to�pay�more�for�green�design�knowing�that�it�would�significantly�reduce�or�eliminate�the�negative�impact�of�buildings�on�the�environment�and�occupants.
� Two�of�the�emerging�specialty�parks�include�skate�parks�and�dog�parks.�The�Sporting�Goods�Manufacturers�Association�estimates�there�are�about�1,000�skateboard�parks�in�the�United�States.�
�Fitness�and�Health�National�Trends�There�have�been�many�changes�in�fitness�programs�from�1998�to�2008.�What�clients�wanted�in�1998�is�not�necessarily�what�they�want�today.�Fitness�programs�that�have�increased�in�popularity�since�1998�include�Pilates,�stability/ball�based,�personal�training�(two�clients�share),�post�rehabilitation,�kids�specific�fitness,�and�sport�specific�training.�Declining�programs�since�1998�include�dance,�health�fairs,�sports�clinics,�aerobics,�stress�management�classes,�and�weight�management�classes.�(IDEA�Health�and�Fitness�Association)���
Trails,�playgrounds,�and�natural�areas�were�identified�as�top�priorities�to�add,�expand,�or�improve�in�the�Vision�2030�survey.
Exercise�and�fitness�programs�rated�as�the�top�program�to�add,�expand�or�improve�according�to�the�Vision�2030�survey�and�had�the�highest�frequency�of�participation.�
Volume�1:�Needs�and�Resource�Assessment�� 175��
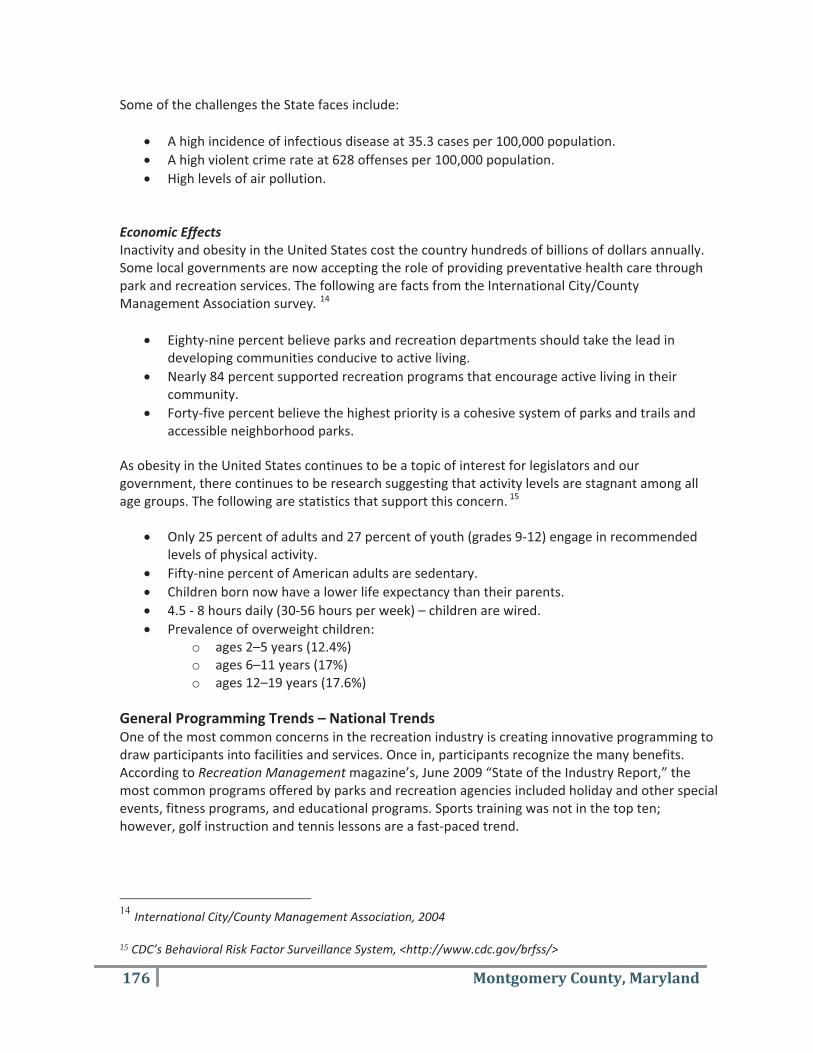
The�American�College�of�Sports�Medicine’s�(ACSM’s)�Health�and�Fitness�Journal�conducted�a�survey�to�determine�trends�that�would�help�create�a�standard�for�health�and�fitness�programming.�Table�26�shows�survey�results�that�focus�on�trends�in�the�commercial,�corporate,�clinical,�and�community�health�and�fitness�industry.�The�Worldwide�Survey�indicates�the�following�shift�in�fitness�trends�between�2007�and�2008.��
Table�26:�Worldwide�Fitness�Trends�(2007�and�2008)�
2007� 20081.�exercise�programs�for�children�to�fight�childhood�and�adolescent�obesity��
1.�educated�and�experiencedfitness�professionals�
*2.�special�fitness�programs�for�older�adults�fitness�professionals��
2.�exercise�programs�for�children�to�fight�childhood�and�adolescent�obesity�
*2.�educated�and�experienced�fitness�professionals�
3.�personal�training�
*2.�functional�fitness��
4.�strength�training
*2.�core�training��
5.�core�training
*2.�strength�training��
6.�special�fitness�programs�for�older�adults�
7.�personal�training��
7.�Pilates
8.�mind/body�exercise��
8.�functional�fitness
9.�exercise�and�weight�loss��
9.�Swiss�ball�
10.�outcome�measurements��
10.�yoga�
*tied�Source:�American�College�of�Sport�Medicine��Health�and�Obesity�Trends�The�United�Health�Foundation�has�ranked�Maryland�21st�in�its�2009�State�Health�Rankings,�up�one�rank�from�2008.���The�State’s�biggest�strengths�include:��
� Low�prevalence�of�smoking�at�14.9�percent�of�the�population.��� Low�percentage�of�children�in�poverty�at�10�percent�of�persons�under�age�18.�� High�immunization�coverage�with�82.6�percent�of�children�ages�19�to�35�months�receiving�
complete�immunizations.�������
176� � � � Montgomery�County,�Maryland�
Some�of�the�challenges�the�State�faces�include:��
� A�high�incidence�of�infectious�disease�at�35.3�cases�per�100,000�population.�� A�high�violent�crime�rate�at�628�offenses�per�100,000�population.��� High�levels�of�air�pollution.�
��Economic�Effects��Inactivity�and�obesity�in�the�United�States�cost�the�country�hundreds�of�billions�of�dollars�annually.�Some�local�governments�are�now�accepting�the�role�of�providing�preventative�health�care�through�park�and�recreation�services.�The�following�are�facts�from�the�International�City/County�Management�Association�survey.�14��
� Eighty�nine�percent�believe�parks�and�recreation�departments�should�take�the�lead�in�developing�communities�conducive�to�active�living.�
� Nearly�84�percent�supported�recreation�programs�that�encourage�active�living�in�their�community.�
� Forty�five�percent�believe�the�highest�priority�is�a�cohesive�system�of�parks�and�trails�and�accessible�neighborhood�parks.�
As�obesity�in�the�United�States�continues�to�be�a�topic�of�interest�for�legislators�and�our�government,�there�continues�to�be�research�suggesting�that�activity�levels�are�stagnant�among�all�age�groups.�The�following�are�statistics�that�support�this�concern.�15
� Only�25�percent�of�adults�and�27�percent�of�youth�(grades�9�12)�engage�in�recommended�levels�of�physical�activity.
� Fifty�nine�percent�of�American�adults�are�sedentary.��� Children�born�now�have�a�lower�life�expectancy�than�their�parents.��� 4.5���8�hours�daily�(30�56�hours�per�week)�–�children�are�wired.��� Prevalence�of�overweight�children:�
o ages�2–5�years�(12.4%)�o ages�6–11�years�(17%)�o ages�12–19�years�(17.6%)�
General�Programming�Trends�–�National�Trends�One�of�the�most�common�concerns�in�the�recreation�industry�is�creating�innovative�programming�to�draw�participants�into�facilities�and�services.�Once�in,�participants�recognize�the�many�benefits.�According�to�Recreation�Management�magazine’s,�June�2009�“State�of�the�Industry�Report,”�the�most�common�programs�offered�by�parks�and�recreation�agencies�included�holiday�and�other�special�events,�fitness�programs,�and�educational�programs.�Sports�training�was�not�in�the�top�ten;�however,�golf�instruction�and�tennis�lessons�are�a�fast�paced�trend.��
14 International�City/County�Management�Association,�2004��15�CDC’s�Behavioral�Risk�Factor�Surveillance�System,�<http://www.cdc.gov/brfss/>�

Volume�1:�Needs�and�Resource�Assessment�� 177��
Recreation�Management�magazine’s�“2009�State�of�the�Industry�Report”�highlighted�the�following�top�10�programs�most�commonly�offered�by�parks�and�recreation�agencies:��
1. Holidays�and�Special�Events��2. Fitness�Programs�3. Educational�Programs�4. Day�Camps�5. Youth�Sports�Teams�6. Adult�Sports�Teams�7. Swimming�Programming�8. Sports�Tournaments�or�Races�9. Mind�Body/Balance�(e.g.�yoga�and�tai�chi)�10. Arts�&�Crafts�
�Heritage�Tourism�According�to�the�Advisory�Council�on�Historic�Preservation�(ACHP),�“Heritage�tourism�programs�and�projects�include�actively�attracting�visitors�as�a�form�of�local�or�regional�economic�development.�Heritage�tourism�is�defined�in�Executive�Order�13287�as�‘the�business�and�practice�of�attracting�and�accommodating�visitors�to�a�place�or�area�based�especially�on�the�unique�or�special�aspects�of�that�locale’s�history,�landscape,�and�culture.’”�16��Today,�tourism,�preservation,�heritage,�and�culture�are�much�more�likely�to�overlap.�Some�state�and�local�agencies�and�tourism�offices�help�develop�heritage�resources.�For�example,�the�Maryland�Heritage�Area�Authority�(part�of�the�Maryland�Historical�Trust�and�the�Maryland�Department�of�Planning)�as�well�as�a�local�Heritage�Tourism�Alliance,�Inc.�support�and�collaborate�with�the���������������M�NCPPC�Department�of�Parks.�The�department’s�Cultural�Resources�program�receives�state�heritage�tourism�grants�every�year,�as�nominated�by�the�countywide�Heritage�Tourism�Alliance,�which�is�required�via�by�the�certified�Montgomery�County�Heritage�Area�Management�Plan.��A�number�of�preservation�organizations�are�marketing�their�sites�to�tourists.�However,�not�every�community�can�have�a�successful�cultural�heritage�tourism�program.�Communities�that�have�lost�too�much�of�their�heritage,�or�not�nurtured�their�cultural�potential�may�not�have�the�historic,�cultural�and�natural�resources�it�takes�to�develop�a�program�that�will�attract�cultural�heritage�visitors.17��
16�Advisory�Council�on�Historic�Preservation,�Preserving�America’s�Heritage,�ACHP�Policy�Statement:��Archaeology,�Heritage�Tourism,�and�Education��17�Getting�Started:�How�to�Succeed�in�Cultural�Heritage�Tourism,�<culturalheritagetourism.org/howToGetStarted>��
Historic/archeological�sites�were�rated�as�very�important�to�47�percent�of�Vision�2030�survey�respondents;�however,�were�ranked�as�a�lower�priority�to�improve�and�expand�compared�to�other�parks�and�recreation�facilities.�Thirty�five�percent�of�respondents�visited�a�historic/archeological�site�within�the�last�year�(at�a�average�frequency�of�1�2�times�a�year).
178� � � � Montgomery�County,�Maryland�
�As�noted�in�the�ACHP�Policy�Statement�on�Archeology,�Heritage�Tourism,�and�Education:�“It�is�the�policy�of�the�federal�government�to�provide�leadership�in�preserving�America’s�heritage�by�actively�advancing�the�protection,�enhancement,�and�contemporary�use�of�the�historic�properties�owned�by�the�federal�government,�and�by�promoting�intergovernmental�cooperation�and�partnerships�for�the�preservation�and�use�of�historic�properties.”�Executive�Order�13287�recognizes�the�importance�of�preserving�“the�unique�cultural�heritage�of�communities�and�of�the�nation,�and�to�realize�the�economic�benefit�that�these�properties�can�provide.”�18�Some�of�the�benefits�of�heritage�tourism�include:��
� Economic�impact�on�local�economies�–�It�promotes�community�pride,�and�a�tourist�industry.��� New�opportunities�–�Tourists�can�gain�an�understanding�of�unfamiliar�places.�� Diversified�economies�–�Communities�are�made�special,�thus�opportunities�increase�ways�to�
prosper�economically.���Marketing�Niche�marketing�trends�have�experienced�change�more�frequently�than�ever�before�as�technology�affects�the�way�the�public�receives�information.�Web�2.0�tools�and�now�Web�3.0�tools�are�a�trend�for�agencies�to�use�as�a�means�of�marketing�programs�and�services.�Popular�social�marketing�electronic�tools�include:�Facebook,�Myspace,�Whirl,�Twitter,�You�Tube,�Flickr,�and�LinkedIn.��Mobile�marketing�is�a�trend�of�the�future.�Young�adults�engage�in�mobile�data�applications�at�much�higher�rates�than�adults�in�age�brackets�30�and�older.19�Usage�rates�of�mobile�applications�demonstrate�chronologically�across�four�major�age�cohorts,�that�millennials�tend�to�get�information�more�frequently�using�mobile�devices�such�as�smart�phones.�For�example,�95%�of�18�to�29�year�old�cell�phone�owners�send�and�receive�text�messages,�compared�to�82%�of�30�to�49�year�olds,�57%�of�50�to�64�year�olds,�and�19%�of�65�and�older.�It�is�also�a�fact�that�minority�Americans�lead�the�way�when�it�comes�to�mobile�access.�Nearly�two�thirds�of�African�Americans�(64%)�and�Latinos�(63%)�are�wireless�internet�users,�and�minority�Americans�are�significantly�more�likely�to�own�a�cell�phone�than�are�their�white�counterparts�(87%�of�blacks�and�Hispanics�own�a�cell�phone,�compared�with�80%�of�whites).20�
Natural�Environments�and�Open�Space�Economic�&�Health�Benefits�of�Parks��There�are�numerous�economic�and�health�benefits�of�parks,�including�the�following:��
� Trails,�parks,�and�playgrounds�are�among�the�five�most�important�community�amenities�considered�when�selecting�a�home.�21�
�
18Advisory�Council�on�Historic�Preservation,�Preserving�America’s�Heritage,�ACHP�Policy�Statement:��Archaeology,�Heritage�Tourism,�and�Education�19�Pew�Internet�and�American�Life�Project,�July�7,�2010�20<�MarketingChart.com>�accessed�July�13,�2010�21�Pack�and�Schunel,�Pack,�A.�&�Schunel,�“The�Economics�of�Urban�Park�Planning,”�Parks�and�Recreation,�August�2005�
Vision�2030�survey�respondents�indicated�a�preference�to�receiving�information�on�program�and�facilities�by�e�mail�and�internet/website.�
Volume�1:�Needs�and�Resource�Assessment�� 179��
� Research�from�the�University�of�Illinois�shows�that�trees,�parks,�and�green�spaces�have�a�profound�impact�on�people’s�health�and�mental�outlook.�22�US�Forest�Service�research�indicates�that�when�the�economic�benefits�produced�by�trees�are�assessed,�total�value�can�be�two�to�six�times�the�cost�for�tree�planting�and�care.��
� Fifty�percent�of�Americans�regard�outdoor�activities�as�their�main�source�of�exercise.23�“There’s�a�direct�link�between�a�lack�of�exposure�to�nature�and�higher�rates�of�attention�deficit�disorder,�obesity,�and�depression.�In�essence,�parks�and�recreation�agencies�can�and�are�becoming�the�‘preferred�provider’�for�offering�this�preventative�healthcare.”�–�Fran�P.�Mainella,�former�director�of�the�National�Park�Service�and�Instructor�at�Clemson�University.24�
�The�Trust�for�Public�Land�published�a�report�titled:�“The�Benefits�of�Parks:�Why�America�Needs�More�City�Parks�and�Open�Space.”25�The�report�makes�the�following�observations�about�the�health,�economic,�environmental,�and�social�benefits�of�parks�and�open�space:�
� Physical�activity�makes�people�healthier.�� Physical�activity�increases�with�access�to�parks.�� Contact�with�the�natural�world�improves�physical�and�physiological�health.��� Residential�and�commercial�property�values�increase.�� Value�is�added�to�community�and�economic�development�sustainability.�� Benefits�of�tourism�are�enhanced.�� Trees�are�effective�in�improving�air�quality�and�act�as�natural�air�conditioners.��� Trees�assist�with�storm�water�control�and�erosion.��� Crime�and�juvenile�delinquency�are�reduced.�� Recreational�opportunities�for�all�ages�are�provided.�� Stable�neighborhoods�and�strong�communities�are�created.�
Nature�Programming�In�April�2007,�the�National�Recreation�and�Park�Association�(NRPA)�sent�out�a�survey�to�member�agencies�in�order�to�learn�more�about�the�programs�and�facilities�that�public�park�and�recreation�agencies�provide�to�connect�children�and�their�families�with�nature.�A�summary�of�the�results�follow:��
� Sixty�eight�percent�of�public�park�and�recreation�agencies�offer�nature�based�programming,�and�61�percent�have�nature�based�facilities.��
� The�most�common�programs�include�nature�hikes,�nature�oriented�arts�and�crafts,�fishing�related�events,�and�nature�based�education�in�cooperation�with�local�schools.��
22�P&R�Magazine,�May�2008�23Outdoor�Industry�Foundation,�<outdoorindustry.org/news.association>�24�Mainella,�Fran�P.,�Honorary�Doctorate,�and�Visiting�Scholar�at�Clemson�University�and�Former�Director�of�the�National�Park�Service,�highlights�in�the�April�16,�2007�issue�of�Newsweek�Magazine��25�Gies,�Erica,�“The�Health�Benefits�of�Parks,”�2006,�The�Trust�for�Public�Land�
Vision�2030�survey�respondents�preferred�outdoor�nature�education�(78�percent)�as�compared�to�indoor�nature�centers�(22�percent).�Nature�programs�consistently�rated�in�the�top�third�of�programs�for�importance,�need,�and�priority�for�adding�or�expanding.
180� � � � Montgomery�County,�Maryland�
� When�asked�to�describe�the�elements�that�directly�contribute�to�their�most�successful�programs,�agencies�listed�staff�training�as�most�important�followed�by�program�content�and�number�of�staff/staff�training.��
� When�asked�what�resources�would�be�needed�most�to�expand�programming,�additional�staff�was�most�important�followed�by�funding.��
� Of�the�agencies�that�do�not�currently�offer�nature�based�programming,�90�percent�indicated�that�they�want�to�in�the�future.�Additional�staff�and�funding�were�again�the�most�important�resources�these�agencies�would�need�going�forward.��
� The�most�common�facilities�include:�nature�parks/preserves,�self�guided�nature�trails,�outdoor�classrooms,�and�nature�centers.��
� When�asked�to�describe�the�elements�that�directly�contribute�to�their�most�successful�facilities,�agencies�listed�funding�as�most�important�followed�by�presence�of�wildlife�and�community�support.��
� �Outdoor�Recreation�and�Wildlife�Local�parks�and�recreation�departments�are�a�common�place�for�residents�to�look�when�getting�outside�for�leisure�activities.�It�is�often�the�mission�of�parks�departments�as�well�as�private�or�non�profits�to�get�more�people�outdoors.�
The�Outdoor�Foundation�recently�released�a�report�on�participation�in�Outdoor�Recreation.26�The�report�highlights�growth�in�nature�based�outdoor�activities�and�continued�decline�in�youth�outdoor�participation.�The�Foundation�states�that�the�trends�show�the�beginning�of�adjustments�in�American�lifestyles�brought�about�by�a�challenging�economy,�shifting�demographics,�and�changing�times.�Their�research�brought�the�following�key�findings.�
Participation�in�Outdoor�Recreation�
� Popular�Pastimes:�In�2008,�48.6�percent�of�Americans�ages�six�and�older�participated�in�outdoor�recreation.�Americans�made�an�estimated�11.16�billion�outdoor�excursions�in�2008–�either�close�to�home,�in�a�nearby�park�or�on�an�overnight�trip.�
� A�Return�to�Nature:�Americans�returned�to�nature�in�2008.�Activities�like�backpacking,�mountain�biking�and�trail�running�showed�double�digit�increases�in�participation,�and�hiking�and�camping�showed�nine�percent�and�seven�percent�increases,�respectively.�
� Young�Women�Head�Indoors:�Among�women,�indoor�activities�are�most�popular�among�ages�21�to�25�and�older.�Among�men,�outdoor�activities�are�more�popular�than�indoor�fitness�activities�and�team�sports�among�all�age�groups�up�to�ages�66�and�older.�
�
�
26 “Participation�in�Outdoor�Recreation,”�September�2009,�Outdoor�Foundation
Trails�are�used�by�the�greatest�proportion�of�Vision�2030�survey�respondents.�Playgrounds,�natural�areas,�picnic�shelters,�and�nature�centers�had�participation�by�over�52�percent�of�respondents.

Volume�1:�Needs�and�Resource�Assessment�� 181��
Youth�
� More�Youth�Indoors:�Participation�in�outdoor�recreation�among�youth�ages�6�to�17�dropped�by�six�percent�–�resulting�in�a�combined�16.7�percent�drop�over�the�last�three�years.�Participation�fell�most�precipitously�among�the�youngest�age�group�measured,�ages�6�to�12,�which�decreased�nine�percent.�
� Busy�Lifestyles:�Taxed�by�the�requirements�of�their�often�highly�structured,�over�scheduled�lives,�today’s�kids�are�struggling�to�find�the�time�to�get�active�outdoors�and�are�foregoingoutdoor�pursuits�in�favor�of�other�competing�priorities.�Among�outdoor�participants�ages�6�to�17,�a�lack�of�time�is�the�primary�reason�they�don’t�get�outdoors�more�often.�
� A�Lack�of�Interest�and�Experience:�For�kids�ages�6�to�17�who�don’t�participate�in�outdoor�activities,�the�chief�barrier�is�a�lack�of�interest�–�an�ambivalence�to�the�outdoors�that�is�likely�the�result�of�a�lack�of�outdoor�experience�and�a�surplus�of�competing�priorities.�
� The�Influence�of�Family:�Most�youth�are�introduced�to�outdoor�activities�by�parents,�friends,�family,�and�relatives.�
Diversity�
� Outdoor�Participation�varies�by�Ethnicity:�Participation�in�outdoor�activities�is�higher�among�Caucasians�than�any�other�ethnicity�and�lowest�among�African�Americans�in�nearly�all�age�groups.�
� Minority�Youth,�More�Focused�on�School:�Minority�youth�participants�cite�school�work�as�the�top�reason�they�don’t�get�out�more�often�–�a�barrier�they�cite�more�prominently�than�Caucasian�youth.�
� Hispanics,�Looking�for�Nearby�Outdoor�Recreation:�Hispanic�participants�and�non�participants�alike�cite�a�lack�of�access�to�nearby�places�to�participate�in�outdoor�activities�as�a�barrier�to�participation�more�often�than�other�ethnicities.�
National�Trends�Related�to�Recreation�and�Park�Administration��Municipal�parks�and�recreation�structures�and�delivery�systems�have�changed,�and�more�alternative�methods�of�delivering�services�are�emerging.�Certain�services�are�being�contracted�out�and�cooperative�agreements�with�non�profit�groups�and�other�public�institutions�are�being�developed.�Newer�partners�include�the�health�system,�social�services,�justice�system,�education,�the�corporate�sector,�and�community�service�agencies.�These�partnerships�reflect�both�a�broader�interpretation�of�the�mandate�of�parks�and�recreation�agencies�and�the�increased�willingness�of�other�sectors�to�work�together�to�address�community�issues.�The�relationship�with�health�agencies�is�vital�in�promoting�wellness.�The�traditional�relationship�with�education�and�the�sharing�of�facilities�through�joint�use�agreements�is�evolving�into�cooperative�planning�and�programming�aimed�at�addressing�youth�inactivity�levels�and�community�needs.��Listed�below�are�additional�administrative�national�trends:��
� While�there�is�still�strong�support�for�public�subsidy�of�parks�and�recreation�in�most�communities,�level�of�subsidy�for�programs�is�lessening�on�average�and�more�“enterprise”�activities�are�being�developed,�thereby�allowing�subsidy�to�be�used�where�deemed�most�appropriate.��
� Information�technology�allows�for�better�tracking�and�reporting.��

182� � � � Montgomery�County,�Maryland�
� Pricing�is�often�determined�by�peak,�off�peak,�and�off�season�rates.��� More�agencies�are�partnering�with�private,�public,�and�non�profit�groups.��
Race�and�Ethnicity�Trends�Following�are�select�national�trends�of�a�variety�of�ethnic�communities.���
� English�as�the�first�language�at�home�will�decrease�as�the�United�States�becomes�more�multicultural.�Fourteen�percent�(14%)�of�the�United�States�population�speaks�a�language�other�than�English�at�home,�with�54�percent�of�the�non�English�speaking�population�speaking�Spanish.�The�number�of�people�speaking�other�languages�will�undoubtedly�increase�in�the�United�States�due�to�immigration.27�
� In�2005,�the�percentage�of�those�over�five�(5)�years�in�age�that�spoke�a�language�other�than�English�in�the�home�was�19.4�percent.�Of�the�foreign�born�population�in�the�United�States�the�majority�are�from�Latin�America�followed�by�Asia�and�Europe.28��
A�2008�study�by�the�Pew�Research�Center�cited�the�ranks�of�the�303�million�Americans�are�projected�to�increase�to�438�million�by�2050�and�that�increase�will�be�driven�primarily�by�immigration,�with�the�number�of�Hispanics�estimated�to�triple.�The�Center’s�projections�are�based�on�detailed�assumptions�about�births,�deaths,�and�immigration�levels.�Other�projections�from�this�report�include:�
� If�current�trends�continue,�82�percent�of�the�increase�will�be�immigrants�arriving�from�2005�to�2050�and�their�U.S.�born�descendants.��
� The�117�million�people�added�during�this�time�period�will�consist�of�67�million�immigrants�and�50�million�of�their�U.S.�born�children.��
� Nearly�one�in�five�Americans�(19%)�will�be�an�immigrant�in�2050,�compared�with�one�in�eight�(12%)�in�2005.��
� By�2025,�the�immigrant,�or�foreign�born�share�of�the�population�will�surpass�the�peak�during�the�last�great�wave�of�immigration�a�century�ago.��
� The�impact�of�immigration�has�been�compounded�as�the�number�of�births�for�U.S.�women�dropped�sharply�and�then�leveled�off.��
� Hispanics�will�make�up�29�percent�of�the�U.S.�population�in�2050,�compared�with�14�percent�in�2005.��
� The�non�Hispanic�white�population�will�increase�more�slowly�than�other�racial�and�ethnic�groups;�whites�will�become�a�minority�(47%)�by�2050.��
� The�nation's�elderly�populations�will�more�than�double�in�size�from�2005�through�2050,�as�the�Baby�Boom�generation�enters�the�traditional�retirement�years.��
� The�number�of�working�age�Americans�and�children�will�grow�more�slowly�than�the�elderly�population,�and�will�shrink�as�a�share�of�the�total�population.��
27�Davis,�B.�“Faces�of�the�Future:�How�America�is�Changing”�Association�of�Zoos�&�Aquariums,�http://www.aza.org/Pulbications/2004/08/Diversity.pdf>�accessed�December�14,�2006 28�U.S.�Census�Bureau
Ethnic�diversity�is�a�defining�characteristic�of�Montgomery�County.�About�40�percent�of�County�residents�speak�a�language�other�than�English.�The�North�Central�sub�area�has�the�highest�percent�of�foreign�born�resident�(33.5�%)�and�the�lowest�is�the�Potomac/Rural�sub�area�(23.9%).
Volume�1:�Needs�and�Resource�Assessment�� 183��
Foreign�Born�� Less�than�three�percent�of�the�population�nationally,�approximately�eight�million�people,�is�
foreign�born�residents�who�have�entered�the�country�from�2000�and�on.�Montgomery�County�sub�areas�show�a�much�higher�foreign�born�population.�Factors�known�about�this�group�nationally�include:29�
�� Hispanics�make�up�more�than�half�of�this�population.��� A�larger�percentage�of�these�households�(compared�to�average�U.S.�resident�
households)�consist�of�married�couples.��� Incomes�are�lower�(25.6%�families�live�below�the�poverty�line�compared�to�10.2%�of�
all�Americans).��� Households�are�larger�(3.6�vs.�2.6�people).�� Households�are�younger�(27.6�years�vs.�36.4�years�median�age).��� 89.5�percent�speak�a�language�other�than�English�at�home;�23.7�percent�speak�
English�“very�well.”���Urban�Recreation�Trends�Recreation�and�Leisure�in�the�City�–�Urban�Trends�Following�is�an�outline�of�national�and�international�trends�as�it�relates�to�recreation�and�leisure�trends�in�dense�urban�areas.�
� Plazas�–�There�is�a�renewed�interest�in�creating�dynamic�public�plazas�in�urban�centers.�Cities�across�the�nation�are�enlivening�public�plazas�with�enhanced�design�features�and�programming�elements,�such�as�farmer’s�markets,�festivals,�and�performances.��
o According�to�the�Project�for�Public�Spaces,�some�key�principles�for�creating�successful�squares�include:�30�
� Image�and�identity�� Attractions�and�destinations�� Amenities�� Flexible�design�� Seasonal�strategy�� Access�� Diverse�funding�sources�
o Portland,�Oregon’s�Pioneer�Square�and�New�York�City’s�Bryant�Square�provide�examples�of�active�public�gathering�spaces�in�the�downtown�that�contain�public�art,�access�to�public�transportation,�open�space�for�special�events,�and�retail.�Both�of�these�sites�are�publicly�owned,�but�managed�(maintenance�and�programming)�through�public/private�partnerships,�a�trend�in�high�profile,�downtown�public�spaces.��
29El�Nasser�and�Overberg�“Diverse�landscape�of�the�newest�Americans,”�December�2008,��USA�Today30�Project�for�Public�Spaces�website.<www.pps.org>�
“Urban�parks�are�where�vast�numbers�of�persons�are�brought�closely�together,�
poor�and�rich,�young�and�old…each�individual�adding�by�his�mere�presence�to�
the�pleasure�of�all�others.”� -Frederick�Law�Olmsted,�father�of�
landscape�architecture,�1870.�
184� � � � Montgomery�County,�Maryland�
o In�an�effort�to�combat�issues�of�undesired�park�uses�(e.g.,�drug�dealing�and�use,�homeless�congregating)�communities�have�worked�to�enliven�park�spaces�through�public�/private�investments�in�enhanced�designs�to�create�attractive,�safe�public�spaces�that�attract�positive�use�and�activity.�Bryant�Square�in�New�York�City�is�an�example�of�a�deteriorated�park�in�the�1970’s�that�was�transformed�through�community�involvement�into�a�source�of�community�pride�and�activity.31��
�� Rooftop�Gardens�and�Park�Structures�–�Rooftop�gardens�(both�public�and�private)�create�
respites�in�a�densely�built�environment�and�help�reduce�the�urban�heat�island�effects.�In�addition,�the�lack�of�availability�and�affordability�of�downtown�real�estate�has�continued�the�trend�of�parks�built�over�structures�such�as�parking�garages�(e.g.,�Millennium�Park�and�Soldier�Field�Stadium/Burnham�Park�re�design�in�Chicago)�and�other�structures�(such�as�Freeway�Park�in�Seattle,�built�in�the�1970’s).�
�� Cultural�Institutions�and�Attractions�–�Downtowns�have�traditionally�been�the�hub�of�private�
and�public�cultural�institutions.�Many�communities�are�building�on�this�recreation�and�leisure�asset�by�creating�special�arts�and�theatre�districts�to�further�promote�visual�and�performing�arts�to�residents�and�tourists�alike.�Partnerships�with�public�park�and�recreation�agencies�for�cultural�programs�and�special�events�in�the�parks�are�a�viable�opportunity.�
� Special�Events�and�Festivals�–�Community�festivals�and�special�events�are�emerging�as�a�tourism�development�as�they�add�vitality�and�enhance�the�appeal�of�a�destination�to�tourists.�The�role�of�festivals�in�a�community�is�to�offer�diverse�cultural�and�recreational�experiences�to�citizens�and�visitors�while�providing�strong�economic�impacts�on�a�region.�Festivals�support�the�local�economy�by�providing�opportunities�for�sponsorship,�visibility,�and�sales�while�also�providing�a�mechanism�for�local�non�profits�to�earn�money�and�gain�exposure.�
�
According�to�a�Brookings�Institution�article,�“A�Much�More�Urban�America,”32�cities�are�experiencing�a�‘second�life’�due�to�distinctive�physical�assets�including:�waterfronts,�mixed�use�downtowns,�historic�districts,�and�pedestrian�friendly�neighborhoods.�The�list�is�different�depending�upon�the�city.�A�growing�number�of�the�American�population�(83%)�lives�in�metropolitan�areas�which,�“together,�drive�and�dominate�the�economy�and�house�wealth�generating�industries,�centers�of�research�and�innovation,�ports�of�commerce�and�gateways�of�immigration.” As�the�trend�to�move�in�metropolitan�communities�continues,�park�and�recreation�professionals�will�need�to�focus�on�the�physical�assets�each�area�offers.���
31�Project�for�Public�Spaces�website,�<www.pps.org>�32 Katz,�Bruce,�“A�Much�More�Urban�America,”�July�2007,�Brookings�Institution
Community�events�and�festivals�had�the�highest�usage�of�all�programs�and�activities�and�was�rated�as�the�second�highest�program�priority�to�add,�expand�or�improve�according�to�the�Vision�2030�survey.��

Volume�1:�Needs�and�Resource�Assessment�� 185��
APPENDIX�C:�SURVEY�REPORT��

������������������
THIS�PAGE�INTENTIONALLY�LEFT�BLANK�
Prepared for:
Montgomery County
GreenPlay LLC
Prepared by:
RRC Associates, Inc.
4940 Pearl East Circle, Ste 103
Boulder, CO 80301
303/449�6558
�������������� �����������
�����������������������������
�������������������
JUNE 2010
M-NCPPC PARKS AND MONTGOMERY COUNTY RECREATION VISION 2030 SURVEY—FINAL RESULTS 2010
RRC Associates, Inc. Contents
INTRODUCTION / METHODOLOGY ............................................... 3
RESPONDENT PROFILE ................................................................. 4
HIGHLIGHTS FROM THE ANALYSIS OF RESULTS ..................... 7 Current Facilities and Programs ........................................................................... 7
Usage levels ........................................................................................................ 7 Importance to the community ......................................................................... 11 Meeting the needs of your household ............................................................. 15 Importance�Satisfaction Matrix ........................................................................ 19 Agreement about parks and recreation facilities in Montgomery County ...... 23 If you or anyone in your household DOES NOT use parks or recreation facilities, why not? .......................................................................................... 24
Future Facilities and Programs ........................................................................... 27 Need for future parks, facilities, and programs ............................................... 27 Importance of adding, expanding, or improving future parks, facilities, and programs .................................................................................................. 30
Most Important parks, facilities, and programs ............................................... 33 Preferred Location of Facilities .......................................................................... 41 Preference of facilities that could be added, expanded, or improved ................ 42 Communication ................................................................................................. 44 Financial Choices ............................................................................................... 46 Comments and Suggestions ............................................................................... 48
M-NCPPC PARKS AND MONTGOMERY COUNTY RECREATION VISION 2030 SURVEY—FINAL RESULTS 2010
RRC Associates, Inc. 3
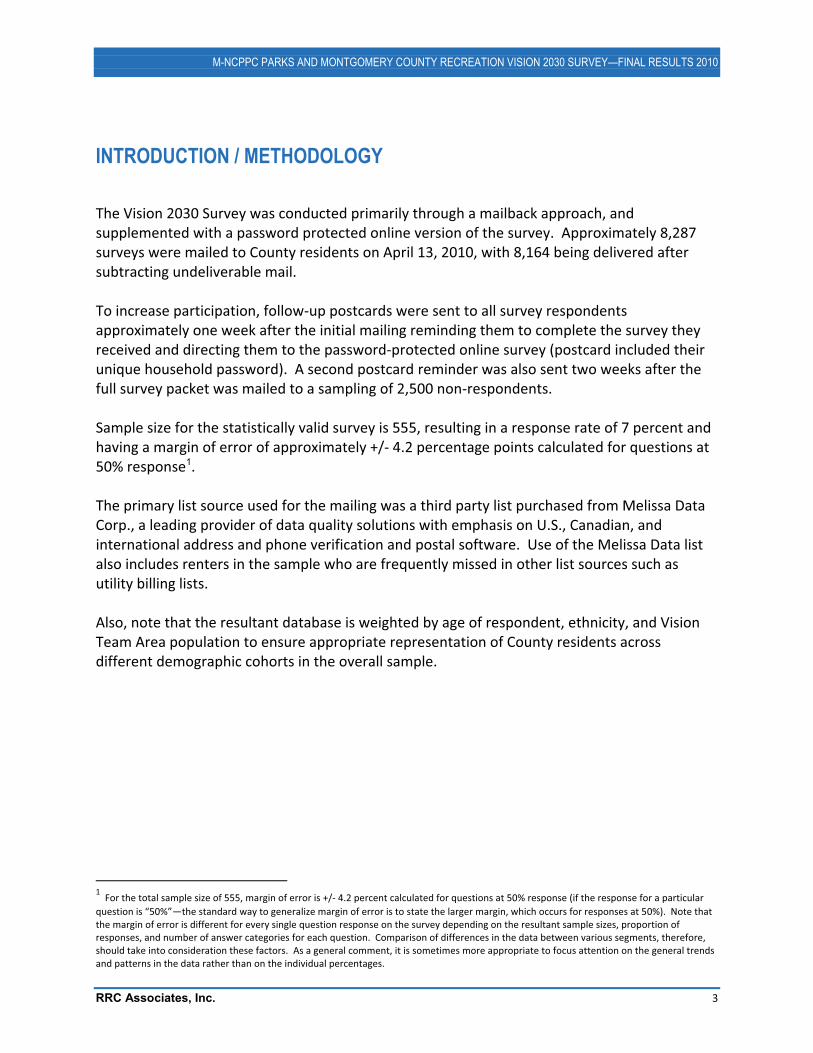
INTRODUCTION / METHODOLOGY The Vision 2030 Survey was conducted primarily through a mailback approach, and supplemented with a password protected online version of the survey. Approximately 8,287 surveys were mailed to County residents on April 13, 2010, with 8,164 being delivered after subtracting undeliverable mail. To increase participation, follow�up postcards were sent to all survey respondents approximately one week after the initial mailing reminding them to complete the survey they received and directing them to the password�protected online survey (postcard included their unique household password). A second postcard reminder was also sent two weeks after the full survey packet was mailed to a sampling of 2,500 non�respondents. Sample size for the statistically valid survey is 555, resulting in a response rate of 7 percent and having a margin of error of approximately +/� 4.2 percentage points calculated for questions at 50% response1. The primary list source used for the mailing was a third party list purchased from Melissa Data Corp., a leading provider of data quality solutions with emphasis on U.S., Canadian, and international address and phone verification and postal software. Use of the Melissa Data list also includes renters in the sample who are frequently missed in other list sources such as utility billing lists. Also, note that the resultant database is weighted by age of respondent, ethnicity, and Vision Team Area population to ensure appropriate representation of County residents across different demographic cohorts in the overall sample.
1 For the total sample size of 555, margin of error is +/� 4.2 percent calculated for questions at 50% response (if the response for a particular
question is “50%”—the standard way to generalize margin of error is to state the larger margin, which occurs for responses at 50%). Note that the margin of error is different for every single question response on the survey depending on the resultant sample sizes, proportion of responses, and number of answer categories for each question. Comparison of differences in the data between various segments, therefore, should take into consideration these factors. As a general comment, it is sometimes more appropriate to focus attention on the general trends and patterns in the data rather than on the individual percentages.
M-NCPPC PARKS AND MONTGOMERY COUNTY RECREATION VISION 2030 SURVEY—FINAL RESULTS 2010
RRC Associates, Inc. 4
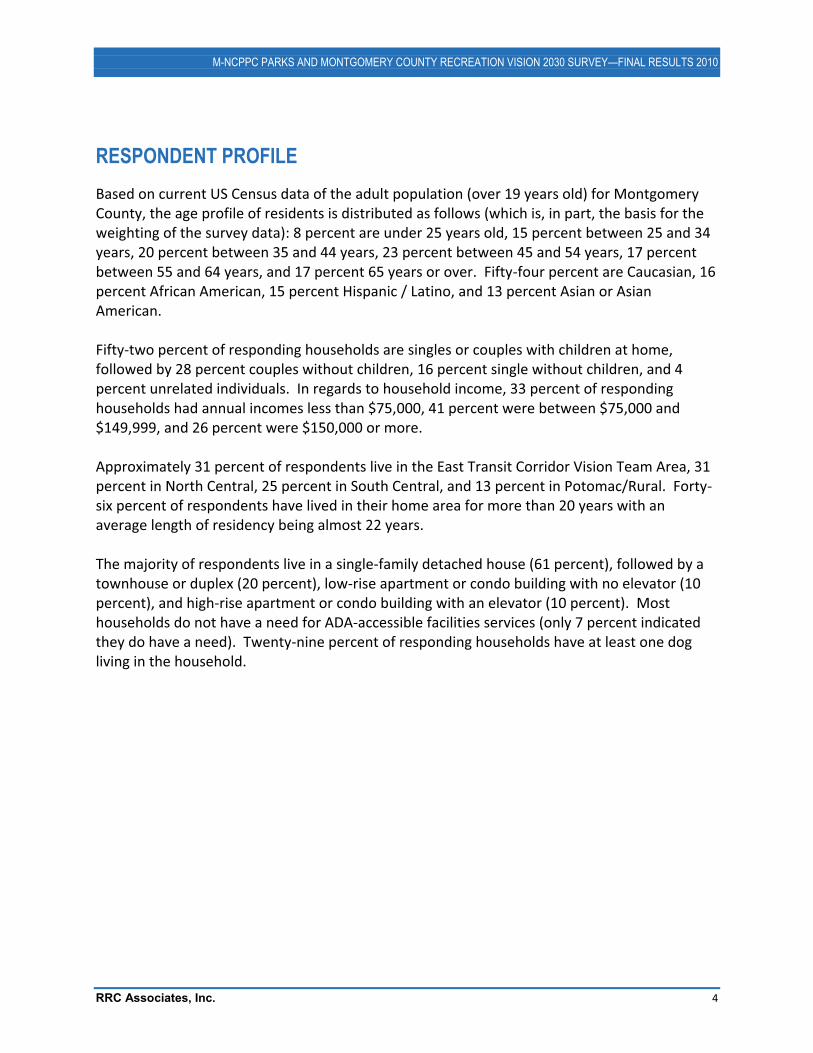
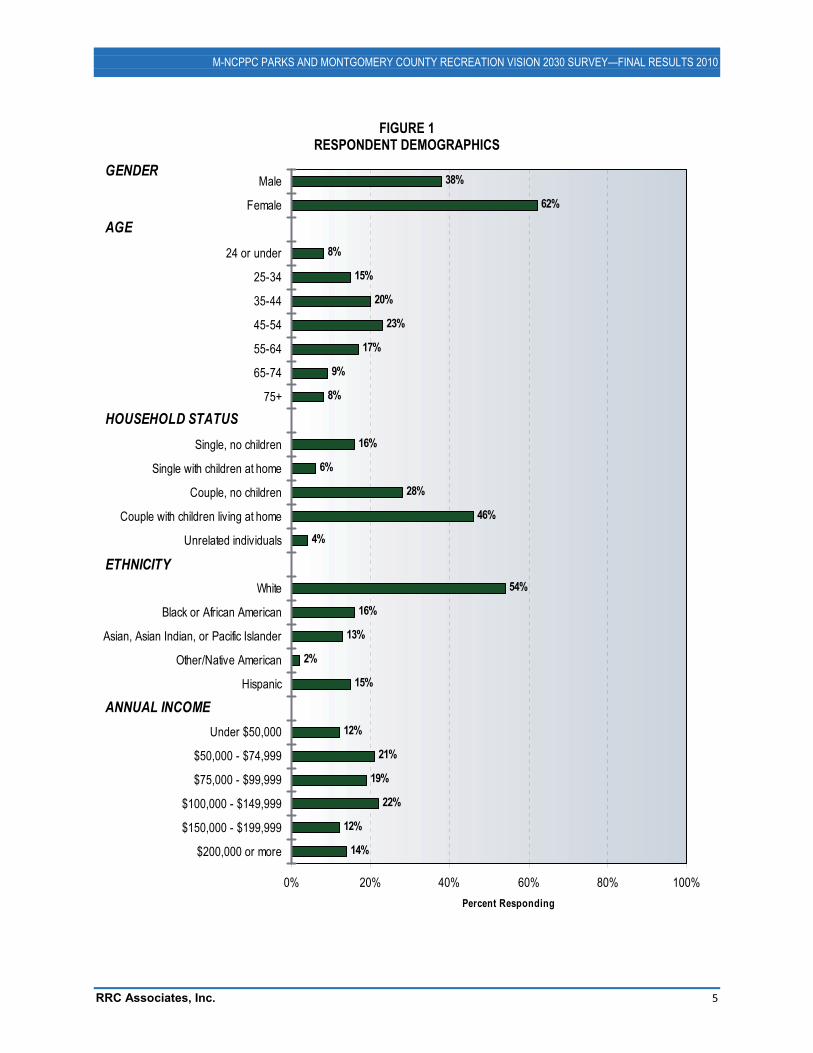
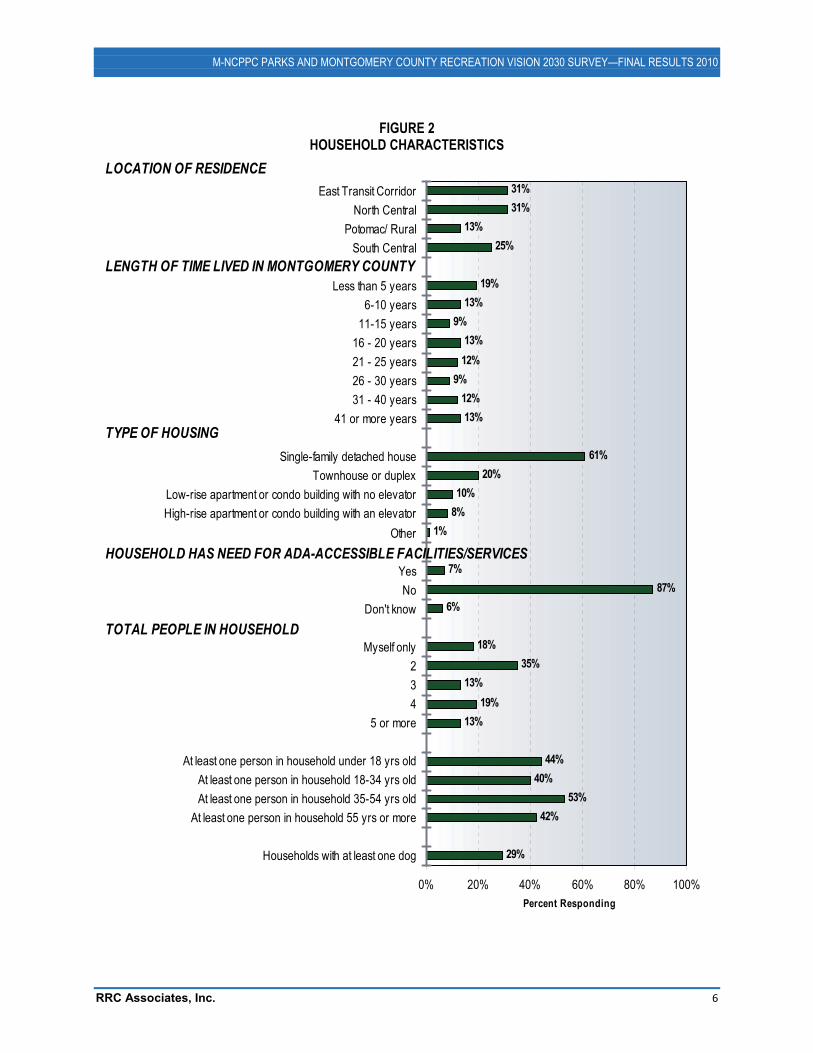
RESPONDENT PROFILE Based on current US Census data of the adult population (over 19 years old) for Montgomery County, the age profile of residents is distributed as follows (which is, in part, the basis for the weighting of the survey data): 8 percent are under 25 years old, 15 percent between 25 and 34 years, 20 percent between 35 and 44 years, 23 percent between 45 and 54 years, 17 percent between 55 and 64 years, and 17 percent 65 years or over. Fifty�four percent are Caucasian, 16 percent African American, 15 percent Hispanic / Latino, and 13 percent Asian or Asian American. Fifty�two percent of responding households are singles or couples with children at home, followed by 28 percent couples without children, 16 percent single without children, and 4 percent unrelated individuals. In regards to household income, 33 percent of responding households had annual incomes less than $75,000, 41 percent were between $75,000 and $149,999, and 26 percent were $150,000 or more. Approximately 31 percent of respondents live in the East Transit Corridor Vision Team Area, 31 percent in North Central, 25 percent in South Central, and 13 percent in Potomac/Rural. Forty�six percent of respondents have lived in their home area for more than 20 years with an average length of residency being almost 22 years. The majority of respondents live in a single�family detached house (61 percent), followed by a townhouse or duplex (20 percent), low�rise apartment or condo building with no elevator (10 percent), and high�rise apartment or condo building with an elevator (10 percent). Most households do not have a need for ADA�accessible facilities services (only 7 percent indicated they do have a need). Twenty�nine percent of responding households have at least one dog living in the household.
M-NCPPC PARKS AND MONTGOMERY COUNTY RECREATION VISION 2030 SURVEY—FINAL RESULTS 2010
RRC Associates, Inc. 5
FIGURE 1 RESPONDENT DEMOGRAPHICS
38%
62%
8%
15%
20%
23%
17%
9%
8%
16%
6%
28%
46%
4%
54%
16%
13%
2%
15%
12%
21%
19%
22%
12%
14%
0% 20% 40% 60% 80% 100%
Male
Female
24 or under
25-34
35-44
45-54
55-64
65-74
75+
Single, no children
Single with children at home
Couple, no children
Couple with children living at home
Unrelated individuals
White
Black or African American
Asian, Asian Indian, or Pacific Islander
Other/Native American
Hispanic
Under $50,000
$50,000 - $74,999
$75,000 - $99,999
$100,000 - $149,999
$150,000 - $199,999
$200,000 or more
Percent Responding
GENDER
AGE
HOUSEHOLD STATUS
ANNUAL INCOME
ETHNICITY
M-NCPPC PARKS AND MONTGOMERY COUNTY RECREATION VISION 2030 SURVEY—FINAL RESULTS 2010
RRC Associates, Inc. 6
FIGURE 2 HOUSEHOLD CHARACTERISTICS
31%31%
13%25%
19%13%
9%13%
12%9%
12%13%
61%20%
10%8%
1%
7%87%
6%
18%35%
13%19%
13%
44%40%
53%42%
29%
0% 20% 40% 60% 80% 100%
East Transit CorridorNorth Central
Potomac/ RuralSouth Central
Less than 5 years6-10 years
11-15 years16 - 20 years21 - 25 years26 - 30 years31 - 40 years
41 or more years
Single-family detached houseTownhouse or duplex
Low-rise apartment or condo building with no elevatorHigh-rise apartment or condo building with an elevator
Other
YesNo
Don't know
Myself only234
5 or more
At least one person in household under 18 yrs oldAt least one person in household 18-34 yrs oldAt least one person in household 35-54 yrs old
At least one person in household 55 yrs or more
Households with at least one dog
Percent Responding
LOCATION OF RESIDENCE
LENGTH OF TIME LIVED IN MONTGOMERY COUNTY
TOTAL PEOPLE IN HOUSEHOLD
TYPE OF HOUSING
HOUSEHOLD HAS NEED FOR ADA-ACCESSIBLE FACILITIES/SERVICES
M-NCPPC PARKS AND MONTGOMERY COUNTY RECREATION VISION 2030 SURVEY—FINAL RESULTS 2010
RRC Associates, Inc. 7
HIGHLIGHTS FROM THE ANALYSIS OF RESULTS Key findings from the study are summarized below. Additionally, several of the questions on the survey form allowed respondents to “write in” their response or comment. Major themes that emerge from the comments are summarized in the report, while a complete set of the comments is provided as an appendix section.
Current Facilities and Programs
Usage levels
Facilities
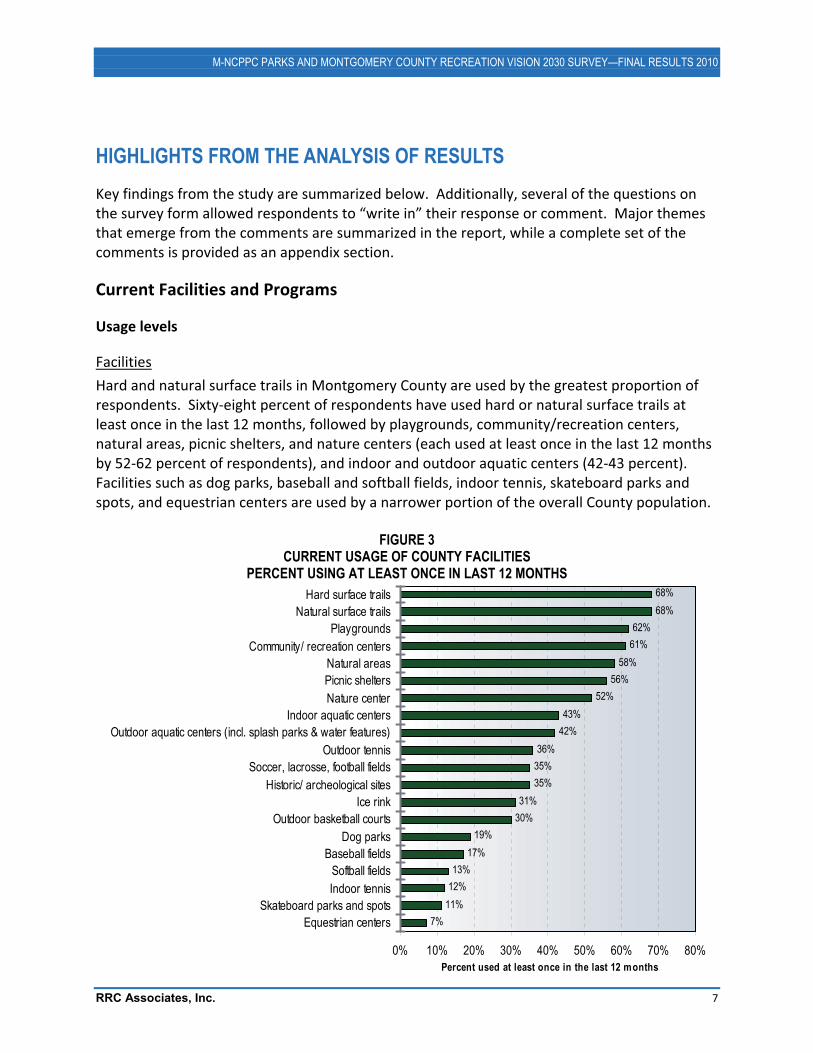
Hard and natural surface trails in Montgomery County are used by the greatest proportion of respondents. Sixty�eight percent of respondents have used hard or natural surface trails at least once in the last 12 months, followed by playgrounds, community/recreation centers, natural areas, picnic shelters, and nature centers (each used at least once in the last 12 months by 52�62 percent of respondents), and indoor and outdoor aquatic centers (42�43 percent). Facilities such as dog parks, baseball and softball fields, indoor tennis, skateboard parks and spots, and equestrian centers are used by a narrower portion of the overall County population.
FIGURE 3 CURRENT USAGE OF COUNTY FACILITIES
PERCENT USING AT LEAST ONCE IN LAST 12 MONTHS 68%68%
62%61%
58%56%
52%43%
42%36%
35%35%
31%30%
19%17%
13%12%
11%7%
0% 10% 20% 30% 40% 50% 60% 70% 80%
Hard surface trailsNatural surface trails
PlaygroundsCommunity/ recreation centers
Natural areasPicnic sheltersNature center
Indoor aquatic centersOutdoor aquatic centers (incl. splash parks & water features)
Outdoor tennisSoccer, lacrosse, football fields
Historic/ archeological sitesIce rink
Outdoor basketball courtsDog parks
Baseball fieldsSoftball fieldsIndoor tennis
Skateboard parks and spotsEquestrian centers
Percent used at least once in the last 12 months
M-NCPPC PARKS AND MONTGOMERY COUNTY RECREATION VISION 2030 SURVEY—FINAL RESULTS 2010
RRC Associates, Inc. 8
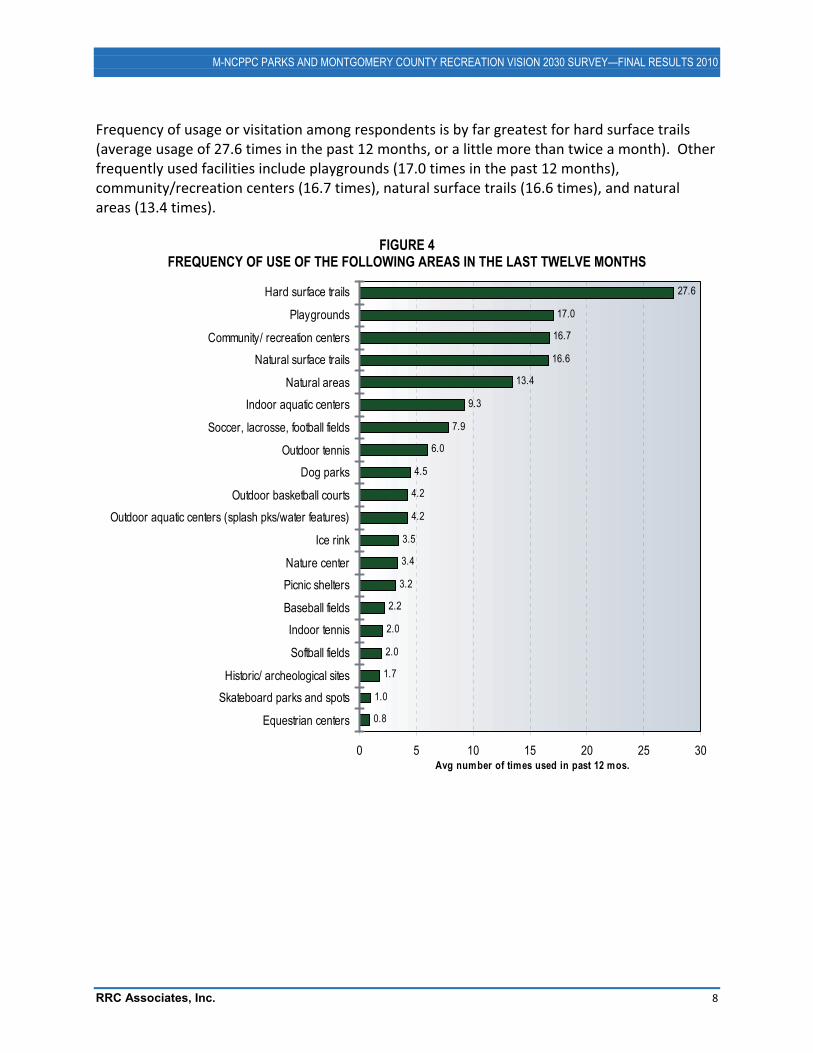
Frequency of usage or visitation among respondents is by far greatest for hard surface trails (average usage of 27.6 times in the past 12 months, or a little more than twice a month). Other frequently used facilities include playgrounds (17.0 times in the past 12 months), community/recreation centers (16.7 times), natural surface trails (16.6 times), and natural areas (13.4 times).
FIGURE 4 FREQUENCY OF USE OF THE FOLLOWING AREAS IN THE LAST TWELVE MONTHS
27.6
17.0
16.7
16.6
13.4
9.3
7.9
6.0
4.5
4.2
4.2
3.5
3.4
3.2
2.2
2.0
2.0
1.7
1.0
0.8
0 5 10 15 20 25 30
Hard surface trails
Playgrounds
Community/ recreation centersNatural surface trails
Natural areasIndoor aquatic centers
Soccer, lacrosse, football fields
Outdoor tennisDog parks
Outdoor basketball courtsOutdoor aquatic centers (splash pks/water features)
Ice rink
Nature centerPicnic shelters
Baseball fieldsIndoor tennis
Softball fields
Historic/ archeological sitesSkateboard parks and spots
Equestrian centers
Avg number of times used in past 12 mos.
M-NCPPC PARKS AND MONTGOMERY COUNTY RECREATION VISION 2030 SURVEY—FINAL RESULTS 2010
RRC Associates, Inc. 9
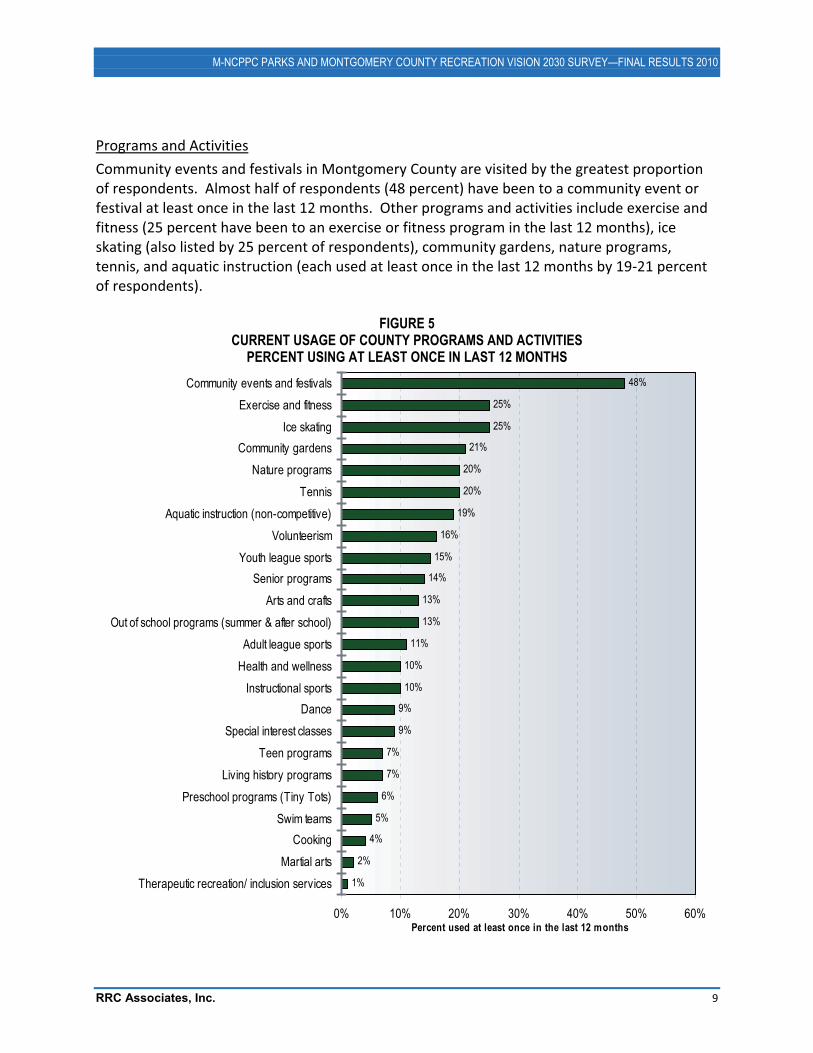
Programs and Activities
Community events and festivals in Montgomery County are visited by the greatest proportion of respondents. Almost half of respondents (48 percent) have been to a community event or festival at least once in the last 12 months. Other programs and activities include exercise and fitness (25 percent have been to an exercise or fitness program in the last 12 months), ice skating (also listed by 25 percent of respondents), community gardens, nature programs, tennis, and aquatic instruction (each used at least once in the last 12 months by 19�21 percent of respondents).
FIGURE 5 CURRENT USAGE OF COUNTY PROGRAMS AND ACTIVITIES
PERCENT USING AT LEAST ONCE IN LAST 12 MONTHS 48%
25%
25%
21%
20%
20%
19%
16%
15%
14%
13%
13%
11%
10%
10%
9%
9%
7%
7%
6%
5%
4%
2%
1%
0% 10% 20% 30% 40% 50% 60%
Community events and festivalsExercise and fitness
Ice skatingCommunity gardens
Nature programsTennis
Aquatic instruction (non-competitive)Volunteerism
Youth league sportsSenior programs
Arts and craftsOut of school programs (summer & after school)
Adult league sportsHealth and wellness
Instructional sportsDance
Special interest classesTeen programs
Living history programsPreschool programs (Tiny Tots)
Swim teamsCooking
Martial artsTherapeutic recreation/ inclusion services
Percent used at least once in the last 12 months
M-NCPPC PARKS AND MONTGOMERY COUNTY RECREATION VISION 2030 SURVEY—FINAL RESULTS 2010
RRC Associates, Inc. 10
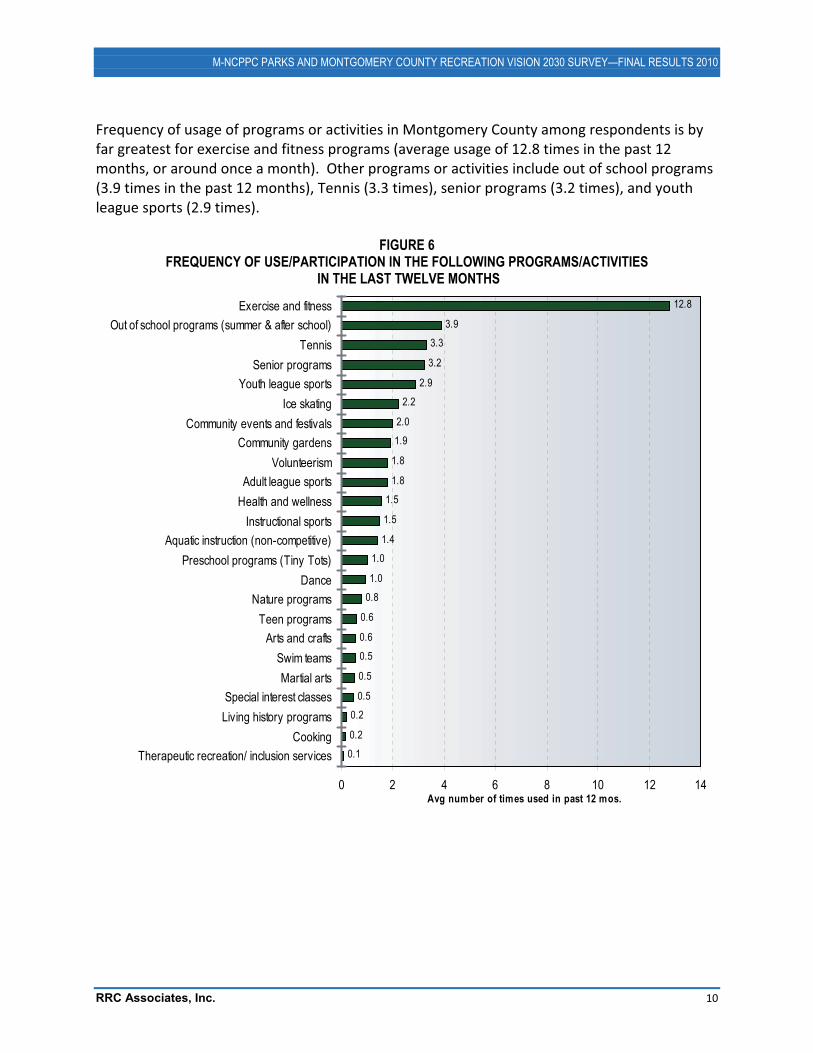
Frequency of usage of programs or activities in Montgomery County among respondents is by far greatest for exercise and fitness programs (average usage of 12.8 times in the past 12 months, or around once a month). Other programs or activities include out of school programs (3.9 times in the past 12 months), Tennis (3.3 times), senior programs (3.2 times), and youth league sports (2.9 times).
FIGURE 6 FREQUENCY OF USE/PARTICIPATION IN THE FOLLOWING PROGRAMS/ACTIVITIES
IN THE LAST TWELVE MONTHS 12.8
3.93.3
3.2
2.92.2
2.01.9
1.8
1.81.5
1.5
1.41.0
1.00.8
0.6
0.60.5
0.5
0.50.2
0.20.1
0 2 4 6 8 10 12 14
Exercise and fitnessOut of school programs (summer & after school)
TennisSenior programs
Youth league sportsIce skating
Community events and festivalsCommunity gardens
VolunteerismAdult league sports
Health and wellnessInstructional sports
Aquatic instruction (non-competitive)Preschool programs (Tiny Tots)
DanceNature programs
Teen programsArts and crafts
Swim teamsMartial arts
Special interest classesLiving history programs
CookingTherapeutic recreation/ inclusion services
Avg number of times used in past 12 mos.
M-NCPPC PARKS AND MONTGOMERY COUNTY RECREATION VISION 2030 SURVEY—FINAL RESULTS 2010
RRC Associates, Inc. 11
Importance to the community
Facilities
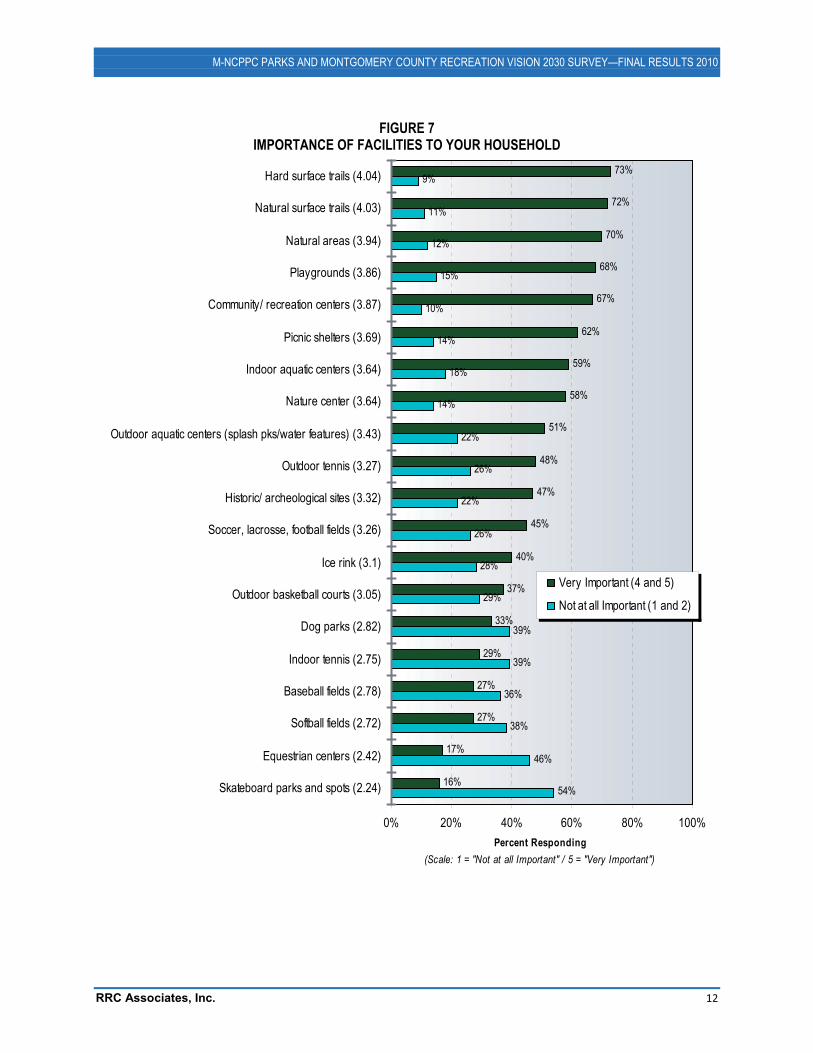
Respondents were asked to indicate how important each of the current facilities is to their household. While most options are rated as being relatively important, the following are rated the highest overall:
� Hard�surface trails (73 percent of respondents rate them “very important,” a 4 or 5 on a 5�point scale)
� Natural surface trails (72 percent) � Natural areas (70 percent) � Playgrounds (68 percent) � Community/recreation centers (67 percent)
While some facilities (which fill a need for a more targeted or narrower population) may be less important to the community as a whole, they are, nevertheless, very important to those certain segments of the population that have such a need, such as dog parks, indoor tennis, baseball and softball fields, equestrian centers, and skateboard parks and spots.
M-NCPPC PARKS AND MONTGOMERY COUNTY RECREATION VISION 2030 SURVEY—FINAL RESULTS 2010
RRC Associates, Inc. 12
FIGURE 7 IMPORTANCE OF FACILITIES TO YOUR HOUSEHOLD
73%
72%
70%
68%
67%
62%
59%
58%
51%
48%
47%
45%
40%
37%
33%
29%
27%
27%
17%
16%
9%
11%
12%
15%
10%
14%
18%
14%
22%
26%
22%
26%
28%
29%
39%
39%
36%
38%
46%
54%
0% 20% 40% 60% 80% 100%
Hard surface trails (4.04)
Natural surface trails (4.03)
Natural areas (3.94)
Playgrounds (3.86)
Community/ recreation centers (3.87)
Picnic shelters (3.69)
Indoor aquatic centers (3.64)
Nature center (3.64)
Outdoor aquatic centers (splash pks/water features) (3.43)
Outdoor tennis (3.27)
Historic/ archeological sites (3.32)
Soccer, lacrosse, football fields (3.26)
Ice rink (3.1)
Outdoor basketball courts (3.05)
Dog parks (2.82)
Indoor tennis (2.75)
Baseball fields (2.78)
Softball fields (2.72)
Equestrian centers (2.42)
Skateboard parks and spots (2.24)
Percent Responding(Scale: 1 = "Not at all Important" / 5 = "Very Important")
Very Important (4 and 5)
Not at all Important (1 and 2)
M-NCPPC PARKS AND MONTGOMERY COUNTY RECREATION VISION 2030 SURVEY—FINAL RESULTS 2010
RRC Associates, Inc. 13
Programs and Activities
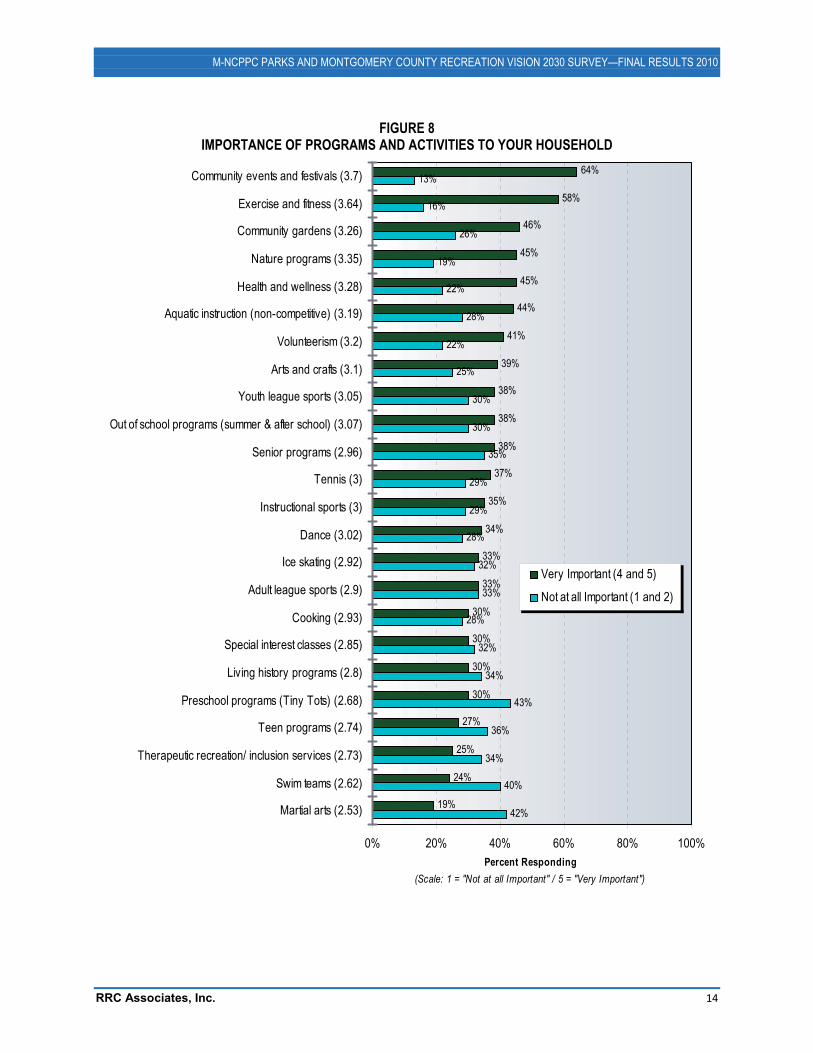
Respondents were asked to indicate how important each of the current programs and facilities is to their household. As expected from the usage/participation levels shown in the previous section, community events and exercise and fitness programs were the most important to respondents. Other programs and activities rated relatively high include:
� Community gardens (46 percent of respondents rate them “very important,” a 4 or 5 on a 5�point scale)
� Nature programs (45 percent) � Health and wellness (45 percent) � Aquatic instruction (non�competitive) (44 percent)
Similar to some of the facilities (previously mentioned), while some programs and activities (which fill a need for a more targeted or narrower population) may be less important to the community as a whole, they are very important to the certain segments of the population that have such a need, such as preschool programs, teen programs, therapeutic recreation/inclusion services, swim teams, and martial arts.
M-NCPPC PARKS AND MONTGOMERY COUNTY RECREATION VISION 2030 SURVEY—FINAL RESULTS 2010
RRC Associates, Inc. 14
FIGURE 8 IMPORTANCE OF PROGRAMS AND ACTIVITIES TO YOUR HOUSEHOLD
64%
58%
46%
45%
45%
44%
41%
39%
38%
38%
38%
37%
35%
34%
33%
33%
30%
30%
30%
30%
27%
25%
24%
19%
13%
16%
26%
19%
22%
28%
22%
25%
30%
30%
35%
29%
29%
28%
32%
33%
28%
32%
34%
43%
36%
34%
40%
42%
0% 20% 40% 60% 80% 100%
Community events and festivals (3.7)
Exercise and fitness (3.64)
Community gardens (3.26)
Nature programs (3.35)
Health and wellness (3.28)
Aquatic instruction (non-competitive) (3.19)
Volunteerism (3.2)
Arts and crafts (3.1)
Youth league sports (3.05)
Out of school programs (summer & after school) (3.07)
Senior programs (2.96)
Tennis (3)
Instructional sports (3)
Dance (3.02)
Ice skating (2.92)
Adult league sports (2.9)
Cooking (2.93)
Special interest classes (2.85)
Living history programs (2.8)
Preschool programs (Tiny Tots) (2.68)
Teen programs (2.74)
Therapeutic recreation/ inclusion services (2.73)
Swim teams (2.62)
Martial arts (2.53)
Percent Responding(Scale: 1 = "Not at all Important" / 5 = "Very Important")
Very Important (4 and 5)
Not at all Important (1 and 2)
M-NCPPC PARKS AND MONTGOMERY COUNTY RECREATION VISION 2030 SURVEY—FINAL RESULTS 2010
RRC Associates, Inc. 15
Meeting the needs of your household
Respondents were then asked to rate how well they thought the facilities, programs, and activities provided throughout the County are currently meeting the needs of their household.
Facilities
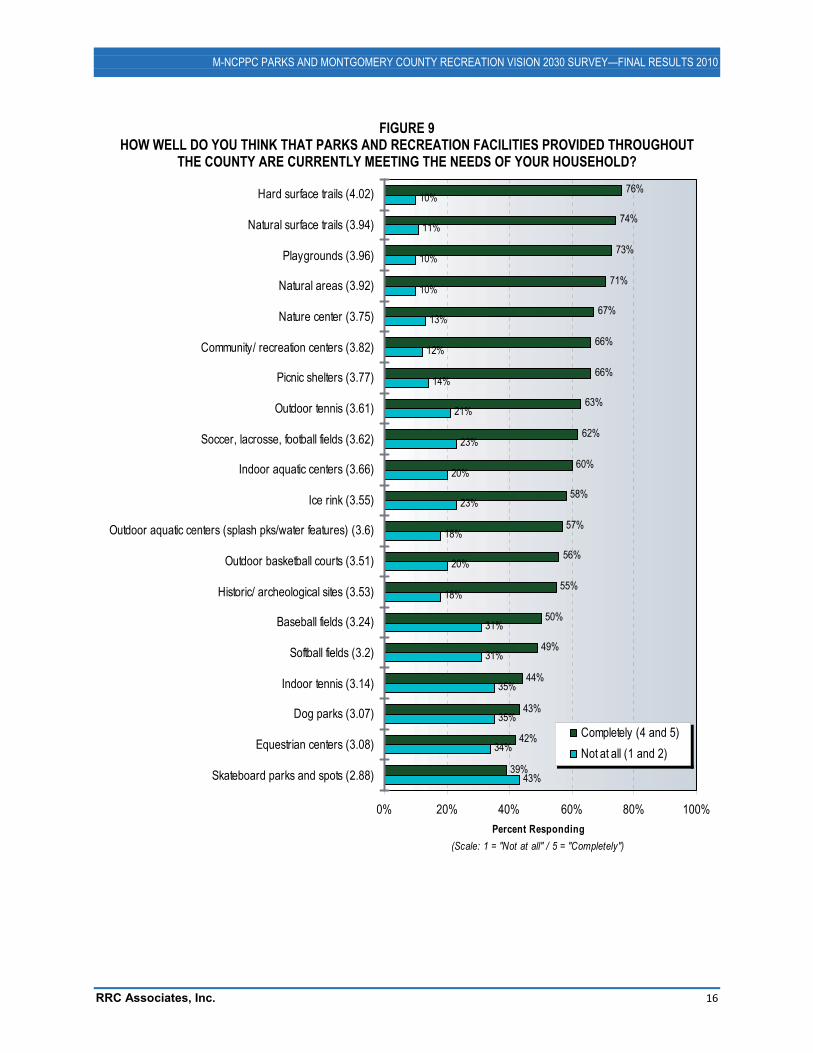
Similar to what was important to respondents, the same top four amenities also received the most positive ratings of what was currently meeting the needs of their household:
� Hard surface trails (76 percent “mostly/completely” meeting need, 4 or 5 on 5�point scale)
� Natural surface trails (74 percent) � Playgrounds (73 percent) � Natural areas (71 percent)
Also similar to the facilities rated least important, the same six amenities also received the most negative ratings in regards to what was currently meeting the needs of their household:
� Skateboard parks and spots (43 percent “Not at all” meeting need, 1 or 2 on 5�point scale)
� Dog parks (35 percent) � Indoor tennis (35 percent) � Equestrian centers (34 percent) � Softball fields (31 percent) � Baseball fields (31 percent)
M-NCPPC PARKS AND MONTGOMERY COUNTY RECREATION VISION 2030 SURVEY—FINAL RESULTS 2010
RRC Associates, Inc. 16
FIGURE 9 HOW WELL DO YOU THINK THAT PARKS AND RECREATION FACILITIES PROVIDED THROUGHOUT
THE COUNTY ARE CURRENTLY MEETING THE NEEDS OF YOUR HOUSEHOLD? 76%
74%
73%
71%
67%
66%
66%
63%
62%
60%
58%
57%
56%
55%
50%
49%
44%
43%
42%
39%
10%
11%
10%
10%
13%
12%
14%
21%
23%
20%
23%
18%
20%
18%
31%
31%
35%
35%
34%
43%
0% 20% 40% 60% 80% 100%
Hard surface trails (4.02)
Natural surface trails (3.94)
Playgrounds (3.96)
Natural areas (3.92)
Nature center (3.75)
Community/ recreation centers (3.82)
Picnic shelters (3.77)
Outdoor tennis (3.61)
Soccer, lacrosse, football fields (3.62)
Indoor aquatic centers (3.66)
Ice rink (3.55)
Outdoor aquatic centers (splash pks/water features) (3.6)
Outdoor basketball courts (3.51)
Historic/ archeological sites (3.53)
Baseball fields (3.24)
Softball fields (3.2)
Indoor tennis (3.14)
Dog parks (3.07)
Equestrian centers (3.08)
Skateboard parks and spots (2.88)
Percent Responding(Scale: 1 = "Not at all" / 5 = "Completely")
Completely (4 and 5)Not at all (1 and 2)
M-NCPPC PARKS AND MONTGOMERY COUNTY RECREATION VISION 2030 SURVEY—FINAL RESULTS 2010
RRC Associates, Inc. 17
Programs and Activities
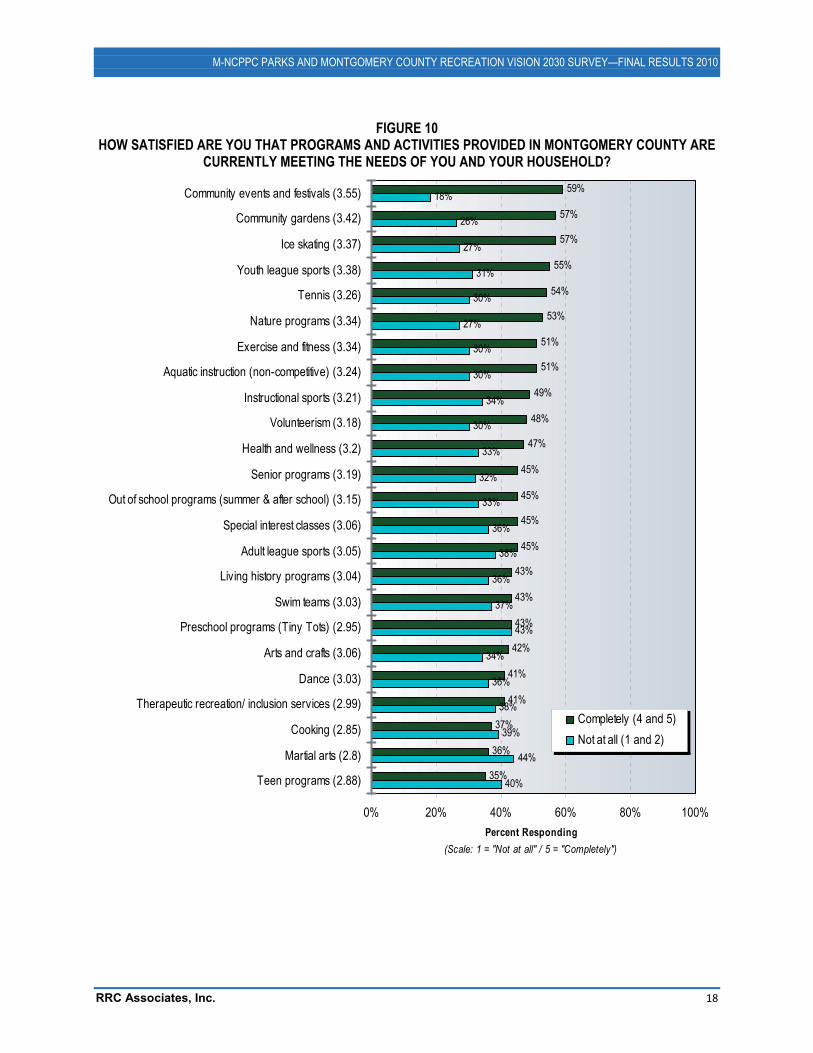
When asked which programs and activities provided throughout the County are currently meeting the needs of their household, respondents again indicated that community events and festivals was at the top of the list.
� Community events and festivals (59 percent “mostly/completely” meeting need, 4 or 5 on 5�point scale)
� Community gardens (57 percent) � Ice skating (57 percent) � Youth league sports (55 percent) � Tennis (54 percent) � Nature programs (53 percent) � Exercise and fitness programs (51 percent) � Aquatic instruction (51 percent)
While exercise and fitness programs were rated relatively high in regards to importance to respondents’ households, the level at which existing exercise and fitness programs in the County are meeting the needs of households was relatively lower (51 percent of respondents indicating “mostly/completely” meeting need, 4 or 5 on 5�point scale). Programs and activities with lower ratings of how well they are meeting the needs of their household include the following:
� Martial arts (44 percent “Not at all” meeting need, 1 or 2 on 5�point scale) � Preschool programs (43 percent) � Teen programs (40 percent) � Cooking (39 percent)
M-NCPPC PARKS AND MONTGOMERY COUNTY RECREATION VISION 2030 SURVEY—FINAL RESULTS 2010
RRC Associates, Inc. 18
FIGURE 10 HOW SATISFIED ARE YOU THAT PROGRAMS AND ACTIVITIES PROVIDED IN MONTGOMERY COUNTY ARE
CURRENTLY MEETING THE NEEDS OF YOU AND YOUR HOUSEHOLD? 59%
57%
57%
55%
54%
53%
51%
51%
49%
48%
47%
45%
45%
45%
45%
43%
43%
43%
42%
41%
41%
37%
36%
35%
18%
26%
27%
31%
30%
27%
30%
30%
34%
30%
33%
32%
33%
36%
38%
36%
37%
43%
34%
36%
38%
39%
44%
40%
0% 20% 40% 60% 80% 100%
Community events and festivals (3.55)
Community gardens (3.42)
Ice skating (3.37)
Youth league sports (3.38)
Tennis (3.26)
Nature programs (3.34)
Exercise and fitness (3.34)
Aquatic instruction (non-competitive) (3.24)
Instructional sports (3.21)
Volunteerism (3.18)
Health and wellness (3.2)
Senior programs (3.19)
Out of school programs (summer & after school) (3.15)
Special interest classes (3.06)
Adult league sports (3.05)
Living history programs (3.04)
Swim teams (3.03)
Preschool programs (Tiny Tots) (2.95)
Arts and crafts (3.06)
Dance (3.03)
Therapeutic recreation/ inclusion services (2.99)
Cooking (2.85)
Martial arts (2.8)
Teen programs (2.88)
Percent Responding(Scale: 1 = "Not at all" / 5 = "Completely")
Completely (4 and 5)Not at all (1 and 2)
M-NCPPC PARKS AND MONTGOMERY COUNTY RECREATION VISION 2030 SURVEY—FINAL RESULTS 2010
RRC Associates, Inc. 19
Importance�Satisfaction Matrix
Parks and Recreation Facilities
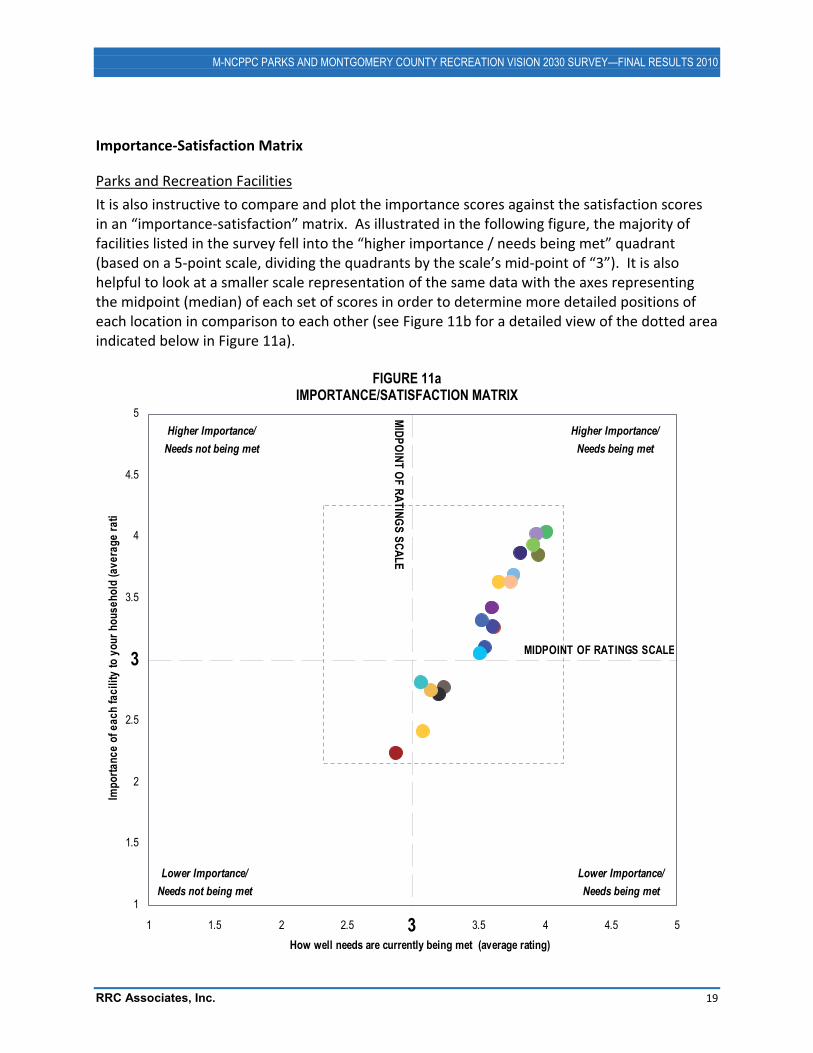
It is also instructive to compare and plot the importance scores against the satisfaction scores in an “importance�satisfaction” matrix. As illustrated in the following figure, the majority of facilities listed in the survey fell into the “higher importance / needs being met” quadrant (based on a 5�point scale, dividing the quadrants by the scale’s mid�point of “3”). It is also helpful to look at a smaller scale representation of the same data with the axes representing the midpoint (median) of each set of scores in order to determine more detailed positions of each location in comparison to each other (see Figure 11b for a detailed view of the dotted area indicated below in Figure 11a).
FIGURE 11a IMPORTANCE/SATISFACTION MATRIX
1
1.5
2
2.5
3
3.5
4
4.5
5
1 1.5 2 2.5 3 3.5 4 4.5 5How well needs are currently being met (average rating)
Impo
rtanc
e of
eac
h fa
cilit
y to
you
r hou
seho
ld (a
vera
ge ra
ti
Higher Importance/Needs being met
Higher Importance/Needs not being met
Lower Importance/Needs not being met
Lower Importance/Needs being met
3
3 MIDPOINT OF RATINGS SCALE
MIDPOINT OF RATINGS SCALE
M-NCPPC PARKS AND MONTGOMERY COUNTY RECREATION VISION 2030 SURVEY—FINAL RESULTS 2010
RRC Associates, Inc. 20
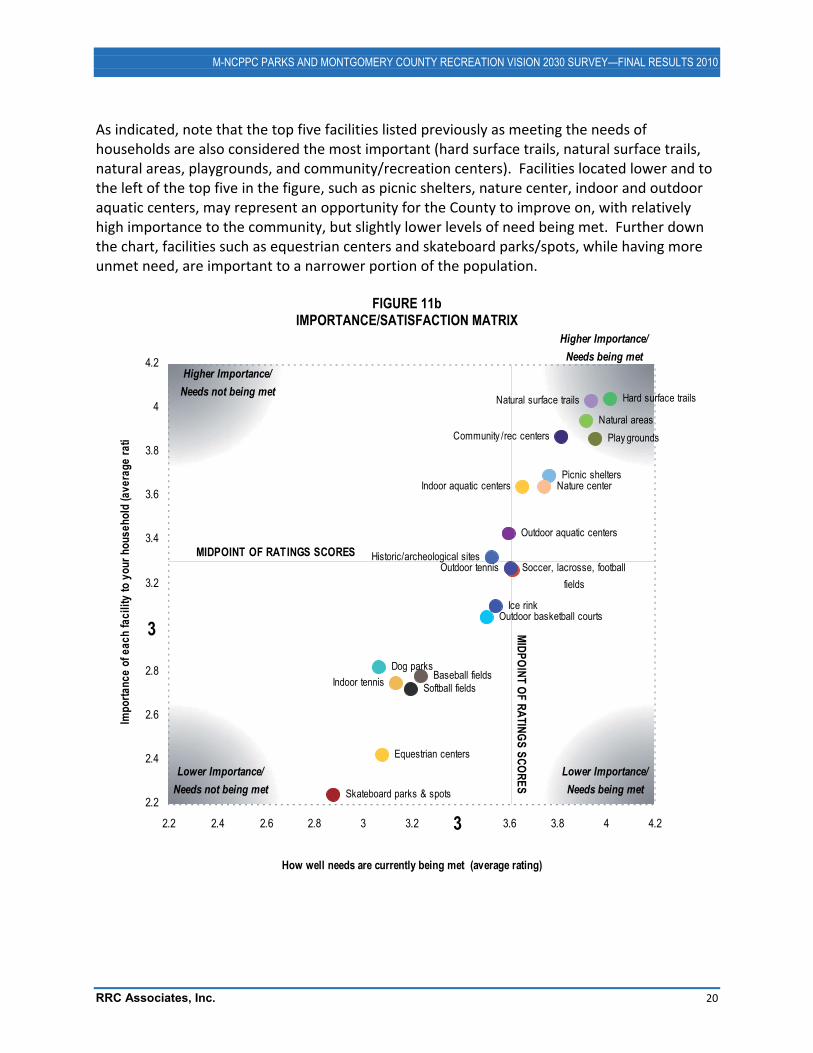
As indicated, note that the top five facilities listed previously as meeting the needs of households are also considered the most important (hard surface trails, natural surface trails, natural areas, playgrounds, and community/recreation centers). Facilities located lower and to the left of the top five in the figure, such as picnic shelters, nature center, indoor and outdoor aquatic centers, may represent an opportunity for the County to improve on, with relatively high importance to the community, but slightly lower levels of need being met. Further down the chart, facilities such as equestrian centers and skateboard parks/spots, while having more unmet need, are important to a narrower portion of the population.
FIGURE 11b IMPORTANCE/SATISFACTION MATRIX
Community /rec centers
Indoor aquatic centers
Outdoor aquatic centers
Skateboard parks & spots
Baseball fieldsSoftball fields
Ice rink
Soccer, lacrosse, football fields
Outdoor basketball courts
Indoor tennis
Outdoor tennis
Play grounds
Picnic shelters
Hard surface trailsNatural surface trails
Nature center
Historic/archeological sites
Dog parks
Natural areas
Equestrian centers
2.2
2.4
2.6
2.8
3
3.2
3.4
3.6
3.8
4
4.2
2.2 2.4 2.6 2.8 3 3.2 3.4 3.6 3.8 4 4.2
How well needs are currently being met (average rating)
Impo
rtanc
e of
eac
h fa
cilit
y to
you
r hou
seho
ld (a
vera
ge ra
ti
3
3
MIDPOINT OF RATINGS SCORES
MIDPOINT OF RATINGS SCORES
Higher Importance/Needs being met
Higher Importance/Needs not being met
Lower Importance/Needs not being met
Lower Importance/Needs being met
M-NCPPC PARKS AND MONTGOMERY COUNTY RECREATION VISION 2030 SURVEY—FINAL RESULTS 2010
RRC Associates, Inc. 21
Programs and Activities
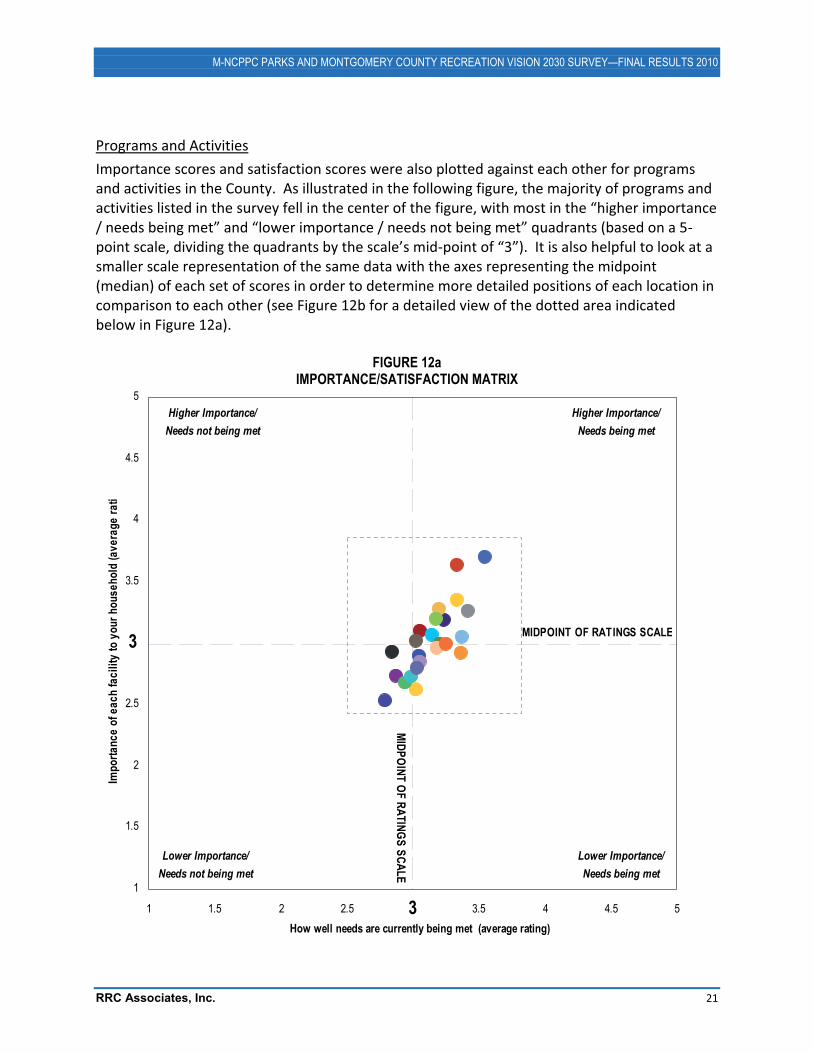
Importance scores and satisfaction scores were also plotted against each other for programs and activities in the County. As illustrated in the following figure, the majority of programs and activities listed in the survey fell in the center of the figure, with most in the “higher importance / needs being met” and “lower importance / needs not being met” quadrants (based on a 5�point scale, dividing the quadrants by the scale’s mid�point of “3”). It is also helpful to look at a smaller scale representation of the same data with the axes representing the midpoint (median) of each set of scores in order to determine more detailed positions of each location in comparison to each other (see Figure 12b for a detailed view of the dotted area indicated below in Figure 12a).
FIGURE 12a IMPORTANCE/SATISFACTION MATRIX
1
1.5
2
2.5
3
3.5
4
4.5
5
1 1.5 2 2.5 3 3.5 4 4.5 5How well needs are currently being met (average rating)
Impo
rtanc
e of
eac
h fa
cilit
y to
you
r hou
seho
ld (a
vera
ge ra
ti
MIDPOINT OF RATINGS SCALE
MIDPOINT OF RATINGS SCALE
3
3
Higher Importance/Needs being met
Higher Importance/Needs not being met
Lower Importance/Needs not being met
Lower Importance/Needs being met
M-NCPPC PARKS AND MONTGOMERY COUNTY RECREATION VISION 2030 SURVEY—FINAL RESULTS 2010
RRC Associates, Inc. 22
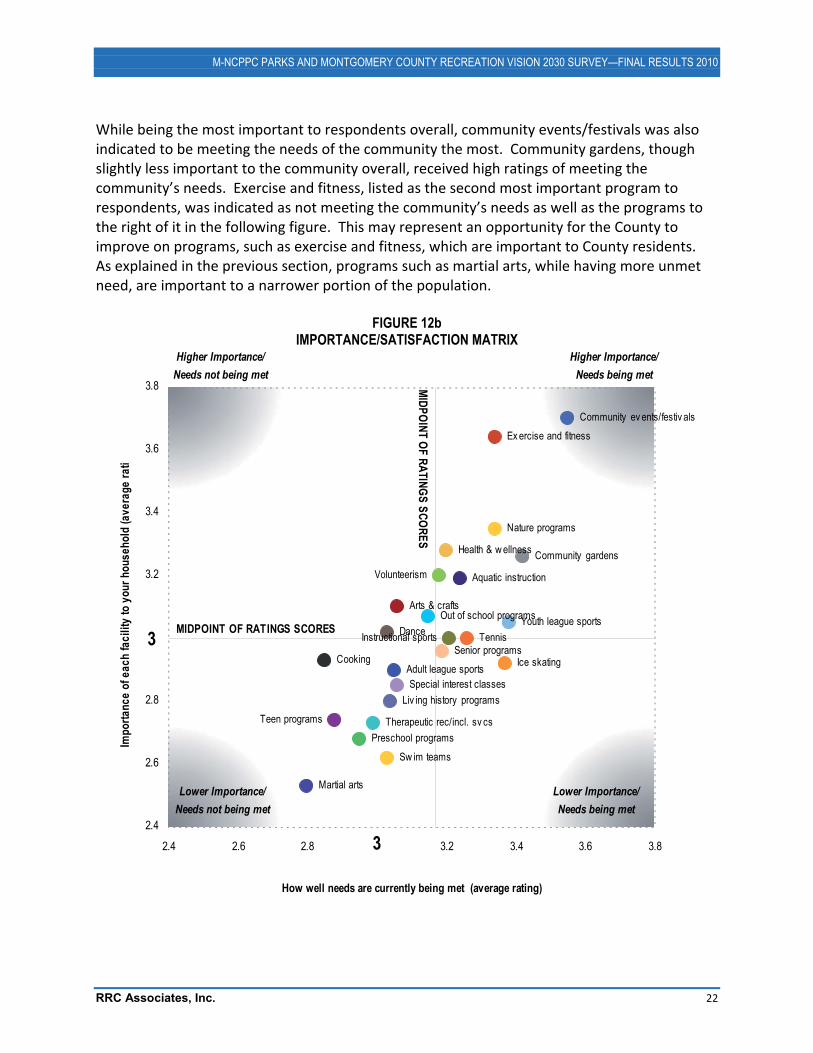
While being the most important to respondents overall, community events/festivals was also indicated to be meeting the needs of the community the most. Community gardens, though slightly less important to the community overall, received high ratings of meeting the community’s needs. Exercise and fitness, listed as the second most important program to respondents, was indicated as not meeting the community’s needs as well as the programs to the right of it in the following figure. This may represent an opportunity for the County to improve on programs, such as exercise and fitness, which are important to County residents. As explained in the previous section, programs such as martial arts, while having more unmet need, are important to a narrower portion of the population.
FIGURE 12b IMPORTANCE/SATISFACTION MATRIX
Aquatic instruction
Sw im teams
Teen programs
Arts & crafts
Dance
CookingAdult league sports
Ex ercise and fitness
Out of school programs
Health & w ellness
Martial arts
Instructional sportsYouth league sports
Preschool programs
Special interest classes
Senior programs
Community ev ents/festiv als
Therapeutic rec/incl. sv cs
Volunteerism
Nature programs
Ice skating
Tennis
Liv ing history programs
Community gardens
2.4
2.6
2.8
3
3.2
3.4
3.6
3.8
2.4 2.6 2.8 3 3.2 3.4 3.6 3.8
How well needs are currently being met (average rating)
Impo
rtanc
e of
eac
h fa
cilit
y to
you
r hou
seho
ld (a
vera
ge ra
ti
MIDPOINT OF RATINGS SCORES
MIDPOINT OF RATINGS SCORES
3
3
Higher Importance/Needs being met
Higher Importance/Needs not being met
Lower Importance/Needs not being met
Lower Importance/Needs being met
M-NCPPC PARKS AND MONTGOMERY COUNTY RECREATION VISION 2030 SURVEY—FINAL RESULTS 2010
RRC Associates, Inc. 23
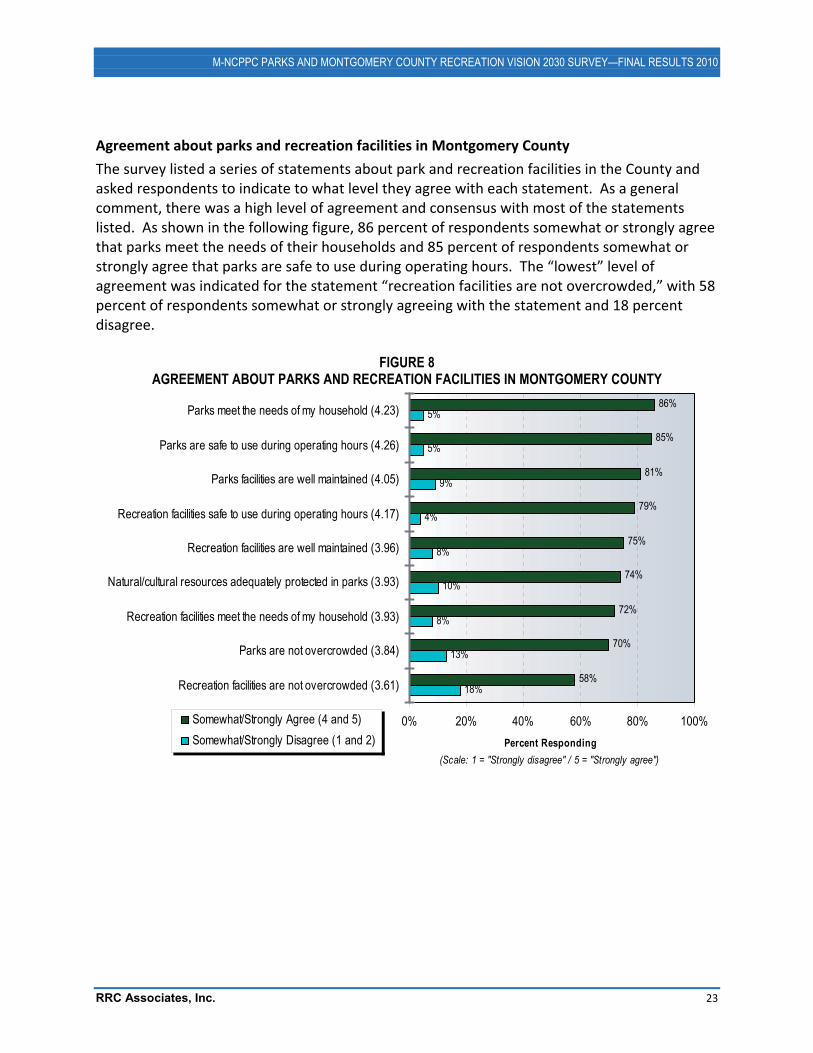
Agreement about parks and recreation facilities in Montgomery County
The survey listed a series of statements about park and recreation facilities in the County and asked respondents to indicate to what level they agree with each statement. As a general comment, there was a high level of agreement and consensus with most of the statements listed. As shown in the following figure, 86 percent of respondents somewhat or strongly agree that parks meet the needs of their households and 85 percent of respondents somewhat or strongly agree that parks are safe to use during operating hours. The “lowest” level of agreement was indicated for the statement “recreation facilities are not overcrowded,” with 58 percent of respondents somewhat or strongly agreeing with the statement and 18 percent disagree.
FIGURE 8 AGREEMENT ABOUT PARKS AND RECREATION FACILITIES IN MONTGOMERY COUNTY
86%
85%
81%
79%
75%
74%
72%
70%
58%
5%
5%
9%
4%
8%
10%
8%
13%
18%
0% 20% 40% 60% 80% 100%
Parks meet the needs of my household (4.23)
Parks are safe to use during operating hours (4.26)
Parks facilities are well maintained (4.05)
Recreation facilities safe to use during operating hours (4.17)
Recreation facilities are well maintained (3.96)
Natural/cultural resources adequately protected in parks (3.93)
Recreation facilities meet the needs of my household (3.93)
Parks are not overcrowded (3.84)
Recreation facilities are not overcrowded (3.61)
Percent Responding(Scale: 1 = "Strongly disagree" / 5 = "Strongly agree")
Somewhat/Strongly Agree (4 and 5)Somewhat/Strongly Disagree (1 and 2)
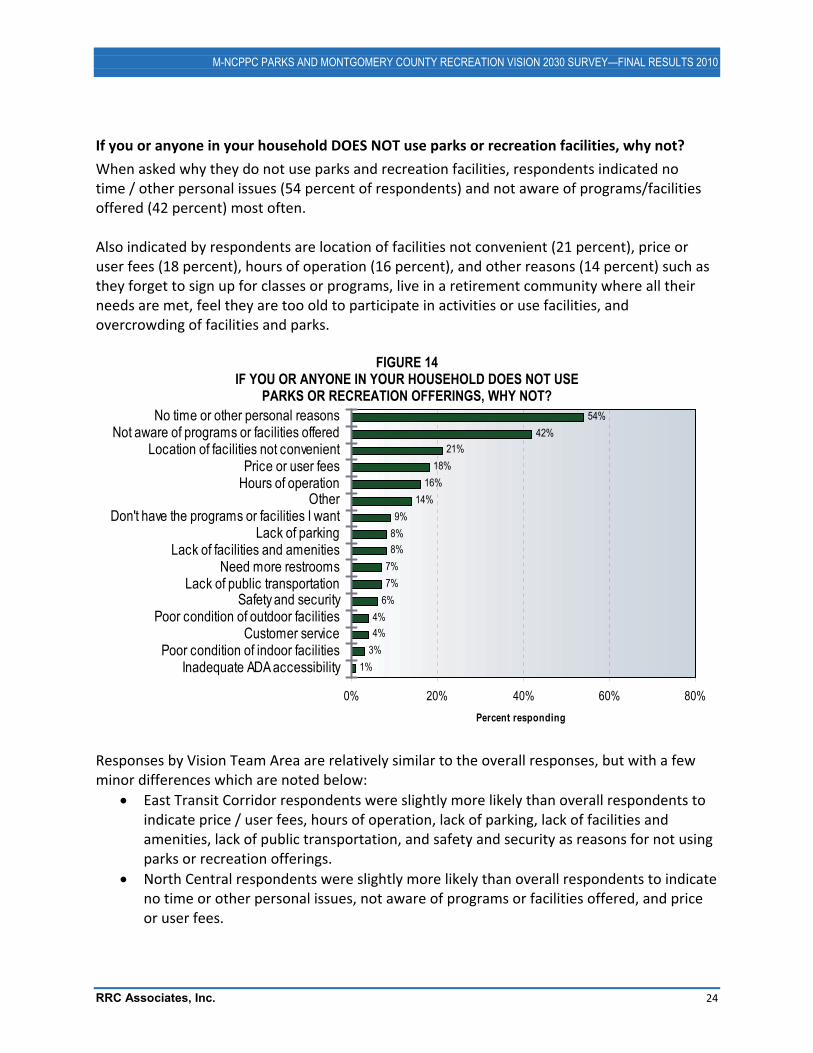
M-NCPPC PARKS AND MONTGOMERY COUNTY RECREATION VISION 2030 SURVEY—FINAL RESULTS 2010
RRC Associates, Inc. 24
If you or anyone in your household DOES NOT use parks or recreation facilities, why not?
When asked why they do not use parks and recreation facilities, respondents indicated no time / other personal issues (54 percent of respondents) and not aware of programs/facilities offered (42 percent) most often. Also indicated by respondents are location of facilities not convenient (21 percent), price or user fees (18 percent), hours of operation (16 percent), and other reasons (14 percent) such as they forget to sign up for classes or programs, live in a retirement community where all their needs are met, feel they are too old to participate in activities or use facilities, and overcrowding of facilities and parks.
FIGURE 14 IF YOU OR ANYONE IN YOUR HOUSEHOLD DOES NOT USE
PARKS OR RECREATION OFFERINGS, WHY NOT? 54%
42%21%
18%16%
14%9%
8%8%
7%7%
6%4%4%
3%1%
0% 20% 40% 60% 80%
No time or other personal reasonsNot aware of programs or facilities offered
Location of facilities not convenientPrice or user fees
Hours of operationOther
Don't have the programs or facilities I wantLack of parking
Lack of facilities and amenitiesNeed more restrooms
Lack of public transportationSafety and security
Poor condition of outdoor facilitiesCustomer service
Poor condition of indoor facilitiesInadequate ADA accessibility
Percent responding
Responses by Vision Team Area are relatively similar to the overall responses, but with a few minor differences which are noted below:
� East Transit Corridor respondents were slightly more likely than overall respondents to indicate price / user fees, hours of operation, lack of parking, lack of facilities and amenities, lack of public transportation, and safety and security as reasons for not using parks or recreation offerings.
� North Central respondents were slightly more likely than overall respondents to indicate no time or other personal issues, not aware of programs or facilities offered, and price or user fees.
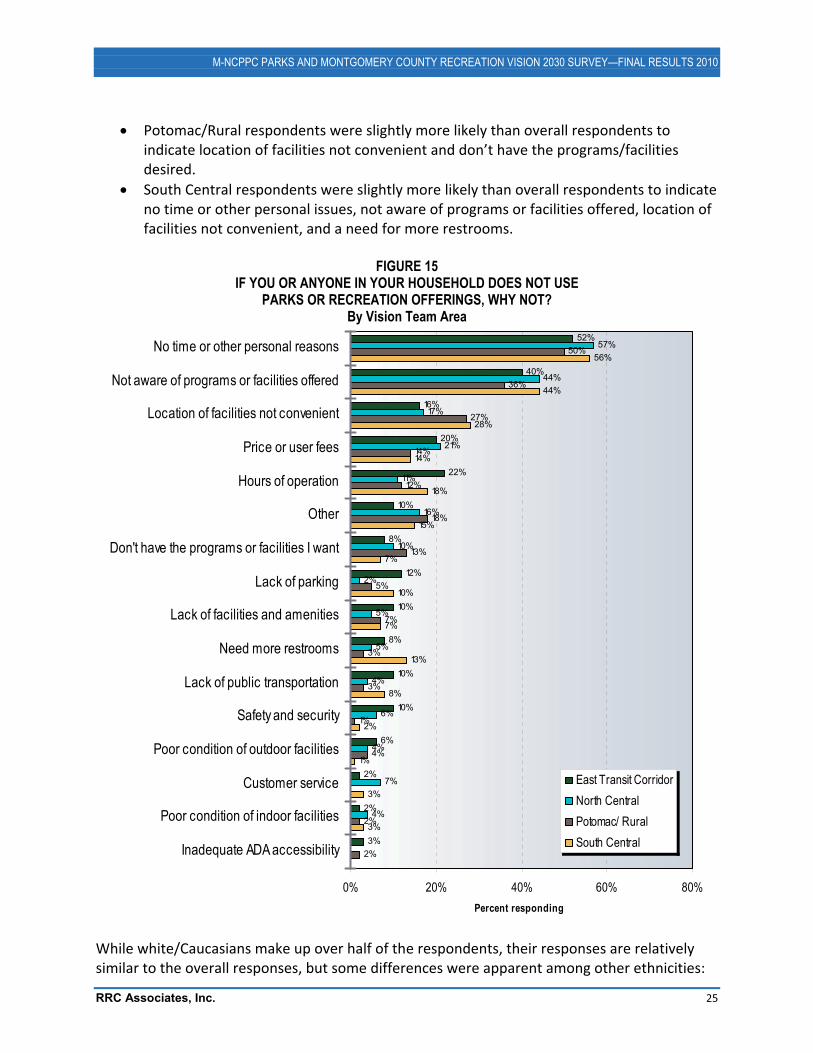
M-NCPPC PARKS AND MONTGOMERY COUNTY RECREATION VISION 2030 SURVEY—FINAL RESULTS 2010
RRC Associates, Inc. 25
� Potomac/Rural respondents were slightly more likely than overall respondents to indicate location of facilities not convenient and don’t have the programs/facilities desired.
� South Central respondents were slightly more likely than overall respondents to indicate no time or other personal issues, not aware of programs or facilities offered, location of facilities not convenient, and a need for more restrooms.
FIGURE 15
IF YOU OR ANYONE IN YOUR HOUSEHOLD DOES NOT USE PARKS OR RECREATION OFFERINGS, WHY NOT?
By Vision Team Area 52%
40%
16%
20%
22%
10%
8%
12%
10%
8%
10%
10%
6%
2%
2%
3%
57%
44%
17%
21%
11%
16%
10%
2%
5%
5%
4%
6%
4%
7%
4%
50%
36%
27%
14%
12%
18%
13%
5%
7%
3%
3%
1%
4%
2%
2%
56%
44%
28%
14%
18%
15%
7%
10%
7%
13%
8%
2%
1%
3%
3%
0% 20% 40% 60% 80%
No time or other personal reasons
Not aware of programs or facilities offered
Location of facilities not convenient
Price or user fees
Hours of operation
Other
Don't have the programs or facilities I want
Lack of parking
Lack of facilities and amenities
Need more restrooms
Lack of public transportation
Safety and security
Poor condition of outdoor facilities
Customer service
Poor condition of indoor facilities
Inadequate ADA accessibility
Percent responding
East Transit CorridorNorth CentralPotomac/ RuralSouth Central
While white/Caucasians make up over half of the respondents, their responses are relatively similar to the overall responses, but some differences were apparent among other ethnicities:
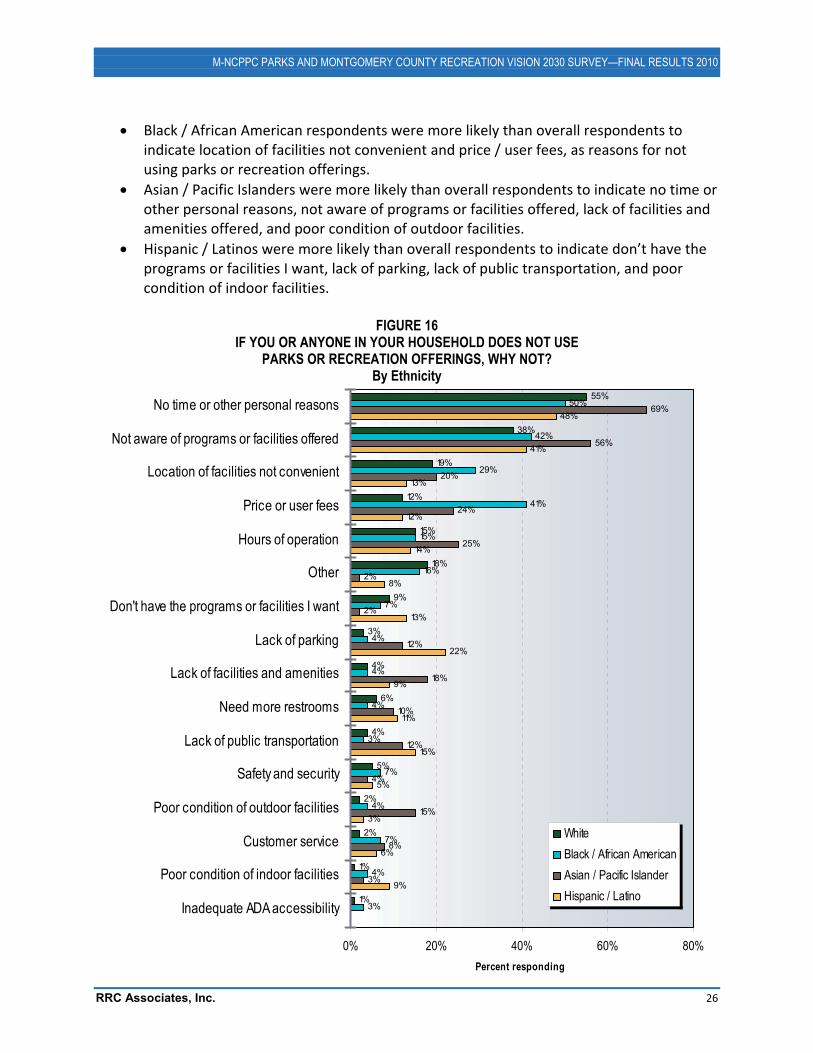
M-NCPPC PARKS AND MONTGOMERY COUNTY RECREATION VISION 2030 SURVEY—FINAL RESULTS 2010
RRC Associates, Inc. 26
� Black / African American respondents were more likely than overall respondents to indicate location of facilities not convenient and price / user fees, as reasons for not using parks or recreation offerings.
� Asian / Pacific Islanders were more likely than overall respondents to indicate no time or other personal reasons, not aware of programs or facilities offered, lack of facilities and amenities offered, and poor condition of outdoor facilities.
� Hispanic / Latinos were more likely than overall respondents to indicate don’t have the programs or facilities I want, lack of parking, lack of public transportation, and poor condition of indoor facilities.
FIGURE 16
IF YOU OR ANYONE IN YOUR HOUSEHOLD DOES NOT USE PARKS OR RECREATION OFFERINGS, WHY NOT?
By Ethnicity 55%
38%
19%
12%
15%
18%
9%
3%
4%
6%
4%
5%
2%
2%
1%
1%
50%
42%
29%
41%
15%
16%
7%
4%
4%
4%
3%
7%
4%
7%
4%
3%
69%
56%
20%
24%
25%
2%
2%
12%
18%
10%
12%
4%
15%
8%
3%
48%
41%
13%
12%
14%
8%
13%
22%
9%
11%
15%
5%
3%
6%
9%
0% 20% 40% 60% 80%
No time or other personal reasons
Not aware of programs or facilities offered
Location of facilities not convenient
Price or user fees
Hours of operation
Other
Don't have the programs or facilities I want
Lack of parking
Lack of facilities and amenities
Need more restrooms
Lack of public transportation
Safety and security
Poor condition of outdoor facilities
Customer service
Poor condition of indoor facilities
Inadequate ADA accessibility
Percent responding
WhiteBlack / African AmericanAsian / Pacific IslanderHispanic / Latino
M-NCPPC PARKS AND MONTGOMERY COUNTY RECREATION VISION 2030 SURVEY—FINAL RESULTS 2010
RRC Associates, Inc. 27
Future Facilities and Programs
Need for future parks, facilities, and programs
In thinking in general about how their household spends leisure time, respondents were asked to indicate, from a list of facilities and programs, which ones their household has a need.
Facilities
Similar to the level of importance in the previous section, the facilities with the highest need include:
� Natural surface trails (80 percent of households indicated a need) � Hard surface trails (76 percent) � Natural areas (74 percent) � Community/recreation centers (74 percent)
Facilities with the lowest level of need include:
� Skateboard parks and spots (21 percent of households indicated a need) � Equestrian centers (23 percent) � Softball fields (30 percent) � Outdoor court games (31 percent) � Baseball fields (31 percent)
Programs
Similar to the level of importance discussed earlier in the report, programs with the highest need include:
� Community events and festivals (72 percent of households indicated a need) � Exercise and fitness (70 percent)
Programs with the lowest level of need include:
� Martial arts (23 percent of households indicated a need) � Swim teams (24 percent) � Therapeutic recreation / inclusion services (28 percent) � Preschool programs (28 percent) � Teen programs (30 percent)
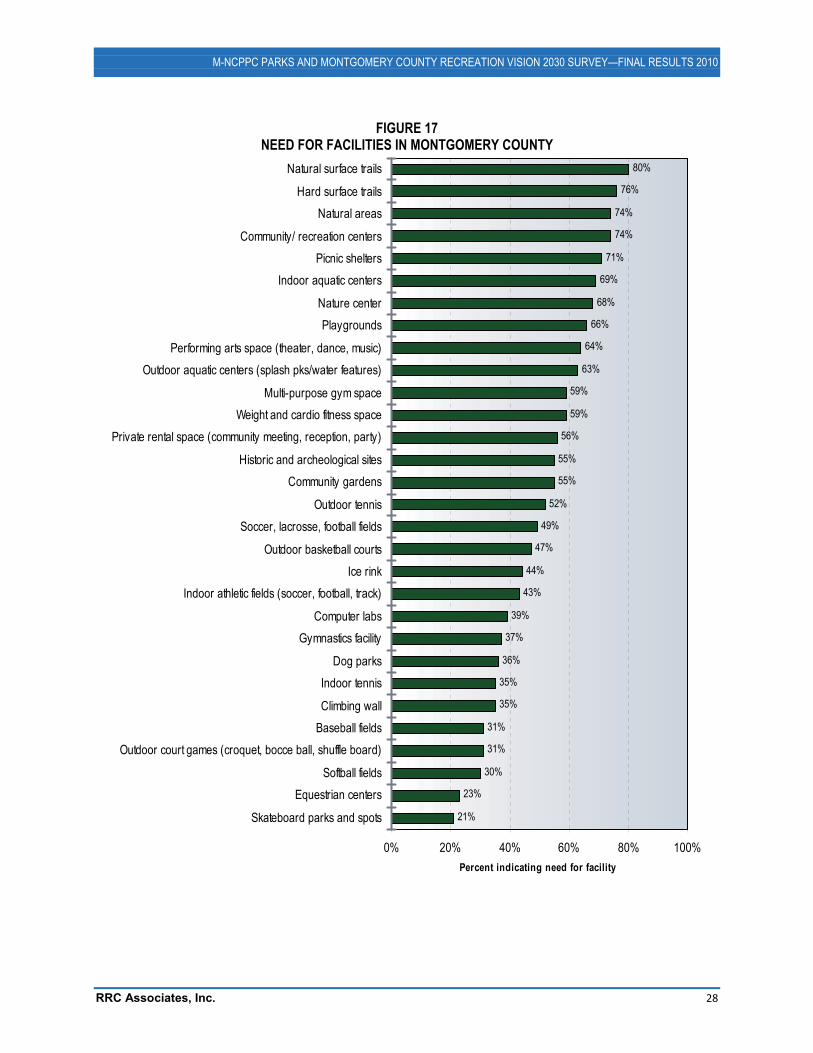
M-NCPPC PARKS AND MONTGOMERY COUNTY RECREATION VISION 2030 SURVEY—FINAL RESULTS 2010
RRC Associates, Inc. 28
FIGURE 17 NEED FOR FACILITIES IN MONTGOMERY COUNTY
80%
76%
74%
74%
71%
69%
68%
66%
64%
63%
59%
59%
56%
55%
55%
52%
49%
47%
44%
43%
39%
37%
36%
35%
35%
31%
31%
30%
23%
21%
0% 20% 40% 60% 80% 100%
Natural surface trails
Hard surface trailsNatural areas
Community/ recreation centersPicnic shelters
Indoor aquatic centers
Nature centerPlaygrounds
Performing arts space (theater, dance, music)Outdoor aquatic centers (splash pks/water features)
Multi-purpose gym spaceWeight and cardio fitness space
Private rental space (community meeting, reception, party)
Historic and archeological sitesCommunity gardens
Outdoor tennisSoccer, lacrosse, football fields
Outdoor basketball courtsIce rink
Indoor athletic fields (soccer, football, track)
Computer labsGymnastics facility
Dog parksIndoor tennis
Climbing wallBaseball fields
Outdoor court games (croquet, bocce ball, shuffle board)
Softball fieldsEquestrian centers
Skateboard parks and spots
Percent indicating need for facility
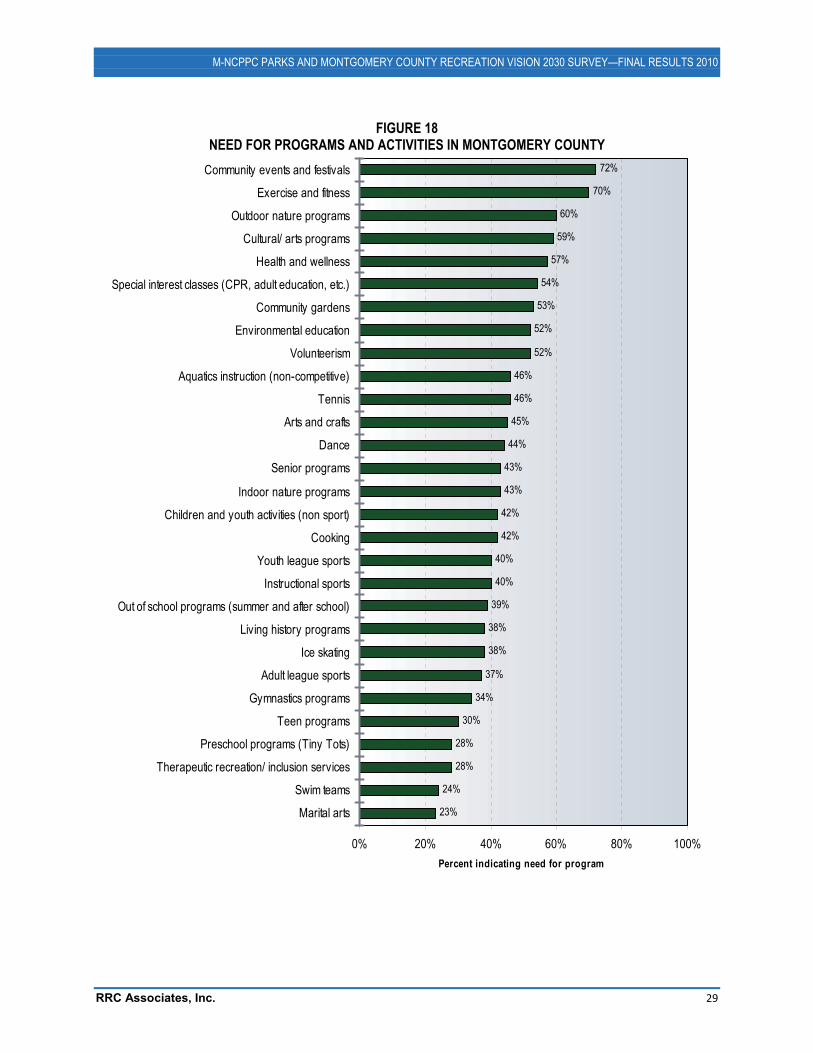
M-NCPPC PARKS AND MONTGOMERY COUNTY RECREATION VISION 2030 SURVEY—FINAL RESULTS 2010
RRC Associates, Inc. 29
FIGURE 18 NEED FOR PROGRAMS AND ACTIVITIES IN MONTGOMERY COUNTY
72%
70%
60%
59%
57%
54%
53%
52%
52%
46%
46%
45%
44%
43%
43%
42%
42%
40%
40%
39%
38%
38%
37%
34%
30%
28%
28%
24%
23%
0% 20% 40% 60% 80% 100%
Community events and festivals
Exercise and fitness
Outdoor nature programs
Cultural/ arts programs
Health and wellness
Special interest classes (CPR, adult education, etc.)
Community gardens
Environmental education
Volunteerism
Aquatics instruction (non-competitive)
Tennis
Arts and crafts
Dance
Senior programs
Indoor nature programs
Children and youth activities (non sport)
Cooking
Youth league sports
Instructional sports
Out of school programs (summer and after school)
Living history programs
Ice skating
Adult league sports
Gymnastics programs
Teen programs
Preschool programs (Tiny Tots)
Therapeutic recreation/ inclusion services
Swim teams
Marital arts
Percent indicating need for program
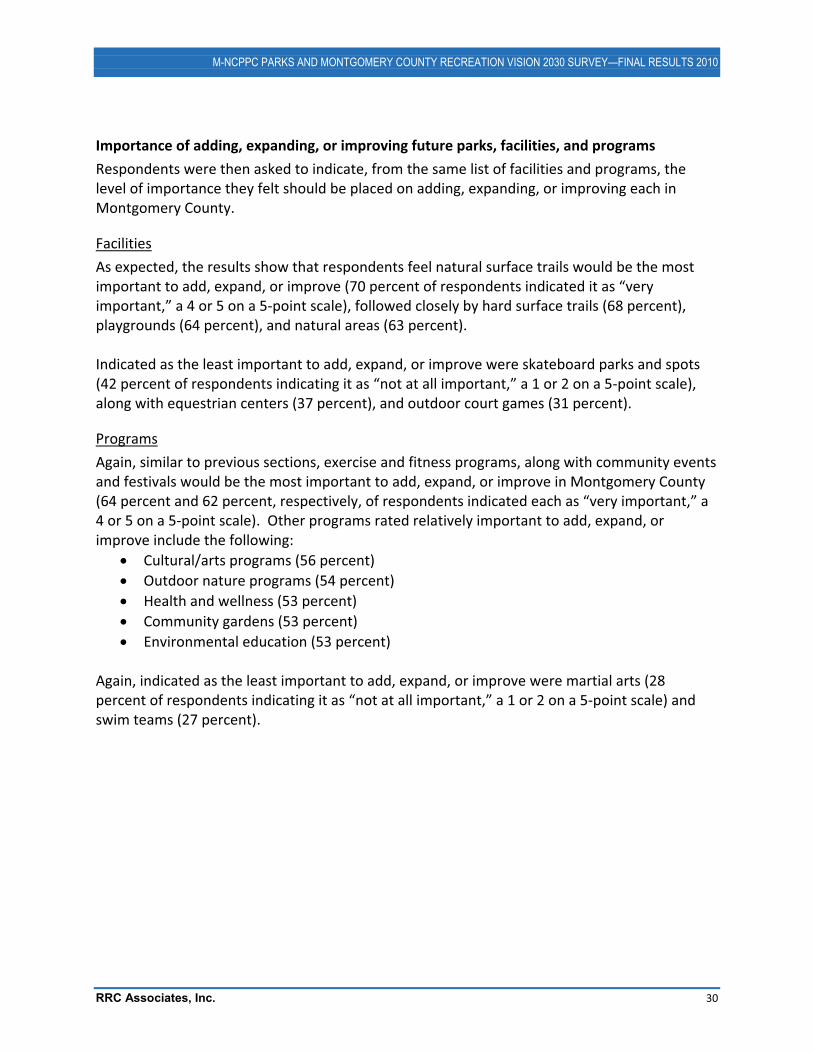
M-NCPPC PARKS AND MONTGOMERY COUNTY RECREATION VISION 2030 SURVEY—FINAL RESULTS 2010
RRC Associates, Inc. 30
Importance of adding, expanding, or improving future parks, facilities, and programs
Respondents were then asked to indicate, from the same list of facilities and programs, the level of importance they felt should be placed on adding, expanding, or improving each in Montgomery County.
Facilities
As expected, the results show that respondents feel natural surface trails would be the most important to add, expand, or improve (70 percent of respondents indicated it as “very important,” a 4 or 5 on a 5�point scale), followed closely by hard surface trails (68 percent), playgrounds (64 percent), and natural areas (63 percent). Indicated as the least important to add, expand, or improve were skateboard parks and spots (42 percent of respondents indicating it as “not at all important,” a 1 or 2 on a 5�point scale), along with equestrian centers (37 percent), and outdoor court games (31 percent).
Programs
Again, similar to previous sections, exercise and fitness programs, along with community events and festivals would be the most important to add, expand, or improve in Montgomery County (64 percent and 62 percent, respectively, of respondents indicated each as “very important,” a 4 or 5 on a 5�point scale). Other programs rated relatively important to add, expand, or improve include the following:
� Cultural/arts programs (56 percent) � Outdoor nature programs (54 percent) � Health and wellness (53 percent) � Community gardens (53 percent) � Environmental education (53 percent)
Again, indicated as the least important to add, expand, or improve were martial arts (28 percent of respondents indicating it as “not at all important,” a 1 or 2 on a 5�point scale) and swim teams (27 percent).
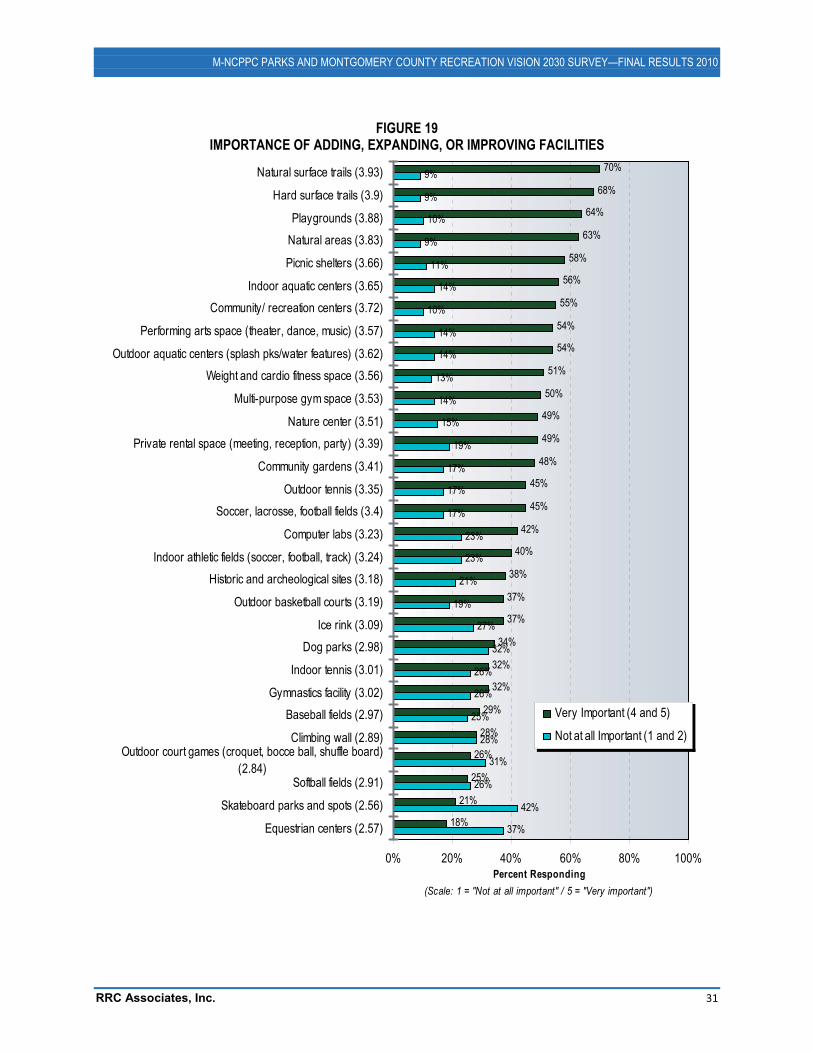
M-NCPPC PARKS AND MONTGOMERY COUNTY RECREATION VISION 2030 SURVEY—FINAL RESULTS 2010
RRC Associates, Inc. 31
FIGURE 19 IMPORTANCE OF ADDING, EXPANDING, OR IMPROVING FACILITIES
70%
68%
64%
63%
58%
56%
55%
54%
54%
51%
50%
49%
49%
48%
45%
45%
42%
40%
38%
37%
37%
34%
32%
32%
29%
28%
26%
25%
21%
18%
9%
9%
10%
9%
11%
14%
10%
14%
14%
13%
14%
15%
19%
17%
17%
17%
23%
23%
21%
19%
27%
32%
26%
26%
25%
28%
31%
26%
42%
37%
0% 20% 40% 60% 80% 100%
Natural surface trails (3.93)
Hard surface trails (3.9)
Playgrounds (3.88)Natural areas (3.83)
Picnic shelters (3.66)
Indoor aquatic centers (3.65)Community/ recreation centers (3.72)
Performing arts space (theater, dance, music) (3.57)
Outdoor aquatic centers (splash pks/water features) (3.62)Weight and cardio fitness space (3.56)
Multi-purpose gym space (3.53)
Nature center (3.51)Private rental space (meeting, reception, party) (3.39)
Community gardens (3.41)
Outdoor tennis (3.35)Soccer, lacrosse, football fields (3.4)
Computer labs (3.23)
Indoor athletic fields (soccer, football, track) (3.24)Historic and archeological sites (3.18)
Outdoor basketball courts (3.19)
Ice rink (3.09)Dog parks (2.98)
Indoor tennis (3.01)
Gymnastics facility (3.02)Baseball fields (2.97)
Climbing wall (2.89)Outdoor court games (croquet, bocce ball, shuffle board)
(2.84)Softball fields (2.91)
Skateboard parks and spots (2.56)
Equestrian centers (2.57)
Percent Responding(Scale: 1 = "Not at all important" / 5 = "Very important")
Very Important (4 and 5)
Not at all Important (1 and 2)
M-NCPPC PARKS AND MONTGOMERY COUNTY RECREATION VISION 2030 SURVEY—FINAL RESULTS 2010
RRC Associates, Inc. 32
FIGURE 20 IMPORTANCE OF ADDING, EXPANDING, OR IMPROVING PROGRAMS AND ACTIVITIES
64%
62%
56%
54%
53%
53%
53%
51%
51%
50%
49%
49%
48%
43%
43%
42%
41%
40%
40%
39%
38%
37%
37%
37%
35%
33%
32%
26%
25%
7%
10%
14%
10%
12%
13%
14%
16%
16%
16%
16%
16%
19%
17%
18%
16%
16%
20%
23%
21%
20%
21%
21%
23%
23%
24%
21%
27%
28%
0% 20% 40% 60% 80% 100%
Exercise and fitness (3.86)
Community events and festivals (3.72)Cultural/ arts programs (3.53)
Outdoor nature programs (3.59)
Health and wellness (3.6)Community gardens (3.54)
Environmental education (3.53)Special interest classes (CPR, adult education, etc.) (3.46)
Out of school programs (summer and after school) (3.56)
Senior programs (3.5)Children and youth activities (non sport) (3.47)
Youth league sports (3.48)Aquatics instruction (non-competitive) (3.41)
Volunteerism (3.28)
Arts and crafts (3.24)Tennis (3.35)
Instructional sports (3.36)Indoor nature programs (3.23)
Adult league sports (3.21)Preschool programs (Tiny Tots) (3.21)
Cooking (3.18)
Teen programs (3.2)Dance (3.14)
Gymnastics programs (3.11)Ice skating (3.06)
Living history programs (3.05)
Therapeutic recreation/ inclusion services (3.1)Swim teams (2.9)
Martial arts (2.87)
Percent Responding(Scale: 1 = "Not at all important" / 5 = "Very important")
Very Important (4 and 5)
Not at all Important (1 and 2)
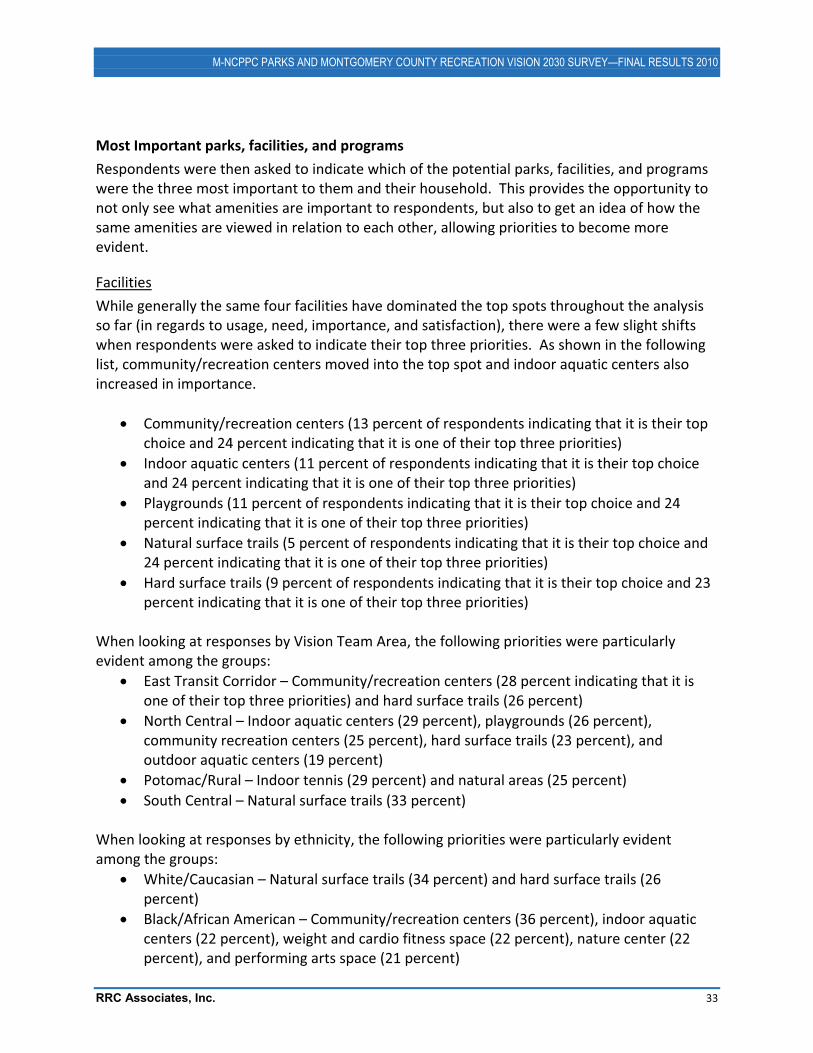
M-NCPPC PARKS AND MONTGOMERY COUNTY RECREATION VISION 2030 SURVEY—FINAL RESULTS 2010
RRC Associates, Inc. 33
Most Important parks, facilities, and programs
Respondents were then asked to indicate which of the potential parks, facilities, and programs were the three most important to them and their household. This provides the opportunity to not only see what amenities are important to respondents, but also to get an idea of how the same amenities are viewed in relation to each other, allowing priorities to become more evident.
Facilities
While generally the same four facilities have dominated the top spots throughout the analysis so far (in regards to usage, need, importance, and satisfaction), there were a few slight shifts when respondents were asked to indicate their top three priorities. As shown in the following list, community/recreation centers moved into the top spot and indoor aquatic centers also increased in importance.
� Community/recreation centers (13 percent of respondents indicating that it is their top choice and 24 percent indicating that it is one of their top three priorities)
� Indoor aquatic centers (11 percent of respondents indicating that it is their top choice and 24 percent indicating that it is one of their top three priorities)
� Playgrounds (11 percent of respondents indicating that it is their top choice and 24 percent indicating that it is one of their top three priorities)
� Natural surface trails (5 percent of respondents indicating that it is their top choice and 24 percent indicating that it is one of their top three priorities)
� Hard surface trails (9 percent of respondents indicating that it is their top choice and 23 percent indicating that it is one of their top three priorities)
When looking at responses by Vision Team Area, the following priorities were particularly evident among the groups:
� East Transit Corridor – Community/recreation centers (28 percent indicating that it is one of their top three priorities) and hard surface trails (26 percent)
� North Central – Indoor aquatic centers (29 percent), playgrounds (26 percent), community recreation centers (25 percent), hard surface trails (23 percent), and outdoor aquatic centers (19 percent)
� Potomac/Rural – Indoor tennis (29 percent) and natural areas (25 percent) � South Central – Natural surface trails (33 percent)
When looking at responses by ethnicity, the following priorities were particularly evident among the groups:
� White/Caucasian – Natural surface trails (34 percent) and hard surface trails (26 percent)
� Black/African American – Community/recreation centers (36 percent), indoor aquatic centers (22 percent), weight and cardio fitness space (22 percent), nature center (22 percent), and performing arts space (21 percent)
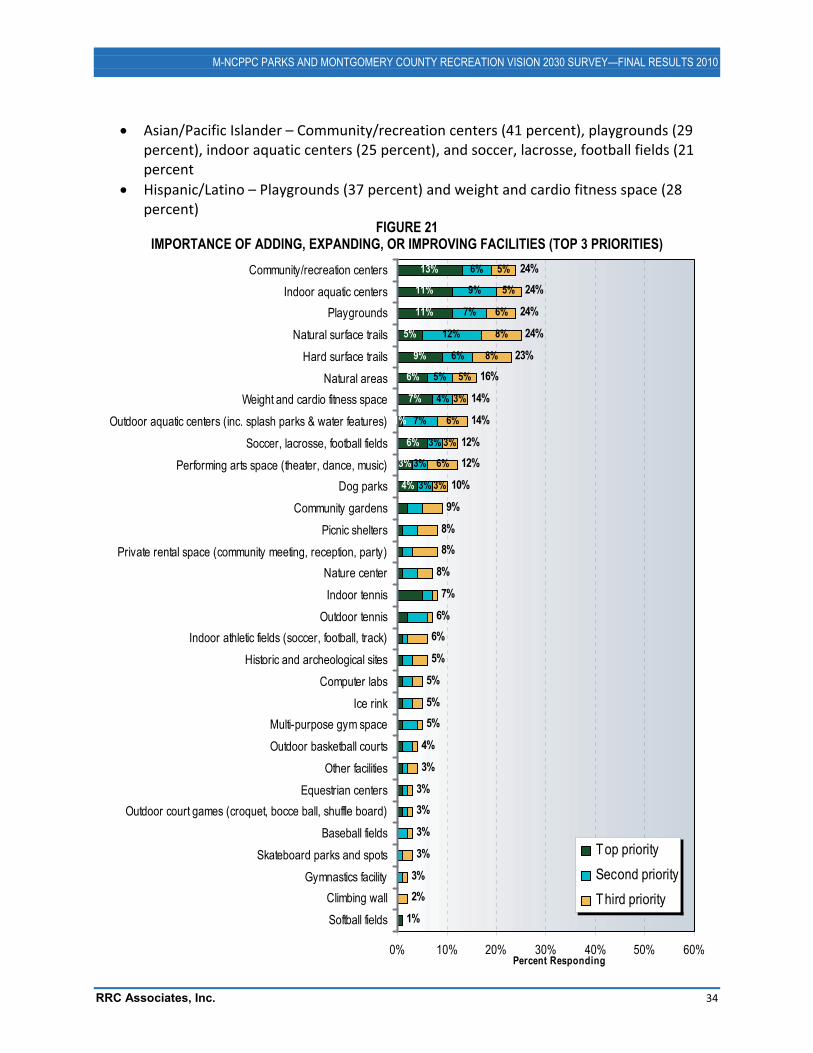
M-NCPPC PARKS AND MONTGOMERY COUNTY RECREATION VISION 2030 SURVEY—FINAL RESULTS 2010
RRC Associates, Inc. 34
� Asian/Pacific Islander – Community/recreation centers (41 percent), playgrounds (29 percent), indoor aquatic centers (25 percent), and soccer, lacrosse, football fields (21 percent
� Hispanic/Latino – Playgrounds (37 percent) and weight and cardio fitness space (28 percent)
FIGURE 21 IMPORTANCE OF ADDING, EXPANDING, OR IMPROVING FACILITIES (TOP 3 PRIORITIES)
13%
11%
11%
5%
9%
6%
7%
1%
6%
3%
4%
6%
9%
7%
12%
6%
5%
4%
7%
3%
3%
3%
5%
5%
6%
8%
8%
5%
3%
6%
3%
6%
3%
24%24%
24%
24%
23%16%
14%
14%
12%12%
10%
9%
8%8%
8%
7%
6%6%
5%
5%
5%5%
4%
3%
3%3%
3%
3%
3%2%
1%
0% 10% 20% 30% 40% 50% 60%
Community/recreation centersIndoor aquatic centers
PlaygroundsNatural surface trails
Hard surface trailsNatural areas
Weight and cardio fitness spaceOutdoor aquatic centers (inc. splash parks & water features)
Soccer, lacrosse, football fieldsPerforming arts space (theater, dance, music)
Dog parksCommunity gardens
Picnic sheltersPrivate rental space (community meeting, reception, party)
Nature centerIndoor tennis
Outdoor tennisIndoor athletic fields (soccer, football, track)
Historic and archeological sitesComputer labs
Ice rinkMulti-purpose gym spaceOutdoor basketball courts
Other facilitiesEquestrian centers
Outdoor court games (croquet, bocce ball, shuffle board)Baseball fields
Skateboard parks and spotsGymnastics facility
Climbing wallSoftball fields
Percent Responding
Top prioritySecond priorityThird priority
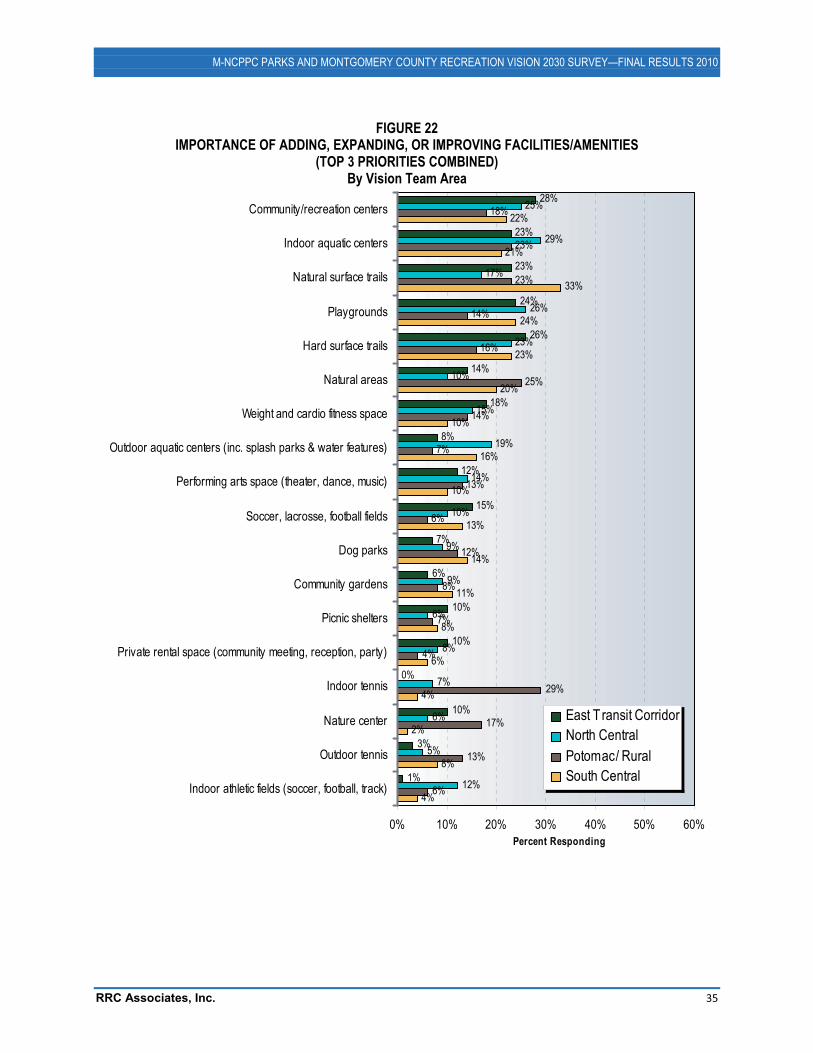
M-NCPPC PARKS AND MONTGOMERY COUNTY RECREATION VISION 2030 SURVEY—FINAL RESULTS 2010
RRC Associates, Inc. 35
FIGURE 22 IMPORTANCE OF ADDING, EXPANDING, OR IMPROVING FACILITIES/AMENITIES
(TOP 3 PRIORITIES COMBINED) By Vision Team Area
28%
23%
23%
24%
26%
14%
18%
8%
12%
15%
7%
25%
29%
17%
26%
23%
10%
15%
19%
14%
10%
9%
18%
23%
23%
14%
16%
25%
14%
7%
13%
6%
12%
22%
21%
33%
24%
23%
20%
10%
16%
10%
13%
14%
11%
8%
6%
4%
2%
8%
4%
1%
3%
10%
0%
10%
10%
6%
12%
5%
6%
7%
8%
6%
9%
6%
13%
17%
29%
4%
7%
8%
0% 10% 20% 30% 40% 50% 60%
Community/recreation centers
Indoor aquatic centers
Natural surface trails
Playgrounds
Hard surface trails
Natural areas
Weight and cardio fitness space
Outdoor aquatic centers (inc. splash parks & water features)
Performing arts space (theater, dance, music)
Soccer, lacrosse, football fields
Dog parks
Community gardens
Picnic shelters
Private rental space (community meeting, reception, party)
Indoor tennis
Nature center
Outdoor tennis
Indoor athletic fields (soccer, football, track)
Percent Responding
East T ransit CorridorNorth CentralPotomac/ RuralSouth Central
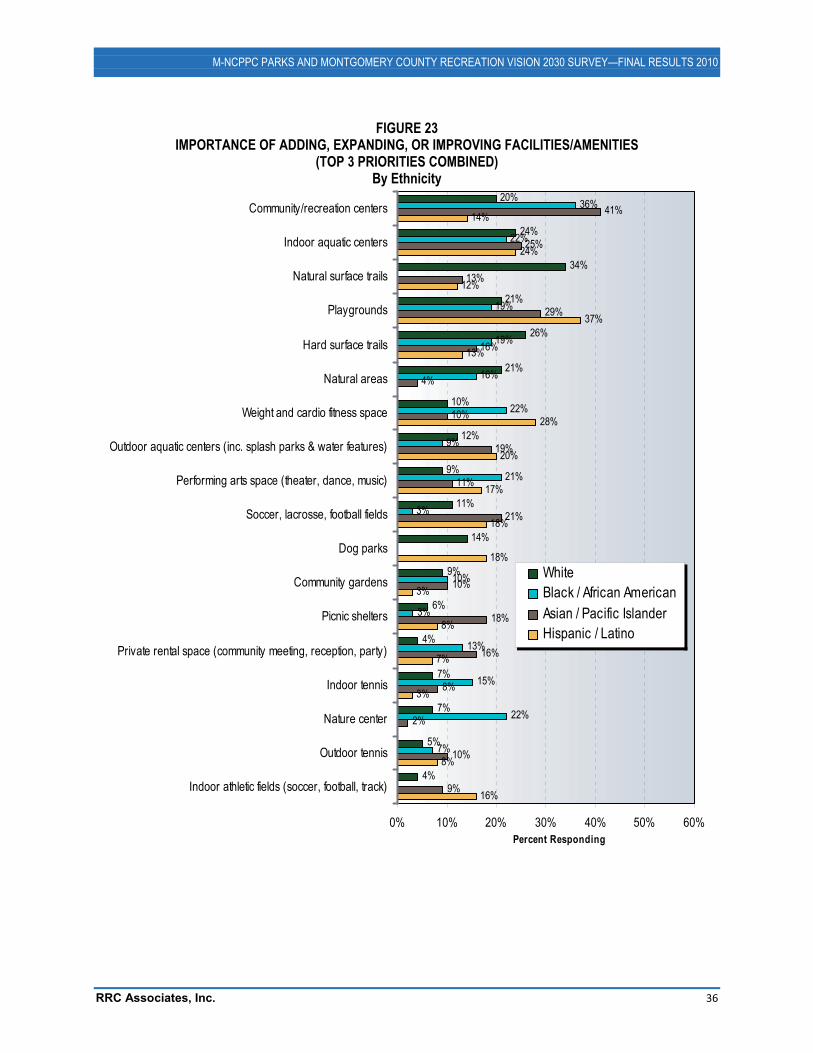
M-NCPPC PARKS AND MONTGOMERY COUNTY RECREATION VISION 2030 SURVEY—FINAL RESULTS 2010
RRC Associates, Inc. 36
FIGURE 23 IMPORTANCE OF ADDING, EXPANDING, OR IMPROVING FACILITIES/AMENITIES
(TOP 3 PRIORITIES COMBINED) By Ethnicity
20%
24%
34%
21%
26%
21%
10%
12%
9%
11%
14%
36%
22%
19%
19%
16%
22%
9%
21%
3%
41%
25%
13%
29%
16%
4%
10%
19%
11%
21%
14%
24%
12%
37%
13%
28%
20%
17%
18%
18%
3%
8%
7%
3%
8%
16%
4%
5%
7%
7%
4%
6%
9%
7%
22%
15%
13%
3%
10%
9%
10%
2%
8%
16%
18%
10%
0% 10% 20% 30% 40% 50% 60%
Community/recreation centers
Indoor aquatic centers
Natural surface trails
Playgrounds
Hard surface trails
Natural areas
Weight and cardio fitness space
Outdoor aquatic centers (inc. splash parks & water features)
Performing arts space (theater, dance, music)
Soccer, lacrosse, football fields
Dog parks
Community gardens
Picnic shelters
Private rental space (community meeting, reception, party)
Indoor tennis
Nature center
Outdoor tennis
Indoor athletic fields (soccer, football, track)
Percent Responding
WhiteBlack / African AmericanAsian / Pacific IslanderHispanic / Latino
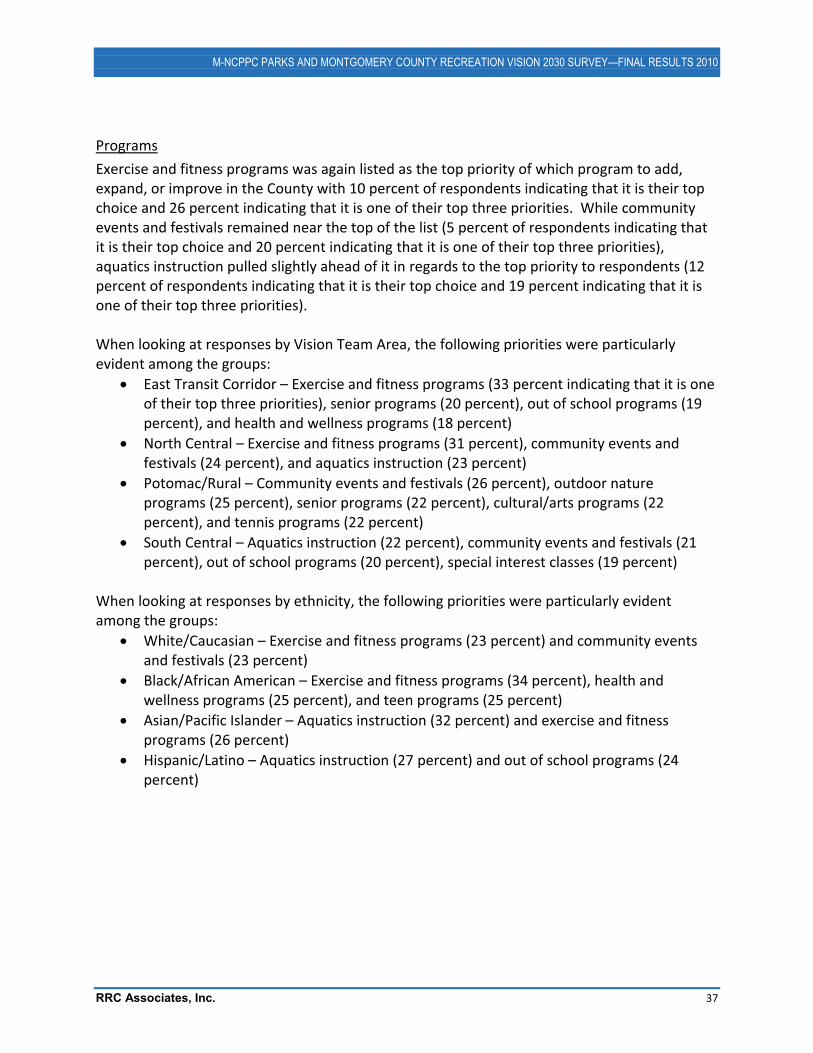
M-NCPPC PARKS AND MONTGOMERY COUNTY RECREATION VISION 2030 SURVEY—FINAL RESULTS 2010
RRC Associates, Inc. 37
Programs
Exercise and fitness programs was again listed as the top priority of which program to add, expand, or improve in the County with 10 percent of respondents indicating that it is their top choice and 26 percent indicating that it is one of their top three priorities. While community events and festivals remained near the top of the list (5 percent of respondents indicating that it is their top choice and 20 percent indicating that it is one of their top three priorities), aquatics instruction pulled slightly ahead of it in regards to the top priority to respondents (12 percent of respondents indicating that it is their top choice and 19 percent indicating that it is one of their top three priorities). When looking at responses by Vision Team Area, the following priorities were particularly evident among the groups:
� East Transit Corridor – Exercise and fitness programs (33 percent indicating that it is one of their top three priorities), senior programs (20 percent), out of school programs (19 percent), and health and wellness programs (18 percent)
� North Central – Exercise and fitness programs (31 percent), community events and festivals (24 percent), and aquatics instruction (23 percent)
� Potomac/Rural – Community events and festivals (26 percent), outdoor nature programs (25 percent), senior programs (22 percent), cultural/arts programs (22 percent), and tennis programs (22 percent)
� South Central – Aquatics instruction (22 percent), community events and festivals (21 percent), out of school programs (20 percent), special interest classes (19 percent)
When looking at responses by ethnicity, the following priorities were particularly evident among the groups:
� White/Caucasian – Exercise and fitness programs (23 percent) and community events and festivals (23 percent)
� Black/African American – Exercise and fitness programs (34 percent), health and wellness programs (25 percent), and teen programs (25 percent)
� Asian/Pacific Islander – Aquatics instruction (32 percent) and exercise and fitness programs (26 percent)
� Hispanic/Latino – Aquatics instruction (27 percent) and out of school programs (24 percent)
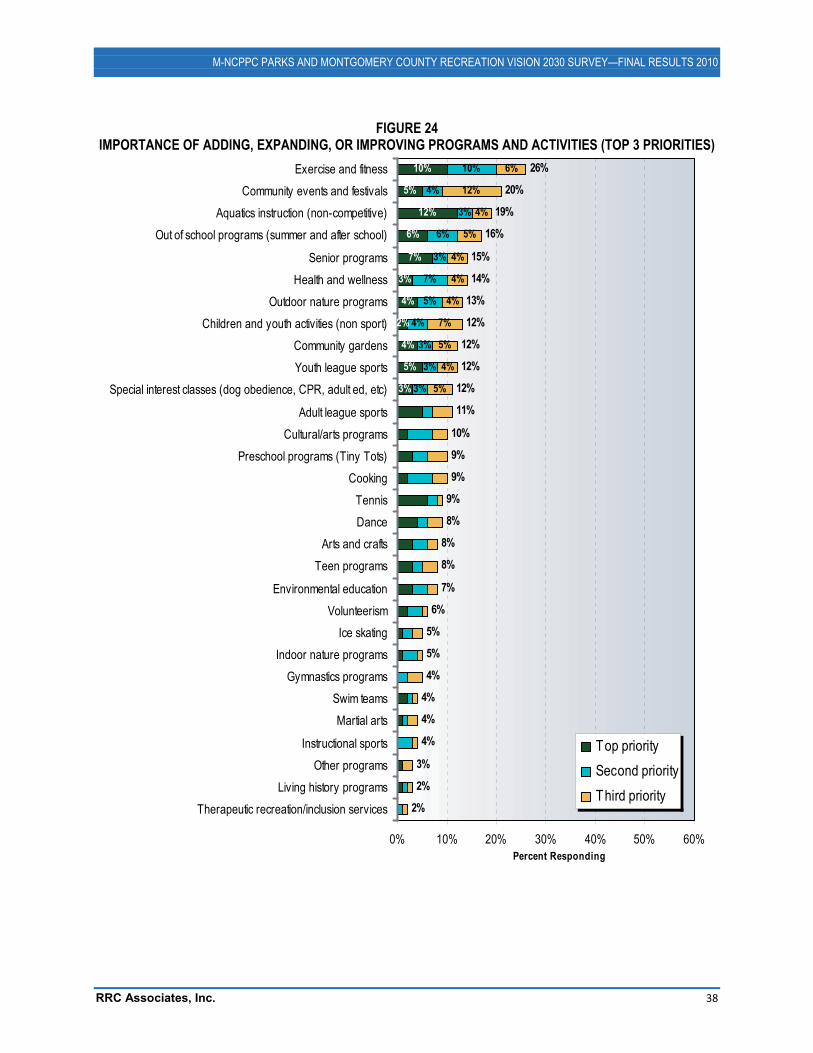
M-NCPPC PARKS AND MONTGOMERY COUNTY RECREATION VISION 2030 SURVEY—FINAL RESULTS 2010
RRC Associates, Inc. 38
FIGURE 24 IMPORTANCE OF ADDING, EXPANDING, OR IMPROVING PROGRAMS AND ACTIVITIES (TOP 3 PRIORITIES)
10%
5%
12%
6%
7%
3%
4%
2%
4%
5%
3%
10%
4%
3%
6%
3%
7%
5%
4%
3%
3%
3%
6%
12%
4%
5%
4%
4%
4%
7%
5%
4%
5%
26%
20%
19%
16%
15%
14%
13%
12%
12%
12%
12%
11%
10%
9%
9%
9%
8%
8%
8%
7%
6%
5%
5%
4%
4%
4%
4%
3%
2%
2%
0% 10% 20% 30% 40% 50% 60%
Exercise and fitnessCommunity events and festivals
Aquatics instruction (non-competitive)Out of school programs (summer and after school)
Senior programsHealth and wellness
Outdoor nature programsChildren and youth activities (non sport)
Community gardensYouth league sports
Special interest classes (dog obedience, CPR, adult ed, etc)
Adult league sportsCultural/arts programs
Preschool programs (Tiny Tots)Cooking
TennisDance
Arts and craftsTeen programs
Environmental educationVolunteerism
Ice skatingIndoor nature programs
Gymnastics programsSwim teamsMartial arts
Instructional sportsOther programs
Living history programsTherapeutic recreation/inclusion services
Percent Responding
Top prioritySecond priorityThird priority
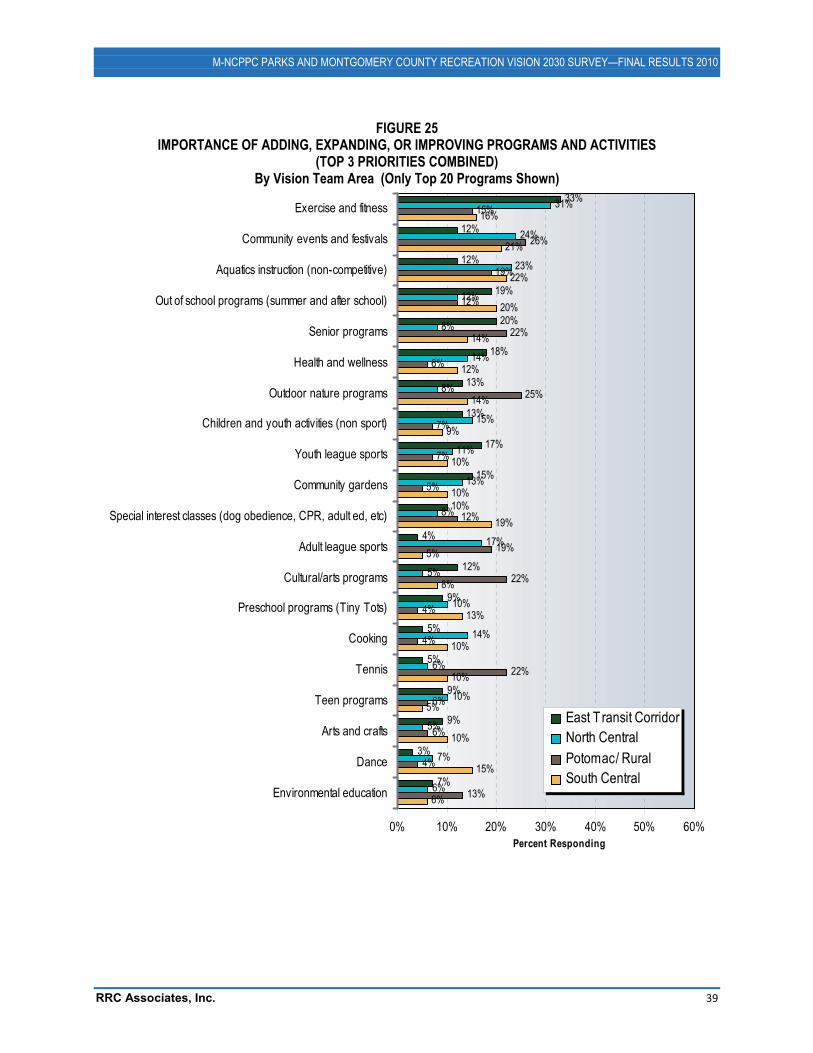
M-NCPPC PARKS AND MONTGOMERY COUNTY RECREATION VISION 2030 SURVEY—FINAL RESULTS 2010
RRC Associates, Inc. 39
FIGURE 25 IMPORTANCE OF ADDING, EXPANDING, OR IMPROVING PROGRAMS AND ACTIVITIES
(TOP 3 PRIORITIES COMBINED) By Vision Team Area (Only Top 20 Programs Shown)
33%
12%
12%
19%
20%
18%
13%
13%
17%
15%
10%
31%
24%
23%
12%
8%
14%
8%
15%
11%
13%
8%
15%
26%
19%
12%
22%
6%
25%
7%
7%
5%
12%
16%
21%
22%
20%
14%
12%
14%
9%
10%
10%
19%
5%
8%
13%
10%
10%
5%
10%
15%
6%7%
3%
9%
9%
5%
5%
9%
12%
4%
6%
7%
5%
10%
6%
14%
10%
5%
17%
13%
4%
6%
6%
22%
4%
4%
22%
19%
0% 10% 20% 30% 40% 50% 60%
Exercise and fitness
Community events and festivals
Aquatics instruction (non-competitive)
Out of school programs (summer and after school)
Senior programs
Health and wellness
Outdoor nature programs
Children and youth activities (non sport)
Youth league sports
Community gardens
Special interest classes (dog obedience, CPR, adult ed, etc)
Adult league sports
Cultural/arts programs
Preschool programs (Tiny Tots)
Cooking
Tennis
Teen programs
Arts and crafts
Dance
Environmental education
Percent Responding
East T ransit CorridorNorth CentralPotomac/ RuralSouth Central
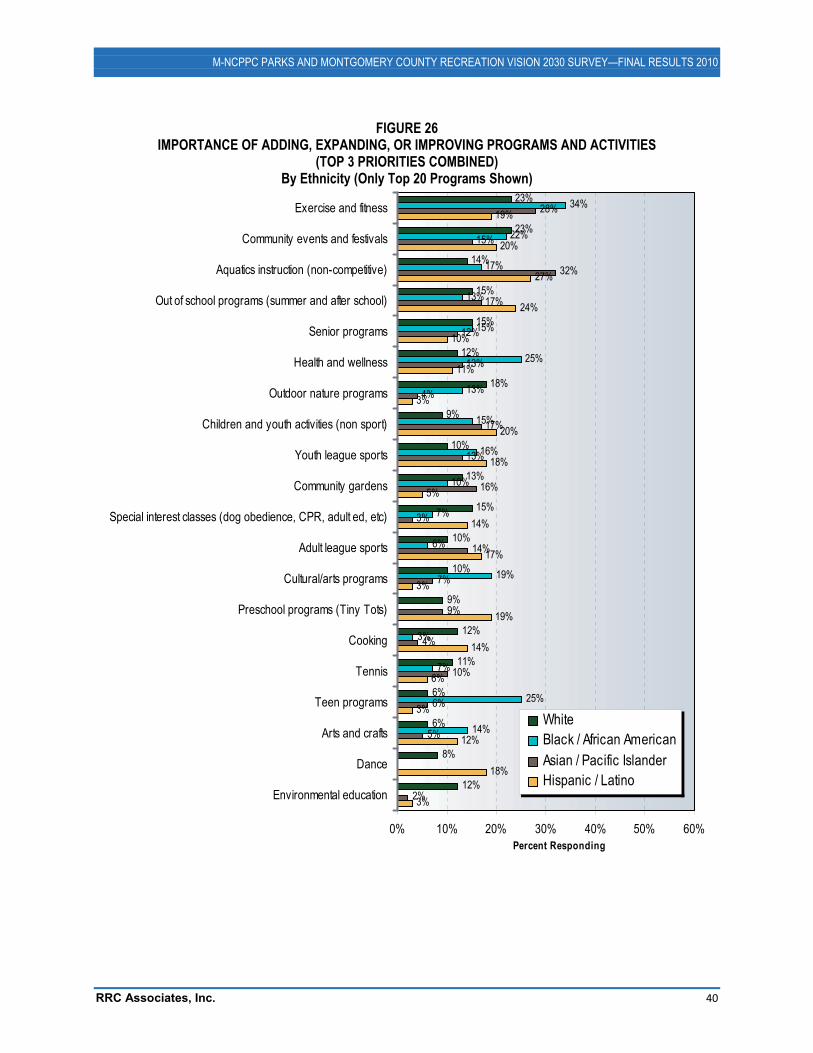
M-NCPPC PARKS AND MONTGOMERY COUNTY RECREATION VISION 2030 SURVEY—FINAL RESULTS 2010
RRC Associates, Inc. 40
FIGURE 26 IMPORTANCE OF ADDING, EXPANDING, OR IMPROVING PROGRAMS AND ACTIVITIES
(TOP 3 PRIORITIES COMBINED) By Ethnicity (Only Top 20 Programs Shown)
23%
23%
14%
15%
15%
12%
18%
9%
10%
13%
15%
34%
22%
17%
13%
15%
25%
13%
15%
16%
10%
7%
28%
15%
32%
17%
12%
13%
4%
17%
13%
16%
3%
19%
20%
27%
24%
10%
11%
3%
20%
18%
5%
14%
17%
3%
19%
14%
6%
3%
12%
18%
3%12%
8%
6%
6%
11%
12%
9%
10%
10%
14%
25%
7%
3%
19%
6%
2%
5%
6%
10%
4%
9%
7%
14%
0% 10% 20% 30% 40% 50% 60%
Exercise and fitness
Community events and festivals
Aquatics instruction (non-competitive)
Out of school programs (summer and after school)
Senior programs
Health and wellness
Outdoor nature programs
Children and youth activities (non sport)
Youth league sports
Community gardens
Special interest classes (dog obedience, CPR, adult ed, etc)
Adult league sports
Cultural/arts programs
Preschool programs (Tiny Tots)
Cooking
Tennis
Teen programs
Arts and crafts
Dance
Environmental education
Percent Responding
WhiteBlack / African AmericanAsian / Pacific IslanderHispanic / Latino
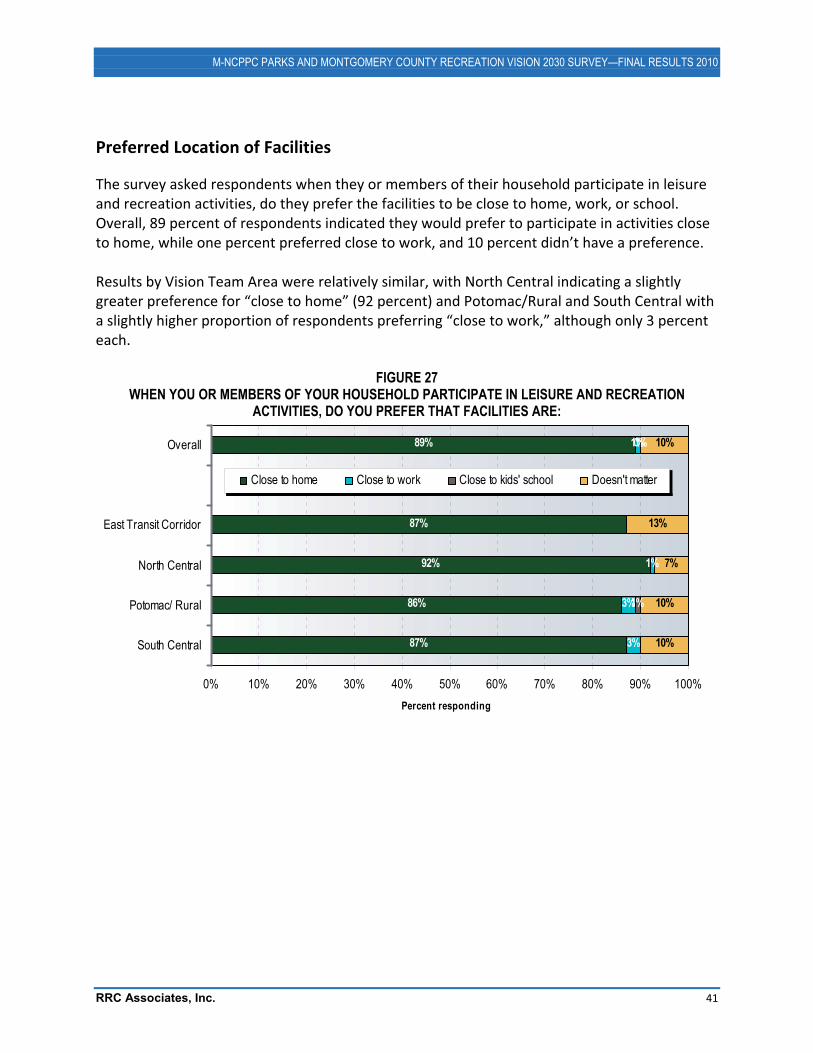
M-NCPPC PARKS AND MONTGOMERY COUNTY RECREATION VISION 2030 SURVEY—FINAL RESULTS 2010
RRC Associates, Inc. 41
Preferred Location of Facilities
The survey asked respondents when they or members of their household participate in leisure and recreation activities, do they prefer the facilities to be close to home, work, or school. Overall, 89 percent of respondents indicated they would prefer to participate in activities close to home, while one percent preferred close to work, and 10 percent didn’t have a preference. Results by Vision Team Area were relatively similar, with North Central indicating a slightly greater preference for “close to home” (92 percent) and Potomac/Rural and South Central with a slightly higher proportion of respondents preferring “close to work,” although only 3 percent each.
FIGURE 27 WHEN YOU OR MEMBERS OF YOUR HOUSEHOLD PARTICIPATE IN LEISURE AND RECREATION
ACTIVITIES, DO YOU PREFER THAT FACILITIES ARE:
89%
87%
92%
86%
87%
1%
3%
0%
1%
10%
13%
7%
10%
10%3%
1%
0% 10% 20% 30% 40% 50% 60% 70% 80% 90% 100%
Overall
East Transit Corridor
North Central
Potomac/ Rural
South Central
Percent responding
Close to home Close to work Close to kids' school Doesn't matter
M-NCPPC PARKS AND MONTGOMERY COUNTY RECREATION VISION 2030 SURVEY—FINAL RESULTS 2010
RRC Associates, Inc. 42
Preference of facilities that could be added, expanded, or improved
The survey listed pairs of facilities that could be added, expanded, or improved in Montgomery County, and asked respondents which one of each pair they would most prefer. Each of the pairs is shown in the following figure, with overall results as well as results by Vision Team Area.
Small local parks vs. large regional parks
� Overall responses were almost evenly split on whether respondents would prefer small local parks with fewer amenities (51 percent) or large regional parks with more amenities (49 percent).
� Results were relatively similar among East Transit Corridor, North Central, and Potomac/Rural respondents, although with slightly greater support for large regional parks with more amenities (52�55 percent vs. 49 percent overall).
� South Central respondents were far more likely to prefer small local parks (67 percent) as compared to large regional parks (33 percent).
Indoor nature center vs. outdoor nature education
� Overall, respondents by far preferred outdoor nature education (78 percent) as compared to indoor nature centers (22 percent).
� All four Vision Team Areas preferred outdoor nature education rather than indoor nature centers with between 71 percent and 86 percent preferring outdoor nature education.
Greater number of smaller community centers vs. fewer, but larger multi�purpose rec centers
� Overall, 63 percent of respondents preferred to build fewer, but larger multi�purpose regional rec centers as compared to 37 percent who preferred to build a greater number of smaller community centers with fewer amenities.
� Results were relatively similar among East Transit Corridor, North Central, and Potomac/Rural respondents with 64�67 percent of respondents preferring to build fewer, but larger multi�purpose regional rec centers.
� South Central respondents were a little more evenly split on the matter, with 56 percent who preferred the larger multi�purpose regional centers and 44 percent who preferred smaller community centers.
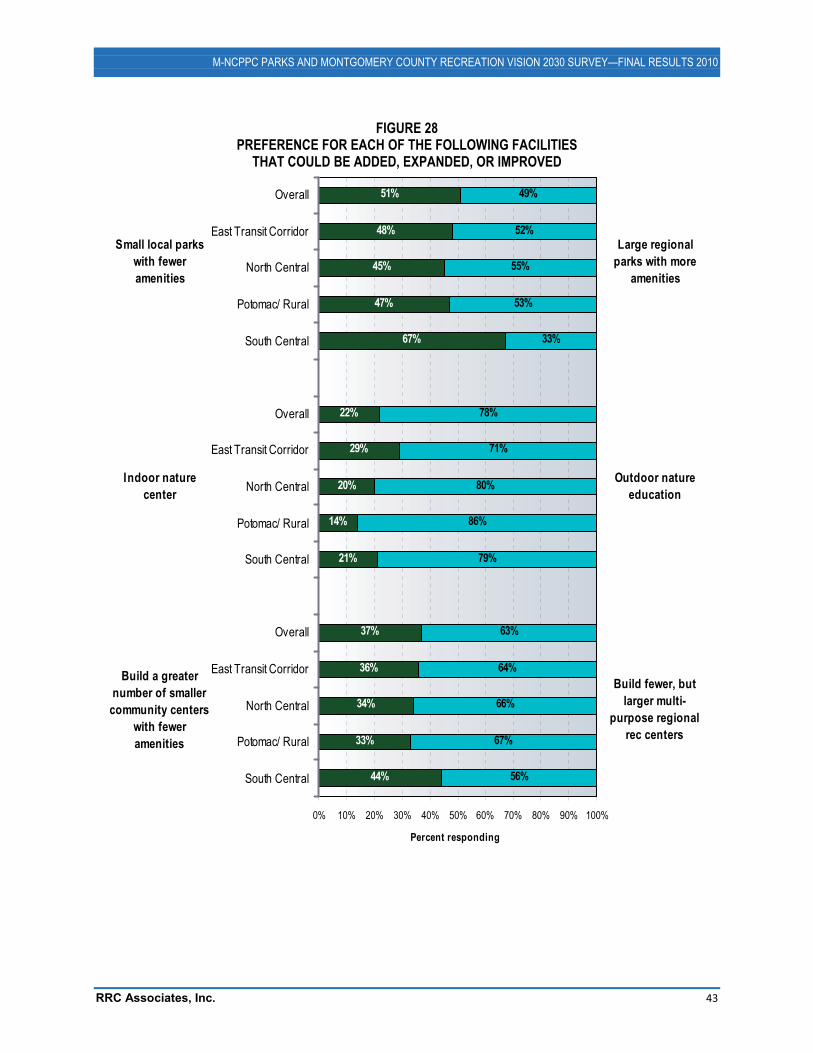
M-NCPPC PARKS AND MONTGOMERY COUNTY RECREATION VISION 2030 SURVEY—FINAL RESULTS 2010
RRC Associates, Inc. 43
FIGURE 28 PREFERENCE FOR EACH OF THE FOLLOWING FACILITIES
THAT COULD BE ADDED, EXPANDED, OR IMPROVED
51%
48%
45%
47%
67%
22%
29%
20%
14%
21%
37%
36%
34%
33%
44%
49%
52%
55%
53%
33%
78%
71%
80%
86%
79%
63%
64%
66%
67%
56%
0% 10% 20% 30% 40% 50% 60% 70% 80% 90% 100%
Overall
East Transit Corridor
North Central
Potomac/ Rural
South Central
Overall
East Transit Corridor
North Central
Potomac/ Rural
South Central
Overall
East Transit Corridor
North Central
Potomac/ Rural
South Central
Percent responding
Large regional parks with more
amenities
Outdoor nature education
Build fewer, but larger multi-
purpose regional rec centers
Small local parks with fewer amenities
Indoor nature center
Build a greater number of smaller
community centers with fewer amenities
M-NCPPC PARKS AND MONTGOMERY COUNTY RECREATION VISION 2030 SURVEY—FINAL RESULTS 2010
RRC Associates, Inc. 44
Communication
How information is currently received
When asked how they usually or currently receive information on recreation programs and facilities in Montgomery County, respondents indicated newspaper/magazine most frequently (47 percent of respondents currently receive information this way), followed by at the recreation facilities/program location (44 percent), program guides (41 percent), flyer or brochure (40 percent), Internet/website (38 percent), and word of mouth (38 percent). While mentioned far less frequently, other sources of information included through schools (14 percent), e�mail (13 percent), and TV/radio (11 percent).
Best Way to Reach You
Approximately one�third of respondents (33 percent) say e�mail is the best way to reach them with information on programs and facilities in Montgomery County, however, as explained above, only 13 percent of respondents are currently getting their information through e�mail, representing an opportunity for further outreach to the community. Other methods of communication listed by respondents as the best way to reach them include the Internet/website (19 percent), program guides (17 percent), and flyers or brochures (14 percent).
Preferred way to register for classes
The majority of respondents prefer to register for classes using the Internet (77 percent), followed by mail/fax (9 percent), in person (7 percent), and by telephone (7 percent).
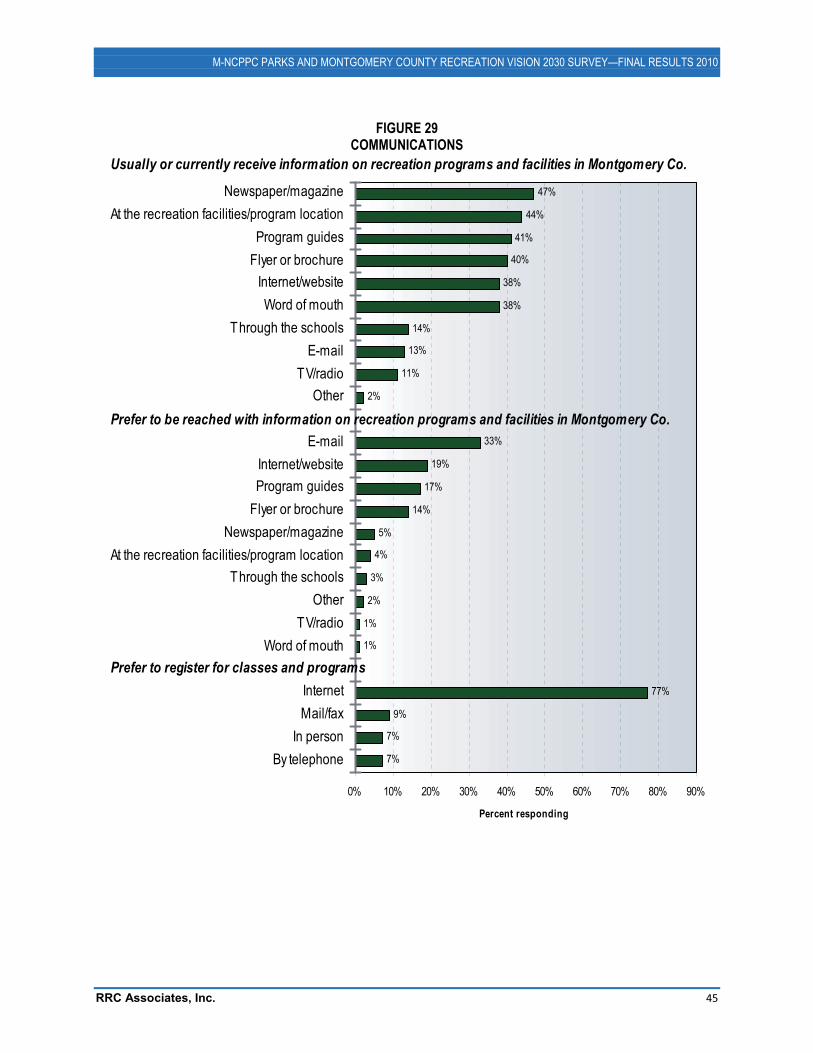
M-NCPPC PARKS AND MONTGOMERY COUNTY RECREATION VISION 2030 SURVEY—FINAL RESULTS 2010
RRC Associates, Inc. 45
FIGURE 29 COMMUNICATIONS
47%
44%
41%
40%
38%
38%
14%
13%
11%
2%
33%
19%
17%
14%
5%
4%
3%
2%
1%
1%
77%
9%
7%
7%
0% 10% 20% 30% 40% 50% 60% 70% 80% 90%
Newspaper/magazineAt the recreation facilities/program location
Program guidesFlyer or brochure
Internet/websiteWord of mouth
Through the schoolsE-mail
TV/radioOther
E-mailInternet/websiteProgram guides
Flyer or brochureNewspaper/magazine
At the recreation facilities/program locationThrough the schools
OtherTV/radio
Word of mouth
InternetMail/fax
In personBy telephone
Percent responding
Prefer to register for classes and programs
Prefer to be reached with information on recreation programs and facilities in Montgomery Co.
Usually or currently receive information on recreation programs and facilities in Montgomery Co.
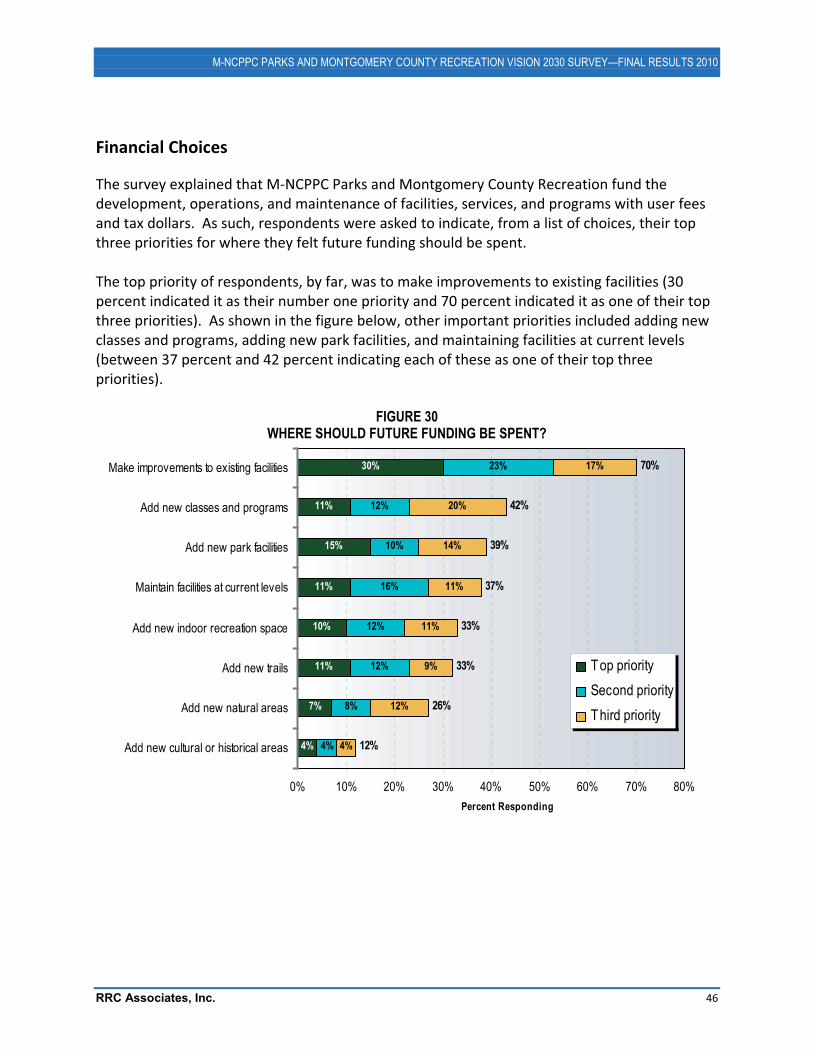
M-NCPPC PARKS AND MONTGOMERY COUNTY RECREATION VISION 2030 SURVEY—FINAL RESULTS 2010
RRC Associates, Inc. 46
Financial Choices
The survey explained that M�NCPPC Parks and Montgomery County Recreation fund the development, operations, and maintenance of facilities, services, and programs with user fees and tax dollars. As such, respondents were asked to indicate, from a list of choices, their top three priorities for where they felt future funding should be spent. The top priority of respondents, by far, was to make improvements to existing facilities (30 percent indicated it as their number one priority and 70 percent indicated it as one of their top three priorities). As shown in the figure below, other important priorities included adding new classes and programs, adding new park facilities, and maintaining facilities at current levels (between 37 percent and 42 percent indicating each of these as one of their top three priorities).
FIGURE 30 WHERE SHOULD FUTURE FUNDING BE SPENT?
30%
11%
15%
11%
10%
11%
7%
4%
23%
12%
10%
16%
12%
12%
8%
4%
17%
20%
14%
11%
11%
9%
12%
4%
70%
42%
39%
37%
33%
33%
26%
12%
0% 10% 20% 30% 40% 50% 60% 70% 80%
Make improvements to existing facilities
Add new classes and programs
Add new park facilities
Maintain facilities at current levels
Add new indoor recreation space
Add new trails
Add new natural areas
Add new cultural or historical areas
Percent Responding
Top prioritySecond priorityThird priority
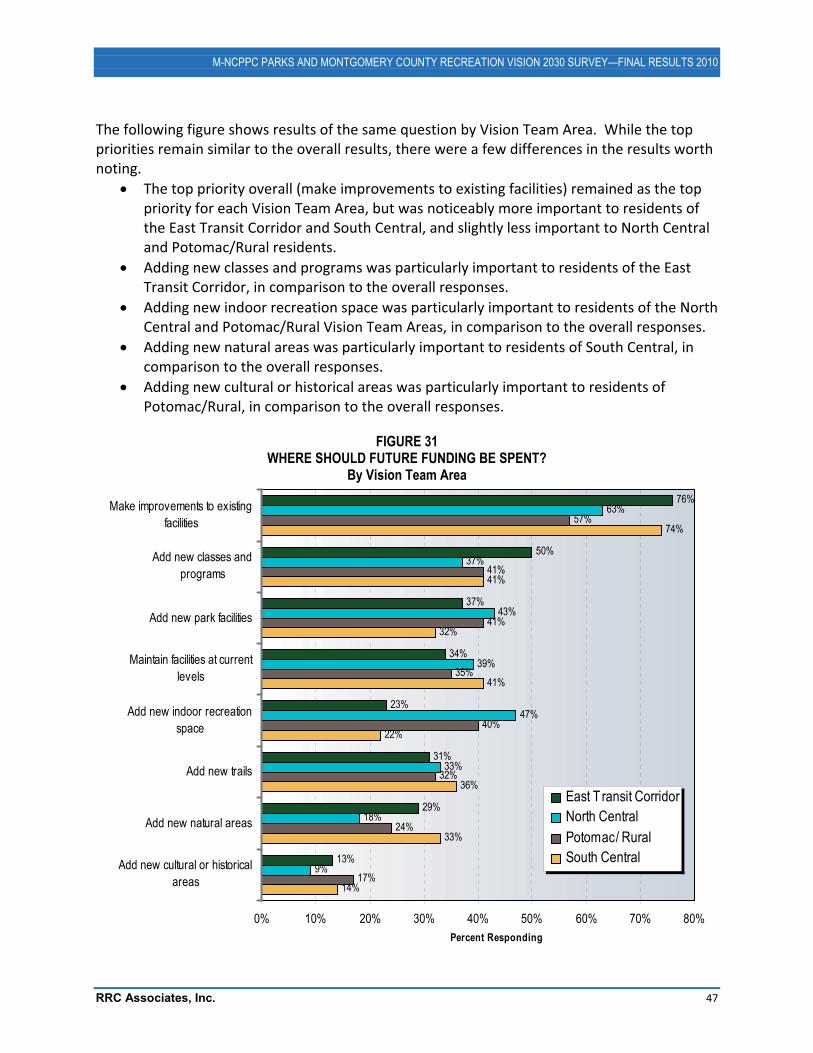
M-NCPPC PARKS AND MONTGOMERY COUNTY RECREATION VISION 2030 SURVEY—FINAL RESULTS 2010
RRC Associates, Inc. 47
The following figure shows results of the same question by Vision Team Area. While the top priorities remain similar to the overall results, there were a few differences in the results worth noting.
� The top priority overall (make improvements to existing facilities) remained as the top priority for each Vision Team Area, but was noticeably more important to residents of the East Transit Corridor and South Central, and slightly less important to North Central and Potomac/Rural residents.
� Adding new classes and programs was particularly important to residents of the East Transit Corridor, in comparison to the overall responses.
� Adding new indoor recreation space was particularly important to residents of the North Central and Potomac/Rural Vision Team Areas, in comparison to the overall responses.
� Adding new natural areas was particularly important to residents of South Central, in comparison to the overall responses.
� Adding new cultural or historical areas was particularly important to residents of Potomac/Rural, in comparison to the overall responses.
FIGURE 31
WHERE SHOULD FUTURE FUNDING BE SPENT? By Vision Team Area
76%
50%
37%
34%
23%
31%
29%
13%
63%
37%
43%
39%
47%
33%
18%
9%
57%
41%
41%
35%
40%
32%
24%
17%
74%
41%
32%
41%
22%
36%
33%
14%
0% 10% 20% 30% 40% 50% 60% 70% 80%
Make improvements to existingfacilities
Add new classes andprograms
Add new park facilities
Maintain facilities at currentlevels
Add new indoor recreationspace
Add new trails
Add new natural areas
Add new cultural or historicalareas
Percent Responding
East T ransit CorridorNorth CentralPotomac/ RuralSouth Central
M-NCPPC PARKS AND MONTGOMERY COUNTY RECREATION VISION 2030 SURVEY—FINAL RESULTS 2010
RRC Associates, Inc. 48
Comments and Suggestions
The survey also gave respondents the opportunity to list any additional facilities, programs, or activities that they would like to see added or expanded in Montgomery County in the future, as well as the opportunity to provide any additional comments or suggestions they may have regarding parks, recreation facilities, services, and programs in the County. While the comments cover a wide variety of topics and issues important to residents, some general themes emerge from the comments. These are summarized below (a selection of verbatim comments are also shown in italics below), but the full set of comments, which can be found in the appendix, should be viewed in order to understand more specific issues.
Additional facilities, programs, or activities that you would like to see added or expanded in Montgomery County in the future
� Expansion of aquatics program. There were many comments about swim classes filling so quickly that you could never get a spot in a class and therefore end up going to private clubs, the YMCA, or other city facilities. There are too few swim classes. If you don’t register at 6:30 am on the first day of
registration, you can’t get in a class. Comments were also given about expanding or adding aquatics facilities (especially additional lap lanes), that open swim times and availability of lap lanes are typically very crowded.
� Expansion of popular programs or classes. Similar to swim classes, there were comments that the most popular classes fill so quickly that it’s hard to ever get in them. Also, increase the program offerings at various centers (there were comments about wanting a specific class, but it was only offered at one center which is too far away).
� More senior programs – outings, activities, fitness classes, etc.
� More and improved restroom facilities at parks and facilities.
� More bike and walking trails, and where possible, link existing trails.
� Upgrades to the Montgomery County Recreation website for class and program registration. Also, ensure that links from other websites to the Recreation website are working (e.g. montgomerycountymd.gov).
� Additional classes later in the evening (7:00 pm and later) and on weekends for working
adults.
� More opportunities, facilities, and activities in the north portion of the County. With all the development up here, it’s surprising how few events occur in this area…
M-NCPPC PARKS AND MONTGOMERY COUNTY RECREATION VISION 2030 SURVEY—FINAL RESULTS 2010
RRC Associates, Inc. 49
� More practical skills classes such as bike repair/safety, car repair, home remodeling,
gardening, cooking, etc.
� More indoor tennis courts and/or better lighting and maintenance for outdoor tennis courts.
Additional comments or suggestions that you would like to offer regarding facilities or programs in Montgomery County
� A number of positive comments were given about the recreation opportunities available in Montgomery County, and how pleased respondents are with what is currently provided and what improvements have been made. I am always amazed at the program offering at Brookside Gardens. Even just visiting the
park and strolling through it is a joy. I am quite pleased with the recreation opportunities available in Montgomery County. The best thing about the County is the access to natural areas that we have in relative
abundance. We need to safeguard them.
� A number of comments indicated that people would like to receive the program guides in the mail at home, rather than viewing online or picking one up at a center. In addition, a desire for more advertising and information available about programs, activities, and facilities in Montgomery County was evident in many comments.
� A desire for additional volunteer opportunities was indicated. Particularly in a time of
budget cuts, a few suggestions were offered to have volunteers help with the maintenance and upkeep of parks, trails, and facilities. More volunteer programs/activities and listing of what the park service needs, would like
to help out.
� A few comments were given that people do not feel that their tax dollars should be supporting dog parks. However, there were also comments that dog parks are necessary in order to reduce the number of dogs let off leash in open space areas.
� A few comments described issues with a lack of parking at some facilities and parks.

������������������
THIS�PAGE�INTENTIONALLY�LEFT�BLANK�
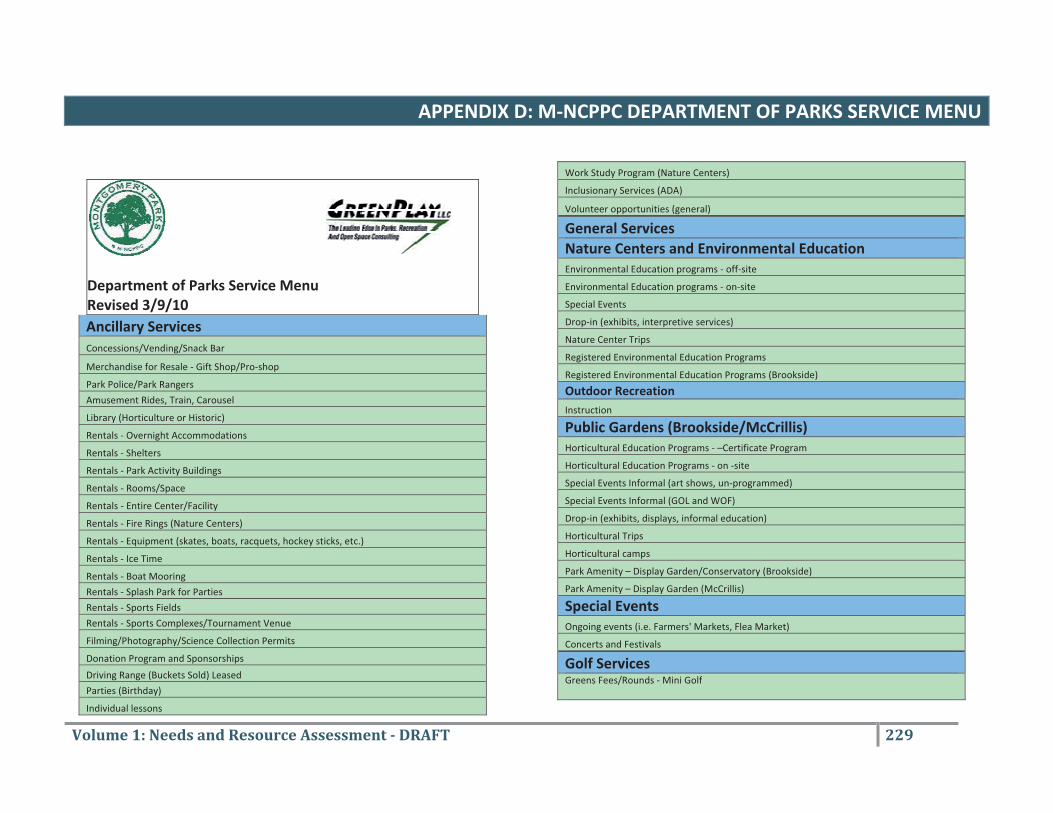
Volume�1:�Needs�and�Resource�Assessment���DRAFT� 229��
APPENDIX�D:�M�NCPPC�DEPARTMENT�OF�PARKS�SERVICE�MENU���
�
��Department�of�Parks�Service�Menu�Revised�3/9/10�Ancillary�Services�Concessions/Vending/Snack�Bar�
Merchandise�for�Resale���Gift�Shop/Pro�shop�
Park�Police/Park�Rangers�
Amusement�Rides,�Train,�Carousel�
Library�(Horticulture�or�Historic)�
Rentals���Overnight�Accommodations�
Rentals���Shelters�
Rentals���Park�Activity�Buildings�
Rentals���Rooms/Space�
Rentals���Entire�Center/Facility�
Rentals���Fire�Rings�(Nature�Centers)�
Rentals���Equipment�(skates,�boats,�racquets,�hockey�sticks,�etc.)�
Rentals���Ice�Time�
Rentals���Boat�Mooring�
Rentals���Splash�Park�for�Parties�
Rentals���Sports�Fields��
Rentals���Sports�Complexes/Tournament�Venue��
Filming/Photography/Science�Collection�Permits�
Donation�Program�and�Sponsorships�
Driving�Range�(Buckets�Sold)�Leased�
Parties�(Birthday)�
Individual�lessons�
Work�Study�Program�(Nature�Centers)�
Inclusionary�Services�(ADA)�
Volunteer�opportunities�(general)�
General�Services�Nature�Centers�and�Environmental�Education�Environmental�Education�programs���off�site�
Environmental�Education�programs���on�site�
Special�Events�
Drop�in�(exhibits,�interpretive�services)�
Nature�Center�Trips�
Registered�Environmental�Education�Programs�
Registered�Environmental�Education�Programs�(Brookside)�
Outdoor�Recreation�Instruction�
Public�Gardens�(Brookside/McCrillis)�Horticultural�Education�Programs���–Certificate�Program�
Horticultural�Education�Programs���on��site�
Special�Events�Informal�(art�shows,�un�programmed)�
Special�Events�Informal�(GOL�and�WOF)�
Drop�in�(exhibits,�displays,�informal�education)�
Horticultural�Trips�
Horticultural�camps�
Park�Amenity�–�Display�Garden/Conservatory�(Brookside)�
Park�Amenity�–�Display�Garden�(McCrillis)�
Special�Events�Ongoing�events�(i.e.�Farmers'�Markets,�Flea�Market)�
Concerts�and�Festivals�
Golf�Services�Greens�Fees/Rounds�� Mini�Golf�
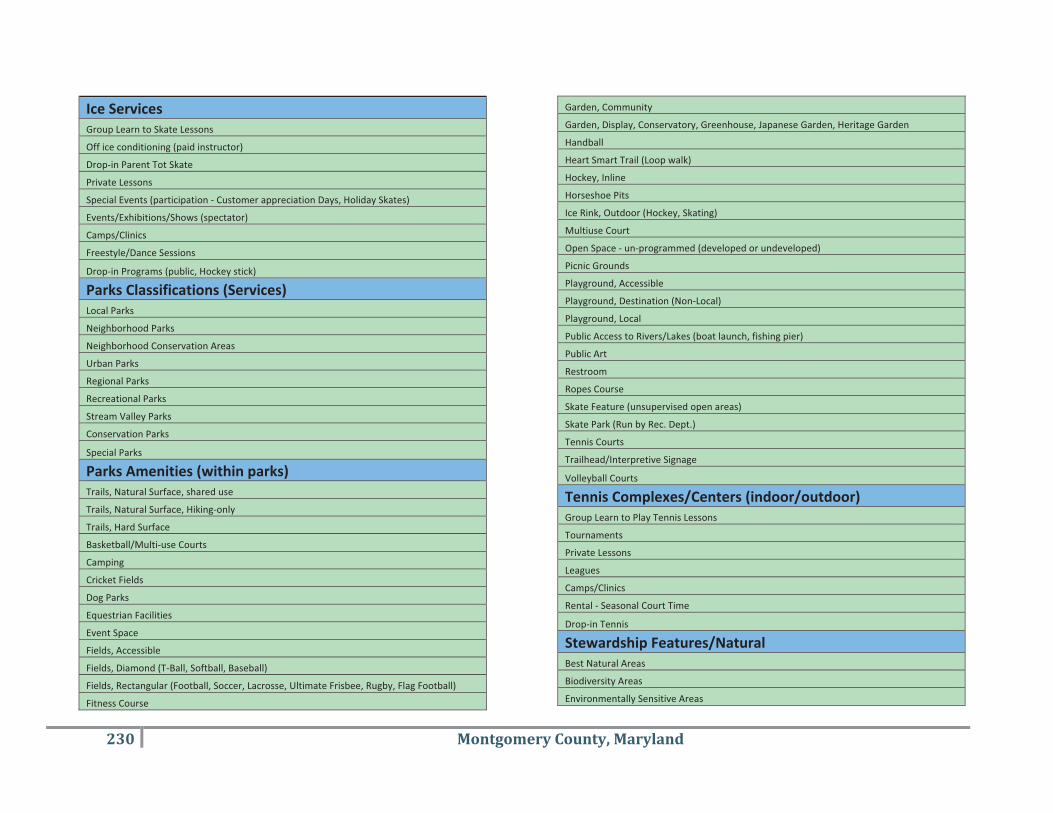
230� � � � Montgomery�County,�Maryland�
Ice�Services�Group�Learn�to�Skate�Lessons�
Off�ice�conditioning�(paid�instructor)�
Drop�in�Parent�Tot�Skate�
Private�Lessons�
Special�Events�(participation���Customer�appreciation�Days,�Holiday�Skates)�
Events/Exhibitions/Shows�(spectator)�
Camps/Clinics�
Freestyle/Dance�Sessions�
Drop�in�Programs�(public,�Hockey�stick)�
Parks�Classifications�(Services)��Local�Parks�
Neighborhood�Parks�
Neighborhood�Conservation�Areas�
Urban�Parks�
Regional�Parks�
Recreational�Parks�
Stream�Valley�Parks�
Conservation�Parks�
Special�Parks�
Parks�Amenities�(within�parks)��Trails,�Natural�Surface,�shared�use�
Trails,�Natural�Surface,�Hiking�only�
Trails,�Hard�Surface�
Basketball/Multi�use�Courts�
Camping�
Cricket�Fields�
Dog�Parks�
Equestrian�Facilities�
Event�Space�
Fields,�Accessible�
Fields,�Diamond�(T�Ball,�Softball,�Baseball)�
Fields,�Rectangular�(Football,�Soccer,�Lacrosse,�Ultimate�Frisbee,�Rugby,�Flag�Football)�
Fitness�Course�
Garden,�Community�
Garden,�Display,�Conservatory,�Greenhouse,�Japanese�Garden,�Heritage�Garden�
Handball�
Heart�Smart�Trail�(Loop�walk)�
Hockey,�Inline�
Horseshoe�Pits�
Ice�Rink,�Outdoor�(Hockey,�Skating)�
Multiuse�Court�
Open�Space���un�programmed�(developed�or�undeveloped)�
Picnic�Grounds�
Playground,�Accessible�
Playground,�Destination�(Non�Local)�
Playground,�Local�
Public�Access�to�Rivers/Lakes�(boat�launch,�fishing�pier)�
Public�Art�
Restroom�
Ropes�Course�
Skate�Feature�(unsupervised�open�areas)�
Skate�Park�(Run�by�Rec.�Dept.)�
Tennis�Courts�
Trailhead/Interpretive�Signage�
Volleyball�Courts�
Tennis�Complexes/Centers�(indoor/outdoor)�Group�Learn�to�Play�Tennis�Lessons�
Tournaments�
Private�Lessons�
Leagues�
Camps/Clinics�
Rental���Seasonal�Court�Time�
Drop�in�Tennis�
Stewardship�Features/Natural�Best�Natural�Areas�
Biodiversity�Areas�
Environmentally�Sensitive�Areas�
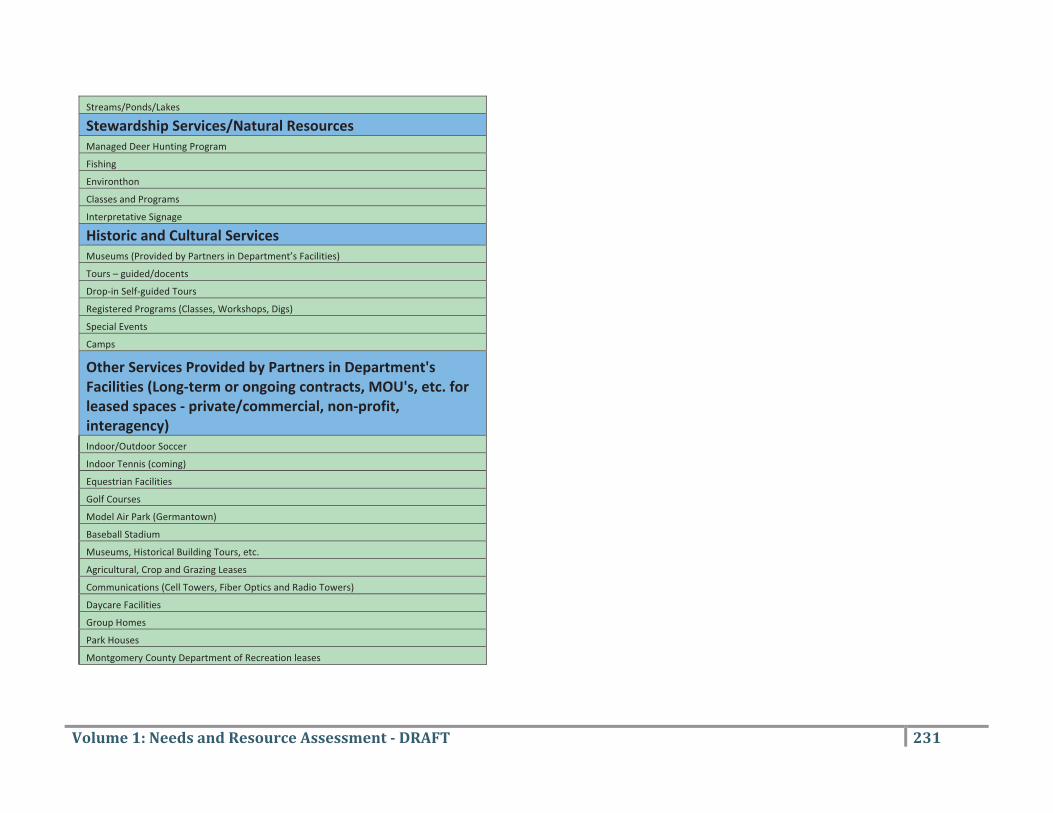
Volume�1:�Needs�and�Resource�Assessment���DRAFT� 231��
Streams/Ponds/Lakes�
Stewardship�Services/Natural�Resources�Managed�Deer�Hunting�Program�
Fishing�
Environthon�
Classes�and�Programs�
Interpretative�Signage�
Historic�and�Cultural�Services�Museums�(Provided�by�Partners�in�Department’s�Facilities)�
Tours�–�guided/docents�
Drop�in�Self�guided�Tours�
Registered�Programs�(Classes,�Workshops,�Digs)�
Special�Events��
Camps�
Other�Services�Provided�by�Partners�in�Department's�Facilities�(Long�term�or�ongoing�contracts,�MOU's,�etc.�for�leased�spaces���private/commercial,�non�profit,�interagency)�Indoor/Outdoor�Soccer�
Indoor�Tennis�(coming)�
Equestrian�Facilities�
Golf�Courses�
Model�Air�Park�(Germantown)�
Baseball�Stadium�
Museums,�Historical�Building�Tours,�etc.��
Agricultural,�Crop�and�Grazing�Leases�
Communications�(Cell�Towers,�Fiber�Optics�and�Radio�Towers)�
Daycare�Facilities�
Group�Homes�
Park�Houses�
Montgomery�County�Department�of�Recreation�leases�

�
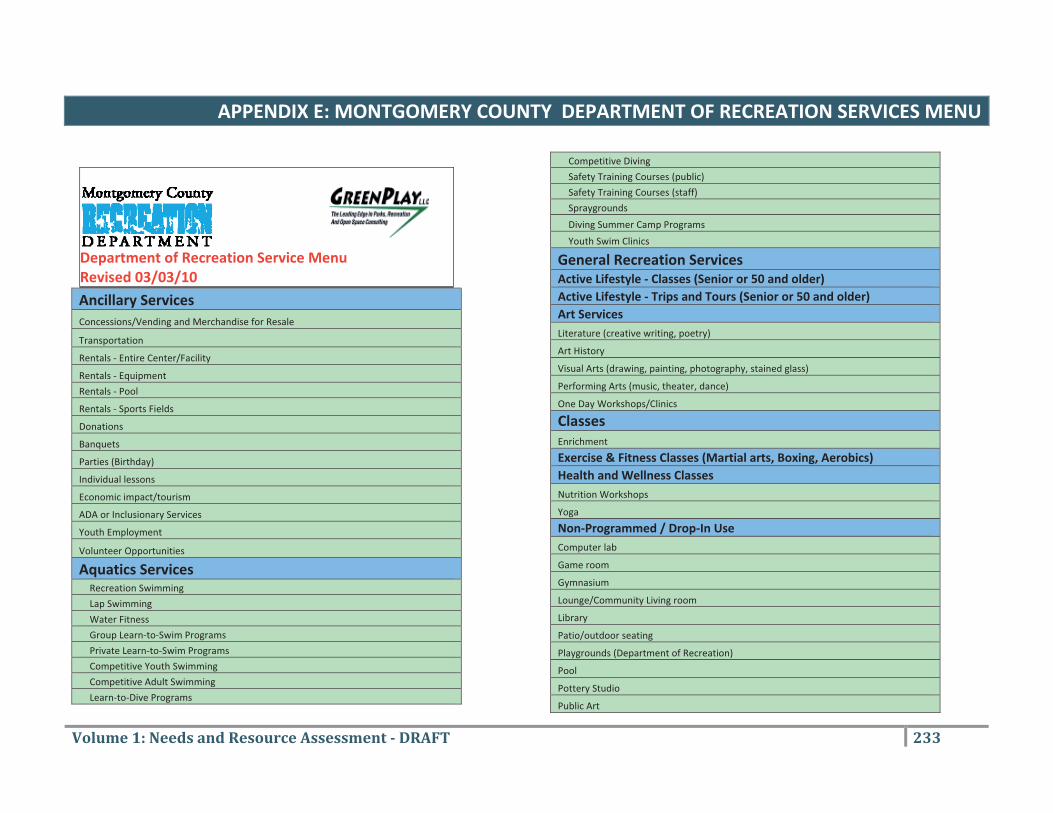
Volume�1:�Needs�and�Resource�Assessment���DRAFT� 233��
APPENDIX�E:�MONTGOMERY�COUNTY��DEPARTMENT�OF�RECREATION�SERVICES�MENU�
�
�Department�of�Recreation�Service�Menu�Revised�03/03/10�
Ancillary�Services�Concessions/Vending�and�Merchandise�for�Resale�
Transportation�
Rentals���Entire�Center/Facility�
Rentals���Equipment�
Rentals���Pool�
Rentals���Sports�Fields�
Donations�
Banquets�
Parties�(Birthday)��
Individual�lessons�
Economic�impact/tourism�
ADA�or�Inclusionary�Services��
Youth�Employment�
Volunteer�Opportunities�
Aquatics�Services�Recreation�Swimming�
Lap�Swimming�
Water�Fitness�
Group�Learn�to�Swim�Programs�
Private�Learn�to�Swim�Programs�
Competitive�Youth�Swimming�
Competitive�Adult�Swimming�
Learn�to�Dive�Programs�
Competitive�Diving�
Safety�Training�Courses�(public)�
Safety�Training�Courses�(staff)�
Spraygrounds�
Diving�Summer�Camp�Programs�
Youth�Swim�Clinics�
General�Recreation�Services�Active�Lifestyle���Classes�(Senior�or�50�and�older)�Active�Lifestyle���Trips�and�Tours�(Senior�or�50�and�older)�Art�Services�Literature�(creative�writing,�poetry)�
Art�History�
Visual�Arts�(drawing,�painting,�photography,�stained�glass)�
Performing�Arts�(music,�theater,�dance)�
One�Day�Workshops/Clinics�
Classes��Enrichment�
Exercise�&�Fitness�Classes�(Martial�arts,�Boxing,�Aerobics)�Health�and�Wellness�Classes�Nutrition�Workshops�
Yoga�
Non�Programmed�/�Drop�In�Use�Computer�lab�
Game�room�
Gymnasium�
Lounge/Community�Living�room�
Library�
Patio/outdoor�seating�
Playgrounds�(Department�of�Recreation)�
Pool�
Pottery�Studio�
Public�Art�
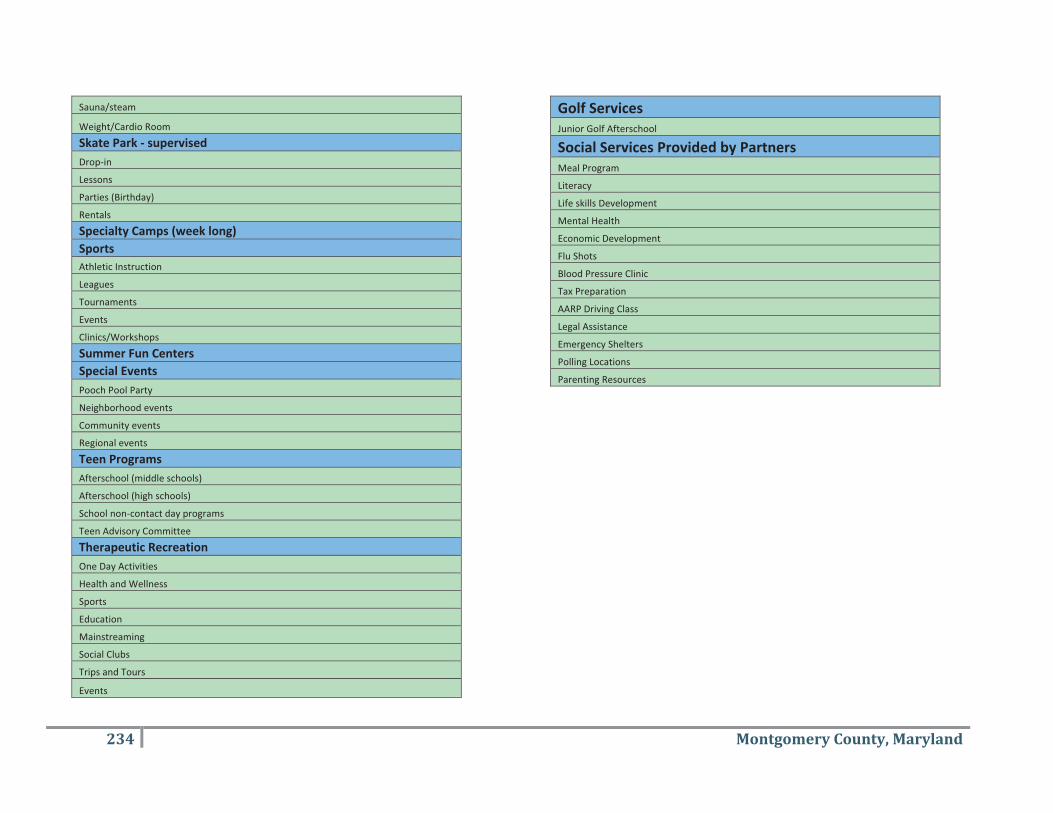
234� Montgomery�County,�Maryland�
Sauna/steam��
Weight/Cardio�Room�
Skate�Park���supervised�Drop�in��
Lessons�
Parties�(Birthday)��
Rentals�
Specialty�Camps�(week�long)�Sports�Athletic�Instruction�
Leagues�
Tournaments�
Events�
Clinics/Workshops�
Summer�Fun�Centers�Special�Events�Pooch�Pool�Party�
Neighborhood�events�
Community�events�
Regional�events�
Teen�Programs�Afterschool�(middle�schools)�
Afterschool�(high�schools)�
School�non�contact�day�programs�
Teen�Advisory�Committee�
Therapeutic�Recreation�One�Day�Activities�
Health�and�Wellness�
Sports�
Education�
Mainstreaming�
Social�Clubs�
Trips�and�Tours�
Events�
Golf�Services�Junior�Golf�Afterschool�
Social�Services�Provided�by�Partners�Meal�Program�
Literacy�
Life�skills�Development�
Mental�Health�
Economic�Development�
Flu�Shots�
Blood�Pressure�Clinic�
Tax�Preparation�
AARP�Driving�Class�
Legal�Assistance�
Emergency�Shelters�
Polling�Locations�
Parenting�Resources�

Volume�1:�Needs�and�Resource�Assessment���DRAFT� 235��
APPENDIX�F:�GRASP®�HISTORY�&�LEVEL�OF�SERVICE�METHODOLOGY

������������������
THIS�PAGE�INTENTIONALLY�LEFT�BLANK�
Volume�1:�Needs�and�Resource�Assessment���DRAFT� 237��
GRASP®�History�and�Level�of�Service�Methodology������A.�Level�of�Service�Analysis���Analysis�of�the�existing�parks,�open�space,�trails,�and�recreation�systems�are�often�conducted�in�order�to�assess�how�the�systems�are�serving�the�public.�A�Level�of�Service�(LOS)�has�been�typically�defined�in�parks�and�recreation�master�plans�as�the�capacity�of�the�various�components�and�facilities�that�make�up�the�system�to�meet�the�needs�of�the�public.�This�is�often�expressed�in�terms�of�the�size�or�quantity�of�a�given�facility�per�unit�of�population.���Brief�History�of�Level�of�Service�Analysis�In�order�to�help�standardize�parks�and�recreation�planning,�universities,�agencies�and�parks�and�recreation�professionals�have�long�been�looking�for�ways�to�benchmark�and�provide�“national�standards”�for�measurements�including:�how�much�acreage,�how�many�ballfields,�pools,�playgrounds,�etc.,�a�community�should�have.�As�examples,�in�1906�the�fledgling�“Playground�Association�of�America”�called�for�playground�space�equal�to�30�square�feet�per�child.�In�the�1970’s�and�early�1980’s,�the�first�detailed�published�works�on�these�topics�began�emerging�(Gold,�1973,�Lancaster,�1983).�In�time�“rule�of�thumb”�capacity�ratios�emerged�with�10�acres�of�parklands�per�thousand�population�becoming�the�most�widely�accepted�standard�application.�Other�normative�guides�also�have�been�cited�as�“traditional�standards,”�but�have�been�less�widely�accepted.�In�1983,�Roger�Lancaster�compiled�a�book�called,�“Recreation,�Park�and�Open�Space�Standards�and�Guidelines,”�that�was�published�by�the�National�Park�and�Recreation�Association�(NRPA).�In�this�publication,�Mr.�Lancaster�centered�on�a�recommendation�“that�a�park�system,�at�minimum,�be�composed�of�a�core�system�of�parklands,�with�a�total�of�6.25�to�10.5�acres�of�developed�open�space�per�1,000�population”�(Lancaster,�1983,�p.�56).�The�guidelines�went�further�to�make�recommendations�regarding�an�appropriate�mix�of�park�types,�sizes,�service�areas,�and�acreages,�and�standards�regarding�the�number�of�available�recreational�facilities�per�thousand�population.�While�the�book�was�published�by�NRPA�and�the�table�of�standards�became�widely�known�as�“the�NRPA�standards,”�for�Level�of�Service�Analysis,�it�is�important�to�note�that�these�standards�were�never�formally�adopted�for�use�by�NRPA.���Since�that�time,�various�publications�have�updated�and�expanded�upon�possible�“standards,”�several�of�which�have�also�been�published�by�NRPA.�Many�of�these�publications�did�benchmarking�and�other�normative�research�to�determine�what�an�“average�LOS”�should�be.�It�is�important�to�note�that�NRPA�and�the�prestigious�American�Academy�for�Park�and�Recreation�Administration,�as�organizations,�have�focused�in�recent�years�on�accreditation�standards�for�agencies,�which�are�less�directed�towards�outputs,�outcomes�and�performance,�and�more�on�planning,�organizational�structure,�and�management�processes.�The�following�table�gives�some�of�the�more�commonly�and�historically�used�“capacity�standards.”���
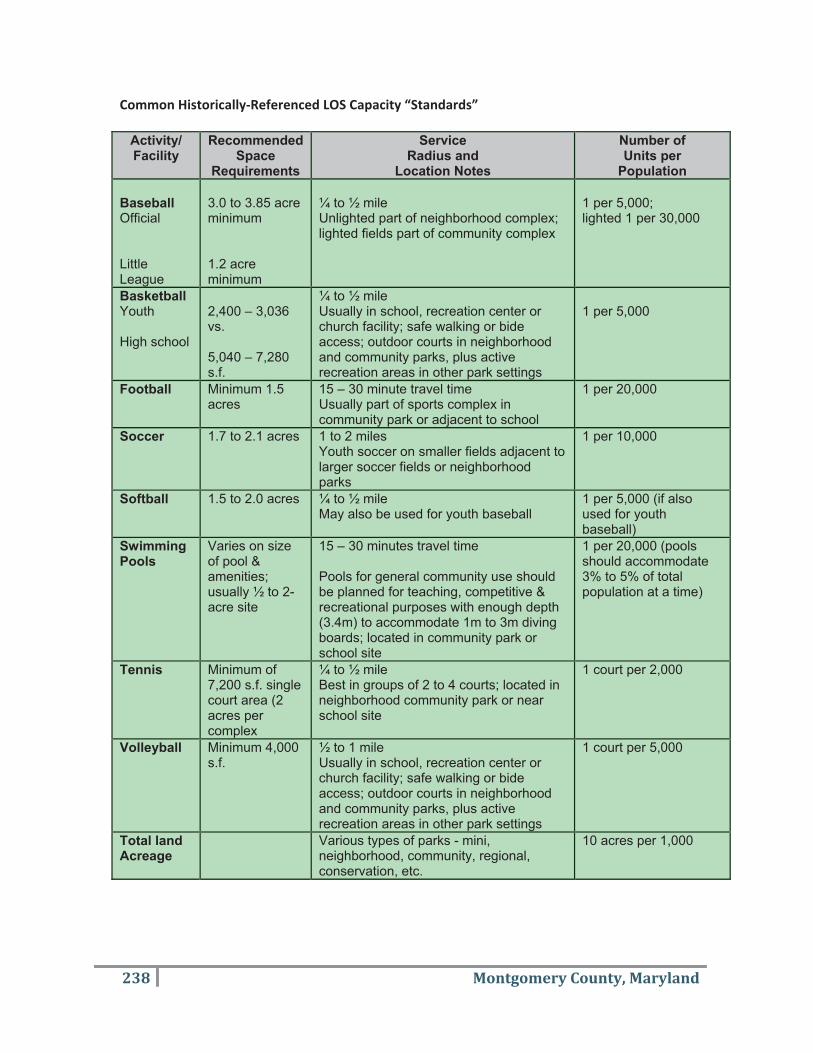
238� Montgomery�County,�Maryland�
Common�Historically�Referenced�LOS�Capacity�“Standards”��
Activity/ Facility
Recommended Space
Requirements
Service Radius and
Location Notes
Number of Units per
Population
BaseballOfficial
LittleLeague
3.0 to 3.85 acre minimum
1.2 acre minimum
¼ to ½ mile Unlighted part of neighborhood complex; lighted fields part of community complex
1 per 5,000; lighted 1 per 30,000
Basketball Youth
High school
2,400 – 3,036 vs.
5,040 – 7,280 s.f.
¼ to ½ mile Usually in school, recreation center or church facility; safe walking or bide access; outdoor courts in neighborhood and community parks, plus active recreation areas in other park settings
1 per 5,000
Football Minimum 1.5 acres
15 – 30 minute travel time Usually part of sports complex in community park or adjacent to school
1 per 20,000
Soccer 1.7 to 2.1 acres 1 to 2 miles Youth soccer on smaller fields adjacent to larger soccer fields or neighborhood parks
1 per 10,000
Softball 1.5 to 2.0 acres ¼ to ½ mile May also be used for youth baseball
1 per 5,000 (if also used for youth baseball)
Swimming Pools
Varies on size of pool & amenities; usually ½ to 2-acre site
15 – 30 minutes travel time
Pools for general community use should be planned for teaching, competitive & recreational purposes with enough depth (3.4m) to accommodate 1m to 3m diving boards; located in community park or school site
1 per 20,000 (pools should accommodate 3% to 5% of total population at a time)
Tennis Minimum of 7,200 s.f. single court area (2 acres per complex
¼ to ½ mile Best in groups of 2 to 4 courts; located in neighborhood community park or near school site
1 court per 2,000
Volleyball Minimum 4,000 s.f.
½ to 1 mile Usually in school, recreation center or church facility; safe walking or bide access; outdoor courts in neighborhood and community parks, plus active recreation areas in other park settings
1 court per 5,000
Total land Acreage
Various types of parks - mini, neighborhood, community, regional, conservation, etc.
10 acres per 1,000
�
Volume�1:�Needs�and�Resource�Assessment���DRAFT� 239��
Sources:��David�N.�Ammons,�Municipal�Benchmarks���Assessing�Local�Performance�and�Establishing�Community�Standards,�2nd�Ed.,�2002��Roger�A.�Lancaster�(Ed.),�Recreation,�Park�and�Open�Space�Standards�and�Guidelines�(Alexandria,�VA:�National�Recreation�and�Park�Association,�1983),�pp.�56�57.��James�D.�Mertes�and�James�R.�Hall,�Park,�Recreation,�Open�Space�and�Greenways�Guidelines,�(Alexandria,�VA:�National�Recreation�and�Park�Association,�1996),�pp.�94�103.��In�conducting�planning�work,�it�is�important�to�realize�that�the�above�standards�can�be�valuable�when�referenced�as�“norms”�for�capacity,�but�not�necessarily�as�the�target�standards�for�which�a�community�should�strive.�Each�community�is�different�and�there�are�many�varying�factors,�which�are�not�addressed�by�the�standards�above.�For�example:��
� Does�“developed�acreage”�include�golf�courses?�What�about�indoor�and�passive�facilities?��� What�are�the�standards�for�skateparks?�Ice�Arenas?�Public�Art?�Etc.?��� What�if�it�is�an�urban�land�locked�community?�What�if�it�is�a�small�town�surrounded�by�open�
Federal�lands?�� What�about�quality�and�condition?�What�if�there�are�a�lot�of�ballfields,�but�they�haven’t�
been�maintained�in�the�last�ten�years?��� And�many�other�questions….�
�B.�GRASP®�Composite�Values�Level�of�Service�Analysis���In�order�to�address�these�and�other�relevant�questions,�a�new�methodology�for�determining�Level�of�Service�was�developed.�It�is�called�a�Composite�Values�Methodology�and�has�been�applied�in�many�communities�across�the�nation�since�2001,�to�provide�a�better�way�of�measuring�and�portraying�the�service�provided�by�parks�and�recreation�systems.�Primary�research�and�development�for�this�methodology�was�conducted�jointly�by�GreenPlay,�LLC,�a�management�consulting�firm�for�parks,�open�space�and�related�agencies,�Design�Concepts,�a�landscape�architecture�and�planning�firm,�and�Geowest,�a�spatial�information�management�firm.�While�Composite�Values�Methodology�can�be�utilized�by�anyone,�the�proprietary�trademarked�name�for�the�composite�values�methodology�process�that�these�three�firms�use�is�called�GRASP®�(Geo�Referenced�Amenities�Standards�Process).�The�GRASP®�methodology�for�analysis�is�proprietary,�but�the�software�used�is�common�and�typical�for�most�agencies,�and�the�data�and�information�collected�is�owned�and�can�be�updated�and�managed�by�the�agency�for�ongoing�usage.���For�this�methodology,�capacity�is�only�part�of�the�LOS�equation.�Other�factors�are�brought�into�consideration,�including�quality,�condition,�location,�comfort,�convenience,�and�ambience.�To�create�a�GRASP®�inventory�and�analysis,�parks,�trails,�recreation,�open�space�and�any�other�relevant�amenities�and�properties�being�studied�are�looked�at�as�part�of�an�overall�infrastructure�for�a�community�made�up�of�various�components,�such�as�playgrounds,�multi�purpose�fields,�passive�areas,�etc.�The�methodology�inventories�characteristics�that�are�part�of�the�context�and�setting�of�a�component.�They�are�not�characteristics�of�the�component�itself,�but�when�they�exist�in�proximity�to�a�component�they�enhance�the�value�of�the�component.��
240� Montgomery�County,�Maryland�
The�characteristics�of�components�include:��
Quality�–�� The�service�provided�by�anything,�whether�it�is�a�playground,�soccer�field,�or�swimming�pool�is�determined�in�part�by�its�quality.�A�playground�with�a�variety�of�features,�such�as�climbers,�slides,�and�swings�provides�a�higher�degree�of�service�than�one�with�nothing�but�an�old�teeter�totter�and�some�“monkey�bars.”��
�Condition�–�The�condition�of�a�component�within�the�park�system�also�affects�the�amount�of�
service�it�provides.�A�playground�in�disrepair�with�unsafe�equipment�does�not�offer�the�same�service�as�one�in�good�condition.�Similarly,�a�soccer�field�with�a�smooth�surface�of�well�maintained�grass�certainly�offers�a�higher�degree�of�service�than�one�that�is�full�of�weeds,�ruts,�and�other�hazards.�
�Location�–�� To�receive�service�from�something,�you�need�to�be�able�to�get�to�it.�Therefore,�
service�is�dependent�upon�proximity�and�access.�All�components�are�geographically�located�using�GPS�coordinates�and�GIS�software.�
�Comfort�–�� The�service�provided�by�a�component�is�increased�by�having�amenities.�For�
example,�outdoor�components�are�often�enhanced�by�attributes�such�as�shade,�seating,�and�a�restroom�nearby.�Comfort�enhances�the�experience�of�using�a�component.�
�Convenience�–�Convenience�encourages�people�to�use�a�component,�which�increased�the�
amount�of�service�that�it�offers.�Easy�access�and�the�availability�of�trash�receptacles,�bike�rack,�or�nearby�parking�are�examples�of�conveniences�that�enhance�the�service�provided�by�a�component.�
�Ambience�–�Simple�observation�will�prove�that�people�are�drawn�to�places�that�“feel”�good.�
This�includes�a�sense�of�safety�and�security,�as�well�as�pleasant�surroundings,�attractive�views,�and�a�sense�of�place.�For�example,�a�well�designed�park�is�preferable�to�a�poorly�designed�one,�and�this�enhances�the�degree�of�service�provided�by�the�components�within�it.�
�Capacity�is�still�part�of�the�LOS�analysis�and�the�quantity�of�each�component�is�recorded�as�well.�By�combining�and�analyzing�the�composite�values�of�each�component,�it�is�possible�to�measure�the�service�provided�by�a�parks�and�recreation�system�from�a�variety�of�perspectives�and�for�any�given�location.�Typically,�this�begins�with�a�decision�on�“relevant�components”�for�the�analysis,�collection�of�an�accurate�inventory�of�those�components,�analysis�and�then�the�results�are�presented�in�a�series�of�maps�and�tables�that�make�up�the�GRASP®�analysis�of�the�study�area.���Data�for�Analysis�and�Making�Justifiable�Decisions�All�of�the�data�generated�from�the�GRASP®�evaluation�is�compiled�into�an�electronic�database�that�is�then�available�and�owned�by�the�agency�for�use�in�a�variety�of�ways.�The�database�can�help�keep�track�of�facilities�and�programs,�and�can�be�used�to�schedule�services,�maintenance,�and�the�replacement�of�components.�In�addition�to�determining�LOS,�it�can�be�used�to�project�long�term�capital�and�life�cycle�costing�needs.�All�portions�of�the�information�are�in�standard�available�software�and�can�be�produced�in�a�variety�of�ways�for�future�planning�or�sharing�with�the�public.���
Volume�1:�Needs�and�Resource�Assessment���DRAFT� 241��
It�is�important�to�note�that�the�GRASP®�methodology�provides�not�only�accurate�LOS�and�facility�inventory�information,�but�also�works�with�and�integrates�with�other�tools�to�help�agencies�make�decisions.�It�is�relatively�easy�to�maintain,�update,�and�creates�easily�understood�graphic�depictions�(analysis�maps�and/or�“Perspectives”)�of�issues.�Combined�with�a�needs�assessment,�public�and�staff�involvement,�program�and�financial�assessment,�GRASP®�allows�an�agency�to�defensibly�make�recommendations�on�priorities�for�ongoing�resource�allocation�along�with�capital�and�operational�funding.���C.�Inventory�Data�Collection�Process��A�detailed�inventory�of�relevant�components�for�the�project�was�conducted.�The�inventory�located�and�catalogued�all�of�the�relevant�components�for�the�project,�and�evaluated�each�one�as�to�how�well�it�was�serving�its�intended�function�within�the�system.�The�planning�team�first�prepared�a�preliminary�list�of�existing�components�using�aerial�photography�and�the�community’s�Geographic�Information�System�(GIS)�information.�Components�were�given�GIS�points�and�names�according�to�the�GRASP®�list�of�standard�components.��Next,�the�inventory�was�reviewed�by�the�consulting�team�and�by�department�staff�to�confirm�the�preliminary�data�and�collect�additional�information.�Additionally,�indoor�facilities�were�scored�and�for�the�purposes�of�this�study,�each�relevant�space�was�considered�a�component�and�was�scored�based�on�its�intended�function.�During�the�inventory�evaluations,�any�missing�relevant�components�were�added�to�the�data�set,�and�each�component�was�evaluated�as�to�how�well�it�meets�expectations�for�its�intended�function.�The�following�inventory�information�was�collected:��
�� Component�type�and�location�� Evaluation�of�component�condition��� Evaluation�of�comfort�and�convenience�features�� Evaluation�of�park�design�and�ambience�
�After�the�inventory�was�completed,�the�project�team�completes�a�final�review�and�approval�for�accuracy.��D.�Standardized�Process�for�Scoring�Components��Component�Scoring�The�approved�inventory�is�the�basis�for�the�creation�of�values�used�in�the�GRASP®�analysis.�Each�component�received�a�functional�score�that�is�related�to�the�quality,�condition,�and�ability�of�the�space�to�meet�operational�and�programming�needs.��The�range�of�scores�for�each�component�is�as�follows:��� Below�Expectations�(BE)�–�The�component�does�not�meet�the�expectations�of�its�intended�
primary�function.�Factors�leading�to�this�may�include�size,�age,�accessibility,�or�others.�Each�such�component�is�given�a�score�of�1�in�the�inventory.�
� Meeting�Expectations�(ME)�–�The�component�meets�expectations�for�its�intended�function.�Such�components�are�given�scores�of�2.�
242� Montgomery�County,�Maryland�
� Exceeding�Expectations�(EE)�–�The�component�exceeds�expectations,�due�to�size,�configuration,�or�unique�qualities.�Such�components�are�given�scores�of�3.�
� If�the�feature�exists�but�is�not�useable�because�it�is�unsafe,�obsolete,�or�dysfunctional,�it�may�be�listed�in�the�feature�description�and�assigned�a�score�of�zero�(0).�
�If�a�feature�is�used�for�multiple�functions,�such�as�a�softball�field�that�is�also�used�for�T�Ball�or�youth�soccer�games,�it�is�scored�only�once�under�the�description�that�best�fits�the�use�that�for�which�the�component�was�designed.��
�Neighborhood�and�Community�Scoring�Components�are�evaluated�from�two�perspectives:�first,�the�value�of�the�component�in�serving�the�immediate�neighborhood,�and�second,�its�value�to�the�entire�community.���
Neighborhood�Score�Each�component�is�evaluated�from�the�perspective�of�a�resident�that�lives�nearby.�High�scoring�components�are�easily�accessible�to�pedestrians�in�the�neighborhood,�are�attractive�for�short�and�frequent�visits,�and�are�unobtrusive�to�the�surrounding�neighborhood.�Components�that�do�not�have�a�high�neighborhood�score�may�not�be�located�within�walking�distance�of�residents,�may�have�“nuisance�features”�such�as�sports�lighting,�or�may�draw�large�crowds�for�which�parking�is�not�provided.��Community�Score�Additionally�each�component�is�evaluated�from�the�perspective�of�residents�in�the�community�as�a�whole.�High�scoring�components�in�this�category�may�be�unique�components�within�the�parks�and�recreation�system,�have�a�broad�draw�from�throughout�the�community,�have�the�capacity�and�associated�facilities�for�community�wide�events,�or�are�located�in�areas�that�are�accessible�only�by�car.��Indoor�Components�Indoor�components�are�generally�thought�to�be�accessible�to�the�entire�community,�partially�because�it�is�often�not�financially�feasible�to�provide�indoor�facilities�at�a�walking�distance�from�every�distance�from�each�residence.�Additionally�indoor�facilities�often�provide�programs�and�facilities�that�are�geared�to�the�community�as�a�whole,�or�in�larger�communities,�are�intended�for�a�region�of�the�community.�For�these�reasons,�unless�a�detailed�indoor�analysis�is�completed,�indoor�facilities�are�given�only�one�score.��
�Modifiers�(Comfort�and�Convenience�Features)�Scoring�
�Outdoor�Modifiers�Besides�standard�components,�this�inventory�also�evaluates�features�that�provide�comfort�and�convenience�to�the�users.�These�are�things�that�a�user�might�not�go�to�the�parks�specifically�to�use,�but�are�things�that�enhance�the�users’�experience�by�making�it�a�nicer�place�to�be�and�include:�drinking�fountains,�seating,�BBQ�grills,�dog�stations,�security�lighting,�bike�parking,�restrooms,�shade,�connections�to�trails,�park�access,�parking,�picnic�tables,�and�seasonal�and�ornamental�plantings.�These�features�are�scored�as�listed�above�with�the�1�3�system.�In�this�case�it�is�not�important�to�get�a�count�of�the�number�or�size�of�these�components;�instead�the�score�should�reflect�the�ability�of�the�item�to�serve�the�park.��
�
Volume�1:�Needs�and�Resource�Assessment���DRAFT� 243��
Indoor�Modifiers�For�indoor�facilities�the�comfort�and�convenience�features�change�slightly�to�reflect�the�characteristics�of�the�building.�Building�modifier�categories�include:�site�access,�setting�aesthetics,�building�entry�function,�building�entry�aesthetics,�overall�building�condition,�entry�desk,�office�space,�overall�storage,�and�restrooms�and/or�locker�rooms.���Activity�and�Sports�Lighting�This�modifier�accounts�for�lighting�that�allows�for�component�use�in�the�evening/night�hours�and�is�applied�to�the�quantity�of�the�component�as�it�affectively�expands�the�capacity�of�the�component.�This�modifier�does�not�apply�to�security�lighting.���Shade�Like�Activity�and�Sports�lighting,�shade�can�be�added�to�outdoor�components�to�extend�use�beyond�normal�hours�or�seasons.��
�Design�&�Ambience�Scoring�Using�the�same�rating�system�that�is�used�for�components�and�modifiers,�the�quality�of�Design�and�Ambience�is�scored.�Good�design�not�only�makes�a�place�look�nice,�it�makes�it�feel�safe�and�pleasant,�and�encourages�people�to�visit�more�often�and�stay�longer.���Trails�Scoring�Trails�can�be�scored�as�independent�parks�or�greenways�or�as�individual�components�within�another�park.�The�former�type�of�trail�receives�its�own�set�of�scores�for�modifiers�and�design�and�ambiance.�The�trail�in�the�latter�situation�takes�on�the�modifiers�and�design�and�ambiance�of�the�larger�park�in�which�it�resides.�Multi�use�trails�are�assumed�to�consist�of�three�(3)�components�including�one�active�component,�one�passive�component,�and�the�parcel�itself.�Because�traveling�the�length�of�any�given�trail�is�time�consuming,�trail�information�is�often�collected�with�the�aid�of�staff.��
�Ownership�Modifier�This�modifier�is�generally�weighted�with�a�percentage�that�is�applied�to�the�GRASP®�score�after�other�modifiers�have�been�applied.�It�accounts�for�access�and�control�of�components�that�are�provided�by�alternative�providers.�For�example,�in�most�cases�components�that�are�owned�and�managed�by�schools�are�given�a�50�percent�weighted�ownership�modifier,�which�halves�the�GRASP®�score�to�account�for�the�limited�access�that�the�neighborhood�has�to�school�facilities�(it’s�only�open�to�the�public�outside�of�school�hours).��E.�Calculating�GRASP®�Functional�Scores��Once�the�components�are�inventoried�and�scored,�calculations�can�be�made�for�any�combination�of�components�to�derive�average�scores,�scores�per�combinations�of�various�components,�scores�per�sub�areas,�etc.,�depending�on�the�key�issues�being�studied�and�objectives�for�the�project.�These�are�very�helpful�for�analyzing�area�comparisons�and�setting�of�target�scores�for�component�service�and�agency�target�standards.�����
244� Montgomery�County,�Maryland�
For�example,�a�total�composite�GRASP®�score�for�each�individual�component�is�determined�by�using�the�following�formula:���
�(total�component�score)�x�(adjusted�modifier�score)�x�(design�and�ambiance�score)�x�(ownership�modifier)�=�Composite�GRASP®�Score�
�These�individual�scores�can�be�additively�combined�in�various�ways�to�examine�service�from�various�subsets�of�the�agency’s�system.���F.�GRASP®�Perspectives�and�Target�Scores��GRASP®�scores�are�often�used�to�create�analysis�maps,�called�Perspectives,�to�show�the�cumulative�level�of�service�available�to�a�resident�at�any�given�location�in�the�community�service�area.�The�scores�provided�blended�quantitative�values�based�on�the�number�and�quality�of�opportunities�to�enjoy�an�experience�(or�level�of�service)�that�exist�in�a�reasonable�proximity�to�the�given�location.�Tables�and�charts�are�created�along�with�the�Perspectives�to�help�provide�quantitative�and�graphic�analysis�tools.��If�a�philosophy�is�adopted�wherein�the�goal�is�to�provide�some�minimum�combination�of�opportunities�to�every�residence,�a�GRASP®�score�can�be�calculated�that�represents�this�minimum.�These�scores�can�be�used�to�create�standards�for�the�agency�to�maintain�a�measurable�level�of�service�over�time.�A�variety�of�Perspectives�are�created�to�analyze�and�depict�the�communities�LOS�through�a�variety�of�combinations�and�composites,�depending�on�the�key�issues�being�studied.��Typical�and�Standard�GRASP®�Perspectives�Often�Perspectives�are�created�that�analyze�the�actual�level�of�service�being�obtained�as�compared�to�a�“standard”�target.��Neighborhood�Composite�
This�Perspective�depicts�service�from�a�neighborhood�point�of�view.�The�threshold�score�for�this�analysis�is�that�each�resident�will�have�access�within�1/4�mile�of�their�home�to�the�equivalent�of�4�recreation�components�and�one�recreational�trail.�Further�expanded,�the�goal�is�to�offer�a�selection�of�active�and�passive�recreation�opportunities�(indoor�or�outdoor)�to�every�residence,�along�with�access�to�a�recreational�trail�of�which�components,�modifiers,�and�design�and�ambiance�are�meeting�expectations.���
Walkability�(same�as�Neighborhood�Composite�but�with�only�¼�mile�catchment�areas)�The�idea�for�this�threshold�score�and�Perspective�is�that�each�resident�will�have�access�within�1/4�mile�of�their�home�to�the�equivalent�of�4�recreation�components�and�one�recreational�trail.��
�Perspectives�showing�Neighborhood�LOS�for�one�component�
The�threshold�score�here�is�that�each�resident�will�have�access�within�1/4�mile�of�their�home�to�the�equivalent�to�the�selected�component�of�which�the�component,�modifiers,�and�design�and�ambiance�are�meeting�expectations.��
��
Volume�1:�Needs�and�Resource�Assessment���DRAFT� 245��
Note:�Aside�from�meeting�this�goal,�the�mix�of�components�also�needs�to�be�considered.�For�example,�a�home�that�is�within�1/4�mile�of�four�tennis�courts�and�no�other�amenities�would�meet�the�basic�numeric�standard,�but�not�the�intent�of�the�standard.�Based�on�this,�it�is�recommended�that�the�target�be�to�provide�the�minimum�score�to�as�many�homes�as�possible,�but�also�to�exceed�the�minimum�by�some�factor�whenever�possible.���G.�GRASP®�Project�Technical�Standards�for�GIS�Data���The�GRASP®�Team�utilizes�the�most�up�to�date�computer�hardware�and�software�to�produce�and�enhance�project�based�GIS�data.�The�following�technical�details�are�standard�with�all�GRASP®�Team�projects.��
� All�GRASP®�Team�GIS�workstations�employ�Microsoft®�Windows®�operating�systems.�All�project�files�conform�to�PC�based�architecture�and�extension�naming�standards.�
� The�GRASP®�Team�employs�ESRI®�ArcGIS™�9.3�for�all�GIS�applications.�Final�project�GIS�data�is�submitted�to�the�client�in�Microsoft®�Access™�based�Geodatabase�(*.mdb)�Feature�Class�format�and/or�Shapefile�(*.shp/*.dbf/*.shx)�format.�ArcMap™�Layer�files�(*.lyr)�are�submitted�to�ease�client�replication�of�all�project�map�legend�formats.�The�GRASP®�Team�will�not�resubmit�original�client�source�data�that�has�not�undergone�enhancement.��
� All�final�GIS�datasets�(deliverables)�area�submitted�to�the�client�using�the�geographic�coordinate�system(s)�from�the�original�client�source�data.�The�GRASP®�team�will�assign�a�coordinate�system�that�is�most�appropriate�for�the�client�location�if�the�client�does�not�require�a�predetermined�standard�coordinate�system.�Most�GRASP®�project�data�is�submitted�in�State�Plane�Coordinates�(Feet)�with�a�NAD83/NAD83�HARN�datum.�
� The�GRASP®�Team�employs�Trimble®�GPS�units�for�all�(spatial)�field�data�collection.�All�data�is�collected�with�sub�foot�and/or�sub�meter�accuracy�when�possible.�All�GPS�data�is�post�processed�with�Trimble®�Pathfinder�Office®�software.�All�GPS�data�will�be�submitted�to�client�as�an�ESRI®�based�Geodatabase�Feature�Class�or�Shapefile.��
� All�GRASP®�Perspectives�and�Resource�Maps�(deliverables)�are�submitted�to�the�client�in�standard�PDF�and�JPEG�formats.�The�project�PDFs�are�high�resolution,�print�ready�files�for�scalable�print�operations.�Most�project�map�based�PDFs�are�300dpi,�36”x54”�images.�The�project�JPEGs�are�lower�resolution�digital�presentation�ready�files�for�insertion�into�Microsoft®�Office®�productivity�suite�applications�–�MS�Word®,�MS�Power�Point®,�etc.�Most�project�map�based�JPEGs�are�300dpi�4x6”�images.�
�H.�Project�Deliverables�and�Future�Use��All�information�and�deliverables�described�above�are�transmitted�“as�is”�to�fulfill�specific�tasks�identified�in�the�scope�of�services�for�this�contract.�While�these�may�be�useful�for�other�purposes,�no�warranties�or�other�assurances�are�made�that�the�deliverables�are�ready�for�such�use.���The�database�can�be�modified�to�add,�change,�or�delete�information�as�needed�by�personnel�trained�in�use�of�these�standard�software�applications.�For�example,�if�new�parks�or�facilities�are�constructed,�the�components�of�these�may�be�added�to�the�database�to�keep�it�current.�The�database�may�also�be�queried�in�a�variety�of�ways�to�produce�tables,�charts,�or�reports�for�use�in�operations,�management,�and�planning�or�other�agency�tasks.�Such�modification,�updating,�reformatting,�or�other�preparation�for�use�in�other�purposes�is�the�sole�responsibility�of�the�client.��

246� Montgomery�County,�Maryland�
�Similarly,�the�database�information�can�be�used�to�prepare�a�variety�of�maps�and�analysis�perspectives�using�GIS�software.�Such�use�by�the�client�is�beyond�the�scope�of�this�contract,�and�no�warranties�or�assurances�are�made�that�the�deliverables�are�ready�or�intended�for�such�future�use.�If�desired,�the�GRASP®�Team�can�make�such�modifications,�and/or�prepare�additional�or�updated�maps�or�Perspectives�upon�request�for�a�negotiated�fee.�
� �

Volume�1:�Needs�and�Resource�Assessment���DRAFT� 247��
APPENDIX�G:�MONTGOMERY�COUNTY�PARK�&�FACILITY�INVENTORY�
�

������������������
THIS�PAGE�INTENTIONALLY�LEFT�BLANK�
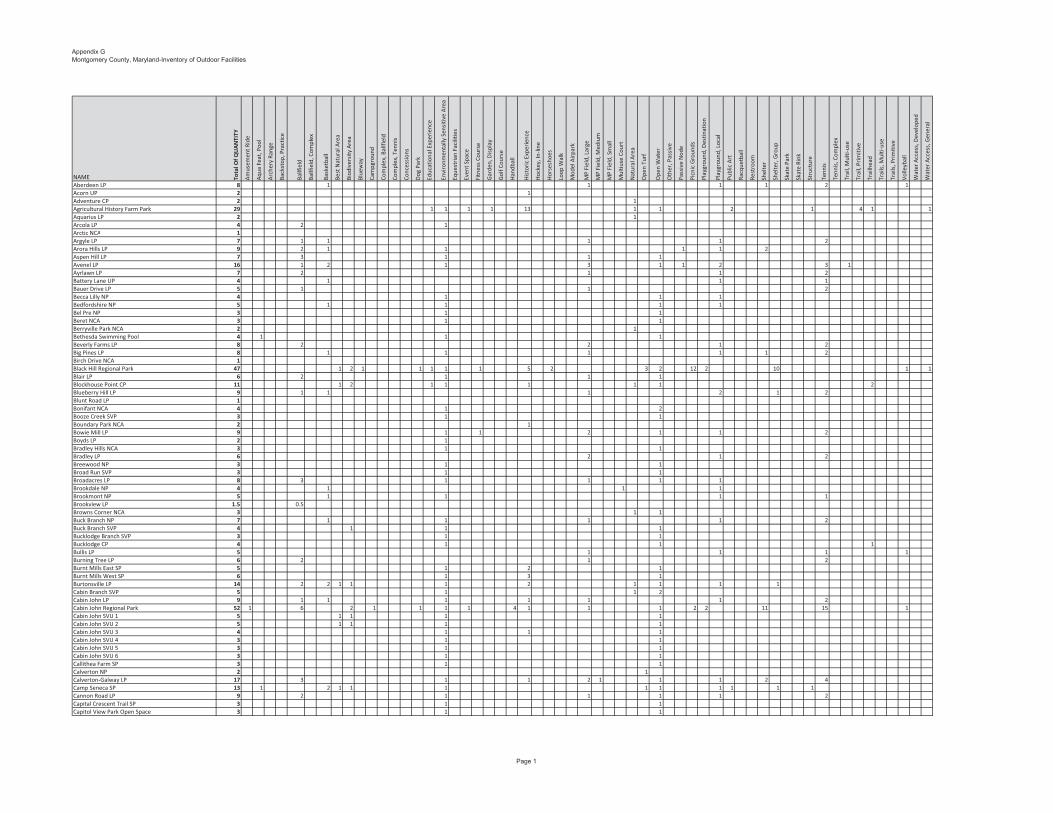
Appendix GMontgomery County, Maryland-Inventory of Outdoor Facilities
NAME Tota
l�Of�Q
UA
NTI
TY
Am
usem
ent�R
ide
Aqu
a�Fe
at,�P
ool
Arc
hery
�Ran
ge
Back
stop
,�Pra
ctic
e
Ballf
ield
Ballf
ield
,�Com
plex
Bask
etba
ll
Best
�Nat
ural
�Are
a
Biod
iver
sity
�Are
a
Blue
way
Cam
pgro
und
Com
plex
,�Bal
lfiel
d
Com
plex
,�Ten
nis
Conc
essi
ons
Dog
�Par
k
Educ
atio
nal�E
xper
ienc
e
Envi
ronm
enta
lly�S
ensi
tive�
Are
a
Eque
stria
n�Fa
cilit
ies
Even
t�Spa
ce
Fitn
ess�
Cour
se
Gar
den,
�Dis
play
Gol
f�Cou
rse
Han
dbal
l
His
tori
c�Ex
peri
ence
Hoc
key,
�In�li
ne
Hor
sesh
oes
Loop
�Wal
k
Mod
el�A
irpa
rk
MP�
Fiel
d,�L
arge
MP�
Fiel
d,�M
ediu
m
MP�
Fiel
d,�S
mal
l
Mul
tiuse
�Cou
rt
Nat
ural
�Are
a
Ope
n�Tu
rf
Ope
n�W
ater
Oth
er,�P
assi
ve
Pass
ive�
Nod
e
Picn
ic�G
roun
ds
Play
grou
nd,�D
estin
atio
n
Play
grou
nd,�L
ocal
Publ
ic�A
rt
Racq
uetb
all
Rest
room
Shel
ter
Shel
ter,
�Gro
up
Skat
e�Pa
rk
Skat
e�Ri
nk
Stru
ctur
e
Tenn
is
Tenn
is,�C
ompl
ex
Trai
l,�M
ulti�
use
Trai
l,�Pr
imiti
ve
Trai
lhea
d
Trai
ls,�M
ulti�
use
Trai
ls,�P
rim
itive
Vol
leyb
all
Wat
er�A
cces
s,�D
evel
oped
Wat
er�A
cces
s,�G
ener
al
Aberdeen�LP 8 1 1 1 1 2 1Acorn�UP 2 1Adventure�CP 2 1Agricultural�History�Farm�Park 29 1 1 1 1 13 1 1 2 1 4 1 1Aquarius�LP 2 1Arcola�LP 4 2 1Arctic�NCA 1Argyle�LP 7 1 1 1 1 2Arora�Hills�LP 9 2 1 1 1 1 2Aspen�Hill�LP 7 3 1 1 1Avenel�LP 16 1 2 1 3 1 1 2 3 1Ayrlawn�LP 7 2 1 1 2Battery�Lane�UP 4 1 1 1Bauer�Drive�LP 5 1 1 2Becca�Lilly�NP 4 1 1 1Bedfordshire�NP 5 1 1 1 1Bel�Pre�NP 3 1 1Beret�NCA 3 1 1Berryville�Park�NCA 2 1Bethesda�Swimming�Pool 4 1 1 1Beverly�Farms�LP 8 2 2 1 2Big�Pines�LP 8 1 1 1 1 1 2Birch�Drive�NCA 1Black�Hill�Regional�Park 47 1 2 1 1 1 1 1 5 2 3 2 12 2 10 1 1Blair�LP 6 2 1 1 1Blockhouse�Point�CP 11 1 2 1 1 1 1 1 2Blueberry�Hill�LP 9 1 1 1 2 1 2Blunt�Road�LP 1Bonifant�NCA 4 1 2Booze�Creek�SVP 3 1 1Boundary�Park�NCA 2 1Bowie�Mill�LP 9 1 1 2 1 1 2Boyds�LP 2 1Bradley�Hills�NCA 3 1 1Bradley�LP 6 2 1 2Breewood�NP 3 1 1Broad�Run�SVP 3 1 1Broadacres�LP 8 3 1 1 1 1Brookdale�NP 4 1 1 1Brookmont�NP 5 1 1 1 1Brookview�LP 1.5 0.5Browns�Corner�NCA 3 1 1Buck�Branch�NP 7 1 1 1 1 2Buck�Branch�SVP 4 1 1 1Bucklodge�Branch�SVP 3 1 1Bucklodge�CP 4 1 1 1Bullis�LP 5 1 1 1 1Burning�Tree�LP 6 2 1 2Burnt�Mills�East�SP 5 1 2 1Burnt�Mills�West�SP 6 1 3 1Burtonsville�LP 14 2 2 1 1 1 2 1 1 1 1Cabin�Branch�SVP 5 1 1 2Cabin�John�LP 9 1 1 1 1 1 1 2Cabin�John�Regional�Park 52 1 6 2 1 1 1 1 4 1 1 1 2 2 11 15 1Cabin�John�SVU�1 5 1 1 1 1Cabin�John�SVU�2 5 1 1 1 1Cabin�John�SVU�3 4 1 1 1Cabin�John�SVU�4 3 1 1Cabin�John�SVU�5 3 1 1Cabin�John�SVU�6 3 1 1Callithea�Farm�SP 3 1 1Calverton�NP 2 1Calverton�Galway�LP 17 3 1 1 2 1 1 1 2 4Camp�Seneca�SP 13 1 2 1 1 1 1 1 1 1 1 1Cannon�Road�LP 9 2 1 1 1 1 2Capital�Crescent�Trail�SP 3 1 1Capitol�View�Park�Open�Space 3 1 1
Page 1
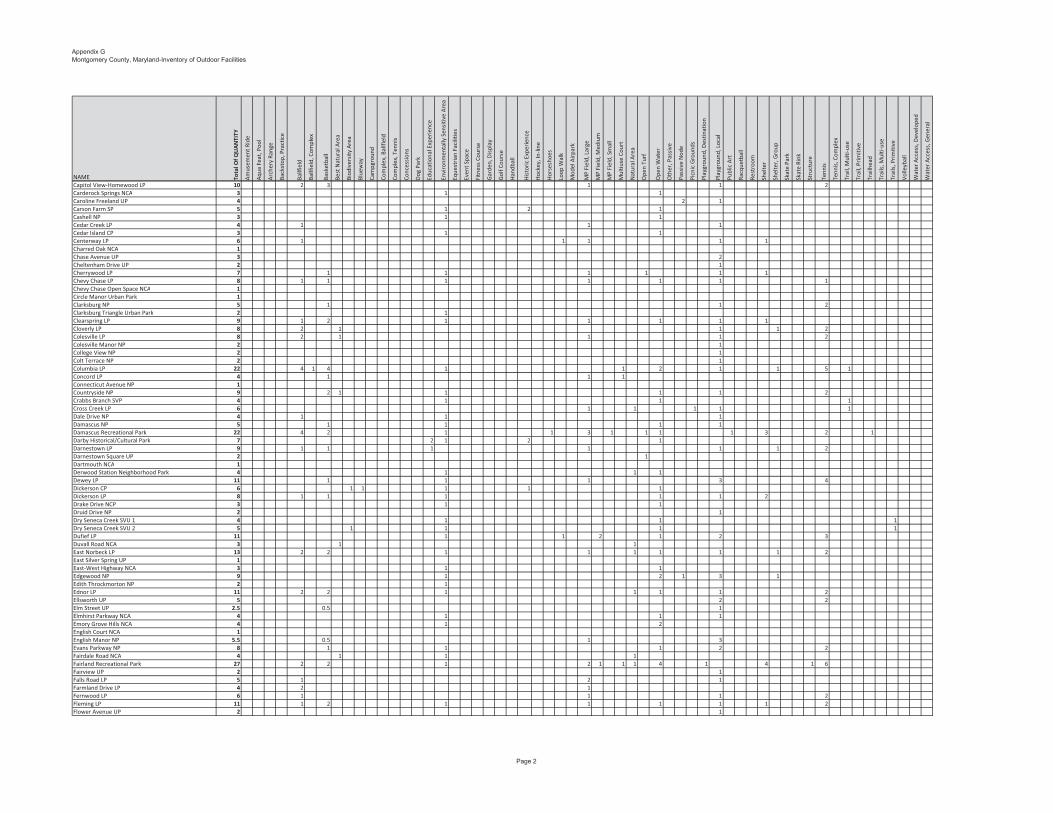
Appendix GMontgomery County, Maryland-Inventory of Outdoor Facilities
NAME Tota
l�Of�Q
UA
NTI
TY
Am
usem
ent�R
ide
Aqu
a�Fe
at,�P
ool
Arc
hery
�Ran
ge
Back
stop
,�Pra
ctic
e
Ballf
ield
Ballf
ield
,�Com
plex
Bask
etba
ll
Best
�Nat
ural
�Are
a
Biod
iver
sity
�Are
a
Blue
way
Cam
pgro
und
Com
plex
,�Bal
lfiel
d
Com
plex
,�Ten
nis
Conc
essi
ons
Dog
�Par
k
Educ
atio
nal�E
xper
ienc
e
Envi
ronm
enta
lly�S
ensi
tive�
Are
a
Eque
stria
n�Fa
cilit
ies
Even
t�Spa
ce
Fitn
ess�
Cour
se
Gar
den,
�Dis
play
Gol
f�Cou
rse
Han
dbal
l
His
tori
c�Ex
peri
ence
Hoc
key,
�In�li
ne
Hor
sesh
oes
Loop
�Wal
k
Mod
el�A
irpa
rk
MP�
Fiel
d,�L
arge
MP�
Fiel
d,�M
ediu
m
MP�
Fiel
d,�S
mal
l
Mul
tiuse
�Cou
rt
Nat
ural
�Are
a
Ope
n�Tu
rf
Ope
n�W
ater
Oth
er,�P
assi
ve
Pass
ive�
Nod
e
Picn
ic�G
roun
ds
Play
grou
nd,�D
estin
atio
n
Play
grou
nd,�L
ocal
Publ
ic�A
rt
Racq
uetb
all
Rest
room
Shel
ter
Shel
ter,
�Gro
up
Skat
e�Pa
rk
Skat
e�Ri
nk
Stru
ctur
e
Tenn
is
Tenn
is,�C
ompl
ex
Trai
l,�M
ulti�
use
Trai
l,�Pr
imiti
ve
Trai
lhea
d
Trai
ls,�M
ulti�
use
Trai
ls,�P
rim
itive
Vol
leyb
all
Wat
er�A
cces
s,�D
evel
oped
Wat
er�A
cces
s,�G
ener
al
Capitol�View�Homewood�LP 10 2 3 1 1 2Carderock�Springs�NCA 3 1 1Caroline�Freeland�UP 4 2 1Carson�Farm�SP 5 1 2 1Cashell�NP 3 1 1Cedar�Creek�LP 4 1 1 1Cedar�Island�CP 3 1 1Centerway�LP 6 1 1 1 1 1Charred�Oak�NCA 1Chase�Avenue�UP 3 2Cheltenham�Drive�UP 2 1Cherrywood�LP 7 1 1 1 1 1 1Chevy�Chase�LP 8 1 1 1 1 1 1 1Chevy�Chase�Open�Space�NCA 1Circle�Manor�Urban�Park 1Clarksburg�NP 5 1 1 2Clarksburg�Triangle�Urban�Park 2 1Clearspring�LP 9 1 2 1 1 1 1 1Cloverly�LP 8 2 1 1 1 2Colesville�LP 8 2 1 1 1 2Colesville�Manor�NP 2 1College�View�NP 2 1Colt�Terrace�NP 2 1Columbia�LP 22 4 1 4 1 1 2 1 1 5 1Concord�LP 4 1 1 1Connecticut�Avenue�NP 1Countryside�NP 9 2 1 1 1 1 2Crabbs�Branch�SVP 4 1 1 1Cross�Creek�LP 6 1 1 1 1 1Dale�Drive�NP 4 1 1 1Damascus�NP 5 1 1 1 1Damascus�Recreational�Park 22 4 2 1 1 3 1 1 1 1 3 2 1Darby�Historical/Cultural�Park 7 2 1 2 1Darnestown�LP 9 1 1 1 1 1 1 2Darnestown�Square�UP 2 1Dartmouth�NCA 1Derwood�Station�Neighborhood�Park 4 1 1 1Dewey�LP 11 1 1 1 3 4Dickerson�CP 6 1 1 1 1 1Dickerson�LP 8 1 1 1 1 1 2Drake�Drive�NCP 3 1 1Druid�Drive�NP 2 1Dry�Seneca�Creek�SVU�1 4 1 1 1Dry�Seneca�Creek�SVU�2 5 1 1 1 1Dufief�LP 11 1 1 2 1 2 3Duvall�Road�NCA 3 1 1East�Norbeck�LP 13 2 2 1 1 1 1 1 1 2East�Silver�Spring�UP 1East�West�Highway�NCA 3 1 1Edgewood�NP 9 1 2 1 3 1Edith�Throckmorton�NP 2 1Ednor�LP 11 2 2 1 1 1 1 2Ellsworth�UP 5 2 2Elm�Street�UP 2.5 0.5 1Elmhirst�Parkway�NCA 4 1 1 1Emory�Grove�Hills�NCA 4 1 2English�Court�NCA 1English�Manor�NP 5.5 0.5 1 3Evans�Parkway�NP 8 1 1 1 2 2Fairdale�Road�NCA 4 1 1 1Fairland�Recreational�Park 27 2 2 1 2 1 1 1 4 1 4 1 6Fairview�UP 2 1Falls�Road�LP 5 1 2 1Farmland�Drive�LP 4 2 1Fernwood�LP 6 1 1 1 2Fleming�LP 11 1 2 1 1 1 1 1 2Flower�Avenue�UP 2 1
Page 2

Appendix GMontgomery County, Maryland-Inventory of Outdoor Facilities
NAME Tota
l�Of�Q
UA
NTI
TY
Am
usem
ent�R
ide
Aqu
a�Fe
at,�P
ool
Arc
hery
�Ran
ge
Back
stop
,�Pra
ctic
e
Ballf
ield
Ballf
ield
,�Com
plex
Bask
etba
ll
Best
�Nat
ural
�Are
a
Biod
iver
sity
�Are
a
Blue
way
Cam
pgro
und
Com
plex
,�Bal
lfiel
d
Com
plex
,�Ten
nis
Conc
essi
ons
Dog
�Par
k
Educ
atio
nal�E
xper
ienc
e
Envi
ronm
enta
lly�S
ensi
tive�
Are
a
Eque
stria
n�Fa
cilit
ies
Even
t�Spa
ce
Fitn
ess�
Cour
se
Gar
den,
�Dis
play
Gol
f�Cou
rse
Han
dbal
l
His
tori
c�Ex
peri
ence
Hoc
key,
�In�li
ne
Hor
sesh
oes
Loop
�Wal
k
Mod
el�A
irpa
rk
MP�
Fiel
d,�L
arge
MP�
Fiel
d,�M
ediu
m
MP�
Fiel
d,�S
mal
l
Mul
tiuse
�Cou
rt
Nat
ural
�Are
a
Ope
n�Tu
rf
Ope
n�W
ater
Oth
er,�P
assi
ve
Pass
ive�
Nod
e
Picn
ic�G
roun
ds
Play
grou
nd,�D
estin
atio
n
Play
grou
nd,�L
ocal
Publ
ic�A
rt
Racq
uetb
all
Rest
room
Shel
ter
Shel
ter,
�Gro
up
Skat
e�Pa
rk
Skat
e�Ri
nk
Stru
ctur
e
Tenn
is
Tenn
is,�C
ompl
ex
Trai
l,�M
ulti�
use
Trai
l,�Pr
imiti
ve
Trai
lhea
d
Trai
ls,�M
ulti�
use
Trai
ls,�P
rim
itive
Vol
leyb
all
Wat
er�A
cces
s,�D
evel
oped
Wat
er�A
cces
s,�G
ener
al
Flower�Hill�LP 9 1 1 1 2 2 1Flower�Valley�NP 11 1 1 1 1 1 1 2 1 1Forest�Glen�NP 4 2 1Forest�Glen�Dallas�Avenue�NP 2 1Forest�Grove�NP 6 2 1 1 1Fountain�Hills�LP 7 1 1 1 1 2Fox�Chapel�NP 5 1 1 2Fox�Hills�West�NP 4 1 1 1Garrett�Park�Estates�LP 4 1 1 1Garrett�Park�Waverly�NP 4 1 2General�Getty�NP 4 1 2Georgian�Forest�LP 8 1 2 1 1 2Germantown�East�LP 4 1 1 1Germantown�Square�UP 3 1 1Glen�Echo�Heights�NP 2.5 0.5 1Glen�Haven�NP 3 1 1Glen�Hills�LP 9.5 2 0.5 1 1 1 1 2Glen�Mar�NP 5 1 2 1Glenfield�LP 6 1 1 1 2Glenmont�Greenway�UP 1Glenmont�LP 6 1 1 1 1 1Good�Hope�LP 10 2 2 1 1 1 2Goshen�Branch�SVP 3 1 1Goshen�Elm�CP 2 1Goshen�Recreational�Park 4 1 1 1Great�Seneca�SVU�1 5 1 1 1 1Great�Seneca�SVU�2 4 1 1 1Great�Seneca�SVU�3 4 1 1 1Great�Seneca�SVU�4 5 2 1 1Great�Seneca�SVU�5 3 1 1Great�Seneca�SVU�6 3 1 1Great�Seneca�SVU�7 3 1 1Great�Seneca�SVU�8 3 1 1Great�Seneca�SVU�9 3 1 1Greenbriar�LP 3 1 1Greenwich�NP 6 1 1 1 2Greenwood�LP 15 2 2 1 1 1 1 1 1 1 2 1Gregerscroft�NP 4 1 1 1Griffith�LP 2 1Gunner's�Branch�LP 11 1 2 1 1 1 1 1 2Gunner's�Lake�LP 6 1 2 1 1Gunner's�Village�NCA 3 1 1Harmony�Hills�NP 2 1Hastings�NCA 1Hawlings�River�SVP 4 1 1 1Heritage�Farm�NP 9 1 1 1 1 1 1 2Highland�Stone�NP 3 1 1Hillandale�LP 11 2 2 1 1 1 1 2Hillmead�NP 6 2 1 2Hillwood�Manor�NP 3 1 1Hopefield�NP 5 1 1 1 1Hoyles�Mill�CP 7 1 1 1 1 2Hoyles�Mill�Village�LP 7 1 1 1 1 1 1Hunters�Woods�LP 9 1 2 1 1 1 1 1Hunters�Woods�NCA 4 1 2Hyattstown�Open�Space�SP 3 1 1Indian�Spring�Terrace�LP 7 1 1 1 1 2Inverness�Forest�NCA 3 1 1Jesup�Blair�LP 7.5 1.5 1 1 1 2John�Haines�NP 3 1 1Johnson�LP 10 1 2 1 1 1 1 2Jones�Mill�Road�NP 3.5 0.5 1 1Juniper�Blair�NP 2 1Kemp�Mill�Estates�LP 7 1 1 1 1 2Kemp�Mill�UP 5 1 1 1 1Ken�Gar�Palisades�LP 11 1 1 1 2 1 1 1 2Kensington�Cabin�LP 10 1 2 1 1 1 1 2
Page 3
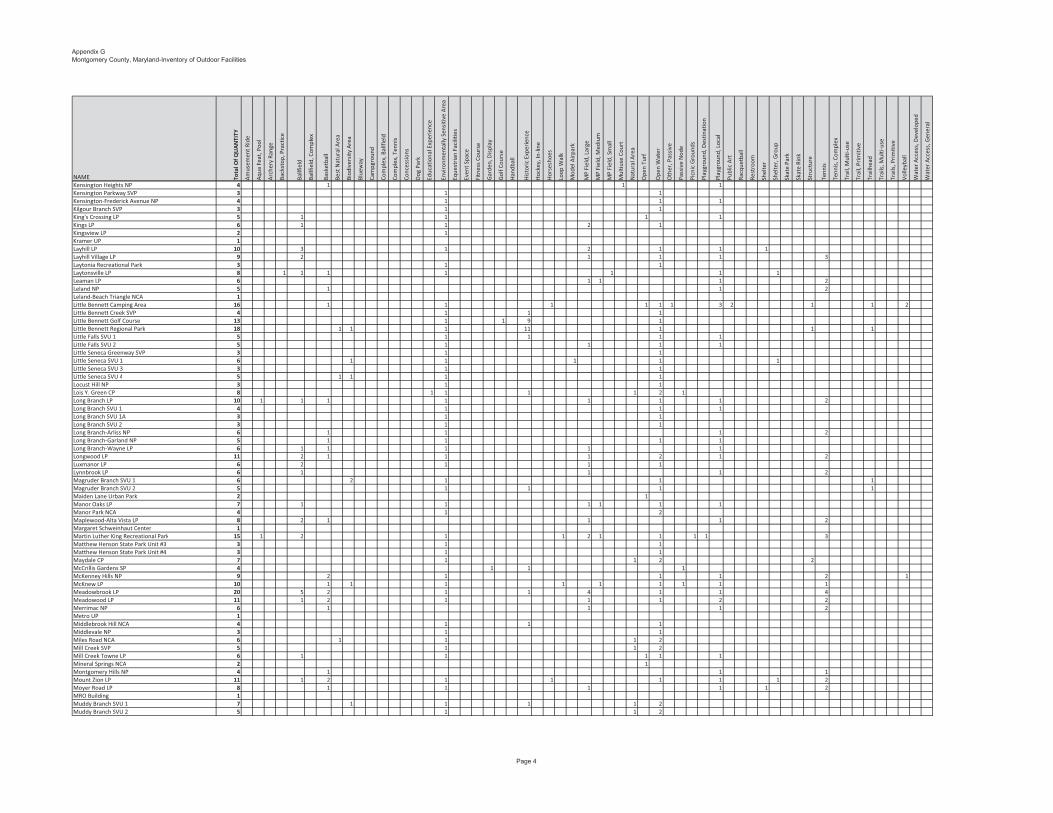
Appendix GMontgomery County, Maryland-Inventory of Outdoor Facilities
NAME Tota
l�Of�Q
UA
NTI
TY
Am
usem
ent�R
ide
Aqu
a�Fe
at,�P
ool
Arc
hery
�Ran
ge
Back
stop
,�Pra
ctic
e
Ballf
ield
Ballf
ield
,�Com
plex
Bask
etba
ll
Best
�Nat
ural
�Are
a
Biod
iver
sity
�Are
a
Blue
way
Cam
pgro
und
Com
plex
,�Bal
lfiel
d
Com
plex
,�Ten
nis
Conc
essi
ons
Dog
�Par
k
Educ
atio
nal�E
xper
ienc
e
Envi
ronm
enta
lly�S
ensi
tive�
Are
a
Eque
stria
n�Fa
cilit
ies
Even
t�Spa
ce
Fitn
ess�
Cour
se
Gar
den,
�Dis
play
Gol
f�Cou
rse
Han
dbal
l
His
tori
c�Ex
peri
ence
Hoc
key,
�In�li
ne
Hor
sesh
oes
Loop
�Wal
k
Mod
el�A
irpa
rk
MP�
Fiel
d,�L
arge
MP�
Fiel
d,�M
ediu
m
MP�
Fiel
d,�S
mal
l
Mul
tiuse
�Cou
rt
Nat
ural
�Are
a
Ope
n�Tu
rf
Ope
n�W
ater
Oth
er,�P
assi
ve
Pass
ive�
Nod
e
Picn
ic�G
roun
ds
Play
grou
nd,�D
estin
atio
n
Play
grou
nd,�L
ocal
Publ
ic�A
rt
Racq
uetb
all
Rest
room
Shel
ter
Shel
ter,
�Gro
up
Skat
e�Pa
rk
Skat
e�Ri
nk
Stru
ctur
e
Tenn
is
Tenn
is,�C
ompl
ex
Trai
l,�M
ulti�
use
Trai
l,�Pr
imiti
ve
Trai
lhea
d
Trai
ls,�M
ulti�
use
Trai
ls,�P
rim
itive
Vol
leyb
all
Wat
er�A
cces
s,�D
evel
oped
Wat
er�A
cces
s,�G
ener
al
Kensington�Heights�NP 4 1 1 1Kensington�Parkway�SVP 3 1 1Kensington�Frederick�Avenue�NP 4 1 1 1Kilgour�Branch�SVP 3 1 1King's�Crossing�LP 5 1 1 1 1Kings�LP 6 1 1 2 1Kingsview�LP 2 1Kramer�UP 1Layhill�LP 10 3 1 2 1 1 1Layhill�Village�LP 9 2 1 1 1 3Laytonia�Recreational�Park 3 1 1Laytonsville�LP 8 1 1 1 1 1 1 1Leaman�LP 6 1 1 1 2Leland�NP 5 1 1 2Leland�Beach�Triangle�NCA 1Little�Bennett�Camping�Area 16 1 1 1 1 1 1 3 2 1 1 2Little�Bennett�Creek�SVP 4 1 1 1Little�Bennett�Golf�Course 13 1 1 9 1Little�Bennett�Regional�Park 18 1 1 1 11 1 1 1Little�Falls�SVU�1 5 1 1 1 1Little�Falls�SVU�2 5 1 1 1 1Little�Seneca�Greenway�SVP 3 1 1Little�Seneca�SVU�1 6 1 1 1 1 1Little�Seneca�SVU�3 3 1 1Little�Seneca�SVU�4 5 1 1 1 1Locust�Hill�NP 3 1 1Lois�Y.�Green�CP 8 1 1 1 1 2 1Long�Branch�LP 10 1 1 1 1 1 1 1 2Long�Branch�SVU�1 4 1 1 1Long�Branch�SVU�1A 3 1 1Long�Branch�SVU�2 3 1 1Long�Branch�Arliss�NP 6 1 1 1 2Long�Branch�Garland�NP 5 1 1 1 1Long�Branch�Wayne�LP 6 1 1 1 1 1Longwood�LP 11 2 1 1 1 2 1 2Luxmanor�LP 6 2 1 1 1Lynnbrook�LP 6 1 1 1 2Magruder�Branch�SVU�1 6 2 1 1 1Magruder�Branch�SVU�2 5 1 1 1 1Maiden�Lane�Urban�Park 2 1Manor�Oaks�LP 7 1 1 1 1 1 1Manor�Park�NCA 4 1 2Maplewood�Alta�Vista�LP 8 2 1 1 1 2Margaret�Schweinhaut�Center 1Martin�Luther�King�Recreational�Park 15 1 2 1 1 2 1 1 1 1 3Matthew�Henson�State�Park�Unit�#3 3 1 1Matthew�Henson�State�Park�Unit�#4 3 1 1Maydale�CP 7 1 1 2 2McCrillis�Gardens�SP 4 1 1 1McKenney�Hills�NP 9 2 1 1 1 2 1McKnew�LP 10 1 1 1 1 1 1 1 1 1Meadowbrook�LP 20 5 2 1 1 4 1 1 4Meadowood�LP 11 1 2 1 1 1 2 2Merrimac�NP 6 1 1 1 2Metro�UP 1Middlebrook�Hill�NCA 4 1 1 1Middlevale�NP 3 1 1Miles�Road�NCA 6 1 1 1 2Mill�Creek�SVP 5 1 1 2Mill�Creek�Towne�LP 6 1 1 1 1 1Mineral�Springs�NCA 2 1Montgomery�Hills�NP 4 1 1 1Mount�Zion�LP 11 1 2 1 1 1 1 1 2Moyer�Road�LP 8 1 1 1 1 1 2MRO�Building 1Muddy�Branch�SVU�1 7 1 1 1 1 2Muddy�Branch�SVU�2 5 1 1 2
Page 4

Appendix GMontgomery County, Maryland-Inventory of Outdoor Facilities
NAME Tota
l�Of�Q
UA
NTI
TY
Am
usem
ent�R
ide
Aqu
a�Fe
at,�P
ool
Arc
hery
�Ran
ge
Back
stop
,�Pra
ctic
e
Ballf
ield
Ballf
ield
,�Com
plex
Bask
etba
ll
Best
�Nat
ural
�Are
a
Biod
iver
sity
�Are
a
Blue
way
Cam
pgro
und
Com
plex
,�Bal
lfiel
d
Com
plex
,�Ten
nis
Conc
essi
ons
Dog
�Par
k
Educ
atio
nal�E
xper
ienc
e
Envi
ronm
enta
lly�S
ensi
tive�
Are
a
Eque
stria
n�Fa
cilit
ies
Even
t�Spa
ce
Fitn
ess�
Cour
se
Gar
den,
�Dis
play
Gol
f�Cou
rse
Han
dbal
l
His
tori
c�Ex
peri
ence
Hoc
key,
�In�li
ne
Hor
sesh
oes
Loop
�Wal
k
Mod
el�A
irpa
rk
MP�
Fiel
d,�L
arge
MP�
Fiel
d,�M
ediu
m
MP�
Fiel
d,�S
mal
l
Mul
tiuse
�Cou
rt
Nat
ural
�Are
a
Ope
n�Tu
rf
Ope
n�W
ater
Oth
er,�P
assi
ve
Pass
ive�
Nod
e
Picn
ic�G
roun
ds
Play
grou
nd,�D
estin
atio
n
Play
grou
nd,�L
ocal
Publ
ic�A
rt
Racq
uetb
all
Rest
room
Shel
ter
Shel
ter,
�Gro
up
Skat
e�Pa
rk
Skat
e�Ri
nk
Stru
ctur
e
Tenn
is
Tenn
is,�C
ompl
ex
Trai
l,�M
ulti�
use
Trai
l,�Pr
imiti
ve
Trai
lhea
d
Trai
ls,�M
ulti�
use
Trai
ls,�P
rim
itive
Vol
leyb
all
Wat
er�A
cces
s,�D
evel
oped
Wat
er�A
cces
s,�G
ener
al
Muddy�Branch�SVU�3 7 1 1 1 1 2Muncaster�Manor�LP 1Needwood�Golf�Course 3 1 1New�Hampshire�Estates�NP 5 1 1 2New�Hope�Island�CP 2 1Newport�Mill�LP 8 2 3 1 1Nike�Missile�LP 12 1 1 1 1 1 1 1 1 2 1Nolte�LP 8 2 1 2 2Norbeck�Meadows�NP 9 1 1 1 1 1 1 1 1Norbeck�Muncaster�Mill�NP 5 1 1 1 1North�Branch�SVU�2 10 1 1 1 1 1 1 1 1 1North�Branch�SVU�3 6 1 1 1 1 1North�Branch�SVU�4 8 1 1 1 1 1 1 1North�Chevy�Chase�LP 9 2 1 1 1 1 2North�Four�Corners�LP 9 1 1 1 1 1 1 2North�Gate�LP 5 1 1 1 1North�Germantown�Greenway�SVP 5 1 1 1 1North�Point�NCA 3 1 1Northwest�Branch�Golf�Course 4 1 1 1Northwest�Branch�Recreational�Park 6 1 1 1 1 1Northwest�Branch�SVU�3 5 1 1 1 1Northwest�Branch�SVU�4 8 1 2 1 2 1Northwest�Branch�SVU�5 6 3 1 1Northwest�Branch�SVU�7 5 1 1 2Norwood�LP 14 2 1 1 2 2 5Norwood�Village�NCA 5 1 1 2Oak�Ridge�CP 6 1 2 2Old�Farm�NCA 2 1Olney�Acres�NP 3.5 0.5 1 1Olney�Family�NP 14 1 1 1 1 1 1 2 3 1 1Olney�Manor�Recreational�Park 65 5 2 1 1 1 1 4 1 3 1 1 1 1 6 1 1 13 18 2Olney�Mill�NP 8 1 1 1 1 1 2Olney�Square�NP 12 2 1 1 1 1 2 1 2Opal�A.�Daniels�NP 3 2Orchard�NP 5 1 1 2Ovid�Hazen�Wells�Recreational�Park 20 3 1 7 2 1 1 3 1Owens�Local�Park 11 1 2 1 1 1 1 3Paint�Branch�NP 4 1 1 1Paint�Branch�SVU�4 6 1 1 1 1 1Paint�Branch�SVU�5 4 1 1 1Paint�Branch�SVU�6 3 1 1Parkland�LP 7 2 2 2Parklawn�Group�Camping�Area 3 1 1Parklawn�Group�Picnicking�Area 5 1 2 1Parklawn�LP 4 1 2Patuxent�River�Watershed�CP 9 1 2 2 1 2Peach�Orchard�NCA 6 1 1 1 2Peachwood�NP 12 2 1 1 1 1 2 1 2Pennyfield�Lock�NCA 9 2 1 1 3 1Philadelphia�Avenue�UP 1Pilgrim�Hill�LP 8 1 1 1 1 1 2Pinecrest�LP 5 1 1 2Pleasant�View�LP 3 1 1Plumgar�LP 8 1 3 1 2Pope�Farm�Nursery 10 1 2 3 2Potomac�Community�NP 6 2 1 2Potomac�Horse�Center 4 1 1 1Potomac�Palisades�CP 1Quebec�Terrace�NP 3 1 1Quince�Orchard�Knolls�LP 10 1 1 1 1 1 1 1 2Quince�Orchard�Valley�NP 8 1 1 1 1 1 2Rachel�Carson�CP 14 1 1 1 5 1 2 1 1Randolph�Hills�LP 11 2 2 1 1 1 1 2Ray's�Meadow�LP 7 1 1 2 1 1Red�Door�Store�Historical/Cultural�Park 7 1 1 1 1 1 1Reddy�Branch�SVU�1 6 1 1 1 2Reddy�Branch�SVU�2 8 1 1 2 1 2
Page 5

Appendix GMontgomery County, Maryland-Inventory of Outdoor Facilities
NAME Tota
l�Of�Q
UA
NTI
TY
Am
usem
ent�R
ide
Aqu
a�Fe
at,�P
ool
Arc
hery
�Ran
ge
Back
stop
,�Pra
ctic
e
Ballf
ield
Ballf
ield
,�Com
plex
Bask
etba
ll
Best
�Nat
ural
�Are
a
Biod
iver
sity
�Are
a
Blue
way
Cam
pgro
und
Com
plex
,�Bal
lfiel
d
Com
plex
,�Ten
nis
Conc
essi
ons
Dog
�Par
k
Educ
atio
nal�E
xper
ienc
e
Envi
ronm
enta
lly�S
ensi
tive�
Are
a
Eque
stria
n�Fa
cilit
ies
Even
t�Spa
ce
Fitn
ess�
Cour
se
Gar
den,
�Dis
play
Gol
f�Cou
rse
Han
dbal
l
His
tori
c�Ex
peri
ence
Hoc
key,
�In�li
ne
Hor
sesh
oes
Loop
�Wal
k
Mod
el�A
irpa
rk
MP�
Fiel
d,�L
arge
MP�
Fiel
d,�M
ediu
m
MP�
Fiel
d,�S
mal
l
Mul
tiuse
�Cou
rt
Nat
ural
�Are
a
Ope
n�Tu
rf
Ope
n�W
ater
Oth
er,�P
assi
ve
Pass
ive�
Nod
e
Picn
ic�G
roun
ds
Play
grou
nd,�D
estin
atio
n
Play
grou
nd,�L
ocal
Publ
ic�A
rt
Racq
uetb
all
Rest
room
Shel
ter
Shel
ter,
�Gro
up
Skat
e�Pa
rk
Skat
e�Ri
nk
Stru
ctur
e
Tenn
is
Tenn
is,�C
ompl
ex
Trai
l,�M
ulti�
use
Trai
l,�Pr
imiti
ve
Trai
lhea
d
Trai
ls,�M
ulti�
use
Trai
ls,�P
rim
itive
Vol
leyb
all
Wat
er�A
cces
s,�D
evel
oped
Wat
er�A
cces
s,�G
ener
al
Reddy�Branch�SVU�3 5 1 1 2Redland�LP 10 1 1 1 1 1 1 1 2Rickman�Farm�Horse�Park 6 1 1 2 1Ridge�Road�Recreational�Park 16 3 1 1 1 1 1 1 1 3 1 1River�Road�Shale�Barrens�CP 5 1 1 1 1Rock�Creek�Hills�LP 8 1 1 2 1 2Rock�Creek�Regional�Park 61 1 3 1 1 2 1 6 3 1 1 1 2 1 3 2 1 3 2 18 1 4 1 1Rock�Creek�SVU�1 6 1 3 1Rock�Creek�SVU�2 5 1 1 1 1Rock�Creek�SVU�3 6 2 1 1 1Rock�Creek�SVU�4 3 1 1Rock�Creek�SVU�5 4 1 1 1Rock�Creek�SVU�6 3 1 1Rock�Creek�SVU�7 4 1 1 1Rock�Creek�SVU11 6 1 1 1 1 1Rock�Creek�SVU12 6 1 1 1 1 1Rock�Creek�SVU14 3 1 1Rock�Creek�SVU15 5 1 1 1 1Rock�Creek�SVU16 3 1 1Rock�Run�SVP 6 1 2 1 1Rosemary�Hills�Lyttonsville�LP 8.5 1 1.5 1 2 2Royce�Hanson�UP 1Sadlebrook�LP 6 1 1 1 1 1Saint�Paul�NCA 3 1 1Sangamore�LP 8 1 1 1 1 1 2Scotland�NP 6 1 1 1 1 1Seek�Lane�NP 2 1Seneca�Crossing�LP 3 1 1Seneca�Landing�SP 14 1 1 5 1 2 1 1 1Seneca�Springs�LP 2 1Serpentine�Barrens�CP 6 1 1 1 1 1Serpentine�Barrons�Conservation�Park��South�Unit 5 1 1 2Seven�Locks�LP 10 2 1 1 1 1 1 2Seven�Oaks�NP 2 1Sherwood�Forest�Manor�NP 3 1 1Sherwood�Forest�NCA 3 1 1Silver�Spring�Intermediate�NP 6 2 1 2Sligo�Avenue�NP 4 1 1 1Sligo�Cabin�NP 4 1 1 1Sligo�Creek�North�NP 4 1 1 1Sligo�Creek�SVU�1 4 1 1 1Sligo�Creek�SVU�1A 3 1 1Sligo�Creek�SVU�2 4 1 1 1Sligo�Creek�SVU�3 5 1 2 1Sligo�Creek�SVU�4 3 1 1Sligo�Creek�SVU�5 3 1 1Sligo�Golf�Course 4 1 1 1Sligo�Mill�NCA 3 1 1Sligo�Mill�Overlook�NP 1Sligo�Bennington�NP 6 1 1 1 2Sligo�Dennis�Avenue�LP 10 1 3 1 1 1 2South�Germantown�Recreational�Park 5 1 1 1 1South�Gunner's�Branch�LP 8 1 1 1 1 1 2Southeast�Olney�LP 8 1 1 1 1 2 1Spencerville�LP 11 2 2 1 1 1 1 2Stewartown�LP 16 1 3 1 1 1 2 1 3 2Stonecrest�NCA 3 1 1Stonegate�LP 8 1 2 1 1 2Stonehedge�LP 5.5 0.5 1 2 1Stoneybrook�LP 9 2 2 1 1 2Strathmore�LP 9 1 1 1 1 1 1 2Stratton�LP 11 1 2 1 2 1 1 2Strawberry�Knoll�LP 8 2 1 1 1 2Sugarland�SP 3 1 1Sundown�Road�LP 11 2 1 1 1 1 1 1 2Takoma�Park�NP 3 1 1Takoma�Park�South�NP 1
Page 6
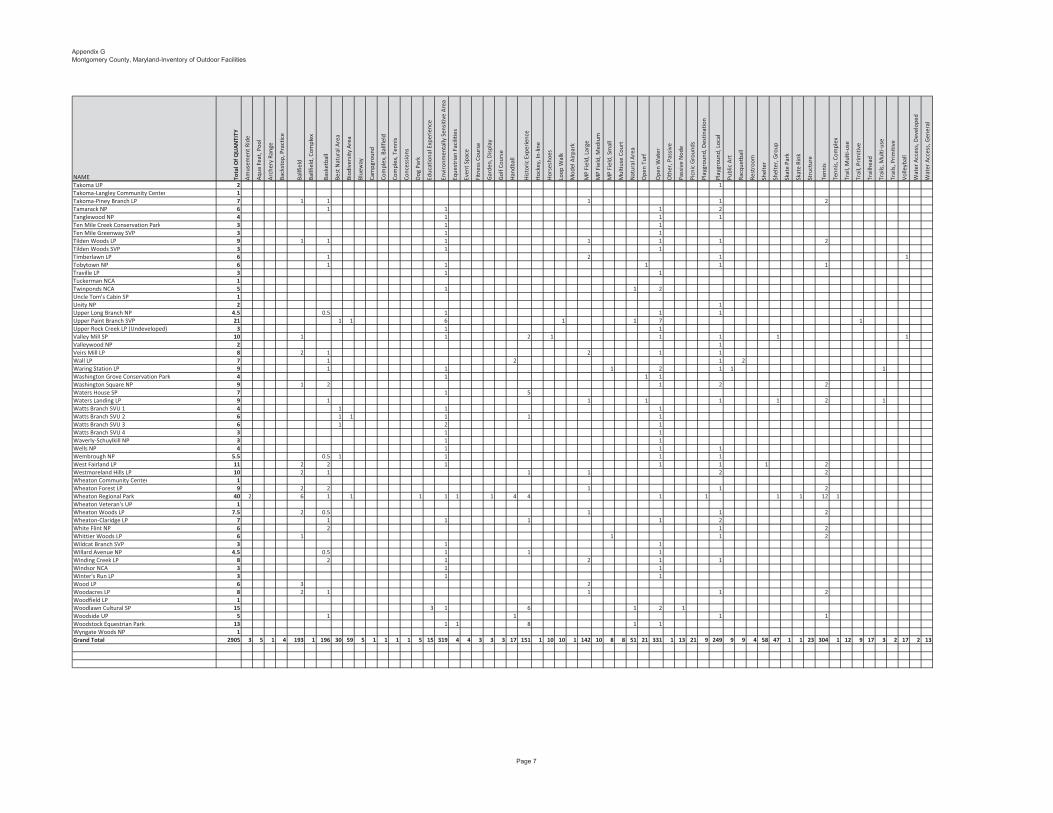
Appendix GMontgomery County, Maryland-Inventory of Outdoor Facilities
NAME Tota
l�Of�Q
UA
NTI
TY
Am
usem
ent�R
ide
Aqu
a�Fe
at,�P
ool
Arc
hery
�Ran
ge
Back
stop
,�Pra
ctic
e
Ballf
ield
Ballf
ield
,�Com
plex
Bask
etba
ll
Best
�Nat
ural
�Are
a
Biod
iver
sity
�Are
a
Blue
way
Cam
pgro
und
Com
plex
,�Bal
lfiel
d
Com
plex
,�Ten
nis
Conc
essi
ons
Dog
�Par
k
Educ
atio
nal�E
xper
ienc
e
Envi
ronm
enta
lly�S
ensi
tive�
Are
a
Eque
stria
n�Fa
cilit
ies
Even
t�Spa
ce
Fitn
ess�
Cour
se
Gar
den,
�Dis
play
Gol
f�Cou
rse
Han
dbal
l
His
tori
c�Ex
peri
ence
Hoc
key,
�In�li
ne
Hor
sesh
oes
Loop
�Wal
k
Mod
el�A
irpa
rk
MP�
Fiel
d,�L
arge
MP�
Fiel
d,�M
ediu
m
MP�
Fiel
d,�S
mal
l
Mul
tiuse
�Cou
rt
Nat
ural
�Are
a
Ope
n�Tu
rf
Ope
n�W
ater
Oth
er,�P
assi
ve
Pass
ive�
Nod
e
Picn
ic�G
roun
ds
Play
grou
nd,�D
estin
atio
n
Play
grou
nd,�L
ocal
Publ
ic�A
rt
Racq
uetb
all
Rest
room
Shel
ter
Shel
ter,
�Gro
up
Skat
e�Pa
rk
Skat
e�Ri
nk
Stru
ctur
e
Tenn
is
Tenn
is,�C
ompl
ex
Trai
l,�M
ulti�
use
Trai
l,�Pr
imiti
ve
Trai
lhea
d
Trai
ls,�M
ulti�
use
Trai
ls,�P
rim
itive
Vol
leyb
all
Wat
er�A
cces
s,�D
evel
oped
Wat
er�A
cces
s,�G
ener
al
Takoma�UP 2 1Takoma�Langley�Community�Center 1Takoma�Piney�Branch�LP 7 1 1 1 1 2Tamarack�NP 6 1 1 1 2Tanglewood�NP 4 1 1 1Ten�Mile�Creek�Conservation�Park 3 1 1Ten�Mile�Greenway�SVP 3 1 1Tilden�Woods�LP 9 1 1 1 1 1 1 2Tilden�Woods�SVP 3 1 1Timberlawn�LP 6 1 2 1 1Tobytown�NP 6 1 1 1 1 1Traville�LP 3 1 1Tuckerman�NCA 1Twinponds�NCA 5 1 1 2Uncle�Tom's�Cabin�SP 1Unity�NP 2 1Upper�Long�Branch�NP 4.5 0.5 1 1 1Upper�Paint�Branch�SVP 21 1 1 6 1 1 7 1Upper�Rock�Creek�LP�(Undeveloped) 3 1 1Valley�Mill�SP 10 1 1 2 1 1 1 1 1Valleywood�NP 2 1Veirs�Mill�LP 8 2 1 2 1 1Wall�LP 7 1 2 1 2Waring�Station�LP 9 1 1 1 2 1 1 1Washington�Grove�Conservation�Park 4 1 1 1Washington�Square�NP 9 1 2 1 2 2Waters�House�SP 7 1 5Waters�Landing�LP 9 1 1 1 1 1 2 1Watts�Branch�SVU�1 4 1 1 1Watts�Branch�SVU�2 6 1 1 1 1 1Watts�Branch�SVU�3 6 1 2 1Watts�Branch�SVU�4 3 1 1Waverly�Schuylkill�NP 3 1 1Wells�NP 4 1 1 1Wembrough�NP 5.5 0.5 1 1 1 1West�Fairland�LP 11 2 2 1 1 1 1 2Westmoreland�Hills�LP 10 2 1 1 1 2 2Wheaton�Community�Center 1Wheaton�Forest�LP 9 2 2 1 1 2Wheaton�Regional�Park 40 2 6 1 1 1 1 1 1 4 4 1 1 1 1 12 1Wheaton�Veteran's�UP 1Wheaton�Woods�LP 7.5 2 0.5 1 1 2Wheaton�Claridge�LP 7 1 1 1 1 2White�Flint�NP 6 2 1 2Whittier�Woods�LP 6 1 1 1 2Wildcat�Branch�SVP 3 1 1Willard�Avenue�NP 4.5 0.5 1 1 1Winding�Creek�LP 8 2 1 2 1 1Windsor�NCA 3 1 1Winter's�Run�LP 3 1 1Wood�LP 6 3 2Woodacres�LP 8 2 1 1 1 2Woodfield�LP 1Woodlawn�Cultural�SP 15 3 1 6 1 2 1Woodside�UP 5 1 1 1 1Woodstock�Equestrian�Park 13 1 1 8 1 1Wyngate�Woods�NP 1Grand�Total 2905 3 5 1 4 193 1 196 30 59 5 1 1 1 1 5 15 319 4 4 3 3 3 17 151 1 10 10 1 142 10 8 8 51 21 331 1 13 21 9 249 9 9 4 58 47 1 1 23 304 1 12 9 17 3 2 17 2 13
Page 7
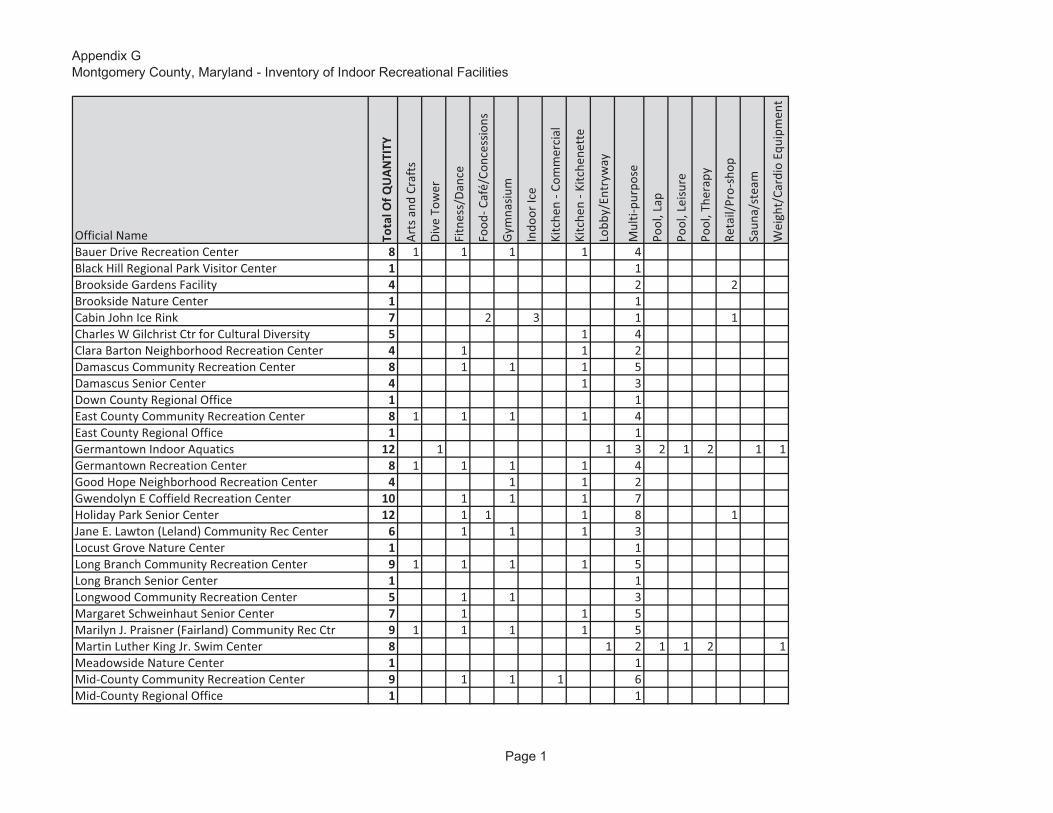
Appendix GMontgomery County, Maryland - Inventory of Indoor Recreational Facilities
Official�Name Tota
l�Of�Q
UA
NTI
TY
Art
s�an
d�Cr
afts
Div
e�To
wer
Fitn
ess/
Dan
ce
Food
��Caf
é/Co
nces
sion
s
Gym
nasi
um
Indo
or�Ic
e
Kitc
hen�
��Com
mer
cial
Kitc
hen�
��Kitc
hene
tte
Lobb
y/En
tryw
ay
Mul
ti�pu
rpos
e
Pool
,�Lap
Pool
,�Lei
sure
Pool
,�The
rapy
Reta
il/Pr
o�sh
op
Saun
a/st
eam
Wei
ght/
Card
io�E
quip
men
t
Bauer�Drive�Recreation�Center 8 1 1 1 1 4Black�Hill�Regional�Park�Visitor�Center 1 1Brookside�Gardens�Facility 4 2 2Brookside�Nature�Center 1 1Cabin�John�Ice�Rink 7 2 3 1 1Charles�W�Gilchrist�Ctr�for�Cultural�Diversity 5 1 4Clara�Barton�Neighborhood�Recreation�Center 4 1 1 2Damascus�Community�Recreation�Center 8 1 1 1 5Damascus�Senior�Center 4 1 3Down�County�Regional�Office 1 1East�County�Community�Recreation�Center 8 1 1 1 1 4East�County�Regional�Office 1 1Germantown�Indoor�Aquatics 12 1 1 3 2 1 2 1 1Germantown�Recreation�Center 8 1 1 1 1 4Good�Hope�Neighborhood�Recreation�Center 4 1 1 2Gwendolyn�E�Coffield�Recreation�Center 10 1 1 1 7Holiday�Park�Senior�Center 12 1 1 1 8 1Jane�E.�Lawton�(Leland)�Community�Rec�Center 6 1 1 1 3Locust�Grove�Nature�Center 1 1Long�Branch�Community�Recreation�Center 9 1 1 1 1 5Long�Branch�Senior�Center 1 1Longwood�Community�Recreation�Center 5 1 1 3Margaret�Schweinhaut�Senior�Center 7 1 1 5Marilyn�J.�Praisner�(Fairland)�Community�Rec�Ctr 9 1 1 1 1 5Martin�Luther�King�Jr.�Swim�Center 8 1 2 1 1 2 1Meadowside�Nature�Center 1 1Mid�County�Community�Recreation�Center 9 1 1 1 6Mid�County�Regional�Office 1 1
Page 1
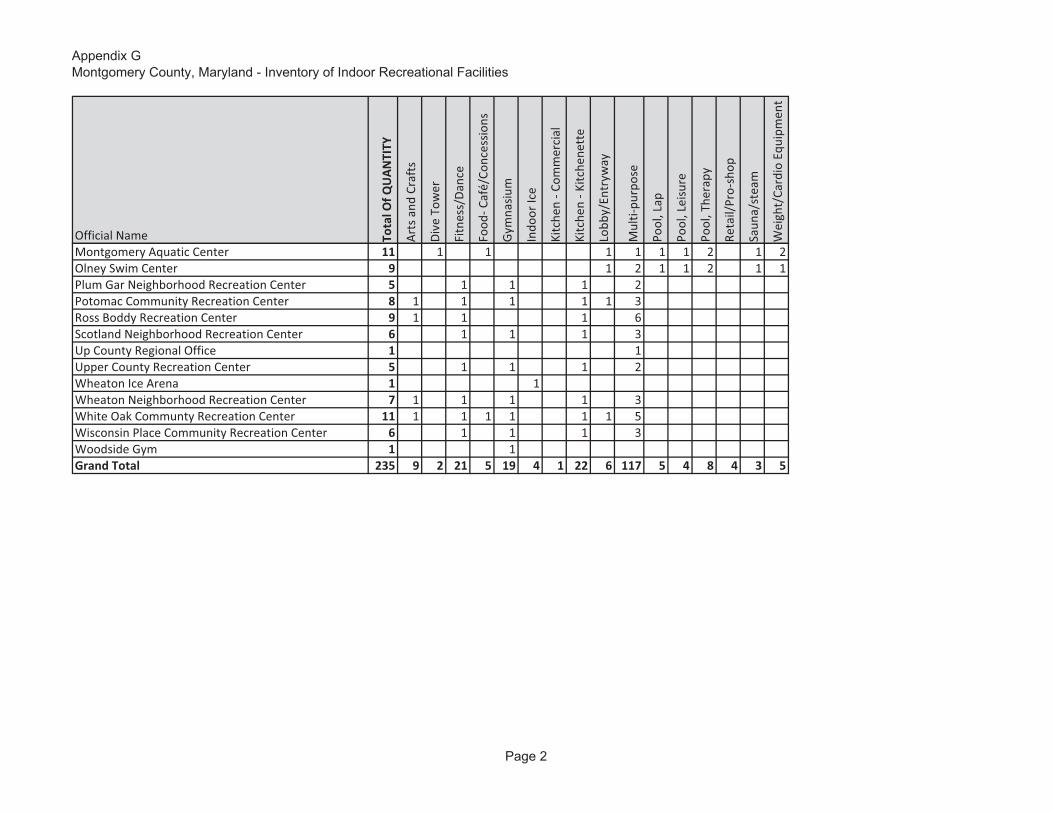
Appendix GMontgomery County, Maryland - Inventory of Indoor Recreational Facilities
Official�Name Tota
l�Of�Q
UA
NTI
TY
Art
s�an
d�Cr
afts
Div
e�To
wer
Fitn
ess/
Dan
ce
Food
��Caf
é/Co
nces
sion
s
Gym
nasi
um
Indo
or�Ic
e
Kitc
hen�
��Com
mer
cial
Kitc
hen�
��Kitc
hene
tte
Lobb
y/En
tryw
ay
Mul
ti�pu
rpos
e
Pool
,�Lap
Pool
,�Lei
sure
Pool
,�The
rapy
Reta
il/Pr
o�sh
op
Saun
a/st
eam
Wei
ght/
Card
io�E
quip
men
t
Montgomery�Aquatic�Center 11 1 1 1 1 1 1 2 1 2Olney�Swim�Center 9 1 2 1 1 2 1 1Plum�Gar�Neighborhood�Recreation�Center 5 1 1 1 2Potomac�Community�Recreation�Center 8 1 1 1 1 1 3Ross�Boddy�Recreation�Center 9 1 1 1 6Scotland�Neighborhood�Recreation�Center 6 1 1 1 3Up�County�Regional�Office 1 1Upper�County�Recreation�Center 5 1 1 1 2Wheaton�Ice�Arena 1 1Wheaton�Neighborhood�Recreation�Center 7 1 1 1 1 3White�Oak�Communty�Recreation�Center 11 1 1 1 1 1 1 5Wisconsin�Place�Community�Recreation�Center 6 1 1 1 3Woodside�Gym 1 1Grand�Total 235 9 2 21 5 19 4 1 22 6 117 5 4 8 4 3 5
Page 2
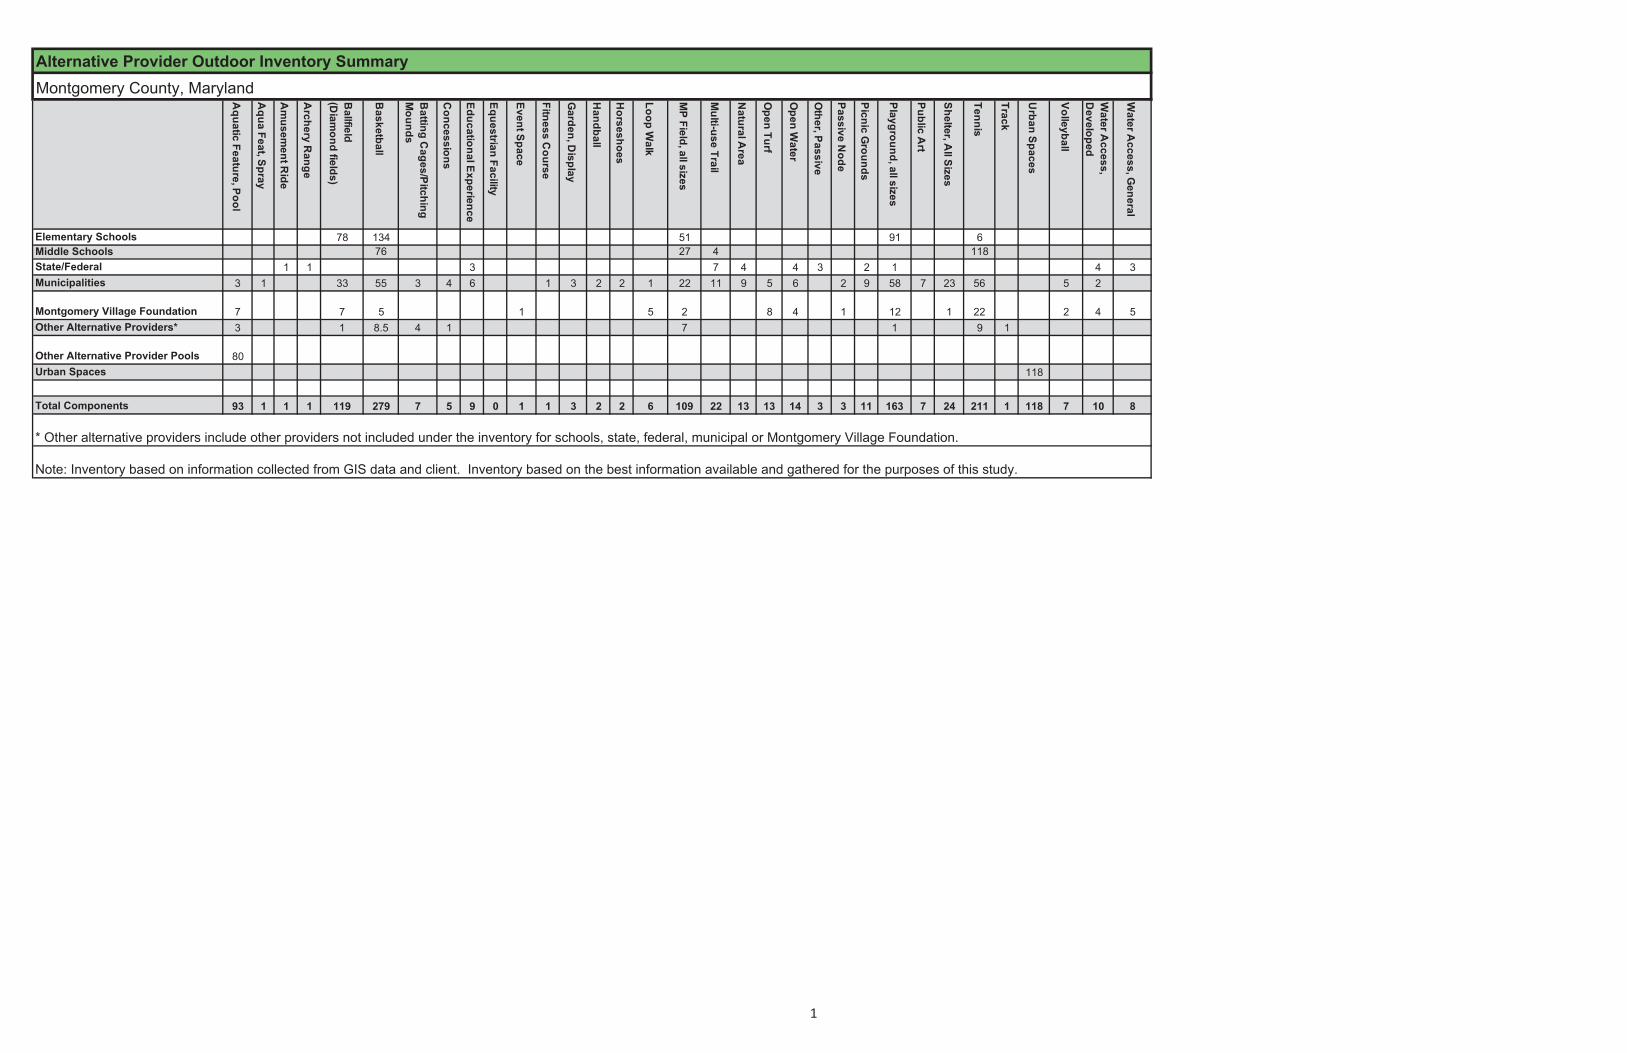
Aquatic Feature, Pool
Aqua Feat, Spray
Am
usement R
ide
Archery R
ange
Ballfield
(Diam
ond fields)
Basketball
Batting C
ages/Pitching M
ounds
Concessions
Educational Experience
Equestrian Facility
Event Space
Fitness Course
Garden, D
isplay
Handball
Horseshoes
Loop Walk
MP Field, all sizes
Multi-use Trail
Natural A
rea
Open Turf
Open W
ater
Other, Passive
Passive Node
Picnic Grounds
Playground, all sizes
Public Art
Shelter, All Sizes
Tennis
Track
Urban Spaces
Volleyball
Water A
ccess, D
eveloped
Water A
ccess, General
Elementary Schools 78 134 51 91 6Middle Schools 76 27 4 118State/Federal 1 1 3 7 4 4 3 2 1 4 3Municipalities 3 1 33 55 3 4 6 1 3 2 2 1 22 11 9 5 6 2 9 58 7 23 56 5 2
Montgomery Village Foundation 7 7 5 1 5 2 8 4 1 12 1 22 2 4 5Other Alternative Providers* 3 1 8.5 4 1 7 1 9 1
Other Alternative Provider Pools 80Urban Spaces 118
Total Components 93 1 1 1 119 279 7 5 9 0 1 1 3 2 2 6 109 22 13 13 14 3 3 11 163 7 24 211 1 118 7 10 8
* Other alternative providers include other providers not included under the inventory for schools, state, federal, municipal or Montgomery Village Foundation.
Note: Inventory based on information collected from GIS data and client. Inventory based on the best information available and gathered for the purposes of this study.
Alternative Provider Outdoor Inventory SummaryMontgomery County, Maryland
1
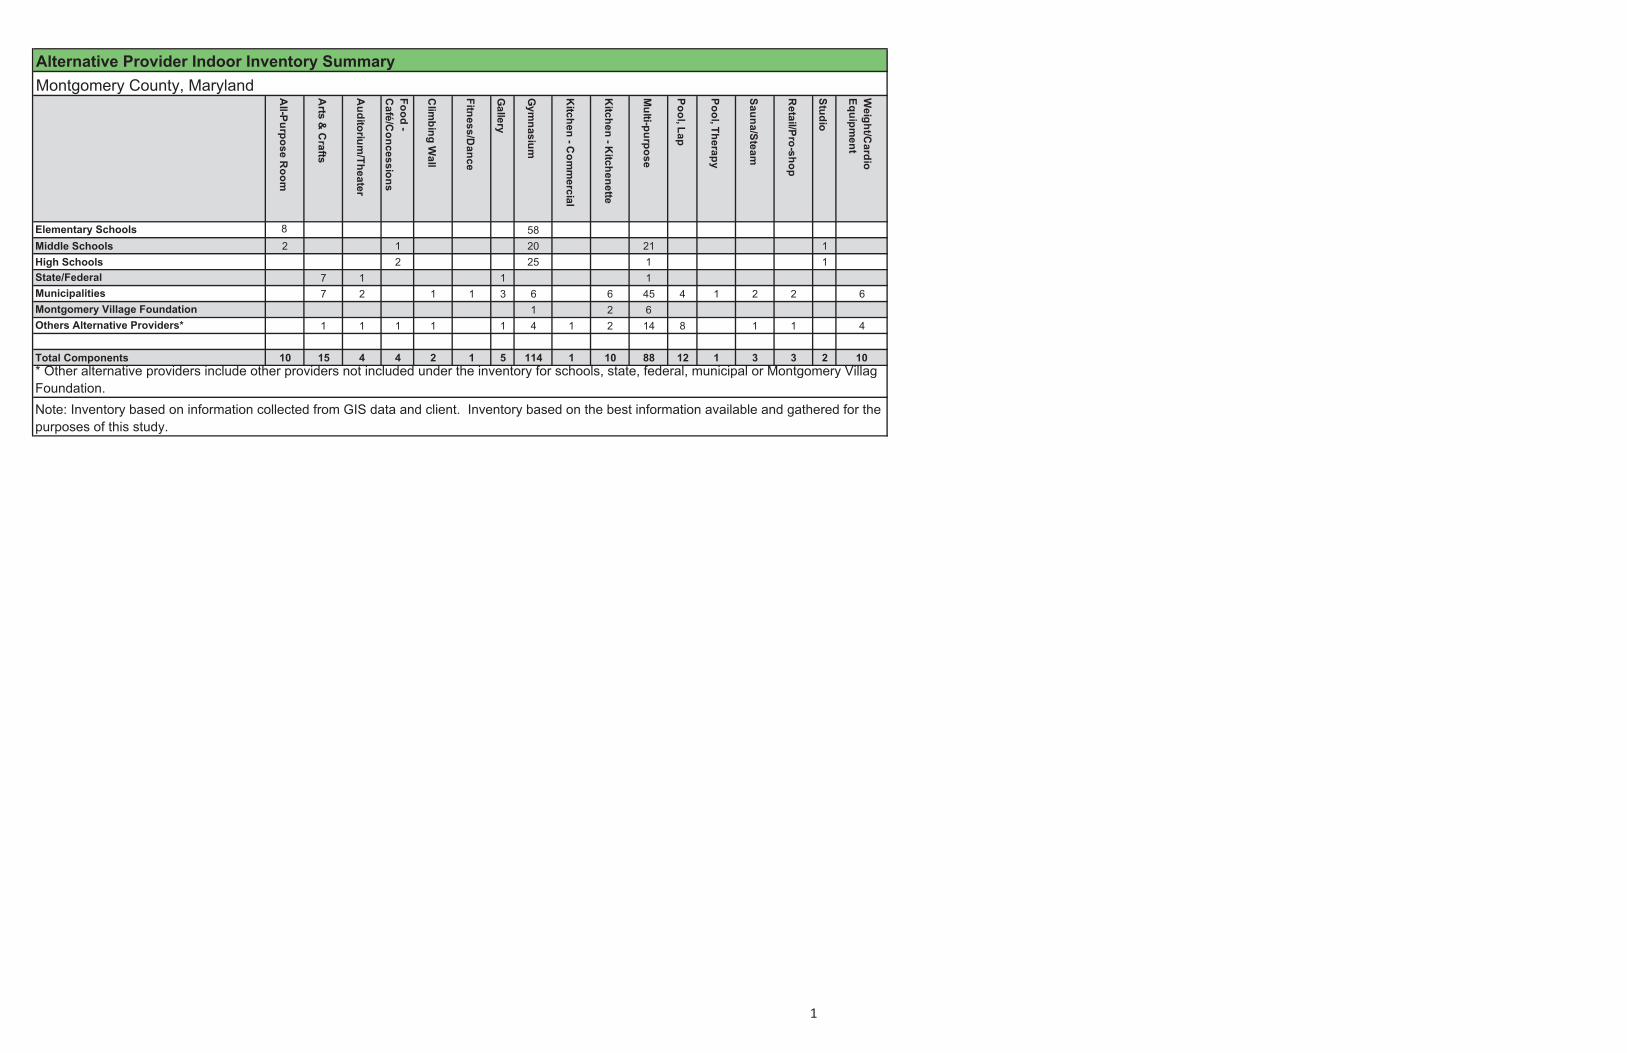
All-Purpose R
oom
Arts &
Crafts
Auditorium
/Theater
Food - C
afé/Concessions
Clim
bing Wall
Fitness/Dance
Gallery
Gym
nasium
Kitchen - C
omm
ercial
Kitchen - K
itchenette
Multi-purpose
Pool, Lap
Pool, Therapy
Sauna/Steam
Retail/Pro-shop
Studio
Weight/C
ardio Equipm
ent
Elementary Schools 8 58Middle Schools 2 1 20 21 1High Schools 2 25 1 1State/Federal 7 1 1 1Municipalities 7 2 1 1 3 6 6 45 4 1 2 2 6Montgomery Village Foundation 1 2 6Others Alternative Providers* 1 1 1 1 1 4 1 2 14 8 1 1 4
Total Components 10 15 4 4 2 1 5 114 1 10 88 12 1 3 3 2 10
Alternative Provider Indoor Inventory SummaryMontgomery County, Maryland
* Other alternative providers include other providers not included under the inventory for schools, state, federal, municipal or Montgomery VillagFoundation.Note: Inventory based on information collected from GIS data and client. Inventory based on the best information available and gathered for the purposes of this study.
1
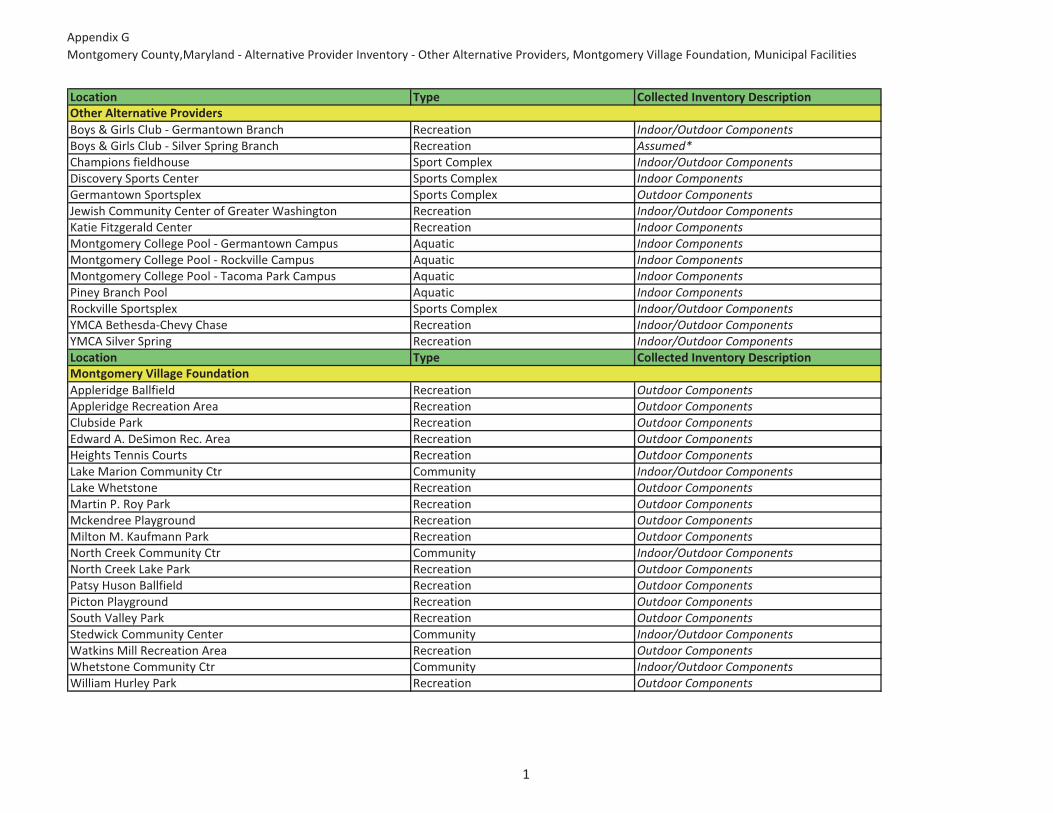
Appendix�GMontgomery�County,Maryland���Alternative�Provider�Inventory���Other�Alternative�Providers,�Montgomery�Village�Foundation,�Municipal�Facilities
Location Type Collected�Inventory�Description
Boys�&�Girls�Club���Germantown�Branch Recreation Indoor/Outdoor�ComponentsBoys�&�Girls�Club���Silver�Spring�Branch Recreation Assumed*Champions�fieldhouse Sport�Complex Indoor/Outdoor�ComponentsDiscovery�Sports�Center Sports�Complex Indoor�ComponentsGermantown�Sportsplex Sports�Complex Outdoor�ComponentsJewish�Community�Center�of�Greater�Washington Recreation Indoor/Outdoor�ComponentsKatie�Fitzgerald�Center Recreation Indoor�ComponentsMontgomery�College�Pool���Germantown�Campus Aquatic Indoor�ComponentsMontgomery�College�Pool���Rockville�Campus Aquatic Indoor�ComponentsMontgomery�College�Pool���Tacoma�Park�Campus Aquatic Indoor�ComponentsPiney�Branch�Pool Aquatic Indoor�ComponentsRockville�Sportsplex Sports�Complex Indoor/Outdoor�ComponentsYMCA�Bethesda�Chevy�Chase Recreation Indoor/Outdoor�ComponentsYMCA�Silver�Spring Recreation Indoor/Outdoor�ComponentsLocation Type Collected�Inventory�Description
Appleridge�Ballfield� Recreation Outdoor�ComponentsAppleridge�Recreation�Area Recreation Outdoor�ComponentsClubside�Park� Recreation Outdoor�ComponentsEdward�A.�DeSimon�Rec.�Area� Recreation Outdoor�ComponentsHeights Tennis Courts Recreation Outdoor Components
Montgomery�Village�Foundation
Other�Alternative�Providers�
Heights�Tennis�Courts�� Recreation Outdoor�ComponentsLake�Marion�Community�Ctr Community Indoor/Outdoor�ComponentsLake�Whetstone� Recreation Outdoor�ComponentsMartin�P.�Roy�Park�� Recreation Outdoor�ComponentsMckendree�Playground�� Recreation Outdoor�ComponentsMilton�M.�Kaufmann�Park�� Recreation Outdoor�ComponentsNorth�Creek�Community�Ctr Community Indoor/Outdoor�ComponentsNorth�Creek�Lake�Park�� Recreation Outdoor�ComponentsPatsy�Huson�Ballfield�� Recreation Outdoor�ComponentsPicton�Playground� Recreation Outdoor�ComponentsSouth�Valley�Park Recreation Outdoor�ComponentsStedwick�Community�Center Community Indoor/Outdoor�ComponentsWatkins�Mill�Recreation�Area� Recreation Outdoor�ComponentsWhetstone�Community�Ctr� Community Indoor/Outdoor�ComponentsWilliam�Hurley�Park�� Recreation Outdoor�Components
1
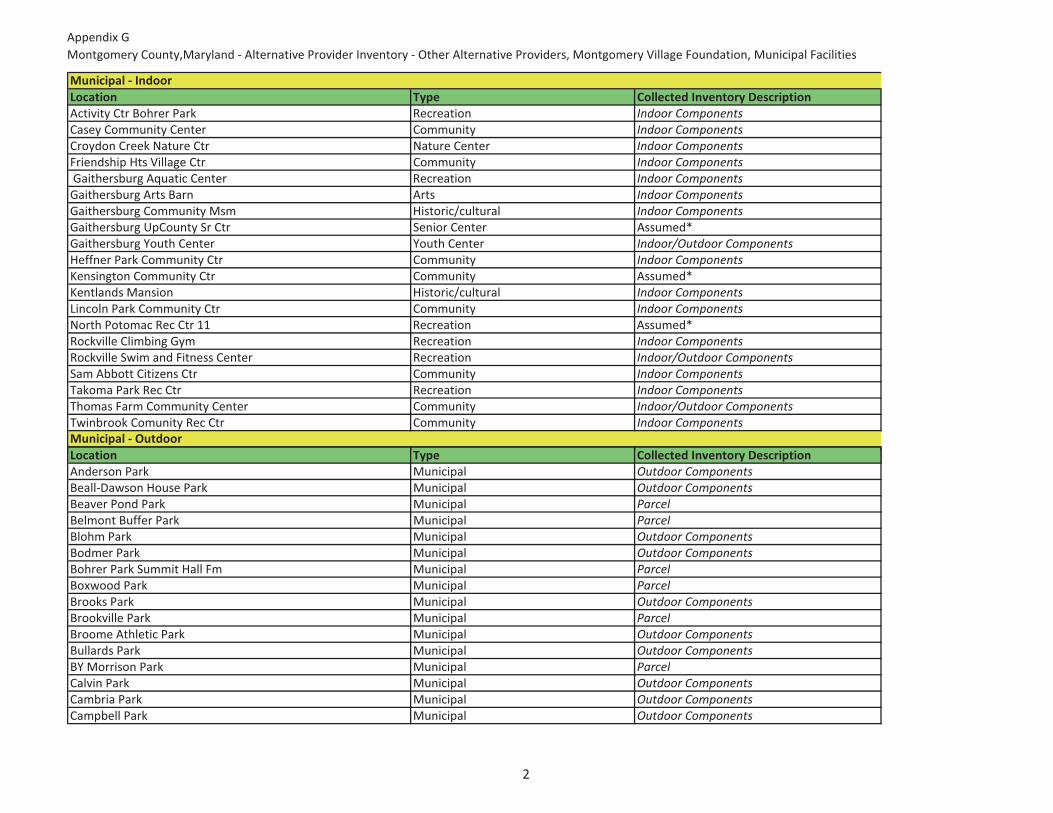
Appendix�GMontgomery�County,Maryland���Alternative�Provider�Inventory���Other�Alternative�Providers,�Montgomery�Village�Foundation,�Municipal�Facilities
Location Type Collected�Inventory�DescriptionActivity�Ctr�Bohrer�Park Recreation Indoor�ComponentsCasey�Community�Center Community Indoor�ComponentsCroydon�Creek�Nature�Ctr Nature�Center Indoor�ComponentsFriendship�Hts�Village�Ctr Community Indoor�Components�Gaithersburg�Aquatic�Center Recreation Indoor�ComponentsGaithersburg�Arts�Barn Arts Indoor�ComponentsGaithersburg�Community�Msm Historic/cultural Indoor�ComponentsGaithersburg�UpCounty�Sr�Ctr Senior�Center Assumed*Gaithersburg�Youth�Center Youth�Center Indoor/Outdoor�ComponentsHeffner�Park�Community�Ctr Community Indoor�ComponentsKensington�Community�Ctr Community Assumed*Kentlands�Mansion Historic/cultural Indoor�ComponentsLincoln�Park�Community�Ctr Community Indoor�ComponentsNorth�Potomac�Rec�Ctr�11 Recreation Assumed*Rockville�Climbing�Gym Recreation Indoor�ComponentsRockville�Swim�and�Fitness�Center Recreation Indoor/Outdoor�ComponentsSam�Abbott�Citizens�Ctr Community Indoor�ComponentsTakoma�Park�Rec�Ctr Recreation Indoor�ComponentsThomas�Farm�Community�Center Community Indoor/Outdoor�ComponentsTwinbrook�Comunity�Rec�Ctr Community Indoor�Components
Location Type Collected Inventory Description
Municipal���Indoor
Municipal���OutdoorLocation Type Collected�Inventory�DescriptionAnderson�Park Municipal Outdoor�ComponentsBeall�Dawson�House�Park Municipal Outdoor�ComponentsBeaver�Pond�Park Municipal ParcelBelmont�Buffer�Park Municipal ParcelBlohm�Park Municipal Outdoor�ComponentsBodmer�Park Municipal Outdoor�ComponentsBohrer�Park�Summit�Hall�Fm Municipal ParcelBoxwood�Park Municipal ParcelBrooks�Park Municipal Outdoor�ComponentsBrookville�Park Municipal ParcelBroome�Athletic�Park Municipal Outdoor�ComponentsBullards�Park Municipal Outdoor�ComponentsBY�Morrison�Park Municipal ParcelCalvin�Park Municipal Outdoor�ComponentsCambria�Park Municipal Outdoor�ComponentsCampbell�Park Municipal Outdoor�Components
2
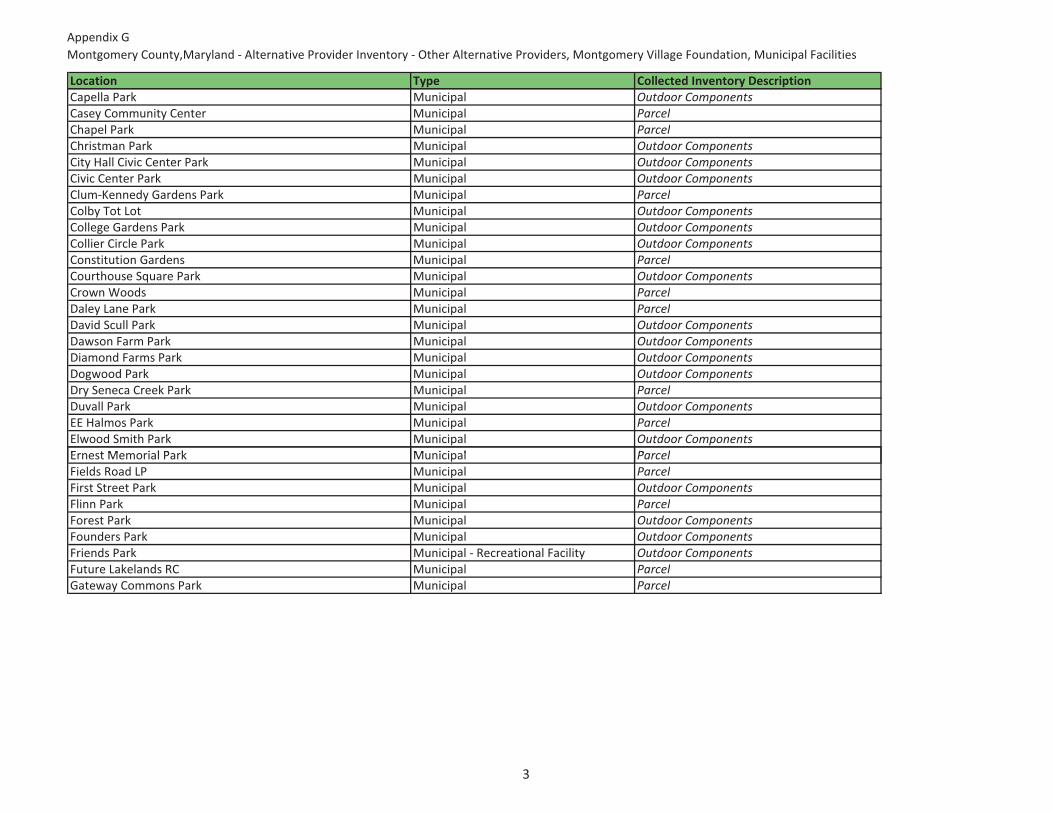
Appendix�GMontgomery�County,Maryland���Alternative�Provider�Inventory���Other�Alternative�Providers,�Montgomery�Village�Foundation,�Municipal�Facilities
Location Type Collected�Inventory�DescriptionCapella�Park Municipal Outdoor�ComponentsCasey�Community�Center Municipal ParcelChapel�Park Municipal ParcelChristman�Park Municipal Outdoor�ComponentsCity�Hall�Civic�Center�Park Municipal Outdoor�ComponentsCivic�Center�Park Municipal Outdoor�ComponentsClum�Kennedy�Gardens�Park Municipal ParcelColby�Tot�Lot Municipal Outdoor�ComponentsCollege�Gardens�Park Municipal Outdoor�ComponentsCollier�Circle�Park Municipal Outdoor�ComponentsConstitution�Gardens Municipal ParcelCourthouse�Square�Park Municipal Outdoor�ComponentsCrown�Woods Municipal ParcelDaley�Lane�Park Municipal ParcelDavid�Scull�Park Municipal Outdoor�ComponentsDawson�Farm�Park Municipal Outdoor�ComponentsDiamond�Farms�Park Municipal Outdoor�ComponentsDogwood�Park Municipal Outdoor�ComponentsDry�Seneca�Creek�Park Municipal ParcelDuvall�Park Municipal Outdoor�ComponentsEE�Halmos�Park Municipal ParcelElwood�Smith�Park Municipal Outdoor�ComponentsErnest Memorial Park Municipal ParcelErnest�Memorial�Park Municipal ParcelFields�Road�LP Municipal ParcelFirst�Street�Park Municipal Outdoor�ComponentsFlinn�Park Municipal ParcelForest�Park Municipal Outdoor�ComponentsFounders�Park Municipal Outdoor�ComponentsFriends�Park Municipal���Recreational�Facility Outdoor�ComponentsFuture�Lakelands�RC Municipal ParcelGateway�Commons�Park Municipal Parcel
3
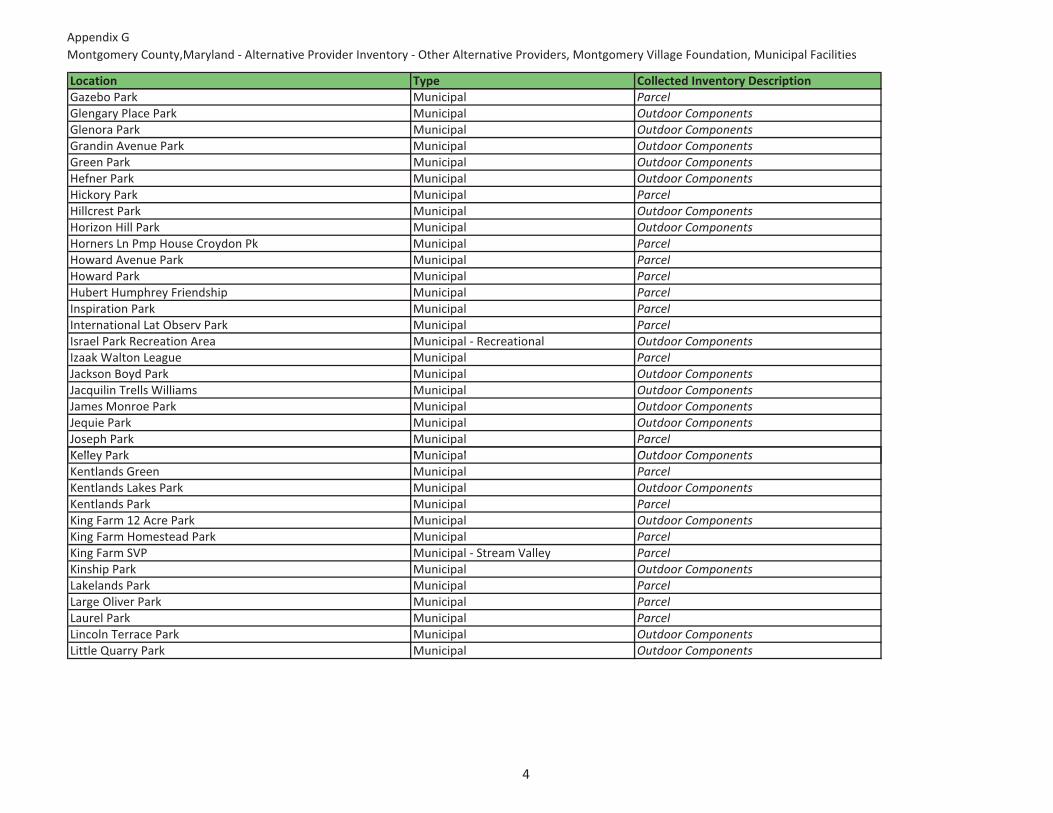
Appendix�GMontgomery�County,Maryland���Alternative�Provider�Inventory���Other�Alternative�Providers,�Montgomery�Village�Foundation,�Municipal�Facilities
Location Type Collected�Inventory�DescriptionGazebo�Park Municipal ParcelGlengary�Place�Park Municipal Outdoor�ComponentsGlenora�Park Municipal Outdoor�ComponentsGrandin�Avenue�Park Municipal Outdoor�ComponentsGreen�Park Municipal Outdoor�ComponentsHefner�Park Municipal Outdoor�ComponentsHickory�Park Municipal ParcelHillcrest�Park Municipal Outdoor�ComponentsHorizon�Hill�Park Municipal Outdoor�ComponentsHorners�Ln�Pmp�House�Croydon�Pk Municipal ParcelHoward�Avenue�Park Municipal ParcelHoward�Park Municipal ParcelHubert�Humphrey�Friendship Municipal ParcelInspiration�Park Municipal ParcelInternational�Lat�Observ�Park Municipal ParcelIsrael�Park�Recreation�Area Municipal���Recreational Outdoor�ComponentsIzaak�Walton�League Municipal ParcelJackson�Boyd�Park Municipal Outdoor�ComponentsJacquilin�Trells�Williams Municipal Outdoor�ComponentsJames�Monroe�Park Municipal Outdoor�ComponentsJequie�Park Municipal Outdoor�ComponentsJoseph�Park Municipal ParcelKelley Park Municipal Outdoor ComponentsKelley�Park Municipal Outdoor�ComponentsKentlands�Green Municipal ParcelKentlands�Lakes�Park Municipal Outdoor�ComponentsKentlands�Park Municipal ParcelKing�Farm�12�Acre�Park Municipal Outdoor�ComponentsKing�Farm�Homestead�Park Municipal ParcelKing�Farm�SVP Municipal���Stream�Valley ParcelKinship�Park Municipal Outdoor�ComponentsLakelands�Park Municipal ParcelLarge�Oliver�Park Municipal ParcelLaurel�Park Municipal ParcelLincoln�Terrace�Park Municipal Outdoor�ComponentsLittle�Quarry�Park Municipal Outdoor�Components
4
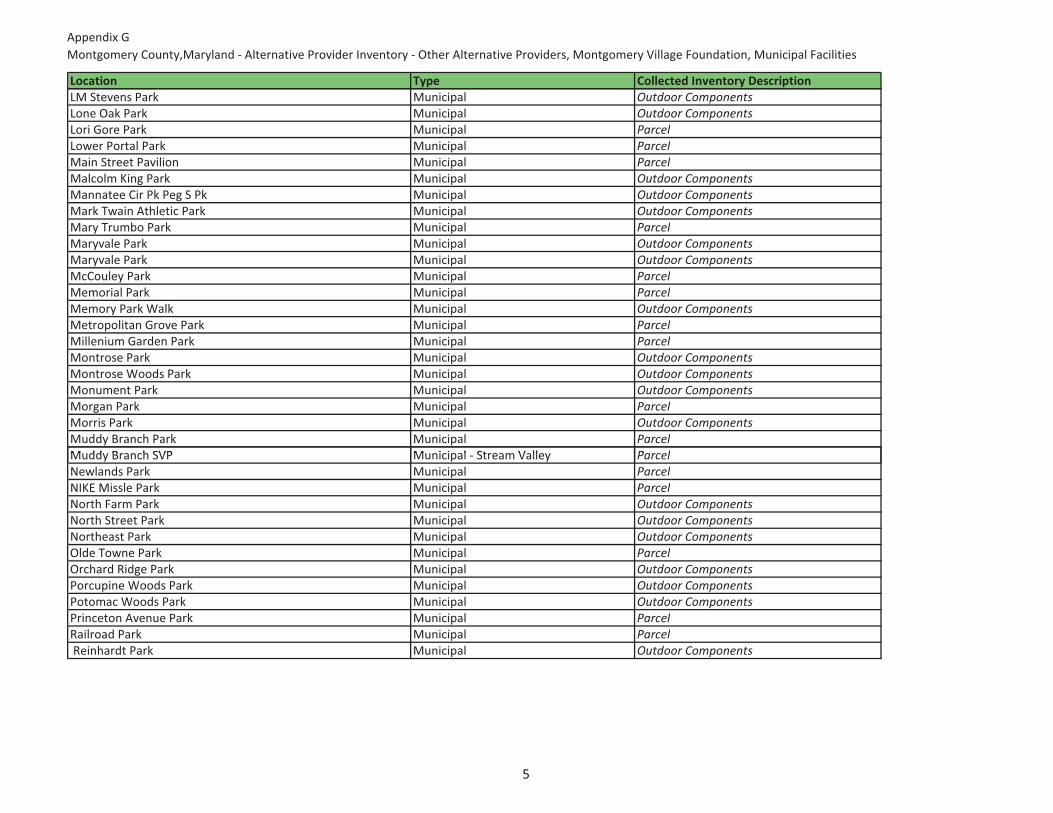
Appendix�GMontgomery�County,Maryland���Alternative�Provider�Inventory���Other�Alternative�Providers,�Montgomery�Village�Foundation,�Municipal�Facilities
Location Type Collected�Inventory�DescriptionLM�Stevens�Park Municipal Outdoor�ComponentsLone�Oak�Park Municipal Outdoor�ComponentsLori�Gore�Park Municipal ParcelLower�Portal�Park Municipal ParcelMain�Street�Pavilion Municipal ParcelMalcolm�King�Park Municipal Outdoor�ComponentsMannatee�Cir�Pk�Peg�S�Pk Municipal Outdoor�ComponentsMark�Twain�Athletic�Park Municipal Outdoor�ComponentsMary�Trumbo�Park Municipal ParcelMaryvale�Park Municipal Outdoor�ComponentsMaryvale�Park Municipal Outdoor�ComponentsMcCouley�Park Municipal ParcelMemorial�Park Municipal ParcelMemory�Park�Walk Municipal Outdoor�ComponentsMetropolitan�Grove�Park Municipal ParcelMillenium�Garden�Park Municipal ParcelMontrose�Park Municipal Outdoor�ComponentsMontrose�Woods�Park Municipal Outdoor�ComponentsMonument�Park Municipal Outdoor�ComponentsMorgan�Park Municipal ParcelMorris�Park Municipal Outdoor�ComponentsMuddy�Branch�Park Municipal ParcelMuddy Branch SVP Municipal Stream Valley ParcelMuddy�Branch�SVP Municipal���Stream�Valley ParcelNewlands�Park Municipal ParcelNIKE�Missle�Park Municipal ParcelNorth�Farm�Park Municipal Outdoor�ComponentsNorth�Street�Park Municipal Outdoor�ComponentsNortheast�Park Municipal Outdoor�ComponentsOlde�Towne�Park Municipal ParcelOrchard�Ridge�Park Municipal Outdoor�ComponentsPorcupine�Woods�Park Municipal Outdoor�ComponentsPotomac�Woods�Park Municipal Outdoor�ComponentsPrinceton�Avenue�Park Municipal ParcelRailroad�Park Municipal Parcel�Reinhardt�Park Municipal Outdoor�Components
5
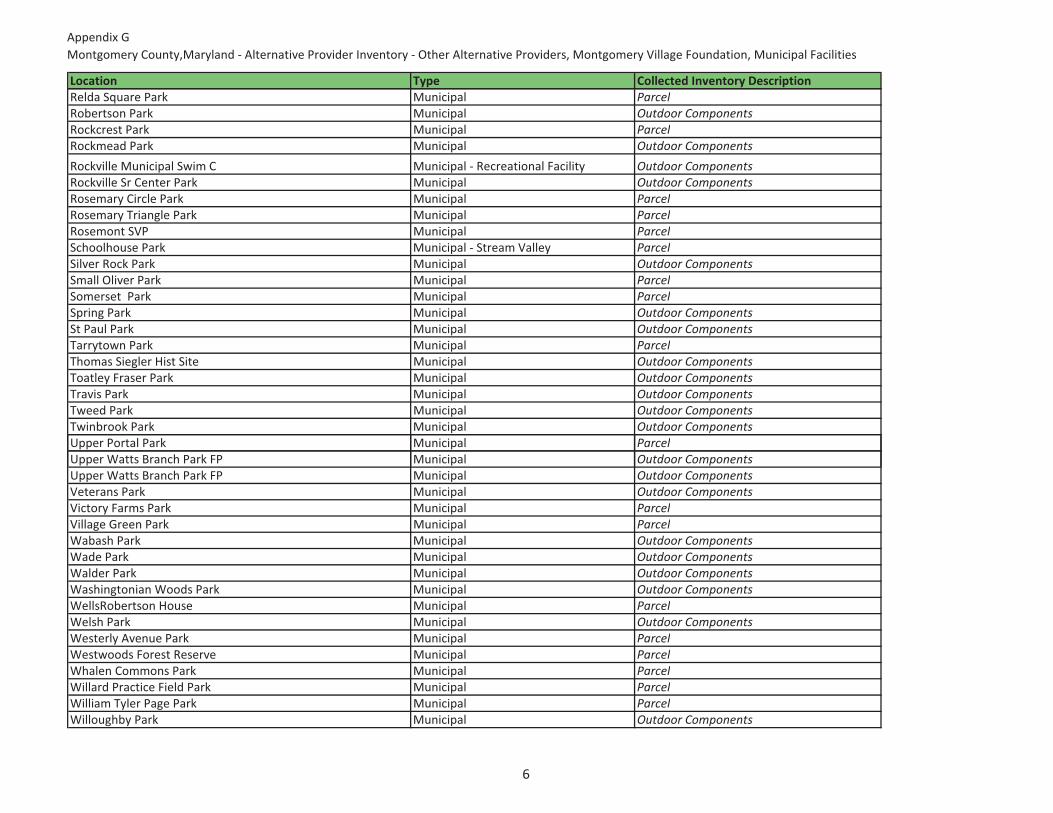
Appendix�GMontgomery�County,Maryland���Alternative�Provider�Inventory���Other�Alternative�Providers,�Montgomery�Village�Foundation,�Municipal�Facilities
Location Type Collected�Inventory�DescriptionRelda�Square�Park Municipal ParcelRobertson�Park Municipal Outdoor�ComponentsRockcrest�Park Municipal ParcelRockmead�Park Municipal Outdoor�Components
Rockville�Municipal�Swim�C Municipal���Recreational�Facility Outdoor�ComponentsRockville�Sr�Center�Park Municipal Outdoor�ComponentsRosemary�Circle�Park Municipal ParcelRosemary�Triangle�Park Municipal ParcelRosemont�SVP Municipal ParcelSchoolhouse�Park Municipal���Stream�Valley ParcelSilver�Rock�Park Municipal Outdoor�ComponentsSmall�Oliver�Park Municipal ParcelSomerset��Park Municipal ParcelSpring�Park Municipal Outdoor�ComponentsSt�Paul�Park Municipal Outdoor�ComponentsTarrytown�Park Municipal ParcelThomas�Siegler�Hist�Site Municipal Outdoor�ComponentsToatley�Fraser�Park Municipal Outdoor�ComponentsTravis�Park Municipal Outdoor�ComponentsTweed�Park Municipal Outdoor�ComponentsTwinbrook�Park Municipal Outdoor�ComponentsUpper�Portal�Park Municipal ParcelUpper�Watts�Branch�Park�FP Municipal Outdoor�ComponentsUpper�Watts�Branch�Park�FP Municipal Outdoor�ComponentsVeterans�Park Municipal Outdoor�ComponentsVictory�Farms�Park Municipal ParcelVillage�Green�Park Municipal ParcelWabash�Park Municipal Outdoor�ComponentsWade�Park Municipal Outdoor�ComponentsWalder�Park Municipal Outdoor�ComponentsWashingtonian�Woods�Park Municipal Outdoor�ComponentsWellsRobertson�House Municipal ParcelWelsh�Park Municipal Outdoor�ComponentsWesterly�Avenue�Park Municipal ParcelWestwoods�Forest�Reserve Municipal ParcelWhalen�Commons�Park Municipal ParcelWillard�Practice�Field�Park Municipal ParcelWilliam�Tyler�Page�Park Municipal ParcelWilloughby�Park Municipal Outdoor�Components
6

Appendix�GMontgomery�County,Maryland���Alternative�Provider�Inventory���Other�Alternative�Providers,�Montgomery�Village�Foundation,�Municipal�Facilities
Location Type Collected�Inventory�DescriptionWoodley�Gardens�Park Municipal Outdoor�ComponentsWoodward�Park Municipal ParcelWootten�Heights�Park Municipal Outdoor�ComponentsWoottons�Mill�Park Municipal Outdoor�ComponentsYeandle�Park Municipal ParcelZimmerman�Park Municipal ParcelZoe�Wadsworth�Park Municipal Parcel
*If�no�component�information�given�to�Design�Concepts�(indicated�by�Assumed),�each�indoor�facility�will�assumed�to�have�at�least�1�component.
7
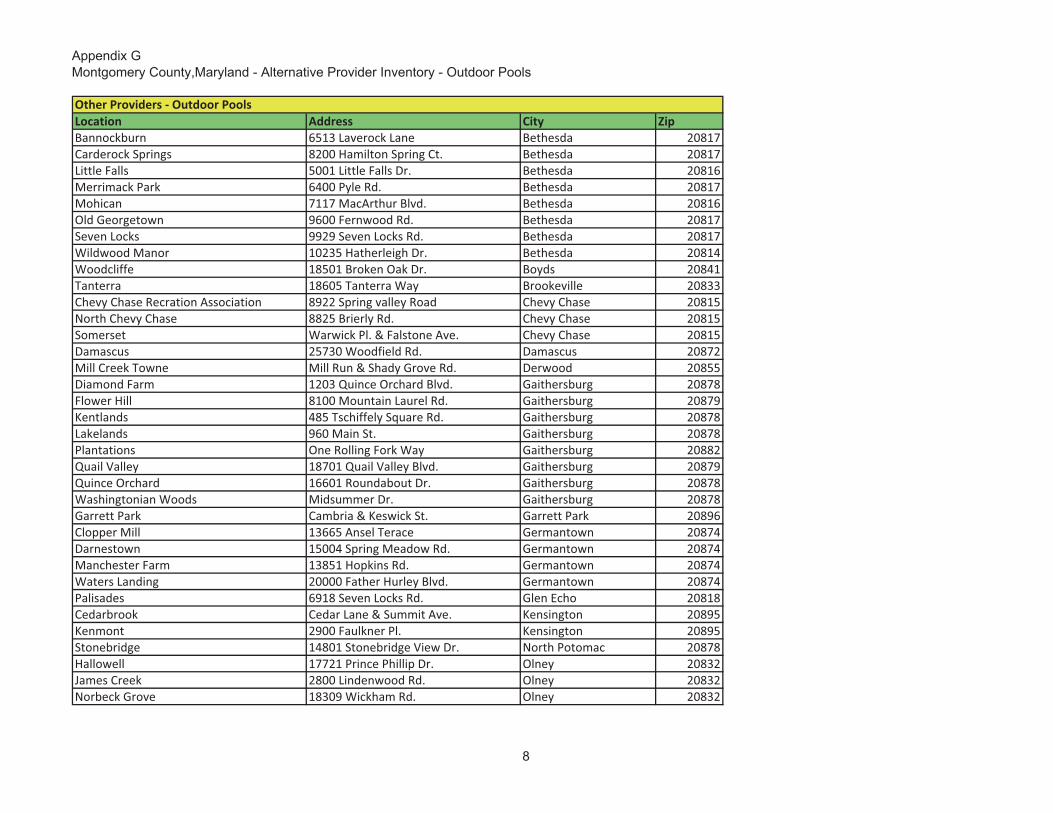
Appendix GMontgomery County,Maryland - Alternative Provider Inventory - Outdoor Pools
Location Address City ZipBannockburn 6513�Laverock�Lane Bethesda 20817Carderock�Springs 8200�Hamilton�Spring�Ct. Bethesda 20817Little�Falls� 5001�Little�Falls�Dr. Bethesda 20816Merrimack�Park 6400�Pyle�Rd. Bethesda 20817Mohican 7117�MacArthur�Blvd. Bethesda 20816Old�Georgetown 9600�Fernwood�Rd. Bethesda 20817Seven�Locks 9929�Seven�Locks�Rd. Bethesda 20817Wildwood�Manor 10235�Hatherleigh�Dr. Bethesda 20814Woodcliffe 18501�Broken�Oak�Dr. Boyds 20841Tanterra 18605�Tanterra�Way Brookeville 20833Chevy�Chase�Recration�Association 8922�Spring�valley�Road Chevy�Chase� 20815North�Chevy�Chase 8825�Brierly�Rd. Chevy�Chase� 20815Somerset Warwick�Pl.�&�Falstone�Ave. Chevy�Chase� 20815Damascus 25730�Woodfield�Rd. Damascus 20872Mill�Creek�Towne Mill�Run�&�Shady�Grove�Rd. Derwood 20855Diamond�Farm 1203�Quince�Orchard�Blvd. Gaithersburg 20878Flower�Hill 8100�Mountain�Laurel�Rd. Gaithersburg 20879Kentlands 485�Tschiffely�Square�Rd. Gaithersburg 20878Lakelands 960�Main�St. Gaithersburg 20878Plantations One�Rolling�Fork�Way Gaithersburg 20882Quail�Valley 18701�Quail�Valley�Blvd. Gaithersburg 20879Quince�Orchard 16601�Roundabout�Dr. Gaithersburg 20878Washingtonian�Woods Midsummer�Dr. Gaithersburg 20878Garrett�Park Cambria�&�Keswick�St. Garrett�Park 20896Clopper�Mill 13665�Ansel�Terace Germantown 20874Darnestown 15004�Spring�Meadow�Rd. Germantown 20874Manchester�Farm 13851�Hopkins�Rd. Germantown 20874Waters�Landing 20000�Father�Hurley�Blvd. Germantown 20874Palisades 6918�Seven�Locks�Rd. Glen�Echo 20818Cedarbrook Cedar�Lane�&�Summit�Ave. Kensington 20895Kenmont 2900�Faulkner�Pl. Kensington 20895Stonebridge 14801�Stonebridge�View�Dr. North�Potomac 20878Hallowell 17721�Prince�Phillip�Dr. Olney 20832James�Creek 2800�Lindenwood�Rd. Olney 20832Norbeck�Grove 18309�Wickham�Rd. Olney 20832
Other�Providers���Outdoor�Pools
8
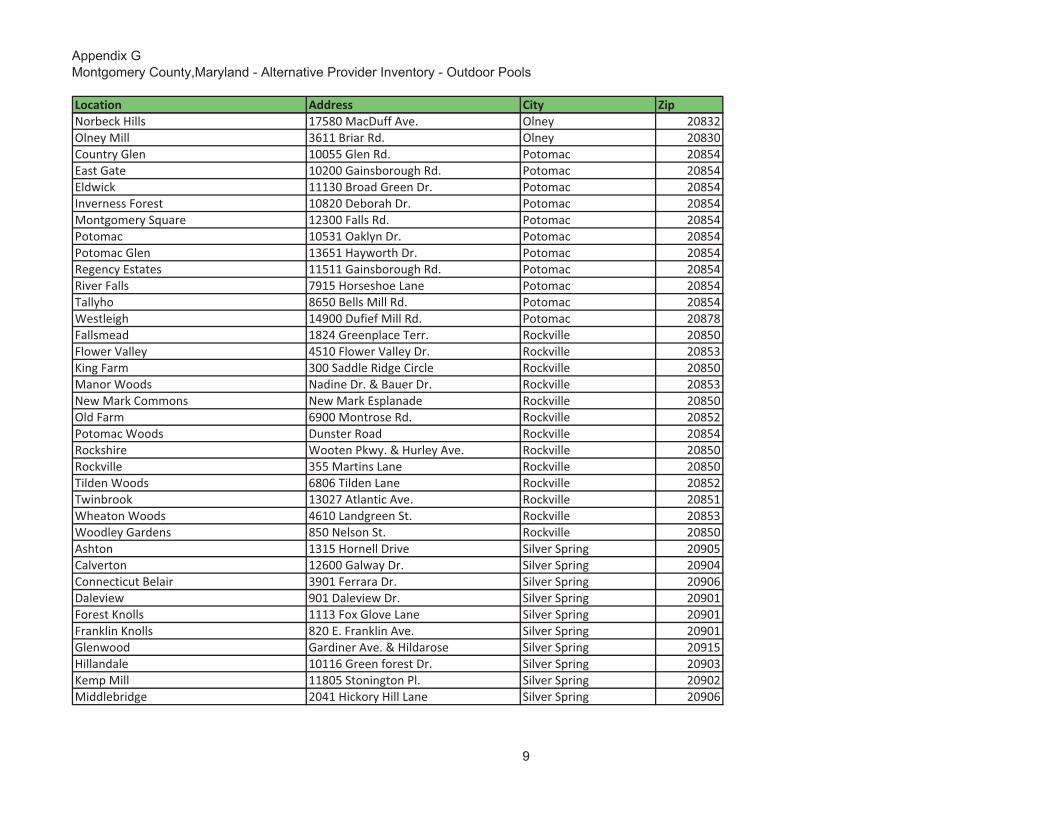
Appendix GMontgomery County,Maryland - Alternative Provider Inventory - Outdoor Pools
Location Address City ZipNorbeck�Hills 17580�MacDuff�Ave. Olney 20832Olney�Mill� 3611�Briar�Rd.� Olney 20830Country�Glen 10055�Glen�Rd. Potomac 20854East�Gate 10200�Gainsborough�Rd. Potomac 20854Eldwick 11130�Broad�Green�Dr. Potomac 20854Inverness�Forest� 10820�Deborah�Dr. Potomac 20854Montgomery�Square 12300�Falls�Rd.� Potomac 20854Potomac 10531�Oaklyn�Dr. Potomac 20854Potomac�Glen 13651�Hayworth�Dr. Potomac 20854Regency�Estates 11511�Gainsborough�Rd. Potomac 20854River�Falls 7915�Horseshoe�Lane Potomac 20854Tallyho 8650�Bells�Mill�Rd. Potomac 20854Westleigh 14900�Dufief�Mill�Rd. Potomac 20878Fallsmead 1824�Greenplace�Terr. Rockville 20850Flower�Valley 4510�Flower�Valley�Dr. Rockville 20853King�Farm� 300�Saddle�Ridge�Circle� Rockville 20850Manor�Woods Nadine�Dr.�&�Bauer�Dr. Rockville 20853New�Mark�Commons� New�Mark�Esplanade Rockville 20850Old�Farm 6900�Montrose�Rd. Rockville 20852Potomac�Woods Dunster�Road Rockville 20854Rockshire Wooten�Pkwy.�&�Hurley�Ave. Rockville 20850Rockville 355�Martins�Lane Rockville 20850Tilden�Woods 6806�Tilden�Lane Rockville 20852Twinbrook 13027�Atlantic�Ave. Rockville 20851Wheaton�Woods 4610�Landgreen�St. Rockville 20853Woodley�Gardens 850�Nelson�St. Rockville 20850Ashton 1315�Hornell�Drive Silver�Spring� 20905Calverton 12600�Galway�Dr. Silver�Spring� 20904Connecticut�Belair 3901�Ferrara�Dr. Silver�Spring� 20906Daleview 901�Daleview�Dr. Silver�Spring� 20901Forest�Knolls 1113�Fox�Glove�Lane Silver�Spring� 20901Franklin�Knolls 820�E.�Franklin�Ave. Silver�Spring� 20901Glenwood Gardiner�Ave.�&�Hildarose Silver�Spring� 20915Hillandale� 10116�Green�forest�Dr. Silver�Spring� 20903Kemp�Mill 11805�Stonington�Pl. Silver�Spring� 20902Middlebridge 2041�Hickory�Hill�Lane Silver�Spring� 20906
9
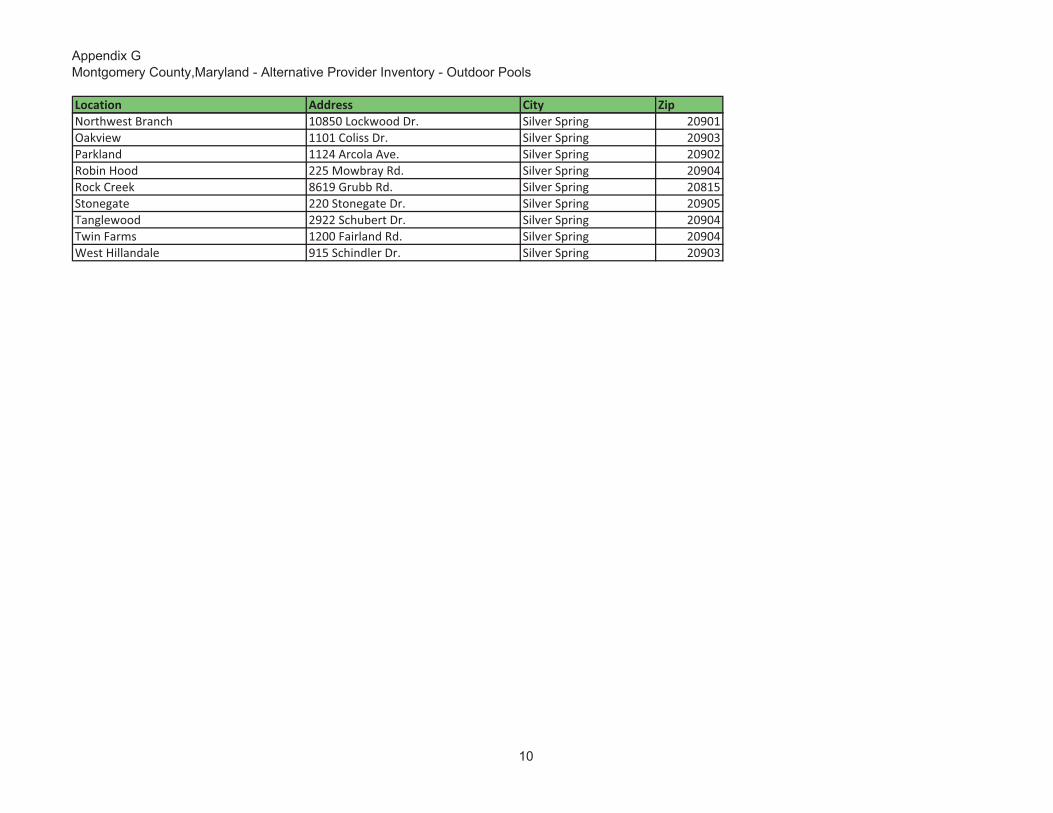
Appendix GMontgomery County,Maryland - Alternative Provider Inventory - Outdoor Pools
Location Address City ZipNorthwest�Branch 10850�Lockwood�Dr.� Silver�Spring� 20901Oakview 1101�Coliss�Dr. Silver�Spring� 20903Parkland 1124�Arcola�Ave. Silver�Spring� 20902Robin�Hood 225�Mowbray�Rd. Silver�Spring� 20904Rock�Creek 8619�Grubb�Rd.� Silver�Spring� 20815Stonegate 220�Stonegate�Dr. Silver�Spring� 20905Tanglewood 2922�Schubert�Dr. Silver�Spring� 20904Twin�Farms 1200�Fairland�Rd. Silver�Spring� 20904West�Hillandale 915�Schindler�Dr. Silver�Spring� 20903
10
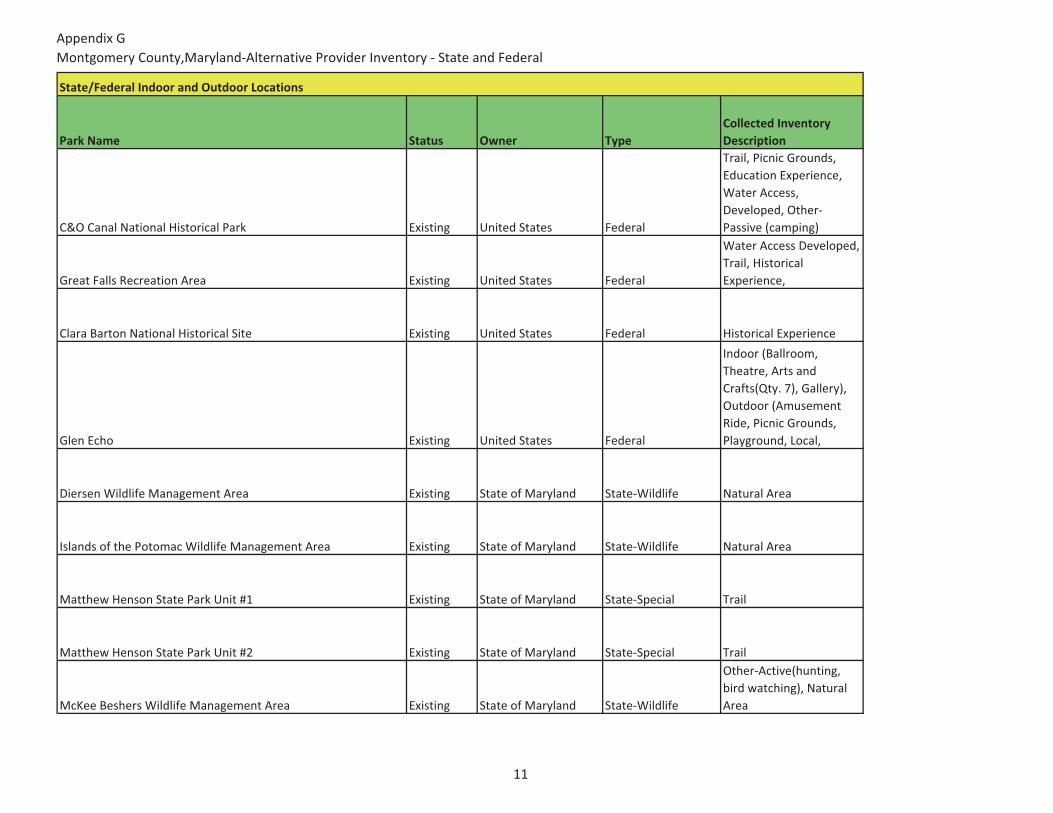
Appendix�GMontgomery�County,Maryland�Alternative�Provider�Inventory���State�and�Federal
Park�Name Status Owner TypeCollected�Inventory�Description
C&O�Canal�National�Historical�Park Existing United�States Federal
Trail,�Picnic�Grounds,�Education�Experience,�Water�Access,�Developed,�Other�Passive�(camping)
Great�Falls�Recreation�Area Existing United�States Federal
Water�Access�Developed,�Trail,�Historical�Experience,�
Clara�Barton�National�Historical�Site Existing United�States Federal Historical�Experience
Glen�Echo Existing United�States Federal
Indoor�(Ballroom,�Theatre,�Arts�and�Crafts(Qty.�7),�Gallery),�Outdoor�(Amusement�Ride,�Picnic�Grounds,�Playground,�Local,�
Diersen�Wildlife�Management�Area Existing State�of�Maryland State�Wildlife Natural�Area
Islands�of�the�Potomac�Wildlife�Management�Area Existing State�of�Maryland State�Wildlife Natural�Area
Matthew�Henson�State�Park�Unit�#1 Existing State�of�Maryland State�Special Trail
Matthew�Henson�State�Park�Unit�#2 Existing State�of�Maryland State�Special Trail
McKee�Beshers�Wildlife�Management�Area Existing State�of�Maryland State�Wildlife
Other�Active(hunting,�bird�watching),�Natural�Area
State/Federal�Indoor�and�Outdoor�Locations
11
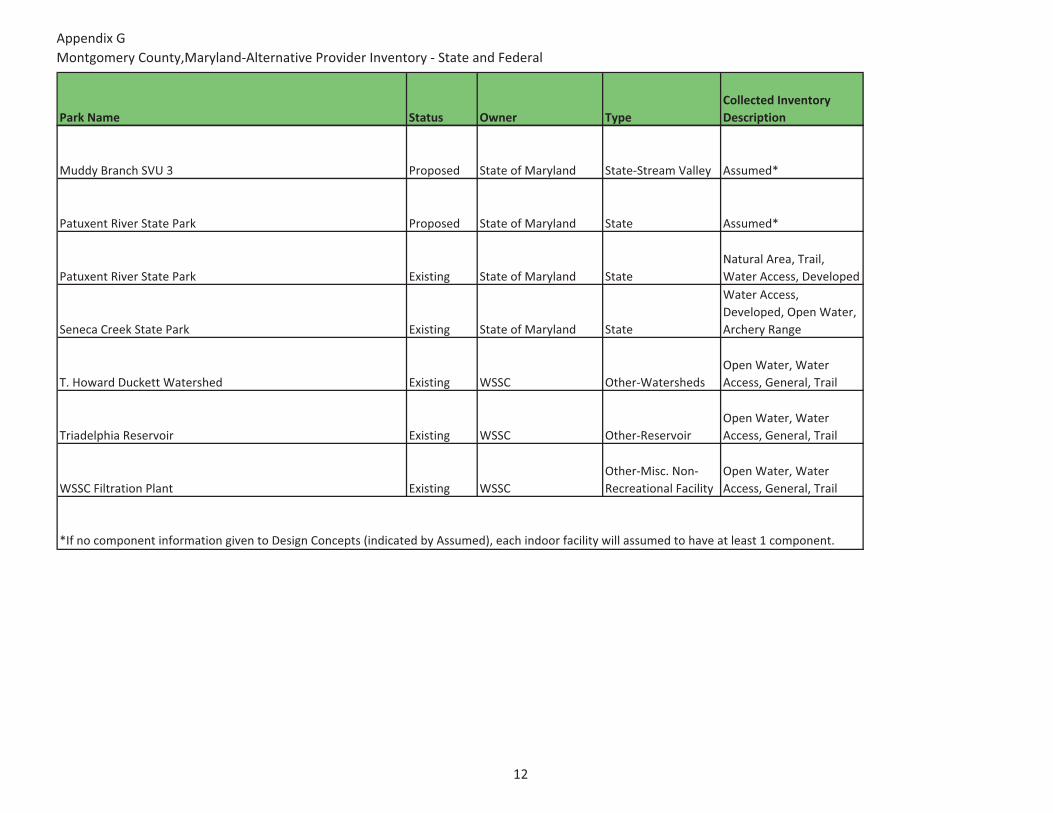
Appendix�GMontgomery�County,Maryland�Alternative�Provider�Inventory���State�and�Federal
Park�Name Status Owner TypeCollected�Inventory�Description
Muddy�Branch�SVU�3 Proposed State�of�Maryland State�Stream�Valley Assumed*
Patuxent�River�State�Park Proposed State�of�Maryland State Assumed*
Patuxent�River�State�Park Existing State�of�Maryland StateNatural�Area,�Trail,�Water�Access,�Developed
Seneca�Creek�State�Park Existing State�of�Maryland State
Water�Access,�Developed,�Open�Water,�Archery�Range
T.�Howard�Duckett�Watershed Existing WSSC Other�WatershedsOpen�Water,�Water�Access,�General,�Trail
Triadelphia�Reservoir Existing WSSC Other�ReservoirOpen�Water,�Water�Access,�General,�Trail
WSSC�Filtration�Plant Existing WSSCOther�Misc.�Non�Recreational�Facility
Open�Water,�Water�Access,�General,�Trail
*If�no�component�information�given�to�Design�Concepts�(indicated�by�Assumed),�each�indoor�facility�will�assumed�to�have�at�least�1�component.
12
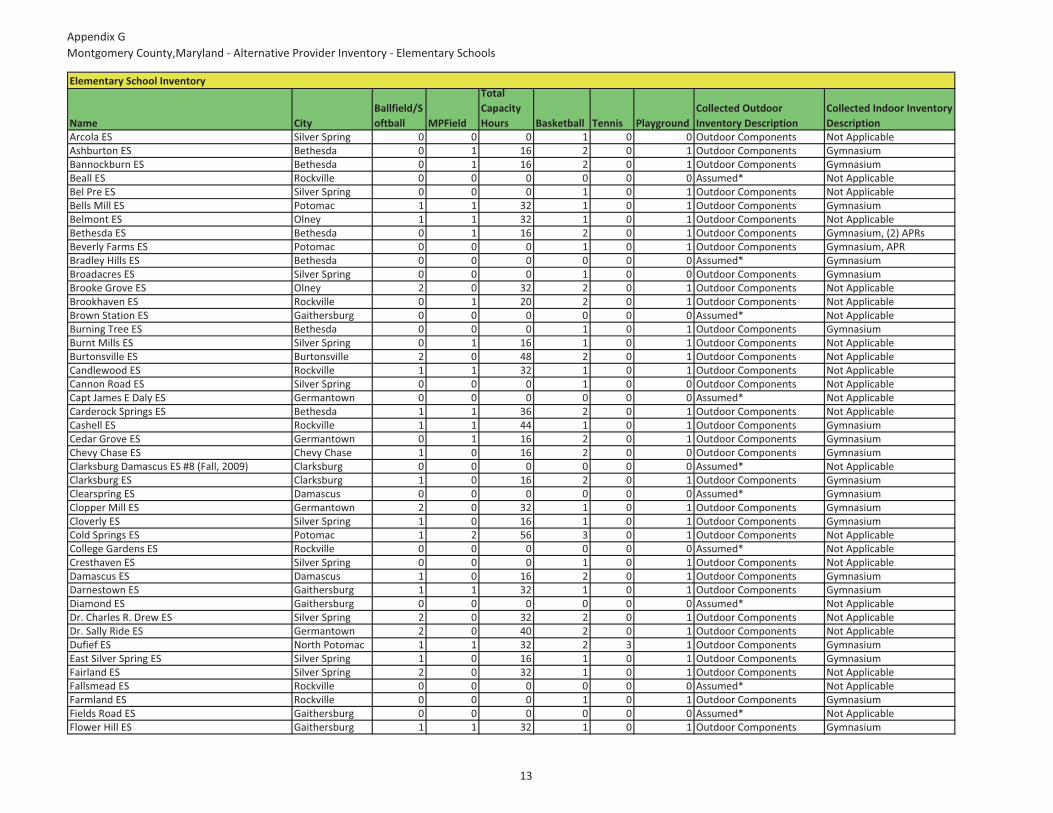
Appendix�GMontgomery�County,Maryland���Alternative�Provider�Inventory���Elementary�Schools
Name CityBallfield/Softball MPField
Total�Capacity�Hours Basketball Tennis Playground
Collected�Outdoor�Inventory�Description
Collected�Indoor�Inventory�Description
Arcola�ES Silver�Spring 0 0 0 1 0 0 Outdoor�Components Not�ApplicableAshburton�ES Bethesda 0 1 16 2 0 1 Outdoor�Components GymnasiumBannockburn�ES Bethesda 0 1 16 2 0 1 Outdoor�Components GymnasiumBeall�ES Rockville 0 0 0 0 0 0 Assumed* Not�ApplicableBel�Pre�ES Silver�Spring 0 0 0 1 0 1 Outdoor�Components Not�ApplicableBells�Mill�ES Potomac 1 1 32 1 0 1 Outdoor�Components GymnasiumBelmont�ES Olney 1 1 32 1 0 1 Outdoor�Components Not�ApplicableBethesda�ES Bethesda 0 1 16 2 0 1 Outdoor�Components Gymnasium,�(2)�APRsBeverly�Farms�ES Potomac 0 0 0 1 0 1 Outdoor�Components Gymnasium,�APRBradley�Hills�ES Bethesda 0 0 0 0 0 0 Assumed* GymnasiumBroadacres�ES Silver�Spring 0 0 0 1 0 0 Outdoor�Components GymnasiumBrooke�Grove�ES Olney 2 0 32 2 0 1 Outdoor�Components Not�ApplicableBrookhaven�ES Rockville 0 1 20 2 0 1 Outdoor�Components Not�ApplicableBrown�Station�ES Gaithersburg 0 0 0 0 0 0 Assumed* Not�ApplicableBurning�Tree�ES Bethesda 0 0 0 1 0 1 Outdoor�Components GymnasiumBurnt�Mills�ES Silver�Spring 0 1 16 1 0 1 Outdoor�Components Not�ApplicableBurtonsville�ES Burtonsville 2 0 48 2 0 1 Outdoor�Components Not�ApplicableCandlewood�ES Rockville 1 1 32 1 0 1 Outdoor�Components Not�ApplicableCannon�Road�ES Silver�Spring 0 0 0 1 0 0 Outdoor�Components Not�ApplicableCapt�James�E�Daly�ES Germantown 0 0 0 0 0 0 Assumed* Not�ApplicableCarderock�Springs�ES Bethesda 1 1 36 2 0 1 Outdoor�Components Not�ApplicableCashell�ES Rockville 1 1 44 1 0 1 Outdoor�Components GymnasiumCedar�Grove�ES Germantown 0 1 16 2 0 1 Outdoor�Components GymnasiumChevy�Chase�ES Chevy�Chase 1 0 16 2 0 0 Outdoor�Components GymnasiumClarksburg�Damascus�ES�#8�(Fall,�2009) Clarksburg 0 0 0 0 0 0 Assumed* Not�ApplicableClarksburg�ES Clarksburg 1 0 16 2 0 1 Outdoor�Components GymnasiumClearspring�ES Damascus 0 0 0 0 0 0 Assumed* GymnasiumClopper�Mill�ES Germantown 2 0 32 1 0 1 Outdoor�Components GymnasiumCloverly�ES Silver�Spring 1 0 16 1 0 1 Outdoor�Components GymnasiumCold�Springs�ES Potomac 1 2 56 3 0 1 Outdoor�Components Not�ApplicableCollege�Gardens�ES Rockville 0 0 0 0 0 0 Assumed* Not�ApplicableCresthaven�ES Silver�Spring 0 0 0 1 0 1 Outdoor�Components Not�ApplicableDamascus�ES Damascus 1 0 16 2 0 1 Outdoor�Components GymnasiumDarnestown�ES Gaithersburg 1 1 32 1 0 1 Outdoor�Components GymnasiumDiamond�ES Gaithersburg 0 0 0 0 0 0 Assumed* Not�ApplicableDr.�Charles�R.�Drew�ES Silver�Spring 2 0 32 2 0 1 Outdoor�Components Not�ApplicableDr.�Sally�Ride�ES Germantown 2 0 40 2 0 1 Outdoor�Components Not�ApplicableDufief�ES North�Potomac 1 1 32 2 3 1 Outdoor�Components GymnasiumEast�Silver�Spring�ES Silver�Spring 1 0 16 1 0 1 Outdoor�Components GymnasiumFairland�ES Silver�Spring 2 0 32 1 0 1 Outdoor�Components Not�ApplicableFallsmead�ES Rockville 0 0 0 0 0 0 Assumed* Not�ApplicableFarmland�ES Rockville 0 0 0 1 0 1 Outdoor�Components GymnasiumFields�Road�ES Gaithersburg 0 0 0 0 0 0 Assumed* Not�ApplicableFlower�Hill�ES Gaithersburg 1 1 32 1 0 1 Outdoor�Components Gymnasium
Elementary�School�Inventory�
13
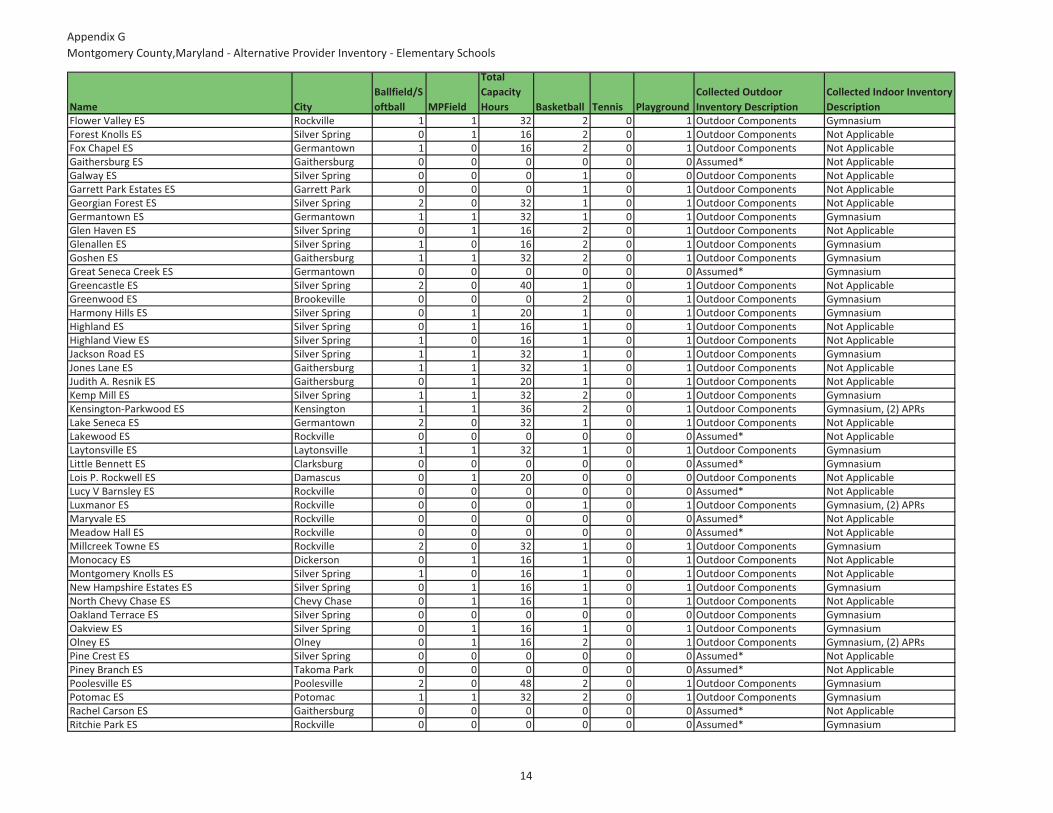
Appendix�GMontgomery�County,Maryland���Alternative�Provider�Inventory���Elementary�Schools
Name CityBallfield/Softball MPField
Total�Capacity�Hours Basketball Tennis Playground
Collected�Outdoor�Inventory�Description
Collected�Indoor�Inventory�Description
Flower�Valley�ES Rockville 1 1 32 2 0 1 Outdoor�Components GymnasiumForest�Knolls�ES Silver�Spring 0 1 16 2 0 1 Outdoor�Components Not�ApplicableFox�Chapel�ES Germantown 1 0 16 2 0 1 Outdoor�Components Not�ApplicableGaithersburg�ES Gaithersburg 0 0 0 0 0 0 Assumed* Not�ApplicableGalway�ES Silver�Spring 0 0 0 1 0 0 Outdoor�Components Not�ApplicableGarrett�Park�Estates�ES Garrett�Park 0 0 0 1 0 1 Outdoor�Components Not�ApplicableGeorgian�Forest�ES Silver�Spring 2 0 32 1 0 1 Outdoor�Components Not�ApplicableGermantown�ES Germantown 1 1 32 1 0 1 Outdoor�Components GymnasiumGlen�Haven�ES Silver�Spring 0 1 16 2 0 1 Outdoor�Components Not�ApplicableGlenallen�ES Silver�Spring 1 0 16 2 0 1 Outdoor�Components GymnasiumGoshen�ES Gaithersburg 1 1 32 2 0 1 Outdoor�Components GymnasiumGreat�Seneca�Creek�ES Germantown 0 0 0 0 0 0 Assumed* GymnasiumGreencastle�ES Silver�Spring 2 0 40 1 0 1 Outdoor�Components Not�ApplicableGreenwood�ES Brookeville 0 0 0 2 0 1 Outdoor�Components GymnasiumHarmony�Hills�ES Silver�Spring 0 1 20 1 0 1 Outdoor�Components GymnasiumHighland�ES Silver�Spring 0 1 16 1 0 1 Outdoor�Components Not�ApplicableHighland�View�ES Silver�Spring 1 0 16 1 0 1 Outdoor�Components Not�ApplicableJackson�Road�ES Silver�Spring 1 1 32 1 0 1 Outdoor�Components GymnasiumJones�Lane�ES Gaithersburg 1 1 32 1 0 1 Outdoor�Components Not�ApplicableJudith�A.�Resnik�ES Gaithersburg 0 1 20 1 0 1 Outdoor�Components Not�ApplicableKemp�Mill�ES Silver�Spring 1 1 32 2 0 1 Outdoor�Components GymnasiumKensington�Parkwood�ES Kensington 1 1 36 2 0 1 Outdoor�Components Gymnasium,�(2)�APRsLake�Seneca�ES Germantown 2 0 32 1 0 1 Outdoor�Components Not�ApplicableLakewood�ES Rockville 0 0 0 0 0 0 Assumed* Not�ApplicableLaytonsville�ES Laytonsville 1 1 32 1 0 1 Outdoor�Components GymnasiumLittle�Bennett�ES Clarksburg 0 0 0 0 0 0 Assumed* GymnasiumLois�P.�Rockwell�ES Damascus 0 1 20 0 0 0 Outdoor�Components Not�ApplicableLucy�V�Barnsley�ES Rockville 0 0 0 0 0 0 Assumed* Not�ApplicableLuxmanor�ES Rockville 0 0 0 1 0 1 Outdoor�Components Gymnasium,�(2)�APRsMaryvale�ES Rockville 0 0 0 0 0 0 Assumed* Not�ApplicableMeadow�Hall�ES Rockville 0 0 0 0 0 0 Assumed* Not�ApplicableMillcreek�Towne�ES Rockville 2 0 32 1 0 1 Outdoor�Components GymnasiumMonocacy�ES Dickerson 0 1 16 1 0 1 Outdoor�Components Not�ApplicableMontgomery�Knolls�ES Silver�Spring 1 0 16 1 0 1 Outdoor�Components Not�ApplicableNew�Hampshire�Estates�ES Silver�Spring 0 1 16 1 0 1 Outdoor�Components GymnasiumNorth�Chevy�Chase�ES Chevy�Chase 0 1 16 1 0 1 Outdoor�Components Not�ApplicableOakland�Terrace�ES Silver�Spring 0 0 0 0 0 0 Outdoor�Components GymnasiumOakview�ES Silver�Spring 0 1 16 1 0 1 Outdoor�Components GymnasiumOlney�ES Olney 0 1 16 2 0 1 Outdoor�Components Gymnasium,�(2)�APRsPine�Crest�ES Silver�Spring 0 0 0 0 0 0 Assumed* Not�ApplicablePiney�Branch�ES Takoma�Park 0 0 0 0 0 0 Assumed* Not�ApplicablePoolesville�ES Poolesville 2 0 48 2 0 1 Outdoor�Components GymnasiumPotomac�ES Potomac 1 1 32 2 0 1 Outdoor�Components GymnasiumRachel�Carson�ES Gaithersburg 0 0 0 0 0 0 Assumed* Not�ApplicableRitchie�Park�ES Rockville 0 0 0 0 0 0 Assumed* Gymnasium
14
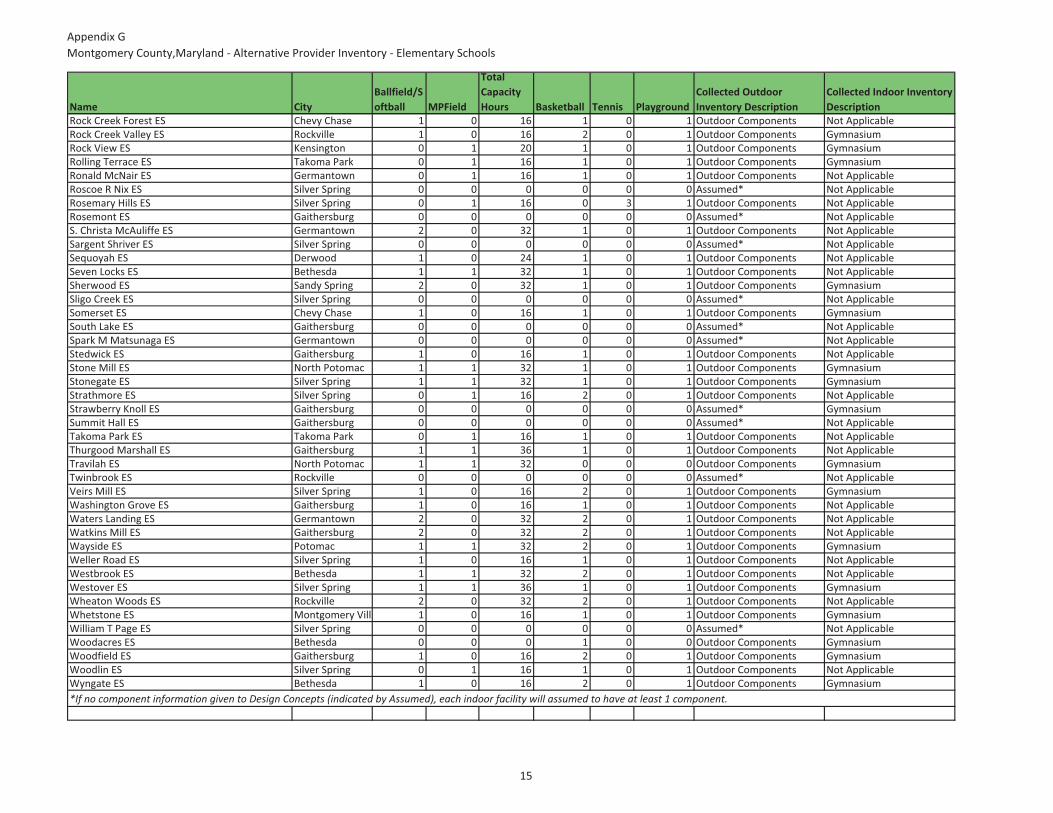
Appendix�GMontgomery�County,Maryland���Alternative�Provider�Inventory���Elementary�Schools
Name CityBallfield/Softball MPField
Total�Capacity�Hours Basketball Tennis Playground
Collected�Outdoor�Inventory�Description
Collected�Indoor�Inventory�Description
Rock�Creek�Forest�ES Chevy�Chase 1 0 16 1 0 1 Outdoor�Components Not�ApplicableRock�Creek�Valley�ES Rockville 1 0 16 2 0 1 Outdoor�Components GymnasiumRock�View�ES Kensington 0 1 20 1 0 1 Outdoor�Components GymnasiumRolling�Terrace�ES Takoma�Park 0 1 16 1 0 1 Outdoor�Components GymnasiumRonald�McNair�ES Germantown 0 1 16 1 0 1 Outdoor�Components Not�ApplicableRoscoe�R�Nix�ES Silver�Spring 0 0 0 0 0 0 Assumed* Not�ApplicableRosemary�Hills�ES Silver�Spring 0 1 16 0 3 1 Outdoor�Components Not�ApplicableRosemont�ES Gaithersburg 0 0 0 0 0 0 Assumed* Not�ApplicableS.�Christa�McAuliffe�ES Germantown 2 0 32 1 0 1 Outdoor�Components Not�ApplicableSargent�Shriver�ES Silver�Spring 0 0 0 0 0 0 Assumed* Not�ApplicableSequoyah�ES Derwood 1 0 24 1 0 1 Outdoor�Components Not�ApplicableSeven�Locks�ES Bethesda 1 1 32 1 0 1 Outdoor�Components Not�ApplicableSherwood�ES Sandy�Spring 2 0 32 1 0 1 Outdoor�Components GymnasiumSligo�Creek�ES Silver�Spring 0 0 0 0 0 0 Assumed* Not�ApplicableSomerset�ES Chevy�Chase 1 0 16 1 0 1 Outdoor�Components GymnasiumSouth�Lake�ES Gaithersburg 0 0 0 0 0 0 Assumed* Not�ApplicableSpark�M�Matsunaga�ES Germantown 0 0 0 0 0 0 Assumed* Not�ApplicableStedwick�ES Gaithersburg 1 0 16 1 0 1 Outdoor�Components Not�ApplicableStone�Mill�ES North�Potomac 1 1 32 1 0 1 Outdoor�Components GymnasiumStonegate�ES Silver�Spring 1 1 32 1 0 1 Outdoor�Components GymnasiumStrathmore�ES Silver�Spring 0 1 16 2 0 1 Outdoor�Components Not�ApplicableStrawberry�Knoll�ES Gaithersburg 0 0 0 0 0 0 Assumed* GymnasiumSummit�Hall�ES Gaithersburg 0 0 0 0 0 0 Assumed* Not�ApplicableTakoma�Park�ES Takoma�Park 0 1 16 1 0 1 Outdoor�Components Not�ApplicableThurgood�Marshall�ES Gaithersburg 1 1 36 1 0 1 Outdoor�Components Not�ApplicableTravilah�ES North�Potomac 1 1 32 0 0 0 Outdoor�Components GymnasiumTwinbrook�ES Rockville 0 0 0 0 0 0 Assumed* Not�ApplicableVeirs�Mill�ES Silver�Spring 1 0 16 2 0 1 Outdoor�Components GymnasiumWashington�Grove�ES Gaithersburg 1 0 16 1 0 1 Outdoor�Components Not�ApplicableWaters�Landing�ES Germantown 2 0 32 2 0 1 Outdoor�Components Not�ApplicableWatkins�Mill�ES Gaithersburg 2 0 32 2 0 1 Outdoor�Components Not�ApplicableWayside�ES Potomac 1 1 32 2 0 1 Outdoor�Components GymnasiumWeller�Road�ES Silver�Spring 1 0 16 1 0 1 Outdoor�Components Not�ApplicableWestbrook�ES Bethesda 1 1 32 2 0 1 Outdoor�Components Not�ApplicableWestover�ES Silver�Spring 1 1 36 1 0 1 Outdoor�Components GymnasiumWheaton�Woods�ES Rockville 2 0 32 2 0 1 Outdoor�Components Not�ApplicableWhetstone�ES Montgomery�Vill 1 0 16 1 0 1 Outdoor�Components GymnasiumWilliam�T�Page�ES Silver�Spring 0 0 0 0 0 0 Assumed* Not�ApplicableWoodacres�ES Bethesda 0 0 0 1 0 0 Outdoor�Components GymnasiumWoodfield�ES Gaithersburg 1 0 16 2 0 1 Outdoor�Components GymnasiumWoodlin�ES Silver�Spring 0 1 16 1 0 1 Outdoor�Components Not�ApplicableWyngate�ES Bethesda 1 0 16 2 0 1 Outdoor�Components Gymnasium*If�no�component�information�given�to�Design�Concepts�(indicated�by�Assumed),�each�indoor�facility�will�assumed�to�have�at�least�1�component.
15
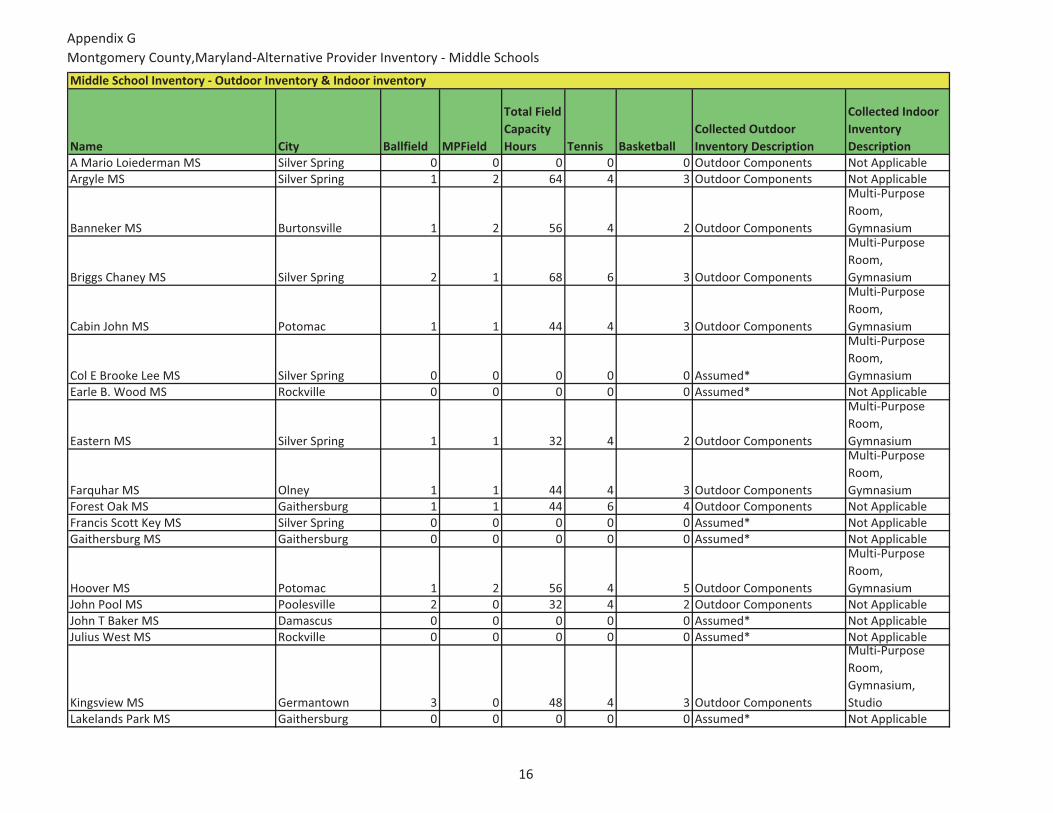
Appendix�GMontgomery�County,Maryland�Alternative�Provider�Inventory���Middle�Schools
Name City Ballfield MPField
Total�Field�Capacity�Hours Tennis Basketball
Collected�Outdoor�Inventory�Description
Collected�Indoor�Inventory�Description
A�Mario�Loiederman�MS Silver�Spring 0 0 0 0 0 Outdoor�Components Not�ApplicableArgyle�MS Silver�Spring 1 2 64 4 3 Outdoor�Components Not�Applicable
Banneker�MS Burtonsville 1 2 56 4 2 Outdoor�Components
Multi�Purpose�Room,�Gymnasium
Briggs�Chaney�MS Silver�Spring 2 1 68 6 3 Outdoor�Components
Multi�Purpose�Room,�Gymnasium
Cabin�John�MS Potomac 1 1 44 4 3 Outdoor�Components
Multi�Purpose�Room,�Gymnasium
Col�E�Brooke�Lee�MS Silver�Spring 0 0 0 0 0 Assumed*
Multi�Purpose�Room,�Gymnasium
Earle�B.�Wood�MS Rockville 0 0 0 0 0 Assumed* Not�Applicable
Eastern�MS Silver�Spring 1 1 32 4 2 Outdoor�Components
Multi�Purpose�Room,�Gymnasium
Farquhar�MS Olney 1 1 44 4 3 Outdoor�Components
Multi�Purpose�Room,�Gymnasium
Forest�Oak�MS Gaithersburg 1 1 44 6 4 Outdoor�Components Not�ApplicableFrancis�Scott�Key�MS Silver�Spring 0 0 0 0 0 Assumed* Not�ApplicableGaithersburg�MS Gaithersburg 0 0 0 0 0 Assumed* Not�Applicable
Hoover�MS Potomac 1 2 56 4 5 Outdoor�Components
Multi�Purpose�Room,�Gymnasium
John�Pool�MS Poolesville 2 0 32 4 2 Outdoor�Components Not�ApplicableJohn�T�Baker�MS Damascus 0 0 0 0 0 Assumed* Not�ApplicableJulius�West�MS Rockville 0 0 0 0 0 Assumed* Not�Applicable
Kingsview�MS Germantown 3 0 48 4 3 Outdoor�Components
Multi�Purpose�Room,�Gymnasium,�Studio
Lakelands�Park�MS Gaithersburg 0 0 0 0 0 Assumed* Not�Applicable
Middle�School�Inventory���Outdoor�Inventory�&�Indoor�inventory�
16
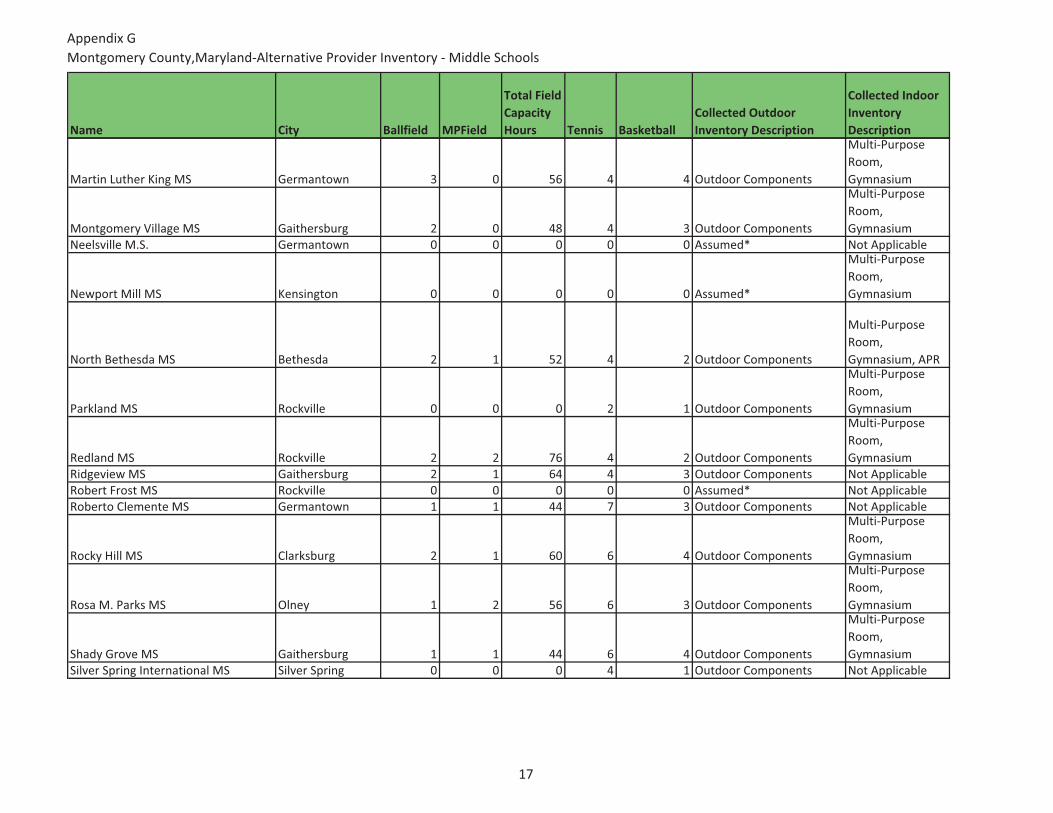
Appendix�GMontgomery�County,Maryland�Alternative�Provider�Inventory���Middle�Schools
Name City Ballfield MPField
Total�Field�Capacity�Hours Tennis Basketball
Collected�Outdoor�Inventory�Description
Collected�Indoor�Inventory�Description
Martin�Luther�King�MS Germantown 3 0 56 4 4 Outdoor�Components
Multi�Purpose�Room,�Gymnasium
Montgomery�Village�MS Gaithersburg 2 0 48 4 3 Outdoor�Components
Multi�Purpose�Room,�Gymnasium
Neelsville�M.S. Germantown 0 0 0 0 0 Assumed* Not�Applicable
Newport�Mill�MS Kensington 0 0 0 0 0 Assumed*
Multi�Purpose�Room,�Gymnasium
North�Bethesda�MS Bethesda 2 1 52 4 2 Outdoor�Components
Multi�Purpose�Room,�Gymnasium,�APR
Parkland�MS Rockville 0 0 0 2 1 Outdoor�Components
Multi�Purpose�Room,�Gymnasium
Redland�MS Rockville 2 2 76 4 2 Outdoor�Components
Multi�Purpose�Room,�Gymnasium
Ridgeview�MS Gaithersburg 2 1 64 4 3 Outdoor�Components Not�ApplicableRobert�Frost�MS Rockville 0 0 0 0 0 Assumed* Not�ApplicableRoberto�Clemente�MS Germantown 1 1 44 7 3 Outdoor�Components Not�Applicable
Rocky�Hill�MS Clarksburg 2 1 60 6 4 Outdoor�Components
Multi�Purpose�Room,�Gymnasium
Rosa�M.�Parks�MS Olney 1 2 56 6 3 Outdoor�Components
Multi�Purpose�Room,�Gymnasium
Shady�Grove�MS Gaithersburg 1 1 44 6 4 Outdoor�Components
Multi�Purpose�Room,�Gymnasium
Silver�Spring�International�MS Silver�Spring 0 0 0 4 1 Outdoor�Components Not�Applicable
17
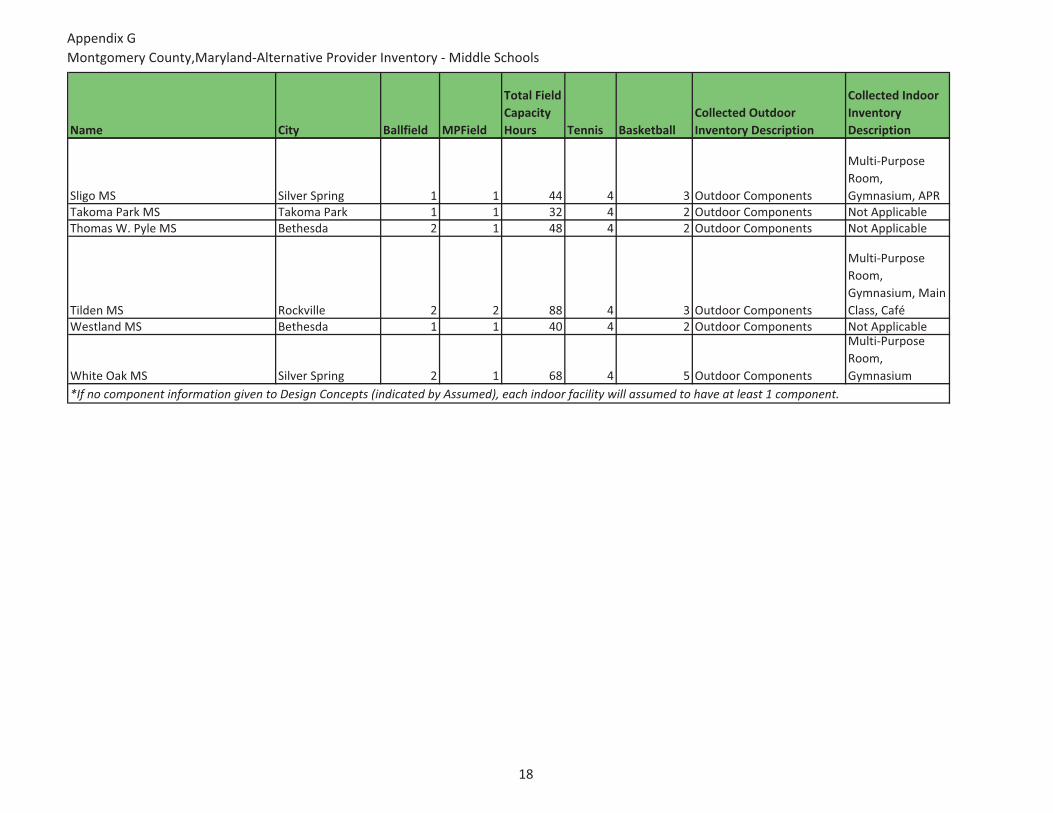
Appendix�GMontgomery�County,Maryland�Alternative�Provider�Inventory���Middle�Schools
Name City Ballfield MPField
Total�Field�Capacity�Hours Tennis Basketball
Collected�Outdoor�Inventory�Description
Collected�Indoor�Inventory�Description
Sligo�MS Silver�Spring 1 1 44 4 3 Outdoor�Components
Multi�Purpose�Room,�Gymnasium,�APR
Takoma�Park�MS Takoma�Park 1 1 32 4 2 Outdoor�Components Not�ApplicableThomas�W.�Pyle�MS Bethesda 2 1 48 4 2 Outdoor�Components Not�Applicable
Tilden�MS Rockville 2 2 88 4 3 Outdoor�Components
Multi�Purpose�Room,�Gymnasium,�Main�Class,�Café
Westland�MS Bethesda 1 1 40 4 2 Outdoor�Components Not�Applicable
White�Oak�MS Silver�Spring 2 1 68 4 5 Outdoor�Components
Multi�Purpose�Room,�Gymnasium
*If�no�component�information�given�to�Design�Concepts�(indicated�by�Assumed),�each�indoor�facility�will�assumed�to�have�at�least�1�component.
18
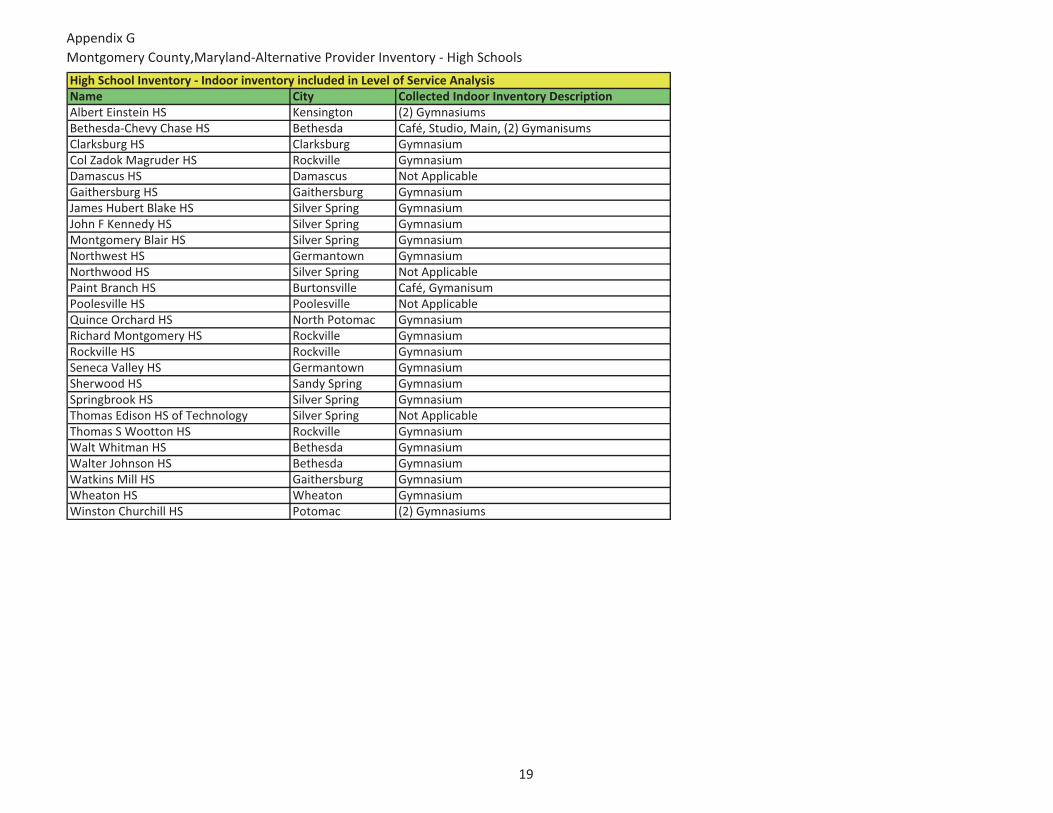
Appendix�GMontgomery�County,Maryland�Alternative�Provider�Inventory���High�Schools
Name City Collected�Indoor�Inventory�DescriptionAlbert�Einstein�HS Kensington (2)�GymnasiumsBethesda�Chevy�Chase�HS Bethesda Café,�Studio,�Main,�(2)�GymanisumsClarksburg�HS Clarksburg GymnasiumCol�Zadok�Magruder�HS Rockville GymnasiumDamascus�HS Damascus Not�ApplicableGaithersburg�HS Gaithersburg GymnasiumJames�Hubert�Blake�HS Silver�Spring GymnasiumJohn�F�Kennedy�HS Silver�Spring GymnasiumMontgomery�Blair�HS Silver�Spring GymnasiumNorthwest�HS Germantown GymnasiumNorthwood�HS Silver�Spring Not�ApplicablePaint�Branch�HS Burtonsville Café,�GymanisumPoolesville�HS Poolesville Not�ApplicableQuince�Orchard�HS North�Potomac GymnasiumRichard�Montgomery�HS Rockville GymnasiumRockville�HS Rockville GymnasiumSeneca�Valley�HS Germantown GymnasiumSherwood�HS Sandy�Spring GymnasiumSpringbrook�HS Silver�Spring GymnasiumThomas�Edison�HS�of�Technology Silver�Spring Not�ApplicableThomas�S�Wootton�HS Rockville GymnasiumWalt�Whitman�HS Bethesda GymnasiumWalter�Johnson�HS Bethesda GymnasiumWatkins�Mill�HS Gaithersburg GymnasiumWheaton�HS Wheaton GymnasiumWinston�Churchill�HS Potomac (2)�Gymnasiums
High�School�Inventory���Indoor�inventory�included�in�Level�of�Service�Analysis
19

������������������
THIS�PAGE�INTENTIONALLY�LEFT�BLANK�

Volume�1:�Needs�and�Resource�Assessment���DRAFT� 259��
APPENDIX�H:�OUTDOOR�COMPONENT�LIST�&�CATCHMENT�AREAS��

������������������
THIS�PAGE�INTENTIONALLY�LEFT�BLANK�
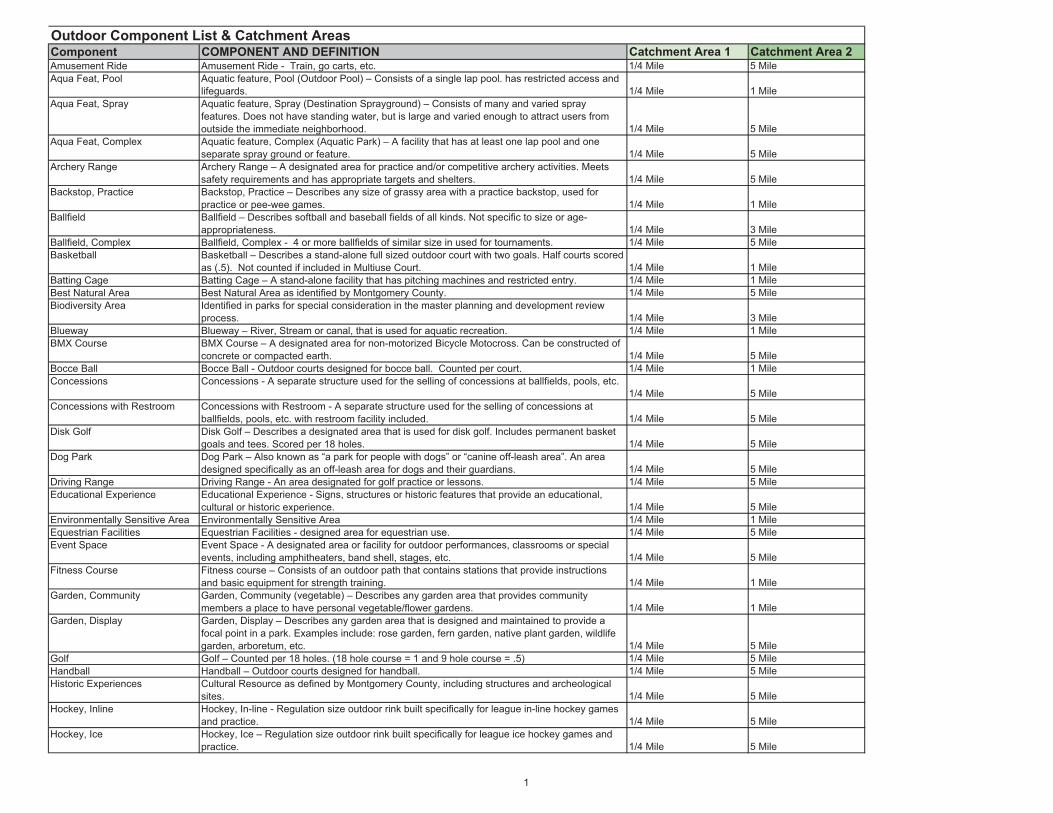
Component COMPONENT AND DEFINITION Catchment Area 1 Catchment Area 2Amusement Ride Amusement Ride - Train, go carts, etc. 1/4 Mile 5 MileAqua Feat, Pool Aquatic feature, Pool (Outdoor Pool) – Consists of a single lap pool. has restricted access and
lifeguards. 1/4 Mile 1 MileAqua Feat, Spray Aquatic feature, Spray (Destination Sprayground) – Consists of many and varied spray
features. Does not have standing water, but is large and varied enough to attract users from outside the immediate neighborhood. 1/4 Mile 5 Mile
Aqua Feat, Complex Aquatic feature, Complex (Aquatic Park) – A facility that has at least one lap pool and one separate spray ground or feature. 1/4 Mile 5 Mile
Archery Range Archery Range – A designated area for practice and/or competitive archery activities. Meets safety requirements and has appropriate targets and shelters. 1/4 Mile 5 Mile
Backstop, Practice Backstop, Practice – Describes any size of grassy area with a practice backstop, used for practice or pee-wee games. 1/4 Mile 1 Mile
Ballfield Ballfield – Describes softball and baseball fields of all kinds. Not specific to size or age-appropriateness. 1/4 Mile 3 Mile
Ballfield, Complex Ballfield, Complex - 4 or more ballfields of similar size in used for tournaments. 1/4 Mile 5 MileBasketball Basketball – Describes a stand-alone full sized outdoor court with two goals. Half courts scored
as (.5). Not counted if included in Multiuse Court. 1/4 Mile 1 MileBatting Cage Batting Cage – A stand-alone facility that has pitching machines and restricted entry. 1/4 Mile 1 MileBest Natural Area Best Natural Area as identified by Montgomery County. 1/4 Mile 5 MileBiodiversity Area Identified in parks for special consideration in the master planning and development review
process. 1/4 Mile 3 MileBlueway Blueway – River, Stream or canal, that is used for aquatic recreation. 1/4 Mile 1 MileBMX Course BMX Course – A designated area for non-motorized Bicycle Motocross. Can be constructed of
concrete or compacted earth. 1/4 Mile 5 MileBocce Ball Bocce Ball - Outdoor courts designed for bocce ball. Counted per court. 1/4 Mile 1 MileConcessions Concessions - A separate structure used for the selling of concessions at ballfields, pools, etc.
1/4 Mile 5 MileConcessions with Restroom Concessions with Restroom - A separate structure used for the selling of concessions at
ballfields, pools, etc. with restroom facility included. 1/4 Mile 5 MileDisk Golf Disk Golf – Describes a designated area that is used for disk golf. Includes permanent basket
goals and tees. Scored per 18 holes. 1/4 Mile 5 MileDog Park Dog Park – Also known as “a park for people with dogs” or “canine off-leash area”. An area
designed specifically as an off-leash area for dogs and their guardians. 1/4 Mile 5 MileDriving Range Driving Range - An area designated for golf practice or lessons. 1/4 Mile 5 MileEducational Experience Educational Experience - Signs, structures or historic features that provide an educational,
cultural or historic experience. 1/4 Mile 5 MileEnvironmentally Sensitive Area Environmentally Sensitive Area 1/4 Mile 1 MileEquestrian Facilities Equestrian Facilities - designed area for equestrian use. 1/4 Mile 5 MileEvent Space Event Space - A designated area or facility for outdoor performances, classrooms or special
events, including amphitheaters, band shell, stages, etc. 1/4 Mile 5 MileFitness Course Fitness course – Consists of an outdoor path that contains stations that provide instructions
and basic equipment for strength training. 1/4 Mile 1 MileGarden, Community Garden, Community (vegetable) – Describes any garden area that provides community
members a place to have personal vegetable/flower gardens. 1/4 Mile 1 MileGarden, Display Garden, Display – Describes any garden area that is designed and maintained to provide a
focal point in a park. Examples include: rose garden, fern garden, native plant garden, wildlife garden, arboretum, etc. 1/4 Mile 5 Mile
Golf Golf – Counted per 18 holes. (18 hole course = 1 and 9 hole course = .5) 1/4 Mile 5 MileHandball Handball – Outdoor courts designed for handball. 1/4 Mile 5 MileHistoric Experiences Cultural Resource as defined by Montgomery County, including structures and archeological
sites. 1/4 Mile 5 MileHockey, Inline Hockey, In-line - Regulation size outdoor rink built specifically for league in-line hockey games
and practice. 1/4 Mile 5 MileHockey, Ice Hockey, Ice – Regulation size outdoor rink built specifically for league ice hockey games and
practice. 1/4 Mile 5 Mile
Outdoor Component List & Catchment Areas
1
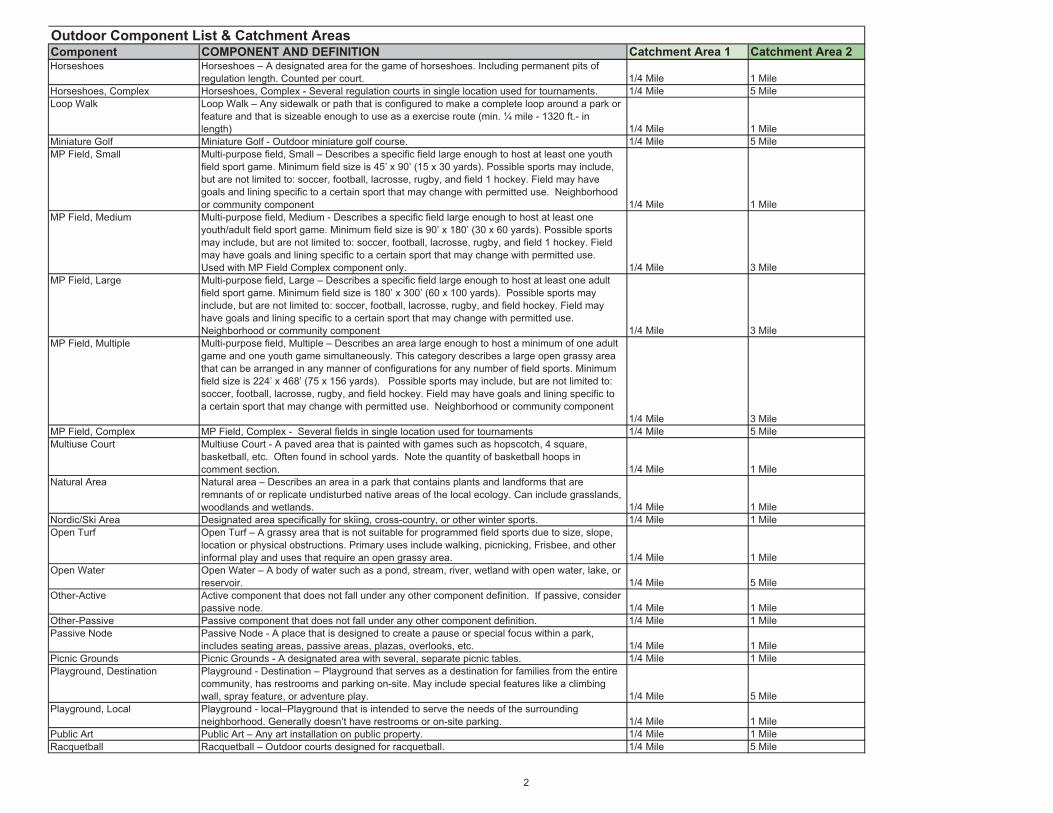
Component COMPONENT AND DEFINITION Catchment Area 1 Catchment Area 2Outdoor Component List & Catchment Areas
Horseshoes Horseshoes – A designated area for the game of horseshoes. Including permanent pits of regulation length. Counted per court. 1/4 Mile 1 Mile
Horseshoes, Complex Horseshoes, Complex - Several regulation courts in single location used for tournaments. 1/4 Mile 5 MileLoop Walk Loop Walk – Any sidewalk or path that is configured to make a complete loop around a park or
feature and that is sizeable enough to use as a exercise route (min. ¼ mile - 1320 ft.- in length) 1/4 Mile 1 Mile
Miniature Golf Miniature Golf - Outdoor miniature golf course. 1/4 Mile 5 MileMP Field, Small Multi-purpose field, Small – Describes a specific field large enough to host at least one youth
field sport game. Minimum field size is 45’ x 90’ (15 x 30 yards). Possible sports may include, but are not limited to: soccer, football, lacrosse, rugby, and field 1 hockey. Field may have goals and lining specific to a certain sport that may change with permitted use. Neighborhood or community component 1/4 Mile 1 Mile
MP Field, Medium Multi-purpose field, Medium - Describes a specific field large enough to host at least one youth/adult field sport game. Minimum field size is 90’ x 180’ (30 x 60 yards). Possible sports may include, but are not limited to: soccer, football, lacrosse, rugby, and field 1 hockey. Field may have goals and lining specific to a certain sport that may change with permitted use.Used with MP Field Complex component only. 1/4 Mile 3 Mile
MP Field, Large Multi-purpose field, Large – Describes a specific field large enough to host at least one adult field sport game. Minimum field size is 180’ x 300’ (60 x 100 yards). Possible sports may include, but are not limited to: soccer, football, lacrosse, rugby, and field hockey. Field may have goals and lining specific to a certain sport that may change with permitted use.Neighborhood or community component 1/4 Mile 3 Mile
MP Field, Multiple Multi-purpose field, Multiple – Describes an area large enough to host a minimum of one adult game and one youth game simultaneously. This category describes a large open grassy area that can be arranged in any manner of configurations for any number of field sports. Minimum field size is 224’ x 468’ (75 x 156 yards). Possible sports may include, but are not limited to: soccer, football, lacrosse, rugby, and field hockey. Field may have goals and lining specific to a certain sport that may change with permitted use. Neighborhood or community component
1/4 Mile 3 MileMP Field, Complex MP Field, Complex - Several fields in single location used for tournaments 1/4 Mile 5 MileMultiuse Court Multiuse Court - A paved area that is painted with games such as hopscotch, 4 square,
basketball, etc. Often found in school yards. Note the quantity of basketball hoops in comment section. 1/4 Mile 1 Mile
Natural Area Natural area – Describes an area in a park that contains plants and landforms that are remnants of or replicate undisturbed native areas of the local ecology. Can include grasslands, woodlands and wetlands. 1/4 Mile 1 Mile
Nordic/Ski Area Designated area specifically for skiing, cross-country, or other winter sports. 1/4 Mile 1 MileOpen Turf Open Turf – A grassy area that is not suitable for programmed field sports due to size, slope,
location or physical obstructions. Primary uses include walking, picnicking, Frisbee, and other informal play and uses that require an open grassy area. 1/4 Mile 1 Mile
Open Water Open Water – A body of water such as a pond, stream, river, wetland with open water, lake, or reservoir. 1/4 Mile 5 Mile
Other-Active Active component that does not fall under any other component definition. If passive, consider passive node. 1/4 Mile 1 Mile
Other-Passive Passive component that does not fall under any other component definition. 1/4 Mile 1 MilePassive Node Passive Node - A place that is designed to create a pause or special focus within a park,
includes seating areas, passive areas, plazas, overlooks, etc. 1/4 Mile 1 MilePicnic Grounds Picnic Grounds - A designated area with several, separate picnic tables. 1/4 Mile 1 MilePlayground, Destination Playground - Destination – Playground that serves as a destination for families from the entire
community, has restrooms and parking on-site. May include special features like a climbing wall, spray feature, or adventure play. 1/4 Mile 5 Mile
Playground, Local Playground - local–Playground that is intended to serve the needs of the surrounding neighborhood. Generally doesn’t have restrooms or on-site parking. 1/4 Mile 1 Mile
Public Art Public Art – Any art installation on public property. 1/4 Mile 1 MileRacquetball Racquetball – Outdoor courts designed for racquetball. 1/4 Mile 5 Mile
2
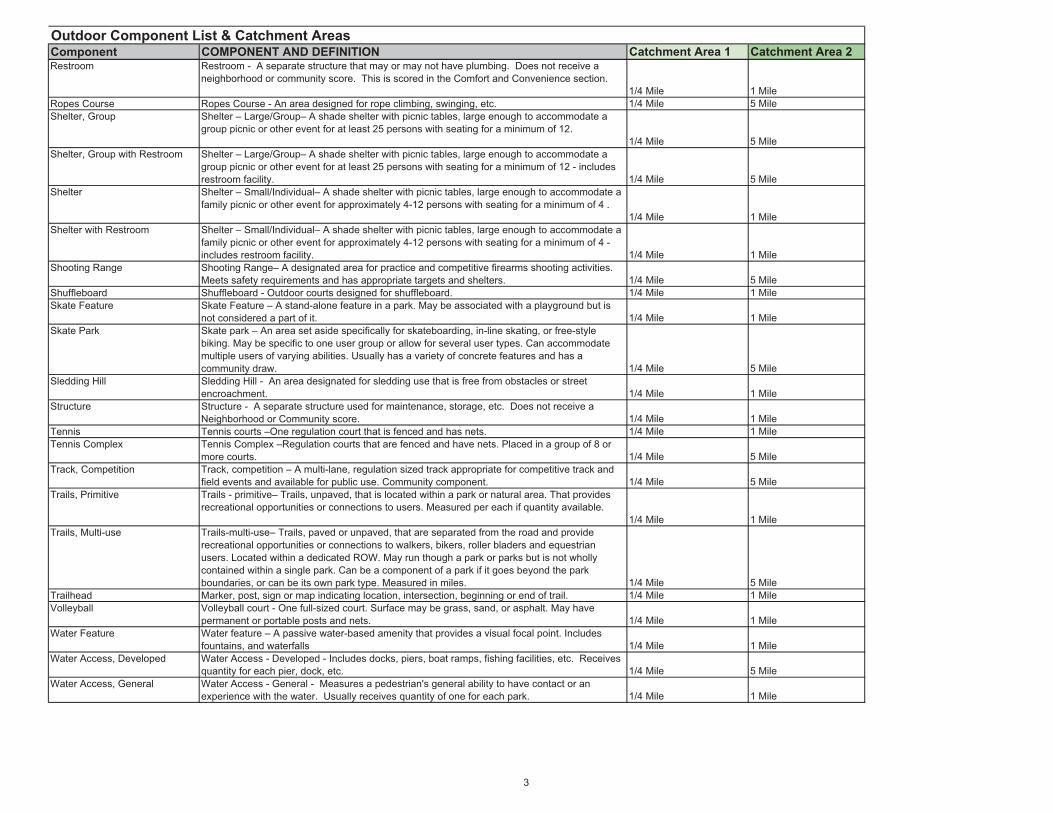
Component COMPONENT AND DEFINITION Catchment Area 1 Catchment Area 2Outdoor Component List & Catchment Areas
Restroom Restroom - A separate structure that may or may not have plumbing. Does not receive a neighborhood or community score. This is scored in the Comfort and Convenience section.
1/4 Mile 1 MileRopes Course Ropes Course - An area designed for rope climbing, swinging, etc. 1/4 Mile 5 MileShelter, Group Shelter – Large/Group– A shade shelter with picnic tables, large enough to accommodate a
group picnic or other event for at least 25 persons with seating for a minimum of 12. 1/4 Mile 5 Mile
Shelter, Group with Restroom Shelter – Large/Group– A shade shelter with picnic tables, large enough to accommodate a group picnic or other event for at least 25 persons with seating for a minimum of 12 - includes restroom facility. 1/4 Mile 5 Mile
Shelter Shelter – Small/Individual– A shade shelter with picnic tables, large enough to accommodate a family picnic or other event for approximately 4-12 persons with seating for a minimum of 4 .
1/4 Mile 1 MileShelter with Restroom Shelter – Small/Individual– A shade shelter with picnic tables, large enough to accommodate a
family picnic or other event for approximately 4-12 persons with seating for a minimum of 4 - includes restroom facility. 1/4 Mile 1 Mile
Shooting Range Shooting Range– A designated area for practice and competitive firearms shooting activities. Meets safety requirements and has appropriate targets and shelters. 1/4 Mile 5 Mile
Shuffleboard Shuffleboard - Outdoor courts designed for shuffleboard. 1/4 Mile 1 MileSkate Feature Skate Feature – A stand-alone feature in a park. May be associated with a playground but is
not considered a part of it. 1/4 Mile 1 MileSkate Park Skate park – An area set aside specifically for skateboarding, in-line skating, or free-style
biking. May be specific to one user group or allow for several user types. Can accommodate multiple users of varying abilities. Usually has a variety of concrete features and has a community draw. 1/4 Mile 5 Mile
Sledding Hill Sledding Hill - An area designated for sledding use that is free from obstacles or street encroachment. 1/4 Mile 1 Mile
Structure Structure - A separate structure used for maintenance, storage, etc. Does not receive a Neighborhood or Community score. 1/4 Mile 1 Mile
Tennis Tennis courts –One regulation court that is fenced and has nets. 1/4 Mile 1 MileTennis Complex Tennis Complex –Regulation courts that are fenced and have nets. Placed in a group of 8 or
more courts. 1/4 Mile 5 MileTrack, Competition Track, competition – A multi-lane, regulation sized track appropriate for competitive track and
field events and available for public use. Community component. 1/4 Mile 5 MileTrails, Primitive Trails - primitive– Trails, unpaved, that is located within a park or natural area. That provides
recreational opportunities or connections to users. Measured per each if quantity available. 1/4 Mile 1 Mile
Trails, Multi-use Trails-multi-use– Trails, paved or unpaved, that are separated from the road and provide recreational opportunities or connections to walkers, bikers, roller bladers and equestrian users. Located within a dedicated ROW. May run though a park or parks but is not wholly contained within a single park. Can be a component of a park if it goes beyond the park boundaries, or can be its own park type. Measured in miles. 1/4 Mile 5 Mile
Trailhead Marker, post, sign or map indicating location, intersection, beginning or end of trail. 1/4 Mile 1 MileVolleyball Volleyball court - One full-sized court. Surface may be grass, sand, or asphalt. May have
permanent or portable posts and nets. 1/4 Mile 1 MileWater Feature Water feature – A passive water-based amenity that provides a visual focal point. Includes
fountains, and waterfalls 1/4 Mile 1 MileWater Access, Developed Water Access - Developed - Includes docks, piers, boat ramps, fishing facilities, etc. Receives
quantity for each pier, dock, etc. 1/4 Mile 5 MileWater Access, General Water Access - General - Measures a pedestrian's general ability to have contact or an
experience with the water. Usually receives quantity of one for each park. 1/4 Mile 1 Mile
3
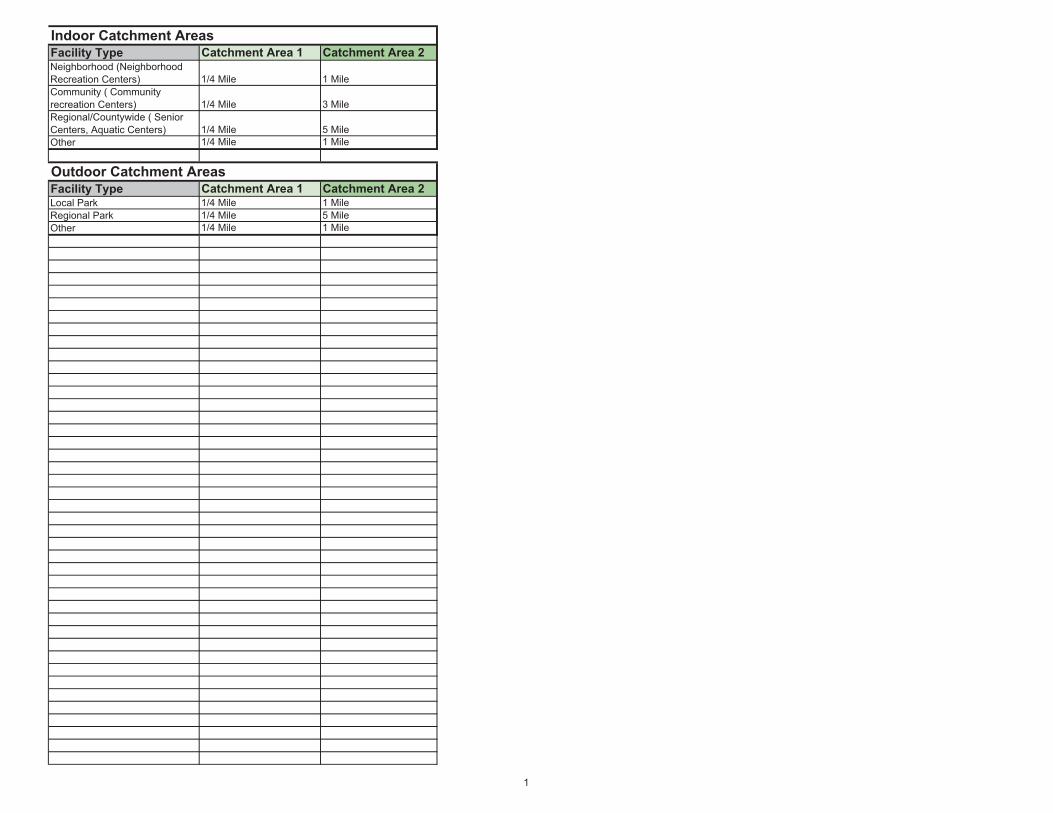
Facility Type Catchment Area 1 Catchment Area 2Neighborhood (Neighborhood Recreation Centers) 1/4 Mile 1 MileCommunity ( Community recreation Centers) 1/4 Mile 3 MileRegional/Countywide ( Senior Centers, Aquatic Centers) 1/4 Mile 5 MileOther 1/4 Mile 1 Mile
Facility Type Catchment Area 1 Catchment Area 2Local Park 1/4 Mile 1 MileRegional Park 1/4 Mile 5 MileOther 1/4 Mile 1 Mile
Indoor Catchment Areas
Outdoor Catchment Areas
1

Facility Type Catchment Area 1 Catchment Area 2Indoor Catchment Areas
2

������������������
THIS�PAGE�INTENTIONALLY�LEFT�BLANK�