Embed Size (px)
Citation preview
APPENDIX A ndash NUMERICAL MODELLING AND PILLARPANEL STABILITY ASSESSMENT
A1 INTRODUCTION
As part of the Collingwood Park Subsidence Assessment project numerical modelling was undertaken to assist in the evaluation of backfilling strategies focussed on reducing potential pillar and panel instability Backfilling of mine roadways surrounding pillars is proposed for the purpose of increasing both immediate pillar strength and reducing the rate of pillar strength degradation from pillar spalling and roadway instability Backfilled roadways would be expected to reduce surface subsidence tilt and strains in the unlikely event that pillar failure was to occur after remediation by backfill
Subsequent to numerical studies calibrated empirical or semi-analytical assessment of every pillar of Westfalen No 3 colliery was undertaken for the purpose of identifying regions of potential instability
Towards these objectives the following tasks have been undertaken
bull Literature review of reports on Collingwood Park subsidence events and coal pillar strength and stress calculations by empirical analytical and numerical methods Review of the strength based Factor of Safety (FoS) method for pillar design
bull Literature review of backfill properties
bull Calibrating material parameters in numerical models by comparison with the analytical coal pillar strength formula
bull Assessing size shape and post failure strength parameters and characteristics of coal pillars of dimensions typical of Westfalen No 3 Colliery
bull Assessing the effectiveness of backfilling roadways surrounding a single square pillar
bull Development of a full three dimensional (3D) numerical model of the Duncan St area comprising 46 pillars and pillar and panel stability assessment for various pillar heights
bull Assessment of various backfill options on pillar stability surface subsidence tilt and strain for the 3D Duncan St model
bull Development of a full three-dimensional model of the region to the north east of Duncan St comprising 76 pillars
bull Estimating the strength difference between pillar panels west and east of the Waterline fault from the two 3D models
Outputs and outcomes from the modelling study include the following
bull An understanding of pre and post-peak strength and shape effects for pillars with typical dimensions of pillars in the Duncan St area
bull An understanding of the pillar strength increase when surrounding roadways are filled by cohesive and non-cohesive backfill to various heights
bull Understanding of pillar and panel FoS increase from backfill
bull A full 3D model of 46 pillars in the Duncan St area and surface subsidence prediction at nominal 6m mining height and 9m mining height benchmarked with monitoring data
bull Estimates of lateral extent of stress abutment
bull Comparative strength assessment of the two panel layouts west and east of Waterline fault
A2 LITERATURE REVIEW ON PILLAR STRENGTH
A21 Pillar strength formula
Several empirical formulas have been developed to calculate mine pillar strength based on experimental field data in the form of a single equation where pillar strength (S) is equal to an empirical constant (A) times pillar width (w) to a constant power (α) divided by pillar height (h) to a constant power (β) ie S = A wα hβ
The empirical equation developed by Salamon amp Munro [Salamon 1967 Salamon 1998] (in SI units) has been widely used in South Africa and Australia since its development in 1967
Pillar strength = 72 w046 h066 (1)
where the constant A = 72 α = 046 and β = 066 and
w = pillar width
h = mining height
The coal pillar strength equation developed by UNSW from a database of Australian coal pillars in 1996 [Galvin 1999] uses different constants given by
Pillar strength = 860 w051 h084 (2)
Coal pillar strength estimated from the combined databases of South African and Australian coal pillars in 1999 [Galvin 1999] has the following form
Pillar strength = 688 w050 h070 (3)
Interestingly all the above formulas Equations (1) (2) and (3) give very similar results although they are derived for pillars from two different continents with generally different geological conditions and settings [Mark 1999 Galvin 1999]
An observation from this is that above a width-to-height ratio of two geometric parameters influence pillar strength rather than the pillar material below two Galvin
[Galvin 2006] reports that geological properties of the pillar dominate the overall pillar strength
A22 Pillar effective width
Wagner [Wagner 1974] invoked the concept of hydraulic radius to define the effective width we as [Wagner 1980]
we = 4 Ap Cp (4)
where
Ap = cross sectional area of the pillar (w2 for a square pillar)
Cp = cross sectional circumference of the pillar (4w for a square pillar)
and which becomes identical to w for square pillars
To account for parallelepiped pillars of widths w1 and w2 and internal acute angle θ UNSW [Galvin 1999] has expressed the effective width by
we = wm Θ (5)
where
wm = w1 sin θ (6)
and
Θ = 2 w2 (w1 + w2) (7)
A23 Pillar load
Pillar axial stress can be estimated by [Salamon 1967 Salamon 1974]
Pillar stress = ρ g H (1 ndash e) (8)
where H is depth of cover e is the area extraction ratio which is theoretically between zero (no extraction) and one (100 extraction) To keep consistency with the original parameters of equation (1) gravity and average overburden density are defined as
g = 10 m sec2
ρ = 2488 kg m3
Using tributary area theory the original work of Salamon and Munro calculates the loading share of a square pillar of width w bord width B and depth of mining H as
Pillar stress = ρ g H (1 - e) = ρ g H [(w + B)w]2 (9)
Assumed in equation (9) is that the stress is fully contained on the pillars that are uniform in size with constant bord width [Salamon 1974 Zipf 2001] which is a conservative assumption [Wagner 1980] and is acceptable if the panel width to depth ratio exceeds unity [Roberts 2002]
One of the outcomes of the present Collingwood Park investigation is the development of a method of estimating pillar loads where the conditions for tributary area theory cannot be satisfied as is the case at Westfalen No 3 colliery in the western branch This stress estimation method is termed ldquoPressure Arch theoryrdquo (PAt) [Poulsen 2010]
A24 Pressure Arch Theory
When conditions for tributary area theory are not satisfied due to an irregular pillar layout or variable overburden cover an alternative approach to estimate pillar stress is PAt The main components of PAt are
bull Load is uniquely estimated for every pillar
bull Depth-of-cover (H in equation (8)) is calculated at the pillar centroid
bull Extraction ratio ρ in equation (8) is calculated locally within a zone-of-influence defined by the depth dependent Load Transfer Distance [Abel 1988]
It is important to note that PAt converges to the equivalent tributary area theory (TAt) value when the conditions for TAt are satisfied Figure A-2
Zone of Influence
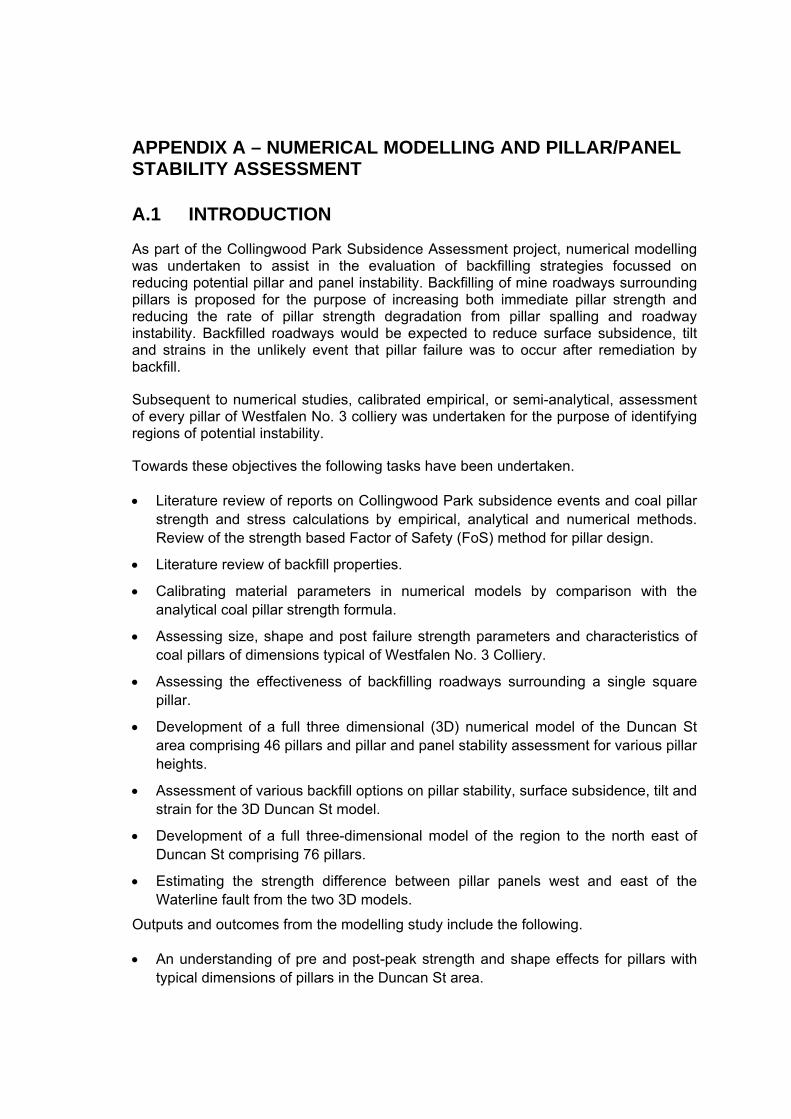
The Zone-of-Influence (ZI) used in PAt is based on the Load Transfer Distance (LTD) defined by Abel [Abel 1988] as the maximum distance any load can be laterally transferred and is determined by measuring the maximum distance that any effect of mining can be detected Monitoring results from mining in sedimentary strata are displayed in Figure A-1 and the LTD defined as
LTD = -1e-4 H2 + 02701 H (10)
LTD = -00001H2 + 02701H
R2 = 08701
0
20
40
60
80
100
120
140
160
180
200
0 200 400 600 800 1000 1200 Depth (m)
Load
Tra
nsfe
r Dis
tanc
e (m
)
Distance (m) Poly (Distance (m))
Figure A-1 Load transfer distance with depth for sedimentary strata (after Abel 1988)
Pillars within the LTD of each other will be able to interact and shed load Typically a stiffer pillar generally of greater width to height ratio such as a barrier pillar will carry a greater proportion of the load than smaller production pillars within its zone of influence A pillar of effective width we has a lateral zone of influence measured from the pillar centroid of
ZI = 2 LTD + we 2 (11)
ZI in equation (11) is then the radius of a circular influence zone centred on the pillar for which stress is estimated The extraction ratio in this influence region ρ is then used to estimate pillar stress with equation (8) [Poulsen 2010]
Comparison with numerical models and tributary area theory
Comparison of pillar stress calculated by PAt and numerical models is made in [Poulsen 2010] and in the numerical models constructed after both the 1988 and 2008 subsidence events at Collingwood Park
35
4
45
5
55
6 60
Pressure arch theory Tributary area theory Numerical model
0 5 10 15 20 25 30
Pillar number
Press Arch theory
Trib area theory A
vera
ge v
ertic
al s
tres
s in
cor
ner p
illar
(MPa
)
Stre
ss d
iffer
ence
from
num
eric
al m
odel
(MPa
)
50
40
30
20
10
00 0 20 40 60 80
Number of pillars excavated
Figure A-2 Stress in central pillar calculated by tributary area and pressure arch theories compared with an elastic numerical model
-10
Figure A-3 Stress difference from elastic numerical model for pillar stress estimated by pressure arch and tributary area theories Average absolute stress difference for pillar stress estimated with pressure arch theory is 030 MPa and with tributary area theory is 237 MPa
5
55
6
65
7
75
0 5 10 15 20 25
Pillar
Pill
ar s
tres
s (M
Pa)
MinCad PA theory TA theory
Figure A-4 pillar stresses predicted by pressure arch theory (left) and stresses predicted by pressure arch theory tributary area theory and MinCad model (right) Average absolute percentage variation from modelling results is 75 PA theory and 108 TA theory
After the 1988 subsidence event at Collingwood Park a numerical model was constructed with the code MINCAD and reported in [Wardel 1989] Stresses predicted by this numerical model PAt and TAt are made in Figure A-4
Comparison with Duncan St FLAC3D model constructed for this project is made in Figure A-5
3
35
4
45
5
55
6
65
7
75
8
0 10 20 30 40 50 Pillar
Pilla
r stre
ss (M
Pa)
Num Mod elas szz PA theory TA stress
Figure A-5 Predicted pillar stress from numerical model of Duncan St region Pressure Arch (PA) theory and Tributary Area (TA) theory TA theory with constant bord width of 66m (mine plan shows 66m+ bord) Average absolute stress difference is 03MPa for PA theory and 14MPa for TA theory
A3 BENCHMARKING OF NUMERICAL MODEL
The pillar strength equation derived from the combined databases of Australia and South Africa is used to benchmark the numerical model This equation which is the same as equation (3) above rewritten for convenience
Pillar strength = 688 w050 h070 (3)
A typical pillar from the Duncan St region of Collingwood Park has a side length of 20m internal acute angle in the range of 50-54 degrees The excavation or pillar height is 6m+ and depth of cover is 124m as shown in the mine pillar plan of Figure A-6
Figure A-6 Typical pillar with dimensions in the Duncan Street subsidence region Highlighted outline is the location of the 3D model Depth of cover is approximately 124m and pillar height is 6m+
The code FLAC3D (F3D) by Itasca Consulting Group [Itasca 2006] has been used for all numerical models F3D is a continuum code with yield criteria suitably flexible for modelling the full stressstrain response of coal type materials Only a quarter section of the bord and pillar array needs to be modelled once symmetry conditions are enforced in both x and y directions as shown in Figure A-7 Notice that only partial parts of the roof and floor have been considered
Figure A-7 A sketch of F3D mesh showing a quarter of a pillar as well as roof and floor and boundary conditions
A strain softening yield criterion has been used for coal and rock materials modelling In other words Mohr-Coulomb material model with non-associated shear and associated tension flow rules [Fama 1995 Itasca Consulting Group Inc 2006 Pietruszczak 1980 Hoke 1990] has been used In this model the parameters representing material cohesion friction dilation and tensile strength may reduce or soften after the onset of plastic yield by a user defined piecewise linear function [Jiang 2009 Zhou 2009] as displayed in Figure A-8 It is assumed that the roof and floor rock masses are elastic and only coal pillar is allowed to behave both elastically and plastically All model material parameters are listed in Table A-1 To achieve a reasonable match with the strength formula of Equation (3) for a width to height ratio greater than 4 it was found that it is necessary to have an explicit yielding interface or joint at the pillar boundaries on both the roof and the floor contact areas The interface properties are listed in Table A-2
Coal properties for the numerical model are estimated from the reported literature values and from calibration analyses by matching Equation (3) for the range of width-to-height ratios from 2 to 4 These numerical results are compared with Equation (3) in Figure A-9
00
02
04
06
08
10
12
Coh
esio
n (M
Pa)
29
30
31
32
33
34
35
36
37
Fric
tion
Ang
le (deg
)
Cohesion (MPa) Friction Angle (deg)
0 1 2 3 4 5 6 7 8 9 10 Plastic strain ()
Figure A-8 Variation of cohesion and friction angle with plastic strain
Table A-1 Mechanical parameters used in numerical models
Property
Youngs Modulus
(GPa) Poissonrsquo s ratio
UCS (MPa)
Tensile Strength (MPa)
Original value (MPa)
Cohesion
Softening rate ()
Residu al value (MPa)
Original value (deg)
Friction Angle
Softening rate ()
Residual value (deg)
Dilation Angle
(deg)
Coal 110 030 40 004 102 5 0102 360 05 300 60
Roof 570 019
Floor 797 024
from CSIRO report 42 Roof and floor materials are assumed elastic
Table A-2 Mechanical parameters of interface used in numerical model
Interface property Normal stiffness (GPa) Shear stiffness (GPa) Cohesion (MPa) Friction Angle (deg)
Value 20 20 05 200
Pilla
r stre
ngth
(MP
a)
11
10
9
8
7
6
5
S amp M combined
Numerical results
15 20 25 30 35 40 45 wh ratio
Figure A-9 FLAC3D parametric study to match pillar strength with the analytical formula of Salamon amp Munro (combined Australian and South African version)
A4 PILLAR STRENGTH INCLUDING FULL STRESS STRAIN CURVE AND PILLAR SHAPE EFFECTS
A41 Post peak strength
Das [Das 1986] has presented work on the post peak strength for Indian coals at various width-to height ratios His results show some variability but have a general correlation between post peak strength and increasing wh ratio Beyond a certain wh ratio of approximately 5 to 8 Dasrsquos results predict that samples start to harden with increasing strain
Figure A-10 Post peak strength of Indian coal at various width-to-height ratio after Das 1986
The numerical model of a square pillar of side length 20m and variable height was compressed to approximately 10 strain to investigate post peak behaviour with increasing wh ratio for comparison with results of Das in Figure A-10 The numerical results are plotted in Figure A-11 for various width to height ratios in the range of 10 strain The post peak pattern is similar to those of Das in Figure A-10 although the numerical hardening starts at lower strains
variable height (h)
000
500
1000
1500
2000
2500
3000
000 002 004 006 008 010
Strain
Ave
rage
pill
ar s
tres
s (M
Pa)
WH=20
WH=25 WH=29 WH=33
WH=40 WH=50
WH=67 WH=100
Figure A-11 Post peak failure behaviour of numerical pillars of constant width w = 20m but
Results from the modelling of the full stress strain curve of a 20m square pillar is used to estimate the stress redistributed to neighbouring pillars in the empirical estimation of pillar FoS for the CSIRO Hazard Maps At 4 strain the percentage of peak strength carried by the coal pillar is approximated from Figure A-11 in Figure A-12 where conservatively it is assumed pillars cannot harden but only soften or retain strength
00
200
400
600
800
1000
1200
20 40 60 80 100
Width to height ratio
R e s
idua
l s tr
e ngt
h (
)
residual strength
Figure A-12 Estimation of pillar residual strength at 4 strain
A42 Pillar shape influence on strength
Collingwood Park has many pillars of regular and irregular shapes including square rectangle diamond triangular and other polygon shapes A study of some of these shapes at fixed 6m mining height was conducted
As discussed in [Galvin 1981] with reference to physical models there is a subtle difference in model response at specific width to height ratios depending on whether the width or height of the model is fixed This variation is attributed by Galvin to volume stiffness and pillar end effect variation between width and height changes In the Collingwood Park single pillar studies generally the width is fixed at 20m and width-to-height changes are achieved with height variations and material properties are calibrated to this In studies of diamond and other shaped pillars where the width or effective width varies a unique set of material properties calibrated over width-to-height 2 to 4 at fixed height is developed Table A-3
Attempt is made to keep the constant 05m cube element size although for some of the shapes studied this is not possible and where meshing options exist priority is given to minimizing the variability from the standard element size Ideally the soften rate of the yield criteria would be adjusted based on an element characteristic length Implementation of this reduced mesh dependent errors but it was not felt sufficiently rigorous for inclusion in this report
Table A-3 Cohesion and friction for calibrated model at wh 2 to 4 with fixed 6m pillar height
Property Original value (MPa)
Cohesion
Softening rate ()
Residual value (MPa)
Original value (deg)
Friction Angle
Softening rate ()
Residual value (deg)
Dilation Angle (deg)
Coal 123 35 023 360 05 300 60
Diamond shaped pillars
Diamond pillar shapes located at Duncan St and adjacent areas have typical dimensions of side length 20-30m and minimum acute internal angles of 50 degrees
The area perimeter or circumference (C) of a diamond shape is given by
Circumference = C = 4 w
where w is the side length If the acute internal angle is θ the area can be calculated as follows
Area = A = w2 sin θ
The minimum width or thickness of the cross section is
Minimum width = w sin θ
Hence the effective width weff from the analogy of ldquohydraulic radius = 4ACrdquo defined earlier is given by
weff = 4AC = w sin θ = minimum width
Figure A-13 Predicted pillar strength for diamond shaped pillars at 6m mining height Error at 50 deg internal angle is approximately 6
Polygon with one acute corner
Figure A-14 (a) and (b) show a comparison between theory and numerical model for a polygon with one acute angle
(a) (b)
Figure A-14 (a) Polygon with one acute side (60deg acute angle in figure) Base side length = 40m short side 20m mining height = 6m and (wh 44-38)
Rectangular pillar being split at mid-length in 1m increments
A rectangular pillar of 30m by 10m is modelled as it is split by a 5m roadway
(a) (b)
Figure A-15 (a) Rectangle 30m by 10m being split in 1m increments Note symmetry plane on left hand boundary Mining height 6m (b) Results from numerical model and Strength formula with w=4AC
Triangular shape pillars with two equal sides of 20m
In this example a triangular pillar with two sides of equal length of 20m is analysed
(a) (b)
Figure A-16 (a) Triangular pillar of two equal sides of 20m each Mining height 6m (b) Results from numerical model and strength formula with w=4AC Maximum error is approximately 5
Observations from study of pillar shapes
The general conclusion from the study of pillar shapes at fixed 6m mining heights is that the hydraulic radius analogy of Wagner Equation (4) where the effective width is estimated by area and circumference is applicable to pillars of Westfalen No 3 colliery Errors with this approach at calculating pillar width for width-to-height ratios from approximately 2 to approximately 4 for the shapes studied are under 6
A43 Realistic roof geology
It is recognised that the idealised roof and floor of the pillar model Figure A-7 may have an influence on the predicted strength estimation To quantify this effect a model of a 20m square pillar at width-to-height ratiorsquos of 22 to 4 is analysed with a realistic roof geology
Based on the sonic logging data in borehole CP-C02 located in the failure region of Duncan Street Figure A-17 pillar strength is estimated from a numerical model with the model input parameters selected from the scanned roof geological and geotechnical data The input data are listed in Error Reference source not found and Table A-4 The F3D mesh for a pillar analysis is shown in Figure A-18 and the numerical results for two set of parameters for roof geology are shown in Figure A-19
Table A-4 Mechanical properties of roof and overburden rocks
Youngs Poissonrsquos UCS Tensile Strength CohesionBackfill Modulus Friction Angle (deg)Ratio (MPa) (MPa) (MPa)(GPa)
Sandstone 135 012 25 25 6648 40
Siltstone 195 020 15 15 4728 38
Interbedded 166 017 20 20 2808 38
Mudstone 875 026 10 10 1943 30
UCS Depth (m) (MPa) Geology Scaled UCS (MPa) 1005 7500 sandstone1 2500 1010 1015
6000 6750
interbedded1 2000 2250
1020 1025
7500 9000
sandstone2 2500 3000
1030 6750 interbedded2 2250 1035 4500 siltstone1 1500 1040 5250 interbedded3 1750 1045 4500 siltstone2 1500 1050 1055
225 2250
coal1 750 750
1060 1065
8250 9000
sandstone3 2750 3000
1070 3750 siltstone3 1250 1075 5250 1750 1080 6000 interbedded4 2000 1085 6000 2000 1090 3750 siltstone4 1250 1095 3000 1000 1100 3000 mudstone1 1000 1105 3000 1000 1110 3750 1250 1115 4500 siltstone5 1500 1120 3750 1250 1125 2000 coal2 667 1130 5250 interbedded5 1750 1135 7500 sandstone4 2500 1140 1145
6000 5250
interbedded6 2000 1750
1150 8250 2750 1155 9000 3000 1160 10500 3500 1165 13500 4500 1170 10500 sandstone5 3500 1175 10125 3375 1180 10500 3500 1185 9750 3250 1190 7500 2500 1195 3750 siltstone6 1250 1200 1500 coal3 500 1205 1210
7875 8625
sandstone6 2625 2875
1215 5250 interbedded7 1750 1220 1225
9000 10500
sandstone7 3000 3500
1230 6000 interbedded8 2000 1235 3000 mudstone2 1000 1240 3750 siltstone7 1250
Figure A-17 Sonic log of borehole CP-C02 and roof geological interpretation
Figure A-18 Numerical model of a coal pillar with representative floor and roof rock geology
4 5 6 7 8 9 10 Pillar height (m)
Figure A-19 Comparisons of pillar strength versus pillar height for realistic and simplified roof geology Maximum error is 45
Modelling predicted that the maximum difference in pillar strength for two different roof geology conditions is approximately 45 at the lower height of 6m reducing to less than 1 for pillars of 9m mining height
It is concluded from this study that the simplified roof and floor model satisfactorily estimates pillar strength allowing in excess of 180 numerical models to be analysed in a timely manner
60
65
70
75
80
85
90
95
100
105
Pilla
r str
engt
h (M
Pa)
Assumed geology
Real geology
A44 Pillars surrounded by roadways of variable height
It was observed in the 1983 pillar site investigation [Hollingworth Dames amp Moore 1990] that mining heights at Westfalen No 3 are extremely variable with roadways surrounding individual pillars varying by up to 2m
To investigate the strength of pillars of variable height a 20m wide square model pillar of 8m mining height on one side and 6m height on the directly opposite side of the pillar as shown in Figure Ashy20 has been analysed
Figure A-20 Different views of the numerical modelling mesh of a trapezoidal-square pillar - Model is 8m high on one side and 6m on the other opposite side
Predicted strength of the variable height pillar together with stress-strain curves for pillars of 6m 7m and 8m mining heights presented in Figure A-21 As shown in the figure the predicted strength of a non-uniform-height pillar of trapezoidal shape having 6m and 8m side heights approximates a uniform-height pillar with a constant height of 7m
0
1
2
3
4
5
6
7
8
9
10
Axia
l stre
ss (M
Pa)
Trapezoid pillar
6m pillar 7m pillar
8m pillar
0000 0010 0020 0030 0040 0050
Axial strain
Figure A-21 Stress vs strain curves for rectangular uniform height and trapezoidal non-uniform height pillars Strength of uniform pillars having heights of 6m 7m and 8m are compared with a trapezoidal non-uniform height pillar of having 6m height on one side and 8m on the other opposite side ie a variable height roadway of average 7m height
A45 Pillars created by multiple passes to variable depth
Roadways at Westfalen No 3 colliery were cut in multiple passes at a constant height of 24 m The cut widths were variable ranging from 52 m at the bottom to 76 m at the top as shown schematically in Figure A-22 by the mine managerrsquos hand drawings of the roadway mining method
To asses the strength of such pillars a 9 m high pillar with irregular side surface boundary is modelled Figure A-23 The model pillar has a square base of 23m and side length with three lsquocutsrsquo in its height as shown in Figure A-23
Predicted strength is approximately equal to a similar pillar with effective width equal to minimum width ie 20m in this case Figure A-24
Figure A-22 Sketch of roadways at Collingwood Park showing multiple passes or layers of cutting of the coal seam(from previous mine managersrsquo notes and records)
Figure A-23 Numerical modelling of a multi-pass cut pillar of 9 m height with minimum and maximum side widths of 20m and 23m respectively
0
1
2
3
4
5
6
7
8
Axi
al s
tres
s (M
Pa)
irregular pillar-min w idth 20m high and 9m w ide
square pillar-20m w ide and 9m high
0000 0005 0010 0015 0020 0025 0030 0035 0040
Axial strain
Figure A-24 Stress vs strain curves for pillars of 9m height with regular and irregular square cross-section (Figure A-23) Difference in peak strength predicted to be approximately 35
A5 ROADWAY BACKFILL AND PILLAR STRENGTH IMPROVEMENT
A literature review of backfill applications mechanical properties and behaviours in coal mining identified several examples from China [Guo 2007 Wang 2009] where backfill has been used to reduce surface subsidence from America [Tesarik 2002 2009] where backfill has been used primarily for disposal of fly-ash and reduce acid mine drainage and from Australia [Origin Alliance 2008] - See Table A-5 and the reference list
In the early stages of this modelling specific data and backfill effects and properties required in this numerical study were unavailable and therefore two cases were considered a cohesive backfill having a UCS of 1 MPa and a non-cohesive backfill with no cohesion but a friction angle of 42 degrees Subsequent to these two cases a case of 05MPa cohesive backfill mix was also considered
Backfill properties using in this study are list in
Table A-6
Table A-5 Backfill properties data from various sources
Composition UCS (MPa) E (GPa) Reference
Solid waste including fly-ash 05 initially
to 14-17
0565 Guo et al 2007
Fly-ash amp cement 339 ndash 824 Guo et al 2007
1 4 15 (cement) (fly-ash) (coal
gangue)
07 ndash 17 Wang et al 2009
Fly ash (dry) Scheetz 2009
22 1 (fly-ash) (cement) Scheetz 2009
Cemented rockfill in metal mine 69 1909 Tesarik 2009
Required properties 10 10 OriginAlliance ndash Mine
subsidence interpretive
reporting
P16
25 FA 105 sand 01 bentonite
5 FA 18 sand
Injection 3m intervals
Bell Bruyn 1999
Table A-6 Mechanical parameters of cohesive and non-cohesive backfill used in this numerical
study
Backfill Youngs Modulus (GPa)
Poissonrsquos Ratio UCS
(MPa)
Tensile Strength (MPa)
Cohesion (MPa)
Friction Angle (deg)
Dilation Angle (deg)
1MPa
Cohesive 0565 040 10 01 0117 400 100
05MPashy
cohesive 0565 040 05 005 0061 400 100
Non-
cohesive 0020 015 00 00 0000 420 75
A51 Numerical results and analysis
In order to quantify the influence of backfill on pillar strength in detail 180 models (60 models each for 1MPa 05MPa cohesive and non-cohesive backfill) of square coal pillars were analysed with the following parameters pillar width is 20m mining height is from 5m to 10m equivalent to a wh ratio of 2 to 4 percentage of backfill is from 0 to 90 Table A-7 summarises the results of these pillar strength analyses for all the cohesive and non-cohesive cases
Relationship between pillar strength and percentage of roadway backfill is presented in Figure Ashy25 Figure A-27 and Figure A-29 The raw data from Table A-7 has been calculated in uniform 10
backfill increments and is presented in Figure A-26 Figure A-28 and Figure A-30 As shown in these figures the percentage increase in pillar strength is approximately bilinear with increase in backfill
00
200
400
600
800
1000
1200
1400
1600 P
illar
stre
ngth
incr
ease
()
5m 6m 7m 8m 9m 10m
00 100 200 300 400 500 600 700 800 900 1000
Percentage of bacfill ()
Figure A-25 Pillar strength increase versus percentage of 1MPa cohesive backfill
00
200
400
600
800
1000
1200
1400
1600
Pill
ar s
tren
gth
incr
ease
()
10 backfill
20 backfill
30 backfill
40 backfill
50 backfill
60 backfill
70 backfill
80 backfill
90 backfill
4 5 6 7 8 9 10 11 12 Pillar height (m)
Figure A‐26 Pillar strength increase versus pillar height for 1MPa cohesive backfill
Table A-7 Pillar strength with increasing 1MPa and 05MPa cohesive backfill and non-cohesive backfill
Pillar strength Backfill
Approximate percentage of backfill
() 5 6
Pillar height (m)
7 8 9 10 Pillar
strength Without backfill 0 1007(00) 894(00) 795(00) 714(00) 647(00) 596(00)
(MPa) for different percentshyage of
10 20 30
1049(100) 1104(200) 1140(300)
940(83) 983(167)
1069(333)
833(71) 909(214) 947(286)
785(125) 820(188) 889(313)
720(111) 771(222) 803(278)
650(100) 710(200) 758(300)
backfill 1MPa 40 1205(400) 1130(417) 1046(429) 929(375) 869(389) 824(400)
Cohesive 50 1234(500) 1178(500) 1095(500) 1016(500) 943(500) 894(500) backfill 60 1292(600) 1208(583) 1143(571) 1098(625) 1009(611) 956(600)
70 1342(700) 1271(667) 1270(714) 1158(688) 1120(722) 1035(700) 80 1466(800) 1442(833) 1350(786) 1345(813) 1309(833) 1180(800) 90 1593(900) 1580(917) 1556(929) 1470(875) 1440(889) 1400(900) 10 1026(100) 930(83) 830(71) 773(125) 697(111) 636(100) 20 1081(200) 968(167) 896(214) 803(188) 754(222) 687(200) 30 1132(300) 1053(333) 939(286) 871(313) 786(278) 741(300)
05MPa 40 1184(400) 1098(417) 1018(429) 901(375) 853(389) 799(400) Cohesive 50 1217(500) 1141(500) 1065(500) 1000(500) 936(500) 873(500)
backfill 60 1240(600) 1167(583) 1102(571) 1054(625) 1009(611) 954(600) 70 1269(700) 1189(667) 1237(714) 1093(688) 1044(722) 1014(700) 80 1322(800) 1280(833) 1167(786) 1143(813) 1105(833) 1061(800) 90 1410(900) 1350(917) 1250(929) 1202(875) 1150(889) 1120(900)
Non-cohesive backfill
10 20
1016(100) 1028(200)
902(83) 912(167)
801(71) 819(214)
724(125) 732(188)
657(111) 670(222)
604(100) 615(200)
30 1044(300) 941(333) 832(286) 753(313) 678(278) 629(300)
Pillar strength Backfill
Approximate percentage of backfill
() 5 6
Pillar height (m)
7 8 9 10
40 1063(400) 961(417) 865(429) 767(375) 702(389) 649(400) 50 1086(500) 984(500) 885(500) 800(500) 729(500) 670(500) 60 1113(600) 1006(583) 904(571) 835(625) 760(611) 696(600) 70 1138(700) 1030(667) 943(714) 852(688) 792(722) 725(700) 80 1168(800) 1083(833) 963(786) 889(813) 829(833) 765(800) 90 1206(900) 1130(917) 1029(929) 913(875) 852(889) 804(900)
Figure A-27 Pillar strength increase versus pillar height for 05MPa cohesive backfill
4 5 6 7 8 9 10 11 12 13 Pillar height (m)
Figure A-28 Pillar strength increase versus percentage of 05MPa cohesive backfill
0
10
20
30
40
50
60
70
80
90
100
Pilla
r st
reng
th in
crea
se (
) 10 backfill
20 backfill
30 backfill
40 backfill
50 backfill
60 backfill
70 backfill
80 backfill
90 backfill
00
50
100
150
200
250
300
350
400
Perc
enta
ge o
f pill
ar s
tren
gth
incr
ease
()
5m
6m
7m
8m
9m
10m
00 100 200 300 400 500 600 700 800 900 1000
Percentage of bacfill ()
Figure A-29 Pillar strength increase versus percentage of non-cohesive backfill
00
50
100
150
200
250
300
350
400
Pilla
r st
reng
th in
crea
se (
)
10 backfill
20 backfill
30 backfill
40 backfill
50 backfill
60 backfill
70 backfill
80 backfill
90 backfill
4 5 6 7 8 9 10 11 12 Pillar height (m)
Figure A-30 Pillar strength increase versus pillar height for non-cohesive backfill
The modelling results suggest that the pillar strength will increase with increasing roadway backfill while the percentage increase of pillar strength is greater for the taller pillars than squat pillars it is observed that when the backfill is less than 40-50 the pillar strength increase is less sensitive to pillar height or wh ratio while over 40-50 backfill pillar strength rapidly increase with pillar height
A52 Comparison of three different kinds of backfill
Pillar strength improvement with 05 and 10 MPa cohesive backfill and non-cohesive backfill is presented in Figure A-31 to Figure A-33
0
10
20
30
40
50
60
70
Incr
ease
of p
illar
str
engt
h (
) 5m-00MPa
5m-05MPa
5m-10MPa
0 10 20 30 40 50 60 70 80 90 100
Percentage of backfill ()
Figure A-31 Comparison of 05 and 10 MPa cohesive backfill and non-cohesive backfill at 5m mining height
0
20
40
60
80
100
120
Incr
ease
of p
illar
str
engt
h (
)
7m-00MPa
7m-05MPa
7m-10MPa
0 10 20 30 40 50 60 70 80 90 100
Percentage of backfill ()
Figure A-32 Comparison of 05 and 10 MPa cohesive backfill and non-cohesive backfill at 7m mining height
Incr
ease
of p
illar
str
engt
h (
)
140
120
100
80
60
40
20
0
9m-00MPa
9m-05MPa
9m-10MPa
0 10 20 30 40 50 60 70 80 90 100
Percentage of backfill ()
Figure A-33 Comparison of 05 and 10 MPa cohesive backfill and non-cohesive backfill at 9m mining height
Modelling predicts that 05MPa is as effective as 10MPa at increasing pillar strength below approximately 50-60 roadway fill Modelling suggests that cohesive backfill is more effective at increasing pillar strength than non-cohesive fill
A53 Numerical study of the influence of interface between backfill and pillar
To investigate the influence of an interface between backfill and pillar on the strength response of coal pillar an interface is set between backfill and pillar as shown in Figure A-34 The interface property is list in Table A-8
Figure A-34 Sketch showing the position of interface between backfill and pillar
2
4
6
2
4
6
Table A-8 Mechanical parameters of interface used in numerical model
Interface Cohesion FrictionNormal stiffness (GPa) Shear stiffness (GPa) property (MPa) Angle (deg)
Value 20 20 0 5~40
Pillar strength of a 6m high pillar as interface friction angle is increased from 5 degrees to 40 degrees is displayed in
1212
1010
88
cohesive backfill with interface
cohesive backfill without interface
non-cohesive backfill with interface
non-cohesive backfill without interface
4 cohesive backfill with interface
cohesive backfill without interface
non-cohesive backfill with interface
non-cohesive backfill without interface
stre
ss (M
Pa)
stre
ss (M
Pa)
6
2
00 0000 0005 0010 0015 0020 0025 0030 0035 0040 0045 0000 0005 0010 0015 0020 0025 0030 0035 0040 0045
strain strain
Figure A-35 to Figure A-38
Modelling predicts a non-cohesive interface with friction angle below 20 degrees results in a slight reduction in pillar strength above 20 degrees the interface is predicted to have little influence on pillar strength
cohesive backfill with interface
cohesive backfill without interface
non-cohesive backfill with interface
non-cohesive backfill without interface
1212
1010
88
cohesive backfill with interface
cohesive backfill without interface
non-cohesive backfill with interface
non-cohesive backfill without interface
stre
ss (M
Pa)
stre
ss (M
Pa)
6
4
2
0 0
0000 0005 0010 0015 0020 0025 0030 0035 0040 0045 0000 0005 0010 0015 0020 0025 0030 0035 0040 0045
strain strain
Figure A-35 Post peak pillar for 6m high pillar (wh=33) with friction angle 5deg on left 10deg on right of interface between backfill and pillar
2
4
6
cohesive backfill with interface
cohesive backfill without interface
non-cohesive backfill with interface
non-cohesive backfill without interface
1212
1010
88
cohesive backfill with interface
cohesive backfill without interface
non-cohesive backfill with interface
non-cohesive backfill without interface
stre
ss (M
Pa)
stre
ss (M
Pa)
6 6
44
2 2
0 0 0000 0005 0010 0015 0020 0025 0030 0035 0040 0045 0000 0005 0010 0015 0020 0025 0030 0035 0040 0045
strain strain
Figure A-36 Post peak pillar for 6m high pillar (wh=33) with friction angle 15deg on left 20deg on right of interface between backfill and pillar
12
cohesive backfill with interface
cohesive backfill without interface
non-cohesive backfill with interface non-cohesive backfill without interface
12
10 10
8 8
cohesive backfill with interface
cohesive backfill without interface
non-cohesive backfill with interface
non-cohesive backfill without interface
stre
ss (M
Pa)
stre
ss (M
Pa)
6 6
4 4
2 2
0 0 0000 0005 0010 0015 0020 0025 0030 0035 0040 0045 0000 0005 0010 0015 0020 0025 0030 0035 0040 0045
strain strain
Figure A-37 Post peak pillar for 6m high pillar (wh=33) with friction angle 25deg on left 30deg on right of interface between backfill and pillar
12
cohesive backfill with interface
cohesive backfill without interface
non-cohesive backfill with interface non-cohesive backfill without interface
12
10 10
8 8
cohesive backfill with interface
cohesive backfill without interface
non-cohesive backfill with interface
non-cohesive backfill without interface
stre
ss (M
Pa)
stre
ss (M
Pa)
6
4
2
0 0000 0005 0010 0015 0020 0025 0030 0035 0040 0045
0 0000 0005 0010 0015 0020 0025 0030 0035 0040 0045
strain strain
Figure A-38 Post peak pillar for 6m high pillar (wh=33) with friction angle 35deg on left 40deg on right of interface between backfill and pillar
22
6
8
24
A54 Post peak pillar strength
A full stress strain curve to approximately 35 strain is presented in the following figures for 1MPa cohesive and non-cohesive backfill Results for 05MPa cohesive backfill sit approximately mid-way between these two cases and are included in the summary Table A-9
24 24
0000 0010 0020 0030 0040 0050
Average axial strain of coal pillar
000
2000
3000
4000
5000
6000
7000
8000
9000
22
0000 0010 0020 0030 0040 0050
Average axial strail of coal pillar
000
2000
3000
4000
5000
6000
7000
8000
9000
20 20
18
Ave
rage
str
ess
of c
oal p
illar
(MPa
)
Ave
rage
str
ess
of c
oal p
illar
(MPa
)
18
16 16
1414
12 12
1010
88
66
44
22
00
Figure A-39 Post peak pillar strength with increasing backfill 5m high pillar (wh=40) with 1MPa cohesive backfill on left non-cohesive backfill on right
24
22
0000 0010 0020 0030 0040 0050
Average axial strain of coal pillar
00
250
333
417 500
583
667 833
917
22
0000 0010 0020 0030 0040 0050
Average axial strain of coal pillar
00
250 333
417
500 583
667
833
917
20 20
Ave
rage
str
ess
of c
oal p
illar
(MPa
)
18 18
16 16
14 14
12 12
10 10
8
6
4 4
2 2
0 0
Figure A-40 Post peak pillar strength with increasing backfill 6m high pillar (wh=33) with cohesive backfill on left non-cohesive backfill on right
Aver
age
stre
ss o
f coa
l pill
ar (M
Pa)
4
6
8
10
12
14
16
18
2
4
6
8
0000 0005 0010 0015 0020 0025 0030 0035 0040 0045
Average axial strain of coal pillar
000
2140
2860
4290
5000
5710
7140
7860
9290
2020
0000 0005 0010 0015 0020 0025 0030 0035 0040 0045
Average axial strain of coal pillar
000
2140
2860
4290
5000
5710
7140
7860
9290
18
Ave
rage
str
ess
of c
oal p
illar
(MPa
) A
vera
ge s
tres
s of
coa
l pill
ar (M
Pa)
Aver
age
stre
ss o
f coa
l pill
ar (M
Pa) 16
14
12
10
8
6
4
22
00
Figure A-41 Post peak pillar strength with increasing backfill 7m high pillar (wh=29) with cohesive backfill on left non-cohesive backfill on right
14 14
0
000
2500
3130
3750
5000 6250
6880
8130
8750
0
000
2500
3130
3750
5000
6250
6880
8130
8750
12 12
10
Ave
rage
str
ess
of c
oal p
illar
(MPa
)
10
8
6
4
2
0000 0010 0020 0030 0040 0050 0000 0010 0020 0030 0040 0050
Average axial strain of coal pillar Average axial strain of coal pillar
Figure A-42 Post peak pillar strength with increasing backfill 8m high pillar (wh=25) with cohesive backfill on left non-cohesive backfill on right
2
4
6
8
10
12
14
2
4
6
8
14
12
Ave
rage
str
ess
of c
oal p
illar
(MPa
) A
vera
ge s
tres
s of
coa
l pill
ar (M
Pa)
0
000 2220 2780 3890 5000 6110 7220 8330 8890
0
000 2220 2780 3890 5000 6110 7220 8330 8890
Ave
rage
str
ess
of c
oal p
illar
(MPa
)
10
8
6
4
2
0000 0005 0010 0015 0020 0025 0030 0035 0040 0000 0005 0010 0015 0020 0025 0030 0035 0040
Average axial strain of coal pillar Average axial strain of coal pillar
Figure A-43 Post peak pillar strength with increasing backfill 9m high pillar (wh=22) with cohesive backfill on left non-cohesive backfill on right
12 12
0
000 2500
3000 4000
5000 6000
7000 8000
9000
0
000
2500
3000
4000
5000
6000
7000
8000
9000
10
Ave
rage
str
ess
of c
oal p
illar
(MPa
) 10
8
6
4
2
0000 0005 0010 0015 0020 0025 0030 0035 0000 0005 0010 0015 0020 0025 0030 0035
Average axial strain of coal pillar Average axial strain of coal pillar
Figure A-44 Post peak pillar strength with increasing backfill 10m high pillar (wh=20) with cohesive backfill on left non-cohesive backfill on right
The amount of backfill to achieve the transition between strain softening and hardening is presented in Table A-9 for all mining height The values in this table are estimated from the stress-strain curve analysed to 35 of strain and are depended on the backfill increment which is in turn dependent on the ratio of mining height to the calibrated element size 05m
Table A-9 Percentage of roadway backfill that leads to a transition from strain softening to hardening
Pillar height Non-cohesive 05MPa Cohesive 10MPa Cohesive backfill backfill backfill
5m 300 200 200
6m 500 417 333
7m 571 500 429
8m 625 625 500
9m 722 722 611
10m 800 800 700
The modelling results suggest that the average axial stress of coal pillar increases with compression until peak stress is reached In the post-failure region pillar stress is reduced as strain increases for all models without backfill All the model results predict that there would be a change to strain hardening behaviour as percentage of backfill increases For example this transition point is 333 for 10 MPa cohesive backfill while 50 for non-cohesive backfill with 6m mining height as shown in Table A-9 It can also be seen from Table A-9 that tall pillars need more backfill than squat pillars to achieve the change from strain softening to hardening for either cohesive backfill or non-cohesive backfill
A55 Backfill for diamond shaped pillars
A 7m high diamond shaped pillar with 50 degree skew angle is analysed with increasing level of backfill in surrounding roadways On the skewed angle the backfill is constrained with roller boundary conditions normal to the skewed angle to represent symmetry conditions and a 5m wide roadway
Figure A-45 Numerical model of diamond shaped pillar with backfill on left and boundary conditions on right
The predicted strength of a diamond shaped pillar and equivalent square pillar with increasing roadway backfill of both cohesive and non-cohesive models is presented in Figure A-46 and Figure A-47
6
7
8
9
10
11
12
13
0 10
Pilla
r str
engt
h (M
Pa)
20 30 40 50 60 70 80 90 100
Percentage of backfill ()
Skew pillar
Square pillar
0
10
20
30
40
50
60
70
0 10
Incr
ease
of p
illar
str
engt
h (
)
20 30 40 50 60 70 80 90 100
Percentage of backfill ()
Skew pillar
Square pillar
Figure A-46 Predicted pillar strength of diamond and square shaped pillars with increasing percentage of 1MPa cohesive backfill On left is absolute strength and on right is percentage strength increase
6
7
8
9
10
11
0 10
Pilla
r stre
ngth
(MP
a)
20 30 40 50 60 70 80 90 100
Percentage of backfill ()
Skew pillar
Square pillar
0
5
10
15
20
25
30
35
0 10
Incr
ease
of p
illar
str
engt
h (
)
20 30 40 50 60 70 80 90 100
Percentage of backfill ()
Skew pillar
Square pillar
Figure A-47 Predicted pillar strength of diamond and square shaped pillars with increasing percentage of non-cohesive backfill On left is absolute strength and on right is percentage strength increase
A56 Backfill placed after significant pillar yield
A pillar model with 90 non-cohesive backfill placed after yielding of a 7m high pillar is presented in Figure A-48 The percentage of strength increase is given in Table A-10 It is found that the pillar strength increase is lower if the pillar has undergone significant deformation before the placement of backfill It is predicted that 90 backfill results in a strain-hardening pillar behaviour even if the pillar has previously yielded significantly
Ave
rage
stre
ss o
f coa
l pill
ar (M
Pa)
18 without backfill 025 strain 050 strain
14
16
075 strain 100 strain
12 125 strain 150 strain
10 175 strain 200 strain
8
6
4
2
0 0000 0005 0010 0015 0020 0025 0030 0035 0040 0045 0050
Average strain of coal pillar
Figure A-48 Stress strain curves for backfill placed around the pre-strained pillar displaying state of pillar core upon placement of backfill
Table A-10 Pillar strength increase with 90 non-cohesive backfill placed around a pre-strained 7m high square pillar of 20m width
Percentage backfill ()
Strain at placement of non-cohesive backfill ()
Pillar strength (MPa)
Percentage increase in peak
strength ()
Percentage increase in post-peak
strength at 3 strain ()
0 000 7953 000
90 000 10290 2939
90 025 9156 1513
90 050 8965 1272
90 075 8526 720
90 100 7945 26006
90 125 7951 22608
90 150 7951 18917
90 175 7951 15629
90 200 7951 11134
A6 3D MODEL OF DUNCAN ST FAILURE PANEL
A61 Numerical model
A three dimensional model of 46 pillars in the Duncan St subsidence region has been analysed with over burden geology based on hole CP1 and a constant overburden depth of 124m Figure A-49 Figure A-50 and Figure A-51 Uniform mining heights of 6m and 9m have been analysed
Selection of the pillars to be analysed is based on visual inspection of the panel layout and includes pillars bounded by unmined coal to the west the waterline barrier pillar to the east larger pillars to the south and a panel of slightly larger pillars of different orientation to the north
One row of pillars in the middle of this panel trending from north-west to south-east are of smaller dimension than the average and of diamond shape with acute internal angle of approximately 50degrees Being in the approximate middle of the panel close to full tributary area load will be mobilised on this row of pillars and therefore it is believed pillars in this row initiated the 2008 subsidence event
The Duncan Street numerical model has the following objectives
bull Estimation of pillar stresses and FoS for comparison with empirical formula
bull Comparison of backfill response at panel scale with previous single pillar studies
bull Estimation of surface subsidence at given percentage roadway fill
bull Estimation of extent of abutment stresses due to panel failure
A62 Observations from Duncan Street numerical model
bull At 6m mining height the minimum pillar FoS for these 46 pillars is calculated to be 131 using Pressure Arch theory and UNSW strength formula panel failure is not predicted with this mining height by the model At 9m mining height the minimum FoS is calculated as 099 and panel failure is predicted to occur
bull The probability of pillar failure for associated FoS calculated by the UNSW pillar strength formula Eq(2) is given in Galvin 2006 in Table A-11 The relationship was developed for square pillars using the Australian pillar database and tributary area theory and hence theoretically speaking may not directly apply to this study However it can be taken as a general guide
bull From Table A-11 it is seen that there is a 1 in 20 probability of instability at 6m mining height and a 1 in 2 probability at 9m mining height Numerical modelling is however a deterministic approach and it always predicts failure if the FoS is less than 10 and stability if FoS gt 10 since no variation in geotechnical properties or conditions is used
bull Although our numerical models predict no pillar failure at 6m and panel failure at 9m in reality there remains approximately a 1 in 20 chance of failure at 6m mining height If one pillar was to fail load transferred to adjacent pillars would reduce the FoS of these adjacent pillars and could lead to the pillar failure and subsidence as observed at 2008 event region
Table A-11 Factor of safety failure probabilities for UNSW pillar strength formula
(after Galvin 2006)
Safety Factor Probability of pillar failure
087 8 10
100 5 10
122 1 10
130 5 100
138 2 100
144 1 100
163 1 1000
179 1 10000
195 1 100000
211 1 1000000
bull Based on the numerical results obtained using two mining heights the pillar and overburden failure is consistent with analytical predictions from Pressure Arch theory and UNSW pillar strength calculation
bull Surface subsidence predicted from the numerical model with a mining height of 9m is 196m While this value is in approximate agreement with monitoring data (14mshy15m) the model was not sufficiently calibrated since the real mining height in the region is uncertain to be able to confidently predict final subsidence strains and tilts at the site
bull With 1MPa cohesive backfill at a roadway fill ratio of 83 the predicted strength increase is 70 With non-cohesive backfill at the same fill ratio the strength increase is 20 These values are in agreement with the results for single pillars
bull The numerically predicted surface subsidence with 83 roadway fill is 022m Maximum predicted tilt in east-west direction is 7mmm and in north-south direction is 5mmm Analytical formula [Holla amp Barclay 2000] predict maximum tilt of 53mmm for this amount of subsidence
bull Isolated cohesive backfill surrounding pillars of low wh ratio is predicted to be effective in confining the pillar and increasing peak pillar strength and panel stability Isolated non-cohesive backfill without barriers could not be analysed in this numerical model as backfill lsquoflowsrsquo and numerical stability could not be achieved
bull Stress transfer in the immediate roof sandstone unit (above the coal roof) is predicted to extend approximately 80m beyond the limits of the collapsed panel This is in reasonable agreement with theoretical studies
Figure A-49 Duncan St modelled panel with outline of adjacent modelled panel location of representative open hole CP1 file named ldquoAppendix B2 open hole logsrdquo located in directory ldquoCollingwood Park Subsidence 2B Collingwood Park Mine Subsidence Reports 1988 Eventsrdquo and mine subsidence limit contour
A63 Model properties
Overburden geology is based on borehole CP1 the most complete interpreted available hole drilled in 1988 by Queensland Department of Mines Figure A-50 To include this in the numerical model lithological units had to be coalesced into major units of sandstone (SS) siltstone (SL) mudstone (MS) weathered units and coal Figure A-51
Rock properties for the overburden were determined from a 2D parametric study whereby the UCS of all units was scaled to achieve pillar and overburden failure at 8m mining height Table A-12 and Table A-13
Unit top depth thickness unit thickness
thickness scaled
thickness in model
000 1200 1200 1046 1000 1200 700 SS 700 610 600 1900 600 MS 600 523 500 2500 1100 SS 1300 1133 1100 3600 200 SS 000 3800 100 SL 1000 871 900 3900 100 MS 000 4000 500 000 4500 100 000 4600 100 000 4700 100 000 4800 100 SS 400 349 400 4900 300 SS 000 5200 300 SL 700 610 600 5500 100 MS 000 5600 300 MS 000 5900 400 SS 500 436 400 6300 100 SS 000 6400 400 SL SS 900 784 800 6800 100 SL MS 000 6900 100 SL 000 7000 200 SL MS 000 7200 100 SS SL 000 7300 200 SS 1000 871 900 7500 200 SL 000 7700 200 SS SL 000 7900 200 SS 000 8100 100 SL 000 8200 100 SS 000 8300 200 SL 4350 3790 3800 8500 200 SL 000 8700 100 SS 000 8800 100 COAL 000 8900 200 000 9100 100 000 9200 100 000 9300 100 SL MS 000 9400 300 SL MS SS 000 9700 100 000 9800 100 SL MS 000 9900 400 SL SS 000 10300 200 SS MS 000 10500 100 SL MS 000 10600 200 SL MS SS 000 10800 100 000 10900 400 SL MS 000 11300 400 SL SS 000 11700 100 SS MS 000 11800 300 000 12100 400 SL SS 000
SL MS MS SS
MS
MS
SL
MS SS SL SS SL MS MS
weathering
SL MS SS
12500 150 000 12650 450 850 741 750 13100 400 SS 000 13500 100 MS SL
SS SL 960 837 500
13600 200 13800 100 SS 13900 200 14100 360
SS SL SL MS
14460 470 COAL MINING SEAM 600 14930 FLOOR
Figure A-50 Inferred geology from representative borelog CP1 used in numerical model
weathering SS
Unit Depth floor below surface Num elements Unit Unit name in model surface 0
10 3 16 weather 16 2 15 ss6
MS 21 2 14 ms2 SS 32 4 13 ss5 SL 41 3 12 sl3 SS 45 1 11 ss4 MS 51 2 10 ms1 SS 55 1 9 ss3 SL 63 3 8 sl2 SS 72 3 7 ss2 SL 1055 11 6 sl1 SS 113 4 5 ss1 SEAMR 118 3 4 seamr SEAM 124 3 3 seam FLOOR1 134 3 2 floor2 FLOOR2 250 10 1 floor1
Figure A-51 Coalesced units for numerical model based on hole CP1
Insitu stress is unknown at the site so a horizontal to vertical stress gradient of 15 has been assumed Given that the extensive workings were undertaken 20 to 30 years before the 2008 event horizontal stresses in the mining seam would be considerably disturbed from the pre-mining conditions
Table A-12 Rock properties for softening mohr coloumb material Softening rates of coal friction angle is 6 degrees over 2 plastic strain and total loss of cohesion over 24 plastic strain in coal and over 1 in other rocks Determined from pillar studies
E
nu Bulk Shear UCS UCS Phi Dilation Coh Tensile Strength (GPa) (GPa) (GPa) (MPa) scaled angle (MPa) (MPa)
SS 75 02 4167 3125 50 125 40 2 291 125
SL 4 025 2667 1600 30 75 35 2 195 075
MS 3 025 2000 1200 15 375 32 2 104 0375
Weathering 1 025 0667 0400 8 2 32 2 055 02
COAL 11 03 0917 0423 12 3 36 6 076 003
FLOOR1 4 025 2667 1600 30 75 38 2 183 075
FLOOR2 4 025 2667 1600 30 75 38 2 183 075
Table A-13 Ubiquitous joint properties Softening rate of ubiquitous joints total loss of cohesion over 1 plastic strain Determined from 2D overburden studies
Cohesion Ubiq joint cohesion Tensile Strength Ubiq joint tensile strength Ubiq joint (MPa) (MPa) (MPa) (MPa) friction
SS 291 00029144 125 0000125 15 SL 195 00019521 075 0000075 15 MS 104 00010393 0375 00000375 15 Weathering 055 00005543 02 000002 15 COAL 076 003 FLOOR1 183 - 075 - -FLOOR2 183 075 -
A64 Results from 3D Duncan St model
Factor of Safety estimated at 6m and 9m mining heights
Figure A-52 Pillar FoS calculated for 6m mining height by analytical method with strength by eq(3) and pillar stress by pressure arch theory Minimum value is 131 suggesting a 5 in 100 probability of failure however not sufficient to fail in the numerical model (that requires FoS lt 10)
Figure A-53 Pillar FoS calculated analytically for 9m mining height (eq(3) and PA theory) Minimum value is 099 suggesting a probability of failure of 5 in 10 although in the numerical model failure should occur
Yield on plane for 6m and 9m mining heights
Figure A-54 Location of section plane used for section view in following figures
Figure A-55 Yield on section plane for 6m mining height No significant damage or displacement observed
Figure A-56 Yield on section plane for 9m mining height no backfill
Figure A-57 Displacement on section plane for 9m mining height no backfill Maximum displacement is approximately 15m at surface
Results on horizontal plane at mid-pillar height
Figure A-58 Yield at mid-pillar height 9m mining height Blue elements evident in some pillars indicating pillar core remains intact
Figure A-59 Predicted vertical stress at mid pillar height 9m mining height Insitu stress is 30MPa Unyielded pillars and pillars hardening after yield are transferring vertical load while yielded pillars carry little load Extent of abutment stress increase is approximately 80m
Figure A-60 Roof vertical stress predicted by numerical model with 9m mining height Contour increments are 01MPa Base vertical stress is approximately 27MPa Abutment stress influence distance is approximately 80m
Results on surface after panel failure at 9m mining height
Figure A-61 Surface subsidence as predicted with numerical model with 9m mining height and total subsidence along Duncan St to McLaughlin St as monitored to October 09 Maximum surface subsidence predicted as 196m Outline of numerical modelling pillars and dotted contour of observed subsidence limit
A65 Duncan St model ndash backfill effectiveness
The Duncan St 3D model has been analysed with full and targeted 1MPa cohesive and non-cohesive backfill placed in roadways Roadway fill of 66 is analysed for the 1MPa cohesive mixture and 83 roadway fill for the non-cohesive mix
Results are presented in the following figures and figure captions
Factor of Safety increase from cohesive backfill
Analysis of the Duncan St model with 9m mining height is undertaken to estimate the FoS increase from backfill By increasing gravity in increments the backfill strength improvement is quantified With 83 roadway fill of 1MPa cohesive backfill the overburden and pillar tops (ie region of pillar above height of backfill) fails with gravity of 17ms2 suggesting the pillars with FoS of approximately 10 has increased FoS to 17 by backfilling adjacent roadways
Figure A-62 Gravity of 16g with 83 1MPa cohesive backfill showing no significant yield
Figure A-63 Gravity of 17g with 83 1MPa cohesive backfill predicting failure of pillar tops and overburden and collapse of roadway void space
FoS increase with non-cohesive backfill
With non-cohesive backfill pillars yielded due to lack of confinement upon initial placement of backfill in roadways but overburden remain stable and void space above backfill remained open Overburden remained stable at gravity increase to 11ms2 Figure A-64 but collapsed at gravity increase of 12ms2 Figure A-65
Figure A-64 Gravity of 11g with 83 non-cohesive backfill predicting pillar yield but overburden stability
Figure A-65 Gravity of 12g with 83 non-cohesive backfill predicting failure of pillars and overburden and collapse of roadway void space Maximum surface subsidence is 055m which includes the compressive effect of the 12g gravity increase
Placement of targeted backfill
A model is analysed with cohesive backfill totally surrounding two pillars with low predicted FoS The two pillars are predicted to have a FoS of 099 and 100 left to right viewed from above at a 9m mining height Backfill extends to an extent of 5m to 10m from the pillar and is 6m high in the roadways Gravity increase to 12g required to fail panel suggesting panel strength increase is approximately 20 from targeted backfill Predicted surface subsidence 125m (excessive mesh deformation stops analysis equilibrated stage may have higher surface subsidence)
Figure A-66 Duncan St model with 66 roadway fill of 1MPa cohesive backfill surrounding two pillars with low FoS at 9m mining height
Figure A-67 Predicted yield at mid pillar height of 9m pillars with 66 roadway fill of 1MPa cohesive backfill Note intact core (blue) for targeted pillars
Figure A-68 Pillar strength at 9m mining height Strength WITHOUT BACKFILL of northern focus pillar selected for targeted backfill is 527MPa and southern focus pillar is 526MPa
Figure A-69 Vertical stress in pillars targeted for partial backfill placement Stress calculated at equilibrium of elasto-plastic analysis WITHOUT BACKFILL Stress in northern focus pillar is 54MPa and in southern focus pillar is 513 FoS of NFP=52754 = 0975 FoS of SFP=526513 = 1025
Non-cohesive backfill in targeted placement study
A model with targeted placement of non-cohesive backfill was attempted but could not be satisfactorily converged since backfill lsquoflowsrsquo and inter-penetrates elements resulting in numerical instabilities
Forcing pillars to fail to examine resultant subsidence
To examine the extent of surface subsidence if backfilled pillars fail the numerical model with 9m mining height and 83 roadway fill of 1MPa cohesive backfill is analysed with a 90 reduction in coal pillar strength properties
With 9m mining height and 83 roadway fill of cohesive backfill void space remaining is 15m and the numerical model predicts failure of pillars and overburden results in approximately 02m surface subsidence
Figure A-70 Surface subsidence predicted by numerical model when pillars forced to fail with 83 roadway fill Contour interval is 01m with maximum subsidence predicted as 022m
Figure A-71 Surface strain in east-west direction when pillars forced to fail resulting 022m surface subsidence Maximum strain is 5mmm and contour interval is 1mmm
Figure A-72 Surface strain in north-south direction when pillars forced to fail resulting 022m surface subsidence Maximum strain is 3mmm and contour interval is 1mmm
Figure A-73 Tilt in east-west direction Units are mmm and intervals are 1mmm maximum tilt is 7mmm
Figure A-74 Tilt in north-south direction Units are mmm and intervals are 1mmm maximum tilt is 5mmm
To highlight the need for adequate fill the model with 66 roadway fill is analysed with the pillars forced to fail with a 50 reduction in pillar strength Void space over the backfill in the roadways is 30m Modelling predicts maximum surface subsidence of 068m
Figure A-75 Surface subsidence when pillars forced to fail with 66 roadway fill Roadway void space is 30m with the model predicting 068m surface subsidence Contour interval is 01m
A66 Numerical model of adjacent high risk area
Numerical model and panel stability
A numerical model of the region adjacent to Duncan St incorporating 76 pillars is analysed at 9m mining height Overburden strata strengths and depth-of-cover is consistent with Duncan St model
The main objective of this model is to estimate the strength difference between the two mining panels west and east of the Waterline fault Given uniform mining height and depth-of-cover the strength difference will be due to the pillar configuration and boundary conditions
At 9m mining height the model is predicted to be essentially stable although 9 pillars are predicted to be fully yielded at mid-pillar height
With gravity increase of 10 the model remains stable At 20 increase in gravity the model is predicted to fail with significant overburden yield
It is concluded therefore that the panel to the east of Waterline fault is 20 stronger than the panel to the west
Figure A-76 Location of numerical model 2 together with surface subsidence contours from 1988 and 2008 events and seam level eastern boundary of failure predicted from 3D seismic
Figure A-77 Yield on section at mid-height for 9m mining height
Figure A-78 Rockmass yield on vertical section trending east-west at mid-point of model Note overburden is largly intact with no extensive collapse
Figure A-79 Pillars predicted to have failed from Numerical model 2 with surface subsidence contours and inferred eastern limit of failed zone at seam level
By a 20 increase in gravity the model is forced to fail resulting in predicted 13m surface subsidence that includes increased overburden compression from increased gravitational component Excessive deformation and numerical instability stopped the model true surface deformation may be higher
Figure A-80 Adjacent model with 9m mining height Predicted surface subsidence after 20 increase in gravity Model predicts 13m surface subsidence
Figure A-81 Adjacent model with 9m mining height and 20 gravity increase Predicted failure at mid-pillar height Note intact core in southern pillars which appear stronger from unmined adjacent coal and larger general pillar size
A7 CONCLUSIONS
A71 Current knowledge on coal pillars behaviour
bull The strength based factor-of-safety approach is well established in coal pillar design Factors of safety for coal pillars required to provide medium to long term stability should be greater than 16 [Galvin 2006 Hill 2005]
bull Coal pillar strength has been the subject of rigorous research since at least the 1960rsquos and the Salamon amp Munro formula has been applied in the design of over a million coal pillars in South Africa alone [Mark 1999 Salamon 1998] Strength formula derivations from the UNSW are established in Australia
bull Coal pillar load calculation traditionally relies on tributary area theory which is a conservative approach suitable for pillar design
bull Tributary area conditions are NOT satisfied at Collingwood Park pillars are irregular in size and shape there is large areas of unmined coal and the seam has significant dip
bull This last point is important as analytical methods hold the only hope of evaluating every pillar at Westfalen No 3 Colliery The numerical model of Duncan St analyses 46 pillars and requires significant computational resources the entire Colliery has in excess of 700 pillars and cannot be analysed by the same methods in its entirety by current computer codes in a reasonable time frame
bull Likewise it is not satisfactory to draw conclusions on panel stability from limited analysis of representative groupings of pillars because of the variability in size shape mining height and cover depth over the mining area
bull To overcome the limitations of tributary area theory for the back-analysis of an irregular pillar layout a novel approach for calculating loads based on pressure arch theory has been developed subjected to international peer review and published in the International Journal of Rock Mechanics and Mining Sciences In summary each pillar is individually examined and the pillar area circumference and centroid are calculated At the pillar centroid the cover depth and mining height are determined An influence zone based on a circular area with radius defined by the depth-dependent load transfer distance Within this area the local extraction ratio is calculated This approach has found to satisfactorily account for pillars of arbitrary shape in irregular layout with variable cover depth
bull This allows a FoS to be determined for the over 700 pillars of Westfalen No 3 with reasonable computer resources
A72 Typical pillar strength effects
Width to height ratio
bull Pillars at Westfalen No 3 have typical effective width from 20m to 50m While mining height is uncertain it is believed to range from 6m to 10m With these dimensions pillar wh ratio ranges from 20 to 83
bull At the lower limit of wh=20 geological influences will start to determine pillar strength [Galvin 2006] From wh in the range gt 20 to 40 the formula of Salamon and Munro or UNSW extensions could be expected to estimate pillar strength with the squat pillar version of these formula applicable for whgt40 [Galvin 2006 Salamon 1998 Galvin 1999]
bull The squat pillar extensions were developed since the standard formulas were found to underestimate pillar strength at whgt4 At Westfalen No 3 colliery although there are a number of pillars of whgt4 many of these are irregular in shape often long and relatively narrow (30m ndash 40m) Given this and the need to automate the assessment of every pillar the squat pillar strength formula is not utilised This approach is conservative
Pillar shape effects
bull Many pillars at Westfalen No 3 are skewed of diamond shape with acute internal angle from 50 to 90 degrees Hydraulic radius simile accounts for pillar shape by an effective width defined by 4AC while the UNSW has a parrellopid formula that for pillars of equal side length results in an effective width equivalent to this
bull In a study of pillar shapes common to Westfalen No 3 colliery the hydraulic radius analogy for estimation of effective width is found adequate with errors less than 6 for considered sizes and shapes
Post peak strength
bull Numerical studies and the work of Das in Indian coal fields highlights the changing post peak behaviour with increasing width to height ratiorsquos It has been determined that when wh exceeds approximately 5 pillars start to harden post peak When whlt3 pillars display limited if any post peak strength
bull The significance of this effect will be in the manner that pillars shed load to adjacent pillars In an array of pillars of similar dimensions pillars with a low wh ratio could be expected to shed load in a sudden more catastrophic manner than those that harden post peak Such sudden pillar failure is referred in the literature as catastrophic cascading or rolling pillar failure and has been responsible for damaging wind blasts and significant loss of life over the years
bull In an irregular pillar layout such as Westfalen No 3 with variable wh ratio significant barrier pillars and regions of unmined coal sudden multiple panel collapse would be expected to be less likely
bull The analytical approach developed for assessing pillar load accounts for load shed from a failed pillars to pillars within the zone of influence of that pillar
Specific details of this approach are discussed in the hazard map and risk assessment chapter of this report
Backfill effect
bull Numerical studies on a cohesive and non-cohesive backfill suggest that pillar strength is increased with increasing height of fill Studies suggest a 1MPa cohesive backfill may increase pillar strength by approximately 10 at 40 roadway fill for wh=33 and 18 at 40 roadway fill at wh=22 At 80 roadway fill pillar strength increases are predicted to exceed 50 Percentage strength increases are predicted to be greater with lower wh ratiorsquos
bull Studies of a non-cohesive backfill suggest at 80 roadway fill pillar strength increases are approximately 25
bull With both backfill types pillar strength is predicted to increases dramatically above 80 roadway fill and pillars are predicted to exhibit post-peak hardening behaviour
For example in the Duncan St area a pillar of effective width 20m will have a FoS of approximately 118 at mining height of 10m without backfill A 50 strength increase from 1MPa cohesive backfill at 80 roadway fill will raise the FoS to approximately 177 and reduce the probability of instability from approximately 1 in 10 to less than 1 in 1000
With 80 roadway fill of a non-cohesive backfill the same Duncan St pillar FoS will increase to approximately 147 and the probability of instability reduce to less than 1 in 100
bull Backfill is likely to reduce the rate of time dependent pillar strength degradation by reducing pillar spalling due to the erosive effects over time of high stress and exposure of the pillar surface to the atmosphere
bull In addition backfill is likely to benefit pillar stability by limiting the void available to the roof to fall into Roof falls particularly at roadway intersections may be present By reducing the roadway volume backfill will eventually support the roof when the bulking effect of roof falls fills the remaining roadway voids space Beyond this summary time dependent issues of backfill have not been considered
roadway
fill
Non-cohesive backfill
(7m mining height width 20m) strength increase
05 MPa cohesive backfill
(7m mining height width 20m)
strength increase
10 MPa cohesive backfill
(7m mining height width 20m)
strength increase
60 135 388 437
70 183 432 597
80
90
208
291
474
572
698
957
A73 Duncan St numerical model
bull In the Duncan St subsidence region approximately 46 pillars are surrounded by unmined coal to the west a large pillar containing the Waterline fault to the east and larger pillars to the south and north
bull At 6m mining height pillar minimum FoS for these 46 pillars is calculated at 131 with Pressure Arch theory and UNSW strength formula At 9m mining height minimum FoS is calculated as 099
bull Pillar probability of failure for FoS calculated by the UNSW eq(2) is given in [Galvin 2006] as
Table A-14 Factor of safety failure probabilities for UNSW pillar strength formula (after Galvin 2006)
Safety Factor Probability of pillar failure
087 8 10
100 5 10
122 1 10
13 5 100
138 2 100
144 1 100
163 1 1000
179 1 10000
195 1 100000
211 1 1000000
bull From Table A-14 at 6m mining height there is a 1 in 20 probability of instability and at 9m a 1 in 2 probability The variability in the database of failed and unfailed pillars from which eq (1) to eq (3) are derived is responsible for these probabilities Our numerical model should always predict failure if the FoS is less than 10 and always predict stability with FoS gt 10 since no such variability in geotechnical properties or conditions is used
bull While our numerical model predicts no pillar failure at 6m and pillar failure at 9m in reality there remains approximately a 1 in 20 chance of failure at 6m mining height If one pillar was to fail load transferred to adjacent pillars would reduce these adjacent pillars FoS and may well lead to the pillar failure and resultant subsidence observed at Duncan St
bull Based on the numerical results obtained using two mining heights the pillar and overburden failure is in line with analytical predictions from Pressure Arch theory and UNSW pillar strength calculation
bull Surface subsidence predicted from the 9m mining height numerical model is 196m While this value is in general agreement with monitoring data the model is not sufficiently calibrated since the real mining height in the region is unknown to be able to confidently predict final subsidence strains and tilts
bull With 1MPa cohesive backfill at a fill ratio of 83 the predicted strength increase is 70 With non-cohesive backfill at the same fill ratio the strength increase is 20 these values are in agreement with single pillar studies
bull Abutment stresses in the immediate roof sandstone unit (above the coal roof) are predicted to extend approximately 80m beyond the limits of the model This is in reasonable agreement with twice the load transfer distance of 64m (at 124m depth-of-cover) used to define a pillars zone of influence (the ZI also includes half pillar width ie 74m for 20m pillar)
A74 Numerical model of adjacent region
bull A numerical model of the region immediately to the east of the Duncan St failure region is constructed with 76 pillars
bull At 9m mining height the model predicts failure of 9 pillars but no significant overburden failure The model remains stable in general
bull With a 20 increase in gravity the model is predicted to fail
bull Numerical modelling results suggest the region to the east of the Waterline barrier pillar is stronger by approximately 20 than the subsided region to the west of the barrier pillar
bull Predicted surface subsidence (including compressive effects from gravity increase) is 13m all though numerical instabilities halt the model and true surface subsidence is likely to be higher
bull Inspection of yield at mid-pillar height suggests the southern pillars in the model have intact core when pillars in the middle of the region are failed in their entire volume In reality the southern region of this panel have greater depth-of-cover therefore higher pillar stresses and thus lower FoS in these southern pillars

bull An understanding of the pillar strength increase when surrounding roadways are filled by cohesive and non-cohesive backfill to various heights
bull Understanding of pillar and panel FoS increase from backfill
bull A full 3D model of 46 pillars in the Duncan St area and surface subsidence prediction at nominal 6m mining height and 9m mining height benchmarked with monitoring data
bull Estimates of lateral extent of stress abutment
bull Comparative strength assessment of the two panel layouts west and east of Waterline fault
A2 LITERATURE REVIEW ON PILLAR STRENGTH
A21 Pillar strength formula
Several empirical formulas have been developed to calculate mine pillar strength based on experimental field data in the form of a single equation where pillar strength (S) is equal to an empirical constant (A) times pillar width (w) to a constant power (α) divided by pillar height (h) to a constant power (β) ie S = A wα hβ
The empirical equation developed by Salamon amp Munro [Salamon 1967 Salamon 1998] (in SI units) has been widely used in South Africa and Australia since its development in 1967
Pillar strength = 72 w046 h066 (1)
where the constant A = 72 α = 046 and β = 066 and
w = pillar width
h = mining height
The coal pillar strength equation developed by UNSW from a database of Australian coal pillars in 1996 [Galvin 1999] uses different constants given by
Pillar strength = 860 w051 h084 (2)
Coal pillar strength estimated from the combined databases of South African and Australian coal pillars in 1999 [Galvin 1999] has the following form
Pillar strength = 688 w050 h070 (3)
Interestingly all the above formulas Equations (1) (2) and (3) give very similar results although they are derived for pillars from two different continents with generally different geological conditions and settings [Mark 1999 Galvin 1999]
An observation from this is that above a width-to-height ratio of two geometric parameters influence pillar strength rather than the pillar material below two Galvin
[Galvin 2006] reports that geological properties of the pillar dominate the overall pillar strength
A22 Pillar effective width
Wagner [Wagner 1974] invoked the concept of hydraulic radius to define the effective width we as [Wagner 1980]
we = 4 Ap Cp (4)
where
Ap = cross sectional area of the pillar (w2 for a square pillar)
Cp = cross sectional circumference of the pillar (4w for a square pillar)
and which becomes identical to w for square pillars
To account for parallelepiped pillars of widths w1 and w2 and internal acute angle θ UNSW [Galvin 1999] has expressed the effective width by
we = wm Θ (5)
where
wm = w1 sin θ (6)
and
Θ = 2 w2 (w1 + w2) (7)
A23 Pillar load
Pillar axial stress can be estimated by [Salamon 1967 Salamon 1974]
Pillar stress = ρ g H (1 ndash e) (8)
where H is depth of cover e is the area extraction ratio which is theoretically between zero (no extraction) and one (100 extraction) To keep consistency with the original parameters of equation (1) gravity and average overburden density are defined as
g = 10 m sec2
ρ = 2488 kg m3
Using tributary area theory the original work of Salamon and Munro calculates the loading share of a square pillar of width w bord width B and depth of mining H as
Pillar stress = ρ g H (1 - e) = ρ g H [(w + B)w]2 (9)
Assumed in equation (9) is that the stress is fully contained on the pillars that are uniform in size with constant bord width [Salamon 1974 Zipf 2001] which is a conservative assumption [Wagner 1980] and is acceptable if the panel width to depth ratio exceeds unity [Roberts 2002]
One of the outcomes of the present Collingwood Park investigation is the development of a method of estimating pillar loads where the conditions for tributary area theory cannot be satisfied as is the case at Westfalen No 3 colliery in the western branch This stress estimation method is termed ldquoPressure Arch theoryrdquo (PAt) [Poulsen 2010]
A24 Pressure Arch Theory
When conditions for tributary area theory are not satisfied due to an irregular pillar layout or variable overburden cover an alternative approach to estimate pillar stress is PAt The main components of PAt are
bull Load is uniquely estimated for every pillar
bull Depth-of-cover (H in equation (8)) is calculated at the pillar centroid
bull Extraction ratio ρ in equation (8) is calculated locally within a zone-of-influence defined by the depth dependent Load Transfer Distance [Abel 1988]
It is important to note that PAt converges to the equivalent tributary area theory (TAt) value when the conditions for TAt are satisfied Figure A-2
Zone of Influence
The Zone-of-Influence (ZI) used in PAt is based on the Load Transfer Distance (LTD) defined by Abel [Abel 1988] as the maximum distance any load can be laterally transferred and is determined by measuring the maximum distance that any effect of mining can be detected Monitoring results from mining in sedimentary strata are displayed in Figure A-1 and the LTD defined as
LTD = -1e-4 H2 + 02701 H (10)
LTD = -00001H2 + 02701H
R2 = 08701
0
20
40
60
80
100
120
140
160
180
200
0 200 400 600 800 1000 1200 Depth (m)
Load
Tra
nsfe
r Dis
tanc
e (m
)
Distance (m) Poly (Distance (m))
Figure A-1 Load transfer distance with depth for sedimentary strata (after Abel 1988)
Pillars within the LTD of each other will be able to interact and shed load Typically a stiffer pillar generally of greater width to height ratio such as a barrier pillar will carry a greater proportion of the load than smaller production pillars within its zone of influence A pillar of effective width we has a lateral zone of influence measured from the pillar centroid of
ZI = 2 LTD + we 2 (11)
ZI in equation (11) is then the radius of a circular influence zone centred on the pillar for which stress is estimated The extraction ratio in this influence region ρ is then used to estimate pillar stress with equation (8) [Poulsen 2010]
Comparison with numerical models and tributary area theory
Comparison of pillar stress calculated by PAt and numerical models is made in [Poulsen 2010] and in the numerical models constructed after both the 1988 and 2008 subsidence events at Collingwood Park
35
4
45
5
55
6 60
Pressure arch theory Tributary area theory Numerical model
0 5 10 15 20 25 30
Pillar number
Press Arch theory
Trib area theory A
vera
ge v
ertic
al s
tres
s in
cor
ner p
illar
(MPa
)
Stre
ss d
iffer
ence
from
num
eric
al m
odel
(MPa
)
50
40
30
20
10
00 0 20 40 60 80
Number of pillars excavated
Figure A-2 Stress in central pillar calculated by tributary area and pressure arch theories compared with an elastic numerical model
-10
Figure A-3 Stress difference from elastic numerical model for pillar stress estimated by pressure arch and tributary area theories Average absolute stress difference for pillar stress estimated with pressure arch theory is 030 MPa and with tributary area theory is 237 MPa
5
55
6
65
7
75
0 5 10 15 20 25
Pillar
Pill
ar s
tres
s (M
Pa)
MinCad PA theory TA theory
Figure A-4 pillar stresses predicted by pressure arch theory (left) and stresses predicted by pressure arch theory tributary area theory and MinCad model (right) Average absolute percentage variation from modelling results is 75 PA theory and 108 TA theory
After the 1988 subsidence event at Collingwood Park a numerical model was constructed with the code MINCAD and reported in [Wardel 1989] Stresses predicted by this numerical model PAt and TAt are made in Figure A-4
Comparison with Duncan St FLAC3D model constructed for this project is made in Figure A-5
3
35
4
45
5
55
6
65
7
75
8
0 10 20 30 40 50 Pillar
Pilla
r stre
ss (M
Pa)
Num Mod elas szz PA theory TA stress
Figure A-5 Predicted pillar stress from numerical model of Duncan St region Pressure Arch (PA) theory and Tributary Area (TA) theory TA theory with constant bord width of 66m (mine plan shows 66m+ bord) Average absolute stress difference is 03MPa for PA theory and 14MPa for TA theory
A3 BENCHMARKING OF NUMERICAL MODEL
The pillar strength equation derived from the combined databases of Australia and South Africa is used to benchmark the numerical model This equation which is the same as equation (3) above rewritten for convenience
Pillar strength = 688 w050 h070 (3)
A typical pillar from the Duncan St region of Collingwood Park has a side length of 20m internal acute angle in the range of 50-54 degrees The excavation or pillar height is 6m+ and depth of cover is 124m as shown in the mine pillar plan of Figure A-6
Figure A-6 Typical pillar with dimensions in the Duncan Street subsidence region Highlighted outline is the location of the 3D model Depth of cover is approximately 124m and pillar height is 6m+
The code FLAC3D (F3D) by Itasca Consulting Group [Itasca 2006] has been used for all numerical models F3D is a continuum code with yield criteria suitably flexible for modelling the full stressstrain response of coal type materials Only a quarter section of the bord and pillar array needs to be modelled once symmetry conditions are enforced in both x and y directions as shown in Figure A-7 Notice that only partial parts of the roof and floor have been considered
Figure A-7 A sketch of F3D mesh showing a quarter of a pillar as well as roof and floor and boundary conditions
A strain softening yield criterion has been used for coal and rock materials modelling In other words Mohr-Coulomb material model with non-associated shear and associated tension flow rules [Fama 1995 Itasca Consulting Group Inc 2006 Pietruszczak 1980 Hoke 1990] has been used In this model the parameters representing material cohesion friction dilation and tensile strength may reduce or soften after the onset of plastic yield by a user defined piecewise linear function [Jiang 2009 Zhou 2009] as displayed in Figure A-8 It is assumed that the roof and floor rock masses are elastic and only coal pillar is allowed to behave both elastically and plastically All model material parameters are listed in Table A-1 To achieve a reasonable match with the strength formula of Equation (3) for a width to height ratio greater than 4 it was found that it is necessary to have an explicit yielding interface or joint at the pillar boundaries on both the roof and the floor contact areas The interface properties are listed in Table A-2
Coal properties for the numerical model are estimated from the reported literature values and from calibration analyses by matching Equation (3) for the range of width-to-height ratios from 2 to 4 These numerical results are compared with Equation (3) in Figure A-9
00
02
04
06
08
10
12
Coh
esio
n (M
Pa)
29
30
31
32
33
34
35
36
37
Fric
tion
Ang
le (deg
)
Cohesion (MPa) Friction Angle (deg)
0 1 2 3 4 5 6 7 8 9 10 Plastic strain ()
Figure A-8 Variation of cohesion and friction angle with plastic strain
Table A-1 Mechanical parameters used in numerical models
Property
Youngs Modulus
(GPa) Poissonrsquo s ratio
UCS (MPa)
Tensile Strength (MPa)
Original value (MPa)
Cohesion
Softening rate ()
Residu al value (MPa)
Original value (deg)
Friction Angle
Softening rate ()
Residual value (deg)
Dilation Angle
(deg)
Coal 110 030 40 004 102 5 0102 360 05 300 60
Roof 570 019
Floor 797 024
from CSIRO report 42 Roof and floor materials are assumed elastic
Table A-2 Mechanical parameters of interface used in numerical model
Interface property Normal stiffness (GPa) Shear stiffness (GPa) Cohesion (MPa) Friction Angle (deg)
Value 20 20 05 200
Pilla
r stre
ngth
(MP
a)
11
10
9
8
7
6
5
S amp M combined
Numerical results
15 20 25 30 35 40 45 wh ratio
Figure A-9 FLAC3D parametric study to match pillar strength with the analytical formula of Salamon amp Munro (combined Australian and South African version)
A4 PILLAR STRENGTH INCLUDING FULL STRESS STRAIN CURVE AND PILLAR SHAPE EFFECTS
A41 Post peak strength
Das [Das 1986] has presented work on the post peak strength for Indian coals at various width-to height ratios His results show some variability but have a general correlation between post peak strength and increasing wh ratio Beyond a certain wh ratio of approximately 5 to 8 Dasrsquos results predict that samples start to harden with increasing strain
Figure A-10 Post peak strength of Indian coal at various width-to-height ratio after Das 1986
The numerical model of a square pillar of side length 20m and variable height was compressed to approximately 10 strain to investigate post peak behaviour with increasing wh ratio for comparison with results of Das in Figure A-10 The numerical results are plotted in Figure A-11 for various width to height ratios in the range of 10 strain The post peak pattern is similar to those of Das in Figure A-10 although the numerical hardening starts at lower strains
variable height (h)
000
500
1000
1500
2000
2500
3000
000 002 004 006 008 010
Strain
Ave
rage
pill
ar s
tres
s (M
Pa)
WH=20
WH=25 WH=29 WH=33
WH=40 WH=50
WH=67 WH=100
Figure A-11 Post peak failure behaviour of numerical pillars of constant width w = 20m but
Results from the modelling of the full stress strain curve of a 20m square pillar is used to estimate the stress redistributed to neighbouring pillars in the empirical estimation of pillar FoS for the CSIRO Hazard Maps At 4 strain the percentage of peak strength carried by the coal pillar is approximated from Figure A-11 in Figure A-12 where conservatively it is assumed pillars cannot harden but only soften or retain strength
00
200
400
600
800
1000
1200
20 40 60 80 100
Width to height ratio
R e s
idua
l s tr
e ngt
h (
)
residual strength
Figure A-12 Estimation of pillar residual strength at 4 strain
A42 Pillar shape influence on strength
Collingwood Park has many pillars of regular and irregular shapes including square rectangle diamond triangular and other polygon shapes A study of some of these shapes at fixed 6m mining height was conducted
As discussed in [Galvin 1981] with reference to physical models there is a subtle difference in model response at specific width to height ratios depending on whether the width or height of the model is fixed This variation is attributed by Galvin to volume stiffness and pillar end effect variation between width and height changes In the Collingwood Park single pillar studies generally the width is fixed at 20m and width-to-height changes are achieved with height variations and material properties are calibrated to this In studies of diamond and other shaped pillars where the width or effective width varies a unique set of material properties calibrated over width-to-height 2 to 4 at fixed height is developed Table A-3
Attempt is made to keep the constant 05m cube element size although for some of the shapes studied this is not possible and where meshing options exist priority is given to minimizing the variability from the standard element size Ideally the soften rate of the yield criteria would be adjusted based on an element characteristic length Implementation of this reduced mesh dependent errors but it was not felt sufficiently rigorous for inclusion in this report
Table A-3 Cohesion and friction for calibrated model at wh 2 to 4 with fixed 6m pillar height
Property Original value (MPa)
Cohesion
Softening rate ()
Residual value (MPa)
Original value (deg)
Friction Angle
Softening rate ()
Residual value (deg)
Dilation Angle (deg)
Coal 123 35 023 360 05 300 60
Diamond shaped pillars
Diamond pillar shapes located at Duncan St and adjacent areas have typical dimensions of side length 20-30m and minimum acute internal angles of 50 degrees
The area perimeter or circumference (C) of a diamond shape is given by
Circumference = C = 4 w
where w is the side length If the acute internal angle is θ the area can be calculated as follows
Area = A = w2 sin θ
The minimum width or thickness of the cross section is
Minimum width = w sin θ
Hence the effective width weff from the analogy of ldquohydraulic radius = 4ACrdquo defined earlier is given by
weff = 4AC = w sin θ = minimum width
Figure A-13 Predicted pillar strength for diamond shaped pillars at 6m mining height Error at 50 deg internal angle is approximately 6
Polygon with one acute corner
Figure A-14 (a) and (b) show a comparison between theory and numerical model for a polygon with one acute angle
(a) (b)
Figure A-14 (a) Polygon with one acute side (60deg acute angle in figure) Base side length = 40m short side 20m mining height = 6m and (wh 44-38)
Rectangular pillar being split at mid-length in 1m increments
A rectangular pillar of 30m by 10m is modelled as it is split by a 5m roadway
(a) (b)
Figure A-15 (a) Rectangle 30m by 10m being split in 1m increments Note symmetry plane on left hand boundary Mining height 6m (b) Results from numerical model and Strength formula with w=4AC
Triangular shape pillars with two equal sides of 20m
In this example a triangular pillar with two sides of equal length of 20m is analysed
(a) (b)
Figure A-16 (a) Triangular pillar of two equal sides of 20m each Mining height 6m (b) Results from numerical model and strength formula with w=4AC Maximum error is approximately 5
Observations from study of pillar shapes
The general conclusion from the study of pillar shapes at fixed 6m mining heights is that the hydraulic radius analogy of Wagner Equation (4) where the effective width is estimated by area and circumference is applicable to pillars of Westfalen No 3 colliery Errors with this approach at calculating pillar width for width-to-height ratios from approximately 2 to approximately 4 for the shapes studied are under 6
A43 Realistic roof geology
It is recognised that the idealised roof and floor of the pillar model Figure A-7 may have an influence on the predicted strength estimation To quantify this effect a model of a 20m square pillar at width-to-height ratiorsquos of 22 to 4 is analysed with a realistic roof geology
Based on the sonic logging data in borehole CP-C02 located in the failure region of Duncan Street Figure A-17 pillar strength is estimated from a numerical model with the model input parameters selected from the scanned roof geological and geotechnical data The input data are listed in Error Reference source not found and Table A-4 The F3D mesh for a pillar analysis is shown in Figure A-18 and the numerical results for two set of parameters for roof geology are shown in Figure A-19
Table A-4 Mechanical properties of roof and overburden rocks
Youngs Poissonrsquos UCS Tensile Strength CohesionBackfill Modulus Friction Angle (deg)Ratio (MPa) (MPa) (MPa)(GPa)
Sandstone 135 012 25 25 6648 40
Siltstone 195 020 15 15 4728 38
Interbedded 166 017 20 20 2808 38
Mudstone 875 026 10 10 1943 30
UCS Depth (m) (MPa) Geology Scaled UCS (MPa) 1005 7500 sandstone1 2500 1010 1015
6000 6750
interbedded1 2000 2250
1020 1025
7500 9000
sandstone2 2500 3000
1030 6750 interbedded2 2250 1035 4500 siltstone1 1500 1040 5250 interbedded3 1750 1045 4500 siltstone2 1500 1050 1055
225 2250
coal1 750 750
1060 1065
8250 9000
sandstone3 2750 3000
1070 3750 siltstone3 1250 1075 5250 1750 1080 6000 interbedded4 2000 1085 6000 2000 1090 3750 siltstone4 1250 1095 3000 1000 1100 3000 mudstone1 1000 1105 3000 1000 1110 3750 1250 1115 4500 siltstone5 1500 1120 3750 1250 1125 2000 coal2 667 1130 5250 interbedded5 1750 1135 7500 sandstone4 2500 1140 1145
6000 5250
interbedded6 2000 1750
1150 8250 2750 1155 9000 3000 1160 10500 3500 1165 13500 4500 1170 10500 sandstone5 3500 1175 10125 3375 1180 10500 3500 1185 9750 3250 1190 7500 2500 1195 3750 siltstone6 1250 1200 1500 coal3 500 1205 1210
7875 8625
sandstone6 2625 2875
1215 5250 interbedded7 1750 1220 1225
9000 10500
sandstone7 3000 3500
1230 6000 interbedded8 2000 1235 3000 mudstone2 1000 1240 3750 siltstone7 1250
Figure A-17 Sonic log of borehole CP-C02 and roof geological interpretation
Figure A-18 Numerical model of a coal pillar with representative floor and roof rock geology
4 5 6 7 8 9 10 Pillar height (m)
Figure A-19 Comparisons of pillar strength versus pillar height for realistic and simplified roof geology Maximum error is 45
Modelling predicted that the maximum difference in pillar strength for two different roof geology conditions is approximately 45 at the lower height of 6m reducing to less than 1 for pillars of 9m mining height
It is concluded from this study that the simplified roof and floor model satisfactorily estimates pillar strength allowing in excess of 180 numerical models to be analysed in a timely manner
60
65
70
75
80
85
90
95
100
105
Pilla
r str
engt
h (M
Pa)
Assumed geology
Real geology
A44 Pillars surrounded by roadways of variable height
It was observed in the 1983 pillar site investigation [Hollingworth Dames amp Moore 1990] that mining heights at Westfalen No 3 are extremely variable with roadways surrounding individual pillars varying by up to 2m
To investigate the strength of pillars of variable height a 20m wide square model pillar of 8m mining height on one side and 6m height on the directly opposite side of the pillar as shown in Figure Ashy20 has been analysed
Figure A-20 Different views of the numerical modelling mesh of a trapezoidal-square pillar - Model is 8m high on one side and 6m on the other opposite side
Predicted strength of the variable height pillar together with stress-strain curves for pillars of 6m 7m and 8m mining heights presented in Figure A-21 As shown in the figure the predicted strength of a non-uniform-height pillar of trapezoidal shape having 6m and 8m side heights approximates a uniform-height pillar with a constant height of 7m
0
1
2
3
4
5
6
7
8
9
10
Axia
l stre
ss (M
Pa)
Trapezoid pillar
6m pillar 7m pillar
8m pillar
0000 0010 0020 0030 0040 0050
Axial strain
Figure A-21 Stress vs strain curves for rectangular uniform height and trapezoidal non-uniform height pillars Strength of uniform pillars having heights of 6m 7m and 8m are compared with a trapezoidal non-uniform height pillar of having 6m height on one side and 8m on the other opposite side ie a variable height roadway of average 7m height
A45 Pillars created by multiple passes to variable depth
Roadways at Westfalen No 3 colliery were cut in multiple passes at a constant height of 24 m The cut widths were variable ranging from 52 m at the bottom to 76 m at the top as shown schematically in Figure A-22 by the mine managerrsquos hand drawings of the roadway mining method
To asses the strength of such pillars a 9 m high pillar with irregular side surface boundary is modelled Figure A-23 The model pillar has a square base of 23m and side length with three lsquocutsrsquo in its height as shown in Figure A-23
Predicted strength is approximately equal to a similar pillar with effective width equal to minimum width ie 20m in this case Figure A-24
Figure A-22 Sketch of roadways at Collingwood Park showing multiple passes or layers of cutting of the coal seam(from previous mine managersrsquo notes and records)
Figure A-23 Numerical modelling of a multi-pass cut pillar of 9 m height with minimum and maximum side widths of 20m and 23m respectively
0
1
2
3
4
5
6
7
8
Axi
al s
tres
s (M
Pa)
irregular pillar-min w idth 20m high and 9m w ide
square pillar-20m w ide and 9m high
0000 0005 0010 0015 0020 0025 0030 0035 0040
Axial strain
Figure A-24 Stress vs strain curves for pillars of 9m height with regular and irregular square cross-section (Figure A-23) Difference in peak strength predicted to be approximately 35
A5 ROADWAY BACKFILL AND PILLAR STRENGTH IMPROVEMENT
A literature review of backfill applications mechanical properties and behaviours in coal mining identified several examples from China [Guo 2007 Wang 2009] where backfill has been used to reduce surface subsidence from America [Tesarik 2002 2009] where backfill has been used primarily for disposal of fly-ash and reduce acid mine drainage and from Australia [Origin Alliance 2008] - See Table A-5 and the reference list
In the early stages of this modelling specific data and backfill effects and properties required in this numerical study were unavailable and therefore two cases were considered a cohesive backfill having a UCS of 1 MPa and a non-cohesive backfill with no cohesion but a friction angle of 42 degrees Subsequent to these two cases a case of 05MPa cohesive backfill mix was also considered
Backfill properties using in this study are list in
Table A-6
Table A-5 Backfill properties data from various sources
Composition UCS (MPa) E (GPa) Reference
Solid waste including fly-ash 05 initially
to 14-17
0565 Guo et al 2007
Fly-ash amp cement 339 ndash 824 Guo et al 2007
1 4 15 (cement) (fly-ash) (coal
gangue)
07 ndash 17 Wang et al 2009
Fly ash (dry) Scheetz 2009
22 1 (fly-ash) (cement) Scheetz 2009
Cemented rockfill in metal mine 69 1909 Tesarik 2009
Required properties 10 10 OriginAlliance ndash Mine
subsidence interpretive
reporting
P16
25 FA 105 sand 01 bentonite
5 FA 18 sand
Injection 3m intervals
Bell Bruyn 1999
Table A-6 Mechanical parameters of cohesive and non-cohesive backfill used in this numerical
study
Backfill Youngs Modulus (GPa)
Poissonrsquos Ratio UCS
(MPa)
Tensile Strength (MPa)
Cohesion (MPa)
Friction Angle (deg)
Dilation Angle (deg)
1MPa
Cohesive 0565 040 10 01 0117 400 100
05MPashy
cohesive 0565 040 05 005 0061 400 100
Non-
cohesive 0020 015 00 00 0000 420 75
A51 Numerical results and analysis
In order to quantify the influence of backfill on pillar strength in detail 180 models (60 models each for 1MPa 05MPa cohesive and non-cohesive backfill) of square coal pillars were analysed with the following parameters pillar width is 20m mining height is from 5m to 10m equivalent to a wh ratio of 2 to 4 percentage of backfill is from 0 to 90 Table A-7 summarises the results of these pillar strength analyses for all the cohesive and non-cohesive cases
Relationship between pillar strength and percentage of roadway backfill is presented in Figure Ashy25 Figure A-27 and Figure A-29 The raw data from Table A-7 has been calculated in uniform 10
backfill increments and is presented in Figure A-26 Figure A-28 and Figure A-30 As shown in these figures the percentage increase in pillar strength is approximately bilinear with increase in backfill
00
200
400
600
800
1000
1200
1400
1600 P
illar
stre
ngth
incr
ease
()
5m 6m 7m 8m 9m 10m
00 100 200 300 400 500 600 700 800 900 1000
Percentage of bacfill ()
Figure A-25 Pillar strength increase versus percentage of 1MPa cohesive backfill
00
200
400
600
800
1000
1200
1400
1600
Pill
ar s
tren
gth
incr
ease
()
10 backfill
20 backfill
30 backfill
40 backfill
50 backfill
60 backfill
70 backfill
80 backfill
90 backfill
4 5 6 7 8 9 10 11 12 Pillar height (m)
Figure A‐26 Pillar strength increase versus pillar height for 1MPa cohesive backfill
Table A-7 Pillar strength with increasing 1MPa and 05MPa cohesive backfill and non-cohesive backfill
Pillar strength Backfill
Approximate percentage of backfill
() 5 6
Pillar height (m)
7 8 9 10 Pillar
strength Without backfill 0 1007(00) 894(00) 795(00) 714(00) 647(00) 596(00)
(MPa) for different percentshyage of
10 20 30
1049(100) 1104(200) 1140(300)
940(83) 983(167)
1069(333)
833(71) 909(214) 947(286)
785(125) 820(188) 889(313)
720(111) 771(222) 803(278)
650(100) 710(200) 758(300)
backfill 1MPa 40 1205(400) 1130(417) 1046(429) 929(375) 869(389) 824(400)
Cohesive 50 1234(500) 1178(500) 1095(500) 1016(500) 943(500) 894(500) backfill 60 1292(600) 1208(583) 1143(571) 1098(625) 1009(611) 956(600)
70 1342(700) 1271(667) 1270(714) 1158(688) 1120(722) 1035(700) 80 1466(800) 1442(833) 1350(786) 1345(813) 1309(833) 1180(800) 90 1593(900) 1580(917) 1556(929) 1470(875) 1440(889) 1400(900) 10 1026(100) 930(83) 830(71) 773(125) 697(111) 636(100) 20 1081(200) 968(167) 896(214) 803(188) 754(222) 687(200) 30 1132(300) 1053(333) 939(286) 871(313) 786(278) 741(300)
05MPa 40 1184(400) 1098(417) 1018(429) 901(375) 853(389) 799(400) Cohesive 50 1217(500) 1141(500) 1065(500) 1000(500) 936(500) 873(500)
backfill 60 1240(600) 1167(583) 1102(571) 1054(625) 1009(611) 954(600) 70 1269(700) 1189(667) 1237(714) 1093(688) 1044(722) 1014(700) 80 1322(800) 1280(833) 1167(786) 1143(813) 1105(833) 1061(800) 90 1410(900) 1350(917) 1250(929) 1202(875) 1150(889) 1120(900)
Non-cohesive backfill
10 20
1016(100) 1028(200)
902(83) 912(167)
801(71) 819(214)
724(125) 732(188)
657(111) 670(222)
604(100) 615(200)
30 1044(300) 941(333) 832(286) 753(313) 678(278) 629(300)
Pillar strength Backfill
Approximate percentage of backfill
() 5 6
Pillar height (m)
7 8 9 10
40 1063(400) 961(417) 865(429) 767(375) 702(389) 649(400) 50 1086(500) 984(500) 885(500) 800(500) 729(500) 670(500) 60 1113(600) 1006(583) 904(571) 835(625) 760(611) 696(600) 70 1138(700) 1030(667) 943(714) 852(688) 792(722) 725(700) 80 1168(800) 1083(833) 963(786) 889(813) 829(833) 765(800) 90 1206(900) 1130(917) 1029(929) 913(875) 852(889) 804(900)
Figure A-27 Pillar strength increase versus pillar height for 05MPa cohesive backfill
4 5 6 7 8 9 10 11 12 13 Pillar height (m)
Figure A-28 Pillar strength increase versus percentage of 05MPa cohesive backfill
0
10
20
30
40
50
60
70
80
90
100
Pilla
r st
reng
th in
crea
se (
) 10 backfill
20 backfill
30 backfill
40 backfill
50 backfill
60 backfill
70 backfill
80 backfill
90 backfill
00
50
100
150
200
250
300
350
400
Perc
enta
ge o
f pill
ar s
tren
gth
incr
ease
()
5m
6m
7m
8m
9m
10m
00 100 200 300 400 500 600 700 800 900 1000
Percentage of bacfill ()
Figure A-29 Pillar strength increase versus percentage of non-cohesive backfill
00
50
100
150
200
250
300
350
400
Pilla
r st
reng
th in
crea
se (
)
10 backfill
20 backfill
30 backfill
40 backfill
50 backfill
60 backfill
70 backfill
80 backfill
90 backfill
4 5 6 7 8 9 10 11 12 Pillar height (m)
Figure A-30 Pillar strength increase versus pillar height for non-cohesive backfill
The modelling results suggest that the pillar strength will increase with increasing roadway backfill while the percentage increase of pillar strength is greater for the taller pillars than squat pillars it is observed that when the backfill is less than 40-50 the pillar strength increase is less sensitive to pillar height or wh ratio while over 40-50 backfill pillar strength rapidly increase with pillar height
A52 Comparison of three different kinds of backfill
Pillar strength improvement with 05 and 10 MPa cohesive backfill and non-cohesive backfill is presented in Figure A-31 to Figure A-33
0
10
20
30
40
50
60
70
Incr
ease
of p
illar
str
engt
h (
) 5m-00MPa
5m-05MPa
5m-10MPa
0 10 20 30 40 50 60 70 80 90 100
Percentage of backfill ()
Figure A-31 Comparison of 05 and 10 MPa cohesive backfill and non-cohesive backfill at 5m mining height
0
20
40
60
80
100
120
Incr
ease
of p
illar
str
engt
h (
)
7m-00MPa
7m-05MPa
7m-10MPa
0 10 20 30 40 50 60 70 80 90 100
Percentage of backfill ()
Figure A-32 Comparison of 05 and 10 MPa cohesive backfill and non-cohesive backfill at 7m mining height
Incr
ease
of p
illar
str
engt
h (
)
140
120
100
80
60
40
20
0
9m-00MPa
9m-05MPa
9m-10MPa
0 10 20 30 40 50 60 70 80 90 100
Percentage of backfill ()
Figure A-33 Comparison of 05 and 10 MPa cohesive backfill and non-cohesive backfill at 9m mining height
Modelling predicts that 05MPa is as effective as 10MPa at increasing pillar strength below approximately 50-60 roadway fill Modelling suggests that cohesive backfill is more effective at increasing pillar strength than non-cohesive fill
A53 Numerical study of the influence of interface between backfill and pillar
To investigate the influence of an interface between backfill and pillar on the strength response of coal pillar an interface is set between backfill and pillar as shown in Figure A-34 The interface property is list in Table A-8
Figure A-34 Sketch showing the position of interface between backfill and pillar
2
4
6
2
4
6
Table A-8 Mechanical parameters of interface used in numerical model
Interface Cohesion FrictionNormal stiffness (GPa) Shear stiffness (GPa) property (MPa) Angle (deg)
Value 20 20 0 5~40
Pillar strength of a 6m high pillar as interface friction angle is increased from 5 degrees to 40 degrees is displayed in
1212
1010
88
cohesive backfill with interface
cohesive backfill without interface
non-cohesive backfill with interface
non-cohesive backfill without interface
4 cohesive backfill with interface
cohesive backfill without interface
non-cohesive backfill with interface
non-cohesive backfill without interface
stre
ss (M
Pa)
stre
ss (M
Pa)
6
2
00 0000 0005 0010 0015 0020 0025 0030 0035 0040 0045 0000 0005 0010 0015 0020 0025 0030 0035 0040 0045
strain strain
Figure A-35 to Figure A-38
Modelling predicts a non-cohesive interface with friction angle below 20 degrees results in a slight reduction in pillar strength above 20 degrees the interface is predicted to have little influence on pillar strength
cohesive backfill with interface
cohesive backfill without interface
non-cohesive backfill with interface
non-cohesive backfill without interface
1212
1010
88
cohesive backfill with interface
cohesive backfill without interface
non-cohesive backfill with interface
non-cohesive backfill without interface
stre
ss (M
Pa)
stre
ss (M
Pa)
6
4
2
0 0
0000 0005 0010 0015 0020 0025 0030 0035 0040 0045 0000 0005 0010 0015 0020 0025 0030 0035 0040 0045
strain strain
Figure A-35 Post peak pillar for 6m high pillar (wh=33) with friction angle 5deg on left 10deg on right of interface between backfill and pillar
2
4
6
cohesive backfill with interface
cohesive backfill without interface
non-cohesive backfill with interface
non-cohesive backfill without interface
1212
1010
88
cohesive backfill with interface
cohesive backfill without interface
non-cohesive backfill with interface
non-cohesive backfill without interface
stre
ss (M
Pa)
stre
ss (M
Pa)
6 6
44
2 2
0 0 0000 0005 0010 0015 0020 0025 0030 0035 0040 0045 0000 0005 0010 0015 0020 0025 0030 0035 0040 0045
strain strain
Figure A-36 Post peak pillar for 6m high pillar (wh=33) with friction angle 15deg on left 20deg on right of interface between backfill and pillar
12
cohesive backfill with interface
cohesive backfill without interface
non-cohesive backfill with interface non-cohesive backfill without interface
12
10 10
8 8
cohesive backfill with interface
cohesive backfill without interface
non-cohesive backfill with interface
non-cohesive backfill without interface
stre
ss (M
Pa)
stre
ss (M
Pa)
6 6
4 4
2 2
0 0 0000 0005 0010 0015 0020 0025 0030 0035 0040 0045 0000 0005 0010 0015 0020 0025 0030 0035 0040 0045
strain strain
Figure A-37 Post peak pillar for 6m high pillar (wh=33) with friction angle 25deg on left 30deg on right of interface between backfill and pillar
12
cohesive backfill with interface
cohesive backfill without interface
non-cohesive backfill with interface non-cohesive backfill without interface
12
10 10
8 8
cohesive backfill with interface
cohesive backfill without interface
non-cohesive backfill with interface
non-cohesive backfill without interface
stre
ss (M
Pa)
stre
ss (M
Pa)
6
4
2
0 0000 0005 0010 0015 0020 0025 0030 0035 0040 0045
0 0000 0005 0010 0015 0020 0025 0030 0035 0040 0045
strain strain
Figure A-38 Post peak pillar for 6m high pillar (wh=33) with friction angle 35deg on left 40deg on right of interface between backfill and pillar
22
6
8
24
A54 Post peak pillar strength
A full stress strain curve to approximately 35 strain is presented in the following figures for 1MPa cohesive and non-cohesive backfill Results for 05MPa cohesive backfill sit approximately mid-way between these two cases and are included in the summary Table A-9
24 24
0000 0010 0020 0030 0040 0050
Average axial strain of coal pillar
000
2000
3000
4000
5000
6000
7000
8000
9000
22
0000 0010 0020 0030 0040 0050
Average axial strail of coal pillar
000
2000
3000
4000
5000
6000
7000
8000
9000
20 20
18
Ave
rage
str
ess
of c
oal p
illar
(MPa
)
Ave
rage
str
ess
of c
oal p
illar
(MPa
)
18
16 16
1414
12 12
1010
88
66
44
22
00
Figure A-39 Post peak pillar strength with increasing backfill 5m high pillar (wh=40) with 1MPa cohesive backfill on left non-cohesive backfill on right
24
22
0000 0010 0020 0030 0040 0050
Average axial strain of coal pillar
00
250
333
417 500
583
667 833
917
22
0000 0010 0020 0030 0040 0050
Average axial strain of coal pillar
00
250 333
417
500 583
667
833
917
20 20
Ave
rage
str
ess
of c
oal p
illar
(MPa
)
18 18
16 16
14 14
12 12
10 10
8
6
4 4
2 2
0 0
Figure A-40 Post peak pillar strength with increasing backfill 6m high pillar (wh=33) with cohesive backfill on left non-cohesive backfill on right
Aver
age
stre
ss o
f coa
l pill
ar (M
Pa)
4
6
8
10
12
14
16
18
2
4
6
8
0000 0005 0010 0015 0020 0025 0030 0035 0040 0045
Average axial strain of coal pillar
000
2140
2860
4290
5000
5710
7140
7860
9290
2020
0000 0005 0010 0015 0020 0025 0030 0035 0040 0045
Average axial strain of coal pillar
000
2140
2860
4290
5000
5710
7140
7860
9290
18
Ave
rage
str
ess
of c
oal p
illar
(MPa
) A
vera
ge s
tres
s of
coa
l pill
ar (M
Pa)
Aver
age
stre
ss o
f coa
l pill
ar (M
Pa) 16
14
12
10
8
6
4
22
00
Figure A-41 Post peak pillar strength with increasing backfill 7m high pillar (wh=29) with cohesive backfill on left non-cohesive backfill on right
14 14
0
000
2500
3130
3750
5000 6250
6880
8130
8750
0
000
2500
3130
3750
5000
6250
6880
8130
8750
12 12
10
Ave
rage
str
ess
of c
oal p
illar
(MPa
)
10
8
6
4
2
0000 0010 0020 0030 0040 0050 0000 0010 0020 0030 0040 0050
Average axial strain of coal pillar Average axial strain of coal pillar
Figure A-42 Post peak pillar strength with increasing backfill 8m high pillar (wh=25) with cohesive backfill on left non-cohesive backfill on right
2
4
6
8
10
12
14
2
4
6
8
14
12
Ave
rage
str
ess
of c
oal p
illar
(MPa
) A
vera
ge s
tres
s of
coa
l pill
ar (M
Pa)
0
000 2220 2780 3890 5000 6110 7220 8330 8890
0
000 2220 2780 3890 5000 6110 7220 8330 8890
Ave
rage
str
ess
of c
oal p
illar
(MPa
)
10
8
6
4
2
0000 0005 0010 0015 0020 0025 0030 0035 0040 0000 0005 0010 0015 0020 0025 0030 0035 0040
Average axial strain of coal pillar Average axial strain of coal pillar
Figure A-43 Post peak pillar strength with increasing backfill 9m high pillar (wh=22) with cohesive backfill on left non-cohesive backfill on right
12 12
0
000 2500
3000 4000
5000 6000
7000 8000
9000
0
000
2500
3000
4000
5000
6000
7000
8000
9000
10
Ave
rage
str
ess
of c
oal p
illar
(MPa
) 10
8
6
4
2
0000 0005 0010 0015 0020 0025 0030 0035 0000 0005 0010 0015 0020 0025 0030 0035
Average axial strain of coal pillar Average axial strain of coal pillar
Figure A-44 Post peak pillar strength with increasing backfill 10m high pillar (wh=20) with cohesive backfill on left non-cohesive backfill on right
The amount of backfill to achieve the transition between strain softening and hardening is presented in Table A-9 for all mining height The values in this table are estimated from the stress-strain curve analysed to 35 of strain and are depended on the backfill increment which is in turn dependent on the ratio of mining height to the calibrated element size 05m
Table A-9 Percentage of roadway backfill that leads to a transition from strain softening to hardening
Pillar height Non-cohesive 05MPa Cohesive 10MPa Cohesive backfill backfill backfill
5m 300 200 200
6m 500 417 333
7m 571 500 429
8m 625 625 500
9m 722 722 611
10m 800 800 700
The modelling results suggest that the average axial stress of coal pillar increases with compression until peak stress is reached In the post-failure region pillar stress is reduced as strain increases for all models without backfill All the model results predict that there would be a change to strain hardening behaviour as percentage of backfill increases For example this transition point is 333 for 10 MPa cohesive backfill while 50 for non-cohesive backfill with 6m mining height as shown in Table A-9 It can also be seen from Table A-9 that tall pillars need more backfill than squat pillars to achieve the change from strain softening to hardening for either cohesive backfill or non-cohesive backfill
A55 Backfill for diamond shaped pillars
A 7m high diamond shaped pillar with 50 degree skew angle is analysed with increasing level of backfill in surrounding roadways On the skewed angle the backfill is constrained with roller boundary conditions normal to the skewed angle to represent symmetry conditions and a 5m wide roadway
Figure A-45 Numerical model of diamond shaped pillar with backfill on left and boundary conditions on right
The predicted strength of a diamond shaped pillar and equivalent square pillar with increasing roadway backfill of both cohesive and non-cohesive models is presented in Figure A-46 and Figure A-47
6
7
8
9
10
11
12
13
0 10
Pilla
r str
engt
h (M
Pa)
20 30 40 50 60 70 80 90 100
Percentage of backfill ()
Skew pillar
Square pillar
0
10
20
30
40
50
60
70
0 10
Incr
ease
of p
illar
str
engt
h (
)
20 30 40 50 60 70 80 90 100
Percentage of backfill ()
Skew pillar
Square pillar
Figure A-46 Predicted pillar strength of diamond and square shaped pillars with increasing percentage of 1MPa cohesive backfill On left is absolute strength and on right is percentage strength increase
6
7
8
9
10
11
0 10
Pilla
r stre
ngth
(MP
a)
20 30 40 50 60 70 80 90 100
Percentage of backfill ()
Skew pillar
Square pillar
0
5
10
15
20
25
30
35
0 10
Incr
ease
of p
illar
str
engt
h (
)
20 30 40 50 60 70 80 90 100
Percentage of backfill ()
Skew pillar
Square pillar
Figure A-47 Predicted pillar strength of diamond and square shaped pillars with increasing percentage of non-cohesive backfill On left is absolute strength and on right is percentage strength increase
A56 Backfill placed after significant pillar yield
A pillar model with 90 non-cohesive backfill placed after yielding of a 7m high pillar is presented in Figure A-48 The percentage of strength increase is given in Table A-10 It is found that the pillar strength increase is lower if the pillar has undergone significant deformation before the placement of backfill It is predicted that 90 backfill results in a strain-hardening pillar behaviour even if the pillar has previously yielded significantly
Ave
rage
stre
ss o
f coa
l pill
ar (M
Pa)
18 without backfill 025 strain 050 strain
14
16
075 strain 100 strain
12 125 strain 150 strain
10 175 strain 200 strain
8
6
4
2
0 0000 0005 0010 0015 0020 0025 0030 0035 0040 0045 0050
Average strain of coal pillar
Figure A-48 Stress strain curves for backfill placed around the pre-strained pillar displaying state of pillar core upon placement of backfill
Table A-10 Pillar strength increase with 90 non-cohesive backfill placed around a pre-strained 7m high square pillar of 20m width
Percentage backfill ()
Strain at placement of non-cohesive backfill ()
Pillar strength (MPa)
Percentage increase in peak
strength ()
Percentage increase in post-peak
strength at 3 strain ()
0 000 7953 000
90 000 10290 2939
90 025 9156 1513
90 050 8965 1272
90 075 8526 720
90 100 7945 26006
90 125 7951 22608
90 150 7951 18917
90 175 7951 15629
90 200 7951 11134
A6 3D MODEL OF DUNCAN ST FAILURE PANEL
A61 Numerical model
A three dimensional model of 46 pillars in the Duncan St subsidence region has been analysed with over burden geology based on hole CP1 and a constant overburden depth of 124m Figure A-49 Figure A-50 and Figure A-51 Uniform mining heights of 6m and 9m have been analysed
Selection of the pillars to be analysed is based on visual inspection of the panel layout and includes pillars bounded by unmined coal to the west the waterline barrier pillar to the east larger pillars to the south and a panel of slightly larger pillars of different orientation to the north
One row of pillars in the middle of this panel trending from north-west to south-east are of smaller dimension than the average and of diamond shape with acute internal angle of approximately 50degrees Being in the approximate middle of the panel close to full tributary area load will be mobilised on this row of pillars and therefore it is believed pillars in this row initiated the 2008 subsidence event
The Duncan Street numerical model has the following objectives
bull Estimation of pillar stresses and FoS for comparison with empirical formula
bull Comparison of backfill response at panel scale with previous single pillar studies
bull Estimation of surface subsidence at given percentage roadway fill
bull Estimation of extent of abutment stresses due to panel failure
A62 Observations from Duncan Street numerical model
bull At 6m mining height the minimum pillar FoS for these 46 pillars is calculated to be 131 using Pressure Arch theory and UNSW strength formula panel failure is not predicted with this mining height by the model At 9m mining height the minimum FoS is calculated as 099 and panel failure is predicted to occur
bull The probability of pillar failure for associated FoS calculated by the UNSW pillar strength formula Eq(2) is given in Galvin 2006 in Table A-11 The relationship was developed for square pillars using the Australian pillar database and tributary area theory and hence theoretically speaking may not directly apply to this study However it can be taken as a general guide
bull From Table A-11 it is seen that there is a 1 in 20 probability of instability at 6m mining height and a 1 in 2 probability at 9m mining height Numerical modelling is however a deterministic approach and it always predicts failure if the FoS is less than 10 and stability if FoS gt 10 since no variation in geotechnical properties or conditions is used
bull Although our numerical models predict no pillar failure at 6m and panel failure at 9m in reality there remains approximately a 1 in 20 chance of failure at 6m mining height If one pillar was to fail load transferred to adjacent pillars would reduce the FoS of these adjacent pillars and could lead to the pillar failure and subsidence as observed at 2008 event region
Table A-11 Factor of safety failure probabilities for UNSW pillar strength formula
(after Galvin 2006)
Safety Factor Probability of pillar failure
087 8 10
100 5 10
122 1 10
130 5 100
138 2 100
144 1 100
163 1 1000
179 1 10000
195 1 100000
211 1 1000000
bull Based on the numerical results obtained using two mining heights the pillar and overburden failure is consistent with analytical predictions from Pressure Arch theory and UNSW pillar strength calculation
bull Surface subsidence predicted from the numerical model with a mining height of 9m is 196m While this value is in approximate agreement with monitoring data (14mshy15m) the model was not sufficiently calibrated since the real mining height in the region is uncertain to be able to confidently predict final subsidence strains and tilts at the site
bull With 1MPa cohesive backfill at a roadway fill ratio of 83 the predicted strength increase is 70 With non-cohesive backfill at the same fill ratio the strength increase is 20 These values are in agreement with the results for single pillars
bull The numerically predicted surface subsidence with 83 roadway fill is 022m Maximum predicted tilt in east-west direction is 7mmm and in north-south direction is 5mmm Analytical formula [Holla amp Barclay 2000] predict maximum tilt of 53mmm for this amount of subsidence
bull Isolated cohesive backfill surrounding pillars of low wh ratio is predicted to be effective in confining the pillar and increasing peak pillar strength and panel stability Isolated non-cohesive backfill without barriers could not be analysed in this numerical model as backfill lsquoflowsrsquo and numerical stability could not be achieved
bull Stress transfer in the immediate roof sandstone unit (above the coal roof) is predicted to extend approximately 80m beyond the limits of the collapsed panel This is in reasonable agreement with theoretical studies
Figure A-49 Duncan St modelled panel with outline of adjacent modelled panel location of representative open hole CP1 file named ldquoAppendix B2 open hole logsrdquo located in directory ldquoCollingwood Park Subsidence 2B Collingwood Park Mine Subsidence Reports 1988 Eventsrdquo and mine subsidence limit contour
A63 Model properties
Overburden geology is based on borehole CP1 the most complete interpreted available hole drilled in 1988 by Queensland Department of Mines Figure A-50 To include this in the numerical model lithological units had to be coalesced into major units of sandstone (SS) siltstone (SL) mudstone (MS) weathered units and coal Figure A-51
Rock properties for the overburden were determined from a 2D parametric study whereby the UCS of all units was scaled to achieve pillar and overburden failure at 8m mining height Table A-12 and Table A-13
Unit top depth thickness unit thickness
thickness scaled
thickness in model
000 1200 1200 1046 1000 1200 700 SS 700 610 600 1900 600 MS 600 523 500 2500 1100 SS 1300 1133 1100 3600 200 SS 000 3800 100 SL 1000 871 900 3900 100 MS 000 4000 500 000 4500 100 000 4600 100 000 4700 100 000 4800 100 SS 400 349 400 4900 300 SS 000 5200 300 SL 700 610 600 5500 100 MS 000 5600 300 MS 000 5900 400 SS 500 436 400 6300 100 SS 000 6400 400 SL SS 900 784 800 6800 100 SL MS 000 6900 100 SL 000 7000 200 SL MS 000 7200 100 SS SL 000 7300 200 SS 1000 871 900 7500 200 SL 000 7700 200 SS SL 000 7900 200 SS 000 8100 100 SL 000 8200 100 SS 000 8300 200 SL 4350 3790 3800 8500 200 SL 000 8700 100 SS 000 8800 100 COAL 000 8900 200 000 9100 100 000 9200 100 000 9300 100 SL MS 000 9400 300 SL MS SS 000 9700 100 000 9800 100 SL MS 000 9900 400 SL SS 000 10300 200 SS MS 000 10500 100 SL MS 000 10600 200 SL MS SS 000 10800 100 000 10900 400 SL MS 000 11300 400 SL SS 000 11700 100 SS MS 000 11800 300 000 12100 400 SL SS 000
SL MS MS SS
MS
MS
SL
MS SS SL SS SL MS MS
weathering
SL MS SS
12500 150 000 12650 450 850 741 750 13100 400 SS 000 13500 100 MS SL
SS SL 960 837 500
13600 200 13800 100 SS 13900 200 14100 360
SS SL SL MS
14460 470 COAL MINING SEAM 600 14930 FLOOR
Figure A-50 Inferred geology from representative borelog CP1 used in numerical model
weathering SS
Unit Depth floor below surface Num elements Unit Unit name in model surface 0
10 3 16 weather 16 2 15 ss6
MS 21 2 14 ms2 SS 32 4 13 ss5 SL 41 3 12 sl3 SS 45 1 11 ss4 MS 51 2 10 ms1 SS 55 1 9 ss3 SL 63 3 8 sl2 SS 72 3 7 ss2 SL 1055 11 6 sl1 SS 113 4 5 ss1 SEAMR 118 3 4 seamr SEAM 124 3 3 seam FLOOR1 134 3 2 floor2 FLOOR2 250 10 1 floor1
Figure A-51 Coalesced units for numerical model based on hole CP1
Insitu stress is unknown at the site so a horizontal to vertical stress gradient of 15 has been assumed Given that the extensive workings were undertaken 20 to 30 years before the 2008 event horizontal stresses in the mining seam would be considerably disturbed from the pre-mining conditions
Table A-12 Rock properties for softening mohr coloumb material Softening rates of coal friction angle is 6 degrees over 2 plastic strain and total loss of cohesion over 24 plastic strain in coal and over 1 in other rocks Determined from pillar studies
E
nu Bulk Shear UCS UCS Phi Dilation Coh Tensile Strength (GPa) (GPa) (GPa) (MPa) scaled angle (MPa) (MPa)
SS 75 02 4167 3125 50 125 40 2 291 125
SL 4 025 2667 1600 30 75 35 2 195 075
MS 3 025 2000 1200 15 375 32 2 104 0375
Weathering 1 025 0667 0400 8 2 32 2 055 02
COAL 11 03 0917 0423 12 3 36 6 076 003
FLOOR1 4 025 2667 1600 30 75 38 2 183 075
FLOOR2 4 025 2667 1600 30 75 38 2 183 075
Table A-13 Ubiquitous joint properties Softening rate of ubiquitous joints total loss of cohesion over 1 plastic strain Determined from 2D overburden studies
Cohesion Ubiq joint cohesion Tensile Strength Ubiq joint tensile strength Ubiq joint (MPa) (MPa) (MPa) (MPa) friction
SS 291 00029144 125 0000125 15 SL 195 00019521 075 0000075 15 MS 104 00010393 0375 00000375 15 Weathering 055 00005543 02 000002 15 COAL 076 003 FLOOR1 183 - 075 - -FLOOR2 183 075 -
A64 Results from 3D Duncan St model
Factor of Safety estimated at 6m and 9m mining heights
Figure A-52 Pillar FoS calculated for 6m mining height by analytical method with strength by eq(3) and pillar stress by pressure arch theory Minimum value is 131 suggesting a 5 in 100 probability of failure however not sufficient to fail in the numerical model (that requires FoS lt 10)
Figure A-53 Pillar FoS calculated analytically for 9m mining height (eq(3) and PA theory) Minimum value is 099 suggesting a probability of failure of 5 in 10 although in the numerical model failure should occur
Yield on plane for 6m and 9m mining heights
Figure A-54 Location of section plane used for section view in following figures
Figure A-55 Yield on section plane for 6m mining height No significant damage or displacement observed
Figure A-56 Yield on section plane for 9m mining height no backfill
Figure A-57 Displacement on section plane for 9m mining height no backfill Maximum displacement is approximately 15m at surface
Results on horizontal plane at mid-pillar height
Figure A-58 Yield at mid-pillar height 9m mining height Blue elements evident in some pillars indicating pillar core remains intact
Figure A-59 Predicted vertical stress at mid pillar height 9m mining height Insitu stress is 30MPa Unyielded pillars and pillars hardening after yield are transferring vertical load while yielded pillars carry little load Extent of abutment stress increase is approximately 80m
Figure A-60 Roof vertical stress predicted by numerical model with 9m mining height Contour increments are 01MPa Base vertical stress is approximately 27MPa Abutment stress influence distance is approximately 80m
Results on surface after panel failure at 9m mining height
Figure A-61 Surface subsidence as predicted with numerical model with 9m mining height and total subsidence along Duncan St to McLaughlin St as monitored to October 09 Maximum surface subsidence predicted as 196m Outline of numerical modelling pillars and dotted contour of observed subsidence limit
A65 Duncan St model ndash backfill effectiveness
The Duncan St 3D model has been analysed with full and targeted 1MPa cohesive and non-cohesive backfill placed in roadways Roadway fill of 66 is analysed for the 1MPa cohesive mixture and 83 roadway fill for the non-cohesive mix
Results are presented in the following figures and figure captions
Factor of Safety increase from cohesive backfill
Analysis of the Duncan St model with 9m mining height is undertaken to estimate the FoS increase from backfill By increasing gravity in increments the backfill strength improvement is quantified With 83 roadway fill of 1MPa cohesive backfill the overburden and pillar tops (ie region of pillar above height of backfill) fails with gravity of 17ms2 suggesting the pillars with FoS of approximately 10 has increased FoS to 17 by backfilling adjacent roadways
Figure A-62 Gravity of 16g with 83 1MPa cohesive backfill showing no significant yield
Figure A-63 Gravity of 17g with 83 1MPa cohesive backfill predicting failure of pillar tops and overburden and collapse of roadway void space
FoS increase with non-cohesive backfill
With non-cohesive backfill pillars yielded due to lack of confinement upon initial placement of backfill in roadways but overburden remain stable and void space above backfill remained open Overburden remained stable at gravity increase to 11ms2 Figure A-64 but collapsed at gravity increase of 12ms2 Figure A-65
Figure A-64 Gravity of 11g with 83 non-cohesive backfill predicting pillar yield but overburden stability
Figure A-65 Gravity of 12g with 83 non-cohesive backfill predicting failure of pillars and overburden and collapse of roadway void space Maximum surface subsidence is 055m which includes the compressive effect of the 12g gravity increase
Placement of targeted backfill
A model is analysed with cohesive backfill totally surrounding two pillars with low predicted FoS The two pillars are predicted to have a FoS of 099 and 100 left to right viewed from above at a 9m mining height Backfill extends to an extent of 5m to 10m from the pillar and is 6m high in the roadways Gravity increase to 12g required to fail panel suggesting panel strength increase is approximately 20 from targeted backfill Predicted surface subsidence 125m (excessive mesh deformation stops analysis equilibrated stage may have higher surface subsidence)
Figure A-66 Duncan St model with 66 roadway fill of 1MPa cohesive backfill surrounding two pillars with low FoS at 9m mining height
Figure A-67 Predicted yield at mid pillar height of 9m pillars with 66 roadway fill of 1MPa cohesive backfill Note intact core (blue) for targeted pillars
Figure A-68 Pillar strength at 9m mining height Strength WITHOUT BACKFILL of northern focus pillar selected for targeted backfill is 527MPa and southern focus pillar is 526MPa
Figure A-69 Vertical stress in pillars targeted for partial backfill placement Stress calculated at equilibrium of elasto-plastic analysis WITHOUT BACKFILL Stress in northern focus pillar is 54MPa and in southern focus pillar is 513 FoS of NFP=52754 = 0975 FoS of SFP=526513 = 1025
Non-cohesive backfill in targeted placement study
A model with targeted placement of non-cohesive backfill was attempted but could not be satisfactorily converged since backfill lsquoflowsrsquo and inter-penetrates elements resulting in numerical instabilities
Forcing pillars to fail to examine resultant subsidence
To examine the extent of surface subsidence if backfilled pillars fail the numerical model with 9m mining height and 83 roadway fill of 1MPa cohesive backfill is analysed with a 90 reduction in coal pillar strength properties
With 9m mining height and 83 roadway fill of cohesive backfill void space remaining is 15m and the numerical model predicts failure of pillars and overburden results in approximately 02m surface subsidence
Figure A-70 Surface subsidence predicted by numerical model when pillars forced to fail with 83 roadway fill Contour interval is 01m with maximum subsidence predicted as 022m
Figure A-71 Surface strain in east-west direction when pillars forced to fail resulting 022m surface subsidence Maximum strain is 5mmm and contour interval is 1mmm
Figure A-72 Surface strain in north-south direction when pillars forced to fail resulting 022m surface subsidence Maximum strain is 3mmm and contour interval is 1mmm
Figure A-73 Tilt in east-west direction Units are mmm and intervals are 1mmm maximum tilt is 7mmm
Figure A-74 Tilt in north-south direction Units are mmm and intervals are 1mmm maximum tilt is 5mmm
To highlight the need for adequate fill the model with 66 roadway fill is analysed with the pillars forced to fail with a 50 reduction in pillar strength Void space over the backfill in the roadways is 30m Modelling predicts maximum surface subsidence of 068m
Figure A-75 Surface subsidence when pillars forced to fail with 66 roadway fill Roadway void space is 30m with the model predicting 068m surface subsidence Contour interval is 01m
A66 Numerical model of adjacent high risk area
Numerical model and panel stability
A numerical model of the region adjacent to Duncan St incorporating 76 pillars is analysed at 9m mining height Overburden strata strengths and depth-of-cover is consistent with Duncan St model
The main objective of this model is to estimate the strength difference between the two mining panels west and east of the Waterline fault Given uniform mining height and depth-of-cover the strength difference will be due to the pillar configuration and boundary conditions
At 9m mining height the model is predicted to be essentially stable although 9 pillars are predicted to be fully yielded at mid-pillar height
With gravity increase of 10 the model remains stable At 20 increase in gravity the model is predicted to fail with significant overburden yield
It is concluded therefore that the panel to the east of Waterline fault is 20 stronger than the panel to the west
Figure A-76 Location of numerical model 2 together with surface subsidence contours from 1988 and 2008 events and seam level eastern boundary of failure predicted from 3D seismic
Figure A-77 Yield on section at mid-height for 9m mining height
Figure A-78 Rockmass yield on vertical section trending east-west at mid-point of model Note overburden is largly intact with no extensive collapse
Figure A-79 Pillars predicted to have failed from Numerical model 2 with surface subsidence contours and inferred eastern limit of failed zone at seam level
By a 20 increase in gravity the model is forced to fail resulting in predicted 13m surface subsidence that includes increased overburden compression from increased gravitational component Excessive deformation and numerical instability stopped the model true surface deformation may be higher
Figure A-80 Adjacent model with 9m mining height Predicted surface subsidence after 20 increase in gravity Model predicts 13m surface subsidence
Figure A-81 Adjacent model with 9m mining height and 20 gravity increase Predicted failure at mid-pillar height Note intact core in southern pillars which appear stronger from unmined adjacent coal and larger general pillar size
A7 CONCLUSIONS
A71 Current knowledge on coal pillars behaviour
bull The strength based factor-of-safety approach is well established in coal pillar design Factors of safety for coal pillars required to provide medium to long term stability should be greater than 16 [Galvin 2006 Hill 2005]
bull Coal pillar strength has been the subject of rigorous research since at least the 1960rsquos and the Salamon amp Munro formula has been applied in the design of over a million coal pillars in South Africa alone [Mark 1999 Salamon 1998] Strength formula derivations from the UNSW are established in Australia
bull Coal pillar load calculation traditionally relies on tributary area theory which is a conservative approach suitable for pillar design
bull Tributary area conditions are NOT satisfied at Collingwood Park pillars are irregular in size and shape there is large areas of unmined coal and the seam has significant dip
bull This last point is important as analytical methods hold the only hope of evaluating every pillar at Westfalen No 3 Colliery The numerical model of Duncan St analyses 46 pillars and requires significant computational resources the entire Colliery has in excess of 700 pillars and cannot be analysed by the same methods in its entirety by current computer codes in a reasonable time frame
bull Likewise it is not satisfactory to draw conclusions on panel stability from limited analysis of representative groupings of pillars because of the variability in size shape mining height and cover depth over the mining area
bull To overcome the limitations of tributary area theory for the back-analysis of an irregular pillar layout a novel approach for calculating loads based on pressure arch theory has been developed subjected to international peer review and published in the International Journal of Rock Mechanics and Mining Sciences In summary each pillar is individually examined and the pillar area circumference and centroid are calculated At the pillar centroid the cover depth and mining height are determined An influence zone based on a circular area with radius defined by the depth-dependent load transfer distance Within this area the local extraction ratio is calculated This approach has found to satisfactorily account for pillars of arbitrary shape in irregular layout with variable cover depth
bull This allows a FoS to be determined for the over 700 pillars of Westfalen No 3 with reasonable computer resources
A72 Typical pillar strength effects
Width to height ratio
bull Pillars at Westfalen No 3 have typical effective width from 20m to 50m While mining height is uncertain it is believed to range from 6m to 10m With these dimensions pillar wh ratio ranges from 20 to 83
bull At the lower limit of wh=20 geological influences will start to determine pillar strength [Galvin 2006] From wh in the range gt 20 to 40 the formula of Salamon and Munro or UNSW extensions could be expected to estimate pillar strength with the squat pillar version of these formula applicable for whgt40 [Galvin 2006 Salamon 1998 Galvin 1999]
bull The squat pillar extensions were developed since the standard formulas were found to underestimate pillar strength at whgt4 At Westfalen No 3 colliery although there are a number of pillars of whgt4 many of these are irregular in shape often long and relatively narrow (30m ndash 40m) Given this and the need to automate the assessment of every pillar the squat pillar strength formula is not utilised This approach is conservative
Pillar shape effects
bull Many pillars at Westfalen No 3 are skewed of diamond shape with acute internal angle from 50 to 90 degrees Hydraulic radius simile accounts for pillar shape by an effective width defined by 4AC while the UNSW has a parrellopid formula that for pillars of equal side length results in an effective width equivalent to this
bull In a study of pillar shapes common to Westfalen No 3 colliery the hydraulic radius analogy for estimation of effective width is found adequate with errors less than 6 for considered sizes and shapes
Post peak strength
bull Numerical studies and the work of Das in Indian coal fields highlights the changing post peak behaviour with increasing width to height ratiorsquos It has been determined that when wh exceeds approximately 5 pillars start to harden post peak When whlt3 pillars display limited if any post peak strength
bull The significance of this effect will be in the manner that pillars shed load to adjacent pillars In an array of pillars of similar dimensions pillars with a low wh ratio could be expected to shed load in a sudden more catastrophic manner than those that harden post peak Such sudden pillar failure is referred in the literature as catastrophic cascading or rolling pillar failure and has been responsible for damaging wind blasts and significant loss of life over the years
bull In an irregular pillar layout such as Westfalen No 3 with variable wh ratio significant barrier pillars and regions of unmined coal sudden multiple panel collapse would be expected to be less likely
bull The analytical approach developed for assessing pillar load accounts for load shed from a failed pillars to pillars within the zone of influence of that pillar
Specific details of this approach are discussed in the hazard map and risk assessment chapter of this report
Backfill effect
bull Numerical studies on a cohesive and non-cohesive backfill suggest that pillar strength is increased with increasing height of fill Studies suggest a 1MPa cohesive backfill may increase pillar strength by approximately 10 at 40 roadway fill for wh=33 and 18 at 40 roadway fill at wh=22 At 80 roadway fill pillar strength increases are predicted to exceed 50 Percentage strength increases are predicted to be greater with lower wh ratiorsquos
bull Studies of a non-cohesive backfill suggest at 80 roadway fill pillar strength increases are approximately 25
bull With both backfill types pillar strength is predicted to increases dramatically above 80 roadway fill and pillars are predicted to exhibit post-peak hardening behaviour
For example in the Duncan St area a pillar of effective width 20m will have a FoS of approximately 118 at mining height of 10m without backfill A 50 strength increase from 1MPa cohesive backfill at 80 roadway fill will raise the FoS to approximately 177 and reduce the probability of instability from approximately 1 in 10 to less than 1 in 1000
With 80 roadway fill of a non-cohesive backfill the same Duncan St pillar FoS will increase to approximately 147 and the probability of instability reduce to less than 1 in 100
bull Backfill is likely to reduce the rate of time dependent pillar strength degradation by reducing pillar spalling due to the erosive effects over time of high stress and exposure of the pillar surface to the atmosphere
bull In addition backfill is likely to benefit pillar stability by limiting the void available to the roof to fall into Roof falls particularly at roadway intersections may be present By reducing the roadway volume backfill will eventually support the roof when the bulking effect of roof falls fills the remaining roadway voids space Beyond this summary time dependent issues of backfill have not been considered
roadway
fill
Non-cohesive backfill
(7m mining height width 20m) strength increase
05 MPa cohesive backfill
(7m mining height width 20m)
strength increase
10 MPa cohesive backfill
(7m mining height width 20m)
strength increase
60 135 388 437
70 183 432 597
80
90
208
291
474
572
698
957
A73 Duncan St numerical model
bull In the Duncan St subsidence region approximately 46 pillars are surrounded by unmined coal to the west a large pillar containing the Waterline fault to the east and larger pillars to the south and north
bull At 6m mining height pillar minimum FoS for these 46 pillars is calculated at 131 with Pressure Arch theory and UNSW strength formula At 9m mining height minimum FoS is calculated as 099
bull Pillar probability of failure for FoS calculated by the UNSW eq(2) is given in [Galvin 2006] as
Table A-14 Factor of safety failure probabilities for UNSW pillar strength formula (after Galvin 2006)
Safety Factor Probability of pillar failure
087 8 10
100 5 10
122 1 10
13 5 100
138 2 100
144 1 100
163 1 1000
179 1 10000
195 1 100000
211 1 1000000
bull From Table A-14 at 6m mining height there is a 1 in 20 probability of instability and at 9m a 1 in 2 probability The variability in the database of failed and unfailed pillars from which eq (1) to eq (3) are derived is responsible for these probabilities Our numerical model should always predict failure if the FoS is less than 10 and always predict stability with FoS gt 10 since no such variability in geotechnical properties or conditions is used
bull While our numerical model predicts no pillar failure at 6m and pillar failure at 9m in reality there remains approximately a 1 in 20 chance of failure at 6m mining height If one pillar was to fail load transferred to adjacent pillars would reduce these adjacent pillars FoS and may well lead to the pillar failure and resultant subsidence observed at Duncan St
bull Based on the numerical results obtained using two mining heights the pillar and overburden failure is in line with analytical predictions from Pressure Arch theory and UNSW pillar strength calculation
bull Surface subsidence predicted from the 9m mining height numerical model is 196m While this value is in general agreement with monitoring data the model is not sufficiently calibrated since the real mining height in the region is unknown to be able to confidently predict final subsidence strains and tilts
bull With 1MPa cohesive backfill at a fill ratio of 83 the predicted strength increase is 70 With non-cohesive backfill at the same fill ratio the strength increase is 20 these values are in agreement with single pillar studies
bull Abutment stresses in the immediate roof sandstone unit (above the coal roof) are predicted to extend approximately 80m beyond the limits of the model This is in reasonable agreement with twice the load transfer distance of 64m (at 124m depth-of-cover) used to define a pillars zone of influence (the ZI also includes half pillar width ie 74m for 20m pillar)
A74 Numerical model of adjacent region
bull A numerical model of the region immediately to the east of the Duncan St failure region is constructed with 76 pillars
bull At 9m mining height the model predicts failure of 9 pillars but no significant overburden failure The model remains stable in general
bull With a 20 increase in gravity the model is predicted to fail
bull Numerical modelling results suggest the region to the east of the Waterline barrier pillar is stronger by approximately 20 than the subsided region to the west of the barrier pillar
bull Predicted surface subsidence (including compressive effects from gravity increase) is 13m all though numerical instabilities halt the model and true surface subsidence is likely to be higher
bull Inspection of yield at mid-pillar height suggests the southern pillars in the model have intact core when pillars in the middle of the region are failed in their entire volume In reality the southern region of this panel have greater depth-of-cover therefore higher pillar stresses and thus lower FoS in these southern pillars
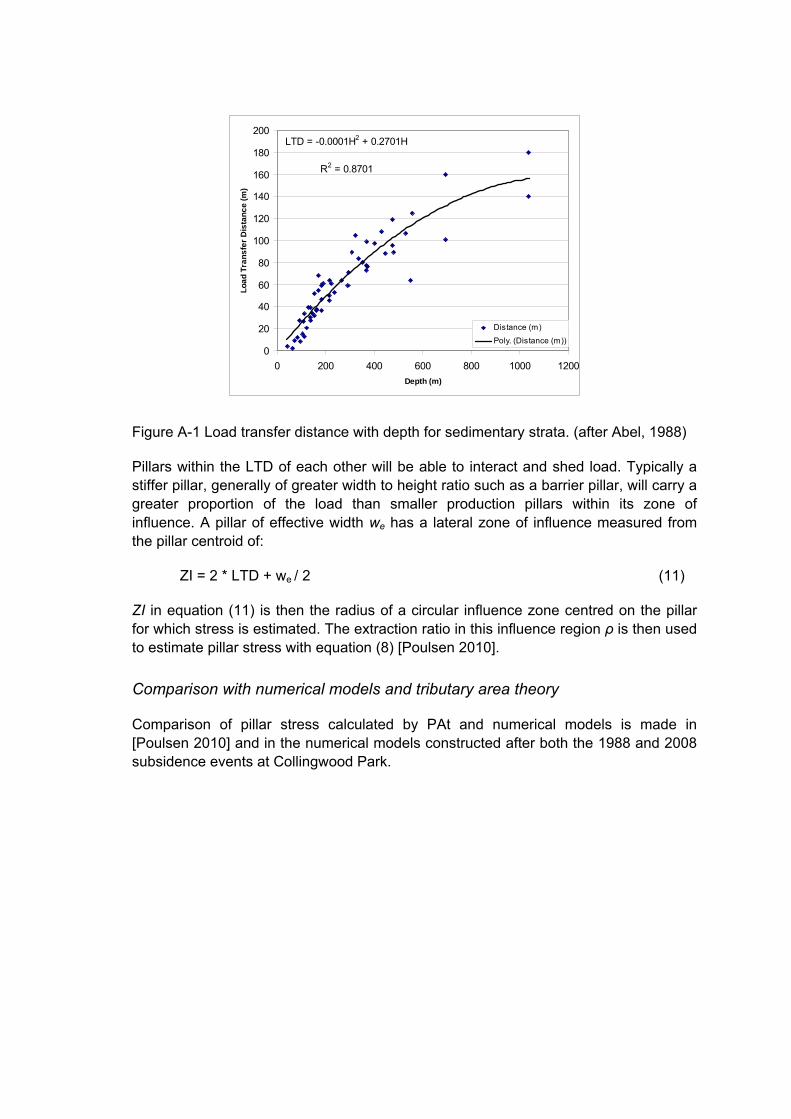

35
4
45
5
55
6 60
Pressure arch theory Tributary area theory Numerical model
0 5 10 15 20 25 30
Pillar number
Press Arch theory
Trib area theory A
vera
ge v
ertic
al s
tres
s in
cor
ner p
illar
(MPa
)
Stre
ss d
iffer
ence
from
num
eric
al m
odel
(MPa
)
50
40
30
20
10
00 0 20 40 60 80
Number of pillars excavated
Figure A-2 Stress in central pillar calculated by tributary area and pressure arch theories compared with an elastic numerical model
-10
Figure A-3 Stress difference from elastic numerical model for pillar stress estimated by pressure arch and tributary area theories Average absolute stress difference for pillar stress estimated with pressure arch theory is 030 MPa and with tributary area theory is 237 MPa
5
55
6
65
7
75
0 5 10 15 20 25
Pillar
Pill
ar s
tres
s (M
Pa)
MinCad PA theory TA theory
Figure A-4 pillar stresses predicted by pressure arch theory (left) and stresses predicted by pressure arch theory tributary area theory and MinCad model (right) Average absolute percentage variation from modelling results is 75 PA theory and 108 TA theory
After the 1988 subsidence event at Collingwood Park a numerical model was constructed with the code MINCAD and reported in [Wardel 1989] Stresses predicted by this numerical model PAt and TAt are made in Figure A-4
Comparison with Duncan St FLAC3D model constructed for this project is made in Figure A-5
3
35
4
45
5
55
6
65
7
75
8
0 10 20 30 40 50 Pillar
Pilla
r stre
ss (M
Pa)
Num Mod elas szz PA theory TA stress
Figure A-5 Predicted pillar stress from numerical model of Duncan St region Pressure Arch (PA) theory and Tributary Area (TA) theory TA theory with constant bord width of 66m (mine plan shows 66m+ bord) Average absolute stress difference is 03MPa for PA theory and 14MPa for TA theory
A3 BENCHMARKING OF NUMERICAL MODEL
The pillar strength equation derived from the combined databases of Australia and South Africa is used to benchmark the numerical model This equation which is the same as equation (3) above rewritten for convenience
Pillar strength = 688 w050 h070 (3)
A typical pillar from the Duncan St region of Collingwood Park has a side length of 20m internal acute angle in the range of 50-54 degrees The excavation or pillar height is 6m+ and depth of cover is 124m as shown in the mine pillar plan of Figure A-6
Figure A-6 Typical pillar with dimensions in the Duncan Street subsidence region Highlighted outline is the location of the 3D model Depth of cover is approximately 124m and pillar height is 6m+
The code FLAC3D (F3D) by Itasca Consulting Group [Itasca 2006] has been used for all numerical models F3D is a continuum code with yield criteria suitably flexible for modelling the full stressstrain response of coal type materials Only a quarter section of the bord and pillar array needs to be modelled once symmetry conditions are enforced in both x and y directions as shown in Figure A-7 Notice that only partial parts of the roof and floor have been considered
Figure A-7 A sketch of F3D mesh showing a quarter of a pillar as well as roof and floor and boundary conditions
A strain softening yield criterion has been used for coal and rock materials modelling In other words Mohr-Coulomb material model with non-associated shear and associated tension flow rules [Fama 1995 Itasca Consulting Group Inc 2006 Pietruszczak 1980 Hoke 1990] has been used In this model the parameters representing material cohesion friction dilation and tensile strength may reduce or soften after the onset of plastic yield by a user defined piecewise linear function [Jiang 2009 Zhou 2009] as displayed in Figure A-8 It is assumed that the roof and floor rock masses are elastic and only coal pillar is allowed to behave both elastically and plastically All model material parameters are listed in Table A-1 To achieve a reasonable match with the strength formula of Equation (3) for a width to height ratio greater than 4 it was found that it is necessary to have an explicit yielding interface or joint at the pillar boundaries on both the roof and the floor contact areas The interface properties are listed in Table A-2
Coal properties for the numerical model are estimated from the reported literature values and from calibration analyses by matching Equation (3) for the range of width-to-height ratios from 2 to 4 These numerical results are compared with Equation (3) in Figure A-9
00
02
04
06
08
10
12
Coh
esio
n (M
Pa)
29
30
31
32
33
34
35
36
37
Fric
tion
Ang
le (deg
)
Cohesion (MPa) Friction Angle (deg)
0 1 2 3 4 5 6 7 8 9 10 Plastic strain ()
Figure A-8 Variation of cohesion and friction angle with plastic strain
Table A-1 Mechanical parameters used in numerical models
Property
Youngs Modulus
(GPa) Poissonrsquo s ratio
UCS (MPa)
Tensile Strength (MPa)
Original value (MPa)
Cohesion
Softening rate ()
Residu al value (MPa)
Original value (deg)
Friction Angle
Softening rate ()
Residual value (deg)
Dilation Angle
(deg)
Coal 110 030 40 004 102 5 0102 360 05 300 60
Roof 570 019
Floor 797 024
from CSIRO report 42 Roof and floor materials are assumed elastic
Table A-2 Mechanical parameters of interface used in numerical model
Interface property Normal stiffness (GPa) Shear stiffness (GPa) Cohesion (MPa) Friction Angle (deg)
Value 20 20 05 200
Pilla
r stre
ngth
(MP
a)
11
10
9
8
7
6
5
S amp M combined
Numerical results
15 20 25 30 35 40 45 wh ratio
Figure A-9 FLAC3D parametric study to match pillar strength with the analytical formula of Salamon amp Munro (combined Australian and South African version)
A4 PILLAR STRENGTH INCLUDING FULL STRESS STRAIN CURVE AND PILLAR SHAPE EFFECTS
A41 Post peak strength
Das [Das 1986] has presented work on the post peak strength for Indian coals at various width-to height ratios His results show some variability but have a general correlation between post peak strength and increasing wh ratio Beyond a certain wh ratio of approximately 5 to 8 Dasrsquos results predict that samples start to harden with increasing strain
Figure A-10 Post peak strength of Indian coal at various width-to-height ratio after Das 1986
The numerical model of a square pillar of side length 20m and variable height was compressed to approximately 10 strain to investigate post peak behaviour with increasing wh ratio for comparison with results of Das in Figure A-10 The numerical results are plotted in Figure A-11 for various width to height ratios in the range of 10 strain The post peak pattern is similar to those of Das in Figure A-10 although the numerical hardening starts at lower strains
variable height (h)
000
500
1000
1500
2000
2500
3000
000 002 004 006 008 010
Strain
Ave
rage
pill
ar s
tres
s (M
Pa)
WH=20
WH=25 WH=29 WH=33
WH=40 WH=50
WH=67 WH=100
Figure A-11 Post peak failure behaviour of numerical pillars of constant width w = 20m but
Results from the modelling of the full stress strain curve of a 20m square pillar is used to estimate the stress redistributed to neighbouring pillars in the empirical estimation of pillar FoS for the CSIRO Hazard Maps At 4 strain the percentage of peak strength carried by the coal pillar is approximated from Figure A-11 in Figure A-12 where conservatively it is assumed pillars cannot harden but only soften or retain strength
00
200
400
600
800
1000
1200
20 40 60 80 100
Width to height ratio
R e s
idua
l s tr
e ngt
h (
)
residual strength
Figure A-12 Estimation of pillar residual strength at 4 strain
A42 Pillar shape influence on strength
Collingwood Park has many pillars of regular and irregular shapes including square rectangle diamond triangular and other polygon shapes A study of some of these shapes at fixed 6m mining height was conducted
As discussed in [Galvin 1981] with reference to physical models there is a subtle difference in model response at specific width to height ratios depending on whether the width or height of the model is fixed This variation is attributed by Galvin to volume stiffness and pillar end effect variation between width and height changes In the Collingwood Park single pillar studies generally the width is fixed at 20m and width-to-height changes are achieved with height variations and material properties are calibrated to this In studies of diamond and other shaped pillars where the width or effective width varies a unique set of material properties calibrated over width-to-height 2 to 4 at fixed height is developed Table A-3
Attempt is made to keep the constant 05m cube element size although for some of the shapes studied this is not possible and where meshing options exist priority is given to minimizing the variability from the standard element size Ideally the soften rate of the yield criteria would be adjusted based on an element characteristic length Implementation of this reduced mesh dependent errors but it was not felt sufficiently rigorous for inclusion in this report
Table A-3 Cohesion and friction for calibrated model at wh 2 to 4 with fixed 6m pillar height
Property Original value (MPa)
Cohesion
Softening rate ()
Residual value (MPa)
Original value (deg)
Friction Angle
Softening rate ()
Residual value (deg)
Dilation Angle (deg)
Coal 123 35 023 360 05 300 60
Diamond shaped pillars
Diamond pillar shapes located at Duncan St and adjacent areas have typical dimensions of side length 20-30m and minimum acute internal angles of 50 degrees
The area perimeter or circumference (C) of a diamond shape is given by
Circumference = C = 4 w
where w is the side length If the acute internal angle is θ the area can be calculated as follows
Area = A = w2 sin θ
The minimum width or thickness of the cross section is
Minimum width = w sin θ
Hence the effective width weff from the analogy of ldquohydraulic radius = 4ACrdquo defined earlier is given by
weff = 4AC = w sin θ = minimum width
Figure A-13 Predicted pillar strength for diamond shaped pillars at 6m mining height Error at 50 deg internal angle is approximately 6
Polygon with one acute corner
Figure A-14 (a) and (b) show a comparison between theory and numerical model for a polygon with one acute angle
(a) (b)
Figure A-14 (a) Polygon with one acute side (60deg acute angle in figure) Base side length = 40m short side 20m mining height = 6m and (wh 44-38)
Rectangular pillar being split at mid-length in 1m increments
A rectangular pillar of 30m by 10m is modelled as it is split by a 5m roadway
(a) (b)
Figure A-15 (a) Rectangle 30m by 10m being split in 1m increments Note symmetry plane on left hand boundary Mining height 6m (b) Results from numerical model and Strength formula with w=4AC
Triangular shape pillars with two equal sides of 20m
In this example a triangular pillar with two sides of equal length of 20m is analysed
(a) (b)
Figure A-16 (a) Triangular pillar of two equal sides of 20m each Mining height 6m (b) Results from numerical model and strength formula with w=4AC Maximum error is approximately 5
Observations from study of pillar shapes
The general conclusion from the study of pillar shapes at fixed 6m mining heights is that the hydraulic radius analogy of Wagner Equation (4) where the effective width is estimated by area and circumference is applicable to pillars of Westfalen No 3 colliery Errors with this approach at calculating pillar width for width-to-height ratios from approximately 2 to approximately 4 for the shapes studied are under 6
A43 Realistic roof geology
It is recognised that the idealised roof and floor of the pillar model Figure A-7 may have an influence on the predicted strength estimation To quantify this effect a model of a 20m square pillar at width-to-height ratiorsquos of 22 to 4 is analysed with a realistic roof geology
Based on the sonic logging data in borehole CP-C02 located in the failure region of Duncan Street Figure A-17 pillar strength is estimated from a numerical model with the model input parameters selected from the scanned roof geological and geotechnical data The input data are listed in Error Reference source not found and Table A-4 The F3D mesh for a pillar analysis is shown in Figure A-18 and the numerical results for two set of parameters for roof geology are shown in Figure A-19
Table A-4 Mechanical properties of roof and overburden rocks
Youngs Poissonrsquos UCS Tensile Strength CohesionBackfill Modulus Friction Angle (deg)Ratio (MPa) (MPa) (MPa)(GPa)
Sandstone 135 012 25 25 6648 40
Siltstone 195 020 15 15 4728 38
Interbedded 166 017 20 20 2808 38
Mudstone 875 026 10 10 1943 30
UCS Depth (m) (MPa) Geology Scaled UCS (MPa) 1005 7500 sandstone1 2500 1010 1015
6000 6750
interbedded1 2000 2250
1020 1025
7500 9000
sandstone2 2500 3000
1030 6750 interbedded2 2250 1035 4500 siltstone1 1500 1040 5250 interbedded3 1750 1045 4500 siltstone2 1500 1050 1055
225 2250
coal1 750 750
1060 1065
8250 9000
sandstone3 2750 3000
1070 3750 siltstone3 1250 1075 5250 1750 1080 6000 interbedded4 2000 1085 6000 2000 1090 3750 siltstone4 1250 1095 3000 1000 1100 3000 mudstone1 1000 1105 3000 1000 1110 3750 1250 1115 4500 siltstone5 1500 1120 3750 1250 1125 2000 coal2 667 1130 5250 interbedded5 1750 1135 7500 sandstone4 2500 1140 1145
6000 5250
interbedded6 2000 1750
1150 8250 2750 1155 9000 3000 1160 10500 3500 1165 13500 4500 1170 10500 sandstone5 3500 1175 10125 3375 1180 10500 3500 1185 9750 3250 1190 7500 2500 1195 3750 siltstone6 1250 1200 1500 coal3 500 1205 1210
7875 8625
sandstone6 2625 2875
1215 5250 interbedded7 1750 1220 1225
9000 10500
sandstone7 3000 3500
1230 6000 interbedded8 2000 1235 3000 mudstone2 1000 1240 3750 siltstone7 1250
Figure A-17 Sonic log of borehole CP-C02 and roof geological interpretation
Figure A-18 Numerical model of a coal pillar with representative floor and roof rock geology
4 5 6 7 8 9 10 Pillar height (m)
Figure A-19 Comparisons of pillar strength versus pillar height for realistic and simplified roof geology Maximum error is 45
Modelling predicted that the maximum difference in pillar strength for two different roof geology conditions is approximately 45 at the lower height of 6m reducing to less than 1 for pillars of 9m mining height
It is concluded from this study that the simplified roof and floor model satisfactorily estimates pillar strength allowing in excess of 180 numerical models to be analysed in a timely manner
60
65
70
75
80
85
90
95
100
105
Pilla
r str
engt
h (M
Pa)
Assumed geology
Real geology
A44 Pillars surrounded by roadways of variable height
It was observed in the 1983 pillar site investigation [Hollingworth Dames amp Moore 1990] that mining heights at Westfalen No 3 are extremely variable with roadways surrounding individual pillars varying by up to 2m
To investigate the strength of pillars of variable height a 20m wide square model pillar of 8m mining height on one side and 6m height on the directly opposite side of the pillar as shown in Figure Ashy20 has been analysed
Figure A-20 Different views of the numerical modelling mesh of a trapezoidal-square pillar - Model is 8m high on one side and 6m on the other opposite side
Predicted strength of the variable height pillar together with stress-strain curves for pillars of 6m 7m and 8m mining heights presented in Figure A-21 As shown in the figure the predicted strength of a non-uniform-height pillar of trapezoidal shape having 6m and 8m side heights approximates a uniform-height pillar with a constant height of 7m
0
1
2
3
4
5
6
7
8
9
10
Axia
l stre
ss (M
Pa)
Trapezoid pillar
6m pillar 7m pillar
8m pillar
0000 0010 0020 0030 0040 0050
Axial strain
Figure A-21 Stress vs strain curves for rectangular uniform height and trapezoidal non-uniform height pillars Strength of uniform pillars having heights of 6m 7m and 8m are compared with a trapezoidal non-uniform height pillar of having 6m height on one side and 8m on the other opposite side ie a variable height roadway of average 7m height
A45 Pillars created by multiple passes to variable depth
Roadways at Westfalen No 3 colliery were cut in multiple passes at a constant height of 24 m The cut widths were variable ranging from 52 m at the bottom to 76 m at the top as shown schematically in Figure A-22 by the mine managerrsquos hand drawings of the roadway mining method
To asses the strength of such pillars a 9 m high pillar with irregular side surface boundary is modelled Figure A-23 The model pillar has a square base of 23m and side length with three lsquocutsrsquo in its height as shown in Figure A-23
Predicted strength is approximately equal to a similar pillar with effective width equal to minimum width ie 20m in this case Figure A-24
Figure A-22 Sketch of roadways at Collingwood Park showing multiple passes or layers of cutting of the coal seam(from previous mine managersrsquo notes and records)
Figure A-23 Numerical modelling of a multi-pass cut pillar of 9 m height with minimum and maximum side widths of 20m and 23m respectively
0
1
2
3
4
5
6
7
8
Axi
al s
tres
s (M
Pa)
irregular pillar-min w idth 20m high and 9m w ide
square pillar-20m w ide and 9m high
0000 0005 0010 0015 0020 0025 0030 0035 0040
Axial strain
Figure A-24 Stress vs strain curves for pillars of 9m height with regular and irregular square cross-section (Figure A-23) Difference in peak strength predicted to be approximately 35
A5 ROADWAY BACKFILL AND PILLAR STRENGTH IMPROVEMENT
A literature review of backfill applications mechanical properties and behaviours in coal mining identified several examples from China [Guo 2007 Wang 2009] where backfill has been used to reduce surface subsidence from America [Tesarik 2002 2009] where backfill has been used primarily for disposal of fly-ash and reduce acid mine drainage and from Australia [Origin Alliance 2008] - See Table A-5 and the reference list
In the early stages of this modelling specific data and backfill effects and properties required in this numerical study were unavailable and therefore two cases were considered a cohesive backfill having a UCS of 1 MPa and a non-cohesive backfill with no cohesion but a friction angle of 42 degrees Subsequent to these two cases a case of 05MPa cohesive backfill mix was also considered
Backfill properties using in this study are list in
Table A-6
Table A-5 Backfill properties data from various sources
Composition UCS (MPa) E (GPa) Reference
Solid waste including fly-ash 05 initially
to 14-17
0565 Guo et al 2007
Fly-ash amp cement 339 ndash 824 Guo et al 2007
1 4 15 (cement) (fly-ash) (coal
gangue)
07 ndash 17 Wang et al 2009
Fly ash (dry) Scheetz 2009
22 1 (fly-ash) (cement) Scheetz 2009
Cemented rockfill in metal mine 69 1909 Tesarik 2009
Required properties 10 10 OriginAlliance ndash Mine
subsidence interpretive
reporting
P16
25 FA 105 sand 01 bentonite
5 FA 18 sand
Injection 3m intervals
Bell Bruyn 1999
Table A-6 Mechanical parameters of cohesive and non-cohesive backfill used in this numerical
study
Backfill Youngs Modulus (GPa)
Poissonrsquos Ratio UCS
(MPa)
Tensile Strength (MPa)
Cohesion (MPa)
Friction Angle (deg)
Dilation Angle (deg)
1MPa
Cohesive 0565 040 10 01 0117 400 100
05MPashy
cohesive 0565 040 05 005 0061 400 100
Non-
cohesive 0020 015 00 00 0000 420 75
A51 Numerical results and analysis
In order to quantify the influence of backfill on pillar strength in detail 180 models (60 models each for 1MPa 05MPa cohesive and non-cohesive backfill) of square coal pillars were analysed with the following parameters pillar width is 20m mining height is from 5m to 10m equivalent to a wh ratio of 2 to 4 percentage of backfill is from 0 to 90 Table A-7 summarises the results of these pillar strength analyses for all the cohesive and non-cohesive cases
Relationship between pillar strength and percentage of roadway backfill is presented in Figure Ashy25 Figure A-27 and Figure A-29 The raw data from Table A-7 has been calculated in uniform 10
backfill increments and is presented in Figure A-26 Figure A-28 and Figure A-30 As shown in these figures the percentage increase in pillar strength is approximately bilinear with increase in backfill
00
200
400
600
800
1000
1200
1400
1600 P
illar
stre
ngth
incr
ease
()
5m 6m 7m 8m 9m 10m
00 100 200 300 400 500 600 700 800 900 1000
Percentage of bacfill ()
Figure A-25 Pillar strength increase versus percentage of 1MPa cohesive backfill
00
200
400
600
800
1000
1200
1400
1600
Pill
ar s
tren
gth
incr
ease
()
10 backfill
20 backfill
30 backfill
40 backfill
50 backfill
60 backfill
70 backfill
80 backfill
90 backfill
4 5 6 7 8 9 10 11 12 Pillar height (m)
Figure A‐26 Pillar strength increase versus pillar height for 1MPa cohesive backfill
Table A-7 Pillar strength with increasing 1MPa and 05MPa cohesive backfill and non-cohesive backfill
Pillar strength Backfill
Approximate percentage of backfill
() 5 6
Pillar height (m)
7 8 9 10 Pillar
strength Without backfill 0 1007(00) 894(00) 795(00) 714(00) 647(00) 596(00)
(MPa) for different percentshyage of
10 20 30
1049(100) 1104(200) 1140(300)
940(83) 983(167)
1069(333)
833(71) 909(214) 947(286)
785(125) 820(188) 889(313)
720(111) 771(222) 803(278)
650(100) 710(200) 758(300)
backfill 1MPa 40 1205(400) 1130(417) 1046(429) 929(375) 869(389) 824(400)
Cohesive 50 1234(500) 1178(500) 1095(500) 1016(500) 943(500) 894(500) backfill 60 1292(600) 1208(583) 1143(571) 1098(625) 1009(611) 956(600)
70 1342(700) 1271(667) 1270(714) 1158(688) 1120(722) 1035(700) 80 1466(800) 1442(833) 1350(786) 1345(813) 1309(833) 1180(800) 90 1593(900) 1580(917) 1556(929) 1470(875) 1440(889) 1400(900) 10 1026(100) 930(83) 830(71) 773(125) 697(111) 636(100) 20 1081(200) 968(167) 896(214) 803(188) 754(222) 687(200) 30 1132(300) 1053(333) 939(286) 871(313) 786(278) 741(300)
05MPa 40 1184(400) 1098(417) 1018(429) 901(375) 853(389) 799(400) Cohesive 50 1217(500) 1141(500) 1065(500) 1000(500) 936(500) 873(500)
backfill 60 1240(600) 1167(583) 1102(571) 1054(625) 1009(611) 954(600) 70 1269(700) 1189(667) 1237(714) 1093(688) 1044(722) 1014(700) 80 1322(800) 1280(833) 1167(786) 1143(813) 1105(833) 1061(800) 90 1410(900) 1350(917) 1250(929) 1202(875) 1150(889) 1120(900)
Non-cohesive backfill
10 20
1016(100) 1028(200)
902(83) 912(167)
801(71) 819(214)
724(125) 732(188)
657(111) 670(222)
604(100) 615(200)
30 1044(300) 941(333) 832(286) 753(313) 678(278) 629(300)
Pillar strength Backfill
Approximate percentage of backfill
() 5 6
Pillar height (m)
7 8 9 10
40 1063(400) 961(417) 865(429) 767(375) 702(389) 649(400) 50 1086(500) 984(500) 885(500) 800(500) 729(500) 670(500) 60 1113(600) 1006(583) 904(571) 835(625) 760(611) 696(600) 70 1138(700) 1030(667) 943(714) 852(688) 792(722) 725(700) 80 1168(800) 1083(833) 963(786) 889(813) 829(833) 765(800) 90 1206(900) 1130(917) 1029(929) 913(875) 852(889) 804(900)
Figure A-27 Pillar strength increase versus pillar height for 05MPa cohesive backfill
4 5 6 7 8 9 10 11 12 13 Pillar height (m)
Figure A-28 Pillar strength increase versus percentage of 05MPa cohesive backfill
0
10
20
30
40
50
60
70
80
90
100
Pilla
r st
reng
th in
crea
se (
) 10 backfill
20 backfill
30 backfill
40 backfill
50 backfill
60 backfill
70 backfill
80 backfill
90 backfill
00
50
100
150
200
250
300
350
400
Perc
enta
ge o
f pill
ar s
tren
gth
incr
ease
()
5m
6m
7m
8m
9m
10m
00 100 200 300 400 500 600 700 800 900 1000
Percentage of bacfill ()
Figure A-29 Pillar strength increase versus percentage of non-cohesive backfill
00
50
100
150
200
250
300
350
400
Pilla
r st
reng
th in
crea
se (
)
10 backfill
20 backfill
30 backfill
40 backfill
50 backfill
60 backfill
70 backfill
80 backfill
90 backfill
4 5 6 7 8 9 10 11 12 Pillar height (m)
Figure A-30 Pillar strength increase versus pillar height for non-cohesive backfill
The modelling results suggest that the pillar strength will increase with increasing roadway backfill while the percentage increase of pillar strength is greater for the taller pillars than squat pillars it is observed that when the backfill is less than 40-50 the pillar strength increase is less sensitive to pillar height or wh ratio while over 40-50 backfill pillar strength rapidly increase with pillar height
A52 Comparison of three different kinds of backfill
Pillar strength improvement with 05 and 10 MPa cohesive backfill and non-cohesive backfill is presented in Figure A-31 to Figure A-33
0
10
20
30
40
50
60
70
Incr
ease
of p
illar
str
engt
h (
) 5m-00MPa
5m-05MPa
5m-10MPa
0 10 20 30 40 50 60 70 80 90 100
Percentage of backfill ()
Figure A-31 Comparison of 05 and 10 MPa cohesive backfill and non-cohesive backfill at 5m mining height
0
20
40
60
80
100
120
Incr
ease
of p
illar
str
engt
h (
)
7m-00MPa
7m-05MPa
7m-10MPa
0 10 20 30 40 50 60 70 80 90 100
Percentage of backfill ()
Figure A-32 Comparison of 05 and 10 MPa cohesive backfill and non-cohesive backfill at 7m mining height
Incr
ease
of p
illar
str
engt
h (
)
140
120
100
80
60
40
20
0
9m-00MPa
9m-05MPa
9m-10MPa
0 10 20 30 40 50 60 70 80 90 100
Percentage of backfill ()
Figure A-33 Comparison of 05 and 10 MPa cohesive backfill and non-cohesive backfill at 9m mining height
Modelling predicts that 05MPa is as effective as 10MPa at increasing pillar strength below approximately 50-60 roadway fill Modelling suggests that cohesive backfill is more effective at increasing pillar strength than non-cohesive fill
A53 Numerical study of the influence of interface between backfill and pillar
To investigate the influence of an interface between backfill and pillar on the strength response of coal pillar an interface is set between backfill and pillar as shown in Figure A-34 The interface property is list in Table A-8
Figure A-34 Sketch showing the position of interface between backfill and pillar
2
4
6
2
4
6
Table A-8 Mechanical parameters of interface used in numerical model
Interface Cohesion FrictionNormal stiffness (GPa) Shear stiffness (GPa) property (MPa) Angle (deg)
Value 20 20 0 5~40
Pillar strength of a 6m high pillar as interface friction angle is increased from 5 degrees to 40 degrees is displayed in
1212
1010
88
cohesive backfill with interface
cohesive backfill without interface
non-cohesive backfill with interface
non-cohesive backfill without interface
4 cohesive backfill with interface
cohesive backfill without interface
non-cohesive backfill with interface
non-cohesive backfill without interface
stre
ss (M
Pa)
stre
ss (M
Pa)
6
2
00 0000 0005 0010 0015 0020 0025 0030 0035 0040 0045 0000 0005 0010 0015 0020 0025 0030 0035 0040 0045
strain strain
Figure A-35 to Figure A-38
Modelling predicts a non-cohesive interface with friction angle below 20 degrees results in a slight reduction in pillar strength above 20 degrees the interface is predicted to have little influence on pillar strength
cohesive backfill with interface
cohesive backfill without interface
non-cohesive backfill with interface
non-cohesive backfill without interface
1212
1010
88
cohesive backfill with interface
cohesive backfill without interface
non-cohesive backfill with interface
non-cohesive backfill without interface
stre
ss (M
Pa)
stre
ss (M
Pa)
6
4
2
0 0
0000 0005 0010 0015 0020 0025 0030 0035 0040 0045 0000 0005 0010 0015 0020 0025 0030 0035 0040 0045
strain strain
Figure A-35 Post peak pillar for 6m high pillar (wh=33) with friction angle 5deg on left 10deg on right of interface between backfill and pillar
2
4
6
cohesive backfill with interface
cohesive backfill without interface
non-cohesive backfill with interface
non-cohesive backfill without interface
1212
1010
88
cohesive backfill with interface
cohesive backfill without interface
non-cohesive backfill with interface
non-cohesive backfill without interface
stre
ss (M
Pa)
stre
ss (M
Pa)
6 6
44
2 2
0 0 0000 0005 0010 0015 0020 0025 0030 0035 0040 0045 0000 0005 0010 0015 0020 0025 0030 0035 0040 0045
strain strain
Figure A-36 Post peak pillar for 6m high pillar (wh=33) with friction angle 15deg on left 20deg on right of interface between backfill and pillar
12
cohesive backfill with interface
cohesive backfill without interface
non-cohesive backfill with interface non-cohesive backfill without interface
12
10 10
8 8
cohesive backfill with interface
cohesive backfill without interface
non-cohesive backfill with interface
non-cohesive backfill without interface
stre
ss (M
Pa)
stre
ss (M
Pa)
6 6
4 4
2 2
0 0 0000 0005 0010 0015 0020 0025 0030 0035 0040 0045 0000 0005 0010 0015 0020 0025 0030 0035 0040 0045
strain strain
Figure A-37 Post peak pillar for 6m high pillar (wh=33) with friction angle 25deg on left 30deg on right of interface between backfill and pillar
12
cohesive backfill with interface
cohesive backfill without interface
non-cohesive backfill with interface non-cohesive backfill without interface
12
10 10
8 8
cohesive backfill with interface
cohesive backfill without interface
non-cohesive backfill with interface
non-cohesive backfill without interface
stre
ss (M
Pa)
stre
ss (M
Pa)
6
4
2
0 0000 0005 0010 0015 0020 0025 0030 0035 0040 0045
0 0000 0005 0010 0015 0020 0025 0030 0035 0040 0045
strain strain
Figure A-38 Post peak pillar for 6m high pillar (wh=33) with friction angle 35deg on left 40deg on right of interface between backfill and pillar
22
6
8
24
A54 Post peak pillar strength
A full stress strain curve to approximately 35 strain is presented in the following figures for 1MPa cohesive and non-cohesive backfill Results for 05MPa cohesive backfill sit approximately mid-way between these two cases and are included in the summary Table A-9
24 24
0000 0010 0020 0030 0040 0050
Average axial strain of coal pillar
000
2000
3000
4000
5000
6000
7000
8000
9000
22
0000 0010 0020 0030 0040 0050
Average axial strail of coal pillar
000
2000
3000
4000
5000
6000
7000
8000
9000
20 20
18
Ave
rage
str
ess
of c
oal p
illar
(MPa
)
Ave
rage
str
ess
of c
oal p
illar
(MPa
)
18
16 16
1414
12 12
1010
88
66
44
22
00
Figure A-39 Post peak pillar strength with increasing backfill 5m high pillar (wh=40) with 1MPa cohesive backfill on left non-cohesive backfill on right
24
22
0000 0010 0020 0030 0040 0050
Average axial strain of coal pillar
00
250
333
417 500
583
667 833
917
22
0000 0010 0020 0030 0040 0050
Average axial strain of coal pillar
00
250 333
417
500 583
667
833
917
20 20
Ave
rage
str
ess
of c
oal p
illar
(MPa
)
18 18
16 16
14 14
12 12
10 10
8
6
4 4
2 2
0 0
Figure A-40 Post peak pillar strength with increasing backfill 6m high pillar (wh=33) with cohesive backfill on left non-cohesive backfill on right
Aver
age
stre
ss o
f coa
l pill
ar (M
Pa)
4
6
8
10
12
14
16
18
2
4
6
8
0000 0005 0010 0015 0020 0025 0030 0035 0040 0045
Average axial strain of coal pillar
000
2140
2860
4290
5000
5710
7140
7860
9290
2020
0000 0005 0010 0015 0020 0025 0030 0035 0040 0045
Average axial strain of coal pillar
000
2140
2860
4290
5000
5710
7140
7860
9290
18
Ave
rage
str
ess
of c
oal p
illar
(MPa
) A
vera
ge s
tres
s of
coa
l pill
ar (M
Pa)
Aver
age
stre
ss o
f coa
l pill
ar (M
Pa) 16
14
12
10
8
6
4
22
00
Figure A-41 Post peak pillar strength with increasing backfill 7m high pillar (wh=29) with cohesive backfill on left non-cohesive backfill on right
14 14
0
000
2500
3130
3750
5000 6250
6880
8130
8750
0
000
2500
3130
3750
5000
6250
6880
8130
8750
12 12
10
Ave
rage
str
ess
of c
oal p
illar
(MPa
)
10
8
6
4
2
0000 0010 0020 0030 0040 0050 0000 0010 0020 0030 0040 0050
Average axial strain of coal pillar Average axial strain of coal pillar
Figure A-42 Post peak pillar strength with increasing backfill 8m high pillar (wh=25) with cohesive backfill on left non-cohesive backfill on right
2
4
6
8
10
12
14
2
4
6
8
14
12
Ave
rage
str
ess
of c
oal p
illar
(MPa
) A
vera
ge s
tres
s of
coa
l pill
ar (M
Pa)
0
000 2220 2780 3890 5000 6110 7220 8330 8890
0
000 2220 2780 3890 5000 6110 7220 8330 8890
Ave
rage
str
ess
of c
oal p
illar
(MPa
)
10
8
6
4
2
0000 0005 0010 0015 0020 0025 0030 0035 0040 0000 0005 0010 0015 0020 0025 0030 0035 0040
Average axial strain of coal pillar Average axial strain of coal pillar
Figure A-43 Post peak pillar strength with increasing backfill 9m high pillar (wh=22) with cohesive backfill on left non-cohesive backfill on right
12 12
0
000 2500
3000 4000
5000 6000
7000 8000
9000
0
000
2500
3000
4000
5000
6000
7000
8000
9000
10
Ave
rage
str
ess
of c
oal p
illar
(MPa
) 10
8
6
4
2
0000 0005 0010 0015 0020 0025 0030 0035 0000 0005 0010 0015 0020 0025 0030 0035
Average axial strain of coal pillar Average axial strain of coal pillar
Figure A-44 Post peak pillar strength with increasing backfill 10m high pillar (wh=20) with cohesive backfill on left non-cohesive backfill on right
The amount of backfill to achieve the transition between strain softening and hardening is presented in Table A-9 for all mining height The values in this table are estimated from the stress-strain curve analysed to 35 of strain and are depended on the backfill increment which is in turn dependent on the ratio of mining height to the calibrated element size 05m
Table A-9 Percentage of roadway backfill that leads to a transition from strain softening to hardening
Pillar height Non-cohesive 05MPa Cohesive 10MPa Cohesive backfill backfill backfill
5m 300 200 200
6m 500 417 333
7m 571 500 429
8m 625 625 500
9m 722 722 611
10m 800 800 700
The modelling results suggest that the average axial stress of coal pillar increases with compression until peak stress is reached In the post-failure region pillar stress is reduced as strain increases for all models without backfill All the model results predict that there would be a change to strain hardening behaviour as percentage of backfill increases For example this transition point is 333 for 10 MPa cohesive backfill while 50 for non-cohesive backfill with 6m mining height as shown in Table A-9 It can also be seen from Table A-9 that tall pillars need more backfill than squat pillars to achieve the change from strain softening to hardening for either cohesive backfill or non-cohesive backfill
A55 Backfill for diamond shaped pillars
A 7m high diamond shaped pillar with 50 degree skew angle is analysed with increasing level of backfill in surrounding roadways On the skewed angle the backfill is constrained with roller boundary conditions normal to the skewed angle to represent symmetry conditions and a 5m wide roadway
Figure A-45 Numerical model of diamond shaped pillar with backfill on left and boundary conditions on right
The predicted strength of a diamond shaped pillar and equivalent square pillar with increasing roadway backfill of both cohesive and non-cohesive models is presented in Figure A-46 and Figure A-47
6
7
8
9
10
11
12
13
0 10
Pilla
r str
engt
h (M
Pa)
20 30 40 50 60 70 80 90 100
Percentage of backfill ()
Skew pillar
Square pillar
0
10
20
30
40
50
60
70
0 10
Incr
ease
of p
illar
str
engt
h (
)
20 30 40 50 60 70 80 90 100
Percentage of backfill ()
Skew pillar
Square pillar
Figure A-46 Predicted pillar strength of diamond and square shaped pillars with increasing percentage of 1MPa cohesive backfill On left is absolute strength and on right is percentage strength increase
6
7
8
9
10
11
0 10
Pilla
r stre
ngth
(MP
a)
20 30 40 50 60 70 80 90 100
Percentage of backfill ()
Skew pillar
Square pillar
0
5
10
15
20
25
30
35
0 10
Incr
ease
of p
illar
str
engt
h (
)
20 30 40 50 60 70 80 90 100
Percentage of backfill ()
Skew pillar
Square pillar
Figure A-47 Predicted pillar strength of diamond and square shaped pillars with increasing percentage of non-cohesive backfill On left is absolute strength and on right is percentage strength increase
A56 Backfill placed after significant pillar yield
A pillar model with 90 non-cohesive backfill placed after yielding of a 7m high pillar is presented in Figure A-48 The percentage of strength increase is given in Table A-10 It is found that the pillar strength increase is lower if the pillar has undergone significant deformation before the placement of backfill It is predicted that 90 backfill results in a strain-hardening pillar behaviour even if the pillar has previously yielded significantly
Ave
rage
stre
ss o
f coa
l pill
ar (M
Pa)
18 without backfill 025 strain 050 strain
14
16
075 strain 100 strain
12 125 strain 150 strain
10 175 strain 200 strain
8
6
4
2
0 0000 0005 0010 0015 0020 0025 0030 0035 0040 0045 0050
Average strain of coal pillar
Figure A-48 Stress strain curves for backfill placed around the pre-strained pillar displaying state of pillar core upon placement of backfill
Table A-10 Pillar strength increase with 90 non-cohesive backfill placed around a pre-strained 7m high square pillar of 20m width
Percentage backfill ()
Strain at placement of non-cohesive backfill ()
Pillar strength (MPa)
Percentage increase in peak
strength ()
Percentage increase in post-peak
strength at 3 strain ()
0 000 7953 000
90 000 10290 2939
90 025 9156 1513
90 050 8965 1272
90 075 8526 720
90 100 7945 26006
90 125 7951 22608
90 150 7951 18917
90 175 7951 15629
90 200 7951 11134
A6 3D MODEL OF DUNCAN ST FAILURE PANEL
A61 Numerical model
A three dimensional model of 46 pillars in the Duncan St subsidence region has been analysed with over burden geology based on hole CP1 and a constant overburden depth of 124m Figure A-49 Figure A-50 and Figure A-51 Uniform mining heights of 6m and 9m have been analysed
Selection of the pillars to be analysed is based on visual inspection of the panel layout and includes pillars bounded by unmined coal to the west the waterline barrier pillar to the east larger pillars to the south and a panel of slightly larger pillars of different orientation to the north
One row of pillars in the middle of this panel trending from north-west to south-east are of smaller dimension than the average and of diamond shape with acute internal angle of approximately 50degrees Being in the approximate middle of the panel close to full tributary area load will be mobilised on this row of pillars and therefore it is believed pillars in this row initiated the 2008 subsidence event
The Duncan Street numerical model has the following objectives
bull Estimation of pillar stresses and FoS for comparison with empirical formula
bull Comparison of backfill response at panel scale with previous single pillar studies
bull Estimation of surface subsidence at given percentage roadway fill
bull Estimation of extent of abutment stresses due to panel failure
A62 Observations from Duncan Street numerical model
bull At 6m mining height the minimum pillar FoS for these 46 pillars is calculated to be 131 using Pressure Arch theory and UNSW strength formula panel failure is not predicted with this mining height by the model At 9m mining height the minimum FoS is calculated as 099 and panel failure is predicted to occur
bull The probability of pillar failure for associated FoS calculated by the UNSW pillar strength formula Eq(2) is given in Galvin 2006 in Table A-11 The relationship was developed for square pillars using the Australian pillar database and tributary area theory and hence theoretically speaking may not directly apply to this study However it can be taken as a general guide
bull From Table A-11 it is seen that there is a 1 in 20 probability of instability at 6m mining height and a 1 in 2 probability at 9m mining height Numerical modelling is however a deterministic approach and it always predicts failure if the FoS is less than 10 and stability if FoS gt 10 since no variation in geotechnical properties or conditions is used
bull Although our numerical models predict no pillar failure at 6m and panel failure at 9m in reality there remains approximately a 1 in 20 chance of failure at 6m mining height If one pillar was to fail load transferred to adjacent pillars would reduce the FoS of these adjacent pillars and could lead to the pillar failure and subsidence as observed at 2008 event region
Table A-11 Factor of safety failure probabilities for UNSW pillar strength formula
(after Galvin 2006)
Safety Factor Probability of pillar failure
087 8 10
100 5 10
122 1 10
130 5 100
138 2 100
144 1 100
163 1 1000
179 1 10000
195 1 100000
211 1 1000000
bull Based on the numerical results obtained using two mining heights the pillar and overburden failure is consistent with analytical predictions from Pressure Arch theory and UNSW pillar strength calculation
bull Surface subsidence predicted from the numerical model with a mining height of 9m is 196m While this value is in approximate agreement with monitoring data (14mshy15m) the model was not sufficiently calibrated since the real mining height in the region is uncertain to be able to confidently predict final subsidence strains and tilts at the site
bull With 1MPa cohesive backfill at a roadway fill ratio of 83 the predicted strength increase is 70 With non-cohesive backfill at the same fill ratio the strength increase is 20 These values are in agreement with the results for single pillars
bull The numerically predicted surface subsidence with 83 roadway fill is 022m Maximum predicted tilt in east-west direction is 7mmm and in north-south direction is 5mmm Analytical formula [Holla amp Barclay 2000] predict maximum tilt of 53mmm for this amount of subsidence
bull Isolated cohesive backfill surrounding pillars of low wh ratio is predicted to be effective in confining the pillar and increasing peak pillar strength and panel stability Isolated non-cohesive backfill without barriers could not be analysed in this numerical model as backfill lsquoflowsrsquo and numerical stability could not be achieved
bull Stress transfer in the immediate roof sandstone unit (above the coal roof) is predicted to extend approximately 80m beyond the limits of the collapsed panel This is in reasonable agreement with theoretical studies
Figure A-49 Duncan St modelled panel with outline of adjacent modelled panel location of representative open hole CP1 file named ldquoAppendix B2 open hole logsrdquo located in directory ldquoCollingwood Park Subsidence 2B Collingwood Park Mine Subsidence Reports 1988 Eventsrdquo and mine subsidence limit contour
A63 Model properties
Overburden geology is based on borehole CP1 the most complete interpreted available hole drilled in 1988 by Queensland Department of Mines Figure A-50 To include this in the numerical model lithological units had to be coalesced into major units of sandstone (SS) siltstone (SL) mudstone (MS) weathered units and coal Figure A-51
Rock properties for the overburden were determined from a 2D parametric study whereby the UCS of all units was scaled to achieve pillar and overburden failure at 8m mining height Table A-12 and Table A-13
Unit top depth thickness unit thickness
thickness scaled
thickness in model
000 1200 1200 1046 1000 1200 700 SS 700 610 600 1900 600 MS 600 523 500 2500 1100 SS 1300 1133 1100 3600 200 SS 000 3800 100 SL 1000 871 900 3900 100 MS 000 4000 500 000 4500 100 000 4600 100 000 4700 100 000 4800 100 SS 400 349 400 4900 300 SS 000 5200 300 SL 700 610 600 5500 100 MS 000 5600 300 MS 000 5900 400 SS 500 436 400 6300 100 SS 000 6400 400 SL SS 900 784 800 6800 100 SL MS 000 6900 100 SL 000 7000 200 SL MS 000 7200 100 SS SL 000 7300 200 SS 1000 871 900 7500 200 SL 000 7700 200 SS SL 000 7900 200 SS 000 8100 100 SL 000 8200 100 SS 000 8300 200 SL 4350 3790 3800 8500 200 SL 000 8700 100 SS 000 8800 100 COAL 000 8900 200 000 9100 100 000 9200 100 000 9300 100 SL MS 000 9400 300 SL MS SS 000 9700 100 000 9800 100 SL MS 000 9900 400 SL SS 000 10300 200 SS MS 000 10500 100 SL MS 000 10600 200 SL MS SS 000 10800 100 000 10900 400 SL MS 000 11300 400 SL SS 000 11700 100 SS MS 000 11800 300 000 12100 400 SL SS 000
SL MS MS SS
MS
MS
SL
MS SS SL SS SL MS MS
weathering
SL MS SS
12500 150 000 12650 450 850 741 750 13100 400 SS 000 13500 100 MS SL
SS SL 960 837 500
13600 200 13800 100 SS 13900 200 14100 360
SS SL SL MS
14460 470 COAL MINING SEAM 600 14930 FLOOR
Figure A-50 Inferred geology from representative borelog CP1 used in numerical model
weathering SS
Unit Depth floor below surface Num elements Unit Unit name in model surface 0
10 3 16 weather 16 2 15 ss6
MS 21 2 14 ms2 SS 32 4 13 ss5 SL 41 3 12 sl3 SS 45 1 11 ss4 MS 51 2 10 ms1 SS 55 1 9 ss3 SL 63 3 8 sl2 SS 72 3 7 ss2 SL 1055 11 6 sl1 SS 113 4 5 ss1 SEAMR 118 3 4 seamr SEAM 124 3 3 seam FLOOR1 134 3 2 floor2 FLOOR2 250 10 1 floor1
Figure A-51 Coalesced units for numerical model based on hole CP1
Insitu stress is unknown at the site so a horizontal to vertical stress gradient of 15 has been assumed Given that the extensive workings were undertaken 20 to 30 years before the 2008 event horizontal stresses in the mining seam would be considerably disturbed from the pre-mining conditions
Table A-12 Rock properties for softening mohr coloumb material Softening rates of coal friction angle is 6 degrees over 2 plastic strain and total loss of cohesion over 24 plastic strain in coal and over 1 in other rocks Determined from pillar studies
E
nu Bulk Shear UCS UCS Phi Dilation Coh Tensile Strength (GPa) (GPa) (GPa) (MPa) scaled angle (MPa) (MPa)
SS 75 02 4167 3125 50 125 40 2 291 125
SL 4 025 2667 1600 30 75 35 2 195 075
MS 3 025 2000 1200 15 375 32 2 104 0375
Weathering 1 025 0667 0400 8 2 32 2 055 02
COAL 11 03 0917 0423 12 3 36 6 076 003
FLOOR1 4 025 2667 1600 30 75 38 2 183 075
FLOOR2 4 025 2667 1600 30 75 38 2 183 075
Table A-13 Ubiquitous joint properties Softening rate of ubiquitous joints total loss of cohesion over 1 plastic strain Determined from 2D overburden studies
Cohesion Ubiq joint cohesion Tensile Strength Ubiq joint tensile strength Ubiq joint (MPa) (MPa) (MPa) (MPa) friction
SS 291 00029144 125 0000125 15 SL 195 00019521 075 0000075 15 MS 104 00010393 0375 00000375 15 Weathering 055 00005543 02 000002 15 COAL 076 003 FLOOR1 183 - 075 - -FLOOR2 183 075 -
A64 Results from 3D Duncan St model
Factor of Safety estimated at 6m and 9m mining heights
Figure A-52 Pillar FoS calculated for 6m mining height by analytical method with strength by eq(3) and pillar stress by pressure arch theory Minimum value is 131 suggesting a 5 in 100 probability of failure however not sufficient to fail in the numerical model (that requires FoS lt 10)
Figure A-53 Pillar FoS calculated analytically for 9m mining height (eq(3) and PA theory) Minimum value is 099 suggesting a probability of failure of 5 in 10 although in the numerical model failure should occur
Yield on plane for 6m and 9m mining heights
Figure A-54 Location of section plane used for section view in following figures
Figure A-55 Yield on section plane for 6m mining height No significant damage or displacement observed
Figure A-56 Yield on section plane for 9m mining height no backfill
Figure A-57 Displacement on section plane for 9m mining height no backfill Maximum displacement is approximately 15m at surface
Results on horizontal plane at mid-pillar height
Figure A-58 Yield at mid-pillar height 9m mining height Blue elements evident in some pillars indicating pillar core remains intact
Figure A-59 Predicted vertical stress at mid pillar height 9m mining height Insitu stress is 30MPa Unyielded pillars and pillars hardening after yield are transferring vertical load while yielded pillars carry little load Extent of abutment stress increase is approximately 80m
Figure A-60 Roof vertical stress predicted by numerical model with 9m mining height Contour increments are 01MPa Base vertical stress is approximately 27MPa Abutment stress influence distance is approximately 80m
Results on surface after panel failure at 9m mining height
Figure A-61 Surface subsidence as predicted with numerical model with 9m mining height and total subsidence along Duncan St to McLaughlin St as monitored to October 09 Maximum surface subsidence predicted as 196m Outline of numerical modelling pillars and dotted contour of observed subsidence limit
A65 Duncan St model ndash backfill effectiveness
The Duncan St 3D model has been analysed with full and targeted 1MPa cohesive and non-cohesive backfill placed in roadways Roadway fill of 66 is analysed for the 1MPa cohesive mixture and 83 roadway fill for the non-cohesive mix
Results are presented in the following figures and figure captions
Factor of Safety increase from cohesive backfill
Analysis of the Duncan St model with 9m mining height is undertaken to estimate the FoS increase from backfill By increasing gravity in increments the backfill strength improvement is quantified With 83 roadway fill of 1MPa cohesive backfill the overburden and pillar tops (ie region of pillar above height of backfill) fails with gravity of 17ms2 suggesting the pillars with FoS of approximately 10 has increased FoS to 17 by backfilling adjacent roadways
Figure A-62 Gravity of 16g with 83 1MPa cohesive backfill showing no significant yield
Figure A-63 Gravity of 17g with 83 1MPa cohesive backfill predicting failure of pillar tops and overburden and collapse of roadway void space
FoS increase with non-cohesive backfill
With non-cohesive backfill pillars yielded due to lack of confinement upon initial placement of backfill in roadways but overburden remain stable and void space above backfill remained open Overburden remained stable at gravity increase to 11ms2 Figure A-64 but collapsed at gravity increase of 12ms2 Figure A-65
Figure A-64 Gravity of 11g with 83 non-cohesive backfill predicting pillar yield but overburden stability
Figure A-65 Gravity of 12g with 83 non-cohesive backfill predicting failure of pillars and overburden and collapse of roadway void space Maximum surface subsidence is 055m which includes the compressive effect of the 12g gravity increase
Placement of targeted backfill
A model is analysed with cohesive backfill totally surrounding two pillars with low predicted FoS The two pillars are predicted to have a FoS of 099 and 100 left to right viewed from above at a 9m mining height Backfill extends to an extent of 5m to 10m from the pillar and is 6m high in the roadways Gravity increase to 12g required to fail panel suggesting panel strength increase is approximately 20 from targeted backfill Predicted surface subsidence 125m (excessive mesh deformation stops analysis equilibrated stage may have higher surface subsidence)
Figure A-66 Duncan St model with 66 roadway fill of 1MPa cohesive backfill surrounding two pillars with low FoS at 9m mining height
Figure A-67 Predicted yield at mid pillar height of 9m pillars with 66 roadway fill of 1MPa cohesive backfill Note intact core (blue) for targeted pillars
Figure A-68 Pillar strength at 9m mining height Strength WITHOUT BACKFILL of northern focus pillar selected for targeted backfill is 527MPa and southern focus pillar is 526MPa
Figure A-69 Vertical stress in pillars targeted for partial backfill placement Stress calculated at equilibrium of elasto-plastic analysis WITHOUT BACKFILL Stress in northern focus pillar is 54MPa and in southern focus pillar is 513 FoS of NFP=52754 = 0975 FoS of SFP=526513 = 1025
Non-cohesive backfill in targeted placement study
A model with targeted placement of non-cohesive backfill was attempted but could not be satisfactorily converged since backfill lsquoflowsrsquo and inter-penetrates elements resulting in numerical instabilities
Forcing pillars to fail to examine resultant subsidence
To examine the extent of surface subsidence if backfilled pillars fail the numerical model with 9m mining height and 83 roadway fill of 1MPa cohesive backfill is analysed with a 90 reduction in coal pillar strength properties
With 9m mining height and 83 roadway fill of cohesive backfill void space remaining is 15m and the numerical model predicts failure of pillars and overburden results in approximately 02m surface subsidence
Figure A-70 Surface subsidence predicted by numerical model when pillars forced to fail with 83 roadway fill Contour interval is 01m with maximum subsidence predicted as 022m
Figure A-71 Surface strain in east-west direction when pillars forced to fail resulting 022m surface subsidence Maximum strain is 5mmm and contour interval is 1mmm
Figure A-72 Surface strain in north-south direction when pillars forced to fail resulting 022m surface subsidence Maximum strain is 3mmm and contour interval is 1mmm
Figure A-73 Tilt in east-west direction Units are mmm and intervals are 1mmm maximum tilt is 7mmm
Figure A-74 Tilt in north-south direction Units are mmm and intervals are 1mmm maximum tilt is 5mmm
To highlight the need for adequate fill the model with 66 roadway fill is analysed with the pillars forced to fail with a 50 reduction in pillar strength Void space over the backfill in the roadways is 30m Modelling predicts maximum surface subsidence of 068m
Figure A-75 Surface subsidence when pillars forced to fail with 66 roadway fill Roadway void space is 30m with the model predicting 068m surface subsidence Contour interval is 01m
A66 Numerical model of adjacent high risk area
Numerical model and panel stability
A numerical model of the region adjacent to Duncan St incorporating 76 pillars is analysed at 9m mining height Overburden strata strengths and depth-of-cover is consistent with Duncan St model
The main objective of this model is to estimate the strength difference between the two mining panels west and east of the Waterline fault Given uniform mining height and depth-of-cover the strength difference will be due to the pillar configuration and boundary conditions
At 9m mining height the model is predicted to be essentially stable although 9 pillars are predicted to be fully yielded at mid-pillar height
With gravity increase of 10 the model remains stable At 20 increase in gravity the model is predicted to fail with significant overburden yield
It is concluded therefore that the panel to the east of Waterline fault is 20 stronger than the panel to the west
Figure A-76 Location of numerical model 2 together with surface subsidence contours from 1988 and 2008 events and seam level eastern boundary of failure predicted from 3D seismic
Figure A-77 Yield on section at mid-height for 9m mining height
Figure A-78 Rockmass yield on vertical section trending east-west at mid-point of model Note overburden is largly intact with no extensive collapse
Figure A-79 Pillars predicted to have failed from Numerical model 2 with surface subsidence contours and inferred eastern limit of failed zone at seam level
By a 20 increase in gravity the model is forced to fail resulting in predicted 13m surface subsidence that includes increased overburden compression from increased gravitational component Excessive deformation and numerical instability stopped the model true surface deformation may be higher
Figure A-80 Adjacent model with 9m mining height Predicted surface subsidence after 20 increase in gravity Model predicts 13m surface subsidence
Figure A-81 Adjacent model with 9m mining height and 20 gravity increase Predicted failure at mid-pillar height Note intact core in southern pillars which appear stronger from unmined adjacent coal and larger general pillar size
A7 CONCLUSIONS
A71 Current knowledge on coal pillars behaviour
bull The strength based factor-of-safety approach is well established in coal pillar design Factors of safety for coal pillars required to provide medium to long term stability should be greater than 16 [Galvin 2006 Hill 2005]
bull Coal pillar strength has been the subject of rigorous research since at least the 1960rsquos and the Salamon amp Munro formula has been applied in the design of over a million coal pillars in South Africa alone [Mark 1999 Salamon 1998] Strength formula derivations from the UNSW are established in Australia
bull Coal pillar load calculation traditionally relies on tributary area theory which is a conservative approach suitable for pillar design
bull Tributary area conditions are NOT satisfied at Collingwood Park pillars are irregular in size and shape there is large areas of unmined coal and the seam has significant dip
bull This last point is important as analytical methods hold the only hope of evaluating every pillar at Westfalen No 3 Colliery The numerical model of Duncan St analyses 46 pillars and requires significant computational resources the entire Colliery has in excess of 700 pillars and cannot be analysed by the same methods in its entirety by current computer codes in a reasonable time frame
bull Likewise it is not satisfactory to draw conclusions on panel stability from limited analysis of representative groupings of pillars because of the variability in size shape mining height and cover depth over the mining area
bull To overcome the limitations of tributary area theory for the back-analysis of an irregular pillar layout a novel approach for calculating loads based on pressure arch theory has been developed subjected to international peer review and published in the International Journal of Rock Mechanics and Mining Sciences In summary each pillar is individually examined and the pillar area circumference and centroid are calculated At the pillar centroid the cover depth and mining height are determined An influence zone based on a circular area with radius defined by the depth-dependent load transfer distance Within this area the local extraction ratio is calculated This approach has found to satisfactorily account for pillars of arbitrary shape in irregular layout with variable cover depth
bull This allows a FoS to be determined for the over 700 pillars of Westfalen No 3 with reasonable computer resources
A72 Typical pillar strength effects
Width to height ratio
bull Pillars at Westfalen No 3 have typical effective width from 20m to 50m While mining height is uncertain it is believed to range from 6m to 10m With these dimensions pillar wh ratio ranges from 20 to 83
bull At the lower limit of wh=20 geological influences will start to determine pillar strength [Galvin 2006] From wh in the range gt 20 to 40 the formula of Salamon and Munro or UNSW extensions could be expected to estimate pillar strength with the squat pillar version of these formula applicable for whgt40 [Galvin 2006 Salamon 1998 Galvin 1999]
bull The squat pillar extensions were developed since the standard formulas were found to underestimate pillar strength at whgt4 At Westfalen No 3 colliery although there are a number of pillars of whgt4 many of these are irregular in shape often long and relatively narrow (30m ndash 40m) Given this and the need to automate the assessment of every pillar the squat pillar strength formula is not utilised This approach is conservative
Pillar shape effects
bull Many pillars at Westfalen No 3 are skewed of diamond shape with acute internal angle from 50 to 90 degrees Hydraulic radius simile accounts for pillar shape by an effective width defined by 4AC while the UNSW has a parrellopid formula that for pillars of equal side length results in an effective width equivalent to this
bull In a study of pillar shapes common to Westfalen No 3 colliery the hydraulic radius analogy for estimation of effective width is found adequate with errors less than 6 for considered sizes and shapes
Post peak strength
bull Numerical studies and the work of Das in Indian coal fields highlights the changing post peak behaviour with increasing width to height ratiorsquos It has been determined that when wh exceeds approximately 5 pillars start to harden post peak When whlt3 pillars display limited if any post peak strength
bull The significance of this effect will be in the manner that pillars shed load to adjacent pillars In an array of pillars of similar dimensions pillars with a low wh ratio could be expected to shed load in a sudden more catastrophic manner than those that harden post peak Such sudden pillar failure is referred in the literature as catastrophic cascading or rolling pillar failure and has been responsible for damaging wind blasts and significant loss of life over the years
bull In an irregular pillar layout such as Westfalen No 3 with variable wh ratio significant barrier pillars and regions of unmined coal sudden multiple panel collapse would be expected to be less likely
bull The analytical approach developed for assessing pillar load accounts for load shed from a failed pillars to pillars within the zone of influence of that pillar
Specific details of this approach are discussed in the hazard map and risk assessment chapter of this report
Backfill effect
bull Numerical studies on a cohesive and non-cohesive backfill suggest that pillar strength is increased with increasing height of fill Studies suggest a 1MPa cohesive backfill may increase pillar strength by approximately 10 at 40 roadway fill for wh=33 and 18 at 40 roadway fill at wh=22 At 80 roadway fill pillar strength increases are predicted to exceed 50 Percentage strength increases are predicted to be greater with lower wh ratiorsquos
bull Studies of a non-cohesive backfill suggest at 80 roadway fill pillar strength increases are approximately 25
bull With both backfill types pillar strength is predicted to increases dramatically above 80 roadway fill and pillars are predicted to exhibit post-peak hardening behaviour
For example in the Duncan St area a pillar of effective width 20m will have a FoS of approximately 118 at mining height of 10m without backfill A 50 strength increase from 1MPa cohesive backfill at 80 roadway fill will raise the FoS to approximately 177 and reduce the probability of instability from approximately 1 in 10 to less than 1 in 1000
With 80 roadway fill of a non-cohesive backfill the same Duncan St pillar FoS will increase to approximately 147 and the probability of instability reduce to less than 1 in 100
bull Backfill is likely to reduce the rate of time dependent pillar strength degradation by reducing pillar spalling due to the erosive effects over time of high stress and exposure of the pillar surface to the atmosphere
bull In addition backfill is likely to benefit pillar stability by limiting the void available to the roof to fall into Roof falls particularly at roadway intersections may be present By reducing the roadway volume backfill will eventually support the roof when the bulking effect of roof falls fills the remaining roadway voids space Beyond this summary time dependent issues of backfill have not been considered
roadway
fill
Non-cohesive backfill
(7m mining height width 20m) strength increase
05 MPa cohesive backfill
(7m mining height width 20m)
strength increase
10 MPa cohesive backfill
(7m mining height width 20m)
strength increase
60 135 388 437
70 183 432 597
80
90
208
291
474
572
698
957
A73 Duncan St numerical model
bull In the Duncan St subsidence region approximately 46 pillars are surrounded by unmined coal to the west a large pillar containing the Waterline fault to the east and larger pillars to the south and north
bull At 6m mining height pillar minimum FoS for these 46 pillars is calculated at 131 with Pressure Arch theory and UNSW strength formula At 9m mining height minimum FoS is calculated as 099
bull Pillar probability of failure for FoS calculated by the UNSW eq(2) is given in [Galvin 2006] as
Table A-14 Factor of safety failure probabilities for UNSW pillar strength formula (after Galvin 2006)
Safety Factor Probability of pillar failure
087 8 10
100 5 10
122 1 10
13 5 100
138 2 100
144 1 100
163 1 1000
179 1 10000
195 1 100000
211 1 1000000
bull From Table A-14 at 6m mining height there is a 1 in 20 probability of instability and at 9m a 1 in 2 probability The variability in the database of failed and unfailed pillars from which eq (1) to eq (3) are derived is responsible for these probabilities Our numerical model should always predict failure if the FoS is less than 10 and always predict stability with FoS gt 10 since no such variability in geotechnical properties or conditions is used
bull While our numerical model predicts no pillar failure at 6m and pillar failure at 9m in reality there remains approximately a 1 in 20 chance of failure at 6m mining height If one pillar was to fail load transferred to adjacent pillars would reduce these adjacent pillars FoS and may well lead to the pillar failure and resultant subsidence observed at Duncan St
bull Based on the numerical results obtained using two mining heights the pillar and overburden failure is in line with analytical predictions from Pressure Arch theory and UNSW pillar strength calculation
bull Surface subsidence predicted from the 9m mining height numerical model is 196m While this value is in general agreement with monitoring data the model is not sufficiently calibrated since the real mining height in the region is unknown to be able to confidently predict final subsidence strains and tilts
bull With 1MPa cohesive backfill at a fill ratio of 83 the predicted strength increase is 70 With non-cohesive backfill at the same fill ratio the strength increase is 20 these values are in agreement with single pillar studies
bull Abutment stresses in the immediate roof sandstone unit (above the coal roof) are predicted to extend approximately 80m beyond the limits of the model This is in reasonable agreement with twice the load transfer distance of 64m (at 124m depth-of-cover) used to define a pillars zone of influence (the ZI also includes half pillar width ie 74m for 20m pillar)
A74 Numerical model of adjacent region
bull A numerical model of the region immediately to the east of the Duncan St failure region is constructed with 76 pillars
bull At 9m mining height the model predicts failure of 9 pillars but no significant overburden failure The model remains stable in general
bull With a 20 increase in gravity the model is predicted to fail
bull Numerical modelling results suggest the region to the east of the Waterline barrier pillar is stronger by approximately 20 than the subsided region to the west of the barrier pillar
bull Predicted surface subsidence (including compressive effects from gravity increase) is 13m all though numerical instabilities halt the model and true surface subsidence is likely to be higher
bull Inspection of yield at mid-pillar height suggests the southern pillars in the model have intact core when pillars in the middle of the region are failed in their entire volume In reality the southern region of this panel have greater depth-of-cover therefore higher pillar stresses and thus lower FoS in these southern pillars

3
35
4
45
5
55
6
65
7
75
8
0 10 20 30 40 50 Pillar
Pilla
r stre
ss (M
Pa)
Num Mod elas szz PA theory TA stress
Figure A-5 Predicted pillar stress from numerical model of Duncan St region Pressure Arch (PA) theory and Tributary Area (TA) theory TA theory with constant bord width of 66m (mine plan shows 66m+ bord) Average absolute stress difference is 03MPa for PA theory and 14MPa for TA theory
A3 BENCHMARKING OF NUMERICAL MODEL
The pillar strength equation derived from the combined databases of Australia and South Africa is used to benchmark the numerical model This equation which is the same as equation (3) above rewritten for convenience
Pillar strength = 688 w050 h070 (3)
A typical pillar from the Duncan St region of Collingwood Park has a side length of 20m internal acute angle in the range of 50-54 degrees The excavation or pillar height is 6m+ and depth of cover is 124m as shown in the mine pillar plan of Figure A-6
Figure A-6 Typical pillar with dimensions in the Duncan Street subsidence region Highlighted outline is the location of the 3D model Depth of cover is approximately 124m and pillar height is 6m+
The code FLAC3D (F3D) by Itasca Consulting Group [Itasca 2006] has been used for all numerical models F3D is a continuum code with yield criteria suitably flexible for modelling the full stressstrain response of coal type materials Only a quarter section of the bord and pillar array needs to be modelled once symmetry conditions are enforced in both x and y directions as shown in Figure A-7 Notice that only partial parts of the roof and floor have been considered
Figure A-7 A sketch of F3D mesh showing a quarter of a pillar as well as roof and floor and boundary conditions
A strain softening yield criterion has been used for coal and rock materials modelling In other words Mohr-Coulomb material model with non-associated shear and associated tension flow rules [Fama 1995 Itasca Consulting Group Inc 2006 Pietruszczak 1980 Hoke 1990] has been used In this model the parameters representing material cohesion friction dilation and tensile strength may reduce or soften after the onset of plastic yield by a user defined piecewise linear function [Jiang 2009 Zhou 2009] as displayed in Figure A-8 It is assumed that the roof and floor rock masses are elastic and only coal pillar is allowed to behave both elastically and plastically All model material parameters are listed in Table A-1 To achieve a reasonable match with the strength formula of Equation (3) for a width to height ratio greater than 4 it was found that it is necessary to have an explicit yielding interface or joint at the pillar boundaries on both the roof and the floor contact areas The interface properties are listed in Table A-2
Coal properties for the numerical model are estimated from the reported literature values and from calibration analyses by matching Equation (3) for the range of width-to-height ratios from 2 to 4 These numerical results are compared with Equation (3) in Figure A-9
00
02
04
06
08
10
12
Coh
esio
n (M
Pa)
29
30
31
32
33
34
35
36
37
Fric
tion
Ang
le (deg
)
Cohesion (MPa) Friction Angle (deg)
0 1 2 3 4 5 6 7 8 9 10 Plastic strain ()
Figure A-8 Variation of cohesion and friction angle with plastic strain
Table A-1 Mechanical parameters used in numerical models
Property
Youngs Modulus
(GPa) Poissonrsquo s ratio
UCS (MPa)
Tensile Strength (MPa)
Original value (MPa)
Cohesion
Softening rate ()
Residu al value (MPa)
Original value (deg)
Friction Angle
Softening rate ()
Residual value (deg)
Dilation Angle
(deg)
Coal 110 030 40 004 102 5 0102 360 05 300 60
Roof 570 019
Floor 797 024
from CSIRO report 42 Roof and floor materials are assumed elastic
Table A-2 Mechanical parameters of interface used in numerical model
Interface property Normal stiffness (GPa) Shear stiffness (GPa) Cohesion (MPa) Friction Angle (deg)
Value 20 20 05 200
Pilla
r stre
ngth
(MP
a)
11
10
9
8
7
6
5
S amp M combined
Numerical results
15 20 25 30 35 40 45 wh ratio
Figure A-9 FLAC3D parametric study to match pillar strength with the analytical formula of Salamon amp Munro (combined Australian and South African version)
A4 PILLAR STRENGTH INCLUDING FULL STRESS STRAIN CURVE AND PILLAR SHAPE EFFECTS
A41 Post peak strength
Das [Das 1986] has presented work on the post peak strength for Indian coals at various width-to height ratios His results show some variability but have a general correlation between post peak strength and increasing wh ratio Beyond a certain wh ratio of approximately 5 to 8 Dasrsquos results predict that samples start to harden with increasing strain
Figure A-10 Post peak strength of Indian coal at various width-to-height ratio after Das 1986
The numerical model of a square pillar of side length 20m and variable height was compressed to approximately 10 strain to investigate post peak behaviour with increasing wh ratio for comparison with results of Das in Figure A-10 The numerical results are plotted in Figure A-11 for various width to height ratios in the range of 10 strain The post peak pattern is similar to those of Das in Figure A-10 although the numerical hardening starts at lower strains
variable height (h)
000
500
1000
1500
2000
2500
3000
000 002 004 006 008 010
Strain
Ave
rage
pill
ar s
tres
s (M
Pa)
WH=20
WH=25 WH=29 WH=33
WH=40 WH=50
WH=67 WH=100
Figure A-11 Post peak failure behaviour of numerical pillars of constant width w = 20m but
Results from the modelling of the full stress strain curve of a 20m square pillar is used to estimate the stress redistributed to neighbouring pillars in the empirical estimation of pillar FoS for the CSIRO Hazard Maps At 4 strain the percentage of peak strength carried by the coal pillar is approximated from Figure A-11 in Figure A-12 where conservatively it is assumed pillars cannot harden but only soften or retain strength
00
200
400
600
800
1000
1200
20 40 60 80 100
Width to height ratio
R e s
idua
l s tr
e ngt
h (
)
residual strength
Figure A-12 Estimation of pillar residual strength at 4 strain
A42 Pillar shape influence on strength
Collingwood Park has many pillars of regular and irregular shapes including square rectangle diamond triangular and other polygon shapes A study of some of these shapes at fixed 6m mining height was conducted
As discussed in [Galvin 1981] with reference to physical models there is a subtle difference in model response at specific width to height ratios depending on whether the width or height of the model is fixed This variation is attributed by Galvin to volume stiffness and pillar end effect variation between width and height changes In the Collingwood Park single pillar studies generally the width is fixed at 20m and width-to-height changes are achieved with height variations and material properties are calibrated to this In studies of diamond and other shaped pillars where the width or effective width varies a unique set of material properties calibrated over width-to-height 2 to 4 at fixed height is developed Table A-3
Attempt is made to keep the constant 05m cube element size although for some of the shapes studied this is not possible and where meshing options exist priority is given to minimizing the variability from the standard element size Ideally the soften rate of the yield criteria would be adjusted based on an element characteristic length Implementation of this reduced mesh dependent errors but it was not felt sufficiently rigorous for inclusion in this report
Table A-3 Cohesion and friction for calibrated model at wh 2 to 4 with fixed 6m pillar height
Property Original value (MPa)
Cohesion
Softening rate ()
Residual value (MPa)
Original value (deg)
Friction Angle
Softening rate ()
Residual value (deg)
Dilation Angle (deg)
Coal 123 35 023 360 05 300 60
Diamond shaped pillars
Diamond pillar shapes located at Duncan St and adjacent areas have typical dimensions of side length 20-30m and minimum acute internal angles of 50 degrees
The area perimeter or circumference (C) of a diamond shape is given by
Circumference = C = 4 w
where w is the side length If the acute internal angle is θ the area can be calculated as follows
Area = A = w2 sin θ
The minimum width or thickness of the cross section is
Minimum width = w sin θ
Hence the effective width weff from the analogy of ldquohydraulic radius = 4ACrdquo defined earlier is given by
weff = 4AC = w sin θ = minimum width
Figure A-13 Predicted pillar strength for diamond shaped pillars at 6m mining height Error at 50 deg internal angle is approximately 6
Polygon with one acute corner
Figure A-14 (a) and (b) show a comparison between theory and numerical model for a polygon with one acute angle
(a) (b)
Figure A-14 (a) Polygon with one acute side (60deg acute angle in figure) Base side length = 40m short side 20m mining height = 6m and (wh 44-38)
Rectangular pillar being split at mid-length in 1m increments
A rectangular pillar of 30m by 10m is modelled as it is split by a 5m roadway
(a) (b)
Figure A-15 (a) Rectangle 30m by 10m being split in 1m increments Note symmetry plane on left hand boundary Mining height 6m (b) Results from numerical model and Strength formula with w=4AC
Triangular shape pillars with two equal sides of 20m
In this example a triangular pillar with two sides of equal length of 20m is analysed
(a) (b)
Figure A-16 (a) Triangular pillar of two equal sides of 20m each Mining height 6m (b) Results from numerical model and strength formula with w=4AC Maximum error is approximately 5
Observations from study of pillar shapes
The general conclusion from the study of pillar shapes at fixed 6m mining heights is that the hydraulic radius analogy of Wagner Equation (4) where the effective width is estimated by area and circumference is applicable to pillars of Westfalen No 3 colliery Errors with this approach at calculating pillar width for width-to-height ratios from approximately 2 to approximately 4 for the shapes studied are under 6
A43 Realistic roof geology
It is recognised that the idealised roof and floor of the pillar model Figure A-7 may have an influence on the predicted strength estimation To quantify this effect a model of a 20m square pillar at width-to-height ratiorsquos of 22 to 4 is analysed with a realistic roof geology
Based on the sonic logging data in borehole CP-C02 located in the failure region of Duncan Street Figure A-17 pillar strength is estimated from a numerical model with the model input parameters selected from the scanned roof geological and geotechnical data The input data are listed in Error Reference source not found and Table A-4 The F3D mesh for a pillar analysis is shown in Figure A-18 and the numerical results for two set of parameters for roof geology are shown in Figure A-19
Table A-4 Mechanical properties of roof and overburden rocks
Youngs Poissonrsquos UCS Tensile Strength CohesionBackfill Modulus Friction Angle (deg)Ratio (MPa) (MPa) (MPa)(GPa)
Sandstone 135 012 25 25 6648 40
Siltstone 195 020 15 15 4728 38
Interbedded 166 017 20 20 2808 38
Mudstone 875 026 10 10 1943 30
UCS Depth (m) (MPa) Geology Scaled UCS (MPa) 1005 7500 sandstone1 2500 1010 1015
6000 6750
interbedded1 2000 2250
1020 1025
7500 9000
sandstone2 2500 3000
1030 6750 interbedded2 2250 1035 4500 siltstone1 1500 1040 5250 interbedded3 1750 1045 4500 siltstone2 1500 1050 1055
225 2250
coal1 750 750
1060 1065
8250 9000
sandstone3 2750 3000
1070 3750 siltstone3 1250 1075 5250 1750 1080 6000 interbedded4 2000 1085 6000 2000 1090 3750 siltstone4 1250 1095 3000 1000 1100 3000 mudstone1 1000 1105 3000 1000 1110 3750 1250 1115 4500 siltstone5 1500 1120 3750 1250 1125 2000 coal2 667 1130 5250 interbedded5 1750 1135 7500 sandstone4 2500 1140 1145
6000 5250
interbedded6 2000 1750
1150 8250 2750 1155 9000 3000 1160 10500 3500 1165 13500 4500 1170 10500 sandstone5 3500 1175 10125 3375 1180 10500 3500 1185 9750 3250 1190 7500 2500 1195 3750 siltstone6 1250 1200 1500 coal3 500 1205 1210
7875 8625
sandstone6 2625 2875
1215 5250 interbedded7 1750 1220 1225
9000 10500
sandstone7 3000 3500
1230 6000 interbedded8 2000 1235 3000 mudstone2 1000 1240 3750 siltstone7 1250
Figure A-17 Sonic log of borehole CP-C02 and roof geological interpretation
Figure A-18 Numerical model of a coal pillar with representative floor and roof rock geology
4 5 6 7 8 9 10 Pillar height (m)
Figure A-19 Comparisons of pillar strength versus pillar height for realistic and simplified roof geology Maximum error is 45
Modelling predicted that the maximum difference in pillar strength for two different roof geology conditions is approximately 45 at the lower height of 6m reducing to less than 1 for pillars of 9m mining height
It is concluded from this study that the simplified roof and floor model satisfactorily estimates pillar strength allowing in excess of 180 numerical models to be analysed in a timely manner
60
65
70
75
80
85
90
95
100
105
Pilla
r str
engt
h (M
Pa)
Assumed geology
Real geology
A44 Pillars surrounded by roadways of variable height
It was observed in the 1983 pillar site investigation [Hollingworth Dames amp Moore 1990] that mining heights at Westfalen No 3 are extremely variable with roadways surrounding individual pillars varying by up to 2m
To investigate the strength of pillars of variable height a 20m wide square model pillar of 8m mining height on one side and 6m height on the directly opposite side of the pillar as shown in Figure Ashy20 has been analysed
Figure A-20 Different views of the numerical modelling mesh of a trapezoidal-square pillar - Model is 8m high on one side and 6m on the other opposite side
Predicted strength of the variable height pillar together with stress-strain curves for pillars of 6m 7m and 8m mining heights presented in Figure A-21 As shown in the figure the predicted strength of a non-uniform-height pillar of trapezoidal shape having 6m and 8m side heights approximates a uniform-height pillar with a constant height of 7m
0
1
2
3
4
5
6
7
8
9
10
Axia
l stre
ss (M
Pa)
Trapezoid pillar
6m pillar 7m pillar
8m pillar
0000 0010 0020 0030 0040 0050
Axial strain
Figure A-21 Stress vs strain curves for rectangular uniform height and trapezoidal non-uniform height pillars Strength of uniform pillars having heights of 6m 7m and 8m are compared with a trapezoidal non-uniform height pillar of having 6m height on one side and 8m on the other opposite side ie a variable height roadway of average 7m height
A45 Pillars created by multiple passes to variable depth
Roadways at Westfalen No 3 colliery were cut in multiple passes at a constant height of 24 m The cut widths were variable ranging from 52 m at the bottom to 76 m at the top as shown schematically in Figure A-22 by the mine managerrsquos hand drawings of the roadway mining method
To asses the strength of such pillars a 9 m high pillar with irregular side surface boundary is modelled Figure A-23 The model pillar has a square base of 23m and side length with three lsquocutsrsquo in its height as shown in Figure A-23
Predicted strength is approximately equal to a similar pillar with effective width equal to minimum width ie 20m in this case Figure A-24
Figure A-22 Sketch of roadways at Collingwood Park showing multiple passes or layers of cutting of the coal seam(from previous mine managersrsquo notes and records)
Figure A-23 Numerical modelling of a multi-pass cut pillar of 9 m height with minimum and maximum side widths of 20m and 23m respectively
0
1
2
3
4
5
6
7
8
Axi
al s
tres
s (M
Pa)
irregular pillar-min w idth 20m high and 9m w ide
square pillar-20m w ide and 9m high
0000 0005 0010 0015 0020 0025 0030 0035 0040
Axial strain
Figure A-24 Stress vs strain curves for pillars of 9m height with regular and irregular square cross-section (Figure A-23) Difference in peak strength predicted to be approximately 35
A5 ROADWAY BACKFILL AND PILLAR STRENGTH IMPROVEMENT
A literature review of backfill applications mechanical properties and behaviours in coal mining identified several examples from China [Guo 2007 Wang 2009] where backfill has been used to reduce surface subsidence from America [Tesarik 2002 2009] where backfill has been used primarily for disposal of fly-ash and reduce acid mine drainage and from Australia [Origin Alliance 2008] - See Table A-5 and the reference list
In the early stages of this modelling specific data and backfill effects and properties required in this numerical study were unavailable and therefore two cases were considered a cohesive backfill having a UCS of 1 MPa and a non-cohesive backfill with no cohesion but a friction angle of 42 degrees Subsequent to these two cases a case of 05MPa cohesive backfill mix was also considered
Backfill properties using in this study are list in
Table A-6
Table A-5 Backfill properties data from various sources
Composition UCS (MPa) E (GPa) Reference
Solid waste including fly-ash 05 initially
to 14-17
0565 Guo et al 2007
Fly-ash amp cement 339 ndash 824 Guo et al 2007
1 4 15 (cement) (fly-ash) (coal
gangue)
07 ndash 17 Wang et al 2009
Fly ash (dry) Scheetz 2009
22 1 (fly-ash) (cement) Scheetz 2009
Cemented rockfill in metal mine 69 1909 Tesarik 2009
Required properties 10 10 OriginAlliance ndash Mine
subsidence interpretive
reporting
P16
25 FA 105 sand 01 bentonite
5 FA 18 sand
Injection 3m intervals
Bell Bruyn 1999
Table A-6 Mechanical parameters of cohesive and non-cohesive backfill used in this numerical
study
Backfill Youngs Modulus (GPa)
Poissonrsquos Ratio UCS
(MPa)
Tensile Strength (MPa)
Cohesion (MPa)
Friction Angle (deg)
Dilation Angle (deg)
1MPa
Cohesive 0565 040 10 01 0117 400 100
05MPashy
cohesive 0565 040 05 005 0061 400 100
Non-
cohesive 0020 015 00 00 0000 420 75
A51 Numerical results and analysis
In order to quantify the influence of backfill on pillar strength in detail 180 models (60 models each for 1MPa 05MPa cohesive and non-cohesive backfill) of square coal pillars were analysed with the following parameters pillar width is 20m mining height is from 5m to 10m equivalent to a wh ratio of 2 to 4 percentage of backfill is from 0 to 90 Table A-7 summarises the results of these pillar strength analyses for all the cohesive and non-cohesive cases
Relationship between pillar strength and percentage of roadway backfill is presented in Figure Ashy25 Figure A-27 and Figure A-29 The raw data from Table A-7 has been calculated in uniform 10
backfill increments and is presented in Figure A-26 Figure A-28 and Figure A-30 As shown in these figures the percentage increase in pillar strength is approximately bilinear with increase in backfill
00
200
400
600
800
1000
1200
1400
1600 P
illar
stre
ngth
incr
ease
()
5m 6m 7m 8m 9m 10m
00 100 200 300 400 500 600 700 800 900 1000
Percentage of bacfill ()
Figure A-25 Pillar strength increase versus percentage of 1MPa cohesive backfill
00
200
400
600
800
1000
1200
1400
1600
Pill
ar s
tren
gth
incr
ease
()
10 backfill
20 backfill
30 backfill
40 backfill
50 backfill
60 backfill
70 backfill
80 backfill
90 backfill
4 5 6 7 8 9 10 11 12 Pillar height (m)
Figure A‐26 Pillar strength increase versus pillar height for 1MPa cohesive backfill
Table A-7 Pillar strength with increasing 1MPa and 05MPa cohesive backfill and non-cohesive backfill
Pillar strength Backfill
Approximate percentage of backfill
() 5 6
Pillar height (m)
7 8 9 10 Pillar
strength Without backfill 0 1007(00) 894(00) 795(00) 714(00) 647(00) 596(00)
(MPa) for different percentshyage of
10 20 30
1049(100) 1104(200) 1140(300)
940(83) 983(167)
1069(333)
833(71) 909(214) 947(286)
785(125) 820(188) 889(313)
720(111) 771(222) 803(278)
650(100) 710(200) 758(300)
backfill 1MPa 40 1205(400) 1130(417) 1046(429) 929(375) 869(389) 824(400)
Cohesive 50 1234(500) 1178(500) 1095(500) 1016(500) 943(500) 894(500) backfill 60 1292(600) 1208(583) 1143(571) 1098(625) 1009(611) 956(600)
70 1342(700) 1271(667) 1270(714) 1158(688) 1120(722) 1035(700) 80 1466(800) 1442(833) 1350(786) 1345(813) 1309(833) 1180(800) 90 1593(900) 1580(917) 1556(929) 1470(875) 1440(889) 1400(900) 10 1026(100) 930(83) 830(71) 773(125) 697(111) 636(100) 20 1081(200) 968(167) 896(214) 803(188) 754(222) 687(200) 30 1132(300) 1053(333) 939(286) 871(313) 786(278) 741(300)
05MPa 40 1184(400) 1098(417) 1018(429) 901(375) 853(389) 799(400) Cohesive 50 1217(500) 1141(500) 1065(500) 1000(500) 936(500) 873(500)
backfill 60 1240(600) 1167(583) 1102(571) 1054(625) 1009(611) 954(600) 70 1269(700) 1189(667) 1237(714) 1093(688) 1044(722) 1014(700) 80 1322(800) 1280(833) 1167(786) 1143(813) 1105(833) 1061(800) 90 1410(900) 1350(917) 1250(929) 1202(875) 1150(889) 1120(900)
Non-cohesive backfill
10 20
1016(100) 1028(200)
902(83) 912(167)
801(71) 819(214)
724(125) 732(188)
657(111) 670(222)
604(100) 615(200)
30 1044(300) 941(333) 832(286) 753(313) 678(278) 629(300)
Pillar strength Backfill
Approximate percentage of backfill
() 5 6
Pillar height (m)
7 8 9 10
40 1063(400) 961(417) 865(429) 767(375) 702(389) 649(400) 50 1086(500) 984(500) 885(500) 800(500) 729(500) 670(500) 60 1113(600) 1006(583) 904(571) 835(625) 760(611) 696(600) 70 1138(700) 1030(667) 943(714) 852(688) 792(722) 725(700) 80 1168(800) 1083(833) 963(786) 889(813) 829(833) 765(800) 90 1206(900) 1130(917) 1029(929) 913(875) 852(889) 804(900)
Figure A-27 Pillar strength increase versus pillar height for 05MPa cohesive backfill
4 5 6 7 8 9 10 11 12 13 Pillar height (m)
Figure A-28 Pillar strength increase versus percentage of 05MPa cohesive backfill
0
10
20
30
40
50
60
70
80
90
100
Pilla
r st
reng
th in
crea
se (
) 10 backfill
20 backfill
30 backfill
40 backfill
50 backfill
60 backfill
70 backfill
80 backfill
90 backfill
00
50
100
150
200
250
300
350
400
Perc
enta
ge o
f pill
ar s
tren
gth
incr
ease
()
5m
6m
7m
8m
9m
10m
00 100 200 300 400 500 600 700 800 900 1000
Percentage of bacfill ()
Figure A-29 Pillar strength increase versus percentage of non-cohesive backfill
00
50
100
150
200
250
300
350
400
Pilla
r st
reng
th in
crea
se (
)
10 backfill
20 backfill
30 backfill
40 backfill
50 backfill
60 backfill
70 backfill
80 backfill
90 backfill
4 5 6 7 8 9 10 11 12 Pillar height (m)
Figure A-30 Pillar strength increase versus pillar height for non-cohesive backfill
The modelling results suggest that the pillar strength will increase with increasing roadway backfill while the percentage increase of pillar strength is greater for the taller pillars than squat pillars it is observed that when the backfill is less than 40-50 the pillar strength increase is less sensitive to pillar height or wh ratio while over 40-50 backfill pillar strength rapidly increase with pillar height
A52 Comparison of three different kinds of backfill
Pillar strength improvement with 05 and 10 MPa cohesive backfill and non-cohesive backfill is presented in Figure A-31 to Figure A-33
0
10
20
30
40
50
60
70
Incr
ease
of p
illar
str
engt
h (
) 5m-00MPa
5m-05MPa
5m-10MPa
0 10 20 30 40 50 60 70 80 90 100
Percentage of backfill ()
Figure A-31 Comparison of 05 and 10 MPa cohesive backfill and non-cohesive backfill at 5m mining height
0
20
40
60
80
100
120
Incr
ease
of p
illar
str
engt
h (
)
7m-00MPa
7m-05MPa
7m-10MPa
0 10 20 30 40 50 60 70 80 90 100
Percentage of backfill ()
Figure A-32 Comparison of 05 and 10 MPa cohesive backfill and non-cohesive backfill at 7m mining height
Incr
ease
of p
illar
str
engt
h (
)
140
120
100
80
60
40
20
0
9m-00MPa
9m-05MPa
9m-10MPa
0 10 20 30 40 50 60 70 80 90 100
Percentage of backfill ()
Figure A-33 Comparison of 05 and 10 MPa cohesive backfill and non-cohesive backfill at 9m mining height
Modelling predicts that 05MPa is as effective as 10MPa at increasing pillar strength below approximately 50-60 roadway fill Modelling suggests that cohesive backfill is more effective at increasing pillar strength than non-cohesive fill
A53 Numerical study of the influence of interface between backfill and pillar
To investigate the influence of an interface between backfill and pillar on the strength response of coal pillar an interface is set between backfill and pillar as shown in Figure A-34 The interface property is list in Table A-8
Figure A-34 Sketch showing the position of interface between backfill and pillar
2
4
6
2
4
6
Table A-8 Mechanical parameters of interface used in numerical model
Interface Cohesion FrictionNormal stiffness (GPa) Shear stiffness (GPa) property (MPa) Angle (deg)
Value 20 20 0 5~40
Pillar strength of a 6m high pillar as interface friction angle is increased from 5 degrees to 40 degrees is displayed in
1212
1010
88
cohesive backfill with interface
cohesive backfill without interface
non-cohesive backfill with interface
non-cohesive backfill without interface
4 cohesive backfill with interface
cohesive backfill without interface
non-cohesive backfill with interface
non-cohesive backfill without interface
stre
ss (M
Pa)
stre
ss (M
Pa)
6
2
00 0000 0005 0010 0015 0020 0025 0030 0035 0040 0045 0000 0005 0010 0015 0020 0025 0030 0035 0040 0045
strain strain
Figure A-35 to Figure A-38
Modelling predicts a non-cohesive interface with friction angle below 20 degrees results in a slight reduction in pillar strength above 20 degrees the interface is predicted to have little influence on pillar strength
cohesive backfill with interface
cohesive backfill without interface
non-cohesive backfill with interface
non-cohesive backfill without interface
1212
1010
88
cohesive backfill with interface
cohesive backfill without interface
non-cohesive backfill with interface
non-cohesive backfill without interface
stre
ss (M
Pa)
stre
ss (M
Pa)
6
4
2
0 0
0000 0005 0010 0015 0020 0025 0030 0035 0040 0045 0000 0005 0010 0015 0020 0025 0030 0035 0040 0045
strain strain
Figure A-35 Post peak pillar for 6m high pillar (wh=33) with friction angle 5deg on left 10deg on right of interface between backfill and pillar
2
4
6
cohesive backfill with interface
cohesive backfill without interface
non-cohesive backfill with interface
non-cohesive backfill without interface
1212
1010
88
cohesive backfill with interface
cohesive backfill without interface
non-cohesive backfill with interface
non-cohesive backfill without interface
stre
ss (M
Pa)
stre
ss (M
Pa)
6 6
44
2 2
0 0 0000 0005 0010 0015 0020 0025 0030 0035 0040 0045 0000 0005 0010 0015 0020 0025 0030 0035 0040 0045
strain strain
Figure A-36 Post peak pillar for 6m high pillar (wh=33) with friction angle 15deg on left 20deg on right of interface between backfill and pillar
12
cohesive backfill with interface
cohesive backfill without interface
non-cohesive backfill with interface non-cohesive backfill without interface
12
10 10
8 8
cohesive backfill with interface
cohesive backfill without interface
non-cohesive backfill with interface
non-cohesive backfill without interface
stre
ss (M
Pa)
stre
ss (M
Pa)
6 6
4 4
2 2
0 0 0000 0005 0010 0015 0020 0025 0030 0035 0040 0045 0000 0005 0010 0015 0020 0025 0030 0035 0040 0045
strain strain
Figure A-37 Post peak pillar for 6m high pillar (wh=33) with friction angle 25deg on left 30deg on right of interface between backfill and pillar
12
cohesive backfill with interface
cohesive backfill without interface
non-cohesive backfill with interface non-cohesive backfill without interface
12
10 10
8 8
cohesive backfill with interface
cohesive backfill without interface
non-cohesive backfill with interface
non-cohesive backfill without interface
stre
ss (M
Pa)
stre
ss (M
Pa)
6
4
2
0 0000 0005 0010 0015 0020 0025 0030 0035 0040 0045
0 0000 0005 0010 0015 0020 0025 0030 0035 0040 0045
strain strain
Figure A-38 Post peak pillar for 6m high pillar (wh=33) with friction angle 35deg on left 40deg on right of interface between backfill and pillar
22
6
8
24
A54 Post peak pillar strength
A full stress strain curve to approximately 35 strain is presented in the following figures for 1MPa cohesive and non-cohesive backfill Results for 05MPa cohesive backfill sit approximately mid-way between these two cases and are included in the summary Table A-9
24 24
0000 0010 0020 0030 0040 0050
Average axial strain of coal pillar
000
2000
3000
4000
5000
6000
7000
8000
9000
22
0000 0010 0020 0030 0040 0050
Average axial strail of coal pillar
000
2000
3000
4000
5000
6000
7000
8000
9000
20 20
18
Ave
rage
str
ess
of c
oal p
illar
(MPa
)
Ave
rage
str
ess
of c
oal p
illar
(MPa
)
18
16 16
1414
12 12
1010
88
66
44
22
00
Figure A-39 Post peak pillar strength with increasing backfill 5m high pillar (wh=40) with 1MPa cohesive backfill on left non-cohesive backfill on right
24
22
0000 0010 0020 0030 0040 0050
Average axial strain of coal pillar
00
250
333
417 500
583
667 833
917
22
0000 0010 0020 0030 0040 0050
Average axial strain of coal pillar
00
250 333
417
500 583
667
833
917
20 20
Ave
rage
str
ess
of c
oal p
illar
(MPa
)
18 18
16 16
14 14
12 12
10 10
8
6
4 4
2 2
0 0
Figure A-40 Post peak pillar strength with increasing backfill 6m high pillar (wh=33) with cohesive backfill on left non-cohesive backfill on right
Aver
age
stre
ss o
f coa
l pill
ar (M
Pa)
4
6
8
10
12
14
16
18
2
4
6
8
0000 0005 0010 0015 0020 0025 0030 0035 0040 0045
Average axial strain of coal pillar
000
2140
2860
4290
5000
5710
7140
7860
9290
2020
0000 0005 0010 0015 0020 0025 0030 0035 0040 0045
Average axial strain of coal pillar
000
2140
2860
4290
5000
5710
7140
7860
9290
18
Ave
rage
str
ess
of c
oal p
illar
(MPa
) A
vera
ge s
tres
s of
coa
l pill
ar (M
Pa)
Aver
age
stre
ss o
f coa
l pill
ar (M
Pa) 16
14
12
10
8
6
4
22
00
Figure A-41 Post peak pillar strength with increasing backfill 7m high pillar (wh=29) with cohesive backfill on left non-cohesive backfill on right
14 14
0
000
2500
3130
3750
5000 6250
6880
8130
8750
0
000
2500
3130
3750
5000
6250
6880
8130
8750
12 12
10
Ave
rage
str
ess
of c
oal p
illar
(MPa
)
10
8
6
4
2
0000 0010 0020 0030 0040 0050 0000 0010 0020 0030 0040 0050
Average axial strain of coal pillar Average axial strain of coal pillar
Figure A-42 Post peak pillar strength with increasing backfill 8m high pillar (wh=25) with cohesive backfill on left non-cohesive backfill on right
2
4
6
8
10
12
14
2
4
6
8
14
12
Ave
rage
str
ess
of c
oal p
illar
(MPa
) A
vera
ge s
tres
s of
coa
l pill
ar (M
Pa)
0
000 2220 2780 3890 5000 6110 7220 8330 8890
0
000 2220 2780 3890 5000 6110 7220 8330 8890
Ave
rage
str
ess
of c
oal p
illar
(MPa
)
10
8
6
4
2
0000 0005 0010 0015 0020 0025 0030 0035 0040 0000 0005 0010 0015 0020 0025 0030 0035 0040
Average axial strain of coal pillar Average axial strain of coal pillar
Figure A-43 Post peak pillar strength with increasing backfill 9m high pillar (wh=22) with cohesive backfill on left non-cohesive backfill on right
12 12
0
000 2500
3000 4000
5000 6000
7000 8000
9000
0
000
2500
3000
4000
5000
6000
7000
8000
9000
10
Ave
rage
str
ess
of c
oal p
illar
(MPa
) 10
8
6
4
2
0000 0005 0010 0015 0020 0025 0030 0035 0000 0005 0010 0015 0020 0025 0030 0035
Average axial strain of coal pillar Average axial strain of coal pillar
Figure A-44 Post peak pillar strength with increasing backfill 10m high pillar (wh=20) with cohesive backfill on left non-cohesive backfill on right
The amount of backfill to achieve the transition between strain softening and hardening is presented in Table A-9 for all mining height The values in this table are estimated from the stress-strain curve analysed to 35 of strain and are depended on the backfill increment which is in turn dependent on the ratio of mining height to the calibrated element size 05m
Table A-9 Percentage of roadway backfill that leads to a transition from strain softening to hardening
Pillar height Non-cohesive 05MPa Cohesive 10MPa Cohesive backfill backfill backfill
5m 300 200 200
6m 500 417 333
7m 571 500 429
8m 625 625 500
9m 722 722 611
10m 800 800 700
The modelling results suggest that the average axial stress of coal pillar increases with compression until peak stress is reached In the post-failure region pillar stress is reduced as strain increases for all models without backfill All the model results predict that there would be a change to strain hardening behaviour as percentage of backfill increases For example this transition point is 333 for 10 MPa cohesive backfill while 50 for non-cohesive backfill with 6m mining height as shown in Table A-9 It can also be seen from Table A-9 that tall pillars need more backfill than squat pillars to achieve the change from strain softening to hardening for either cohesive backfill or non-cohesive backfill
A55 Backfill for diamond shaped pillars
A 7m high diamond shaped pillar with 50 degree skew angle is analysed with increasing level of backfill in surrounding roadways On the skewed angle the backfill is constrained with roller boundary conditions normal to the skewed angle to represent symmetry conditions and a 5m wide roadway
Figure A-45 Numerical model of diamond shaped pillar with backfill on left and boundary conditions on right
The predicted strength of a diamond shaped pillar and equivalent square pillar with increasing roadway backfill of both cohesive and non-cohesive models is presented in Figure A-46 and Figure A-47
6
7
8
9
10
11
12
13
0 10
Pilla
r str
engt
h (M
Pa)
20 30 40 50 60 70 80 90 100
Percentage of backfill ()
Skew pillar
Square pillar
0
10
20
30
40
50
60
70
0 10
Incr
ease
of p
illar
str
engt
h (
)
20 30 40 50 60 70 80 90 100
Percentage of backfill ()
Skew pillar
Square pillar
Figure A-46 Predicted pillar strength of diamond and square shaped pillars with increasing percentage of 1MPa cohesive backfill On left is absolute strength and on right is percentage strength increase
6
7
8
9
10
11
0 10
Pilla
r stre
ngth
(MP
a)
20 30 40 50 60 70 80 90 100
Percentage of backfill ()
Skew pillar
Square pillar
0
5
10
15
20
25
30
35
0 10
Incr
ease
of p
illar
str
engt
h (
)
20 30 40 50 60 70 80 90 100
Percentage of backfill ()
Skew pillar
Square pillar
Figure A-47 Predicted pillar strength of diamond and square shaped pillars with increasing percentage of non-cohesive backfill On left is absolute strength and on right is percentage strength increase
A56 Backfill placed after significant pillar yield
A pillar model with 90 non-cohesive backfill placed after yielding of a 7m high pillar is presented in Figure A-48 The percentage of strength increase is given in Table A-10 It is found that the pillar strength increase is lower if the pillar has undergone significant deformation before the placement of backfill It is predicted that 90 backfill results in a strain-hardening pillar behaviour even if the pillar has previously yielded significantly
Ave
rage
stre
ss o
f coa
l pill
ar (M
Pa)
18 without backfill 025 strain 050 strain
14
16
075 strain 100 strain
12 125 strain 150 strain
10 175 strain 200 strain
8
6
4
2
0 0000 0005 0010 0015 0020 0025 0030 0035 0040 0045 0050
Average strain of coal pillar
Figure A-48 Stress strain curves for backfill placed around the pre-strained pillar displaying state of pillar core upon placement of backfill
Table A-10 Pillar strength increase with 90 non-cohesive backfill placed around a pre-strained 7m high square pillar of 20m width
Percentage backfill ()
Strain at placement of non-cohesive backfill ()
Pillar strength (MPa)
Percentage increase in peak
strength ()
Percentage increase in post-peak
strength at 3 strain ()
0 000 7953 000
90 000 10290 2939
90 025 9156 1513
90 050 8965 1272
90 075 8526 720
90 100 7945 26006
90 125 7951 22608
90 150 7951 18917
90 175 7951 15629
90 200 7951 11134
A6 3D MODEL OF DUNCAN ST FAILURE PANEL
A61 Numerical model
A three dimensional model of 46 pillars in the Duncan St subsidence region has been analysed with over burden geology based on hole CP1 and a constant overburden depth of 124m Figure A-49 Figure A-50 and Figure A-51 Uniform mining heights of 6m and 9m have been analysed
Selection of the pillars to be analysed is based on visual inspection of the panel layout and includes pillars bounded by unmined coal to the west the waterline barrier pillar to the east larger pillars to the south and a panel of slightly larger pillars of different orientation to the north
One row of pillars in the middle of this panel trending from north-west to south-east are of smaller dimension than the average and of diamond shape with acute internal angle of approximately 50degrees Being in the approximate middle of the panel close to full tributary area load will be mobilised on this row of pillars and therefore it is believed pillars in this row initiated the 2008 subsidence event
The Duncan Street numerical model has the following objectives
bull Estimation of pillar stresses and FoS for comparison with empirical formula
bull Comparison of backfill response at panel scale with previous single pillar studies
bull Estimation of surface subsidence at given percentage roadway fill
bull Estimation of extent of abutment stresses due to panel failure
A62 Observations from Duncan Street numerical model
bull At 6m mining height the minimum pillar FoS for these 46 pillars is calculated to be 131 using Pressure Arch theory and UNSW strength formula panel failure is not predicted with this mining height by the model At 9m mining height the minimum FoS is calculated as 099 and panel failure is predicted to occur
bull The probability of pillar failure for associated FoS calculated by the UNSW pillar strength formula Eq(2) is given in Galvin 2006 in Table A-11 The relationship was developed for square pillars using the Australian pillar database and tributary area theory and hence theoretically speaking may not directly apply to this study However it can be taken as a general guide
bull From Table A-11 it is seen that there is a 1 in 20 probability of instability at 6m mining height and a 1 in 2 probability at 9m mining height Numerical modelling is however a deterministic approach and it always predicts failure if the FoS is less than 10 and stability if FoS gt 10 since no variation in geotechnical properties or conditions is used
bull Although our numerical models predict no pillar failure at 6m and panel failure at 9m in reality there remains approximately a 1 in 20 chance of failure at 6m mining height If one pillar was to fail load transferred to adjacent pillars would reduce the FoS of these adjacent pillars and could lead to the pillar failure and subsidence as observed at 2008 event region
Table A-11 Factor of safety failure probabilities for UNSW pillar strength formula
(after Galvin 2006)
Safety Factor Probability of pillar failure
087 8 10
100 5 10
122 1 10
130 5 100
138 2 100
144 1 100
163 1 1000
179 1 10000
195 1 100000
211 1 1000000
bull Based on the numerical results obtained using two mining heights the pillar and overburden failure is consistent with analytical predictions from Pressure Arch theory and UNSW pillar strength calculation
bull Surface subsidence predicted from the numerical model with a mining height of 9m is 196m While this value is in approximate agreement with monitoring data (14mshy15m) the model was not sufficiently calibrated since the real mining height in the region is uncertain to be able to confidently predict final subsidence strains and tilts at the site
bull With 1MPa cohesive backfill at a roadway fill ratio of 83 the predicted strength increase is 70 With non-cohesive backfill at the same fill ratio the strength increase is 20 These values are in agreement with the results for single pillars
bull The numerically predicted surface subsidence with 83 roadway fill is 022m Maximum predicted tilt in east-west direction is 7mmm and in north-south direction is 5mmm Analytical formula [Holla amp Barclay 2000] predict maximum tilt of 53mmm for this amount of subsidence
bull Isolated cohesive backfill surrounding pillars of low wh ratio is predicted to be effective in confining the pillar and increasing peak pillar strength and panel stability Isolated non-cohesive backfill without barriers could not be analysed in this numerical model as backfill lsquoflowsrsquo and numerical stability could not be achieved
bull Stress transfer in the immediate roof sandstone unit (above the coal roof) is predicted to extend approximately 80m beyond the limits of the collapsed panel This is in reasonable agreement with theoretical studies
Figure A-49 Duncan St modelled panel with outline of adjacent modelled panel location of representative open hole CP1 file named ldquoAppendix B2 open hole logsrdquo located in directory ldquoCollingwood Park Subsidence 2B Collingwood Park Mine Subsidence Reports 1988 Eventsrdquo and mine subsidence limit contour
A63 Model properties
Overburden geology is based on borehole CP1 the most complete interpreted available hole drilled in 1988 by Queensland Department of Mines Figure A-50 To include this in the numerical model lithological units had to be coalesced into major units of sandstone (SS) siltstone (SL) mudstone (MS) weathered units and coal Figure A-51
Rock properties for the overburden were determined from a 2D parametric study whereby the UCS of all units was scaled to achieve pillar and overburden failure at 8m mining height Table A-12 and Table A-13
Unit top depth thickness unit thickness
thickness scaled
thickness in model
000 1200 1200 1046 1000 1200 700 SS 700 610 600 1900 600 MS 600 523 500 2500 1100 SS 1300 1133 1100 3600 200 SS 000 3800 100 SL 1000 871 900 3900 100 MS 000 4000 500 000 4500 100 000 4600 100 000 4700 100 000 4800 100 SS 400 349 400 4900 300 SS 000 5200 300 SL 700 610 600 5500 100 MS 000 5600 300 MS 000 5900 400 SS 500 436 400 6300 100 SS 000 6400 400 SL SS 900 784 800 6800 100 SL MS 000 6900 100 SL 000 7000 200 SL MS 000 7200 100 SS SL 000 7300 200 SS 1000 871 900 7500 200 SL 000 7700 200 SS SL 000 7900 200 SS 000 8100 100 SL 000 8200 100 SS 000 8300 200 SL 4350 3790 3800 8500 200 SL 000 8700 100 SS 000 8800 100 COAL 000 8900 200 000 9100 100 000 9200 100 000 9300 100 SL MS 000 9400 300 SL MS SS 000 9700 100 000 9800 100 SL MS 000 9900 400 SL SS 000 10300 200 SS MS 000 10500 100 SL MS 000 10600 200 SL MS SS 000 10800 100 000 10900 400 SL MS 000 11300 400 SL SS 000 11700 100 SS MS 000 11800 300 000 12100 400 SL SS 000
SL MS MS SS
MS
MS
SL
MS SS SL SS SL MS MS
weathering
SL MS SS
12500 150 000 12650 450 850 741 750 13100 400 SS 000 13500 100 MS SL
SS SL 960 837 500
13600 200 13800 100 SS 13900 200 14100 360
SS SL SL MS
14460 470 COAL MINING SEAM 600 14930 FLOOR
Figure A-50 Inferred geology from representative borelog CP1 used in numerical model
weathering SS
Unit Depth floor below surface Num elements Unit Unit name in model surface 0
10 3 16 weather 16 2 15 ss6
MS 21 2 14 ms2 SS 32 4 13 ss5 SL 41 3 12 sl3 SS 45 1 11 ss4 MS 51 2 10 ms1 SS 55 1 9 ss3 SL 63 3 8 sl2 SS 72 3 7 ss2 SL 1055 11 6 sl1 SS 113 4 5 ss1 SEAMR 118 3 4 seamr SEAM 124 3 3 seam FLOOR1 134 3 2 floor2 FLOOR2 250 10 1 floor1
Figure A-51 Coalesced units for numerical model based on hole CP1
Insitu stress is unknown at the site so a horizontal to vertical stress gradient of 15 has been assumed Given that the extensive workings were undertaken 20 to 30 years before the 2008 event horizontal stresses in the mining seam would be considerably disturbed from the pre-mining conditions
Table A-12 Rock properties for softening mohr coloumb material Softening rates of coal friction angle is 6 degrees over 2 plastic strain and total loss of cohesion over 24 plastic strain in coal and over 1 in other rocks Determined from pillar studies
E
nu Bulk Shear UCS UCS Phi Dilation Coh Tensile Strength (GPa) (GPa) (GPa) (MPa) scaled angle (MPa) (MPa)
SS 75 02 4167 3125 50 125 40 2 291 125
SL 4 025 2667 1600 30 75 35 2 195 075
MS 3 025 2000 1200 15 375 32 2 104 0375
Weathering 1 025 0667 0400 8 2 32 2 055 02
COAL 11 03 0917 0423 12 3 36 6 076 003
FLOOR1 4 025 2667 1600 30 75 38 2 183 075
FLOOR2 4 025 2667 1600 30 75 38 2 183 075
Table A-13 Ubiquitous joint properties Softening rate of ubiquitous joints total loss of cohesion over 1 plastic strain Determined from 2D overburden studies
Cohesion Ubiq joint cohesion Tensile Strength Ubiq joint tensile strength Ubiq joint (MPa) (MPa) (MPa) (MPa) friction
SS 291 00029144 125 0000125 15 SL 195 00019521 075 0000075 15 MS 104 00010393 0375 00000375 15 Weathering 055 00005543 02 000002 15 COAL 076 003 FLOOR1 183 - 075 - -FLOOR2 183 075 -
A64 Results from 3D Duncan St model
Factor of Safety estimated at 6m and 9m mining heights
Figure A-52 Pillar FoS calculated for 6m mining height by analytical method with strength by eq(3) and pillar stress by pressure arch theory Minimum value is 131 suggesting a 5 in 100 probability of failure however not sufficient to fail in the numerical model (that requires FoS lt 10)
Figure A-53 Pillar FoS calculated analytically for 9m mining height (eq(3) and PA theory) Minimum value is 099 suggesting a probability of failure of 5 in 10 although in the numerical model failure should occur
Yield on plane for 6m and 9m mining heights
Figure A-54 Location of section plane used for section view in following figures
Figure A-55 Yield on section plane for 6m mining height No significant damage or displacement observed
Figure A-56 Yield on section plane for 9m mining height no backfill
Figure A-57 Displacement on section plane for 9m mining height no backfill Maximum displacement is approximately 15m at surface
Results on horizontal plane at mid-pillar height
Figure A-58 Yield at mid-pillar height 9m mining height Blue elements evident in some pillars indicating pillar core remains intact
Figure A-59 Predicted vertical stress at mid pillar height 9m mining height Insitu stress is 30MPa Unyielded pillars and pillars hardening after yield are transferring vertical load while yielded pillars carry little load Extent of abutment stress increase is approximately 80m
Figure A-60 Roof vertical stress predicted by numerical model with 9m mining height Contour increments are 01MPa Base vertical stress is approximately 27MPa Abutment stress influence distance is approximately 80m
Results on surface after panel failure at 9m mining height
Figure A-61 Surface subsidence as predicted with numerical model with 9m mining height and total subsidence along Duncan St to McLaughlin St as monitored to October 09 Maximum surface subsidence predicted as 196m Outline of numerical modelling pillars and dotted contour of observed subsidence limit
A65 Duncan St model ndash backfill effectiveness
The Duncan St 3D model has been analysed with full and targeted 1MPa cohesive and non-cohesive backfill placed in roadways Roadway fill of 66 is analysed for the 1MPa cohesive mixture and 83 roadway fill for the non-cohesive mix
Results are presented in the following figures and figure captions
Factor of Safety increase from cohesive backfill
Analysis of the Duncan St model with 9m mining height is undertaken to estimate the FoS increase from backfill By increasing gravity in increments the backfill strength improvement is quantified With 83 roadway fill of 1MPa cohesive backfill the overburden and pillar tops (ie region of pillar above height of backfill) fails with gravity of 17ms2 suggesting the pillars with FoS of approximately 10 has increased FoS to 17 by backfilling adjacent roadways
Figure A-62 Gravity of 16g with 83 1MPa cohesive backfill showing no significant yield
Figure A-63 Gravity of 17g with 83 1MPa cohesive backfill predicting failure of pillar tops and overburden and collapse of roadway void space
FoS increase with non-cohesive backfill
With non-cohesive backfill pillars yielded due to lack of confinement upon initial placement of backfill in roadways but overburden remain stable and void space above backfill remained open Overburden remained stable at gravity increase to 11ms2 Figure A-64 but collapsed at gravity increase of 12ms2 Figure A-65
Figure A-64 Gravity of 11g with 83 non-cohesive backfill predicting pillar yield but overburden stability
Figure A-65 Gravity of 12g with 83 non-cohesive backfill predicting failure of pillars and overburden and collapse of roadway void space Maximum surface subsidence is 055m which includes the compressive effect of the 12g gravity increase
Placement of targeted backfill
A model is analysed with cohesive backfill totally surrounding two pillars with low predicted FoS The two pillars are predicted to have a FoS of 099 and 100 left to right viewed from above at a 9m mining height Backfill extends to an extent of 5m to 10m from the pillar and is 6m high in the roadways Gravity increase to 12g required to fail panel suggesting panel strength increase is approximately 20 from targeted backfill Predicted surface subsidence 125m (excessive mesh deformation stops analysis equilibrated stage may have higher surface subsidence)
Figure A-66 Duncan St model with 66 roadway fill of 1MPa cohesive backfill surrounding two pillars with low FoS at 9m mining height
Figure A-67 Predicted yield at mid pillar height of 9m pillars with 66 roadway fill of 1MPa cohesive backfill Note intact core (blue) for targeted pillars
Figure A-68 Pillar strength at 9m mining height Strength WITHOUT BACKFILL of northern focus pillar selected for targeted backfill is 527MPa and southern focus pillar is 526MPa
Figure A-69 Vertical stress in pillars targeted for partial backfill placement Stress calculated at equilibrium of elasto-plastic analysis WITHOUT BACKFILL Stress in northern focus pillar is 54MPa and in southern focus pillar is 513 FoS of NFP=52754 = 0975 FoS of SFP=526513 = 1025
Non-cohesive backfill in targeted placement study
A model with targeted placement of non-cohesive backfill was attempted but could not be satisfactorily converged since backfill lsquoflowsrsquo and inter-penetrates elements resulting in numerical instabilities
Forcing pillars to fail to examine resultant subsidence
To examine the extent of surface subsidence if backfilled pillars fail the numerical model with 9m mining height and 83 roadway fill of 1MPa cohesive backfill is analysed with a 90 reduction in coal pillar strength properties
With 9m mining height and 83 roadway fill of cohesive backfill void space remaining is 15m and the numerical model predicts failure of pillars and overburden results in approximately 02m surface subsidence
Figure A-70 Surface subsidence predicted by numerical model when pillars forced to fail with 83 roadway fill Contour interval is 01m with maximum subsidence predicted as 022m
Figure A-71 Surface strain in east-west direction when pillars forced to fail resulting 022m surface subsidence Maximum strain is 5mmm and contour interval is 1mmm
Figure A-72 Surface strain in north-south direction when pillars forced to fail resulting 022m surface subsidence Maximum strain is 3mmm and contour interval is 1mmm
Figure A-73 Tilt in east-west direction Units are mmm and intervals are 1mmm maximum tilt is 7mmm
Figure A-74 Tilt in north-south direction Units are mmm and intervals are 1mmm maximum tilt is 5mmm
To highlight the need for adequate fill the model with 66 roadway fill is analysed with the pillars forced to fail with a 50 reduction in pillar strength Void space over the backfill in the roadways is 30m Modelling predicts maximum surface subsidence of 068m
Figure A-75 Surface subsidence when pillars forced to fail with 66 roadway fill Roadway void space is 30m with the model predicting 068m surface subsidence Contour interval is 01m
A66 Numerical model of adjacent high risk area
Numerical model and panel stability
A numerical model of the region adjacent to Duncan St incorporating 76 pillars is analysed at 9m mining height Overburden strata strengths and depth-of-cover is consistent with Duncan St model
The main objective of this model is to estimate the strength difference between the two mining panels west and east of the Waterline fault Given uniform mining height and depth-of-cover the strength difference will be due to the pillar configuration and boundary conditions
At 9m mining height the model is predicted to be essentially stable although 9 pillars are predicted to be fully yielded at mid-pillar height
With gravity increase of 10 the model remains stable At 20 increase in gravity the model is predicted to fail with significant overburden yield
It is concluded therefore that the panel to the east of Waterline fault is 20 stronger than the panel to the west
Figure A-76 Location of numerical model 2 together with surface subsidence contours from 1988 and 2008 events and seam level eastern boundary of failure predicted from 3D seismic
Figure A-77 Yield on section at mid-height for 9m mining height
Figure A-78 Rockmass yield on vertical section trending east-west at mid-point of model Note overburden is largly intact with no extensive collapse
Figure A-79 Pillars predicted to have failed from Numerical model 2 with surface subsidence contours and inferred eastern limit of failed zone at seam level
By a 20 increase in gravity the model is forced to fail resulting in predicted 13m surface subsidence that includes increased overburden compression from increased gravitational component Excessive deformation and numerical instability stopped the model true surface deformation may be higher
Figure A-80 Adjacent model with 9m mining height Predicted surface subsidence after 20 increase in gravity Model predicts 13m surface subsidence
Figure A-81 Adjacent model with 9m mining height and 20 gravity increase Predicted failure at mid-pillar height Note intact core in southern pillars which appear stronger from unmined adjacent coal and larger general pillar size
A7 CONCLUSIONS
A71 Current knowledge on coal pillars behaviour
bull The strength based factor-of-safety approach is well established in coal pillar design Factors of safety for coal pillars required to provide medium to long term stability should be greater than 16 [Galvin 2006 Hill 2005]
bull Coal pillar strength has been the subject of rigorous research since at least the 1960rsquos and the Salamon amp Munro formula has been applied in the design of over a million coal pillars in South Africa alone [Mark 1999 Salamon 1998] Strength formula derivations from the UNSW are established in Australia
bull Coal pillar load calculation traditionally relies on tributary area theory which is a conservative approach suitable for pillar design
bull Tributary area conditions are NOT satisfied at Collingwood Park pillars are irregular in size and shape there is large areas of unmined coal and the seam has significant dip
bull This last point is important as analytical methods hold the only hope of evaluating every pillar at Westfalen No 3 Colliery The numerical model of Duncan St analyses 46 pillars and requires significant computational resources the entire Colliery has in excess of 700 pillars and cannot be analysed by the same methods in its entirety by current computer codes in a reasonable time frame
bull Likewise it is not satisfactory to draw conclusions on panel stability from limited analysis of representative groupings of pillars because of the variability in size shape mining height and cover depth over the mining area
bull To overcome the limitations of tributary area theory for the back-analysis of an irregular pillar layout a novel approach for calculating loads based on pressure arch theory has been developed subjected to international peer review and published in the International Journal of Rock Mechanics and Mining Sciences In summary each pillar is individually examined and the pillar area circumference and centroid are calculated At the pillar centroid the cover depth and mining height are determined An influence zone based on a circular area with radius defined by the depth-dependent load transfer distance Within this area the local extraction ratio is calculated This approach has found to satisfactorily account for pillars of arbitrary shape in irregular layout with variable cover depth
bull This allows a FoS to be determined for the over 700 pillars of Westfalen No 3 with reasonable computer resources
A72 Typical pillar strength effects
Width to height ratio
bull Pillars at Westfalen No 3 have typical effective width from 20m to 50m While mining height is uncertain it is believed to range from 6m to 10m With these dimensions pillar wh ratio ranges from 20 to 83
bull At the lower limit of wh=20 geological influences will start to determine pillar strength [Galvin 2006] From wh in the range gt 20 to 40 the formula of Salamon and Munro or UNSW extensions could be expected to estimate pillar strength with the squat pillar version of these formula applicable for whgt40 [Galvin 2006 Salamon 1998 Galvin 1999]
bull The squat pillar extensions were developed since the standard formulas were found to underestimate pillar strength at whgt4 At Westfalen No 3 colliery although there are a number of pillars of whgt4 many of these are irregular in shape often long and relatively narrow (30m ndash 40m) Given this and the need to automate the assessment of every pillar the squat pillar strength formula is not utilised This approach is conservative
Pillar shape effects
bull Many pillars at Westfalen No 3 are skewed of diamond shape with acute internal angle from 50 to 90 degrees Hydraulic radius simile accounts for pillar shape by an effective width defined by 4AC while the UNSW has a parrellopid formula that for pillars of equal side length results in an effective width equivalent to this
bull In a study of pillar shapes common to Westfalen No 3 colliery the hydraulic radius analogy for estimation of effective width is found adequate with errors less than 6 for considered sizes and shapes
Post peak strength
bull Numerical studies and the work of Das in Indian coal fields highlights the changing post peak behaviour with increasing width to height ratiorsquos It has been determined that when wh exceeds approximately 5 pillars start to harden post peak When whlt3 pillars display limited if any post peak strength
bull The significance of this effect will be in the manner that pillars shed load to adjacent pillars In an array of pillars of similar dimensions pillars with a low wh ratio could be expected to shed load in a sudden more catastrophic manner than those that harden post peak Such sudden pillar failure is referred in the literature as catastrophic cascading or rolling pillar failure and has been responsible for damaging wind blasts and significant loss of life over the years
bull In an irregular pillar layout such as Westfalen No 3 with variable wh ratio significant barrier pillars and regions of unmined coal sudden multiple panel collapse would be expected to be less likely
bull The analytical approach developed for assessing pillar load accounts for load shed from a failed pillars to pillars within the zone of influence of that pillar
Specific details of this approach are discussed in the hazard map and risk assessment chapter of this report
Backfill effect
bull Numerical studies on a cohesive and non-cohesive backfill suggest that pillar strength is increased with increasing height of fill Studies suggest a 1MPa cohesive backfill may increase pillar strength by approximately 10 at 40 roadway fill for wh=33 and 18 at 40 roadway fill at wh=22 At 80 roadway fill pillar strength increases are predicted to exceed 50 Percentage strength increases are predicted to be greater with lower wh ratiorsquos
bull Studies of a non-cohesive backfill suggest at 80 roadway fill pillar strength increases are approximately 25
bull With both backfill types pillar strength is predicted to increases dramatically above 80 roadway fill and pillars are predicted to exhibit post-peak hardening behaviour
For example in the Duncan St area a pillar of effective width 20m will have a FoS of approximately 118 at mining height of 10m without backfill A 50 strength increase from 1MPa cohesive backfill at 80 roadway fill will raise the FoS to approximately 177 and reduce the probability of instability from approximately 1 in 10 to less than 1 in 1000
With 80 roadway fill of a non-cohesive backfill the same Duncan St pillar FoS will increase to approximately 147 and the probability of instability reduce to less than 1 in 100
bull Backfill is likely to reduce the rate of time dependent pillar strength degradation by reducing pillar spalling due to the erosive effects over time of high stress and exposure of the pillar surface to the atmosphere
bull In addition backfill is likely to benefit pillar stability by limiting the void available to the roof to fall into Roof falls particularly at roadway intersections may be present By reducing the roadway volume backfill will eventually support the roof when the bulking effect of roof falls fills the remaining roadway voids space Beyond this summary time dependent issues of backfill have not been considered
roadway
fill
Non-cohesive backfill
(7m mining height width 20m) strength increase
05 MPa cohesive backfill
(7m mining height width 20m)
strength increase
10 MPa cohesive backfill
(7m mining height width 20m)
strength increase
60 135 388 437
70 183 432 597
80
90
208
291
474
572
698
957
A73 Duncan St numerical model
bull In the Duncan St subsidence region approximately 46 pillars are surrounded by unmined coal to the west a large pillar containing the Waterline fault to the east and larger pillars to the south and north
bull At 6m mining height pillar minimum FoS for these 46 pillars is calculated at 131 with Pressure Arch theory and UNSW strength formula At 9m mining height minimum FoS is calculated as 099
bull Pillar probability of failure for FoS calculated by the UNSW eq(2) is given in [Galvin 2006] as
Table A-14 Factor of safety failure probabilities for UNSW pillar strength formula (after Galvin 2006)
Safety Factor Probability of pillar failure
087 8 10
100 5 10
122 1 10
13 5 100
138 2 100
144 1 100
163 1 1000
179 1 10000
195 1 100000
211 1 1000000
bull From Table A-14 at 6m mining height there is a 1 in 20 probability of instability and at 9m a 1 in 2 probability The variability in the database of failed and unfailed pillars from which eq (1) to eq (3) are derived is responsible for these probabilities Our numerical model should always predict failure if the FoS is less than 10 and always predict stability with FoS gt 10 since no such variability in geotechnical properties or conditions is used
bull While our numerical model predicts no pillar failure at 6m and pillar failure at 9m in reality there remains approximately a 1 in 20 chance of failure at 6m mining height If one pillar was to fail load transferred to adjacent pillars would reduce these adjacent pillars FoS and may well lead to the pillar failure and resultant subsidence observed at Duncan St
bull Based on the numerical results obtained using two mining heights the pillar and overburden failure is in line with analytical predictions from Pressure Arch theory and UNSW pillar strength calculation
bull Surface subsidence predicted from the 9m mining height numerical model is 196m While this value is in general agreement with monitoring data the model is not sufficiently calibrated since the real mining height in the region is unknown to be able to confidently predict final subsidence strains and tilts
bull With 1MPa cohesive backfill at a fill ratio of 83 the predicted strength increase is 70 With non-cohesive backfill at the same fill ratio the strength increase is 20 these values are in agreement with single pillar studies
bull Abutment stresses in the immediate roof sandstone unit (above the coal roof) are predicted to extend approximately 80m beyond the limits of the model This is in reasonable agreement with twice the load transfer distance of 64m (at 124m depth-of-cover) used to define a pillars zone of influence (the ZI also includes half pillar width ie 74m for 20m pillar)
A74 Numerical model of adjacent region
bull A numerical model of the region immediately to the east of the Duncan St failure region is constructed with 76 pillars
bull At 9m mining height the model predicts failure of 9 pillars but no significant overburden failure The model remains stable in general
bull With a 20 increase in gravity the model is predicted to fail
bull Numerical modelling results suggest the region to the east of the Waterline barrier pillar is stronger by approximately 20 than the subsided region to the west of the barrier pillar
bull Predicted surface subsidence (including compressive effects from gravity increase) is 13m all though numerical instabilities halt the model and true surface subsidence is likely to be higher
bull Inspection of yield at mid-pillar height suggests the southern pillars in the model have intact core when pillars in the middle of the region are failed in their entire volume In reality the southern region of this panel have greater depth-of-cover therefore higher pillar stresses and thus lower FoS in these southern pillars

Pilla
r stre
ngth
(MP
a)
11
10
9
8
7
6
5
S amp M combined
Numerical results
15 20 25 30 35 40 45 wh ratio
Figure A-9 FLAC3D parametric study to match pillar strength with the analytical formula of Salamon amp Munro (combined Australian and South African version)
A4 PILLAR STRENGTH INCLUDING FULL STRESS STRAIN CURVE AND PILLAR SHAPE EFFECTS
A41 Post peak strength
Das [Das 1986] has presented work on the post peak strength for Indian coals at various width-to height ratios His results show some variability but have a general correlation between post peak strength and increasing wh ratio Beyond a certain wh ratio of approximately 5 to 8 Dasrsquos results predict that samples start to harden with increasing strain
Figure A-10 Post peak strength of Indian coal at various width-to-height ratio after Das 1986
The numerical model of a square pillar of side length 20m and variable height was compressed to approximately 10 strain to investigate post peak behaviour with increasing wh ratio for comparison with results of Das in Figure A-10 The numerical results are plotted in Figure A-11 for various width to height ratios in the range of 10 strain The post peak pattern is similar to those of Das in Figure A-10 although the numerical hardening starts at lower strains
variable height (h)
000
500
1000
1500
2000
2500
3000
000 002 004 006 008 010
Strain
Ave
rage
pill
ar s
tres
s (M
Pa)
WH=20
WH=25 WH=29 WH=33
WH=40 WH=50
WH=67 WH=100
Figure A-11 Post peak failure behaviour of numerical pillars of constant width w = 20m but
Results from the modelling of the full stress strain curve of a 20m square pillar is used to estimate the stress redistributed to neighbouring pillars in the empirical estimation of pillar FoS for the CSIRO Hazard Maps At 4 strain the percentage of peak strength carried by the coal pillar is approximated from Figure A-11 in Figure A-12 where conservatively it is assumed pillars cannot harden but only soften or retain strength
00
200
400
600
800
1000
1200
20 40 60 80 100
Width to height ratio
R e s
idua
l s tr
e ngt
h (
)
residual strength
Figure A-12 Estimation of pillar residual strength at 4 strain
A42 Pillar shape influence on strength
Collingwood Park has many pillars of regular and irregular shapes including square rectangle diamond triangular and other polygon shapes A study of some of these shapes at fixed 6m mining height was conducted
As discussed in [Galvin 1981] with reference to physical models there is a subtle difference in model response at specific width to height ratios depending on whether the width or height of the model is fixed This variation is attributed by Galvin to volume stiffness and pillar end effect variation between width and height changes In the Collingwood Park single pillar studies generally the width is fixed at 20m and width-to-height changes are achieved with height variations and material properties are calibrated to this In studies of diamond and other shaped pillars where the width or effective width varies a unique set of material properties calibrated over width-to-height 2 to 4 at fixed height is developed Table A-3
Attempt is made to keep the constant 05m cube element size although for some of the shapes studied this is not possible and where meshing options exist priority is given to minimizing the variability from the standard element size Ideally the soften rate of the yield criteria would be adjusted based on an element characteristic length Implementation of this reduced mesh dependent errors but it was not felt sufficiently rigorous for inclusion in this report
Table A-3 Cohesion and friction for calibrated model at wh 2 to 4 with fixed 6m pillar height
Property Original value (MPa)
Cohesion
Softening rate ()
Residual value (MPa)
Original value (deg)
Friction Angle
Softening rate ()
Residual value (deg)
Dilation Angle (deg)
Coal 123 35 023 360 05 300 60
Diamond shaped pillars
Diamond pillar shapes located at Duncan St and adjacent areas have typical dimensions of side length 20-30m and minimum acute internal angles of 50 degrees
The area perimeter or circumference (C) of a diamond shape is given by
Circumference = C = 4 w
where w is the side length If the acute internal angle is θ the area can be calculated as follows
Area = A = w2 sin θ
The minimum width or thickness of the cross section is
Minimum width = w sin θ
Hence the effective width weff from the analogy of ldquohydraulic radius = 4ACrdquo defined earlier is given by
weff = 4AC = w sin θ = minimum width
Figure A-13 Predicted pillar strength for diamond shaped pillars at 6m mining height Error at 50 deg internal angle is approximately 6
Polygon with one acute corner
Figure A-14 (a) and (b) show a comparison between theory and numerical model for a polygon with one acute angle
(a) (b)
Figure A-14 (a) Polygon with one acute side (60deg acute angle in figure) Base side length = 40m short side 20m mining height = 6m and (wh 44-38)
Rectangular pillar being split at mid-length in 1m increments
A rectangular pillar of 30m by 10m is modelled as it is split by a 5m roadway
(a) (b)
Figure A-15 (a) Rectangle 30m by 10m being split in 1m increments Note symmetry plane on left hand boundary Mining height 6m (b) Results from numerical model and Strength formula with w=4AC
Triangular shape pillars with two equal sides of 20m
In this example a triangular pillar with two sides of equal length of 20m is analysed
(a) (b)
Figure A-16 (a) Triangular pillar of two equal sides of 20m each Mining height 6m (b) Results from numerical model and strength formula with w=4AC Maximum error is approximately 5
Observations from study of pillar shapes
The general conclusion from the study of pillar shapes at fixed 6m mining heights is that the hydraulic radius analogy of Wagner Equation (4) where the effective width is estimated by area and circumference is applicable to pillars of Westfalen No 3 colliery Errors with this approach at calculating pillar width for width-to-height ratios from approximately 2 to approximately 4 for the shapes studied are under 6
A43 Realistic roof geology
It is recognised that the idealised roof and floor of the pillar model Figure A-7 may have an influence on the predicted strength estimation To quantify this effect a model of a 20m square pillar at width-to-height ratiorsquos of 22 to 4 is analysed with a realistic roof geology
Based on the sonic logging data in borehole CP-C02 located in the failure region of Duncan Street Figure A-17 pillar strength is estimated from a numerical model with the model input parameters selected from the scanned roof geological and geotechnical data The input data are listed in Error Reference source not found and Table A-4 The F3D mesh for a pillar analysis is shown in Figure A-18 and the numerical results for two set of parameters for roof geology are shown in Figure A-19
Table A-4 Mechanical properties of roof and overburden rocks
Youngs Poissonrsquos UCS Tensile Strength CohesionBackfill Modulus Friction Angle (deg)Ratio (MPa) (MPa) (MPa)(GPa)
Sandstone 135 012 25 25 6648 40
Siltstone 195 020 15 15 4728 38
Interbedded 166 017 20 20 2808 38
Mudstone 875 026 10 10 1943 30
UCS Depth (m) (MPa) Geology Scaled UCS (MPa) 1005 7500 sandstone1 2500 1010 1015
6000 6750
interbedded1 2000 2250
1020 1025
7500 9000
sandstone2 2500 3000
1030 6750 interbedded2 2250 1035 4500 siltstone1 1500 1040 5250 interbedded3 1750 1045 4500 siltstone2 1500 1050 1055
225 2250
coal1 750 750
1060 1065
8250 9000
sandstone3 2750 3000
1070 3750 siltstone3 1250 1075 5250 1750 1080 6000 interbedded4 2000 1085 6000 2000 1090 3750 siltstone4 1250 1095 3000 1000 1100 3000 mudstone1 1000 1105 3000 1000 1110 3750 1250 1115 4500 siltstone5 1500 1120 3750 1250 1125 2000 coal2 667 1130 5250 interbedded5 1750 1135 7500 sandstone4 2500 1140 1145
6000 5250
interbedded6 2000 1750
1150 8250 2750 1155 9000 3000 1160 10500 3500 1165 13500 4500 1170 10500 sandstone5 3500 1175 10125 3375 1180 10500 3500 1185 9750 3250 1190 7500 2500 1195 3750 siltstone6 1250 1200 1500 coal3 500 1205 1210
7875 8625
sandstone6 2625 2875
1215 5250 interbedded7 1750 1220 1225
9000 10500
sandstone7 3000 3500
1230 6000 interbedded8 2000 1235 3000 mudstone2 1000 1240 3750 siltstone7 1250
Figure A-17 Sonic log of borehole CP-C02 and roof geological interpretation
Figure A-18 Numerical model of a coal pillar with representative floor and roof rock geology
4 5 6 7 8 9 10 Pillar height (m)
Figure A-19 Comparisons of pillar strength versus pillar height for realistic and simplified roof geology Maximum error is 45
Modelling predicted that the maximum difference in pillar strength for two different roof geology conditions is approximately 45 at the lower height of 6m reducing to less than 1 for pillars of 9m mining height
It is concluded from this study that the simplified roof and floor model satisfactorily estimates pillar strength allowing in excess of 180 numerical models to be analysed in a timely manner
60
65
70
75
80
85
90
95
100
105
Pilla
r str
engt
h (M
Pa)
Assumed geology
Real geology
A44 Pillars surrounded by roadways of variable height
It was observed in the 1983 pillar site investigation [Hollingworth Dames amp Moore 1990] that mining heights at Westfalen No 3 are extremely variable with roadways surrounding individual pillars varying by up to 2m
To investigate the strength of pillars of variable height a 20m wide square model pillar of 8m mining height on one side and 6m height on the directly opposite side of the pillar as shown in Figure Ashy20 has been analysed
Figure A-20 Different views of the numerical modelling mesh of a trapezoidal-square pillar - Model is 8m high on one side and 6m on the other opposite side
Predicted strength of the variable height pillar together with stress-strain curves for pillars of 6m 7m and 8m mining heights presented in Figure A-21 As shown in the figure the predicted strength of a non-uniform-height pillar of trapezoidal shape having 6m and 8m side heights approximates a uniform-height pillar with a constant height of 7m
0
1
2
3
4
5
6
7
8
9
10
Axia
l stre
ss (M
Pa)
Trapezoid pillar
6m pillar 7m pillar
8m pillar
0000 0010 0020 0030 0040 0050
Axial strain
Figure A-21 Stress vs strain curves for rectangular uniform height and trapezoidal non-uniform height pillars Strength of uniform pillars having heights of 6m 7m and 8m are compared with a trapezoidal non-uniform height pillar of having 6m height on one side and 8m on the other opposite side ie a variable height roadway of average 7m height
A45 Pillars created by multiple passes to variable depth
Roadways at Westfalen No 3 colliery were cut in multiple passes at a constant height of 24 m The cut widths were variable ranging from 52 m at the bottom to 76 m at the top as shown schematically in Figure A-22 by the mine managerrsquos hand drawings of the roadway mining method
To asses the strength of such pillars a 9 m high pillar with irregular side surface boundary is modelled Figure A-23 The model pillar has a square base of 23m and side length with three lsquocutsrsquo in its height as shown in Figure A-23
Predicted strength is approximately equal to a similar pillar with effective width equal to minimum width ie 20m in this case Figure A-24
Figure A-22 Sketch of roadways at Collingwood Park showing multiple passes or layers of cutting of the coal seam(from previous mine managersrsquo notes and records)
Figure A-23 Numerical modelling of a multi-pass cut pillar of 9 m height with minimum and maximum side widths of 20m and 23m respectively
0
1
2
3
4
5
6
7
8
Axi
al s
tres
s (M
Pa)
irregular pillar-min w idth 20m high and 9m w ide
square pillar-20m w ide and 9m high
0000 0005 0010 0015 0020 0025 0030 0035 0040
Axial strain
Figure A-24 Stress vs strain curves for pillars of 9m height with regular and irregular square cross-section (Figure A-23) Difference in peak strength predicted to be approximately 35
A5 ROADWAY BACKFILL AND PILLAR STRENGTH IMPROVEMENT
A literature review of backfill applications mechanical properties and behaviours in coal mining identified several examples from China [Guo 2007 Wang 2009] where backfill has been used to reduce surface subsidence from America [Tesarik 2002 2009] where backfill has been used primarily for disposal of fly-ash and reduce acid mine drainage and from Australia [Origin Alliance 2008] - See Table A-5 and the reference list
In the early stages of this modelling specific data and backfill effects and properties required in this numerical study were unavailable and therefore two cases were considered a cohesive backfill having a UCS of 1 MPa and a non-cohesive backfill with no cohesion but a friction angle of 42 degrees Subsequent to these two cases a case of 05MPa cohesive backfill mix was also considered
Backfill properties using in this study are list in
Table A-6
Table A-5 Backfill properties data from various sources
Composition UCS (MPa) E (GPa) Reference
Solid waste including fly-ash 05 initially
to 14-17
0565 Guo et al 2007
Fly-ash amp cement 339 ndash 824 Guo et al 2007
1 4 15 (cement) (fly-ash) (coal
gangue)
07 ndash 17 Wang et al 2009
Fly ash (dry) Scheetz 2009
22 1 (fly-ash) (cement) Scheetz 2009
Cemented rockfill in metal mine 69 1909 Tesarik 2009
Required properties 10 10 OriginAlliance ndash Mine
subsidence interpretive
reporting
P16
25 FA 105 sand 01 bentonite
5 FA 18 sand
Injection 3m intervals
Bell Bruyn 1999
Table A-6 Mechanical parameters of cohesive and non-cohesive backfill used in this numerical
study
Backfill Youngs Modulus (GPa)
Poissonrsquos Ratio UCS
(MPa)
Tensile Strength (MPa)
Cohesion (MPa)
Friction Angle (deg)
Dilation Angle (deg)
1MPa
Cohesive 0565 040 10 01 0117 400 100
05MPashy
cohesive 0565 040 05 005 0061 400 100
Non-
cohesive 0020 015 00 00 0000 420 75
A51 Numerical results and analysis
In order to quantify the influence of backfill on pillar strength in detail 180 models (60 models each for 1MPa 05MPa cohesive and non-cohesive backfill) of square coal pillars were analysed with the following parameters pillar width is 20m mining height is from 5m to 10m equivalent to a wh ratio of 2 to 4 percentage of backfill is from 0 to 90 Table A-7 summarises the results of these pillar strength analyses for all the cohesive and non-cohesive cases
Relationship between pillar strength and percentage of roadway backfill is presented in Figure Ashy25 Figure A-27 and Figure A-29 The raw data from Table A-7 has been calculated in uniform 10
backfill increments and is presented in Figure A-26 Figure A-28 and Figure A-30 As shown in these figures the percentage increase in pillar strength is approximately bilinear with increase in backfill
00
200
400
600
800
1000
1200
1400
1600 P
illar
stre
ngth
incr
ease
()
5m 6m 7m 8m 9m 10m
00 100 200 300 400 500 600 700 800 900 1000
Percentage of bacfill ()
Figure A-25 Pillar strength increase versus percentage of 1MPa cohesive backfill
00
200
400
600
800
1000
1200
1400
1600
Pill
ar s
tren
gth
incr
ease
()
10 backfill
20 backfill
30 backfill
40 backfill
50 backfill
60 backfill
70 backfill
80 backfill
90 backfill
4 5 6 7 8 9 10 11 12 Pillar height (m)
Figure A‐26 Pillar strength increase versus pillar height for 1MPa cohesive backfill
Table A-7 Pillar strength with increasing 1MPa and 05MPa cohesive backfill and non-cohesive backfill
Pillar strength Backfill
Approximate percentage of backfill
() 5 6
Pillar height (m)
7 8 9 10 Pillar
strength Without backfill 0 1007(00) 894(00) 795(00) 714(00) 647(00) 596(00)
(MPa) for different percentshyage of
10 20 30
1049(100) 1104(200) 1140(300)
940(83) 983(167)
1069(333)
833(71) 909(214) 947(286)
785(125) 820(188) 889(313)
720(111) 771(222) 803(278)
650(100) 710(200) 758(300)
backfill 1MPa 40 1205(400) 1130(417) 1046(429) 929(375) 869(389) 824(400)
Cohesive 50 1234(500) 1178(500) 1095(500) 1016(500) 943(500) 894(500) backfill 60 1292(600) 1208(583) 1143(571) 1098(625) 1009(611) 956(600)
70 1342(700) 1271(667) 1270(714) 1158(688) 1120(722) 1035(700) 80 1466(800) 1442(833) 1350(786) 1345(813) 1309(833) 1180(800) 90 1593(900) 1580(917) 1556(929) 1470(875) 1440(889) 1400(900) 10 1026(100) 930(83) 830(71) 773(125) 697(111) 636(100) 20 1081(200) 968(167) 896(214) 803(188) 754(222) 687(200) 30 1132(300) 1053(333) 939(286) 871(313) 786(278) 741(300)
05MPa 40 1184(400) 1098(417) 1018(429) 901(375) 853(389) 799(400) Cohesive 50 1217(500) 1141(500) 1065(500) 1000(500) 936(500) 873(500)
backfill 60 1240(600) 1167(583) 1102(571) 1054(625) 1009(611) 954(600) 70 1269(700) 1189(667) 1237(714) 1093(688) 1044(722) 1014(700) 80 1322(800) 1280(833) 1167(786) 1143(813) 1105(833) 1061(800) 90 1410(900) 1350(917) 1250(929) 1202(875) 1150(889) 1120(900)
Non-cohesive backfill
10 20
1016(100) 1028(200)
902(83) 912(167)
801(71) 819(214)
724(125) 732(188)
657(111) 670(222)
604(100) 615(200)
30 1044(300) 941(333) 832(286) 753(313) 678(278) 629(300)
Pillar strength Backfill
Approximate percentage of backfill
() 5 6
Pillar height (m)
7 8 9 10
40 1063(400) 961(417) 865(429) 767(375) 702(389) 649(400) 50 1086(500) 984(500) 885(500) 800(500) 729(500) 670(500) 60 1113(600) 1006(583) 904(571) 835(625) 760(611) 696(600) 70 1138(700) 1030(667) 943(714) 852(688) 792(722) 725(700) 80 1168(800) 1083(833) 963(786) 889(813) 829(833) 765(800) 90 1206(900) 1130(917) 1029(929) 913(875) 852(889) 804(900)
Figure A-27 Pillar strength increase versus pillar height for 05MPa cohesive backfill
4 5 6 7 8 9 10 11 12 13 Pillar height (m)
Figure A-28 Pillar strength increase versus percentage of 05MPa cohesive backfill
0
10
20
30
40
50
60
70
80
90
100
Pilla
r st
reng
th in
crea
se (
) 10 backfill
20 backfill
30 backfill
40 backfill
50 backfill
60 backfill
70 backfill
80 backfill
90 backfill
00
50
100
150
200
250
300
350
400
Perc
enta
ge o
f pill
ar s
tren
gth
incr
ease
()
5m
6m
7m
8m
9m
10m
00 100 200 300 400 500 600 700 800 900 1000
Percentage of bacfill ()
Figure A-29 Pillar strength increase versus percentage of non-cohesive backfill
00
50
100
150
200
250
300
350
400
Pilla
r st
reng
th in
crea
se (
)
10 backfill
20 backfill
30 backfill
40 backfill
50 backfill
60 backfill
70 backfill
80 backfill
90 backfill
4 5 6 7 8 9 10 11 12 Pillar height (m)
Figure A-30 Pillar strength increase versus pillar height for non-cohesive backfill
The modelling results suggest that the pillar strength will increase with increasing roadway backfill while the percentage increase of pillar strength is greater for the taller pillars than squat pillars it is observed that when the backfill is less than 40-50 the pillar strength increase is less sensitive to pillar height or wh ratio while over 40-50 backfill pillar strength rapidly increase with pillar height
A52 Comparison of three different kinds of backfill
Pillar strength improvement with 05 and 10 MPa cohesive backfill and non-cohesive backfill is presented in Figure A-31 to Figure A-33
0
10
20
30
40
50
60
70
Incr
ease
of p
illar
str
engt
h (
) 5m-00MPa
5m-05MPa
5m-10MPa
0 10 20 30 40 50 60 70 80 90 100
Percentage of backfill ()
Figure A-31 Comparison of 05 and 10 MPa cohesive backfill and non-cohesive backfill at 5m mining height
0
20
40
60
80
100
120
Incr
ease
of p
illar
str
engt
h (
)
7m-00MPa
7m-05MPa
7m-10MPa
0 10 20 30 40 50 60 70 80 90 100
Percentage of backfill ()
Figure A-32 Comparison of 05 and 10 MPa cohesive backfill and non-cohesive backfill at 7m mining height
Incr
ease
of p
illar
str
engt
h (
)
140
120
100
80
60
40
20
0
9m-00MPa
9m-05MPa
9m-10MPa
0 10 20 30 40 50 60 70 80 90 100
Percentage of backfill ()
Figure A-33 Comparison of 05 and 10 MPa cohesive backfill and non-cohesive backfill at 9m mining height
Modelling predicts that 05MPa is as effective as 10MPa at increasing pillar strength below approximately 50-60 roadway fill Modelling suggests that cohesive backfill is more effective at increasing pillar strength than non-cohesive fill
A53 Numerical study of the influence of interface between backfill and pillar
To investigate the influence of an interface between backfill and pillar on the strength response of coal pillar an interface is set between backfill and pillar as shown in Figure A-34 The interface property is list in Table A-8
Figure A-34 Sketch showing the position of interface between backfill and pillar
2
4
6
2
4
6
Table A-8 Mechanical parameters of interface used in numerical model
Interface Cohesion FrictionNormal stiffness (GPa) Shear stiffness (GPa) property (MPa) Angle (deg)
Value 20 20 0 5~40
Pillar strength of a 6m high pillar as interface friction angle is increased from 5 degrees to 40 degrees is displayed in
1212
1010
88
cohesive backfill with interface
cohesive backfill without interface
non-cohesive backfill with interface
non-cohesive backfill without interface
4 cohesive backfill with interface
cohesive backfill without interface
non-cohesive backfill with interface
non-cohesive backfill without interface
stre
ss (M
Pa)
stre
ss (M
Pa)
6
2
00 0000 0005 0010 0015 0020 0025 0030 0035 0040 0045 0000 0005 0010 0015 0020 0025 0030 0035 0040 0045
strain strain
Figure A-35 to Figure A-38
Modelling predicts a non-cohesive interface with friction angle below 20 degrees results in a slight reduction in pillar strength above 20 degrees the interface is predicted to have little influence on pillar strength
cohesive backfill with interface
cohesive backfill without interface
non-cohesive backfill with interface
non-cohesive backfill without interface
1212
1010
88
cohesive backfill with interface
cohesive backfill without interface
non-cohesive backfill with interface
non-cohesive backfill without interface
stre
ss (M
Pa)
stre
ss (M
Pa)
6
4
2
0 0
0000 0005 0010 0015 0020 0025 0030 0035 0040 0045 0000 0005 0010 0015 0020 0025 0030 0035 0040 0045
strain strain
Figure A-35 Post peak pillar for 6m high pillar (wh=33) with friction angle 5deg on left 10deg on right of interface between backfill and pillar
2
4
6
cohesive backfill with interface
cohesive backfill without interface
non-cohesive backfill with interface
non-cohesive backfill without interface
1212
1010
88
cohesive backfill with interface
cohesive backfill without interface
non-cohesive backfill with interface
non-cohesive backfill without interface
stre
ss (M
Pa)
stre
ss (M
Pa)
6 6
44
2 2
0 0 0000 0005 0010 0015 0020 0025 0030 0035 0040 0045 0000 0005 0010 0015 0020 0025 0030 0035 0040 0045
strain strain
Figure A-36 Post peak pillar for 6m high pillar (wh=33) with friction angle 15deg on left 20deg on right of interface between backfill and pillar
12
cohesive backfill with interface
cohesive backfill without interface
non-cohesive backfill with interface non-cohesive backfill without interface
12
10 10
8 8
cohesive backfill with interface
cohesive backfill without interface
non-cohesive backfill with interface
non-cohesive backfill without interface
stre
ss (M
Pa)
stre
ss (M
Pa)
6 6
4 4
2 2
0 0 0000 0005 0010 0015 0020 0025 0030 0035 0040 0045 0000 0005 0010 0015 0020 0025 0030 0035 0040 0045
strain strain
Figure A-37 Post peak pillar for 6m high pillar (wh=33) with friction angle 25deg on left 30deg on right of interface between backfill and pillar
12
cohesive backfill with interface
cohesive backfill without interface
non-cohesive backfill with interface non-cohesive backfill without interface
12
10 10
8 8
cohesive backfill with interface
cohesive backfill without interface
non-cohesive backfill with interface
non-cohesive backfill without interface
stre
ss (M
Pa)
stre
ss (M
Pa)
6
4
2
0 0000 0005 0010 0015 0020 0025 0030 0035 0040 0045
0 0000 0005 0010 0015 0020 0025 0030 0035 0040 0045
strain strain
Figure A-38 Post peak pillar for 6m high pillar (wh=33) with friction angle 35deg on left 40deg on right of interface between backfill and pillar
22
6
8
24
A54 Post peak pillar strength
A full stress strain curve to approximately 35 strain is presented in the following figures for 1MPa cohesive and non-cohesive backfill Results for 05MPa cohesive backfill sit approximately mid-way between these two cases and are included in the summary Table A-9
24 24
0000 0010 0020 0030 0040 0050
Average axial strain of coal pillar
000
2000
3000
4000
5000
6000
7000
8000
9000
22
0000 0010 0020 0030 0040 0050
Average axial strail of coal pillar
000
2000
3000
4000
5000
6000
7000
8000
9000
20 20
18
Ave
rage
str
ess
of c
oal p
illar
(MPa
)
Ave
rage
str
ess
of c
oal p
illar
(MPa
)
18
16 16
1414
12 12
1010
88
66
44
22
00
Figure A-39 Post peak pillar strength with increasing backfill 5m high pillar (wh=40) with 1MPa cohesive backfill on left non-cohesive backfill on right
24
22
0000 0010 0020 0030 0040 0050
Average axial strain of coal pillar
00
250
333
417 500
583
667 833
917
22
0000 0010 0020 0030 0040 0050
Average axial strain of coal pillar
00
250 333
417
500 583
667
833
917
20 20
Ave
rage
str
ess
of c
oal p
illar
(MPa
)
18 18
16 16
14 14
12 12
10 10
8
6
4 4
2 2
0 0
Figure A-40 Post peak pillar strength with increasing backfill 6m high pillar (wh=33) with cohesive backfill on left non-cohesive backfill on right
Aver
age
stre
ss o
f coa
l pill
ar (M
Pa)
4
6
8
10
12
14
16
18
2
4
6
8
0000 0005 0010 0015 0020 0025 0030 0035 0040 0045
Average axial strain of coal pillar
000
2140
2860
4290
5000
5710
7140
7860
9290
2020
0000 0005 0010 0015 0020 0025 0030 0035 0040 0045
Average axial strain of coal pillar
000
2140
2860
4290
5000
5710
7140
7860
9290
18
Ave
rage
str
ess
of c
oal p
illar
(MPa
) A
vera
ge s
tres
s of
coa
l pill
ar (M
Pa)
Aver
age
stre
ss o
f coa
l pill
ar (M
Pa) 16
14
12
10
8
6
4
22
00
Figure A-41 Post peak pillar strength with increasing backfill 7m high pillar (wh=29) with cohesive backfill on left non-cohesive backfill on right
14 14
0
000
2500
3130
3750
5000 6250
6880
8130
8750
0
000
2500
3130
3750
5000
6250
6880
8130
8750
12 12
10
Ave
rage
str
ess
of c
oal p
illar
(MPa
)
10
8
6
4
2
0000 0010 0020 0030 0040 0050 0000 0010 0020 0030 0040 0050
Average axial strain of coal pillar Average axial strain of coal pillar
Figure A-42 Post peak pillar strength with increasing backfill 8m high pillar (wh=25) with cohesive backfill on left non-cohesive backfill on right
2
4
6
8
10
12
14
2
4
6
8
14
12
Ave
rage
str
ess
of c
oal p
illar
(MPa
) A
vera
ge s
tres
s of
coa
l pill
ar (M
Pa)
0
000 2220 2780 3890 5000 6110 7220 8330 8890
0
000 2220 2780 3890 5000 6110 7220 8330 8890
Ave
rage
str
ess
of c
oal p
illar
(MPa
)
10
8
6
4
2
0000 0005 0010 0015 0020 0025 0030 0035 0040 0000 0005 0010 0015 0020 0025 0030 0035 0040
Average axial strain of coal pillar Average axial strain of coal pillar
Figure A-43 Post peak pillar strength with increasing backfill 9m high pillar (wh=22) with cohesive backfill on left non-cohesive backfill on right
12 12
0
000 2500
3000 4000
5000 6000
7000 8000
9000
0
000
2500
3000
4000
5000
6000
7000
8000
9000
10
Ave
rage
str
ess
of c
oal p
illar
(MPa
) 10
8
6
4
2
0000 0005 0010 0015 0020 0025 0030 0035 0000 0005 0010 0015 0020 0025 0030 0035
Average axial strain of coal pillar Average axial strain of coal pillar
Figure A-44 Post peak pillar strength with increasing backfill 10m high pillar (wh=20) with cohesive backfill on left non-cohesive backfill on right
The amount of backfill to achieve the transition between strain softening and hardening is presented in Table A-9 for all mining height The values in this table are estimated from the stress-strain curve analysed to 35 of strain and are depended on the backfill increment which is in turn dependent on the ratio of mining height to the calibrated element size 05m
Table A-9 Percentage of roadway backfill that leads to a transition from strain softening to hardening
Pillar height Non-cohesive 05MPa Cohesive 10MPa Cohesive backfill backfill backfill
5m 300 200 200
6m 500 417 333
7m 571 500 429
8m 625 625 500
9m 722 722 611
10m 800 800 700
The modelling results suggest that the average axial stress of coal pillar increases with compression until peak stress is reached In the post-failure region pillar stress is reduced as strain increases for all models without backfill All the model results predict that there would be a change to strain hardening behaviour as percentage of backfill increases For example this transition point is 333 for 10 MPa cohesive backfill while 50 for non-cohesive backfill with 6m mining height as shown in Table A-9 It can also be seen from Table A-9 that tall pillars need more backfill than squat pillars to achieve the change from strain softening to hardening for either cohesive backfill or non-cohesive backfill
A55 Backfill for diamond shaped pillars
A 7m high diamond shaped pillar with 50 degree skew angle is analysed with increasing level of backfill in surrounding roadways On the skewed angle the backfill is constrained with roller boundary conditions normal to the skewed angle to represent symmetry conditions and a 5m wide roadway
Figure A-45 Numerical model of diamond shaped pillar with backfill on left and boundary conditions on right
The predicted strength of a diamond shaped pillar and equivalent square pillar with increasing roadway backfill of both cohesive and non-cohesive models is presented in Figure A-46 and Figure A-47
6
7
8
9
10
11
12
13
0 10
Pilla
r str
engt
h (M
Pa)
20 30 40 50 60 70 80 90 100
Percentage of backfill ()
Skew pillar
Square pillar
0
10
20
30
40
50
60
70
0 10
Incr
ease
of p
illar
str
engt
h (
)
20 30 40 50 60 70 80 90 100
Percentage of backfill ()
Skew pillar
Square pillar
Figure A-46 Predicted pillar strength of diamond and square shaped pillars with increasing percentage of 1MPa cohesive backfill On left is absolute strength and on right is percentage strength increase
6
7
8
9
10
11
0 10
Pilla
r stre
ngth
(MP
a)
20 30 40 50 60 70 80 90 100
Percentage of backfill ()
Skew pillar
Square pillar
0
5
10
15
20
25
30
35
0 10
Incr
ease
of p
illar
str
engt
h (
)
20 30 40 50 60 70 80 90 100
Percentage of backfill ()
Skew pillar
Square pillar
Figure A-47 Predicted pillar strength of diamond and square shaped pillars with increasing percentage of non-cohesive backfill On left is absolute strength and on right is percentage strength increase
A56 Backfill placed after significant pillar yield
A pillar model with 90 non-cohesive backfill placed after yielding of a 7m high pillar is presented in Figure A-48 The percentage of strength increase is given in Table A-10 It is found that the pillar strength increase is lower if the pillar has undergone significant deformation before the placement of backfill It is predicted that 90 backfill results in a strain-hardening pillar behaviour even if the pillar has previously yielded significantly
Ave
rage
stre
ss o
f coa
l pill
ar (M
Pa)
18 without backfill 025 strain 050 strain
14
16
075 strain 100 strain
12 125 strain 150 strain
10 175 strain 200 strain
8
6
4
2
0 0000 0005 0010 0015 0020 0025 0030 0035 0040 0045 0050
Average strain of coal pillar
Figure A-48 Stress strain curves for backfill placed around the pre-strained pillar displaying state of pillar core upon placement of backfill
Table A-10 Pillar strength increase with 90 non-cohesive backfill placed around a pre-strained 7m high square pillar of 20m width
Percentage backfill ()
Strain at placement of non-cohesive backfill ()
Pillar strength (MPa)
Percentage increase in peak
strength ()
Percentage increase in post-peak
strength at 3 strain ()
0 000 7953 000
90 000 10290 2939
90 025 9156 1513
90 050 8965 1272
90 075 8526 720
90 100 7945 26006
90 125 7951 22608
90 150 7951 18917
90 175 7951 15629
90 200 7951 11134
A6 3D MODEL OF DUNCAN ST FAILURE PANEL
A61 Numerical model
A three dimensional model of 46 pillars in the Duncan St subsidence region has been analysed with over burden geology based on hole CP1 and a constant overburden depth of 124m Figure A-49 Figure A-50 and Figure A-51 Uniform mining heights of 6m and 9m have been analysed
Selection of the pillars to be analysed is based on visual inspection of the panel layout and includes pillars bounded by unmined coal to the west the waterline barrier pillar to the east larger pillars to the south and a panel of slightly larger pillars of different orientation to the north
One row of pillars in the middle of this panel trending from north-west to south-east are of smaller dimension than the average and of diamond shape with acute internal angle of approximately 50degrees Being in the approximate middle of the panel close to full tributary area load will be mobilised on this row of pillars and therefore it is believed pillars in this row initiated the 2008 subsidence event
The Duncan Street numerical model has the following objectives
bull Estimation of pillar stresses and FoS for comparison with empirical formula
bull Comparison of backfill response at panel scale with previous single pillar studies
bull Estimation of surface subsidence at given percentage roadway fill
bull Estimation of extent of abutment stresses due to panel failure
A62 Observations from Duncan Street numerical model
bull At 6m mining height the minimum pillar FoS for these 46 pillars is calculated to be 131 using Pressure Arch theory and UNSW strength formula panel failure is not predicted with this mining height by the model At 9m mining height the minimum FoS is calculated as 099 and panel failure is predicted to occur
bull The probability of pillar failure for associated FoS calculated by the UNSW pillar strength formula Eq(2) is given in Galvin 2006 in Table A-11 The relationship was developed for square pillars using the Australian pillar database and tributary area theory and hence theoretically speaking may not directly apply to this study However it can be taken as a general guide
bull From Table A-11 it is seen that there is a 1 in 20 probability of instability at 6m mining height and a 1 in 2 probability at 9m mining height Numerical modelling is however a deterministic approach and it always predicts failure if the FoS is less than 10 and stability if FoS gt 10 since no variation in geotechnical properties or conditions is used
bull Although our numerical models predict no pillar failure at 6m and panel failure at 9m in reality there remains approximately a 1 in 20 chance of failure at 6m mining height If one pillar was to fail load transferred to adjacent pillars would reduce the FoS of these adjacent pillars and could lead to the pillar failure and subsidence as observed at 2008 event region
Table A-11 Factor of safety failure probabilities for UNSW pillar strength formula
(after Galvin 2006)
Safety Factor Probability of pillar failure
087 8 10
100 5 10
122 1 10
130 5 100
138 2 100
144 1 100
163 1 1000
179 1 10000
195 1 100000
211 1 1000000
bull Based on the numerical results obtained using two mining heights the pillar and overburden failure is consistent with analytical predictions from Pressure Arch theory and UNSW pillar strength calculation
bull Surface subsidence predicted from the numerical model with a mining height of 9m is 196m While this value is in approximate agreement with monitoring data (14mshy15m) the model was not sufficiently calibrated since the real mining height in the region is uncertain to be able to confidently predict final subsidence strains and tilts at the site
bull With 1MPa cohesive backfill at a roadway fill ratio of 83 the predicted strength increase is 70 With non-cohesive backfill at the same fill ratio the strength increase is 20 These values are in agreement with the results for single pillars
bull The numerically predicted surface subsidence with 83 roadway fill is 022m Maximum predicted tilt in east-west direction is 7mmm and in north-south direction is 5mmm Analytical formula [Holla amp Barclay 2000] predict maximum tilt of 53mmm for this amount of subsidence
bull Isolated cohesive backfill surrounding pillars of low wh ratio is predicted to be effective in confining the pillar and increasing peak pillar strength and panel stability Isolated non-cohesive backfill without barriers could not be analysed in this numerical model as backfill lsquoflowsrsquo and numerical stability could not be achieved
bull Stress transfer in the immediate roof sandstone unit (above the coal roof) is predicted to extend approximately 80m beyond the limits of the collapsed panel This is in reasonable agreement with theoretical studies
Figure A-49 Duncan St modelled panel with outline of adjacent modelled panel location of representative open hole CP1 file named ldquoAppendix B2 open hole logsrdquo located in directory ldquoCollingwood Park Subsidence 2B Collingwood Park Mine Subsidence Reports 1988 Eventsrdquo and mine subsidence limit contour
A63 Model properties
Overburden geology is based on borehole CP1 the most complete interpreted available hole drilled in 1988 by Queensland Department of Mines Figure A-50 To include this in the numerical model lithological units had to be coalesced into major units of sandstone (SS) siltstone (SL) mudstone (MS) weathered units and coal Figure A-51
Rock properties for the overburden were determined from a 2D parametric study whereby the UCS of all units was scaled to achieve pillar and overburden failure at 8m mining height Table A-12 and Table A-13
Unit top depth thickness unit thickness
thickness scaled
thickness in model
000 1200 1200 1046 1000 1200 700 SS 700 610 600 1900 600 MS 600 523 500 2500 1100 SS 1300 1133 1100 3600 200 SS 000 3800 100 SL 1000 871 900 3900 100 MS 000 4000 500 000 4500 100 000 4600 100 000 4700 100 000 4800 100 SS 400 349 400 4900 300 SS 000 5200 300 SL 700 610 600 5500 100 MS 000 5600 300 MS 000 5900 400 SS 500 436 400 6300 100 SS 000 6400 400 SL SS 900 784 800 6800 100 SL MS 000 6900 100 SL 000 7000 200 SL MS 000 7200 100 SS SL 000 7300 200 SS 1000 871 900 7500 200 SL 000 7700 200 SS SL 000 7900 200 SS 000 8100 100 SL 000 8200 100 SS 000 8300 200 SL 4350 3790 3800 8500 200 SL 000 8700 100 SS 000 8800 100 COAL 000 8900 200 000 9100 100 000 9200 100 000 9300 100 SL MS 000 9400 300 SL MS SS 000 9700 100 000 9800 100 SL MS 000 9900 400 SL SS 000 10300 200 SS MS 000 10500 100 SL MS 000 10600 200 SL MS SS 000 10800 100 000 10900 400 SL MS 000 11300 400 SL SS 000 11700 100 SS MS 000 11800 300 000 12100 400 SL SS 000
SL MS MS SS
MS
MS
SL
MS SS SL SS SL MS MS
weathering
SL MS SS
12500 150 000 12650 450 850 741 750 13100 400 SS 000 13500 100 MS SL
SS SL 960 837 500
13600 200 13800 100 SS 13900 200 14100 360
SS SL SL MS
14460 470 COAL MINING SEAM 600 14930 FLOOR
Figure A-50 Inferred geology from representative borelog CP1 used in numerical model
weathering SS
Unit Depth floor below surface Num elements Unit Unit name in model surface 0
10 3 16 weather 16 2 15 ss6
MS 21 2 14 ms2 SS 32 4 13 ss5 SL 41 3 12 sl3 SS 45 1 11 ss4 MS 51 2 10 ms1 SS 55 1 9 ss3 SL 63 3 8 sl2 SS 72 3 7 ss2 SL 1055 11 6 sl1 SS 113 4 5 ss1 SEAMR 118 3 4 seamr SEAM 124 3 3 seam FLOOR1 134 3 2 floor2 FLOOR2 250 10 1 floor1
Figure A-51 Coalesced units for numerical model based on hole CP1
Insitu stress is unknown at the site so a horizontal to vertical stress gradient of 15 has been assumed Given that the extensive workings were undertaken 20 to 30 years before the 2008 event horizontal stresses in the mining seam would be considerably disturbed from the pre-mining conditions
Table A-12 Rock properties for softening mohr coloumb material Softening rates of coal friction angle is 6 degrees over 2 plastic strain and total loss of cohesion over 24 plastic strain in coal and over 1 in other rocks Determined from pillar studies
E
nu Bulk Shear UCS UCS Phi Dilation Coh Tensile Strength (GPa) (GPa) (GPa) (MPa) scaled angle (MPa) (MPa)
SS 75 02 4167 3125 50 125 40 2 291 125
SL 4 025 2667 1600 30 75 35 2 195 075
MS 3 025 2000 1200 15 375 32 2 104 0375
Weathering 1 025 0667 0400 8 2 32 2 055 02
COAL 11 03 0917 0423 12 3 36 6 076 003
FLOOR1 4 025 2667 1600 30 75 38 2 183 075
FLOOR2 4 025 2667 1600 30 75 38 2 183 075
Table A-13 Ubiquitous joint properties Softening rate of ubiquitous joints total loss of cohesion over 1 plastic strain Determined from 2D overburden studies
Cohesion Ubiq joint cohesion Tensile Strength Ubiq joint tensile strength Ubiq joint (MPa) (MPa) (MPa) (MPa) friction
SS 291 00029144 125 0000125 15 SL 195 00019521 075 0000075 15 MS 104 00010393 0375 00000375 15 Weathering 055 00005543 02 000002 15 COAL 076 003 FLOOR1 183 - 075 - -FLOOR2 183 075 -
A64 Results from 3D Duncan St model
Factor of Safety estimated at 6m and 9m mining heights
Figure A-52 Pillar FoS calculated for 6m mining height by analytical method with strength by eq(3) and pillar stress by pressure arch theory Minimum value is 131 suggesting a 5 in 100 probability of failure however not sufficient to fail in the numerical model (that requires FoS lt 10)
Figure A-53 Pillar FoS calculated analytically for 9m mining height (eq(3) and PA theory) Minimum value is 099 suggesting a probability of failure of 5 in 10 although in the numerical model failure should occur
Yield on plane for 6m and 9m mining heights
Figure A-54 Location of section plane used for section view in following figures
Figure A-55 Yield on section plane for 6m mining height No significant damage or displacement observed
Figure A-56 Yield on section plane for 9m mining height no backfill
Figure A-57 Displacement on section plane for 9m mining height no backfill Maximum displacement is approximately 15m at surface
Results on horizontal plane at mid-pillar height
Figure A-58 Yield at mid-pillar height 9m mining height Blue elements evident in some pillars indicating pillar core remains intact
Figure A-59 Predicted vertical stress at mid pillar height 9m mining height Insitu stress is 30MPa Unyielded pillars and pillars hardening after yield are transferring vertical load while yielded pillars carry little load Extent of abutment stress increase is approximately 80m
Figure A-60 Roof vertical stress predicted by numerical model with 9m mining height Contour increments are 01MPa Base vertical stress is approximately 27MPa Abutment stress influence distance is approximately 80m
Results on surface after panel failure at 9m mining height
Figure A-61 Surface subsidence as predicted with numerical model with 9m mining height and total subsidence along Duncan St to McLaughlin St as monitored to October 09 Maximum surface subsidence predicted as 196m Outline of numerical modelling pillars and dotted contour of observed subsidence limit
A65 Duncan St model ndash backfill effectiveness
The Duncan St 3D model has been analysed with full and targeted 1MPa cohesive and non-cohesive backfill placed in roadways Roadway fill of 66 is analysed for the 1MPa cohesive mixture and 83 roadway fill for the non-cohesive mix
Results are presented in the following figures and figure captions
Factor of Safety increase from cohesive backfill
Analysis of the Duncan St model with 9m mining height is undertaken to estimate the FoS increase from backfill By increasing gravity in increments the backfill strength improvement is quantified With 83 roadway fill of 1MPa cohesive backfill the overburden and pillar tops (ie region of pillar above height of backfill) fails with gravity of 17ms2 suggesting the pillars with FoS of approximately 10 has increased FoS to 17 by backfilling adjacent roadways
Figure A-62 Gravity of 16g with 83 1MPa cohesive backfill showing no significant yield
Figure A-63 Gravity of 17g with 83 1MPa cohesive backfill predicting failure of pillar tops and overburden and collapse of roadway void space
FoS increase with non-cohesive backfill
With non-cohesive backfill pillars yielded due to lack of confinement upon initial placement of backfill in roadways but overburden remain stable and void space above backfill remained open Overburden remained stable at gravity increase to 11ms2 Figure A-64 but collapsed at gravity increase of 12ms2 Figure A-65
Figure A-64 Gravity of 11g with 83 non-cohesive backfill predicting pillar yield but overburden stability
Figure A-65 Gravity of 12g with 83 non-cohesive backfill predicting failure of pillars and overburden and collapse of roadway void space Maximum surface subsidence is 055m which includes the compressive effect of the 12g gravity increase
Placement of targeted backfill
A model is analysed with cohesive backfill totally surrounding two pillars with low predicted FoS The two pillars are predicted to have a FoS of 099 and 100 left to right viewed from above at a 9m mining height Backfill extends to an extent of 5m to 10m from the pillar and is 6m high in the roadways Gravity increase to 12g required to fail panel suggesting panel strength increase is approximately 20 from targeted backfill Predicted surface subsidence 125m (excessive mesh deformation stops analysis equilibrated stage may have higher surface subsidence)
Figure A-66 Duncan St model with 66 roadway fill of 1MPa cohesive backfill surrounding two pillars with low FoS at 9m mining height
Figure A-67 Predicted yield at mid pillar height of 9m pillars with 66 roadway fill of 1MPa cohesive backfill Note intact core (blue) for targeted pillars
Figure A-68 Pillar strength at 9m mining height Strength WITHOUT BACKFILL of northern focus pillar selected for targeted backfill is 527MPa and southern focus pillar is 526MPa
Figure A-69 Vertical stress in pillars targeted for partial backfill placement Stress calculated at equilibrium of elasto-plastic analysis WITHOUT BACKFILL Stress in northern focus pillar is 54MPa and in southern focus pillar is 513 FoS of NFP=52754 = 0975 FoS of SFP=526513 = 1025
Non-cohesive backfill in targeted placement study
A model with targeted placement of non-cohesive backfill was attempted but could not be satisfactorily converged since backfill lsquoflowsrsquo and inter-penetrates elements resulting in numerical instabilities
Forcing pillars to fail to examine resultant subsidence
To examine the extent of surface subsidence if backfilled pillars fail the numerical model with 9m mining height and 83 roadway fill of 1MPa cohesive backfill is analysed with a 90 reduction in coal pillar strength properties
With 9m mining height and 83 roadway fill of cohesive backfill void space remaining is 15m and the numerical model predicts failure of pillars and overburden results in approximately 02m surface subsidence
Figure A-70 Surface subsidence predicted by numerical model when pillars forced to fail with 83 roadway fill Contour interval is 01m with maximum subsidence predicted as 022m
Figure A-71 Surface strain in east-west direction when pillars forced to fail resulting 022m surface subsidence Maximum strain is 5mmm and contour interval is 1mmm
Figure A-72 Surface strain in north-south direction when pillars forced to fail resulting 022m surface subsidence Maximum strain is 3mmm and contour interval is 1mmm
Figure A-73 Tilt in east-west direction Units are mmm and intervals are 1mmm maximum tilt is 7mmm
Figure A-74 Tilt in north-south direction Units are mmm and intervals are 1mmm maximum tilt is 5mmm
To highlight the need for adequate fill the model with 66 roadway fill is analysed with the pillars forced to fail with a 50 reduction in pillar strength Void space over the backfill in the roadways is 30m Modelling predicts maximum surface subsidence of 068m
Figure A-75 Surface subsidence when pillars forced to fail with 66 roadway fill Roadway void space is 30m with the model predicting 068m surface subsidence Contour interval is 01m
A66 Numerical model of adjacent high risk area
Numerical model and panel stability
A numerical model of the region adjacent to Duncan St incorporating 76 pillars is analysed at 9m mining height Overburden strata strengths and depth-of-cover is consistent with Duncan St model
The main objective of this model is to estimate the strength difference between the two mining panels west and east of the Waterline fault Given uniform mining height and depth-of-cover the strength difference will be due to the pillar configuration and boundary conditions
At 9m mining height the model is predicted to be essentially stable although 9 pillars are predicted to be fully yielded at mid-pillar height
With gravity increase of 10 the model remains stable At 20 increase in gravity the model is predicted to fail with significant overburden yield
It is concluded therefore that the panel to the east of Waterline fault is 20 stronger than the panel to the west
Figure A-76 Location of numerical model 2 together with surface subsidence contours from 1988 and 2008 events and seam level eastern boundary of failure predicted from 3D seismic
Figure A-77 Yield on section at mid-height for 9m mining height
Figure A-78 Rockmass yield on vertical section trending east-west at mid-point of model Note overburden is largly intact with no extensive collapse
Figure A-79 Pillars predicted to have failed from Numerical model 2 with surface subsidence contours and inferred eastern limit of failed zone at seam level
By a 20 increase in gravity the model is forced to fail resulting in predicted 13m surface subsidence that includes increased overburden compression from increased gravitational component Excessive deformation and numerical instability stopped the model true surface deformation may be higher
Figure A-80 Adjacent model with 9m mining height Predicted surface subsidence after 20 increase in gravity Model predicts 13m surface subsidence
Figure A-81 Adjacent model with 9m mining height and 20 gravity increase Predicted failure at mid-pillar height Note intact core in southern pillars which appear stronger from unmined adjacent coal and larger general pillar size
A7 CONCLUSIONS
A71 Current knowledge on coal pillars behaviour
bull The strength based factor-of-safety approach is well established in coal pillar design Factors of safety for coal pillars required to provide medium to long term stability should be greater than 16 [Galvin 2006 Hill 2005]
bull Coal pillar strength has been the subject of rigorous research since at least the 1960rsquos and the Salamon amp Munro formula has been applied in the design of over a million coal pillars in South Africa alone [Mark 1999 Salamon 1998] Strength formula derivations from the UNSW are established in Australia
bull Coal pillar load calculation traditionally relies on tributary area theory which is a conservative approach suitable for pillar design
bull Tributary area conditions are NOT satisfied at Collingwood Park pillars are irregular in size and shape there is large areas of unmined coal and the seam has significant dip
bull This last point is important as analytical methods hold the only hope of evaluating every pillar at Westfalen No 3 Colliery The numerical model of Duncan St analyses 46 pillars and requires significant computational resources the entire Colliery has in excess of 700 pillars and cannot be analysed by the same methods in its entirety by current computer codes in a reasonable time frame
bull Likewise it is not satisfactory to draw conclusions on panel stability from limited analysis of representative groupings of pillars because of the variability in size shape mining height and cover depth over the mining area
bull To overcome the limitations of tributary area theory for the back-analysis of an irregular pillar layout a novel approach for calculating loads based on pressure arch theory has been developed subjected to international peer review and published in the International Journal of Rock Mechanics and Mining Sciences In summary each pillar is individually examined and the pillar area circumference and centroid are calculated At the pillar centroid the cover depth and mining height are determined An influence zone based on a circular area with radius defined by the depth-dependent load transfer distance Within this area the local extraction ratio is calculated This approach has found to satisfactorily account for pillars of arbitrary shape in irregular layout with variable cover depth
bull This allows a FoS to be determined for the over 700 pillars of Westfalen No 3 with reasonable computer resources
A72 Typical pillar strength effects
Width to height ratio
bull Pillars at Westfalen No 3 have typical effective width from 20m to 50m While mining height is uncertain it is believed to range from 6m to 10m With these dimensions pillar wh ratio ranges from 20 to 83
bull At the lower limit of wh=20 geological influences will start to determine pillar strength [Galvin 2006] From wh in the range gt 20 to 40 the formula of Salamon and Munro or UNSW extensions could be expected to estimate pillar strength with the squat pillar version of these formula applicable for whgt40 [Galvin 2006 Salamon 1998 Galvin 1999]
bull The squat pillar extensions were developed since the standard formulas were found to underestimate pillar strength at whgt4 At Westfalen No 3 colliery although there are a number of pillars of whgt4 many of these are irregular in shape often long and relatively narrow (30m ndash 40m) Given this and the need to automate the assessment of every pillar the squat pillar strength formula is not utilised This approach is conservative
Pillar shape effects
bull Many pillars at Westfalen No 3 are skewed of diamond shape with acute internal angle from 50 to 90 degrees Hydraulic radius simile accounts for pillar shape by an effective width defined by 4AC while the UNSW has a parrellopid formula that for pillars of equal side length results in an effective width equivalent to this
bull In a study of pillar shapes common to Westfalen No 3 colliery the hydraulic radius analogy for estimation of effective width is found adequate with errors less than 6 for considered sizes and shapes
Post peak strength
bull Numerical studies and the work of Das in Indian coal fields highlights the changing post peak behaviour with increasing width to height ratiorsquos It has been determined that when wh exceeds approximately 5 pillars start to harden post peak When whlt3 pillars display limited if any post peak strength
bull The significance of this effect will be in the manner that pillars shed load to adjacent pillars In an array of pillars of similar dimensions pillars with a low wh ratio could be expected to shed load in a sudden more catastrophic manner than those that harden post peak Such sudden pillar failure is referred in the literature as catastrophic cascading or rolling pillar failure and has been responsible for damaging wind blasts and significant loss of life over the years
bull In an irregular pillar layout such as Westfalen No 3 with variable wh ratio significant barrier pillars and regions of unmined coal sudden multiple panel collapse would be expected to be less likely
bull The analytical approach developed for assessing pillar load accounts for load shed from a failed pillars to pillars within the zone of influence of that pillar
Specific details of this approach are discussed in the hazard map and risk assessment chapter of this report
Backfill effect
bull Numerical studies on a cohesive and non-cohesive backfill suggest that pillar strength is increased with increasing height of fill Studies suggest a 1MPa cohesive backfill may increase pillar strength by approximately 10 at 40 roadway fill for wh=33 and 18 at 40 roadway fill at wh=22 At 80 roadway fill pillar strength increases are predicted to exceed 50 Percentage strength increases are predicted to be greater with lower wh ratiorsquos
bull Studies of a non-cohesive backfill suggest at 80 roadway fill pillar strength increases are approximately 25
bull With both backfill types pillar strength is predicted to increases dramatically above 80 roadway fill and pillars are predicted to exhibit post-peak hardening behaviour
For example in the Duncan St area a pillar of effective width 20m will have a FoS of approximately 118 at mining height of 10m without backfill A 50 strength increase from 1MPa cohesive backfill at 80 roadway fill will raise the FoS to approximately 177 and reduce the probability of instability from approximately 1 in 10 to less than 1 in 1000
With 80 roadway fill of a non-cohesive backfill the same Duncan St pillar FoS will increase to approximately 147 and the probability of instability reduce to less than 1 in 100
bull Backfill is likely to reduce the rate of time dependent pillar strength degradation by reducing pillar spalling due to the erosive effects over time of high stress and exposure of the pillar surface to the atmosphere
bull In addition backfill is likely to benefit pillar stability by limiting the void available to the roof to fall into Roof falls particularly at roadway intersections may be present By reducing the roadway volume backfill will eventually support the roof when the bulking effect of roof falls fills the remaining roadway voids space Beyond this summary time dependent issues of backfill have not been considered
roadway
fill
Non-cohesive backfill
(7m mining height width 20m) strength increase
05 MPa cohesive backfill
(7m mining height width 20m)
strength increase
10 MPa cohesive backfill
(7m mining height width 20m)
strength increase
60 135 388 437
70 183 432 597
80
90
208
291
474
572
698
957
A73 Duncan St numerical model
bull In the Duncan St subsidence region approximately 46 pillars are surrounded by unmined coal to the west a large pillar containing the Waterline fault to the east and larger pillars to the south and north
bull At 6m mining height pillar minimum FoS for these 46 pillars is calculated at 131 with Pressure Arch theory and UNSW strength formula At 9m mining height minimum FoS is calculated as 099
bull Pillar probability of failure for FoS calculated by the UNSW eq(2) is given in [Galvin 2006] as
Table A-14 Factor of safety failure probabilities for UNSW pillar strength formula (after Galvin 2006)
Safety Factor Probability of pillar failure
087 8 10
100 5 10
122 1 10
13 5 100
138 2 100
144 1 100
163 1 1000
179 1 10000
195 1 100000
211 1 1000000
bull From Table A-14 at 6m mining height there is a 1 in 20 probability of instability and at 9m a 1 in 2 probability The variability in the database of failed and unfailed pillars from which eq (1) to eq (3) are derived is responsible for these probabilities Our numerical model should always predict failure if the FoS is less than 10 and always predict stability with FoS gt 10 since no such variability in geotechnical properties or conditions is used
bull While our numerical model predicts no pillar failure at 6m and pillar failure at 9m in reality there remains approximately a 1 in 20 chance of failure at 6m mining height If one pillar was to fail load transferred to adjacent pillars would reduce these adjacent pillars FoS and may well lead to the pillar failure and resultant subsidence observed at Duncan St
bull Based on the numerical results obtained using two mining heights the pillar and overburden failure is in line with analytical predictions from Pressure Arch theory and UNSW pillar strength calculation
bull Surface subsidence predicted from the 9m mining height numerical model is 196m While this value is in general agreement with monitoring data the model is not sufficiently calibrated since the real mining height in the region is unknown to be able to confidently predict final subsidence strains and tilts
bull With 1MPa cohesive backfill at a fill ratio of 83 the predicted strength increase is 70 With non-cohesive backfill at the same fill ratio the strength increase is 20 these values are in agreement with single pillar studies
bull Abutment stresses in the immediate roof sandstone unit (above the coal roof) are predicted to extend approximately 80m beyond the limits of the model This is in reasonable agreement with twice the load transfer distance of 64m (at 124m depth-of-cover) used to define a pillars zone of influence (the ZI also includes half pillar width ie 74m for 20m pillar)
A74 Numerical model of adjacent region
bull A numerical model of the region immediately to the east of the Duncan St failure region is constructed with 76 pillars
bull At 9m mining height the model predicts failure of 9 pillars but no significant overburden failure The model remains stable in general
bull With a 20 increase in gravity the model is predicted to fail
bull Numerical modelling results suggest the region to the east of the Waterline barrier pillar is stronger by approximately 20 than the subsided region to the west of the barrier pillar
bull Predicted surface subsidence (including compressive effects from gravity increase) is 13m all though numerical instabilities halt the model and true surface subsidence is likely to be higher
bull Inspection of yield at mid-pillar height suggests the southern pillars in the model have intact core when pillars in the middle of the region are failed in their entire volume In reality the southern region of this panel have greater depth-of-cover therefore higher pillar stresses and thus lower FoS in these southern pillars
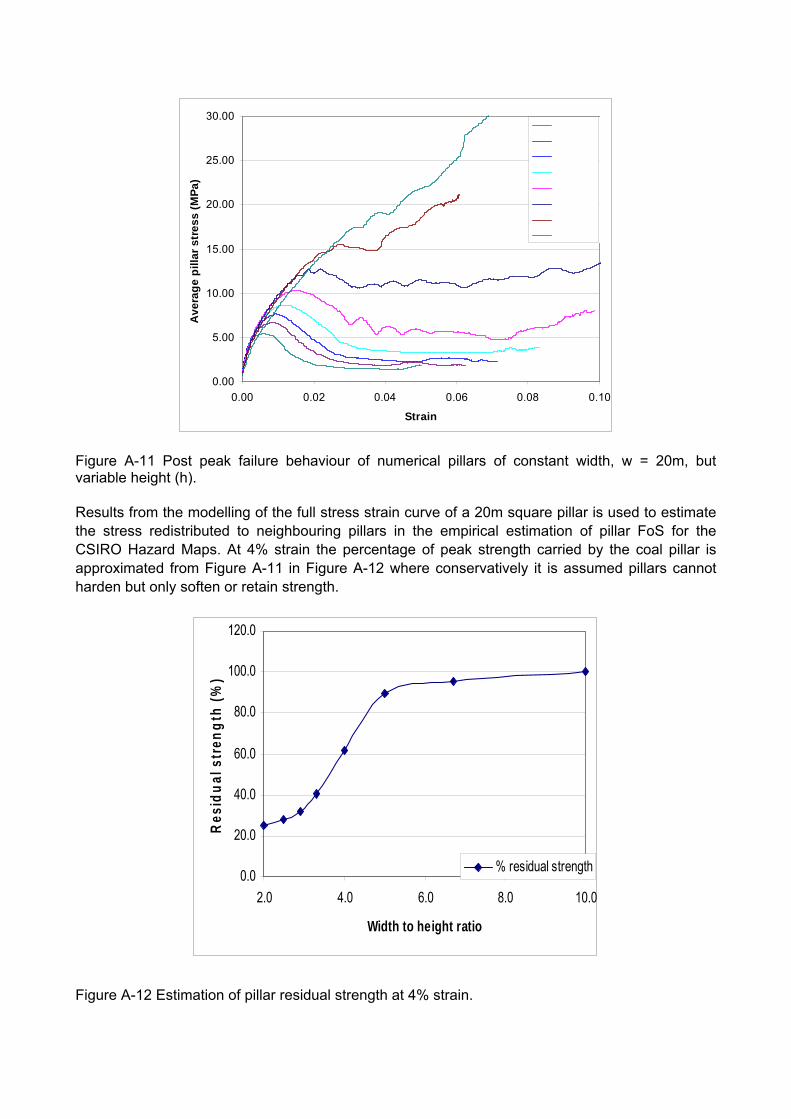

(a) (b)
Figure A-15 (a) Rectangle 30m by 10m being split in 1m increments Note symmetry plane on left hand boundary Mining height 6m (b) Results from numerical model and Strength formula with w=4AC
Triangular shape pillars with two equal sides of 20m
In this example a triangular pillar with two sides of equal length of 20m is analysed
(a) (b)
Figure A-16 (a) Triangular pillar of two equal sides of 20m each Mining height 6m (b) Results from numerical model and strength formula with w=4AC Maximum error is approximately 5
Observations from study of pillar shapes
The general conclusion from the study of pillar shapes at fixed 6m mining heights is that the hydraulic radius analogy of Wagner Equation (4) where the effective width is estimated by area and circumference is applicable to pillars of Westfalen No 3 colliery Errors with this approach at calculating pillar width for width-to-height ratios from approximately 2 to approximately 4 for the shapes studied are under 6
A43 Realistic roof geology
It is recognised that the idealised roof and floor of the pillar model Figure A-7 may have an influence on the predicted strength estimation To quantify this effect a model of a 20m square pillar at width-to-height ratiorsquos of 22 to 4 is analysed with a realistic roof geology
Based on the sonic logging data in borehole CP-C02 located in the failure region of Duncan Street Figure A-17 pillar strength is estimated from a numerical model with the model input parameters selected from the scanned roof geological and geotechnical data The input data are listed in Error Reference source not found and Table A-4 The F3D mesh for a pillar analysis is shown in Figure A-18 and the numerical results for two set of parameters for roof geology are shown in Figure A-19
Table A-4 Mechanical properties of roof and overburden rocks
Youngs Poissonrsquos UCS Tensile Strength CohesionBackfill Modulus Friction Angle (deg)Ratio (MPa) (MPa) (MPa)(GPa)
Sandstone 135 012 25 25 6648 40
Siltstone 195 020 15 15 4728 38
Interbedded 166 017 20 20 2808 38
Mudstone 875 026 10 10 1943 30
UCS Depth (m) (MPa) Geology Scaled UCS (MPa) 1005 7500 sandstone1 2500 1010 1015
6000 6750
interbedded1 2000 2250
1020 1025
7500 9000
sandstone2 2500 3000
1030 6750 interbedded2 2250 1035 4500 siltstone1 1500 1040 5250 interbedded3 1750 1045 4500 siltstone2 1500 1050 1055
225 2250
coal1 750 750
1060 1065
8250 9000
sandstone3 2750 3000
1070 3750 siltstone3 1250 1075 5250 1750 1080 6000 interbedded4 2000 1085 6000 2000 1090 3750 siltstone4 1250 1095 3000 1000 1100 3000 mudstone1 1000 1105 3000 1000 1110 3750 1250 1115 4500 siltstone5 1500 1120 3750 1250 1125 2000 coal2 667 1130 5250 interbedded5 1750 1135 7500 sandstone4 2500 1140 1145
6000 5250
interbedded6 2000 1750
1150 8250 2750 1155 9000 3000 1160 10500 3500 1165 13500 4500 1170 10500 sandstone5 3500 1175 10125 3375 1180 10500 3500 1185 9750 3250 1190 7500 2500 1195 3750 siltstone6 1250 1200 1500 coal3 500 1205 1210
7875 8625
sandstone6 2625 2875
1215 5250 interbedded7 1750 1220 1225
9000 10500
sandstone7 3000 3500
1230 6000 interbedded8 2000 1235 3000 mudstone2 1000 1240 3750 siltstone7 1250
Figure A-17 Sonic log of borehole CP-C02 and roof geological interpretation
Figure A-18 Numerical model of a coal pillar with representative floor and roof rock geology
4 5 6 7 8 9 10 Pillar height (m)
Figure A-19 Comparisons of pillar strength versus pillar height for realistic and simplified roof geology Maximum error is 45
Modelling predicted that the maximum difference in pillar strength for two different roof geology conditions is approximately 45 at the lower height of 6m reducing to less than 1 for pillars of 9m mining height
It is concluded from this study that the simplified roof and floor model satisfactorily estimates pillar strength allowing in excess of 180 numerical models to be analysed in a timely manner
60
65
70
75
80
85
90
95
100
105
Pilla
r str
engt
h (M
Pa)
Assumed geology
Real geology
A44 Pillars surrounded by roadways of variable height
It was observed in the 1983 pillar site investigation [Hollingworth Dames amp Moore 1990] that mining heights at Westfalen No 3 are extremely variable with roadways surrounding individual pillars varying by up to 2m
To investigate the strength of pillars of variable height a 20m wide square model pillar of 8m mining height on one side and 6m height on the directly opposite side of the pillar as shown in Figure Ashy20 has been analysed
Figure A-20 Different views of the numerical modelling mesh of a trapezoidal-square pillar - Model is 8m high on one side and 6m on the other opposite side
Predicted strength of the variable height pillar together with stress-strain curves for pillars of 6m 7m and 8m mining heights presented in Figure A-21 As shown in the figure the predicted strength of a non-uniform-height pillar of trapezoidal shape having 6m and 8m side heights approximates a uniform-height pillar with a constant height of 7m
0
1
2
3
4
5
6
7
8
9
10
Axia
l stre
ss (M
Pa)
Trapezoid pillar
6m pillar 7m pillar
8m pillar
0000 0010 0020 0030 0040 0050
Axial strain
Figure A-21 Stress vs strain curves for rectangular uniform height and trapezoidal non-uniform height pillars Strength of uniform pillars having heights of 6m 7m and 8m are compared with a trapezoidal non-uniform height pillar of having 6m height on one side and 8m on the other opposite side ie a variable height roadway of average 7m height
A45 Pillars created by multiple passes to variable depth
Roadways at Westfalen No 3 colliery were cut in multiple passes at a constant height of 24 m The cut widths were variable ranging from 52 m at the bottom to 76 m at the top as shown schematically in Figure A-22 by the mine managerrsquos hand drawings of the roadway mining method
To asses the strength of such pillars a 9 m high pillar with irregular side surface boundary is modelled Figure A-23 The model pillar has a square base of 23m and side length with three lsquocutsrsquo in its height as shown in Figure A-23
Predicted strength is approximately equal to a similar pillar with effective width equal to minimum width ie 20m in this case Figure A-24
Figure A-22 Sketch of roadways at Collingwood Park showing multiple passes or layers of cutting of the coal seam(from previous mine managersrsquo notes and records)
Figure A-23 Numerical modelling of a multi-pass cut pillar of 9 m height with minimum and maximum side widths of 20m and 23m respectively
0
1
2
3
4
5
6
7
8
Axi
al s
tres
s (M
Pa)
irregular pillar-min w idth 20m high and 9m w ide
square pillar-20m w ide and 9m high
0000 0005 0010 0015 0020 0025 0030 0035 0040
Axial strain
Figure A-24 Stress vs strain curves for pillars of 9m height with regular and irregular square cross-section (Figure A-23) Difference in peak strength predicted to be approximately 35
A5 ROADWAY BACKFILL AND PILLAR STRENGTH IMPROVEMENT
A literature review of backfill applications mechanical properties and behaviours in coal mining identified several examples from China [Guo 2007 Wang 2009] where backfill has been used to reduce surface subsidence from America [Tesarik 2002 2009] where backfill has been used primarily for disposal of fly-ash and reduce acid mine drainage and from Australia [Origin Alliance 2008] - See Table A-5 and the reference list
In the early stages of this modelling specific data and backfill effects and properties required in this numerical study were unavailable and therefore two cases were considered a cohesive backfill having a UCS of 1 MPa and a non-cohesive backfill with no cohesion but a friction angle of 42 degrees Subsequent to these two cases a case of 05MPa cohesive backfill mix was also considered
Backfill properties using in this study are list in
Table A-6
Table A-5 Backfill properties data from various sources
Composition UCS (MPa) E (GPa) Reference
Solid waste including fly-ash 05 initially
to 14-17
0565 Guo et al 2007
Fly-ash amp cement 339 ndash 824 Guo et al 2007
1 4 15 (cement) (fly-ash) (coal
gangue)
07 ndash 17 Wang et al 2009
Fly ash (dry) Scheetz 2009
22 1 (fly-ash) (cement) Scheetz 2009
Cemented rockfill in metal mine 69 1909 Tesarik 2009
Required properties 10 10 OriginAlliance ndash Mine
subsidence interpretive
reporting
P16
25 FA 105 sand 01 bentonite
5 FA 18 sand
Injection 3m intervals
Bell Bruyn 1999
Table A-6 Mechanical parameters of cohesive and non-cohesive backfill used in this numerical
study
Backfill Youngs Modulus (GPa)
Poissonrsquos Ratio UCS
(MPa)
Tensile Strength (MPa)
Cohesion (MPa)
Friction Angle (deg)
Dilation Angle (deg)
1MPa
Cohesive 0565 040 10 01 0117 400 100
05MPashy
cohesive 0565 040 05 005 0061 400 100
Non-
cohesive 0020 015 00 00 0000 420 75
A51 Numerical results and analysis
In order to quantify the influence of backfill on pillar strength in detail 180 models (60 models each for 1MPa 05MPa cohesive and non-cohesive backfill) of square coal pillars were analysed with the following parameters pillar width is 20m mining height is from 5m to 10m equivalent to a wh ratio of 2 to 4 percentage of backfill is from 0 to 90 Table A-7 summarises the results of these pillar strength analyses for all the cohesive and non-cohesive cases
Relationship between pillar strength and percentage of roadway backfill is presented in Figure Ashy25 Figure A-27 and Figure A-29 The raw data from Table A-7 has been calculated in uniform 10
backfill increments and is presented in Figure A-26 Figure A-28 and Figure A-30 As shown in these figures the percentage increase in pillar strength is approximately bilinear with increase in backfill
00
200
400
600
800
1000
1200
1400
1600 P
illar
stre
ngth
incr
ease
()
5m 6m 7m 8m 9m 10m
00 100 200 300 400 500 600 700 800 900 1000
Percentage of bacfill ()
Figure A-25 Pillar strength increase versus percentage of 1MPa cohesive backfill
00
200
400
600
800
1000
1200
1400
1600
Pill
ar s
tren
gth
incr
ease
()
10 backfill
20 backfill
30 backfill
40 backfill
50 backfill
60 backfill
70 backfill
80 backfill
90 backfill
4 5 6 7 8 9 10 11 12 Pillar height (m)
Figure A‐26 Pillar strength increase versus pillar height for 1MPa cohesive backfill
Table A-7 Pillar strength with increasing 1MPa and 05MPa cohesive backfill and non-cohesive backfill
Pillar strength Backfill
Approximate percentage of backfill
() 5 6
Pillar height (m)
7 8 9 10 Pillar
strength Without backfill 0 1007(00) 894(00) 795(00) 714(00) 647(00) 596(00)
(MPa) for different percentshyage of
10 20 30
1049(100) 1104(200) 1140(300)
940(83) 983(167)
1069(333)
833(71) 909(214) 947(286)
785(125) 820(188) 889(313)
720(111) 771(222) 803(278)
650(100) 710(200) 758(300)
backfill 1MPa 40 1205(400) 1130(417) 1046(429) 929(375) 869(389) 824(400)
Cohesive 50 1234(500) 1178(500) 1095(500) 1016(500) 943(500) 894(500) backfill 60 1292(600) 1208(583) 1143(571) 1098(625) 1009(611) 956(600)
70 1342(700) 1271(667) 1270(714) 1158(688) 1120(722) 1035(700) 80 1466(800) 1442(833) 1350(786) 1345(813) 1309(833) 1180(800) 90 1593(900) 1580(917) 1556(929) 1470(875) 1440(889) 1400(900) 10 1026(100) 930(83) 830(71) 773(125) 697(111) 636(100) 20 1081(200) 968(167) 896(214) 803(188) 754(222) 687(200) 30 1132(300) 1053(333) 939(286) 871(313) 786(278) 741(300)
05MPa 40 1184(400) 1098(417) 1018(429) 901(375) 853(389) 799(400) Cohesive 50 1217(500) 1141(500) 1065(500) 1000(500) 936(500) 873(500)
backfill 60 1240(600) 1167(583) 1102(571) 1054(625) 1009(611) 954(600) 70 1269(700) 1189(667) 1237(714) 1093(688) 1044(722) 1014(700) 80 1322(800) 1280(833) 1167(786) 1143(813) 1105(833) 1061(800) 90 1410(900) 1350(917) 1250(929) 1202(875) 1150(889) 1120(900)
Non-cohesive backfill
10 20
1016(100) 1028(200)
902(83) 912(167)
801(71) 819(214)
724(125) 732(188)
657(111) 670(222)
604(100) 615(200)
30 1044(300) 941(333) 832(286) 753(313) 678(278) 629(300)
Pillar strength Backfill
Approximate percentage of backfill
() 5 6
Pillar height (m)
7 8 9 10
40 1063(400) 961(417) 865(429) 767(375) 702(389) 649(400) 50 1086(500) 984(500) 885(500) 800(500) 729(500) 670(500) 60 1113(600) 1006(583) 904(571) 835(625) 760(611) 696(600) 70 1138(700) 1030(667) 943(714) 852(688) 792(722) 725(700) 80 1168(800) 1083(833) 963(786) 889(813) 829(833) 765(800) 90 1206(900) 1130(917) 1029(929) 913(875) 852(889) 804(900)
Figure A-27 Pillar strength increase versus pillar height for 05MPa cohesive backfill
4 5 6 7 8 9 10 11 12 13 Pillar height (m)
Figure A-28 Pillar strength increase versus percentage of 05MPa cohesive backfill
0
10
20
30
40
50
60
70
80
90
100
Pilla
r st
reng
th in
crea
se (
) 10 backfill
20 backfill
30 backfill
40 backfill
50 backfill
60 backfill
70 backfill
80 backfill
90 backfill
00
50
100
150
200
250
300
350
400
Perc
enta
ge o
f pill
ar s
tren
gth
incr
ease
()
5m
6m
7m
8m
9m
10m
00 100 200 300 400 500 600 700 800 900 1000
Percentage of bacfill ()
Figure A-29 Pillar strength increase versus percentage of non-cohesive backfill
00
50
100
150
200
250
300
350
400
Pilla
r st
reng
th in
crea
se (
)
10 backfill
20 backfill
30 backfill
40 backfill
50 backfill
60 backfill
70 backfill
80 backfill
90 backfill
4 5 6 7 8 9 10 11 12 Pillar height (m)
Figure A-30 Pillar strength increase versus pillar height for non-cohesive backfill
The modelling results suggest that the pillar strength will increase with increasing roadway backfill while the percentage increase of pillar strength is greater for the taller pillars than squat pillars it is observed that when the backfill is less than 40-50 the pillar strength increase is less sensitive to pillar height or wh ratio while over 40-50 backfill pillar strength rapidly increase with pillar height
A52 Comparison of three different kinds of backfill
Pillar strength improvement with 05 and 10 MPa cohesive backfill and non-cohesive backfill is presented in Figure A-31 to Figure A-33
0
10
20
30
40
50
60
70
Incr
ease
of p
illar
str
engt
h (
) 5m-00MPa
5m-05MPa
5m-10MPa
0 10 20 30 40 50 60 70 80 90 100
Percentage of backfill ()
Figure A-31 Comparison of 05 and 10 MPa cohesive backfill and non-cohesive backfill at 5m mining height
0
20
40
60
80
100
120
Incr
ease
of p
illar
str
engt
h (
)
7m-00MPa
7m-05MPa
7m-10MPa
0 10 20 30 40 50 60 70 80 90 100
Percentage of backfill ()
Figure A-32 Comparison of 05 and 10 MPa cohesive backfill and non-cohesive backfill at 7m mining height
Incr
ease
of p
illar
str
engt
h (
)
140
120
100
80
60
40
20
0
9m-00MPa
9m-05MPa
9m-10MPa
0 10 20 30 40 50 60 70 80 90 100
Percentage of backfill ()
Figure A-33 Comparison of 05 and 10 MPa cohesive backfill and non-cohesive backfill at 9m mining height
Modelling predicts that 05MPa is as effective as 10MPa at increasing pillar strength below approximately 50-60 roadway fill Modelling suggests that cohesive backfill is more effective at increasing pillar strength than non-cohesive fill
A53 Numerical study of the influence of interface between backfill and pillar
To investigate the influence of an interface between backfill and pillar on the strength response of coal pillar an interface is set between backfill and pillar as shown in Figure A-34 The interface property is list in Table A-8
Figure A-34 Sketch showing the position of interface between backfill and pillar
2
4
6
2
4
6
Table A-8 Mechanical parameters of interface used in numerical model
Interface Cohesion FrictionNormal stiffness (GPa) Shear stiffness (GPa) property (MPa) Angle (deg)
Value 20 20 0 5~40
Pillar strength of a 6m high pillar as interface friction angle is increased from 5 degrees to 40 degrees is displayed in
1212
1010
88
cohesive backfill with interface
cohesive backfill without interface
non-cohesive backfill with interface
non-cohesive backfill without interface
4 cohesive backfill with interface
cohesive backfill without interface
non-cohesive backfill with interface
non-cohesive backfill without interface
stre
ss (M
Pa)
stre
ss (M
Pa)
6
2
00 0000 0005 0010 0015 0020 0025 0030 0035 0040 0045 0000 0005 0010 0015 0020 0025 0030 0035 0040 0045
strain strain
Figure A-35 to Figure A-38
Modelling predicts a non-cohesive interface with friction angle below 20 degrees results in a slight reduction in pillar strength above 20 degrees the interface is predicted to have little influence on pillar strength
cohesive backfill with interface
cohesive backfill without interface
non-cohesive backfill with interface
non-cohesive backfill without interface
1212
1010
88
cohesive backfill with interface
cohesive backfill without interface
non-cohesive backfill with interface
non-cohesive backfill without interface
stre
ss (M
Pa)
stre
ss (M
Pa)
6
4
2
0 0
0000 0005 0010 0015 0020 0025 0030 0035 0040 0045 0000 0005 0010 0015 0020 0025 0030 0035 0040 0045
strain strain
Figure A-35 Post peak pillar for 6m high pillar (wh=33) with friction angle 5deg on left 10deg on right of interface between backfill and pillar
2
4
6
cohesive backfill with interface
cohesive backfill without interface
non-cohesive backfill with interface
non-cohesive backfill without interface
1212
1010
88
cohesive backfill with interface
cohesive backfill without interface
non-cohesive backfill with interface
non-cohesive backfill without interface
stre
ss (M
Pa)
stre
ss (M
Pa)
6 6
44
2 2
0 0 0000 0005 0010 0015 0020 0025 0030 0035 0040 0045 0000 0005 0010 0015 0020 0025 0030 0035 0040 0045
strain strain
Figure A-36 Post peak pillar for 6m high pillar (wh=33) with friction angle 15deg on left 20deg on right of interface between backfill and pillar
12
cohesive backfill with interface
cohesive backfill without interface
non-cohesive backfill with interface non-cohesive backfill without interface
12
10 10
8 8
cohesive backfill with interface
cohesive backfill without interface
non-cohesive backfill with interface
non-cohesive backfill without interface
stre
ss (M
Pa)
stre
ss (M
Pa)
6 6
4 4
2 2
0 0 0000 0005 0010 0015 0020 0025 0030 0035 0040 0045 0000 0005 0010 0015 0020 0025 0030 0035 0040 0045
strain strain
Figure A-37 Post peak pillar for 6m high pillar (wh=33) with friction angle 25deg on left 30deg on right of interface between backfill and pillar
12
cohesive backfill with interface
cohesive backfill without interface
non-cohesive backfill with interface non-cohesive backfill without interface
12
10 10
8 8
cohesive backfill with interface
cohesive backfill without interface
non-cohesive backfill with interface
non-cohesive backfill without interface
stre
ss (M
Pa)
stre
ss (M
Pa)
6
4
2
0 0000 0005 0010 0015 0020 0025 0030 0035 0040 0045
0 0000 0005 0010 0015 0020 0025 0030 0035 0040 0045
strain strain
Figure A-38 Post peak pillar for 6m high pillar (wh=33) with friction angle 35deg on left 40deg on right of interface between backfill and pillar
22
6
8
24
A54 Post peak pillar strength
A full stress strain curve to approximately 35 strain is presented in the following figures for 1MPa cohesive and non-cohesive backfill Results for 05MPa cohesive backfill sit approximately mid-way between these two cases and are included in the summary Table A-9
24 24
0000 0010 0020 0030 0040 0050
Average axial strain of coal pillar
000
2000
3000
4000
5000
6000
7000
8000
9000
22
0000 0010 0020 0030 0040 0050
Average axial strail of coal pillar
000
2000
3000
4000
5000
6000
7000
8000
9000
20 20
18
Ave
rage
str
ess
of c
oal p
illar
(MPa
)
Ave
rage
str
ess
of c
oal p
illar
(MPa
)
18
16 16
1414
12 12
1010
88
66
44
22
00
Figure A-39 Post peak pillar strength with increasing backfill 5m high pillar (wh=40) with 1MPa cohesive backfill on left non-cohesive backfill on right
24
22
0000 0010 0020 0030 0040 0050
Average axial strain of coal pillar
00
250
333
417 500
583
667 833
917
22
0000 0010 0020 0030 0040 0050
Average axial strain of coal pillar
00
250 333
417
500 583
667
833
917
20 20
Ave
rage
str
ess
of c
oal p
illar
(MPa
)
18 18
16 16
14 14
12 12
10 10
8
6
4 4
2 2
0 0
Figure A-40 Post peak pillar strength with increasing backfill 6m high pillar (wh=33) with cohesive backfill on left non-cohesive backfill on right
Aver
age
stre
ss o
f coa
l pill
ar (M
Pa)
4
6
8
10
12
14
16
18
2
4
6
8
0000 0005 0010 0015 0020 0025 0030 0035 0040 0045
Average axial strain of coal pillar
000
2140
2860
4290
5000
5710
7140
7860
9290
2020
0000 0005 0010 0015 0020 0025 0030 0035 0040 0045
Average axial strain of coal pillar
000
2140
2860
4290
5000
5710
7140
7860
9290
18
Ave
rage
str
ess
of c
oal p
illar
(MPa
) A
vera
ge s
tres
s of
coa
l pill
ar (M
Pa)
Aver
age
stre
ss o
f coa
l pill
ar (M
Pa) 16
14
12
10
8
6
4
22
00
Figure A-41 Post peak pillar strength with increasing backfill 7m high pillar (wh=29) with cohesive backfill on left non-cohesive backfill on right
14 14
0
000
2500
3130
3750
5000 6250
6880
8130
8750
0
000
2500
3130
3750
5000
6250
6880
8130
8750
12 12
10
Ave
rage
str
ess
of c
oal p
illar
(MPa
)
10
8
6
4
2
0000 0010 0020 0030 0040 0050 0000 0010 0020 0030 0040 0050
Average axial strain of coal pillar Average axial strain of coal pillar
Figure A-42 Post peak pillar strength with increasing backfill 8m high pillar (wh=25) with cohesive backfill on left non-cohesive backfill on right
2
4
6
8
10
12
14
2
4
6
8
14
12
Ave
rage
str
ess
of c
oal p
illar
(MPa
) A
vera
ge s
tres
s of
coa
l pill
ar (M
Pa)
0
000 2220 2780 3890 5000 6110 7220 8330 8890
0
000 2220 2780 3890 5000 6110 7220 8330 8890
Ave
rage
str
ess
of c
oal p
illar
(MPa
)
10
8
6
4
2
0000 0005 0010 0015 0020 0025 0030 0035 0040 0000 0005 0010 0015 0020 0025 0030 0035 0040
Average axial strain of coal pillar Average axial strain of coal pillar
Figure A-43 Post peak pillar strength with increasing backfill 9m high pillar (wh=22) with cohesive backfill on left non-cohesive backfill on right
12 12
0
000 2500
3000 4000
5000 6000
7000 8000
9000
0
000
2500
3000
4000
5000
6000
7000
8000
9000
10
Ave
rage
str
ess
of c
oal p
illar
(MPa
) 10
8
6
4
2
0000 0005 0010 0015 0020 0025 0030 0035 0000 0005 0010 0015 0020 0025 0030 0035
Average axial strain of coal pillar Average axial strain of coal pillar
Figure A-44 Post peak pillar strength with increasing backfill 10m high pillar (wh=20) with cohesive backfill on left non-cohesive backfill on right
The amount of backfill to achieve the transition between strain softening and hardening is presented in Table A-9 for all mining height The values in this table are estimated from the stress-strain curve analysed to 35 of strain and are depended on the backfill increment which is in turn dependent on the ratio of mining height to the calibrated element size 05m
Table A-9 Percentage of roadway backfill that leads to a transition from strain softening to hardening
Pillar height Non-cohesive 05MPa Cohesive 10MPa Cohesive backfill backfill backfill
5m 300 200 200
6m 500 417 333
7m 571 500 429
8m 625 625 500
9m 722 722 611
10m 800 800 700
The modelling results suggest that the average axial stress of coal pillar increases with compression until peak stress is reached In the post-failure region pillar stress is reduced as strain increases for all models without backfill All the model results predict that there would be a change to strain hardening behaviour as percentage of backfill increases For example this transition point is 333 for 10 MPa cohesive backfill while 50 for non-cohesive backfill with 6m mining height as shown in Table A-9 It can also be seen from Table A-9 that tall pillars need more backfill than squat pillars to achieve the change from strain softening to hardening for either cohesive backfill or non-cohesive backfill
A55 Backfill for diamond shaped pillars
A 7m high diamond shaped pillar with 50 degree skew angle is analysed with increasing level of backfill in surrounding roadways On the skewed angle the backfill is constrained with roller boundary conditions normal to the skewed angle to represent symmetry conditions and a 5m wide roadway
Figure A-45 Numerical model of diamond shaped pillar with backfill on left and boundary conditions on right
The predicted strength of a diamond shaped pillar and equivalent square pillar with increasing roadway backfill of both cohesive and non-cohesive models is presented in Figure A-46 and Figure A-47
6
7
8
9
10
11
12
13
0 10
Pilla
r str
engt
h (M
Pa)
20 30 40 50 60 70 80 90 100
Percentage of backfill ()
Skew pillar
Square pillar
0
10
20
30
40
50
60
70
0 10
Incr
ease
of p
illar
str
engt
h (
)
20 30 40 50 60 70 80 90 100
Percentage of backfill ()
Skew pillar
Square pillar
Figure A-46 Predicted pillar strength of diamond and square shaped pillars with increasing percentage of 1MPa cohesive backfill On left is absolute strength and on right is percentage strength increase
6
7
8
9
10
11
0 10
Pilla
r stre
ngth
(MP
a)
20 30 40 50 60 70 80 90 100
Percentage of backfill ()
Skew pillar
Square pillar
0
5
10
15
20
25
30
35
0 10
Incr
ease
of p
illar
str
engt
h (
)
20 30 40 50 60 70 80 90 100
Percentage of backfill ()
Skew pillar
Square pillar
Figure A-47 Predicted pillar strength of diamond and square shaped pillars with increasing percentage of non-cohesive backfill On left is absolute strength and on right is percentage strength increase
A56 Backfill placed after significant pillar yield
A pillar model with 90 non-cohesive backfill placed after yielding of a 7m high pillar is presented in Figure A-48 The percentage of strength increase is given in Table A-10 It is found that the pillar strength increase is lower if the pillar has undergone significant deformation before the placement of backfill It is predicted that 90 backfill results in a strain-hardening pillar behaviour even if the pillar has previously yielded significantly
Ave
rage
stre
ss o
f coa
l pill
ar (M
Pa)
18 without backfill 025 strain 050 strain
14
16
075 strain 100 strain
12 125 strain 150 strain
10 175 strain 200 strain
8
6
4
2
0 0000 0005 0010 0015 0020 0025 0030 0035 0040 0045 0050
Average strain of coal pillar
Figure A-48 Stress strain curves for backfill placed around the pre-strained pillar displaying state of pillar core upon placement of backfill
Table A-10 Pillar strength increase with 90 non-cohesive backfill placed around a pre-strained 7m high square pillar of 20m width
Percentage backfill ()
Strain at placement of non-cohesive backfill ()
Pillar strength (MPa)
Percentage increase in peak
strength ()
Percentage increase in post-peak
strength at 3 strain ()
0 000 7953 000
90 000 10290 2939
90 025 9156 1513
90 050 8965 1272
90 075 8526 720
90 100 7945 26006
90 125 7951 22608
90 150 7951 18917
90 175 7951 15629
90 200 7951 11134
A6 3D MODEL OF DUNCAN ST FAILURE PANEL
A61 Numerical model
A three dimensional model of 46 pillars in the Duncan St subsidence region has been analysed with over burden geology based on hole CP1 and a constant overburden depth of 124m Figure A-49 Figure A-50 and Figure A-51 Uniform mining heights of 6m and 9m have been analysed
Selection of the pillars to be analysed is based on visual inspection of the panel layout and includes pillars bounded by unmined coal to the west the waterline barrier pillar to the east larger pillars to the south and a panel of slightly larger pillars of different orientation to the north
One row of pillars in the middle of this panel trending from north-west to south-east are of smaller dimension than the average and of diamond shape with acute internal angle of approximately 50degrees Being in the approximate middle of the panel close to full tributary area load will be mobilised on this row of pillars and therefore it is believed pillars in this row initiated the 2008 subsidence event
The Duncan Street numerical model has the following objectives
bull Estimation of pillar stresses and FoS for comparison with empirical formula
bull Comparison of backfill response at panel scale with previous single pillar studies
bull Estimation of surface subsidence at given percentage roadway fill
bull Estimation of extent of abutment stresses due to panel failure
A62 Observations from Duncan Street numerical model
bull At 6m mining height the minimum pillar FoS for these 46 pillars is calculated to be 131 using Pressure Arch theory and UNSW strength formula panel failure is not predicted with this mining height by the model At 9m mining height the minimum FoS is calculated as 099 and panel failure is predicted to occur
bull The probability of pillar failure for associated FoS calculated by the UNSW pillar strength formula Eq(2) is given in Galvin 2006 in Table A-11 The relationship was developed for square pillars using the Australian pillar database and tributary area theory and hence theoretically speaking may not directly apply to this study However it can be taken as a general guide
bull From Table A-11 it is seen that there is a 1 in 20 probability of instability at 6m mining height and a 1 in 2 probability at 9m mining height Numerical modelling is however a deterministic approach and it always predicts failure if the FoS is less than 10 and stability if FoS gt 10 since no variation in geotechnical properties or conditions is used
bull Although our numerical models predict no pillar failure at 6m and panel failure at 9m in reality there remains approximately a 1 in 20 chance of failure at 6m mining height If one pillar was to fail load transferred to adjacent pillars would reduce the FoS of these adjacent pillars and could lead to the pillar failure and subsidence as observed at 2008 event region
Table A-11 Factor of safety failure probabilities for UNSW pillar strength formula
(after Galvin 2006)
Safety Factor Probability of pillar failure
087 8 10
100 5 10
122 1 10
130 5 100
138 2 100
144 1 100
163 1 1000
179 1 10000
195 1 100000
211 1 1000000
bull Based on the numerical results obtained using two mining heights the pillar and overburden failure is consistent with analytical predictions from Pressure Arch theory and UNSW pillar strength calculation
bull Surface subsidence predicted from the numerical model with a mining height of 9m is 196m While this value is in approximate agreement with monitoring data (14mshy15m) the model was not sufficiently calibrated since the real mining height in the region is uncertain to be able to confidently predict final subsidence strains and tilts at the site
bull With 1MPa cohesive backfill at a roadway fill ratio of 83 the predicted strength increase is 70 With non-cohesive backfill at the same fill ratio the strength increase is 20 These values are in agreement with the results for single pillars
bull The numerically predicted surface subsidence with 83 roadway fill is 022m Maximum predicted tilt in east-west direction is 7mmm and in north-south direction is 5mmm Analytical formula [Holla amp Barclay 2000] predict maximum tilt of 53mmm for this amount of subsidence
bull Isolated cohesive backfill surrounding pillars of low wh ratio is predicted to be effective in confining the pillar and increasing peak pillar strength and panel stability Isolated non-cohesive backfill without barriers could not be analysed in this numerical model as backfill lsquoflowsrsquo and numerical stability could not be achieved
bull Stress transfer in the immediate roof sandstone unit (above the coal roof) is predicted to extend approximately 80m beyond the limits of the collapsed panel This is in reasonable agreement with theoretical studies
Figure A-49 Duncan St modelled panel with outline of adjacent modelled panel location of representative open hole CP1 file named ldquoAppendix B2 open hole logsrdquo located in directory ldquoCollingwood Park Subsidence 2B Collingwood Park Mine Subsidence Reports 1988 Eventsrdquo and mine subsidence limit contour
A63 Model properties
Overburden geology is based on borehole CP1 the most complete interpreted available hole drilled in 1988 by Queensland Department of Mines Figure A-50 To include this in the numerical model lithological units had to be coalesced into major units of sandstone (SS) siltstone (SL) mudstone (MS) weathered units and coal Figure A-51
Rock properties for the overburden were determined from a 2D parametric study whereby the UCS of all units was scaled to achieve pillar and overburden failure at 8m mining height Table A-12 and Table A-13
Unit top depth thickness unit thickness
thickness scaled
thickness in model
000 1200 1200 1046 1000 1200 700 SS 700 610 600 1900 600 MS 600 523 500 2500 1100 SS 1300 1133 1100 3600 200 SS 000 3800 100 SL 1000 871 900 3900 100 MS 000 4000 500 000 4500 100 000 4600 100 000 4700 100 000 4800 100 SS 400 349 400 4900 300 SS 000 5200 300 SL 700 610 600 5500 100 MS 000 5600 300 MS 000 5900 400 SS 500 436 400 6300 100 SS 000 6400 400 SL SS 900 784 800 6800 100 SL MS 000 6900 100 SL 000 7000 200 SL MS 000 7200 100 SS SL 000 7300 200 SS 1000 871 900 7500 200 SL 000 7700 200 SS SL 000 7900 200 SS 000 8100 100 SL 000 8200 100 SS 000 8300 200 SL 4350 3790 3800 8500 200 SL 000 8700 100 SS 000 8800 100 COAL 000 8900 200 000 9100 100 000 9200 100 000 9300 100 SL MS 000 9400 300 SL MS SS 000 9700 100 000 9800 100 SL MS 000 9900 400 SL SS 000 10300 200 SS MS 000 10500 100 SL MS 000 10600 200 SL MS SS 000 10800 100 000 10900 400 SL MS 000 11300 400 SL SS 000 11700 100 SS MS 000 11800 300 000 12100 400 SL SS 000
SL MS MS SS
MS
MS
SL
MS SS SL SS SL MS MS
weathering
SL MS SS
12500 150 000 12650 450 850 741 750 13100 400 SS 000 13500 100 MS SL
SS SL 960 837 500
13600 200 13800 100 SS 13900 200 14100 360
SS SL SL MS
14460 470 COAL MINING SEAM 600 14930 FLOOR
Figure A-50 Inferred geology from representative borelog CP1 used in numerical model
weathering SS
Unit Depth floor below surface Num elements Unit Unit name in model surface 0
10 3 16 weather 16 2 15 ss6
MS 21 2 14 ms2 SS 32 4 13 ss5 SL 41 3 12 sl3 SS 45 1 11 ss4 MS 51 2 10 ms1 SS 55 1 9 ss3 SL 63 3 8 sl2 SS 72 3 7 ss2 SL 1055 11 6 sl1 SS 113 4 5 ss1 SEAMR 118 3 4 seamr SEAM 124 3 3 seam FLOOR1 134 3 2 floor2 FLOOR2 250 10 1 floor1
Figure A-51 Coalesced units for numerical model based on hole CP1
Insitu stress is unknown at the site so a horizontal to vertical stress gradient of 15 has been assumed Given that the extensive workings were undertaken 20 to 30 years before the 2008 event horizontal stresses in the mining seam would be considerably disturbed from the pre-mining conditions
Table A-12 Rock properties for softening mohr coloumb material Softening rates of coal friction angle is 6 degrees over 2 plastic strain and total loss of cohesion over 24 plastic strain in coal and over 1 in other rocks Determined from pillar studies
E
nu Bulk Shear UCS UCS Phi Dilation Coh Tensile Strength (GPa) (GPa) (GPa) (MPa) scaled angle (MPa) (MPa)
SS 75 02 4167 3125 50 125 40 2 291 125
SL 4 025 2667 1600 30 75 35 2 195 075
MS 3 025 2000 1200 15 375 32 2 104 0375
Weathering 1 025 0667 0400 8 2 32 2 055 02
COAL 11 03 0917 0423 12 3 36 6 076 003
FLOOR1 4 025 2667 1600 30 75 38 2 183 075
FLOOR2 4 025 2667 1600 30 75 38 2 183 075
Table A-13 Ubiquitous joint properties Softening rate of ubiquitous joints total loss of cohesion over 1 plastic strain Determined from 2D overburden studies
Cohesion Ubiq joint cohesion Tensile Strength Ubiq joint tensile strength Ubiq joint (MPa) (MPa) (MPa) (MPa) friction
SS 291 00029144 125 0000125 15 SL 195 00019521 075 0000075 15 MS 104 00010393 0375 00000375 15 Weathering 055 00005543 02 000002 15 COAL 076 003 FLOOR1 183 - 075 - -FLOOR2 183 075 -
A64 Results from 3D Duncan St model
Factor of Safety estimated at 6m and 9m mining heights
Figure A-52 Pillar FoS calculated for 6m mining height by analytical method with strength by eq(3) and pillar stress by pressure arch theory Minimum value is 131 suggesting a 5 in 100 probability of failure however not sufficient to fail in the numerical model (that requires FoS lt 10)
Figure A-53 Pillar FoS calculated analytically for 9m mining height (eq(3) and PA theory) Minimum value is 099 suggesting a probability of failure of 5 in 10 although in the numerical model failure should occur
Yield on plane for 6m and 9m mining heights
Figure A-54 Location of section plane used for section view in following figures
Figure A-55 Yield on section plane for 6m mining height No significant damage or displacement observed
Figure A-56 Yield on section plane for 9m mining height no backfill
Figure A-57 Displacement on section plane for 9m mining height no backfill Maximum displacement is approximately 15m at surface
Results on horizontal plane at mid-pillar height
Figure A-58 Yield at mid-pillar height 9m mining height Blue elements evident in some pillars indicating pillar core remains intact
Figure A-59 Predicted vertical stress at mid pillar height 9m mining height Insitu stress is 30MPa Unyielded pillars and pillars hardening after yield are transferring vertical load while yielded pillars carry little load Extent of abutment stress increase is approximately 80m
Figure A-60 Roof vertical stress predicted by numerical model with 9m mining height Contour increments are 01MPa Base vertical stress is approximately 27MPa Abutment stress influence distance is approximately 80m
Results on surface after panel failure at 9m mining height
Figure A-61 Surface subsidence as predicted with numerical model with 9m mining height and total subsidence along Duncan St to McLaughlin St as monitored to October 09 Maximum surface subsidence predicted as 196m Outline of numerical modelling pillars and dotted contour of observed subsidence limit
A65 Duncan St model ndash backfill effectiveness
The Duncan St 3D model has been analysed with full and targeted 1MPa cohesive and non-cohesive backfill placed in roadways Roadway fill of 66 is analysed for the 1MPa cohesive mixture and 83 roadway fill for the non-cohesive mix
Results are presented in the following figures and figure captions
Factor of Safety increase from cohesive backfill
Analysis of the Duncan St model with 9m mining height is undertaken to estimate the FoS increase from backfill By increasing gravity in increments the backfill strength improvement is quantified With 83 roadway fill of 1MPa cohesive backfill the overburden and pillar tops (ie region of pillar above height of backfill) fails with gravity of 17ms2 suggesting the pillars with FoS of approximately 10 has increased FoS to 17 by backfilling adjacent roadways
Figure A-62 Gravity of 16g with 83 1MPa cohesive backfill showing no significant yield
Figure A-63 Gravity of 17g with 83 1MPa cohesive backfill predicting failure of pillar tops and overburden and collapse of roadway void space
FoS increase with non-cohesive backfill
With non-cohesive backfill pillars yielded due to lack of confinement upon initial placement of backfill in roadways but overburden remain stable and void space above backfill remained open Overburden remained stable at gravity increase to 11ms2 Figure A-64 but collapsed at gravity increase of 12ms2 Figure A-65
Figure A-64 Gravity of 11g with 83 non-cohesive backfill predicting pillar yield but overburden stability
Figure A-65 Gravity of 12g with 83 non-cohesive backfill predicting failure of pillars and overburden and collapse of roadway void space Maximum surface subsidence is 055m which includes the compressive effect of the 12g gravity increase
Placement of targeted backfill
A model is analysed with cohesive backfill totally surrounding two pillars with low predicted FoS The two pillars are predicted to have a FoS of 099 and 100 left to right viewed from above at a 9m mining height Backfill extends to an extent of 5m to 10m from the pillar and is 6m high in the roadways Gravity increase to 12g required to fail panel suggesting panel strength increase is approximately 20 from targeted backfill Predicted surface subsidence 125m (excessive mesh deformation stops analysis equilibrated stage may have higher surface subsidence)
Figure A-66 Duncan St model with 66 roadway fill of 1MPa cohesive backfill surrounding two pillars with low FoS at 9m mining height
Figure A-67 Predicted yield at mid pillar height of 9m pillars with 66 roadway fill of 1MPa cohesive backfill Note intact core (blue) for targeted pillars
Figure A-68 Pillar strength at 9m mining height Strength WITHOUT BACKFILL of northern focus pillar selected for targeted backfill is 527MPa and southern focus pillar is 526MPa
Figure A-69 Vertical stress in pillars targeted for partial backfill placement Stress calculated at equilibrium of elasto-plastic analysis WITHOUT BACKFILL Stress in northern focus pillar is 54MPa and in southern focus pillar is 513 FoS of NFP=52754 = 0975 FoS of SFP=526513 = 1025
Non-cohesive backfill in targeted placement study
A model with targeted placement of non-cohesive backfill was attempted but could not be satisfactorily converged since backfill lsquoflowsrsquo and inter-penetrates elements resulting in numerical instabilities
Forcing pillars to fail to examine resultant subsidence
To examine the extent of surface subsidence if backfilled pillars fail the numerical model with 9m mining height and 83 roadway fill of 1MPa cohesive backfill is analysed with a 90 reduction in coal pillar strength properties
With 9m mining height and 83 roadway fill of cohesive backfill void space remaining is 15m and the numerical model predicts failure of pillars and overburden results in approximately 02m surface subsidence
Figure A-70 Surface subsidence predicted by numerical model when pillars forced to fail with 83 roadway fill Contour interval is 01m with maximum subsidence predicted as 022m
Figure A-71 Surface strain in east-west direction when pillars forced to fail resulting 022m surface subsidence Maximum strain is 5mmm and contour interval is 1mmm
Figure A-72 Surface strain in north-south direction when pillars forced to fail resulting 022m surface subsidence Maximum strain is 3mmm and contour interval is 1mmm
Figure A-73 Tilt in east-west direction Units are mmm and intervals are 1mmm maximum tilt is 7mmm
Figure A-74 Tilt in north-south direction Units are mmm and intervals are 1mmm maximum tilt is 5mmm
To highlight the need for adequate fill the model with 66 roadway fill is analysed with the pillars forced to fail with a 50 reduction in pillar strength Void space over the backfill in the roadways is 30m Modelling predicts maximum surface subsidence of 068m
Figure A-75 Surface subsidence when pillars forced to fail with 66 roadway fill Roadway void space is 30m with the model predicting 068m surface subsidence Contour interval is 01m
A66 Numerical model of adjacent high risk area
Numerical model and panel stability
A numerical model of the region adjacent to Duncan St incorporating 76 pillars is analysed at 9m mining height Overburden strata strengths and depth-of-cover is consistent with Duncan St model
The main objective of this model is to estimate the strength difference between the two mining panels west and east of the Waterline fault Given uniform mining height and depth-of-cover the strength difference will be due to the pillar configuration and boundary conditions
At 9m mining height the model is predicted to be essentially stable although 9 pillars are predicted to be fully yielded at mid-pillar height
With gravity increase of 10 the model remains stable At 20 increase in gravity the model is predicted to fail with significant overburden yield
It is concluded therefore that the panel to the east of Waterline fault is 20 stronger than the panel to the west
Figure A-76 Location of numerical model 2 together with surface subsidence contours from 1988 and 2008 events and seam level eastern boundary of failure predicted from 3D seismic
Figure A-77 Yield on section at mid-height for 9m mining height
Figure A-78 Rockmass yield on vertical section trending east-west at mid-point of model Note overburden is largly intact with no extensive collapse
Figure A-79 Pillars predicted to have failed from Numerical model 2 with surface subsidence contours and inferred eastern limit of failed zone at seam level
By a 20 increase in gravity the model is forced to fail resulting in predicted 13m surface subsidence that includes increased overburden compression from increased gravitational component Excessive deformation and numerical instability stopped the model true surface deformation may be higher
Figure A-80 Adjacent model with 9m mining height Predicted surface subsidence after 20 increase in gravity Model predicts 13m surface subsidence
Figure A-81 Adjacent model with 9m mining height and 20 gravity increase Predicted failure at mid-pillar height Note intact core in southern pillars which appear stronger from unmined adjacent coal and larger general pillar size
A7 CONCLUSIONS
A71 Current knowledge on coal pillars behaviour
bull The strength based factor-of-safety approach is well established in coal pillar design Factors of safety for coal pillars required to provide medium to long term stability should be greater than 16 [Galvin 2006 Hill 2005]
bull Coal pillar strength has been the subject of rigorous research since at least the 1960rsquos and the Salamon amp Munro formula has been applied in the design of over a million coal pillars in South Africa alone [Mark 1999 Salamon 1998] Strength formula derivations from the UNSW are established in Australia
bull Coal pillar load calculation traditionally relies on tributary area theory which is a conservative approach suitable for pillar design
bull Tributary area conditions are NOT satisfied at Collingwood Park pillars are irregular in size and shape there is large areas of unmined coal and the seam has significant dip
bull This last point is important as analytical methods hold the only hope of evaluating every pillar at Westfalen No 3 Colliery The numerical model of Duncan St analyses 46 pillars and requires significant computational resources the entire Colliery has in excess of 700 pillars and cannot be analysed by the same methods in its entirety by current computer codes in a reasonable time frame
bull Likewise it is not satisfactory to draw conclusions on panel stability from limited analysis of representative groupings of pillars because of the variability in size shape mining height and cover depth over the mining area
bull To overcome the limitations of tributary area theory for the back-analysis of an irregular pillar layout a novel approach for calculating loads based on pressure arch theory has been developed subjected to international peer review and published in the International Journal of Rock Mechanics and Mining Sciences In summary each pillar is individually examined and the pillar area circumference and centroid are calculated At the pillar centroid the cover depth and mining height are determined An influence zone based on a circular area with radius defined by the depth-dependent load transfer distance Within this area the local extraction ratio is calculated This approach has found to satisfactorily account for pillars of arbitrary shape in irregular layout with variable cover depth
bull This allows a FoS to be determined for the over 700 pillars of Westfalen No 3 with reasonable computer resources
A72 Typical pillar strength effects
Width to height ratio
bull Pillars at Westfalen No 3 have typical effective width from 20m to 50m While mining height is uncertain it is believed to range from 6m to 10m With these dimensions pillar wh ratio ranges from 20 to 83
bull At the lower limit of wh=20 geological influences will start to determine pillar strength [Galvin 2006] From wh in the range gt 20 to 40 the formula of Salamon and Munro or UNSW extensions could be expected to estimate pillar strength with the squat pillar version of these formula applicable for whgt40 [Galvin 2006 Salamon 1998 Galvin 1999]
bull The squat pillar extensions were developed since the standard formulas were found to underestimate pillar strength at whgt4 At Westfalen No 3 colliery although there are a number of pillars of whgt4 many of these are irregular in shape often long and relatively narrow (30m ndash 40m) Given this and the need to automate the assessment of every pillar the squat pillar strength formula is not utilised This approach is conservative
Pillar shape effects
bull Many pillars at Westfalen No 3 are skewed of diamond shape with acute internal angle from 50 to 90 degrees Hydraulic radius simile accounts for pillar shape by an effective width defined by 4AC while the UNSW has a parrellopid formula that for pillars of equal side length results in an effective width equivalent to this
bull In a study of pillar shapes common to Westfalen No 3 colliery the hydraulic radius analogy for estimation of effective width is found adequate with errors less than 6 for considered sizes and shapes
Post peak strength
bull Numerical studies and the work of Das in Indian coal fields highlights the changing post peak behaviour with increasing width to height ratiorsquos It has been determined that when wh exceeds approximately 5 pillars start to harden post peak When whlt3 pillars display limited if any post peak strength
bull The significance of this effect will be in the manner that pillars shed load to adjacent pillars In an array of pillars of similar dimensions pillars with a low wh ratio could be expected to shed load in a sudden more catastrophic manner than those that harden post peak Such sudden pillar failure is referred in the literature as catastrophic cascading or rolling pillar failure and has been responsible for damaging wind blasts and significant loss of life over the years
bull In an irregular pillar layout such as Westfalen No 3 with variable wh ratio significant barrier pillars and regions of unmined coal sudden multiple panel collapse would be expected to be less likely
bull The analytical approach developed for assessing pillar load accounts for load shed from a failed pillars to pillars within the zone of influence of that pillar
Specific details of this approach are discussed in the hazard map and risk assessment chapter of this report
Backfill effect
bull Numerical studies on a cohesive and non-cohesive backfill suggest that pillar strength is increased with increasing height of fill Studies suggest a 1MPa cohesive backfill may increase pillar strength by approximately 10 at 40 roadway fill for wh=33 and 18 at 40 roadway fill at wh=22 At 80 roadway fill pillar strength increases are predicted to exceed 50 Percentage strength increases are predicted to be greater with lower wh ratiorsquos
bull Studies of a non-cohesive backfill suggest at 80 roadway fill pillar strength increases are approximately 25
bull With both backfill types pillar strength is predicted to increases dramatically above 80 roadway fill and pillars are predicted to exhibit post-peak hardening behaviour
For example in the Duncan St area a pillar of effective width 20m will have a FoS of approximately 118 at mining height of 10m without backfill A 50 strength increase from 1MPa cohesive backfill at 80 roadway fill will raise the FoS to approximately 177 and reduce the probability of instability from approximately 1 in 10 to less than 1 in 1000
With 80 roadway fill of a non-cohesive backfill the same Duncan St pillar FoS will increase to approximately 147 and the probability of instability reduce to less than 1 in 100
bull Backfill is likely to reduce the rate of time dependent pillar strength degradation by reducing pillar spalling due to the erosive effects over time of high stress and exposure of the pillar surface to the atmosphere
bull In addition backfill is likely to benefit pillar stability by limiting the void available to the roof to fall into Roof falls particularly at roadway intersections may be present By reducing the roadway volume backfill will eventually support the roof when the bulking effect of roof falls fills the remaining roadway voids space Beyond this summary time dependent issues of backfill have not been considered
roadway
fill
Non-cohesive backfill
(7m mining height width 20m) strength increase
05 MPa cohesive backfill
(7m mining height width 20m)
strength increase
10 MPa cohesive backfill
(7m mining height width 20m)
strength increase
60 135 388 437
70 183 432 597
80
90
208
291
474
572
698
957
A73 Duncan St numerical model
bull In the Duncan St subsidence region approximately 46 pillars are surrounded by unmined coal to the west a large pillar containing the Waterline fault to the east and larger pillars to the south and north
bull At 6m mining height pillar minimum FoS for these 46 pillars is calculated at 131 with Pressure Arch theory and UNSW strength formula At 9m mining height minimum FoS is calculated as 099
bull Pillar probability of failure for FoS calculated by the UNSW eq(2) is given in [Galvin 2006] as
Table A-14 Factor of safety failure probabilities for UNSW pillar strength formula (after Galvin 2006)
Safety Factor Probability of pillar failure
087 8 10
100 5 10
122 1 10
13 5 100
138 2 100
144 1 100
163 1 1000
179 1 10000
195 1 100000
211 1 1000000
bull From Table A-14 at 6m mining height there is a 1 in 20 probability of instability and at 9m a 1 in 2 probability The variability in the database of failed and unfailed pillars from which eq (1) to eq (3) are derived is responsible for these probabilities Our numerical model should always predict failure if the FoS is less than 10 and always predict stability with FoS gt 10 since no such variability in geotechnical properties or conditions is used
bull While our numerical model predicts no pillar failure at 6m and pillar failure at 9m in reality there remains approximately a 1 in 20 chance of failure at 6m mining height If one pillar was to fail load transferred to adjacent pillars would reduce these adjacent pillars FoS and may well lead to the pillar failure and resultant subsidence observed at Duncan St
bull Based on the numerical results obtained using two mining heights the pillar and overburden failure is in line with analytical predictions from Pressure Arch theory and UNSW pillar strength calculation
bull Surface subsidence predicted from the 9m mining height numerical model is 196m While this value is in general agreement with monitoring data the model is not sufficiently calibrated since the real mining height in the region is unknown to be able to confidently predict final subsidence strains and tilts
bull With 1MPa cohesive backfill at a fill ratio of 83 the predicted strength increase is 70 With non-cohesive backfill at the same fill ratio the strength increase is 20 these values are in agreement with single pillar studies
bull Abutment stresses in the immediate roof sandstone unit (above the coal roof) are predicted to extend approximately 80m beyond the limits of the model This is in reasonable agreement with twice the load transfer distance of 64m (at 124m depth-of-cover) used to define a pillars zone of influence (the ZI also includes half pillar width ie 74m for 20m pillar)
A74 Numerical model of adjacent region
bull A numerical model of the region immediately to the east of the Duncan St failure region is constructed with 76 pillars
bull At 9m mining height the model predicts failure of 9 pillars but no significant overburden failure The model remains stable in general
bull With a 20 increase in gravity the model is predicted to fail
bull Numerical modelling results suggest the region to the east of the Waterline barrier pillar is stronger by approximately 20 than the subsided region to the west of the barrier pillar
bull Predicted surface subsidence (including compressive effects from gravity increase) is 13m all though numerical instabilities halt the model and true surface subsidence is likely to be higher
bull Inspection of yield at mid-pillar height suggests the southern pillars in the model have intact core when pillars in the middle of the region are failed in their entire volume In reality the southern region of this panel have greater depth-of-cover therefore higher pillar stresses and thus lower FoS in these southern pillars

0
1
2
3
4
5
6
7
8
9
10
Axia
l stre
ss (M
Pa)
Trapezoid pillar
6m pillar 7m pillar
8m pillar
0000 0010 0020 0030 0040 0050
Axial strain
Figure A-21 Stress vs strain curves for rectangular uniform height and trapezoidal non-uniform height pillars Strength of uniform pillars having heights of 6m 7m and 8m are compared with a trapezoidal non-uniform height pillar of having 6m height on one side and 8m on the other opposite side ie a variable height roadway of average 7m height
A45 Pillars created by multiple passes to variable depth
Roadways at Westfalen No 3 colliery were cut in multiple passes at a constant height of 24 m The cut widths were variable ranging from 52 m at the bottom to 76 m at the top as shown schematically in Figure A-22 by the mine managerrsquos hand drawings of the roadway mining method
To asses the strength of such pillars a 9 m high pillar with irregular side surface boundary is modelled Figure A-23 The model pillar has a square base of 23m and side length with three lsquocutsrsquo in its height as shown in Figure A-23
Predicted strength is approximately equal to a similar pillar with effective width equal to minimum width ie 20m in this case Figure A-24
Figure A-22 Sketch of roadways at Collingwood Park showing multiple passes or layers of cutting of the coal seam(from previous mine managersrsquo notes and records)
Figure A-23 Numerical modelling of a multi-pass cut pillar of 9 m height with minimum and maximum side widths of 20m and 23m respectively
0
1
2
3
4
5
6
7
8
Axi
al s
tres
s (M
Pa)
irregular pillar-min w idth 20m high and 9m w ide
square pillar-20m w ide and 9m high
0000 0005 0010 0015 0020 0025 0030 0035 0040
Axial strain
Figure A-24 Stress vs strain curves for pillars of 9m height with regular and irregular square cross-section (Figure A-23) Difference in peak strength predicted to be approximately 35
A5 ROADWAY BACKFILL AND PILLAR STRENGTH IMPROVEMENT
A literature review of backfill applications mechanical properties and behaviours in coal mining identified several examples from China [Guo 2007 Wang 2009] where backfill has been used to reduce surface subsidence from America [Tesarik 2002 2009] where backfill has been used primarily for disposal of fly-ash and reduce acid mine drainage and from Australia [Origin Alliance 2008] - See Table A-5 and the reference list
In the early stages of this modelling specific data and backfill effects and properties required in this numerical study were unavailable and therefore two cases were considered a cohesive backfill having a UCS of 1 MPa and a non-cohesive backfill with no cohesion but a friction angle of 42 degrees Subsequent to these two cases a case of 05MPa cohesive backfill mix was also considered
Backfill properties using in this study are list in
Table A-6
Table A-5 Backfill properties data from various sources
Composition UCS (MPa) E (GPa) Reference
Solid waste including fly-ash 05 initially
to 14-17
0565 Guo et al 2007
Fly-ash amp cement 339 ndash 824 Guo et al 2007
1 4 15 (cement) (fly-ash) (coal
gangue)
07 ndash 17 Wang et al 2009
Fly ash (dry) Scheetz 2009
22 1 (fly-ash) (cement) Scheetz 2009
Cemented rockfill in metal mine 69 1909 Tesarik 2009
Required properties 10 10 OriginAlliance ndash Mine
subsidence interpretive
reporting
P16
25 FA 105 sand 01 bentonite
5 FA 18 sand
Injection 3m intervals
Bell Bruyn 1999
Table A-6 Mechanical parameters of cohesive and non-cohesive backfill used in this numerical
study
Backfill Youngs Modulus (GPa)
Poissonrsquos Ratio UCS
(MPa)
Tensile Strength (MPa)
Cohesion (MPa)
Friction Angle (deg)
Dilation Angle (deg)
1MPa
Cohesive 0565 040 10 01 0117 400 100
05MPashy
cohesive 0565 040 05 005 0061 400 100
Non-
cohesive 0020 015 00 00 0000 420 75
A51 Numerical results and analysis
In order to quantify the influence of backfill on pillar strength in detail 180 models (60 models each for 1MPa 05MPa cohesive and non-cohesive backfill) of square coal pillars were analysed with the following parameters pillar width is 20m mining height is from 5m to 10m equivalent to a wh ratio of 2 to 4 percentage of backfill is from 0 to 90 Table A-7 summarises the results of these pillar strength analyses for all the cohesive and non-cohesive cases
Relationship between pillar strength and percentage of roadway backfill is presented in Figure Ashy25 Figure A-27 and Figure A-29 The raw data from Table A-7 has been calculated in uniform 10
backfill increments and is presented in Figure A-26 Figure A-28 and Figure A-30 As shown in these figures the percentage increase in pillar strength is approximately bilinear with increase in backfill
00
200
400
600
800
1000
1200
1400
1600 P
illar
stre
ngth
incr
ease
()
5m 6m 7m 8m 9m 10m
00 100 200 300 400 500 600 700 800 900 1000
Percentage of bacfill ()
Figure A-25 Pillar strength increase versus percentage of 1MPa cohesive backfill
00
200
400
600
800
1000
1200
1400
1600
Pill
ar s
tren
gth
incr
ease
()
10 backfill
20 backfill
30 backfill
40 backfill
50 backfill
60 backfill
70 backfill
80 backfill
90 backfill
4 5 6 7 8 9 10 11 12 Pillar height (m)
Figure A‐26 Pillar strength increase versus pillar height for 1MPa cohesive backfill
Table A-7 Pillar strength with increasing 1MPa and 05MPa cohesive backfill and non-cohesive backfill
Pillar strength Backfill
Approximate percentage of backfill
() 5 6
Pillar height (m)
7 8 9 10 Pillar
strength Without backfill 0 1007(00) 894(00) 795(00) 714(00) 647(00) 596(00)
(MPa) for different percentshyage of
10 20 30
1049(100) 1104(200) 1140(300)
940(83) 983(167)
1069(333)
833(71) 909(214) 947(286)
785(125) 820(188) 889(313)
720(111) 771(222) 803(278)
650(100) 710(200) 758(300)
backfill 1MPa 40 1205(400) 1130(417) 1046(429) 929(375) 869(389) 824(400)
Cohesive 50 1234(500) 1178(500) 1095(500) 1016(500) 943(500) 894(500) backfill 60 1292(600) 1208(583) 1143(571) 1098(625) 1009(611) 956(600)
70 1342(700) 1271(667) 1270(714) 1158(688) 1120(722) 1035(700) 80 1466(800) 1442(833) 1350(786) 1345(813) 1309(833) 1180(800) 90 1593(900) 1580(917) 1556(929) 1470(875) 1440(889) 1400(900) 10 1026(100) 930(83) 830(71) 773(125) 697(111) 636(100) 20 1081(200) 968(167) 896(214) 803(188) 754(222) 687(200) 30 1132(300) 1053(333) 939(286) 871(313) 786(278) 741(300)
05MPa 40 1184(400) 1098(417) 1018(429) 901(375) 853(389) 799(400) Cohesive 50 1217(500) 1141(500) 1065(500) 1000(500) 936(500) 873(500)
backfill 60 1240(600) 1167(583) 1102(571) 1054(625) 1009(611) 954(600) 70 1269(700) 1189(667) 1237(714) 1093(688) 1044(722) 1014(700) 80 1322(800) 1280(833) 1167(786) 1143(813) 1105(833) 1061(800) 90 1410(900) 1350(917) 1250(929) 1202(875) 1150(889) 1120(900)
Non-cohesive backfill
10 20
1016(100) 1028(200)
902(83) 912(167)
801(71) 819(214)
724(125) 732(188)
657(111) 670(222)
604(100) 615(200)
30 1044(300) 941(333) 832(286) 753(313) 678(278) 629(300)
Pillar strength Backfill
Approximate percentage of backfill
() 5 6
Pillar height (m)
7 8 9 10
40 1063(400) 961(417) 865(429) 767(375) 702(389) 649(400) 50 1086(500) 984(500) 885(500) 800(500) 729(500) 670(500) 60 1113(600) 1006(583) 904(571) 835(625) 760(611) 696(600) 70 1138(700) 1030(667) 943(714) 852(688) 792(722) 725(700) 80 1168(800) 1083(833) 963(786) 889(813) 829(833) 765(800) 90 1206(900) 1130(917) 1029(929) 913(875) 852(889) 804(900)
Figure A-27 Pillar strength increase versus pillar height for 05MPa cohesive backfill
4 5 6 7 8 9 10 11 12 13 Pillar height (m)
Figure A-28 Pillar strength increase versus percentage of 05MPa cohesive backfill
0
10
20
30
40
50
60
70
80
90
100
Pilla
r st
reng
th in
crea
se (
) 10 backfill
20 backfill
30 backfill
40 backfill
50 backfill
60 backfill
70 backfill
80 backfill
90 backfill
00
50
100
150
200
250
300
350
400
Perc
enta
ge o
f pill
ar s
tren
gth
incr
ease
()
5m
6m
7m
8m
9m
10m
00 100 200 300 400 500 600 700 800 900 1000
Percentage of bacfill ()
Figure A-29 Pillar strength increase versus percentage of non-cohesive backfill
00
50
100
150
200
250
300
350
400
Pilla
r st
reng
th in
crea
se (
)
10 backfill
20 backfill
30 backfill
40 backfill
50 backfill
60 backfill
70 backfill
80 backfill
90 backfill
4 5 6 7 8 9 10 11 12 Pillar height (m)
Figure A-30 Pillar strength increase versus pillar height for non-cohesive backfill
The modelling results suggest that the pillar strength will increase with increasing roadway backfill while the percentage increase of pillar strength is greater for the taller pillars than squat pillars it is observed that when the backfill is less than 40-50 the pillar strength increase is less sensitive to pillar height or wh ratio while over 40-50 backfill pillar strength rapidly increase with pillar height
A52 Comparison of three different kinds of backfill
Pillar strength improvement with 05 and 10 MPa cohesive backfill and non-cohesive backfill is presented in Figure A-31 to Figure A-33
0
10
20
30
40
50
60
70
Incr
ease
of p
illar
str
engt
h (
) 5m-00MPa
5m-05MPa
5m-10MPa
0 10 20 30 40 50 60 70 80 90 100
Percentage of backfill ()
Figure A-31 Comparison of 05 and 10 MPa cohesive backfill and non-cohesive backfill at 5m mining height
0
20
40
60
80
100
120
Incr
ease
of p
illar
str
engt
h (
)
7m-00MPa
7m-05MPa
7m-10MPa
0 10 20 30 40 50 60 70 80 90 100
Percentage of backfill ()
Figure A-32 Comparison of 05 and 10 MPa cohesive backfill and non-cohesive backfill at 7m mining height
Incr
ease
of p
illar
str
engt
h (
)
140
120
100
80
60
40
20
0
9m-00MPa
9m-05MPa
9m-10MPa
0 10 20 30 40 50 60 70 80 90 100
Percentage of backfill ()
Figure A-33 Comparison of 05 and 10 MPa cohesive backfill and non-cohesive backfill at 9m mining height
Modelling predicts that 05MPa is as effective as 10MPa at increasing pillar strength below approximately 50-60 roadway fill Modelling suggests that cohesive backfill is more effective at increasing pillar strength than non-cohesive fill
A53 Numerical study of the influence of interface between backfill and pillar
To investigate the influence of an interface between backfill and pillar on the strength response of coal pillar an interface is set between backfill and pillar as shown in Figure A-34 The interface property is list in Table A-8
Figure A-34 Sketch showing the position of interface between backfill and pillar
2
4
6
2
4
6
Table A-8 Mechanical parameters of interface used in numerical model
Interface Cohesion FrictionNormal stiffness (GPa) Shear stiffness (GPa) property (MPa) Angle (deg)
Value 20 20 0 5~40
Pillar strength of a 6m high pillar as interface friction angle is increased from 5 degrees to 40 degrees is displayed in
1212
1010
88
cohesive backfill with interface
cohesive backfill without interface
non-cohesive backfill with interface
non-cohesive backfill without interface
4 cohesive backfill with interface
cohesive backfill without interface
non-cohesive backfill with interface
non-cohesive backfill without interface
stre
ss (M
Pa)
stre
ss (M
Pa)
6
2
00 0000 0005 0010 0015 0020 0025 0030 0035 0040 0045 0000 0005 0010 0015 0020 0025 0030 0035 0040 0045
strain strain
Figure A-35 to Figure A-38
Modelling predicts a non-cohesive interface with friction angle below 20 degrees results in a slight reduction in pillar strength above 20 degrees the interface is predicted to have little influence on pillar strength
cohesive backfill with interface
cohesive backfill without interface
non-cohesive backfill with interface
non-cohesive backfill without interface
1212
1010
88
cohesive backfill with interface
cohesive backfill without interface
non-cohesive backfill with interface
non-cohesive backfill without interface
stre
ss (M
Pa)
stre
ss (M
Pa)
6
4
2
0 0
0000 0005 0010 0015 0020 0025 0030 0035 0040 0045 0000 0005 0010 0015 0020 0025 0030 0035 0040 0045
strain strain
Figure A-35 Post peak pillar for 6m high pillar (wh=33) with friction angle 5deg on left 10deg on right of interface between backfill and pillar
2
4
6
cohesive backfill with interface
cohesive backfill without interface
non-cohesive backfill with interface
non-cohesive backfill without interface
1212
1010
88
cohesive backfill with interface
cohesive backfill without interface
non-cohesive backfill with interface
non-cohesive backfill without interface
stre
ss (M
Pa)
stre
ss (M
Pa)
6 6
44
2 2
0 0 0000 0005 0010 0015 0020 0025 0030 0035 0040 0045 0000 0005 0010 0015 0020 0025 0030 0035 0040 0045
strain strain
Figure A-36 Post peak pillar for 6m high pillar (wh=33) with friction angle 15deg on left 20deg on right of interface between backfill and pillar
12
cohesive backfill with interface
cohesive backfill without interface
non-cohesive backfill with interface non-cohesive backfill without interface
12
10 10
8 8
cohesive backfill with interface
cohesive backfill without interface
non-cohesive backfill with interface
non-cohesive backfill without interface
stre
ss (M
Pa)
stre
ss (M
Pa)
6 6
4 4
2 2
0 0 0000 0005 0010 0015 0020 0025 0030 0035 0040 0045 0000 0005 0010 0015 0020 0025 0030 0035 0040 0045
strain strain
Figure A-37 Post peak pillar for 6m high pillar (wh=33) with friction angle 25deg on left 30deg on right of interface between backfill and pillar
12
cohesive backfill with interface
cohesive backfill without interface
non-cohesive backfill with interface non-cohesive backfill without interface
12
10 10
8 8
cohesive backfill with interface
cohesive backfill without interface
non-cohesive backfill with interface
non-cohesive backfill without interface
stre
ss (M
Pa)
stre
ss (M
Pa)
6
4
2
0 0000 0005 0010 0015 0020 0025 0030 0035 0040 0045
0 0000 0005 0010 0015 0020 0025 0030 0035 0040 0045
strain strain
Figure A-38 Post peak pillar for 6m high pillar (wh=33) with friction angle 35deg on left 40deg on right of interface between backfill and pillar
22
6
8
24
A54 Post peak pillar strength
A full stress strain curve to approximately 35 strain is presented in the following figures for 1MPa cohesive and non-cohesive backfill Results for 05MPa cohesive backfill sit approximately mid-way between these two cases and are included in the summary Table A-9
24 24
0000 0010 0020 0030 0040 0050
Average axial strain of coal pillar
000
2000
3000
4000
5000
6000
7000
8000
9000
22
0000 0010 0020 0030 0040 0050
Average axial strail of coal pillar
000
2000
3000
4000
5000
6000
7000
8000
9000
20 20
18
Ave
rage
str
ess
of c
oal p
illar
(MPa
)
Ave
rage
str
ess
of c
oal p
illar
(MPa
)
18
16 16
1414
12 12
1010
88
66
44
22
00
Figure A-39 Post peak pillar strength with increasing backfill 5m high pillar (wh=40) with 1MPa cohesive backfill on left non-cohesive backfill on right
24
22
0000 0010 0020 0030 0040 0050
Average axial strain of coal pillar
00
250
333
417 500
583
667 833
917
22
0000 0010 0020 0030 0040 0050
Average axial strain of coal pillar
00
250 333
417
500 583
667
833
917
20 20
Ave
rage
str
ess
of c
oal p
illar
(MPa
)
18 18
16 16
14 14
12 12
10 10
8
6
4 4
2 2
0 0
Figure A-40 Post peak pillar strength with increasing backfill 6m high pillar (wh=33) with cohesive backfill on left non-cohesive backfill on right
Aver
age
stre
ss o
f coa
l pill
ar (M
Pa)
4
6
8
10
12
14
16
18
2
4
6
8
0000 0005 0010 0015 0020 0025 0030 0035 0040 0045
Average axial strain of coal pillar
000
2140
2860
4290
5000
5710
7140
7860
9290
2020
0000 0005 0010 0015 0020 0025 0030 0035 0040 0045
Average axial strain of coal pillar
000
2140
2860
4290
5000
5710
7140
7860
9290
18
Ave
rage
str
ess
of c
oal p
illar
(MPa
) A
vera
ge s
tres
s of
coa
l pill
ar (M
Pa)
Aver
age
stre
ss o
f coa
l pill
ar (M
Pa) 16
14
12
10
8
6
4
22
00
Figure A-41 Post peak pillar strength with increasing backfill 7m high pillar (wh=29) with cohesive backfill on left non-cohesive backfill on right
14 14
0
000
2500
3130
3750
5000 6250
6880
8130
8750
0
000
2500
3130
3750
5000
6250
6880
8130
8750
12 12
10
Ave
rage
str
ess
of c
oal p
illar
(MPa
)
10
8
6
4
2
0000 0010 0020 0030 0040 0050 0000 0010 0020 0030 0040 0050
Average axial strain of coal pillar Average axial strain of coal pillar
Figure A-42 Post peak pillar strength with increasing backfill 8m high pillar (wh=25) with cohesive backfill on left non-cohesive backfill on right
2
4
6
8
10
12
14
2
4
6
8
14
12
Ave
rage
str
ess
of c
oal p
illar
(MPa
) A
vera
ge s
tres
s of
coa
l pill
ar (M
Pa)
0
000 2220 2780 3890 5000 6110 7220 8330 8890
0
000 2220 2780 3890 5000 6110 7220 8330 8890
Ave
rage
str
ess
of c
oal p
illar
(MPa
)
10
8
6
4
2
0000 0005 0010 0015 0020 0025 0030 0035 0040 0000 0005 0010 0015 0020 0025 0030 0035 0040
Average axial strain of coal pillar Average axial strain of coal pillar
Figure A-43 Post peak pillar strength with increasing backfill 9m high pillar (wh=22) with cohesive backfill on left non-cohesive backfill on right
12 12
0
000 2500
3000 4000
5000 6000
7000 8000
9000
0
000
2500
3000
4000
5000
6000
7000
8000
9000
10
Ave
rage
str
ess
of c
oal p
illar
(MPa
) 10
8
6
4
2
0000 0005 0010 0015 0020 0025 0030 0035 0000 0005 0010 0015 0020 0025 0030 0035
Average axial strain of coal pillar Average axial strain of coal pillar
Figure A-44 Post peak pillar strength with increasing backfill 10m high pillar (wh=20) with cohesive backfill on left non-cohesive backfill on right
The amount of backfill to achieve the transition between strain softening and hardening is presented in Table A-9 for all mining height The values in this table are estimated from the stress-strain curve analysed to 35 of strain and are depended on the backfill increment which is in turn dependent on the ratio of mining height to the calibrated element size 05m
Table A-9 Percentage of roadway backfill that leads to a transition from strain softening to hardening
Pillar height Non-cohesive 05MPa Cohesive 10MPa Cohesive backfill backfill backfill
5m 300 200 200
6m 500 417 333
7m 571 500 429
8m 625 625 500
9m 722 722 611
10m 800 800 700
The modelling results suggest that the average axial stress of coal pillar increases with compression until peak stress is reached In the post-failure region pillar stress is reduced as strain increases for all models without backfill All the model results predict that there would be a change to strain hardening behaviour as percentage of backfill increases For example this transition point is 333 for 10 MPa cohesive backfill while 50 for non-cohesive backfill with 6m mining height as shown in Table A-9 It can also be seen from Table A-9 that tall pillars need more backfill than squat pillars to achieve the change from strain softening to hardening for either cohesive backfill or non-cohesive backfill
A55 Backfill for diamond shaped pillars
A 7m high diamond shaped pillar with 50 degree skew angle is analysed with increasing level of backfill in surrounding roadways On the skewed angle the backfill is constrained with roller boundary conditions normal to the skewed angle to represent symmetry conditions and a 5m wide roadway
Figure A-45 Numerical model of diamond shaped pillar with backfill on left and boundary conditions on right
The predicted strength of a diamond shaped pillar and equivalent square pillar with increasing roadway backfill of both cohesive and non-cohesive models is presented in Figure A-46 and Figure A-47
6
7
8
9
10
11
12
13
0 10
Pilla
r str
engt
h (M
Pa)
20 30 40 50 60 70 80 90 100
Percentage of backfill ()
Skew pillar
Square pillar
0
10
20
30
40
50
60
70
0 10
Incr
ease
of p
illar
str
engt
h (
)
20 30 40 50 60 70 80 90 100
Percentage of backfill ()
Skew pillar
Square pillar
Figure A-46 Predicted pillar strength of diamond and square shaped pillars with increasing percentage of 1MPa cohesive backfill On left is absolute strength and on right is percentage strength increase
6
7
8
9
10
11
0 10
Pilla
r stre
ngth
(MP
a)
20 30 40 50 60 70 80 90 100
Percentage of backfill ()
Skew pillar
Square pillar
0
5
10
15
20
25
30
35
0 10
Incr
ease
of p
illar
str
engt
h (
)
20 30 40 50 60 70 80 90 100
Percentage of backfill ()
Skew pillar
Square pillar
Figure A-47 Predicted pillar strength of diamond and square shaped pillars with increasing percentage of non-cohesive backfill On left is absolute strength and on right is percentage strength increase
A56 Backfill placed after significant pillar yield
A pillar model with 90 non-cohesive backfill placed after yielding of a 7m high pillar is presented in Figure A-48 The percentage of strength increase is given in Table A-10 It is found that the pillar strength increase is lower if the pillar has undergone significant deformation before the placement of backfill It is predicted that 90 backfill results in a strain-hardening pillar behaviour even if the pillar has previously yielded significantly
Ave
rage
stre
ss o
f coa
l pill
ar (M
Pa)
18 without backfill 025 strain 050 strain
14
16
075 strain 100 strain
12 125 strain 150 strain
10 175 strain 200 strain
8
6
4
2
0 0000 0005 0010 0015 0020 0025 0030 0035 0040 0045 0050
Average strain of coal pillar
Figure A-48 Stress strain curves for backfill placed around the pre-strained pillar displaying state of pillar core upon placement of backfill
Table A-10 Pillar strength increase with 90 non-cohesive backfill placed around a pre-strained 7m high square pillar of 20m width
Percentage backfill ()
Strain at placement of non-cohesive backfill ()
Pillar strength (MPa)
Percentage increase in peak
strength ()
Percentage increase in post-peak
strength at 3 strain ()
0 000 7953 000
90 000 10290 2939
90 025 9156 1513
90 050 8965 1272
90 075 8526 720
90 100 7945 26006
90 125 7951 22608
90 150 7951 18917
90 175 7951 15629
90 200 7951 11134
A6 3D MODEL OF DUNCAN ST FAILURE PANEL
A61 Numerical model
A three dimensional model of 46 pillars in the Duncan St subsidence region has been analysed with over burden geology based on hole CP1 and a constant overburden depth of 124m Figure A-49 Figure A-50 and Figure A-51 Uniform mining heights of 6m and 9m have been analysed
Selection of the pillars to be analysed is based on visual inspection of the panel layout and includes pillars bounded by unmined coal to the west the waterline barrier pillar to the east larger pillars to the south and a panel of slightly larger pillars of different orientation to the north
One row of pillars in the middle of this panel trending from north-west to south-east are of smaller dimension than the average and of diamond shape with acute internal angle of approximately 50degrees Being in the approximate middle of the panel close to full tributary area load will be mobilised on this row of pillars and therefore it is believed pillars in this row initiated the 2008 subsidence event
The Duncan Street numerical model has the following objectives
bull Estimation of pillar stresses and FoS for comparison with empirical formula
bull Comparison of backfill response at panel scale with previous single pillar studies
bull Estimation of surface subsidence at given percentage roadway fill
bull Estimation of extent of abutment stresses due to panel failure
A62 Observations from Duncan Street numerical model
bull At 6m mining height the minimum pillar FoS for these 46 pillars is calculated to be 131 using Pressure Arch theory and UNSW strength formula panel failure is not predicted with this mining height by the model At 9m mining height the minimum FoS is calculated as 099 and panel failure is predicted to occur
bull The probability of pillar failure for associated FoS calculated by the UNSW pillar strength formula Eq(2) is given in Galvin 2006 in Table A-11 The relationship was developed for square pillars using the Australian pillar database and tributary area theory and hence theoretically speaking may not directly apply to this study However it can be taken as a general guide
bull From Table A-11 it is seen that there is a 1 in 20 probability of instability at 6m mining height and a 1 in 2 probability at 9m mining height Numerical modelling is however a deterministic approach and it always predicts failure if the FoS is less than 10 and stability if FoS gt 10 since no variation in geotechnical properties or conditions is used
bull Although our numerical models predict no pillar failure at 6m and panel failure at 9m in reality there remains approximately a 1 in 20 chance of failure at 6m mining height If one pillar was to fail load transferred to adjacent pillars would reduce the FoS of these adjacent pillars and could lead to the pillar failure and subsidence as observed at 2008 event region
Table A-11 Factor of safety failure probabilities for UNSW pillar strength formula
(after Galvin 2006)
Safety Factor Probability of pillar failure
087 8 10
100 5 10
122 1 10
130 5 100
138 2 100
144 1 100
163 1 1000
179 1 10000
195 1 100000
211 1 1000000
bull Based on the numerical results obtained using two mining heights the pillar and overburden failure is consistent with analytical predictions from Pressure Arch theory and UNSW pillar strength calculation
bull Surface subsidence predicted from the numerical model with a mining height of 9m is 196m While this value is in approximate agreement with monitoring data (14mshy15m) the model was not sufficiently calibrated since the real mining height in the region is uncertain to be able to confidently predict final subsidence strains and tilts at the site
bull With 1MPa cohesive backfill at a roadway fill ratio of 83 the predicted strength increase is 70 With non-cohesive backfill at the same fill ratio the strength increase is 20 These values are in agreement with the results for single pillars
bull The numerically predicted surface subsidence with 83 roadway fill is 022m Maximum predicted tilt in east-west direction is 7mmm and in north-south direction is 5mmm Analytical formula [Holla amp Barclay 2000] predict maximum tilt of 53mmm for this amount of subsidence
bull Isolated cohesive backfill surrounding pillars of low wh ratio is predicted to be effective in confining the pillar and increasing peak pillar strength and panel stability Isolated non-cohesive backfill without barriers could not be analysed in this numerical model as backfill lsquoflowsrsquo and numerical stability could not be achieved
bull Stress transfer in the immediate roof sandstone unit (above the coal roof) is predicted to extend approximately 80m beyond the limits of the collapsed panel This is in reasonable agreement with theoretical studies
Figure A-49 Duncan St modelled panel with outline of adjacent modelled panel location of representative open hole CP1 file named ldquoAppendix B2 open hole logsrdquo located in directory ldquoCollingwood Park Subsidence 2B Collingwood Park Mine Subsidence Reports 1988 Eventsrdquo and mine subsidence limit contour
A63 Model properties
Overburden geology is based on borehole CP1 the most complete interpreted available hole drilled in 1988 by Queensland Department of Mines Figure A-50 To include this in the numerical model lithological units had to be coalesced into major units of sandstone (SS) siltstone (SL) mudstone (MS) weathered units and coal Figure A-51
Rock properties for the overburden were determined from a 2D parametric study whereby the UCS of all units was scaled to achieve pillar and overburden failure at 8m mining height Table A-12 and Table A-13
Unit top depth thickness unit thickness
thickness scaled
thickness in model
000 1200 1200 1046 1000 1200 700 SS 700 610 600 1900 600 MS 600 523 500 2500 1100 SS 1300 1133 1100 3600 200 SS 000 3800 100 SL 1000 871 900 3900 100 MS 000 4000 500 000 4500 100 000 4600 100 000 4700 100 000 4800 100 SS 400 349 400 4900 300 SS 000 5200 300 SL 700 610 600 5500 100 MS 000 5600 300 MS 000 5900 400 SS 500 436 400 6300 100 SS 000 6400 400 SL SS 900 784 800 6800 100 SL MS 000 6900 100 SL 000 7000 200 SL MS 000 7200 100 SS SL 000 7300 200 SS 1000 871 900 7500 200 SL 000 7700 200 SS SL 000 7900 200 SS 000 8100 100 SL 000 8200 100 SS 000 8300 200 SL 4350 3790 3800 8500 200 SL 000 8700 100 SS 000 8800 100 COAL 000 8900 200 000 9100 100 000 9200 100 000 9300 100 SL MS 000 9400 300 SL MS SS 000 9700 100 000 9800 100 SL MS 000 9900 400 SL SS 000 10300 200 SS MS 000 10500 100 SL MS 000 10600 200 SL MS SS 000 10800 100 000 10900 400 SL MS 000 11300 400 SL SS 000 11700 100 SS MS 000 11800 300 000 12100 400 SL SS 000
SL MS MS SS
MS
MS
SL
MS SS SL SS SL MS MS
weathering
SL MS SS
12500 150 000 12650 450 850 741 750 13100 400 SS 000 13500 100 MS SL
SS SL 960 837 500
13600 200 13800 100 SS 13900 200 14100 360
SS SL SL MS
14460 470 COAL MINING SEAM 600 14930 FLOOR
Figure A-50 Inferred geology from representative borelog CP1 used in numerical model
weathering SS
Unit Depth floor below surface Num elements Unit Unit name in model surface 0
10 3 16 weather 16 2 15 ss6
MS 21 2 14 ms2 SS 32 4 13 ss5 SL 41 3 12 sl3 SS 45 1 11 ss4 MS 51 2 10 ms1 SS 55 1 9 ss3 SL 63 3 8 sl2 SS 72 3 7 ss2 SL 1055 11 6 sl1 SS 113 4 5 ss1 SEAMR 118 3 4 seamr SEAM 124 3 3 seam FLOOR1 134 3 2 floor2 FLOOR2 250 10 1 floor1
Figure A-51 Coalesced units for numerical model based on hole CP1
Insitu stress is unknown at the site so a horizontal to vertical stress gradient of 15 has been assumed Given that the extensive workings were undertaken 20 to 30 years before the 2008 event horizontal stresses in the mining seam would be considerably disturbed from the pre-mining conditions
Table A-12 Rock properties for softening mohr coloumb material Softening rates of coal friction angle is 6 degrees over 2 plastic strain and total loss of cohesion over 24 plastic strain in coal and over 1 in other rocks Determined from pillar studies
E
nu Bulk Shear UCS UCS Phi Dilation Coh Tensile Strength (GPa) (GPa) (GPa) (MPa) scaled angle (MPa) (MPa)
SS 75 02 4167 3125 50 125 40 2 291 125
SL 4 025 2667 1600 30 75 35 2 195 075
MS 3 025 2000 1200 15 375 32 2 104 0375
Weathering 1 025 0667 0400 8 2 32 2 055 02
COAL 11 03 0917 0423 12 3 36 6 076 003
FLOOR1 4 025 2667 1600 30 75 38 2 183 075
FLOOR2 4 025 2667 1600 30 75 38 2 183 075
Table A-13 Ubiquitous joint properties Softening rate of ubiquitous joints total loss of cohesion over 1 plastic strain Determined from 2D overburden studies
Cohesion Ubiq joint cohesion Tensile Strength Ubiq joint tensile strength Ubiq joint (MPa) (MPa) (MPa) (MPa) friction
SS 291 00029144 125 0000125 15 SL 195 00019521 075 0000075 15 MS 104 00010393 0375 00000375 15 Weathering 055 00005543 02 000002 15 COAL 076 003 FLOOR1 183 - 075 - -FLOOR2 183 075 -
A64 Results from 3D Duncan St model
Factor of Safety estimated at 6m and 9m mining heights
Figure A-52 Pillar FoS calculated for 6m mining height by analytical method with strength by eq(3) and pillar stress by pressure arch theory Minimum value is 131 suggesting a 5 in 100 probability of failure however not sufficient to fail in the numerical model (that requires FoS lt 10)
Figure A-53 Pillar FoS calculated analytically for 9m mining height (eq(3) and PA theory) Minimum value is 099 suggesting a probability of failure of 5 in 10 although in the numerical model failure should occur
Yield on plane for 6m and 9m mining heights
Figure A-54 Location of section plane used for section view in following figures
Figure A-55 Yield on section plane for 6m mining height No significant damage or displacement observed
Figure A-56 Yield on section plane for 9m mining height no backfill
Figure A-57 Displacement on section plane for 9m mining height no backfill Maximum displacement is approximately 15m at surface
Results on horizontal plane at mid-pillar height
Figure A-58 Yield at mid-pillar height 9m mining height Blue elements evident in some pillars indicating pillar core remains intact
Figure A-59 Predicted vertical stress at mid pillar height 9m mining height Insitu stress is 30MPa Unyielded pillars and pillars hardening after yield are transferring vertical load while yielded pillars carry little load Extent of abutment stress increase is approximately 80m
Figure A-60 Roof vertical stress predicted by numerical model with 9m mining height Contour increments are 01MPa Base vertical stress is approximately 27MPa Abutment stress influence distance is approximately 80m
Results on surface after panel failure at 9m mining height
Figure A-61 Surface subsidence as predicted with numerical model with 9m mining height and total subsidence along Duncan St to McLaughlin St as monitored to October 09 Maximum surface subsidence predicted as 196m Outline of numerical modelling pillars and dotted contour of observed subsidence limit
A65 Duncan St model ndash backfill effectiveness
The Duncan St 3D model has been analysed with full and targeted 1MPa cohesive and non-cohesive backfill placed in roadways Roadway fill of 66 is analysed for the 1MPa cohesive mixture and 83 roadway fill for the non-cohesive mix
Results are presented in the following figures and figure captions
Factor of Safety increase from cohesive backfill
Analysis of the Duncan St model with 9m mining height is undertaken to estimate the FoS increase from backfill By increasing gravity in increments the backfill strength improvement is quantified With 83 roadway fill of 1MPa cohesive backfill the overburden and pillar tops (ie region of pillar above height of backfill) fails with gravity of 17ms2 suggesting the pillars with FoS of approximately 10 has increased FoS to 17 by backfilling adjacent roadways
Figure A-62 Gravity of 16g with 83 1MPa cohesive backfill showing no significant yield
Figure A-63 Gravity of 17g with 83 1MPa cohesive backfill predicting failure of pillar tops and overburden and collapse of roadway void space
FoS increase with non-cohesive backfill
With non-cohesive backfill pillars yielded due to lack of confinement upon initial placement of backfill in roadways but overburden remain stable and void space above backfill remained open Overburden remained stable at gravity increase to 11ms2 Figure A-64 but collapsed at gravity increase of 12ms2 Figure A-65
Figure A-64 Gravity of 11g with 83 non-cohesive backfill predicting pillar yield but overburden stability
Figure A-65 Gravity of 12g with 83 non-cohesive backfill predicting failure of pillars and overburden and collapse of roadway void space Maximum surface subsidence is 055m which includes the compressive effect of the 12g gravity increase
Placement of targeted backfill
A model is analysed with cohesive backfill totally surrounding two pillars with low predicted FoS The two pillars are predicted to have a FoS of 099 and 100 left to right viewed from above at a 9m mining height Backfill extends to an extent of 5m to 10m from the pillar and is 6m high in the roadways Gravity increase to 12g required to fail panel suggesting panel strength increase is approximately 20 from targeted backfill Predicted surface subsidence 125m (excessive mesh deformation stops analysis equilibrated stage may have higher surface subsidence)
Figure A-66 Duncan St model with 66 roadway fill of 1MPa cohesive backfill surrounding two pillars with low FoS at 9m mining height
Figure A-67 Predicted yield at mid pillar height of 9m pillars with 66 roadway fill of 1MPa cohesive backfill Note intact core (blue) for targeted pillars
Figure A-68 Pillar strength at 9m mining height Strength WITHOUT BACKFILL of northern focus pillar selected for targeted backfill is 527MPa and southern focus pillar is 526MPa
Figure A-69 Vertical stress in pillars targeted for partial backfill placement Stress calculated at equilibrium of elasto-plastic analysis WITHOUT BACKFILL Stress in northern focus pillar is 54MPa and in southern focus pillar is 513 FoS of NFP=52754 = 0975 FoS of SFP=526513 = 1025
Non-cohesive backfill in targeted placement study
A model with targeted placement of non-cohesive backfill was attempted but could not be satisfactorily converged since backfill lsquoflowsrsquo and inter-penetrates elements resulting in numerical instabilities
Forcing pillars to fail to examine resultant subsidence
To examine the extent of surface subsidence if backfilled pillars fail the numerical model with 9m mining height and 83 roadway fill of 1MPa cohesive backfill is analysed with a 90 reduction in coal pillar strength properties
With 9m mining height and 83 roadway fill of cohesive backfill void space remaining is 15m and the numerical model predicts failure of pillars and overburden results in approximately 02m surface subsidence
Figure A-70 Surface subsidence predicted by numerical model when pillars forced to fail with 83 roadway fill Contour interval is 01m with maximum subsidence predicted as 022m
Figure A-71 Surface strain in east-west direction when pillars forced to fail resulting 022m surface subsidence Maximum strain is 5mmm and contour interval is 1mmm
Figure A-72 Surface strain in north-south direction when pillars forced to fail resulting 022m surface subsidence Maximum strain is 3mmm and contour interval is 1mmm
Figure A-73 Tilt in east-west direction Units are mmm and intervals are 1mmm maximum tilt is 7mmm
Figure A-74 Tilt in north-south direction Units are mmm and intervals are 1mmm maximum tilt is 5mmm
To highlight the need for adequate fill the model with 66 roadway fill is analysed with the pillars forced to fail with a 50 reduction in pillar strength Void space over the backfill in the roadways is 30m Modelling predicts maximum surface subsidence of 068m
Figure A-75 Surface subsidence when pillars forced to fail with 66 roadway fill Roadway void space is 30m with the model predicting 068m surface subsidence Contour interval is 01m
A66 Numerical model of adjacent high risk area
Numerical model and panel stability
A numerical model of the region adjacent to Duncan St incorporating 76 pillars is analysed at 9m mining height Overburden strata strengths and depth-of-cover is consistent with Duncan St model
The main objective of this model is to estimate the strength difference between the two mining panels west and east of the Waterline fault Given uniform mining height and depth-of-cover the strength difference will be due to the pillar configuration and boundary conditions
At 9m mining height the model is predicted to be essentially stable although 9 pillars are predicted to be fully yielded at mid-pillar height
With gravity increase of 10 the model remains stable At 20 increase in gravity the model is predicted to fail with significant overburden yield
It is concluded therefore that the panel to the east of Waterline fault is 20 stronger than the panel to the west
Figure A-76 Location of numerical model 2 together with surface subsidence contours from 1988 and 2008 events and seam level eastern boundary of failure predicted from 3D seismic
Figure A-77 Yield on section at mid-height for 9m mining height
Figure A-78 Rockmass yield on vertical section trending east-west at mid-point of model Note overburden is largly intact with no extensive collapse
Figure A-79 Pillars predicted to have failed from Numerical model 2 with surface subsidence contours and inferred eastern limit of failed zone at seam level
By a 20 increase in gravity the model is forced to fail resulting in predicted 13m surface subsidence that includes increased overburden compression from increased gravitational component Excessive deformation and numerical instability stopped the model true surface deformation may be higher
Figure A-80 Adjacent model with 9m mining height Predicted surface subsidence after 20 increase in gravity Model predicts 13m surface subsidence
Figure A-81 Adjacent model with 9m mining height and 20 gravity increase Predicted failure at mid-pillar height Note intact core in southern pillars which appear stronger from unmined adjacent coal and larger general pillar size
A7 CONCLUSIONS
A71 Current knowledge on coal pillars behaviour
bull The strength based factor-of-safety approach is well established in coal pillar design Factors of safety for coal pillars required to provide medium to long term stability should be greater than 16 [Galvin 2006 Hill 2005]
bull Coal pillar strength has been the subject of rigorous research since at least the 1960rsquos and the Salamon amp Munro formula has been applied in the design of over a million coal pillars in South Africa alone [Mark 1999 Salamon 1998] Strength formula derivations from the UNSW are established in Australia
bull Coal pillar load calculation traditionally relies on tributary area theory which is a conservative approach suitable for pillar design
bull Tributary area conditions are NOT satisfied at Collingwood Park pillars are irregular in size and shape there is large areas of unmined coal and the seam has significant dip
bull This last point is important as analytical methods hold the only hope of evaluating every pillar at Westfalen No 3 Colliery The numerical model of Duncan St analyses 46 pillars and requires significant computational resources the entire Colliery has in excess of 700 pillars and cannot be analysed by the same methods in its entirety by current computer codes in a reasonable time frame
bull Likewise it is not satisfactory to draw conclusions on panel stability from limited analysis of representative groupings of pillars because of the variability in size shape mining height and cover depth over the mining area
bull To overcome the limitations of tributary area theory for the back-analysis of an irregular pillar layout a novel approach for calculating loads based on pressure arch theory has been developed subjected to international peer review and published in the International Journal of Rock Mechanics and Mining Sciences In summary each pillar is individually examined and the pillar area circumference and centroid are calculated At the pillar centroid the cover depth and mining height are determined An influence zone based on a circular area with radius defined by the depth-dependent load transfer distance Within this area the local extraction ratio is calculated This approach has found to satisfactorily account for pillars of arbitrary shape in irregular layout with variable cover depth
bull This allows a FoS to be determined for the over 700 pillars of Westfalen No 3 with reasonable computer resources
A72 Typical pillar strength effects
Width to height ratio
bull Pillars at Westfalen No 3 have typical effective width from 20m to 50m While mining height is uncertain it is believed to range from 6m to 10m With these dimensions pillar wh ratio ranges from 20 to 83
bull At the lower limit of wh=20 geological influences will start to determine pillar strength [Galvin 2006] From wh in the range gt 20 to 40 the formula of Salamon and Munro or UNSW extensions could be expected to estimate pillar strength with the squat pillar version of these formula applicable for whgt40 [Galvin 2006 Salamon 1998 Galvin 1999]
bull The squat pillar extensions were developed since the standard formulas were found to underestimate pillar strength at whgt4 At Westfalen No 3 colliery although there are a number of pillars of whgt4 many of these are irregular in shape often long and relatively narrow (30m ndash 40m) Given this and the need to automate the assessment of every pillar the squat pillar strength formula is not utilised This approach is conservative
Pillar shape effects
bull Many pillars at Westfalen No 3 are skewed of diamond shape with acute internal angle from 50 to 90 degrees Hydraulic radius simile accounts for pillar shape by an effective width defined by 4AC while the UNSW has a parrellopid formula that for pillars of equal side length results in an effective width equivalent to this
bull In a study of pillar shapes common to Westfalen No 3 colliery the hydraulic radius analogy for estimation of effective width is found adequate with errors less than 6 for considered sizes and shapes
Post peak strength
bull Numerical studies and the work of Das in Indian coal fields highlights the changing post peak behaviour with increasing width to height ratiorsquos It has been determined that when wh exceeds approximately 5 pillars start to harden post peak When whlt3 pillars display limited if any post peak strength
bull The significance of this effect will be in the manner that pillars shed load to adjacent pillars In an array of pillars of similar dimensions pillars with a low wh ratio could be expected to shed load in a sudden more catastrophic manner than those that harden post peak Such sudden pillar failure is referred in the literature as catastrophic cascading or rolling pillar failure and has been responsible for damaging wind blasts and significant loss of life over the years
bull In an irregular pillar layout such as Westfalen No 3 with variable wh ratio significant barrier pillars and regions of unmined coal sudden multiple panel collapse would be expected to be less likely
bull The analytical approach developed for assessing pillar load accounts for load shed from a failed pillars to pillars within the zone of influence of that pillar
Specific details of this approach are discussed in the hazard map and risk assessment chapter of this report
Backfill effect
bull Numerical studies on a cohesive and non-cohesive backfill suggest that pillar strength is increased with increasing height of fill Studies suggest a 1MPa cohesive backfill may increase pillar strength by approximately 10 at 40 roadway fill for wh=33 and 18 at 40 roadway fill at wh=22 At 80 roadway fill pillar strength increases are predicted to exceed 50 Percentage strength increases are predicted to be greater with lower wh ratiorsquos
bull Studies of a non-cohesive backfill suggest at 80 roadway fill pillar strength increases are approximately 25
bull With both backfill types pillar strength is predicted to increases dramatically above 80 roadway fill and pillars are predicted to exhibit post-peak hardening behaviour
For example in the Duncan St area a pillar of effective width 20m will have a FoS of approximately 118 at mining height of 10m without backfill A 50 strength increase from 1MPa cohesive backfill at 80 roadway fill will raise the FoS to approximately 177 and reduce the probability of instability from approximately 1 in 10 to less than 1 in 1000
With 80 roadway fill of a non-cohesive backfill the same Duncan St pillar FoS will increase to approximately 147 and the probability of instability reduce to less than 1 in 100
bull Backfill is likely to reduce the rate of time dependent pillar strength degradation by reducing pillar spalling due to the erosive effects over time of high stress and exposure of the pillar surface to the atmosphere
bull In addition backfill is likely to benefit pillar stability by limiting the void available to the roof to fall into Roof falls particularly at roadway intersections may be present By reducing the roadway volume backfill will eventually support the roof when the bulking effect of roof falls fills the remaining roadway voids space Beyond this summary time dependent issues of backfill have not been considered
roadway
fill
Non-cohesive backfill
(7m mining height width 20m) strength increase
05 MPa cohesive backfill
(7m mining height width 20m)
strength increase
10 MPa cohesive backfill
(7m mining height width 20m)
strength increase
60 135 388 437
70 183 432 597
80
90
208
291
474
572
698
957
A73 Duncan St numerical model
bull In the Duncan St subsidence region approximately 46 pillars are surrounded by unmined coal to the west a large pillar containing the Waterline fault to the east and larger pillars to the south and north
bull At 6m mining height pillar minimum FoS for these 46 pillars is calculated at 131 with Pressure Arch theory and UNSW strength formula At 9m mining height minimum FoS is calculated as 099
bull Pillar probability of failure for FoS calculated by the UNSW eq(2) is given in [Galvin 2006] as
Table A-14 Factor of safety failure probabilities for UNSW pillar strength formula (after Galvin 2006)
Safety Factor Probability of pillar failure
087 8 10
100 5 10
122 1 10
13 5 100
138 2 100
144 1 100
163 1 1000
179 1 10000
195 1 100000
211 1 1000000
bull From Table A-14 at 6m mining height there is a 1 in 20 probability of instability and at 9m a 1 in 2 probability The variability in the database of failed and unfailed pillars from which eq (1) to eq (3) are derived is responsible for these probabilities Our numerical model should always predict failure if the FoS is less than 10 and always predict stability with FoS gt 10 since no such variability in geotechnical properties or conditions is used
bull While our numerical model predicts no pillar failure at 6m and pillar failure at 9m in reality there remains approximately a 1 in 20 chance of failure at 6m mining height If one pillar was to fail load transferred to adjacent pillars would reduce these adjacent pillars FoS and may well lead to the pillar failure and resultant subsidence observed at Duncan St
bull Based on the numerical results obtained using two mining heights the pillar and overburden failure is in line with analytical predictions from Pressure Arch theory and UNSW pillar strength calculation
bull Surface subsidence predicted from the 9m mining height numerical model is 196m While this value is in general agreement with monitoring data the model is not sufficiently calibrated since the real mining height in the region is unknown to be able to confidently predict final subsidence strains and tilts
bull With 1MPa cohesive backfill at a fill ratio of 83 the predicted strength increase is 70 With non-cohesive backfill at the same fill ratio the strength increase is 20 these values are in agreement with single pillar studies
bull Abutment stresses in the immediate roof sandstone unit (above the coal roof) are predicted to extend approximately 80m beyond the limits of the model This is in reasonable agreement with twice the load transfer distance of 64m (at 124m depth-of-cover) used to define a pillars zone of influence (the ZI also includes half pillar width ie 74m for 20m pillar)
A74 Numerical model of adjacent region
bull A numerical model of the region immediately to the east of the Duncan St failure region is constructed with 76 pillars
bull At 9m mining height the model predicts failure of 9 pillars but no significant overburden failure The model remains stable in general
bull With a 20 increase in gravity the model is predicted to fail
bull Numerical modelling results suggest the region to the east of the Waterline barrier pillar is stronger by approximately 20 than the subsided region to the west of the barrier pillar
bull Predicted surface subsidence (including compressive effects from gravity increase) is 13m all though numerical instabilities halt the model and true surface subsidence is likely to be higher
bull Inspection of yield at mid-pillar height suggests the southern pillars in the model have intact core when pillars in the middle of the region are failed in their entire volume In reality the southern region of this panel have greater depth-of-cover therefore higher pillar stresses and thus lower FoS in these southern pillars

0
1
2
3
4
5
6
7
8
Axi
al s
tres
s (M
Pa)
irregular pillar-min w idth 20m high and 9m w ide
square pillar-20m w ide and 9m high
0000 0005 0010 0015 0020 0025 0030 0035 0040
Axial strain
Figure A-24 Stress vs strain curves for pillars of 9m height with regular and irregular square cross-section (Figure A-23) Difference in peak strength predicted to be approximately 35
A5 ROADWAY BACKFILL AND PILLAR STRENGTH IMPROVEMENT
A literature review of backfill applications mechanical properties and behaviours in coal mining identified several examples from China [Guo 2007 Wang 2009] where backfill has been used to reduce surface subsidence from America [Tesarik 2002 2009] where backfill has been used primarily for disposal of fly-ash and reduce acid mine drainage and from Australia [Origin Alliance 2008] - See Table A-5 and the reference list
In the early stages of this modelling specific data and backfill effects and properties required in this numerical study were unavailable and therefore two cases were considered a cohesive backfill having a UCS of 1 MPa and a non-cohesive backfill with no cohesion but a friction angle of 42 degrees Subsequent to these two cases a case of 05MPa cohesive backfill mix was also considered
Backfill properties using in this study are list in
Table A-6
Table A-5 Backfill properties data from various sources
Composition UCS (MPa) E (GPa) Reference
Solid waste including fly-ash 05 initially
to 14-17
0565 Guo et al 2007
Fly-ash amp cement 339 ndash 824 Guo et al 2007
1 4 15 (cement) (fly-ash) (coal
gangue)
07 ndash 17 Wang et al 2009
Fly ash (dry) Scheetz 2009
22 1 (fly-ash) (cement) Scheetz 2009
Cemented rockfill in metal mine 69 1909 Tesarik 2009
Required properties 10 10 OriginAlliance ndash Mine
subsidence interpretive
reporting
P16
25 FA 105 sand 01 bentonite
5 FA 18 sand
Injection 3m intervals
Bell Bruyn 1999
Table A-6 Mechanical parameters of cohesive and non-cohesive backfill used in this numerical
study
Backfill Youngs Modulus (GPa)
Poissonrsquos Ratio UCS
(MPa)
Tensile Strength (MPa)
Cohesion (MPa)
Friction Angle (deg)
Dilation Angle (deg)
1MPa
Cohesive 0565 040 10 01 0117 400 100
05MPashy
cohesive 0565 040 05 005 0061 400 100
Non-
cohesive 0020 015 00 00 0000 420 75
A51 Numerical results and analysis
In order to quantify the influence of backfill on pillar strength in detail 180 models (60 models each for 1MPa 05MPa cohesive and non-cohesive backfill) of square coal pillars were analysed with the following parameters pillar width is 20m mining height is from 5m to 10m equivalent to a wh ratio of 2 to 4 percentage of backfill is from 0 to 90 Table A-7 summarises the results of these pillar strength analyses for all the cohesive and non-cohesive cases
Relationship between pillar strength and percentage of roadway backfill is presented in Figure Ashy25 Figure A-27 and Figure A-29 The raw data from Table A-7 has been calculated in uniform 10
backfill increments and is presented in Figure A-26 Figure A-28 and Figure A-30 As shown in these figures the percentage increase in pillar strength is approximately bilinear with increase in backfill
00
200
400
600
800
1000
1200
1400
1600 P
illar
stre
ngth
incr
ease
()
5m 6m 7m 8m 9m 10m
00 100 200 300 400 500 600 700 800 900 1000
Percentage of bacfill ()
Figure A-25 Pillar strength increase versus percentage of 1MPa cohesive backfill
00
200
400
600
800
1000
1200
1400
1600
Pill
ar s
tren
gth
incr
ease
()
10 backfill
20 backfill
30 backfill
40 backfill
50 backfill
60 backfill
70 backfill
80 backfill
90 backfill
4 5 6 7 8 9 10 11 12 Pillar height (m)
Figure A‐26 Pillar strength increase versus pillar height for 1MPa cohesive backfill
Table A-7 Pillar strength with increasing 1MPa and 05MPa cohesive backfill and non-cohesive backfill
Pillar strength Backfill
Approximate percentage of backfill
() 5 6
Pillar height (m)
7 8 9 10 Pillar
strength Without backfill 0 1007(00) 894(00) 795(00) 714(00) 647(00) 596(00)
(MPa) for different percentshyage of
10 20 30
1049(100) 1104(200) 1140(300)
940(83) 983(167)
1069(333)
833(71) 909(214) 947(286)
785(125) 820(188) 889(313)
720(111) 771(222) 803(278)
650(100) 710(200) 758(300)
backfill 1MPa 40 1205(400) 1130(417) 1046(429) 929(375) 869(389) 824(400)
Cohesive 50 1234(500) 1178(500) 1095(500) 1016(500) 943(500) 894(500) backfill 60 1292(600) 1208(583) 1143(571) 1098(625) 1009(611) 956(600)
70 1342(700) 1271(667) 1270(714) 1158(688) 1120(722) 1035(700) 80 1466(800) 1442(833) 1350(786) 1345(813) 1309(833) 1180(800) 90 1593(900) 1580(917) 1556(929) 1470(875) 1440(889) 1400(900) 10 1026(100) 930(83) 830(71) 773(125) 697(111) 636(100) 20 1081(200) 968(167) 896(214) 803(188) 754(222) 687(200) 30 1132(300) 1053(333) 939(286) 871(313) 786(278) 741(300)
05MPa 40 1184(400) 1098(417) 1018(429) 901(375) 853(389) 799(400) Cohesive 50 1217(500) 1141(500) 1065(500) 1000(500) 936(500) 873(500)
backfill 60 1240(600) 1167(583) 1102(571) 1054(625) 1009(611) 954(600) 70 1269(700) 1189(667) 1237(714) 1093(688) 1044(722) 1014(700) 80 1322(800) 1280(833) 1167(786) 1143(813) 1105(833) 1061(800) 90 1410(900) 1350(917) 1250(929) 1202(875) 1150(889) 1120(900)
Non-cohesive backfill
10 20
1016(100) 1028(200)
902(83) 912(167)
801(71) 819(214)
724(125) 732(188)
657(111) 670(222)
604(100) 615(200)
30 1044(300) 941(333) 832(286) 753(313) 678(278) 629(300)
Pillar strength Backfill
Approximate percentage of backfill
() 5 6
Pillar height (m)
7 8 9 10
40 1063(400) 961(417) 865(429) 767(375) 702(389) 649(400) 50 1086(500) 984(500) 885(500) 800(500) 729(500) 670(500) 60 1113(600) 1006(583) 904(571) 835(625) 760(611) 696(600) 70 1138(700) 1030(667) 943(714) 852(688) 792(722) 725(700) 80 1168(800) 1083(833) 963(786) 889(813) 829(833) 765(800) 90 1206(900) 1130(917) 1029(929) 913(875) 852(889) 804(900)
Figure A-27 Pillar strength increase versus pillar height for 05MPa cohesive backfill
4 5 6 7 8 9 10 11 12 13 Pillar height (m)
Figure A-28 Pillar strength increase versus percentage of 05MPa cohesive backfill
0
10
20
30
40
50
60
70
80
90
100
Pilla
r st
reng
th in
crea
se (
) 10 backfill
20 backfill
30 backfill
40 backfill
50 backfill
60 backfill
70 backfill
80 backfill
90 backfill
00
50
100
150
200
250
300
350
400
Perc
enta
ge o
f pill
ar s
tren
gth
incr
ease
()
5m
6m
7m
8m
9m
10m
00 100 200 300 400 500 600 700 800 900 1000
Percentage of bacfill ()
Figure A-29 Pillar strength increase versus percentage of non-cohesive backfill
00
50
100
150
200
250
300
350
400
Pilla
r st
reng
th in
crea
se (
)
10 backfill
20 backfill
30 backfill
40 backfill
50 backfill
60 backfill
70 backfill
80 backfill
90 backfill
4 5 6 7 8 9 10 11 12 Pillar height (m)
Figure A-30 Pillar strength increase versus pillar height for non-cohesive backfill
The modelling results suggest that the pillar strength will increase with increasing roadway backfill while the percentage increase of pillar strength is greater for the taller pillars than squat pillars it is observed that when the backfill is less than 40-50 the pillar strength increase is less sensitive to pillar height or wh ratio while over 40-50 backfill pillar strength rapidly increase with pillar height
A52 Comparison of three different kinds of backfill
Pillar strength improvement with 05 and 10 MPa cohesive backfill and non-cohesive backfill is presented in Figure A-31 to Figure A-33
0
10
20
30
40
50
60
70
Incr
ease
of p
illar
str
engt
h (
) 5m-00MPa
5m-05MPa
5m-10MPa
0 10 20 30 40 50 60 70 80 90 100
Percentage of backfill ()
Figure A-31 Comparison of 05 and 10 MPa cohesive backfill and non-cohesive backfill at 5m mining height
0
20
40
60
80
100
120
Incr
ease
of p
illar
str
engt
h (
)
7m-00MPa
7m-05MPa
7m-10MPa
0 10 20 30 40 50 60 70 80 90 100
Percentage of backfill ()
Figure A-32 Comparison of 05 and 10 MPa cohesive backfill and non-cohesive backfill at 7m mining height
Incr
ease
of p
illar
str
engt
h (
)
140
120
100
80
60
40
20
0
9m-00MPa
9m-05MPa
9m-10MPa
0 10 20 30 40 50 60 70 80 90 100
Percentage of backfill ()
Figure A-33 Comparison of 05 and 10 MPa cohesive backfill and non-cohesive backfill at 9m mining height
Modelling predicts that 05MPa is as effective as 10MPa at increasing pillar strength below approximately 50-60 roadway fill Modelling suggests that cohesive backfill is more effective at increasing pillar strength than non-cohesive fill
A53 Numerical study of the influence of interface between backfill and pillar
To investigate the influence of an interface between backfill and pillar on the strength response of coal pillar an interface is set between backfill and pillar as shown in Figure A-34 The interface property is list in Table A-8
Figure A-34 Sketch showing the position of interface between backfill and pillar
2
4
6
2
4
6
Table A-8 Mechanical parameters of interface used in numerical model
Interface Cohesion FrictionNormal stiffness (GPa) Shear stiffness (GPa) property (MPa) Angle (deg)
Value 20 20 0 5~40
Pillar strength of a 6m high pillar as interface friction angle is increased from 5 degrees to 40 degrees is displayed in
1212
1010
88
cohesive backfill with interface
cohesive backfill without interface
non-cohesive backfill with interface
non-cohesive backfill without interface
4 cohesive backfill with interface
cohesive backfill without interface
non-cohesive backfill with interface
non-cohesive backfill without interface
stre
ss (M
Pa)
stre
ss (M
Pa)
6
2
00 0000 0005 0010 0015 0020 0025 0030 0035 0040 0045 0000 0005 0010 0015 0020 0025 0030 0035 0040 0045
strain strain
Figure A-35 to Figure A-38
Modelling predicts a non-cohesive interface with friction angle below 20 degrees results in a slight reduction in pillar strength above 20 degrees the interface is predicted to have little influence on pillar strength
cohesive backfill with interface
cohesive backfill without interface
non-cohesive backfill with interface
non-cohesive backfill without interface
1212
1010
88
cohesive backfill with interface
cohesive backfill without interface
non-cohesive backfill with interface
non-cohesive backfill without interface
stre
ss (M
Pa)
stre
ss (M
Pa)
6
4
2
0 0
0000 0005 0010 0015 0020 0025 0030 0035 0040 0045 0000 0005 0010 0015 0020 0025 0030 0035 0040 0045
strain strain
Figure A-35 Post peak pillar for 6m high pillar (wh=33) with friction angle 5deg on left 10deg on right of interface between backfill and pillar
2
4
6
cohesive backfill with interface
cohesive backfill without interface
non-cohesive backfill with interface
non-cohesive backfill without interface
1212
1010
88
cohesive backfill with interface
cohesive backfill without interface
non-cohesive backfill with interface
non-cohesive backfill without interface
stre
ss (M
Pa)
stre
ss (M
Pa)
6 6
44
2 2
0 0 0000 0005 0010 0015 0020 0025 0030 0035 0040 0045 0000 0005 0010 0015 0020 0025 0030 0035 0040 0045
strain strain
Figure A-36 Post peak pillar for 6m high pillar (wh=33) with friction angle 15deg on left 20deg on right of interface between backfill and pillar
12
cohesive backfill with interface
cohesive backfill without interface
non-cohesive backfill with interface non-cohesive backfill without interface
12
10 10
8 8
cohesive backfill with interface
cohesive backfill without interface
non-cohesive backfill with interface
non-cohesive backfill without interface
stre
ss (M
Pa)
stre
ss (M
Pa)
6 6
4 4
2 2
0 0 0000 0005 0010 0015 0020 0025 0030 0035 0040 0045 0000 0005 0010 0015 0020 0025 0030 0035 0040 0045
strain strain
Figure A-37 Post peak pillar for 6m high pillar (wh=33) with friction angle 25deg on left 30deg on right of interface between backfill and pillar
12
cohesive backfill with interface
cohesive backfill without interface
non-cohesive backfill with interface non-cohesive backfill without interface
12
10 10
8 8
cohesive backfill with interface
cohesive backfill without interface
non-cohesive backfill with interface
non-cohesive backfill without interface
stre
ss (M
Pa)
stre
ss (M
Pa)
6
4
2
0 0000 0005 0010 0015 0020 0025 0030 0035 0040 0045
0 0000 0005 0010 0015 0020 0025 0030 0035 0040 0045
strain strain
Figure A-38 Post peak pillar for 6m high pillar (wh=33) with friction angle 35deg on left 40deg on right of interface between backfill and pillar
22
6
8
24
A54 Post peak pillar strength
A full stress strain curve to approximately 35 strain is presented in the following figures for 1MPa cohesive and non-cohesive backfill Results for 05MPa cohesive backfill sit approximately mid-way between these two cases and are included in the summary Table A-9
24 24
0000 0010 0020 0030 0040 0050
Average axial strain of coal pillar
000
2000
3000
4000
5000
6000
7000
8000
9000
22
0000 0010 0020 0030 0040 0050
Average axial strail of coal pillar
000
2000
3000
4000
5000
6000
7000
8000
9000
20 20
18
Ave
rage
str
ess
of c
oal p
illar
(MPa
)
Ave
rage
str
ess
of c
oal p
illar
(MPa
)
18
16 16
1414
12 12
1010
88
66
44
22
00
Figure A-39 Post peak pillar strength with increasing backfill 5m high pillar (wh=40) with 1MPa cohesive backfill on left non-cohesive backfill on right
24
22
0000 0010 0020 0030 0040 0050
Average axial strain of coal pillar
00
250
333
417 500
583
667 833
917
22
0000 0010 0020 0030 0040 0050
Average axial strain of coal pillar
00
250 333
417
500 583
667
833
917
20 20
Ave
rage
str
ess
of c
oal p
illar
(MPa
)
18 18
16 16
14 14
12 12
10 10
8
6
4 4
2 2
0 0
Figure A-40 Post peak pillar strength with increasing backfill 6m high pillar (wh=33) with cohesive backfill on left non-cohesive backfill on right
Aver
age
stre
ss o
f coa
l pill
ar (M
Pa)
4
6
8
10
12
14
16
18
2
4
6
8
0000 0005 0010 0015 0020 0025 0030 0035 0040 0045
Average axial strain of coal pillar
000
2140
2860
4290
5000
5710
7140
7860
9290
2020
0000 0005 0010 0015 0020 0025 0030 0035 0040 0045
Average axial strain of coal pillar
000
2140
2860
4290
5000
5710
7140
7860
9290
18
Ave
rage
str
ess
of c
oal p
illar
(MPa
) A
vera
ge s
tres
s of
coa
l pill
ar (M
Pa)
Aver
age
stre
ss o
f coa
l pill
ar (M
Pa) 16
14
12
10
8
6
4
22
00
Figure A-41 Post peak pillar strength with increasing backfill 7m high pillar (wh=29) with cohesive backfill on left non-cohesive backfill on right
14 14
0
000
2500
3130
3750
5000 6250
6880
8130
8750
0
000
2500
3130
3750
5000
6250
6880
8130
8750
12 12
10
Ave
rage
str
ess
of c
oal p
illar
(MPa
)
10
8
6
4
2
0000 0010 0020 0030 0040 0050 0000 0010 0020 0030 0040 0050
Average axial strain of coal pillar Average axial strain of coal pillar
Figure A-42 Post peak pillar strength with increasing backfill 8m high pillar (wh=25) with cohesive backfill on left non-cohesive backfill on right
2
4
6
8
10
12
14
2
4
6
8
14
12
Ave
rage
str
ess
of c
oal p
illar
(MPa
) A
vera
ge s
tres
s of
coa
l pill
ar (M
Pa)
0
000 2220 2780 3890 5000 6110 7220 8330 8890
0
000 2220 2780 3890 5000 6110 7220 8330 8890
Ave
rage
str
ess
of c
oal p
illar
(MPa
)
10
8
6
4
2
0000 0005 0010 0015 0020 0025 0030 0035 0040 0000 0005 0010 0015 0020 0025 0030 0035 0040
Average axial strain of coal pillar Average axial strain of coal pillar
Figure A-43 Post peak pillar strength with increasing backfill 9m high pillar (wh=22) with cohesive backfill on left non-cohesive backfill on right
12 12
0
000 2500
3000 4000
5000 6000
7000 8000
9000
0
000
2500
3000
4000
5000
6000
7000
8000
9000
10
Ave
rage
str
ess
of c
oal p
illar
(MPa
) 10
8
6
4
2
0000 0005 0010 0015 0020 0025 0030 0035 0000 0005 0010 0015 0020 0025 0030 0035
Average axial strain of coal pillar Average axial strain of coal pillar
Figure A-44 Post peak pillar strength with increasing backfill 10m high pillar (wh=20) with cohesive backfill on left non-cohesive backfill on right
The amount of backfill to achieve the transition between strain softening and hardening is presented in Table A-9 for all mining height The values in this table are estimated from the stress-strain curve analysed to 35 of strain and are depended on the backfill increment which is in turn dependent on the ratio of mining height to the calibrated element size 05m
Table A-9 Percentage of roadway backfill that leads to a transition from strain softening to hardening
Pillar height Non-cohesive 05MPa Cohesive 10MPa Cohesive backfill backfill backfill
5m 300 200 200
6m 500 417 333
7m 571 500 429
8m 625 625 500
9m 722 722 611
10m 800 800 700
The modelling results suggest that the average axial stress of coal pillar increases with compression until peak stress is reached In the post-failure region pillar stress is reduced as strain increases for all models without backfill All the model results predict that there would be a change to strain hardening behaviour as percentage of backfill increases For example this transition point is 333 for 10 MPa cohesive backfill while 50 for non-cohesive backfill with 6m mining height as shown in Table A-9 It can also be seen from Table A-9 that tall pillars need more backfill than squat pillars to achieve the change from strain softening to hardening for either cohesive backfill or non-cohesive backfill
A55 Backfill for diamond shaped pillars
A 7m high diamond shaped pillar with 50 degree skew angle is analysed with increasing level of backfill in surrounding roadways On the skewed angle the backfill is constrained with roller boundary conditions normal to the skewed angle to represent symmetry conditions and a 5m wide roadway
Figure A-45 Numerical model of diamond shaped pillar with backfill on left and boundary conditions on right
The predicted strength of a diamond shaped pillar and equivalent square pillar with increasing roadway backfill of both cohesive and non-cohesive models is presented in Figure A-46 and Figure A-47
6
7
8
9
10
11
12
13
0 10
Pilla
r str
engt
h (M
Pa)
20 30 40 50 60 70 80 90 100
Percentage of backfill ()
Skew pillar
Square pillar
0
10
20
30
40
50
60
70
0 10
Incr
ease
of p
illar
str
engt
h (
)
20 30 40 50 60 70 80 90 100
Percentage of backfill ()
Skew pillar
Square pillar
Figure A-46 Predicted pillar strength of diamond and square shaped pillars with increasing percentage of 1MPa cohesive backfill On left is absolute strength and on right is percentage strength increase
6
7
8
9
10
11
0 10
Pilla
r stre
ngth
(MP
a)
20 30 40 50 60 70 80 90 100
Percentage of backfill ()
Skew pillar
Square pillar
0
5
10
15
20
25
30
35
0 10
Incr
ease
of p
illar
str
engt
h (
)
20 30 40 50 60 70 80 90 100
Percentage of backfill ()
Skew pillar
Square pillar
Figure A-47 Predicted pillar strength of diamond and square shaped pillars with increasing percentage of non-cohesive backfill On left is absolute strength and on right is percentage strength increase
A56 Backfill placed after significant pillar yield
A pillar model with 90 non-cohesive backfill placed after yielding of a 7m high pillar is presented in Figure A-48 The percentage of strength increase is given in Table A-10 It is found that the pillar strength increase is lower if the pillar has undergone significant deformation before the placement of backfill It is predicted that 90 backfill results in a strain-hardening pillar behaviour even if the pillar has previously yielded significantly
Ave
rage
stre
ss o
f coa
l pill
ar (M
Pa)
18 without backfill 025 strain 050 strain
14
16
075 strain 100 strain
12 125 strain 150 strain
10 175 strain 200 strain
8
6
4
2
0 0000 0005 0010 0015 0020 0025 0030 0035 0040 0045 0050
Average strain of coal pillar
Figure A-48 Stress strain curves for backfill placed around the pre-strained pillar displaying state of pillar core upon placement of backfill
Table A-10 Pillar strength increase with 90 non-cohesive backfill placed around a pre-strained 7m high square pillar of 20m width
Percentage backfill ()
Strain at placement of non-cohesive backfill ()
Pillar strength (MPa)
Percentage increase in peak
strength ()
Percentage increase in post-peak
strength at 3 strain ()
0 000 7953 000
90 000 10290 2939
90 025 9156 1513
90 050 8965 1272
90 075 8526 720
90 100 7945 26006
90 125 7951 22608
90 150 7951 18917
90 175 7951 15629
90 200 7951 11134
A6 3D MODEL OF DUNCAN ST FAILURE PANEL
A61 Numerical model
A three dimensional model of 46 pillars in the Duncan St subsidence region has been analysed with over burden geology based on hole CP1 and a constant overburden depth of 124m Figure A-49 Figure A-50 and Figure A-51 Uniform mining heights of 6m and 9m have been analysed
Selection of the pillars to be analysed is based on visual inspection of the panel layout and includes pillars bounded by unmined coal to the west the waterline barrier pillar to the east larger pillars to the south and a panel of slightly larger pillars of different orientation to the north
One row of pillars in the middle of this panel trending from north-west to south-east are of smaller dimension than the average and of diamond shape with acute internal angle of approximately 50degrees Being in the approximate middle of the panel close to full tributary area load will be mobilised on this row of pillars and therefore it is believed pillars in this row initiated the 2008 subsidence event
The Duncan Street numerical model has the following objectives
bull Estimation of pillar stresses and FoS for comparison with empirical formula
bull Comparison of backfill response at panel scale with previous single pillar studies
bull Estimation of surface subsidence at given percentage roadway fill
bull Estimation of extent of abutment stresses due to panel failure
A62 Observations from Duncan Street numerical model
bull At 6m mining height the minimum pillar FoS for these 46 pillars is calculated to be 131 using Pressure Arch theory and UNSW strength formula panel failure is not predicted with this mining height by the model At 9m mining height the minimum FoS is calculated as 099 and panel failure is predicted to occur
bull The probability of pillar failure for associated FoS calculated by the UNSW pillar strength formula Eq(2) is given in Galvin 2006 in Table A-11 The relationship was developed for square pillars using the Australian pillar database and tributary area theory and hence theoretically speaking may not directly apply to this study However it can be taken as a general guide
bull From Table A-11 it is seen that there is a 1 in 20 probability of instability at 6m mining height and a 1 in 2 probability at 9m mining height Numerical modelling is however a deterministic approach and it always predicts failure if the FoS is less than 10 and stability if FoS gt 10 since no variation in geotechnical properties or conditions is used
bull Although our numerical models predict no pillar failure at 6m and panel failure at 9m in reality there remains approximately a 1 in 20 chance of failure at 6m mining height If one pillar was to fail load transferred to adjacent pillars would reduce the FoS of these adjacent pillars and could lead to the pillar failure and subsidence as observed at 2008 event region
Table A-11 Factor of safety failure probabilities for UNSW pillar strength formula
(after Galvin 2006)
Safety Factor Probability of pillar failure
087 8 10
100 5 10
122 1 10
130 5 100
138 2 100
144 1 100
163 1 1000
179 1 10000
195 1 100000
211 1 1000000
bull Based on the numerical results obtained using two mining heights the pillar and overburden failure is consistent with analytical predictions from Pressure Arch theory and UNSW pillar strength calculation
bull Surface subsidence predicted from the numerical model with a mining height of 9m is 196m While this value is in approximate agreement with monitoring data (14mshy15m) the model was not sufficiently calibrated since the real mining height in the region is uncertain to be able to confidently predict final subsidence strains and tilts at the site
bull With 1MPa cohesive backfill at a roadway fill ratio of 83 the predicted strength increase is 70 With non-cohesive backfill at the same fill ratio the strength increase is 20 These values are in agreement with the results for single pillars
bull The numerically predicted surface subsidence with 83 roadway fill is 022m Maximum predicted tilt in east-west direction is 7mmm and in north-south direction is 5mmm Analytical formula [Holla amp Barclay 2000] predict maximum tilt of 53mmm for this amount of subsidence
bull Isolated cohesive backfill surrounding pillars of low wh ratio is predicted to be effective in confining the pillar and increasing peak pillar strength and panel stability Isolated non-cohesive backfill without barriers could not be analysed in this numerical model as backfill lsquoflowsrsquo and numerical stability could not be achieved
bull Stress transfer in the immediate roof sandstone unit (above the coal roof) is predicted to extend approximately 80m beyond the limits of the collapsed panel This is in reasonable agreement with theoretical studies
Figure A-49 Duncan St modelled panel with outline of adjacent modelled panel location of representative open hole CP1 file named ldquoAppendix B2 open hole logsrdquo located in directory ldquoCollingwood Park Subsidence 2B Collingwood Park Mine Subsidence Reports 1988 Eventsrdquo and mine subsidence limit contour
A63 Model properties
Overburden geology is based on borehole CP1 the most complete interpreted available hole drilled in 1988 by Queensland Department of Mines Figure A-50 To include this in the numerical model lithological units had to be coalesced into major units of sandstone (SS) siltstone (SL) mudstone (MS) weathered units and coal Figure A-51
Rock properties for the overburden were determined from a 2D parametric study whereby the UCS of all units was scaled to achieve pillar and overburden failure at 8m mining height Table A-12 and Table A-13
Unit top depth thickness unit thickness
thickness scaled
thickness in model
000 1200 1200 1046 1000 1200 700 SS 700 610 600 1900 600 MS 600 523 500 2500 1100 SS 1300 1133 1100 3600 200 SS 000 3800 100 SL 1000 871 900 3900 100 MS 000 4000 500 000 4500 100 000 4600 100 000 4700 100 000 4800 100 SS 400 349 400 4900 300 SS 000 5200 300 SL 700 610 600 5500 100 MS 000 5600 300 MS 000 5900 400 SS 500 436 400 6300 100 SS 000 6400 400 SL SS 900 784 800 6800 100 SL MS 000 6900 100 SL 000 7000 200 SL MS 000 7200 100 SS SL 000 7300 200 SS 1000 871 900 7500 200 SL 000 7700 200 SS SL 000 7900 200 SS 000 8100 100 SL 000 8200 100 SS 000 8300 200 SL 4350 3790 3800 8500 200 SL 000 8700 100 SS 000 8800 100 COAL 000 8900 200 000 9100 100 000 9200 100 000 9300 100 SL MS 000 9400 300 SL MS SS 000 9700 100 000 9800 100 SL MS 000 9900 400 SL SS 000 10300 200 SS MS 000 10500 100 SL MS 000 10600 200 SL MS SS 000 10800 100 000 10900 400 SL MS 000 11300 400 SL SS 000 11700 100 SS MS 000 11800 300 000 12100 400 SL SS 000
SL MS MS SS
MS
MS
SL
MS SS SL SS SL MS MS
weathering
SL MS SS
12500 150 000 12650 450 850 741 750 13100 400 SS 000 13500 100 MS SL
SS SL 960 837 500
13600 200 13800 100 SS 13900 200 14100 360
SS SL SL MS
14460 470 COAL MINING SEAM 600 14930 FLOOR
Figure A-50 Inferred geology from representative borelog CP1 used in numerical model
weathering SS
Unit Depth floor below surface Num elements Unit Unit name in model surface 0
10 3 16 weather 16 2 15 ss6
MS 21 2 14 ms2 SS 32 4 13 ss5 SL 41 3 12 sl3 SS 45 1 11 ss4 MS 51 2 10 ms1 SS 55 1 9 ss3 SL 63 3 8 sl2 SS 72 3 7 ss2 SL 1055 11 6 sl1 SS 113 4 5 ss1 SEAMR 118 3 4 seamr SEAM 124 3 3 seam FLOOR1 134 3 2 floor2 FLOOR2 250 10 1 floor1
Figure A-51 Coalesced units for numerical model based on hole CP1
Insitu stress is unknown at the site so a horizontal to vertical stress gradient of 15 has been assumed Given that the extensive workings were undertaken 20 to 30 years before the 2008 event horizontal stresses in the mining seam would be considerably disturbed from the pre-mining conditions
Table A-12 Rock properties for softening mohr coloumb material Softening rates of coal friction angle is 6 degrees over 2 plastic strain and total loss of cohesion over 24 plastic strain in coal and over 1 in other rocks Determined from pillar studies
E
nu Bulk Shear UCS UCS Phi Dilation Coh Tensile Strength (GPa) (GPa) (GPa) (MPa) scaled angle (MPa) (MPa)
SS 75 02 4167 3125 50 125 40 2 291 125
SL 4 025 2667 1600 30 75 35 2 195 075
MS 3 025 2000 1200 15 375 32 2 104 0375
Weathering 1 025 0667 0400 8 2 32 2 055 02
COAL 11 03 0917 0423 12 3 36 6 076 003
FLOOR1 4 025 2667 1600 30 75 38 2 183 075
FLOOR2 4 025 2667 1600 30 75 38 2 183 075
Table A-13 Ubiquitous joint properties Softening rate of ubiquitous joints total loss of cohesion over 1 plastic strain Determined from 2D overburden studies
Cohesion Ubiq joint cohesion Tensile Strength Ubiq joint tensile strength Ubiq joint (MPa) (MPa) (MPa) (MPa) friction
SS 291 00029144 125 0000125 15 SL 195 00019521 075 0000075 15 MS 104 00010393 0375 00000375 15 Weathering 055 00005543 02 000002 15 COAL 076 003 FLOOR1 183 - 075 - -FLOOR2 183 075 -
A64 Results from 3D Duncan St model
Factor of Safety estimated at 6m and 9m mining heights
Figure A-52 Pillar FoS calculated for 6m mining height by analytical method with strength by eq(3) and pillar stress by pressure arch theory Minimum value is 131 suggesting a 5 in 100 probability of failure however not sufficient to fail in the numerical model (that requires FoS lt 10)
Figure A-53 Pillar FoS calculated analytically for 9m mining height (eq(3) and PA theory) Minimum value is 099 suggesting a probability of failure of 5 in 10 although in the numerical model failure should occur
Yield on plane for 6m and 9m mining heights
Figure A-54 Location of section plane used for section view in following figures
Figure A-55 Yield on section plane for 6m mining height No significant damage or displacement observed
Figure A-56 Yield on section plane for 9m mining height no backfill
Figure A-57 Displacement on section plane for 9m mining height no backfill Maximum displacement is approximately 15m at surface
Results on horizontal plane at mid-pillar height
Figure A-58 Yield at mid-pillar height 9m mining height Blue elements evident in some pillars indicating pillar core remains intact
Figure A-59 Predicted vertical stress at mid pillar height 9m mining height Insitu stress is 30MPa Unyielded pillars and pillars hardening after yield are transferring vertical load while yielded pillars carry little load Extent of abutment stress increase is approximately 80m
Figure A-60 Roof vertical stress predicted by numerical model with 9m mining height Contour increments are 01MPa Base vertical stress is approximately 27MPa Abutment stress influence distance is approximately 80m
Results on surface after panel failure at 9m mining height
Figure A-61 Surface subsidence as predicted with numerical model with 9m mining height and total subsidence along Duncan St to McLaughlin St as monitored to October 09 Maximum surface subsidence predicted as 196m Outline of numerical modelling pillars and dotted contour of observed subsidence limit
A65 Duncan St model ndash backfill effectiveness
The Duncan St 3D model has been analysed with full and targeted 1MPa cohesive and non-cohesive backfill placed in roadways Roadway fill of 66 is analysed for the 1MPa cohesive mixture and 83 roadway fill for the non-cohesive mix
Results are presented in the following figures and figure captions
Factor of Safety increase from cohesive backfill
Analysis of the Duncan St model with 9m mining height is undertaken to estimate the FoS increase from backfill By increasing gravity in increments the backfill strength improvement is quantified With 83 roadway fill of 1MPa cohesive backfill the overburden and pillar tops (ie region of pillar above height of backfill) fails with gravity of 17ms2 suggesting the pillars with FoS of approximately 10 has increased FoS to 17 by backfilling adjacent roadways
Figure A-62 Gravity of 16g with 83 1MPa cohesive backfill showing no significant yield
Figure A-63 Gravity of 17g with 83 1MPa cohesive backfill predicting failure of pillar tops and overburden and collapse of roadway void space
FoS increase with non-cohesive backfill
With non-cohesive backfill pillars yielded due to lack of confinement upon initial placement of backfill in roadways but overburden remain stable and void space above backfill remained open Overburden remained stable at gravity increase to 11ms2 Figure A-64 but collapsed at gravity increase of 12ms2 Figure A-65
Figure A-64 Gravity of 11g with 83 non-cohesive backfill predicting pillar yield but overburden stability
Figure A-65 Gravity of 12g with 83 non-cohesive backfill predicting failure of pillars and overburden and collapse of roadway void space Maximum surface subsidence is 055m which includes the compressive effect of the 12g gravity increase
Placement of targeted backfill
A model is analysed with cohesive backfill totally surrounding two pillars with low predicted FoS The two pillars are predicted to have a FoS of 099 and 100 left to right viewed from above at a 9m mining height Backfill extends to an extent of 5m to 10m from the pillar and is 6m high in the roadways Gravity increase to 12g required to fail panel suggesting panel strength increase is approximately 20 from targeted backfill Predicted surface subsidence 125m (excessive mesh deformation stops analysis equilibrated stage may have higher surface subsidence)
Figure A-66 Duncan St model with 66 roadway fill of 1MPa cohesive backfill surrounding two pillars with low FoS at 9m mining height
Figure A-67 Predicted yield at mid pillar height of 9m pillars with 66 roadway fill of 1MPa cohesive backfill Note intact core (blue) for targeted pillars
Figure A-68 Pillar strength at 9m mining height Strength WITHOUT BACKFILL of northern focus pillar selected for targeted backfill is 527MPa and southern focus pillar is 526MPa
Figure A-69 Vertical stress in pillars targeted for partial backfill placement Stress calculated at equilibrium of elasto-plastic analysis WITHOUT BACKFILL Stress in northern focus pillar is 54MPa and in southern focus pillar is 513 FoS of NFP=52754 = 0975 FoS of SFP=526513 = 1025
Non-cohesive backfill in targeted placement study
A model with targeted placement of non-cohesive backfill was attempted but could not be satisfactorily converged since backfill lsquoflowsrsquo and inter-penetrates elements resulting in numerical instabilities
Forcing pillars to fail to examine resultant subsidence
To examine the extent of surface subsidence if backfilled pillars fail the numerical model with 9m mining height and 83 roadway fill of 1MPa cohesive backfill is analysed with a 90 reduction in coal pillar strength properties
With 9m mining height and 83 roadway fill of cohesive backfill void space remaining is 15m and the numerical model predicts failure of pillars and overburden results in approximately 02m surface subsidence
Figure A-70 Surface subsidence predicted by numerical model when pillars forced to fail with 83 roadway fill Contour interval is 01m with maximum subsidence predicted as 022m
Figure A-71 Surface strain in east-west direction when pillars forced to fail resulting 022m surface subsidence Maximum strain is 5mmm and contour interval is 1mmm
Figure A-72 Surface strain in north-south direction when pillars forced to fail resulting 022m surface subsidence Maximum strain is 3mmm and contour interval is 1mmm
Figure A-73 Tilt in east-west direction Units are mmm and intervals are 1mmm maximum tilt is 7mmm
Figure A-74 Tilt in north-south direction Units are mmm and intervals are 1mmm maximum tilt is 5mmm
To highlight the need for adequate fill the model with 66 roadway fill is analysed with the pillars forced to fail with a 50 reduction in pillar strength Void space over the backfill in the roadways is 30m Modelling predicts maximum surface subsidence of 068m
Figure A-75 Surface subsidence when pillars forced to fail with 66 roadway fill Roadway void space is 30m with the model predicting 068m surface subsidence Contour interval is 01m
A66 Numerical model of adjacent high risk area
Numerical model and panel stability
A numerical model of the region adjacent to Duncan St incorporating 76 pillars is analysed at 9m mining height Overburden strata strengths and depth-of-cover is consistent with Duncan St model
The main objective of this model is to estimate the strength difference between the two mining panels west and east of the Waterline fault Given uniform mining height and depth-of-cover the strength difference will be due to the pillar configuration and boundary conditions
At 9m mining height the model is predicted to be essentially stable although 9 pillars are predicted to be fully yielded at mid-pillar height
With gravity increase of 10 the model remains stable At 20 increase in gravity the model is predicted to fail with significant overburden yield
It is concluded therefore that the panel to the east of Waterline fault is 20 stronger than the panel to the west
Figure A-76 Location of numerical model 2 together with surface subsidence contours from 1988 and 2008 events and seam level eastern boundary of failure predicted from 3D seismic
Figure A-77 Yield on section at mid-height for 9m mining height
Figure A-78 Rockmass yield on vertical section trending east-west at mid-point of model Note overburden is largly intact with no extensive collapse
Figure A-79 Pillars predicted to have failed from Numerical model 2 with surface subsidence contours and inferred eastern limit of failed zone at seam level
By a 20 increase in gravity the model is forced to fail resulting in predicted 13m surface subsidence that includes increased overburden compression from increased gravitational component Excessive deformation and numerical instability stopped the model true surface deformation may be higher
Figure A-80 Adjacent model with 9m mining height Predicted surface subsidence after 20 increase in gravity Model predicts 13m surface subsidence
Figure A-81 Adjacent model with 9m mining height and 20 gravity increase Predicted failure at mid-pillar height Note intact core in southern pillars which appear stronger from unmined adjacent coal and larger general pillar size
A7 CONCLUSIONS
A71 Current knowledge on coal pillars behaviour
bull The strength based factor-of-safety approach is well established in coal pillar design Factors of safety for coal pillars required to provide medium to long term stability should be greater than 16 [Galvin 2006 Hill 2005]
bull Coal pillar strength has been the subject of rigorous research since at least the 1960rsquos and the Salamon amp Munro formula has been applied in the design of over a million coal pillars in South Africa alone [Mark 1999 Salamon 1998] Strength formula derivations from the UNSW are established in Australia
bull Coal pillar load calculation traditionally relies on tributary area theory which is a conservative approach suitable for pillar design
bull Tributary area conditions are NOT satisfied at Collingwood Park pillars are irregular in size and shape there is large areas of unmined coal and the seam has significant dip
bull This last point is important as analytical methods hold the only hope of evaluating every pillar at Westfalen No 3 Colliery The numerical model of Duncan St analyses 46 pillars and requires significant computational resources the entire Colliery has in excess of 700 pillars and cannot be analysed by the same methods in its entirety by current computer codes in a reasonable time frame
bull Likewise it is not satisfactory to draw conclusions on panel stability from limited analysis of representative groupings of pillars because of the variability in size shape mining height and cover depth over the mining area
bull To overcome the limitations of tributary area theory for the back-analysis of an irregular pillar layout a novel approach for calculating loads based on pressure arch theory has been developed subjected to international peer review and published in the International Journal of Rock Mechanics and Mining Sciences In summary each pillar is individually examined and the pillar area circumference and centroid are calculated At the pillar centroid the cover depth and mining height are determined An influence zone based on a circular area with radius defined by the depth-dependent load transfer distance Within this area the local extraction ratio is calculated This approach has found to satisfactorily account for pillars of arbitrary shape in irregular layout with variable cover depth
bull This allows a FoS to be determined for the over 700 pillars of Westfalen No 3 with reasonable computer resources
A72 Typical pillar strength effects
Width to height ratio
bull Pillars at Westfalen No 3 have typical effective width from 20m to 50m While mining height is uncertain it is believed to range from 6m to 10m With these dimensions pillar wh ratio ranges from 20 to 83
bull At the lower limit of wh=20 geological influences will start to determine pillar strength [Galvin 2006] From wh in the range gt 20 to 40 the formula of Salamon and Munro or UNSW extensions could be expected to estimate pillar strength with the squat pillar version of these formula applicable for whgt40 [Galvin 2006 Salamon 1998 Galvin 1999]
bull The squat pillar extensions were developed since the standard formulas were found to underestimate pillar strength at whgt4 At Westfalen No 3 colliery although there are a number of pillars of whgt4 many of these are irregular in shape often long and relatively narrow (30m ndash 40m) Given this and the need to automate the assessment of every pillar the squat pillar strength formula is not utilised This approach is conservative
Pillar shape effects
bull Many pillars at Westfalen No 3 are skewed of diamond shape with acute internal angle from 50 to 90 degrees Hydraulic radius simile accounts for pillar shape by an effective width defined by 4AC while the UNSW has a parrellopid formula that for pillars of equal side length results in an effective width equivalent to this
bull In a study of pillar shapes common to Westfalen No 3 colliery the hydraulic radius analogy for estimation of effective width is found adequate with errors less than 6 for considered sizes and shapes
Post peak strength
bull Numerical studies and the work of Das in Indian coal fields highlights the changing post peak behaviour with increasing width to height ratiorsquos It has been determined that when wh exceeds approximately 5 pillars start to harden post peak When whlt3 pillars display limited if any post peak strength
bull The significance of this effect will be in the manner that pillars shed load to adjacent pillars In an array of pillars of similar dimensions pillars with a low wh ratio could be expected to shed load in a sudden more catastrophic manner than those that harden post peak Such sudden pillar failure is referred in the literature as catastrophic cascading or rolling pillar failure and has been responsible for damaging wind blasts and significant loss of life over the years
bull In an irregular pillar layout such as Westfalen No 3 with variable wh ratio significant barrier pillars and regions of unmined coal sudden multiple panel collapse would be expected to be less likely
bull The analytical approach developed for assessing pillar load accounts for load shed from a failed pillars to pillars within the zone of influence of that pillar
Specific details of this approach are discussed in the hazard map and risk assessment chapter of this report
Backfill effect
bull Numerical studies on a cohesive and non-cohesive backfill suggest that pillar strength is increased with increasing height of fill Studies suggest a 1MPa cohesive backfill may increase pillar strength by approximately 10 at 40 roadway fill for wh=33 and 18 at 40 roadway fill at wh=22 At 80 roadway fill pillar strength increases are predicted to exceed 50 Percentage strength increases are predicted to be greater with lower wh ratiorsquos
bull Studies of a non-cohesive backfill suggest at 80 roadway fill pillar strength increases are approximately 25
bull With both backfill types pillar strength is predicted to increases dramatically above 80 roadway fill and pillars are predicted to exhibit post-peak hardening behaviour
For example in the Duncan St area a pillar of effective width 20m will have a FoS of approximately 118 at mining height of 10m without backfill A 50 strength increase from 1MPa cohesive backfill at 80 roadway fill will raise the FoS to approximately 177 and reduce the probability of instability from approximately 1 in 10 to less than 1 in 1000
With 80 roadway fill of a non-cohesive backfill the same Duncan St pillar FoS will increase to approximately 147 and the probability of instability reduce to less than 1 in 100
bull Backfill is likely to reduce the rate of time dependent pillar strength degradation by reducing pillar spalling due to the erosive effects over time of high stress and exposure of the pillar surface to the atmosphere
bull In addition backfill is likely to benefit pillar stability by limiting the void available to the roof to fall into Roof falls particularly at roadway intersections may be present By reducing the roadway volume backfill will eventually support the roof when the bulking effect of roof falls fills the remaining roadway voids space Beyond this summary time dependent issues of backfill have not been considered
roadway
fill
Non-cohesive backfill
(7m mining height width 20m) strength increase
05 MPa cohesive backfill
(7m mining height width 20m)
strength increase
10 MPa cohesive backfill
(7m mining height width 20m)
strength increase
60 135 388 437
70 183 432 597
80
90
208
291
474
572
698
957
A73 Duncan St numerical model
bull In the Duncan St subsidence region approximately 46 pillars are surrounded by unmined coal to the west a large pillar containing the Waterline fault to the east and larger pillars to the south and north
bull At 6m mining height pillar minimum FoS for these 46 pillars is calculated at 131 with Pressure Arch theory and UNSW strength formula At 9m mining height minimum FoS is calculated as 099
bull Pillar probability of failure for FoS calculated by the UNSW eq(2) is given in [Galvin 2006] as
Table A-14 Factor of safety failure probabilities for UNSW pillar strength formula (after Galvin 2006)
Safety Factor Probability of pillar failure
087 8 10
100 5 10
122 1 10
13 5 100
138 2 100
144 1 100
163 1 1000
179 1 10000
195 1 100000
211 1 1000000
bull From Table A-14 at 6m mining height there is a 1 in 20 probability of instability and at 9m a 1 in 2 probability The variability in the database of failed and unfailed pillars from which eq (1) to eq (3) are derived is responsible for these probabilities Our numerical model should always predict failure if the FoS is less than 10 and always predict stability with FoS gt 10 since no such variability in geotechnical properties or conditions is used
bull While our numerical model predicts no pillar failure at 6m and pillar failure at 9m in reality there remains approximately a 1 in 20 chance of failure at 6m mining height If one pillar was to fail load transferred to adjacent pillars would reduce these adjacent pillars FoS and may well lead to the pillar failure and resultant subsidence observed at Duncan St
bull Based on the numerical results obtained using two mining heights the pillar and overburden failure is in line with analytical predictions from Pressure Arch theory and UNSW pillar strength calculation
bull Surface subsidence predicted from the 9m mining height numerical model is 196m While this value is in general agreement with monitoring data the model is not sufficiently calibrated since the real mining height in the region is unknown to be able to confidently predict final subsidence strains and tilts
bull With 1MPa cohesive backfill at a fill ratio of 83 the predicted strength increase is 70 With non-cohesive backfill at the same fill ratio the strength increase is 20 these values are in agreement with single pillar studies
bull Abutment stresses in the immediate roof sandstone unit (above the coal roof) are predicted to extend approximately 80m beyond the limits of the model This is in reasonable agreement with twice the load transfer distance of 64m (at 124m depth-of-cover) used to define a pillars zone of influence (the ZI also includes half pillar width ie 74m for 20m pillar)
A74 Numerical model of adjacent region
bull A numerical model of the region immediately to the east of the Duncan St failure region is constructed with 76 pillars
bull At 9m mining height the model predicts failure of 9 pillars but no significant overburden failure The model remains stable in general
bull With a 20 increase in gravity the model is predicted to fail
bull Numerical modelling results suggest the region to the east of the Waterline barrier pillar is stronger by approximately 20 than the subsided region to the west of the barrier pillar
bull Predicted surface subsidence (including compressive effects from gravity increase) is 13m all though numerical instabilities halt the model and true surface subsidence is likely to be higher
bull Inspection of yield at mid-pillar height suggests the southern pillars in the model have intact core when pillars in the middle of the region are failed in their entire volume In reality the southern region of this panel have greater depth-of-cover therefore higher pillar stresses and thus lower FoS in these southern pillars

00
50
100
150
200
250
300
350
400
Perc
enta
ge o
f pill
ar s
tren
gth
incr
ease
()
5m
6m
7m
8m
9m
10m
00 100 200 300 400 500 600 700 800 900 1000
Percentage of bacfill ()
Figure A-29 Pillar strength increase versus percentage of non-cohesive backfill
00
50
100
150
200
250
300
350
400
Pilla
r st
reng
th in
crea
se (
)
10 backfill
20 backfill
30 backfill
40 backfill
50 backfill
60 backfill
70 backfill
80 backfill
90 backfill
4 5 6 7 8 9 10 11 12 Pillar height (m)
Figure A-30 Pillar strength increase versus pillar height for non-cohesive backfill
The modelling results suggest that the pillar strength will increase with increasing roadway backfill while the percentage increase of pillar strength is greater for the taller pillars than squat pillars it is observed that when the backfill is less than 40-50 the pillar strength increase is less sensitive to pillar height or wh ratio while over 40-50 backfill pillar strength rapidly increase with pillar height
A52 Comparison of three different kinds of backfill
Pillar strength improvement with 05 and 10 MPa cohesive backfill and non-cohesive backfill is presented in Figure A-31 to Figure A-33
0
10
20
30
40
50
60
70
Incr
ease
of p
illar
str
engt
h (
) 5m-00MPa
5m-05MPa
5m-10MPa
0 10 20 30 40 50 60 70 80 90 100
Percentage of backfill ()
Figure A-31 Comparison of 05 and 10 MPa cohesive backfill and non-cohesive backfill at 5m mining height
0
20
40
60
80
100
120
Incr
ease
of p
illar
str
engt
h (
)
7m-00MPa
7m-05MPa
7m-10MPa
0 10 20 30 40 50 60 70 80 90 100
Percentage of backfill ()
Figure A-32 Comparison of 05 and 10 MPa cohesive backfill and non-cohesive backfill at 7m mining height
Incr
ease
of p
illar
str
engt
h (
)
140
120
100
80
60
40
20
0
9m-00MPa
9m-05MPa
9m-10MPa
0 10 20 30 40 50 60 70 80 90 100
Percentage of backfill ()
Figure A-33 Comparison of 05 and 10 MPa cohesive backfill and non-cohesive backfill at 9m mining height
Modelling predicts that 05MPa is as effective as 10MPa at increasing pillar strength below approximately 50-60 roadway fill Modelling suggests that cohesive backfill is more effective at increasing pillar strength than non-cohesive fill
A53 Numerical study of the influence of interface between backfill and pillar
To investigate the influence of an interface between backfill and pillar on the strength response of coal pillar an interface is set between backfill and pillar as shown in Figure A-34 The interface property is list in Table A-8
Figure A-34 Sketch showing the position of interface between backfill and pillar
2
4
6
2
4
6
Table A-8 Mechanical parameters of interface used in numerical model
Interface Cohesion FrictionNormal stiffness (GPa) Shear stiffness (GPa) property (MPa) Angle (deg)
Value 20 20 0 5~40
Pillar strength of a 6m high pillar as interface friction angle is increased from 5 degrees to 40 degrees is displayed in
1212
1010
88
cohesive backfill with interface
cohesive backfill without interface
non-cohesive backfill with interface
non-cohesive backfill without interface
4 cohesive backfill with interface
cohesive backfill without interface
non-cohesive backfill with interface
non-cohesive backfill without interface
stre
ss (M
Pa)
stre
ss (M
Pa)
6
2
00 0000 0005 0010 0015 0020 0025 0030 0035 0040 0045 0000 0005 0010 0015 0020 0025 0030 0035 0040 0045
strain strain
Figure A-35 to Figure A-38
Modelling predicts a non-cohesive interface with friction angle below 20 degrees results in a slight reduction in pillar strength above 20 degrees the interface is predicted to have little influence on pillar strength
cohesive backfill with interface
cohesive backfill without interface
non-cohesive backfill with interface
non-cohesive backfill without interface
1212
1010
88
cohesive backfill with interface
cohesive backfill without interface
non-cohesive backfill with interface
non-cohesive backfill without interface
stre
ss (M
Pa)
stre
ss (M
Pa)
6
4
2
0 0
0000 0005 0010 0015 0020 0025 0030 0035 0040 0045 0000 0005 0010 0015 0020 0025 0030 0035 0040 0045
strain strain
Figure A-35 Post peak pillar for 6m high pillar (wh=33) with friction angle 5deg on left 10deg on right of interface between backfill and pillar
2
4
6
cohesive backfill with interface
cohesive backfill without interface
non-cohesive backfill with interface
non-cohesive backfill without interface
1212
1010
88
cohesive backfill with interface
cohesive backfill without interface
non-cohesive backfill with interface
non-cohesive backfill without interface
stre
ss (M
Pa)
stre
ss (M
Pa)
6 6
44
2 2
0 0 0000 0005 0010 0015 0020 0025 0030 0035 0040 0045 0000 0005 0010 0015 0020 0025 0030 0035 0040 0045
strain strain
Figure A-36 Post peak pillar for 6m high pillar (wh=33) with friction angle 15deg on left 20deg on right of interface between backfill and pillar
12
cohesive backfill with interface
cohesive backfill without interface
non-cohesive backfill with interface non-cohesive backfill without interface
12
10 10
8 8
cohesive backfill with interface
cohesive backfill without interface
non-cohesive backfill with interface
non-cohesive backfill without interface
stre
ss (M
Pa)
stre
ss (M
Pa)
6 6
4 4
2 2
0 0 0000 0005 0010 0015 0020 0025 0030 0035 0040 0045 0000 0005 0010 0015 0020 0025 0030 0035 0040 0045
strain strain
Figure A-37 Post peak pillar for 6m high pillar (wh=33) with friction angle 25deg on left 30deg on right of interface between backfill and pillar
12
cohesive backfill with interface
cohesive backfill without interface
non-cohesive backfill with interface non-cohesive backfill without interface
12
10 10
8 8
cohesive backfill with interface
cohesive backfill without interface
non-cohesive backfill with interface
non-cohesive backfill without interface
stre
ss (M
Pa)
stre
ss (M
Pa)
6
4
2
0 0000 0005 0010 0015 0020 0025 0030 0035 0040 0045
0 0000 0005 0010 0015 0020 0025 0030 0035 0040 0045
strain strain
Figure A-38 Post peak pillar for 6m high pillar (wh=33) with friction angle 35deg on left 40deg on right of interface between backfill and pillar
22
6
8
24
A54 Post peak pillar strength
A full stress strain curve to approximately 35 strain is presented in the following figures for 1MPa cohesive and non-cohesive backfill Results for 05MPa cohesive backfill sit approximately mid-way between these two cases and are included in the summary Table A-9
24 24
0000 0010 0020 0030 0040 0050
Average axial strain of coal pillar
000
2000
3000
4000
5000
6000
7000
8000
9000
22
0000 0010 0020 0030 0040 0050
Average axial strail of coal pillar
000
2000
3000
4000
5000
6000
7000
8000
9000
20 20
18
Ave
rage
str
ess
of c
oal p
illar
(MPa
)
Ave
rage
str
ess
of c
oal p
illar
(MPa
)
18
16 16
1414
12 12
1010
88
66
44
22
00
Figure A-39 Post peak pillar strength with increasing backfill 5m high pillar (wh=40) with 1MPa cohesive backfill on left non-cohesive backfill on right
24
22
0000 0010 0020 0030 0040 0050
Average axial strain of coal pillar
00
250
333
417 500
583
667 833
917
22
0000 0010 0020 0030 0040 0050
Average axial strain of coal pillar
00
250 333
417
500 583
667
833
917
20 20
Ave
rage
str
ess
of c
oal p
illar
(MPa
)
18 18
16 16
14 14
12 12
10 10
8
6
4 4
2 2
0 0
Figure A-40 Post peak pillar strength with increasing backfill 6m high pillar (wh=33) with cohesive backfill on left non-cohesive backfill on right
Aver
age
stre
ss o
f coa
l pill
ar (M
Pa)
4
6
8
10
12
14
16
18
2
4
6
8
0000 0005 0010 0015 0020 0025 0030 0035 0040 0045
Average axial strain of coal pillar
000
2140
2860
4290
5000
5710
7140
7860
9290
2020
0000 0005 0010 0015 0020 0025 0030 0035 0040 0045
Average axial strain of coal pillar
000
2140
2860
4290
5000
5710
7140
7860
9290
18
Ave
rage
str
ess
of c
oal p
illar
(MPa
) A
vera
ge s
tres
s of
coa
l pill
ar (M
Pa)
Aver
age
stre
ss o
f coa
l pill
ar (M
Pa) 16
14
12
10
8
6
4
22
00
Figure A-41 Post peak pillar strength with increasing backfill 7m high pillar (wh=29) with cohesive backfill on left non-cohesive backfill on right
14 14
0
000
2500
3130
3750
5000 6250
6880
8130
8750
0
000
2500
3130
3750
5000
6250
6880
8130
8750
12 12
10
Ave
rage
str
ess
of c
oal p
illar
(MPa
)
10
8
6
4
2
0000 0010 0020 0030 0040 0050 0000 0010 0020 0030 0040 0050
Average axial strain of coal pillar Average axial strain of coal pillar
Figure A-42 Post peak pillar strength with increasing backfill 8m high pillar (wh=25) with cohesive backfill on left non-cohesive backfill on right
2
4
6
8
10
12
14
2
4
6
8
14
12
Ave
rage
str
ess
of c
oal p
illar
(MPa
) A
vera
ge s
tres
s of
coa
l pill
ar (M
Pa)
0
000 2220 2780 3890 5000 6110 7220 8330 8890
0
000 2220 2780 3890 5000 6110 7220 8330 8890
Ave
rage
str
ess
of c
oal p
illar
(MPa
)
10
8
6
4
2
0000 0005 0010 0015 0020 0025 0030 0035 0040 0000 0005 0010 0015 0020 0025 0030 0035 0040
Average axial strain of coal pillar Average axial strain of coal pillar
Figure A-43 Post peak pillar strength with increasing backfill 9m high pillar (wh=22) with cohesive backfill on left non-cohesive backfill on right
12 12
0
000 2500
3000 4000
5000 6000
7000 8000
9000
0
000
2500
3000
4000
5000
6000
7000
8000
9000
10
Ave
rage
str
ess
of c
oal p
illar
(MPa
) 10
8
6
4
2
0000 0005 0010 0015 0020 0025 0030 0035 0000 0005 0010 0015 0020 0025 0030 0035
Average axial strain of coal pillar Average axial strain of coal pillar
Figure A-44 Post peak pillar strength with increasing backfill 10m high pillar (wh=20) with cohesive backfill on left non-cohesive backfill on right
The amount of backfill to achieve the transition between strain softening and hardening is presented in Table A-9 for all mining height The values in this table are estimated from the stress-strain curve analysed to 35 of strain and are depended on the backfill increment which is in turn dependent on the ratio of mining height to the calibrated element size 05m
Table A-9 Percentage of roadway backfill that leads to a transition from strain softening to hardening
Pillar height Non-cohesive 05MPa Cohesive 10MPa Cohesive backfill backfill backfill
5m 300 200 200
6m 500 417 333
7m 571 500 429
8m 625 625 500
9m 722 722 611
10m 800 800 700
The modelling results suggest that the average axial stress of coal pillar increases with compression until peak stress is reached In the post-failure region pillar stress is reduced as strain increases for all models without backfill All the model results predict that there would be a change to strain hardening behaviour as percentage of backfill increases For example this transition point is 333 for 10 MPa cohesive backfill while 50 for non-cohesive backfill with 6m mining height as shown in Table A-9 It can also be seen from Table A-9 that tall pillars need more backfill than squat pillars to achieve the change from strain softening to hardening for either cohesive backfill or non-cohesive backfill
A55 Backfill for diamond shaped pillars
A 7m high diamond shaped pillar with 50 degree skew angle is analysed with increasing level of backfill in surrounding roadways On the skewed angle the backfill is constrained with roller boundary conditions normal to the skewed angle to represent symmetry conditions and a 5m wide roadway
Figure A-45 Numerical model of diamond shaped pillar with backfill on left and boundary conditions on right
The predicted strength of a diamond shaped pillar and equivalent square pillar with increasing roadway backfill of both cohesive and non-cohesive models is presented in Figure A-46 and Figure A-47
6
7
8
9
10
11
12
13
0 10
Pilla
r str
engt
h (M
Pa)
20 30 40 50 60 70 80 90 100
Percentage of backfill ()
Skew pillar
Square pillar
0
10
20
30
40
50
60
70
0 10
Incr
ease
of p
illar
str
engt
h (
)
20 30 40 50 60 70 80 90 100
Percentage of backfill ()
Skew pillar
Square pillar
Figure A-46 Predicted pillar strength of diamond and square shaped pillars with increasing percentage of 1MPa cohesive backfill On left is absolute strength and on right is percentage strength increase
6
7
8
9
10
11
0 10
Pilla
r stre
ngth
(MP
a)
20 30 40 50 60 70 80 90 100
Percentage of backfill ()
Skew pillar
Square pillar
0
5
10
15
20
25
30
35
0 10
Incr
ease
of p
illar
str
engt
h (
)
20 30 40 50 60 70 80 90 100
Percentage of backfill ()
Skew pillar
Square pillar
Figure A-47 Predicted pillar strength of diamond and square shaped pillars with increasing percentage of non-cohesive backfill On left is absolute strength and on right is percentage strength increase
A56 Backfill placed after significant pillar yield
A pillar model with 90 non-cohesive backfill placed after yielding of a 7m high pillar is presented in Figure A-48 The percentage of strength increase is given in Table A-10 It is found that the pillar strength increase is lower if the pillar has undergone significant deformation before the placement of backfill It is predicted that 90 backfill results in a strain-hardening pillar behaviour even if the pillar has previously yielded significantly
Ave
rage
stre
ss o
f coa
l pill
ar (M
Pa)
18 without backfill 025 strain 050 strain
14
16
075 strain 100 strain
12 125 strain 150 strain
10 175 strain 200 strain
8
6
4
2
0 0000 0005 0010 0015 0020 0025 0030 0035 0040 0045 0050
Average strain of coal pillar
Figure A-48 Stress strain curves for backfill placed around the pre-strained pillar displaying state of pillar core upon placement of backfill
Table A-10 Pillar strength increase with 90 non-cohesive backfill placed around a pre-strained 7m high square pillar of 20m width
Percentage backfill ()
Strain at placement of non-cohesive backfill ()
Pillar strength (MPa)
Percentage increase in peak
strength ()
Percentage increase in post-peak
strength at 3 strain ()
0 000 7953 000
90 000 10290 2939
90 025 9156 1513
90 050 8965 1272
90 075 8526 720
90 100 7945 26006
90 125 7951 22608
90 150 7951 18917
90 175 7951 15629
90 200 7951 11134
A6 3D MODEL OF DUNCAN ST FAILURE PANEL
A61 Numerical model
A three dimensional model of 46 pillars in the Duncan St subsidence region has been analysed with over burden geology based on hole CP1 and a constant overburden depth of 124m Figure A-49 Figure A-50 and Figure A-51 Uniform mining heights of 6m and 9m have been analysed
Selection of the pillars to be analysed is based on visual inspection of the panel layout and includes pillars bounded by unmined coal to the west the waterline barrier pillar to the east larger pillars to the south and a panel of slightly larger pillars of different orientation to the north
One row of pillars in the middle of this panel trending from north-west to south-east are of smaller dimension than the average and of diamond shape with acute internal angle of approximately 50degrees Being in the approximate middle of the panel close to full tributary area load will be mobilised on this row of pillars and therefore it is believed pillars in this row initiated the 2008 subsidence event
The Duncan Street numerical model has the following objectives
bull Estimation of pillar stresses and FoS for comparison with empirical formula
bull Comparison of backfill response at panel scale with previous single pillar studies
bull Estimation of surface subsidence at given percentage roadway fill
bull Estimation of extent of abutment stresses due to panel failure
A62 Observations from Duncan Street numerical model
bull At 6m mining height the minimum pillar FoS for these 46 pillars is calculated to be 131 using Pressure Arch theory and UNSW strength formula panel failure is not predicted with this mining height by the model At 9m mining height the minimum FoS is calculated as 099 and panel failure is predicted to occur
bull The probability of pillar failure for associated FoS calculated by the UNSW pillar strength formula Eq(2) is given in Galvin 2006 in Table A-11 The relationship was developed for square pillars using the Australian pillar database and tributary area theory and hence theoretically speaking may not directly apply to this study However it can be taken as a general guide
bull From Table A-11 it is seen that there is a 1 in 20 probability of instability at 6m mining height and a 1 in 2 probability at 9m mining height Numerical modelling is however a deterministic approach and it always predicts failure if the FoS is less than 10 and stability if FoS gt 10 since no variation in geotechnical properties or conditions is used
bull Although our numerical models predict no pillar failure at 6m and panel failure at 9m in reality there remains approximately a 1 in 20 chance of failure at 6m mining height If one pillar was to fail load transferred to adjacent pillars would reduce the FoS of these adjacent pillars and could lead to the pillar failure and subsidence as observed at 2008 event region
Table A-11 Factor of safety failure probabilities for UNSW pillar strength formula
(after Galvin 2006)
Safety Factor Probability of pillar failure
087 8 10
100 5 10
122 1 10
130 5 100
138 2 100
144 1 100
163 1 1000
179 1 10000
195 1 100000
211 1 1000000
bull Based on the numerical results obtained using two mining heights the pillar and overburden failure is consistent with analytical predictions from Pressure Arch theory and UNSW pillar strength calculation
bull Surface subsidence predicted from the numerical model with a mining height of 9m is 196m While this value is in approximate agreement with monitoring data (14mshy15m) the model was not sufficiently calibrated since the real mining height in the region is uncertain to be able to confidently predict final subsidence strains and tilts at the site
bull With 1MPa cohesive backfill at a roadway fill ratio of 83 the predicted strength increase is 70 With non-cohesive backfill at the same fill ratio the strength increase is 20 These values are in agreement with the results for single pillars
bull The numerically predicted surface subsidence with 83 roadway fill is 022m Maximum predicted tilt in east-west direction is 7mmm and in north-south direction is 5mmm Analytical formula [Holla amp Barclay 2000] predict maximum tilt of 53mmm for this amount of subsidence
bull Isolated cohesive backfill surrounding pillars of low wh ratio is predicted to be effective in confining the pillar and increasing peak pillar strength and panel stability Isolated non-cohesive backfill without barriers could not be analysed in this numerical model as backfill lsquoflowsrsquo and numerical stability could not be achieved
bull Stress transfer in the immediate roof sandstone unit (above the coal roof) is predicted to extend approximately 80m beyond the limits of the collapsed panel This is in reasonable agreement with theoretical studies
Figure A-49 Duncan St modelled panel with outline of adjacent modelled panel location of representative open hole CP1 file named ldquoAppendix B2 open hole logsrdquo located in directory ldquoCollingwood Park Subsidence 2B Collingwood Park Mine Subsidence Reports 1988 Eventsrdquo and mine subsidence limit contour
A63 Model properties
Overburden geology is based on borehole CP1 the most complete interpreted available hole drilled in 1988 by Queensland Department of Mines Figure A-50 To include this in the numerical model lithological units had to be coalesced into major units of sandstone (SS) siltstone (SL) mudstone (MS) weathered units and coal Figure A-51
Rock properties for the overburden were determined from a 2D parametric study whereby the UCS of all units was scaled to achieve pillar and overburden failure at 8m mining height Table A-12 and Table A-13
Unit top depth thickness unit thickness
thickness scaled
thickness in model
000 1200 1200 1046 1000 1200 700 SS 700 610 600 1900 600 MS 600 523 500 2500 1100 SS 1300 1133 1100 3600 200 SS 000 3800 100 SL 1000 871 900 3900 100 MS 000 4000 500 000 4500 100 000 4600 100 000 4700 100 000 4800 100 SS 400 349 400 4900 300 SS 000 5200 300 SL 700 610 600 5500 100 MS 000 5600 300 MS 000 5900 400 SS 500 436 400 6300 100 SS 000 6400 400 SL SS 900 784 800 6800 100 SL MS 000 6900 100 SL 000 7000 200 SL MS 000 7200 100 SS SL 000 7300 200 SS 1000 871 900 7500 200 SL 000 7700 200 SS SL 000 7900 200 SS 000 8100 100 SL 000 8200 100 SS 000 8300 200 SL 4350 3790 3800 8500 200 SL 000 8700 100 SS 000 8800 100 COAL 000 8900 200 000 9100 100 000 9200 100 000 9300 100 SL MS 000 9400 300 SL MS SS 000 9700 100 000 9800 100 SL MS 000 9900 400 SL SS 000 10300 200 SS MS 000 10500 100 SL MS 000 10600 200 SL MS SS 000 10800 100 000 10900 400 SL MS 000 11300 400 SL SS 000 11700 100 SS MS 000 11800 300 000 12100 400 SL SS 000
SL MS MS SS
MS
MS
SL
MS SS SL SS SL MS MS
weathering
SL MS SS
12500 150 000 12650 450 850 741 750 13100 400 SS 000 13500 100 MS SL
SS SL 960 837 500
13600 200 13800 100 SS 13900 200 14100 360
SS SL SL MS
14460 470 COAL MINING SEAM 600 14930 FLOOR
Figure A-50 Inferred geology from representative borelog CP1 used in numerical model
weathering SS
Unit Depth floor below surface Num elements Unit Unit name in model surface 0
10 3 16 weather 16 2 15 ss6
MS 21 2 14 ms2 SS 32 4 13 ss5 SL 41 3 12 sl3 SS 45 1 11 ss4 MS 51 2 10 ms1 SS 55 1 9 ss3 SL 63 3 8 sl2 SS 72 3 7 ss2 SL 1055 11 6 sl1 SS 113 4 5 ss1 SEAMR 118 3 4 seamr SEAM 124 3 3 seam FLOOR1 134 3 2 floor2 FLOOR2 250 10 1 floor1
Figure A-51 Coalesced units for numerical model based on hole CP1
Insitu stress is unknown at the site so a horizontal to vertical stress gradient of 15 has been assumed Given that the extensive workings were undertaken 20 to 30 years before the 2008 event horizontal stresses in the mining seam would be considerably disturbed from the pre-mining conditions
Table A-12 Rock properties for softening mohr coloumb material Softening rates of coal friction angle is 6 degrees over 2 plastic strain and total loss of cohesion over 24 plastic strain in coal and over 1 in other rocks Determined from pillar studies
E
nu Bulk Shear UCS UCS Phi Dilation Coh Tensile Strength (GPa) (GPa) (GPa) (MPa) scaled angle (MPa) (MPa)
SS 75 02 4167 3125 50 125 40 2 291 125
SL 4 025 2667 1600 30 75 35 2 195 075
MS 3 025 2000 1200 15 375 32 2 104 0375
Weathering 1 025 0667 0400 8 2 32 2 055 02
COAL 11 03 0917 0423 12 3 36 6 076 003
FLOOR1 4 025 2667 1600 30 75 38 2 183 075
FLOOR2 4 025 2667 1600 30 75 38 2 183 075
Table A-13 Ubiquitous joint properties Softening rate of ubiquitous joints total loss of cohesion over 1 plastic strain Determined from 2D overburden studies
Cohesion Ubiq joint cohesion Tensile Strength Ubiq joint tensile strength Ubiq joint (MPa) (MPa) (MPa) (MPa) friction
SS 291 00029144 125 0000125 15 SL 195 00019521 075 0000075 15 MS 104 00010393 0375 00000375 15 Weathering 055 00005543 02 000002 15 COAL 076 003 FLOOR1 183 - 075 - -FLOOR2 183 075 -
A64 Results from 3D Duncan St model
Factor of Safety estimated at 6m and 9m mining heights
Figure A-52 Pillar FoS calculated for 6m mining height by analytical method with strength by eq(3) and pillar stress by pressure arch theory Minimum value is 131 suggesting a 5 in 100 probability of failure however not sufficient to fail in the numerical model (that requires FoS lt 10)
Figure A-53 Pillar FoS calculated analytically for 9m mining height (eq(3) and PA theory) Minimum value is 099 suggesting a probability of failure of 5 in 10 although in the numerical model failure should occur
Yield on plane for 6m and 9m mining heights
Figure A-54 Location of section plane used for section view in following figures
Figure A-55 Yield on section plane for 6m mining height No significant damage or displacement observed
Figure A-56 Yield on section plane for 9m mining height no backfill
Figure A-57 Displacement on section plane for 9m mining height no backfill Maximum displacement is approximately 15m at surface
Results on horizontal plane at mid-pillar height
Figure A-58 Yield at mid-pillar height 9m mining height Blue elements evident in some pillars indicating pillar core remains intact
Figure A-59 Predicted vertical stress at mid pillar height 9m mining height Insitu stress is 30MPa Unyielded pillars and pillars hardening after yield are transferring vertical load while yielded pillars carry little load Extent of abutment stress increase is approximately 80m
Figure A-60 Roof vertical stress predicted by numerical model with 9m mining height Contour increments are 01MPa Base vertical stress is approximately 27MPa Abutment stress influence distance is approximately 80m
Results on surface after panel failure at 9m mining height
Figure A-61 Surface subsidence as predicted with numerical model with 9m mining height and total subsidence along Duncan St to McLaughlin St as monitored to October 09 Maximum surface subsidence predicted as 196m Outline of numerical modelling pillars and dotted contour of observed subsidence limit
A65 Duncan St model ndash backfill effectiveness
The Duncan St 3D model has been analysed with full and targeted 1MPa cohesive and non-cohesive backfill placed in roadways Roadway fill of 66 is analysed for the 1MPa cohesive mixture and 83 roadway fill for the non-cohesive mix
Results are presented in the following figures and figure captions
Factor of Safety increase from cohesive backfill
Analysis of the Duncan St model with 9m mining height is undertaken to estimate the FoS increase from backfill By increasing gravity in increments the backfill strength improvement is quantified With 83 roadway fill of 1MPa cohesive backfill the overburden and pillar tops (ie region of pillar above height of backfill) fails with gravity of 17ms2 suggesting the pillars with FoS of approximately 10 has increased FoS to 17 by backfilling adjacent roadways
Figure A-62 Gravity of 16g with 83 1MPa cohesive backfill showing no significant yield
Figure A-63 Gravity of 17g with 83 1MPa cohesive backfill predicting failure of pillar tops and overburden and collapse of roadway void space
FoS increase with non-cohesive backfill
With non-cohesive backfill pillars yielded due to lack of confinement upon initial placement of backfill in roadways but overburden remain stable and void space above backfill remained open Overburden remained stable at gravity increase to 11ms2 Figure A-64 but collapsed at gravity increase of 12ms2 Figure A-65
Figure A-64 Gravity of 11g with 83 non-cohesive backfill predicting pillar yield but overburden stability
Figure A-65 Gravity of 12g with 83 non-cohesive backfill predicting failure of pillars and overburden and collapse of roadway void space Maximum surface subsidence is 055m which includes the compressive effect of the 12g gravity increase
Placement of targeted backfill
A model is analysed with cohesive backfill totally surrounding two pillars with low predicted FoS The two pillars are predicted to have a FoS of 099 and 100 left to right viewed from above at a 9m mining height Backfill extends to an extent of 5m to 10m from the pillar and is 6m high in the roadways Gravity increase to 12g required to fail panel suggesting panel strength increase is approximately 20 from targeted backfill Predicted surface subsidence 125m (excessive mesh deformation stops analysis equilibrated stage may have higher surface subsidence)
Figure A-66 Duncan St model with 66 roadway fill of 1MPa cohesive backfill surrounding two pillars with low FoS at 9m mining height
Figure A-67 Predicted yield at mid pillar height of 9m pillars with 66 roadway fill of 1MPa cohesive backfill Note intact core (blue) for targeted pillars
Figure A-68 Pillar strength at 9m mining height Strength WITHOUT BACKFILL of northern focus pillar selected for targeted backfill is 527MPa and southern focus pillar is 526MPa
Figure A-69 Vertical stress in pillars targeted for partial backfill placement Stress calculated at equilibrium of elasto-plastic analysis WITHOUT BACKFILL Stress in northern focus pillar is 54MPa and in southern focus pillar is 513 FoS of NFP=52754 = 0975 FoS of SFP=526513 = 1025
Non-cohesive backfill in targeted placement study
A model with targeted placement of non-cohesive backfill was attempted but could not be satisfactorily converged since backfill lsquoflowsrsquo and inter-penetrates elements resulting in numerical instabilities
Forcing pillars to fail to examine resultant subsidence
To examine the extent of surface subsidence if backfilled pillars fail the numerical model with 9m mining height and 83 roadway fill of 1MPa cohesive backfill is analysed with a 90 reduction in coal pillar strength properties
With 9m mining height and 83 roadway fill of cohesive backfill void space remaining is 15m and the numerical model predicts failure of pillars and overburden results in approximately 02m surface subsidence
Figure A-70 Surface subsidence predicted by numerical model when pillars forced to fail with 83 roadway fill Contour interval is 01m with maximum subsidence predicted as 022m
Figure A-71 Surface strain in east-west direction when pillars forced to fail resulting 022m surface subsidence Maximum strain is 5mmm and contour interval is 1mmm
Figure A-72 Surface strain in north-south direction when pillars forced to fail resulting 022m surface subsidence Maximum strain is 3mmm and contour interval is 1mmm
Figure A-73 Tilt in east-west direction Units are mmm and intervals are 1mmm maximum tilt is 7mmm
Figure A-74 Tilt in north-south direction Units are mmm and intervals are 1mmm maximum tilt is 5mmm
To highlight the need for adequate fill the model with 66 roadway fill is analysed with the pillars forced to fail with a 50 reduction in pillar strength Void space over the backfill in the roadways is 30m Modelling predicts maximum surface subsidence of 068m
Figure A-75 Surface subsidence when pillars forced to fail with 66 roadway fill Roadway void space is 30m with the model predicting 068m surface subsidence Contour interval is 01m
A66 Numerical model of adjacent high risk area
Numerical model and panel stability
A numerical model of the region adjacent to Duncan St incorporating 76 pillars is analysed at 9m mining height Overburden strata strengths and depth-of-cover is consistent with Duncan St model
The main objective of this model is to estimate the strength difference between the two mining panels west and east of the Waterline fault Given uniform mining height and depth-of-cover the strength difference will be due to the pillar configuration and boundary conditions
At 9m mining height the model is predicted to be essentially stable although 9 pillars are predicted to be fully yielded at mid-pillar height
With gravity increase of 10 the model remains stable At 20 increase in gravity the model is predicted to fail with significant overburden yield
It is concluded therefore that the panel to the east of Waterline fault is 20 stronger than the panel to the west
Figure A-76 Location of numerical model 2 together with surface subsidence contours from 1988 and 2008 events and seam level eastern boundary of failure predicted from 3D seismic
Figure A-77 Yield on section at mid-height for 9m mining height
Figure A-78 Rockmass yield on vertical section trending east-west at mid-point of model Note overburden is largly intact with no extensive collapse
Figure A-79 Pillars predicted to have failed from Numerical model 2 with surface subsidence contours and inferred eastern limit of failed zone at seam level
By a 20 increase in gravity the model is forced to fail resulting in predicted 13m surface subsidence that includes increased overburden compression from increased gravitational component Excessive deformation and numerical instability stopped the model true surface deformation may be higher
Figure A-80 Adjacent model with 9m mining height Predicted surface subsidence after 20 increase in gravity Model predicts 13m surface subsidence
Figure A-81 Adjacent model with 9m mining height and 20 gravity increase Predicted failure at mid-pillar height Note intact core in southern pillars which appear stronger from unmined adjacent coal and larger general pillar size
A7 CONCLUSIONS
A71 Current knowledge on coal pillars behaviour
bull The strength based factor-of-safety approach is well established in coal pillar design Factors of safety for coal pillars required to provide medium to long term stability should be greater than 16 [Galvin 2006 Hill 2005]
bull Coal pillar strength has been the subject of rigorous research since at least the 1960rsquos and the Salamon amp Munro formula has been applied in the design of over a million coal pillars in South Africa alone [Mark 1999 Salamon 1998] Strength formula derivations from the UNSW are established in Australia
bull Coal pillar load calculation traditionally relies on tributary area theory which is a conservative approach suitable for pillar design
bull Tributary area conditions are NOT satisfied at Collingwood Park pillars are irregular in size and shape there is large areas of unmined coal and the seam has significant dip
bull This last point is important as analytical methods hold the only hope of evaluating every pillar at Westfalen No 3 Colliery The numerical model of Duncan St analyses 46 pillars and requires significant computational resources the entire Colliery has in excess of 700 pillars and cannot be analysed by the same methods in its entirety by current computer codes in a reasonable time frame
bull Likewise it is not satisfactory to draw conclusions on panel stability from limited analysis of representative groupings of pillars because of the variability in size shape mining height and cover depth over the mining area
bull To overcome the limitations of tributary area theory for the back-analysis of an irregular pillar layout a novel approach for calculating loads based on pressure arch theory has been developed subjected to international peer review and published in the International Journal of Rock Mechanics and Mining Sciences In summary each pillar is individually examined and the pillar area circumference and centroid are calculated At the pillar centroid the cover depth and mining height are determined An influence zone based on a circular area with radius defined by the depth-dependent load transfer distance Within this area the local extraction ratio is calculated This approach has found to satisfactorily account for pillars of arbitrary shape in irregular layout with variable cover depth
bull This allows a FoS to be determined for the over 700 pillars of Westfalen No 3 with reasonable computer resources
A72 Typical pillar strength effects
Width to height ratio
bull Pillars at Westfalen No 3 have typical effective width from 20m to 50m While mining height is uncertain it is believed to range from 6m to 10m With these dimensions pillar wh ratio ranges from 20 to 83
bull At the lower limit of wh=20 geological influences will start to determine pillar strength [Galvin 2006] From wh in the range gt 20 to 40 the formula of Salamon and Munro or UNSW extensions could be expected to estimate pillar strength with the squat pillar version of these formula applicable for whgt40 [Galvin 2006 Salamon 1998 Galvin 1999]
bull The squat pillar extensions were developed since the standard formulas were found to underestimate pillar strength at whgt4 At Westfalen No 3 colliery although there are a number of pillars of whgt4 many of these are irregular in shape often long and relatively narrow (30m ndash 40m) Given this and the need to automate the assessment of every pillar the squat pillar strength formula is not utilised This approach is conservative
Pillar shape effects
bull Many pillars at Westfalen No 3 are skewed of diamond shape with acute internal angle from 50 to 90 degrees Hydraulic radius simile accounts for pillar shape by an effective width defined by 4AC while the UNSW has a parrellopid formula that for pillars of equal side length results in an effective width equivalent to this
bull In a study of pillar shapes common to Westfalen No 3 colliery the hydraulic radius analogy for estimation of effective width is found adequate with errors less than 6 for considered sizes and shapes
Post peak strength
bull Numerical studies and the work of Das in Indian coal fields highlights the changing post peak behaviour with increasing width to height ratiorsquos It has been determined that when wh exceeds approximately 5 pillars start to harden post peak When whlt3 pillars display limited if any post peak strength
bull The significance of this effect will be in the manner that pillars shed load to adjacent pillars In an array of pillars of similar dimensions pillars with a low wh ratio could be expected to shed load in a sudden more catastrophic manner than those that harden post peak Such sudden pillar failure is referred in the literature as catastrophic cascading or rolling pillar failure and has been responsible for damaging wind blasts and significant loss of life over the years
bull In an irregular pillar layout such as Westfalen No 3 with variable wh ratio significant barrier pillars and regions of unmined coal sudden multiple panel collapse would be expected to be less likely
bull The analytical approach developed for assessing pillar load accounts for load shed from a failed pillars to pillars within the zone of influence of that pillar
Specific details of this approach are discussed in the hazard map and risk assessment chapter of this report
Backfill effect
bull Numerical studies on a cohesive and non-cohesive backfill suggest that pillar strength is increased with increasing height of fill Studies suggest a 1MPa cohesive backfill may increase pillar strength by approximately 10 at 40 roadway fill for wh=33 and 18 at 40 roadway fill at wh=22 At 80 roadway fill pillar strength increases are predicted to exceed 50 Percentage strength increases are predicted to be greater with lower wh ratiorsquos
bull Studies of a non-cohesive backfill suggest at 80 roadway fill pillar strength increases are approximately 25
bull With both backfill types pillar strength is predicted to increases dramatically above 80 roadway fill and pillars are predicted to exhibit post-peak hardening behaviour
For example in the Duncan St area a pillar of effective width 20m will have a FoS of approximately 118 at mining height of 10m without backfill A 50 strength increase from 1MPa cohesive backfill at 80 roadway fill will raise the FoS to approximately 177 and reduce the probability of instability from approximately 1 in 10 to less than 1 in 1000
With 80 roadway fill of a non-cohesive backfill the same Duncan St pillar FoS will increase to approximately 147 and the probability of instability reduce to less than 1 in 100
bull Backfill is likely to reduce the rate of time dependent pillar strength degradation by reducing pillar spalling due to the erosive effects over time of high stress and exposure of the pillar surface to the atmosphere
bull In addition backfill is likely to benefit pillar stability by limiting the void available to the roof to fall into Roof falls particularly at roadway intersections may be present By reducing the roadway volume backfill will eventually support the roof when the bulking effect of roof falls fills the remaining roadway voids space Beyond this summary time dependent issues of backfill have not been considered
roadway
fill
Non-cohesive backfill
(7m mining height width 20m) strength increase
05 MPa cohesive backfill
(7m mining height width 20m)
strength increase
10 MPa cohesive backfill
(7m mining height width 20m)
strength increase
60 135 388 437
70 183 432 597
80
90
208
291
474
572
698
957
A73 Duncan St numerical model
bull In the Duncan St subsidence region approximately 46 pillars are surrounded by unmined coal to the west a large pillar containing the Waterline fault to the east and larger pillars to the south and north
bull At 6m mining height pillar minimum FoS for these 46 pillars is calculated at 131 with Pressure Arch theory and UNSW strength formula At 9m mining height minimum FoS is calculated as 099
bull Pillar probability of failure for FoS calculated by the UNSW eq(2) is given in [Galvin 2006] as
Table A-14 Factor of safety failure probabilities for UNSW pillar strength formula (after Galvin 2006)
Safety Factor Probability of pillar failure
087 8 10
100 5 10
122 1 10
13 5 100
138 2 100
144 1 100
163 1 1000
179 1 10000
195 1 100000
211 1 1000000
bull From Table A-14 at 6m mining height there is a 1 in 20 probability of instability and at 9m a 1 in 2 probability The variability in the database of failed and unfailed pillars from which eq (1) to eq (3) are derived is responsible for these probabilities Our numerical model should always predict failure if the FoS is less than 10 and always predict stability with FoS gt 10 since no such variability in geotechnical properties or conditions is used
bull While our numerical model predicts no pillar failure at 6m and pillar failure at 9m in reality there remains approximately a 1 in 20 chance of failure at 6m mining height If one pillar was to fail load transferred to adjacent pillars would reduce these adjacent pillars FoS and may well lead to the pillar failure and resultant subsidence observed at Duncan St
bull Based on the numerical results obtained using two mining heights the pillar and overburden failure is in line with analytical predictions from Pressure Arch theory and UNSW pillar strength calculation
bull Surface subsidence predicted from the 9m mining height numerical model is 196m While this value is in general agreement with monitoring data the model is not sufficiently calibrated since the real mining height in the region is unknown to be able to confidently predict final subsidence strains and tilts
bull With 1MPa cohesive backfill at a fill ratio of 83 the predicted strength increase is 70 With non-cohesive backfill at the same fill ratio the strength increase is 20 these values are in agreement with single pillar studies
bull Abutment stresses in the immediate roof sandstone unit (above the coal roof) are predicted to extend approximately 80m beyond the limits of the model This is in reasonable agreement with twice the load transfer distance of 64m (at 124m depth-of-cover) used to define a pillars zone of influence (the ZI also includes half pillar width ie 74m for 20m pillar)
A74 Numerical model of adjacent region
bull A numerical model of the region immediately to the east of the Duncan St failure region is constructed with 76 pillars
bull At 9m mining height the model predicts failure of 9 pillars but no significant overburden failure The model remains stable in general
bull With a 20 increase in gravity the model is predicted to fail
bull Numerical modelling results suggest the region to the east of the Waterline barrier pillar is stronger by approximately 20 than the subsided region to the west of the barrier pillar
bull Predicted surface subsidence (including compressive effects from gravity increase) is 13m all though numerical instabilities halt the model and true surface subsidence is likely to be higher
bull Inspection of yield at mid-pillar height suggests the southern pillars in the model have intact core when pillars in the middle of the region are failed in their entire volume In reality the southern region of this panel have greater depth-of-cover therefore higher pillar stresses and thus lower FoS in these southern pillars

Incr
ease
of p
illar
str
engt
h (
)
140
120
100
80
60
40
20
0
9m-00MPa
9m-05MPa
9m-10MPa
0 10 20 30 40 50 60 70 80 90 100
Percentage of backfill ()
Figure A-33 Comparison of 05 and 10 MPa cohesive backfill and non-cohesive backfill at 9m mining height
Modelling predicts that 05MPa is as effective as 10MPa at increasing pillar strength below approximately 50-60 roadway fill Modelling suggests that cohesive backfill is more effective at increasing pillar strength than non-cohesive fill
A53 Numerical study of the influence of interface between backfill and pillar
To investigate the influence of an interface between backfill and pillar on the strength response of coal pillar an interface is set between backfill and pillar as shown in Figure A-34 The interface property is list in Table A-8
Figure A-34 Sketch showing the position of interface between backfill and pillar
2
4
6
2
4
6
Table A-8 Mechanical parameters of interface used in numerical model
Interface Cohesion FrictionNormal stiffness (GPa) Shear stiffness (GPa) property (MPa) Angle (deg)
Value 20 20 0 5~40
Pillar strength of a 6m high pillar as interface friction angle is increased from 5 degrees to 40 degrees is displayed in
1212
1010
88
cohesive backfill with interface
cohesive backfill without interface
non-cohesive backfill with interface
non-cohesive backfill without interface
4 cohesive backfill with interface
cohesive backfill without interface
non-cohesive backfill with interface
non-cohesive backfill without interface
stre
ss (M
Pa)
stre
ss (M
Pa)
6
2
00 0000 0005 0010 0015 0020 0025 0030 0035 0040 0045 0000 0005 0010 0015 0020 0025 0030 0035 0040 0045
strain strain
Figure A-35 to Figure A-38
Modelling predicts a non-cohesive interface with friction angle below 20 degrees results in a slight reduction in pillar strength above 20 degrees the interface is predicted to have little influence on pillar strength
cohesive backfill with interface
cohesive backfill without interface
non-cohesive backfill with interface
non-cohesive backfill without interface
1212
1010
88
cohesive backfill with interface
cohesive backfill without interface
non-cohesive backfill with interface
non-cohesive backfill without interface
stre
ss (M
Pa)
stre
ss (M
Pa)
6
4
2
0 0
0000 0005 0010 0015 0020 0025 0030 0035 0040 0045 0000 0005 0010 0015 0020 0025 0030 0035 0040 0045
strain strain
Figure A-35 Post peak pillar for 6m high pillar (wh=33) with friction angle 5deg on left 10deg on right of interface between backfill and pillar
2
4
6
cohesive backfill with interface
cohesive backfill without interface
non-cohesive backfill with interface
non-cohesive backfill without interface
1212
1010
88
cohesive backfill with interface
cohesive backfill without interface
non-cohesive backfill with interface
non-cohesive backfill without interface
stre
ss (M
Pa)
stre
ss (M
Pa)
6 6
44
2 2
0 0 0000 0005 0010 0015 0020 0025 0030 0035 0040 0045 0000 0005 0010 0015 0020 0025 0030 0035 0040 0045
strain strain
Figure A-36 Post peak pillar for 6m high pillar (wh=33) with friction angle 15deg on left 20deg on right of interface between backfill and pillar
12
cohesive backfill with interface
cohesive backfill without interface
non-cohesive backfill with interface non-cohesive backfill without interface
12
10 10
8 8
cohesive backfill with interface
cohesive backfill without interface
non-cohesive backfill with interface
non-cohesive backfill without interface
stre
ss (M
Pa)
stre
ss (M
Pa)
6 6
4 4
2 2
0 0 0000 0005 0010 0015 0020 0025 0030 0035 0040 0045 0000 0005 0010 0015 0020 0025 0030 0035 0040 0045
strain strain
Figure A-37 Post peak pillar for 6m high pillar (wh=33) with friction angle 25deg on left 30deg on right of interface between backfill and pillar
12
cohesive backfill with interface
cohesive backfill without interface
non-cohesive backfill with interface non-cohesive backfill without interface
12
10 10
8 8
cohesive backfill with interface
cohesive backfill without interface
non-cohesive backfill with interface
non-cohesive backfill without interface
stre
ss (M
Pa)
stre
ss (M
Pa)
6
4
2
0 0000 0005 0010 0015 0020 0025 0030 0035 0040 0045
0 0000 0005 0010 0015 0020 0025 0030 0035 0040 0045
strain strain
Figure A-38 Post peak pillar for 6m high pillar (wh=33) with friction angle 35deg on left 40deg on right of interface between backfill and pillar
22
6
8
24
A54 Post peak pillar strength
A full stress strain curve to approximately 35 strain is presented in the following figures for 1MPa cohesive and non-cohesive backfill Results for 05MPa cohesive backfill sit approximately mid-way between these two cases and are included in the summary Table A-9
24 24
0000 0010 0020 0030 0040 0050
Average axial strain of coal pillar
000
2000
3000
4000
5000
6000
7000
8000
9000
22
0000 0010 0020 0030 0040 0050
Average axial strail of coal pillar
000
2000
3000
4000
5000
6000
7000
8000
9000
20 20
18
Ave
rage
str
ess
of c
oal p
illar
(MPa
)
Ave
rage
str
ess
of c
oal p
illar
(MPa
)
18
16 16
1414
12 12
1010
88
66
44
22
00
Figure A-39 Post peak pillar strength with increasing backfill 5m high pillar (wh=40) with 1MPa cohesive backfill on left non-cohesive backfill on right
24
22
0000 0010 0020 0030 0040 0050
Average axial strain of coal pillar
00
250
333
417 500
583
667 833
917
22
0000 0010 0020 0030 0040 0050
Average axial strain of coal pillar
00
250 333
417
500 583
667
833
917
20 20
Ave
rage
str
ess
of c
oal p
illar
(MPa
)
18 18
16 16
14 14
12 12
10 10
8
6
4 4
2 2
0 0
Figure A-40 Post peak pillar strength with increasing backfill 6m high pillar (wh=33) with cohesive backfill on left non-cohesive backfill on right
Aver
age
stre
ss o
f coa
l pill
ar (M
Pa)
4
6
8
10
12
14
16
18
2
4
6
8
0000 0005 0010 0015 0020 0025 0030 0035 0040 0045
Average axial strain of coal pillar
000
2140
2860
4290
5000
5710
7140
7860
9290
2020
0000 0005 0010 0015 0020 0025 0030 0035 0040 0045
Average axial strain of coal pillar
000
2140
2860
4290
5000
5710
7140
7860
9290
18
Ave
rage
str
ess
of c
oal p
illar
(MPa
) A
vera
ge s
tres
s of
coa
l pill
ar (M
Pa)
Aver
age
stre
ss o
f coa
l pill
ar (M
Pa) 16
14
12
10
8
6
4
22
00
Figure A-41 Post peak pillar strength with increasing backfill 7m high pillar (wh=29) with cohesive backfill on left non-cohesive backfill on right
14 14
0
000
2500
3130
3750
5000 6250
6880
8130
8750
0
000
2500
3130
3750
5000
6250
6880
8130
8750
12 12
10
Ave
rage
str
ess
of c
oal p
illar
(MPa
)
10
8
6
4
2
0000 0010 0020 0030 0040 0050 0000 0010 0020 0030 0040 0050
Average axial strain of coal pillar Average axial strain of coal pillar
Figure A-42 Post peak pillar strength with increasing backfill 8m high pillar (wh=25) with cohesive backfill on left non-cohesive backfill on right
2
4
6
8
10
12
14
2
4
6
8
14
12
Ave
rage
str
ess
of c
oal p
illar
(MPa
) A
vera
ge s
tres
s of
coa
l pill
ar (M
Pa)
0
000 2220 2780 3890 5000 6110 7220 8330 8890
0
000 2220 2780 3890 5000 6110 7220 8330 8890
Ave
rage
str
ess
of c
oal p
illar
(MPa
)
10
8
6
4
2
0000 0005 0010 0015 0020 0025 0030 0035 0040 0000 0005 0010 0015 0020 0025 0030 0035 0040
Average axial strain of coal pillar Average axial strain of coal pillar
Figure A-43 Post peak pillar strength with increasing backfill 9m high pillar (wh=22) with cohesive backfill on left non-cohesive backfill on right
12 12
0
000 2500
3000 4000
5000 6000
7000 8000
9000
0
000
2500
3000
4000
5000
6000
7000
8000
9000
10
Ave
rage
str
ess
of c
oal p
illar
(MPa
) 10
8
6
4
2
0000 0005 0010 0015 0020 0025 0030 0035 0000 0005 0010 0015 0020 0025 0030 0035
Average axial strain of coal pillar Average axial strain of coal pillar
Figure A-44 Post peak pillar strength with increasing backfill 10m high pillar (wh=20) with cohesive backfill on left non-cohesive backfill on right
The amount of backfill to achieve the transition between strain softening and hardening is presented in Table A-9 for all mining height The values in this table are estimated from the stress-strain curve analysed to 35 of strain and are depended on the backfill increment which is in turn dependent on the ratio of mining height to the calibrated element size 05m
Table A-9 Percentage of roadway backfill that leads to a transition from strain softening to hardening
Pillar height Non-cohesive 05MPa Cohesive 10MPa Cohesive backfill backfill backfill
5m 300 200 200
6m 500 417 333
7m 571 500 429
8m 625 625 500
9m 722 722 611
10m 800 800 700
The modelling results suggest that the average axial stress of coal pillar increases with compression until peak stress is reached In the post-failure region pillar stress is reduced as strain increases for all models without backfill All the model results predict that there would be a change to strain hardening behaviour as percentage of backfill increases For example this transition point is 333 for 10 MPa cohesive backfill while 50 for non-cohesive backfill with 6m mining height as shown in Table A-9 It can also be seen from Table A-9 that tall pillars need more backfill than squat pillars to achieve the change from strain softening to hardening for either cohesive backfill or non-cohesive backfill
A55 Backfill for diamond shaped pillars
A 7m high diamond shaped pillar with 50 degree skew angle is analysed with increasing level of backfill in surrounding roadways On the skewed angle the backfill is constrained with roller boundary conditions normal to the skewed angle to represent symmetry conditions and a 5m wide roadway
Figure A-45 Numerical model of diamond shaped pillar with backfill on left and boundary conditions on right
The predicted strength of a diamond shaped pillar and equivalent square pillar with increasing roadway backfill of both cohesive and non-cohesive models is presented in Figure A-46 and Figure A-47
6
7
8
9
10
11
12
13
0 10
Pilla
r str
engt
h (M
Pa)
20 30 40 50 60 70 80 90 100
Percentage of backfill ()
Skew pillar
Square pillar
0
10
20
30
40
50
60
70
0 10
Incr
ease
of p
illar
str
engt
h (
)
20 30 40 50 60 70 80 90 100
Percentage of backfill ()
Skew pillar
Square pillar
Figure A-46 Predicted pillar strength of diamond and square shaped pillars with increasing percentage of 1MPa cohesive backfill On left is absolute strength and on right is percentage strength increase
6
7
8
9
10
11
0 10
Pilla
r stre
ngth
(MP
a)
20 30 40 50 60 70 80 90 100
Percentage of backfill ()
Skew pillar
Square pillar
0
5
10
15
20
25
30
35
0 10
Incr
ease
of p
illar
str
engt
h (
)
20 30 40 50 60 70 80 90 100
Percentage of backfill ()
Skew pillar
Square pillar
Figure A-47 Predicted pillar strength of diamond and square shaped pillars with increasing percentage of non-cohesive backfill On left is absolute strength and on right is percentage strength increase
A56 Backfill placed after significant pillar yield
A pillar model with 90 non-cohesive backfill placed after yielding of a 7m high pillar is presented in Figure A-48 The percentage of strength increase is given in Table A-10 It is found that the pillar strength increase is lower if the pillar has undergone significant deformation before the placement of backfill It is predicted that 90 backfill results in a strain-hardening pillar behaviour even if the pillar has previously yielded significantly
Ave
rage
stre
ss o
f coa
l pill
ar (M
Pa)
18 without backfill 025 strain 050 strain
14
16
075 strain 100 strain
12 125 strain 150 strain
10 175 strain 200 strain
8
6
4
2
0 0000 0005 0010 0015 0020 0025 0030 0035 0040 0045 0050
Average strain of coal pillar
Figure A-48 Stress strain curves for backfill placed around the pre-strained pillar displaying state of pillar core upon placement of backfill
Table A-10 Pillar strength increase with 90 non-cohesive backfill placed around a pre-strained 7m high square pillar of 20m width
Percentage backfill ()
Strain at placement of non-cohesive backfill ()
Pillar strength (MPa)
Percentage increase in peak
strength ()
Percentage increase in post-peak
strength at 3 strain ()
0 000 7953 000
90 000 10290 2939
90 025 9156 1513
90 050 8965 1272
90 075 8526 720
90 100 7945 26006
90 125 7951 22608
90 150 7951 18917
90 175 7951 15629
90 200 7951 11134
A6 3D MODEL OF DUNCAN ST FAILURE PANEL
A61 Numerical model
A three dimensional model of 46 pillars in the Duncan St subsidence region has been analysed with over burden geology based on hole CP1 and a constant overburden depth of 124m Figure A-49 Figure A-50 and Figure A-51 Uniform mining heights of 6m and 9m have been analysed
Selection of the pillars to be analysed is based on visual inspection of the panel layout and includes pillars bounded by unmined coal to the west the waterline barrier pillar to the east larger pillars to the south and a panel of slightly larger pillars of different orientation to the north
One row of pillars in the middle of this panel trending from north-west to south-east are of smaller dimension than the average and of diamond shape with acute internal angle of approximately 50degrees Being in the approximate middle of the panel close to full tributary area load will be mobilised on this row of pillars and therefore it is believed pillars in this row initiated the 2008 subsidence event
The Duncan Street numerical model has the following objectives
bull Estimation of pillar stresses and FoS for comparison with empirical formula
bull Comparison of backfill response at panel scale with previous single pillar studies
bull Estimation of surface subsidence at given percentage roadway fill
bull Estimation of extent of abutment stresses due to panel failure
A62 Observations from Duncan Street numerical model
bull At 6m mining height the minimum pillar FoS for these 46 pillars is calculated to be 131 using Pressure Arch theory and UNSW strength formula panel failure is not predicted with this mining height by the model At 9m mining height the minimum FoS is calculated as 099 and panel failure is predicted to occur
bull The probability of pillar failure for associated FoS calculated by the UNSW pillar strength formula Eq(2) is given in Galvin 2006 in Table A-11 The relationship was developed for square pillars using the Australian pillar database and tributary area theory and hence theoretically speaking may not directly apply to this study However it can be taken as a general guide
bull From Table A-11 it is seen that there is a 1 in 20 probability of instability at 6m mining height and a 1 in 2 probability at 9m mining height Numerical modelling is however a deterministic approach and it always predicts failure if the FoS is less than 10 and stability if FoS gt 10 since no variation in geotechnical properties or conditions is used
bull Although our numerical models predict no pillar failure at 6m and panel failure at 9m in reality there remains approximately a 1 in 20 chance of failure at 6m mining height If one pillar was to fail load transferred to adjacent pillars would reduce the FoS of these adjacent pillars and could lead to the pillar failure and subsidence as observed at 2008 event region
Table A-11 Factor of safety failure probabilities for UNSW pillar strength formula
(after Galvin 2006)
Safety Factor Probability of pillar failure
087 8 10
100 5 10
122 1 10
130 5 100
138 2 100
144 1 100
163 1 1000
179 1 10000
195 1 100000
211 1 1000000
bull Based on the numerical results obtained using two mining heights the pillar and overburden failure is consistent with analytical predictions from Pressure Arch theory and UNSW pillar strength calculation
bull Surface subsidence predicted from the numerical model with a mining height of 9m is 196m While this value is in approximate agreement with monitoring data (14mshy15m) the model was not sufficiently calibrated since the real mining height in the region is uncertain to be able to confidently predict final subsidence strains and tilts at the site
bull With 1MPa cohesive backfill at a roadway fill ratio of 83 the predicted strength increase is 70 With non-cohesive backfill at the same fill ratio the strength increase is 20 These values are in agreement with the results for single pillars
bull The numerically predicted surface subsidence with 83 roadway fill is 022m Maximum predicted tilt in east-west direction is 7mmm and in north-south direction is 5mmm Analytical formula [Holla amp Barclay 2000] predict maximum tilt of 53mmm for this amount of subsidence
bull Isolated cohesive backfill surrounding pillars of low wh ratio is predicted to be effective in confining the pillar and increasing peak pillar strength and panel stability Isolated non-cohesive backfill without barriers could not be analysed in this numerical model as backfill lsquoflowsrsquo and numerical stability could not be achieved
bull Stress transfer in the immediate roof sandstone unit (above the coal roof) is predicted to extend approximately 80m beyond the limits of the collapsed panel This is in reasonable agreement with theoretical studies
Figure A-49 Duncan St modelled panel with outline of adjacent modelled panel location of representative open hole CP1 file named ldquoAppendix B2 open hole logsrdquo located in directory ldquoCollingwood Park Subsidence 2B Collingwood Park Mine Subsidence Reports 1988 Eventsrdquo and mine subsidence limit contour
A63 Model properties
Overburden geology is based on borehole CP1 the most complete interpreted available hole drilled in 1988 by Queensland Department of Mines Figure A-50 To include this in the numerical model lithological units had to be coalesced into major units of sandstone (SS) siltstone (SL) mudstone (MS) weathered units and coal Figure A-51
Rock properties for the overburden were determined from a 2D parametric study whereby the UCS of all units was scaled to achieve pillar and overburden failure at 8m mining height Table A-12 and Table A-13
Unit top depth thickness unit thickness
thickness scaled
thickness in model
000 1200 1200 1046 1000 1200 700 SS 700 610 600 1900 600 MS 600 523 500 2500 1100 SS 1300 1133 1100 3600 200 SS 000 3800 100 SL 1000 871 900 3900 100 MS 000 4000 500 000 4500 100 000 4600 100 000 4700 100 000 4800 100 SS 400 349 400 4900 300 SS 000 5200 300 SL 700 610 600 5500 100 MS 000 5600 300 MS 000 5900 400 SS 500 436 400 6300 100 SS 000 6400 400 SL SS 900 784 800 6800 100 SL MS 000 6900 100 SL 000 7000 200 SL MS 000 7200 100 SS SL 000 7300 200 SS 1000 871 900 7500 200 SL 000 7700 200 SS SL 000 7900 200 SS 000 8100 100 SL 000 8200 100 SS 000 8300 200 SL 4350 3790 3800 8500 200 SL 000 8700 100 SS 000 8800 100 COAL 000 8900 200 000 9100 100 000 9200 100 000 9300 100 SL MS 000 9400 300 SL MS SS 000 9700 100 000 9800 100 SL MS 000 9900 400 SL SS 000 10300 200 SS MS 000 10500 100 SL MS 000 10600 200 SL MS SS 000 10800 100 000 10900 400 SL MS 000 11300 400 SL SS 000 11700 100 SS MS 000 11800 300 000 12100 400 SL SS 000
SL MS MS SS
MS
MS
SL
MS SS SL SS SL MS MS
weathering
SL MS SS
12500 150 000 12650 450 850 741 750 13100 400 SS 000 13500 100 MS SL
SS SL 960 837 500
13600 200 13800 100 SS 13900 200 14100 360
SS SL SL MS
14460 470 COAL MINING SEAM 600 14930 FLOOR
Figure A-50 Inferred geology from representative borelog CP1 used in numerical model
weathering SS
Unit Depth floor below surface Num elements Unit Unit name in model surface 0
10 3 16 weather 16 2 15 ss6
MS 21 2 14 ms2 SS 32 4 13 ss5 SL 41 3 12 sl3 SS 45 1 11 ss4 MS 51 2 10 ms1 SS 55 1 9 ss3 SL 63 3 8 sl2 SS 72 3 7 ss2 SL 1055 11 6 sl1 SS 113 4 5 ss1 SEAMR 118 3 4 seamr SEAM 124 3 3 seam FLOOR1 134 3 2 floor2 FLOOR2 250 10 1 floor1
Figure A-51 Coalesced units for numerical model based on hole CP1
Insitu stress is unknown at the site so a horizontal to vertical stress gradient of 15 has been assumed Given that the extensive workings were undertaken 20 to 30 years before the 2008 event horizontal stresses in the mining seam would be considerably disturbed from the pre-mining conditions
Table A-12 Rock properties for softening mohr coloumb material Softening rates of coal friction angle is 6 degrees over 2 plastic strain and total loss of cohesion over 24 plastic strain in coal and over 1 in other rocks Determined from pillar studies
E
nu Bulk Shear UCS UCS Phi Dilation Coh Tensile Strength (GPa) (GPa) (GPa) (MPa) scaled angle (MPa) (MPa)
SS 75 02 4167 3125 50 125 40 2 291 125
SL 4 025 2667 1600 30 75 35 2 195 075
MS 3 025 2000 1200 15 375 32 2 104 0375
Weathering 1 025 0667 0400 8 2 32 2 055 02
COAL 11 03 0917 0423 12 3 36 6 076 003
FLOOR1 4 025 2667 1600 30 75 38 2 183 075
FLOOR2 4 025 2667 1600 30 75 38 2 183 075
Table A-13 Ubiquitous joint properties Softening rate of ubiquitous joints total loss of cohesion over 1 plastic strain Determined from 2D overburden studies
Cohesion Ubiq joint cohesion Tensile Strength Ubiq joint tensile strength Ubiq joint (MPa) (MPa) (MPa) (MPa) friction
SS 291 00029144 125 0000125 15 SL 195 00019521 075 0000075 15 MS 104 00010393 0375 00000375 15 Weathering 055 00005543 02 000002 15 COAL 076 003 FLOOR1 183 - 075 - -FLOOR2 183 075 -
A64 Results from 3D Duncan St model
Factor of Safety estimated at 6m and 9m mining heights
Figure A-52 Pillar FoS calculated for 6m mining height by analytical method with strength by eq(3) and pillar stress by pressure arch theory Minimum value is 131 suggesting a 5 in 100 probability of failure however not sufficient to fail in the numerical model (that requires FoS lt 10)
Figure A-53 Pillar FoS calculated analytically for 9m mining height (eq(3) and PA theory) Minimum value is 099 suggesting a probability of failure of 5 in 10 although in the numerical model failure should occur
Yield on plane for 6m and 9m mining heights
Figure A-54 Location of section plane used for section view in following figures
Figure A-55 Yield on section plane for 6m mining height No significant damage or displacement observed
Figure A-56 Yield on section plane for 9m mining height no backfill
Figure A-57 Displacement on section plane for 9m mining height no backfill Maximum displacement is approximately 15m at surface
Results on horizontal plane at mid-pillar height
Figure A-58 Yield at mid-pillar height 9m mining height Blue elements evident in some pillars indicating pillar core remains intact
Figure A-59 Predicted vertical stress at mid pillar height 9m mining height Insitu stress is 30MPa Unyielded pillars and pillars hardening after yield are transferring vertical load while yielded pillars carry little load Extent of abutment stress increase is approximately 80m
Figure A-60 Roof vertical stress predicted by numerical model with 9m mining height Contour increments are 01MPa Base vertical stress is approximately 27MPa Abutment stress influence distance is approximately 80m
Results on surface after panel failure at 9m mining height
Figure A-61 Surface subsidence as predicted with numerical model with 9m mining height and total subsidence along Duncan St to McLaughlin St as monitored to October 09 Maximum surface subsidence predicted as 196m Outline of numerical modelling pillars and dotted contour of observed subsidence limit
A65 Duncan St model ndash backfill effectiveness
The Duncan St 3D model has been analysed with full and targeted 1MPa cohesive and non-cohesive backfill placed in roadways Roadway fill of 66 is analysed for the 1MPa cohesive mixture and 83 roadway fill for the non-cohesive mix
Results are presented in the following figures and figure captions
Factor of Safety increase from cohesive backfill
Analysis of the Duncan St model with 9m mining height is undertaken to estimate the FoS increase from backfill By increasing gravity in increments the backfill strength improvement is quantified With 83 roadway fill of 1MPa cohesive backfill the overburden and pillar tops (ie region of pillar above height of backfill) fails with gravity of 17ms2 suggesting the pillars with FoS of approximately 10 has increased FoS to 17 by backfilling adjacent roadways
Figure A-62 Gravity of 16g with 83 1MPa cohesive backfill showing no significant yield
Figure A-63 Gravity of 17g with 83 1MPa cohesive backfill predicting failure of pillar tops and overburden and collapse of roadway void space
FoS increase with non-cohesive backfill
With non-cohesive backfill pillars yielded due to lack of confinement upon initial placement of backfill in roadways but overburden remain stable and void space above backfill remained open Overburden remained stable at gravity increase to 11ms2 Figure A-64 but collapsed at gravity increase of 12ms2 Figure A-65
Figure A-64 Gravity of 11g with 83 non-cohesive backfill predicting pillar yield but overburden stability
Figure A-65 Gravity of 12g with 83 non-cohesive backfill predicting failure of pillars and overburden and collapse of roadway void space Maximum surface subsidence is 055m which includes the compressive effect of the 12g gravity increase
Placement of targeted backfill
A model is analysed with cohesive backfill totally surrounding two pillars with low predicted FoS The two pillars are predicted to have a FoS of 099 and 100 left to right viewed from above at a 9m mining height Backfill extends to an extent of 5m to 10m from the pillar and is 6m high in the roadways Gravity increase to 12g required to fail panel suggesting panel strength increase is approximately 20 from targeted backfill Predicted surface subsidence 125m (excessive mesh deformation stops analysis equilibrated stage may have higher surface subsidence)
Figure A-66 Duncan St model with 66 roadway fill of 1MPa cohesive backfill surrounding two pillars with low FoS at 9m mining height
Figure A-67 Predicted yield at mid pillar height of 9m pillars with 66 roadway fill of 1MPa cohesive backfill Note intact core (blue) for targeted pillars
Figure A-68 Pillar strength at 9m mining height Strength WITHOUT BACKFILL of northern focus pillar selected for targeted backfill is 527MPa and southern focus pillar is 526MPa
Figure A-69 Vertical stress in pillars targeted for partial backfill placement Stress calculated at equilibrium of elasto-plastic analysis WITHOUT BACKFILL Stress in northern focus pillar is 54MPa and in southern focus pillar is 513 FoS of NFP=52754 = 0975 FoS of SFP=526513 = 1025
Non-cohesive backfill in targeted placement study
A model with targeted placement of non-cohesive backfill was attempted but could not be satisfactorily converged since backfill lsquoflowsrsquo and inter-penetrates elements resulting in numerical instabilities
Forcing pillars to fail to examine resultant subsidence
To examine the extent of surface subsidence if backfilled pillars fail the numerical model with 9m mining height and 83 roadway fill of 1MPa cohesive backfill is analysed with a 90 reduction in coal pillar strength properties
With 9m mining height and 83 roadway fill of cohesive backfill void space remaining is 15m and the numerical model predicts failure of pillars and overburden results in approximately 02m surface subsidence
Figure A-70 Surface subsidence predicted by numerical model when pillars forced to fail with 83 roadway fill Contour interval is 01m with maximum subsidence predicted as 022m
Figure A-71 Surface strain in east-west direction when pillars forced to fail resulting 022m surface subsidence Maximum strain is 5mmm and contour interval is 1mmm
Figure A-72 Surface strain in north-south direction when pillars forced to fail resulting 022m surface subsidence Maximum strain is 3mmm and contour interval is 1mmm
Figure A-73 Tilt in east-west direction Units are mmm and intervals are 1mmm maximum tilt is 7mmm
Figure A-74 Tilt in north-south direction Units are mmm and intervals are 1mmm maximum tilt is 5mmm
To highlight the need for adequate fill the model with 66 roadway fill is analysed with the pillars forced to fail with a 50 reduction in pillar strength Void space over the backfill in the roadways is 30m Modelling predicts maximum surface subsidence of 068m
Figure A-75 Surface subsidence when pillars forced to fail with 66 roadway fill Roadway void space is 30m with the model predicting 068m surface subsidence Contour interval is 01m
A66 Numerical model of adjacent high risk area
Numerical model and panel stability
A numerical model of the region adjacent to Duncan St incorporating 76 pillars is analysed at 9m mining height Overburden strata strengths and depth-of-cover is consistent with Duncan St model
The main objective of this model is to estimate the strength difference between the two mining panels west and east of the Waterline fault Given uniform mining height and depth-of-cover the strength difference will be due to the pillar configuration and boundary conditions
At 9m mining height the model is predicted to be essentially stable although 9 pillars are predicted to be fully yielded at mid-pillar height
With gravity increase of 10 the model remains stable At 20 increase in gravity the model is predicted to fail with significant overburden yield
It is concluded therefore that the panel to the east of Waterline fault is 20 stronger than the panel to the west
Figure A-76 Location of numerical model 2 together with surface subsidence contours from 1988 and 2008 events and seam level eastern boundary of failure predicted from 3D seismic
Figure A-77 Yield on section at mid-height for 9m mining height
Figure A-78 Rockmass yield on vertical section trending east-west at mid-point of model Note overburden is largly intact with no extensive collapse
Figure A-79 Pillars predicted to have failed from Numerical model 2 with surface subsidence contours and inferred eastern limit of failed zone at seam level
By a 20 increase in gravity the model is forced to fail resulting in predicted 13m surface subsidence that includes increased overburden compression from increased gravitational component Excessive deformation and numerical instability stopped the model true surface deformation may be higher
Figure A-80 Adjacent model with 9m mining height Predicted surface subsidence after 20 increase in gravity Model predicts 13m surface subsidence
Figure A-81 Adjacent model with 9m mining height and 20 gravity increase Predicted failure at mid-pillar height Note intact core in southern pillars which appear stronger from unmined adjacent coal and larger general pillar size
A7 CONCLUSIONS
A71 Current knowledge on coal pillars behaviour
bull The strength based factor-of-safety approach is well established in coal pillar design Factors of safety for coal pillars required to provide medium to long term stability should be greater than 16 [Galvin 2006 Hill 2005]
bull Coal pillar strength has been the subject of rigorous research since at least the 1960rsquos and the Salamon amp Munro formula has been applied in the design of over a million coal pillars in South Africa alone [Mark 1999 Salamon 1998] Strength formula derivations from the UNSW are established in Australia
bull Coal pillar load calculation traditionally relies on tributary area theory which is a conservative approach suitable for pillar design
bull Tributary area conditions are NOT satisfied at Collingwood Park pillars are irregular in size and shape there is large areas of unmined coal and the seam has significant dip
bull This last point is important as analytical methods hold the only hope of evaluating every pillar at Westfalen No 3 Colliery The numerical model of Duncan St analyses 46 pillars and requires significant computational resources the entire Colliery has in excess of 700 pillars and cannot be analysed by the same methods in its entirety by current computer codes in a reasonable time frame
bull Likewise it is not satisfactory to draw conclusions on panel stability from limited analysis of representative groupings of pillars because of the variability in size shape mining height and cover depth over the mining area
bull To overcome the limitations of tributary area theory for the back-analysis of an irregular pillar layout a novel approach for calculating loads based on pressure arch theory has been developed subjected to international peer review and published in the International Journal of Rock Mechanics and Mining Sciences In summary each pillar is individually examined and the pillar area circumference and centroid are calculated At the pillar centroid the cover depth and mining height are determined An influence zone based on a circular area with radius defined by the depth-dependent load transfer distance Within this area the local extraction ratio is calculated This approach has found to satisfactorily account for pillars of arbitrary shape in irregular layout with variable cover depth
bull This allows a FoS to be determined for the over 700 pillars of Westfalen No 3 with reasonable computer resources
A72 Typical pillar strength effects
Width to height ratio
bull Pillars at Westfalen No 3 have typical effective width from 20m to 50m While mining height is uncertain it is believed to range from 6m to 10m With these dimensions pillar wh ratio ranges from 20 to 83
bull At the lower limit of wh=20 geological influences will start to determine pillar strength [Galvin 2006] From wh in the range gt 20 to 40 the formula of Salamon and Munro or UNSW extensions could be expected to estimate pillar strength with the squat pillar version of these formula applicable for whgt40 [Galvin 2006 Salamon 1998 Galvin 1999]
bull The squat pillar extensions were developed since the standard formulas were found to underestimate pillar strength at whgt4 At Westfalen No 3 colliery although there are a number of pillars of whgt4 many of these are irregular in shape often long and relatively narrow (30m ndash 40m) Given this and the need to automate the assessment of every pillar the squat pillar strength formula is not utilised This approach is conservative
Pillar shape effects
bull Many pillars at Westfalen No 3 are skewed of diamond shape with acute internal angle from 50 to 90 degrees Hydraulic radius simile accounts for pillar shape by an effective width defined by 4AC while the UNSW has a parrellopid formula that for pillars of equal side length results in an effective width equivalent to this
bull In a study of pillar shapes common to Westfalen No 3 colliery the hydraulic radius analogy for estimation of effective width is found adequate with errors less than 6 for considered sizes and shapes
Post peak strength
bull Numerical studies and the work of Das in Indian coal fields highlights the changing post peak behaviour with increasing width to height ratiorsquos It has been determined that when wh exceeds approximately 5 pillars start to harden post peak When whlt3 pillars display limited if any post peak strength
bull The significance of this effect will be in the manner that pillars shed load to adjacent pillars In an array of pillars of similar dimensions pillars with a low wh ratio could be expected to shed load in a sudden more catastrophic manner than those that harden post peak Such sudden pillar failure is referred in the literature as catastrophic cascading or rolling pillar failure and has been responsible for damaging wind blasts and significant loss of life over the years
bull In an irregular pillar layout such as Westfalen No 3 with variable wh ratio significant barrier pillars and regions of unmined coal sudden multiple panel collapse would be expected to be less likely
bull The analytical approach developed for assessing pillar load accounts for load shed from a failed pillars to pillars within the zone of influence of that pillar
Specific details of this approach are discussed in the hazard map and risk assessment chapter of this report
Backfill effect
bull Numerical studies on a cohesive and non-cohesive backfill suggest that pillar strength is increased with increasing height of fill Studies suggest a 1MPa cohesive backfill may increase pillar strength by approximately 10 at 40 roadway fill for wh=33 and 18 at 40 roadway fill at wh=22 At 80 roadway fill pillar strength increases are predicted to exceed 50 Percentage strength increases are predicted to be greater with lower wh ratiorsquos
bull Studies of a non-cohesive backfill suggest at 80 roadway fill pillar strength increases are approximately 25
bull With both backfill types pillar strength is predicted to increases dramatically above 80 roadway fill and pillars are predicted to exhibit post-peak hardening behaviour
For example in the Duncan St area a pillar of effective width 20m will have a FoS of approximately 118 at mining height of 10m without backfill A 50 strength increase from 1MPa cohesive backfill at 80 roadway fill will raise the FoS to approximately 177 and reduce the probability of instability from approximately 1 in 10 to less than 1 in 1000
With 80 roadway fill of a non-cohesive backfill the same Duncan St pillar FoS will increase to approximately 147 and the probability of instability reduce to less than 1 in 100
bull Backfill is likely to reduce the rate of time dependent pillar strength degradation by reducing pillar spalling due to the erosive effects over time of high stress and exposure of the pillar surface to the atmosphere
bull In addition backfill is likely to benefit pillar stability by limiting the void available to the roof to fall into Roof falls particularly at roadway intersections may be present By reducing the roadway volume backfill will eventually support the roof when the bulking effect of roof falls fills the remaining roadway voids space Beyond this summary time dependent issues of backfill have not been considered
roadway
fill
Non-cohesive backfill
(7m mining height width 20m) strength increase
05 MPa cohesive backfill
(7m mining height width 20m)
strength increase
10 MPa cohesive backfill
(7m mining height width 20m)
strength increase
60 135 388 437
70 183 432 597
80
90
208
291
474
572
698
957
A73 Duncan St numerical model
bull In the Duncan St subsidence region approximately 46 pillars are surrounded by unmined coal to the west a large pillar containing the Waterline fault to the east and larger pillars to the south and north
bull At 6m mining height pillar minimum FoS for these 46 pillars is calculated at 131 with Pressure Arch theory and UNSW strength formula At 9m mining height minimum FoS is calculated as 099
bull Pillar probability of failure for FoS calculated by the UNSW eq(2) is given in [Galvin 2006] as
Table A-14 Factor of safety failure probabilities for UNSW pillar strength formula (after Galvin 2006)
Safety Factor Probability of pillar failure
087 8 10
100 5 10
122 1 10
13 5 100
138 2 100
144 1 100
163 1 1000
179 1 10000
195 1 100000
211 1 1000000
bull From Table A-14 at 6m mining height there is a 1 in 20 probability of instability and at 9m a 1 in 2 probability The variability in the database of failed and unfailed pillars from which eq (1) to eq (3) are derived is responsible for these probabilities Our numerical model should always predict failure if the FoS is less than 10 and always predict stability with FoS gt 10 since no such variability in geotechnical properties or conditions is used
bull While our numerical model predicts no pillar failure at 6m and pillar failure at 9m in reality there remains approximately a 1 in 20 chance of failure at 6m mining height If one pillar was to fail load transferred to adjacent pillars would reduce these adjacent pillars FoS and may well lead to the pillar failure and resultant subsidence observed at Duncan St
bull Based on the numerical results obtained using two mining heights the pillar and overburden failure is in line with analytical predictions from Pressure Arch theory and UNSW pillar strength calculation
bull Surface subsidence predicted from the 9m mining height numerical model is 196m While this value is in general agreement with monitoring data the model is not sufficiently calibrated since the real mining height in the region is unknown to be able to confidently predict final subsidence strains and tilts
bull With 1MPa cohesive backfill at a fill ratio of 83 the predicted strength increase is 70 With non-cohesive backfill at the same fill ratio the strength increase is 20 these values are in agreement with single pillar studies
bull Abutment stresses in the immediate roof sandstone unit (above the coal roof) are predicted to extend approximately 80m beyond the limits of the model This is in reasonable agreement with twice the load transfer distance of 64m (at 124m depth-of-cover) used to define a pillars zone of influence (the ZI also includes half pillar width ie 74m for 20m pillar)
A74 Numerical model of adjacent region
bull A numerical model of the region immediately to the east of the Duncan St failure region is constructed with 76 pillars
bull At 9m mining height the model predicts failure of 9 pillars but no significant overburden failure The model remains stable in general
bull With a 20 increase in gravity the model is predicted to fail
bull Numerical modelling results suggest the region to the east of the Waterline barrier pillar is stronger by approximately 20 than the subsided region to the west of the barrier pillar
bull Predicted surface subsidence (including compressive effects from gravity increase) is 13m all though numerical instabilities halt the model and true surface subsidence is likely to be higher
bull Inspection of yield at mid-pillar height suggests the southern pillars in the model have intact core when pillars in the middle of the region are failed in their entire volume In reality the southern region of this panel have greater depth-of-cover therefore higher pillar stresses and thus lower FoS in these southern pillars

2
4
6
2
4
6
Table A-8 Mechanical parameters of interface used in numerical model
Interface Cohesion FrictionNormal stiffness (GPa) Shear stiffness (GPa) property (MPa) Angle (deg)
Value 20 20 0 5~40
Pillar strength of a 6m high pillar as interface friction angle is increased from 5 degrees to 40 degrees is displayed in
1212
1010
88
cohesive backfill with interface
cohesive backfill without interface
non-cohesive backfill with interface
non-cohesive backfill without interface
4 cohesive backfill with interface
cohesive backfill without interface
non-cohesive backfill with interface
non-cohesive backfill without interface
stre
ss (M
Pa)
stre
ss (M
Pa)
6
2
00 0000 0005 0010 0015 0020 0025 0030 0035 0040 0045 0000 0005 0010 0015 0020 0025 0030 0035 0040 0045
strain strain
Figure A-35 to Figure A-38
Modelling predicts a non-cohesive interface with friction angle below 20 degrees results in a slight reduction in pillar strength above 20 degrees the interface is predicted to have little influence on pillar strength
cohesive backfill with interface
cohesive backfill without interface
non-cohesive backfill with interface
non-cohesive backfill without interface
1212
1010
88
cohesive backfill with interface
cohesive backfill without interface
non-cohesive backfill with interface
non-cohesive backfill without interface
stre
ss (M
Pa)
stre
ss (M
Pa)
6
4
2
0 0
0000 0005 0010 0015 0020 0025 0030 0035 0040 0045 0000 0005 0010 0015 0020 0025 0030 0035 0040 0045
strain strain
Figure A-35 Post peak pillar for 6m high pillar (wh=33) with friction angle 5deg on left 10deg on right of interface between backfill and pillar
2
4
6
cohesive backfill with interface
cohesive backfill without interface
non-cohesive backfill with interface
non-cohesive backfill without interface
1212
1010
88
cohesive backfill with interface
cohesive backfill without interface
non-cohesive backfill with interface
non-cohesive backfill without interface
stre
ss (M
Pa)
stre
ss (M
Pa)
6 6
44
2 2
0 0 0000 0005 0010 0015 0020 0025 0030 0035 0040 0045 0000 0005 0010 0015 0020 0025 0030 0035 0040 0045
strain strain
Figure A-36 Post peak pillar for 6m high pillar (wh=33) with friction angle 15deg on left 20deg on right of interface between backfill and pillar
12
cohesive backfill with interface
cohesive backfill without interface
non-cohesive backfill with interface non-cohesive backfill without interface
12
10 10
8 8
cohesive backfill with interface
cohesive backfill without interface
non-cohesive backfill with interface
non-cohesive backfill without interface
stre
ss (M
Pa)
stre
ss (M
Pa)
6 6
4 4
2 2
0 0 0000 0005 0010 0015 0020 0025 0030 0035 0040 0045 0000 0005 0010 0015 0020 0025 0030 0035 0040 0045
strain strain
Figure A-37 Post peak pillar for 6m high pillar (wh=33) with friction angle 25deg on left 30deg on right of interface between backfill and pillar
12
cohesive backfill with interface
cohesive backfill without interface
non-cohesive backfill with interface non-cohesive backfill without interface
12
10 10
8 8
cohesive backfill with interface
cohesive backfill without interface
non-cohesive backfill with interface
non-cohesive backfill without interface
stre
ss (M
Pa)
stre
ss (M
Pa)
6
4
2
0 0000 0005 0010 0015 0020 0025 0030 0035 0040 0045
0 0000 0005 0010 0015 0020 0025 0030 0035 0040 0045
strain strain
Figure A-38 Post peak pillar for 6m high pillar (wh=33) with friction angle 35deg on left 40deg on right of interface between backfill and pillar
22
6
8
24
A54 Post peak pillar strength
A full stress strain curve to approximately 35 strain is presented in the following figures for 1MPa cohesive and non-cohesive backfill Results for 05MPa cohesive backfill sit approximately mid-way between these two cases and are included in the summary Table A-9
24 24
0000 0010 0020 0030 0040 0050
Average axial strain of coal pillar
000
2000
3000
4000
5000
6000
7000
8000
9000
22
0000 0010 0020 0030 0040 0050
Average axial strail of coal pillar
000
2000
3000
4000
5000
6000
7000
8000
9000
20 20
18
Ave
rage
str
ess
of c
oal p
illar
(MPa
)
Ave
rage
str
ess
of c
oal p
illar
(MPa
)
18
16 16
1414
12 12
1010
88
66
44
22
00
Figure A-39 Post peak pillar strength with increasing backfill 5m high pillar (wh=40) with 1MPa cohesive backfill on left non-cohesive backfill on right
24
22
0000 0010 0020 0030 0040 0050
Average axial strain of coal pillar
00
250
333
417 500
583
667 833
917
22
0000 0010 0020 0030 0040 0050
Average axial strain of coal pillar
00
250 333
417
500 583
667
833
917
20 20
Ave
rage
str
ess
of c
oal p
illar
(MPa
)
18 18
16 16
14 14
12 12
10 10
8
6
4 4
2 2
0 0
Figure A-40 Post peak pillar strength with increasing backfill 6m high pillar (wh=33) with cohesive backfill on left non-cohesive backfill on right
Aver
age
stre
ss o
f coa
l pill
ar (M
Pa)
4
6
8
10
12
14
16
18
2
4
6
8
0000 0005 0010 0015 0020 0025 0030 0035 0040 0045
Average axial strain of coal pillar
000
2140
2860
4290
5000
5710
7140
7860
9290
2020
0000 0005 0010 0015 0020 0025 0030 0035 0040 0045
Average axial strain of coal pillar
000
2140
2860
4290
5000
5710
7140
7860
9290
18
Ave
rage
str
ess
of c
oal p
illar
(MPa
) A
vera
ge s
tres
s of
coa
l pill
ar (M
Pa)
Aver
age
stre
ss o
f coa
l pill
ar (M
Pa) 16
14
12
10
8
6
4
22
00
Figure A-41 Post peak pillar strength with increasing backfill 7m high pillar (wh=29) with cohesive backfill on left non-cohesive backfill on right
14 14
0
000
2500
3130
3750
5000 6250
6880
8130
8750
0
000
2500
3130
3750
5000
6250
6880
8130
8750
12 12
10
Ave
rage
str
ess
of c
oal p
illar
(MPa
)
10
8
6
4
2
0000 0010 0020 0030 0040 0050 0000 0010 0020 0030 0040 0050
Average axial strain of coal pillar Average axial strain of coal pillar
Figure A-42 Post peak pillar strength with increasing backfill 8m high pillar (wh=25) with cohesive backfill on left non-cohesive backfill on right
2
4
6
8
10
12
14
2
4
6
8
14
12
Ave
rage
str
ess
of c
oal p
illar
(MPa
) A
vera
ge s
tres
s of
coa
l pill
ar (M
Pa)
0
000 2220 2780 3890 5000 6110 7220 8330 8890
0
000 2220 2780 3890 5000 6110 7220 8330 8890
Ave
rage
str
ess
of c
oal p
illar
(MPa
)
10
8
6
4
2
0000 0005 0010 0015 0020 0025 0030 0035 0040 0000 0005 0010 0015 0020 0025 0030 0035 0040
Average axial strain of coal pillar Average axial strain of coal pillar
Figure A-43 Post peak pillar strength with increasing backfill 9m high pillar (wh=22) with cohesive backfill on left non-cohesive backfill on right
12 12
0
000 2500
3000 4000
5000 6000
7000 8000
9000
0
000
2500
3000
4000
5000
6000
7000
8000
9000
10
Ave
rage
str
ess
of c
oal p
illar
(MPa
) 10
8
6
4
2
0000 0005 0010 0015 0020 0025 0030 0035 0000 0005 0010 0015 0020 0025 0030 0035
Average axial strain of coal pillar Average axial strain of coal pillar
Figure A-44 Post peak pillar strength with increasing backfill 10m high pillar (wh=20) with cohesive backfill on left non-cohesive backfill on right
The amount of backfill to achieve the transition between strain softening and hardening is presented in Table A-9 for all mining height The values in this table are estimated from the stress-strain curve analysed to 35 of strain and are depended on the backfill increment which is in turn dependent on the ratio of mining height to the calibrated element size 05m
Table A-9 Percentage of roadway backfill that leads to a transition from strain softening to hardening
Pillar height Non-cohesive 05MPa Cohesive 10MPa Cohesive backfill backfill backfill
5m 300 200 200
6m 500 417 333
7m 571 500 429
8m 625 625 500
9m 722 722 611
10m 800 800 700
The modelling results suggest that the average axial stress of coal pillar increases with compression until peak stress is reached In the post-failure region pillar stress is reduced as strain increases for all models without backfill All the model results predict that there would be a change to strain hardening behaviour as percentage of backfill increases For example this transition point is 333 for 10 MPa cohesive backfill while 50 for non-cohesive backfill with 6m mining height as shown in Table A-9 It can also be seen from Table A-9 that tall pillars need more backfill than squat pillars to achieve the change from strain softening to hardening for either cohesive backfill or non-cohesive backfill
A55 Backfill for diamond shaped pillars
A 7m high diamond shaped pillar with 50 degree skew angle is analysed with increasing level of backfill in surrounding roadways On the skewed angle the backfill is constrained with roller boundary conditions normal to the skewed angle to represent symmetry conditions and a 5m wide roadway
Figure A-45 Numerical model of diamond shaped pillar with backfill on left and boundary conditions on right
The predicted strength of a diamond shaped pillar and equivalent square pillar with increasing roadway backfill of both cohesive and non-cohesive models is presented in Figure A-46 and Figure A-47
6
7
8
9
10
11
12
13
0 10
Pilla
r str
engt
h (M
Pa)
20 30 40 50 60 70 80 90 100
Percentage of backfill ()
Skew pillar
Square pillar
0
10
20
30
40
50
60
70
0 10
Incr
ease
of p
illar
str
engt
h (
)
20 30 40 50 60 70 80 90 100
Percentage of backfill ()
Skew pillar
Square pillar
Figure A-46 Predicted pillar strength of diamond and square shaped pillars with increasing percentage of 1MPa cohesive backfill On left is absolute strength and on right is percentage strength increase
6
7
8
9
10
11
0 10
Pilla
r stre
ngth
(MP
a)
20 30 40 50 60 70 80 90 100
Percentage of backfill ()
Skew pillar
Square pillar
0
5
10
15
20
25
30
35
0 10
Incr
ease
of p
illar
str
engt
h (
)
20 30 40 50 60 70 80 90 100
Percentage of backfill ()
Skew pillar
Square pillar
Figure A-47 Predicted pillar strength of diamond and square shaped pillars with increasing percentage of non-cohesive backfill On left is absolute strength and on right is percentage strength increase
A56 Backfill placed after significant pillar yield
A pillar model with 90 non-cohesive backfill placed after yielding of a 7m high pillar is presented in Figure A-48 The percentage of strength increase is given in Table A-10 It is found that the pillar strength increase is lower if the pillar has undergone significant deformation before the placement of backfill It is predicted that 90 backfill results in a strain-hardening pillar behaviour even if the pillar has previously yielded significantly
Ave
rage
stre
ss o
f coa
l pill
ar (M
Pa)
18 without backfill 025 strain 050 strain
14
16
075 strain 100 strain
12 125 strain 150 strain
10 175 strain 200 strain
8
6
4
2
0 0000 0005 0010 0015 0020 0025 0030 0035 0040 0045 0050
Average strain of coal pillar
Figure A-48 Stress strain curves for backfill placed around the pre-strained pillar displaying state of pillar core upon placement of backfill
Table A-10 Pillar strength increase with 90 non-cohesive backfill placed around a pre-strained 7m high square pillar of 20m width
Percentage backfill ()
Strain at placement of non-cohesive backfill ()
Pillar strength (MPa)
Percentage increase in peak
strength ()
Percentage increase in post-peak
strength at 3 strain ()
0 000 7953 000
90 000 10290 2939
90 025 9156 1513
90 050 8965 1272
90 075 8526 720
90 100 7945 26006
90 125 7951 22608
90 150 7951 18917
90 175 7951 15629
90 200 7951 11134
A6 3D MODEL OF DUNCAN ST FAILURE PANEL
A61 Numerical model
A three dimensional model of 46 pillars in the Duncan St subsidence region has been analysed with over burden geology based on hole CP1 and a constant overburden depth of 124m Figure A-49 Figure A-50 and Figure A-51 Uniform mining heights of 6m and 9m have been analysed
Selection of the pillars to be analysed is based on visual inspection of the panel layout and includes pillars bounded by unmined coal to the west the waterline barrier pillar to the east larger pillars to the south and a panel of slightly larger pillars of different orientation to the north
One row of pillars in the middle of this panel trending from north-west to south-east are of smaller dimension than the average and of diamond shape with acute internal angle of approximately 50degrees Being in the approximate middle of the panel close to full tributary area load will be mobilised on this row of pillars and therefore it is believed pillars in this row initiated the 2008 subsidence event
The Duncan Street numerical model has the following objectives
bull Estimation of pillar stresses and FoS for comparison with empirical formula
bull Comparison of backfill response at panel scale with previous single pillar studies
bull Estimation of surface subsidence at given percentage roadway fill
bull Estimation of extent of abutment stresses due to panel failure
A62 Observations from Duncan Street numerical model
bull At 6m mining height the minimum pillar FoS for these 46 pillars is calculated to be 131 using Pressure Arch theory and UNSW strength formula panel failure is not predicted with this mining height by the model At 9m mining height the minimum FoS is calculated as 099 and panel failure is predicted to occur
bull The probability of pillar failure for associated FoS calculated by the UNSW pillar strength formula Eq(2) is given in Galvin 2006 in Table A-11 The relationship was developed for square pillars using the Australian pillar database and tributary area theory and hence theoretically speaking may not directly apply to this study However it can be taken as a general guide
bull From Table A-11 it is seen that there is a 1 in 20 probability of instability at 6m mining height and a 1 in 2 probability at 9m mining height Numerical modelling is however a deterministic approach and it always predicts failure if the FoS is less than 10 and stability if FoS gt 10 since no variation in geotechnical properties or conditions is used
bull Although our numerical models predict no pillar failure at 6m and panel failure at 9m in reality there remains approximately a 1 in 20 chance of failure at 6m mining height If one pillar was to fail load transferred to adjacent pillars would reduce the FoS of these adjacent pillars and could lead to the pillar failure and subsidence as observed at 2008 event region
Table A-11 Factor of safety failure probabilities for UNSW pillar strength formula
(after Galvin 2006)
Safety Factor Probability of pillar failure
087 8 10
100 5 10
122 1 10
130 5 100
138 2 100
144 1 100
163 1 1000
179 1 10000
195 1 100000
211 1 1000000
bull Based on the numerical results obtained using two mining heights the pillar and overburden failure is consistent with analytical predictions from Pressure Arch theory and UNSW pillar strength calculation
bull Surface subsidence predicted from the numerical model with a mining height of 9m is 196m While this value is in approximate agreement with monitoring data (14mshy15m) the model was not sufficiently calibrated since the real mining height in the region is uncertain to be able to confidently predict final subsidence strains and tilts at the site
bull With 1MPa cohesive backfill at a roadway fill ratio of 83 the predicted strength increase is 70 With non-cohesive backfill at the same fill ratio the strength increase is 20 These values are in agreement with the results for single pillars
bull The numerically predicted surface subsidence with 83 roadway fill is 022m Maximum predicted tilt in east-west direction is 7mmm and in north-south direction is 5mmm Analytical formula [Holla amp Barclay 2000] predict maximum tilt of 53mmm for this amount of subsidence
bull Isolated cohesive backfill surrounding pillars of low wh ratio is predicted to be effective in confining the pillar and increasing peak pillar strength and panel stability Isolated non-cohesive backfill without barriers could not be analysed in this numerical model as backfill lsquoflowsrsquo and numerical stability could not be achieved
bull Stress transfer in the immediate roof sandstone unit (above the coal roof) is predicted to extend approximately 80m beyond the limits of the collapsed panel This is in reasonable agreement with theoretical studies
Figure A-49 Duncan St modelled panel with outline of adjacent modelled panel location of representative open hole CP1 file named ldquoAppendix B2 open hole logsrdquo located in directory ldquoCollingwood Park Subsidence 2B Collingwood Park Mine Subsidence Reports 1988 Eventsrdquo and mine subsidence limit contour
A63 Model properties
Overburden geology is based on borehole CP1 the most complete interpreted available hole drilled in 1988 by Queensland Department of Mines Figure A-50 To include this in the numerical model lithological units had to be coalesced into major units of sandstone (SS) siltstone (SL) mudstone (MS) weathered units and coal Figure A-51
Rock properties for the overburden were determined from a 2D parametric study whereby the UCS of all units was scaled to achieve pillar and overburden failure at 8m mining height Table A-12 and Table A-13
Unit top depth thickness unit thickness
thickness scaled
thickness in model
000 1200 1200 1046 1000 1200 700 SS 700 610 600 1900 600 MS 600 523 500 2500 1100 SS 1300 1133 1100 3600 200 SS 000 3800 100 SL 1000 871 900 3900 100 MS 000 4000 500 000 4500 100 000 4600 100 000 4700 100 000 4800 100 SS 400 349 400 4900 300 SS 000 5200 300 SL 700 610 600 5500 100 MS 000 5600 300 MS 000 5900 400 SS 500 436 400 6300 100 SS 000 6400 400 SL SS 900 784 800 6800 100 SL MS 000 6900 100 SL 000 7000 200 SL MS 000 7200 100 SS SL 000 7300 200 SS 1000 871 900 7500 200 SL 000 7700 200 SS SL 000 7900 200 SS 000 8100 100 SL 000 8200 100 SS 000 8300 200 SL 4350 3790 3800 8500 200 SL 000 8700 100 SS 000 8800 100 COAL 000 8900 200 000 9100 100 000 9200 100 000 9300 100 SL MS 000 9400 300 SL MS SS 000 9700 100 000 9800 100 SL MS 000 9900 400 SL SS 000 10300 200 SS MS 000 10500 100 SL MS 000 10600 200 SL MS SS 000 10800 100 000 10900 400 SL MS 000 11300 400 SL SS 000 11700 100 SS MS 000 11800 300 000 12100 400 SL SS 000
SL MS MS SS
MS
MS
SL
MS SS SL SS SL MS MS
weathering
SL MS SS
12500 150 000 12650 450 850 741 750 13100 400 SS 000 13500 100 MS SL
SS SL 960 837 500
13600 200 13800 100 SS 13900 200 14100 360
SS SL SL MS
14460 470 COAL MINING SEAM 600 14930 FLOOR
Figure A-50 Inferred geology from representative borelog CP1 used in numerical model
weathering SS
Unit Depth floor below surface Num elements Unit Unit name in model surface 0
10 3 16 weather 16 2 15 ss6
MS 21 2 14 ms2 SS 32 4 13 ss5 SL 41 3 12 sl3 SS 45 1 11 ss4 MS 51 2 10 ms1 SS 55 1 9 ss3 SL 63 3 8 sl2 SS 72 3 7 ss2 SL 1055 11 6 sl1 SS 113 4 5 ss1 SEAMR 118 3 4 seamr SEAM 124 3 3 seam FLOOR1 134 3 2 floor2 FLOOR2 250 10 1 floor1
Figure A-51 Coalesced units for numerical model based on hole CP1
Insitu stress is unknown at the site so a horizontal to vertical stress gradient of 15 has been assumed Given that the extensive workings were undertaken 20 to 30 years before the 2008 event horizontal stresses in the mining seam would be considerably disturbed from the pre-mining conditions
Table A-12 Rock properties for softening mohr coloumb material Softening rates of coal friction angle is 6 degrees over 2 plastic strain and total loss of cohesion over 24 plastic strain in coal and over 1 in other rocks Determined from pillar studies
E
nu Bulk Shear UCS UCS Phi Dilation Coh Tensile Strength (GPa) (GPa) (GPa) (MPa) scaled angle (MPa) (MPa)
SS 75 02 4167 3125 50 125 40 2 291 125
SL 4 025 2667 1600 30 75 35 2 195 075
MS 3 025 2000 1200 15 375 32 2 104 0375
Weathering 1 025 0667 0400 8 2 32 2 055 02
COAL 11 03 0917 0423 12 3 36 6 076 003
FLOOR1 4 025 2667 1600 30 75 38 2 183 075
FLOOR2 4 025 2667 1600 30 75 38 2 183 075
Table A-13 Ubiquitous joint properties Softening rate of ubiquitous joints total loss of cohesion over 1 plastic strain Determined from 2D overburden studies
Cohesion Ubiq joint cohesion Tensile Strength Ubiq joint tensile strength Ubiq joint (MPa) (MPa) (MPa) (MPa) friction
SS 291 00029144 125 0000125 15 SL 195 00019521 075 0000075 15 MS 104 00010393 0375 00000375 15 Weathering 055 00005543 02 000002 15 COAL 076 003 FLOOR1 183 - 075 - -FLOOR2 183 075 -
A64 Results from 3D Duncan St model
Factor of Safety estimated at 6m and 9m mining heights
Figure A-52 Pillar FoS calculated for 6m mining height by analytical method with strength by eq(3) and pillar stress by pressure arch theory Minimum value is 131 suggesting a 5 in 100 probability of failure however not sufficient to fail in the numerical model (that requires FoS lt 10)
Figure A-53 Pillar FoS calculated analytically for 9m mining height (eq(3) and PA theory) Minimum value is 099 suggesting a probability of failure of 5 in 10 although in the numerical model failure should occur
Yield on plane for 6m and 9m mining heights
Figure A-54 Location of section plane used for section view in following figures
Figure A-55 Yield on section plane for 6m mining height No significant damage or displacement observed
Figure A-56 Yield on section plane for 9m mining height no backfill
Figure A-57 Displacement on section plane for 9m mining height no backfill Maximum displacement is approximately 15m at surface
Results on horizontal plane at mid-pillar height
Figure A-58 Yield at mid-pillar height 9m mining height Blue elements evident in some pillars indicating pillar core remains intact
Figure A-59 Predicted vertical stress at mid pillar height 9m mining height Insitu stress is 30MPa Unyielded pillars and pillars hardening after yield are transferring vertical load while yielded pillars carry little load Extent of abutment stress increase is approximately 80m
Figure A-60 Roof vertical stress predicted by numerical model with 9m mining height Contour increments are 01MPa Base vertical stress is approximately 27MPa Abutment stress influence distance is approximately 80m
Results on surface after panel failure at 9m mining height
Figure A-61 Surface subsidence as predicted with numerical model with 9m mining height and total subsidence along Duncan St to McLaughlin St as monitored to October 09 Maximum surface subsidence predicted as 196m Outline of numerical modelling pillars and dotted contour of observed subsidence limit
A65 Duncan St model ndash backfill effectiveness
The Duncan St 3D model has been analysed with full and targeted 1MPa cohesive and non-cohesive backfill placed in roadways Roadway fill of 66 is analysed for the 1MPa cohesive mixture and 83 roadway fill for the non-cohesive mix
Results are presented in the following figures and figure captions
Factor of Safety increase from cohesive backfill
Analysis of the Duncan St model with 9m mining height is undertaken to estimate the FoS increase from backfill By increasing gravity in increments the backfill strength improvement is quantified With 83 roadway fill of 1MPa cohesive backfill the overburden and pillar tops (ie region of pillar above height of backfill) fails with gravity of 17ms2 suggesting the pillars with FoS of approximately 10 has increased FoS to 17 by backfilling adjacent roadways
Figure A-62 Gravity of 16g with 83 1MPa cohesive backfill showing no significant yield
Figure A-63 Gravity of 17g with 83 1MPa cohesive backfill predicting failure of pillar tops and overburden and collapse of roadway void space
FoS increase with non-cohesive backfill
With non-cohesive backfill pillars yielded due to lack of confinement upon initial placement of backfill in roadways but overburden remain stable and void space above backfill remained open Overburden remained stable at gravity increase to 11ms2 Figure A-64 but collapsed at gravity increase of 12ms2 Figure A-65
Figure A-64 Gravity of 11g with 83 non-cohesive backfill predicting pillar yield but overburden stability
Figure A-65 Gravity of 12g with 83 non-cohesive backfill predicting failure of pillars and overburden and collapse of roadway void space Maximum surface subsidence is 055m which includes the compressive effect of the 12g gravity increase
Placement of targeted backfill
A model is analysed with cohesive backfill totally surrounding two pillars with low predicted FoS The two pillars are predicted to have a FoS of 099 and 100 left to right viewed from above at a 9m mining height Backfill extends to an extent of 5m to 10m from the pillar and is 6m high in the roadways Gravity increase to 12g required to fail panel suggesting panel strength increase is approximately 20 from targeted backfill Predicted surface subsidence 125m (excessive mesh deformation stops analysis equilibrated stage may have higher surface subsidence)
Figure A-66 Duncan St model with 66 roadway fill of 1MPa cohesive backfill surrounding two pillars with low FoS at 9m mining height
Figure A-67 Predicted yield at mid pillar height of 9m pillars with 66 roadway fill of 1MPa cohesive backfill Note intact core (blue) for targeted pillars
Figure A-68 Pillar strength at 9m mining height Strength WITHOUT BACKFILL of northern focus pillar selected for targeted backfill is 527MPa and southern focus pillar is 526MPa
Figure A-69 Vertical stress in pillars targeted for partial backfill placement Stress calculated at equilibrium of elasto-plastic analysis WITHOUT BACKFILL Stress in northern focus pillar is 54MPa and in southern focus pillar is 513 FoS of NFP=52754 = 0975 FoS of SFP=526513 = 1025
Non-cohesive backfill in targeted placement study
A model with targeted placement of non-cohesive backfill was attempted but could not be satisfactorily converged since backfill lsquoflowsrsquo and inter-penetrates elements resulting in numerical instabilities
Forcing pillars to fail to examine resultant subsidence
To examine the extent of surface subsidence if backfilled pillars fail the numerical model with 9m mining height and 83 roadway fill of 1MPa cohesive backfill is analysed with a 90 reduction in coal pillar strength properties
With 9m mining height and 83 roadway fill of cohesive backfill void space remaining is 15m and the numerical model predicts failure of pillars and overburden results in approximately 02m surface subsidence
Figure A-70 Surface subsidence predicted by numerical model when pillars forced to fail with 83 roadway fill Contour interval is 01m with maximum subsidence predicted as 022m
Figure A-71 Surface strain in east-west direction when pillars forced to fail resulting 022m surface subsidence Maximum strain is 5mmm and contour interval is 1mmm
Figure A-72 Surface strain in north-south direction when pillars forced to fail resulting 022m surface subsidence Maximum strain is 3mmm and contour interval is 1mmm
Figure A-73 Tilt in east-west direction Units are mmm and intervals are 1mmm maximum tilt is 7mmm
Figure A-74 Tilt in north-south direction Units are mmm and intervals are 1mmm maximum tilt is 5mmm
To highlight the need for adequate fill the model with 66 roadway fill is analysed with the pillars forced to fail with a 50 reduction in pillar strength Void space over the backfill in the roadways is 30m Modelling predicts maximum surface subsidence of 068m
Figure A-75 Surface subsidence when pillars forced to fail with 66 roadway fill Roadway void space is 30m with the model predicting 068m surface subsidence Contour interval is 01m
A66 Numerical model of adjacent high risk area
Numerical model and panel stability
A numerical model of the region adjacent to Duncan St incorporating 76 pillars is analysed at 9m mining height Overburden strata strengths and depth-of-cover is consistent with Duncan St model
The main objective of this model is to estimate the strength difference between the two mining panels west and east of the Waterline fault Given uniform mining height and depth-of-cover the strength difference will be due to the pillar configuration and boundary conditions
At 9m mining height the model is predicted to be essentially stable although 9 pillars are predicted to be fully yielded at mid-pillar height
With gravity increase of 10 the model remains stable At 20 increase in gravity the model is predicted to fail with significant overburden yield
It is concluded therefore that the panel to the east of Waterline fault is 20 stronger than the panel to the west
Figure A-76 Location of numerical model 2 together with surface subsidence contours from 1988 and 2008 events and seam level eastern boundary of failure predicted from 3D seismic
Figure A-77 Yield on section at mid-height for 9m mining height
Figure A-78 Rockmass yield on vertical section trending east-west at mid-point of model Note overburden is largly intact with no extensive collapse
Figure A-79 Pillars predicted to have failed from Numerical model 2 with surface subsidence contours and inferred eastern limit of failed zone at seam level
By a 20 increase in gravity the model is forced to fail resulting in predicted 13m surface subsidence that includes increased overburden compression from increased gravitational component Excessive deformation and numerical instability stopped the model true surface deformation may be higher
Figure A-80 Adjacent model with 9m mining height Predicted surface subsidence after 20 increase in gravity Model predicts 13m surface subsidence
Figure A-81 Adjacent model with 9m mining height and 20 gravity increase Predicted failure at mid-pillar height Note intact core in southern pillars which appear stronger from unmined adjacent coal and larger general pillar size
A7 CONCLUSIONS
A71 Current knowledge on coal pillars behaviour
bull The strength based factor-of-safety approach is well established in coal pillar design Factors of safety for coal pillars required to provide medium to long term stability should be greater than 16 [Galvin 2006 Hill 2005]
bull Coal pillar strength has been the subject of rigorous research since at least the 1960rsquos and the Salamon amp Munro formula has been applied in the design of over a million coal pillars in South Africa alone [Mark 1999 Salamon 1998] Strength formula derivations from the UNSW are established in Australia
bull Coal pillar load calculation traditionally relies on tributary area theory which is a conservative approach suitable for pillar design
bull Tributary area conditions are NOT satisfied at Collingwood Park pillars are irregular in size and shape there is large areas of unmined coal and the seam has significant dip
bull This last point is important as analytical methods hold the only hope of evaluating every pillar at Westfalen No 3 Colliery The numerical model of Duncan St analyses 46 pillars and requires significant computational resources the entire Colliery has in excess of 700 pillars and cannot be analysed by the same methods in its entirety by current computer codes in a reasonable time frame
bull Likewise it is not satisfactory to draw conclusions on panel stability from limited analysis of representative groupings of pillars because of the variability in size shape mining height and cover depth over the mining area
bull To overcome the limitations of tributary area theory for the back-analysis of an irregular pillar layout a novel approach for calculating loads based on pressure arch theory has been developed subjected to international peer review and published in the International Journal of Rock Mechanics and Mining Sciences In summary each pillar is individually examined and the pillar area circumference and centroid are calculated At the pillar centroid the cover depth and mining height are determined An influence zone based on a circular area with radius defined by the depth-dependent load transfer distance Within this area the local extraction ratio is calculated This approach has found to satisfactorily account for pillars of arbitrary shape in irregular layout with variable cover depth
bull This allows a FoS to be determined for the over 700 pillars of Westfalen No 3 with reasonable computer resources
A72 Typical pillar strength effects
Width to height ratio
bull Pillars at Westfalen No 3 have typical effective width from 20m to 50m While mining height is uncertain it is believed to range from 6m to 10m With these dimensions pillar wh ratio ranges from 20 to 83
bull At the lower limit of wh=20 geological influences will start to determine pillar strength [Galvin 2006] From wh in the range gt 20 to 40 the formula of Salamon and Munro or UNSW extensions could be expected to estimate pillar strength with the squat pillar version of these formula applicable for whgt40 [Galvin 2006 Salamon 1998 Galvin 1999]
bull The squat pillar extensions were developed since the standard formulas were found to underestimate pillar strength at whgt4 At Westfalen No 3 colliery although there are a number of pillars of whgt4 many of these are irregular in shape often long and relatively narrow (30m ndash 40m) Given this and the need to automate the assessment of every pillar the squat pillar strength formula is not utilised This approach is conservative
Pillar shape effects
bull Many pillars at Westfalen No 3 are skewed of diamond shape with acute internal angle from 50 to 90 degrees Hydraulic radius simile accounts for pillar shape by an effective width defined by 4AC while the UNSW has a parrellopid formula that for pillars of equal side length results in an effective width equivalent to this
bull In a study of pillar shapes common to Westfalen No 3 colliery the hydraulic radius analogy for estimation of effective width is found adequate with errors less than 6 for considered sizes and shapes
Post peak strength
bull Numerical studies and the work of Das in Indian coal fields highlights the changing post peak behaviour with increasing width to height ratiorsquos It has been determined that when wh exceeds approximately 5 pillars start to harden post peak When whlt3 pillars display limited if any post peak strength
bull The significance of this effect will be in the manner that pillars shed load to adjacent pillars In an array of pillars of similar dimensions pillars with a low wh ratio could be expected to shed load in a sudden more catastrophic manner than those that harden post peak Such sudden pillar failure is referred in the literature as catastrophic cascading or rolling pillar failure and has been responsible for damaging wind blasts and significant loss of life over the years
bull In an irregular pillar layout such as Westfalen No 3 with variable wh ratio significant barrier pillars and regions of unmined coal sudden multiple panel collapse would be expected to be less likely
bull The analytical approach developed for assessing pillar load accounts for load shed from a failed pillars to pillars within the zone of influence of that pillar
Specific details of this approach are discussed in the hazard map and risk assessment chapter of this report
Backfill effect
bull Numerical studies on a cohesive and non-cohesive backfill suggest that pillar strength is increased with increasing height of fill Studies suggest a 1MPa cohesive backfill may increase pillar strength by approximately 10 at 40 roadway fill for wh=33 and 18 at 40 roadway fill at wh=22 At 80 roadway fill pillar strength increases are predicted to exceed 50 Percentage strength increases are predicted to be greater with lower wh ratiorsquos
bull Studies of a non-cohesive backfill suggest at 80 roadway fill pillar strength increases are approximately 25
bull With both backfill types pillar strength is predicted to increases dramatically above 80 roadway fill and pillars are predicted to exhibit post-peak hardening behaviour
For example in the Duncan St area a pillar of effective width 20m will have a FoS of approximately 118 at mining height of 10m without backfill A 50 strength increase from 1MPa cohesive backfill at 80 roadway fill will raise the FoS to approximately 177 and reduce the probability of instability from approximately 1 in 10 to less than 1 in 1000
With 80 roadway fill of a non-cohesive backfill the same Duncan St pillar FoS will increase to approximately 147 and the probability of instability reduce to less than 1 in 100
bull Backfill is likely to reduce the rate of time dependent pillar strength degradation by reducing pillar spalling due to the erosive effects over time of high stress and exposure of the pillar surface to the atmosphere
bull In addition backfill is likely to benefit pillar stability by limiting the void available to the roof to fall into Roof falls particularly at roadway intersections may be present By reducing the roadway volume backfill will eventually support the roof when the bulking effect of roof falls fills the remaining roadway voids space Beyond this summary time dependent issues of backfill have not been considered
roadway
fill
Non-cohesive backfill
(7m mining height width 20m) strength increase
05 MPa cohesive backfill
(7m mining height width 20m)
strength increase
10 MPa cohesive backfill
(7m mining height width 20m)
strength increase
60 135 388 437
70 183 432 597
80
90
208
291
474
572
698
957
A73 Duncan St numerical model
bull In the Duncan St subsidence region approximately 46 pillars are surrounded by unmined coal to the west a large pillar containing the Waterline fault to the east and larger pillars to the south and north
bull At 6m mining height pillar minimum FoS for these 46 pillars is calculated at 131 with Pressure Arch theory and UNSW strength formula At 9m mining height minimum FoS is calculated as 099
bull Pillar probability of failure for FoS calculated by the UNSW eq(2) is given in [Galvin 2006] as
Table A-14 Factor of safety failure probabilities for UNSW pillar strength formula (after Galvin 2006)
Safety Factor Probability of pillar failure
087 8 10
100 5 10
122 1 10
13 5 100
138 2 100
144 1 100
163 1 1000
179 1 10000
195 1 100000
211 1 1000000
bull From Table A-14 at 6m mining height there is a 1 in 20 probability of instability and at 9m a 1 in 2 probability The variability in the database of failed and unfailed pillars from which eq (1) to eq (3) are derived is responsible for these probabilities Our numerical model should always predict failure if the FoS is less than 10 and always predict stability with FoS gt 10 since no such variability in geotechnical properties or conditions is used
bull While our numerical model predicts no pillar failure at 6m and pillar failure at 9m in reality there remains approximately a 1 in 20 chance of failure at 6m mining height If one pillar was to fail load transferred to adjacent pillars would reduce these adjacent pillars FoS and may well lead to the pillar failure and resultant subsidence observed at Duncan St
bull Based on the numerical results obtained using two mining heights the pillar and overburden failure is in line with analytical predictions from Pressure Arch theory and UNSW pillar strength calculation
bull Surface subsidence predicted from the 9m mining height numerical model is 196m While this value is in general agreement with monitoring data the model is not sufficiently calibrated since the real mining height in the region is unknown to be able to confidently predict final subsidence strains and tilts
bull With 1MPa cohesive backfill at a fill ratio of 83 the predicted strength increase is 70 With non-cohesive backfill at the same fill ratio the strength increase is 20 these values are in agreement with single pillar studies
bull Abutment stresses in the immediate roof sandstone unit (above the coal roof) are predicted to extend approximately 80m beyond the limits of the model This is in reasonable agreement with twice the load transfer distance of 64m (at 124m depth-of-cover) used to define a pillars zone of influence (the ZI also includes half pillar width ie 74m for 20m pillar)
A74 Numerical model of adjacent region
bull A numerical model of the region immediately to the east of the Duncan St failure region is constructed with 76 pillars
bull At 9m mining height the model predicts failure of 9 pillars but no significant overburden failure The model remains stable in general
bull With a 20 increase in gravity the model is predicted to fail
bull Numerical modelling results suggest the region to the east of the Waterline barrier pillar is stronger by approximately 20 than the subsided region to the west of the barrier pillar
bull Predicted surface subsidence (including compressive effects from gravity increase) is 13m all though numerical instabilities halt the model and true surface subsidence is likely to be higher
bull Inspection of yield at mid-pillar height suggests the southern pillars in the model have intact core when pillars in the middle of the region are failed in their entire volume In reality the southern region of this panel have greater depth-of-cover therefore higher pillar stresses and thus lower FoS in these southern pillars

2
4
6
cohesive backfill with interface
cohesive backfill without interface
non-cohesive backfill with interface
non-cohesive backfill without interface
1212
1010
88
cohesive backfill with interface
cohesive backfill without interface
non-cohesive backfill with interface
non-cohesive backfill without interface
stre
ss (M
Pa)
stre
ss (M
Pa)
6 6
44
2 2
0 0 0000 0005 0010 0015 0020 0025 0030 0035 0040 0045 0000 0005 0010 0015 0020 0025 0030 0035 0040 0045
strain strain
Figure A-36 Post peak pillar for 6m high pillar (wh=33) with friction angle 15deg on left 20deg on right of interface between backfill and pillar
12
cohesive backfill with interface
cohesive backfill without interface
non-cohesive backfill with interface non-cohesive backfill without interface
12
10 10
8 8
cohesive backfill with interface
cohesive backfill without interface
non-cohesive backfill with interface
non-cohesive backfill without interface
stre
ss (M
Pa)
stre
ss (M
Pa)
6 6
4 4
2 2
0 0 0000 0005 0010 0015 0020 0025 0030 0035 0040 0045 0000 0005 0010 0015 0020 0025 0030 0035 0040 0045
strain strain
Figure A-37 Post peak pillar for 6m high pillar (wh=33) with friction angle 25deg on left 30deg on right of interface between backfill and pillar
12
cohesive backfill with interface
cohesive backfill without interface
non-cohesive backfill with interface non-cohesive backfill without interface
12
10 10
8 8
cohesive backfill with interface
cohesive backfill without interface
non-cohesive backfill with interface
non-cohesive backfill without interface
stre
ss (M
Pa)
stre
ss (M
Pa)
6
4
2
0 0000 0005 0010 0015 0020 0025 0030 0035 0040 0045
0 0000 0005 0010 0015 0020 0025 0030 0035 0040 0045
strain strain
Figure A-38 Post peak pillar for 6m high pillar (wh=33) with friction angle 35deg on left 40deg on right of interface between backfill and pillar
22
6
8
24
A54 Post peak pillar strength
A full stress strain curve to approximately 35 strain is presented in the following figures for 1MPa cohesive and non-cohesive backfill Results for 05MPa cohesive backfill sit approximately mid-way between these two cases and are included in the summary Table A-9
24 24
0000 0010 0020 0030 0040 0050
Average axial strain of coal pillar
000
2000
3000
4000
5000
6000
7000
8000
9000
22
0000 0010 0020 0030 0040 0050
Average axial strail of coal pillar
000
2000
3000
4000
5000
6000
7000
8000
9000
20 20
18
Ave
rage
str
ess
of c
oal p
illar
(MPa
)
Ave
rage
str
ess
of c
oal p
illar
(MPa
)
18
16 16
1414
12 12
1010
88
66
44
22
00
Figure A-39 Post peak pillar strength with increasing backfill 5m high pillar (wh=40) with 1MPa cohesive backfill on left non-cohesive backfill on right
24
22
0000 0010 0020 0030 0040 0050
Average axial strain of coal pillar
00
250
333
417 500
583
667 833
917
22
0000 0010 0020 0030 0040 0050
Average axial strain of coal pillar
00
250 333
417
500 583
667
833
917
20 20
Ave
rage
str
ess
of c
oal p
illar
(MPa
)
18 18
16 16
14 14
12 12
10 10
8
6
4 4
2 2
0 0
Figure A-40 Post peak pillar strength with increasing backfill 6m high pillar (wh=33) with cohesive backfill on left non-cohesive backfill on right
Aver
age
stre
ss o
f coa
l pill
ar (M
Pa)
4
6
8
10
12
14
16
18
2
4
6
8
0000 0005 0010 0015 0020 0025 0030 0035 0040 0045
Average axial strain of coal pillar
000
2140
2860
4290
5000
5710
7140
7860
9290
2020
0000 0005 0010 0015 0020 0025 0030 0035 0040 0045
Average axial strain of coal pillar
000
2140
2860
4290
5000
5710
7140
7860
9290
18
Ave
rage
str
ess
of c
oal p
illar
(MPa
) A
vera
ge s
tres
s of
coa
l pill
ar (M
Pa)
Aver
age
stre
ss o
f coa
l pill
ar (M
Pa) 16
14
12
10
8
6
4
22
00
Figure A-41 Post peak pillar strength with increasing backfill 7m high pillar (wh=29) with cohesive backfill on left non-cohesive backfill on right
14 14
0
000
2500
3130
3750
5000 6250
6880
8130
8750
0
000
2500
3130
3750
5000
6250
6880
8130
8750
12 12
10
Ave
rage
str
ess
of c
oal p
illar
(MPa
)
10
8
6
4
2
0000 0010 0020 0030 0040 0050 0000 0010 0020 0030 0040 0050
Average axial strain of coal pillar Average axial strain of coal pillar
Figure A-42 Post peak pillar strength with increasing backfill 8m high pillar (wh=25) with cohesive backfill on left non-cohesive backfill on right
2
4
6
8
10
12
14
2
4
6
8
14
12
Ave
rage
str
ess
of c
oal p
illar
(MPa
) A
vera
ge s
tres
s of
coa
l pill
ar (M
Pa)
0
000 2220 2780 3890 5000 6110 7220 8330 8890
0
000 2220 2780 3890 5000 6110 7220 8330 8890
Ave
rage
str
ess
of c
oal p
illar
(MPa
)
10
8
6
4
2
0000 0005 0010 0015 0020 0025 0030 0035 0040 0000 0005 0010 0015 0020 0025 0030 0035 0040
Average axial strain of coal pillar Average axial strain of coal pillar
Figure A-43 Post peak pillar strength with increasing backfill 9m high pillar (wh=22) with cohesive backfill on left non-cohesive backfill on right
12 12
0
000 2500
3000 4000
5000 6000
7000 8000
9000
0
000
2500
3000
4000
5000
6000
7000
8000
9000
10
Ave
rage
str
ess
of c
oal p
illar
(MPa
) 10
8
6
4
2
0000 0005 0010 0015 0020 0025 0030 0035 0000 0005 0010 0015 0020 0025 0030 0035
Average axial strain of coal pillar Average axial strain of coal pillar
Figure A-44 Post peak pillar strength with increasing backfill 10m high pillar (wh=20) with cohesive backfill on left non-cohesive backfill on right
The amount of backfill to achieve the transition between strain softening and hardening is presented in Table A-9 for all mining height The values in this table are estimated from the stress-strain curve analysed to 35 of strain and are depended on the backfill increment which is in turn dependent on the ratio of mining height to the calibrated element size 05m
Table A-9 Percentage of roadway backfill that leads to a transition from strain softening to hardening
Pillar height Non-cohesive 05MPa Cohesive 10MPa Cohesive backfill backfill backfill
5m 300 200 200
6m 500 417 333
7m 571 500 429
8m 625 625 500
9m 722 722 611
10m 800 800 700
The modelling results suggest that the average axial stress of coal pillar increases with compression until peak stress is reached In the post-failure region pillar stress is reduced as strain increases for all models without backfill All the model results predict that there would be a change to strain hardening behaviour as percentage of backfill increases For example this transition point is 333 for 10 MPa cohesive backfill while 50 for non-cohesive backfill with 6m mining height as shown in Table A-9 It can also be seen from Table A-9 that tall pillars need more backfill than squat pillars to achieve the change from strain softening to hardening for either cohesive backfill or non-cohesive backfill
A55 Backfill for diamond shaped pillars
A 7m high diamond shaped pillar with 50 degree skew angle is analysed with increasing level of backfill in surrounding roadways On the skewed angle the backfill is constrained with roller boundary conditions normal to the skewed angle to represent symmetry conditions and a 5m wide roadway
Figure A-45 Numerical model of diamond shaped pillar with backfill on left and boundary conditions on right
The predicted strength of a diamond shaped pillar and equivalent square pillar with increasing roadway backfill of both cohesive and non-cohesive models is presented in Figure A-46 and Figure A-47
6
7
8
9
10
11
12
13
0 10
Pilla
r str
engt
h (M
Pa)
20 30 40 50 60 70 80 90 100
Percentage of backfill ()
Skew pillar
Square pillar
0
10
20
30
40
50
60
70
0 10
Incr
ease
of p
illar
str
engt
h (
)
20 30 40 50 60 70 80 90 100
Percentage of backfill ()
Skew pillar
Square pillar
Figure A-46 Predicted pillar strength of diamond and square shaped pillars with increasing percentage of 1MPa cohesive backfill On left is absolute strength and on right is percentage strength increase
6
7
8
9
10
11
0 10
Pilla
r stre
ngth
(MP
a)
20 30 40 50 60 70 80 90 100
Percentage of backfill ()
Skew pillar
Square pillar
0
5
10
15
20
25
30
35
0 10
Incr
ease
of p
illar
str
engt
h (
)
20 30 40 50 60 70 80 90 100
Percentage of backfill ()
Skew pillar
Square pillar
Figure A-47 Predicted pillar strength of diamond and square shaped pillars with increasing percentage of non-cohesive backfill On left is absolute strength and on right is percentage strength increase
A56 Backfill placed after significant pillar yield
A pillar model with 90 non-cohesive backfill placed after yielding of a 7m high pillar is presented in Figure A-48 The percentage of strength increase is given in Table A-10 It is found that the pillar strength increase is lower if the pillar has undergone significant deformation before the placement of backfill It is predicted that 90 backfill results in a strain-hardening pillar behaviour even if the pillar has previously yielded significantly
Ave
rage
stre
ss o
f coa
l pill
ar (M
Pa)
18 without backfill 025 strain 050 strain
14
16
075 strain 100 strain
12 125 strain 150 strain
10 175 strain 200 strain
8
6
4
2
0 0000 0005 0010 0015 0020 0025 0030 0035 0040 0045 0050
Average strain of coal pillar
Figure A-48 Stress strain curves for backfill placed around the pre-strained pillar displaying state of pillar core upon placement of backfill
Table A-10 Pillar strength increase with 90 non-cohesive backfill placed around a pre-strained 7m high square pillar of 20m width
Percentage backfill ()
Strain at placement of non-cohesive backfill ()
Pillar strength (MPa)
Percentage increase in peak
strength ()
Percentage increase in post-peak
strength at 3 strain ()
0 000 7953 000
90 000 10290 2939
90 025 9156 1513
90 050 8965 1272
90 075 8526 720
90 100 7945 26006
90 125 7951 22608
90 150 7951 18917
90 175 7951 15629
90 200 7951 11134
A6 3D MODEL OF DUNCAN ST FAILURE PANEL
A61 Numerical model
A three dimensional model of 46 pillars in the Duncan St subsidence region has been analysed with over burden geology based on hole CP1 and a constant overburden depth of 124m Figure A-49 Figure A-50 and Figure A-51 Uniform mining heights of 6m and 9m have been analysed
Selection of the pillars to be analysed is based on visual inspection of the panel layout and includes pillars bounded by unmined coal to the west the waterline barrier pillar to the east larger pillars to the south and a panel of slightly larger pillars of different orientation to the north
One row of pillars in the middle of this panel trending from north-west to south-east are of smaller dimension than the average and of diamond shape with acute internal angle of approximately 50degrees Being in the approximate middle of the panel close to full tributary area load will be mobilised on this row of pillars and therefore it is believed pillars in this row initiated the 2008 subsidence event
The Duncan Street numerical model has the following objectives
bull Estimation of pillar stresses and FoS for comparison with empirical formula
bull Comparison of backfill response at panel scale with previous single pillar studies
bull Estimation of surface subsidence at given percentage roadway fill
bull Estimation of extent of abutment stresses due to panel failure
A62 Observations from Duncan Street numerical model
bull At 6m mining height the minimum pillar FoS for these 46 pillars is calculated to be 131 using Pressure Arch theory and UNSW strength formula panel failure is not predicted with this mining height by the model At 9m mining height the minimum FoS is calculated as 099 and panel failure is predicted to occur
bull The probability of pillar failure for associated FoS calculated by the UNSW pillar strength formula Eq(2) is given in Galvin 2006 in Table A-11 The relationship was developed for square pillars using the Australian pillar database and tributary area theory and hence theoretically speaking may not directly apply to this study However it can be taken as a general guide
bull From Table A-11 it is seen that there is a 1 in 20 probability of instability at 6m mining height and a 1 in 2 probability at 9m mining height Numerical modelling is however a deterministic approach and it always predicts failure if the FoS is less than 10 and stability if FoS gt 10 since no variation in geotechnical properties or conditions is used
bull Although our numerical models predict no pillar failure at 6m and panel failure at 9m in reality there remains approximately a 1 in 20 chance of failure at 6m mining height If one pillar was to fail load transferred to adjacent pillars would reduce the FoS of these adjacent pillars and could lead to the pillar failure and subsidence as observed at 2008 event region
Table A-11 Factor of safety failure probabilities for UNSW pillar strength formula
(after Galvin 2006)
Safety Factor Probability of pillar failure
087 8 10
100 5 10
122 1 10
130 5 100
138 2 100
144 1 100
163 1 1000
179 1 10000
195 1 100000
211 1 1000000
bull Based on the numerical results obtained using two mining heights the pillar and overburden failure is consistent with analytical predictions from Pressure Arch theory and UNSW pillar strength calculation
bull Surface subsidence predicted from the numerical model with a mining height of 9m is 196m While this value is in approximate agreement with monitoring data (14mshy15m) the model was not sufficiently calibrated since the real mining height in the region is uncertain to be able to confidently predict final subsidence strains and tilts at the site
bull With 1MPa cohesive backfill at a roadway fill ratio of 83 the predicted strength increase is 70 With non-cohesive backfill at the same fill ratio the strength increase is 20 These values are in agreement with the results for single pillars
bull The numerically predicted surface subsidence with 83 roadway fill is 022m Maximum predicted tilt in east-west direction is 7mmm and in north-south direction is 5mmm Analytical formula [Holla amp Barclay 2000] predict maximum tilt of 53mmm for this amount of subsidence
bull Isolated cohesive backfill surrounding pillars of low wh ratio is predicted to be effective in confining the pillar and increasing peak pillar strength and panel stability Isolated non-cohesive backfill without barriers could not be analysed in this numerical model as backfill lsquoflowsrsquo and numerical stability could not be achieved
bull Stress transfer in the immediate roof sandstone unit (above the coal roof) is predicted to extend approximately 80m beyond the limits of the collapsed panel This is in reasonable agreement with theoretical studies
Figure A-49 Duncan St modelled panel with outline of adjacent modelled panel location of representative open hole CP1 file named ldquoAppendix B2 open hole logsrdquo located in directory ldquoCollingwood Park Subsidence 2B Collingwood Park Mine Subsidence Reports 1988 Eventsrdquo and mine subsidence limit contour
A63 Model properties
Overburden geology is based on borehole CP1 the most complete interpreted available hole drilled in 1988 by Queensland Department of Mines Figure A-50 To include this in the numerical model lithological units had to be coalesced into major units of sandstone (SS) siltstone (SL) mudstone (MS) weathered units and coal Figure A-51
Rock properties for the overburden were determined from a 2D parametric study whereby the UCS of all units was scaled to achieve pillar and overburden failure at 8m mining height Table A-12 and Table A-13
Unit top depth thickness unit thickness
thickness scaled
thickness in model
000 1200 1200 1046 1000 1200 700 SS 700 610 600 1900 600 MS 600 523 500 2500 1100 SS 1300 1133 1100 3600 200 SS 000 3800 100 SL 1000 871 900 3900 100 MS 000 4000 500 000 4500 100 000 4600 100 000 4700 100 000 4800 100 SS 400 349 400 4900 300 SS 000 5200 300 SL 700 610 600 5500 100 MS 000 5600 300 MS 000 5900 400 SS 500 436 400 6300 100 SS 000 6400 400 SL SS 900 784 800 6800 100 SL MS 000 6900 100 SL 000 7000 200 SL MS 000 7200 100 SS SL 000 7300 200 SS 1000 871 900 7500 200 SL 000 7700 200 SS SL 000 7900 200 SS 000 8100 100 SL 000 8200 100 SS 000 8300 200 SL 4350 3790 3800 8500 200 SL 000 8700 100 SS 000 8800 100 COAL 000 8900 200 000 9100 100 000 9200 100 000 9300 100 SL MS 000 9400 300 SL MS SS 000 9700 100 000 9800 100 SL MS 000 9900 400 SL SS 000 10300 200 SS MS 000 10500 100 SL MS 000 10600 200 SL MS SS 000 10800 100 000 10900 400 SL MS 000 11300 400 SL SS 000 11700 100 SS MS 000 11800 300 000 12100 400 SL SS 000
SL MS MS SS
MS
MS
SL
MS SS SL SS SL MS MS
weathering
SL MS SS
12500 150 000 12650 450 850 741 750 13100 400 SS 000 13500 100 MS SL
SS SL 960 837 500
13600 200 13800 100 SS 13900 200 14100 360
SS SL SL MS
14460 470 COAL MINING SEAM 600 14930 FLOOR
Figure A-50 Inferred geology from representative borelog CP1 used in numerical model
weathering SS
Unit Depth floor below surface Num elements Unit Unit name in model surface 0
10 3 16 weather 16 2 15 ss6
MS 21 2 14 ms2 SS 32 4 13 ss5 SL 41 3 12 sl3 SS 45 1 11 ss4 MS 51 2 10 ms1 SS 55 1 9 ss3 SL 63 3 8 sl2 SS 72 3 7 ss2 SL 1055 11 6 sl1 SS 113 4 5 ss1 SEAMR 118 3 4 seamr SEAM 124 3 3 seam FLOOR1 134 3 2 floor2 FLOOR2 250 10 1 floor1
Figure A-51 Coalesced units for numerical model based on hole CP1
Insitu stress is unknown at the site so a horizontal to vertical stress gradient of 15 has been assumed Given that the extensive workings were undertaken 20 to 30 years before the 2008 event horizontal stresses in the mining seam would be considerably disturbed from the pre-mining conditions
Table A-12 Rock properties for softening mohr coloumb material Softening rates of coal friction angle is 6 degrees over 2 plastic strain and total loss of cohesion over 24 plastic strain in coal and over 1 in other rocks Determined from pillar studies
E
nu Bulk Shear UCS UCS Phi Dilation Coh Tensile Strength (GPa) (GPa) (GPa) (MPa) scaled angle (MPa) (MPa)
SS 75 02 4167 3125 50 125 40 2 291 125
SL 4 025 2667 1600 30 75 35 2 195 075
MS 3 025 2000 1200 15 375 32 2 104 0375
Weathering 1 025 0667 0400 8 2 32 2 055 02
COAL 11 03 0917 0423 12 3 36 6 076 003
FLOOR1 4 025 2667 1600 30 75 38 2 183 075
FLOOR2 4 025 2667 1600 30 75 38 2 183 075
Table A-13 Ubiquitous joint properties Softening rate of ubiquitous joints total loss of cohesion over 1 plastic strain Determined from 2D overburden studies
Cohesion Ubiq joint cohesion Tensile Strength Ubiq joint tensile strength Ubiq joint (MPa) (MPa) (MPa) (MPa) friction
SS 291 00029144 125 0000125 15 SL 195 00019521 075 0000075 15 MS 104 00010393 0375 00000375 15 Weathering 055 00005543 02 000002 15 COAL 076 003 FLOOR1 183 - 075 - -FLOOR2 183 075 -
A64 Results from 3D Duncan St model
Factor of Safety estimated at 6m and 9m mining heights
Figure A-52 Pillar FoS calculated for 6m mining height by analytical method with strength by eq(3) and pillar stress by pressure arch theory Minimum value is 131 suggesting a 5 in 100 probability of failure however not sufficient to fail in the numerical model (that requires FoS lt 10)
Figure A-53 Pillar FoS calculated analytically for 9m mining height (eq(3) and PA theory) Minimum value is 099 suggesting a probability of failure of 5 in 10 although in the numerical model failure should occur
Yield on plane for 6m and 9m mining heights
Figure A-54 Location of section plane used for section view in following figures
Figure A-55 Yield on section plane for 6m mining height No significant damage or displacement observed
Figure A-56 Yield on section plane for 9m mining height no backfill
Figure A-57 Displacement on section plane for 9m mining height no backfill Maximum displacement is approximately 15m at surface
Results on horizontal plane at mid-pillar height
Figure A-58 Yield at mid-pillar height 9m mining height Blue elements evident in some pillars indicating pillar core remains intact
Figure A-59 Predicted vertical stress at mid pillar height 9m mining height Insitu stress is 30MPa Unyielded pillars and pillars hardening after yield are transferring vertical load while yielded pillars carry little load Extent of abutment stress increase is approximately 80m
Figure A-60 Roof vertical stress predicted by numerical model with 9m mining height Contour increments are 01MPa Base vertical stress is approximately 27MPa Abutment stress influence distance is approximately 80m
Results on surface after panel failure at 9m mining height
Figure A-61 Surface subsidence as predicted with numerical model with 9m mining height and total subsidence along Duncan St to McLaughlin St as monitored to October 09 Maximum surface subsidence predicted as 196m Outline of numerical modelling pillars and dotted contour of observed subsidence limit
A65 Duncan St model ndash backfill effectiveness
The Duncan St 3D model has been analysed with full and targeted 1MPa cohesive and non-cohesive backfill placed in roadways Roadway fill of 66 is analysed for the 1MPa cohesive mixture and 83 roadway fill for the non-cohesive mix
Results are presented in the following figures and figure captions
Factor of Safety increase from cohesive backfill
Analysis of the Duncan St model with 9m mining height is undertaken to estimate the FoS increase from backfill By increasing gravity in increments the backfill strength improvement is quantified With 83 roadway fill of 1MPa cohesive backfill the overburden and pillar tops (ie region of pillar above height of backfill) fails with gravity of 17ms2 suggesting the pillars with FoS of approximately 10 has increased FoS to 17 by backfilling adjacent roadways
Figure A-62 Gravity of 16g with 83 1MPa cohesive backfill showing no significant yield
Figure A-63 Gravity of 17g with 83 1MPa cohesive backfill predicting failure of pillar tops and overburden and collapse of roadway void space
FoS increase with non-cohesive backfill
With non-cohesive backfill pillars yielded due to lack of confinement upon initial placement of backfill in roadways but overburden remain stable and void space above backfill remained open Overburden remained stable at gravity increase to 11ms2 Figure A-64 but collapsed at gravity increase of 12ms2 Figure A-65
Figure A-64 Gravity of 11g with 83 non-cohesive backfill predicting pillar yield but overburden stability
Figure A-65 Gravity of 12g with 83 non-cohesive backfill predicting failure of pillars and overburden and collapse of roadway void space Maximum surface subsidence is 055m which includes the compressive effect of the 12g gravity increase
Placement of targeted backfill
A model is analysed with cohesive backfill totally surrounding two pillars with low predicted FoS The two pillars are predicted to have a FoS of 099 and 100 left to right viewed from above at a 9m mining height Backfill extends to an extent of 5m to 10m from the pillar and is 6m high in the roadways Gravity increase to 12g required to fail panel suggesting panel strength increase is approximately 20 from targeted backfill Predicted surface subsidence 125m (excessive mesh deformation stops analysis equilibrated stage may have higher surface subsidence)
Figure A-66 Duncan St model with 66 roadway fill of 1MPa cohesive backfill surrounding two pillars with low FoS at 9m mining height
Figure A-67 Predicted yield at mid pillar height of 9m pillars with 66 roadway fill of 1MPa cohesive backfill Note intact core (blue) for targeted pillars
Figure A-68 Pillar strength at 9m mining height Strength WITHOUT BACKFILL of northern focus pillar selected for targeted backfill is 527MPa and southern focus pillar is 526MPa
Figure A-69 Vertical stress in pillars targeted for partial backfill placement Stress calculated at equilibrium of elasto-plastic analysis WITHOUT BACKFILL Stress in northern focus pillar is 54MPa and in southern focus pillar is 513 FoS of NFP=52754 = 0975 FoS of SFP=526513 = 1025
Non-cohesive backfill in targeted placement study
A model with targeted placement of non-cohesive backfill was attempted but could not be satisfactorily converged since backfill lsquoflowsrsquo and inter-penetrates elements resulting in numerical instabilities
Forcing pillars to fail to examine resultant subsidence
To examine the extent of surface subsidence if backfilled pillars fail the numerical model with 9m mining height and 83 roadway fill of 1MPa cohesive backfill is analysed with a 90 reduction in coal pillar strength properties
With 9m mining height and 83 roadway fill of cohesive backfill void space remaining is 15m and the numerical model predicts failure of pillars and overburden results in approximately 02m surface subsidence
Figure A-70 Surface subsidence predicted by numerical model when pillars forced to fail with 83 roadway fill Contour interval is 01m with maximum subsidence predicted as 022m
Figure A-71 Surface strain in east-west direction when pillars forced to fail resulting 022m surface subsidence Maximum strain is 5mmm and contour interval is 1mmm
Figure A-72 Surface strain in north-south direction when pillars forced to fail resulting 022m surface subsidence Maximum strain is 3mmm and contour interval is 1mmm
Figure A-73 Tilt in east-west direction Units are mmm and intervals are 1mmm maximum tilt is 7mmm
Figure A-74 Tilt in north-south direction Units are mmm and intervals are 1mmm maximum tilt is 5mmm
To highlight the need for adequate fill the model with 66 roadway fill is analysed with the pillars forced to fail with a 50 reduction in pillar strength Void space over the backfill in the roadways is 30m Modelling predicts maximum surface subsidence of 068m
Figure A-75 Surface subsidence when pillars forced to fail with 66 roadway fill Roadway void space is 30m with the model predicting 068m surface subsidence Contour interval is 01m
A66 Numerical model of adjacent high risk area
Numerical model and panel stability
A numerical model of the region adjacent to Duncan St incorporating 76 pillars is analysed at 9m mining height Overburden strata strengths and depth-of-cover is consistent with Duncan St model
The main objective of this model is to estimate the strength difference between the two mining panels west and east of the Waterline fault Given uniform mining height and depth-of-cover the strength difference will be due to the pillar configuration and boundary conditions
At 9m mining height the model is predicted to be essentially stable although 9 pillars are predicted to be fully yielded at mid-pillar height
With gravity increase of 10 the model remains stable At 20 increase in gravity the model is predicted to fail with significant overburden yield
It is concluded therefore that the panel to the east of Waterline fault is 20 stronger than the panel to the west
Figure A-76 Location of numerical model 2 together with surface subsidence contours from 1988 and 2008 events and seam level eastern boundary of failure predicted from 3D seismic
Figure A-77 Yield on section at mid-height for 9m mining height
Figure A-78 Rockmass yield on vertical section trending east-west at mid-point of model Note overburden is largly intact with no extensive collapse
Figure A-79 Pillars predicted to have failed from Numerical model 2 with surface subsidence contours and inferred eastern limit of failed zone at seam level
By a 20 increase in gravity the model is forced to fail resulting in predicted 13m surface subsidence that includes increased overburden compression from increased gravitational component Excessive deformation and numerical instability stopped the model true surface deformation may be higher
Figure A-80 Adjacent model with 9m mining height Predicted surface subsidence after 20 increase in gravity Model predicts 13m surface subsidence
Figure A-81 Adjacent model with 9m mining height and 20 gravity increase Predicted failure at mid-pillar height Note intact core in southern pillars which appear stronger from unmined adjacent coal and larger general pillar size
A7 CONCLUSIONS
A71 Current knowledge on coal pillars behaviour
bull The strength based factor-of-safety approach is well established in coal pillar design Factors of safety for coal pillars required to provide medium to long term stability should be greater than 16 [Galvin 2006 Hill 2005]
bull Coal pillar strength has been the subject of rigorous research since at least the 1960rsquos and the Salamon amp Munro formula has been applied in the design of over a million coal pillars in South Africa alone [Mark 1999 Salamon 1998] Strength formula derivations from the UNSW are established in Australia
bull Coal pillar load calculation traditionally relies on tributary area theory which is a conservative approach suitable for pillar design
bull Tributary area conditions are NOT satisfied at Collingwood Park pillars are irregular in size and shape there is large areas of unmined coal and the seam has significant dip
bull This last point is important as analytical methods hold the only hope of evaluating every pillar at Westfalen No 3 Colliery The numerical model of Duncan St analyses 46 pillars and requires significant computational resources the entire Colliery has in excess of 700 pillars and cannot be analysed by the same methods in its entirety by current computer codes in a reasonable time frame
bull Likewise it is not satisfactory to draw conclusions on panel stability from limited analysis of representative groupings of pillars because of the variability in size shape mining height and cover depth over the mining area
bull To overcome the limitations of tributary area theory for the back-analysis of an irregular pillar layout a novel approach for calculating loads based on pressure arch theory has been developed subjected to international peer review and published in the International Journal of Rock Mechanics and Mining Sciences In summary each pillar is individually examined and the pillar area circumference and centroid are calculated At the pillar centroid the cover depth and mining height are determined An influence zone based on a circular area with radius defined by the depth-dependent load transfer distance Within this area the local extraction ratio is calculated This approach has found to satisfactorily account for pillars of arbitrary shape in irregular layout with variable cover depth
bull This allows a FoS to be determined for the over 700 pillars of Westfalen No 3 with reasonable computer resources
A72 Typical pillar strength effects
Width to height ratio
bull Pillars at Westfalen No 3 have typical effective width from 20m to 50m While mining height is uncertain it is believed to range from 6m to 10m With these dimensions pillar wh ratio ranges from 20 to 83
bull At the lower limit of wh=20 geological influences will start to determine pillar strength [Galvin 2006] From wh in the range gt 20 to 40 the formula of Salamon and Munro or UNSW extensions could be expected to estimate pillar strength with the squat pillar version of these formula applicable for whgt40 [Galvin 2006 Salamon 1998 Galvin 1999]
bull The squat pillar extensions were developed since the standard formulas were found to underestimate pillar strength at whgt4 At Westfalen No 3 colliery although there are a number of pillars of whgt4 many of these are irregular in shape often long and relatively narrow (30m ndash 40m) Given this and the need to automate the assessment of every pillar the squat pillar strength formula is not utilised This approach is conservative
Pillar shape effects
bull Many pillars at Westfalen No 3 are skewed of diamond shape with acute internal angle from 50 to 90 degrees Hydraulic radius simile accounts for pillar shape by an effective width defined by 4AC while the UNSW has a parrellopid formula that for pillars of equal side length results in an effective width equivalent to this
bull In a study of pillar shapes common to Westfalen No 3 colliery the hydraulic radius analogy for estimation of effective width is found adequate with errors less than 6 for considered sizes and shapes
Post peak strength
bull Numerical studies and the work of Das in Indian coal fields highlights the changing post peak behaviour with increasing width to height ratiorsquos It has been determined that when wh exceeds approximately 5 pillars start to harden post peak When whlt3 pillars display limited if any post peak strength
bull The significance of this effect will be in the manner that pillars shed load to adjacent pillars In an array of pillars of similar dimensions pillars with a low wh ratio could be expected to shed load in a sudden more catastrophic manner than those that harden post peak Such sudden pillar failure is referred in the literature as catastrophic cascading or rolling pillar failure and has been responsible for damaging wind blasts and significant loss of life over the years
bull In an irregular pillar layout such as Westfalen No 3 with variable wh ratio significant barrier pillars and regions of unmined coal sudden multiple panel collapse would be expected to be less likely
bull The analytical approach developed for assessing pillar load accounts for load shed from a failed pillars to pillars within the zone of influence of that pillar
Specific details of this approach are discussed in the hazard map and risk assessment chapter of this report
Backfill effect
bull Numerical studies on a cohesive and non-cohesive backfill suggest that pillar strength is increased with increasing height of fill Studies suggest a 1MPa cohesive backfill may increase pillar strength by approximately 10 at 40 roadway fill for wh=33 and 18 at 40 roadway fill at wh=22 At 80 roadway fill pillar strength increases are predicted to exceed 50 Percentage strength increases are predicted to be greater with lower wh ratiorsquos
bull Studies of a non-cohesive backfill suggest at 80 roadway fill pillar strength increases are approximately 25
bull With both backfill types pillar strength is predicted to increases dramatically above 80 roadway fill and pillars are predicted to exhibit post-peak hardening behaviour
For example in the Duncan St area a pillar of effective width 20m will have a FoS of approximately 118 at mining height of 10m without backfill A 50 strength increase from 1MPa cohesive backfill at 80 roadway fill will raise the FoS to approximately 177 and reduce the probability of instability from approximately 1 in 10 to less than 1 in 1000
With 80 roadway fill of a non-cohesive backfill the same Duncan St pillar FoS will increase to approximately 147 and the probability of instability reduce to less than 1 in 100
bull Backfill is likely to reduce the rate of time dependent pillar strength degradation by reducing pillar spalling due to the erosive effects over time of high stress and exposure of the pillar surface to the atmosphere
bull In addition backfill is likely to benefit pillar stability by limiting the void available to the roof to fall into Roof falls particularly at roadway intersections may be present By reducing the roadway volume backfill will eventually support the roof when the bulking effect of roof falls fills the remaining roadway voids space Beyond this summary time dependent issues of backfill have not been considered
roadway
fill
Non-cohesive backfill
(7m mining height width 20m) strength increase
05 MPa cohesive backfill
(7m mining height width 20m)
strength increase
10 MPa cohesive backfill
(7m mining height width 20m)
strength increase
60 135 388 437
70 183 432 597
80
90
208
291
474
572
698
957
A73 Duncan St numerical model
bull In the Duncan St subsidence region approximately 46 pillars are surrounded by unmined coal to the west a large pillar containing the Waterline fault to the east and larger pillars to the south and north
bull At 6m mining height pillar minimum FoS for these 46 pillars is calculated at 131 with Pressure Arch theory and UNSW strength formula At 9m mining height minimum FoS is calculated as 099
bull Pillar probability of failure for FoS calculated by the UNSW eq(2) is given in [Galvin 2006] as
Table A-14 Factor of safety failure probabilities for UNSW pillar strength formula (after Galvin 2006)
Safety Factor Probability of pillar failure
087 8 10
100 5 10
122 1 10
13 5 100
138 2 100
144 1 100
163 1 1000
179 1 10000
195 1 100000
211 1 1000000
bull From Table A-14 at 6m mining height there is a 1 in 20 probability of instability and at 9m a 1 in 2 probability The variability in the database of failed and unfailed pillars from which eq (1) to eq (3) are derived is responsible for these probabilities Our numerical model should always predict failure if the FoS is less than 10 and always predict stability with FoS gt 10 since no such variability in geotechnical properties or conditions is used
bull While our numerical model predicts no pillar failure at 6m and pillar failure at 9m in reality there remains approximately a 1 in 20 chance of failure at 6m mining height If one pillar was to fail load transferred to adjacent pillars would reduce these adjacent pillars FoS and may well lead to the pillar failure and resultant subsidence observed at Duncan St
bull Based on the numerical results obtained using two mining heights the pillar and overburden failure is in line with analytical predictions from Pressure Arch theory and UNSW pillar strength calculation
bull Surface subsidence predicted from the 9m mining height numerical model is 196m While this value is in general agreement with monitoring data the model is not sufficiently calibrated since the real mining height in the region is unknown to be able to confidently predict final subsidence strains and tilts
bull With 1MPa cohesive backfill at a fill ratio of 83 the predicted strength increase is 70 With non-cohesive backfill at the same fill ratio the strength increase is 20 these values are in agreement with single pillar studies
bull Abutment stresses in the immediate roof sandstone unit (above the coal roof) are predicted to extend approximately 80m beyond the limits of the model This is in reasonable agreement with twice the load transfer distance of 64m (at 124m depth-of-cover) used to define a pillars zone of influence (the ZI also includes half pillar width ie 74m for 20m pillar)
A74 Numerical model of adjacent region
bull A numerical model of the region immediately to the east of the Duncan St failure region is constructed with 76 pillars
bull At 9m mining height the model predicts failure of 9 pillars but no significant overburden failure The model remains stable in general
bull With a 20 increase in gravity the model is predicted to fail
bull Numerical modelling results suggest the region to the east of the Waterline barrier pillar is stronger by approximately 20 than the subsided region to the west of the barrier pillar
bull Predicted surface subsidence (including compressive effects from gravity increase) is 13m all though numerical instabilities halt the model and true surface subsidence is likely to be higher
bull Inspection of yield at mid-pillar height suggests the southern pillars in the model have intact core when pillars in the middle of the region are failed in their entire volume In reality the southern region of this panel have greater depth-of-cover therefore higher pillar stresses and thus lower FoS in these southern pillars

22
6
8
24
A54 Post peak pillar strength
A full stress strain curve to approximately 35 strain is presented in the following figures for 1MPa cohesive and non-cohesive backfill Results for 05MPa cohesive backfill sit approximately mid-way between these two cases and are included in the summary Table A-9
24 24
0000 0010 0020 0030 0040 0050
Average axial strain of coal pillar
000
2000
3000
4000
5000
6000
7000
8000
9000
22
0000 0010 0020 0030 0040 0050
Average axial strail of coal pillar
000
2000
3000
4000
5000
6000
7000
8000
9000
20 20
18
Ave
rage
str
ess
of c
oal p
illar
(MPa
)
Ave
rage
str
ess
of c
oal p
illar
(MPa
)
18
16 16
1414
12 12
1010
88
66
44
22
00
Figure A-39 Post peak pillar strength with increasing backfill 5m high pillar (wh=40) with 1MPa cohesive backfill on left non-cohesive backfill on right
24
22
0000 0010 0020 0030 0040 0050
Average axial strain of coal pillar
00
250
333
417 500
583
667 833
917
22
0000 0010 0020 0030 0040 0050
Average axial strain of coal pillar
00
250 333
417
500 583
667
833
917
20 20
Ave
rage
str
ess
of c
oal p
illar
(MPa
)
18 18
16 16
14 14
12 12
10 10
8
6
4 4
2 2
0 0
Figure A-40 Post peak pillar strength with increasing backfill 6m high pillar (wh=33) with cohesive backfill on left non-cohesive backfill on right
Aver
age
stre
ss o
f coa
l pill
ar (M
Pa)
4
6
8
10
12
14
16
18
2
4
6
8
0000 0005 0010 0015 0020 0025 0030 0035 0040 0045
Average axial strain of coal pillar
000
2140
2860
4290
5000
5710
7140
7860
9290
2020
0000 0005 0010 0015 0020 0025 0030 0035 0040 0045
Average axial strain of coal pillar
000
2140
2860
4290
5000
5710
7140
7860
9290
18
Ave
rage
str
ess
of c
oal p
illar
(MPa
) A
vera
ge s
tres
s of
coa
l pill
ar (M
Pa)
Aver
age
stre
ss o
f coa
l pill
ar (M
Pa) 16
14
12
10
8
6
4
22
00
Figure A-41 Post peak pillar strength with increasing backfill 7m high pillar (wh=29) with cohesive backfill on left non-cohesive backfill on right
14 14
0
000
2500
3130
3750
5000 6250
6880
8130
8750
0
000
2500
3130
3750
5000
6250
6880
8130
8750
12 12
10
Ave
rage
str
ess
of c
oal p
illar
(MPa
)
10
8
6
4
2
0000 0010 0020 0030 0040 0050 0000 0010 0020 0030 0040 0050
Average axial strain of coal pillar Average axial strain of coal pillar
Figure A-42 Post peak pillar strength with increasing backfill 8m high pillar (wh=25) with cohesive backfill on left non-cohesive backfill on right
2
4
6
8
10
12
14
2
4
6
8
14
12
Ave
rage
str
ess
of c
oal p
illar
(MPa
) A
vera
ge s
tres
s of
coa
l pill
ar (M
Pa)
0
000 2220 2780 3890 5000 6110 7220 8330 8890
0
000 2220 2780 3890 5000 6110 7220 8330 8890
Ave
rage
str
ess
of c
oal p
illar
(MPa
)
10
8
6
4
2
0000 0005 0010 0015 0020 0025 0030 0035 0040 0000 0005 0010 0015 0020 0025 0030 0035 0040
Average axial strain of coal pillar Average axial strain of coal pillar
Figure A-43 Post peak pillar strength with increasing backfill 9m high pillar (wh=22) with cohesive backfill on left non-cohesive backfill on right
12 12
0
000 2500
3000 4000
5000 6000
7000 8000
9000
0
000
2500
3000
4000
5000
6000
7000
8000
9000
10
Ave
rage
str
ess
of c
oal p
illar
(MPa
) 10
8
6
4
2
0000 0005 0010 0015 0020 0025 0030 0035 0000 0005 0010 0015 0020 0025 0030 0035
Average axial strain of coal pillar Average axial strain of coal pillar
Figure A-44 Post peak pillar strength with increasing backfill 10m high pillar (wh=20) with cohesive backfill on left non-cohesive backfill on right
The amount of backfill to achieve the transition between strain softening and hardening is presented in Table A-9 for all mining height The values in this table are estimated from the stress-strain curve analysed to 35 of strain and are depended on the backfill increment which is in turn dependent on the ratio of mining height to the calibrated element size 05m
Table A-9 Percentage of roadway backfill that leads to a transition from strain softening to hardening
Pillar height Non-cohesive 05MPa Cohesive 10MPa Cohesive backfill backfill backfill
5m 300 200 200
6m 500 417 333
7m 571 500 429
8m 625 625 500
9m 722 722 611
10m 800 800 700
The modelling results suggest that the average axial stress of coal pillar increases with compression until peak stress is reached In the post-failure region pillar stress is reduced as strain increases for all models without backfill All the model results predict that there would be a change to strain hardening behaviour as percentage of backfill increases For example this transition point is 333 for 10 MPa cohesive backfill while 50 for non-cohesive backfill with 6m mining height as shown in Table A-9 It can also be seen from Table A-9 that tall pillars need more backfill than squat pillars to achieve the change from strain softening to hardening for either cohesive backfill or non-cohesive backfill
A55 Backfill for diamond shaped pillars
A 7m high diamond shaped pillar with 50 degree skew angle is analysed with increasing level of backfill in surrounding roadways On the skewed angle the backfill is constrained with roller boundary conditions normal to the skewed angle to represent symmetry conditions and a 5m wide roadway
Figure A-45 Numerical model of diamond shaped pillar with backfill on left and boundary conditions on right
The predicted strength of a diamond shaped pillar and equivalent square pillar with increasing roadway backfill of both cohesive and non-cohesive models is presented in Figure A-46 and Figure A-47
6
7
8
9
10
11
12
13
0 10
Pilla
r str
engt
h (M
Pa)
20 30 40 50 60 70 80 90 100
Percentage of backfill ()
Skew pillar
Square pillar
0
10
20
30
40
50
60
70
0 10
Incr
ease
of p
illar
str
engt
h (
)
20 30 40 50 60 70 80 90 100
Percentage of backfill ()
Skew pillar
Square pillar
Figure A-46 Predicted pillar strength of diamond and square shaped pillars with increasing percentage of 1MPa cohesive backfill On left is absolute strength and on right is percentage strength increase
6
7
8
9
10
11
0 10
Pilla
r stre
ngth
(MP
a)
20 30 40 50 60 70 80 90 100
Percentage of backfill ()
Skew pillar
Square pillar
0
5
10
15
20
25
30
35
0 10
Incr
ease
of p
illar
str
engt
h (
)
20 30 40 50 60 70 80 90 100
Percentage of backfill ()
Skew pillar
Square pillar
Figure A-47 Predicted pillar strength of diamond and square shaped pillars with increasing percentage of non-cohesive backfill On left is absolute strength and on right is percentage strength increase
A56 Backfill placed after significant pillar yield
A pillar model with 90 non-cohesive backfill placed after yielding of a 7m high pillar is presented in Figure A-48 The percentage of strength increase is given in Table A-10 It is found that the pillar strength increase is lower if the pillar has undergone significant deformation before the placement of backfill It is predicted that 90 backfill results in a strain-hardening pillar behaviour even if the pillar has previously yielded significantly
Ave
rage
stre
ss o
f coa
l pill
ar (M
Pa)
18 without backfill 025 strain 050 strain
14
16
075 strain 100 strain
12 125 strain 150 strain
10 175 strain 200 strain
8
6
4
2
0 0000 0005 0010 0015 0020 0025 0030 0035 0040 0045 0050
Average strain of coal pillar
Figure A-48 Stress strain curves for backfill placed around the pre-strained pillar displaying state of pillar core upon placement of backfill
Table A-10 Pillar strength increase with 90 non-cohesive backfill placed around a pre-strained 7m high square pillar of 20m width
Percentage backfill ()
Strain at placement of non-cohesive backfill ()
Pillar strength (MPa)
Percentage increase in peak
strength ()
Percentage increase in post-peak
strength at 3 strain ()
0 000 7953 000
90 000 10290 2939
90 025 9156 1513
90 050 8965 1272
90 075 8526 720
90 100 7945 26006
90 125 7951 22608
90 150 7951 18917
90 175 7951 15629
90 200 7951 11134
A6 3D MODEL OF DUNCAN ST FAILURE PANEL
A61 Numerical model
A three dimensional model of 46 pillars in the Duncan St subsidence region has been analysed with over burden geology based on hole CP1 and a constant overburden depth of 124m Figure A-49 Figure A-50 and Figure A-51 Uniform mining heights of 6m and 9m have been analysed
Selection of the pillars to be analysed is based on visual inspection of the panel layout and includes pillars bounded by unmined coal to the west the waterline barrier pillar to the east larger pillars to the south and a panel of slightly larger pillars of different orientation to the north
One row of pillars in the middle of this panel trending from north-west to south-east are of smaller dimension than the average and of diamond shape with acute internal angle of approximately 50degrees Being in the approximate middle of the panel close to full tributary area load will be mobilised on this row of pillars and therefore it is believed pillars in this row initiated the 2008 subsidence event
The Duncan Street numerical model has the following objectives
bull Estimation of pillar stresses and FoS for comparison with empirical formula
bull Comparison of backfill response at panel scale with previous single pillar studies
bull Estimation of surface subsidence at given percentage roadway fill
bull Estimation of extent of abutment stresses due to panel failure
A62 Observations from Duncan Street numerical model
bull At 6m mining height the minimum pillar FoS for these 46 pillars is calculated to be 131 using Pressure Arch theory and UNSW strength formula panel failure is not predicted with this mining height by the model At 9m mining height the minimum FoS is calculated as 099 and panel failure is predicted to occur
bull The probability of pillar failure for associated FoS calculated by the UNSW pillar strength formula Eq(2) is given in Galvin 2006 in Table A-11 The relationship was developed for square pillars using the Australian pillar database and tributary area theory and hence theoretically speaking may not directly apply to this study However it can be taken as a general guide
bull From Table A-11 it is seen that there is a 1 in 20 probability of instability at 6m mining height and a 1 in 2 probability at 9m mining height Numerical modelling is however a deterministic approach and it always predicts failure if the FoS is less than 10 and stability if FoS gt 10 since no variation in geotechnical properties or conditions is used
bull Although our numerical models predict no pillar failure at 6m and panel failure at 9m in reality there remains approximately a 1 in 20 chance of failure at 6m mining height If one pillar was to fail load transferred to adjacent pillars would reduce the FoS of these adjacent pillars and could lead to the pillar failure and subsidence as observed at 2008 event region
Table A-11 Factor of safety failure probabilities for UNSW pillar strength formula
(after Galvin 2006)
Safety Factor Probability of pillar failure
087 8 10
100 5 10
122 1 10
130 5 100
138 2 100
144 1 100
163 1 1000
179 1 10000
195 1 100000
211 1 1000000
bull Based on the numerical results obtained using two mining heights the pillar and overburden failure is consistent with analytical predictions from Pressure Arch theory and UNSW pillar strength calculation
bull Surface subsidence predicted from the numerical model with a mining height of 9m is 196m While this value is in approximate agreement with monitoring data (14mshy15m) the model was not sufficiently calibrated since the real mining height in the region is uncertain to be able to confidently predict final subsidence strains and tilts at the site
bull With 1MPa cohesive backfill at a roadway fill ratio of 83 the predicted strength increase is 70 With non-cohesive backfill at the same fill ratio the strength increase is 20 These values are in agreement with the results for single pillars
bull The numerically predicted surface subsidence with 83 roadway fill is 022m Maximum predicted tilt in east-west direction is 7mmm and in north-south direction is 5mmm Analytical formula [Holla amp Barclay 2000] predict maximum tilt of 53mmm for this amount of subsidence
bull Isolated cohesive backfill surrounding pillars of low wh ratio is predicted to be effective in confining the pillar and increasing peak pillar strength and panel stability Isolated non-cohesive backfill without barriers could not be analysed in this numerical model as backfill lsquoflowsrsquo and numerical stability could not be achieved
bull Stress transfer in the immediate roof sandstone unit (above the coal roof) is predicted to extend approximately 80m beyond the limits of the collapsed panel This is in reasonable agreement with theoretical studies
Figure A-49 Duncan St modelled panel with outline of adjacent modelled panel location of representative open hole CP1 file named ldquoAppendix B2 open hole logsrdquo located in directory ldquoCollingwood Park Subsidence 2B Collingwood Park Mine Subsidence Reports 1988 Eventsrdquo and mine subsidence limit contour
A63 Model properties
Overburden geology is based on borehole CP1 the most complete interpreted available hole drilled in 1988 by Queensland Department of Mines Figure A-50 To include this in the numerical model lithological units had to be coalesced into major units of sandstone (SS) siltstone (SL) mudstone (MS) weathered units and coal Figure A-51
Rock properties for the overburden were determined from a 2D parametric study whereby the UCS of all units was scaled to achieve pillar and overburden failure at 8m mining height Table A-12 and Table A-13
Unit top depth thickness unit thickness
thickness scaled
thickness in model
000 1200 1200 1046 1000 1200 700 SS 700 610 600 1900 600 MS 600 523 500 2500 1100 SS 1300 1133 1100 3600 200 SS 000 3800 100 SL 1000 871 900 3900 100 MS 000 4000 500 000 4500 100 000 4600 100 000 4700 100 000 4800 100 SS 400 349 400 4900 300 SS 000 5200 300 SL 700 610 600 5500 100 MS 000 5600 300 MS 000 5900 400 SS 500 436 400 6300 100 SS 000 6400 400 SL SS 900 784 800 6800 100 SL MS 000 6900 100 SL 000 7000 200 SL MS 000 7200 100 SS SL 000 7300 200 SS 1000 871 900 7500 200 SL 000 7700 200 SS SL 000 7900 200 SS 000 8100 100 SL 000 8200 100 SS 000 8300 200 SL 4350 3790 3800 8500 200 SL 000 8700 100 SS 000 8800 100 COAL 000 8900 200 000 9100 100 000 9200 100 000 9300 100 SL MS 000 9400 300 SL MS SS 000 9700 100 000 9800 100 SL MS 000 9900 400 SL SS 000 10300 200 SS MS 000 10500 100 SL MS 000 10600 200 SL MS SS 000 10800 100 000 10900 400 SL MS 000 11300 400 SL SS 000 11700 100 SS MS 000 11800 300 000 12100 400 SL SS 000
SL MS MS SS
MS
MS
SL
MS SS SL SS SL MS MS
weathering
SL MS SS
12500 150 000 12650 450 850 741 750 13100 400 SS 000 13500 100 MS SL
SS SL 960 837 500
13600 200 13800 100 SS 13900 200 14100 360
SS SL SL MS
14460 470 COAL MINING SEAM 600 14930 FLOOR
Figure A-50 Inferred geology from representative borelog CP1 used in numerical model
weathering SS
Unit Depth floor below surface Num elements Unit Unit name in model surface 0
10 3 16 weather 16 2 15 ss6
MS 21 2 14 ms2 SS 32 4 13 ss5 SL 41 3 12 sl3 SS 45 1 11 ss4 MS 51 2 10 ms1 SS 55 1 9 ss3 SL 63 3 8 sl2 SS 72 3 7 ss2 SL 1055 11 6 sl1 SS 113 4 5 ss1 SEAMR 118 3 4 seamr SEAM 124 3 3 seam FLOOR1 134 3 2 floor2 FLOOR2 250 10 1 floor1
Figure A-51 Coalesced units for numerical model based on hole CP1
Insitu stress is unknown at the site so a horizontal to vertical stress gradient of 15 has been assumed Given that the extensive workings were undertaken 20 to 30 years before the 2008 event horizontal stresses in the mining seam would be considerably disturbed from the pre-mining conditions
Table A-12 Rock properties for softening mohr coloumb material Softening rates of coal friction angle is 6 degrees over 2 plastic strain and total loss of cohesion over 24 plastic strain in coal and over 1 in other rocks Determined from pillar studies
E
nu Bulk Shear UCS UCS Phi Dilation Coh Tensile Strength (GPa) (GPa) (GPa) (MPa) scaled angle (MPa) (MPa)
SS 75 02 4167 3125 50 125 40 2 291 125
SL 4 025 2667 1600 30 75 35 2 195 075
MS 3 025 2000 1200 15 375 32 2 104 0375
Weathering 1 025 0667 0400 8 2 32 2 055 02
COAL 11 03 0917 0423 12 3 36 6 076 003
FLOOR1 4 025 2667 1600 30 75 38 2 183 075
FLOOR2 4 025 2667 1600 30 75 38 2 183 075
Table A-13 Ubiquitous joint properties Softening rate of ubiquitous joints total loss of cohesion over 1 plastic strain Determined from 2D overburden studies
Cohesion Ubiq joint cohesion Tensile Strength Ubiq joint tensile strength Ubiq joint (MPa) (MPa) (MPa) (MPa) friction
SS 291 00029144 125 0000125 15 SL 195 00019521 075 0000075 15 MS 104 00010393 0375 00000375 15 Weathering 055 00005543 02 000002 15 COAL 076 003 FLOOR1 183 - 075 - -FLOOR2 183 075 -
A64 Results from 3D Duncan St model
Factor of Safety estimated at 6m and 9m mining heights
Figure A-52 Pillar FoS calculated for 6m mining height by analytical method with strength by eq(3) and pillar stress by pressure arch theory Minimum value is 131 suggesting a 5 in 100 probability of failure however not sufficient to fail in the numerical model (that requires FoS lt 10)
Figure A-53 Pillar FoS calculated analytically for 9m mining height (eq(3) and PA theory) Minimum value is 099 suggesting a probability of failure of 5 in 10 although in the numerical model failure should occur
Yield on plane for 6m and 9m mining heights
Figure A-54 Location of section plane used for section view in following figures
Figure A-55 Yield on section plane for 6m mining height No significant damage or displacement observed
Figure A-56 Yield on section plane for 9m mining height no backfill
Figure A-57 Displacement on section plane for 9m mining height no backfill Maximum displacement is approximately 15m at surface
Results on horizontal plane at mid-pillar height
Figure A-58 Yield at mid-pillar height 9m mining height Blue elements evident in some pillars indicating pillar core remains intact
Figure A-59 Predicted vertical stress at mid pillar height 9m mining height Insitu stress is 30MPa Unyielded pillars and pillars hardening after yield are transferring vertical load while yielded pillars carry little load Extent of abutment stress increase is approximately 80m
Figure A-60 Roof vertical stress predicted by numerical model with 9m mining height Contour increments are 01MPa Base vertical stress is approximately 27MPa Abutment stress influence distance is approximately 80m
Results on surface after panel failure at 9m mining height
Figure A-61 Surface subsidence as predicted with numerical model with 9m mining height and total subsidence along Duncan St to McLaughlin St as monitored to October 09 Maximum surface subsidence predicted as 196m Outline of numerical modelling pillars and dotted contour of observed subsidence limit
A65 Duncan St model ndash backfill effectiveness
The Duncan St 3D model has been analysed with full and targeted 1MPa cohesive and non-cohesive backfill placed in roadways Roadway fill of 66 is analysed for the 1MPa cohesive mixture and 83 roadway fill for the non-cohesive mix
Results are presented in the following figures and figure captions
Factor of Safety increase from cohesive backfill
Analysis of the Duncan St model with 9m mining height is undertaken to estimate the FoS increase from backfill By increasing gravity in increments the backfill strength improvement is quantified With 83 roadway fill of 1MPa cohesive backfill the overburden and pillar tops (ie region of pillar above height of backfill) fails with gravity of 17ms2 suggesting the pillars with FoS of approximately 10 has increased FoS to 17 by backfilling adjacent roadways
Figure A-62 Gravity of 16g with 83 1MPa cohesive backfill showing no significant yield
Figure A-63 Gravity of 17g with 83 1MPa cohesive backfill predicting failure of pillar tops and overburden and collapse of roadway void space
FoS increase with non-cohesive backfill
With non-cohesive backfill pillars yielded due to lack of confinement upon initial placement of backfill in roadways but overburden remain stable and void space above backfill remained open Overburden remained stable at gravity increase to 11ms2 Figure A-64 but collapsed at gravity increase of 12ms2 Figure A-65
Figure A-64 Gravity of 11g with 83 non-cohesive backfill predicting pillar yield but overburden stability
Figure A-65 Gravity of 12g with 83 non-cohesive backfill predicting failure of pillars and overburden and collapse of roadway void space Maximum surface subsidence is 055m which includes the compressive effect of the 12g gravity increase
Placement of targeted backfill
A model is analysed with cohesive backfill totally surrounding two pillars with low predicted FoS The two pillars are predicted to have a FoS of 099 and 100 left to right viewed from above at a 9m mining height Backfill extends to an extent of 5m to 10m from the pillar and is 6m high in the roadways Gravity increase to 12g required to fail panel suggesting panel strength increase is approximately 20 from targeted backfill Predicted surface subsidence 125m (excessive mesh deformation stops analysis equilibrated stage may have higher surface subsidence)
Figure A-66 Duncan St model with 66 roadway fill of 1MPa cohesive backfill surrounding two pillars with low FoS at 9m mining height
Figure A-67 Predicted yield at mid pillar height of 9m pillars with 66 roadway fill of 1MPa cohesive backfill Note intact core (blue) for targeted pillars
Figure A-68 Pillar strength at 9m mining height Strength WITHOUT BACKFILL of northern focus pillar selected for targeted backfill is 527MPa and southern focus pillar is 526MPa
Figure A-69 Vertical stress in pillars targeted for partial backfill placement Stress calculated at equilibrium of elasto-plastic analysis WITHOUT BACKFILL Stress in northern focus pillar is 54MPa and in southern focus pillar is 513 FoS of NFP=52754 = 0975 FoS of SFP=526513 = 1025
Non-cohesive backfill in targeted placement study
A model with targeted placement of non-cohesive backfill was attempted but could not be satisfactorily converged since backfill lsquoflowsrsquo and inter-penetrates elements resulting in numerical instabilities
Forcing pillars to fail to examine resultant subsidence
To examine the extent of surface subsidence if backfilled pillars fail the numerical model with 9m mining height and 83 roadway fill of 1MPa cohesive backfill is analysed with a 90 reduction in coal pillar strength properties
With 9m mining height and 83 roadway fill of cohesive backfill void space remaining is 15m and the numerical model predicts failure of pillars and overburden results in approximately 02m surface subsidence
Figure A-70 Surface subsidence predicted by numerical model when pillars forced to fail with 83 roadway fill Contour interval is 01m with maximum subsidence predicted as 022m
Figure A-71 Surface strain in east-west direction when pillars forced to fail resulting 022m surface subsidence Maximum strain is 5mmm and contour interval is 1mmm
Figure A-72 Surface strain in north-south direction when pillars forced to fail resulting 022m surface subsidence Maximum strain is 3mmm and contour interval is 1mmm
Figure A-73 Tilt in east-west direction Units are mmm and intervals are 1mmm maximum tilt is 7mmm
Figure A-74 Tilt in north-south direction Units are mmm and intervals are 1mmm maximum tilt is 5mmm
To highlight the need for adequate fill the model with 66 roadway fill is analysed with the pillars forced to fail with a 50 reduction in pillar strength Void space over the backfill in the roadways is 30m Modelling predicts maximum surface subsidence of 068m
Figure A-75 Surface subsidence when pillars forced to fail with 66 roadway fill Roadway void space is 30m with the model predicting 068m surface subsidence Contour interval is 01m
A66 Numerical model of adjacent high risk area
Numerical model and panel stability
A numerical model of the region adjacent to Duncan St incorporating 76 pillars is analysed at 9m mining height Overburden strata strengths and depth-of-cover is consistent with Duncan St model
The main objective of this model is to estimate the strength difference between the two mining panels west and east of the Waterline fault Given uniform mining height and depth-of-cover the strength difference will be due to the pillar configuration and boundary conditions
At 9m mining height the model is predicted to be essentially stable although 9 pillars are predicted to be fully yielded at mid-pillar height
With gravity increase of 10 the model remains stable At 20 increase in gravity the model is predicted to fail with significant overburden yield
It is concluded therefore that the panel to the east of Waterline fault is 20 stronger than the panel to the west
Figure A-76 Location of numerical model 2 together with surface subsidence contours from 1988 and 2008 events and seam level eastern boundary of failure predicted from 3D seismic
Figure A-77 Yield on section at mid-height for 9m mining height
Figure A-78 Rockmass yield on vertical section trending east-west at mid-point of model Note overburden is largly intact with no extensive collapse
Figure A-79 Pillars predicted to have failed from Numerical model 2 with surface subsidence contours and inferred eastern limit of failed zone at seam level
By a 20 increase in gravity the model is forced to fail resulting in predicted 13m surface subsidence that includes increased overburden compression from increased gravitational component Excessive deformation and numerical instability stopped the model true surface deformation may be higher
Figure A-80 Adjacent model with 9m mining height Predicted surface subsidence after 20 increase in gravity Model predicts 13m surface subsidence
Figure A-81 Adjacent model with 9m mining height and 20 gravity increase Predicted failure at mid-pillar height Note intact core in southern pillars which appear stronger from unmined adjacent coal and larger general pillar size
A7 CONCLUSIONS
A71 Current knowledge on coal pillars behaviour
bull The strength based factor-of-safety approach is well established in coal pillar design Factors of safety for coal pillars required to provide medium to long term stability should be greater than 16 [Galvin 2006 Hill 2005]
bull Coal pillar strength has been the subject of rigorous research since at least the 1960rsquos and the Salamon amp Munro formula has been applied in the design of over a million coal pillars in South Africa alone [Mark 1999 Salamon 1998] Strength formula derivations from the UNSW are established in Australia
bull Coal pillar load calculation traditionally relies on tributary area theory which is a conservative approach suitable for pillar design
bull Tributary area conditions are NOT satisfied at Collingwood Park pillars are irregular in size and shape there is large areas of unmined coal and the seam has significant dip
bull This last point is important as analytical methods hold the only hope of evaluating every pillar at Westfalen No 3 Colliery The numerical model of Duncan St analyses 46 pillars and requires significant computational resources the entire Colliery has in excess of 700 pillars and cannot be analysed by the same methods in its entirety by current computer codes in a reasonable time frame
bull Likewise it is not satisfactory to draw conclusions on panel stability from limited analysis of representative groupings of pillars because of the variability in size shape mining height and cover depth over the mining area
bull To overcome the limitations of tributary area theory for the back-analysis of an irregular pillar layout a novel approach for calculating loads based on pressure arch theory has been developed subjected to international peer review and published in the International Journal of Rock Mechanics and Mining Sciences In summary each pillar is individually examined and the pillar area circumference and centroid are calculated At the pillar centroid the cover depth and mining height are determined An influence zone based on a circular area with radius defined by the depth-dependent load transfer distance Within this area the local extraction ratio is calculated This approach has found to satisfactorily account for pillars of arbitrary shape in irregular layout with variable cover depth
bull This allows a FoS to be determined for the over 700 pillars of Westfalen No 3 with reasonable computer resources
A72 Typical pillar strength effects
Width to height ratio
bull Pillars at Westfalen No 3 have typical effective width from 20m to 50m While mining height is uncertain it is believed to range from 6m to 10m With these dimensions pillar wh ratio ranges from 20 to 83
bull At the lower limit of wh=20 geological influences will start to determine pillar strength [Galvin 2006] From wh in the range gt 20 to 40 the formula of Salamon and Munro or UNSW extensions could be expected to estimate pillar strength with the squat pillar version of these formula applicable for whgt40 [Galvin 2006 Salamon 1998 Galvin 1999]
bull The squat pillar extensions were developed since the standard formulas were found to underestimate pillar strength at whgt4 At Westfalen No 3 colliery although there are a number of pillars of whgt4 many of these are irregular in shape often long and relatively narrow (30m ndash 40m) Given this and the need to automate the assessment of every pillar the squat pillar strength formula is not utilised This approach is conservative
Pillar shape effects
bull Many pillars at Westfalen No 3 are skewed of diamond shape with acute internal angle from 50 to 90 degrees Hydraulic radius simile accounts for pillar shape by an effective width defined by 4AC while the UNSW has a parrellopid formula that for pillars of equal side length results in an effective width equivalent to this
bull In a study of pillar shapes common to Westfalen No 3 colliery the hydraulic radius analogy for estimation of effective width is found adequate with errors less than 6 for considered sizes and shapes
Post peak strength
bull Numerical studies and the work of Das in Indian coal fields highlights the changing post peak behaviour with increasing width to height ratiorsquos It has been determined that when wh exceeds approximately 5 pillars start to harden post peak When whlt3 pillars display limited if any post peak strength
bull The significance of this effect will be in the manner that pillars shed load to adjacent pillars In an array of pillars of similar dimensions pillars with a low wh ratio could be expected to shed load in a sudden more catastrophic manner than those that harden post peak Such sudden pillar failure is referred in the literature as catastrophic cascading or rolling pillar failure and has been responsible for damaging wind blasts and significant loss of life over the years
bull In an irregular pillar layout such as Westfalen No 3 with variable wh ratio significant barrier pillars and regions of unmined coal sudden multiple panel collapse would be expected to be less likely
bull The analytical approach developed for assessing pillar load accounts for load shed from a failed pillars to pillars within the zone of influence of that pillar
Specific details of this approach are discussed in the hazard map and risk assessment chapter of this report
Backfill effect
bull Numerical studies on a cohesive and non-cohesive backfill suggest that pillar strength is increased with increasing height of fill Studies suggest a 1MPa cohesive backfill may increase pillar strength by approximately 10 at 40 roadway fill for wh=33 and 18 at 40 roadway fill at wh=22 At 80 roadway fill pillar strength increases are predicted to exceed 50 Percentage strength increases are predicted to be greater with lower wh ratiorsquos
bull Studies of a non-cohesive backfill suggest at 80 roadway fill pillar strength increases are approximately 25
bull With both backfill types pillar strength is predicted to increases dramatically above 80 roadway fill and pillars are predicted to exhibit post-peak hardening behaviour
For example in the Duncan St area a pillar of effective width 20m will have a FoS of approximately 118 at mining height of 10m without backfill A 50 strength increase from 1MPa cohesive backfill at 80 roadway fill will raise the FoS to approximately 177 and reduce the probability of instability from approximately 1 in 10 to less than 1 in 1000
With 80 roadway fill of a non-cohesive backfill the same Duncan St pillar FoS will increase to approximately 147 and the probability of instability reduce to less than 1 in 100
bull Backfill is likely to reduce the rate of time dependent pillar strength degradation by reducing pillar spalling due to the erosive effects over time of high stress and exposure of the pillar surface to the atmosphere
bull In addition backfill is likely to benefit pillar stability by limiting the void available to the roof to fall into Roof falls particularly at roadway intersections may be present By reducing the roadway volume backfill will eventually support the roof when the bulking effect of roof falls fills the remaining roadway voids space Beyond this summary time dependent issues of backfill have not been considered
roadway
fill
Non-cohesive backfill
(7m mining height width 20m) strength increase
05 MPa cohesive backfill
(7m mining height width 20m)
strength increase
10 MPa cohesive backfill
(7m mining height width 20m)
strength increase
60 135 388 437
70 183 432 597
80
90
208
291
474
572
698
957
A73 Duncan St numerical model
bull In the Duncan St subsidence region approximately 46 pillars are surrounded by unmined coal to the west a large pillar containing the Waterline fault to the east and larger pillars to the south and north
bull At 6m mining height pillar minimum FoS for these 46 pillars is calculated at 131 with Pressure Arch theory and UNSW strength formula At 9m mining height minimum FoS is calculated as 099
bull Pillar probability of failure for FoS calculated by the UNSW eq(2) is given in [Galvin 2006] as
Table A-14 Factor of safety failure probabilities for UNSW pillar strength formula (after Galvin 2006)
Safety Factor Probability of pillar failure
087 8 10
100 5 10
122 1 10
13 5 100
138 2 100
144 1 100
163 1 1000
179 1 10000
195 1 100000
211 1 1000000
bull From Table A-14 at 6m mining height there is a 1 in 20 probability of instability and at 9m a 1 in 2 probability The variability in the database of failed and unfailed pillars from which eq (1) to eq (3) are derived is responsible for these probabilities Our numerical model should always predict failure if the FoS is less than 10 and always predict stability with FoS gt 10 since no such variability in geotechnical properties or conditions is used
bull While our numerical model predicts no pillar failure at 6m and pillar failure at 9m in reality there remains approximately a 1 in 20 chance of failure at 6m mining height If one pillar was to fail load transferred to adjacent pillars would reduce these adjacent pillars FoS and may well lead to the pillar failure and resultant subsidence observed at Duncan St
bull Based on the numerical results obtained using two mining heights the pillar and overburden failure is in line with analytical predictions from Pressure Arch theory and UNSW pillar strength calculation
bull Surface subsidence predicted from the 9m mining height numerical model is 196m While this value is in general agreement with monitoring data the model is not sufficiently calibrated since the real mining height in the region is unknown to be able to confidently predict final subsidence strains and tilts
bull With 1MPa cohesive backfill at a fill ratio of 83 the predicted strength increase is 70 With non-cohesive backfill at the same fill ratio the strength increase is 20 these values are in agreement with single pillar studies
bull Abutment stresses in the immediate roof sandstone unit (above the coal roof) are predicted to extend approximately 80m beyond the limits of the model This is in reasonable agreement with twice the load transfer distance of 64m (at 124m depth-of-cover) used to define a pillars zone of influence (the ZI also includes half pillar width ie 74m for 20m pillar)
A74 Numerical model of adjacent region
bull A numerical model of the region immediately to the east of the Duncan St failure region is constructed with 76 pillars
bull At 9m mining height the model predicts failure of 9 pillars but no significant overburden failure The model remains stable in general
bull With a 20 increase in gravity the model is predicted to fail
bull Numerical modelling results suggest the region to the east of the Waterline barrier pillar is stronger by approximately 20 than the subsided region to the west of the barrier pillar
bull Predicted surface subsidence (including compressive effects from gravity increase) is 13m all though numerical instabilities halt the model and true surface subsidence is likely to be higher
bull Inspection of yield at mid-pillar height suggests the southern pillars in the model have intact core when pillars in the middle of the region are failed in their entire volume In reality the southern region of this panel have greater depth-of-cover therefore higher pillar stresses and thus lower FoS in these southern pillars

4
6
8
10
12
14
16
18
2
4
6
8
0000 0005 0010 0015 0020 0025 0030 0035 0040 0045
Average axial strain of coal pillar
000
2140
2860
4290
5000
5710
7140
7860
9290
2020
0000 0005 0010 0015 0020 0025 0030 0035 0040 0045
Average axial strain of coal pillar
000
2140
2860
4290
5000
5710
7140
7860
9290
18
Ave
rage
str
ess
of c
oal p
illar
(MPa
) A
vera
ge s
tres
s of
coa
l pill
ar (M
Pa)
Aver
age
stre
ss o
f coa
l pill
ar (M
Pa) 16
14
12
10
8
6
4
22
00
Figure A-41 Post peak pillar strength with increasing backfill 7m high pillar (wh=29) with cohesive backfill on left non-cohesive backfill on right
14 14
0
000
2500
3130
3750
5000 6250
6880
8130
8750
0
000
2500
3130
3750
5000
6250
6880
8130
8750
12 12
10
Ave
rage
str
ess
of c
oal p
illar
(MPa
)
10
8
6
4
2
0000 0010 0020 0030 0040 0050 0000 0010 0020 0030 0040 0050
Average axial strain of coal pillar Average axial strain of coal pillar
Figure A-42 Post peak pillar strength with increasing backfill 8m high pillar (wh=25) with cohesive backfill on left non-cohesive backfill on right
2
4
6
8
10
12
14
2
4
6
8
14
12
Ave
rage
str
ess
of c
oal p
illar
(MPa
) A
vera
ge s
tres
s of
coa
l pill
ar (M
Pa)
0
000 2220 2780 3890 5000 6110 7220 8330 8890
0
000 2220 2780 3890 5000 6110 7220 8330 8890
Ave
rage
str
ess
of c
oal p
illar
(MPa
)
10
8
6
4
2
0000 0005 0010 0015 0020 0025 0030 0035 0040 0000 0005 0010 0015 0020 0025 0030 0035 0040
Average axial strain of coal pillar Average axial strain of coal pillar
Figure A-43 Post peak pillar strength with increasing backfill 9m high pillar (wh=22) with cohesive backfill on left non-cohesive backfill on right
12 12
0
000 2500
3000 4000
5000 6000
7000 8000
9000
0
000
2500
3000
4000
5000
6000
7000
8000
9000
10
Ave
rage
str
ess
of c
oal p
illar
(MPa
) 10
8
6
4
2
0000 0005 0010 0015 0020 0025 0030 0035 0000 0005 0010 0015 0020 0025 0030 0035
Average axial strain of coal pillar Average axial strain of coal pillar
Figure A-44 Post peak pillar strength with increasing backfill 10m high pillar (wh=20) with cohesive backfill on left non-cohesive backfill on right
The amount of backfill to achieve the transition between strain softening and hardening is presented in Table A-9 for all mining height The values in this table are estimated from the stress-strain curve analysed to 35 of strain and are depended on the backfill increment which is in turn dependent on the ratio of mining height to the calibrated element size 05m
Table A-9 Percentage of roadway backfill that leads to a transition from strain softening to hardening
Pillar height Non-cohesive 05MPa Cohesive 10MPa Cohesive backfill backfill backfill
5m 300 200 200
6m 500 417 333
7m 571 500 429
8m 625 625 500
9m 722 722 611
10m 800 800 700
The modelling results suggest that the average axial stress of coal pillar increases with compression until peak stress is reached In the post-failure region pillar stress is reduced as strain increases for all models without backfill All the model results predict that there would be a change to strain hardening behaviour as percentage of backfill increases For example this transition point is 333 for 10 MPa cohesive backfill while 50 for non-cohesive backfill with 6m mining height as shown in Table A-9 It can also be seen from Table A-9 that tall pillars need more backfill than squat pillars to achieve the change from strain softening to hardening for either cohesive backfill or non-cohesive backfill
A55 Backfill for diamond shaped pillars
A 7m high diamond shaped pillar with 50 degree skew angle is analysed with increasing level of backfill in surrounding roadways On the skewed angle the backfill is constrained with roller boundary conditions normal to the skewed angle to represent symmetry conditions and a 5m wide roadway
Figure A-45 Numerical model of diamond shaped pillar with backfill on left and boundary conditions on right
The predicted strength of a diamond shaped pillar and equivalent square pillar with increasing roadway backfill of both cohesive and non-cohesive models is presented in Figure A-46 and Figure A-47
6
7
8
9
10
11
12
13
0 10
Pilla
r str
engt
h (M
Pa)
20 30 40 50 60 70 80 90 100
Percentage of backfill ()
Skew pillar
Square pillar
0
10
20
30
40
50
60
70
0 10
Incr
ease
of p
illar
str
engt
h (
)
20 30 40 50 60 70 80 90 100
Percentage of backfill ()
Skew pillar
Square pillar
Figure A-46 Predicted pillar strength of diamond and square shaped pillars with increasing percentage of 1MPa cohesive backfill On left is absolute strength and on right is percentage strength increase
6
7
8
9
10
11
0 10
Pilla
r stre
ngth
(MP
a)
20 30 40 50 60 70 80 90 100
Percentage of backfill ()
Skew pillar
Square pillar
0
5
10
15
20
25
30
35
0 10
Incr
ease
of p
illar
str
engt
h (
)
20 30 40 50 60 70 80 90 100
Percentage of backfill ()
Skew pillar
Square pillar
Figure A-47 Predicted pillar strength of diamond and square shaped pillars with increasing percentage of non-cohesive backfill On left is absolute strength and on right is percentage strength increase
A56 Backfill placed after significant pillar yield
A pillar model with 90 non-cohesive backfill placed after yielding of a 7m high pillar is presented in Figure A-48 The percentage of strength increase is given in Table A-10 It is found that the pillar strength increase is lower if the pillar has undergone significant deformation before the placement of backfill It is predicted that 90 backfill results in a strain-hardening pillar behaviour even if the pillar has previously yielded significantly
Ave
rage
stre
ss o
f coa
l pill
ar (M
Pa)
18 without backfill 025 strain 050 strain
14
16
075 strain 100 strain
12 125 strain 150 strain
10 175 strain 200 strain
8
6
4
2
0 0000 0005 0010 0015 0020 0025 0030 0035 0040 0045 0050
Average strain of coal pillar
Figure A-48 Stress strain curves for backfill placed around the pre-strained pillar displaying state of pillar core upon placement of backfill
Table A-10 Pillar strength increase with 90 non-cohesive backfill placed around a pre-strained 7m high square pillar of 20m width
Percentage backfill ()
Strain at placement of non-cohesive backfill ()
Pillar strength (MPa)
Percentage increase in peak
strength ()
Percentage increase in post-peak
strength at 3 strain ()
0 000 7953 000
90 000 10290 2939
90 025 9156 1513
90 050 8965 1272
90 075 8526 720
90 100 7945 26006
90 125 7951 22608
90 150 7951 18917
90 175 7951 15629
90 200 7951 11134
A6 3D MODEL OF DUNCAN ST FAILURE PANEL
A61 Numerical model
A three dimensional model of 46 pillars in the Duncan St subsidence region has been analysed with over burden geology based on hole CP1 and a constant overburden depth of 124m Figure A-49 Figure A-50 and Figure A-51 Uniform mining heights of 6m and 9m have been analysed
Selection of the pillars to be analysed is based on visual inspection of the panel layout and includes pillars bounded by unmined coal to the west the waterline barrier pillar to the east larger pillars to the south and a panel of slightly larger pillars of different orientation to the north
One row of pillars in the middle of this panel trending from north-west to south-east are of smaller dimension than the average and of diamond shape with acute internal angle of approximately 50degrees Being in the approximate middle of the panel close to full tributary area load will be mobilised on this row of pillars and therefore it is believed pillars in this row initiated the 2008 subsidence event
The Duncan Street numerical model has the following objectives
bull Estimation of pillar stresses and FoS for comparison with empirical formula
bull Comparison of backfill response at panel scale with previous single pillar studies
bull Estimation of surface subsidence at given percentage roadway fill
bull Estimation of extent of abutment stresses due to panel failure
A62 Observations from Duncan Street numerical model
bull At 6m mining height the minimum pillar FoS for these 46 pillars is calculated to be 131 using Pressure Arch theory and UNSW strength formula panel failure is not predicted with this mining height by the model At 9m mining height the minimum FoS is calculated as 099 and panel failure is predicted to occur
bull The probability of pillar failure for associated FoS calculated by the UNSW pillar strength formula Eq(2) is given in Galvin 2006 in Table A-11 The relationship was developed for square pillars using the Australian pillar database and tributary area theory and hence theoretically speaking may not directly apply to this study However it can be taken as a general guide
bull From Table A-11 it is seen that there is a 1 in 20 probability of instability at 6m mining height and a 1 in 2 probability at 9m mining height Numerical modelling is however a deterministic approach and it always predicts failure if the FoS is less than 10 and stability if FoS gt 10 since no variation in geotechnical properties or conditions is used
bull Although our numerical models predict no pillar failure at 6m and panel failure at 9m in reality there remains approximately a 1 in 20 chance of failure at 6m mining height If one pillar was to fail load transferred to adjacent pillars would reduce the FoS of these adjacent pillars and could lead to the pillar failure and subsidence as observed at 2008 event region
Table A-11 Factor of safety failure probabilities for UNSW pillar strength formula
(after Galvin 2006)
Safety Factor Probability of pillar failure
087 8 10
100 5 10
122 1 10
130 5 100
138 2 100
144 1 100
163 1 1000
179 1 10000
195 1 100000
211 1 1000000
bull Based on the numerical results obtained using two mining heights the pillar and overburden failure is consistent with analytical predictions from Pressure Arch theory and UNSW pillar strength calculation
bull Surface subsidence predicted from the numerical model with a mining height of 9m is 196m While this value is in approximate agreement with monitoring data (14mshy15m) the model was not sufficiently calibrated since the real mining height in the region is uncertain to be able to confidently predict final subsidence strains and tilts at the site
bull With 1MPa cohesive backfill at a roadway fill ratio of 83 the predicted strength increase is 70 With non-cohesive backfill at the same fill ratio the strength increase is 20 These values are in agreement with the results for single pillars
bull The numerically predicted surface subsidence with 83 roadway fill is 022m Maximum predicted tilt in east-west direction is 7mmm and in north-south direction is 5mmm Analytical formula [Holla amp Barclay 2000] predict maximum tilt of 53mmm for this amount of subsidence
bull Isolated cohesive backfill surrounding pillars of low wh ratio is predicted to be effective in confining the pillar and increasing peak pillar strength and panel stability Isolated non-cohesive backfill without barriers could not be analysed in this numerical model as backfill lsquoflowsrsquo and numerical stability could not be achieved
bull Stress transfer in the immediate roof sandstone unit (above the coal roof) is predicted to extend approximately 80m beyond the limits of the collapsed panel This is in reasonable agreement with theoretical studies
Figure A-49 Duncan St modelled panel with outline of adjacent modelled panel location of representative open hole CP1 file named ldquoAppendix B2 open hole logsrdquo located in directory ldquoCollingwood Park Subsidence 2B Collingwood Park Mine Subsidence Reports 1988 Eventsrdquo and mine subsidence limit contour
A63 Model properties
Overburden geology is based on borehole CP1 the most complete interpreted available hole drilled in 1988 by Queensland Department of Mines Figure A-50 To include this in the numerical model lithological units had to be coalesced into major units of sandstone (SS) siltstone (SL) mudstone (MS) weathered units and coal Figure A-51
Rock properties for the overburden were determined from a 2D parametric study whereby the UCS of all units was scaled to achieve pillar and overburden failure at 8m mining height Table A-12 and Table A-13
Unit top depth thickness unit thickness
thickness scaled
thickness in model
000 1200 1200 1046 1000 1200 700 SS 700 610 600 1900 600 MS 600 523 500 2500 1100 SS 1300 1133 1100 3600 200 SS 000 3800 100 SL 1000 871 900 3900 100 MS 000 4000 500 000 4500 100 000 4600 100 000 4700 100 000 4800 100 SS 400 349 400 4900 300 SS 000 5200 300 SL 700 610 600 5500 100 MS 000 5600 300 MS 000 5900 400 SS 500 436 400 6300 100 SS 000 6400 400 SL SS 900 784 800 6800 100 SL MS 000 6900 100 SL 000 7000 200 SL MS 000 7200 100 SS SL 000 7300 200 SS 1000 871 900 7500 200 SL 000 7700 200 SS SL 000 7900 200 SS 000 8100 100 SL 000 8200 100 SS 000 8300 200 SL 4350 3790 3800 8500 200 SL 000 8700 100 SS 000 8800 100 COAL 000 8900 200 000 9100 100 000 9200 100 000 9300 100 SL MS 000 9400 300 SL MS SS 000 9700 100 000 9800 100 SL MS 000 9900 400 SL SS 000 10300 200 SS MS 000 10500 100 SL MS 000 10600 200 SL MS SS 000 10800 100 000 10900 400 SL MS 000 11300 400 SL SS 000 11700 100 SS MS 000 11800 300 000 12100 400 SL SS 000
SL MS MS SS
MS
MS
SL
MS SS SL SS SL MS MS
weathering
SL MS SS
12500 150 000 12650 450 850 741 750 13100 400 SS 000 13500 100 MS SL
SS SL 960 837 500
13600 200 13800 100 SS 13900 200 14100 360
SS SL SL MS
14460 470 COAL MINING SEAM 600 14930 FLOOR
Figure A-50 Inferred geology from representative borelog CP1 used in numerical model
weathering SS
Unit Depth floor below surface Num elements Unit Unit name in model surface 0
10 3 16 weather 16 2 15 ss6
MS 21 2 14 ms2 SS 32 4 13 ss5 SL 41 3 12 sl3 SS 45 1 11 ss4 MS 51 2 10 ms1 SS 55 1 9 ss3 SL 63 3 8 sl2 SS 72 3 7 ss2 SL 1055 11 6 sl1 SS 113 4 5 ss1 SEAMR 118 3 4 seamr SEAM 124 3 3 seam FLOOR1 134 3 2 floor2 FLOOR2 250 10 1 floor1
Figure A-51 Coalesced units for numerical model based on hole CP1
Insitu stress is unknown at the site so a horizontal to vertical stress gradient of 15 has been assumed Given that the extensive workings were undertaken 20 to 30 years before the 2008 event horizontal stresses in the mining seam would be considerably disturbed from the pre-mining conditions
Table A-12 Rock properties for softening mohr coloumb material Softening rates of coal friction angle is 6 degrees over 2 plastic strain and total loss of cohesion over 24 plastic strain in coal and over 1 in other rocks Determined from pillar studies
E
nu Bulk Shear UCS UCS Phi Dilation Coh Tensile Strength (GPa) (GPa) (GPa) (MPa) scaled angle (MPa) (MPa)
SS 75 02 4167 3125 50 125 40 2 291 125
SL 4 025 2667 1600 30 75 35 2 195 075
MS 3 025 2000 1200 15 375 32 2 104 0375
Weathering 1 025 0667 0400 8 2 32 2 055 02
COAL 11 03 0917 0423 12 3 36 6 076 003
FLOOR1 4 025 2667 1600 30 75 38 2 183 075
FLOOR2 4 025 2667 1600 30 75 38 2 183 075
Table A-13 Ubiquitous joint properties Softening rate of ubiquitous joints total loss of cohesion over 1 plastic strain Determined from 2D overburden studies
Cohesion Ubiq joint cohesion Tensile Strength Ubiq joint tensile strength Ubiq joint (MPa) (MPa) (MPa) (MPa) friction
SS 291 00029144 125 0000125 15 SL 195 00019521 075 0000075 15 MS 104 00010393 0375 00000375 15 Weathering 055 00005543 02 000002 15 COAL 076 003 FLOOR1 183 - 075 - -FLOOR2 183 075 -
A64 Results from 3D Duncan St model
Factor of Safety estimated at 6m and 9m mining heights
Figure A-52 Pillar FoS calculated for 6m mining height by analytical method with strength by eq(3) and pillar stress by pressure arch theory Minimum value is 131 suggesting a 5 in 100 probability of failure however not sufficient to fail in the numerical model (that requires FoS lt 10)
Figure A-53 Pillar FoS calculated analytically for 9m mining height (eq(3) and PA theory) Minimum value is 099 suggesting a probability of failure of 5 in 10 although in the numerical model failure should occur
Yield on plane for 6m and 9m mining heights
Figure A-54 Location of section plane used for section view in following figures
Figure A-55 Yield on section plane for 6m mining height No significant damage or displacement observed
Figure A-56 Yield on section plane for 9m mining height no backfill
Figure A-57 Displacement on section plane for 9m mining height no backfill Maximum displacement is approximately 15m at surface
Results on horizontal plane at mid-pillar height
Figure A-58 Yield at mid-pillar height 9m mining height Blue elements evident in some pillars indicating pillar core remains intact
Figure A-59 Predicted vertical stress at mid pillar height 9m mining height Insitu stress is 30MPa Unyielded pillars and pillars hardening after yield are transferring vertical load while yielded pillars carry little load Extent of abutment stress increase is approximately 80m
Figure A-60 Roof vertical stress predicted by numerical model with 9m mining height Contour increments are 01MPa Base vertical stress is approximately 27MPa Abutment stress influence distance is approximately 80m
Results on surface after panel failure at 9m mining height
Figure A-61 Surface subsidence as predicted with numerical model with 9m mining height and total subsidence along Duncan St to McLaughlin St as monitored to October 09 Maximum surface subsidence predicted as 196m Outline of numerical modelling pillars and dotted contour of observed subsidence limit
A65 Duncan St model ndash backfill effectiveness
The Duncan St 3D model has been analysed with full and targeted 1MPa cohesive and non-cohesive backfill placed in roadways Roadway fill of 66 is analysed for the 1MPa cohesive mixture and 83 roadway fill for the non-cohesive mix
Results are presented in the following figures and figure captions
Factor of Safety increase from cohesive backfill
Analysis of the Duncan St model with 9m mining height is undertaken to estimate the FoS increase from backfill By increasing gravity in increments the backfill strength improvement is quantified With 83 roadway fill of 1MPa cohesive backfill the overburden and pillar tops (ie region of pillar above height of backfill) fails with gravity of 17ms2 suggesting the pillars with FoS of approximately 10 has increased FoS to 17 by backfilling adjacent roadways
Figure A-62 Gravity of 16g with 83 1MPa cohesive backfill showing no significant yield
Figure A-63 Gravity of 17g with 83 1MPa cohesive backfill predicting failure of pillar tops and overburden and collapse of roadway void space
FoS increase with non-cohesive backfill
With non-cohesive backfill pillars yielded due to lack of confinement upon initial placement of backfill in roadways but overburden remain stable and void space above backfill remained open Overburden remained stable at gravity increase to 11ms2 Figure A-64 but collapsed at gravity increase of 12ms2 Figure A-65
Figure A-64 Gravity of 11g with 83 non-cohesive backfill predicting pillar yield but overburden stability
Figure A-65 Gravity of 12g with 83 non-cohesive backfill predicting failure of pillars and overburden and collapse of roadway void space Maximum surface subsidence is 055m which includes the compressive effect of the 12g gravity increase
Placement of targeted backfill
A model is analysed with cohesive backfill totally surrounding two pillars with low predicted FoS The two pillars are predicted to have a FoS of 099 and 100 left to right viewed from above at a 9m mining height Backfill extends to an extent of 5m to 10m from the pillar and is 6m high in the roadways Gravity increase to 12g required to fail panel suggesting panel strength increase is approximately 20 from targeted backfill Predicted surface subsidence 125m (excessive mesh deformation stops analysis equilibrated stage may have higher surface subsidence)
Figure A-66 Duncan St model with 66 roadway fill of 1MPa cohesive backfill surrounding two pillars with low FoS at 9m mining height
Figure A-67 Predicted yield at mid pillar height of 9m pillars with 66 roadway fill of 1MPa cohesive backfill Note intact core (blue) for targeted pillars
Figure A-68 Pillar strength at 9m mining height Strength WITHOUT BACKFILL of northern focus pillar selected for targeted backfill is 527MPa and southern focus pillar is 526MPa
Figure A-69 Vertical stress in pillars targeted for partial backfill placement Stress calculated at equilibrium of elasto-plastic analysis WITHOUT BACKFILL Stress in northern focus pillar is 54MPa and in southern focus pillar is 513 FoS of NFP=52754 = 0975 FoS of SFP=526513 = 1025
Non-cohesive backfill in targeted placement study
A model with targeted placement of non-cohesive backfill was attempted but could not be satisfactorily converged since backfill lsquoflowsrsquo and inter-penetrates elements resulting in numerical instabilities
Forcing pillars to fail to examine resultant subsidence
To examine the extent of surface subsidence if backfilled pillars fail the numerical model with 9m mining height and 83 roadway fill of 1MPa cohesive backfill is analysed with a 90 reduction in coal pillar strength properties
With 9m mining height and 83 roadway fill of cohesive backfill void space remaining is 15m and the numerical model predicts failure of pillars and overburden results in approximately 02m surface subsidence
Figure A-70 Surface subsidence predicted by numerical model when pillars forced to fail with 83 roadway fill Contour interval is 01m with maximum subsidence predicted as 022m
Figure A-71 Surface strain in east-west direction when pillars forced to fail resulting 022m surface subsidence Maximum strain is 5mmm and contour interval is 1mmm
Figure A-72 Surface strain in north-south direction when pillars forced to fail resulting 022m surface subsidence Maximum strain is 3mmm and contour interval is 1mmm
Figure A-73 Tilt in east-west direction Units are mmm and intervals are 1mmm maximum tilt is 7mmm
Figure A-74 Tilt in north-south direction Units are mmm and intervals are 1mmm maximum tilt is 5mmm
To highlight the need for adequate fill the model with 66 roadway fill is analysed with the pillars forced to fail with a 50 reduction in pillar strength Void space over the backfill in the roadways is 30m Modelling predicts maximum surface subsidence of 068m
Figure A-75 Surface subsidence when pillars forced to fail with 66 roadway fill Roadway void space is 30m with the model predicting 068m surface subsidence Contour interval is 01m
A66 Numerical model of adjacent high risk area
Numerical model and panel stability
A numerical model of the region adjacent to Duncan St incorporating 76 pillars is analysed at 9m mining height Overburden strata strengths and depth-of-cover is consistent with Duncan St model
The main objective of this model is to estimate the strength difference between the two mining panels west and east of the Waterline fault Given uniform mining height and depth-of-cover the strength difference will be due to the pillar configuration and boundary conditions
At 9m mining height the model is predicted to be essentially stable although 9 pillars are predicted to be fully yielded at mid-pillar height
With gravity increase of 10 the model remains stable At 20 increase in gravity the model is predicted to fail with significant overburden yield
It is concluded therefore that the panel to the east of Waterline fault is 20 stronger than the panel to the west
Figure A-76 Location of numerical model 2 together with surface subsidence contours from 1988 and 2008 events and seam level eastern boundary of failure predicted from 3D seismic
Figure A-77 Yield on section at mid-height for 9m mining height
Figure A-78 Rockmass yield on vertical section trending east-west at mid-point of model Note overburden is largly intact with no extensive collapse
Figure A-79 Pillars predicted to have failed from Numerical model 2 with surface subsidence contours and inferred eastern limit of failed zone at seam level
By a 20 increase in gravity the model is forced to fail resulting in predicted 13m surface subsidence that includes increased overburden compression from increased gravitational component Excessive deformation and numerical instability stopped the model true surface deformation may be higher
Figure A-80 Adjacent model with 9m mining height Predicted surface subsidence after 20 increase in gravity Model predicts 13m surface subsidence
Figure A-81 Adjacent model with 9m mining height and 20 gravity increase Predicted failure at mid-pillar height Note intact core in southern pillars which appear stronger from unmined adjacent coal and larger general pillar size
A7 CONCLUSIONS
A71 Current knowledge on coal pillars behaviour
bull The strength based factor-of-safety approach is well established in coal pillar design Factors of safety for coal pillars required to provide medium to long term stability should be greater than 16 [Galvin 2006 Hill 2005]
bull Coal pillar strength has been the subject of rigorous research since at least the 1960rsquos and the Salamon amp Munro formula has been applied in the design of over a million coal pillars in South Africa alone [Mark 1999 Salamon 1998] Strength formula derivations from the UNSW are established in Australia
bull Coal pillar load calculation traditionally relies on tributary area theory which is a conservative approach suitable for pillar design
bull Tributary area conditions are NOT satisfied at Collingwood Park pillars are irregular in size and shape there is large areas of unmined coal and the seam has significant dip
bull This last point is important as analytical methods hold the only hope of evaluating every pillar at Westfalen No 3 Colliery The numerical model of Duncan St analyses 46 pillars and requires significant computational resources the entire Colliery has in excess of 700 pillars and cannot be analysed by the same methods in its entirety by current computer codes in a reasonable time frame
bull Likewise it is not satisfactory to draw conclusions on panel stability from limited analysis of representative groupings of pillars because of the variability in size shape mining height and cover depth over the mining area
bull To overcome the limitations of tributary area theory for the back-analysis of an irregular pillar layout a novel approach for calculating loads based on pressure arch theory has been developed subjected to international peer review and published in the International Journal of Rock Mechanics and Mining Sciences In summary each pillar is individually examined and the pillar area circumference and centroid are calculated At the pillar centroid the cover depth and mining height are determined An influence zone based on a circular area with radius defined by the depth-dependent load transfer distance Within this area the local extraction ratio is calculated This approach has found to satisfactorily account for pillars of arbitrary shape in irregular layout with variable cover depth
bull This allows a FoS to be determined for the over 700 pillars of Westfalen No 3 with reasonable computer resources
A72 Typical pillar strength effects
Width to height ratio
bull Pillars at Westfalen No 3 have typical effective width from 20m to 50m While mining height is uncertain it is believed to range from 6m to 10m With these dimensions pillar wh ratio ranges from 20 to 83
bull At the lower limit of wh=20 geological influences will start to determine pillar strength [Galvin 2006] From wh in the range gt 20 to 40 the formula of Salamon and Munro or UNSW extensions could be expected to estimate pillar strength with the squat pillar version of these formula applicable for whgt40 [Galvin 2006 Salamon 1998 Galvin 1999]
bull The squat pillar extensions were developed since the standard formulas were found to underestimate pillar strength at whgt4 At Westfalen No 3 colliery although there are a number of pillars of whgt4 many of these are irregular in shape often long and relatively narrow (30m ndash 40m) Given this and the need to automate the assessment of every pillar the squat pillar strength formula is not utilised This approach is conservative
Pillar shape effects
bull Many pillars at Westfalen No 3 are skewed of diamond shape with acute internal angle from 50 to 90 degrees Hydraulic radius simile accounts for pillar shape by an effective width defined by 4AC while the UNSW has a parrellopid formula that for pillars of equal side length results in an effective width equivalent to this
bull In a study of pillar shapes common to Westfalen No 3 colliery the hydraulic radius analogy for estimation of effective width is found adequate with errors less than 6 for considered sizes and shapes
Post peak strength
bull Numerical studies and the work of Das in Indian coal fields highlights the changing post peak behaviour with increasing width to height ratiorsquos It has been determined that when wh exceeds approximately 5 pillars start to harden post peak When whlt3 pillars display limited if any post peak strength
bull The significance of this effect will be in the manner that pillars shed load to adjacent pillars In an array of pillars of similar dimensions pillars with a low wh ratio could be expected to shed load in a sudden more catastrophic manner than those that harden post peak Such sudden pillar failure is referred in the literature as catastrophic cascading or rolling pillar failure and has been responsible for damaging wind blasts and significant loss of life over the years
bull In an irregular pillar layout such as Westfalen No 3 with variable wh ratio significant barrier pillars and regions of unmined coal sudden multiple panel collapse would be expected to be less likely
bull The analytical approach developed for assessing pillar load accounts for load shed from a failed pillars to pillars within the zone of influence of that pillar
Specific details of this approach are discussed in the hazard map and risk assessment chapter of this report
Backfill effect
bull Numerical studies on a cohesive and non-cohesive backfill suggest that pillar strength is increased with increasing height of fill Studies suggest a 1MPa cohesive backfill may increase pillar strength by approximately 10 at 40 roadway fill for wh=33 and 18 at 40 roadway fill at wh=22 At 80 roadway fill pillar strength increases are predicted to exceed 50 Percentage strength increases are predicted to be greater with lower wh ratiorsquos
bull Studies of a non-cohesive backfill suggest at 80 roadway fill pillar strength increases are approximately 25
bull With both backfill types pillar strength is predicted to increases dramatically above 80 roadway fill and pillars are predicted to exhibit post-peak hardening behaviour
For example in the Duncan St area a pillar of effective width 20m will have a FoS of approximately 118 at mining height of 10m without backfill A 50 strength increase from 1MPa cohesive backfill at 80 roadway fill will raise the FoS to approximately 177 and reduce the probability of instability from approximately 1 in 10 to less than 1 in 1000
With 80 roadway fill of a non-cohesive backfill the same Duncan St pillar FoS will increase to approximately 147 and the probability of instability reduce to less than 1 in 100
bull Backfill is likely to reduce the rate of time dependent pillar strength degradation by reducing pillar spalling due to the erosive effects over time of high stress and exposure of the pillar surface to the atmosphere
bull In addition backfill is likely to benefit pillar stability by limiting the void available to the roof to fall into Roof falls particularly at roadway intersections may be present By reducing the roadway volume backfill will eventually support the roof when the bulking effect of roof falls fills the remaining roadway voids space Beyond this summary time dependent issues of backfill have not been considered
roadway
fill
Non-cohesive backfill
(7m mining height width 20m) strength increase
05 MPa cohesive backfill
(7m mining height width 20m)
strength increase
10 MPa cohesive backfill
(7m mining height width 20m)
strength increase
60 135 388 437
70 183 432 597
80
90
208
291
474
572
698
957
A73 Duncan St numerical model
bull In the Duncan St subsidence region approximately 46 pillars are surrounded by unmined coal to the west a large pillar containing the Waterline fault to the east and larger pillars to the south and north
bull At 6m mining height pillar minimum FoS for these 46 pillars is calculated at 131 with Pressure Arch theory and UNSW strength formula At 9m mining height minimum FoS is calculated as 099
bull Pillar probability of failure for FoS calculated by the UNSW eq(2) is given in [Galvin 2006] as
Table A-14 Factor of safety failure probabilities for UNSW pillar strength formula (after Galvin 2006)
Safety Factor Probability of pillar failure
087 8 10
100 5 10
122 1 10
13 5 100
138 2 100
144 1 100
163 1 1000
179 1 10000
195 1 100000
211 1 1000000
bull From Table A-14 at 6m mining height there is a 1 in 20 probability of instability and at 9m a 1 in 2 probability The variability in the database of failed and unfailed pillars from which eq (1) to eq (3) are derived is responsible for these probabilities Our numerical model should always predict failure if the FoS is less than 10 and always predict stability with FoS gt 10 since no such variability in geotechnical properties or conditions is used
bull While our numerical model predicts no pillar failure at 6m and pillar failure at 9m in reality there remains approximately a 1 in 20 chance of failure at 6m mining height If one pillar was to fail load transferred to adjacent pillars would reduce these adjacent pillars FoS and may well lead to the pillar failure and resultant subsidence observed at Duncan St
bull Based on the numerical results obtained using two mining heights the pillar and overburden failure is in line with analytical predictions from Pressure Arch theory and UNSW pillar strength calculation
bull Surface subsidence predicted from the 9m mining height numerical model is 196m While this value is in general agreement with monitoring data the model is not sufficiently calibrated since the real mining height in the region is unknown to be able to confidently predict final subsidence strains and tilts
bull With 1MPa cohesive backfill at a fill ratio of 83 the predicted strength increase is 70 With non-cohesive backfill at the same fill ratio the strength increase is 20 these values are in agreement with single pillar studies
bull Abutment stresses in the immediate roof sandstone unit (above the coal roof) are predicted to extend approximately 80m beyond the limits of the model This is in reasonable agreement with twice the load transfer distance of 64m (at 124m depth-of-cover) used to define a pillars zone of influence (the ZI also includes half pillar width ie 74m for 20m pillar)
A74 Numerical model of adjacent region
bull A numerical model of the region immediately to the east of the Duncan St failure region is constructed with 76 pillars
bull At 9m mining height the model predicts failure of 9 pillars but no significant overburden failure The model remains stable in general
bull With a 20 increase in gravity the model is predicted to fail
bull Numerical modelling results suggest the region to the east of the Waterline barrier pillar is stronger by approximately 20 than the subsided region to the west of the barrier pillar
bull Predicted surface subsidence (including compressive effects from gravity increase) is 13m all though numerical instabilities halt the model and true surface subsidence is likely to be higher
bull Inspection of yield at mid-pillar height suggests the southern pillars in the model have intact core when pillars in the middle of the region are failed in their entire volume In reality the southern region of this panel have greater depth-of-cover therefore higher pillar stresses and thus lower FoS in these southern pillars

2
4
6
8
10
12
14
2
4
6
8
14
12
Ave
rage
str
ess
of c
oal p
illar
(MPa
) A
vera
ge s
tres
s of
coa
l pill
ar (M
Pa)
0
000 2220 2780 3890 5000 6110 7220 8330 8890
0
000 2220 2780 3890 5000 6110 7220 8330 8890
Ave
rage
str
ess
of c
oal p
illar
(MPa
)
10
8
6
4
2
0000 0005 0010 0015 0020 0025 0030 0035 0040 0000 0005 0010 0015 0020 0025 0030 0035 0040
Average axial strain of coal pillar Average axial strain of coal pillar
Figure A-43 Post peak pillar strength with increasing backfill 9m high pillar (wh=22) with cohesive backfill on left non-cohesive backfill on right
12 12
0
000 2500
3000 4000
5000 6000
7000 8000
9000
0
000
2500
3000
4000
5000
6000
7000
8000
9000
10
Ave
rage
str
ess
of c
oal p
illar
(MPa
) 10
8
6
4
2
0000 0005 0010 0015 0020 0025 0030 0035 0000 0005 0010 0015 0020 0025 0030 0035
Average axial strain of coal pillar Average axial strain of coal pillar
Figure A-44 Post peak pillar strength with increasing backfill 10m high pillar (wh=20) with cohesive backfill on left non-cohesive backfill on right
The amount of backfill to achieve the transition between strain softening and hardening is presented in Table A-9 for all mining height The values in this table are estimated from the stress-strain curve analysed to 35 of strain and are depended on the backfill increment which is in turn dependent on the ratio of mining height to the calibrated element size 05m
Table A-9 Percentage of roadway backfill that leads to a transition from strain softening to hardening
Pillar height Non-cohesive 05MPa Cohesive 10MPa Cohesive backfill backfill backfill
5m 300 200 200
6m 500 417 333
7m 571 500 429
8m 625 625 500
9m 722 722 611
10m 800 800 700
The modelling results suggest that the average axial stress of coal pillar increases with compression until peak stress is reached In the post-failure region pillar stress is reduced as strain increases for all models without backfill All the model results predict that there would be a change to strain hardening behaviour as percentage of backfill increases For example this transition point is 333 for 10 MPa cohesive backfill while 50 for non-cohesive backfill with 6m mining height as shown in Table A-9 It can also be seen from Table A-9 that tall pillars need more backfill than squat pillars to achieve the change from strain softening to hardening for either cohesive backfill or non-cohesive backfill
A55 Backfill for diamond shaped pillars
A 7m high diamond shaped pillar with 50 degree skew angle is analysed with increasing level of backfill in surrounding roadways On the skewed angle the backfill is constrained with roller boundary conditions normal to the skewed angle to represent symmetry conditions and a 5m wide roadway
Figure A-45 Numerical model of diamond shaped pillar with backfill on left and boundary conditions on right
The predicted strength of a diamond shaped pillar and equivalent square pillar with increasing roadway backfill of both cohesive and non-cohesive models is presented in Figure A-46 and Figure A-47
6
7
8
9
10
11
12
13
0 10
Pilla
r str
engt
h (M
Pa)
20 30 40 50 60 70 80 90 100
Percentage of backfill ()
Skew pillar
Square pillar
0
10
20
30
40
50
60
70
0 10
Incr
ease
of p
illar
str
engt
h (
)
20 30 40 50 60 70 80 90 100
Percentage of backfill ()
Skew pillar
Square pillar
Figure A-46 Predicted pillar strength of diamond and square shaped pillars with increasing percentage of 1MPa cohesive backfill On left is absolute strength and on right is percentage strength increase
6
7
8
9
10
11
0 10
Pilla
r stre
ngth
(MP
a)
20 30 40 50 60 70 80 90 100
Percentage of backfill ()
Skew pillar
Square pillar
0
5
10
15
20
25
30
35
0 10
Incr
ease
of p
illar
str
engt
h (
)
20 30 40 50 60 70 80 90 100
Percentage of backfill ()
Skew pillar
Square pillar
Figure A-47 Predicted pillar strength of diamond and square shaped pillars with increasing percentage of non-cohesive backfill On left is absolute strength and on right is percentage strength increase
A56 Backfill placed after significant pillar yield
A pillar model with 90 non-cohesive backfill placed after yielding of a 7m high pillar is presented in Figure A-48 The percentage of strength increase is given in Table A-10 It is found that the pillar strength increase is lower if the pillar has undergone significant deformation before the placement of backfill It is predicted that 90 backfill results in a strain-hardening pillar behaviour even if the pillar has previously yielded significantly
Ave
rage
stre
ss o
f coa
l pill
ar (M
Pa)
18 without backfill 025 strain 050 strain
14
16
075 strain 100 strain
12 125 strain 150 strain
10 175 strain 200 strain
8
6
4
2
0 0000 0005 0010 0015 0020 0025 0030 0035 0040 0045 0050
Average strain of coal pillar
Figure A-48 Stress strain curves for backfill placed around the pre-strained pillar displaying state of pillar core upon placement of backfill
Table A-10 Pillar strength increase with 90 non-cohesive backfill placed around a pre-strained 7m high square pillar of 20m width
Percentage backfill ()
Strain at placement of non-cohesive backfill ()
Pillar strength (MPa)
Percentage increase in peak
strength ()
Percentage increase in post-peak
strength at 3 strain ()
0 000 7953 000
90 000 10290 2939
90 025 9156 1513
90 050 8965 1272
90 075 8526 720
90 100 7945 26006
90 125 7951 22608
90 150 7951 18917
90 175 7951 15629
90 200 7951 11134
A6 3D MODEL OF DUNCAN ST FAILURE PANEL
A61 Numerical model
A three dimensional model of 46 pillars in the Duncan St subsidence region has been analysed with over burden geology based on hole CP1 and a constant overburden depth of 124m Figure A-49 Figure A-50 and Figure A-51 Uniform mining heights of 6m and 9m have been analysed
Selection of the pillars to be analysed is based on visual inspection of the panel layout and includes pillars bounded by unmined coal to the west the waterline barrier pillar to the east larger pillars to the south and a panel of slightly larger pillars of different orientation to the north
One row of pillars in the middle of this panel trending from north-west to south-east are of smaller dimension than the average and of diamond shape with acute internal angle of approximately 50degrees Being in the approximate middle of the panel close to full tributary area load will be mobilised on this row of pillars and therefore it is believed pillars in this row initiated the 2008 subsidence event
The Duncan Street numerical model has the following objectives
bull Estimation of pillar stresses and FoS for comparison with empirical formula
bull Comparison of backfill response at panel scale with previous single pillar studies
bull Estimation of surface subsidence at given percentage roadway fill
bull Estimation of extent of abutment stresses due to panel failure
A62 Observations from Duncan Street numerical model
bull At 6m mining height the minimum pillar FoS for these 46 pillars is calculated to be 131 using Pressure Arch theory and UNSW strength formula panel failure is not predicted with this mining height by the model At 9m mining height the minimum FoS is calculated as 099 and panel failure is predicted to occur
bull The probability of pillar failure for associated FoS calculated by the UNSW pillar strength formula Eq(2) is given in Galvin 2006 in Table A-11 The relationship was developed for square pillars using the Australian pillar database and tributary area theory and hence theoretically speaking may not directly apply to this study However it can be taken as a general guide
bull From Table A-11 it is seen that there is a 1 in 20 probability of instability at 6m mining height and a 1 in 2 probability at 9m mining height Numerical modelling is however a deterministic approach and it always predicts failure if the FoS is less than 10 and stability if FoS gt 10 since no variation in geotechnical properties or conditions is used
bull Although our numerical models predict no pillar failure at 6m and panel failure at 9m in reality there remains approximately a 1 in 20 chance of failure at 6m mining height If one pillar was to fail load transferred to adjacent pillars would reduce the FoS of these adjacent pillars and could lead to the pillar failure and subsidence as observed at 2008 event region
Table A-11 Factor of safety failure probabilities for UNSW pillar strength formula
(after Galvin 2006)
Safety Factor Probability of pillar failure
087 8 10
100 5 10
122 1 10
130 5 100
138 2 100
144 1 100
163 1 1000
179 1 10000
195 1 100000
211 1 1000000
bull Based on the numerical results obtained using two mining heights the pillar and overburden failure is consistent with analytical predictions from Pressure Arch theory and UNSW pillar strength calculation
bull Surface subsidence predicted from the numerical model with a mining height of 9m is 196m While this value is in approximate agreement with monitoring data (14mshy15m) the model was not sufficiently calibrated since the real mining height in the region is uncertain to be able to confidently predict final subsidence strains and tilts at the site
bull With 1MPa cohesive backfill at a roadway fill ratio of 83 the predicted strength increase is 70 With non-cohesive backfill at the same fill ratio the strength increase is 20 These values are in agreement with the results for single pillars
bull The numerically predicted surface subsidence with 83 roadway fill is 022m Maximum predicted tilt in east-west direction is 7mmm and in north-south direction is 5mmm Analytical formula [Holla amp Barclay 2000] predict maximum tilt of 53mmm for this amount of subsidence
bull Isolated cohesive backfill surrounding pillars of low wh ratio is predicted to be effective in confining the pillar and increasing peak pillar strength and panel stability Isolated non-cohesive backfill without barriers could not be analysed in this numerical model as backfill lsquoflowsrsquo and numerical stability could not be achieved
bull Stress transfer in the immediate roof sandstone unit (above the coal roof) is predicted to extend approximately 80m beyond the limits of the collapsed panel This is in reasonable agreement with theoretical studies
Figure A-49 Duncan St modelled panel with outline of adjacent modelled panel location of representative open hole CP1 file named ldquoAppendix B2 open hole logsrdquo located in directory ldquoCollingwood Park Subsidence 2B Collingwood Park Mine Subsidence Reports 1988 Eventsrdquo and mine subsidence limit contour
A63 Model properties
Overburden geology is based on borehole CP1 the most complete interpreted available hole drilled in 1988 by Queensland Department of Mines Figure A-50 To include this in the numerical model lithological units had to be coalesced into major units of sandstone (SS) siltstone (SL) mudstone (MS) weathered units and coal Figure A-51
Rock properties for the overburden were determined from a 2D parametric study whereby the UCS of all units was scaled to achieve pillar and overburden failure at 8m mining height Table A-12 and Table A-13
Unit top depth thickness unit thickness
thickness scaled
thickness in model
000 1200 1200 1046 1000 1200 700 SS 700 610 600 1900 600 MS 600 523 500 2500 1100 SS 1300 1133 1100 3600 200 SS 000 3800 100 SL 1000 871 900 3900 100 MS 000 4000 500 000 4500 100 000 4600 100 000 4700 100 000 4800 100 SS 400 349 400 4900 300 SS 000 5200 300 SL 700 610 600 5500 100 MS 000 5600 300 MS 000 5900 400 SS 500 436 400 6300 100 SS 000 6400 400 SL SS 900 784 800 6800 100 SL MS 000 6900 100 SL 000 7000 200 SL MS 000 7200 100 SS SL 000 7300 200 SS 1000 871 900 7500 200 SL 000 7700 200 SS SL 000 7900 200 SS 000 8100 100 SL 000 8200 100 SS 000 8300 200 SL 4350 3790 3800 8500 200 SL 000 8700 100 SS 000 8800 100 COAL 000 8900 200 000 9100 100 000 9200 100 000 9300 100 SL MS 000 9400 300 SL MS SS 000 9700 100 000 9800 100 SL MS 000 9900 400 SL SS 000 10300 200 SS MS 000 10500 100 SL MS 000 10600 200 SL MS SS 000 10800 100 000 10900 400 SL MS 000 11300 400 SL SS 000 11700 100 SS MS 000 11800 300 000 12100 400 SL SS 000
SL MS MS SS
MS
MS
SL
MS SS SL SS SL MS MS
weathering
SL MS SS
12500 150 000 12650 450 850 741 750 13100 400 SS 000 13500 100 MS SL
SS SL 960 837 500
13600 200 13800 100 SS 13900 200 14100 360
SS SL SL MS
14460 470 COAL MINING SEAM 600 14930 FLOOR
Figure A-50 Inferred geology from representative borelog CP1 used in numerical model
weathering SS
Unit Depth floor below surface Num elements Unit Unit name in model surface 0
10 3 16 weather 16 2 15 ss6
MS 21 2 14 ms2 SS 32 4 13 ss5 SL 41 3 12 sl3 SS 45 1 11 ss4 MS 51 2 10 ms1 SS 55 1 9 ss3 SL 63 3 8 sl2 SS 72 3 7 ss2 SL 1055 11 6 sl1 SS 113 4 5 ss1 SEAMR 118 3 4 seamr SEAM 124 3 3 seam FLOOR1 134 3 2 floor2 FLOOR2 250 10 1 floor1
Figure A-51 Coalesced units for numerical model based on hole CP1
Insitu stress is unknown at the site so a horizontal to vertical stress gradient of 15 has been assumed Given that the extensive workings were undertaken 20 to 30 years before the 2008 event horizontal stresses in the mining seam would be considerably disturbed from the pre-mining conditions
Table A-12 Rock properties for softening mohr coloumb material Softening rates of coal friction angle is 6 degrees over 2 plastic strain and total loss of cohesion over 24 plastic strain in coal and over 1 in other rocks Determined from pillar studies
E
nu Bulk Shear UCS UCS Phi Dilation Coh Tensile Strength (GPa) (GPa) (GPa) (MPa) scaled angle (MPa) (MPa)
SS 75 02 4167 3125 50 125 40 2 291 125
SL 4 025 2667 1600 30 75 35 2 195 075
MS 3 025 2000 1200 15 375 32 2 104 0375
Weathering 1 025 0667 0400 8 2 32 2 055 02
COAL 11 03 0917 0423 12 3 36 6 076 003
FLOOR1 4 025 2667 1600 30 75 38 2 183 075
FLOOR2 4 025 2667 1600 30 75 38 2 183 075
Table A-13 Ubiquitous joint properties Softening rate of ubiquitous joints total loss of cohesion over 1 plastic strain Determined from 2D overburden studies
Cohesion Ubiq joint cohesion Tensile Strength Ubiq joint tensile strength Ubiq joint (MPa) (MPa) (MPa) (MPa) friction
SS 291 00029144 125 0000125 15 SL 195 00019521 075 0000075 15 MS 104 00010393 0375 00000375 15 Weathering 055 00005543 02 000002 15 COAL 076 003 FLOOR1 183 - 075 - -FLOOR2 183 075 -
A64 Results from 3D Duncan St model
Factor of Safety estimated at 6m and 9m mining heights
Figure A-52 Pillar FoS calculated for 6m mining height by analytical method with strength by eq(3) and pillar stress by pressure arch theory Minimum value is 131 suggesting a 5 in 100 probability of failure however not sufficient to fail in the numerical model (that requires FoS lt 10)
Figure A-53 Pillar FoS calculated analytically for 9m mining height (eq(3) and PA theory) Minimum value is 099 suggesting a probability of failure of 5 in 10 although in the numerical model failure should occur
Yield on plane for 6m and 9m mining heights
Figure A-54 Location of section plane used for section view in following figures
Figure A-55 Yield on section plane for 6m mining height No significant damage or displacement observed
Figure A-56 Yield on section plane for 9m mining height no backfill
Figure A-57 Displacement on section plane for 9m mining height no backfill Maximum displacement is approximately 15m at surface
Results on horizontal plane at mid-pillar height
Figure A-58 Yield at mid-pillar height 9m mining height Blue elements evident in some pillars indicating pillar core remains intact
Figure A-59 Predicted vertical stress at mid pillar height 9m mining height Insitu stress is 30MPa Unyielded pillars and pillars hardening after yield are transferring vertical load while yielded pillars carry little load Extent of abutment stress increase is approximately 80m
Figure A-60 Roof vertical stress predicted by numerical model with 9m mining height Contour increments are 01MPa Base vertical stress is approximately 27MPa Abutment stress influence distance is approximately 80m
Results on surface after panel failure at 9m mining height
Figure A-61 Surface subsidence as predicted with numerical model with 9m mining height and total subsidence along Duncan St to McLaughlin St as monitored to October 09 Maximum surface subsidence predicted as 196m Outline of numerical modelling pillars and dotted contour of observed subsidence limit
A65 Duncan St model ndash backfill effectiveness
The Duncan St 3D model has been analysed with full and targeted 1MPa cohesive and non-cohesive backfill placed in roadways Roadway fill of 66 is analysed for the 1MPa cohesive mixture and 83 roadway fill for the non-cohesive mix
Results are presented in the following figures and figure captions
Factor of Safety increase from cohesive backfill
Analysis of the Duncan St model with 9m mining height is undertaken to estimate the FoS increase from backfill By increasing gravity in increments the backfill strength improvement is quantified With 83 roadway fill of 1MPa cohesive backfill the overburden and pillar tops (ie region of pillar above height of backfill) fails with gravity of 17ms2 suggesting the pillars with FoS of approximately 10 has increased FoS to 17 by backfilling adjacent roadways
Figure A-62 Gravity of 16g with 83 1MPa cohesive backfill showing no significant yield
Figure A-63 Gravity of 17g with 83 1MPa cohesive backfill predicting failure of pillar tops and overburden and collapse of roadway void space
FoS increase with non-cohesive backfill
With non-cohesive backfill pillars yielded due to lack of confinement upon initial placement of backfill in roadways but overburden remain stable and void space above backfill remained open Overburden remained stable at gravity increase to 11ms2 Figure A-64 but collapsed at gravity increase of 12ms2 Figure A-65
Figure A-64 Gravity of 11g with 83 non-cohesive backfill predicting pillar yield but overburden stability
Figure A-65 Gravity of 12g with 83 non-cohesive backfill predicting failure of pillars and overburden and collapse of roadway void space Maximum surface subsidence is 055m which includes the compressive effect of the 12g gravity increase
Placement of targeted backfill
A model is analysed with cohesive backfill totally surrounding two pillars with low predicted FoS The two pillars are predicted to have a FoS of 099 and 100 left to right viewed from above at a 9m mining height Backfill extends to an extent of 5m to 10m from the pillar and is 6m high in the roadways Gravity increase to 12g required to fail panel suggesting panel strength increase is approximately 20 from targeted backfill Predicted surface subsidence 125m (excessive mesh deformation stops analysis equilibrated stage may have higher surface subsidence)
Figure A-66 Duncan St model with 66 roadway fill of 1MPa cohesive backfill surrounding two pillars with low FoS at 9m mining height
Figure A-67 Predicted yield at mid pillar height of 9m pillars with 66 roadway fill of 1MPa cohesive backfill Note intact core (blue) for targeted pillars
Figure A-68 Pillar strength at 9m mining height Strength WITHOUT BACKFILL of northern focus pillar selected for targeted backfill is 527MPa and southern focus pillar is 526MPa
Figure A-69 Vertical stress in pillars targeted for partial backfill placement Stress calculated at equilibrium of elasto-plastic analysis WITHOUT BACKFILL Stress in northern focus pillar is 54MPa and in southern focus pillar is 513 FoS of NFP=52754 = 0975 FoS of SFP=526513 = 1025
Non-cohesive backfill in targeted placement study
A model with targeted placement of non-cohesive backfill was attempted but could not be satisfactorily converged since backfill lsquoflowsrsquo and inter-penetrates elements resulting in numerical instabilities
Forcing pillars to fail to examine resultant subsidence
To examine the extent of surface subsidence if backfilled pillars fail the numerical model with 9m mining height and 83 roadway fill of 1MPa cohesive backfill is analysed with a 90 reduction in coal pillar strength properties
With 9m mining height and 83 roadway fill of cohesive backfill void space remaining is 15m and the numerical model predicts failure of pillars and overburden results in approximately 02m surface subsidence
Figure A-70 Surface subsidence predicted by numerical model when pillars forced to fail with 83 roadway fill Contour interval is 01m with maximum subsidence predicted as 022m
Figure A-71 Surface strain in east-west direction when pillars forced to fail resulting 022m surface subsidence Maximum strain is 5mmm and contour interval is 1mmm
Figure A-72 Surface strain in north-south direction when pillars forced to fail resulting 022m surface subsidence Maximum strain is 3mmm and contour interval is 1mmm
Figure A-73 Tilt in east-west direction Units are mmm and intervals are 1mmm maximum tilt is 7mmm
Figure A-74 Tilt in north-south direction Units are mmm and intervals are 1mmm maximum tilt is 5mmm
To highlight the need for adequate fill the model with 66 roadway fill is analysed with the pillars forced to fail with a 50 reduction in pillar strength Void space over the backfill in the roadways is 30m Modelling predicts maximum surface subsidence of 068m
Figure A-75 Surface subsidence when pillars forced to fail with 66 roadway fill Roadway void space is 30m with the model predicting 068m surface subsidence Contour interval is 01m
A66 Numerical model of adjacent high risk area
Numerical model and panel stability
A numerical model of the region adjacent to Duncan St incorporating 76 pillars is analysed at 9m mining height Overburden strata strengths and depth-of-cover is consistent with Duncan St model
The main objective of this model is to estimate the strength difference between the two mining panels west and east of the Waterline fault Given uniform mining height and depth-of-cover the strength difference will be due to the pillar configuration and boundary conditions
At 9m mining height the model is predicted to be essentially stable although 9 pillars are predicted to be fully yielded at mid-pillar height
With gravity increase of 10 the model remains stable At 20 increase in gravity the model is predicted to fail with significant overburden yield
It is concluded therefore that the panel to the east of Waterline fault is 20 stronger than the panel to the west
Figure A-76 Location of numerical model 2 together with surface subsidence contours from 1988 and 2008 events and seam level eastern boundary of failure predicted from 3D seismic
Figure A-77 Yield on section at mid-height for 9m mining height
Figure A-78 Rockmass yield on vertical section trending east-west at mid-point of model Note overburden is largly intact with no extensive collapse
Figure A-79 Pillars predicted to have failed from Numerical model 2 with surface subsidence contours and inferred eastern limit of failed zone at seam level
By a 20 increase in gravity the model is forced to fail resulting in predicted 13m surface subsidence that includes increased overburden compression from increased gravitational component Excessive deformation and numerical instability stopped the model true surface deformation may be higher
Figure A-80 Adjacent model with 9m mining height Predicted surface subsidence after 20 increase in gravity Model predicts 13m surface subsidence
Figure A-81 Adjacent model with 9m mining height and 20 gravity increase Predicted failure at mid-pillar height Note intact core in southern pillars which appear stronger from unmined adjacent coal and larger general pillar size
A7 CONCLUSIONS
A71 Current knowledge on coal pillars behaviour
bull The strength based factor-of-safety approach is well established in coal pillar design Factors of safety for coal pillars required to provide medium to long term stability should be greater than 16 [Galvin 2006 Hill 2005]
bull Coal pillar strength has been the subject of rigorous research since at least the 1960rsquos and the Salamon amp Munro formula has been applied in the design of over a million coal pillars in South Africa alone [Mark 1999 Salamon 1998] Strength formula derivations from the UNSW are established in Australia
bull Coal pillar load calculation traditionally relies on tributary area theory which is a conservative approach suitable for pillar design
bull Tributary area conditions are NOT satisfied at Collingwood Park pillars are irregular in size and shape there is large areas of unmined coal and the seam has significant dip
bull This last point is important as analytical methods hold the only hope of evaluating every pillar at Westfalen No 3 Colliery The numerical model of Duncan St analyses 46 pillars and requires significant computational resources the entire Colliery has in excess of 700 pillars and cannot be analysed by the same methods in its entirety by current computer codes in a reasonable time frame
bull Likewise it is not satisfactory to draw conclusions on panel stability from limited analysis of representative groupings of pillars because of the variability in size shape mining height and cover depth over the mining area
bull To overcome the limitations of tributary area theory for the back-analysis of an irregular pillar layout a novel approach for calculating loads based on pressure arch theory has been developed subjected to international peer review and published in the International Journal of Rock Mechanics and Mining Sciences In summary each pillar is individually examined and the pillar area circumference and centroid are calculated At the pillar centroid the cover depth and mining height are determined An influence zone based on a circular area with radius defined by the depth-dependent load transfer distance Within this area the local extraction ratio is calculated This approach has found to satisfactorily account for pillars of arbitrary shape in irregular layout with variable cover depth
bull This allows a FoS to be determined for the over 700 pillars of Westfalen No 3 with reasonable computer resources
A72 Typical pillar strength effects
Width to height ratio
bull Pillars at Westfalen No 3 have typical effective width from 20m to 50m While mining height is uncertain it is believed to range from 6m to 10m With these dimensions pillar wh ratio ranges from 20 to 83
bull At the lower limit of wh=20 geological influences will start to determine pillar strength [Galvin 2006] From wh in the range gt 20 to 40 the formula of Salamon and Munro or UNSW extensions could be expected to estimate pillar strength with the squat pillar version of these formula applicable for whgt40 [Galvin 2006 Salamon 1998 Galvin 1999]
bull The squat pillar extensions were developed since the standard formulas were found to underestimate pillar strength at whgt4 At Westfalen No 3 colliery although there are a number of pillars of whgt4 many of these are irregular in shape often long and relatively narrow (30m ndash 40m) Given this and the need to automate the assessment of every pillar the squat pillar strength formula is not utilised This approach is conservative
Pillar shape effects
bull Many pillars at Westfalen No 3 are skewed of diamond shape with acute internal angle from 50 to 90 degrees Hydraulic radius simile accounts for pillar shape by an effective width defined by 4AC while the UNSW has a parrellopid formula that for pillars of equal side length results in an effective width equivalent to this
bull In a study of pillar shapes common to Westfalen No 3 colliery the hydraulic radius analogy for estimation of effective width is found adequate with errors less than 6 for considered sizes and shapes
Post peak strength
bull Numerical studies and the work of Das in Indian coal fields highlights the changing post peak behaviour with increasing width to height ratiorsquos It has been determined that when wh exceeds approximately 5 pillars start to harden post peak When whlt3 pillars display limited if any post peak strength
bull The significance of this effect will be in the manner that pillars shed load to adjacent pillars In an array of pillars of similar dimensions pillars with a low wh ratio could be expected to shed load in a sudden more catastrophic manner than those that harden post peak Such sudden pillar failure is referred in the literature as catastrophic cascading or rolling pillar failure and has been responsible for damaging wind blasts and significant loss of life over the years
bull In an irregular pillar layout such as Westfalen No 3 with variable wh ratio significant barrier pillars and regions of unmined coal sudden multiple panel collapse would be expected to be less likely
bull The analytical approach developed for assessing pillar load accounts for load shed from a failed pillars to pillars within the zone of influence of that pillar
Specific details of this approach are discussed in the hazard map and risk assessment chapter of this report
Backfill effect
bull Numerical studies on a cohesive and non-cohesive backfill suggest that pillar strength is increased with increasing height of fill Studies suggest a 1MPa cohesive backfill may increase pillar strength by approximately 10 at 40 roadway fill for wh=33 and 18 at 40 roadway fill at wh=22 At 80 roadway fill pillar strength increases are predicted to exceed 50 Percentage strength increases are predicted to be greater with lower wh ratiorsquos
bull Studies of a non-cohesive backfill suggest at 80 roadway fill pillar strength increases are approximately 25
bull With both backfill types pillar strength is predicted to increases dramatically above 80 roadway fill and pillars are predicted to exhibit post-peak hardening behaviour
For example in the Duncan St area a pillar of effective width 20m will have a FoS of approximately 118 at mining height of 10m without backfill A 50 strength increase from 1MPa cohesive backfill at 80 roadway fill will raise the FoS to approximately 177 and reduce the probability of instability from approximately 1 in 10 to less than 1 in 1000
With 80 roadway fill of a non-cohesive backfill the same Duncan St pillar FoS will increase to approximately 147 and the probability of instability reduce to less than 1 in 100
bull Backfill is likely to reduce the rate of time dependent pillar strength degradation by reducing pillar spalling due to the erosive effects over time of high stress and exposure of the pillar surface to the atmosphere
bull In addition backfill is likely to benefit pillar stability by limiting the void available to the roof to fall into Roof falls particularly at roadway intersections may be present By reducing the roadway volume backfill will eventually support the roof when the bulking effect of roof falls fills the remaining roadway voids space Beyond this summary time dependent issues of backfill have not been considered
roadway
fill
Non-cohesive backfill
(7m mining height width 20m) strength increase
05 MPa cohesive backfill
(7m mining height width 20m)
strength increase
10 MPa cohesive backfill
(7m mining height width 20m)
strength increase
60 135 388 437
70 183 432 597
80
90
208
291
474
572
698
957
A73 Duncan St numerical model
bull In the Duncan St subsidence region approximately 46 pillars are surrounded by unmined coal to the west a large pillar containing the Waterline fault to the east and larger pillars to the south and north
bull At 6m mining height pillar minimum FoS for these 46 pillars is calculated at 131 with Pressure Arch theory and UNSW strength formula At 9m mining height minimum FoS is calculated as 099
bull Pillar probability of failure for FoS calculated by the UNSW eq(2) is given in [Galvin 2006] as
Table A-14 Factor of safety failure probabilities for UNSW pillar strength formula (after Galvin 2006)
Safety Factor Probability of pillar failure
087 8 10
100 5 10
122 1 10
13 5 100
138 2 100
144 1 100
163 1 1000
179 1 10000
195 1 100000
211 1 1000000
bull From Table A-14 at 6m mining height there is a 1 in 20 probability of instability and at 9m a 1 in 2 probability The variability in the database of failed and unfailed pillars from which eq (1) to eq (3) are derived is responsible for these probabilities Our numerical model should always predict failure if the FoS is less than 10 and always predict stability with FoS gt 10 since no such variability in geotechnical properties or conditions is used
bull While our numerical model predicts no pillar failure at 6m and pillar failure at 9m in reality there remains approximately a 1 in 20 chance of failure at 6m mining height If one pillar was to fail load transferred to adjacent pillars would reduce these adjacent pillars FoS and may well lead to the pillar failure and resultant subsidence observed at Duncan St
bull Based on the numerical results obtained using two mining heights the pillar and overburden failure is in line with analytical predictions from Pressure Arch theory and UNSW pillar strength calculation
bull Surface subsidence predicted from the 9m mining height numerical model is 196m While this value is in general agreement with monitoring data the model is not sufficiently calibrated since the real mining height in the region is unknown to be able to confidently predict final subsidence strains and tilts
bull With 1MPa cohesive backfill at a fill ratio of 83 the predicted strength increase is 70 With non-cohesive backfill at the same fill ratio the strength increase is 20 these values are in agreement with single pillar studies
bull Abutment stresses in the immediate roof sandstone unit (above the coal roof) are predicted to extend approximately 80m beyond the limits of the model This is in reasonable agreement with twice the load transfer distance of 64m (at 124m depth-of-cover) used to define a pillars zone of influence (the ZI also includes half pillar width ie 74m for 20m pillar)
A74 Numerical model of adjacent region
bull A numerical model of the region immediately to the east of the Duncan St failure region is constructed with 76 pillars
bull At 9m mining height the model predicts failure of 9 pillars but no significant overburden failure The model remains stable in general
bull With a 20 increase in gravity the model is predicted to fail
bull Numerical modelling results suggest the region to the east of the Waterline barrier pillar is stronger by approximately 20 than the subsided region to the west of the barrier pillar
bull Predicted surface subsidence (including compressive effects from gravity increase) is 13m all though numerical instabilities halt the model and true surface subsidence is likely to be higher
bull Inspection of yield at mid-pillar height suggests the southern pillars in the model have intact core when pillars in the middle of the region are failed in their entire volume In reality the southern region of this panel have greater depth-of-cover therefore higher pillar stresses and thus lower FoS in these southern pillars
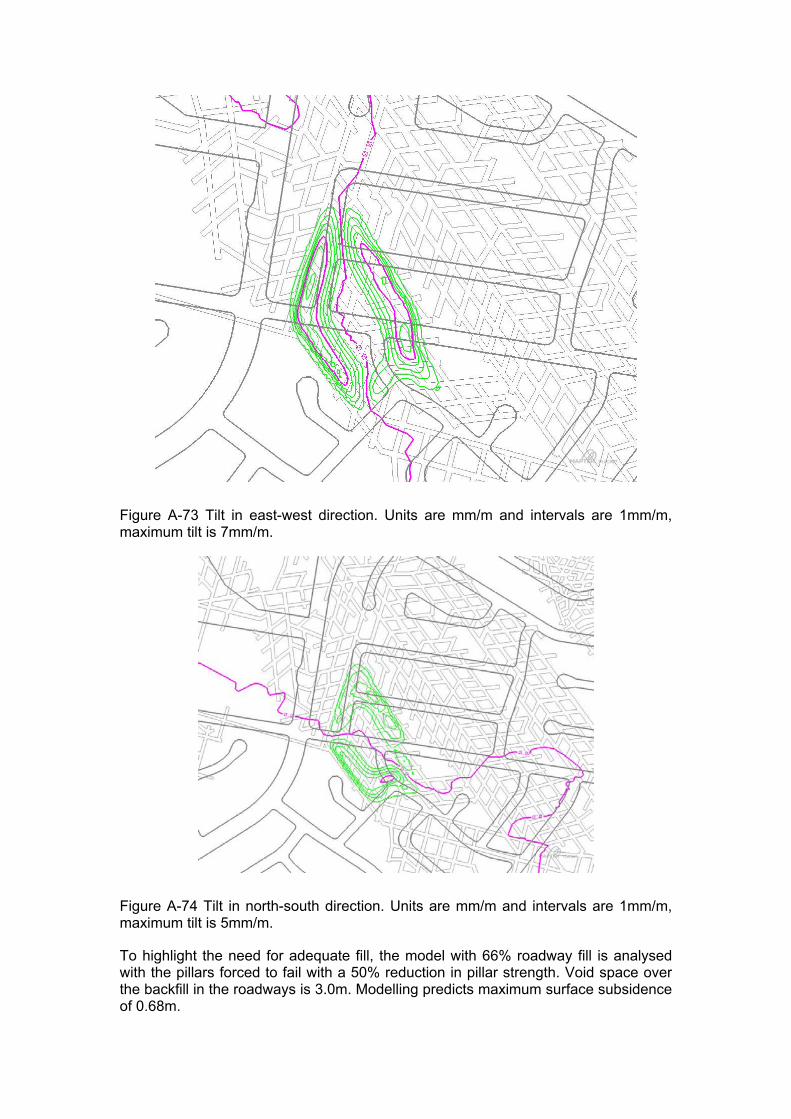
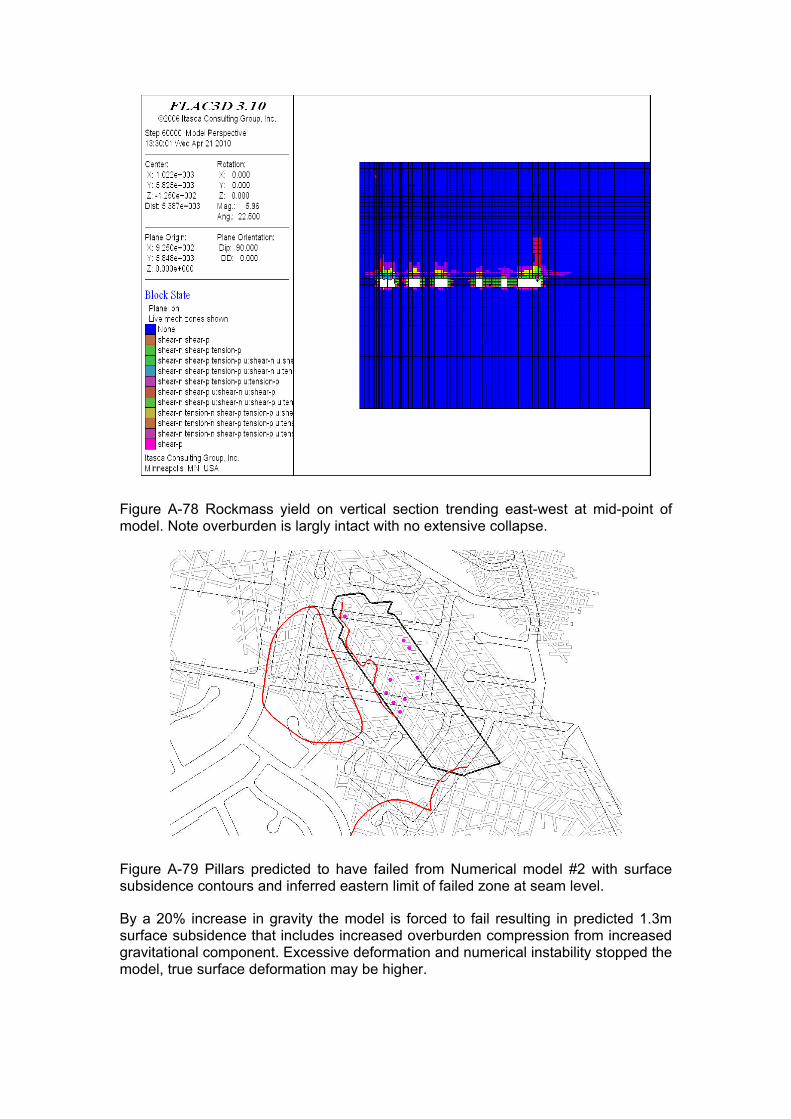