Embed Size (px)
Citation preview
MWH Appendix A – Page 1
Appendix AReferences
AirPhotoUSA, 2005 AirPhotoUSA, LLC. Digital Aerial Photography of the Coachella
Valley.
BBC, 2000 BBC Research and Consulting. Preliminary Economic and
Financial Evaluation of Water Management Plan Alternatives,
2000.
Bechtel, 1967 Bechtel Corporation, Comprehensive Water Resources
Management Plan. Prepared for CVWD. March 1967.
Bookman- Edmonston, 1998 Bookman-Edmonston. Salinity Management Study. Final Report.
Prepared for Metropolitan Water District of Southern California
and U.S. Bureau of Reclamation. 1998.
BV, 2004 Black and Veatch. Historic District Billing Data. Excel, 2004.
CIMIS, 1999 California Irrigation Management Information System. CIMIS
Reference Evapotranspiration Map. http://wwwcimis.water.ca.gov
/cimis/images/etomap.jpg
CIMIS, 2005 California Irrigation Management Information System. CIMIS
data; http://wwwcimis.water.ca .gov/cimis/welcome.jsp. 2005.
Crowley, 2002 Crowley, S. Kerr-McGee. Personal Conversation. 2002.
CTC, 1998 California Turfgrass Culture. Movement of Nitrogen Fertilizer in a
Turfgrass System. Cooperative Extension, University of California
at Riverside. Volume 48, No. 1&2 pg 4. 1998.
CUWCC, 2004 California Urban Water Conservation Council. Memorandum of
Understanding Regarding Urban Water Conservation inCalifornia. March, 2004
CVWD, 1993-2005 Coachella Valley Water District. Annual Review. 1991-93
through 2004-05.
CVWD, 2001 Coachella Valley Water District. Lush and Efficient: A Guide to
Coachella Valley Landscaping. 2001.
CVWD, 2002a Coachella Valley Water District. Coachella Valley Water
Management Plan. 2002.
Appendix A - References
Appendix A -Page 2 MWH
CVWD, 2002b Coachella Valley Water District. Water Management Plan
Program Environmental Impact Report. 2002.
CVWD, 2004a Coachella Valley Water District. Billing Information. Access
Database, 2004.
CVWD, 2004b Coachella Valley Water District. Operational Data Log. Excel,
2004.
CVWD, 2005a Coachella Valley Water District. Annual Review and Water
Quality Report, 2004-2005.
CVWD, 2005b Engineer’s Report on Water Supply and Replenishment
Assessment – Lower Whitewater River Subbasin Area of Benefit –
2005-2006. April 2005.
CVWD, 2005c Engineer’s Report on Water Supply and Replenishment
Assessment – Mission Creek Subbasin Area of Benefit – 2005-
2006. April 2005.
CVWD, 2005d Engineer’s Report on Water Supply and Replenishment
Assessment, Upper Whitewater River Subbasin Area of Benefit –
2005-2006. April 2005
CVWD, 2005e Coachella Valley Water District. Dave Koller, Water
Conservation Coordinator, multiple personal communications.
2005.
CVWD, 2005f Coachella Valley Water District. WRP Data Spreadsheets. 2005.
CVWD, 2005g Cochlea Valley Water District. Mitigated Negative Declaration for
Well 6806-1 and Well 7802-1 Arsenic Removal Systems.
February 2005.
CVWD, 2005h Coachella Valley Water District. Production and Consumption
Data, 2005.
CWC, 2005 California Water Code, 2005.
DOI, 2001 US Department of the Interior. Quality of Colorado Water River
Basin, Progress Report No. 20. January 2001. 2001.
DWR, 1964 Department of Water Resources. Coachella Valley Investigation,
Bulletin 108. 1964.
DWR, 1979 Department of Water Resources. Coachella Valley Area Well
Standards Investigation. 1979.
Appendix A - References
MWH Appendix A – Page 3
DWR, 1993 Department of Water Resources. The California Water Plan
Update. Bulletin 160-93. 1993
DWR, 2005a Department of Water Resources. California Water Plan Update
2005-DRAFT. http://www.waterplan.water.ca.gov/ docs/ cwpu
2005/Vol_3/11-CR/V3PRD11-CR.pdf. 2005.
DWR, 2005b Department of Water Resources. The State Water Project Delivery
Reliability Report 2005. Public Review Draft. November 16,
2005.
Fiske, 2001 Fiske, Gary & Associates. California Urban Water Agencies
Urban Water Conservation Potential. August, 2001.
NCDC, 1999 National Climatic Data Center via: worldclimate.com.
http://www.World climate.com/cgibin/data.pl?ref=N33W116+2200+046635C. 1999.
NOAA, 2002 National Oceanic and Atmospheric Administration.
http://www.nws.noaa. gov/. 2005.
Pillsbury,1948 Pillsbury, A.F. et. Al. Hydrologic Studies in Coachella Valley,
California. University of California-College of Agriculture,
Berkley. 1948.
PSDRCVA, 2005 Palm Springs Desert Resorts Convention and Visitors Authority.
Palm Springs Desert Resorts General Information Handout. 2005.
Riverside County, 2005 Riverside County Transportation and Land Management Agency.
Geographical Information System Parcel Database for Eastern
Riverside County.
RWQCB, 1998 Regional Water Quality Control Board, Colorado River Basin
Region. Watershed Management Initiative Planning DocumentRegion 7 Revised Chapter. May 15, 1998.
RWQCB, 2001 Regional Water Quality Control Board, Colorado River Basin
Region. Water Quality Control Plan, Colorado River Basin
Region.
RWQCB, 2002 Regional Water Quality Control Board, Colorado River Basin
Region. Comment Letter on Quantification Settlement Agreement
PEIR. April 18, 2002.
RWQCB, 2004 Regional Water Quality Control Board, Colorado River Basin
Region. Watershed Management Initiative - Strategic Planning
Chapter. Updated October 2004.
Appendix A - References
Appendix A -Page 4 MWH
SCAG, 1998 Coachella Valley Association of Governments. Coachella Valley
Population, Household, and Employment Projections by CensusTract Excel Spreadsheet. 1998.
SCAG, 2005 Southern California Association of Governments. Population-
Housing-Employment Projection Excel Spreadsheet. 2005.
TWC, 2005 The Weather Channel. Monthly Averages for Palm Springs, CA
http://www.weather.com/activities/travel/businesstraveler/weather/climo-monthly-graph.html?locid=USCA0828&from=search. 2005.
USBR, 2002 US Bureau of Reclamation. Draft Environmental Impact
Statement, Implementation Agreement, Inadvertent Overrun andPayback Policy, and Related Federal Action, 2vols. Filed January
4, 2002
USEPA, 2002 US Environmental Protection Agency. Comment Letter; on
Program EIR for the Quantification Settlement Agreement. 2002.
USGS, 1971 United States Geological Survey. Analog Model of the Ground-
water Basin of the Upper Coachella Valley California. USGS
Open-file Report. January 28, 1971.
Vickman, 2002 Vickman, K. Southern Nevada Water Authority. Personal
communication. 2002.
WDL, 2000 Wheeler’s Desert Letter. Economic Overview of the Coachella
Valley. 2000.
WDL, 2004 Wheeler’s Desert Letter. A Record –Setting Year in 2004. Vol 46,
No. 23. December 2004. 1 pp.
MWH Appendix B - Page 1
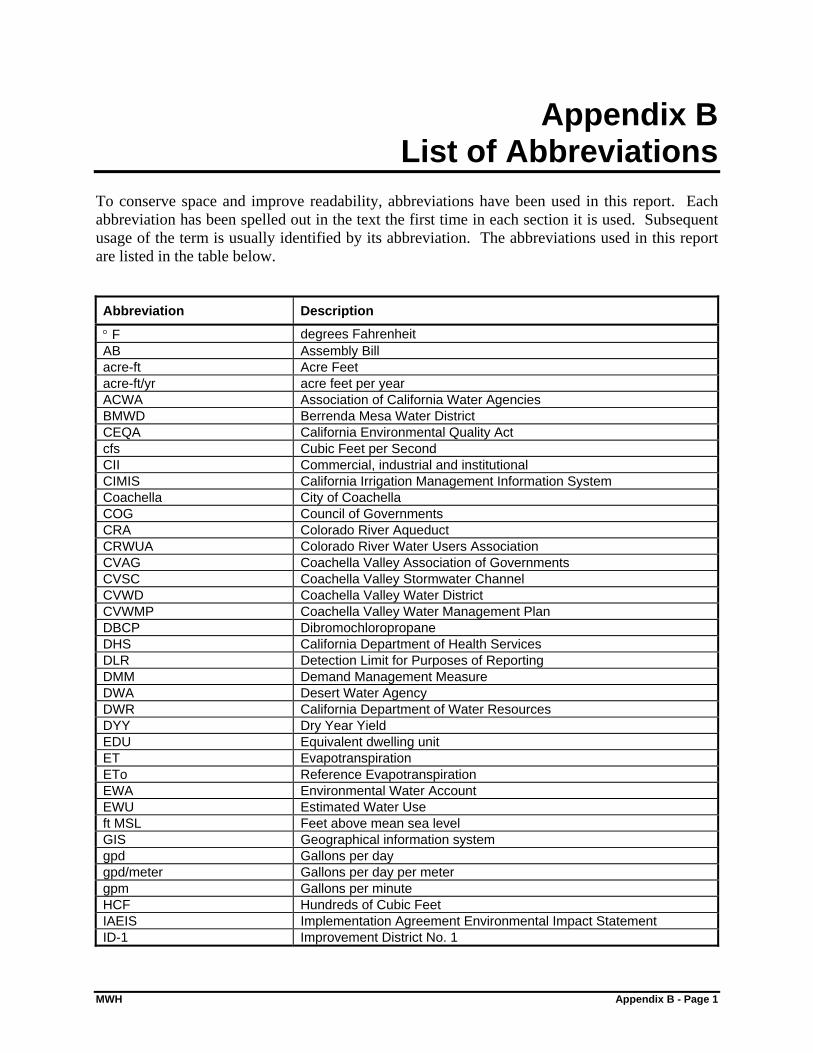
Appendix BList of Abbreviations
To conserve space and improve readability, abbreviations have been used in this report. Eachabbreviation has been spelled out in the text the first time in each section it is used. Subsequentusage of the term is usually identified by its abbreviation. The abbreviations used in this reportare listed in the table below.
Abbreviation Description
° F degrees FahrenheitAB Assembly Billacre-ft Acre Feetacre-ft/yr acre feet per yearACWA Association of California Water AgenciesBMWD Berrenda Mesa Water DistrictCEQA California Environmental Quality Actcfs Cubic Feet per SecondCII Commercial, industrial and institutionalCIMIS California Irrigation Management Information SystemCoachella City of CoachellaCOG Council of GovernmentsCRA Colorado River AqueductCRWUA Colorado River Water Users AssociationCVAG Coachella Valley Association of GovernmentsCVSC Coachella Valley Stormwater ChannelCVWD Coachella Valley Water DistrictCVWMP Coachella Valley Water Management PlanDBCP DibromochloropropaneDHS California Department of Health ServicesDLR Detection Limit for Purposes of ReportingDMM Demand Management MeasureDWA Desert Water AgencyDWR California Department of Water ResourcesDYY Dry Year YieldEDU Equivalent dwelling unitET EvapotranspirationETo Reference EvapotranspirationEWA Environmental Water AccountEWU Estimated Water Useft MSL Feet above mean sea levelGIS Geographical information systemgpd Gallons per daygpd/meter Gallons per day per metergpm Gallons per minuteHCF Hundreds of Cubic FeetIAEIS Implementation Agreement Environmental Impact StatementID-1 Improvement District No. 1
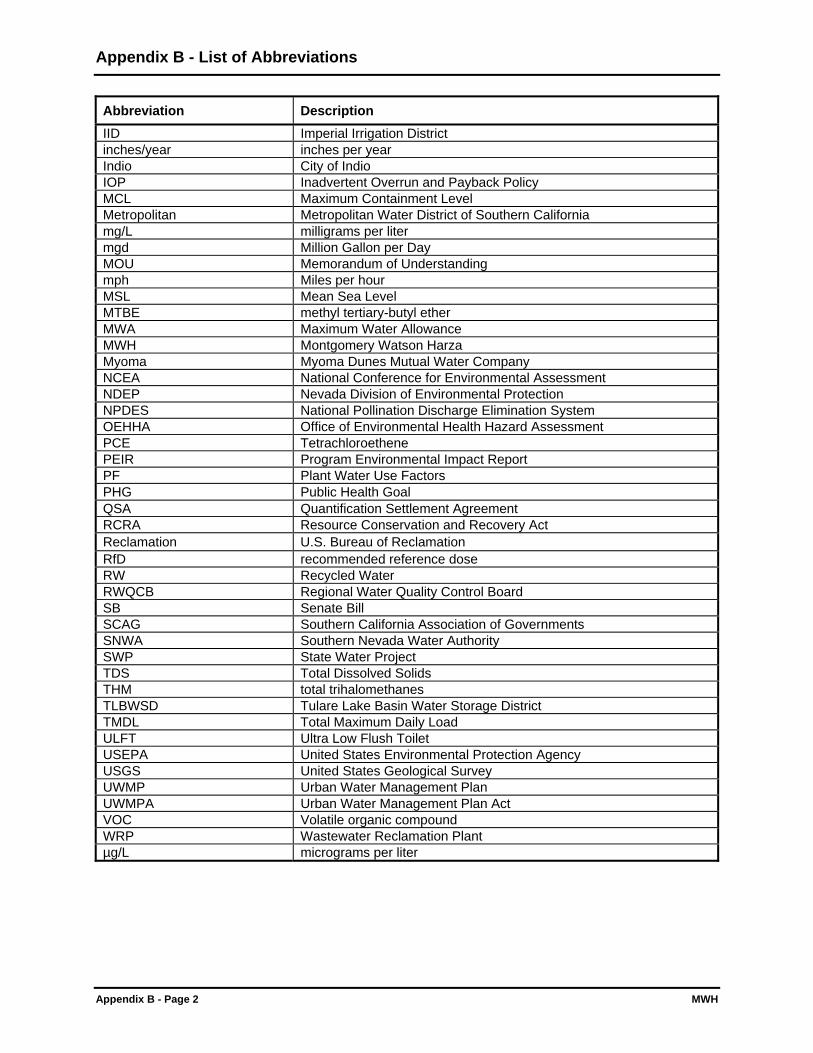
Appendix B - List of Abbreviations
Appendix B - Page 2 MWH
Abbreviation DescriptionIID Imperial Irrigation Districtinches/year inches per yearIndio City of IndioIOP Inadvertent Overrun and Payback PolicyMCL Maximum Containment LevelMetropolitan Metropolitan Water District of Southern Californiamg/L milligrams per litermgd Million Gallon per DayMOU Memorandum of Understandingmph Miles per hourMSL Mean Sea LevelMTBE methyl tertiary-butyl etherMWA Maximum Water AllowanceMWH Montgomery Watson HarzaMyoma Myoma Dunes Mutual Water CompanyNCEA National Conference for Environmental AssessmentNDEP Nevada Division of Environmental ProtectionNPDES National Pollination Discharge Elimination SystemOEHHA Office of Environmental Health Hazard AssessmentPCE TetrachloroethenePEIR Program Environmental Impact ReportPF Plant Water Use FactorsPHG Public Health GoalQSA Quantification Settlement AgreementRCRA Resource Conservation and Recovery ActReclamation U.S. Bureau of ReclamationRfD recommended reference doseRW Recycled WaterRWQCB Regional Water Quality Control BoardSB Senate BillSCAG Southern California Association of GovernmentsSNWA Southern Nevada Water AuthoritySWP State Water ProjectTDS Total Dissolved SolidsTHM total trihalomethanesTLBWSD Tulare Lake Basin Water Storage DistrictTMDL Total Maximum Daily LoadULFT Ultra Low Flush ToiletUSEPA United States Environmental Protection AgencyUSGS United States Geological SurveyUWMP Urban Water Management PlanUWMPA Urban Water Management Plan ActVOC Volatile organic compoundWRP Wastewater Reclamation Plantµg/L micrograms per liter
MWH Appendix C –Page 1
Appendix CUWMP Law

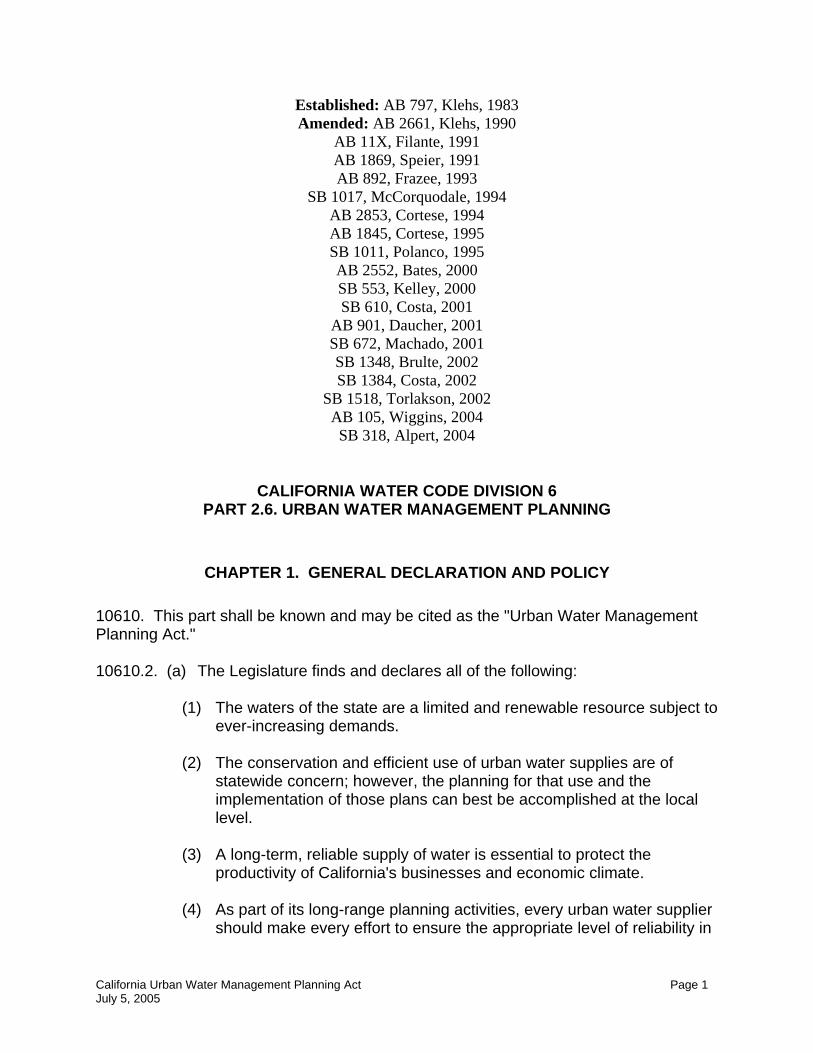
Established: AB 797, Klehs, 1983 Amended: AB 2661, Klehs, 1990
AB 11X, Filante, 1991 AB 1869, Speier, 1991 AB 892, Frazee, 1993
SB 1017, McCorquodale, 1994 AB 2853, Cortese, 1994 AB 1845, Cortese, 1995 SB 1011, Polanco, 1995 AB 2552, Bates, 2000 SB 553, Kelley, 2000 SB 610, Costa, 2001
AB 901, Daucher, 2001 SB 672, Machado, 2001 SB 1348, Brulte, 2002 SB 1384, Costa, 2002
SB 1518, Torlakson, 2002 AB 105, Wiggins, 2004 SB 318, Alpert, 2004
CALIFORNIA WATER CODE DIVISION 6 PART 2.6. URBAN WATER MANAGEMENT PLANNING
CHAPTER 1. GENERAL DECLARATION AND POLICY 10610. This part shall be known and may be cited as the "Urban Water Management Planning Act." 10610.2. (a) The Legislature finds and declares all of the following:
(1) The waters of the state are a limited and renewable resource subject to ever-increasing demands.
(2) The conservation and efficient use of urban water supplies are of
statewide concern; however, the planning for that use and the implementation of those plans can best be accomplished at the local level.
(3) A long-term, reliable supply of water is essential to protect the
productivity of California's businesses and economic climate. (4) As part of its long-range planning activities, every urban water supplier
should make every effort to ensure the appropriate level of reliability in
California Urban Water Management Planning Act Page 1 July 5, 2005
its water service sufficient to meet the needs of its various categories of customers during normal, dry, and multiple dry water years.
(5) Public health issues have been raised over a number of contaminants
that have been identified in certain local and imported water supplies. (6) Implementing effective water management strategies, including
groundwater storage projects and recycled water projects, may require specific water quality and salinity targets for meeting groundwater basins water quality objectives and promoting beneficial use of recycled water.
(7) Water quality regulations are becoming an increasingly important
factor in water agencies' selection of raw water sources, treatment alternatives, and modifications to existing treatment facilities.
(8) Changes in drinking water quality standards may also impact the
usefulness of water supplies and may ultimately impact supply reliability.
(9) The quality of source supplies can have a significant impact on water
management strategies and supply reliability.
(b) This part is intended to provide assistance to water agencies in carrying out their long-term resource planning responsibilities to ensure adequate water supplies to meet existing and future demands for water.
10610.4. The Legislature finds and declares that it is the policy of the state as follows:
(a) The management of urban water demands and efficient use of water shall be actively pursued to protect both the people of the state and their water resources.
(b) The management of urban water demands and efficient use of urban water
supplies shall be a guiding criterion in public decisions.
(c) Urban water suppliers shall be required to develop water management plans to actively pursue the efficient use of available supplies.
CHAPTER 2. DEFINITIONS
10611. Unless the context otherwise requires, the definitions of this chapter govern the construction of this part.
California Urban Water Management Planning Act Page 2 July 5, 2005
10611.5. "Demand management" means those water conservation measures, programs, and incentives that prevent the waste of water and promote the reasonable and efficient use and reuse of available supplies. 10612. "Customer" means a purchaser of water from a water supplier who uses the water for municipal purposes, including residential, commercial, governmental, and industrial uses. 10613. "Efficient use" means those management measures that result in the most effective use of water so as to prevent its waste or unreasonable use or unreasonable method of use. 10614. "Person" means any individual, firm, association, organization, partnership, business, trust, corporation, company, public agency, or any agency of such an entity. 10615. "Plan" means an urban water management plan prepared pursuant to this part. A plan shall describe and evaluate sources of supply, reasonable and practical efficient uses, reclamation and demand management activities. The components of the plan may vary according to an individual community or area's characteristics and its capabilities to efficiently use and conserve water. The plan shall address measures for residential, commercial, governmental, and industrial water demand management as set forth in Article 2 (commencing with Section 10630) of Chapter 3. In addition, a strategy and time schedule for implementation shall be included in the plan. 10616. "Public agency" means any board, commission, county, city and county, city, regional agency, district, or other public entity. 10616.5. "Recycled water" means the reclamation and reuse of wastewater for beneficial use. 10617. "Urban water supplier" means a supplier, either publicly or privately owned, providing water for municipal purposes either directly or indirectly to more than 3,000 customers or supplying more than 3,000 acre-feet of water annually. An urban water supplier includes a supplier or contractor for water, regardless of the basis of right, which distributes or sells for ultimate resale to customers. This part applies only to water supplied from public water systems subject to Chapter 4 (commencing with Section 116275) of Part 12 of Division 104 of the Health and Safety Code.
CHAPTER 3. URBAN WATER MANAGEMENT PLANS Article 1. General Provisions
10620.
(a) Every urban water supplier shall prepare and adopt an urban water management plan in the manner set forth in Article 3 (commencing with Section 10640).
California Urban Water Management Planning Act Page 3 July 5, 2005
(b) Every person that becomes an urban water supplier shall adopt an urban
water management plan within one year after it has become an urban water supplier.
(c) An urban water supplier indirectly providing water shall not include planning
elements in its water management plan as provided in Article 2 (commencing with Section 10630) that would be applicable to urban water suppliers or public agencies directly providing water, or to their customers, without the consent of those suppliers or public agencies.
(d)
(1) An urban water supplier may satisfy the requirements of this part by participation in areawide, regional, watershed, or basinwide urban water management planning where those plans will reduce preparation costs and contribute to the achievement of conservation and efficient water use.
(2) Each urban water supplier shall coordinate the preparation of its plan
with other appropriate agencies in the area, including other water suppliers that share a common source, water management agencies, and relevant public agencies, to the extent practicable.
(e) The urban water supplier may prepare the plan with its own staff, by
contract, or in cooperation with other governmental agencies.
(f) An urban water supplier shall describe in the plan water management tools and options used by that entity that will maximize resources and minimize the need to import water from other regions.
10621.
(a) Each urban water supplier shall update its plan at least once every five years on or before December 31, in years ending in five and zero.
(b) Every urban water supplier required to prepare a plan pursuant to this part
shall notify any city or county within which the supplier provides water supplies that the urban water supplier will be reviewing the plan and considering amendments or changes to the plan. The urban water supplier may consult with, and obtain comments from, any city or county that receives notice pursuant to this subdivision.
(c) The amendments to, or changes in, the plan shall be adopted and filed in
the manner set forth in Article 3 (commencing with Section 10640).
Article 2. Contents of Plans
California Urban Water Management Planning Act Page 4 July 5, 2005
10630. It is the intention of the Legislature, in enacting this part, to permit levels of water management planning commensurate with the numbers of customers served and the volume of water supplied. 10631. A plan shall be adopted in accordance with this chapter and shall do all of the following:
(a) Describe the service area of the supplier, including current and projected population, climate, and other demographic factors affecting the supplier's water management planning. The projected population estimates shall be based upon data from the state, regional, or local service agency population projections within the service area of the urban water supplier and shall be in five-year increments to 20 years or as far as data is available.
(b) Identify and quantify, to the extent practicable, the existing and planned
sources of water available to the supplier over the same five-year increments described in subdivision (a). If groundwater is identified as an existing or planned source of water available to the supplier, all of the following information shall be included in the plan:
(1) A copy of any groundwater management plan adopted by the urban
water supplier, including plans adopted pursuant to Part 2.75 (commencing with Section 10750), or any other specific authorization for groundwater management.
(2) A description of any groundwater basin or basins from which the
urban water supplier pumps groundwater. For those basins for which a court or the board has adjudicated the rights to pump groundwater, a copy of the order or decree adopted by the court or the board and a description of the amount of groundwater the urban water supplier has the legal right to pump under the order or decree.
For basins that have not been adjudicated, information as to whether
the department has identified the basin or basins as overdrafted or has projected that the basin will become overdrafted if present management conditions continue, in the most current official departmental bulletin that characterizes the condition of the groundwater basin, and a detailed description of the efforts being undertaken by the urban water supplier to eliminate the long-term overdraft condition.
(3) A detailed description and analysis of the location, amount, and
sufficiency of groundwater pumped by the urban water supplier for the past five years. The description and analysis shall be based on information that is reasonably available, including, but not limited to, historic use records.
California Urban Water Management Planning Act Page 5 July 5, 2005
(4) A detailed description and analysis of the amount and location of
groundwater that is projected to be pumped by the urban water supplier. The description and analysis shall be based on information that is reasonably available, including, but not limited to, historic use records.
(c) Describe the reliability of the water supply and vulnerability to seasonal or
climatic shortage, to the extent practicable, and provide data for each of the following:
(1) An average water year. (2) A single dry water year. (3) Multiple dry water years. For any water source that may not be available at a consistent level of use, given specific legal, environmental, water quality, or climatic factors, describe plans to supplement or replace that source with alternative sources or water demand management measures, to the extent practicable.
(d) Describe the opportunities for exchanges or transfers of water on a short-term or long-term basis.
(e)
(1) Quantify, to the extent records are available, past and current water use, over the same five-year increments described in subdivision (a), and projected water use, identifying the uses among water use sectors including, but not necessarily limited to, all of the following uses:
(A) Single-family residential. (B) Multifamily. (C) Commercial. (D) Industrial. (E) Institutional and governmental. (F) Landscape. (G) Sales to other agencies. (H) Saline water intrusion barriers, groundwater recharge, or
conjunctive use, or any combination thereof. (I) Agricultural.
(2) The water use projections shall be in the same five-year increments described in subdivision (a).
California Urban Water Management Planning Act Page 6 July 5, 2005
(f) Provide a description of the supplier's water demand management measures. This description shall include all of the following:
(1) A description of each water demand management measure that is
currently being implemented, or scheduled for implementation, including the steps necessary to implement any proposed measures, including, but not limited to, all of the following:
(A) Water survey programs for single-family residential and
multifamily residential customers. (B) Residential plumbing retrofit. (C) System water audits, leak detection, and repair. (D) Metering with commodity rates for all new connections and
retrofit of existing connections. (E) Large landscape conservation programs and incentives. (F) High-efficiency washing machine rebate programs. (G) Public information programs. (H) School education programs. (I) Conservation programs for commercial, industrial, and
institutional accounts. (J) Wholesale agency programs.
(K) Conservation pricing. (L) Water conservation coordinator. (M) Water waste prohibition. (N) Residential ultra-low-flush toilet replacement programs.
(2) A schedule of implementation for all water demand management measures proposed or described in the plan.
(3) A description of the methods, if any, that the supplier will use to
evaluate the effectiveness of water demand management measures implemented or described under the plan.
California Urban Water Management Planning Act Page 7 July 5, 2005
(4) An estimate, if available, of existing conservation savings on water use within the supplier's service area, and the effect of the savings on the supplier's ability to further reduce demand.
(g) An evaluation of each water demand management measure listed in
paragraph (1) of subdivision (f) that is not currently being implemented or scheduled for implementation. In the course of the evaluation, first consideration shall be given to water demand management measures, or combination of measures, that offer lower incremental costs than expanded or additional water supplies. This evaluation shall do all of the following:
(1) Take into account economic and noneconomic factors, including
environmental, social, health, customer impact, and technological factors.
(2) Include a cost-benefit analysis, identifying total benefits and total
costs.
(3) Include a description of funding available to implement any planned water supply project that would provide water at a higher unit cost.
(4) Include a description of the water supplier's legal authority to
implement the measure and efforts to work with other relevant agencies to ensure the implementation of the measure and to share the cost of implementation.
(h) Include a description of all water supply projects and water supply
programs that may be undertaken by the urban water supplier to meet the total projected water use as established pursuant to subdivision (a) of Section 10635. The urban water supplier shall include a detailed description of expected future projects and programs, other than the demand management programs identified pursuant to paragraph (1) of subdivision (f), that the urban water supplier may implement to increase the amount of the water supply available to the urban water supplier in average, single-dry, and multiple-dry water years. The description shall identify specific projects and include a description of the increase in water supply that is expected to be available from each project. The description shall include an estimate with regard to the implementation timeline for each project or program.
(i) Describe the opportunities for development of desalinated water,
including, but not limited to, ocean water, brackish water, and groundwater, as a long-term supply.
(j) Urban water suppliers that are members of the California Urban
Water Conservation Council and submit annual reports to that council
California Urban Water Management Planning Act Page 8 July 5, 2005
in accordance with the ‘‘Memorandum of Understanding Regarding Urban Water Conservation in California,’’ dated September 1991, may submit the annual reports identifying water demand management measures currently being implemented, or scheduled for implementation, to satisfy the requirements of subdivisions (f) and (g).
(k) Urban water suppliers that rely upon a wholesale agency for a
source of water, shall provide the wholesale agency with water use projections from that agency for that source of water in five-year increments to 20 years or as far as data is available. The wholesale agency shall provide information to the urban water supplier for inclusion in the urban water supplier’s plan that identifies and quantifies, to the extent practicable, the existing and planned sources of water as required by subdivision (b), available from the wholesale agency to the urban water supplier over the same five-year increments, and during various water-year types in accordance with subdivision (c). An urban water supplier may rely upon water supply information provided by the wholesale agency in fulfilling the plan informational requirements of subdivisions (b) and (c), including, but not limited to, ocean water, brackish water, and groundwater, as a long-term supply.
10631.5. The department shall take into consideration whether the urban water supplier is implementing or scheduled for implementation, the water demand management activities that the urban water supplier identified in its urban water management plan, pursuant to Section 10631, in evaluating applications for grants and loans made available pursuant to Section 79163. The urban water supplier may submit to the department copies of its annual reports and other relevant documents to assist the department in determining whether the urban water supplier is implementing or scheduling the implementation of water demand management activities. 10632. The plan shall provide an urban water shortage contingency analysis which includes each of the following elements which are within the authority of the urban water supplier:
(a) Stages of action to be undertaken by the urban water supplier in response to water supply shortages, including up to a 50 percent reduction in water supply, and an outline of specific water supply conditions which are applicable to each stage.
(b) An estimate of the minimum water supply available during each of the next
three water years based on the driest three-year historic sequence for the agency's water supply.
(c) Actions to be undertaken by the urban water supplier to prepare for, and
implement during, a catastrophic interruption of water supplies including,
California Urban Water Management Planning Act Page 9 July 5, 2005
but not limited to, a regional power outage, an earthquake, or other disaster.
(d) Additional, mandatory prohibitions against specific water use practices
during water shortages, including, but not limited to, prohibiting the use of potable water for street cleaning.
(e) Consumption reduction methods in the most restrictive stages. Each urban
water supplier may use any type of consumption reduction methods in its water shortage contingency analysis that would reduce water use, are appropriate for its area, and have the ability to achieve a water use reduction consistent with up to a 50 percent reduction in water supply.
(f) Penalties or charges for excessive use, where applicable.
(g) An analysis of the impacts of each of the actions and conditions described
in subdivisions (a) to (f), inclusive, on the revenues and expenditures of the urban water supplier, and proposed measures to overcome those impacts, such as the development of reserves and rate adjustments.
(h) A draft water shortage contingency resolution or ordinance.
(i) A mechanism for determining actual reductions in water use pursuant to the
urban water shortage contingency analysis. 10633. The plan shall provide, to the extent available, information on recycled water and its potential for use as a water source in the service area of the urban water supplier. The preparation of the plan shall be coordinated with local water, wastewater, groundwater, and planning agencies that operate within the supplier's service area, and shall include all of the following:
(a) A description of the wastewater collection and treatment systems in the supplier's service area, including a quantification of the amount of wastewater collected and treated and the methods of wastewater disposal.
(b) A description of the quantity of treated wastewater that meets
recycled water standards, is being discharged, and is otherwise available for use in a recycled water project.
(c) A description of the recycled water currently being used in
the supplier's service area, including, but not limited to, the type, place, and quantity of use.
California Urban Water Management Planning Act Page 10 July 5, 2005
(d) A description and quantification of the potential uses of recycled water, including, but not limited to, agricultural irrigation, landscape irrigation, wildlife habitat enhancement, wetlands, industrial reuse, groundwater recharge, and other appropriate uses, and a determination with regard to the technical and economic feasibility of serving those uses.
(e) The projected use of recycled water within the supplier's
service area at the end of 5, 10, 15, and 20 years, and a description of the actual use of recycled water in comparison to uses previously projected pursuant to this subdivision.
(f) A description of actions, including financial incentives,
which may be taken to encourage the use of recycled water, and the projected results of these actions in terms of acre-feet of recycled water used per year.
(g) A plan for optimizing the use of recycled water in the
supplier's service area, including actions to facilitate the installation of dual distribution systems, to promote recirculating uses, to facilitate the increased use of treated wastewater that meets recycled water standards, and to overcome any obstacles to achieving that increased use.
10634. The plan shall include information, to the extent practicable, relating to the quality of existing sources of water available to the supplier over the same five-year increments as described in subdivision (a) of Section 10631, and the manner in which water quality affects water management strategies and supply reliability.
Article 2.5 Water Service Reliability 10635.
(a) Every urban water supplier shall include, as part of its urban water management plan, an assessment of the reliability of its water service to its customers during normal, dry, and multiple dry water years. This water supply and demand assessment shall compare the total water supply sources available to the water supplier with the total projected water use over the next 20 years, in five-year increments, for a normal water year, a single dry water year, and multiple dry water years. The water service reliability assessment shall be based upon the information compiled pursuant to Section 10631, including available data from state, regional, or local agency population projections within the service area of the urban water supplier.
California Urban Water Management Planning Act Page 11 July 5, 2005
(b) The urban water supplier shall provide that portion of its urban water management plan prepared pursuant to this article to any city or county within which it provides water supplies no later than 60 days after the submission of its urban water management plan.
(c) Nothing in this article is intended to create a right or entitlement to water
service or any specific level of water service.
(d) Nothing in this article is intended to change existing law concerning an urban water supplier's obligation to provide water service to its existing customers or to any potential future customers.
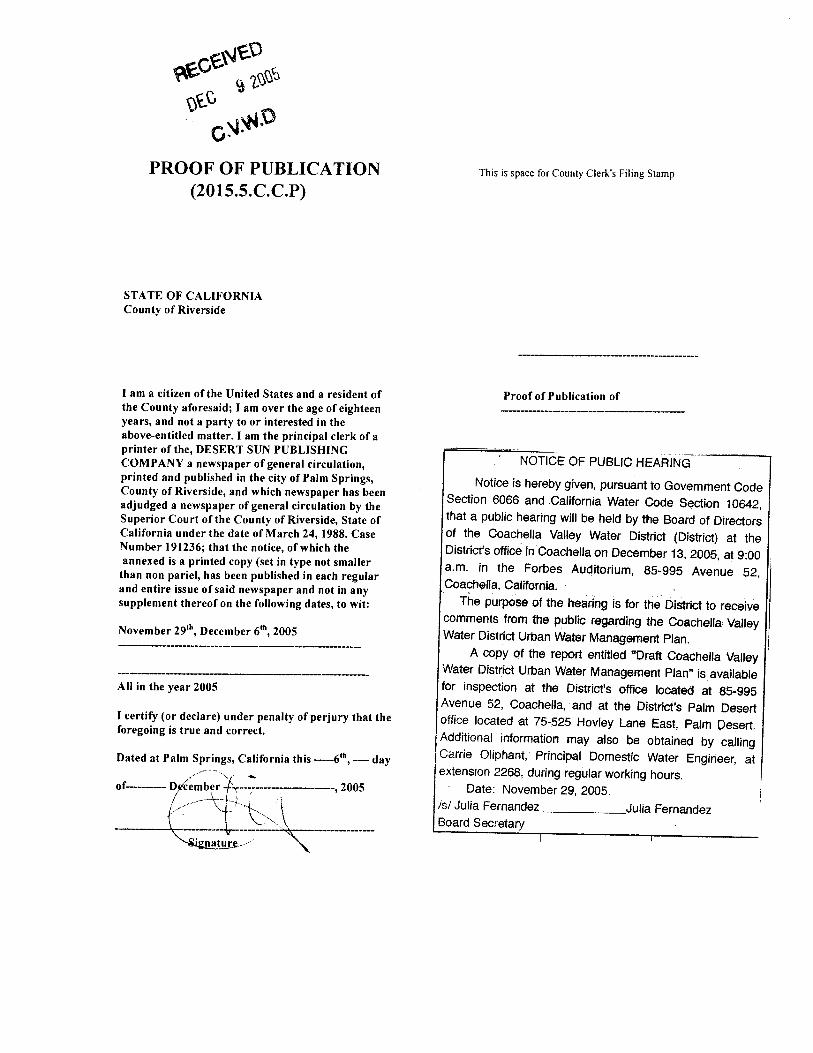
Articl 3. Adoption and Implementation of Plans 10640. Every urban water supplier required to prepare a plan pursuant to this part shall prepare its plan pursuant to Article 2 (commencing with Section 10630). The supplier shall likewise periodically review the plan as required by Section 10621, and any amendments or changes required as a result of that review shall be adopted pursuant to this article. 10641. An urban water supplier required to prepare a plan may consult with, and obtain comments from, any public agency or state agency or any person who has special expertise with respect to water demand management methods and techniques. 10642. Each urban water supplier shall encourage the active involvement of diverse social, cultural, and economic elements of the population within the service area prior to and during the preparation of the plan. Prior to adopting a plan, the urban water supplier shall make the plan available for public inspection and shall hold a public hearing thereon. Prior to the hearing, notice of the time and place of hearing shall be published within the jurisdiction of the publicly owned water supplier pursuant to Section 6066 of the Government Code. The urban water supplier shall provide notice of the time and place of hearing to any city or county within which the supplier provides water supplies. A privately owned water supplier shall provide an equivalent notice within its service area. After the hearing, the plan shall be adopted as prepared or as modified after the hearing. 10643. An urban water supplier shall implement its plan adopted pursuant to this chapter in accordance with the schedule set forth in its plan. 10644.
(a) An urban water supplier shall file with the department and any city or county within which the supplier provides water supplies a copy of its plan no later than 30 days after adoption. Copies of amendments or changes to the
California Urban Water Management Planning Act Page 12 July 5, 2005
plans shall be filed with the department and any city or county within which the supplier provides water supplies within 30 days after adoption.
(b) The department shall prepare and submit to the Legislature, on or before
December 31, in the years ending in six and one, a report summarizing the status of the plans adopted pursuant to this part. The report prepared by the department shall identify the outstanding elements of the individual plans. The department shall provide a copy of the report to each urban water supplier that has filed its plan with the department. The department shall also prepare reports and provide data for any legislative hearings designed to consider the effectiveness of plans submitted pursuant to this part.
10645. Not later than 30 days after filing a copy of its plan with the department, the urban water supplier and the department shall make the plan available for public review during normal business hours.
CHAPTER 4. MISCELLANEOUS PROVISIONS 10650. Any actions or proceedings to attack, review, set aside, void, or annul the acts or decisions of an urban water supplier on the grounds of noncompliance with this part shall be commenced as follows:
(a) An action or proceeding alleging failure to adopt a plan shall be commenced within 18 months after that adoption is required by this part.
(b) Any action or proceeding alleging that a plan, or action taken pursuant to
the plan, does not comply with this part shall be commenced within 90 days after filing of the plan or amendment thereto pursuant to Section 10644 or the taking of that action.
10651. In any action or proceeding to attack, review, set aside, void, or annul a plan, or an action taken pursuant to the plan by an urban water supplier on the grounds of noncompliance with this part, the inquiry shall extend only to whether there was a prejudicial abuse of discretion. Abuse of discretion is established if the supplier has not proceeded in a manner required by law or if the action by the water supplier is not supported by substantial evidence. 10652. The California Environmental Quality Act (Division 13 (commencing with Section 21000) of the Public Resources Code) does not apply to the preparation and adoption of plans pursuant to this part or to the implementation of actions taken pursuant to Section 10632. Nothing in this part shall be interpreted as exempting from the California Environmental Quality Act any project that would significantly affect water supplies for fish and wildlife, or any project for implementation of the plan, other than projects implementing Section 10632, or any project for expanded or additional water supplies.
California Urban Water Management Planning Act Page 13 July 5, 2005
10653. The adoption of a plan shall satisfy any requirements of state law, regulation, or order, including those of the State Water Resources Control Board and the Public Utilities Commission, for the preparation of water management plans or conservation plans; provided, that if the State Water Resources Control Board or the Public Utilities Commission requires additional information concerning water conservation to implement its existing authority, nothing in this part shall be deemed to limit the board or the commission in obtaining that information. The requirements of this part shall be satisfied by any urban water demand management plan prepared to meet federal laws or regulations after the effective date of this part, and which substantially meets the requirements of this part, or by any existing urban water management plan which includes the contents of a plan required under this part. 10654. An urban water supplier may recover in its rates the costs incurred in preparing its plan and implementing the reasonable water conservation measures included in the plan. Any best water management practice that is included in the plan that is identified in the "Memorandum of Understanding Regarding Urban Water Conservation in California" is deemed to be reasonable for the purposes of this section. 10655. If any provision of this part or the application thereof to any person or circumstances is held invalid, that invalidity shall not affect other provisions or applications of this part which can be given effect without the invalid provision or application thereof, and to this end the provisions of this part are severable. 10656. An urban water supplier that does not prepare, adopt, and submit its urban water management plan to the department in accordance with this part, is ineligible to receive funding pursuant to Division 24 (commencing with Section 78500) or Division 26 (commencing with Section 79000), or receive drought assistance from the state until the urban water management plan is submitted pursuant to this article. 10657.
(a) The department shall take into consideration whether the urban water supplier has submitted an updated urban water management plan that is consistent with Section 10631, as amended by the act that adds this section, in determining whether the urban water supplier is eligible for funds made available pursuant to any program administered by the department.
(b) This section shall remain in effect only until January 1, 2006, and as of that
date is repealed, unless a later enacted statute, that is enacted before January 1, 2006, deletes or extends that date.
California Urban Water Management Planning Act Page 14 July 5, 2005
MWH Appendix D -Page 1
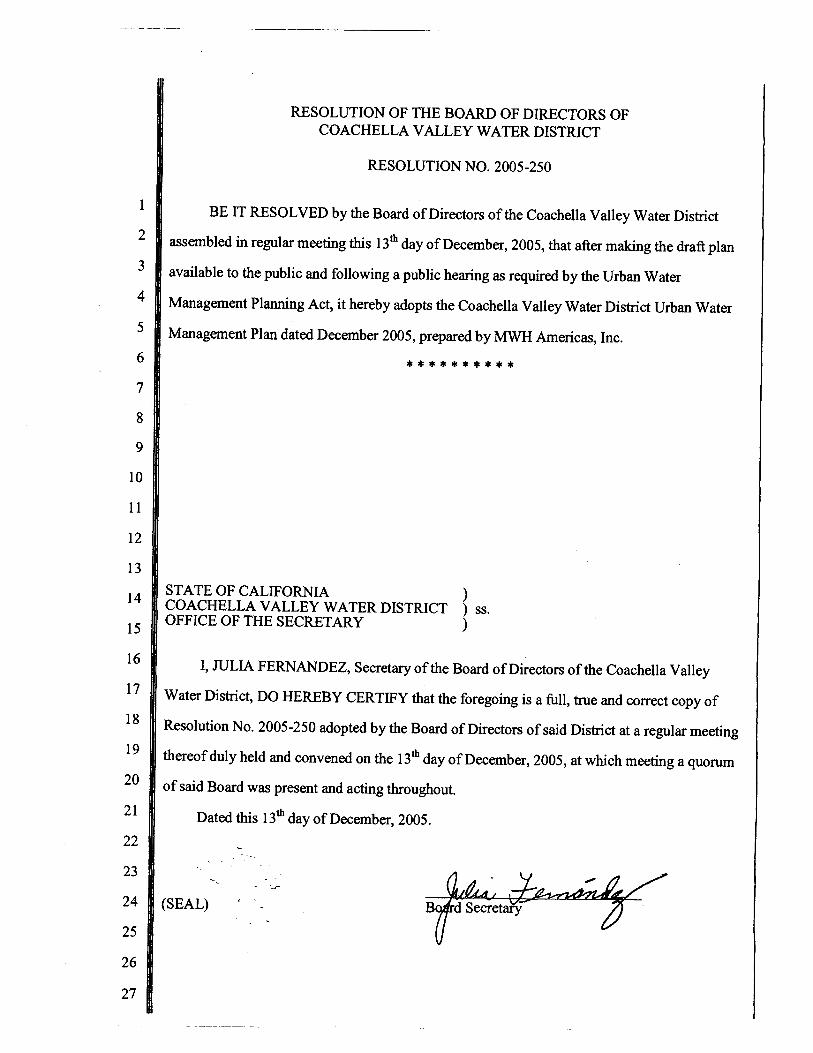
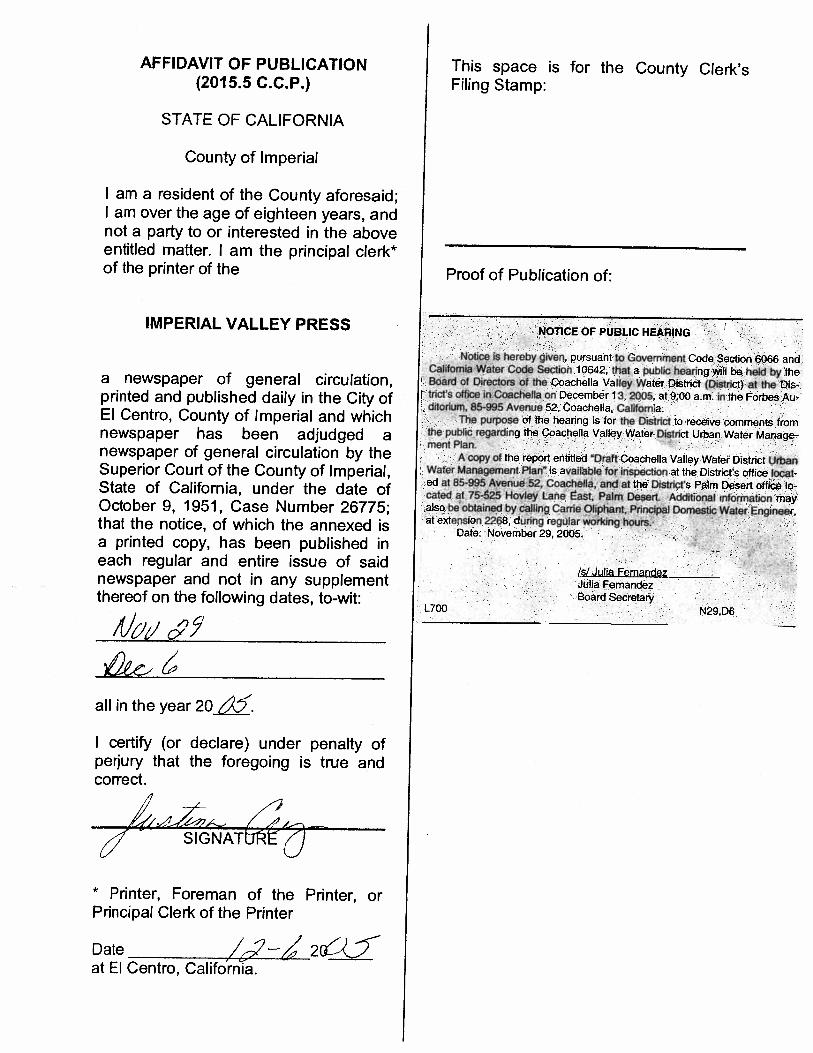
Appendix DResolution of Adoption


MWH Appendix E - Page 1
Appendix EWater Demand Projections and 2004
Demands

Appendix E – Water Demand Projections and 2004 Demands
MWH Appendix E - Page 3
E.1 WATER DEMANDS PROJECTION METHODOLOGY
Multiple data inputs were used to project future water demands. GIS (geographic informationsystems) was utilized to integrate these data inputs for all areas within the CVWD service area asshown in Figure 2-8 in Section 2.
E.1.1 Cities and Census Tracts
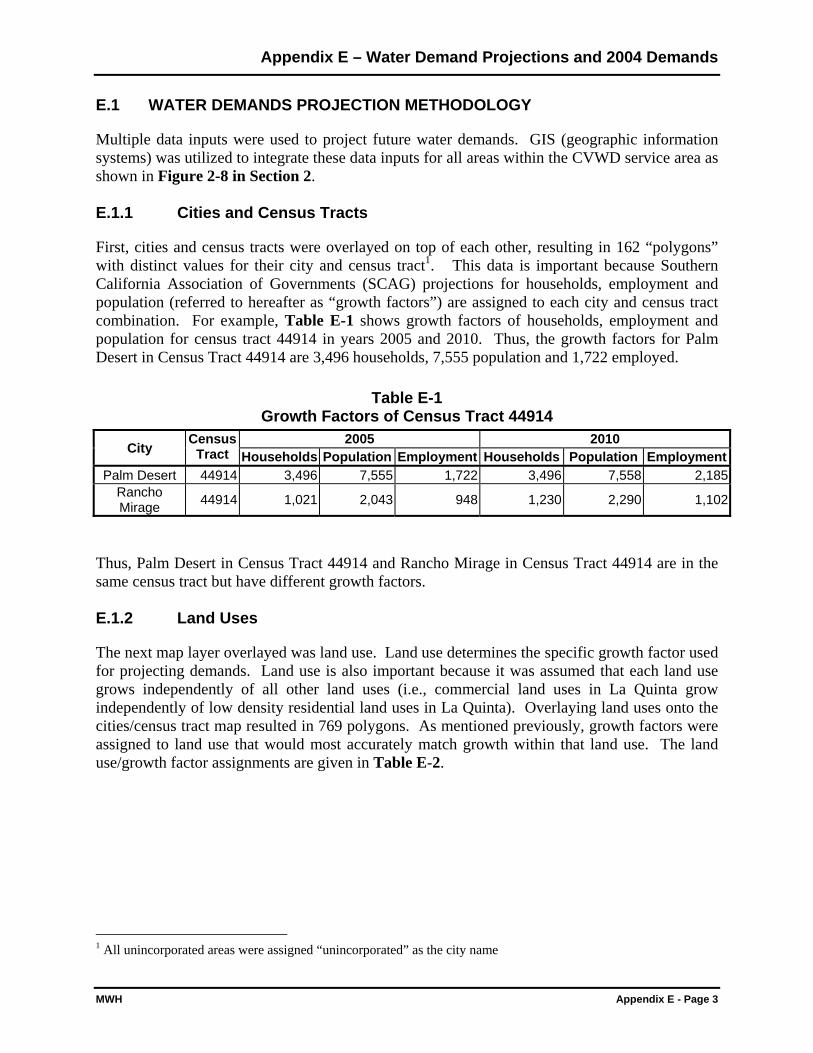
First, cities and census tracts were overlayed on top of each other, resulting in 162 “polygons”with distinct values for their city and census tract1. This data is important because SouthernCalifornia Association of Governments (SCAG) projections for households, employment andpopulation (referred to hereafter as “growth factors”) are assigned to each city and census tractcombination. For example, Table E-1 shows growth factors of households, employment andpopulation for census tract 44914 in years 2005 and 2010. Thus, the growth factors for PalmDesert in Census Tract 44914 are 3,496 households, 7,555 population and 1,722 employed.
Table E-1Growth Factors of Census Tract 44914
2005 2010City
CensusTract Households Population Employment Households Population Employment
Palm Desert 44914 3,496 7,555 1,722 3,496 7,558 2,185RanchoMirage 44914 1,021 2,043 948 1,230 2,290 1,102
Thus, Palm Desert in Census Tract 44914 and Rancho Mirage in Census Tract 44914 are in thesame census tract but have different growth factors.
E.1.2 Land Uses
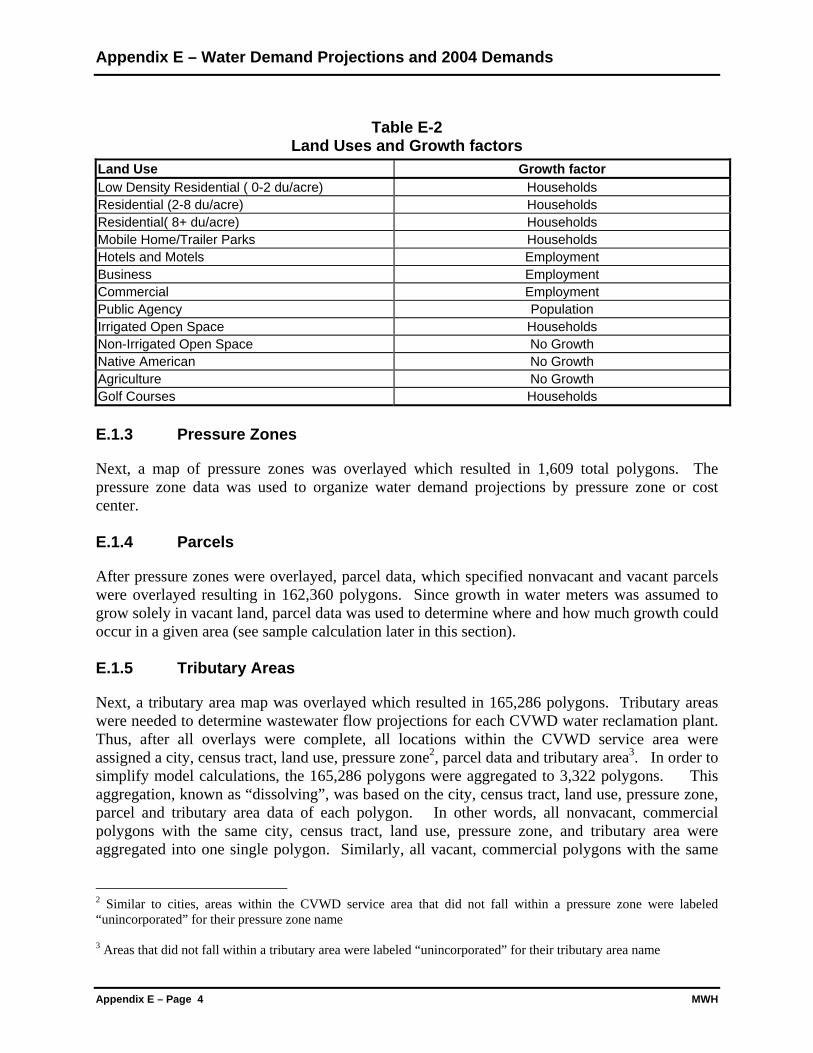
The next map layer overlayed was land use. Land use determines the specific growth factor usedfor projecting demands. Land use is also important because it was assumed that each land usegrows independently of all other land uses (i.e., commercial land uses in La Quinta growindependently of low density residential land uses in La Quinta). Overlaying land uses onto thecities/census tract map resulted in 769 polygons. As mentioned previously, growth factors wereassigned to land use that would most accurately match growth within that land use. The landuse/growth factor assignments are given in Table E-2.
1 All unincorporated areas were assigned “unincorporated” as the city name
Appendix E – Water Demand Projections and 2004 Demands
Appendix E – Page 4 MWH
Table E-2Land Uses and Growth factors
Land Use Growth factorLow Density Residential ( 0-2 du/acre) HouseholdsResidential (2-8 du/acre) HouseholdsResidential( 8+ du/acre) HouseholdsMobile Home/Trailer Parks HouseholdsHotels and Motels EmploymentBusiness EmploymentCommercial EmploymentPublic Agency PopulationIrrigated Open Space HouseholdsNon-Irrigated Open Space No GrowthNative American No GrowthAgriculture No GrowthGolf Courses Households
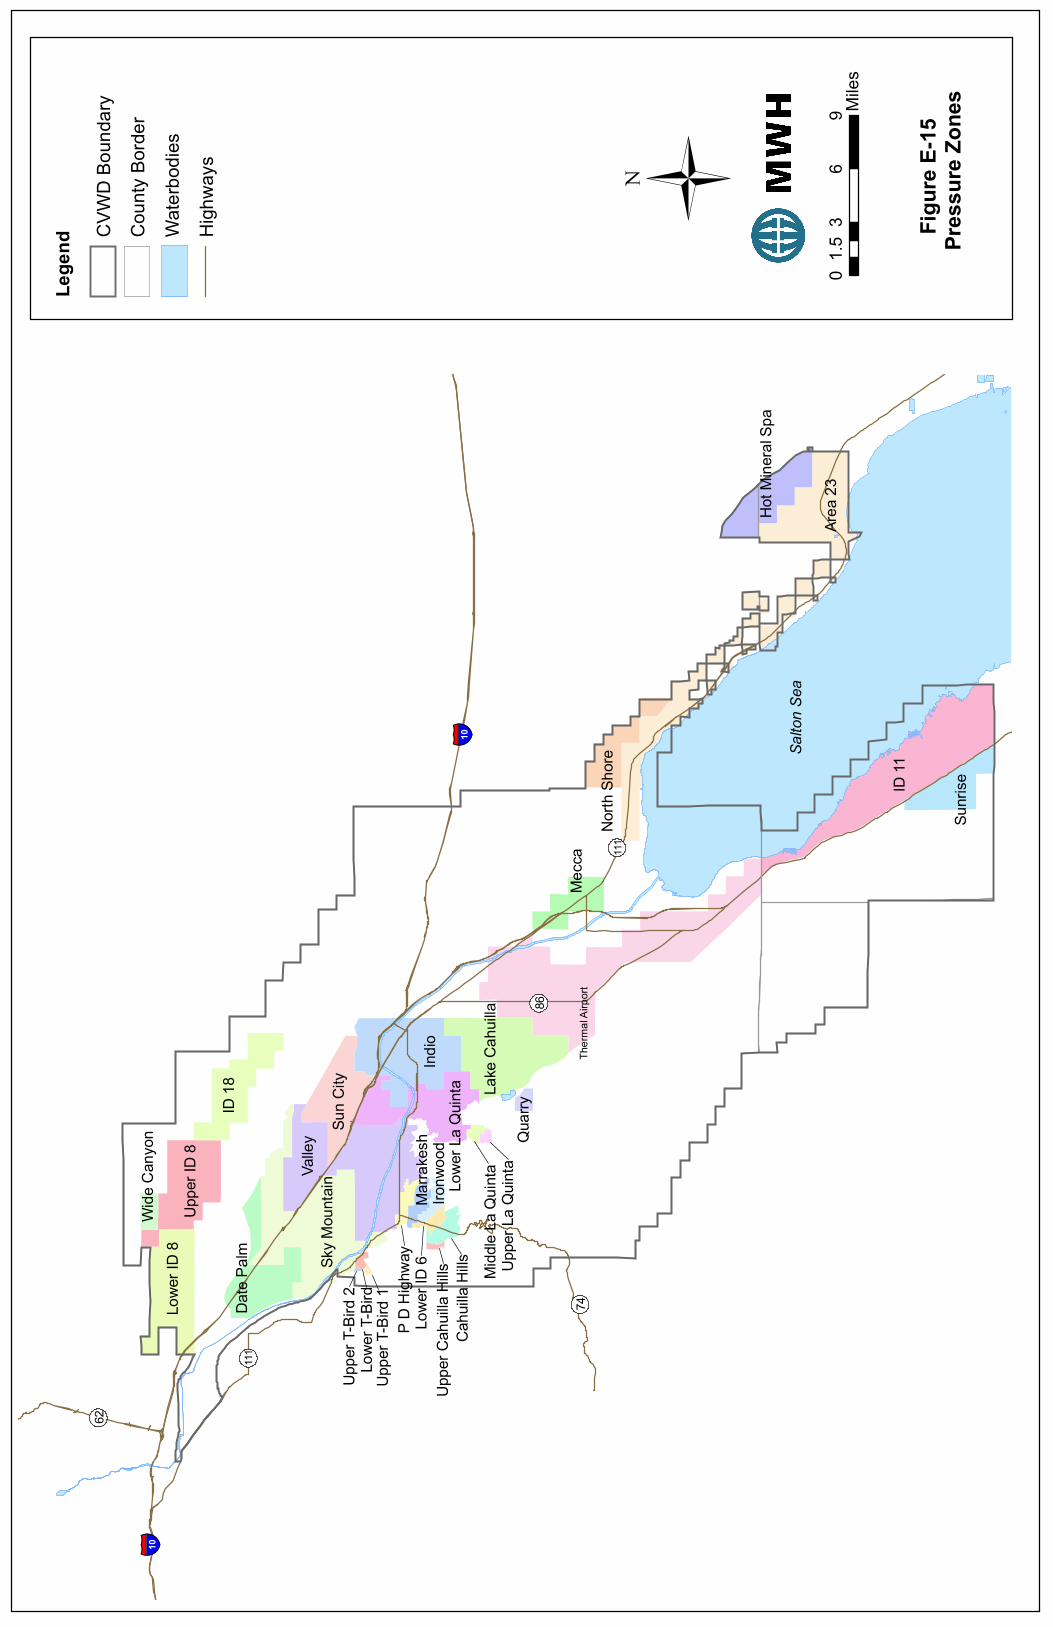
E.1.3 Pressure Zones
Next, a map of pressure zones was overlayed which resulted in 1,609 total polygons. Thepressure zone data was used to organize water demand projections by pressure zone or costcenter.
E.1.4 Parcels
After pressure zones were overlayed, parcel data, which specified nonvacant and vacant parcelswere overlayed resulting in 162,360 polygons. Since growth in water meters was assumed togrow solely in vacant land, parcel data was used to determine where and how much growth couldoccur in a given area (see sample calculation later in this section).
E.1.5 Tributary Areas
Next, a tributary area map was overlayed which resulted in 165,286 polygons. Tributary areaswere needed to determine wastewater flow projections for each CVWD water reclamation plant.Thus, after all overlays were complete, all locations within the CVWD service area wereassigned a city, census tract, land use, pressure zone2, parcel data and tributary area3. In order tosimplify model calculations, the 165,286 polygons were aggregated to 3,322 polygons. Thisaggregation, known as “dissolving”, was based on the city, census tract, land use, pressure zone,parcel and tributary area data of each polygon. In other words, all nonvacant, commercialpolygons with the same city, census tract, land use, pressure zone, and tributary area wereaggregated into one single polygon. Similarly, all vacant, commercial polygons with the same
2 Similar to cities, areas within the CVWD service area that did not fall within a pressure zone were labeled“unincorporated” for their pressure zone name
3 Areas that did not fall within a tributary area were labeled “unincorporated” for their tributary area name
Appendix E – Water Demand Projections and 2004 Demands
MWH Appendix E - Page 5
city, census tract, land use, pressure zone, and tributary area were aggregated into anotherpolygon.
Polygons were then joined with CVWD 2004 billing data to show water and wastewater usagethroughout the CVWD service area. 2004 billing data contained account numbers, annual waterusage, annual wastewater usage, number of water meters and number of wastewater meters.AutoCAD plat sheets, developed by MWH, provided a precise geographical location for everyaccount number. Matching account numbers from the billing data with the account numbers onthe plat sheets provided a geographic point for more than 95% of all CVWD accounts. Theresult of integrating this data was a map that showed water usage in acre-ft/year for all areaswithin the CVWD service area in 2004. Overlaying boundaries beforehand allowed greaterflexibility in presenting water usage data. Water usage data could be shown by pressure zone,tributary area, land use, city, census tract, nonvacant land or vacant land.
E.2 WATER DEMAND PROJECTIONS: SAMPLE CALCULATION
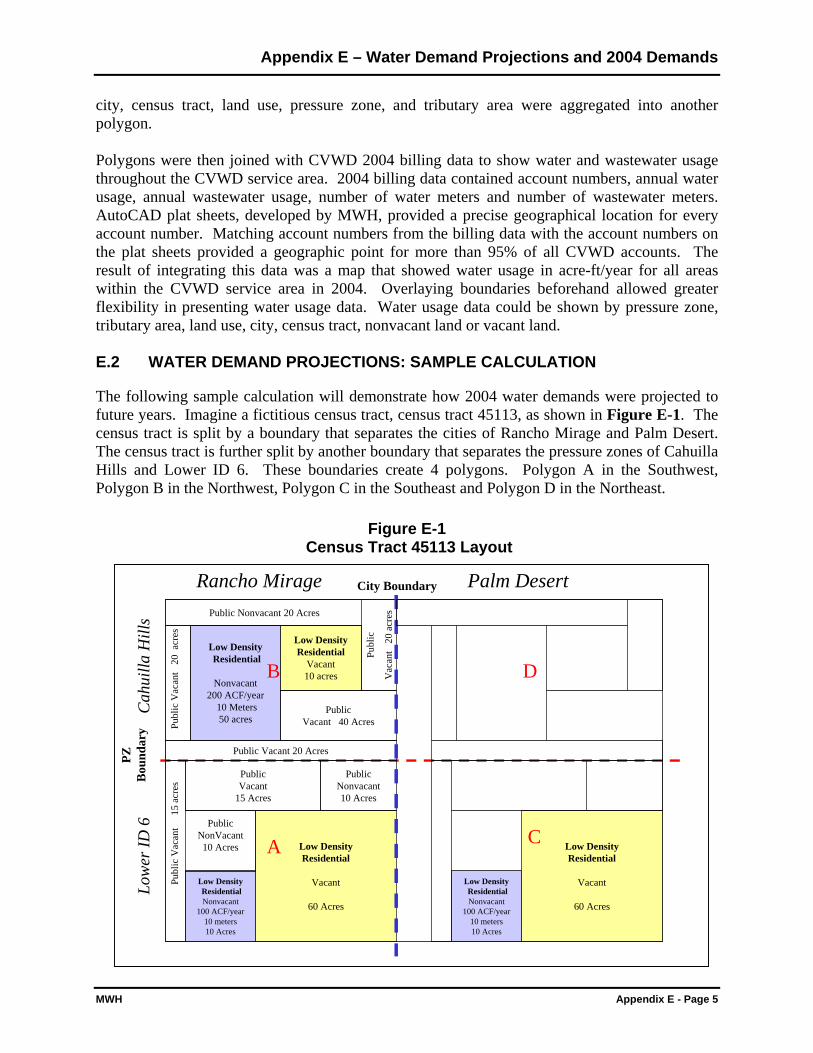
The following sample calculation will demonstrate how 2004 water demands were projected tofuture years. Imagine a fictitious census tract, census tract 45113, as shown in Figure E-1. Thecensus tract is split by a boundary that separates the cities of Rancho Mirage and Palm Desert.The census tract is further split by another boundary that separates the pressure zones of CahuillaHills and Lower ID 6. These boundaries create 4 polygons. Polygon A in the Southwest,Polygon B in the Northwest, Polygon C in the Southeast and Polygon D in the Northeast.
Figure E-1 Census Tract 45113 Layout
City Boundary
PZB
ound
ary
Low Density ResidentialNonvacant
100 ACF/year10 meters10 Acres
Low DensityResidential
Vacant
60 Acres
Low Density Residential
Nonvacant200 ACF/year
10 Meters50 acres
Low DensityResidential
Vacant10 acres
PublicNonVacant10 Acres
PublicVacant
15 Acres
PublicNonvacant10 Acres
Public Vacant 20 Acres
PublicVacant 40 Acres
Public Nonvacant 20 Acres
B
A
Rancho Mirage Palm Desert
Low Density ResidentialNonvacant
100 ACF/year10 meters10 Acres
Low DensityResidential
Vacant
60 Acres
Publ
ic V
acan
t
15 a
cres
Publ
ic V
acan
t 2
0 a
cres
Publ
ic
Vac
ant
20
acre
s
Cah
uilla
Hill
sLo
wer
ID 6
D
C
Appendix E – Water Demand Projections and 2004 Demands
Appendix E – Page 6 MWH
For illustrative purposes, the sample calculation will restrict itself to low density residential landuses, although the same process can be repeated for all other land uses. In Polygons A and B(Rancho Mirage/Census Tract 45113) the vacant land area, nonvacant land area and water usagedata for nonvacant, low density residential uses are shown. Calculation of future water demandinvolved the following steps:
1) Identify the Growth factor for each Land Use
Referring to Table E-2 low density residential land uses is assigned the “Households” growthfactor. Let’s assume that the growth factors for Polygons A and B are the following:
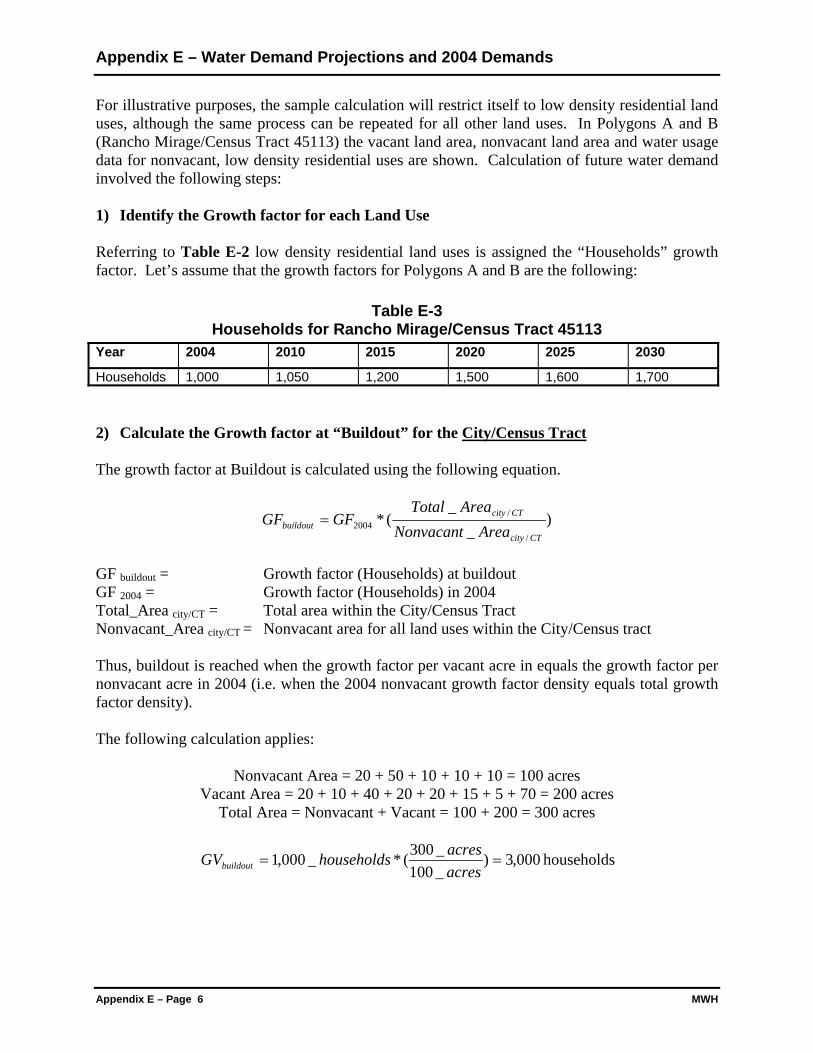
Table E-3Households for Rancho Mirage/Census Tract 45113
Year 2004 2010 2015 2020 2025 2030
Households 1,000 1,050 1,200 1,500 1,600 1,700
2) Calculate the Growth factor at “Buildout” for the City/Census Tract
The growth factor at Buildout is calculated using the following equation.
)_
_(*
/
/2004
CTcity
CTcitybuildout AreaNonvacant
AreaTotalGFGF =
GF buildout = Growth factor (Households) at buildoutGF 2004 = Growth factor (Households) in 2004Total_Area city/CT = Total area within the City/Census TractNonvacant_Area city/CT = Nonvacant area for all land uses within the City/Census tract
Thus, buildout is reached when the growth factor per vacant acre in equals the growth factor pernonvacant acre in 2004 (i.e. when the 2004 nonvacant growth factor density equals total growthfactor density).
The following calculation applies:
Nonvacant Area = 20 + 50 + 10 + 10 + 10 = 100 acresVacant Area = 20 + 10 + 40 + 20 + 20 + 15 + 5 + 70 = 200 acres
Total Area = Nonvacant + Vacant = 100 + 200 = 300 acres
000,3)_100_300(*_000,1 ==
acresacreshouseholdsGVbuildout households
Appendix E – Water Demand Projections and 2004 Demands
MWH Appendix E - Page 7
3) Calculate Total Meters at Buildout for each land use within each Polygon
The total meters at buildout is calculated using the following equation:
)__
__(*2004
polygon
polygonbuildout AreaLUNonvacant
AreaLUTotalMeterMeter =
where:
Meter buildout = Total water meters for a given land use within a polygon at buildoutMeter 2004 = Total water meters for a given land use within a polygon in 2004Total_LU_Area polygon = Total area for a given land use within a polygonNonvacant_LU_Area polygon = Total nonvacant area for a given land use within a polygon
Thus, buildout is reached when the number of meters per total acre is equal to the number ofmeters per nonvacant acre in 2004 (i.e. when the meter density of the total area of the polygonequals the nonvacant meter density). For low density residential land uses in polygon A, thefollowing calculation applies:
70)_10_70(*_10 ==
acresacresmetersMeterbuildout meters
4) Calculate Additional Meters in all future years for each land use within each Polygon
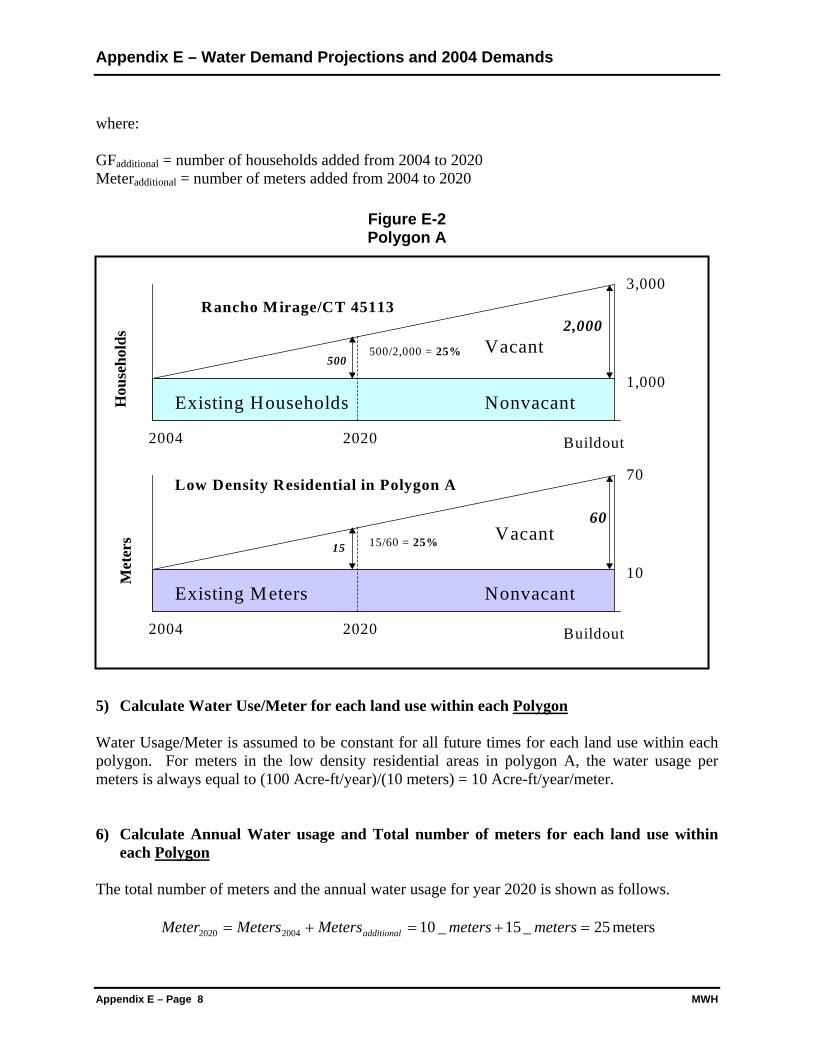
Figure E-2 shows Households vs. Time for Rancho Mirage/Census Tract 45113 and Meters vs.Time for low density residential areas in Polygon A. Total households and total meters atbuildout are shown on the far right of the figure. There are 2,000 additional households and 60additional meters from 2004 to buildout. Assuming that the number of meters in non-vacantareas remain constant in future years, the growth of meters in vacant areas increasesproportionately to the growth of growth factors in vacant areas. Thus, at 2020, when 500additional households represent 500/2000 = 25% to buildout at the city/census tract scale, therewill be 15 additional meters because (25%)(60 meters) = 15 additional meters at 25% of meterbuildout at the polygon scale.
The following equation was used to calculate additional meters
20042004 GFGFGF
MeterMeterMeter
buildout
additional
buildout
additional
−=
−
householdshouseholdshouseholds
metersmetersMeteradditional
_1000_3000_500
_10_70 −=
−
15=additionalMeter meters
Appendix E – Water Demand Projections and 2004 Demands
Appendix E – Page 8 MWH
where:
GFadditional = number of households added from 2004 to 2020Meteradditional = number of meters added from 2004 to 2020
Figure E-2Polygon A
5) Calculate Water Use/Meter for each land use within each Polygon
Water Usage/Meter is assumed to be constant for all future times for each land use within eachpolygon. For meters in the low density residential areas in polygon A, the water usage permeters is always equal to (100 Acre-ft/year)/(10 meters) = 10 Acre-ft/year/meter.
6) Calculate Annual Water usage and Total number of meters for each land use withineach Polygon
The total number of meters and the annual water usage for year 2020 is shown as follows.
25_15_1020042020 =+=+= metersmetersMetersMetersMeter additional meters
Vacant
1,000
3,000
2004 Buildout2020
Existing Households Nonvacant
500/2,000 = 25%500
Hou
seho
lds 2,000
Vacant
10
70
2004 Buildout2020
Existing Meters Nonvacant
15/60 = 25%15
Met
ers
60
Rancho Mirage/CT 45113
Low Density Residential in Polygon A
Appendix E – Water Demand Projections and 2004 Demands
MWH Appendix E - Page 9
250_10
/_100*_25)_
(*_2004
200420202020 =
−==
metersyearftAcremeters
MetersUsageWater
MetersUsageWater
Comparing these results to Polygon B demonstrates how the planning model captures localizeddifferences in water usage. Polygon B has the same growth factor (households) and has abuildout of 3,000 households. But all other calculations are different for year 2020 as shown inthe calculations in Figure E-3.
Figure E-3Polygon B Calculations
12)_50_60(*_10 ==
acresacresmetersMeterbuildout meters
householdshouseholdshouseholds
metersmetersMeteradditional
_1000_3000_500
_10_12 −=
−
15.0 ≈=additionalMeter meter
20_10
/_200)_
(2004
2004 =−
=meters
yearftAcreMeter
UsageWaterAcre-ft/year/meter
11_1_1020042020 =+=+= metermetersMeterMeterMeter additional meters
220_10
/_200*_11_ 2020 =−
=meters
yearftAcremetersUsageWater Acre-ft/year
Although Polygon B has a higher water usage/acre of land than Polygon A, the low area ofvacant land for growth means that it will have a lower annual water usage than Polygon A in2020. In another case, the low density residential land uses in Polygon C may have the samenonvacant area, vacant areas, number of meters and water usage as Polygon A. But the futurewater demand will be different because the growth factor will increase at a different rate forPalm Desert/Census Tract 45113 than for Rancho Mirage/Census Tract 45113.
Appendix E – Water Demand Projections and 2004 Demands
Appendix E – Page 10 MWH
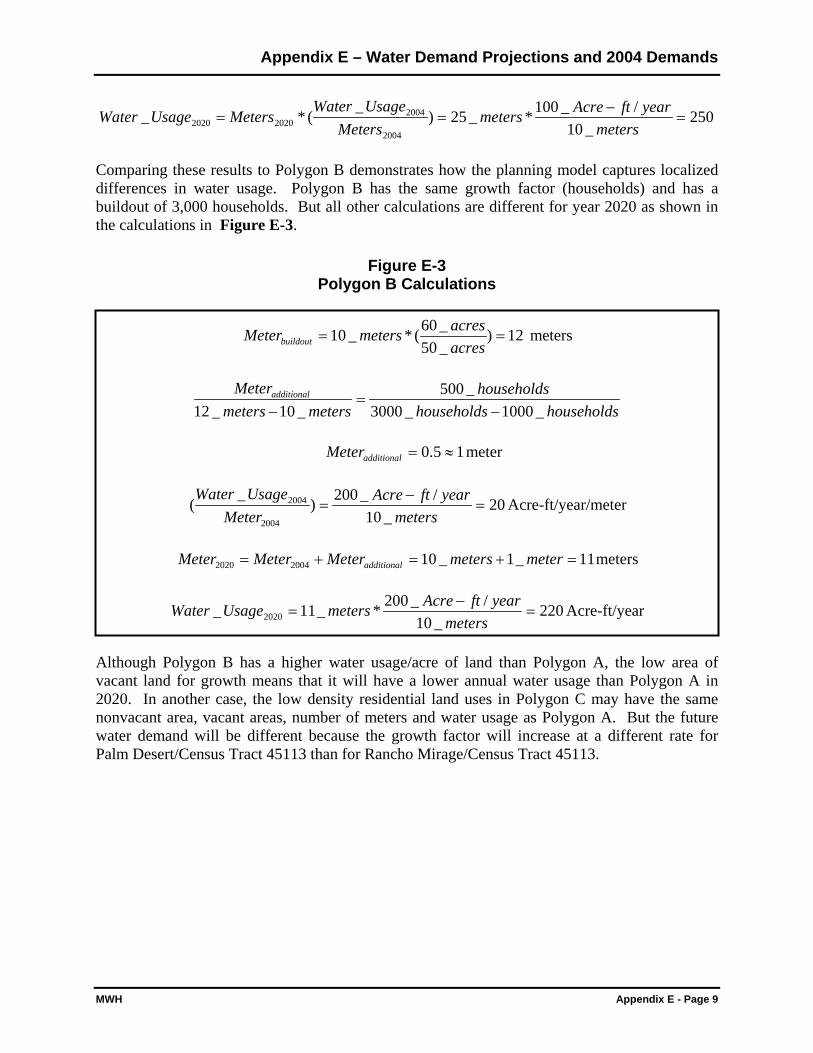
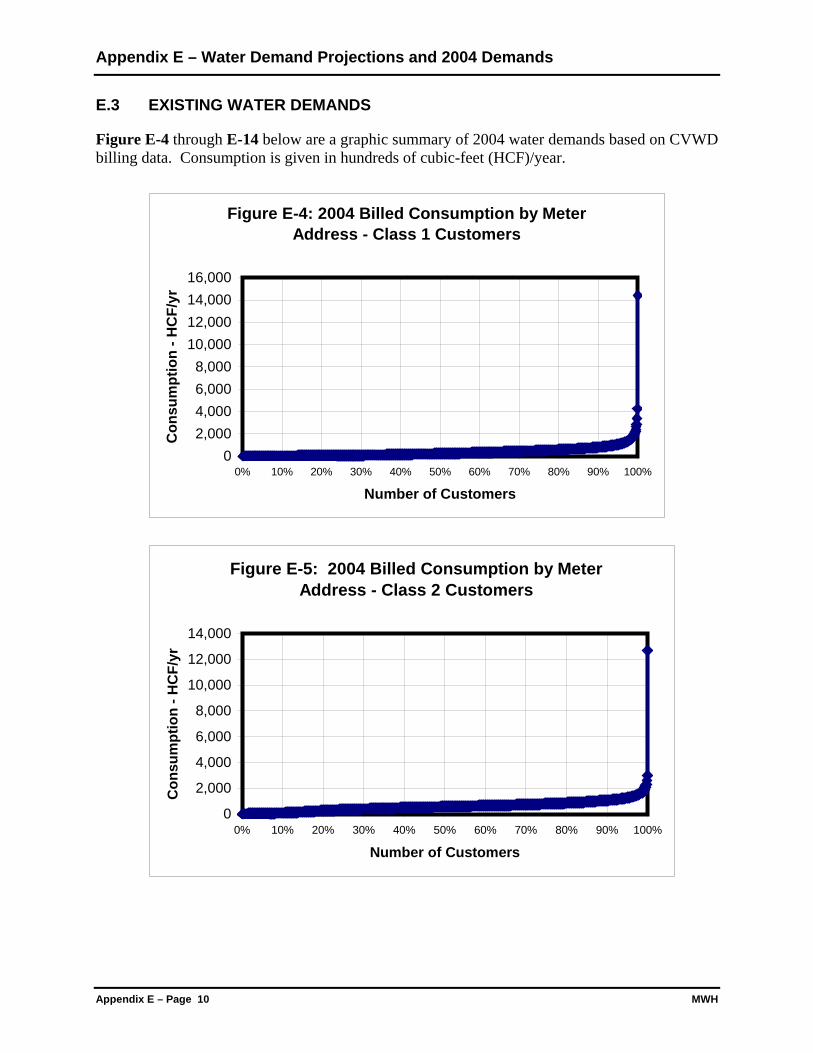
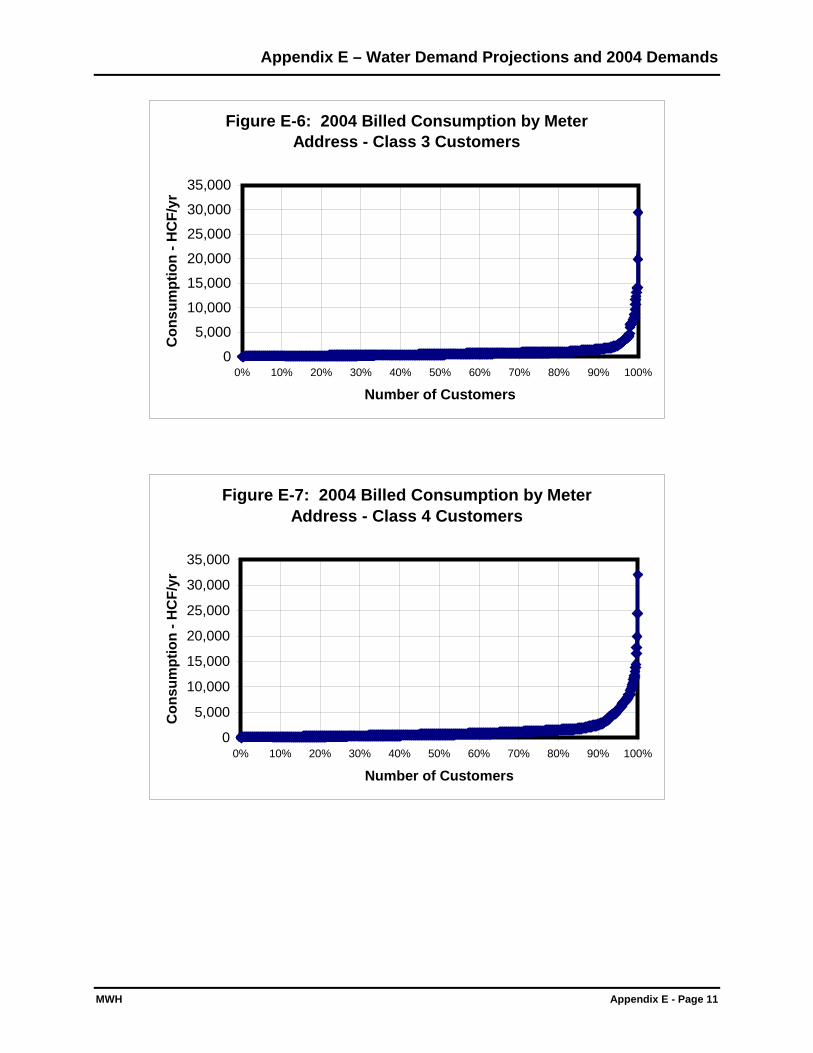
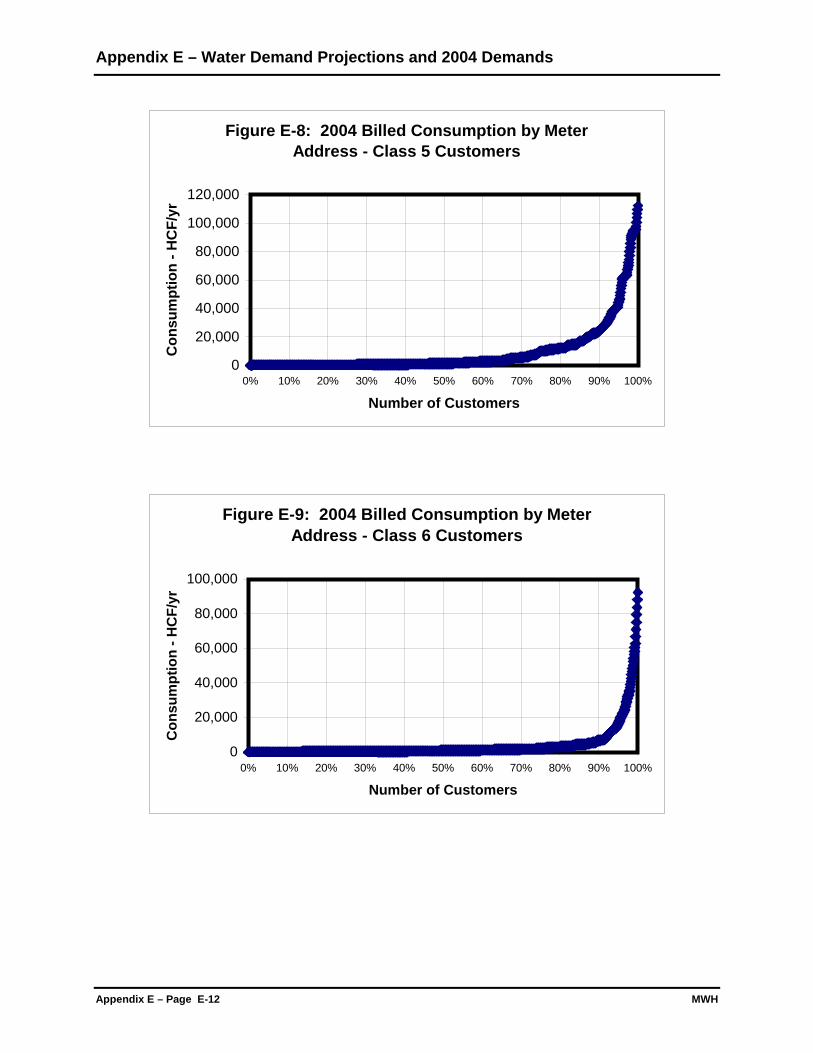
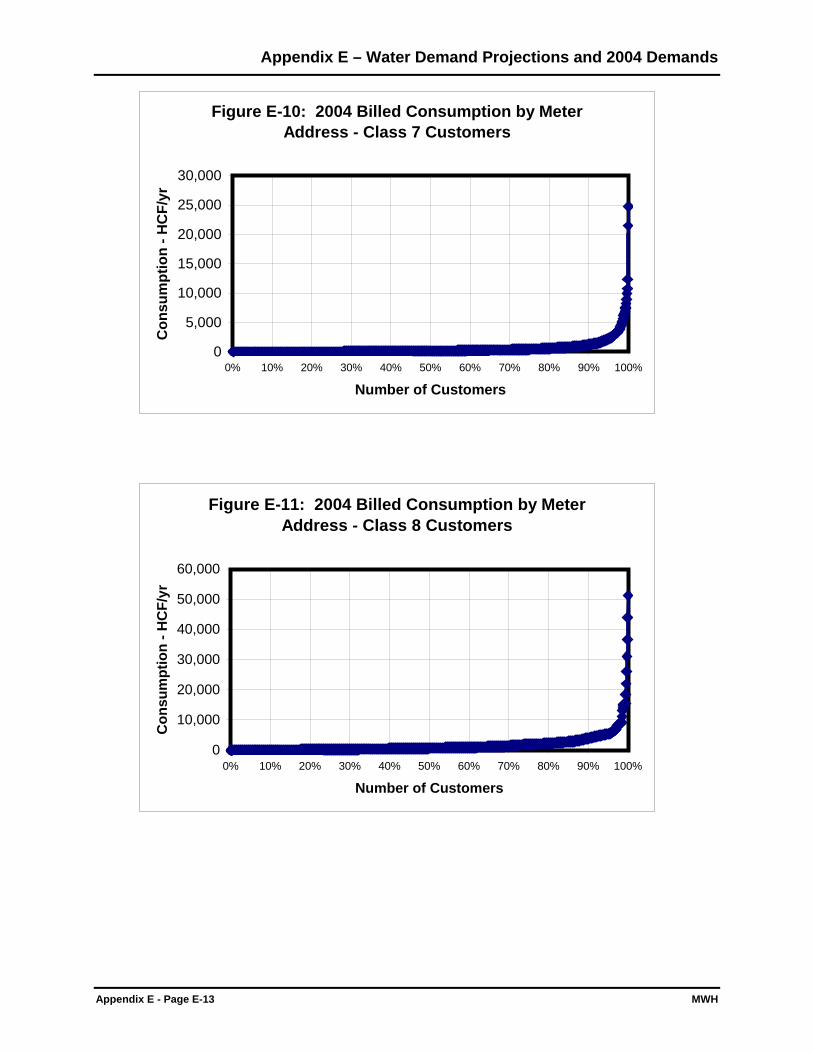
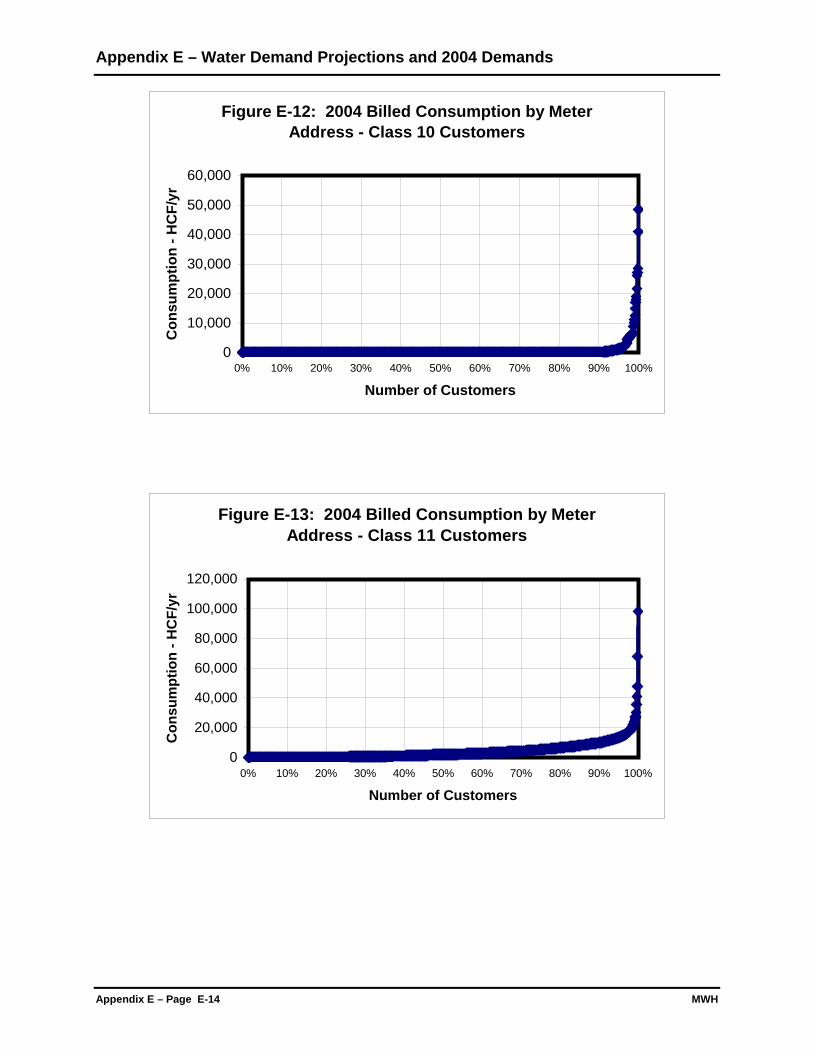
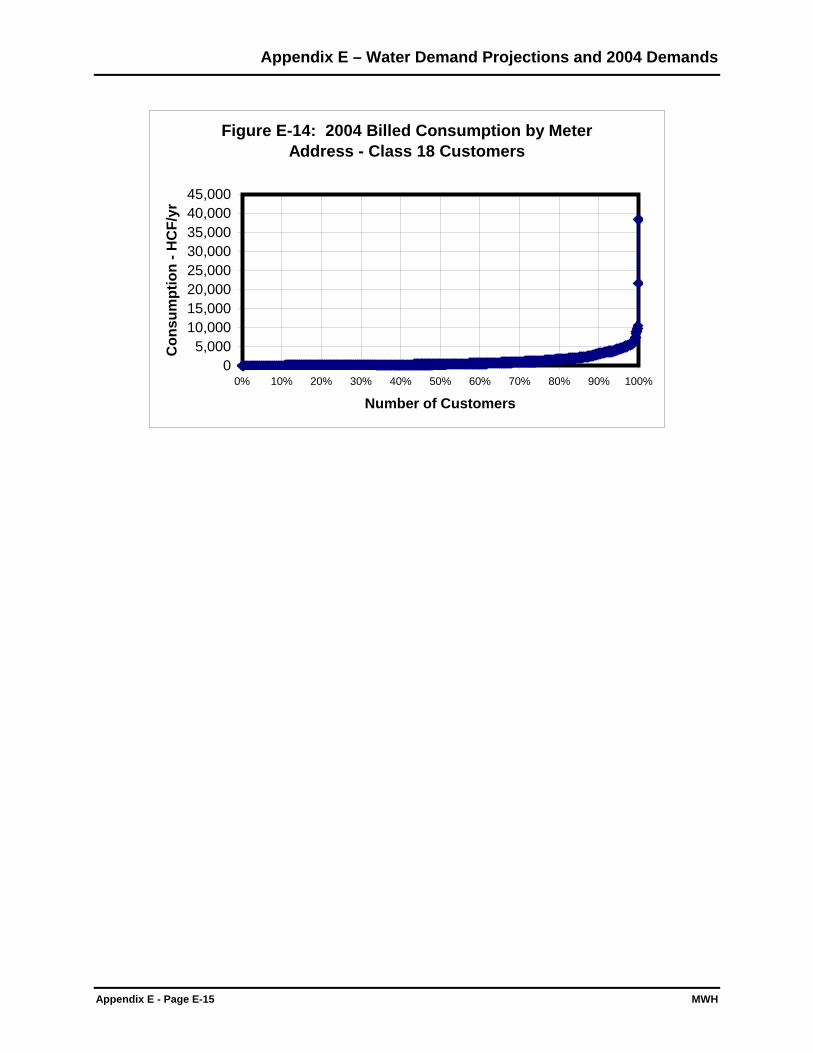
E.3 EXISTING WATER DEMANDS
Figure E-4 through E-14 below are a graphic summary of 2004 water demands based on CVWDbilling data. Consumption is given in hundreds of cubic-feet (HCF)/year.
Figure E-4: 2004 Billed Consumption by Meter Address - Class 1 Customers
02,0004,0006,0008,000
10,00012,00014,00016,000
0% 10% 20% 30% 40% 50% 60% 70% 80% 90% 100%
Number of Customers
Con
sum
ptio
n - H
CF/
yr
Figure E-5: 2004 Billed Consumption by Meter Address - Class 2 Customers
0
2,000
4,000
6,000
8,000
10,000
12,000
14,000
0% 10% 20% 30% 40% 50% 60% 70% 80% 90% 100%
Number of Customers
Con
sum
ptio
n - H
CF/
yr
Appendix E – Water Demand Projections and 2004 Demands
MWH Appendix E - Page 11
Figure E-6: 2004 Billed Consumption by Meter Address - Class 3 Customers
0
5,000
10,000
15,000
20,000
25,000
30,000
35,000
0% 10% 20% 30% 40% 50% 60% 70% 80% 90% 100%
Number of Customers
Con
sum
ptio
n - H
CF/
yr
Figure E-7: 2004 Billed Consumption by Meter Address - Class 4 Customers
0
5,000
10,000
15,000
20,000
25,000
30,000
35,000
0% 10% 20% 30% 40% 50% 60% 70% 80% 90% 100%
Number of Customers
Con
sum
ptio
n - H
CF/
yr
Appendix E – Water Demand Projections and 2004 Demands
Appendix E – Page E-12 MWH
Figure E-8: 2004 Billed Consumption by Meter Address - Class 5 Customers
0
20,000
40,000
60,000
80,000
100,000
120,000
0% 10% 20% 30% 40% 50% 60% 70% 80% 90% 100%
Number of Customers
Con
sum
ptio
n - H
CF/
yr
Figure E-9: 2004 Billed Consumption by Meter Address - Class 6 Customers
0
20,000
40,000
60,000
80,000
100,000
0% 10% 20% 30% 40% 50% 60% 70% 80% 90% 100%
Number of Customers
Con
sum
ptio
n - H
CF/
yr
Appendix E – Water Demand Projections and 2004 Demands
Appendix E - Page E-13 MWH
Figure E-10: 2004 Billed Consumption by Meter Address - Class 7 Customers
0
5,000
10,000
15,000
20,000
25,000
30,000
0% 10% 20% 30% 40% 50% 60% 70% 80% 90% 100%
Number of Customers
Con
sum
ptio
n - H
CF/
yr
Figure E-11: 2004 Billed Consumption by Meter Address - Class 8 Customers
0
10,000
20,000
30,000
40,000
50,000
60,000
0% 10% 20% 30% 40% 50% 60% 70% 80% 90% 100%
Number of Customers
Con
sum
ptio
n - H
CF/
yr
Appendix E – Water Demand Projections and 2004 Demands
Appendix E – Page E-14 MWH
Figure E-12: 2004 Billed Consumption by Meter Address - Class 10 Customers
0
10,000
20,000
30,000
40,000
50,000
60,000
0% 10% 20% 30% 40% 50% 60% 70% 80% 90% 100%
Number of Customers
Con
sum
ptio
n - H
CF/
yr
Figure E-13: 2004 Billed Consumption by Meter Address - Class 11 Customers
0
20,000
40,000
60,000
80,000
100,000
120,000
0% 10% 20% 30% 40% 50% 60% 70% 80% 90% 100%
Number of Customers
Con
sum
ptio
n - H
CF/
yr
Appendix E – Water Demand Projections and 2004 Demands
Appendix E - Page E-15 MWH
Figure E-14: 2004 Billed Consumption by Meter Address - Class 18 Customers
05,000
10,00015,00020,00025,00030,00035,00040,00045,000
0% 10% 20% 30% 40% 50% 60% 70% 80% 90% 100%
Number of Customers
Con
sum
ptio
n - H
CF/
yr
Appendix E – Water Demand Projections and 2004 Demands
Appendix E – Page E-16 MWH
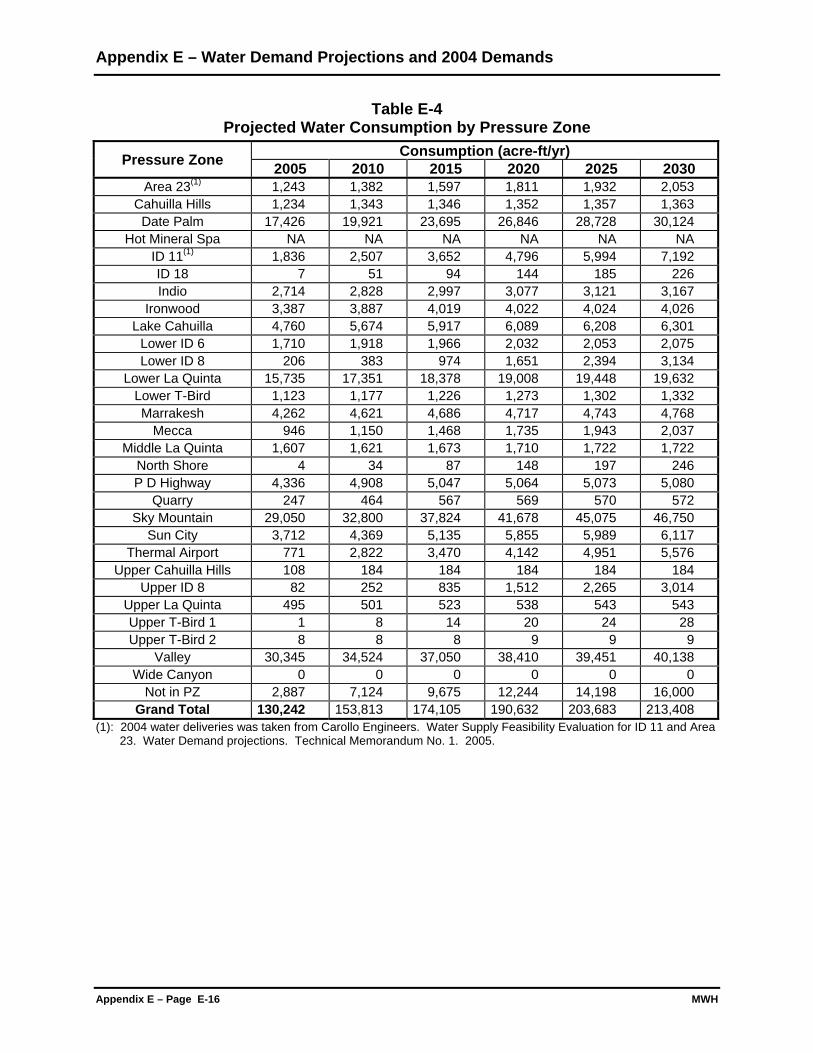
Table E-4Projected Water Consumption by Pressure Zone
Consumption (acre-ft/yr)Pressure Zone 2005 2010 2015 2020 2025 2030Area 23(1) 1,243 1,382 1,597 1,811 1,932 2,053
Cahuilla Hills 1,234 1,343 1,346 1,352 1,357 1,363Date Palm 17,426 19,921 23,695 26,846 28,728 30,124
Hot Mineral Spa NA NA NA NA NA NAID 11(1) 1,836 2,507 3,652 4,796 5,994 7,192ID 18 7 51 94 144 185 226Indio 2,714 2,828 2,997 3,077 3,121 3,167
Ironwood 3,387 3,887 4,019 4,022 4,024 4,026Lake Cahuilla 4,760 5,674 5,917 6,089 6,208 6,301
Lower ID 6 1,710 1,918 1,966 2,032 2,053 2,075Lower ID 8 206 383 974 1,651 2,394 3,134
Lower La Quinta 15,735 17,351 18,378 19,008 19,448 19,632Lower T-Bird 1,123 1,177 1,226 1,273 1,302 1,332Marrakesh 4,262 4,621 4,686 4,717 4,743 4,768
Mecca 946 1,150 1,468 1,735 1,943 2,037Middle La Quinta 1,607 1,621 1,673 1,710 1,722 1,722
North Shore 4 34 87 148 197 246P D Highway 4,336 4,908 5,047 5,064 5,073 5,080
Quarry 247 464 567 569 570 572Sky Mountain 29,050 32,800 37,824 41,678 45,075 46,750
Sun City 3,712 4,369 5,135 5,855 5,989 6,117Thermal Airport 771 2,822 3,470 4,142 4,951 5,576
Upper Cahuilla Hills 108 184 184 184 184 184Upper ID 8 82 252 835 1,512 2,265 3,014
Upper La Quinta 495 501 523 538 543 543Upper T-Bird 1 1 8 14 20 24 28Upper T-Bird 2 8 8 8 9 9 9
Valley 30,345 34,524 37,050 38,410 39,451 40,138Wide Canyon 0 0 0 0 0 0
Not in PZ 2,887 7,124 9,675 12,244 14,198 16,000Grand Total 130,242 153,813 174,105 190,632 203,683 213,408
(1): 2004 water deliveries was taken from Carollo Engineers. Water Supply Feasibility Evaluation for ID 11 and Area23. Water Demand projections. Technical Memorandum No. 1. 2005.
§̈ ¦10
§̈ ¦10
74
86
Ther
mal
Airp
ort
111
111
62
ID 1
1
Valle
y
Indi
o
ID 1
8
Sky
Mou
ntai
nSu
n C
ity
Low
er ID
8U
pper
ID 8
Area
23
Lake
Cah
uilla
Dat
e P
alm
Sunr
ise
Mec
ca
Low
er L
a Q
uint
a
Hot
Min
eral
Spa
Nor
th S
hore
Ironw
ood
Mar
rake
sh
Cah
uilla
Hills
Qua
rry
Wid
e C
anyo
n
P D
Hig
hway
Low
er ID
6 Mid
dle
La Q
uint
a
Low
er T
-Bird
Upp
er L
a Q
uint
a
Upp
er T
-Bird
1
Upp
er C
ahui
lla H
ills
Upp
er T
-Bird
2
Salto
n Se
a
Lege
nd
Hig
hway
s
CV
WD
Bou
ndar
y
Cou
nty
Bor
der
Figu
re E
-15
Pr
essu
re Z
ones
Wat
erbo
dies
03
69
1.5
Mile
s

Appendix E – Water Demand Projections and 2004 Demands
Appendix E - Page E-19 MWH
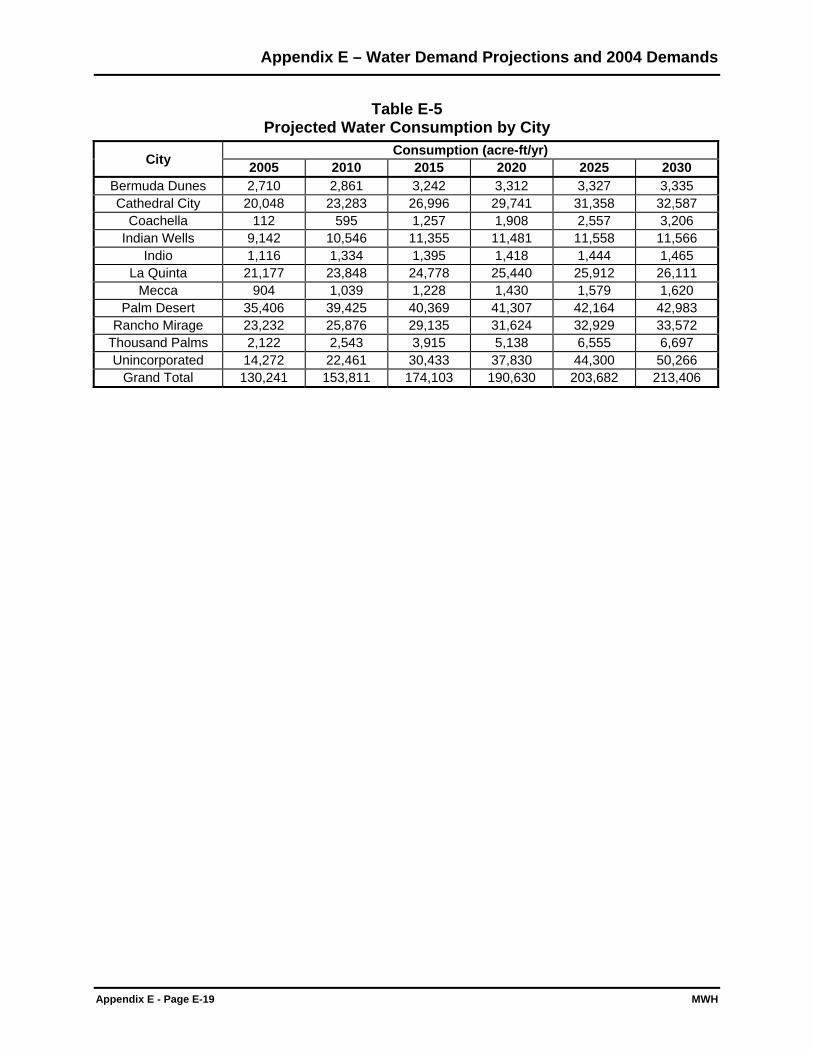
Table E-5Projected Water Consumption by City
Consumption (acre-ft/yr)City 2005 2010 2015 2020 2025 2030
Bermuda Dunes 2,710 2,861 3,242 3,312 3,327 3,335Cathedral City 20,048 23,283 26,996 29,741 31,358 32,587
Coachella 112 595 1,257 1,908 2,557 3,206Indian Wells 9,142 10,546 11,355 11,481 11,558 11,566
Indio 1,116 1,334 1,395 1,418 1,444 1,465La Quinta 21,177 23,848 24,778 25,440 25,912 26,111
Mecca 904 1,039 1,228 1,430 1,579 1,620Palm Desert 35,406 39,425 40,369 41,307 42,164 42,983
Rancho Mirage 23,232 25,876 29,135 31,624 32,929 33,572Thousand Palms 2,122 2,543 3,915 5,138 6,555 6,697Unincorporated 14,272 22,461 30,433 37,830 44,300 50,266
Grand Total 130,241 153,811 174,103 190,630 203,682 213,406

MWH Appendix F - Page 1
Appendix FWater Management Plan
Executive SummaryINTRODUCTION
Water resources management in the arid west involves many challenges. Droughts, limitedsupplies, increasing demands, water quality degradation - all of these factors must be taken intoconsideration to provide a safe and reliable water supply for the Coachella Valley. TheCoachella Valley Water District (CVWD or District) is developing a comprehensive WaterManagement Plan (Plan) that will assure adequate quantities of safe, high-quality water supplyfor the Coachella Valley well into this century.
As part of the planning process, alternatives have been formulated, and a preferred alternative hasbeen identified. Public comment will be solicited on the Plan in the form of public forums andworkshops which will invite input from the general public, taxpayers, water users, localgovernments, tribal interests, federal and state agencies, and other Colorado River water users.
The Coachella Valley
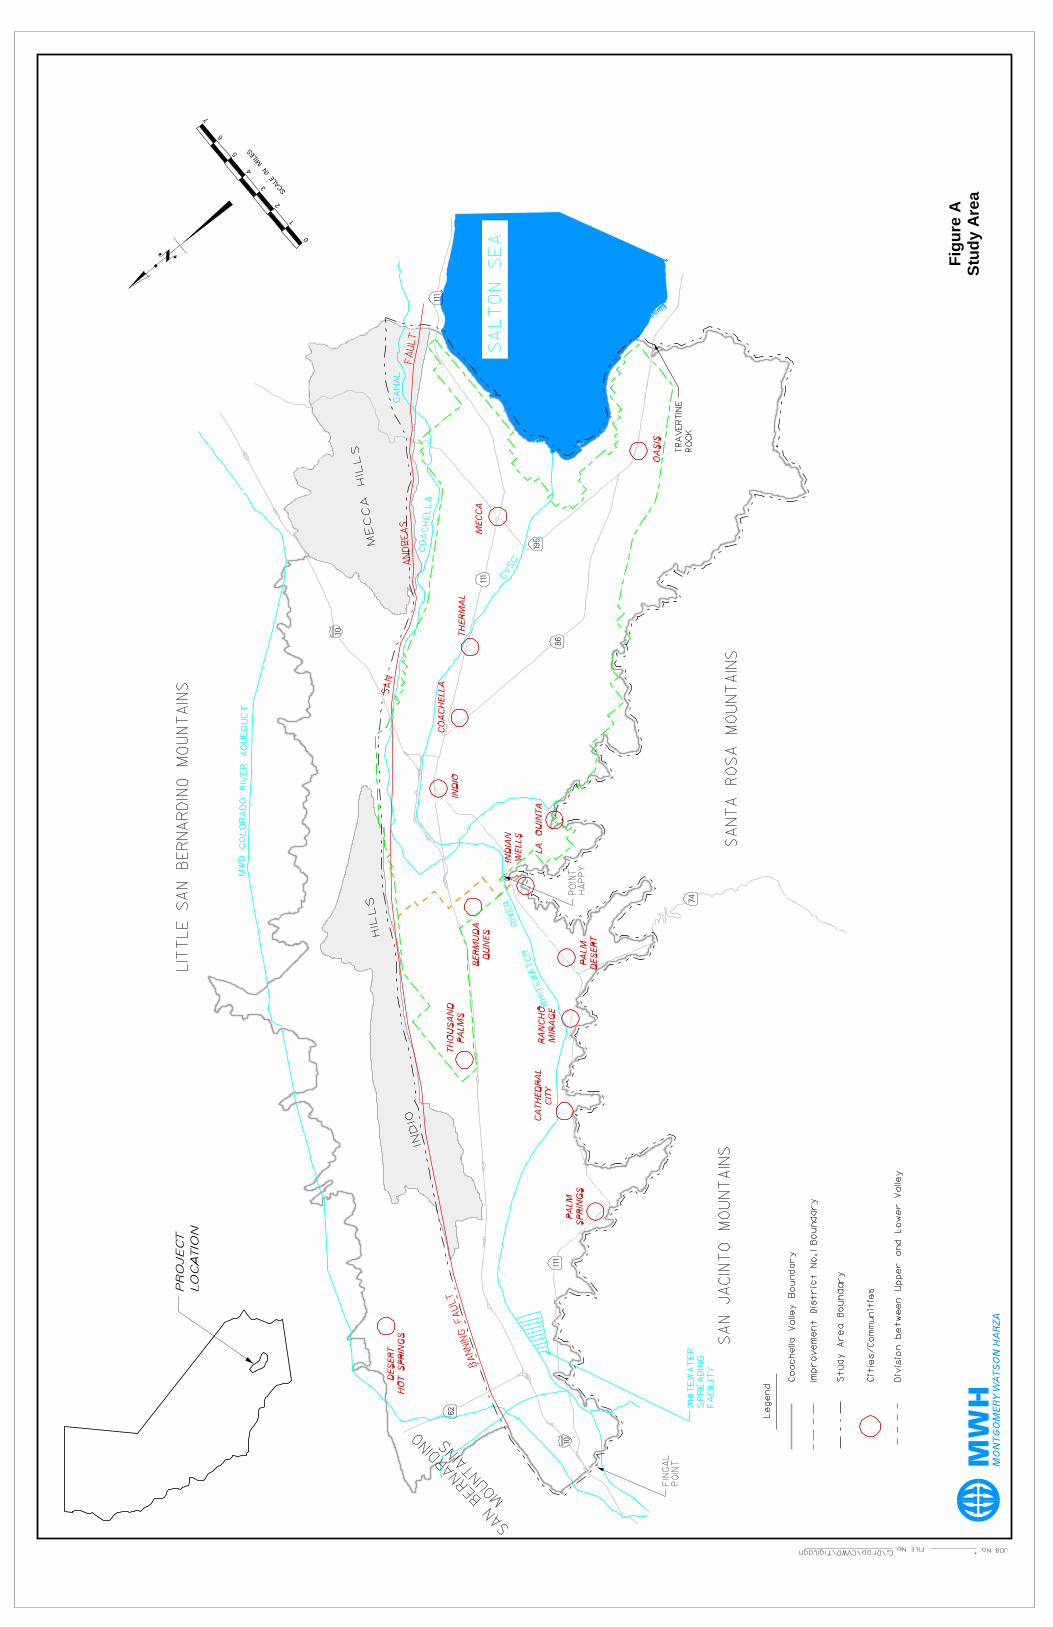
For purposes of this Water Management Plan, the Coachella Valley is divided into the UpperValley and the Lower Valley. Generally, the Upper Valley is a resort/recreation-based economydeveloped on groundwater while the Lower Valley is an agricultural-based economy with accessto Colorado River water imported via the Coachella Canal. Geographically, the Lower Valley issoutheast of a line extending from Washington Street and Point Happy northeast to the IndioHills near Jefferson Street, and the Upper Valley is northwest of this line (Figure A).
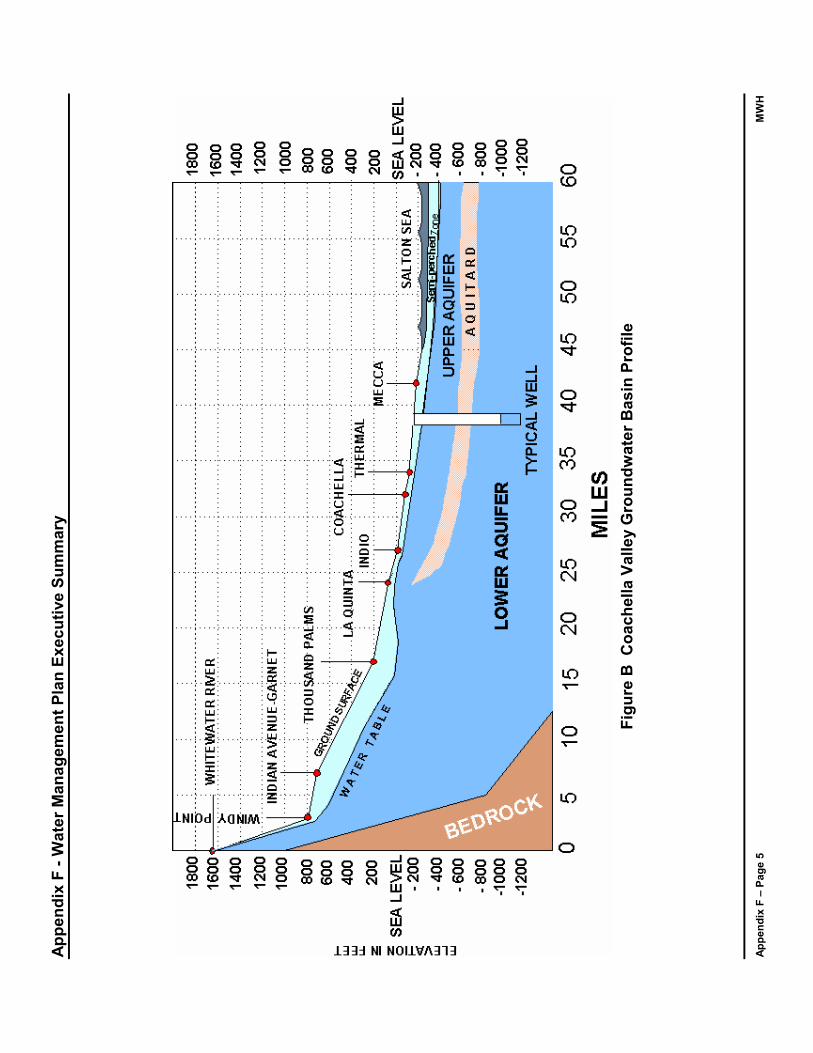
The Coachella Valley’s groundwater basin can be described as a giant tilted bathtub full of sand,with the high end at the northwest edge of the valley near Whitewater and the low end at theSalton Sea. Water placed on the ground surface in the Upper Valley will percolate through thesand directly into the groundwater aquifer. However in the Lower Valley, several imperviousclay layers lie between the ground surface and the main groundwater aquifer. Water applied tothe surface in the Lower Valley does not easily reach the lower groundwater aquifers due to theseimpervious clay layers. The only natural outlet for water in the Coachella Valley is throughsubsurface outflow to the Salton Sea. A profile of the Coachella Valley groundwater basin inprovided in Figure B.
Historical Water Management
Water management in the Coachella Valley began as early as 1915 when, with groundwaterlevels falling, the need for a supplemental water source was recognized in order for the CoachellaValley to continue to flourish. The Coachella Valley Stormwater District was formed in 1915
Appendix F - Water Management Plan Executive Summary
Appendix F – Page 2 MWH
followed by formation of CVWD in January 1918. In 1918, a contract had been awarded forconstruction of spreading facilities in the Whitewater River northwest of Palm Springs.
During the next 16 years, District activities focused on obtaining imported Colorado River water.In 1934, negotiations with the federal government were completed, and plans were in place forthe construction of the Coachella Branch of the All American Canal. Construction of the Canalbegan in 1938, was interrupted by World War II, and was finally completed with the firstdeliveries of imported Colorado River water to area growers in 1949. The impact of importedwater on the Coachella Valley was almost immediate. By the early 1960s, water levels in theLower Valley had returned to their historical highs.
Although groundwater levels in the Lower Valley had stabilized, water levels in the UpperValley continued to decline. In 1963, the District and Desert Water Agency (DWA) entered intocontracts with the State of California for entitlements to State Water Project (SWP) water. Toavoid the estimated $150 million cost of constructing an aqueduct to bring SWP water directly tothe Coachella Valley, the District and the DWA entered into an agreement with The MetropolitanWater District of Southern California (Metropolitan) to exchange Colorado River water for SWPwater.
Starting in 1973, the District and DWA began exchanging their annual SWP entitlement of61,200 acre-ft with Metropolitan to recharge Upper Valley groundwater supplies at theWhitewater Spreading Facility. CVWD, DWA, and Metropolitan also signed an advancedelivery agreement in 1984 that allows Metropolitan to store additional SWP water in wet years.By 1999, the spreading facility had percolated in excess of 1.7 million acre-ft of Colorado Riverwater exchanged for SWP water.
Water levels in the Lower Valley remained relatively stable until the 1980s when they once againbegan to decline. Groundwater demand had once again exceeded supply, resulting ingroundwater level decreases of 60 feet or more in some parts of the Lower Valley. Becausegroundwater recharge in the Lower Valley is complicated by the existence of relativelyimpervious clay layers in the Valley floor, the District began looking for sites sufficiently faraway from the main clay layer to allow groundwater recharge. In 1995, the District beganoperating the Dike No. 4 pilot recharge facility (located on the west side of the Lower Valley),which has successfully demonstrated that Lower Valley groundwater recharge is possible. Thefacility was expanded in 1998 in order to determine the ultimate recharge capacity of a facility atthis location. Assuming favorable results, it may be possible to recharge as much as 30,000 to60,000 acre-ft/yr at this location.
Recycled water has been a priority water management practice in the Coachella Valley for manyyears. The first permit to use recycled water for golf course irrigation in the Coachella Valleywas issued by the Regional Water Quality Control Board to the Palm Desert Country Club in1965. Today, the District and the DWA provide more than 8,000 acre-ft of recycled water eachyear for golf course and greenbelt irrigation purposes from four wastewater treatment facilities.
Figu
re A
Stud
y Ar
ea

Appe
ndix
F -
Wat
er M
anag
emen
t Pla
n Ex
ecut
ive
Sum
mar
y
Appe
ndix
F –
Pag
e 5
MW
H
Figu
re B
Coa
chel
la V
alle
y G
roun
dwat
er B
asin
Pro
file
Appendix F - Water Management Plan Executive Summary
Appendix F – Page 6 MWH
Water conservation is also a key ingredient for managing water demands in the Coachella Valley.Water efficient methods such as drip irrigation have changed the face of farming in the CoachellaValley. The District continually educates Valley residents in water-efficient landscapingtechniques, works with local farmers to ensure reasonable beneficial use of irrigation water, andprovides in-school visits to more than 21,000 children a year, educating them about waterconservation, water value, and aquatic safety.
Sources of Water Supply
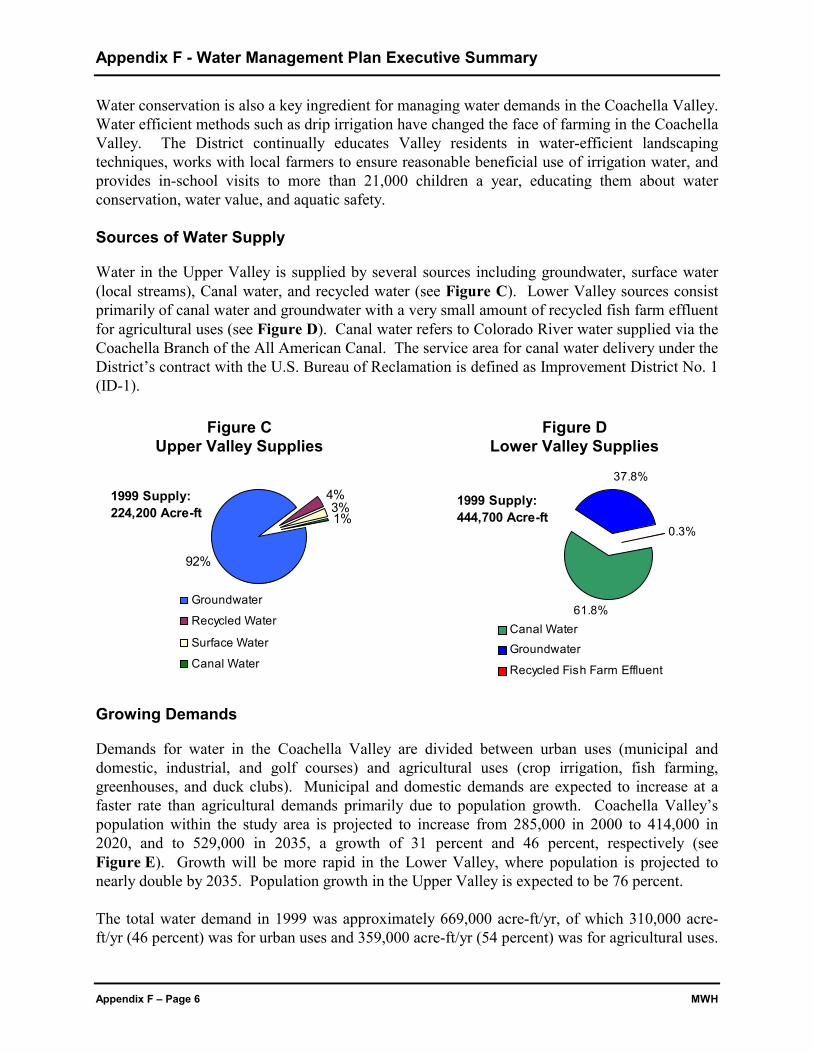
Water in the Upper Valley is supplied by several sources including groundwater, surface water(local streams), Canal water, and recycled water (see Figure C). Lower Valley sources consistprimarily of canal water and groundwater with a very small amount of recycled fish farm effluentfor agricultural uses (see Figure D). Canal water refers to Colorado River water supplied via theCoachella Branch of the All American Canal. The service area for canal water delivery under theDistrict’s contract with the U.S. Bureau of Reclamation is defined as Improvement District No. 1(ID-1).
Figure C Figure DUpper Valley Supplies Lower Valley Supplies
Growing Demands
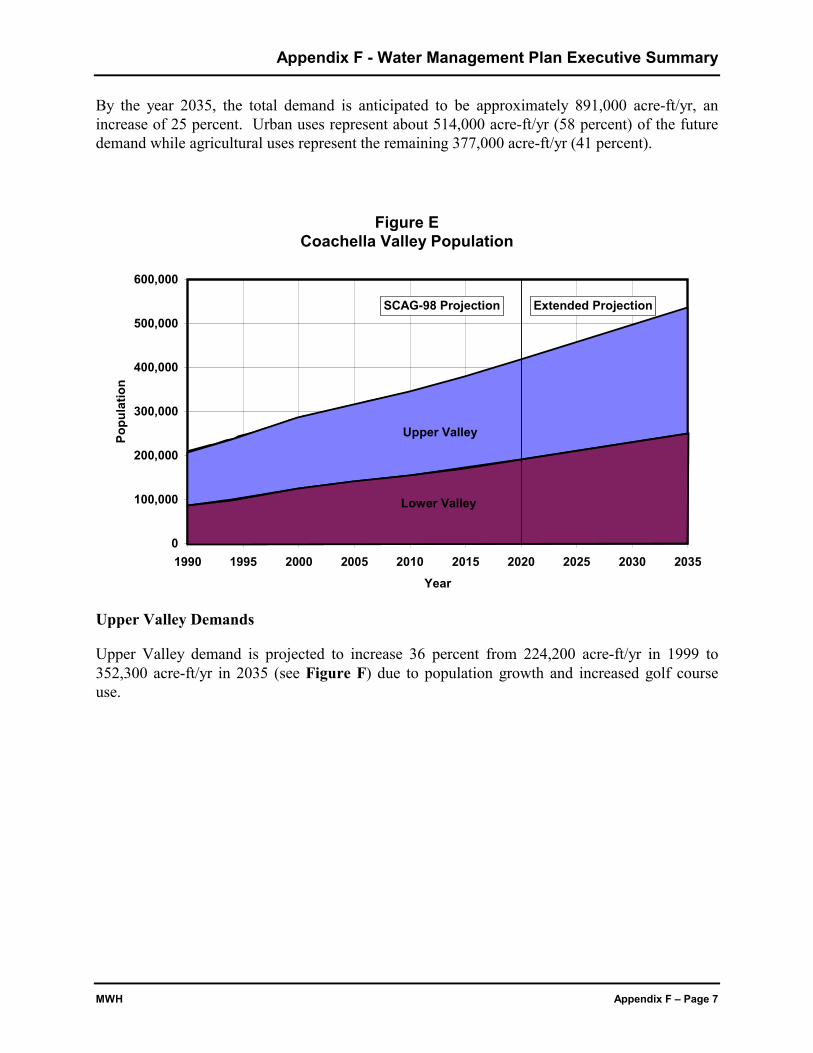
Demands for water in the Coachella Valley are divided between urban uses (municipal anddomestic, industrial, and golf courses) and agricultural uses (crop irrigation, fish farming,greenhouses, and duck clubs). Municipal and domestic demands are expected to increase at afaster rate than agricultural demands primarily due to population growth. Coachella Valley’spopulation within the study area is projected to increase from 285,000 in 2000 to 414,000 in2020, and to 529,000 in 2035, a growth of 31 percent and 46 percent, respectively (seeFigure E). Growth will be more rapid in the Lower Valley, where population is projected tonearly double by 2035. Population growth in the Upper Valley is expected to be 76 percent.
The total water demand in 1999 was approximately 669,000 acre-ft/yr, of which 310,000 acre-ft/yr (46 percent) was for urban uses and 359,000 acre-ft/yr (54 percent) was for agricultural uses.
92%
4%3%1%
Groundwater
Recycled Water
Surface Water
Canal Water
1999 Supply:224,200 Acre-ft
61.8%
37.8%
0.3%
Canal Water
Groundwater
Recycled Fish Farm Effluent
1999 Supply:444,700 Acre-ft
Appendix F - Water Management Plan Executive Summary
MWH Appendix F – Page 7
By the year 2035, the total demand is anticipated to be approximately 891,000 acre-ft/yr, anincrease of 25 percent. Urban uses represent about 514,000 acre-ft/yr (58 percent) of the futuredemand while agricultural uses represent the remaining 377,000 acre-ft/yr (41 percent).
Figure ECoachella Valley Population
0
100,000
200,000
300,000
400,000
500,000
600,000
1990 1995 2000 2005 2010 2015 2020 2025 2030 2035
Year
Popu
latio
n
SCAG-98 Projection Extended Projection
Upper Valley
Lower Valley
Upper Valley Demands
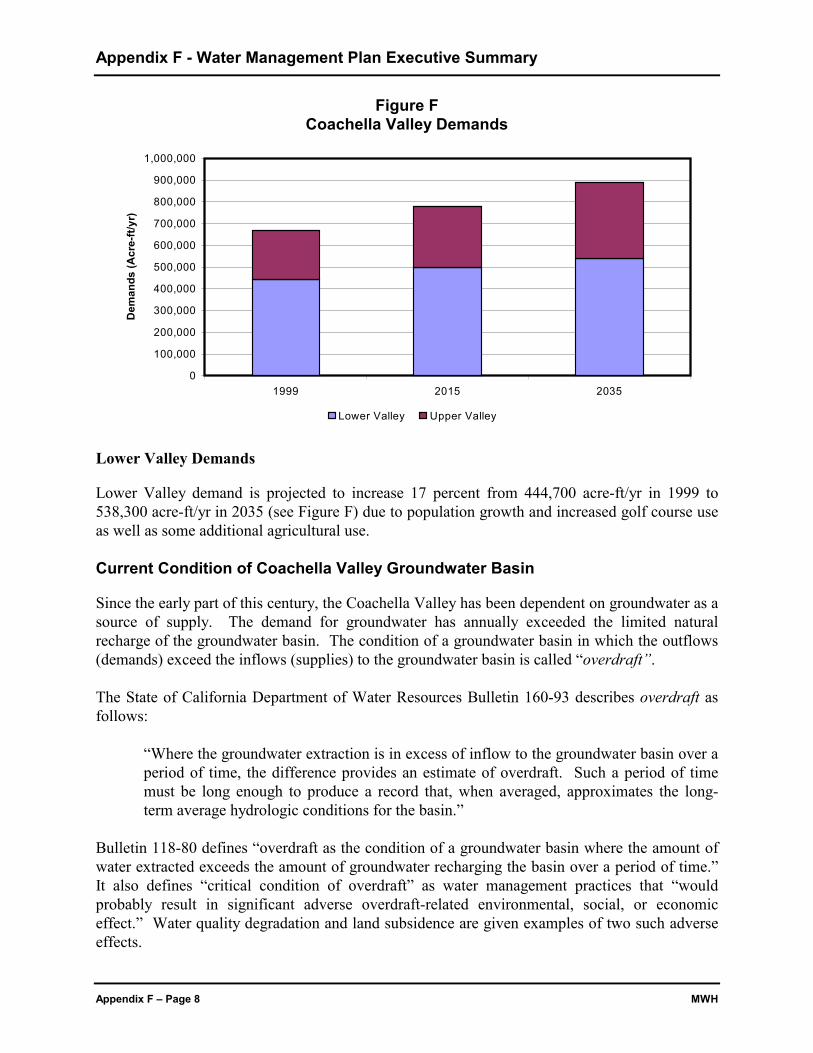
Upper Valley demand is projected to increase 36 percent from 224,200 acre-ft/yr in 1999 to352,300 acre-ft/yr in 2035 (see Figure F) due to population growth and increased golf courseuse.
Appendix F - Water Management Plan Executive Summary
Appendix F – Page 8 MWH
Figure FCoachella Valley Demands
0
100,000
200,000
300,000
400,000
500,000
600,000
700,000
800,000
900,000
1,000,000
1999 2015 2035
Dem
ands
(Acr
e-ft/
yr)
Lower Valley Upper Valley
Lower Valley Demands
Lower Valley demand is projected to increase 17 percent from 444,700 acre-ft/yr in 1999 to538,300 acre-ft/yr in 2035 (see Figure F) due to population growth and increased golf course useas well as some additional agricultural use.
Current Condition of Coachella Valley Groundwater Basin
Since the early part of this century, the Coachella Valley has been dependent on groundwater as asource of supply. The demand for groundwater has annually exceeded the limited naturalrecharge of the groundwater basin. The condition of a groundwater basin in which the outflows(demands) exceed the inflows (supplies) to the groundwater basin is called “overdraft”.
The State of California Department of Water Resources Bulletin 160-93 describes overdraft asfollows:
“Where the groundwater extraction is in excess of inflow to the groundwater basin over aperiod of time, the difference provides an estimate of overdraft. Such a period of timemust be long enough to produce a record that, when averaged, approximates the long-term average hydrologic conditions for the basin.”
Bulletin 118-80 defines “overdraft as the condition of a groundwater basin where the amount ofwater extracted exceeds the amount of groundwater recharging the basin over a period of time.”It also defines “critical condition of overdraft” as water management practices that “wouldprobably result in significant adverse overdraft-related environmental, social, or economiceffect.” Water quality degradation and land subsidence are given examples of two such adverseeffects.
Appendix F - Water Management Plan Executive Summary
MWH Appendix F – Page 9
This overdraft condition or “mining” of the groundwater has caused groundwater levels todecrease more than 60 feet in portions of the Lower Valley and raised concerns about waterquality degradation and land subsidence. Groundwater levels in the Upper Valley have alsodecreased substantially, except in the areas near the Whitewater Spreading Facility whereartificial recharge has successfully raised water levels.
Continued overdraft will have serious consequences for the Coachella Valley. The immediateand direct effect will be increased groundwater pumping costs for all water users. Wells willhave to be deepened, larger pumps will have to be installed, and energy costs will increase as thepump lifts increase. Eventually, the need for deeper wells and larger pumps will have an adverseimpact on agriculture and will increase the cost of water for municipalities, resorts, homes, andbusinesses. Continued decline of groundwater levels could result in a substantial and possiblyirreversible degradation of water quality in the groundwater basin.
Continued overdraft also increases the possibility of land subsidence within the Valley. Asgroundwater is removed, the dewatered soil begins to compress from the weight of the groundabove, causing subsidence. Subsidence can cause ground fissures and damage to buildings,homes, sidewalks, streets, and buried pipelines - all of the structures that make the Valley livable.Recent studies indicate that as much as 7 centimeters of subsidence occurred in the Palm Desertarea between 1996 and 1998.
The calculation of an annual value of overdraft that accounts for all of the components ofoverdraft is difficult. One method of estimating the overdraft is to look at the net annual changein freshwater storage in the basin. Change in freshwater storage is the difference between theinflows and outflows of the basin, excluding the inflows of poor-quality water (irrigation returnflows and Salton Sea water) which are induced by the overdraft. By excluding these inflows, amore accurate approximation of actual annual overdraft is possible. In 1999, the change infreshwater storage in the Coachella Valley is estimated to be 136,700 acre-ft/yr. The cumulativechange in freshwater storage from 1936 to 1999 is estimated to be nearly 4.8 million acre-ft i.e.,4.8 million acre-ft of freshwater was withdrawn from the basin and not replaced. Usingfreshwater storage as an indicator of overdraft does not account for all aspects of overdraft suchas subsidence and other water quality, environmental, social, and economic effects.
Action Required by Coachella Valley Water District
It is clear that the continued decline of groundwater levels and overdraft is unacceptable. TheDistrict is charged with providing a reliable, safe water supply to its area of the Valley now andin the future. In order to fulfill its obligations to Valley residents, the District must take action toprevent continuing decline of groundwater levels and degradation of water quality. Acomprehensive water management plan will guide the District in its efforts to preventgroundwater level decline, protect water quality, prevent subsidence, and expand its waterconservation programs.
Appendix F - Water Management Plan Executive Summary
Appendix F – Page 10 MWH
WATER MANAGEMENT PLAN PROCESS
To meet its responsibilities for ensuring that there are adequate water supplies in the future, theDistrict initiated a planning process in the early 1990s. The process initially addressed the LowerValley, but was expanded to include the entire Coachella Valley in 1995. This Plan is theproduct of that process.
Goals and Objectives
The goal of the Water Management Plan is to assure adequate quantities of safe, high-qualitywater at the lowest cost to Coachella Valley water users. To meet this goal, four objectives havebeen identified:
1. eliminate groundwater overdraft and its associated adverse impacts, including:
• groundwater storage reductions,
• declining groundwater levels,
• land subsidence, and
• water quality degradation,
2. maximize conjunctive use opportunities,
3. minimize adverse economic impacts to Coachella Valley water users, and
4. minimize environmental impacts.
Formulation of Plan Alternatives
The District staff and consultants conducted several brainstorming sessions to identify potentialwater management elements for inclusion in the Plan. Potential elements were consideredwithout regard to cost, potential environmental impact, technical feasibility, or otherconsiderations. Additional input was obtained through public meetings with local Indian tribes,state and federal agencies, regional and local governments, other interested and affected parties,and the public at large resulting in additional potential management elements for consideration.A detailed description of the element screening and alternative formulation process is containedin Appendix B.
Potential management elements were subsequently organized into six categories: pumpingrestrictions, demand reduction , local water sources, imported water sources, water managementactions, and water quality approaches. Each of the potential management elements was ratedbased on the element’s ability to reduce overdraft, technical feasibility, potential environmentalimpacts, costs, legal and regulatory factors, and regional economic impacts. Based on theseratings, numerous potential elements were eliminated from further consideration. The remaining “short-listed” elements were organized into the following conceptual managementalternatives:
Appendix F - Water Management Plan Executive Summary
MWH Appendix F – Page 11
• No Project,
• Pumping Restrictions,
• Demand Management,
• Groundwater Recharge,
• Source Substitution, and
• Combinations of the above.
With the exception of the No Project alternative, which is required under the CaliforniaEnvironmental Quality Act (CEQA), a preliminary evaluation of each alternative was performedto determine which alternatives should be formally considered and evaluated in the Plan. Theevaluation process involved technical analyses coupled with professional judgement andexperience. The following four proposed alternative management scenarios were selected forevaluation within the Plan. Alternative 1 – No Project
The No Project Alternative, would involve continuation of current water management actions bythe District which include:
• groundwater recharge in the Upper Valley at historical average rates (approximately50,000 acre-ft/yr),
• supplying Canal water to existing golf courses and agricultural users,
• supplying Canal water to all new agricultural users and new golf courses within ID-1,
• supplying excess recycled wastewater effluent beyond percolation capacity from the PalmSprings Wastewater Reclamation Plant (WRP-10) to area golf courses, and
• domestic, golf course, and agricultural water conservation at current levels. Alternative 2 – Pumping Restriction by Adjudication
Alternative 2 assumes court-ordered restrictions imposed through a process in which the waterrights of the basin are allotted to individual groundwater pumpers. Court-ordered restrictionswould likely require groundwater pumping be reduced throughout the Coachella Valley to thepoint where basin inflows and outflows balance. This balance point, also known as perennialyield, is the amount of groundwater that can be pumped each year without adversely depletingthe basin, lowering long-term groundwater levels, or degrading water quality. The exact limit ofindividual well pumpage is determined in the adjudication process.
Since overdraft exists in both the Upper and Lower Valleys, any adjudication will necessarilyapply to both areas. The overdrafts in the Upper and Lower Valleys are different; thus thepumping reductions associated with the adjudication could be computed separately for eachportion of the Valley. In order to accommodate the perennial yield of the basin, Upper Valley
Appendix F - Water Management Plan Executive Summary
Appendix F – Page 12 MWH
pumping would have to be reduced by approximately 35 percent while in the Lower Valleypumping would have to be reduced by approximately 75 percent.
Alternative 3 – Management of Demand and Maximization of Local Resources
Alternative 3 focuses on maximizing the use of available local water resources and managingwater demand while maintaining imported water usage at approximately current levels. Demandwould be managed, to the extent practical, by maximizing water conservation for both urban andagricultural uses. Local resources would be maximized by the increased use of recycled water.The primary features of Alternative 3 include:
• implementation of extensive water conservation measures for urban water use,
• reduction of non-agricultural irrigation demand through mandatory xeriscaping for newresidential, commercial, and golf course properties,
• increased conservation by agricultural water users through the use of more efficientirrigation technology and application methods,
• increasing recycled water use by Upper and Lower Valley golf courses, homeownerassociations, and agricultural users, and
• fixing imported water supplies at historical levels.
Alternative 4 – Combination Alternative
Alternative 4 engages elements within three basic water management categories: conservation,groundwater recharge, and source substitution. The most feasible and cost effective managementelements are combined to form an alternative that incorporates the following:
• urban, golf course, and agricultural conservation measures.
• groundwater recharge in the Upper and Lower Valleys.
• numerous source substitution elements including
• Canal water to agricultural groundwater users within ID-1,
• Canal water for golf course irrigation within ID-1,
• additional recycled water to Upper Valley golf courses,
• desalted agricultural drain water for agricultural irrigation outside ID-1,
• recycled water for agricultural irrigation in Lower Valley,
• treated Canal water for urban uses within ID-1,
• direct delivery of SWP exchange water for Upper Valley golf course irrigation.
Appendix F - Water Management Plan Executive Summary
MWH Appendix F – Page 13
EVALUATION OF ALTERNATIVES
Each proposed alternative was evaluated against a set of specific criteria based on the goals andobjectives of the Plan. The evaluation criteria are the foundation of the overall evaluationprocess used to select the preferred alternative. The evaluation process and criteria are describedbelow.
Evaluation Process
The evaluation process involved technical analyses, application of the evaluation criteria,professional judgment, and experience. To assist in the evaluation process, the Districtdeveloped a three-dimensional groundwater model (model) for the Coachella Valley. The modelprovides a consistent, scientific basis for identifying the impacts of the proposed managementalternatives on groundwater basin storage, groundwater levels, land subsidence, and waterquality. A brief description of the model is provided in Appendix C.
Another important technical evaluation tool was an economic evaluation of the four managementalternatives. The purpose of this evaluation was to provide a comparative economic and financialevaluation among the four alternatives within the Coachella Valley as a whole. The evaluationprovided a reconnaissance level, order of magnitude comparison of the economic and financialeffects of each alternative. In general, the evaluation of economic and financial effects focusedon year 2015, to provide an assessment of near-term impacts, and 2035, to allow assessment oflonger-term impacts.
Evaluation Criteria
The following criteria, reflecting the goals and objectives of the Plan, were used to evaluate eachalternative:
The ability to eliminate groundwater overdraft and associated adverse impacts, including:
1. decreasing groundwater basin storage,
• declining groundwater levels,
• land subsidence,
• water quality degradation,
2. The ability to maximize conjunctive use opportunities.
3. The ability to minimize adverse economic impacts to Coachella Valley water users.
4. The ability to minimize environmental impacts.
A brief description of the specific methodology used with each evaluation criterion is discussedbelow.
Appendix F - Water Management Plan Executive Summary
Appendix F – Page 14 MWH
Criterion 1: Eliminate Overdraft and Associated Adverse Impacts
The elimination of the groundwater basin overdraft and the associated adverse impacts areprimary goals of the Plan. The inflows to the groundwater basin must meet or exceed theoutflows (an increase in groundwater storage) in order to eliminate the overdraft. Groundwaterlevels must be stabilized at levels that will prevent land subsidence and water qualitydegradation.
Changes in Groundwater Basin Storage. Change in groundwater basin storage is evaluated interms of the change in total storage and the change in freshwater storage. For each alternative,the model-predicted future (2035) groundwater inflows and outflows for both the Upper andLower Valley are compared. The changes in both total and freshwater storage are thendetermined using these estimates. For Alternative 2, the change in total storage is used torepresent the perennial yield of the groundwater basin. The change in freshwater storage is usedto estimate the groundwater overdraft.
Groundwater Levels. As groundwater levels decline due to reductions in groundwater storage,the potential for associated adverse impacts such as land subsidence and water qualitydegradation increases significantly. The changes in Upper and Lower Valley groundwater levelsfrom 1999 to 2035, as predicted by the model, are compared.Land Subsidence. A recent USGS study of land subsidence in the Lower Valley indicated thatland subsidence resulting from groundwater pumping may have occurred since the early 1990s,when groundwater levels began declining below previously recorded lows in 1949. To evaluatethe potential for land subsidence, the model-predicted 2035 groundwater levels for eachalternative are compared to the 1999 groundwater levels. If the 2035 groundwater levels arebelow the 1999 levels, the potential for land subsidence is likely to increase. Conversely, if the2035 groundwater levels are above the 1999 levels, the potential for land subsidence is reduced.
Water Quality Degradation. Water quality degradation is a serious adverse impact of overdraft.In particular, declining water levels and decreased drain flows allow the migration of poor-quality water into the underlying aquifer units of the basin and prevent the removal of appliedsalts from leaving the basin through the drains. To evaluate the potential for water qualitydegradation, the projected salt balance in 2015 and 2035 is compared to current conditions.
Criterion 2: Maximize Conjunctive Use Opportunities
Each alternative is evaluated based on the alternative's ability to maximize conjunctive useopportunities. Conjunctive use of surface and groundwater may be defined as an integrated planthat capitalizes on the combination of available surface and groundwater resources in order toachieve a reliable long-term water supply. When surface water i.e., SWP exchange water, Canalwater, recycled water, or surplus Colorado River water, is available, surface water is utilized tothe maximum extent possible. Surface water not used directly is also recharged to augmentgroundwater storage. Conversely, when surface supplies are limited, surface water resourcesmay be supplemented by pumping groundwater.
Appendix F - Water Management Plan Executive Summary
MWH Appendix F – Page 15
The conjunctive use potential of each alternative is evaluated based on its ability to:
1. store available surface water supplies,
2. extract stored water, and
3. utilize alternate sources of supply in-lieu of groundwater.
Criterion 3: Minimize Economic Impacts
This criterion provides a comparative evaluation of the economic and financial impactsassociated with the Plan alternatives. The evaluation is based on a reconnaissance-leveleconomic and financial analysis. The economic impact analysis of each alternative considers sixeconomic factors:
• economic sustainability,
• economic development,
• regional economic activity measures,
• economic and financial risks,
• direct costs, and
• indirect costs or savings.
Economic sustainability, economic development, and regional economic impact assessments aremade by comparing the projected economic conditions in the Coachella Valley and conditionsthat could occur under each Plan alternative. Criterion 4: Minimize Environmental Impacts
The District has prepared a Program Environmental Impact Report (PEIR) to fully assess thepotential environmental impacts of each alternative and to develop feasible mitigation measuresto minimize those effects. The PEIR summarizes the results of technical and environmentalanalyses and stakeholder input regarding the Plan alternatives. In addition to the criteria ongroundwater effects and water supply, the PEIR evaluates the following factors:
• surface water resources (Coachella Canal, Coachella Valley Stormwater Channel,agricultural drains, and Salton Sea),
• energy use (pumping),
• land use (crop patterns, water use patterns, golf course operations, etc.),
• population/housing
• geology/soils/seismicity (liquefaction and subsidence),
• Indian trust assets,
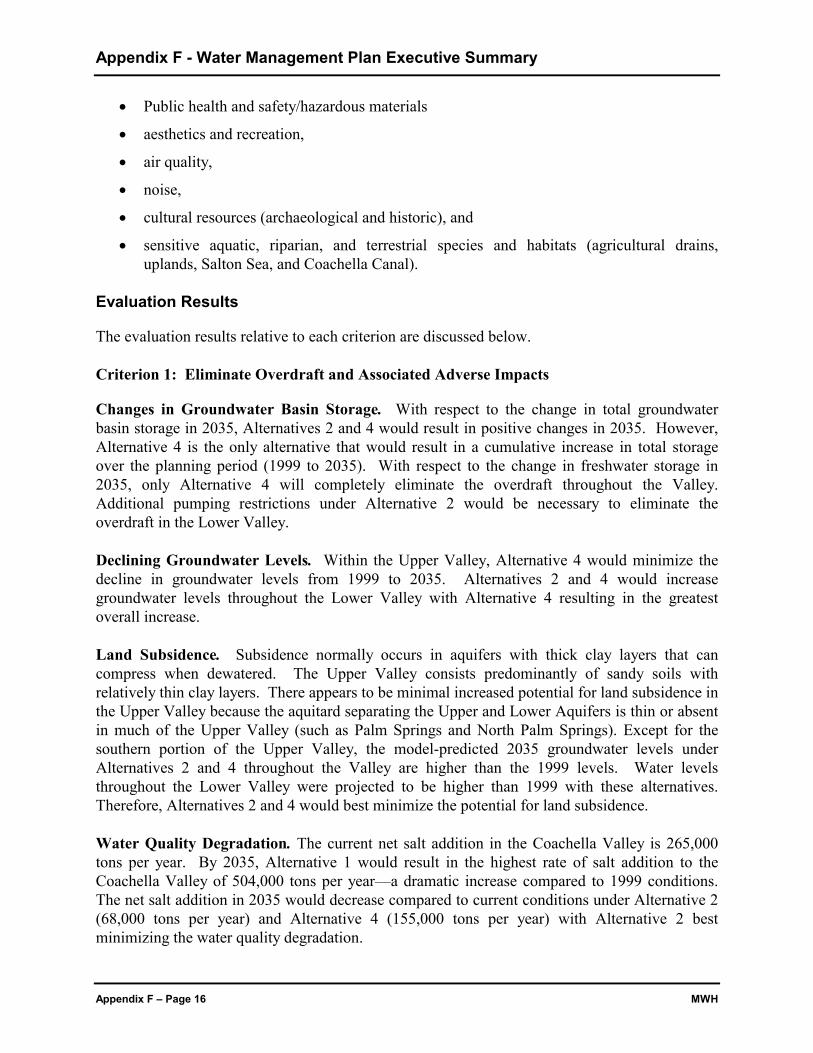
Appendix F - Water Management Plan Executive Summary
Appendix F – Page 16 MWH
• Public health and safety/hazardous materials
• aesthetics and recreation,
• air quality,
• noise,
• cultural resources (archaeological and historic), and
• sensitive aquatic, riparian, and terrestrial species and habitats (agricultural drains,uplands, Salton Sea, and Coachella Canal).
Evaluation Results
The evaluation results relative to each criterion are discussed below.
Criterion 1: Eliminate Overdraft and Associated Adverse Impacts
Changes in Groundwater Basin Storage. With respect to the change in total groundwaterbasin storage in 2035, Alternatives 2 and 4 would result in positive changes in 2035. However,Alternative 4 is the only alternative that would result in a cumulative increase in total storageover the planning period (1999 to 2035). With respect to the change in freshwater storage in2035, only Alternative 4 will completely eliminate the overdraft throughout the Valley.Additional pumping restrictions under Alternative 2 would be necessary to eliminate theoverdraft in the Lower Valley.
Declining Groundwater Levels. Within the Upper Valley, Alternative 4 would minimize thedecline in groundwater levels from 1999 to 2035. Alternatives 2 and 4 would increasegroundwater levels throughout the Lower Valley with Alternative 4 resulting in the greatestoverall increase. Land Subsidence. Subsidence normally occurs in aquifers with thick clay layers that cancompress when dewatered. The Upper Valley consists predominantly of sandy soils withrelatively thin clay layers. There appears to be minimal increased potential for land subsidence inthe Upper Valley because the aquitard separating the Upper and Lower Aquifers is thin or absentin much of the Upper Valley (such as Palm Springs and North Palm Springs). Except for thesouthern portion of the Upper Valley, the model-predicted 2035 groundwater levels underAlternatives 2 and 4 throughout the Valley are higher than the 1999 levels. Water levelsthroughout the Lower Valley were projected to be higher than 1999 with these alternatives.Therefore, Alternatives 2 and 4 would best minimize the potential for land subsidence.
Water Quality Degradation. The current net salt addition in the Coachella Valley is 265,000tons per year. By 2035, Alternative 1 would result in the highest rate of salt addition to theCoachella Valley of 504,000 tons per year—a dramatic increase compared to 1999 conditions.The net salt addition in 2035 would decrease compared to current conditions under Alternative 2(68,000 tons per year) and Alternative 4 (155,000 tons per year) with Alternative 2 bestminimizing the water quality degradation.
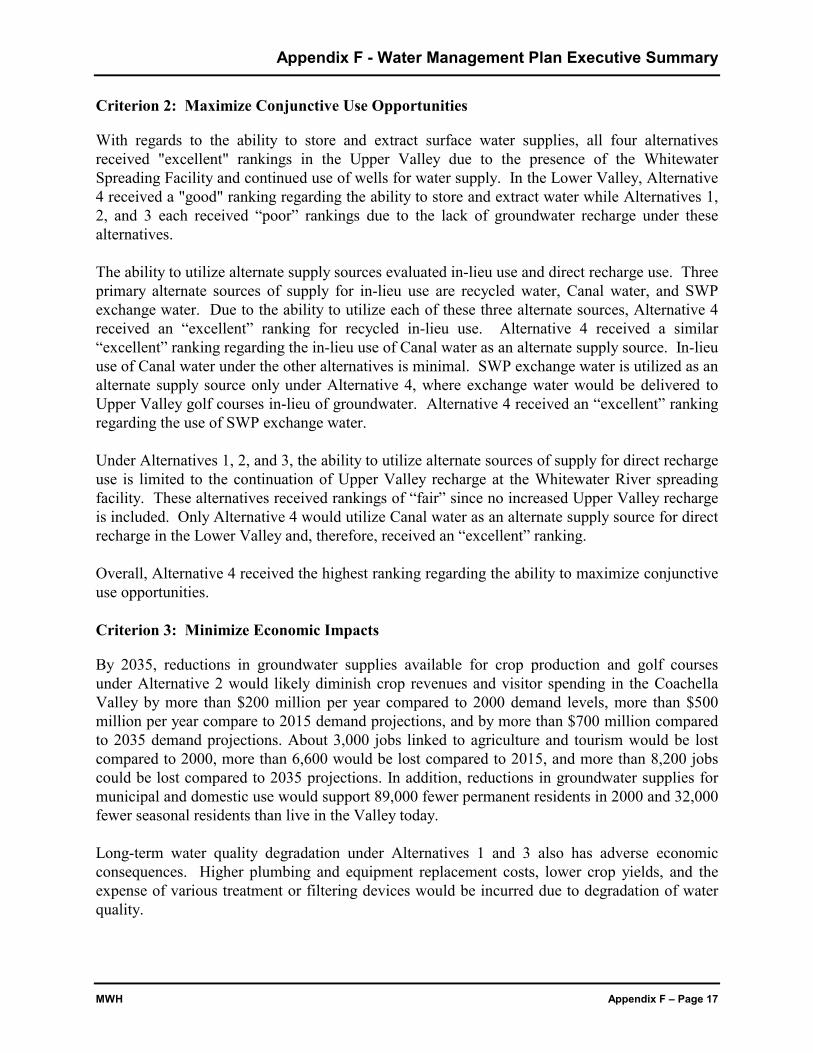
Appendix F - Water Management Plan Executive Summary
MWH Appendix F – Page 17
Criterion 2: Maximize Conjunctive Use Opportunities
With regards to the ability to store and extract surface water supplies, all four alternativesreceived "excellent" rankings in the Upper Valley due to the presence of the WhitewaterSpreading Facility and continued use of wells for water supply. In the Lower Valley, Alternative4 received a "good" ranking regarding the ability to store and extract water while Alternatives 1,2, and 3 each received “poor” rankings due to the lack of groundwater recharge under thesealternatives.
The ability to utilize alternate supply sources evaluated in-lieu use and direct recharge use. Threeprimary alternate sources of supply for in-lieu use are recycled water, Canal water, and SWPexchange water. Due to the ability to utilize each of these three alternate sources, Alternative 4received an “excellent” ranking for recycled in-lieu use. Alternative 4 received a similar“excellent” ranking regarding the in-lieu use of Canal water as an alternate supply source. In-lieuuse of Canal water under the other alternatives is minimal. SWP exchange water is utilized as analternate supply source only under Alternative 4, where exchange water would be delivered toUpper Valley golf courses in-lieu of groundwater. Alternative 4 received an “excellent” rankingregarding the use of SWP exchange water.
Under Alternatives 1, 2, and 3, the ability to utilize alternate sources of supply for direct rechargeuse is limited to the continuation of Upper Valley recharge at the Whitewater River spreadingfacility. These alternatives received rankings of “fair” since no increased Upper Valley rechargeis included. Only Alternative 4 would utilize Canal water as an alternate supply source for directrecharge in the Lower Valley and, therefore, received an “excellent” ranking.
Overall, Alternative 4 received the highest ranking regarding the ability to maximize conjunctiveuse opportunities.
Criterion 3: Minimize Economic Impacts
By 2035, reductions in groundwater supplies available for crop production and golf coursesunder Alternative 2 would likely diminish crop revenues and visitor spending in the CoachellaValley by more than $200 million per year compared to 2000 demand levels, more than $500million per year compare to 2015 demand projections, and by more than $700 million comparedto 2035 demand projections. About 3,000 jobs linked to agriculture and tourism would be lostcompared to 2000, more than 6,600 would be lost compared to 2015, and more than 8,200 jobscould be lost compared to 2035 projections. In addition, reductions in groundwater supplies formunicipal and domestic use would support 89,000 fewer permanent residents in 2000 and 32,000fewer seasonal residents than live in the Valley today.
Long-term water quality degradation under Alternatives 1 and 3 also has adverse economicconsequences. Higher plumbing and equipment replacement costs, lower crop yields, and theexpense of various treatment or filtering devices would be incurred due to degradation of waterquality.
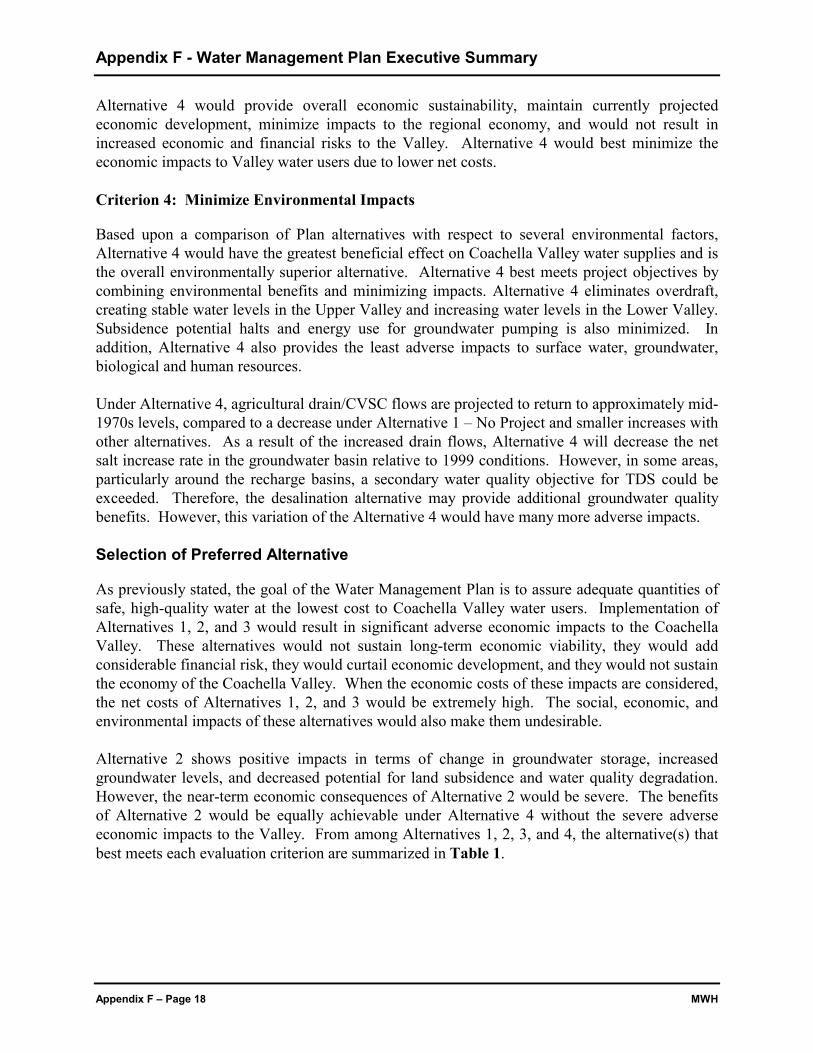
Appendix F - Water Management Plan Executive Summary
Appendix F – Page 18 MWH
Alternative 4 would provide overall economic sustainability, maintain currently projectedeconomic development, minimize impacts to the regional economy, and would not result inincreased economic and financial risks to the Valley. Alternative 4 would best minimize theeconomic impacts to Valley water users due to lower net costs.
Criterion 4: Minimize Environmental Impacts
Based upon a comparison of Plan alternatives with respect to several environmental factors,Alternative 4 would have the greatest beneficial effect on Coachella Valley water supplies and isthe overall environmentally superior alternative. Alternative 4 best meets project objectives bycombining environmental benefits and minimizing impacts. Alternative 4 eliminates overdraft,creating stable water levels in the Upper Valley and increasing water levels in the Lower Valley.Subsidence potential halts and energy use for groundwater pumping is also minimized. Inaddition, Alternative 4 also provides the least adverse impacts to surface water, groundwater,biological and human resources.
Under Alternative 4, agricultural drain/CVSC flows are projected to return to approximately mid-1970s levels, compared to a decrease under Alternative 1 – No Project and smaller increases withother alternatives. As a result of the increased drain flows, Alternative 4 will decrease the netsalt increase rate in the groundwater basin relative to 1999 conditions. However, in some areas,particularly around the recharge basins, a secondary water quality objective for TDS could beexceeded. Therefore, the desalination alternative may provide additional groundwater qualitybenefits. However, this variation of the Alternative 4 would have many more adverse impacts.
Selection of Preferred Alternative
As previously stated, the goal of the Water Management Plan is to assure adequate quantities ofsafe, high-quality water at the lowest cost to Coachella Valley water users. Implementation ofAlternatives 1, 2, and 3 would result in significant adverse economic impacts to the CoachellaValley. These alternatives would not sustain long-term economic viability, they would addconsiderable financial risk, they would curtail economic development, and they would not sustainthe economy of the Coachella Valley. When the economic costs of these impacts are considered,the net costs of Alternatives 1, 2, and 3 would be extremely high. The social, economic, andenvironmental impacts of these alternatives would also make them undesirable.
Alternative 2 shows positive impacts in terms of change in groundwater storage, increasedgroundwater levels, and decreased potential for land subsidence and water quality degradation.However, the near-term economic consequences of Alternative 2 would be severe. The benefitsof Alternative 2 would be equally achievable under Alternative 4 without the severe adverseeconomic impacts to the Valley. From among Alternatives 1, 2, 3, and 4, the alternative(s) thatbest meets each evaluation criterion are summarized in Table 1.
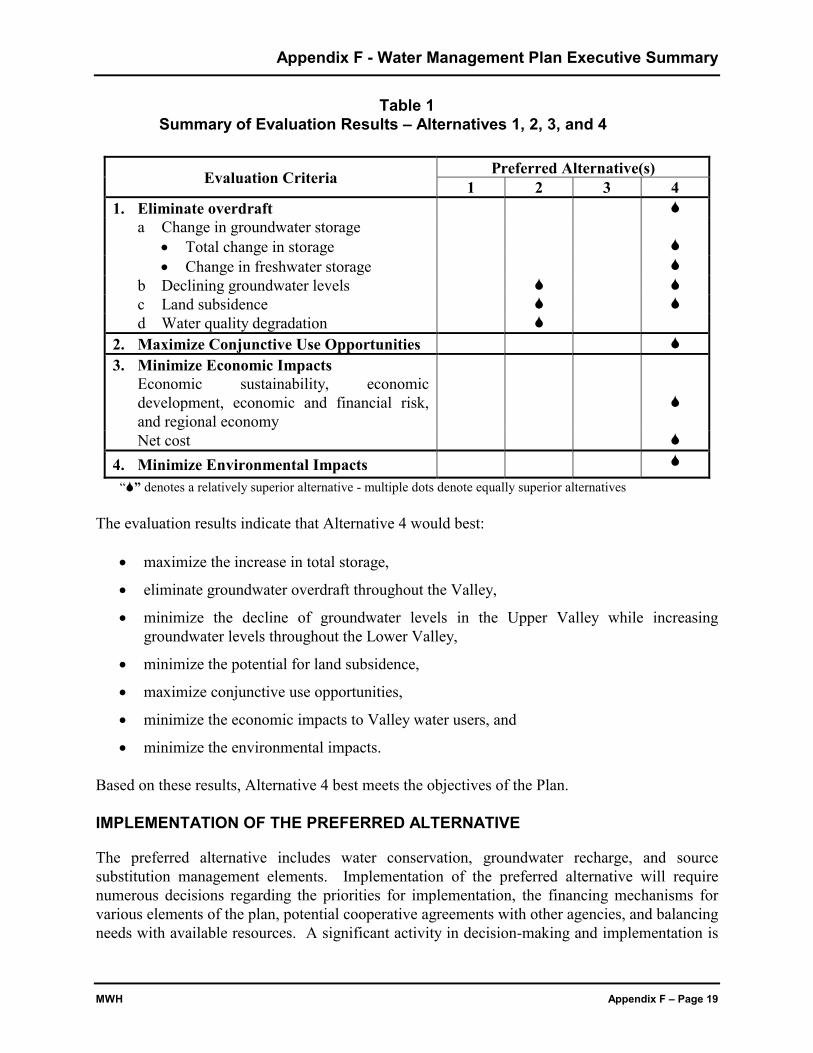
Appendix F - Water Management Plan Executive Summary
MWH Appendix F – Page 19
Table 1Summary of Evaluation Results – Alternatives 1, 2, 3, and 4
Preferred Alternative(s)Evaluation Criteria 1 2 3 41. Eliminate overdraft
a Change in groundwater storage• Total change in storage• Change in freshwater storage
b Declining groundwater levelsc Land subsidenced Water quality degradation
2. Maximize Conjunctive Use Opportunities3. Minimize Economic Impacts
Economic sustainability, economicdevelopment, economic and financial risk,and regional economyNet cost
4. Minimize Environmental Impacts“ ” denotes a relatively superior alternative - multiple dots denote equally superior alternatives
The evaluation results indicate that Alternative 4 would best:
• maximize the increase in total storage,
• eliminate groundwater overdraft throughout the Valley,
• minimize the decline of groundwater levels in the Upper Valley while increasinggroundwater levels throughout the Lower Valley,
• minimize the potential for land subsidence,
• maximize conjunctive use opportunities,
• minimize the economic impacts to Valley water users, and
• minimize the environmental impacts. Based on these results, Alternative 4 best meets the objectives of the Plan. IMPLEMENTATION OF THE PREFERRED ALTERNATIVE
The preferred alternative includes water conservation, groundwater recharge, and sourcesubstitution management elements. Implementation of the preferred alternative will requirenumerous decisions regarding the priorities for implementation, the financing mechanisms forvarious elements of the plan, potential cooperative agreements with other agencies, and balancingneeds with available resources. A significant activity in decision-making and implementation is
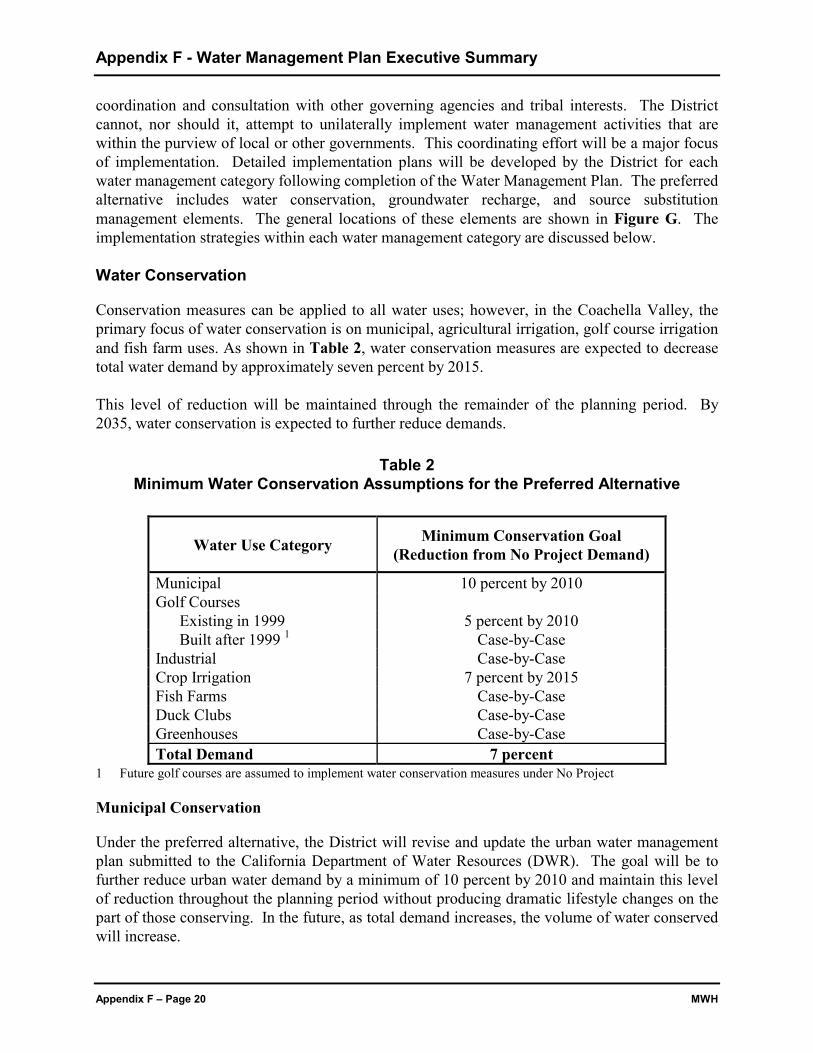
Appendix F - Water Management Plan Executive Summary
Appendix F – Page 20 MWH
coordination and consultation with other governing agencies and tribal interests. The Districtcannot, nor should it, attempt to unilaterally implement water management activities that arewithin the purview of local or other governments. This coordinating effort will be a major focusof implementation. Detailed implementation plans will be developed by the District for eachwater management category following completion of the Water Management Plan. The preferredalternative includes water conservation, groundwater recharge, and source substitutionmanagement elements. The general locations of these elements are shown in Figure G. Theimplementation strategies within each water management category are discussed below.
Water Conservation
Conservation measures can be applied to all water uses; however, in the Coachella Valley, theprimary focus of water conservation is on municipal, agricultural irrigation, golf course irrigationand fish farm uses. As shown in Table 2, water conservation measures are expected to decreasetotal water demand by approximately seven percent by 2015.
This level of reduction will be maintained through the remainder of the planning period. By2035, water conservation is expected to further reduce demands.
Table 2Minimum Water Conservation Assumptions for the Preferred Alternative
Water Use Category Minimum Conservation Goal(Reduction from No Project Demand)
Municipal 10 percent by 2010Golf Courses
Existing in 1999 5 percent by 2010Built after 1999 1 Case-by-Case
Industrial Case-by-CaseCrop Irrigation 7 percent by 2015Fish Farms Case-by-CaseDuck Clubs Case-by-CaseGreenhouses Case-by-CaseTotal Demand 7 percent
1 Future golf courses are assumed to implement water conservation measures under No Project
Municipal Conservation
Under the preferred alternative, the District will revise and update the urban water managementplan submitted to the California Department of Water Resources (DWR). The goal will be tofurther reduce urban water demand by a minimum of 10 percent by 2010 and maintain this levelof reduction throughout the planning period without producing dramatic lifestyle changes on thepart of those conserving. In the future, as total demand increases, the volume of water conservedwill increase.
Appendix F - Water Management Plan Executive Summary
MWH Appendix F – Page 21
During revision of the urban water management plan, various existing and new waterconservation measures will be evaluated including:
• Water Efficient Landscaping – maintaining water-efficient urban and residentiallandscaping and irrigation systems, optimizing existing systems, improving the overallefficiency of local water use, developing and enforcing water efficient landscapeordinances.
• Water Efficient Plumbing – retrofitting indoor plumbing with ultra-low flush toilets andlow-flow showerheads, encouraging development of local ordinances requiringretrofitting as a condition of sale of a property, installing water efficient plumbing in allnew buildings.
• Tiered or Seasonal Water Pricing – revising the District’s water pricing structure to atiered or increased block-rate structure that will encourage water conservation byincreasing the price of water either year-around or seasonally as usage increases.
• Public information and education programs – promoting the importance of waterconservation efforts within the schools and to the general public.
• Alternate Water Supplies – requiring the use of alternate water supplies (such as recycledor Canal water) for urban irrigation purposes where available.
• Municipal Development Policies – working with municipalities, counties, and otheragencies to incorporate specific policies regarding water conservation measures intofuture general plan updates and development policies.
• Conservation Coordinator – designating a full-time position and support staff as requiredto coordinate and develop water conservation plans.
• Maximum Allowable Water Allowance – establish new and enforce existing annualMaximum Applied Water Allowances for parks, playgrounds, sports fields, school yards,and other recreational areas.
Agricultural Conservation
As presented in Table 2, the goal is to reduce agricultural demand for crop irrigation byapproximately 7 percent by 2015. This corresponds to an increase in irrigation efficiency from70 to 75 percent. Conservation would be maintained at this level for the remainder of theplanning period. The District will prepare an agricultural water conservation plan to develop andevaluate specific existing and new agricultural conservation measures including:
• Efficient Irrigation Practices – working with Valley growers to ensure that the most up-to-date irrigation practices are being employed, converting from furrow irrigation to dripirrigation, refining existing drip irrigation management and design to improve distributionuniformity such as buried drip systems, installation of pressure compensating emitters,and including more emitters per line.
Appendix F - Water Management Plan Executive Summary
Appendix F – Page 22 MWH
• On-farm Water Audits – reviewing individual grower’s water use practices on a field-by-field basis and evaluating the unique characteristics of each field and crop type.Confidential reports will be made to each grower indicating the general efficiency of eachfield and containing recommendations for improved efficiency.
Golf Course Conservation
Golf course conservation is expected to reduce the water demand of existing golf courses by atleast 5 percent by 2010 and maintain that level throughout the planning period. The District willprepare a golf course water conservation plan to develop and evaluate specific existing and newgolf course conservation measures including:
• Efficient Irrigation Practices-promoting the use of more efficient irrigation techniques,such as improved sprinkler layouts, computer-based irrigation systems and ET-basedirrigation scheduling.
• Golf Course Turf Restrictions-establishing criteria in a local ordinance to specify themaximum allowable irrigated area for golf courses. Such an ordinance would restrict theplacement of turf grass on the tees, greens, and small portions of the fairways.
• Maximum Allowable Water Allowance-enforce existing annual Maximum AppliedWater Allowances for newly installed and rehabilitated landscapes. Establish annualMaximum Applied Water Allowances for golf courses.
District Operating Policies
In addition, the District is in the process of reviewing its operating policies. The purpose of thisreview is to identify CVWD operating policies that (1) result in additional water savings or (2)make the use of Canal water more attractive to groundwater users.
Evaluation of Water Conservation Programs
The District’s water conservation programs will be evaluated to determine the effectiveness ofvoluntary programs with recommendations for improvement in specific areas, such as publiceducation, ordinances, etc. Based on the evaluation results, additional conservation measureswill be considered.
Additional Water Supplies
In addition to water conservation, the District and DWA will need to obtain additional watersupplies to eliminate current and future overdraft. Evaluation of many potential alternativesupplies has identified four sources that will be augmented as part of the preferred alternative.These sources are the Colorado River, State Water Project, Whitewater River and recycledwater. The steps to be taken to augment these supplies are discussed below.
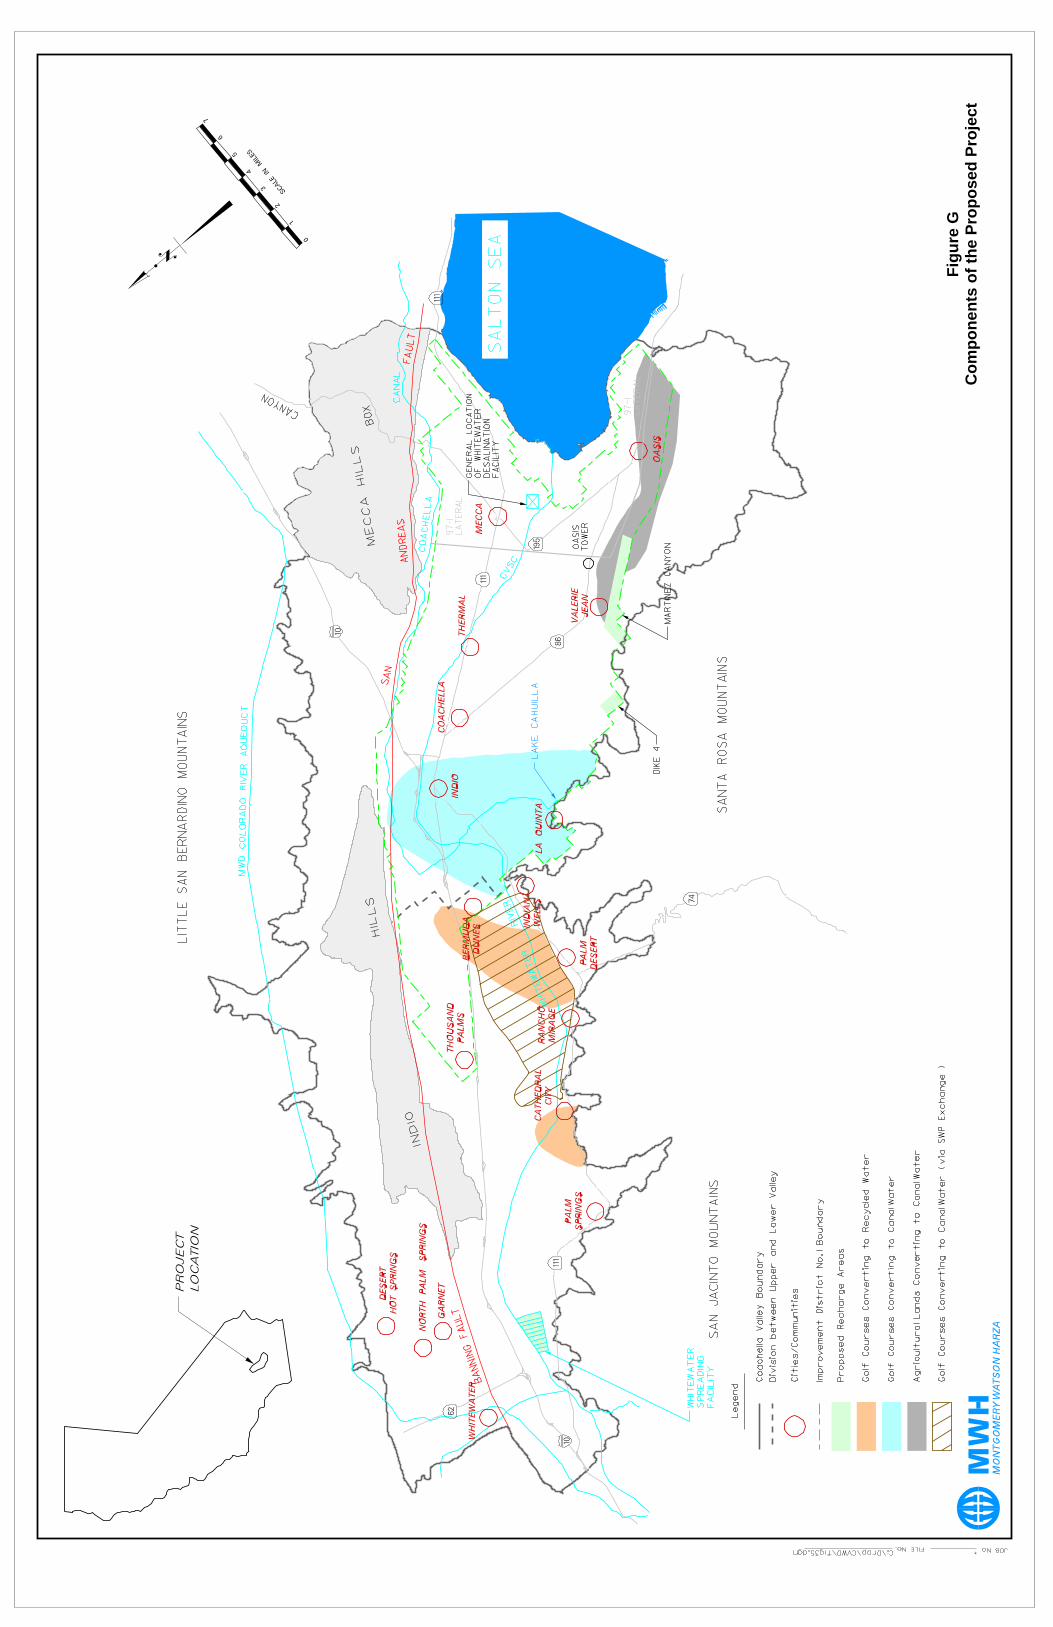
Figu
re G
Com
pone
nts
of th
e Pr
opos
ed P
roje
ct

Appendix F - Water Management Plan Executive Summary
MWH Appendix F – Page 25
Colorado River Water
In October 1999, CVWD, IID and Metropolitan reached agreement on the “key terms” that willbe necessary elements in a formal Quantification Settlement Agreement (QSA) regarding adivision and quantification of their respective shares of Colorado River water. The detailed QSAdocument is being prepared for review and, pending completion of all required environmentalreviews, formal approval by the three agencies’ Boards. The intent of this agreement is toquantify the rights of each agency and allow the transfer of water between willing buyers andsellers. The Quantification Settlement includes:
• Capping IID and CVWD Priority 3 water,
• Modification to the 1988 IID/Metropolitan Water Conservation Agreement,
• Amendment to the 1989 Metropolitan/IID/CVWD/PVID Approval Agreement andtransferring 20,000 acre-ft/yr to CVWD,
• Conservation and transfer of 200,000 acre-ft/yr from IID to SDCWA,
• Exchange Agreement between SDCWA and Metropolitan,
• Conservation and transfer of 100,000 acre-ft/yr from IID to CVWD,
• Lining the All-American Canal and the Coachella Canal and transfer of conserved waterto Metropolitan less 16,000 acre-ft/yr for the San Luis Rey Indian Water RightsSettlement,
• Sharing obligations to provide 14,500 acre-ft/yr from IID and CVWD for miscellaneouspresent perfected rights,
• Transferring 35,000 acre-ft/yr of SWP water from Metropolitan to CVWD,
• Quantification of surplus water available under Priority 6 and 7,
• Sharing of shortages between CVWD and IID when there is less than 3.85 million acre-ft/yr available to Priorities 1, 2, 3a and 3b,
• Various conditions precedents for approval of the final agreement,
• The term of the QSA is 75 years.
Under the Quantification Settlement Agreement, CVWD’s consumptive use entitlement under itsshare of the Priority 3 allotment is capped at 330,000 acre-ft/yr at Imperial Dam for thequantification period, less an amount of water equal to that conserved by CVWD for the benefitof others as identified in the QSA and subject to adjustments as provided in the InadvertentOverrun and Payback Policy (IOP). CVWD agrees to forbear use of up to 3,000 acre-ft/yr tosatisfy the present perfected rights (PPRs) of miscellaneous and Indian rights holders. CVWDalso agrees to reduce its diversion by 26,000 acre-ft/yr due to lining the Coachella Canal.Metropolitan will provide 20,000 acre-ft/yr to CVWD at Imperial Dam under the 1989 ApprovalAgreement for the 1988 Metropolitan/IID Water Conservation Agreement. CVWD has theoption to purchase water from IID in two phases of 50,000 acre-ft/yr each. This water would bemade available by the implementation of water conservation measures by IID which are financed
Appendix F - Water Management Plan Executive Summary
Appendix F – Page 26 MWH
by the payments for water by CVWD. The first phase would be available beginning in 2007 andthe second phase would be available beginning in 2017. Under the terms of the settlementagreement, CVWD may acquire the water in increments of 5,000 acre-ft/yr, reaching fullentitlement by 2033. CVWD may acquire the water at rates of 3,000 acre-ft/yr and 4,000 acre-ft/yr given one year’s notice to IID. Metropolitan will transfer 35,000 acre-ft/yr of its SWPentitlement to CVWD on a permanent basis. CVWD, IID and Metropolitan have agreed toprovide 16,000 acre-ft/yr of water from the lining of the All-American and Coachella Canals aspart of the San Luis Rey settlement. During wet years, CVWD will also have access to 119,000acre-ft/yr of Priority 6 water after Metropolitan and IID have received 38,000 acre-ft/yr and63,000 acre-ft/yr, respectively.
If there is less than 3.85 million acre-ft/yr available to Priorities 1, 2, 3a, and 3b, the deficiency isborne by CVWD and IID. CVWD and IID shall negotiate a consensual sharing of the shortfall.In the event that a consensual resolution cannot be reached, either CVWD or IID may commencelitigation to resolve the allocation of the shortfall. During the litigation process, the shortfallshall be provisionally allocated 75 percent to IID and 25 percent to CVWD until IID is reduced toits PPR, after which all remaining shortfalls would be borne entirely by CVWD. If IID werereduced to its PPR, water transfers under the QSA would be suspended.
An inadvertent overrun is defined as Colorado River water that is diverted, pumped or receivedby an entitlement holder in excess of the water user’s entitlement for that year beyond the controlof the water user. The IOP establishes a policy to identify and account for inadvertent overrunsand define subsequent payback provisions. The IOP limits CVWD to a maximum overrun ofapproximately 10 percent of its normal year entitlement. Depending on the water level in LakeMead, the overrun must be paid back within one to three years using water managementmeasures over and above the normal consumptive use of water. If CVWD is charged with aninadvertent overrun, the District plans to reduce its use of Colorado River water for groundwaterrecharge. The IOP states that overruns are forgiven in the event of a flood control or spacebuilding release from Lake Mead.
When all water transfers have been completed, CVWD will have a total diversion of 456,000acre-ft/yr at Imperial Dam as shown in Table 3. After deducting conveyance losses, about441,000 acre-ft/yr will be available for use in the Valley. The build-up curve for Colorado Riverwater to CVWD under the agreement will impact the timing of the various projects to beimplemented under the Water Management Plan.
The preferred alternative includes delivery of 441,000 acre-ft/yr of Canal water provided underthe Quantification Settlement Agreement by 2033 and remaining at that level through 2035.Approximately 361,000 acre-ft/yr of this amount will be supplied directly to existing and futureusers in the Valley. Of this amount, about 83,000 acre-ft/yr will replace groundwater pumping(source substitution). The remaining 80,000 acre-ft/yr will be used for groundwater recharge.The Quantification Settlement provides the mechanism for obtaining the additional ColoradoRiver supply needed to implement the Water Management Plan. The projects required to useCanal water are discussed later in this section.
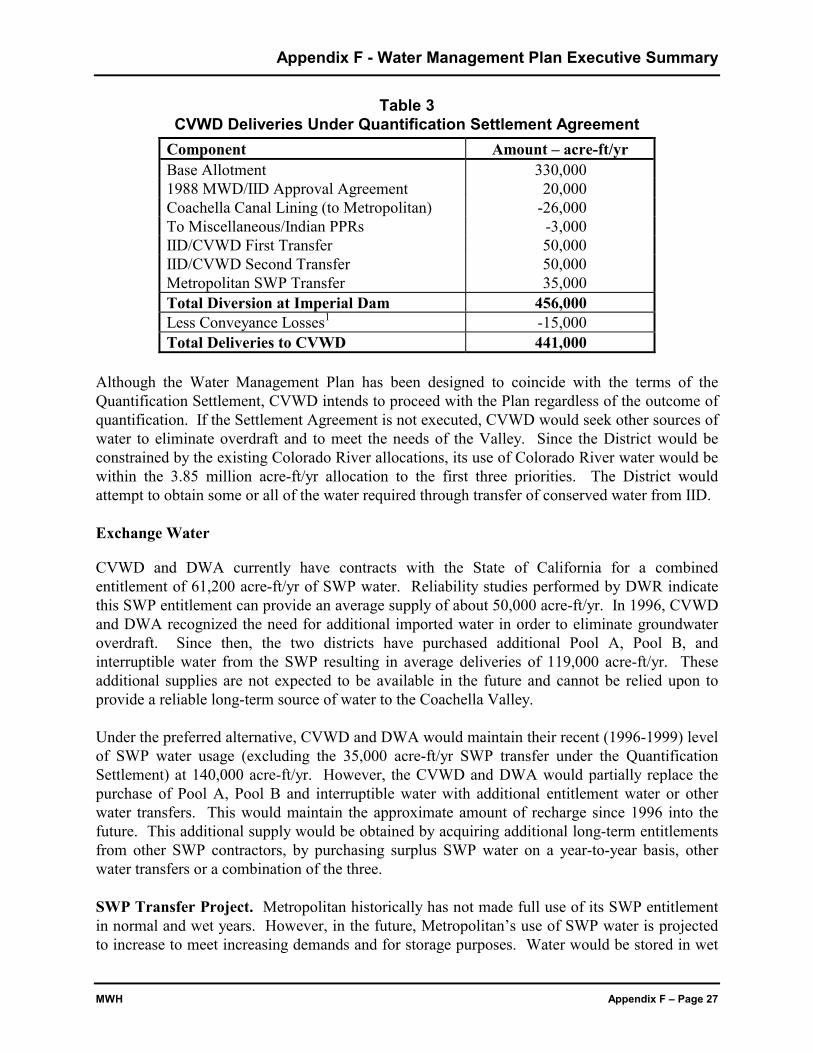
Appendix F - Water Management Plan Executive Summary
MWH Appendix F – Page 27
Table 3CVWD Deliveries Under Quantification Settlement Agreement
Component Amount – acre-ft/yrBase Allotment 330,0001988 MWD/IID Approval Agreement 20,000Coachella Canal Lining (to Metropolitan) -26,000To Miscellaneous/Indian PPRs -3,000IID/CVWD First Transfer 50,000IID/CVWD Second Transfer 50,000Metropolitan SWP Transfer 35,000Total Diversion at Imperial Dam 456,000Less Conveyance Losses1 -15,000Total Deliveries to CVWD 441,000
Although the Water Management Plan has been designed to coincide with the terms of theQuantification Settlement, CVWD intends to proceed with the Plan regardless of the outcome ofquantification. If the Settlement Agreement is not executed, CVWD would seek other sources ofwater to eliminate overdraft and to meet the needs of the Valley. Since the District would beconstrained by the existing Colorado River allocations, its use of Colorado River water would bewithin the 3.85 million acre-ft/yr allocation to the first three priorities. The District wouldattempt to obtain some or all of the water required through transfer of conserved water from IID.
Exchange Water
CVWD and DWA currently have contracts with the State of California for a combinedentitlement of 61,200 acre-ft/yr of SWP water. Reliability studies performed by DWR indicatethis SWP entitlement can provide an average supply of about 50,000 acre-ft/yr. In 1996, CVWDand DWA recognized the need for additional imported water in order to eliminate groundwateroverdraft. Since then, the two districts have purchased additional Pool A, Pool B, andinterruptible water from the SWP resulting in average deliveries of 119,000 acre-ft/yr. Theseadditional supplies are not expected to be available in the future and cannot be relied upon toprovide a reliable long-term source of water to the Coachella Valley.
Under the preferred alternative, CVWD and DWA would maintain their recent (1996-1999) levelof SWP water usage (excluding the 35,000 acre-ft/yr SWP transfer under the QuantificationSettlement) at 140,000 acre-ft/yr. However, the CVWD and DWA would partially replace thepurchase of Pool A, Pool B and interruptible water with additional entitlement water or otherwater transfers. This would maintain the approximate amount of recharge since 1996 into thefuture. This additional supply would be obtained by acquiring additional long-term entitlementsfrom other SWP contractors, by purchasing surplus SWP water on a year-to-year basis, otherwater transfers or a combination of the three.
SWP Transfer Project. Metropolitan historically has not made full use of its SWP entitlementin normal and wet years. However, in the future, Metropolitan’s use of SWP water is projectedto increase to meet increasing demands and for storage purposes. Water would be stored in wet
Appendix F - Water Management Plan Executive Summary
Appendix F – Page 28 MWH
years for withdrawal in dry years. Under the SWP Transfer Project, CVWD and DWA wouldacquire 100,000 acre-ft/yr of Metropolitan’s State Water Project entitlement as a permanenttransfer. The entitlement would be exchanged for Colorado River water and either recharged atthe existing Whitewater River Spreading Basins or delivered via the Coachella Canal forirrigation purposes in the Palm Desert-Rancho Mirage area of the Upper Valley. CVWD andDWA would assume all costs associated with this entitlement except as described below. Thisentitlement transfer would partially offset the current CVWD and DWA practice of acquiringinterruptible SWP water from other SWP contractors when it is available. Completion of thistransfer would provide CVWD and DWA with a combined SWP entitlement of 161,200 acre-ft/yr, exclusive of the 35,000 acre-ft/yr transferred as part of the QSA.
Future Water Acquisitions. During wet years, CVWD and DWA would continue their currentpractice of purchasing Pool A, Pool B and interruptible water, as available from other SWPcontractors. Since the availability of this water is expected to decline in the future, CVWD andDWA would seek to acquire additional water supplies, as they become available. These suppliescould include SWP entitlements, other water transfers or participation in out-of-basin waterdevelopment projects. In addition, CVWD and DWA would evaluate the purchase of waterduring dry years from programs like the Governor’s Drought Water Bank based on supplyavailability and costs. The goal of these purchases and acquisitions is to achieve the proposedlong-term average deliveries of 140,000 acre-ft/yr. With implementation of the proposed SWPTransfer Project, CVWD and DWA would need to acquire sufficient water to provide anadditional average supply of 40,000 acre-ft/yr. Acquisition of additional permanent watersupplies would be subject to separate CEQA documentation when such acquisition is identified.However, the impacts of using the water are covered in this PEIR.
SWP exchange water obtained from Metropolitan under the Quantification Settlement will bedelivered via the Coachella Canal for agricultural irrigation purposes in the Lower Valley.
Recycled Water
There are two principal potential sources of recycled water in the Coachella Valley, desalinatedagricultural drainage water and treated municipal wastewater effluent. Of these treatedmunicipal effluent is currently being used for golf course and park irrigation in portions of theCoachella Valley. In addition, fish farm effluent is available in certain localized areas of theLower Valley.
Treated Municipal Effluent. There are seven wastewater plants located in the CoachellaValley. The cities of Coachella and Palm Springs and the Valley Sanitary District (VSD) eachoperate water reclamation plants (WRP). CVWD operated four plants designated WRP-4, WRP-7, WRP-9 and WRP-10. Water is recycled from each plant except for the Coachella and WRP-4facilities. These three plants (VSD, Coachella, and WRP-4 discharge effluent to the CVSC. Theother facilities discharge to percolation ponds when the demand for recycled water is low inwinter months. Use of recycled water effluent is assumed to increase by about 14,000 acre-ft/yrin the absence of the Water Management Plan as growth occurs in the Valley.
Appendix F - Water Management Plan Executive Summary
MWH Appendix F – Page 29
The use of recycled water will increase an additional 16,000 acre-ft/yr compared to No Projectconditions. The proposed uses for recycled water are discussed in the following section.
Desalinated Agricultural Drain Water. In 1997, the District filed an application with the StateWater Resources Control Board to appropriate all waters in the CVSC (up to a maximum of 150cfs) draining from lands irrigated in ID-1. The application was submitted with the intent to retainlocal control of local water resources. Initial diversions must take place by 2013, building up tofull diversion in 2063.
Up to 11,000 acre-ft/yr of agricultural drain water will be desalted to a quality equivalent toCanal water and delivered for irrigation use. Approximately 13.6 million gallons per day (mgd)of drain water would be diverted and filtered prior to desalination. The desalination facilitywould have a 10-mgd capacity that will produce about 7.5-mgd of product water. Approximately3.5 mgd of the flow would be bypassed and blended with the product water to produce thedesired quality. Delivery of this water would begin at a rate of about 4,000 acre-ft/yr and reaches11,000 acre-ft/yr in approximately fifteen years. The preferred alternative does not identifyspecific users for this water since the product water would be delivered to the District’s Canalwater distribution system. Because the CVSC contains water of wastewater origin, this supply isnot suitable for potable uses even if treated. Therefore, it will be likely be delivered to the 97-1Lateral, where the downstream demand is for agricultural irrigation. Since this water is non-federal, it is not subject to the contractual restrictions regarding use of Canal water within the ID-1 service area. The District anticipates that an equal amount of Canal water can be delivered togolf courses or the portion of the Oasis system outside ID-1. Preliminary discussion with USBRofficials indicated that such an exchange of water might be feasible. No specific location for theplant has been identified.
The Coachella Canal and its distribution system were constructed by and are owned by thefederal government for the purpose of delivering Colorado River water for irrigation anddomestic use in the ID-1 service area. Colorado River water is federal water that by contractcannot be used outside ID-1. Since the reclaimed agricultural drainage water is non-federal, it isnot subject to the contractual restrictions regarding use of Canal water within the ID-1 servicearea. The District anticipates that an equal amount of Canal water can be delivered to golfcourses or the portion of the Oasis area located outside ID-1. Preliminary discussions withBureau officials indicated that such an exchange of treated, reclaimed drain water might befeasible. CVWD would obtain approval from the Bureau, if required, prior to conveying thiswater in the distribution system or delivering it outside of ID-1.
The treatment process would produce about 2.6 mgd of filter backwash and brine waste.Preliminary studies have considered both on-site and off-site evaporation ponds for brinedisposal. On-site evaporation ponds would require about 530 acres of surface area due to therelatively low TDS of the brine. Alternatively, the brine could be conveyed to the Salton Seaeither in the CVSC or a parallel brine outfall. Evaporation ponds located near the sea couldremove an equivalent amount of salt by evaporating Salton Sea water. Approximately 110 acresof ponds would be required in this case. Decisions on the method of brine disposal will beaddressed as project implementation proceeds.
Appendix F - Water Management Plan Executive Summary
Appendix F – Page 30 MWH
Fish Farm Effluent. Recycled fish farm effluent from fish farms in the Lower Valley iscurrently reused for fish farms, duck clubs and agricultural irrigation. This reuse is projected tocontinue into the future.
Source Substitution
Source substitution is the delivery of an alternate source of water to users currently pumpinggroundwater. This approach is frequently referred to as in-lieu delivery where other watersources are delivered in place (or in-lieu) of groundwater use. The substitution of an alternatewater source reduces groundwater extraction and allows the groundwater to remain in storage,thus reducing overdraft. Alternative sources of water include: recycled water from WRP-7,WRP-9, WRP-10 or City of Palm Springs WRP; Canal water, desalinated agricultural drainagewater, or SWP Exchange water delivered through the Coachella Canal.
Source substitution projects under the preferred alternative include the following:
• Conversion of existing and future golf courses in the Lower Valley from groundwater toCanal water,
• Conversion of existing and future golf courses in the Upper Valley from groundwater torecycled water,
• Conversion of existing and future golf courses in the Upper Valley from groundwater toSWP Exchange water,
• Conversion of agricultural irrigation from groundwater to Canal water, primarily in theOasis area, and
• Conversion of municipal use from groundwater to treated Canal water in ID-1
Specific details on each of these projects are presented below. The timing for the variousprojects is dependent on the available water supplies and the economics of the various projects.Therefore, the implementation schedules presented are generalized.
Conversion of Lower Valley Golf Courses
Canal water use will be expanded to serve additional golf courses within ID-1. Existing golfcourses within ID-1 that use groundwater will be supplied with Canal water. The District willdevelop a program to convert existing courses from groundwater to Canal water. Many of theexisting golf courses within ID-1 have Canal water connections but are not making full use of thewater. The District will also work with the courses currently using both groundwater and Canalwater to maximize their Canal water use. Because of the availability of desalinated WhitewaterRiver water, the preferred alternative also includes conversion of several Lower Valley golfcourses that are located outside ID-1.
Since the Canal water distribution system is currently in place, the facilities required to serve golfcourses located inside ID-1 are generally expected to be minimal. Some new pipelines andpumping facilities may be required to convey desalinated Whitewater River water that is
Appendix F - Water Management Plan Executive Summary
MWH Appendix F – Page 31
exchanged for Canal water to courses located outside ID-1. Conversion of golf courses isexpected to reduce groundwater pumping by about 14,000 acre-ft/yr over the next 10 to 15 years.
Upper Valley Golf Course Conversion to Recycled Water
The preferred alternative includes increased use of recycled water, primarily for golf courseirrigation in the Upper Valley. Water from wastewater treatment plants in the Upper Valley iscurrently either recycled for golf courses or municipal irrigation or disposed bypercolation/evaporation ponds located at each facility.
Recycling water for irrigation does have other benefits that favor recycled use over percolation.Because recycled water has a high nutrient (i.e., nitrogen) load, long-term percolation couldeventually lead to degradation of the groundwater supply. Direct use of recycled water forirrigation removes these nutrients - use of nitrogen-rich recycled water for irrigation lowers theamount of inorganic fertilizers needed on golf courses and other landscaped areas, thus reducingthe nitrogen loading on the entire basin. One difficulty in recycling sewage effluent for irrigationpurposes involves fluctuations in supply and demand. Flows to Valley treatment plants aregenerally higher in the winter months when irrigation demands are at their lowest, and flows areconversely lower when demand is highest.
In the Upper Valley, recycled water use for golf course and park irrigation will be expanded inareas adjacent to treatment plants where it is most cost-effective. The preferred alternativeanticipates about 8,000 acre-ft/yr more recycled water use than the No Project conditions. Thefacilities required to expand the recycled water systems are expected to include pipelines andpump stations.
Conversion of Upper Valley Golf Courses to SWP Exchange Water
There are a number of golf courses in the Rancho Mirage-Palm Desert-Indian Wells area thatpump groundwater for irrigation. This area has experienced a steady decline in groundwaterlevels over the past 50 years or more. Recent information indicates that there is an increased riskof land subsidence if water levels continue to decline. Therefore, conversion of the golf coursesin this area to imported or recycled water is a high priority for the District.
Since this area is outside the ID-1 service area, it is not eligible for Canal water delivery.However, the District could redirect a portion of its SWP entitlement to this area. Conveyanceoptions include the construction of over 20 miles of pipelines from the Whitewater turnouts, over12 miles of pipelines from the Metropolitan aqueduct at Fan Canyon (east of Dillon Road) or bytaking delivery through the Coachella Canal. The latter option would be similar to the proposedconveyance of desalinated Whitewater River water in the Canal delivery system. The CoachellaCanal conveyance option was chosen as it involves the least amount of conveyance facilities tobring imported water to the Rancho Mirage-Palm Desert-Indian Wells area.
This project will require construction of over 30 miles of pipelines, two major pumping stationsand delivery connections to each course. The project to convert the Upper Valley golf courses is
Appendix F - Water Management Plan Executive Summary
Appendix F – Page 32 MWH
expected to be implemented in phases beginning in the late 2000s and finishing in the mid 2010s.Approximately 37,000 acre-ft/yr of groundwater pumping would be eliminated by this project.
Conversion of Existing Lower Valley Agriculture
Agricultural users within the ID-1 service area that currently pump groundwater would also beconverted to Canal water under the preferred alternative. In that portion of ID-1 where the Canalwater distribution system currently exists, the Plan includes conversion of agricultural users fromgroundwater to Canal water by the mid-2010s. Because most of these users have existingconnections to the District’s Canal water distribution system, these conversions would requireminimal infrastructure modifications. For drip irrigation use, farmers would probably need toinstall a small storage reservoir, a booster pump and a pressure sand filtration unit to removesuspended solids that may clog the emitters. The cost of these facilities are borne by the farmerbut typically are offset by a cost savings compared to pumping groundwater. Since Canal waterhas a higher salinity than groundwater, periodic soil leaching is required to flush out accumulatedsalt. The additional demand for leaching is incorporated into the water demand estimates.CVWD has prepared a manual to guide farmers in the conversion from groundwater to Canalwater (Olson, 1996).
Agricultural users located in the unserved area of ID-1 (other than the Oasis area) are proposed toconvert from groundwater to Canal water in the late-2020s. Since these users do not currentlyhave access to the distribution system, some new conveyance facilities would be required. Theamount of Canal water delivered to agricultural users within ID-1 is expected to increase 30,000acre-ft/yr by 2035.
Up to 8,000 acre-ft/yr of recycled effluent from CVWD’s WRP-4 facility would also be deliveredto Lower Valley agricultural and golf course users by 2035. Water could be delivered directly tousers or delivered through the Canal water distribution system. This element of the Plan alsoincludes upgrading WRP-4 to tertiary treatment. The Plan does not include the use of water fromthe Valley Sanitary District and City of Coachella wastewater plants, as these plants are notcontrolled by CVWD. Recycled water from these two plants could be used in the future.
Oasis Area Agricultural Conversion
The preferred alternative proposes the extension of the Canal water distribution system to serveall acreage in the Oasis area from the Riverside County line northerly to Avenue 66. Studiesconducted for CVWD indicate this project could supply Canal water to about 6,700 acres of landlocated within ID-1 and about 2,200 acres outside ID-1 (Summers Engineering, 1996). TheOasis Conversion Project involves construction of over 20 miles of pipelines, two pumpingstations, two small regulating reservoirs and miscellaneous facilities to convey Canal water tothis area from the vicinity of the 97-1 Lateral.
Since portions of the Oasis area are outside ID-1, only non-federal water could be served to theseusers. CVWD proposes to use desalted agricultural drainage water and recycled water for thisuse. Desalinated agricultural drainage water and recycled municipal effluent would be pumpedinto the 97.1 Lateral for conveyance to the Oasis area. The District would track the amount of
Appendix F - Water Management Plan Executive Summary
MWH Appendix F – Page 33
desalinated agricultural drainage water and recycled water conveyed in the system and serve alike amount to users outside ID-1. Facilities to serve water to this portion of the Oasis area areexpected to include two pumping stations, about six miles of pipeline and other appurtenantfacilities. CVWD would obtain Bureau approval of this concept prior to conveying desalinatedagricultural drainage in the distribution system.
The ID-1 portion of the Oasis area is expected to convert to Canal water by the mid-2020s. Theportion of the Oasis area outside ID-1 will be completed in the late-2020s. Because detailedengineering studies have not been conducted, separate environmental documents will be preparedfor this project prior to its implementation.
Conversion of Municipal Use to Canal Water
Approximately 30 percent of the municipal demand in the Lower Valley would receive Canalwater. The facilities required for this conversion would include the construction of one or morepotable water treatment plants having a total capacity of at least 30 mgd. Other facilities wouldinclude pipelines to convey water from the Canal to the filtration plants, pipelines, pumpingstations and reservoirs to deliver water from the filtration plants to the existing municipal watersystems. Total municipal usage of treated Canal water is estimated to be about 32,000 acre-ft/yr.These facilities are projected to be phased in during the late 2020s and early 2030s.
Groundwater Recharge
Groundwater recharge is an important management element. Overall, groundwater rechargeunder the preferred alternative will increase above No Project. Recharge activities in the Upperand Lower Valley are described below.
Upper Valley
CVWD and DWA would recharge up to an average of 103,000 acre-ft/yr of SWP water at theWhitewater Spreading Facility. As with the current operation, SWP water would be exchangedfor Colorado River water with Metropolitan. No capital improvements would be required at theWhitewater facility.
Lower Valley
Under the preferred alternative, approximately 80,000 acre-ft/yr of Coachella Canal water will berecharged in the Lower Valley. This amount will be phased in over time at recharge facilitiesanticipated to be near Dike No. 4 and in the Martinez Canyon area.
Dike No. 4: Although it may be possible to recharge in the range of 30,000 to 60,000 acre-ft/yrat the Dike No. 4 location, the Plan assumes an average recharge rate of approximately 40,000acre-ft/yr. The Dike No. 4 recharge facility would be constructed within three to four years. Thefacility would include approximately 240 acres of recharge ponds along with a pumping stationand over two miles of pipeline to convey water from Lake Cahuilla to the site. This recharge
Appendix F - Water Management Plan Executive Summary
Appendix F – Page 34 MWH
project will be subjected to separate environmental review when the project is more thoroughlydefined.
Martinez Canyon: CVWD has evaluated other potential recharge sites in the Lower Valleyincluding the Martinez Canyon area along the western margin the Valley. The Martinez Canyonrecharge facility is expected to be operational by the mid-2010s and would be at full capacity bythe mid-2020s. The basins could be constructed in phases to match the availability of Canalwater. An average recharge rate of approximately 40,000 acre-ft/yr is assumed. The facility isexpected to include approximately 240 acres of recharge basins, a pumping station and aboutthree miles of pipeline to convey water from the Oasis Tower to the site. This recharge projectwill be subjected to separate environmental review when the project is more thoroughly defined.The District plans to conduct a demonstration recharge study on District-owned land on thealluvial fan to determine the feasibility of a large scale facility.
Groundwater Monitoring Program
As the Plan is implemented, the District's ongoing groundwater monitoring program will play anintegral role in the District's understanding of the basin's response to different plan elements.The effectiveness of the Plan will be measured against its impacts on groundwater levels, waterquality, and subsidence potential. In addition to continuation of the CVWD/USGS landsubsidence studies, additional monitoring wells will be constructed as part of the program. Datacollected through the monitoring program will enable the District to accurately assess individualplan elements and their effectiveness in meeting the goals of the Plan.
Cooperative Agreements with Other Agencies
The District, DWA, and Metropolitan have historically worked together on programs which aremutually beneficial to all three agencies. The exchange program at the Whitewater SpreadingFacility and the advance delivery program are two such examples. Several other programs,which would provide benefits to both the Coachella Valley and to Metropolitan, are currentlybeing studied. These programs are designed to provide the Coachella Valley with a firm long-term water supply and to provide Metropolitan with the dry-year supplies needed to serve itsmember agencies. Projects currently under consideration include:
• transfer of a portion of Metropolitan's SWP entitlement to DWA and the District and
• implementation of a conjunctive use program with Metropolitan to store surplus water inthe Valley's groundwater basin during wet periods to be recovered during droughtperiods.
Implementation Costs
Each management category-conservation, groundwater recharge, and source substitution-willhave specific implementation costs in addition to the baseline costs associated with the NoProject alternative. The baseline costs include existing water conservation activities, existingdelivery of recycled water to Upper Valley golf courses, and the continued purchase of existing
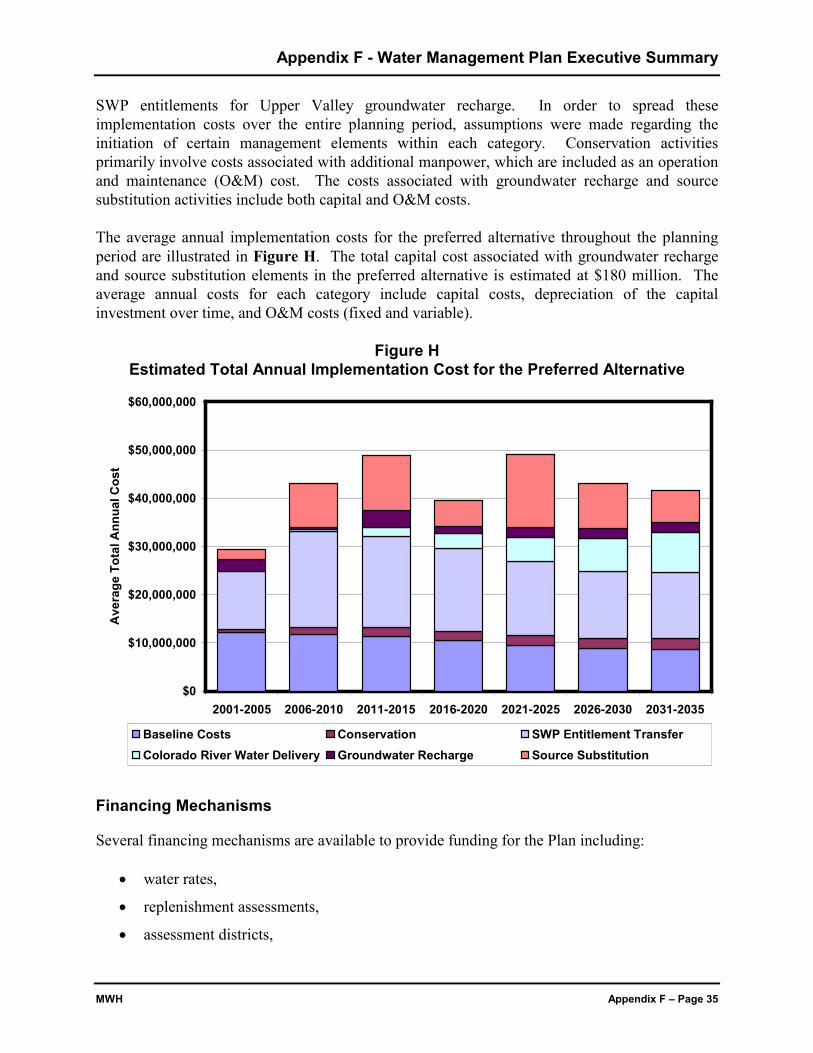
Appendix F - Water Management Plan Executive Summary
MWH Appendix F – Page 35
SWP entitlements for Upper Valley groundwater recharge. In order to spread theseimplementation costs over the entire planning period, assumptions were made regarding theinitiation of certain management elements within each category. Conservation activitiesprimarily involve costs associated with additional manpower, which are included as an operationand maintenance (O&M) cost. The costs associated with groundwater recharge and sourcesubstitution activities include both capital and O&M costs.
The average annual implementation costs for the preferred alternative throughout the planningperiod are illustrated in Figure H. The total capital cost associated with groundwater rechargeand source substitution elements in the preferred alternative is estimated at $180 million. Theaverage annual costs for each category include capital costs, depreciation of the capitalinvestment over time, and O&M costs (fixed and variable).
Figure HEstimated Total Annual Implementation Cost for the Preferred Alternative
$0
$10,000,000
$20,000,000
$30,000,000
$40,000,000
$50,000,000
$60,000,000
2001-2005 2006-2010 2011-2015 2016-2020 2021-2025 2026-2030 2031-2035
Ave
rage
Tot
al A
nnua
l Cos
t
Baseline Costs Conservation SWP Entitlement TransferColorado River Water Delivery Groundwater Recharge Source Substitution
Financing Mechanisms
Several financing mechanisms are available to provide funding for the Plan including:
• water rates,
• replenishment assessments,
• assessment districts,
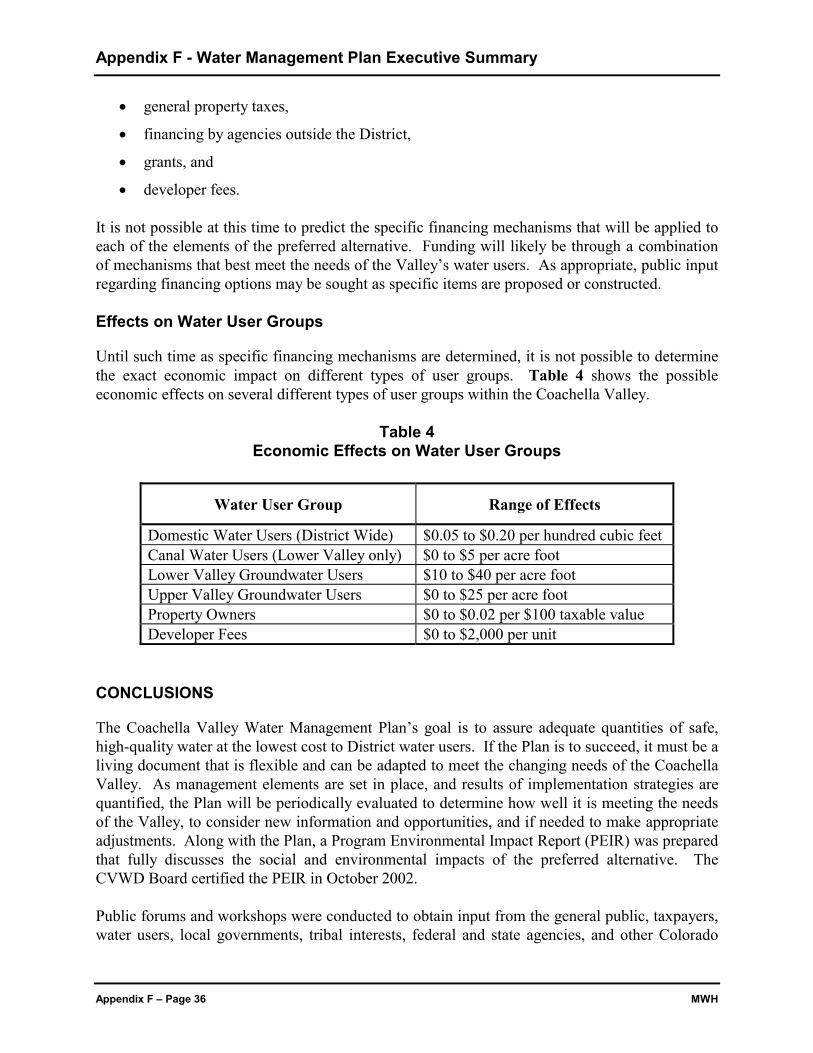
Appendix F - Water Management Plan Executive Summary
Appendix F – Page 36 MWH
• general property taxes,
• financing by agencies outside the District,
• grants, and
• developer fees.
It is not possible at this time to predict the specific financing mechanisms that will be applied toeach of the elements of the preferred alternative. Funding will likely be through a combinationof mechanisms that best meet the needs of the Valley’s water users. As appropriate, public inputregarding financing options may be sought as specific items are proposed or constructed.
Effects on Water User Groups
Until such time as specific financing mechanisms are determined, it is not possible to determinethe exact economic impact on different types of user groups. Table 4 shows the possibleeconomic effects on several different types of user groups within the Coachella Valley.
Table 4Economic Effects on Water User Groups
Water User Group Range of Effects
Domestic Water Users (District Wide) $0.05 to $0.20 per hundred cubic feetCanal Water Users (Lower Valley only) $0 to $5 per acre footLower Valley Groundwater Users $10 to $40 per acre footUpper Valley Groundwater Users $0 to $25 per acre footProperty Owners $0 to $0.02 per $100 taxable valueDeveloper Fees $0 to $2,000 per unit
CONCLUSIONS
The Coachella Valley Water Management Plan’s goal is to assure adequate quantities of safe,high-quality water at the lowest cost to District water users. If the Plan is to succeed, it must be aliving document that is flexible and can be adapted to meet the changing needs of the CoachellaValley. As management elements are set in place, and results of implementation strategies arequantified, the Plan will be periodically evaluated to determine how well it is meeting the needsof the Valley, to consider new information and opportunities, and if needed to make appropriateadjustments. Along with the Plan, a Program Environmental Impact Report (PEIR) was preparedthat fully discusses the social and environmental impacts of the preferred alternative. TheCVWD Board certified the PEIR in October 2002.
Public forums and workshops were conducted to obtain input from the general public, taxpayers,water users, local governments, tribal interests, federal and state agencies, and other Colorado
Appendix F - Water Management Plan Executive Summary
MWH Appendix F – Page 37
River water users. Based on the results of the public review of the Plan and PEIR, the CVWDBoard adopted the Plan in October 2002.
Actions needed to ensure that the preferred alternative meets the objectives of the Plan requirecommitment, consensus, and cooperation from all water users in the Valley. The success of pastwater management efforts, coupled with implementation of the recommendations in theCoachella Valley Water Management Plan, will allow the Coachella Valley to sustain its vibranteconomy and move into the new century with a reliable, affordable, and stable water supply.

MWH Appendix G-1
Appendix GCVWD Landscape Irrigation
Ordinance (#1032)

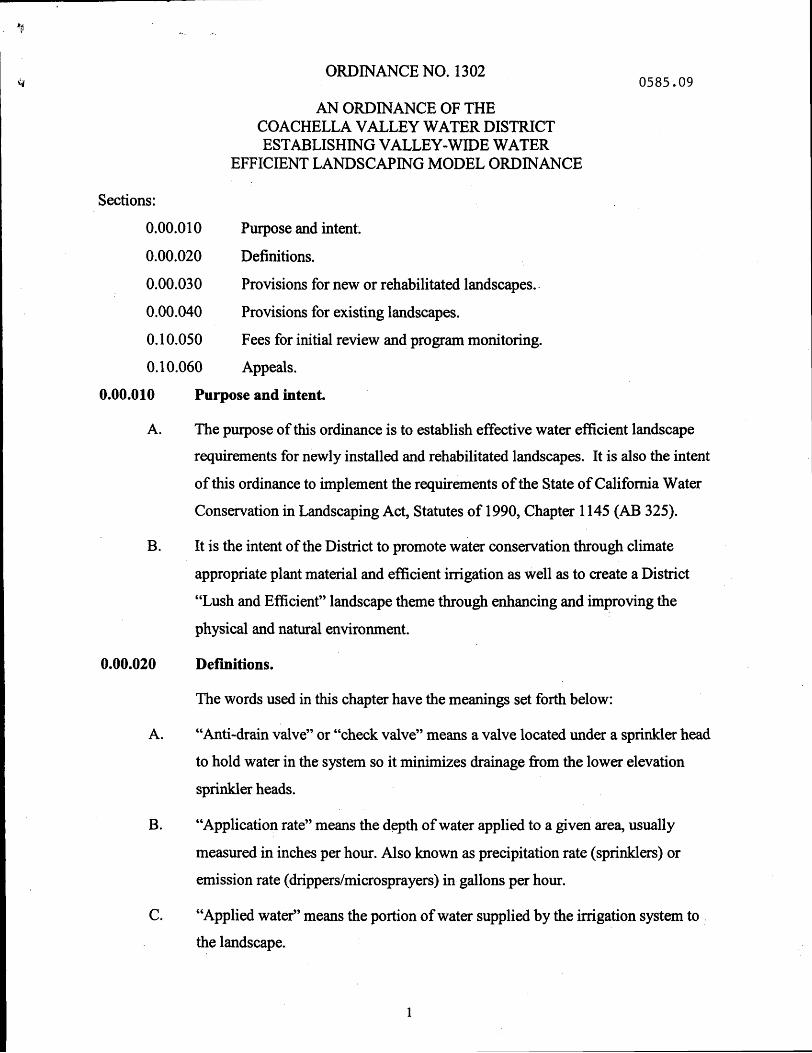
ORDINANCE NO. 1302
AN ORDINANCE OF THE COACHELLA VALLEY WATER DISTRICT
EFFICIENT LANDSCAPING MODEL ORDINANCE ESTABLISHING VALLEY-WIDE WATER
Sections :
0.00.01 0
0.00.020
0.00.030
0.00.040
0.10.050
0.10.060
0.00.010
A.
B.
0.00.020
A.
B.
C.
0585.09
Purpose and intent.
Definitions.
Provisions for new or rehabilitated landscapes.
Provisions for existing landscapes.
Fees for initial review and program monitoring.
Appeals.
Purpose and intent.
The purpose of this ordinance is to establish effective water efficient landscape requirements for newly installed and rehabilitated landscapes. It is also the intent
of this ordinance to implement the requirements of the State of California Water
Conservation in Landscaping Act, Statutes of 1990, Chapter 1 145 (AB 325).
It is the intent of the District to promote water conservation through climate
appropriate plant material and efficient irrigation as well as to create a District “Lush and Efficient” landscape theme through enhancing and improving the
physical and natural environment.
Definitions.
The words used in this chapter have the meanings set forth below:
“Anti-drain valve” or “check valve” means a valve located under a sprinkler head
to hold water in the system so it minimizes drainage fiom the lower elevation
sprinkler heads.
“Application rate” means the depth of water applied to a given area, usually
measured in inches per hour. Also known as precipitation rate (sprinklers) or emission rate (drippers/microsprayers) in gallons per hour.
“Applied water” means the portion of water supplied by the irrigation system to the landscape.
1
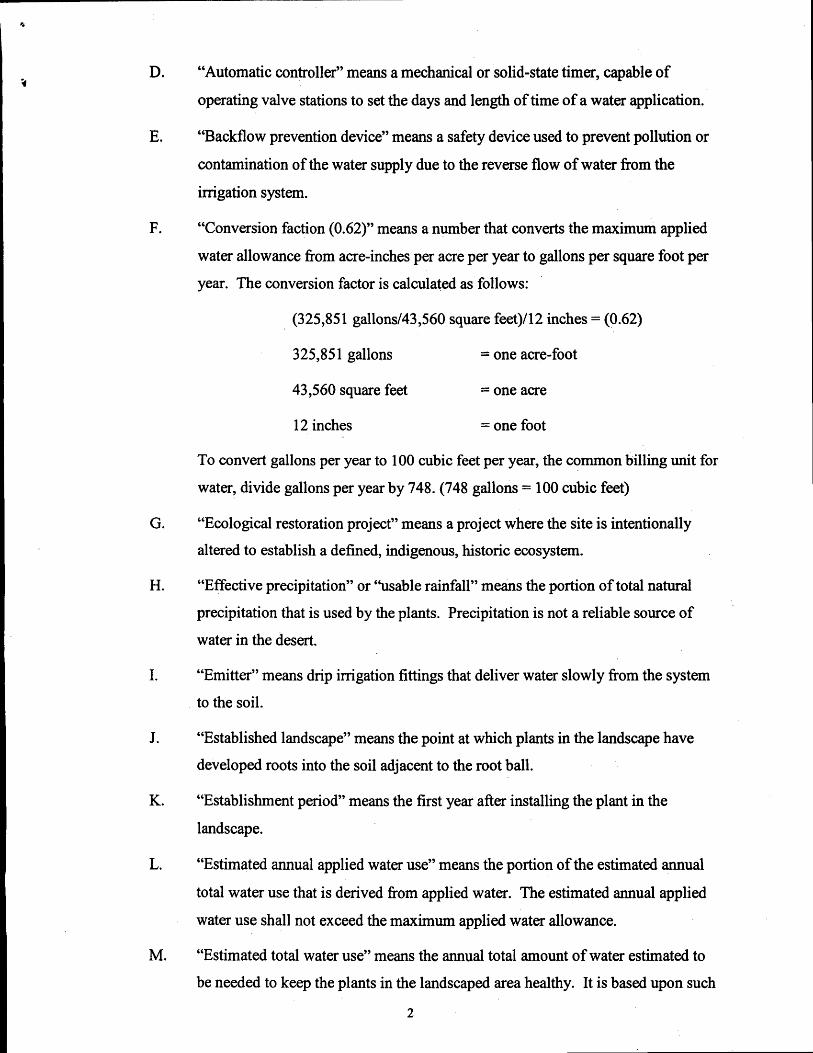
D.
E.
F.
G.
H.
I.
J.
K.
L.
M.
“Automatic controller” means a mechanical or solid-state timer, capable of
operating valve stations to set the days and length of time of a water application.
“Backflow prevention device” means a safety device used to prevent pollution or
contamination of the water supply due to the reverse flow of water fiom the
imgation system.
“Conversion faction (0.62)” means a number that converts the maximum applied
water allowance fiom acre-inches per acre per year to gallons per square foot per
year. The conversion factor is calculated as follows:
(325,851 gallons/43,560 square fee9112 inches = (0.62)
325,85 1 gallons = one acre-foot
43,560 square feet = one acre
12 inches = one foot
To convert gallons per year to 100 cubic feet per year, the common billing unit for
water, divide gallons per year by 748. (748 gallons = 100 cubic feet)
“Ecological restoration project” means a project where the site is intentionally altered to establish a defined, indigenous, historic ecosystem.
“Effective precipitation” or “usable rainfall” means the portion of total natural precipitation that is used by the plants. Precipitation is not a reliable source of water in the desert.
“Emitter” means drip imgation fittings that deliver water slowly fiom the system to the soil.
“Established landscape” means the point at which plants in the landscape have developed roots into the soil adjacent to the root ball.
“Establishment period” means the first year after installing the plant in the
landscape.
“Estimated annual applied water use” means the portion of the estimated annual
total water use that is derived fkom applied water. The estimated annual applied
water use shall not exceed the maximum applied water allowance.
“Estimated total water use” means the annual total amount of water estimated to be needed to keep the plants in the landscaped area healthy. It is based upon such
2
C.
3
N.
0.
P.
Q-
R.
S.
T.
U.
factors as the local evapotranspiration rate, the size of the landscaped area, the
types of plants, and the efficiency of the imgation system.
“ET adjustment factor” means a factor of 0.6 that, when applied to reference
evapotranspiration, adjusts for plant factors and irrigation efficiency, two major
influences upon the amount of water that needs to be applied to the landscape. A combined plant mix with a site-wide average 0.45 is the basis of the plant factor
portion of this calculation. The irrigation efficiency for purposes of the ET
adjustment factor is 0.75. Therefore, the ET adjustment factor (0.6) = (0.4510.75).
“Evapotranspiration” means the quantity of water evaporated fi-om adjacent soil
surfaces and transpired by plants during a specific time.
“Flow rate” means the rate at which water flows through pipes and valves (gallons per minute or cubic feet per second).
“Hydrozone” means a portion of the landscaped area having plants with similar water needs that are served by a valve or set of valves with the same schedule. A
hydrozone may be irrigated or nonirrigated. For example, a naturalized area planted with native vegetation that will not need supplemental imgation once established is a nonirrigated hydrozone.
“Infiltration rate” means the rate of water entry into the soil expressed as a depth of water per unit of time (inches per hour).
“Irrigation efficiency” means the measurement of the amount of water
beneficially used divided by the amount of water applied. Imgation efficiency is derived from measurements and estimates of irrigation system characteristics and
management practices. The minimum irrigation efficiency for purposes of this chapter is 0.75. Greater imgation efficiency can be expected fi-om well-designed
and maintained systems.
“Landscape imgation audit” means a process to perform site inspections, evaluate
irrigation systems, and develop efficient irrigation schedules.
“Landscaped area” means the entire parcel less the building footprint, driveways,
nonimgated portions of parking lots, hardscapes such as decks and patios, and other nonporous areas. Water features are included in the calculation of the
landscaped area.
3
V.
w.
X.
Y.
Z.
AA.
BB.
cc
DD.
EE.
FF.
“Lateral line” means the water delivery pipeline that supplies water to the emitters
or sprinklers fiom the valve.
“Main line” means the pressurized pipeline that delivers water fiom the water
meter to the valve or outlet.
“Service line” means the pressurized pipeline that delivers water from the water
source to the water meter.
“Maximum applied water allowance” means for design purposes, the upper limit
of annual applied water for the established landscaped area. It is based upon the
area’s reference evapotranspiration, the ET adjustment factor, and the size of the landscaped area. The estimated applied water use shall not exceed the maximum
applied water allowance.
“Mined-land reclamation projects” means any surface mining operation with a
reclamation plan approved in accordance with the Surface Mining and Reclamation Act of 1975.
“Mulch” means any material such as gravel, small rocks, pebbles, decorative
sand, decomposed granite, bark, straw or other material left loose and applied to the soil surface for the beneficial purpose of reducing evaporation.
“Operating pressure” means the manufacturer’s recommended pressure at which a
system of sprinklers, bubblers, drippers or microsprayers is designed to operate.
“Overhead sprinkler irrigation systems” means those with high flow rates
(pop-ups, impulse sprinklers, rotors, etc.).
“Overspray” means the water which is delivered beyond the landscaped
area, wetting pavements, walks, structures, or other nonlandscaped areas.
“Plant factor” means a factor that when multiplied by reference
evapotranspiration, estimates the amount of water used by plants. For purposes of
this ordinance, the average plant factor of very low water using plants ranges fiom 0.01 to 0. IO, for low water using plants the range is 0.10 to 0.35, for moderate
water using plants the range is 0.35 to 0.60 and for high water using plants, the
range is 0.60 to 0.90.
“Rain sensing device” means a system which automatically shuts off the
irrigation system when it rains. 4
GG.
HH.
11.
JJ.
KK.
LL.
MM.
”.
00.
PP.
“Record drawing” or “as-builts” means a set of reproducible drawings
which show significant changes in the work made during construction which are
usually based on drawings marked up in the field and other data furnished by the
contractor.
“Recreational area” means areas of active play or recreation such as sports fields,
school yards, picnic grounds, or other areas with intense foot traffic.
“Recycled water,” “reclaimed water” or “treated sewage eMuent water” means
treated or recycled waste water of a quality suitable for nonpotable uses such as landscape irrigation; not intended for human consumption.
“Reference evapotranspiration” or “ETo” means a standard measurement of
environmental parameters which affect the water use of plants. ETo is given in inches per day, month, or year, and is an estimate of the evapotranspiration of a
large field of cool-season grass that is well watered. Reference evapotranspiration is used as a basis of determining the maximum applied water allowances so that
regional differences in climate can be accommodated. For purposes of this ordinance, CVWD Dwg. No. 29523 will be used for ETo zone.
“Rehabilitated landscape” means any relandscaping project whose choice of new
plant material and/or new irrigation system components is such that the calculation of the site’s estimated water use will be significantly changed. The
new estimated water use calculation must not exceed the maximum applied water
allowance calculated for the site using a 0.6 ET adjustment factor.
“Runoff’ means water which is not absorbed by the soil or landscape to which it is applied and flows from the planted area. For example, runoff may result from water that is applied at too great a rate (application rate exceeds infiltration rate),
when there is a severe slope or when water is misapplied to hardscapes.
“Soil moisture sensing device” means a device that measures the amount of water in the soil.
“Soil texture” means the classification of soil based on the percentage of sand, silt
and clay in the soil.
‘‘Sprinkler head” means a device which sprays water through a nozzle.
“Static water pressure” means the pipeline pressure when water is not flowing.
5
QQ- Y
RR.
ss. TT.
uu.
w.
“Station” means an area served by one valve or by a set of valves that operates
simultaneously.
“Turf” means a surface layer of earth containing mowed grass with its roots.
Perennial and Annual Ryegrass are cool season grasses. Hybrid and common
Bermuda grass, are warm season grasses.
“Valve” means a device used to control the flow of water in the imgation system.
“Water Conservation Concept Statement” means a one-page checklist and a
narrative summary of the project.
“Water Feature” means any water applied to the landscape for non-irrigation decorative purposes. Fountains, streams, ponds and lakes are considered water
features. Water features use more water than efficiently irrigated turfgrass and are
assigned a plant factor value of 1.1 for a stationary body of water and 1.2 for a
moving body of water.
“Recreational Turfgrass” means turfgrass that serves as a playing surface for
sports and recreational activities. Athletic fields, golf courses, parks and school playgrounds are all examples of areas hosting recreational turfgass.
‘ww. “Recreational Turfgrass ET adjustment factor” means a factor of 0.82 that, when applied to reference evapotranspiration, adjusts for the additional stress of high
traffic on recreational turfgrass and the higher imgation efficiencies of long range
rotary sprinklers. These are the two major influences upon the amount of water
that needs to be applied to a recreational landscape. A mixed cool/warm season turfgrass with a seasonal average of 0.7 is the basis of the plant factor portion of this calculation. The irrigation efficiency of long range sprinklers for purposes of
the ET adjustment factor is 0.85. Therefore, the ET adjustment factor is 0.82 =
0.7/0.8 5.
6
0.00.030 Provisions for new or rehabilitated landscapes. A. Applicability.
1. Except as provided in subsection (A)(3) of this section, this section shall apply to:
a. All new and rehabilitated landscaping for private, public,
recreational, commercial and governmental development projects
that require a permit; and
b. Developer-installed landscaping in single-family tracts and
mu1 ti family projects.
2. Projects subject to this section shall conform to the provisions in this
section.
This section shall not apply to: 3.
a. Resident home owner-provided landscaping at single-family residences.
B. Landscape Documentation Package.
4. Each landscape documentation package shall include the following elements, which are described in subsection C of this section.
a. Water conservation concept statement;
b. Calculation of the maximum applied water allowance;
c.
d.
Calculation of the estimated applied water use;
Calculation of the estimated total water use;
e. Landscape design plan;
f Irrigation design plan;
g. Grading design plan;
h Soil analysis (optional);
1. Certificate of substantial completion. (To be submitted by certified
landscape designer, auditor or landscape architect after installation
of the project.)
7
8 5. Three copies of the landscape documentation package conforming to this
chapter shall be submitted to the District. No permit shall be issued until
the District reviews and approves the landscape documentation package.
6. A copy of the approved landscape documentation package shall be
provided to the property owner or site manager along with the record
drawings and any other information normally forwarded to the property
owner or site manager.
Upon completion of construction, a copy of the water conservation
concept statement and the certificate of substantial completion shall be sent by the project manager to the water management specialist of the
water district and city/county having jurisdiction.
7.
C . Elements of Landscape Documentation Package.
1. Water Conservation Concept Statement. Each landscape documentation package shall include a cover sheet, referred to as the water conservation statement similar to the following example. It serves as a checklist to verify that the elements of the landscape documentation package have been completed and has a narrative summary of the project.
8
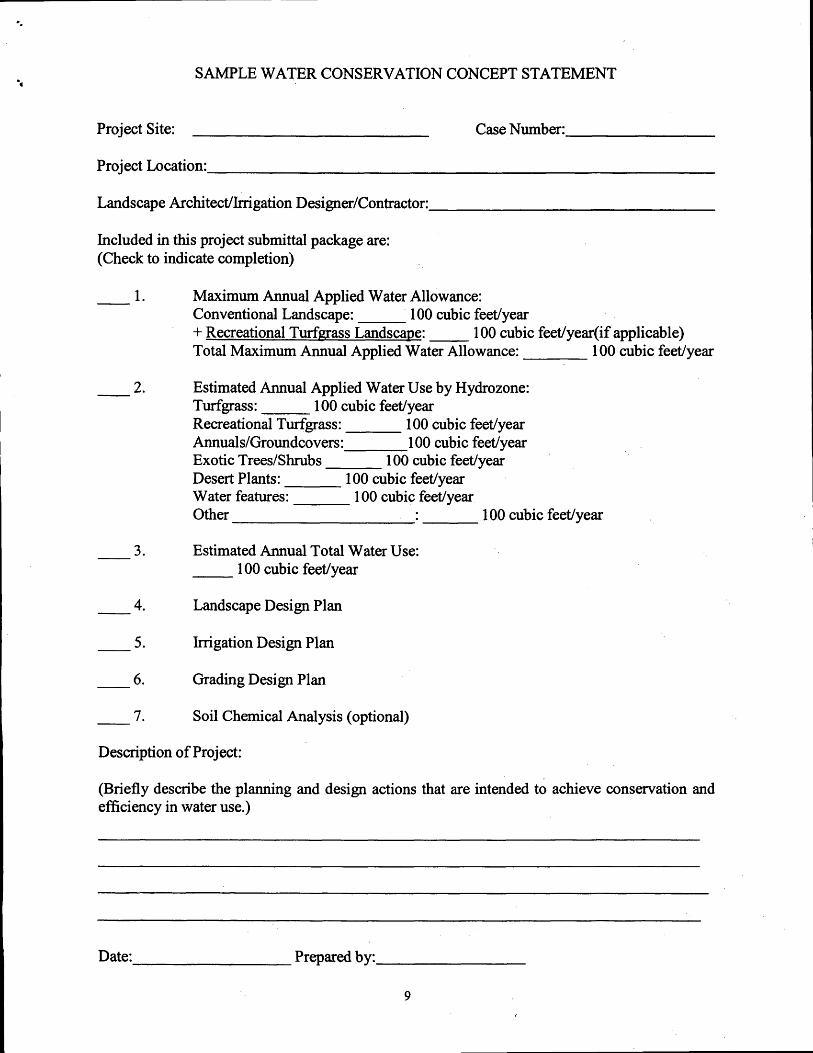
SAMPLE WATER CONSERVATION CONCEPT STATEMENT
Project Site: Case Number:
Project Location:
Landscape Architect/Irrigation DesignedContractor:
Included in this project submittal package are: (Check to indicate completion)
1. Maximum Annual Applied Water Allowance: Conventional Landscape: 100 cubic feedyear + Recreational Turfgrass Landscape: 100 cubic feet/year(if applicable) Total Maximum Annual Applied Water Allowance: 100 cubic feet/year
2. Estimated Annual Applied Water Use by Hydrozone: Turfgrass: 100 cubic feet/year Recreational Turfgrass: 100 cubic feet/year Annual s/Groundcovers : 100 cubic feedyear Exotic Trees/Shrubs 100 cubic feet/year Desert Plants: 100 cubic feet/year Water features: 100 cubic feet/year Other 100 cubic feet/year
3. Estimated Annual Total Water Use: 100 cubic feedyear
4. Landscape Design Plan
5. Irrigation Design Plan
6 . Grading Design Plan
7. Soil Chemical Analysis (optional)
Description of Project:
(Briefly describe the planning and design actions that are intended to achieve conservation and efficiency in water use.)
Date: Prepared by:
9
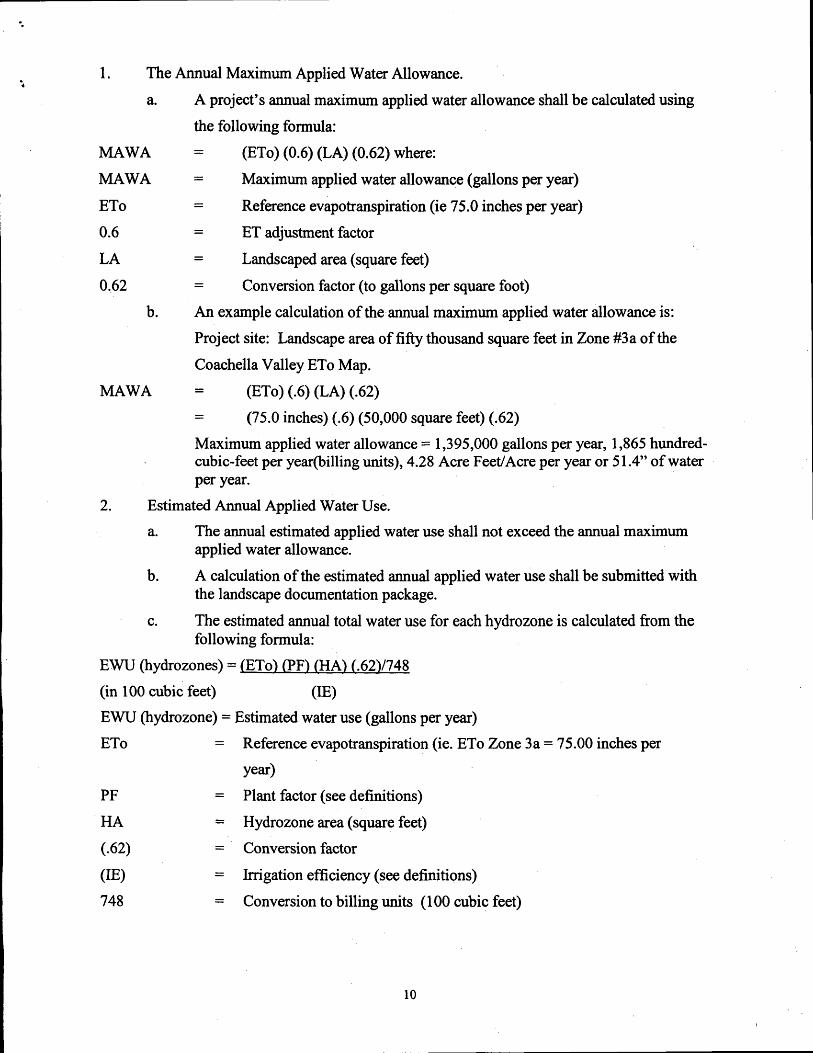
4 1. The Annual Maximum Applied Water Allowance.
a. A project’s annual maximum applied water allowance shall be calculated using the following formula:
MAWA - - (ETo) (0.6) (LA) (0.62) where: MAWA = Maximum applied water allowance (gallons per year) ETo 0.6 LA 0.62
MAWA
2.
= Reference evapotranspiration (ie 75.0 inches per year) ET adjustment factor
= Landscaped area (square feet)
- -
Conversion factor (to gallons per square foot) - -
b. An example calculation of the annual maximum applied water allowance is: Project site: Landscape area of fifty thousand square feet in Zone #3a of the Coachella Valley ETo Map.
(ETo) (.6) (LA) (.62) (75.0 inches) (.6) (50,000 square feet) (.62)
- -
- -
Maximum applied water allowance = 1,395,000 gallons per year, 1,865 hundred- cubic-feet per year(bi1ling units), 4.28 Acre Feet/Acre per year or 5 1.4” of water per year.
Estimated Annual Applied Water Use. a. The annual estimated applied water use shall not exceed the annual maximum
applied water allowance. b. A calculation of the estimated annual applied water use shall be submitted with
the landscape documentation package. The estimated annual total water use for each hydrozone is calculated from the following formula:
c.
E W (hydrozones) = {ETo) (PF) (HA) (.62)/748
(in 100 cubic feet) (IE) EWU (hydrozone) = Estimated water use (gallons per year) ETo = Reference evapotranspiration (ie. ETo Zone 3a = 75.00 inches per
Year> PF = Plant factor (see definitions) HA = Hydrozone area (square feet) (-62) = Conversion factor (IE) = Imgation efficiency (see definitions) 748 = Conversion to billing units (100 cubic feet)
10
3. Estimated Annual Total Water Use. A calculation of the estimated annual total hydrozone water use shall be submitted with the landscape documentation package. The estimated annual total water use for the entire landscaped area equals the sum of the estimated annual water use (EWU) of all hydrozones in that landscaped area. Landscape Design Plan. A landscape design plan meeting the following requirements shall be submitted as part of the landscape documentation package. A. Plant Selection and Grouping.
4.
i. Any plants may be used in the landscape, providing the estimated annual applied water use recommended does not exceed the maximum annual applied water allowance and that the plants meet the specifications set forth in (ii), (iii) and (iv). Plants having similar water use shall be grouped together in distinct h ydrozones . Plants shall be selected appropriately based upon their adaptability to the climate, geologic, and topographical conditions of the site. Protection and preservation of native species and natural areas is encouraged. The planting of trees is encouraged whenever it is consistent with the other provisions of this chapter. Fire prevention needs shall be addressed in areas that are fire prone. Information about fire prone areas and appropriate landscaping for fire safety is available fiom the fire marshal.
ii.
iii.
iv.
B. Water Features. 1.
Landscape Design Plan Specifications. The landscape design plan shall be drawn on project base sheets at a scale that accurately and clearly identifies: 1. Designation of hydrozones; 11.
Recirculating water shall be used for decorative water features. C.
.. Landscape materials, trees, shrubs, groundcover, huf and other vegetation. Planting symbols shall be clearly drawn and plants labeled by botanical name, common name, water use classification, container size, spacing and quantities of each group of plants indicated; Property lines and street names; Streets, driveways, walkways and other paved areas; Pools, ponds, water features, fences and retaining walls; Existing and proposed buildings and structures including elevation, if applicable; Location of all overhead and underground utilities. Natural features including but not limited to rock outcroppings, existing trees and shrubs that will remain; Tree staking, plant installation, soil preparation details, and any other applicable planting and installation details;
... 111.
iv. v. vi.
vii. viii.
ix.
11
x. xi. Designation of recreational areas.
A calculation of the total landscaped area;
5. Irrigation Design Plan. An imgation design plan meeting the following conditions shall be submitted as part of the landscape documentation package. A. Irrigation Design Criteria.
i. Runoff and Overspray. Soil types and infiltration rate shall be considered when designing imgation systems. All irrigation systems shall be designed to avoid runoff, low-head drainage, overspray, or other similar conditions where water flows onto adjacent property, nonimgated areas, walks, roadways or structures. Proper imgation equipment and schedules, including features such as repeat cycles, shall be used to closely match application rates to infiltration rates therefore minimizing runoff. Special attention shall be given to avoid runoff on slopes and to avoid overspray in planting areas with a width less than ten feet. No overhead sprinkler irrigation systems shall be installed in median strips or islands
.. 11. Irrigation Efficiency. For the purpose of determining the maximum
applied water allowance, irrigation efficiency is assumed to be 0.75. Mixed irrigation system types shall be designed, maintained and managed to meet or exceed an average of 0.75 efficiency.
... 111. Equipment.
(A) Water Meters. Separate landscape water meters shall be installed for all projects except for single-family homes or any project with a landscaped area of less than twenty five hundred square feet. Controllers. Automatic control systems (solar or electric) shall be required for all imgation systems and must be able to accommodate all aspects of the design. Mechanical irrigation controllers are prohibited. Valves. Plants which require different amounts of water shall be irrigated by separate valves. If one valve is used for a given area, only plants with similar water use shall be used in that area. Anti-drain (check) valves shall be installed in strategic points to prevent low -head drainage. Sprinkler Heads. Heads shall have application rates appropriate to the plant water use requirements within each control valve circuit. Sprinkler heads shall be selected for proper area coverage, application rate, matched precipitation rate nozzles, operating pressure, adjustment capability and ease of maintenance. Scheduling Aids: Soil Moisture Sensing Devices. It is required that soil moisture sensing devices be installed on all turfgrass sites exceeding 1 .O acres(43,560 square feet) of planted area. Scheduling Aids: ETo Controllers. It is recommended that ETo controllers be considered for installation on all sites.
(B)
( C )
(D)
(E)
(F)
(G)
12
..
(H) Equipment in Publicly Maintained Areas. areas which may or will be maintained by conform to specifications of the District.
1
Irrigation equipment in the District shall
(I) Emitters. Emitters shall have application rates appropriate to the plant water use requirements within each control valve circuit. Emitters shall be selected for specific area coverage (individual plants), application rates, operating pressure, adjustment capability and ease of maintenance.
B. Recycled Water. 1. The installation of recycled water imgation systems (dual distribution
systems) shall be required to allow for the current and future use of recycled water, unless a written exemption has been granted as described in the following subsection ii. Imgation systems shall make use of recycled water unless a written exemption has been granted by the District, stating that recycled water meeting all health standards is not available and will not be available in the foreseeable future.
.. 11.
... 111. Recycled water imgation systems shall be designed and operated in
accordance with all local and state codes and be applicable to all of the provisions of this ordinance.
C. Imgation Design Plan Specifications. Irrigation systems shall be designed to be consistent with hydrozones. The irrigation design plan shall be drawn on project base sheets. It shall be separate from, but use the same format as, the landscape design plan. The scale shall be the same as that used for the landscape design plan. The irrigation design plan shall accurately and clearly identify: 1. Location and size of separate water meters for the landscape; 11. Location, type, and size of all components of the irrigation system,
including automatic controllers, main and lateral lines, valves, sprinkler heads, moisture sensing devices, rain switches, quick couplers, and backflow prevention devices; Static water pressure at the point of connection to the water supply; Flow rate (gallons per minute), application rate (inches per hour), and design operating pressure (psi) for each station;
..
... 111.
iv.
v. Recycled water imgation systems. 6. Grading Design Plan. Grading design plans satisfylng the city/county grading ordinance
and the following conditions shall be submitted as part of the landscape documentation package. A.
B.
A grading design plan shall be drawn on project base sheets. It shall be separate fiom but use the same format as the landscape design plan. The grading design plan shall indicate finished configurations and elevations of the landscaped area, including the height of graded slopes, drainage patterns, pad elevations, and finish grade.
13
7. Soil Analysis. A. A soil analysis satisfjmg the following conditions should be submitted as part of
the landscape documentation package: i. Determination of soil texture, indicating the available water holding
capacity. An approximate soil infiltration rate (either) measured or derived fiom soil texture/infiltration rate tables. A range of infiltration rates shall be noted where appropriate. Measure of pH and total soluble salts.
.. 11.
iii. 8. Certification.
A. A licensed landscape architect, designer of record or designated District staff shall conduct a final field observation and shall provide a certificate of substantial completion to the District. The certificate shall specifically indicate that plants were installed as specified, that the imgation system was installed as designed, and that an imgation audit has been performed, along with a list of any observed deficiencies.
B. Certification shall be accomplished by completing a certificate of substantial completion and delivering it to the District, to the retail water supplier, and to the owner of record. A sample of such a form, which shall be provided by the District is:
14
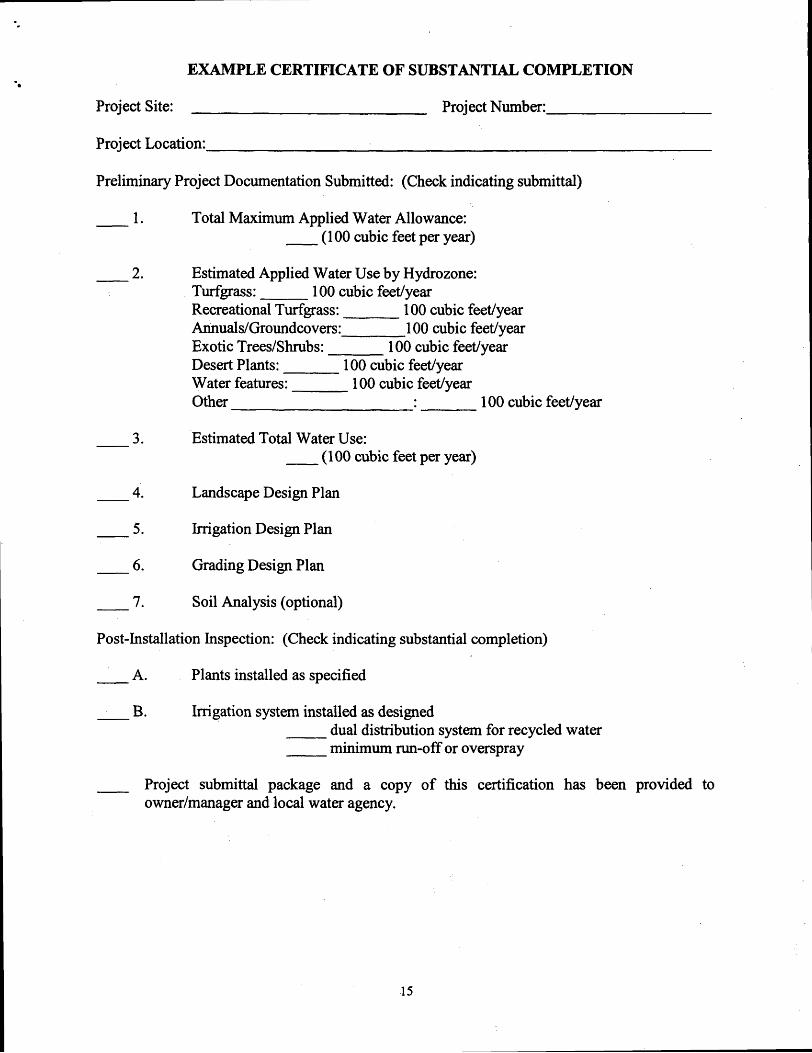
EXAMPLE CERTIFICATE OF SUBSTANTIAL COMPLETION
Project Site: Project Number:
Project Location:
Preliminary Project Documentation Submitted: (Check indicating submittal)
1. Total Maximum Applied Water Allowance: (1 00 cubic feet per year)
2. Estimated Applied Water Use by Hydrozone: Turfgrass: 100 cubic feeuyear Recreational Turfgrass: 100 cubic feetlyear Annual s/Groundcovers : 100 cubic feetlyear Exotic TreedShrubs: 100 cubic feeuyear Desert Plants: 100 cubic feeuyear Water features: 100 cubic feetlyear Other 100 cubic feeuyear
3. Estimated Total Water Use: (1 00 cubic feet per year)
4. Landscape Design Plan
5. Irrigation Design Plan
6. Grading Design Plan
7. Soil Analysis (optional)
Post-Installation Inspection: (Check indicating substantial completion)
A. Plants installed as specified
B. Irrigation system installed as designed dual distribution system for recycled water minimum run-off or overspray
Project submittal package and a copy of this certification has been provided to owner/manager and local water agency.
15
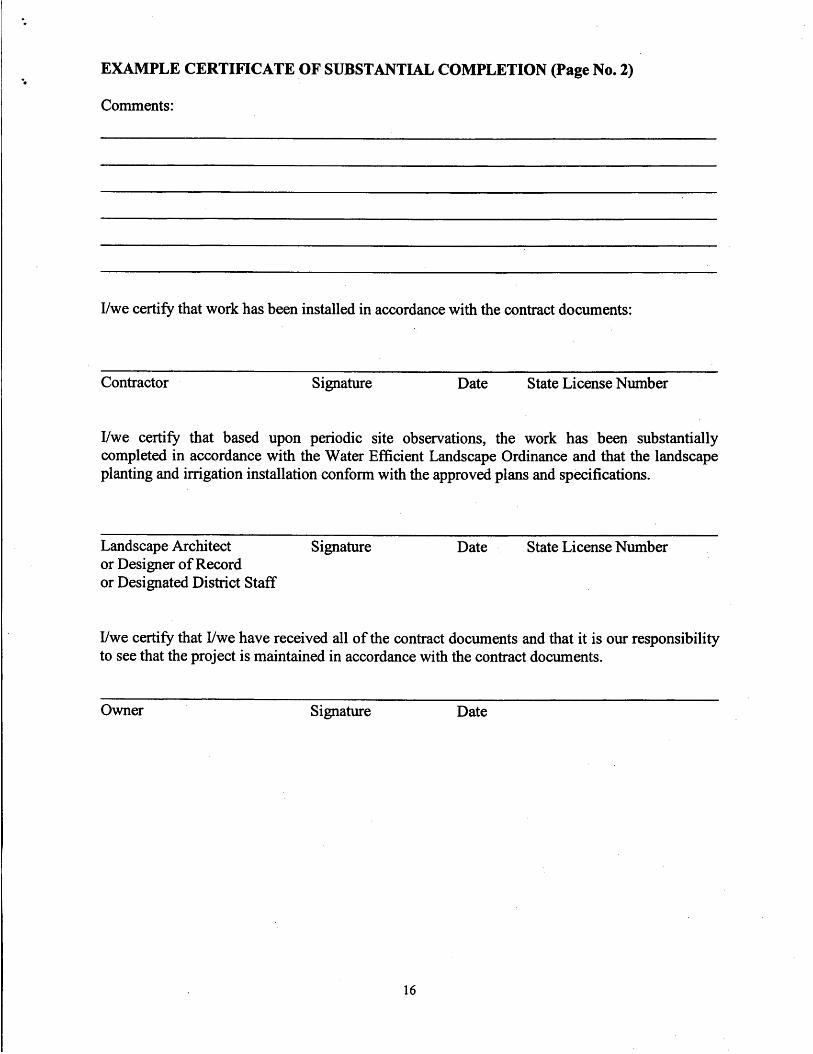
EXAMPLE CERTIFICATE OF SUBSTANTIAL COMPLETION (Page No. 2)
Comments:
Ywe certify that work has been installed in accordance with the contract documents:
~~
Contractor Signature Date State License Number
Ywe certify that based upon periodic site observations, the work has been substantially completed in accordance with the Water Efficient Landscape Ordinance and that the landscape planting and irrigation installation conform with the approved plans and specifications.
Landscape Architect Signature Date State License Number or Designer of Record or Designated District Staff
Ywe certify that Ywe have received all of the contract documents and that it is our responsibility to see that the project is maintained in accordance with the contract documents.
Owner Signature Date
16
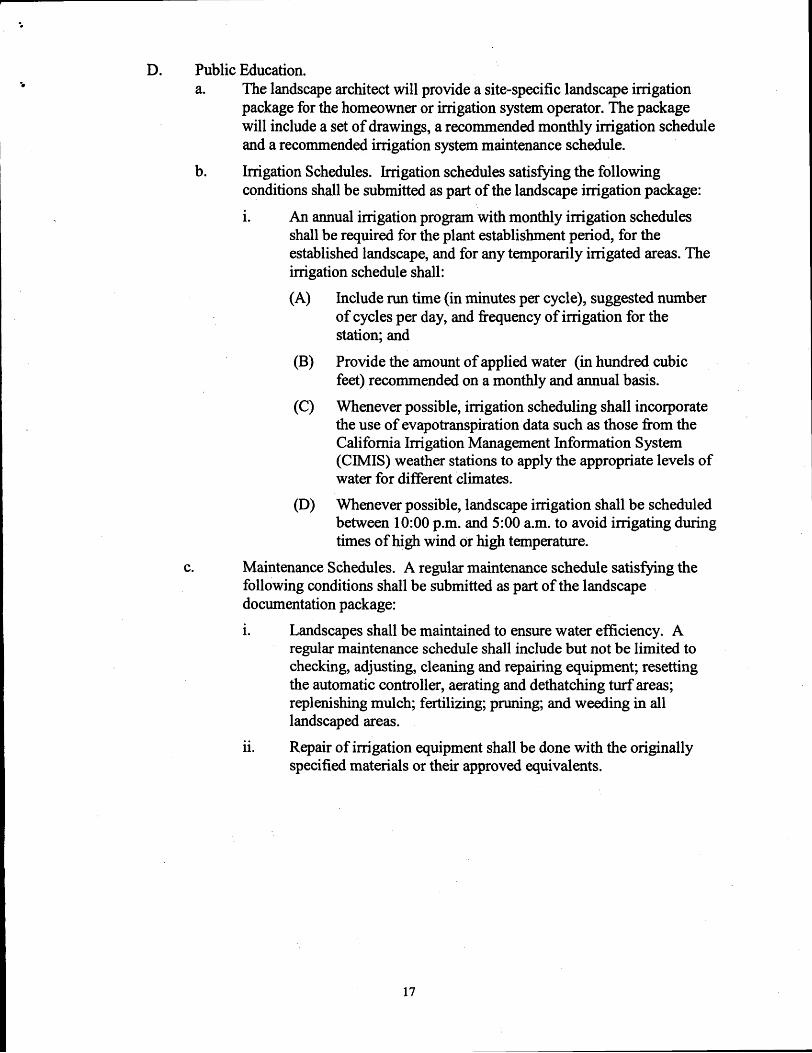
.
~
I
D. Public Education. a. The landscape architect will provide a site-specific landscape irrigation
package for the homeowner or irrigation system operator. The package will include a set of drawings, a recommended monthly irrigation schedule and a recommended imgation system maintenance schedule. Irrigation Schedules. Irrigation schedules satisfying the following conditions shall be submitted as part of the landscape irrigation package: i. An annual irrigation program with monthly irrigation schedules
shall be required for the plant establishment period, for the established landscape, and for any temporarily irrigated areas. The irrigation schedule shall:
(A) Include run time (in minutes per cycle), suggested number of cycles per day, and frequency of imgation for the station; and
b.
(B)
(C)
Provide the amount of applied water (in hundred cubic feet) recommended on a monthly and annual basis. Whenever possible, irrigation scheduling shall incorporate the use of evapotranspiration data such as those fkom the California Imgation Management Infonnation System (CIMIS) weather stations to apply the appropriate levels of water for different climates.
(D) Whenever possible, landscape irrigation shall be scheduled between 1O:OO p.m. and 5:OO a.m. to avoid imgating during times of high wind or high temperature.
C. Maintenance Schedules. A regular maintenance schedule satisfjmg the following conditions shall be submitted as part of the landscape documentation package: 1. Landscapes shall be maintained to ensure water efficiency. A
regular maintenance schedule shall include but not be limited to checking, adjusting, cleaning and repairing equipment; resetting the automatic controller, aerating and dethatching turf areas; replenishing mulch; fertilizing; pruning; and weeding in all landscaped areas. Repair of irrigation equipment shall be done with the originally specified materials or their approved equivalents.
.. 11.
17
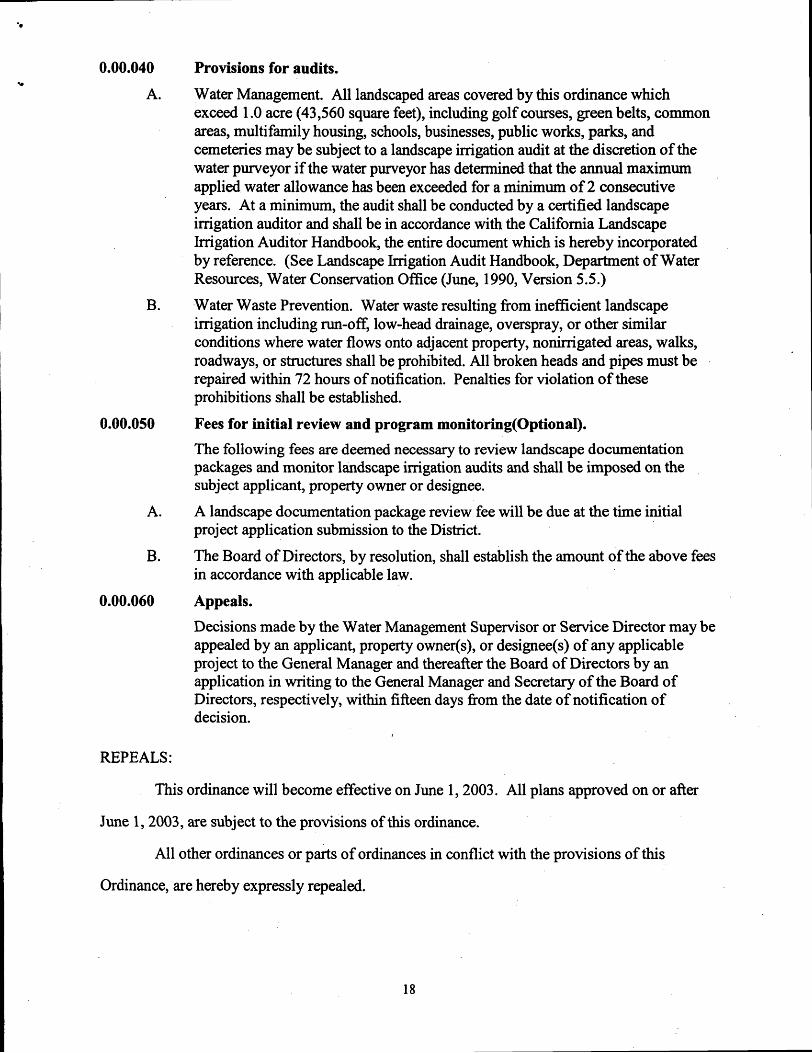
0.00.040 Y
A.
B.
0.00.050
A.
B.
0.00.060
REPEALS:
Provisions for audits. Water Management. All landscaped areas covered by this ordinance which exceed 1 .O acre (43,560 square feet), including golf courses, green belts, common areas, multifamily housing, schools, businesses, public works, parks, and cemeteries may be subject to a landscape irrigation audit at the discretion of the water purveyor if the water purveyor has determined that the annual maximum applied water allowance has been exceeded for a minimum of 2 consecutive years. At a minimum, the audit shall be conducted by a certified landscape irrigation auditor and shall be in accordance with the California Landscape Irrigation Auditor Handbook, the entire document which is hereby incorporated by reference. (See Landscape Irrigation Audit Handbook, Department of Water Resources, Water Conservation Office (June, 1 990, Version 5.5 .) Water Waste Prevention. Water waste resulting from inefficient landscape irrigation including run-off, low-head drainage, overspray, or other similar conditions where water flows onto adjacent property, nonimgated areas, walks, roadways, or structures shall be prohibited. All broken heads and pipes must be repaired within 72 hours of notification. Penalties for violation of these prohibitions shall be established. Fees for initial review and program monitoring(Optiona1). The following fees are deemed necessary to review landscape documentation packages and monitor landscape irrigation audits and shall be imposed on the subject applicant, property owner or designee. A landscape documentation package review fee will be due at the time initial project application submission to the District. The Board of Directors, by resolution, shall establish the amount of the above fees in accordance with applicable law. Appeals. Decisions made by the Water Management Supervisor or Service Director may be appealed by an applicant, property owner(s), or designee(s) of any applicable project to the General Manager and thereafter the Board of Directors by an application in writing to the General Manager and Secretary of the Board of Directors, respectively, within fifteen days from the date of notification of decision.
This ordinance will become effective on June 1,2003. All plans approved on or after
June 1,2003, are subject to the provisions of this ordinance.
All other ordinances or parts of ordinances in conflict with the provisions of this
Ordinance, are hereby expressly repealed.
18
* ADOPTED this 25th day of March, 2003.
/s/ John W. McFadden President
I, the undersigned Secretary of the Coachella Valley Water District, do hereby certify
that the foregoing is a true and correct copy of Ordinance No. 1302 of said District introduced and passed at meeting of said Board held March 25,2003, and that said Ordinance was passed by the following vote:
Ayes: Five
Directors: Larson, Codekas, Nelson, Kitahara, McFadden Noes: None
I further certifL that said Ordinance was thereupon signed by the President of the Board of Directors of said District.
(SEAL)
19