Embed Size (px)
Citation preview
Appendix B NOISE STUDY
LEO RECYCLE NOISE STUDY
PREPARED BY
FEBRUARY 2018
TABLE OF CONTENTS
Michael Baker International Leo Recycle February 2018 Noise Study
i
1.0 INTRODUCTION
1.1 Project Location ................................................................................................................................... 1 1.2 Project Description .............................................................................................................................. 1
2.0 NOISE SETTING
2.1 Fundamentals of Sound and Environmental Noise....................................................................... 3 2.2 Regulatory Framework ....................................................................................................................... 6 2.2 Existing Setting .................................................................................................................................... 10
3.0 NOISE IMPACT ASSESSMENT
3.1 Existing Operations Description ....................................................................................................... 13 3.2 Existing Operational Noise Measurements ................................................................................... 13 3.3 Noise Impact Calculations .............................................................................................................. 17 3.4 Conclusion .......................................................................................................................................... 18
4.0 REFERENCES
TABLES
Table 1 Definitions of Acoustical Terms ...................................................................................................... 4 Table 2 Land Use Compatibility Guidelines for Community Noise in San José .................................. 8 Table 3 Noise Standards [for Industrial Land Uses] ................................................................................. 10 Table 4 Existing Operational Noise Measurements ................................................................................ 14
FIGURES
Figure 1 Noise Measurement Locations .................................................................................................... 15
APPENDICES
Appendix A: ............................................................................................. Noise Measurement Output Files
TABLE OF CONTENTS
Leo Recycle Michael Baker International Noise Study February 2018
ii
This page intentionally left blank.

1.0 INTRODUCTION
Michael Baker International Leo Recycle February 2018 Noise Study
1
This report documents the results of a noise study for grinding operations of recycled materials at Leo Recycle located at 215 Leo Avenue in San José, California.
1.0 INTRODUCTION
1.1 PROJECT LOCATION
The project site is on the north side of Leo Avenue, approximately 540 feet west of South 7th Street, in San José. The site is generally surrounded by commercial and industrial uses in all directions.
1.2 PROJECT DESCRIPTION
The 2.51-acre project site is occupied by a 50,000-square-foot industrial building currently being used for the processing of recyclables including less than 175 tons per day of Construction Demolition and Inert Debris (CDI), less than 200 tons per day of chipping and grinding wood debris and green waste, and less than 1,500 tons per day of Type A, single stream source separated recyclable commodities. CDI material and green waste trimmings are processed with a Vermeer HG6000 horizonal grinder. The facility currently operates under a special use permit that allows grinding operations from 8:00 a.m. to 5:00 p.m. The proposed project is to amend the special use permit to extend the allowed hours of grinding operations until 11:00 p.m. The grinder would operate approximately 50 percent of the time, primarily between the hours of 2:00 p.m. and 11:00 p.m. This study examines the potential community noise impacts resulting from extending the grinding operations hours.

1.0 INTRODUCTION
Leo Recycle Michael Baker International Noise Study February 2018
2
This page intentionally left blank.
2.0 NOISE SETTING
Michael Baker International Leo Recycle February 2018 Noise Study
3
2.0 NOISE SETTING
2.1 FUNDAMENTALS OF SOUND AND ENVIRONMENTAL NOISE
Acoustics is the science of sound. Sound may be thought of as mechanical energy of a vibrating object transmitted by pressure waves through a medium to human (or animal) ears. If the pressure variations occur frequently enough (at least 20 times per second), they can be heard and are called sound. The number of pressure variations per second is called the frequency of sound and is expressed as cycles per second, or hertz (Hz).
Noise is a subjective reaction to different types of sounds. Noise is typically defined as airborne sound that is loud, unpleasant, unexpected, or undesired and may therefore be classified as a more specific group of sounds. A typical noise environment consists of a base of steady background noise that is the sum of many distant and indistinguishable noise sources. Superimposed on this background noise is the sound from individual local sources. These sources can vary from an occasional aircraft or train passing by to virtually continuous noise from, for example, traffic on a major highway. Perceptions of sound and noise are highly subjective from person to person.
The decibel scale is used to measure sound; it uses the hearing threshold (20 micropascals) as a point of reference, defined as 0 decibels (dB). Other sound pressures are then compared to this reference pressure, and the logarithm is taken to keep the numbers in a practical range. The decibel scale allows a million-fold increase in pressure to be expressed as 120 dB, and changes in levels (dB) correspond closely to human perception of relative loudness.
The perceived loudness of sounds is dependent on many factors, including sound pressure level and frequency content. However, within the usual range of environmental noise levels, perception of loudness is relatively predictable and can be approximated by A-weighted sound levels. There is a strong correlation between A-weighted sound levels (expressed as dBA) and the way the human ear perceives sound. For this reason, the A-weighted sound level has become the standard tool of environmental noise assessment. All noise levels reported in this report are in terms of A-weighted levels, but are expressed as dB, unless otherwise noted.
Addition of Decibels
The decibel scale is logarithmic, not linear, and therefore sound levels cannot be added or subtracted through ordinary arithmetic. Two sound levels 10 dB apart differ in acoustic energy by a factor of 10. When the standard logarithmic decibel is A-weighted, an increase of 10 dB is generally perceived as a doubling in loudness. For example, a 70 dB sound is half as loud as an 80 dB sound and twice as loud as a 60 dB sound. When two identical sources are each producing sound of the same loudness, the resulting sound level at a given distance would be 3 dB higher than one source under the same conditions (FTA 2006). Under the decibel scale, three sources of equal loudness together would produce an increase of 5 dB.
Sound Propagation and Attenuation
Sound spreads (propagates) uniformly outward in a spherical pattern, and the sound level decreases (attenuates) at a rate of approximately 6 dB for each doubling of distance from a stationary or point source. Sound from a line source, such as a highway, propagates outward in a cylindrical pattern, often referred to as cylindrical spreading. Sound levels attenuate at a rate of approximately 3 dB for each doubling of distance from a line source, such as a roadway, depending on ground surface characteristics (FHWA 2006). No excess attenuation is assumed for

2.0 NOISE SETTING
Leo Recycle Michael Baker International Noise Study February 2018
4
hard surfaces like a parking lot or a body of water. Soft surfaces, such as soft dirt or grass, can absorb sound, so an excess ground-attenuation value of 1.5 dB per doubling of distance is normally assumed. For line sources, an overall attenuation rate of 3 dB per doubling of distance is assumed (FHWA 2006).
Noise levels may also be reduced by intervening structures; generally, a single row of buildings between the receptor and the noise source reduces the noise level by about 5 dB, while a solid wall or berm reduces noise levels by 5 to 10 dB (FHWA 2006). The manner in which older homes in California were constructed generally provides a reduction of exterior-to-interior noise levels of about 20 to 25 dB with closed windows. The exterior-to-interior reduction of newer residential units is generally 30 dB or more.
Noise Descriptors
The decibel scale alone does not adequately characterize how humans perceive noise. The dominant frequencies of a sound have a substantial effect on the human response to that sound. Several rating scales have been developed to analyze the adverse effect of community noise on people. Because environmental noise fluctuates over time, these scales consider that the effect of noise on people is largely dependent on the total acoustical energy content of the noise, as well as the time of day when the noise occurs. The Leq is a measure of ambient noise, while the Ldn and CNEL are measures of community noise. Each is applicable to this analysis and defined in Table 1.
TABLE 1 DEFINITIONS OF ACOUSTICAL TERMS
Term Definition
Decibel, dB A unit describing the amplitude of sound, equal to 20 times the logarithm to the base 10 of the ratio of the pressure of the sound measured to the reference pressure. The reference pressure for air is 20.
Sound Pressure Level Sound pressure is the sound force per unit area, usually expressed in micropascals (or 20 micronewtons per square meter), where 1 pascal is the pressure resulting from a force of 1 newton exerted over an area of 1 square meter. The sound pressure level is expressed in decibels as 20 times the logarithm to the base 10 of the ratio between the pressures exerted by the sound to a reference sound pressure (e.g., 20 micropascals). Sound pressure level is the quantity that is directly measured by a sound level meter.
Frequency, Hz The number of complete pressure fluctuations per second above and below atmospheric pressure. Normal human hearing is between 20 Hz and 20,000 Hz. Infrasonic sound are below 20 Hz and ultrasonic sounds are above 20,000 Hz.
A-Weighted Sound Level, dBA
The sound pressure level in decibels as measured on a sound level meter using the A-weighting filter network. The A-weighting filter de-emphasizes the very low and very high frequency components of the sound in a manner similar to the frequency response of the human ear and correlates well with subjective reactions to noise.
Equivalent Noise Level, Leq The average acoustic energy content of noise for a stated period of time. Thus, the Leq of a time-varying noise and that of a steady noise are the same if they deliver the same acoustic energy to the ear during exposure. For evaluating community impacts, this rating scale does not vary, regardless of whether the noise occurs during the day or the night.
Lmax, Lmin The maximum and minimum A-weighted noise level during the measurement period.
L01, L10, L50, L90 The A-weighted noise levels that are exceeded 1%, 10%, 50%, and 90% of the time during the measurement period.

2.0 NOISE SETTING
Michael Baker International Leo Recycle February 2018 Noise Study
5
Term Definition
Day/Night Noise Level, Ldn or DNL
A 24-hour average Leq with a 10 dBA “weighting” added to noise during the hours of 10:00 p.m. to 7:00 a.m. to account for noise sensitivity in the nighttime. The logarithmic effect of these additions is that a 60 dBA 24-hour Leq would result in a measurement of 66.4 dBA Ldn.
Community Noise Equivalent Level, CNEL
A 24-hour average Leq with a 5 dBA “weighting” during the hours of 7:00 p.m. to 10:00 p.m. and a 10 dBA “weighting” added to noise during the hours of 10:00 p.m. to 7:00 a.m. to account for noise sensitivity in the evening and nighttime, respectively. The logarithmic effect of these additions is that a 60 dBA 24-hour Leq would result in a measurement of 66.7 dBA CNEL.
Ambient Noise Level The composite of noise from all sources near and far. The normal or existing level of environmental noise at a given location.
Intrusive That noise which intrudes over and above the existing ambient noise at a given location. The relative intrusiveness of a sound depends on its amplitude, duration, frequency, and time of occurrence and tonal or informational content as well as the prevailing ambient noise level.
Source: Harris 1979
The A-weighted decibel sound level scale gives greater weight to the frequencies of sound to which the human ear is most sensitive. Because sound levels can vary markedly over a short period of time, a method for describing either the average character of the sound or the statistical behavior of the variations must be utilized. Most commonly, environmental sounds are described in terms of an average level that has the same acoustical energy as the summation of all the time-varying events.
The scientific instrument used to measure noise is the sound level meter, which can accurately measure environmental noise levels to within about plus or minus 1 dB. Various computer models are used to predict environmental noise levels from sources, such as roadways and airports. The accuracy of the predicted models depends on the distance between the receptor and the noise source. Close to the noise source, the models are accurate to within about plus or minus 1 to 2 dB.
Human Response to Noise
The human response to environmental noise is subjective and varies considerably from individual to individual. Noise in the community has often been cited as a health problem, not in terms of actual physiological damage, such as hearing impairment, but in terms of inhibiting general well-being and contributing to undue stress and annoyance. The health effects of noise in the community arise from interference with human activities, including sleep, speech, recreation, and tasks that demand concentration or coordination. Hearing loss can occur at the highest noise intensity levels.
Noise environments and consequences of human activities are usually well represented by median noise levels during the day or night or over a 24-hour period. Environmental noise levels are generally considered low when the CNEL is below 60 dB, moderate in the 60 to 70 dB range, and high above 70 dB. Examples of low daytime levels are isolated, natural settings with noise levels as low as 20 dB and quiet, suburban, residential streets with noise levels around 40 dBA. Noise levels above 45 dB at night can disrupt sleep. Examples of moderate-level noise environments are urban residential or semi-commercial areas (typically 55 to 60 dB) and commercial locations (typically 60 dB). People may consider louder environments adverse, but most will accept the higher levels associated with noisier urban residential or residential-commercial areas (60 to 75 dB) or dense urban or industrial areas (65 to 80 dB). Regarding increases in A-weighted noise levels, the following relationships should be noted in understanding this analysis:
2.0 NOISE SETTING
Leo Recycle Michael Baker International Noise Study February 2018
6
• Except in carefully controlled laboratory experiments, a change of 1 dB cannot be perceived by humans.
• Outside of the laboratory, a 3 dB change is considered a just-perceivable difference.
• A change in level of at least 5 dB is required before any noticeable change in community response would be expected. An increase of 5 dB is typically considered substantial.
• A 10 dB change is subjectively heard as an approximate doubling in loudness and would almost certainly cause an adverse change in community response.
Effects of Noise on People
Hearing Loss
While physical damage to the ear from an intense noise impulse is rare, a degradation of auditory acuity can occur even in a community noise environment. Hearing loss occurs mainly due to chronic exposure to excessive noise but may be the result of a single event such as an explosion. Natural hearing loss associated with aging may also be accelerated by chronic exposure to loud noise.
The Occupational Safety and Health Administration (OSHA) has a workplace noise exposure standard that is set at the noise threshold where hearing loss may occur from long-term exposures. The maximum allowable level is 90 dB averaged over 8 hours. If the noise is above 90 dB, the allowable exposure time is correspondingly shorter.
Annoyance
Attitude surveys are used for measuring the annoyance felt in a community for noises intruding into homes or affecting outdoor activity areas. In these surveys, it was determined that causes of annoyance include interference with speech, radio and television, house vibrations, and interference with sleep and rest. The Ldn/CNEL as a measure of noise has been found to provide a valid correlation of noise level and the percentage of people annoyed. People have been asked to judge the annoyance caused by aircraft noise and ground transportation noise. There continues to be disagreement about the relative annoyance of these different sources. For ground vehicles, a noise level of about 55 dB Ldn is the threshold at which a substantial percentage of people begin to report annoyance.
2.2 REGULATORY FRAMEWORK
State
California Noise Control Act of 1973
California Health and Safety Code Sections 46000 through 46080, known as the California Noise Control Act, find that excessive noise is a serious hazard to public health and welfare and that exposure to certain levels of noise can result in physiological, psychological, and economic damage. The act also finds that there is a continuous and increasing bombardment of noise in urban, suburban, and rural areas. The California Noise Control Act declares that the State of California has a responsibility to protect the health and welfare of its citizens through the control, prevention, and abatement of noise. It is the State’s policy to provide an environment for all Californians that is free from noise which jeopardizes their health or welfare.
2.0 NOISE SETTING
Michael Baker International Leo Recycle February 2018 Noise Study
7
Governor’s Office of Planning and Research
The Governor’s Office of Planning and Research (OPR) (2017), published the General Plan Guidelines, which provide guidance for the acceptability of projects in specific noise environments based on average daily noise conditions (CNEL/Ldn). However, it is important to note that the OPR guidance does not take local conditions into account, including a particular community’s sensitivity to noise, noise reduction goals, or assessment of the relative importance of noise pollution. As a result, noise standards developed by local jurisdictions typically differ somewhat from the OPR guidance. In the case of the proposed project, the City of San José has adopted local noise standards, which are most relevant to the noise conditions in the city. Therefore, this analysis is based on local standards, and the OPR guidance is not considered.
Local
City of San José General Plan
The applicable plan pertaining to the evaluation of noise impacts of the proposed project is the City’s Envision San José 2040 General Plan, which includes established noise level standards that are intended to protect community residents from harmful and annoying noise levels (San José 2011). General Plan Table EC-1, Land Use Compatibility Guidelines for Community Noise in San José [included below as Table 2], and Policies EC-1.1, EC-1.2, and EC-1.6 are applicable to the proposed project.

2.0 NOISE SETTING
Leo Recycle Michael Baker International Noise Study February 2018
8
TABLE 2 LAND USE COMPATIBILITY GUIDELINES FOR COMMUNITY NOISE IN SAN JOSÉ
Exterior Noise Exposure (Ldn dBA)
Land Use Category 55 60 65 70 75 80
1. Residential, Hotels and Motels, Hospitals and Residential Care
2. Outdoor Sports and Recreation, Neighborhood Parks and Playgrounds
3. Schools, Libraries, Museums, Meeting Halls, Churches
4. Office Buildings, Business Commercial, and Professional Offices
5. Sports Arena, Outdoor Spectator Sports
6. Public and Quasi-Public Auditoriums, Concert Halls, Amphitheaters
Normally Acceptable:
Specified land use is satisfactory, based upon the assumption that any buildings involved are of normal conventional construction, without any special noise insulation requirements.
Conditionally Acceptable:
Specified land use may be permitted only after detailed analysis of the noise reduction requirements and needed noise insulation features included in the design.
Unacceptable:
New construction or development should generally not be undertaken because mitigation is usually not feasible to comply with noise element policies.
Source: San José 2011, Table EC-1
EC-1.1 Locate new development in areas where noise levels are appropriate for the proposed uses. Consider federal, state and City noise standards and guidelines as a part of new development review. Applicable standards and guidelines for land uses in San José include:
Interior Noise Levels
• The City’s standard for interior noise levels in residences, hotels, motels, residential care facilities, and hospitals is 45 dBA DNL. Include appropriate site and building design, building construction and noise attenuation techniques in new development to meet this standard. For sites with exterior noise levels of 60 dBA DNL or more, an acoustical analysis following protocols in the City-adopted California Building Code is required to demonstrate that development projects can meet this standard. The acoustical analysis shall base required noise attenuation techniques on expected Envision General Plan traffic volumes to ensure land use compatibility and General Plan consistency over the life of this plan.

2.0 NOISE SETTING
Michael Baker International Leo Recycle February 2018 Noise Study
9
Exterior Noise Levels
• The City’s acceptable exterior noise level objective is 60 dBA DNL or less for residential and most institutional land uses (Table EC-1). The acceptable exterior noise level objective is established for the City, except in the environs of the San José International Airport and the Downtown, as described below: o For new multi-family residential projects and for the residential component
of mixed-use development, use a standard of 60 dBA DNL in usable outdoor activity areas, excluding balconies and residential stoops and porches facing existing roadways. Some common use areas that meet the 60 dBA DNL exterior standard will be available to all residents. Use noise attenuation techniques such as shielding by buildings and structures for outdoor common use areas. On sites subject to aircraft overflights or adjacent to elevated roadways, use noise attenuation techniques to achieve the 60 dBA DNL standard for noise from sources other than aircraft and elevated roadway segments.
o For single family residential uses, use a standard of 60 dBA DNL for exterior noise in private usable outdoor activity areas, such as backyards
EC-1.2 Minimize the noise impacts of new development on land uses sensitive to increased noise levels (Categories 1, 2, 3 and 6) by limiting noise generation and by requiring use of noise attenuation measures such as acoustical enclosures and sound barriers, where feasible. The City considers significant noise impacts to occur if a project would:
• Cause the DNL at noise sensitive receptors to increase by five dBA DNL or more where the noise levels would remain “Normally Acceptable”; or
• Cause the DNL at noise sensitive receptors to increase by three dBA DNL or more where noise levels would equal or exceed the “Normally Acceptable” level.
EC-1.6 Regulate the effects of operational noise from existing and new industrial and commercial development on adjacent uses through noise standards in the City’s Municipal Code.
City of San José Municipal Code
Noise standards for industrial zones are defined in Municipal Code Chapter 20.50, Section 20.050.300.
20.50.300 – Performance standards.
A. In the IP, LI and HI industrial districts no primary, secondary, incidental or conditional use or activity related thereto shall be conducted or permitted:
1. In a manner that causes or results in the harmful discharge of any waste materials into or upon the ground, into or within any sanitary or storm sewer system, into or within any water system or water, or into the atmosphere; or
2. In a manner that constitutes a menace to persons or property or in a manner that is dangerous, obnoxious, or offensive by reason of the creation of a fire, explosion,

2.0 NOISE SETTING
Leo Recycle Michael Baker International Noise Study February 2018
10
or other physical hazard, or by reason of air pollution, odor, smoke, noise, dust vibration, radiation, or fumes; or
3. In a manner that creates a public or private nuisance.
B. Without limiting the generality of the preceding subsection, the following specific standards shall apply in the industrial zoning districts:
1. Incineration. There shall be no incineration on any site of any waste material.
2. Vibration. There shall be no activity on any site that causes ground vibration which is perceptible without instruments at the property line of the site.
3. Air pollution. Total emissions from any use or combination of uses on a site shall not exceed the emissions and health risk thresholds as established by the director of planning.
4. Noise.
a. The sound pressure level generated by any use or combination of uses shall not exceed the decibel level at any property line as shown in Table 20-135 [included below as Table 3], except upon issuance and in compliance with a special use permit as provided in Chapter 20.100.
TABLE 3 NOISE STANDARDS [FOR INDUSTRIAL LAND USES]
Maximum Noise Level in
Decibels (dBA) at Property Line
Industrial use adjacent to a property used or zoned for residential purposes 55
Industrial use adjacent to a property used or zoned for commercial purposes 60
Industrial use adjacent to a property used or zoned for industrial or use other than commercial or residential purposes 70
Source: San José 2017, Table 20-135
2.2 EXISTING SETTING
Noise-Sensitive Receptors
Noise-sensitive land uses are those that may be subject to stress and/or interference from excessive noise. Noise-sensitive land uses include schools, hospitals, and institutional uses such as churches and museums. Typically, residential uses are also considered noise-sensitive receptors. Industrial and commercial land uses are generally not considered sensitive to noise. However, Table EC-1 in the City’s General Plan includes hotels and motels in the same land use category as residential. Residential land uses in the project area include mobile home and trailer parks to the east, southwest, and southeast, ranging from 0.12 mile to 0.34 mile from the project site, and single-family homes 0.32 mile to the northwest. The closest noise-sensitive receptor is a mobile home/trailer park across South 7th Street, approximately 617 feet (0.12 mile) to the east (see Figure 1), beyond several industrial buildings. Hotels and motels in the project area are located to the west and southwest. The closest motel to the project site is approximately 340 feet to the west beyond railroad tracks and an intervening metal recycling business.

2.0 NOISE SETTING
Michael Baker International Leo Recycle February 2018 Noise Study
11
Existing Noise Environment
The project site is zoned Heavy Industrial. Surrounding land uses include Heavy Industrial to the west and north, Heavy Industrial to the east across the railroad tracks, and Light Industrial to the south across Leo Avenue. The primary businesses on the surrounding properties are metal recycling facilities and automotive repair and salvage. Dominant noise sources in the area include operational noise from the industrial business; heavy truck and light vehicle traffic on area streets; traffic noise from State Route 82, State Route 87, Interstate 280, and US Highway 101; noise from commuter and freight rail lines to the west; and air traffic from Norman Y. Mineta San José International Airport to the north.
The environmental noise assessment prepared for the Envision San José 2040 General Plan Comprehensive Update provides existing and predicted future noise contours. In the City’s South Planning Area, existing and future noise ranges from Ldn 55 to 75 dBA. The project site in located in an Ldn 60 to 65 dB contour (Illingworth & Rodkin 2010).

2.0 NOISE SETTING
Leo Recycle Michael Baker International Noise Study February 2018
12
This page intentionally left blank.

3.0 NOISE IMPACT ASSESSMENT
Michael Baker International Leo Recycle February 2018 Noise Study
13
3.0 NOISE IMPACT ASSESSMENT
3.1 EXISTING OPERATIONS DESCRIPTION
Leo Recycle collects green waste and CDI material via truck deliveries and self-hauling by customers. Material is delivered to staging areas in the yard to the west of the building. Shredding and grinding operations are performed by a Vermeer HG6000 horizontal grinder mounted on tracks. When processing green waste and wood, the grinder is positioned in the door at the northwest of the building. When processing other CDI material, the grinder is positioned inside the building. The grinder is fed by a track-mounted excavator equipped with a claw or a rubber-tire bucket loader.
The building is of reinforced concrete construction with vehicle access openings on the west and south sides. Land uses to the east and south are shielded primarily by the building. A 6-foot masonry wall surrounds the yard and shields land uses to the west.
Noise sources associated with operation of the recycling facility include: operation of the grinder; operation of loading equipment; heavy duty trucks entering and exiting the facility; and light duty cars and trucks entering and exiting the facility. The recycling facility is located in an area zoned Heavy Industrial. Therefore, the facility is located in an area where noise levels are appropriate for the proposed uses and operation of the facility would be consistent with General Plan Policy EC-1.1. Noise levels resulting from operation of the facility, the impact of the operational noise on sensitive receptors, and compliance with General Plan Policy EC-1.2 and Noise Ordinances are discussed below in subsection 3.3.
3.2 EXISTING OPERATIONAL NOISE MEASUREMENTS
Operational noise in the project area was measured on January 10, 2018. Three short-term noise measurements were taken at the project property line closest to the nearest residential land use (approximately 340 feet from the grinder) under three conditions:
Condition 1 – existing operational noise while the grinder is not running
Condition 2 – existing operational noise while the grinder is running inside the building
Condition 3 – existing operational noise while the grinder is running in the doorway of the building
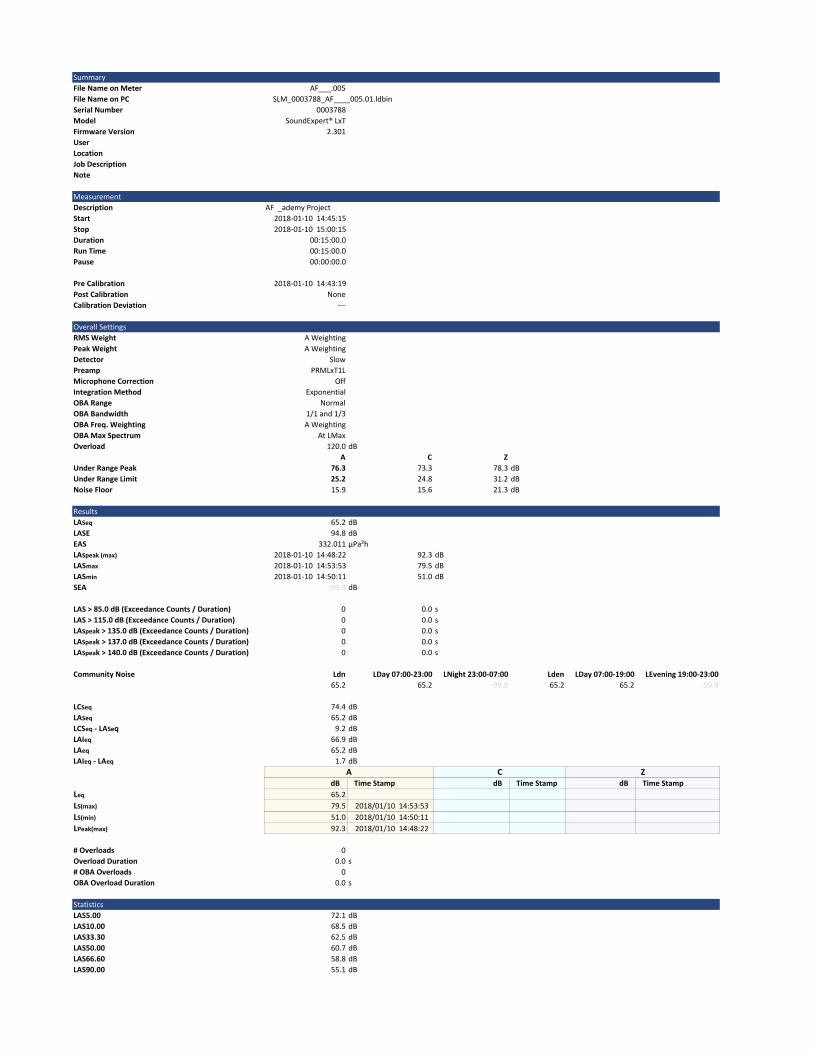
An additional short-term measurement was taken in proximity of the grinder to determine a reference noise level of the grinder at a distance of 100 feet. The measurements were taken with a Larson Davis SoundExpert LxT precision sound level meter, which satisfies the American National Standards Institute (ANSI) for general environmental noise measurement instrumentation. Prior to the measurements, the SoundExpert LxT sound level meter was calibrated according to manufacturer specifications with a Larson Davis CAL200 Class I Calibrator (see Appendix A for measurement output files). The 15-minute measurements were taken between 2:30 and 4:30 p.m. on Wednesday, January 10, 2018. Noise measurement locations are shown in Figure 1. The noise levels and sources of noise measured are listed in Table 4.
3.0 NOISE IMPACT ASSESSMENT
Leo Recycle Michael Baker International Noise Study February 2018
14
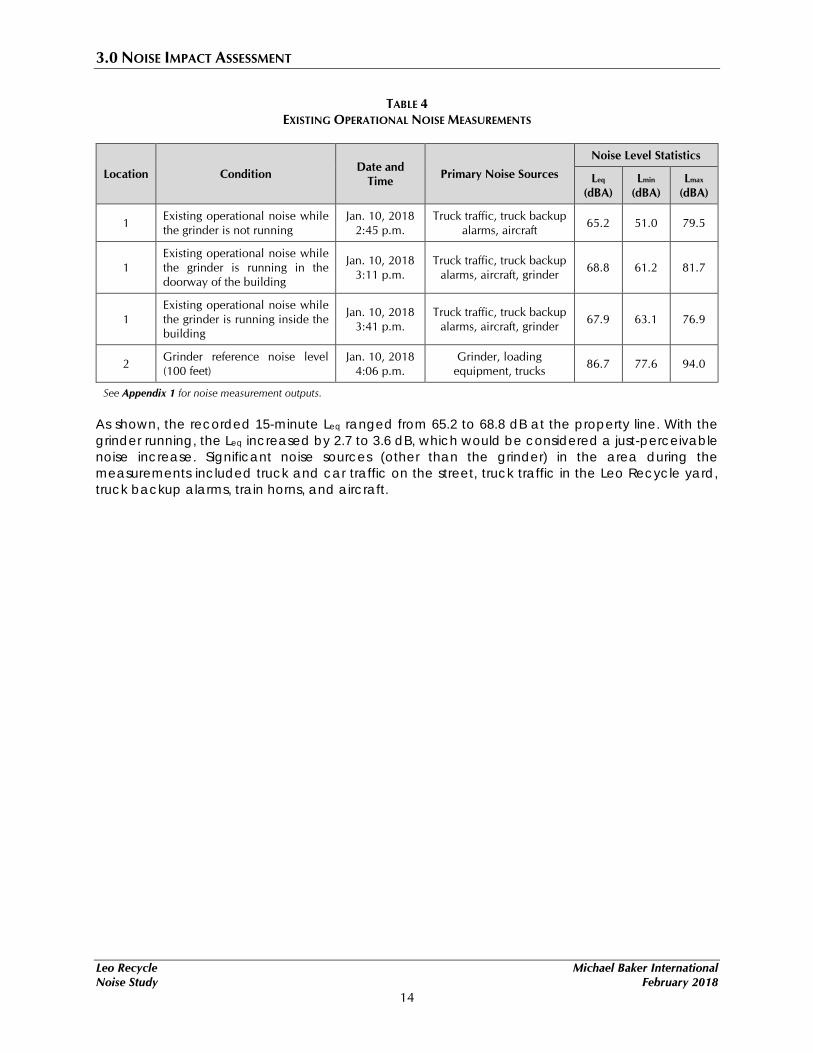
TABLE 4 EXISTING OPERATIONAL NOISE MEASUREMENTS
Location Condition Date and Time Primary Noise Sources
Noise Level Statistics
Leq
(dBA) Lmin
(dBA) Lmax
(dBA)
1 Existing operational noise while the grinder is not running
Jan. 10, 2018 2:45 p.m.
Truck traffic, truck backup alarms, aircraft 65.2 51.0 79.5
1 Existing operational noise while the grinder is running in the doorway of the building
Jan. 10, 2018 3:11 p.m.
Truck traffic, truck backup alarms, aircraft, grinder 68.8 61.2 81.7
1 Existing operational noise while the grinder is running inside the building
Jan. 10, 2018 3:41 p.m.
Truck traffic, truck backup alarms, aircraft, grinder 67.9 63.1 76.9
2 Grinder reference noise level (100 feet)
Jan. 10, 2018 4:06 p.m.
Grinder, loading equipment, trucks 86.7 77.6 94.0
See Appendix 1 for noise measurement outputs.
As shown, the recorded 15-minute Leq ranged from 65.2 to 68.8 dB at the property line. With the grinder running, the Leq increased by 2.7 to 3.6 dB, which would be considered a just-perceivable noise increase. Significant noise sources (other than the grinder) in the area during the measurements included truck and car traffic on the street, truck traffic in the Leo Recycle yard, truck backup alarms, train horns, and aircraft.
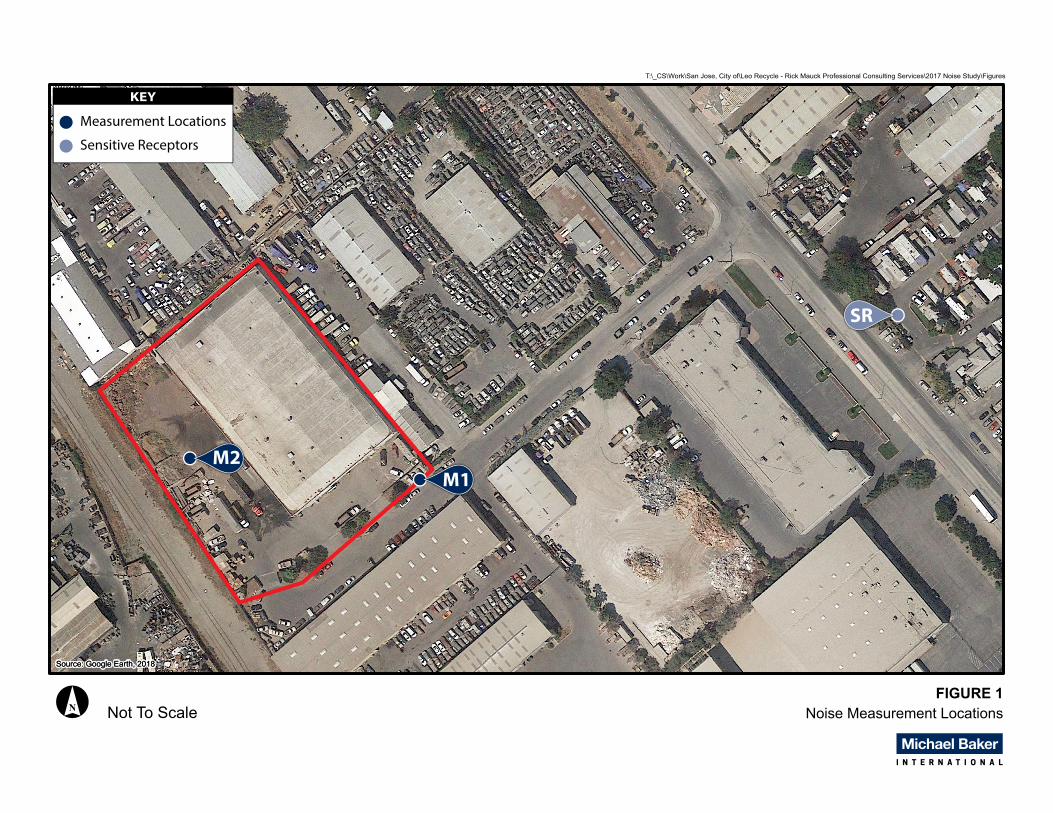
KEY
Measurement Locations
Sensitive Receptors
SR
M2M1
FIGURE 1Noise Measurement Locations
T:\_CS\Work\San Jose, City of\Leo Recycle - Rick Mauck Professional Consulting Services\2017 Noise Study\Figures
Source: Google Earth, 2018 Source: Google Earth, 2018
Not To Scale
3.0 NOISE IMPACT ASSESSMENT
Leo Recycle Michael Baker International Noise Study February 2018
16
This page intentionally left blank.

3.0 NOISE IMPACT ASSESSMENT
Michael Baker International Leo Recycle February 2018 Noise Study
17
3.3 NOISE IMPACT CALCULATIONS
Residential Community Noise Impacts
The closest residential use to the project site is a mobile home/trailer park, approximately 617 feet to the east beyond several industrial buildings. Traffic noise contour maps in the environmental noise assessment prepared for the Envision San José 2040 General Plan Comprehensive Update indicate the closest residences to the project are in an area with an Ldn (or DNL) of 60 to 65 dB (Illingworth & Rodkin 2010). These existing residences are in an area that exceeds the standard of Ldn 60 dB for new residential uses specified in General Plan Policy EC-1.1 and the area is identified as “conditionally acceptable” per Table EC-1 (see Table 2).
The highest measured Leq was 68.8 dB, 340 feet from the grinder. Using the Federal Highway Administration (FHWA) estimate of 5 dB attenuation for a single row of buildings (FHWA 2006), the resulting noise at the residential property line would be Leq 58.6 dB. Assuming an existing Ldn of 60 dB in the residential area and assuming a worst case of the grinder operating continuously from 8:00 a.m. to 11:00 p.m., the resulting Ldn at the nearest residential land use would be 62.4 dB. This is less than the 3 dB increase identified as significant in Policy EC-1.2 of the San José General Plan. Therefore, changes in noise levels at the closest existing residential use resulting from increased operational hours of grinding operations would be consistent with the General Plan Policy EC-1.2.
Commercial Community Noise Impacts
The closest hotel or motel to the project site is approximately 340 feet to the west beyond a metal recycling building. According to the traffic noise contour maps in the environmental noise assessment prepared for the Envision San José 2040 General Plan, this commercial property has an existing noise contour of Ldn (or DNL) 70 to 75 dB (Illingworth & Rodkin 2010). This existing commercial use is in an area that exceeds the standard of Ldn 60 dB for a motel specified in General Plan Policy EC-1.1 and the area is identified as “conditionally acceptable” per Table EC-1 (see Table 2).
The distance from the grinder to the motel is similar to the distance from the grinder to the noise measurement at location M1, and there are intervening buildings between the grinder and the motel. Therefore, it is assumed the resulting noise from grinding operations at the motel property line would not exceed Leq 68.8 dB, as measured at location M1. Assuming an existing Ldn of 70 dB in the commercial area and assuming a worst case of the grinder operating continuously from 8:00 a.m. to 11:00 p.m., the resulting Ldn would be 72.3 dB. This is less than the 3 dB increase identified as significant in General Plan Policy EC-1.2. Therefore, changes in noise levels at the closest existing hotel or motel resulting from increased operational hours of grinding operations would be consistent with the General Plan Policy EC-1.2.
Compliance with the Municipal Code
As shown in the measurement results, the Lmax measured at the property line to the southeast (location M1) was not substantially affected by grinding operations. The dominant noise source was truck traffic on Leo Avenue. Therefore, grinding operations would not cause noise to exceed 70 dB on the north, east, or south property lines. To the west, the Leo Recycle yard is surrounded by a 6-foot-high masonry wall. The metal recycling business across the railroad tracks is surrounded by a 12-foot-high masonry wall, 220 feet from the grinder when it is positioned in the doorway of the building. The attenuation due to the walls, estimated using the Kurze-Anderson Spherical Barrier Insertion Loss formula, is between 16.5 and 18.0 dB, depending on the frequency of the noise. The attenuation due to distance is 7 dB (6 dB for every doubling of distance). Using the Lmax of 94 dB from noise measurements, the resulting predicted maximum noise from the grinder at the

3.0 NOISE IMPACT ASSESSMENT
Leo Recycle Michael Baker International Noise Study February 2018
18
industrial business to the west is 69.5 dB. Therefore, the predicted noise from grinding operations at adjacent industrial uses would not exceed the standards established in Municipal Code Section 20.50.300 and would be consistent with General Plan Policy EC-1.6.
3.4 CONCLUSION
The project site is in an area zoned Heavy Industrial and is surrounded by industrial uses and is in an area where noise levels are appropriate for the proposed uses, consistent with General Plan Policy EC-1.1. Grinding operations are substantially shielded by buildings on three sides and by two walls on the fourth side. Extending the permitted hours of grinding operations would not result in exceeding the standards of San José Municipal Code Section 20.50.300 and would be consistent with General Plan Policy EC-1.6. The closest residential or commercial uses (hotel/motel) are separated by multiple industrial buildings and walls. Assuming a worst-case scenario of the grinder operating continuously from 8:00 a.m. to 11:00 p.m., the maximum predicted increase in Ldn at the nearest residential or commercial use would be 2.4 dB. Extending the hours of grinding operations to 11:00 p.m. would not result in exceeding the standards established in General Plan Policy EC-1.2. Therefore, the impact of noise resulting from modifying the conditional use permit to allow Leo Recycle to extend the hours of grinding operations to 11:00 p.m. would be less than significant.
4.0 REFERENCES
Michael Baker International Leo Recycle February 2018 Noise Study
19
4.0 REFERENCES
FHWA (Federal Highway Administration). 2006. Highway Construction Noise Handbook.
FTA (Federal Transit Administration). 2006. Transit Noise and Vibration Impact Assessment.
Harris, Cyril M. 1979. Handbook of Noise Control.
Illingworth & Rodkin, Inc. 2010. Envision San José 2040 General Plan Comprehensive Update Environmental Noise Assessment San José, California.
OPR (Governor’s Office of Planning and Research). 2017. General Plan Guidelines.
San José, City of. 2011. Envision San José 2040 General Plan.
———. 2017. City of San José Municipal Code. Accessed January 15, 2018. http://www.sanjoseca.gov/index.aspx?NID=441.

APPENDIX A:
NOISE MEASUREMENT OUTPUT FILES

1
Measurement 1 – Location 1 without the grinder running
Summary
File Name on Meter AF___.005
File Name on PC
Serial Number 0003788
Model SoundExpert® LxT
Firmware Version 2.301
User
Location
Job Description
Note
Measurement
Description
Start 2018‐01‐10 14:45:15
Stop 2018‐01‐10 15:00:15
Duration 00:15:00.0
Run Time 00:15:00.0
Pause 00:00:00.0
Pre Calibration 2018‐01‐10 14:43:19
Post Calibration None
Calibration Deviation ‐‐‐
Overall Settings
RMS Weight A Weighting
Peak Weight A Weighting
Detector Slow
Preamp PRMLxT1L
Microphone Correction Off
Integration Method Exponential
OBA Range Normal
OBA Bandwidth 1/1 and 1/3
OBA Freq. Weighting A Weighting
OBA Max Spectrum At LMax
Overload 120.0 dB
A C Z
Under Range Peak 76.3 73.3 78.3 dB
Under Range Limit 25.2 24.8 31.2 dB
Noise Floor 15.9 15.6 21.3 dB
Results
LASeq 65.2 dB
LASE 94.8 dB
EAS 332.011 µPa²h
LASpeak (max) 2018‐01‐10 14:48:22 92.3 dB
LASmax 2018‐01‐10 14:53:53 79.5 dB
LASmin 2018‐01‐10 14:50:11 51.0 dB
SEA ‐99.9 dB
LAS > 85.0 dB (Exceedance Counts / Duration) 0 0.0 s
LAS > 115.0 dB (Exceedance Counts / Duration) 0 0.0 s
LASpeak > 135.0 dB (Exceedance Counts / Duration) 0 0.0 s
LASpeak > 137.0 dB (Exceedance Counts / Duration) 0 0.0 s
LASpeak > 140.0 dB (Exceedance Counts / Duration) 0 0.0 s
Community Noise Ldn LDay 07:00‐23:00 LNight 23:00‐07:00 Lden LDay 07:00‐19:00 LEvening 19:00‐23:00
65.2 65.2 ‐99.9 65.2 65.2 ‐99.9
LCSeq 74.4 dB
LASeq 65.2 dB
LCSeq ‐ LASeq 9.2 dB
LAIeq 66.9 dB
LAeq 65.2 dB
LAIeq ‐ LAeq 1.7 dB
dB Time Stamp dB Time Stamp dB Time Stamp
Leq 65.2
LS(max) 79.5 2018/01/10 14:53:53
LS(min) 51.0 2018/01/10 14:50:11
LPeak(max) 92.3 2018/01/10 14:48:22
# Overloads 0
Overload Duration 0.0 s
# OBA Overloads 0
OBA Overload Duration 0.0 s
Statistics
LAS5.00 72.1 dB
LAS10.00 68.5 dB
LAS33.30 62.5 dB
LAS50.00 60.7 dB
LAS66.60 58.8 dB
LAS90.00 55.1 dB
SLM_0003788_AF____005.01.ldbin
AF _ademy Project
A C Z

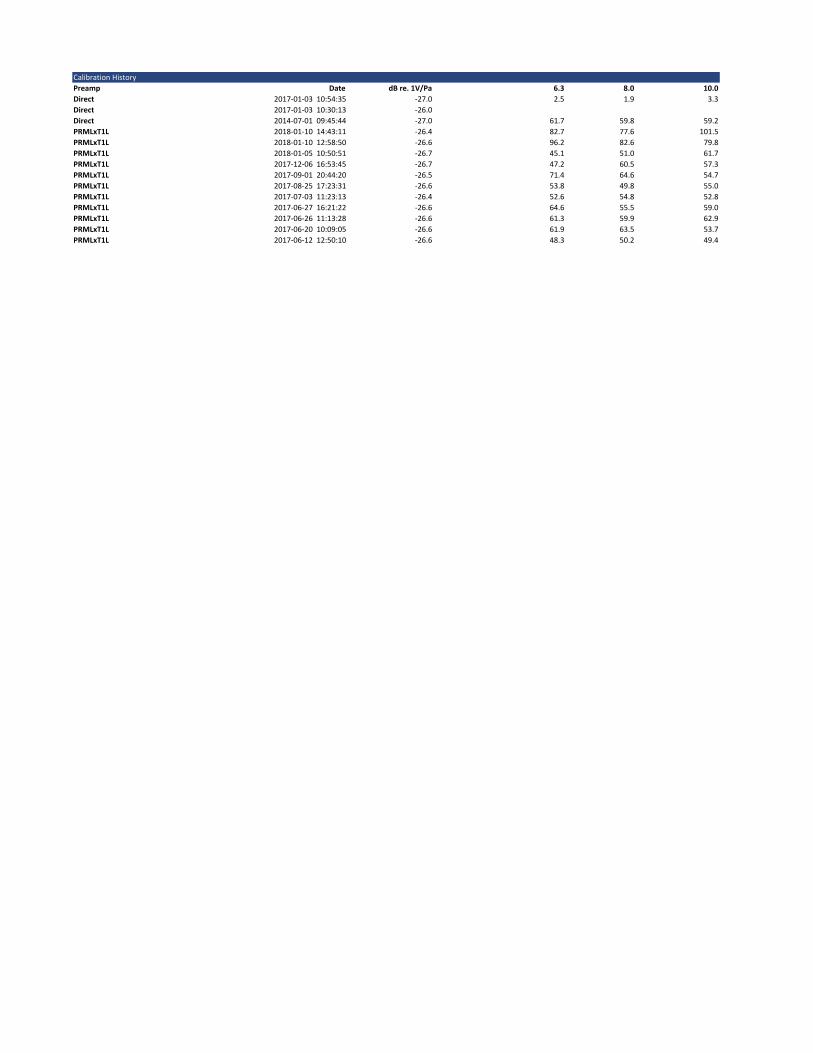
Calibration History
Preamp Date dB re. 1V/Pa 6.3 8.0 10.0
Direct 2017‐01‐03 10:54:35 ‐27.0 2.5 1.9 3.3
Direct 2017‐01‐03 10:30:13 ‐26.0
Direct 2014‐07‐01 09:45:44 ‐27.0 61.7 59.8 59.2
PRMLxT1L 2018‐01‐10 14:43:11 ‐26.4 82.7 77.6 101.5
PRMLxT1L 2018‐01‐10 12:58:50 ‐26.6 96.2 82.6 79.8
PRMLxT1L 2018‐01‐05 10:50:51 ‐26.7 45.1 51.0 61.7
PRMLxT1L 2017‐12‐06 16:53:45 ‐26.7 47.2 60.5 57.3
PRMLxT1L 2017‐09‐01 20:44:20 ‐26.5 71.4 64.6 54.7
PRMLxT1L 2017‐08‐25 17:23:31 ‐26.6 53.8 49.8 55.0
PRMLxT1L 2017‐07‐03 11:23:13 ‐26.4 52.6 54.8 52.8
PRMLxT1L 2017‐06‐27 16:21:22 ‐26.6 64.6 55.5 59.0
PRMLxT1L 2017‐06‐26 11:13:28 ‐26.6 61.3 59.9 62.9
PRMLxT1L 2017‐06‐20 10:09:05 ‐26.6 61.9 63.5 53.7
PRMLxT1L 2017‐06‐12 12:50:10 ‐26.6 48.3 50.2 49.4
2
Measurement 2 – Location 1 with the grinder running in the doorway

Summary
File Name on Meter AF___.006
File Name on PC
Serial Number 0003788
Model SoundExpert® LxT
Firmware Version 2.301
User
Location
Job Description
Note
Measurement
Description
Start 2018‐01‐10 15:11:09
Stop 2018‐01‐10 15:26:09
Duration 00:15:00.0
Run Time 00:15:00.0
Pause 00:00:00.0
Pre Calibration 2018‐01‐10 14:43:11
Post Calibration None
Calibration Deviation ‐‐‐
Overall Settings
RMS Weight A Weighting
Peak Weight A Weighting
Detector Slow
Preamp PRMLxT1L
Microphone Correction Off
Integration Method Exponential
OBA Range Normal
OBA Bandwidth 1/1 and 1/3
OBA Freq. Weighting A Weighting
OBA Max Spectrum At LMax
Overload 120.0 dB
A C Z
Under Range Peak 76.3 73.3 78.3 dB
Under Range Limit 25.2 24.8 31.2 dB
Noise Floor 15.9 15.6 21.3 dB
Results
LASeq 68.8 dB
LASE 98.4 dB
EAS 761.245 µPa²h
LASpeak (max) 2018‐01‐10 15:14:47 96.0 dB
LASmax 2018‐01‐10 15:14:57 81.7 dB
LASmin 2018‐01‐10 15:16:37 61.2 dB
SEA ‐99.9 dB
LAS > 85.0 dB (Exceedance Counts / Duration) 0 0.0 s
LAS > 115.0 dB (Exceedance Counts / Duration) 0 0.0 s
LASpeak > 135.0 dB (Exceedance Counts / Duration) 0 0.0 s
LASpeak > 137.0 dB (Exceedance Counts / Duration) 0 0.0 s
LASpeak > 140.0 dB (Exceedance Counts / Duration) 0 0.0 s
Community Noise Ldn LDay 07:00‐23:00 LNight 23:00‐07:00 Lden LDay 07:00‐19:00 LEvening 19:00‐23:00
68.8 68.8 ‐99.9 68.8 68.8 ‐99.9
LCSeq 76.2 dB
LASeq 68.8 dB
LCSeq ‐ LASeq 7.4 dB
LAIeq 70.6 dB
LAeq 68.8 dB
LAIeq ‐ LAeq 1.8 dB
dB Time Stamp dB Time Stamp dB Time Stamp
Leq 68.8
LS(max) 81.7 2018/01/10 15:14:57
LS(min) 61.2 2018/01/10 15:16:37
LPeak(max) 96.0 2018/01/10 15:14:47
# Overloads 0
Overload Duration 0.0 s
# OBA Overloads 0
OBA Overload Duration 0.0 s
Statistics
LAS5.00 73.8 dB
LAS10.00 71.6 dB
LAS33.30 67.5 dB
LAS50.00 66.7 dB
LAS66.60 66.0 dB
LAS90.00 64.9 dB
SLM_0003788_AF____006.01.ldbin
AF _ademy Project
A C Z

Calibration History
Preamp Date dB re. 1V/Pa 6.3 8.0 10.0
Direct 2017‐01‐03 10:54:35 ‐27.0 2.5 1.9 3.3
Direct 2017‐01‐03 10:30:13 ‐26.0
Direct 2014‐07‐01 09:45:44 ‐27.0 61.7 59.8 59.2
PRMLxT1L 2018‐01‐10 14:43:11 ‐26.4 82.7 77.6 101.5
PRMLxT1L 2018‐01‐10 12:58:50 ‐26.6 96.2 82.6 79.8
PRMLxT1L 2018‐01‐05 10:50:51 ‐26.7 45.1 51.0 61.7
PRMLxT1L 2017‐12‐06 16:53:45 ‐26.7 47.2 60.5 57.3
PRMLxT1L 2017‐09‐01 20:44:20 ‐26.5 71.4 64.6 54.7
PRMLxT1L 2017‐08‐25 17:23:31 ‐26.6 53.8 49.8 55.0
PRMLxT1L 2017‐07‐03 11:23:13 ‐26.4 52.6 54.8 52.8
PRMLxT1L 2017‐06‐27 16:21:22 ‐26.6 64.6 55.5 59.0
PRMLxT1L 2017‐06‐26 11:13:28 ‐26.6 61.3 59.9 62.9
PRMLxT1L 2017‐06‐20 10:09:05 ‐26.6 61.9 63.5 53.7
PRMLxT1L 2017‐06‐12 12:50:10 ‐26.6 48.3 50.2 49.4

3
Measurement 3 – Location 1 with the grinder running inside

Summary
File Name on Meter AF___.007
File Name on PC
Serial Number 0003788
Model SoundExpert® LxT
Firmware Version 2.301
User
Location
Job Description
Note
Measurement
Description
Start 2018‐01‐10 15:41:52
Stop 2018‐01‐10 15:56:52
Duration 00:15:00.0
Run Time 00:15:00.0
Pause 00:00:00.0
Pre Calibration 2018‐01‐10 14:43:11
Post Calibration None
Calibration Deviation ‐‐‐
Overall Settings
RMS Weight A Weighting
Peak Weight A Weighting
Detector Slow
Preamp PRMLxT1L
Microphone Correction Off
Integration Method Exponential
OBA Range Normal
OBA Bandwidth 1/1 and 1/3
OBA Freq. Weighting A Weighting
OBA Max Spectrum At LMax
Overload 120.0 dB
A C Z
Under Range Peak 76.3 73.3 78.3 dB
Under Range Limit 25.2 24.8 31.2 dB
Noise Floor 15.9 15.6 21.3 dB
Results
LASeq 67.9 dB
LASE 97.5 dB
EAS 617.948 µPa²h
LASpeak (max) 2018‐01‐10 15:56:18 102.6 dB
LASmax 2018‐01‐10 15:47:14 76.9 dB
LASmin 2018‐01‐10 15:55:30 63.1 dB
SEA ‐99.9 dB
LAS > 85.0 dB (Exceedance Counts / Duration) 0 0.0 s
LAS > 115.0 dB (Exceedance Counts / Duration) 0 0.0 s
LASpeak > 135.0 dB (Exceedance Counts / Duration) 0 0.0 s
LASpeak > 137.0 dB (Exceedance Counts / Duration) 0 0.0 s
LASpeak > 140.0 dB (Exceedance Counts / Duration) 0 0.0 s
Community Noise Ldn LDay 07:00‐23:00 LNight 23:00‐07:00 Lden LDay 07:00‐19:00 LEvening 19:00‐23:00
67.9 67.9 ‐99.9 67.9 67.9 ‐99.9
LCSeq 74.5 dB
LASeq 67.9 dB
LCSeq ‐ LASeq 6.5 dB
LAIeq 69.9 dB
LAeq 67.9 dB
LAIeq ‐ LAeq 2.0 dB
dB Time Stamp dB Time Stamp dB Time Stamp
Leq 67.9
LS(max) 76.9 2018/01/10 15:47:14
LS(min) 63.1 2018/01/10 15:55:30
LPeak(max) 102.6 2018/01/10 15:56:18
# Overloads 0
Overload Duration 0.0 s
# OBA Overloads 0
OBA Overload Duration 0.0 s
Statistics
LAS5.00 70.3 dB
LAS10.00 69.4 dB
LAS33.30 68.1 dB
LAS50.00 67.3 dB
LAS66.60 66.6 dB
LAS90.00 65.1 dB
SLM_0003788_AF____007.01.ldbin
AF _ademy Project
A C Z
Calibration History
Preamp Date dB re. 1V/Pa 6.3 8.0 10.0
Direct 2017‐01‐03 10:54:35 ‐27.0 2.5 1.9 3.3
Direct 2017‐01‐03 10:30:13 ‐26.0
Direct 2014‐07‐01 09:45:44 ‐27.0 61.7 59.8 59.2
PRMLxT1L 2018‐01‐10 14:43:11 ‐26.4 82.7 77.6 101.5
PRMLxT1L 2018‐01‐10 12:58:50 ‐26.6 96.2 82.6 79.8
PRMLxT1L 2018‐01‐05 10:50:51 ‐26.7 45.1 51.0 61.7
PRMLxT1L 2017‐12‐06 16:53:45 ‐26.7 47.2 60.5 57.3
PRMLxT1L 2017‐09‐01 20:44:20 ‐26.5 71.4 64.6 54.7
PRMLxT1L 2017‐08‐25 17:23:31 ‐26.6 53.8 49.8 55.0
PRMLxT1L 2017‐07‐03 11:23:13 ‐26.4 52.6 54.8 52.8
PRMLxT1L 2017‐06‐27 16:21:22 ‐26.6 64.6 55.5 59.0
PRMLxT1L 2017‐06‐26 11:13:28 ‐26.6 61.3 59.9 62.9
PRMLxT1L 2017‐06‐20 10:09:05 ‐26.6 61.9 63.5 53.7
PRMLxT1L 2017‐06‐12 12:50:10 ‐26.6 48.3 50.2 49.4

4
Measurement 4 – Location 2 with the grinder running in the doorway

Summary
File Name on Meter AF___.008
File Name on PC
Serial Number 0003788
Model SoundExpert® LxT
Firmware Version 2.301
User
Location
Job Description
Note
Measurement
Description
Start 2018‐01‐10 16:06:48
Stop 2018‐01‐10 16:21:48
Duration 00:15:00.0
Run Time 00:15:00.0
Pause 00:00:00.0
Pre Calibration 2018‐01‐10 14:43:11
Post Calibration None
Calibration Deviation ‐‐‐
Overall Settings
RMS Weight A Weighting
Peak Weight A Weighting
Detector Slow
Preamp PRMLxT1L
Microphone Correction Off
Integration Method Exponential
OBA Range Normal
OBA Bandwidth 1/1 and 1/3
OBA Freq. Weighting A Weighting
OBA Max Spectrum At LMax
Overload 120.0 dB
A C Z
Under Range Peak 76.3 73.3 78.3 dB
Under Range Limit 25.2 24.8 31.2 dB
Noise Floor 15.9 15.6 21.3 dB
Results
LASeq 86.7 dB
LASE 116.2 dB
EAS 46.457 mPa²h
LASpeak (max) 2018‐01‐10 16:14:34 111.7 dB
LASmax 2018‐01‐10 16:19:09 94.0 dB
LASmin 2018‐01‐10 16:15:01 77.6 dB
SEA ‐99.9 dB
LAS > 85.0 dB (Exceedance Counts / Duration) 27 668.5 s
LAS > 115.0 dB (Exceedance Counts / Duration) 0 0.0 s
LASpeak > 135.0 dB (Exceedance Counts / Duration) 0 0.0 s
LASpeak > 137.0 dB (Exceedance Counts / Duration) 0 0.0 s
LASpeak > 140.0 dB (Exceedance Counts / Duration) 0 0.0 s
Community Noise Ldn LDay 07:00‐23:00 LNight 23:00‐07:00 Lden LDay 07:00‐19:00 LEvening 19:00‐23:00
86.7 86.7 ‐99.9 86.7 86.7 ‐99.9
LCSeq 91.8 dB
LASeq 86.7 dB
LCSeq ‐ LASeq 5.1 dB
LAIeq 88.1 dB
LAeq 86.7 dB
LAIeq ‐ LAeq 1.4 dB
dB Time Stamp dB Time Stamp dB Time Stamp
Leq 86.7
LS(max) 94.0 2018/01/10 16:19:09
LS(min) 77.6 2018/01/10 16:15:01
LPeak(max) 111.7 2018/01/10 16:14:34
# Overloads 0
Overload Duration 0.0 s
# OBA Overloads 0
OBA Overload Duration 0.0 s
Statistics
LAS5.00 89.8 dB
LAS10.00 89.2 dB
LAS33.30 87.3 dB
LAS50.00 86.0 dB
LAS66.60 84.5 dB
LAS90.00 82.2 dB
SLM_0003788_AF____008.01.ldbin
AF _ademy Project
A C Z

Calibration History
Preamp Date dB re. 1V/Pa 6.3 8.0 10.0
Direct 2017‐01‐03 10:54:35 ‐27.0 2.5 1.9 3.3
Direct 2017‐01‐03 10:30:13 ‐26.0
Direct 2014‐07‐01 09:45:44 ‐27.0 61.7 59.8 59.2
PRMLxT1L 2018‐01‐10 14:43:11 ‐26.4 82.7 77.6 101.5
PRMLxT1L 2018‐01‐10 12:58:50 ‐26.6 96.2 82.6 79.8
PRMLxT1L 2018‐01‐05 10:50:51 ‐26.7 45.1 51.0 61.7
PRMLxT1L 2017‐12‐06 16:53:45 ‐26.7 47.2 60.5 57.3
PRMLxT1L 2017‐09‐01 20:44:20 ‐26.5 71.4 64.6 54.7
PRMLxT1L 2017‐08‐25 17:23:31 ‐26.6 53.8 49.8 55.0
PRMLxT1L 2017‐07‐03 11:23:13 ‐26.4 52.6 54.8 52.8
PRMLxT1L 2017‐06‐27 16:21:22 ‐26.6 64.6 55.5 59.0
PRMLxT1L 2017‐06‐26 11:13:28 ‐26.6 61.3 59.9 62.9
PRMLxT1L 2017‐06‐20 10:09:05 ‐26.6 61.9 63.5 53.7
PRMLxT1L 2017‐06‐12 12:50:10 ‐26.6 48.3 50.2 49.4