Embed Size (px)
Citation preview
APPENDIX C AIR QUALITY AND GREENHOUSE GAS
EMISSIONS

468 Poli Street, Suite 2E • Ventura, CA 93001 Office (805) 275-1515 • Fax (805) 667-8104
Sespe Consulting, Inc.
AIR QUALITY AND GREENHOUSE GAS IMPACT ASSESSMENT
Omya White Knob and White Ridge Quarries Expansion County of San Bernardino
November 5, 2013
Prepared for: Omya
7225 Crystal Creek Road Lucerne Valley, CA 92356
Prepared by: Sespe Consulting, Inc. 468 Poli Street, Suite 2E Ventura, California 93001 (805) 275-1515
468 Poli Street, Suite 2E • Ventura, CA 93001 Office (805) 275-1515 • Fax (805) 667-8104
AQIA - 11613 - ii Sespe Consulting, Inc.
AIR QUALITY AND GREENHOUSE GAS IMPACT ASSESSMENT
Omya White Knob and White Ridge Quarries Expansion
County of San Bernardino
November 5, 2013 TABLE OF CONTENTS
1.0 Introduction ..........................................................................................................................1
2.0 Environmental Setting ............................................................................................................2
2.1 Existing Sources and Receptors .......................................................................................... 22.2 Meteorology and Topography ............................................................................................ 22.3 Ambient Air Quality ............................................................................................................ 22.4 Ambient Health Risk ........................................................................................................... 42.5 Effects of Greenhouse Gases .............................................................................................. 42.6 Class I and Class II Wilderness Areas ................................................................................... 5
3.0 Regulatory Setting .................................................................................................................7
3.1 Air Quality Regulatory Framework ..................................................................................... 73.2 Conformity ........................................................................................................................ 113.3 Federal Land Managers’ Air Quality Related Values ......................................................... 113.4 Health Risk ........................................................................................................................ 123.5 Greenhouse Gas Regulations ............................................................................................ 13
4.0 Significance Thresholds ........................................................................................................ 17
5.0 Assessment Methodology .................................................................................................... 19
5.1 Baseline Activity Levels ..................................................................................................... 195.1.1 Vehicles ................................................................................................................ 205.1.2 Crushing ............................................................................................................... 225.1.3 Roads ................................................................................................................... 225.1.4 Mining Activities .................................................................................................. 23
5.2 Baseline Emissions ............................................................................................................ 245.3 Potential Future Emissions ............................................................................................... 285.4 Dispersion Modeling ......................................................................................................... 325.5 Health Risk Assessment .................................................................................................... 34
6.0 Project Impacts .................................................................................................................... 35
6.1 Federal Conformity ........................................................................................................... 356.2 Federal Land Managers’ Air Quality Related Values ......................................................... 36
White Knob and White Ridge Quarries Expansion Air Quality and Greenhouse Gas Impact Assessment County of San Bernardino November 5, 2013
AQIA - 11613 - iii Sespe Consulting, Inc.
6.3 Localized Criteria Pollutant Impacts ................................................................................. 376.4 Health Risk Impacts ........................................................................................................... 38
7.0 Mitigated Impacts ................................................................................................................ 39
8.0 Alternatives ......................................................................................................................... 40
8.1 Alternative 1: No Action/Mining under Current Entitlements ........................................ 408.2 Alternative 2: Combined Production with the Sentinel and Butterfield Quarries ........... 40
9.0 References ........................................................................................................................... 41
TABLES Table 1: Ambient Pollutant Concentrations ................................................................................................. 3Table 2: Ambient Air Quality Standards ....................................................................................................... 8Table 3: MDAQMD Attainment Status ......................................................................................................... 9Table 4: MDAQMD Attainment Plans .......................................................................................................... 9Table 5: Significant Emissions Thresholds .................................................................................................. 18Table 6: Baseline Activity Levels ................................................................................................................ 20Table 7: Baseline Vehicle Activity ............................................................................................................... 20Table 8: Baseline Stationary Source Throughputs ..................................................................................... 22Table 9: Baseline Activity on Roads ........................................................................................................... 23Table 10: Vehicle Emissions Factors ........................................................................................................... 24Table 11: Baseline Vehicle Emissions ......................................................................................................... 26Table 12: Baseline Vehicle Emissions by Location ..................................................................................... 26Table 13: Baseline Emissions on Roads ...................................................................................................... 27Table 14: Baseline Mining and Processing Dust Emissions ........................................................................ 27Table 15: Baseline Mining and Processing Combustion Emissions ............................................................ 28Table 16: Activity Scaling Factors ............................................................................................................... 29Table 17: Project Vehicle Emissions by Location ....................................................................................... 29Table 18: Project Emissions on Roads ........................................................................................................ 30Table 19: Project On-Site Particulate Matter Emissions ............................................................................ 30Table 20: Project Mining and Processing Combustion Emissions .............................................................. 31Table 21: Incremental Change in Emissions ............................................................................................... 32Table 22: Nearby Receptors ....................................................................................................................... 33Table 23: Deposition Parameters ............................................................................................................... 33Table 24: Project Emissions Comparisons .................................................................................................. 35Table 25: Increment in Concentration at Point of Maximum Impact ........................................................ 38Table 26: Project Health Risk Impacts ........................................................................................................ 38Table 27: Mitigated Emissions Comparisons ............................................................................................. 39Table 28: Mitigated Concentration at Point of Maximum Impact ............................................................. 39
White Knob and White Ridge Quarries Expansion Air Quality and Greenhouse Gas Impact Assessment County of San Bernardino November 5, 2013
AQIA - 11613 - iv Sespe Consulting, Inc.
APPENDICES Appendix A: Figures Appendix B: Health Effects of Air Pollutants Appendix C: Ambient Pollutant Concentrations Appendix D: San Gorgonio Wilderness Area Description Appendix E: MDAQMD Rule Development Calendar Appendix F: MDAQMD Mineral Industry Emissions Inventory Guidelines Appendix G: Baseline Data from Omya Appendix H: Baseline Emissions Calculations Appendix I: Project Emissions Appendix J: Mitigated Emissions Appendix K: Modeling Files on Electronic Media
468 Poli Street, Suite 2E • Ventura, CA 93001 Office (805) 275-1515 • Fax (805) 667-8104
AQIA - 11613 - 1 Sespe Consulting, Inc.
AIR QUALITY AND GREENHOUSE GAS IMPACT ASSESSMENT
Omya White Knob and White Ridge Quarries Expansion
County of San Bernardino, California
November 5, 2013 1.0 INTRODUCTION
This Air Quality and Greenhouse Gas Impact Assessment report (AQIA) has been prepared for the Omya White Knob and White Ridge Quarries Expansion project (“Project”). The Project is located adjacent to the San Bernardino National Forest (SBNF) 6.5 miles southwest of the intersection of State Route 18 and State Route 247 in the Lucerne Valley. The Project is 4.2 miles west-southwest of the existing Omya processing plant located near the intersection of Crystal Creek Road and Powerline Road. An existing access haul road connects the Project to the processing plant. The Project involves the expansion of two quarries and three fill areas. Specifically, the existing White Knob Quarry and Overburden Site #1 would be expanded. The White Ridge Quarry and White Knob Annex Quarry do not currently exist but are already approved and would be expanded. Overburden Sites #2 and #3 would be added to the existing plan. Primary crushing occurs near the quarries and ore is hauled north down the mountain and then east along the foothills to the processing plant. Omya operates two other quarries in the area. The Sentinel and Butterfield Quarries are located approximately 3 miles south of the processing plant on Crystal Creek Road. The Sentinel and Butterfield Quarries are currently undergoing a separate CEQA evaluation for proposed expansion. Cloudy and Claudia Quarries are inactive and in the process of being reclaimed. Cloudy and Claudia Quarries are located approximately 5 miles south of the processing plant at the terminus of Crystal Creek Road. The combined production from all the operating quarries (Butterfield, Sentinel, and White Knob) is limited by the processing plant maximum production rate. The Project would allow up to the maximum production rate of 680,000 tons per year of finished ore to be extracted exclusively from the White Knob and White Ridge quarries. This would result in no material being quarried at Sentinel and Butterfield which is an indirect effect of the Project that necessitates calculation of Sentinel and Butterfield emissions in the air quality baseline. Moreover the available vehicular activity data does not distinguish which units operate in each quarry. Thus, the emissions from vehicles are calculated for the fleet and apportioned to quarries based on throughput amount and to units operating on roads by vehicle miles traveled (VMT). Impacts from alternatives to the Project are assessed in this report and described in Section 8.0. The two alternatives include: No Action and Mixed Production with Sentinel and Butterfield.
White Knob and White Ridge Quarries Expansion Air Quality and Greenhouse Gas Impact Assessment County of San Bernardino November 5, 2013
AQIA - 11613 - 2 Sespe Consulting, Inc.
2.0 ENVIRONMENTAL SETTING
Air pollutants are regulated in order to protect public health and welfare. Health effects of common air pollutants are presented in Appendix B. Effects of pollutants on public welfare include visibility impairment; and impacts to animals, crops, vegetation, and buildings. 2.1 Existing Sources and Receptors
The Omya processing plant receives ore from the Butterfield, Sentinel and White Knob Quarries. Omya provided information on historical activity levels and equipment that was used to develop a baseline for the Project. In general, the quarries and processing plant consist of operations and equipment that emit fugitive dust and diesel exhaust. Detailed discussion of how the baseline emissions were quantified is presented in Section 5.0. 2.2 Meteorology and Topography
The MDAQMD Guidelines state:
The Mojave Desert Air Basin (MDAB) is an assemblage of mountain ranges interspersed with long broad valleys that often contain dry lakes. Many of the lower mountains which dot the vast terrain rise from 1,000 to 4,000 feet above the valley floor. Prevailing winds in the MDAB are out of the west and southwest. These prevailing winds are due to the proximity of the MDAB to coastal and central regions and the blocking nature of the Sierra Nevada mountains to the north; air masses pushed onshore in southern California by differential heating are channeled through the MDAB. The MDAB is separated from the southern California coastal and central California valley regions by mountains (highest elevation approximately 10,000 feet), whose passes form the main channels for these air masses. The Antelope Valley is bordered in the northwest by the Tehachapi Mountains, separated from the Sierra Nevadas in the north by the Tehachapi Pass (3,800 ft elevation). The Antelope Valley is bordered in the south by the San Gabriel Mountains, bisected by Soledad Canyon (3,300 ft). The Mojave Desert is bordered in the southwest by the San Bernardino Mountains, separated from the San Gabriels by the Cajon Pass (4,200 ft). A lesser channel lies between the San Bernardino Mountains and the Little San Bernardino Mountains (the Morongo Valley). During the summer the MDAB is generally influenced by a Pacific Subtropical High cell that sits off the coast, inhibiting cloud formation and encouraging daytime solar heating. The MDAB is rarely influenced by cold air masses moving south from Canada and Alaska, as these frontal systems are weak and diffuse by the time the reach the desert. Most desert moisture arrives from infrequent warm, moist and unstable air masses from the south. The MDAB averages between three and seven inches of precipitation per year (from 16 to 30 days with at least 0.01 inches of precipitation). The MDAB is classified as a dry-hot desert climate (BWh), with portions classified as dry-very hot desert (BWhh), to indicate at least three months have maximum average temperatures over 100.4° F.
2.3 Ambient Air Quality
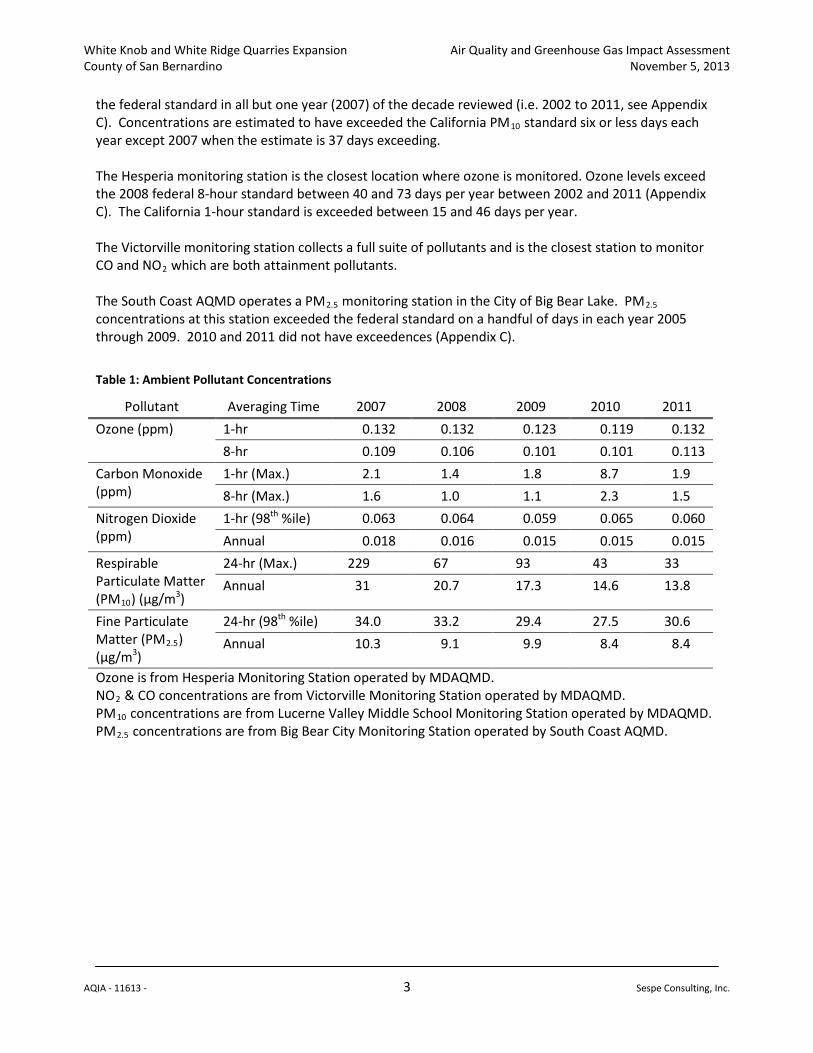
Appendix C contains the airborne pollutant concentration data and number of days exceeding each Ambient Air Quality Standard (AAQS) monitored by local air districts. The Project is located near the Lucerne Valley monitoring station which measures PM10. Concentrations at this station were less than
White Knob and White Ridge Quarries Expansion Air Quality and Greenhouse Gas Impact Assessment County of San Bernardino November 5, 2013
AQIA - 11613 - 3 Sespe Consulting, Inc.
the federal standard in all but one year (2007) of the decade reviewed (i.e. 2002 to 2011, see Appendix C). Concentrations are estimated to have exceeded the California PM10
standard six or less days each year except 2007 when the estimate is 37 days exceeding.
The Hesperia monitoring station is the closest location where ozone is monitored. Ozone levels exceed the 2008 federal 8-hour standard between 40 and 73 days per year between 2002 and 2011 (Appendix C). The California 1-hour standard is exceeded between 15 and 46 days per year. The Victorville monitoring station collects a full suite of pollutants and is the closest station to monitor CO and NO2
which are both attainment pollutants.
The South Coast AQMD operates a PM2.5 monitoring station in the City of Big Bear Lake. PM2.5
Appendix C
concentrations at this station exceeded the federal standard on a handful of days in each year 2005 through 2009. 2010 and 2011 did not have exceedences ( ).
Table 1: Ambient Pollutant Concentrations
Pollutant Averaging Time 2007 2008 2009 2010 2011 Ozone (ppm) 1-hr 0.132 0.132 0.123 0.119 0.132
8-hr 0.109 0.106 0.101 0.101 0.113 Carbon Monoxide (ppm)
1-hr (Max.) 2.1 1.4 1.8 8.7 1.9 8-hr (Max.) 1.6 1.0 1.1 2.3 1.5
Nitrogen Dioxide (ppm)
1-hr (98th 0.063 %ile) 0.064 0.059 0.065 0.060 Annual 0.018 0.016 0.015 0.015 0.015
Respirable Particulate Matter (PM10) (µg/m3
24-hr (Max.)
)
229 67 93 43 33 Annual 31 20.7 17.3 14.6 13.8
Fine Particulate Matter (PM2.5) (µg/m3
24-hr (98
)
th 34.0 %ile) 33.2 29.4 27.5 30.6 Annual 10.3 9.1 9.9 8.4 8.4
Ozone is from Hesperia Monitoring Station operated by MDAQMD. NO2
PM & CO concentrations are from Victorville Monitoring Station operated by MDAQMD.
10
PM concentrations are from Lucerne Valley Middle School Monitoring Station operated by MDAQMD.
2.5 concentrations are from Big Bear City Monitoring Station operated by South Coast AQMD.
White Knob and White Ridge Quarries Expansion Air Quality and Greenhouse Gas Impact Assessment County of San Bernardino November 5, 2013
AQIA - 11613 - 4 Sespe Consulting, Inc.
2.4 Ambient Health Risk
The MDAQMD does not publish health risk estimates for areas within its jurisdiction. The Project is near the boundary of Mojave Desert and South Coast Air Basins. Thus, the SCAQMD Multiple Air Toxics Exposure Study (MATES) III risk maps which show total cancer risk of approximately 85 excess cancer cases per one million people exposed in the Big Bear Lake area is considered representative of conditions in the area of the Project as documented on Figure 3 (Appendix A). It should be noted that the SCAQMD’s MATES study is based on ambient air quality monitoring data from several monitoring stations in the South Coast Air Basin. The MATES III study includes fixed monitoring sites (where data is collected over multiple years) and microscale or temporary sites where monitoring occurred for a limited time period (six to ten weeks). The nearest fixed air monitoring site to the Project vicinity is the Inland Valley San Bernardino station located at 14360 Arrow Highway in Fontana, CA which is over sixty (60) miles southwest of the Project. The MATES III study did include a temporary site that appears to be located closer to the Project but no address is provided in the MATES III documentation. The MATES III study acknowledges that “Since the sampling periods for the microscale sites are limited, annual averages for measured substances cannot be calculated.” (Page 2-4, MATES III). The ambient health risk identified in Figure 3 (Appendix A) includes projection of risk levels from locations that were monitored to those that were not. This report overlooks these details and considers the risk map published by SCAQMD at face value such that it represents existing conditions at the project site. Diesel particulate matter (DPM) is identified as a TAC and accounts for roughly 70% of the cancer risk from air pollution in urban areas where on-road sources dominate the inventory. Diesel engines are a ubiquitous source and thus it is not surprising that stationary source TAC effects "are generally much lower than region-wide risk levels, region-wide risks tend to overwhelm any potential local ‘hot spots.’” (SCAQMD Mates II Study, Section 7.3). 2.5 Effects of Greenhouse Gases
The effect of greenhouse gas emission regulations are potentially far reaching. On December 7, 2009, United States Environmental Protection Agency (US EPA) Administrator Lisa Jackson signed a final action, under Section 202(a) of the Clean Air Act, finding that six key well-mixed greenhouse gases constitute a threat to public health and welfare, and that the combined emissions from motor vehicles cause and contribute to the climate change problem. The “endangerment finding” allows the US EPA to begin regulating the six GHGs that are identified. Key effects that US EPA claims support the determination that GHGs endanger public health include:
“Temperature. There is evidence that the number of extremely hot days is already increasing. Severe heat waves are projected to intensify, which can increase heat-related mortality and sickness. Fewer deaths from exposure to extreme cold is a possible benefit of moderate temperature increases. Recent evidence suggests, however, that the net impact on mortality is more likely to be a danger because heat is already the leading cause of weather-related deaths in the United States.
White Knob and White Ridge Quarries Expansion Air Quality and Greenhouse Gas Impact Assessment County of San Bernardino November 5, 2013
AQIA - 11613 - 5 Sespe Consulting, Inc.
Air Quality. Climate change is expected to worsen regional ground-level ozone pollution. Exposure to ground-level ozone has been linked to respiratory health problems ranging from decreased lung function and aggravated asthma to increased emergency department visits, hospital admissions, and even premature death. The impact on particulate matter remains less certain.
Climate-Sensitive Diseases and Aeroallergens. • Potential ranges of certain diseases affected by temperature and precipitation changes, including tick-borne diseases and food and water-borne pathogens, are expected to increase. • Climate change could impact the production, distribution, dispersion and allergenicity of aeroallergens and the growth and distribution of weeds, grasses, and trees that produce them. These changes in aeroallergens and subsequent human exposures could affect the prevalence and severity of allergy symptoms.
Vulnerable Populations and Environmental Justice. • Certain parts of the population may be especially vulnerable to climate impacts, including the poor, the elderly, those already in poor health, the disabled, those living alone, and/or indigenous populations dependent on one or a few resources. • Environmental justice issues are clearly raised through examples such as warmer temperatures in urban areas having a more direct impact on those without air-conditioning.
Extreme Events. Storm impacts are likely to be more severe, especially along the Gulf and Atlantic coasts. Heavy rainfall events are expected to increase, increasing the risk of flooding, greater runoff and erosion, and thus the potential for adverse water quality effects. These projected trends can increase the number of people at risk from suffering disease and injury due to floods, storms, droughts and fires.” (EPA’s Endangerment Finding - Health Effects Fact Sheet, US EPA).
2.6 Class I and Class II Wilderness Areas
Class I Wilderness Areas are areas designated in the Clean Air Act (42 USC 7472) including: - International parks; - National wilderness areas which exceed 5,000 acres in size; - National memorial parks which exceed 5,000 acres in size; and - National parks which exceed 6,000 acres in size. The Project is within 100 kilometers of the following Class I Wilderness Areas: - San Gorgonio 23 km. - Cucamonga 50 km. - San Jacinto 56 km. - Joshua Tree National Park 59 km. - San Gabriel 75 km. Class I areas are protected from impacts on visibility, ozone phytotoxicity, and deposition of nitrates and sulfates which can acidify water bodies. In addition, the deposition of fugitive dust onto plants is a concern particularly for protected species, such as the carbonaceous plants found near the quarries. The remainder of the SBNF is considered Class II Wilderness.
White Knob and White Ridge Quarries Expansion Air Quality and Greenhouse Gas Impact Assessment County of San Bernardino November 5, 2013
AQIA - 11613 - 6 Sespe Consulting, Inc.
Good visibility is essential to the enjoyment of national parks and scenic areas. Across the United States, regional haze has decreased the visual range in these pristine areas from 140 miles to 35-90 miles in the West, and from 90 miles to 15-25 miles in the East. This haze is composed of small particles that absorb and scatter light, affecting the clarity and color of what humans see in a vista. The pollutants that create haze (also called haze species) are measurable as sulfates, nitrates, organic carbon, elemental carbon, fine soil, sea salt, and coarse mass. Anthropogenic sources of haze include industry, motor vehicles, agricultural and forestry burning, and dust from soils disturbed by human activities. Pollutants from these sources, in concentrations much lower than those which affect public health, can impair visibility anywhere. Natural forest fires, biological emissions, sea salt and other natural events also contribute to haze species concentrations. Visibility-reducing particles can be transported long distances from where they are generated, thereby producing regional haze. When they are transported to and occur in national parks and wilderness areas, the reduced visibility impairs the quality and the value of the wilderness experience. Conditions in the San Gorgonio Wilderness Area would be of primary concern for this Project because it is closest and other areas would experience less severe impacts. The environmental setting for each Class I Wilderness Area within California is found in the California Regional Haze Plan. The San Gorgonio Wilderness Area description from this Plan is provided in Appendix D. The Project is bounded on the south, west, and east by mountainous undeveloped Forest Lands and to the north by a rural area of the Lucerne Valley. Other than mining, which has historically been active in the area, land use in the rugged mountainous area has been limited to occasional use by hikers and hunters. Off highway vehicle use and fuel wood cutting have increased as more access roads were built. The “Land Management Plan, Part 2 San Bernardino National Forest Strategy” (USDA September 2005) defines the project area as the “Desert Rim.” The Desert Rim is described as “a high desert, remote, rugged landscape formed by complex geological faulting. Today, the majority of the land is valued in the production of large quantities of high quality, limestone mineral deposits used in the production of pharmaceuticals and cement. These carbonate deposits are also valuable habitat supporting four species of threatened and endangered plants found nowhere else in the world.” An intensive collaborative effort led to the development of the Carbonate Habitat Management Strategy (CHMS) in 2003. The CHMS is designed to provide long-term protection for the carbonate endemic plants and also provide for continued long-term mining. Portions of the carbonate habitats are protected from mining impacts in perpetuity within the carbonate habitat reserves dedicated and managed as described in the CHMS.
White Knob and White Ridge Quarries Expansion Air Quality and Greenhouse Gas Impact Assessment County of San Bernardino November 5, 2013
AQIA - 11613 - 7 Sespe Consulting, Inc.
3.0 REGULATORY SETTING
Regulations that affect air quality consist primarily of those promulgated under federal and state clean air acts as discussed in Section 3.1. Other regulations that affect air quality include those related to federal conformity (Section 3.2), impacts on Class I and Class II Wilderness Areas (Section 3.3), impacts on health risk (Section 3.4), and greenhouse gases (Section 3.5). 3.1 Air Quality Regulatory Framework
The Federal Clean Air Act and the California Clean Air Act each contain comprehensive frameworks for air quality planning and regulation. Title 40 of the Code of Federal Regulations and Title 17 of the California Code of Regulations contain requirements that have been promulgated under authority granted to US EPA and California Air Resource Board (CARB) by the Acts. Criteria air pollutants include sulfur oxides (SOx), nitrogen oxides (NOx), particulate matter (PM), carbon monoxide (CO), lead (Pb), and ground-level ozone (O3
). AAQS are developed by US EPA and CARB for each of the criteria pollutants. Primary AAQS are designed to protect human health, with an adequate margin of safety, including sensitive populations such as children, the elderly, and individuals suffering from respiratory disease. Secondary AAQS are designed to protect public welfare from any known or anticipated adverse effects of a pollutant (e.g. building facade degradation, reduced visibility, and damage to crops and domestic animals).
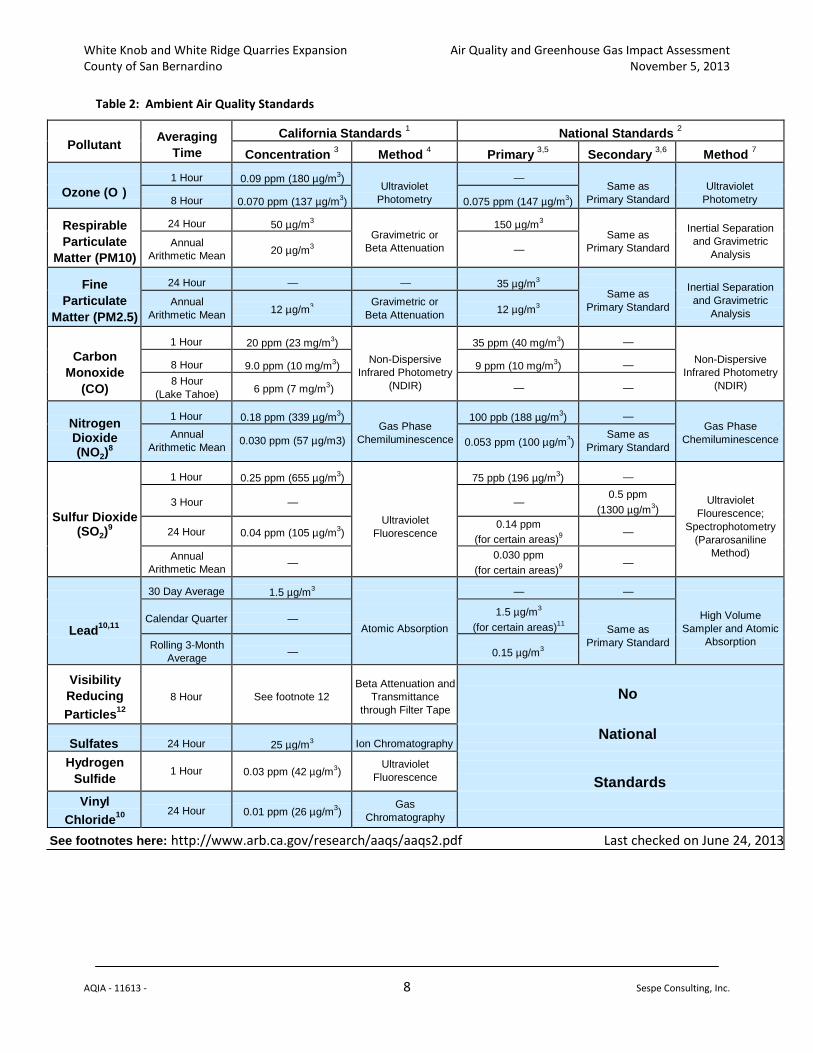
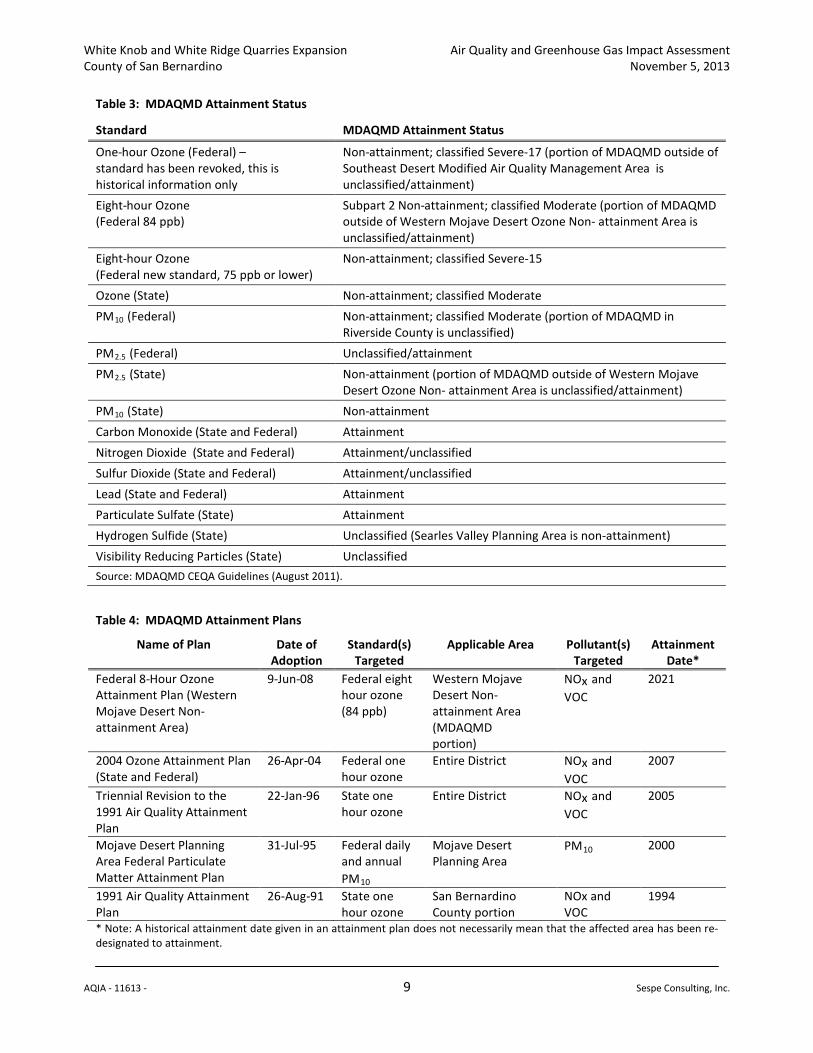
AAQS and related monitoring programs are among the many devices established by air quality regulations (40 CFR 50 - 51). Geographic areas called “attainment areas” are classified by US EPA and CARB based on whether the ambient air in the area meets the AAQSs. An “attainment area” is an area in which pollutant concentrations are less than or equal to the AAQS while “non-attainment areas” have pollution levels above the AAQS. State and federal AAQS are shown in Table 2. In order to make progress towards attainment with the AAQS, each state and air district containing federal non-attainment areas is required to develop a written plan for improving air quality in those areas. These plans are called State Implementation Plans (SIP) and Attainment Plans. California’s SIP contains mobile source and consumer product emission control strategies proposed by CARB and a compilation of stationary and area source strategies that have been developed by local air districts under CARB supervision. Through these plans, the state and local air districts outline efforts that they will take to reduce air pollutant concentrations to levels below the standards. Federal and State attainment status designations assigned by US EPA and CARB for the Project area are summarized in Table 3. California Ambient Air Quality Standards (CAAQS) are more stringent than the National Ambient Air Quality Standard (NAAQS). Existing law requires district plans for attaining CAAQS to assess the cost-effectiveness of available and proposed emission control measures. Proposed emission control measures in the Attainment Plans are typically developed into air district rules. The MDAQMD assists CARB in preparing the State Implementation Plan by preparing Attainment Plans that demonstrate how the Ambient Air Quality Standards will be achieved. The Attainment Plans describe the rules that will be developed and other means by which the MDAQMD will manage the emissions within the jurisdiction. MDAQMD Attainment Plans are listed in Table 4.
White Knob and White Ridge Quarries Expansion Air Quality and Greenhouse Gas Impact Assessment County of San Bernardino November 5, 2013
AQIA - 11613 - 8 Sespe Consulting, Inc.
Table 2: Ambient Air Quality Standards
Pollutant
Averaging
Time California Standards 1 National Standards 2
Concentration 3 Method 4 Primary 3,5 Secondary 3,6
Method 7
Ozone (O )
1 Hour
0.09 ppm (180 µg/m3) Ultraviolet
Photometry
—
Same as Primary Standard
Ultraviolet
Photometry
8 Hour
0.070 ppm (137 µg/m3)
0.075 ppm (147 µg/m3)
Respirable Particulate
Matter (PM10)
24 Hour
50 µg/m3
Gravimetric or
Beta Attenuation
150 µg/m3
Same as
Primary Standard
Inertial Separation and Gravimetric
Analysis Annual
Arithmetic Mean
20 µg/m3
—
Fine
Particulate Matter (PM2.5)
24 Hour
—
—
35 µg/m3
Same as
Primary Standard
Inertial Separation and Gravimetric
Analysis Annual
Arithmetic Mean
3
12 µg/m Gravimetric or
Beta Attenuation
12 µg/m3
Carbon Monoxide
(CO)
1 Hour
20 ppm (23 mg/m3)
Non-Dispersive Infrared Photometry
(NDIR)
35 ppm (40 mg/m3)
—
Non-Dispersive Infrared Photometry
(NDIR)
8 Hour
9.0 ppm (10 mg/m3)
9 ppm (10 mg/m3)
— 8 Hour
(Lake Tahoe)
3
6 ppm (7 mg/m )
—
—
Nitrogen Dioxide (NO2)
8
1 Hour
0.18 ppm (339 µg/m3) Gas Phase
Chemiluminescence
100 ppb (188 µg/m3)
— Gas Phase
Chemiluminescence Annual Arithmetic Mean
0.030 ppm (57 µg/m3)
3
0.053 ppm (100 µg/m ) Same as
Primary Standard
Sulfur Dioxide
(SO2)
9
1 Hour
0.25 ppm (655 µg/m3)
Ultraviolet Fluorescence
75 ppb (196 µg/m3)
—
Ultraviolet Flourescence;
Spectrophotometry (Pararosaniline
Method)
3 Hour
—
—
0.5 ppm (1300 µg/m3)
24 Hour
0.04 ppm (105 µg/m3) 0.14 ppm
(for certain areas)9
—
Annual Arithmetic Mean
—
0.030 ppm (for certain areas)9
—
Lead10,11
30 Day Average
1.5 µg/m3
Atomic Absorption
—
—
High Volume
Sampler and Atomic Absorption
Calendar Quarter
— 1.5 µg/m3
(for certain areas)11
Same as Primary Standard Rolling 3-Month
Average
—
0.15 µg/m3
Visibility Reducing Particles12
8 Hour
See footnote 12
Beta Attenuation and
Transmittance through Filter Tape
No
Sulfates
24 Hour
25 µg/m3
Ion Chromatography
National
Hydrogen Sulfide
1 Hour
0.03 ppm (42 µg/m3)
Ultraviolet Fluorescence
Standards Vinyl
Chloride10
24 Hour
0.01 ppm (26 µg/m3)
Gas Chromatography
See footnotes here: http://www.arb.ca.gov/research/aaqs/aaqs2.pdf Last checked on June 24, 2013
White Knob and White Ridge Quarries Expansion Air Quality and Greenhouse Gas Impact Assessment County of San Bernardino November 5, 2013
AQIA - 11613 - 9 Sespe Consulting, Inc.
Table 3: MDAQMD Attainment Status
Standard MDAQMD Attainment Status
One-hour Ozone (Federal) – standard has been revoked, this is historical information only
Non-attainment; classified Severe-17 (portion of MDAQMD outside of Southeast Desert Modified Air Quality Management Area is unclassified/attainment)
Eight-hour Ozone (Federal 84 ppb)
Subpart 2 Non-attainment; classified Moderate (portion of MDAQMD outside of Western Mojave Desert Ozone Non- attainment Area is unclassified/attainment)
Eight-hour Ozone (Federal new standard, 75 ppb or lower)
Non-attainment; classified Severe-15
Ozone (State) Non-attainment; classified Moderate PM10 Non-attainment; classified Moderate (portion of MDAQMD in
Riverside County is unclassified) (Federal)
PM2.5 Unclassified/attainment (Federal) PM2.5 Non-attainment (portion of MDAQMD outside of Western Mojave
Desert Ozone Non- attainment Area is unclassified/attainment) (State)
PM10 Non-attainment (State) Carbon Monoxide (State and Federal) Attainment Nitrogen Dioxide (State and Federal) Attainment/unclassified Sulfur Dioxide (State and Federal) Attainment/unclassified Lead (State and Federal) Attainment Particulate Sulfate (State) Attainment Hydrogen Sulfide (State) Unclassified (Searles Valley Planning Area is non-attainment) Visibility Reducing Particles (State) Unclassified Source: MDAQMD CEQA Guidelines (August 2011).
Table 4: MDAQMD Attainment Plans
Name of Plan Date of Adoption
Standard(s) Targeted
Applicable Area Pollutant(s) Targeted
Attainment Date*
Federal 8-Hour Ozone Attainment Plan (Western Mojave Desert Non-attainment Area)
9-Jun-08 Federal eight hour ozone (84 ppb)
Western Mojave Desert Non- attainment Area (MDAQMD portion)
NOx and VOC
2021
2004 Ozone Attainment Plan (State and Federal)
26-Apr-04 Federal one hour ozone
Entire District NOx and VOC
2007
Triennial Revision to the 1991 Air Quality Attainment Plan
22-Jan-96 State one hour ozone
Entire District NOx and VOC
2005
Mojave Desert Planning Area Federal Particulate Matter Attainment Plan
31-Jul-95 Federal daily and annual PM
Mojave Desert Planning Area
10
PM 2000 10
1991 Air Quality Attainment Plan
26-Aug-91 State one hour ozone
San Bernardino County portion
NOx and VOC
1994
* Note: A historical attainment date given in an attainment plan does not necessarily mean that the affected area has been re-designated to attainment.
White Knob and White Ridge Quarries Expansion Air Quality and Greenhouse Gas Impact Assessment County of San Bernardino November 5, 2013
AQIA - 11613 - 10 Sespe Consulting, Inc.
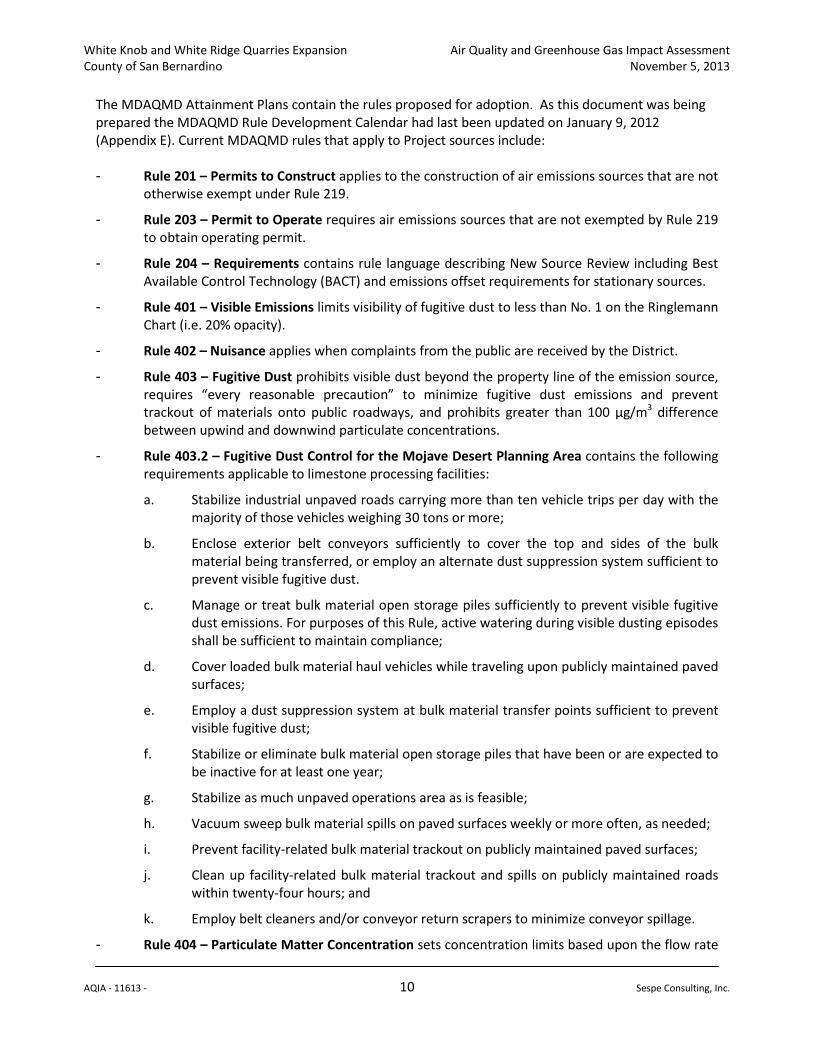
The MDAQMD Attainment Plans contain the rules proposed for adoption. As this document was being prepared the MDAQMD Rule Development Calendar had last been updated on January 9, 2012 (Appendix E). Current MDAQMD rules that apply to Project sources include: - Rule 201 – Permits to Construct applies to the construction of air emissions sources that are not
otherwise exempt under Rule 219.
- Rule 203 – Permit to Operate requires air emissions sources that are not exempted by Rule 219 to obtain operating permit.
- Rule 204 – Requirements contains rule language describing New Source Review including Best Available Control Technology (BACT) and emissions offset requirements for stationary sources.
- Rule 401 – Visible Emissions limits visibility of fugitive dust to less than No. 1 on the Ringlemann Chart (i.e. 20% opacity).
- Rule 402 – Nuisance applies when complaints from the public are received by the District.
- Rule 403 – Fugitive Dust prohibits visible dust beyond the property line of the emission source, requires “every reasonable precaution” to minimize fugitive dust emissions and prevent trackout of materials onto public roadways, and prohibits greater than 100 µg/m3
- Rule 403.2 – Fugitive Dust Control for the Mojave Desert Planning Area contains the following requirements applicable to limestone processing facilities:
difference between upwind and downwind particulate concentrations.
a. Stabilize industrial unpaved roads carrying more than ten vehicle trips per day with the majority of those vehicles weighing 30 tons or more;
b. Enclose exterior belt conveyors sufficiently to cover the top and sides of the bulk material being transferred, or employ an alternate dust suppression system sufficient to prevent visible fugitive dust.
c. Manage or treat bulk material open storage piles sufficiently to prevent visible fugitive dust emissions. For purposes of this Rule, active watering during visible dusting episodes shall be sufficient to maintain compliance;
d. Cover loaded bulk material haul vehicles while traveling upon publicly maintained paved surfaces;
e. Employ a dust suppression system at bulk material transfer points sufficient to prevent visible fugitive dust;
f. Stabilize or eliminate bulk material open storage piles that have been or are expected to be inactive for at least one year;
g. Stabilize as much unpaved operations area as is feasible;
h. Vacuum sweep bulk material spills on paved surfaces weekly or more often, as needed;
i. Prevent facility-related bulk material trackout on publicly maintained paved surfaces;
j. Clean up facility-related bulk material trackout and spills on publicly maintained roads within twenty-four hours; and
k. Employ belt cleaners and/or conveyor return scrapers to minimize conveyor spillage.
- Rule 404 – Particulate Matter Concentration sets concentration limits based upon the flow rate
White Knob and White Ridge Quarries Expansion Air Quality and Greenhouse Gas Impact Assessment County of San Bernardino November 5, 2013
AQIA - 11613 - 11 Sespe Consulting, Inc.
of the discharge. The concentration limits would apply to discharge from a stack (e.g. baghouse).
- Rule 405 – Solid Particulate Matter Weight limits emissions based upon the weight of material processed.
- Rule 900 – New Source Performance Standards incorporates Federal regulation (40 CFR 60) which affects the construction of emissions units. Requirements may or may not apply depending upon the size, construction and manufacture date of equipment that will be used. Specifically, NSPS OOO (40 CFR 60.670) applies to equipment in non-metallic mineral processing plants.
- Regulation XIII – New Source Review contains a number of rules that are applied to new and modified sources.
- Rule 1520 – Control of Toxic Air Contaminants from Existing Sources implements AB 2588 Air Toxics Hot Spots requirements.
- Rule 2002 – General Federal Actions Conformity requires federal actions to conform to the applicable implementation plan.
3.2 Conformity
A project is conforming if it complies with all applicable District rules and regulations, complies with all proposed control measures that are not yet adopted from the applicable plan(s), and is consistent with the growth forecasts in the applicable plan(s) (or is directly included in the applicable plan). A project is non-conforming if it conflicts with or delays implementation of any applicable attainment or maintenance plan. Conformity with growth forecasts can be established by demonstrating that the project is consistent with the land use plan that was used to generate the growth forecast. An example of a non-conforming project would be one that increases the gross number of dwelling units, increases the number of trips, and/or increases the overall vehicle miles traveled in an affected area (relative to the applicable land use plan). Federal Conformity regulation (40CFR93) and MDAQMD Rule 2002 which mirrors the federal regulation were adopted in order to ensure that federal actions conform to the applicable implementation plan. Federal actions where the total of direct and indirect emissions in a nonattainment or maintenance area is less than specified rates would screen out of conformity analysis. As presented in Table 3, the western area of the MDAQMD where the Project is located is severe non-attainment for federal ozone, and moderate non-attainment for federal PM10
. On the basis of those attainment designations, the Project would screen-out of conformity analysis if:
- NOx and VOC emissions are less than 25 tons per year each;
- PM10
- Emissions are less than 10% of the non-attainment area emissions inventory.
emissions are less than 100 tons per year; and
3.3 Federal Land Managers’ Air Quality Related Values
The Federal Land Manager (FLM) and the Federal official with direct responsibility for management of Federal Class I parks and wilderness areas (i.e., Park Superintendent, Refuge Manager, Forest Supervisor) have an affirmative responsibility to protect the Air Quality Related Values (AQRVs)
White Knob and White Ridge Quarries Expansion Air Quality and Greenhouse Gas Impact Assessment County of San Bernardino November 5, 2013
AQIA - 11613 - 12 Sespe Consulting, Inc.
(including visibility) of such lands, and to consider whether a proposed project with emissions exceeding the “major” source thresholds will have an adverse impact on such values. The FLM’s decision regarding whether there is an adverse impact is then conveyed to the permitting authority for consideration in its determinations regarding the permit. The permitting authority’s determinations generally consider a wide range of factors, including the potential impact of the new source or major modification on the AQRVs of Class I areas, if applicable. At the request of both State permitting agencies and permit applicants, the FLMs formed the Federal Land Managers’ Air Quality Related Values Work Group (FLAG) to provide better consistency pertaining to their role in the review of new source permit applications near Federal Class I areas. The purpose of FLAG is twofold: (1) to develop a more consistent and objective approach for the FLMs to evaluate air pollution effects on public AQRVs in Class I areas, including a process to identify those resources and any potential adverse impacts, and (2) to provide state permitting authorities and potential permit applicants consistency on how to assess the impacts of new and existing sources on AQRVs in Class I areas. The FLMs are also concerned about resources in Class II parks and wilderness areas because they have other mandates to protect those areas as well. The information and procedures outlined in the FLAG Report are generally applicable to evaluating the effect of new or modified sources on the AQRVs in both Class I and Class II areas, including the evaluation of effects as part of Environmental Assessments and/or Environmental Impact Statements under the National Environmental Policy Act (NEPA). However, FLAG does not preclude more refined or regional analyses being performed under NEPA or other programs. The FLAG 2010 Phase I Report update recommends how to evaluate visibility, ozone phytotoxicity, and deposition impacts from new or modified sources. The FLAG Phase I Report recommends that an applicant apply the “Q/D test” for sources greater than 50 km from a Class I area to determine whether or not any further analysis is necessary. The Q/D test sums emissions of SO2, NOx, PM10, and H2SO4
(i.e. Q in tons per year) and then divides that total by the distance between the source and receptor (D in kilometers). Results equal to or less than 10 do not require further assessment (i.e. Q/D ≤ 10).
3.4 Health Risk
Toxic air contaminants (TACs) are pollutants listed by the State of California that pose acute, chronic, and/or cancer health risks to exposed individuals. Hazardous air pollutants (HAP) are pollutants listed by US EPA that pose acute, chronic, and/or cancer health risks to exposed individuals. The California Office of Environmental Health Hazard Assessment (OEHHA) is responsible for developing the scientific basis for listing and evaluation of health risk from TACs. CARB is responsible for quantifying TAC emissions and controlling TACs by promulgation and enforcement of air toxic control measures (ATCM). Assembly Bill 1807 (AB1807) passed in 1983 requires the state of California to identify and control TACs. TACs are formally identified through a detailed process which starts when a chemical’s risk to human health and the environment is above certain criteria. Once TACs are identified, the emission sources, controls, technologies and costs are reviewed to determine if regulation is needed to reduce emissions. In 1993, AB 1807 was amended by passage of Assembly Bill 2728 (AB 2728) which requires the State to list the 189 federal HAPs in the TAC list. In 1987, the AB 2588 air toxics “hot spots” program was established. This program requires subject
White Knob and White Ridge Quarries Expansion Air Quality and Greenhouse Gas Impact Assessment County of San Bernardino November 5, 2013
AQIA - 11613 - 13 Sespe Consulting, Inc.
facilities to report their air toxics emissions, determine localized health risks, and notify nearby residents for whom risk may exceed the notification level.1
The program was amended in 1992 to require facilities to reduce high risks (e.g. greater than 100 in 1 million cancer risk; or 10 hazard index) through the development of a risk management plan. The Hotspots Analysis and Reporting Program (HARP) is a software program that calculates TAC emission inventories and performs health risk assessments (HRA) for use in the AB 2588 Program.
The Off-Road Vehicle Regulation (13 CCR 2449) was adopted by the CARB in 2007 to reduce diesel particulate matter (PM) and oxides of nitrogen (NOx) emissions from in-use off-road heavy-duty diesel vehicles in California. The regulation was amended by the CARB in December 2010. Prior to that time, the regulation phased in from 2010 to 2020; but the December 2010 rulemaking pushed the start date back to 2014 and the date of final implementation back to 2024. In addition, until CARB receives a waiver from US EPA to regulate in-use off-road engines, the provisions that require further control are not enforceable. Registering fleets through the Diesel Off-road On-line Reporting System (DOORS), labeling equipment, idling limits and sale notification are requirements of the Off-Road Regulation that are still in effect. Regulatory Advisory 10-414 describes the enforcement delay and was last updated in May 2011. The On-Road Heavy Duty Diesel Vehicle (In-Use) Regulation (13 CCR 2025) was adopted in December 2010. The regulation requires diesel trucks and buses that operate in California to be upgraded to reduce emissions. Heavier trucks must be retrofitted with PM filters beginning January 1, 2012, and older trucks must be replaced starting January 1, 2015. By January 1, 2023, nearly all trucks and buses will need to have 2010 model year engines or equivalent. The regulation applies to nearly all privately and federally owned diesel fueled trucks and buses and to privately and publicly owned school buses with a gross vehicle weight rating (GVWR) greater than 14,000 pounds. Portable engines are regulated by an air toxic control measure (17 CCR 93116) that limits diesel particulate matter and may also be regulated by the Portable Equipment Registration Program (PERP) or local air district permit. In-use portable engines regulated by the ATCM begin phasing in controls to meet emissions reductions criteria on January 1 of 2013, 2017, and 2020. By 2020, in-use portable engines will have Tier 4 particulate emissions characteristics. The PERP program requires applications for new registrations are accepted only for engines that emit less than the interim Tier 4 standards. 3.5 Greenhouse Gas Regulations
On May 13, 2010 US EPA finalized the GHG Tailoring Rule (75 FR 31514, June 3, 2010). The Tailoring Rule sets major source emissions thresholds that define when federal operating permits under Prevention Significant Deterioration (PSD) or Title V are required. The Tailoring Rule establishes a threshold of 100,000 tpy of GHGs from new sources above which sources are considered major sources requiring a federal operating permit. Modification of an existing source that increases GHG emissions by an amount greater than 75,000 tpy is considered a major modification. CARB approved the AB 32 Scoping Plan at the Board hearing on December 12, 2008. The Scoping Plan contains the main strategies that California will use to reduce GHGs as required by AB 32. On August 24, 2011, the CARB Board approved the Final Supplement to the AB 32 Scoping Plan Functionally Equivalent
1 http://www.arb.ca.gov/ab2588/district_levels.htm
White Knob and White Ridge Quarries Expansion Air Quality and Greenhouse Gas Impact Assessment County of San Bernardino November 5, 2013
AQIA - 11613 - 14 Sespe Consulting, Inc.
Document which accounted for progress already made towards reducing statewide GHG emissions and the effect of the severe and prolonged economic downturn that occurred after 2006. Control measures contained in the Scoping Plan that may affect Project emissions include, but are not limited to: - Transportation Measures. These measures propose to reduce GHG’s from vehicles by making
vehicles more efficient, reducing the carbon content of the fuels, and reducing the vehicle miles traveled. Thus, vehicles would emit less GHG emissions in the future.
a. Light Duty Vehicle GHG Standard (T-1). This measure implements AB 1493 (Pavley) standards and planned second phase of the program. Align zero-emission vehicle, and alternative and renewable fuel and vehicle technology programs with long-term climate change goals.
b. Low Carbon Fuel Standard (T-2). This measure will reduce the carbon intensity of California's transportation fuels by at least ten percent (10%) by 2020. CARB had previously identified this measure as a Discrete Early Action item which will be implemented through a rulemaking by 2010.
c. Vehicle Efficiency Measures (T-4). This includes measures such as sustainable tire practices, properly inflating vehicle’s tires, and possibly fuel-efficient tire standards.
- Energy Measures. These measures propose that utility operators replace some fossil fuel electricity generation capacity with renewable sources and reinforces incentives that are offered by local governments to encourage the placement of solar panels on new and existing structures. The Renewables Portfolio Standard (RPS) increases renewables from 12% in the baseline year(s) to 20% in 2020. The Renewable Electricity Standard (RES) is a separate measure that requires 33% renewables by 2020. The RES is implemented by the California Energy and Public Utilities Commissions under SBX1-2, signed by Governor Brown in April 2011.
Senate Bill 375 (SB 375) “Transportation planning: travel demand models: sustainable communities strategy: environmental review” was signed by the Governor on September 30, 2008. SB 375 is most concerned with automobile and light truck traffic, but the goal of reducing GHGs covers all transportation sources based on the need for sustainable communities.
“each transportation planning agency … shall prepare and adopt a regional transportation plan directed at achieving a coordinated and balanced regional transportation system, including, but not limited to, mass transportation, highway, railroad, maritime, bicycle, pedestrian, goods movement
The regional transportation plan is to be an internally consistent document and include a sustainable communities strategy (SCS).
, and aviation facilities and services.” (Section 65080(a), underline added.)
“The sustainable communities strategy shall …(v) gather and consider the best practically available scientific information regarding resource areas and farmland in the region ….” (Section 65080(b)(2)(B)(v), underline added.)
White Knob and White Ridge Quarries Expansion Air Quality and Greenhouse Gas Impact Assessment County of San Bernardino November 5, 2013
AQIA - 11613 - 15 Sespe Consulting, Inc.
Resource areas include: “areas of the state designated by the State Mining and Geology Board as areas of statewide or regional significance pursuant to Section 2790 of the Public Resources Code, and lands under Williamson Act contracts.” (Section 65080.01(a)(4).)
Thus, SB 375 recognizes the limestone deposits as a regionally significant resource that requires special consideration in transportation and land use planning efforts. County of San Bernardino Climate Action Plan (CAP, September 2011) may affect sources that would be considered part of the Project. The CAP assesses “GHG emissions in two distinct ways: (1) through the exercise of its land use authority it can affect community/external emissions; (2) through its management of County government and facilities it can affect municipal/internal emissions. The External Inventory includes GHG emissions from land uses within the County’s unincorporated areas where the County has jurisdictional land use authority.” (CAP, Page 2-1). The Project is a land use within the unincorporated County area. The CAP Appendix F includes draft development review processes (DRP) that are presumably being implemented. The DRP procedures for evaluating GHG impacts and determining significance for CEQA purposes are streamlined by (1) applying a uniform set of performance standards to all development projects, and (2) utilizing Screening Tables to mitigate project GHG emissions. Projects have the option of preparing a project-specific technical analysis to quantify and mitigate GHG emissions. A review standard of 3,000 MTCO2
Development Review Process, including the use of performance standards, for assessing and mitigating
e per year is used to identify projects that require the use of Screening Tables or a project-specific technical analysis to quantify and mitigate project emissions. The complete
GHG emissions is paraphrased from CAP Appendix F in the text below.
a) County Performance Standards
. All development projects, including those otherwise determined to be exempt from CEQA are subject to applicable Development Code provisions, including the GHG performance standards, and state requirements, such as the California Building Code requirements for energy efficiency. With the application of the GHG performance standards, projects that are exempt from CEQA and small projects that do not exceed 3,000 MTCO2e per year are considered to be consistent with the Plan and determined to have a less than significant individual and cumulative impact for GHG emissions.
b) Regulatory Agency Performance Standards
. When, and if, South Coast Air Quality Management District or Mojave Basin Air Quality Management District adopts standards, the County will consider such guidance and incorporate all applicable standards.
c) Projects Using Screening Table. For projects exceeding 3,000 MTCO2
e per year of GHG emissions, the County uses Screening Tables as a tool to assist with calculating GHG reduction measures and the determination of a significance finding. Projects that garner a 100 or greater points would not require quantification of project specific GHG emissions. The point system was devised to ensure to Project compliance with the reduction measures in the GHG Plan such that the GHG emissions from new development, when considered together with those existing development, allow the County to meet its 2020 target and support reductions in GHG emissions beyond 2020. Consistent with the CEQA Guidelines, such projects are consistent with the Plan and therefore have a less than significant individual and cumulative impact for GHG emissions.
White Knob and White Ridge Quarries Expansion Air Quality and Greenhouse Gas Impact Assessment County of San Bernardino November 5, 2013
AQIA - 11613 - 16 Sespe Consulting, Inc.
d) Projects Not Using Screening Tables. Projects exceeding 3,000 MTY of GHG emissions that do not use the Screening Tables, are required to quantify project-specific GHG emissions and achieve the equivalent level of GHG emissions efficiency as a 100-point project. Consistent with the CEQA Guidelines, such projects are consistent with the Plan and therefore are determined to have a less than significant individual and cumulative impact for GHG emissions.
White Knob and White Ridge Quarries Expansion Air Quality and Greenhouse Gas Impact Assessment County of San Bernardino November 5, 2013
AQIA - 11613 - 17 Sespe Consulting, Inc.
With respect to Item b), an interim GHG significance threshold for projects where the SCAQMD is lead agency was adopted by that governing board December 5, 2008. Since the CAP was published in September 2011 it would appear that the 10,000 MTCO2
e per year screening criteria used for SCAQMD projects would have informed the CAP and therefore would not be considered applicable under Item b).
However, Item b) is triggered by publication of the CEQA and Federal Conformity Guidelines (MDAQMD, August 2011). The MDAQMD Guidelines were being prepared at the same time as the CAP and therefore could not have been considered in the CAP. The CEQA and Federal Conformity Guidelines contain a GHG significance threshold of 100,000 tons CO2
e per year. Item b) states “the County will consider such guidance and incorporate all applicable standards.” Clearly the MDAQMD standard is applicable since it is meant to be used for CEQA GHG impact analyses and therefore it should be incorporated.
The Project is not of a type that could use the screening tables to avoid further analysis under Item c). If such a project were to exceed the 3,000 MTCO2
e per year review standard, then it would need to “achieve the equivalent level of GHG emissions efficiency as a 100-point project…. Where a project does not use the screening tables, the project is required to quantify its unmitigated emissions and provide a 31 percent reduction of those emissions in order to be considered less than significant.” It appears that the CAP does not take into account the AB-32 Scoping Plan Functionally Equivalent Document (CARB, 2011) that reduces the amount of reductions needed to 16% below business as usual by 2020.
4.0 SIGNIFICANCE THRESHOLDS
Significance thresholds for evaluating potential air quality impacts associated with the Project were developed from Environmental Checklist Form (State CEQA Guidelines, Appendix G) and the MDAQMD Guidelines. The CEQA Checklist contains the following guidance for air quality impacts assessment:
Where available, the significance criteria established by the applicable air quality management or air pollution control district may be relied upon to make the following determinations. Would the project: a) Conflict with or obstruct implementation of the applicable air quality plan? b) Violate any air quality standard or contribute substantially to an existing or projected air
quality violation? c) Result in a cumulatively considerable net increase of any criteria pollutant for which the
project region is non-attainment under an applicable federal or state ambient air quality standard (including releasing emissions which exceed quantitative thresholds for ozone precursors)?
d) Expose sensitive receptors to substantial pollutant concentrations? e) Create objectionable odors affecting a substantial number of people?
MDAQMD Guidelines provide the following text which describes the significance criteria that have been established by that agency:
Any project is significant if it triggers or exceeds the most appropriate evaluation criteria. The
White Knob and White Ridge Quarries Expansion Air Quality and Greenhouse Gas Impact Assessment County of San Bernardino November 5, 2013
AQIA - 11613 - 18 Sespe Consulting, Inc.
District will clarify upon request which threshold is most appropriate for a given project; in general, the emissions comparison (criteria number 1) is sufficient: 1. Generates total emissions (direct and indirect) in excess of the thresholds given in [Table
5]; 2. Generates a violation of any ambient air quality standard when added to the local
background; 3. Does not conform with the applicable attainment or maintenance plan(s); 4. Exposes sensitive receptors to substantial pollutant concentrations, including those
resulting in a cancer risk greater than or equal to 10 in a million and/or a Hazard Index (HI) (non-cancerous) greater than or equal to 1.
A significant project must incorporate mitigation sufficient to reduce its impact to a level that is not significant. A project that cannot be mitigated to a level that is not significant must incorporate all feasible mitigation. Note that the emission thresholds are given as a daily value and an annual value, so that multi-phased project (such as project with a construction phase and a separate operational phase) with phases shorter than one year can be compared to the daily value.
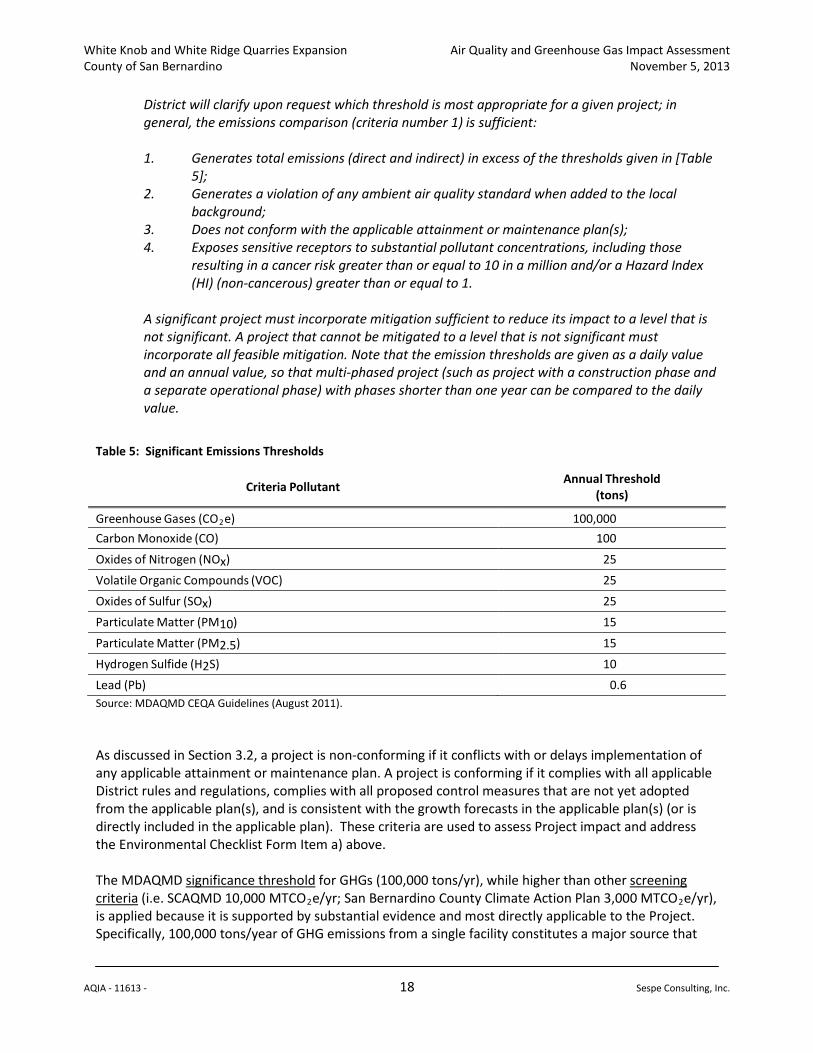
Table 5: Significant Emissions Thresholds
Criteria Pollutant Annual Threshold (tons)
Greenhouse Gases (CO2 100,000 e) Carbon Monoxide (CO) 100
Oxides of Nitrogen (NOx) 25 Volatile Organic Compounds (VOC) 25 Oxides of Sulfur (SOx) 25 Particulate Matter (PM10) 15
Particulate Matter (PM2.5) 15 Hydrogen Sulfide (H2S) 10 Lead (Pb) 0.6 Source: MDAQMD CEQA Guidelines (August 2011). As discussed in Section 3.2, a project is non-conforming if it conflicts with or delays implementation of any applicable attainment or maintenance plan. A project is conforming if it complies with all applicable District rules and regulations, complies with all proposed control measures that are not yet adopted from the applicable plan(s), and is consistent with the growth forecasts in the applicable plan(s) (or is directly included in the applicable plan). These criteria are used to assess Project impact and address the Environmental Checklist Form Item a) above. The MDAQMD significance threshold for GHGs (100,000 tons/yr), while higher than other screening criteria (i.e. SCAQMD 10,000 MTCO2e/yr; San Bernardino County Climate Action Plan 3,000 MTCO2e/yr), is applied because it is supported by substantial evidence and most directly applicable to the Project. Specifically, 100,000 tons/year of GHG emissions from a single facility constitutes a major source that
White Knob and White Ridge Quarries Expansion Air Quality and Greenhouse Gas Impact Assessment County of San Bernardino November 5, 2013
AQIA - 11613 - 19 Sespe Consulting, Inc.
requires a federal operating permit. Similarly, the MDAQMD NOx significance threshold of 25 tons/year is equal to the major source threshold applicable to areas designated severe non-attainment for ozone. MDAQMD states that, in general, emissions less than those listed in Table 5 will result in less than significant impact on air quality. Thus, regional impacts from a project that adds emissions to the air basin in quantities which are less than those listed in Table 5 would be less than cumulatively considerable. Consideration of thresholds in Table 5 addresses Items b) and c) from the Environmental Checklist Form. Localized impacts from stationary sources are not addressed by the values in Table 5. The Project’s modeled concentration of pollutants may not exceed the increment between the AAQS and background concentrations. For pollutants where background already exceeds the AAQS, Significant Impact Levels (SILs) published by SJVAPCD to the Dispersion and Risk Assessment Modelers Group list server (August 12, 2013) are used to evaluate the cumulative impact. Specifically, SJVAPCD guidance contains separate SILs for point and fugitive sources of PM10 and PM2.5. SILs are normally used in the context of PSD permitting and represent a de minimis threshold in attainment areas.2
For non-attainment areas any additional degradation would be significant and so this AQIA uses the SILs (i.e. de minimis level) as significance thresholds.
The increment and SIL methodologies address the Project impact as well as the cumulative impact on local concentrations satisfying Item b) and partially addressing Item d) in the Environmental Checklist Form. Health risk assessment is required to determine whether risk levels exceed the MDAQMD criteria (see Item 4 in the excerpt above) and address the remaining requirements of Item d) in the Environmental Checklist Form. The Project does not emit objectionable odors and so no threshold has been chosen to address Item e) in the Environmental Checklist Form. 5.0 ASSESSMENT METHODOLOGY
Emissions were estimated using methods and parameters from the Mineral Industry Emissions Inventory Guidance (Appendix F), AP-42, EMFAC2011, OFFROAD2011, and CalEEMod. Air dispersion/deposition modeling and health risk assessment were then performed to determine the potential for the Project to result in significant localized impacts. As discussed in Section 1.0, the Project is limited to expanding the White Knob and White Ridge Quarries areas but overall combined production from all quarries is limited by the processing plant maximum production rate. The Project would allow up to the maximum production rate to be extracted exclusively from the White Knob and White Ridge Quarries. This would result in no material being quarried at the Butterfield and Sentinel Quarries which is an indirect effect of the Project that necessitates calculation of Butterfield and Sentinel Quarries emissions in the baseline. 5.1 Baseline Activity Levels
Appendix F contains information that was provided by Omya. Table 6 presents baseline tonnages for
2 http://www.epa.gov/NSR/fs20070912.html
White Knob and White Ridge Quarries Expansion Air Quality and Greenhouse Gas Impact Assessment County of San Bernardino November 5, 2013
AQIA - 11613 - 20 Sespe Consulting, Inc.
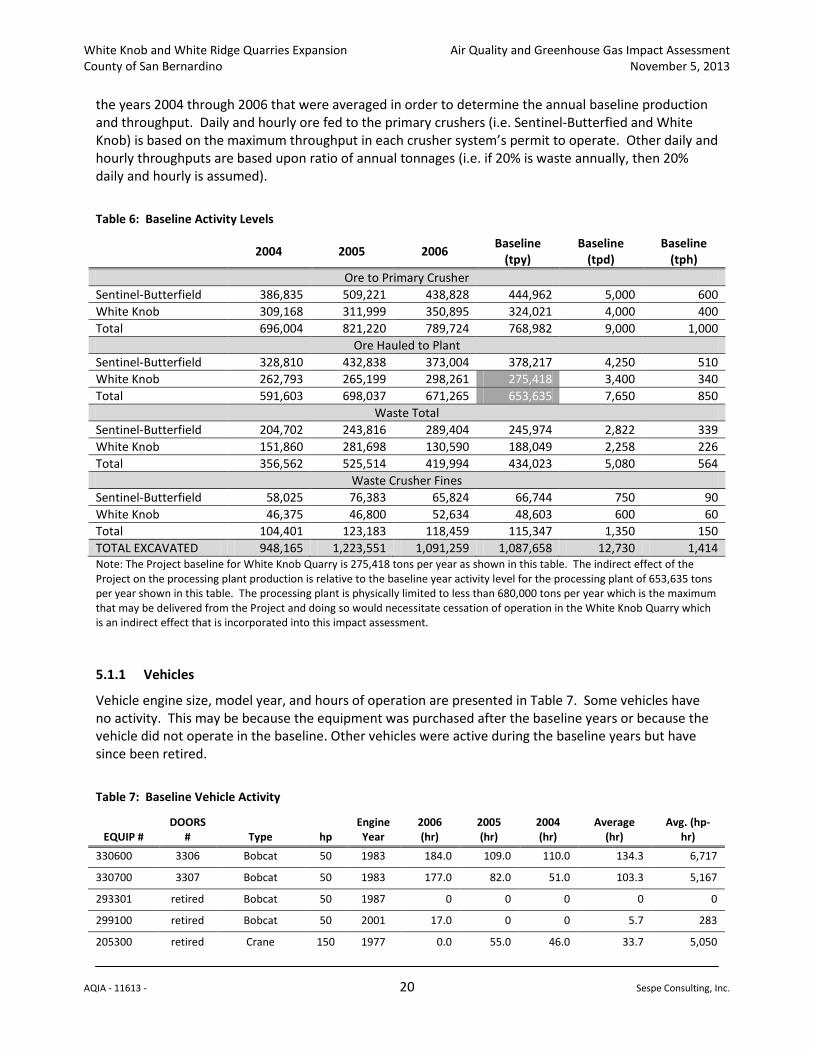
the years 2004 through 2006 that were averaged in order to determine the annual baseline production and throughput. Daily and hourly ore fed to the primary crushers (i.e. Sentinel-Butterfied and White Knob) is based on the maximum throughput in each crusher system’s permit to operate. Other daily and hourly throughputs are based upon ratio of annual tonnages (i.e. if 20% is waste annually, then 20% daily and hourly is assumed).
Table 6: Baseline Activity Levels
2004 2005 2006 Baseline (tpy)
Baseline (tpd)
Baseline (tph)
Ore to Primary Crusher Sentinel-Butterfield 386,835 509,221 438,828 444,962 5,000 600 White Knob 309,168 311,999 350,895 324,021 4,000 400 Total 696,004 821,220 789,724 768,982 9,000 1,000
Ore Hauled to Plant Sentinel-Butterfield 328,810 432,838 373,004 378,217 4,250 510 White Knob 262,793 265,199 298,261 275,418 3,400 340 Total 591,603 698,037 671,265 653,635 7,650 850
Waste Total Sentinel-Butterfield 204,702 243,816 289,404 245,974 2,822 339 White Knob 151,860 281,698 130,590 188,049 2,258 226 Total 356,562 525,514 419,994 434,023 5,080 564
Waste Crusher Fines Sentinel-Butterfield 58,025 76,383 65,824 66,744 750 90 White Knob 46,375 46,800 52,634 48,603 600 60 Total 104,401 123,183 118,459 115,347 1,350 150 TOTAL EXCAVATED 948,165 1,223,551 1,091,259 1,087,658 12,730 1,414 Note: The Project baseline for White Knob Quarry is 275,418 tons per year as shown in this table. The indirect effect of the Project on the processing plant production is relative to the baseline year activity level for the processing plant of 653,635 tons per year shown in this table. The processing plant is physically limited to less than 680,000 tons per year which is the maximum that may be delivered from the Project and doing so would necessitate cessation of operation in the White Knob Quarry which is an indirect effect that is incorporated into this impact assessment. 5.1.1 Vehicles
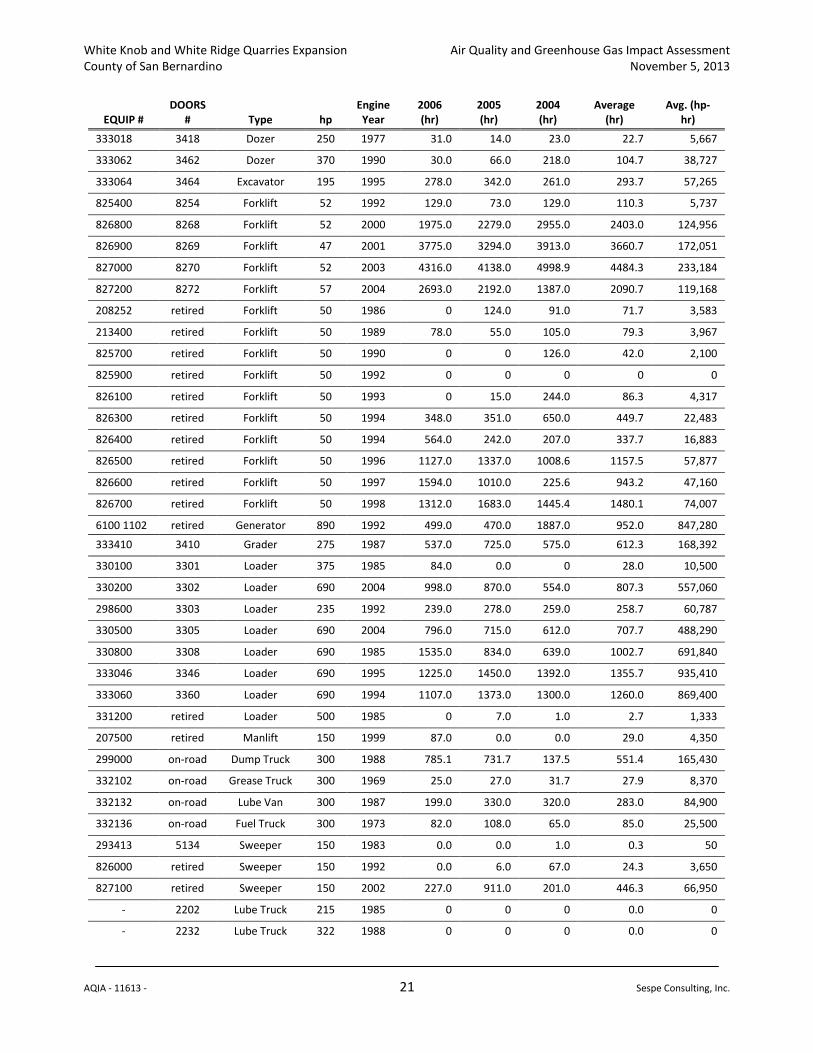
Vehicle engine size, model year, and hours of operation are presented in Table 7. Some vehicles have no activity. This may be because the equipment was purchased after the baseline years or because the vehicle did not operate in the baseline. Other vehicles were active during the baseline years but have since been retired.
Table 7: Baseline Vehicle Activity
EQUIP # DOORS
# Type hp Engine
Year 2006 (hr)
2005 (hr)
2004 (hr)
Average (hr)
Avg. (hp-hr)
330600 3306 Bobcat 50 1983 184.0 109.0 110.0 134.3 6,717
330700 3307 Bobcat 50 1983 177.0 82.0 51.0 103.3 5,167
293301 retired Bobcat 50 1987 0 0 0 0 0
299100 retired Bobcat 50 2001 17.0 0 0 5.7 283
205300 retired Crane 150 1977 0.0 55.0 46.0 33.7 5,050
White Knob and White Ridge Quarries Expansion Air Quality and Greenhouse Gas Impact Assessment County of San Bernardino November 5, 2013
AQIA - 11613 - 21 Sespe Consulting, Inc.
EQUIP # DOORS
# Type hp Engine
Year 2006 (hr)
2005 (hr)
2004 (hr)
Average (hr)
Avg. (hp-hr)
333018 3418 Dozer 250 1977 31.0 14.0 23.0 22.7 5,667
333062 3462 Dozer 370 1990 30.0 66.0 218.0 104.7 38,727
333064 3464 Excavator 195 1995 278.0 342.0 261.0 293.7 57,265
825400 8254 Forklift 52 1992 129.0 73.0 129.0 110.3 5,737
826800 8268 Forklift 52 2000 1975.0 2279.0 2955.0 2403.0 124,956
826900 8269 Forklift 47 2001 3775.0 3294.0 3913.0 3660.7 172,051
827000 8270 Forklift 52 2003 4316.0 4138.0 4998.9 4484.3 233,184
827200 8272 Forklift 57 2004 2693.0 2192.0 1387.0 2090.7 119,168
208252 retired Forklift 50 1986 0 124.0 91.0 71.7 3,583
213400 retired Forklift 50 1989 78.0 55.0 105.0 79.3 3,967
825700 retired Forklift 50 1990 0 0 126.0 42.0 2,100
825900 retired Forklift 50 1992 0 0 0 0 0
826100 retired Forklift 50 1993 0 15.0 244.0 86.3 4,317
826300 retired Forklift 50 1994 348.0 351.0 650.0 449.7 22,483
826400 retired Forklift 50 1994 564.0 242.0 207.0 337.7 16,883
826500 retired Forklift 50 1996 1127.0 1337.0 1008.6 1157.5 57,877
826600 retired Forklift 50 1997 1594.0 1010.0 225.6 943.2 47,160
826700 retired Forklift 50 1998 1312.0 1683.0 1445.4 1480.1 74,007
6100 1102 retired Generator 890 1992 499.0 470.0 1887.0 952.0 847,280
333410 3410 Grader 275 1987 537.0 725.0 575.0 612.3 168,392
330100 3301 Loader 375 1985 84.0 0.0 0 28.0 10,500
330200 3302 Loader 690 2004 998.0 870.0 554.0 807.3 557,060
298600 3303 Loader 235 1992 239.0 278.0 259.0 258.7 60,787
330500 3305 Loader 690 2004 796.0 715.0 612.0 707.7 488,290
330800 3308 Loader 690 1985 1535.0 834.0 639.0 1002.7 691,840
333046 3346 Loader 690 1995 1225.0 1450.0 1392.0 1355.7 935,410
333060 3360 Loader 690 1994 1107.0 1373.0 1300.0 1260.0 869,400
331200 retired Loader 500 1985 0 7.0 1.0 2.7 1,333
207500 retired Manlift 150 1999 87.0 0.0 0.0 29.0 4,350
299000 on-road Dump Truck 300 1988 785.1 731.7 137.5 551.4 165,430
332102 on-road Grease Truck 300 1969 25.0 27.0 31.7 27.9 8,370
332132 on-road Lube Van 300 1987 199.0 330.0 320.0 283.0 84,900
332136 on-road Fuel Truck 300 1973 82.0 108.0 65.0 85.0 25,500
293413 5134 Sweeper 150 1983 0.0 0.0 1.0 0.3 50
826000 retired Sweeper 150 1992 0.0 6.0 67.0 24.3 3,650
827100 retired Sweeper 150 2002 227.0 911.0 201.0 446.3 66,950
- 2202 Lube Truck 215 1985 0 0 0 0.0 0
- 2232 Lube Truck 322 1988 0 0 0 0.0 0
White Knob and White Ridge Quarries Expansion Air Quality and Greenhouse Gas Impact Assessment County of San Bernardino November 5, 2013
AQIA - 11613 - 22 Sespe Consulting, Inc.
EQUIP # DOORS
# Type hp Engine
Year 2006 (hr)
2005 (hr)
2004 (hr)
Average (hr)
Avg. (hp-hr)
- 2237 Fuel Truck 370 1994 0 0 0 0.0 0
- 2271 Guzzler 322 2001 0 0 0 0.0 0
- 2290 Dump Truck 425 1989 0 0 0 0.0 0
- 5171 Sweeper 52 2003 0 0 0 0.0 0
330900 3209 Truck 1050 1991 1310.0 1220.0 1386.0 1305.3 1,370,600
333411 3211 Truck 635 2006 739.0 600.0 477.0 605.3 384,387
331600 3216 Truck 938 2000 0 0 0 0.0 0
333251 3251 Truck 1050 1982 2435.0 2472.0 2367.0 2424.7 2,545,900
333252 3252 Truck 1050 2002 2466.0 2914.0 2666.0 2682.0 2,816,100
333053 3253 Truck 635 2004 597.0 1123.0 471.0 730.3 463,762
333254 3254 Truck 1050 2004 2380.0 2837.0 2059.0 2425.3 2,546,600
333255 3255 Truck 1050 2004 2549.0 3281.0 2357.0 2729.0 2,865,450
333256 3256 Truck 1050 1997 2768.0 1715.0 1334.0 1939.0 2,035,950
333257 3257 Truck 760 2000 1143.0 629.0 510.8 760.9 578,309
333091 3291 Truck 635 1992 984.0 1186.0 904.0 1024.7 650,663
333098 3298 Truck 635 1990 638.0 1063.0 418.0 706.3 448,522
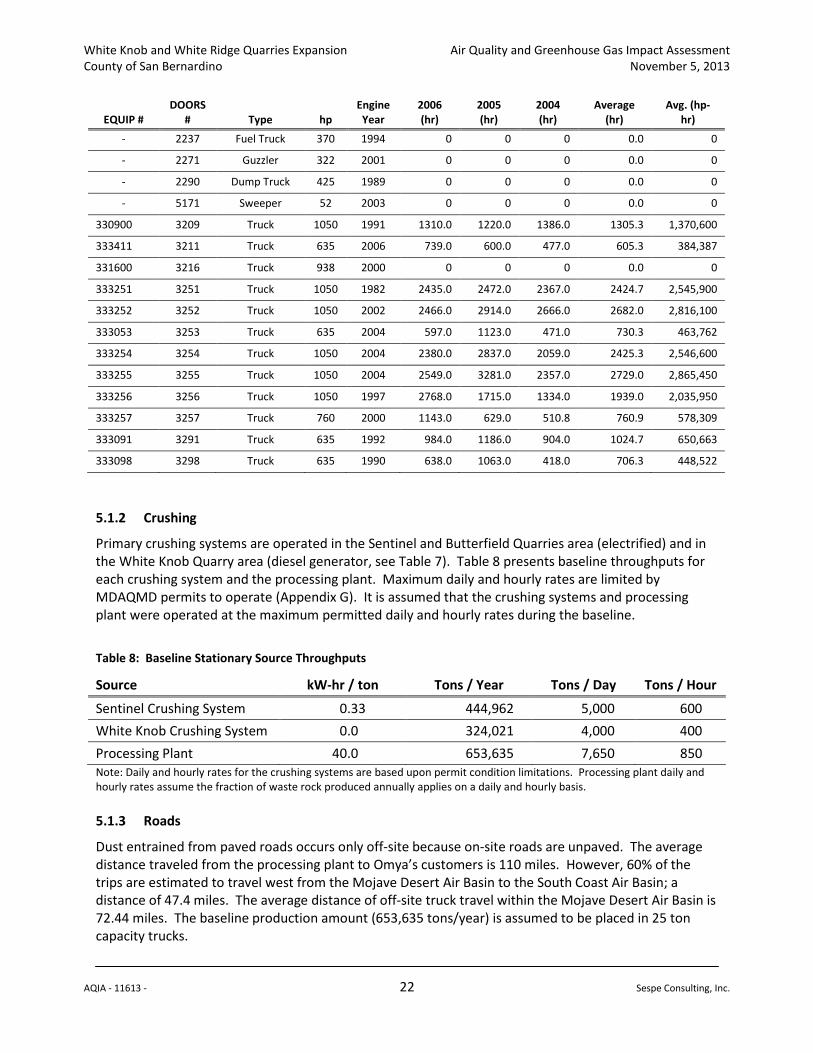
5.1.2 Crushing
Primary crushing systems are operated in the Sentinel and Butterfield Quarries area (electrified) and in the White Knob Quarry area (diesel generator, see Table 7). Table 8 presents baseline throughputs for each crushing system and the processing plant. Maximum daily and hourly rates are limited by MDAQMD permits to operate (Appendix G). It is assumed that the crushing systems and processing plant were operated at the maximum permitted daily and hourly rates during the baseline.
Table 8: Baseline Stationary Source Throughputs
Source kW-hr / ton Tons / Year Tons / Day Tons / Hour
Sentinel Crushing System 0.33 444,962 5,000 600 White Knob Crushing System 0.0 324,021 4,000 400 Processing Plant 40.0 653,635 7,650 850 Note: Daily and hourly rates for the crushing systems are based upon permit condition limitations. Processing plant daily and hourly rates assume the fraction of waste rock produced annually applies on a daily and hourly basis. 5.1.3 Roads
Dust entrained from paved roads occurs only off-site because on-site roads are unpaved. The average distance traveled from the processing plant to Omya’s customers is 110 miles. However, 60% of the trips are estimated to travel west from the Mojave Desert Air Basin to the South Coast Air Basin; a distance of 47.4 miles. The average distance of off-site truck travel within the Mojave Desert Air Basin is 72.44 miles. The baseline production amount (653,635 tons/year) is assumed to be placed in 25 ton capacity trucks.
White Knob and White Ridge Quarries Expansion Air Quality and Greenhouse Gas Impact Assessment County of San Bernardino November 5, 2013
AQIA - 11613 - 23 Sespe Consulting, Inc.
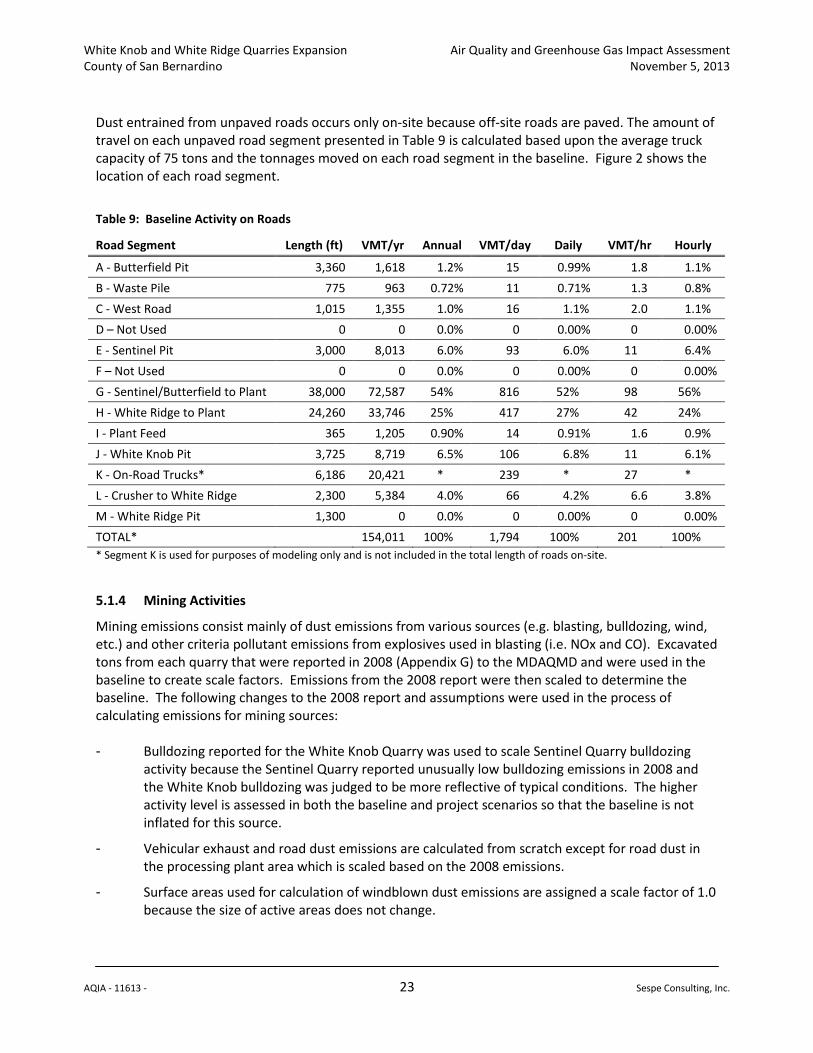
Dust entrained from unpaved roads occurs only on-site because off-site roads are paved. The amount of travel on each unpaved road segment presented in Table 9 is calculated based upon the average truck capacity of 75 tons and the tonnages moved on each road segment in the baseline. Figure 2 shows the location of each road segment.
Table 9: Baseline Activity on Roads
Road Segment Length (ft) VMT/yr Annual VMT/day Daily VMT/hr Hourly
A - Butterfield Pit 3,360 1,618 1.2% 15 0.99% 1.8 1.1% B - Waste Pile 775 963 0.72% 11 0.71% 1.3 0.8% C - West Road 1,015 1,355 1.0% 16 1.1% 2.0 1.1% D – Not Used 0 0 0.0% 0 0.00% 0 0.00% E - Sentinel Pit 3,000 8,013 6.0% 93 6.0% 11 6.4% F – Not Used 0 0 0.0% 0 0.00% 0 0.00% G - Sentinel/Butterfield to Plant 38,000 72,587 54% 816 52% 98 56% H - White Ridge to Plant 24,260 33,746 25% 417 27% 42 24% I - Plant Feed 365 1,205 0.90% 14 0.91% 1.6 0.9% J - White Knob Pit 3,725 8,719 6.5% 106 6.8% 11 6.1% K - On-Road Trucks* 6,186 20,421 * 239 * 27 * L - Crusher to White Ridge 2,300 5,384 4.0% 66 4.2% 6.6 3.8% M - White Ridge Pit 1,300 0 0.0% 0 0.00% 0 0.00% TOTAL* 154,011 100% 1,794 100% 201 100% * Segment K is used for purposes of modeling only and is not included in the total length of roads on-site. 5.1.4 Mining Activities
Mining emissions consist mainly of dust emissions from various sources (e.g. blasting, bulldozing, wind, etc.) and other criteria pollutant emissions from explosives used in blasting (i.e. NOx and CO). Excavated tons from each quarry that were reported in 2008 (Appendix G) to the MDAQMD and were used in the baseline to create scale factors. Emissions from the 2008 report were then scaled to determine the baseline. The following changes to the 2008 report and assumptions were used in the process of calculating emissions for mining sources: - Bulldozing reported for the White Knob Quarry was used to scale Sentinel Quarry bulldozing
activity because the Sentinel Quarry reported unusually low bulldozing emissions in 2008 and the White Knob bulldozing was judged to be more reflective of typical conditions. The higher activity level is assessed in both the baseline and project scenarios so that the baseline is not inflated for this source.
- Vehicular exhaust and road dust emissions are calculated from scratch except for road dust in the processing plant area which is scaled based on the 2008 emissions.
- Surface areas used for calculation of windblown dust emissions are assigned a scale factor of 1.0 because the size of active areas does not change.
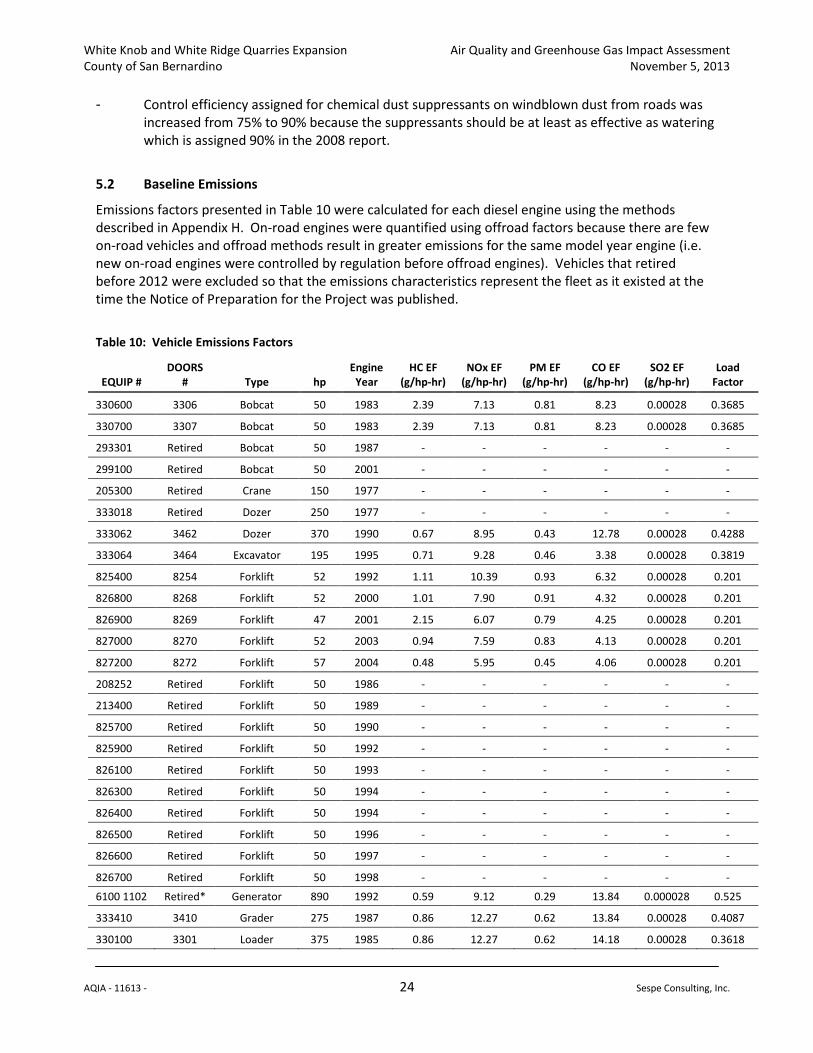
White Knob and White Ridge Quarries Expansion Air Quality and Greenhouse Gas Impact Assessment County of San Bernardino November 5, 2013
AQIA - 11613 - 24 Sespe Consulting, Inc.
- Control efficiency assigned for chemical dust suppressants on windblown dust from roads was increased from 75% to 90% because the suppressants should be at least as effective as watering which is assigned 90% in the 2008 report.
5.2 Baseline Emissions
Emissions factors presented in Table 10 were calculated for each diesel engine using the methods described in Appendix H. On-road engines were quantified using offroad factors because there are few on-road vehicles and offroad methods result in greater emissions for the same model year engine (i.e. new on-road engines were controlled by regulation before offroad engines). Vehicles that retired before 2012 were excluded so that the emissions characteristics represent the fleet as it existed at the time the Notice of Preparation for the Project was published.
Table 10: Vehicle Emissions Factors
EQUIP # DOORS
# Type hp Engine
Year HC EF
(g/hp-hr) NOx EF
(g/hp-hr) PM EF
(g/hp-hr) CO EF
(g/hp-hr) SO2 EF
(g/hp-hr) Load
Factor
330600 3306 Bobcat 50 1983 2.39 7.13 0.81 8.23 0.00028 0.3685
330700 3307 Bobcat 50 1983 2.39 7.13 0.81 8.23 0.00028 0.3685
293301 Retired Bobcat 50 1987 - - - - - -
299100 Retired Bobcat 50 2001 - - - - - -
205300 Retired Crane 150 1977 - - - - - -
333018 Retired Dozer 250 1977 - - - - - -
333062 3462 Dozer 370 1990 0.67 8.95 0.43 12.78 0.00028 0.4288
333064 3464 Excavator 195 1995 0.71 9.28 0.46 3.38 0.00028 0.3819
825400 8254 Forklift 52 1992 1.11 10.39 0.93 6.32 0.00028 0.201
826800 8268 Forklift 52 2000 1.01 7.90 0.91 4.32 0.00028 0.201
826900 8269 Forklift 47 2001 2.15 6.07 0.79 4.25 0.00028 0.201
827000 8270 Forklift 52 2003 0.94 7.59 0.83 4.13 0.00028 0.201
827200 8272 Forklift 57 2004 0.48 5.95 0.45 4.06 0.00028 0.201
208252 Retired Forklift 50 1986 - - - - - -
213400 Retired Forklift 50 1989 - - - - - -
825700 Retired Forklift 50 1990 - - - - - -
825900 Retired Forklift 50 1992 - - - - - -
826100 Retired Forklift 50 1993 - - - - - -
826300 Retired Forklift 50 1994 - - - - - -
826400 Retired Forklift 50 1994 - - - - - -
826500 Retired Forklift 50 1996 - - - - - -
826600 Retired Forklift 50 1997 - - - - - -
826700 Retired Forklift 50 1998 - - - - - -
6100 1102 Retired* Generator 890 1992 0.59 9.12 0.29 13.84 0.000028 0.525
333410 3410 Grader 275 1987 0.86 12.27 0.62 13.84 0.00028 0.4087
330100 3301 Loader 375 1985 0.86 12.27 0.62 14.18 0.00028 0.3618
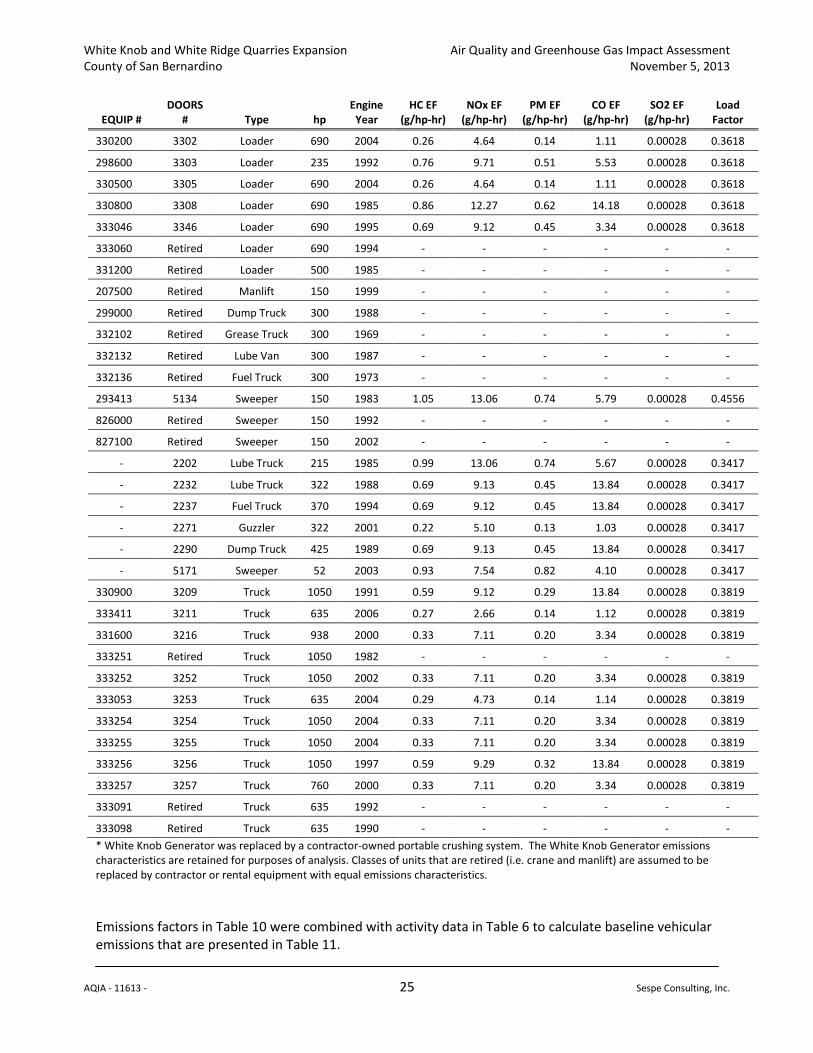
White Knob and White Ridge Quarries Expansion Air Quality and Greenhouse Gas Impact Assessment County of San Bernardino November 5, 2013
AQIA - 11613 - 25 Sespe Consulting, Inc.
EQUIP # DOORS
# Type hp Engine
Year HC EF
(g/hp-hr) NOx EF
(g/hp-hr) PM EF
(g/hp-hr) CO EF
(g/hp-hr) SO2 EF
(g/hp-hr) Load
Factor
330200 3302 Loader 690 2004 0.26 4.64 0.14 1.11 0.00028 0.3618
298600 3303 Loader 235 1992 0.76 9.71 0.51 5.53 0.00028 0.3618
330500 3305 Loader 690 2004 0.26 4.64 0.14 1.11 0.00028 0.3618
330800 3308 Loader 690 1985 0.86 12.27 0.62 14.18 0.00028 0.3618
333046 3346 Loader 690 1995 0.69 9.12 0.45 3.34 0.00028 0.3618
333060 Retired Loader 690 1994 - - - - - -
331200 Retired Loader 500 1985 - - - - - -
207500 Retired Manlift 150 1999 - - - - - -
299000 Retired Dump Truck 300 1988 - - - - - -
332102 Retired Grease Truck 300 1969 - - - - - -
332132 Retired Lube Van 300 1987 - - - - - -
332136 Retired Fuel Truck 300 1973 - - - - - -
293413 5134 Sweeper 150 1983 1.05 13.06 0.74 5.79 0.00028 0.4556
826000 Retired Sweeper 150 1992 - - - - - -
827100 Retired Sweeper 150 2002 - - - - - -
- 2202 Lube Truck 215 1985 0.99 13.06 0.74 5.67 0.00028 0.3417
- 2232 Lube Truck 322 1988 0.69 9.13 0.45 13.84 0.00028 0.3417
- 2237 Fuel Truck 370 1994 0.69 9.12 0.45 13.84 0.00028 0.3417
- 2271 Guzzler 322 2001 0.22 5.10 0.13 1.03 0.00028 0.3417
- 2290 Dump Truck 425 1989 0.69 9.13 0.45 13.84 0.00028 0.3417
- 5171 Sweeper 52 2003 0.93 7.54 0.82 4.10 0.00028 0.3417
330900 3209 Truck 1050 1991 0.59 9.12 0.29 13.84 0.00028 0.3819
333411 3211 Truck 635 2006 0.27 2.66 0.14 1.12 0.00028 0.3819
331600 3216 Truck 938 2000 0.33 7.11 0.20 3.34 0.00028 0.3819
333251 Retired Truck 1050 1982 - - - - - -
333252 3252 Truck 1050 2002 0.33 7.11 0.20 3.34 0.00028 0.3819
333053 3253 Truck 635 2004 0.29 4.73 0.14 1.14 0.00028 0.3819
333254 3254 Truck 1050 2004 0.33 7.11 0.20 3.34 0.00028 0.3819
333255 3255 Truck 1050 2004 0.33 7.11 0.20 3.34 0.00028 0.3819
333256 3256 Truck 1050 1997 0.59 9.29 0.32 13.84 0.00028 0.3819
333257 3257 Truck 760 2000 0.33 7.11 0.20 3.34 0.00028 0.3819
333091 Retired Truck 635 1992 - - - - - -
333098 Retired Truck 635 1990 - - - - - - * White Knob Generator was replaced by a contractor-owned portable crushing system. The White Knob Generator emissions characteristics are retained for purposes of analysis. Classes of units that are retired (i.e. crane and manlift) are assumed to be replaced by contractor or rental equipment with equal emissions characteristics. Emissions factors in Table 10 were combined with activity data in Table 6 to calculate baseline vehicular emissions that are presented in Table 11.
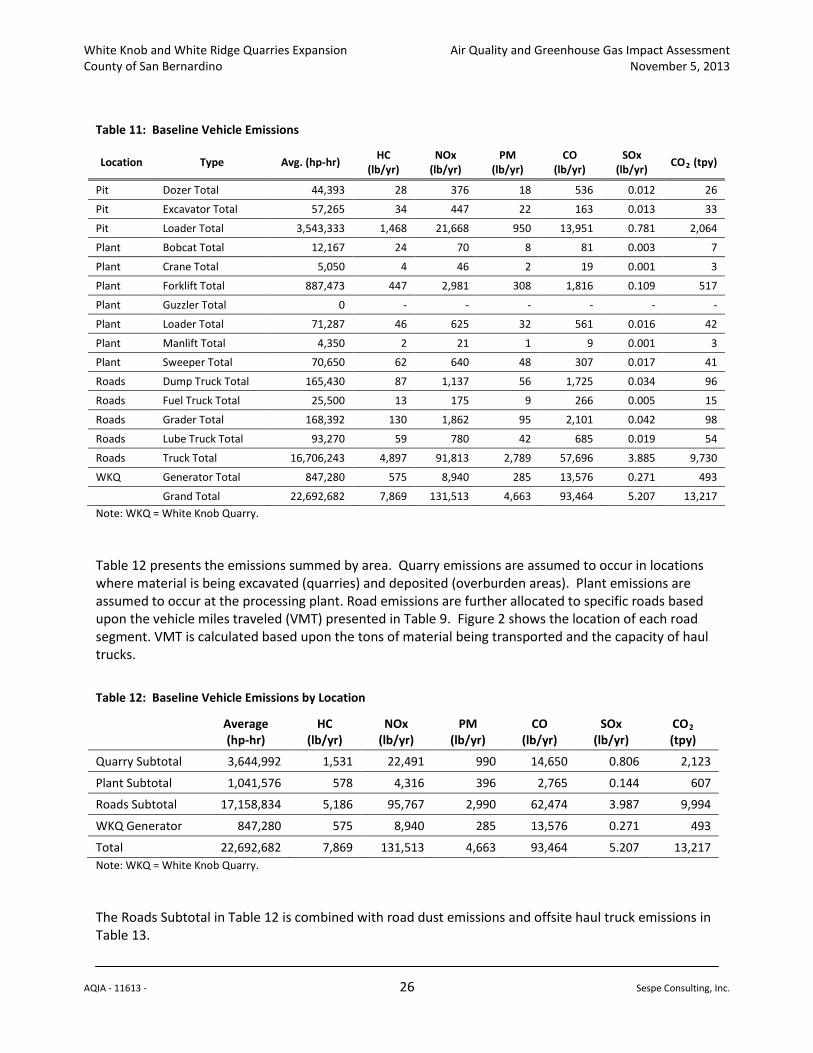
White Knob and White Ridge Quarries Expansion Air Quality and Greenhouse Gas Impact Assessment County of San Bernardino November 5, 2013
AQIA - 11613 - 26 Sespe Consulting, Inc.
Table 11: Baseline Vehicle Emissions
Location Type Avg. (hp-hr) HC (lb/yr)
NOx (lb/yr)
PM (lb/yr)
CO (lb/yr)
SOx (lb/yr) CO2
Pit
(tpy)
Dozer Total 44,393 28 376 18 536 0.012 26
Pit Excavator Total 57,265 34 447 22 163 0.013 33
Pit Loader Total 3,543,333 1,468 21,668 950 13,951 0.781 2,064
Plant Bobcat Total 12,167 24 70 8 81 0.003 7
Plant Crane Total 5,050 4 46 2 19 0.001 3
Plant Forklift Total 887,473 447 2,981 308 1,816 0.109 517
Plant Guzzler Total 0 - - - - - -
Plant Loader Total 71,287 46 625 32 561 0.016 42
Plant Manlift Total 4,350 2 21 1 9 0.001 3
Plant Sweeper Total 70,650 62 640 48 307 0.017 41
Roads Dump Truck Total 165,430 87 1,137 56 1,725 0.034 96
Roads Fuel Truck Total 25,500 13 175 9 266 0.005 15
Roads Grader Total 168,392 130 1,862 95 2,101 0.042 98
Roads Lube Truck Total 93,270 59 780 42 685 0.019 54
Roads Truck Total 16,706,243 4,897 91,813 2,789 57,696 3.885 9,730
WKQ Generator Total 847,280 575 8,940 285 13,576 0.271 493
Grand Total 22,692,682 7,869 131,513 4,663 93,464 5.207 13,217 Note: WKQ = White Knob Quarry. Table 12 presents the emissions summed by area. Quarry emissions are assumed to occur in locations where material is being excavated (quarries) and deposited (overburden areas). Plant emissions are assumed to occur at the processing plant. Road emissions are further allocated to specific roads based upon the vehicle miles traveled (VMT) presented in Table 9. Figure 2 shows the location of each road segment. VMT is calculated based upon the tons of material being transported and the capacity of haul trucks.
Table 12: Baseline Vehicle Emissions by Location
Average (hp-hr)
HC (lb/yr)
NOx (lb/yr)
PM (lb/yr)
CO (lb/yr)
SOx (lb/yr)
CO(tpy)
2
Quarry Subtotal 3,644,992 1,531 22,491 990 14,650 0.806 2,123
Plant Subtotal 1,041,576 578 4,316 396 2,765 0.144 607
Roads Subtotal 17,158,834 5,186 95,767 2,990 62,474 3.987 9,994
WKQ Generator 847,280 575 8,940 285 13,576 0.271 493
Total 22,692,682 7,869 131,513 4,663 93,464 5.207 13,217 Note: WKQ = White Knob Quarry. The Roads Subtotal in Table 12 is combined with road dust emissions and offsite haul truck emissions in Table 13.
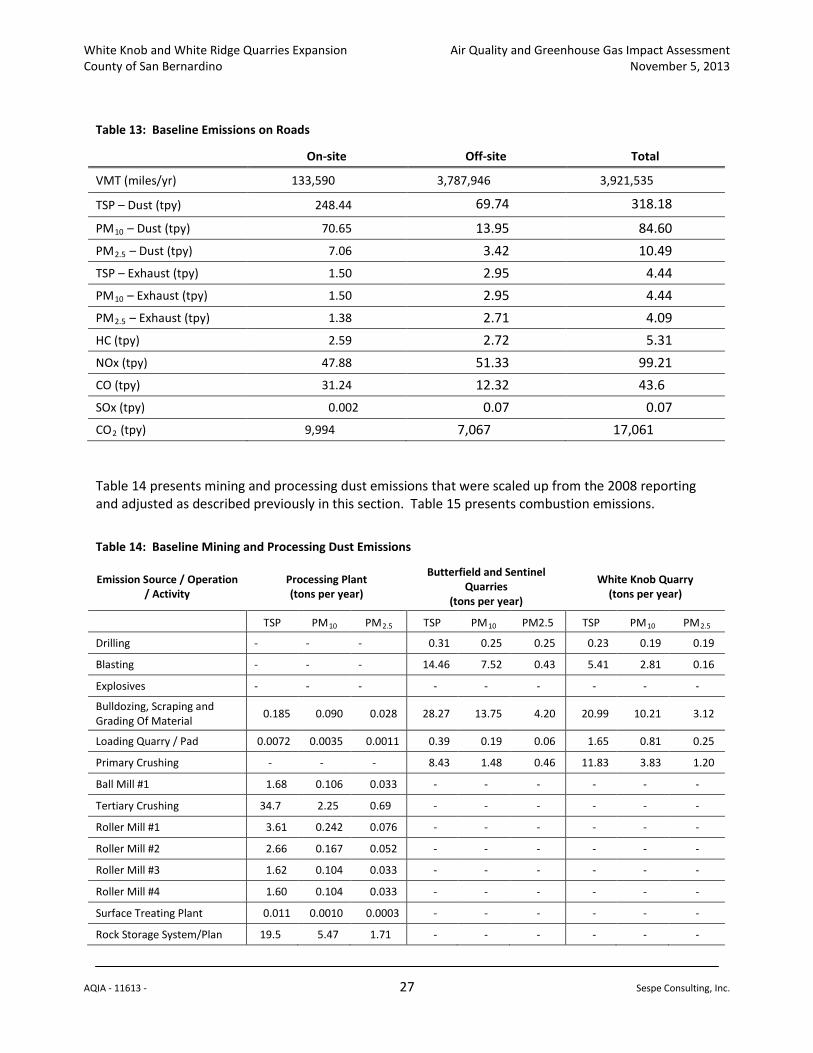
White Knob and White Ridge Quarries Expansion Air Quality and Greenhouse Gas Impact Assessment County of San Bernardino November 5, 2013
AQIA - 11613 - 27 Sespe Consulting, Inc.
Table 13: Baseline Emissions on Roads
On-site Off-site Total
VMT (miles/yr) 133,590 3,787,946 3,921,535
TSP – Dust (tpy) 248.44 69.74 318.18
PM10 70.65 – Dust (tpy) 13.95 84.60 PM2.5 7.06 – Dust (tpy) 3.42 10.49 TSP – Exhaust (tpy) 1.50 2.95 4.44 PM10 1.50 – Exhaust (tpy) 2.95 4.44 PM2.5 1.38 – Exhaust (tpy) 2.71 4.09 HC (tpy) 2.59 2.72 5.31 NOx (tpy) 47.88 51.33 99.21 CO (tpy) 31.24 12.32 43.6 SOx (tpy) 0.002 0.07 0.07 CO2 9,994 (tpy) 7,067 17,061 Table 14 presents mining and processing dust emissions that were scaled up from the 2008 reporting and adjusted as described previously in this section. Table 15 presents combustion emissions.
Table 14: Baseline Mining and Processing Dust Emissions
Emission Source / Operation / Activity
Processing Plant (tons per year)
Butterfield and Sentinel Quarries
(tons per year)
White Knob Quarry (tons per year)
- TSP PM PM10 TSP 2.5 PM PM2.5 10 TSP PM PM10
Drilling 2.5
- - - 0.31 0.25 0.25 0.23 0.19 0.19
Blasting - - - 14.46 7.52 0.43 5.41 2.81 0.16
Explosives - - - - - - - - -
Bulldozing, Scraping and Grading Of Material 0.185 0.090 0.028 28.27 13.75 4.20 20.99 10.21 3.12
Loading Quarry / Pad 0.0072 0.0035 0.0011 0.39 0.19 0.06 1.65 0.81 0.25
Primary Crushing - - - 8.43 1.48 0.46 11.83 3.83 1.20
Ball Mill #1 1.68 0.106 0.033 - - - - - -
Tertiary Crushing 34.7 2.25 0.69 - - - - - -
Roller Mill #1 3.61 0.242 0.076 - - - - - -
Roller Mill #2 2.66 0.167 0.052 - - - - - -
Roller Mill #3 1.62 0.104 0.033 - - - - - -
Roller Mill #4 1.60 0.104 0.033 - - - - - -
Surface Treating Plant 0.011 0.0010 0.0003 - - - - - -
Rock Storage System/Plan 19.5 5.47 1.71 - - - - - -
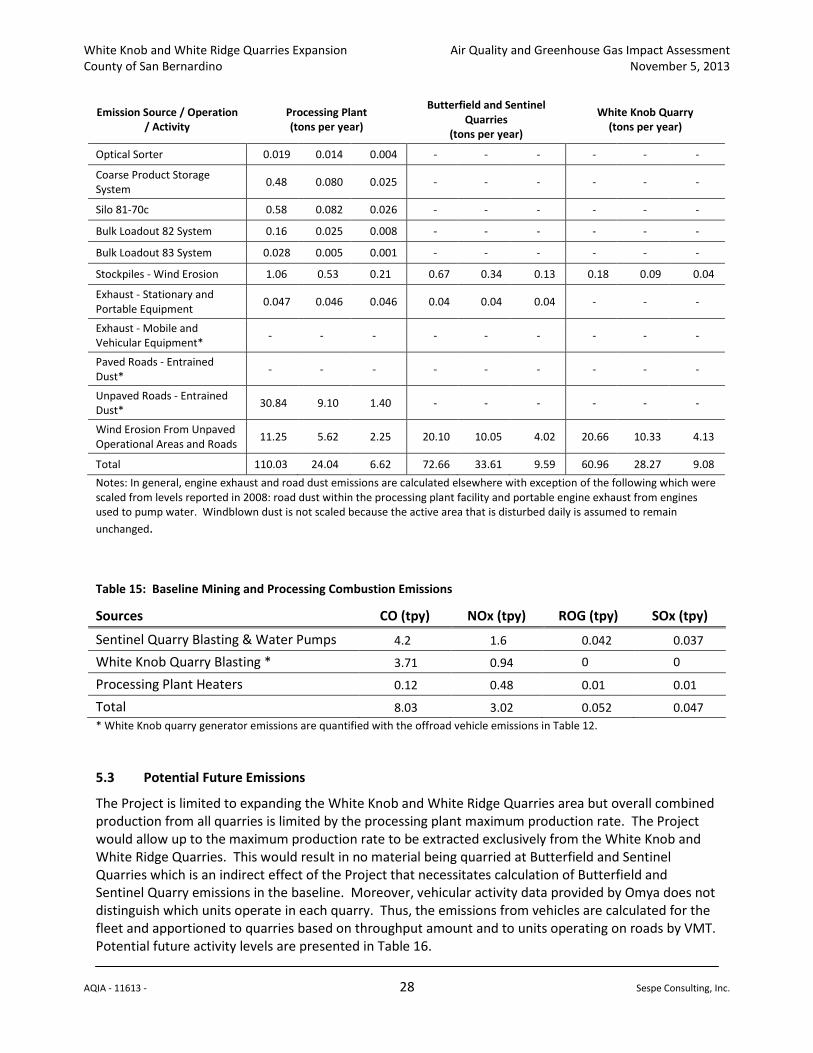
White Knob and White Ridge Quarries Expansion Air Quality and Greenhouse Gas Impact Assessment County of San Bernardino November 5, 2013
AQIA - 11613 - 28 Sespe Consulting, Inc.
Emission Source / Operation / Activity
Processing Plant (tons per year)
Butterfield and Sentinel Quarries
(tons per year)
White Knob Quarry (tons per year)
Optical Sorter 0.019 0.014 0.004 - - - - - -
Coarse Product Storage System 0.48 0.080 0.025 - - - - - -
Silo 81-70c 0.58 0.082 0.026 - - - - - -
Bulk Loadout 82 System 0.16 0.025 0.008 - - - - - -
Bulk Loadout 83 System 0.028 0.005 0.001 - - - - - -
Stockpiles - Wind Erosion 1.06 0.53 0.21 0.67 0.34 0.13 0.18 0.09 0.04
Exhaust - Stationary and Portable Equipment 0.047 0.046 0.046 0.04 0.04 0.04 - - -
Exhaust - Mobile and Vehicular Equipment* - - - - - - - - -
Paved Roads - Entrained Dust* - - - - - - - - -
Unpaved Roads - Entrained Dust* 30.84 9.10 1.40 - - - - - -
Wind Erosion From Unpaved Operational Areas and Roads 11.25 5.62 2.25 20.10 10.05 4.02 20.66 10.33 4.13
Total 110.03 24.04 6.62 72.66 33.61 9.59 60.96 28.27 9.08 Notes: In general, engine exhaust and road dust emissions are calculated elsewhere with exception of the following which were scaled from levels reported in 2008: road dust within the processing plant facility and portable engine exhaust from engines used to pump water. Windblown dust is not scaled because the active area that is disturbed daily is assumed to remain unchanged.
Table 15: Baseline Mining and Processing Combustion Emissions
Sources CO (tpy) NOx (tpy) ROG (tpy) SOx (tpy)
Sentinel Quarry Blasting & Water Pumps 4.2 1.6 0.042 0.037
White Knob Quarry Blasting * 3.71 0.94 0 0
Processing Plant Heaters 0.12 0.48 0.01 0.01
Total 8.03 3.02 0.052 0.047 * White Knob quarry generator emissions are quantified with the offroad vehicle emissions in Table 12. 5.3 Potential Future Emissions
The Project is limited to expanding the White Knob and White Ridge Quarries area but overall combined production from all quarries is limited by the processing plant maximum production rate. The Project would allow up to the maximum production rate to be extracted exclusively from the White Knob and White Ridge Quarries. This would result in no material being quarried at Butterfield and Sentinel Quarries which is an indirect effect of the Project that necessitates calculation of Butterfield and Sentinel Quarry emissions in the baseline. Moreover, vehicular activity data provided by Omya does not distinguish which units operate in each quarry. Thus, the emissions from vehicles are calculated for the fleet and apportioned to quarries based on throughput amount and to units operating on roads by VMT. Potential future activity levels are presented in Table 16.
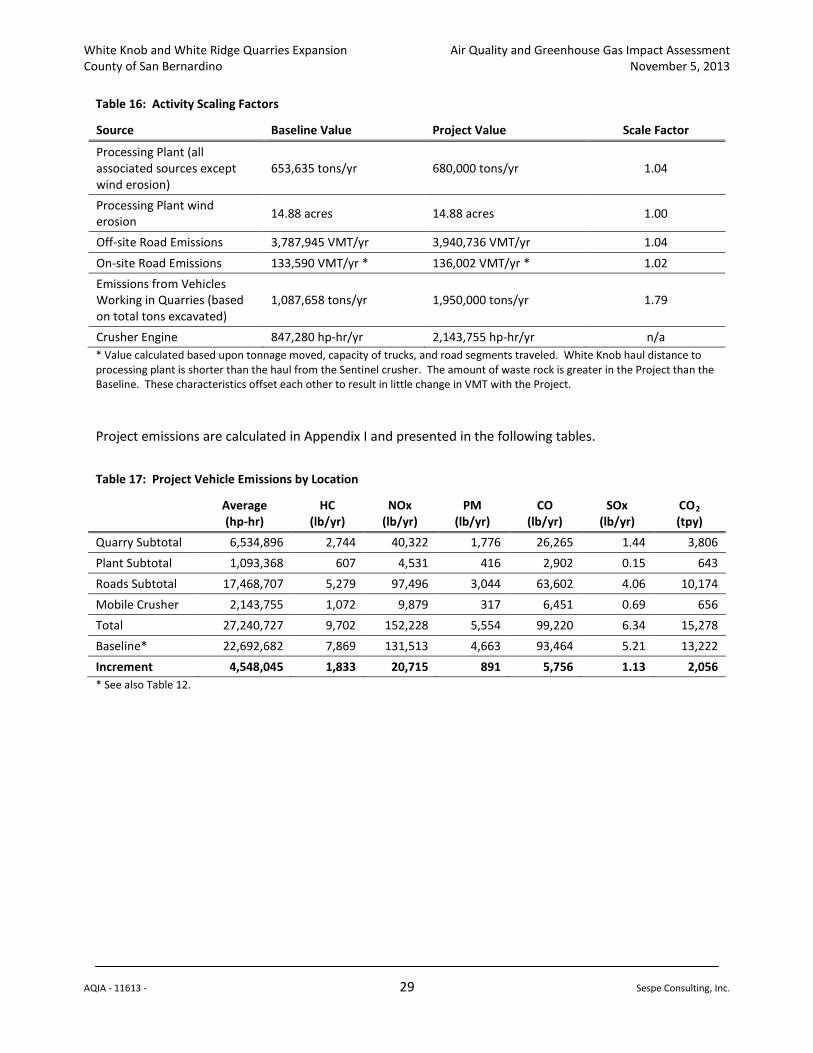
White Knob and White Ridge Quarries Expansion Air Quality and Greenhouse Gas Impact Assessment County of San Bernardino November 5, 2013
AQIA - 11613 - 29 Sespe Consulting, Inc.
Table 16: Activity Scaling Factors
Source Baseline Value Project Value Scale Factor
Processing Plant (all associated sources except wind erosion)
653,635 tons/yr 680,000 tons/yr 1.04
Processing Plant wind erosion 14.88 acres 14.88 acres 1.00
Off-site Road Emissions 3,787,945 VMT/yr 3,940,736 VMT/yr 1.04 On-site Road Emissions 133,590 VMT/yr * 136,002 VMT/yr * 1.02 Emissions from Vehicles Working in Quarries (based on total tons excavated)
1,087,658 tons/yr 1,950,000 tons/yr 1.79
Crusher Engine 847,280 hp-hr/yr 2,143,755 hp-hr/yr n/a * Value calculated based upon tonnage moved, capacity of trucks, and road segments traveled. White Knob haul distance to processing plant is shorter than the haul from the Sentinel crusher. The amount of waste rock is greater in the Project than the Baseline. These characteristics offset each other to result in little change in VMT with the Project. Project emissions are calculated in Appendix I and presented in the following tables.
Table 17: Project Vehicle Emissions by Location
Average (hp-hr)
HC (lb/yr)
NOx (lb/yr)
PM (lb/yr)
CO (lb/yr)
SOx (lb/yr)
CO(tpy)
2
Quarry Subtotal 6,534,896 2,744 40,322 1,776 26,265 1.44 3,806 Plant Subtotal 1,093,368 607 4,531 416 2,902 0.15 643 Roads Subtotal 17,468,707 5,279 97,496 3,044 63,602 4.06 10,174 Mobile Crusher 2,143,755 1,072 9,879 317 6,451 0.69 656 Total 27,240,727 9,702 152,228 5,554 99,220 6.34 15,278 Baseline* 22,692,682 7,869 131,513 4,663 93,464 5.21 13,222 Increment 4,548,045 1,833 20,715 891 5,756 1.13 2,056 * See also Table 12.
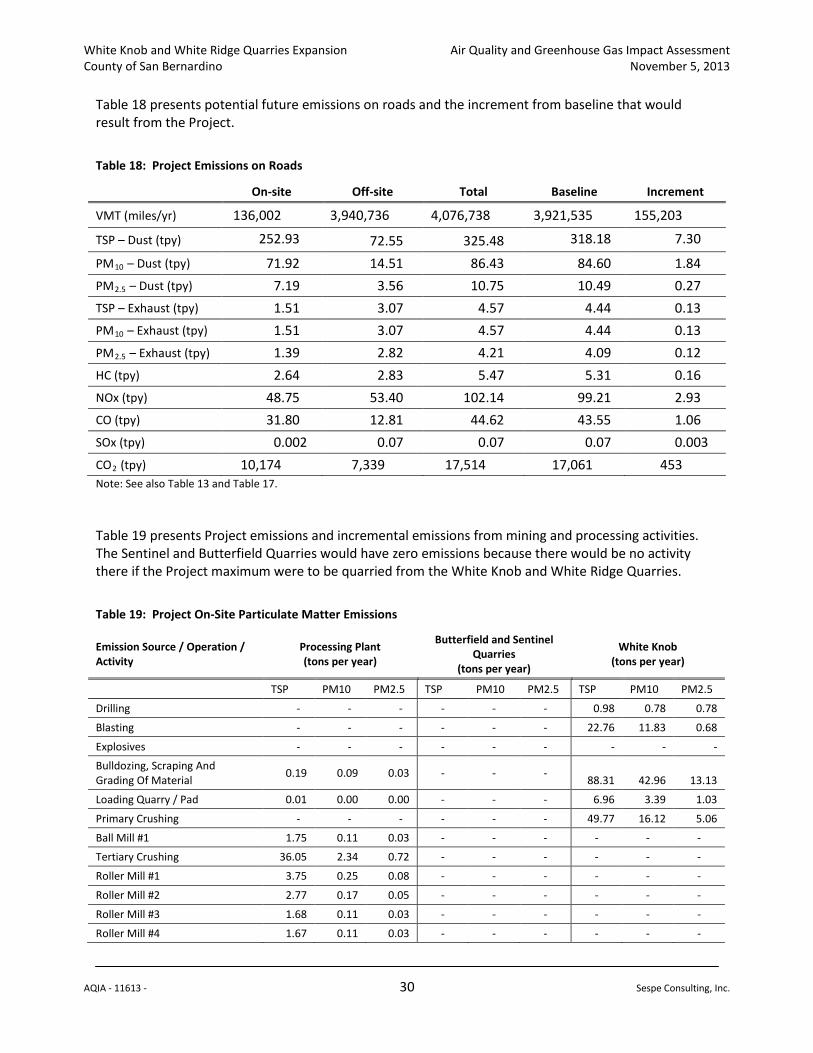
White Knob and White Ridge Quarries Expansion Air Quality and Greenhouse Gas Impact Assessment County of San Bernardino November 5, 2013
AQIA - 11613 - 30 Sespe Consulting, Inc.
Table 18 presents potential future emissions on roads and the increment from baseline that would result from the Project.
Table 18: Project Emissions on Roads
On-site Off-site Total Baseline Increment
VMT (miles/yr) 136,002 3,940,736 4,076,738 3,921,535 155,203
TSP – Dust (tpy) 252.93 72.55 325.48 318.18 7.30
PM10 71.92 – Dust (tpy) 14.51 86.43 84.60 1.84 PM2.5 7.19 – Dust (tpy) 3.56 10.75 10.49 0.27 TSP – Exhaust (tpy) 1.51 3.07 4.57 4.44 0.13 PM10 1.51 – Exhaust (tpy) 3.07 4.57 4.44 0.13 PM2.5 1.39 – Exhaust (tpy) 2.82 4.21 4.09 0.12 HC (tpy) 2.64 2.83 5.47 5.31 0.16 NOx (tpy) 48.75 53.40 102.14 99.21 2.93 CO (tpy) 31.80 12.81 44.62 43.55 1.06 SOx (tpy) 0.002 0.07 0.07 0.07 0.003 CO2 10,174 (tpy) 7,339 17,514 17,061 453 Note: See also Table 13 and Table 17. Table 19 presents Project emissions and incremental emissions from mining and processing activities. The Sentinel and Butterfield Quarries would have zero emissions because there would be no activity there if the Project maximum were to be quarried from the White Knob and White Ridge Quarries.
Table 19: Project On-Site Particulate Matter Emissions
Emission Source / Operation / Activity
Processing Plant (tons per year)
Butterfield and Sentinel Quarries
(tons per year)
White Knob (tons per year)
- TSP PM10 PM2.5 TSP PM10 PM2.5 TSP PM10 PM2.5
Drilling - - - - - - 0.98 0.78 0.78
Blasting - - - - - - 22.76 11.83 0.68
Explosives - - - - - - - - -
Bulldozing, Scraping And Grading Of Material 0.19 0.09 0.03 - - - 88.31 42.96 13.13
Loading Quarry / Pad 0.01 0.00 0.00 - - - 6.96 3.39 1.03
Primary Crushing - - - - - - 49.77 16.12 5.06
Ball Mill #1 1.75 0.11 0.03 - - - - - -
Tertiary Crushing 36.05 2.34 0.72 - - - - - -
Roller Mill #1 3.75 0.25 0.08 - - - - - -
Roller Mill #2 2.77 0.17 0.05 - - - - - -
Roller Mill #3 1.68 0.11 0.03 - - - - - -
Roller Mill #4 1.67 0.11 0.03 - - - - - -
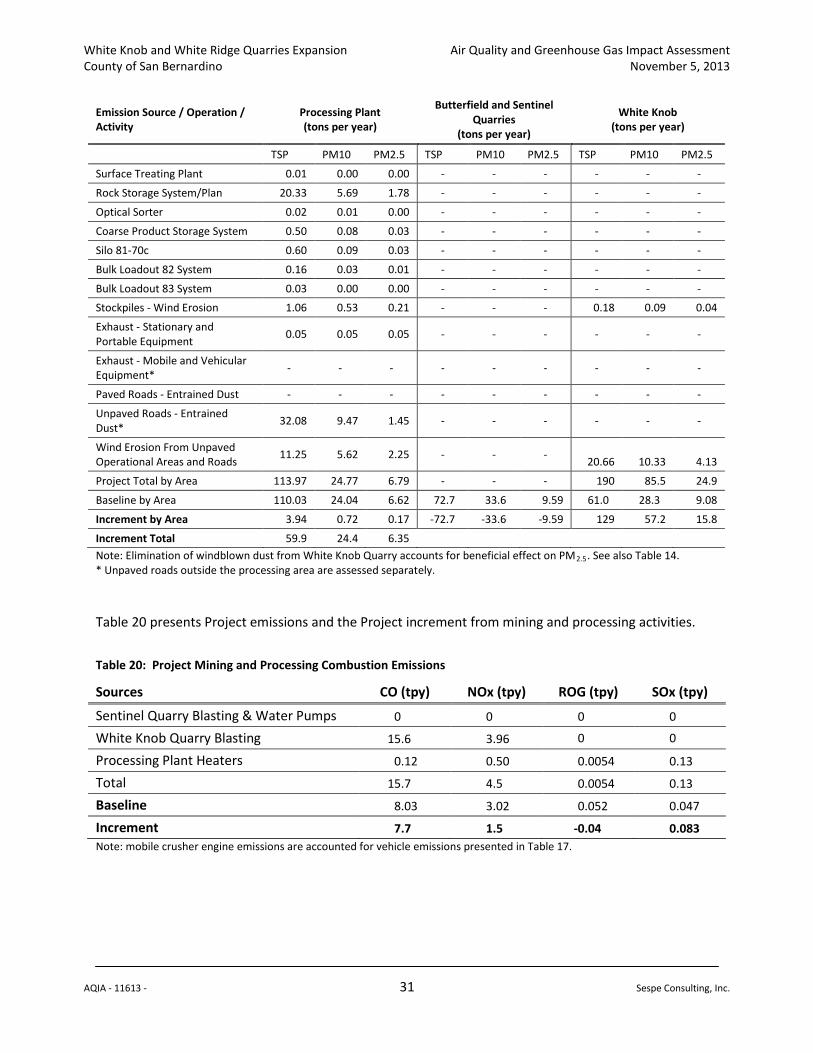
White Knob and White Ridge Quarries Expansion Air Quality and Greenhouse Gas Impact Assessment County of San Bernardino November 5, 2013
AQIA - 11613 - 31 Sespe Consulting, Inc.
Emission Source / Operation / Activity
Processing Plant (tons per year)
Butterfield and Sentinel Quarries
(tons per year)
White Knob (tons per year)
- TSP PM10 PM2.5 TSP PM10 PM2.5 TSP PM10 PM2.5
Surface Treating Plant 0.01 0.00 0.00 - - - - - -
Rock Storage System/Plan 20.33 5.69 1.78 - - - - - -
Optical Sorter 0.02 0.01 0.00 - - - - - -
Coarse Product Storage System 0.50 0.08 0.03 - - - - - -
Silo 81-70c 0.60 0.09 0.03 - - - - - -
Bulk Loadout 82 System 0.16 0.03 0.01 - - - - - -
Bulk Loadout 83 System 0.03 0.00 0.00 - - - - - -
Stockpiles - Wind Erosion 1.06 0.53 0.21 - - - 0.18 0.09 0.04
Exhaust - Stationary and Portable Equipment 0.05 0.05 0.05 - - - - - -
Exhaust - Mobile and Vehicular Equipment* - - - - - - - - -
Paved Roads - Entrained Dust - - - - - - - - -
Unpaved Roads - Entrained Dust* 32.08 9.47 1.45 - - - - - -
Wind Erosion From Unpaved Operational Areas and Roads 11.25 5.62 2.25 - - - 20.66 10.33 4.13
Project Total by Area 113.97 24.77 6.79 - - - 190 85.5 24.9
Baseline by Area 110.03 24.04 6.62 72.7 33.6 9.59 61.0 28.3 9.08
Increment by Area 3.94 0.72 0.17 -72.7 -33.6 -9.59 129 57.2 15.8
Increment Total 59.9 24.4 6.35 Note: Elimination of windblown dust from White Knob Quarry accounts for beneficial effect on PM2.5 Table 14. See also . * Unpaved roads outside the processing area are assessed separately. Table 20 presents Project emissions and the Project increment from mining and processing activities.
Table 20: Project Mining and Processing Combustion Emissions
Sources CO (tpy) NOx (tpy) ROG (tpy) SOx (tpy)
Sentinel Quarry Blasting & Water Pumps 0 0 0 0
White Knob Quarry Blasting 15.6 3.96 0 0
Processing Plant Heaters 0.12 0.50 0.0054 0.13
Total 15.7 4.5 0.0054 0.13
Baseline 8.03 3.02 0.052 0.047
Increment 7.7 1.5 -0.04 0.083 Note: mobile crusher engine emissions are accounted for vehicle emissions presented in Table 17.
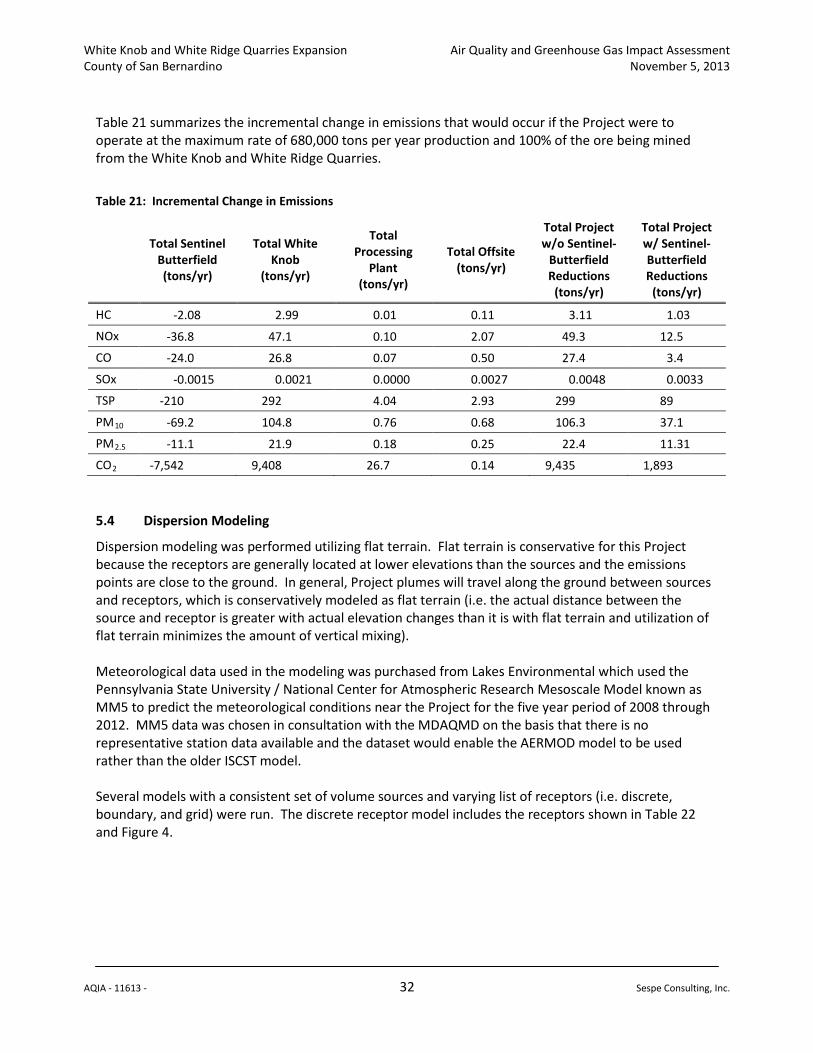
White Knob and White Ridge Quarries Expansion Air Quality and Greenhouse Gas Impact Assessment County of San Bernardino November 5, 2013
AQIA - 11613 - 32 Sespe Consulting, Inc.
Table 21 summarizes the incremental change in emissions that would occur if the Project were to operate at the maximum rate of 680,000 tons per year production and 100% of the ore being mined from the White Knob and White Ridge Quarries.
Table 21: Incremental Change in Emissions
Total Sentinel
Butterfield (tons/yr)
Total White Knob
(tons/yr)
Total Processing
Plant (tons/yr)
Total Offsite (tons/yr)
Total Project w/o Sentinel-
Butterfield Reductions
(tons/yr)
Total Project w/ Sentinel-Butterfield Reductions
(tons/yr)
HC -2.08 2.99 0.01 0.11 3.11 1.03
NOx -36.8 47.1 0.10 2.07 49.3 12.5
CO -24.0 26.8 0.07 0.50 27.4 3.4
SOx -0.0015 0.0021 0.0000 0.0027 0.0048 0.0033
TSP -210 292 4.04 2.93 299 89
PM -69.2 10 104.8 0.76 0.68 106.3 37.1
PM -11.1 2.5 21.9 0.18 0.25 22.4 11.31
CO -7,542 2 9,408 26.7 0.14 9,435 1,893 5.4 Dispersion Modeling
Dispersion modeling was performed utilizing flat terrain. Flat terrain is conservative for this Project because the receptors are generally located at lower elevations than the sources and the emissions points are close to the ground. In general, Project plumes will travel along the ground between sources and receptors, which is conservatively modeled as flat terrain (i.e. the actual distance between the source and receptor is greater with actual elevation changes than it is with flat terrain and utilization of flat terrain minimizes the amount of vertical mixing). Meteorological data used in the modeling was purchased from Lakes Environmental which used the Pennsylvania State University / National Center for Atmospheric Research Mesoscale Model known as MM5 to predict the meteorological conditions near the Project for the five year period of 2008 through 2012. MM5 data was chosen in consultation with the MDAQMD on the basis that there is no representative station data available and the dataset would enable the AERMOD model to be used rather than the older ISCST model. Several models with a consistent set of volume sources and varying list of receptors (i.e. discrete, boundary, and grid) were run. The discrete receptor model includes the receptors shown in Table 22 and Figure 4.
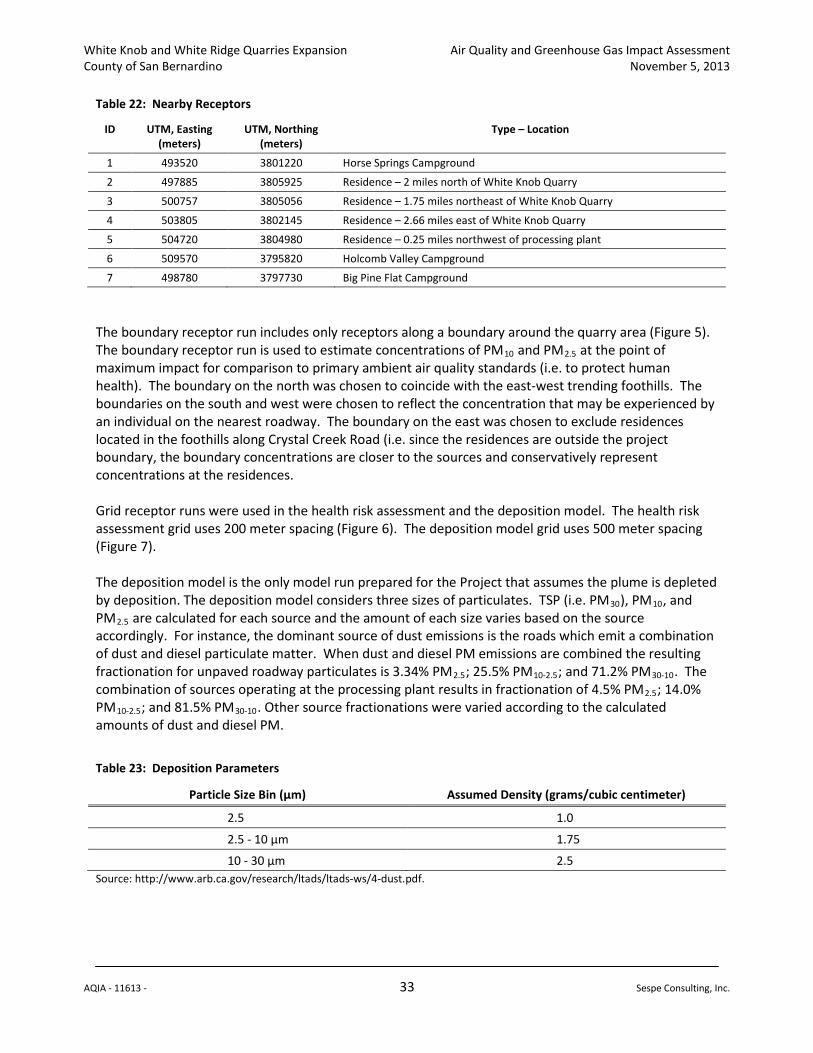
White Knob and White Ridge Quarries Expansion Air Quality and Greenhouse Gas Impact Assessment County of San Bernardino November 5, 2013
AQIA - 11613 - 33 Sespe Consulting, Inc.
Table 22: Nearby Receptors
ID UTM, Easting (meters)
UTM, Northing (meters)
Type – Location
1 493520 3801220 Horse Springs Campground
2 497885 3805925 Residence – 2 miles north of White Knob Quarry
3 500757 3805056 Residence – 1.75 miles northeast of White Knob Quarry
4 503805 3802145 Residence – 2.66 miles east of White Knob Quarry
5 504720 3804980 Residence – 0.25 miles northwest of processing plant
6 509570 3795820 Holcomb Valley Campground
7 498780 3797730 Big Pine Flat Campground
The boundary receptor run includes only receptors along a boundary around the quarry area (Figure 5). The boundary receptor run is used to estimate concentrations of PM10 and PM2.5
at the point of maximum impact for comparison to primary ambient air quality standards (i.e. to protect human health). The boundary on the north was chosen to coincide with the east-west trending foothills. The boundaries on the south and west were chosen to reflect the concentration that may be experienced by an individual on the nearest roadway. The boundary on the east was chosen to exclude residences located in the foothills along Crystal Creek Road (i.e. since the residences are outside the project boundary, the boundary concentrations are closer to the sources and conservatively represent concentrations at the residences.
Grid receptor runs were used in the health risk assessment and the deposition model. The health risk assessment grid uses 200 meter spacing (Figure 6). The deposition model grid uses 500 meter spacing (Figure 7). The deposition model is the only model run prepared for the Project that assumes the plume is depleted by deposition. The deposition model considers three sizes of particulates. TSP (i.e. PM30), PM10, and PM2.5 are calculated for each source and the amount of each size varies based on the source accordingly. For instance, the dominant source of dust emissions is the roads which emit a combination of dust and diesel particulate matter. When dust and diesel PM emissions are combined the resulting fractionation for unpaved roadway particulates is 3.34% PM2.5; 25.5% PM10-2.5; and 71.2% PM30-10. The combination of sources operating at the processing plant results in fractionation of 4.5% PM2.5; 14.0% PM10-2.5; and 81.5% PM30-10
. Other source fractionations were varied according to the calculated amounts of dust and diesel PM.
Table 23: Deposition Parameters
Particle Size Bin (µm) Assumed Density (grams/cubic centimeter)
2.5 1.0 2.5 - 10 µm 1.75 10 - 30 µm 2.5
Source: http://www.arb.ca.gov/research/ltads/ltads-ws/4-dust.pdf.
White Knob and White Ridge Quarries Expansion Air Quality and Greenhouse Gas Impact Assessment County of San Bernardino November 5, 2013
AQIA - 11613 - 34 Sespe Consulting, Inc.
The weight of particles presented in Table 23 is most appropriate for dust particles which constitute the majority of particulate matter emitted by project sources. Because the diesel particulates are emitted in smaller quantities, the dust densities are applied to all particulates regardless of their origin. 5.5 Health Risk Assessment
Constituents in diesel exhaust and dust emissions were speciated into toxic components using the following CARB Speciation Profiles: - Particulate matter from unpaved roads (PM Profile #470); - Particulate matter from paved roads (PM Profile #471); - Particulate matter from aggregate processing (PM Profile #90013); - Diesel particulate matter (PM Profile #6139 for the 2013 fleet); and - Diesel total organic gases (Organic Profile #818). The HRA calculations are performed using HARP. The AERMOD software air dispersion output data (χ/Q) is used as the input file for the HARP health risk assessment module. Before inputting the AERMOD output into HARP it was converted using the HARP ONRAMP software to a format that is compatible with HARP. Exposure to TACs by routes other than inhalation is included by the multi-pathway risk assessment. Exposure via home grown produce, dermal absorption, soil ingestion, and mother’s milk are included. Deposition for the multipathway assessment is assumed to occur at a rate of 0.02 meters per second. Cancer risk is assessed using a 70 year lifetime exposure, 63 kg body weight and the Derived (Adjusted) Method. The Derived (Adjusted) Method is similar to the Derived (OEHHA) Method which is described in the OEHHA HRA Guidelines (October 2003). The Derived (OEHHA) Method calculates cancer risk for two dominant (driving) exposure pathways using the high-end point-estimates of exposure, while the remaining exposure pathways use average point estimates. Specifically, the inhalation pathway which is a dominant pathway in the HRA would be based upon a Daily Breathing Rate of 373 liters of air per kilogram of body weight per day (L/kg BW *Day) under the Derived (OEHHA) Method. The Derived (Adjusted) Method breathing rate is 80th
percentile of exposure rather than the high-end point-estimate. The Derived (Adjusted) method is used when the inhalation pathway is determined to be a dominant exposure route in a multipathway assessment as described in the Recommended Interim Risk Management Policy for Inhalation-Based Residential Cancer Risk (CARB, October 9, 2003).
The dermal pathway risk would be calculated using 63 kg body weight, and average or high end values for soil loading (0.2 and 1.0 mg/cm2-day), exposure frequency (121 and 350 days/yr), and surface area exposed (4,700 and 5,500 cm2
). Risk from soil ingestion is calculated using a point estimate of 1.7 mg/kg BW * Day. Ingestion via home grown produce accounts for average and high end of various produce including exposed, leafy, protected, and root which have varying consumption rates in units g/kg BW * Day. Breast milk consumption rates of 102 and 138 g/kg BW * Day are used for a period of one year.
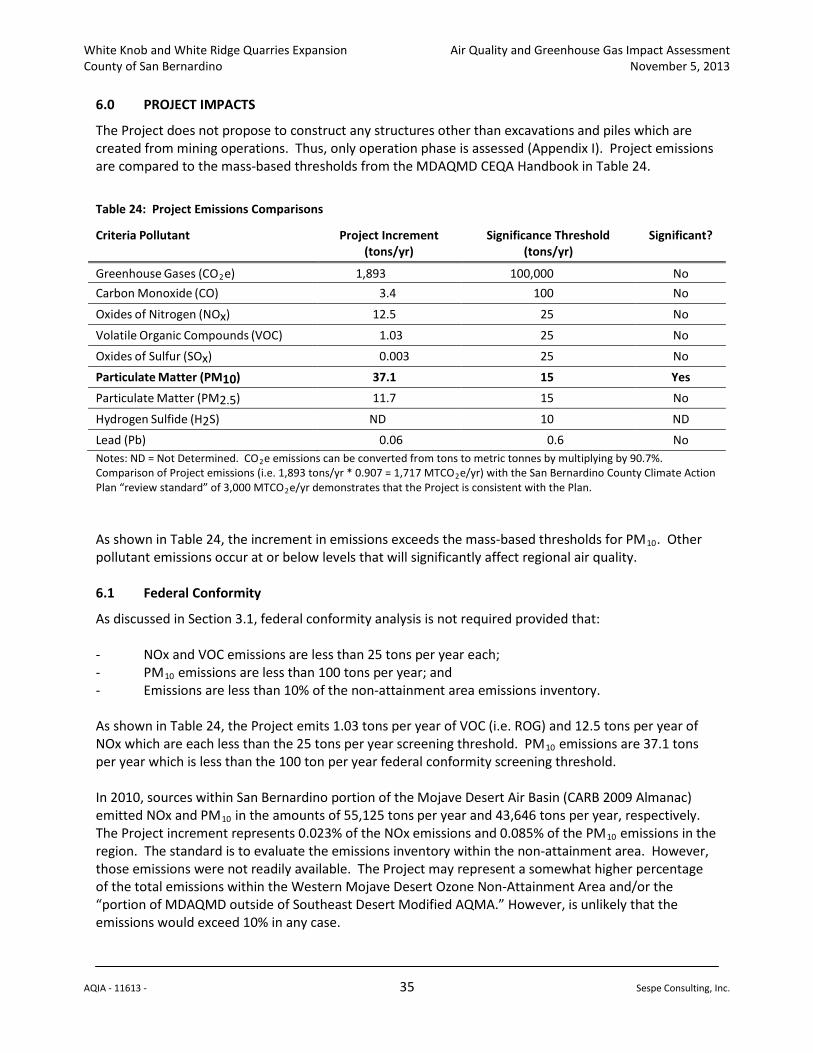
White Knob and White Ridge Quarries Expansion Air Quality and Greenhouse Gas Impact Assessment County of San Bernardino November 5, 2013
AQIA - 11613 - 35 Sespe Consulting, Inc.
6.0 PROJECT IMPACTS
The Project does not propose to construct any structures other than excavations and piles which are created from mining operations. Thus, only operation phase is assessed (Appendix I). Project emissions are compared to the mass-based thresholds from the MDAQMD CEQA Handbook in Table 24.
Table 24: Project Emissions Comparisons
Criteria Pollutant Project Increment (tons/yr)
Significance Threshold (tons/yr)
Significant?
Greenhouse Gases (CO2 1,893 e) 100,000 No Carbon Monoxide (CO) 3.4 100 No
Oxides of Nitrogen (NOx) 12.5 25 No
Volatile Organic Compounds (VOC) 1.03 25 No Oxides of Sulfur (SOx) 0.003 25 No Particulate Matter (PM10) 37.1 15 Yes Particulate Matter (PM2.5) 11.7 15 No
Hydrogen Sulfide (H2S) ND 10 ND Lead (Pb) 0.06 0.6 No Notes: ND = Not Determined. CO2e emissions can be converted from tons to metric tonnes by multiplying by 90.7%. Comparison of Project emissions (i.e. 1,893 tons/yr * 0.907 = 1,717 MTCO2e/yr) with the San Bernardino County Climate Action Plan “review standard” of 3,000 MTCO2
e/yr demonstrates that the Project is consistent with the Plan.
As shown in Table 24, the increment in emissions exceeds the mass-based thresholds for PM10
. Other pollutant emissions occur at or below levels that will significantly affect regional air quality.
6.1 Federal Conformity
As discussed in Section 3.1, federal conformity analysis is not required provided that: - NOx and VOC emissions are less than 25 tons per year each; - PM10
- Emissions are less than 10% of the non-attainment area emissions inventory. emissions are less than 100 tons per year; and
As shown in Table 24, the Project emits 1.03 tons per year of VOC (i.e. ROG) and 12.5 tons per year of NOx which are each less than the 25 tons per year screening threshold. PM10
emissions are 37.1 tons per year which is less than the 100 ton per year federal conformity screening threshold.
In 2010, sources within San Bernardino portion of the Mojave Desert Air Basin (CARB 2009 Almanac) emitted NOx and PM10 in the amounts of 55,125 tons per year and 43,646 tons per year, respectively. The Project increment represents 0.023% of the NOx emissions and 0.085% of the PM10
emissions in the region. The standard is to evaluate the emissions inventory within the non-attainment area. However, those emissions were not readily available. The Project may represent a somewhat higher percentage of the total emissions within the Western Mojave Desert Ozone Non-Attainment Area and/or the “portion of MDAQMD outside of Southeast Desert Modified AQMA.” However, is unlikely that the emissions would exceed 10% in any case.
White Knob and White Ridge Quarries Expansion Air Quality and Greenhouse Gas Impact Assessment County of San Bernardino November 5, 2013
AQIA - 11613 - 36 Sespe Consulting, Inc.
6.2 Federal Land Managers’ Air Quality Related Values
The Federal Land Managers’ AQRVs apply to new or modified major sources and are generally used for PSD permitting under the Clean Air Act. The Project does not propose a new stationary major source or a modified stationary major source that would require a permit under the Clean Air Act. Fugitive area source emissions and vehicular emissions are excluded from determining whether the quarry is a major source. The Omya facility is not considered a major source as evidenced by the fact that it holds local district operating permits rather than a federal operating permit under Title V (i.e. 40 CFR Part 70). Thus, none of the sources operated by Omya are capable of producing effects that would trigger concerns with the AQRVs. The incremental change in emissions from all of the sources combined would slightly exceed major source criteria but the effects are dispersed along roads and within pits. Thus, it is unlikely that the change in emissions will cause or contribute to effects addressed by the AQRVs. The FLAG report provides an equation (Quantity/Distance < 10; or Q/D < 10) by which projects can screen out of detailed analyses of AQRVs. Application of the equation is limited in the FLAG report to projects greater than 50 km from the Class I Wilderness Area. The Project is within 23 km of San Gorgonio but the Q/D test is applied here for disclosure purposes and to acknowledge the scale of emissions from the Project as compared to the screening threshold. Presumably sufficient buffer between the Project Q/D and the screening threshold would be evidence indicating less than significant effects on AQRVs regardless of the distance. The Q/D test uses the sum of SO2, NOx, PM10 and H2SO4
emissions. The Project emits 53.2 tons per year of these pollutants and the distance to San Gorgonio is 23 km. Thus, Q/D for the Project is 2.3 which is a quarter of the screening threshold. Given the fact that there is no single major source and that the emissions are distributed over a large area it seems reasonable to expect that the Project will result in less than significant impacts on AQRVs at Class I Wilderness Areas.
Moreover, monitoring performed in the San Gorgonio Wilderness Area indicates that nitrates, organic matter, and sulfates have the strongest contributions to degrading visibility on worst days (Appendix D). Concentrations of these pollutants result from regional sources and particularly emissions from South Coast Air Basin. The Project emits NOx, some of which may become nitrates but the relative amount as compared to the South Coast Air Basin is de minimis. The Project also emits particulate matter but the worst days are relatively unaffected by particulates. Thus, the Project is unlikely to emit pollutants in amounts that would affect visibility in the San Gorgonio and other nearby Class I Wilderness Areas. The Project impact on visibility and regional haze is considered to be less than significant. Phytotoxic ozone concentrations may result where the plume from a large combustion source travels relatively intact a sufficient distance for the photo-chemical reaction between NOx and reactive organics to have occurred and produce ozone. The ozone would then be concentrated at a hot spot where vegetation could be affected. The Project sources of NOx are small and distributed over a large area. Therefore, it is unlikely that the Project would cause phytotoxic ozone concentrations and the Project impact for this AQRV is considered less than significant.
White Knob and White Ridge Quarries Expansion Air Quality and Greenhouse Gas Impact Assessment County of San Bernardino November 5, 2013
AQIA - 11613 - 37 Sespe Consulting, Inc.
The deposition AQRV is concerned with the acidification of water bodies. Specifically, sulfur and nitrogen compounds cause sensitive freshwater lakes and streams to lose acid-neutralizing capacity and sensitive soils to become acidified. Other ecosystems, including the forest, may exhibit fertilization and other effects from excess nitrogen deposition. The Project sources of nitrogen and sulfur are small and distributed over a large area. Therefore, it is unlikely that the Project would cause acidification and the Project impact for this AQRV is considered less than significant. 6.3 Localized Criteria Pollutant Impacts
A project will have a “potentially significant impact” on air quality if it “violates any air quality standard or contributes substantially to an existing or projected air quality violation.” Project emissions have the potential to create localized “hot spots” if, when summed with existing ambient concentrations, they result in concentrations greater than the applicable AAQS. The main criteria pollutants of concern for the Project are Total Suspended Particulates (used for deposition modeling), PM10, and PM2.5
. Ambient air quality standards for pollutants that are less of a concern are discussed first followed by modeling results for the criteria pollutants of concern.
CO AAQS exceedence is generally a concern at high volume vehicular intersections in urban areas that operate at level of service (LOS) D or worse and where CO is emitted into partially or completely enclosed spaces such as parking structures and garages. CO modeling is not warranted for the Project and the impact on CO AAQS is considered less than significant. SO2 AAQS exceedences are normally a concern for facilities that burn coal or refine petroleum. Diesel fuel used by the Project will meet CARB specifications for sulfur content. SO2 modeling is not warranted for the Project and the impact on SO2
AAQS is considered less than significant.
NO2 AAQS exceedences are normally a concern for facilities with a large combustion source. The quarrying and transportation of materials is performed by diesel engines which are a source of NO2. However, the diesel vehicles are comparatively small emitters of NO2 and they move in order to perform job tasks. Movement reduces the likelihood of a hot spot. NO2
has annual and hourly AAQS.
On an annual basis, the Project NOx emissions are less than the CEQA Significance Threshold. Therefore, modeling to determine annual NO2
concentration for comparison to the AAQS is not warranted.
On an hourly basis, the Project does not propose to change the equipment list. The potential for the Project to cause or contribute to an exceedence of the hourly NO2 AAQS is unlikely given the size of the operational area (335.1 acres), distance from the quarries where activity is expected to be most intense to the boundary at which human health impacts are evaluated, and the limited potential increase in hourly activity at any one location on-site. Therefore, modeling hourly NO2 concentrations is not warranted for the Project and the impact on NO2
AAQS is considered less than significant.
Emissions of the criteria pollutants of concern for the Project (i.e. PM10, PM2.5
Table 25) are modeled to predict
concentrations at the off-site point of maximum impact (PMI). shows impact assessment results for particulate matter air dispersion model that was prepared. AAQSs are applied when background is less than the AAQS and SILs are applied when background already exceeds the AAQS. Significant impact is when the project exceeds the AAQS. A cumulatively considerable impact occurs when the cumulative concentration exceeds the AAQS; or the project concentration exceeds the SIL in an area where the AAQS is exceeded by background concentrations.
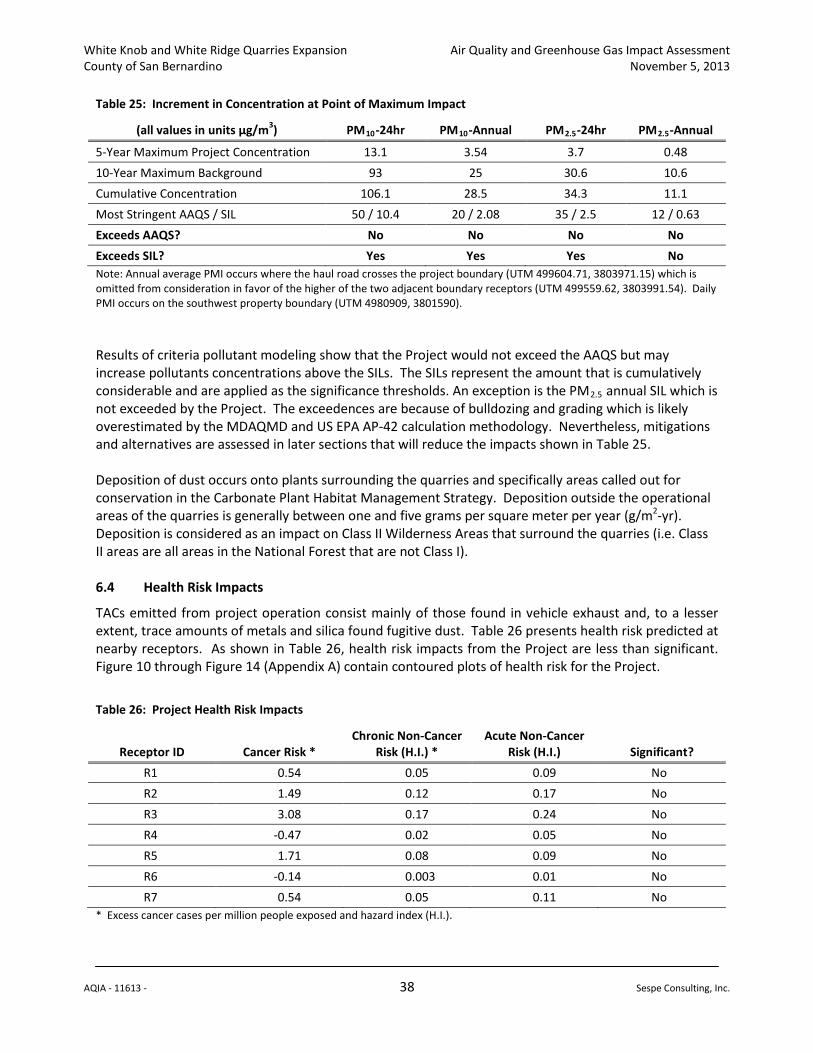
White Knob and White Ridge Quarries Expansion Air Quality and Greenhouse Gas Impact Assessment County of San Bernardino November 5, 2013
AQIA - 11613 - 38 Sespe Consulting, Inc.
Table 25: Increment in Concentration at Point of Maximum Impact
(all values in units µg/m3 PM) 10 PM-24hr 10 PM-Annual 2.5 PM-24hr 2.5
5-Year Maximum Project Concentration
-Annual
13.1 3.54 3.7 0.48 10-Year Maximum Background 93 25 30.6 10.6 Cumulative Concentration 106.1 28.5 34.3 11.1 Most Stringent AAQS / SIL 50 / 10.4 20 / 2.08 35 / 2.5 12 / 0.63 Exceeds AAQS? No No No No Exceeds SIL? Yes Yes Yes No Note: Annual average PMI occurs where the haul road crosses the project boundary (UTM 499604.71, 3803971.15) which is omitted from consideration in favor of the higher of the two adjacent boundary receptors (UTM 499559.62, 3803991.54). Daily PMI occurs on the southwest property boundary (UTM 4980909, 3801590). Results of criteria pollutant modeling show that the Project would not exceed the AAQS but may increase pollutants concentrations above the SILs. The SILs represent the amount that is cumulatively considerable and are applied as the significance thresholds. An exception is the PM2.5
Table 25
annual SIL which is not exceeded by the Project. The exceedences are because of bulldozing and grading which is likely overestimated by the MDAQMD and US EPA AP-42 calculation methodology. Nevertheless, mitigations and alternatives are assessed in later sections that will reduce the impacts shown in . Deposition of dust occurs onto plants surrounding the quarries and specifically areas called out for conservation in the Carbonate Plant Habitat Management Strategy. Deposition outside the operational areas of the quarries is generally between one and five grams per square meter per year (g/m2
-yr). Deposition is considered as an impact on Class II Wilderness Areas that surround the quarries (i.e. Class II areas are all areas in the National Forest that are not Class I).
6.4 Health Risk Impacts
TACs emitted from project operation consist mainly of those found in vehicle exhaust and, to a lesser extent, trace amounts of metals and silica found fugitive dust. Table 26 presents health risk predicted at nearby receptors. As shown in Table 26, health risk impacts from the Project are less than significant. Figure 10 through Figure 14 (Appendix A) contain contoured plots of health risk for the Project.
Table 26: Project Health Risk Impacts
Receptor ID Cancer Risk * Chronic Non-Cancer
Risk (H.I.) * Acute Non-Cancer
Risk (H.I.) Significant? R1 0.54 0.05 0.09 No R2 1.49 0.12 0.17 No R3 3.08 0.17 0.24 No R4 -0.47 0.02 0.05 No R5 1.71 0.08 0.09 No R6 -0.14 0.003 0.01 No R7 0.54 0.05 0.11 No
* Excess cancer cases per million people exposed and hazard index (H.I.).
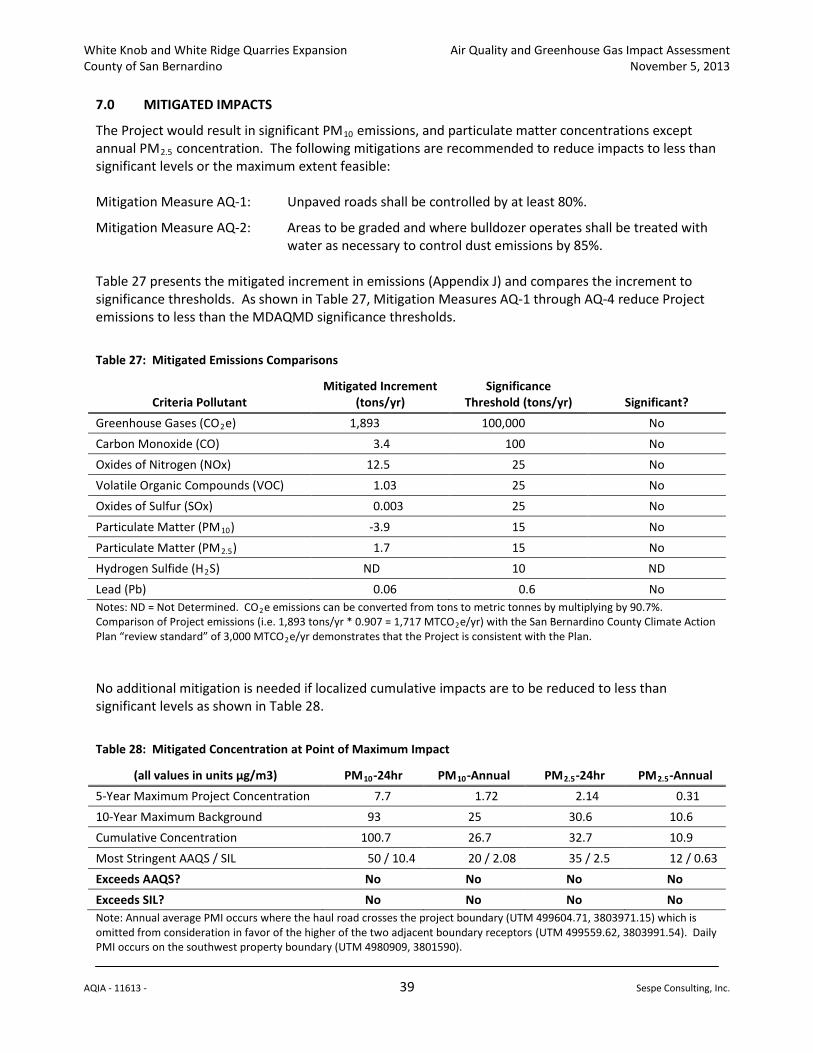
White Knob and White Ridge Quarries Expansion Air Quality and Greenhouse Gas Impact Assessment County of San Bernardino November 5, 2013
AQIA - 11613 - 39 Sespe Consulting, Inc.
7.0 MITIGATED IMPACTS
The Project would result in significant PM10 emissions, and particulate matter concentrations except annual PM2.5
concentration. The following mitigations are recommended to reduce impacts to less than significant levels or the maximum extent feasible:
Mitigation Measure AQ-1: Unpaved roads shall be controlled by at least 80%.
Mitigation Measure AQ-2: Areas to be graded and where bulldozer operates shall be treated with water as necessary to control dust emissions by 85%.
Table 27 presents the mitigated increment in emissions (Appendix J) and compares the increment to significance thresholds. As shown in Table 27, Mitigation Measures AQ-1 through AQ-4 reduce Project emissions to less than the MDAQMD significance thresholds.
Table 27: Mitigated Emissions Comparisons
Criteria Pollutant Mitigated Increment
(tons/yr) Significance
Threshold (tons/yr) Significant? Greenhouse Gases (CO2 1,893 e) 100,000 No Carbon Monoxide (CO) 3.4 100 No Oxides of Nitrogen (NOx) 12.5 25 No Volatile Organic Compounds (VOC) 1.03 25 No Oxides of Sulfur (SOx) 0.003 25 No Particulate Matter (PM10 -3.9 ) 15 No Particulate Matter (PM2.5 1.7 ) 15 No Hydrogen Sulfide (H2 ND S) 10 ND Lead (Pb) 0.06 0.6 No Notes: ND = Not Determined. CO2e emissions can be converted from tons to metric tonnes by multiplying by 90.7%. Comparison of Project emissions (i.e. 1,893 tons/yr * 0.907 = 1,717 MTCO2e/yr) with the San Bernardino County Climate Action Plan “review standard” of 3,000 MTCO2
e/yr demonstrates that the Project is consistent with the Plan.
No additional mitigation is needed if localized cumulative impacts are to be reduced to less than significant levels as shown in Table 28.
Table 28: Mitigated Concentration at Point of Maximum Impact
(all values in units µg/m3) PM10 PM-24hr 10 PM-Annual 2.5 PM-24hr 2.5
5-Year Maximum Project Concentration -Annual
7.7 1.72 2.14 0.31 10-Year Maximum Background 93 25 30.6 10.6 Cumulative Concentration 100.7 26.7 32.7 10.9 Most Stringent AAQS / SIL 50 / 10.4 20 / 2.08 35 / 2.5 12 / 0.63 Exceeds AAQS? No No No No Exceeds SIL? No No No No Note: Annual average PMI occurs where the haul road crosses the project boundary (UTM 499604.71, 3803971.15) which is omitted from consideration in favor of the higher of the two adjacent boundary receptors (UTM 499559.62, 3803991.54). Daily PMI occurs on the southwest property boundary (UTM 4980909, 3801590).
White Knob and White Ridge Quarries Expansion Air Quality and Greenhouse Gas Impact Assessment County of San Bernardino November 5, 2013
AQIA - 11613 - 40 Sespe Consulting, Inc.
8.0 ALTERNATIVES
Reasonable alternatives were developed that respond to the significant issues, reduce potential environmental impacts and address the purpose of and need for action and Project objectives. Alternatives that did not meet the purpose of and need for action, did not resolve environmental conflicts and/or were not available or feasible were eliminated from detailed consideration The County identified the following two alternatives for detailed analysis in this DEIR/EIS, each of which is summarized below, followed by the detailed analysis. 8.1 Alternative 1: No Action/Mining under Current Entitlements
Under this alternative, Omya would not expand the White Knob and White Ridge Quarries. The existing permitted mining activities located on approximately 145 acres within the area controlled by Omya would continue in accordance with the approved POO and Reclamation Plans and other Federal, State and local regulations. Cancer risk which would be less than for the Project due to the shortened life of the resource and exposure duration. Existing entitlements would allow the project maximum of 680,000 tons to be produced from the White Knob and White Ridge Quarries exclusively. Aside from the slightly reduced cancer risk, the air quality impacts of the No Action alternative are the same as the Project alternative. 8.2 Alternative 2: Combined Production with the Sentinel and Butterfield Quarries
Historically the limestone ore provided to the Lucerne Valley Processing Plant has been approximately a 60/40 ratio between the Butterfield and Sentinel Quarries and the White Knob Quarry. This alternative would assume that instead of the White Knob and White Ridge Quarries providing 100% (680,000 tpy) of the ore to the processing plant, a range of more realistic production mixes between the quarries would be evaluated. This alternative would be more likely than the proposed Project and would result in less difference from the existing setting. The haul distance to the processing plant from the Sentinel and Butterfield Quarries is greater than from the White Knob and White Ridge Quarries. On the other hand, the amount of overburden to be removed at White Knob and White Ridge Quarries is greater by 500,000 tons per year than the amount that would need to be removed from the Sentinel and Butterfield Quarries for an equivalent amount of ore. Regardless, the impacts calculated for the Project are greater than those that would be calculated for this alternative.
White Knob and White Ridge Quarries Expansion Air Quality and Greenhouse Gas Impact Assessment County of San Bernardino November 5, 2013
AQIA - 11613 - 41 Sespe Consulting, Inc.
9.0 REFERENCES
AB 32 Scoping Plan, CARB, December 2008. (http://www.arb.ca.gov/cc/scopingplan/document/scopingplandocument.htm). AERMOD View Version 8.2.0 by Lakes Environmental (AERMOD build number 12345). (http://www.weblakes.com/products/aermod/index.html) Air Toxics Hot Spots Program Guidance Manual for Preparation of Health Risk Assessments, California
Office of Environmental Health Hazard Assessment (OEHHA) (August 2003) (http://www.oehha.org/air/hot_spots/HRAguidefinal.html).
AP-42, US EPA. (http://www.epa.gov/ttn/chief). CalEEMod User Guide Version 2011.1, SCAQMD, February 2011.
(http://www.aqmd.gov/caleemod/guide.htm). CEQA and Federal Conformity Guidelines, MDAQMD, August 2011. (http://www.mdaqmd.ca.gov/Modules/ShowDocument.aspx?documentid=2910). EMFAC2011, CARB. (http://www.arb.ca.gov/msei/msei.htm). EPA Memorandum from Tyler Fox, Leader Air Quality Modeling Group C439-01 to Regional Air Division
Directors, “Additional Clarification Regarding Application of Appendix W Modeling Guidance for the 1-hour NO2 National Ambient Air Quality Standard” dated March 1, 2011.
(http://www.epa.gov/region7/air/nsr/nsrmemos/appwno2_2.pdf) EPA’s Endangerment Finding – Health Effects Fact Sheet (http://www.epa.gov/climatechange/Downloads/endangerment/EndangermentFinding_Health.
pdf). Final Supplement to the AB 32 Scoping Plan Functionally Equivalent Document, CARB, August 24, 2011. (http://www.arb.ca.gov/cc/scopingplan/document/final_supplement_to_sp_fed.pdf). HARP Onramp, CARB, February 3, 2009. HARP User Manual, CARB, December 2003 (http://www.arb.ca.gov/toxics/harp/harp.htm). Hot Spots Analysis and Reporting Program (HARP) Version 1.4f (Build 23.11.01), CARB, May 2012.
(http://www.arb.ca.gov/toxics/harp/harp.htm). Multiple Air Toxics Exposure Study in the South Coast Air Basin (MATES-II and MATES-III), South Coast
Air Quality Management District, March 2000 and September 2008. (http://www.aqmd.gov/matesiidf/matestoc.htm http://www.aqmd.gov/prdas/matesIII/matesIII.html) OFFROAD2011, CARB. (http://www.arb.ca.gov/msei/msei.htm).
White Knob and White Ridge Quarries Expansion Air Quality and Greenhouse Gas Impact Assessment County of San Bernardino November 5, 2013
AQIA - 11613 - 42 Sespe Consulting, Inc.
“Phase I Report – Revised 2010,” Federal Land Managers’ Air Quality Related Values Work Group (FLAG), October 2010.
(http://www.nature.nps.gov/air/pubs/pdf/flag/FLAG_2010.pdf). Rules and Regulations of the Mojave Desert Air Quality Management District. (http://www.mdaqmd.ca.gov/index.aspx?page=138). Regulatory Advisory 10-414, CARB, May 2011. (http://www.arb.ca.gov/enf/advs/advs414.pdf). State CEQA Guidelines, National Resources Agency, last updated March 18, 2010. (http://ceres.ca.gov/ceqa/guidelines/). Speciation Profiles Used in ARB Modeling, CARB, December 12, 2012.
(http://www.arb.ca.gov/ei/speciate/speciate.htm).
White Knob and White Ridge Quarries Expansion Air Quality and Greenhouse Gas Impact Assessment County of San Bernardino
AQIA - 11613 - Sespe Consulting, Inc.
FIGURES Figure 1: Site Location Figure 2: Site Plan (details on Figures 2a, 2b, and 2c) Figure 3: Ambient Cancer Risk Figure 4: Discrete Receptors in HRA Figure 5: Boundary Run PM Model Objects Figure 6: Grid Run HRA Model Objects Figure 7: Deposition Model Objects Figure 8: Annual Deposition Figure 9: Daily Deposition Figure 10: Cancer Risk at Sensitive Receptors – Project Increment Figure 11: Chronic Risk at Sensitive Receptors – Project Increment Figure 12: Cancer Risk at Worker Receptors – Project Increment Figure 13: Chronic Risk at Worker Receptors – Project Increment Figure 14: Acute Risk – Project Increment
Appendix A: Figures
White Knob and White Ridge Quarries Expansion Air Quality and Greenhouse Gas Impact Assessment County of San Bernardino
AQIA - 11613 - Sespe Consulting, Inc.
Appendix B: Health Effects of Air Pollutants

White Knob and White Ridge Quarries Expansion Air Quality and Greenhouse Gas Impact Assessment County of San Bernardino
AQIA - 11613 - Sespe Consulting, Inc.
Appendix C: Ambient Pollutant Concentrations
White Knob and White Ridge Quarries Expansion Air Quality and Greenhouse Gas Impact Assessment County of San Bernardino
AQIA - 11613 - Sespe Consulting, Inc.
Appendix D: San Gorgonio Wilderness Area Description
White Knob and White Ridge Quarries Expansion Air Quality and Greenhouse Gas Impact Assessment County of San Bernardino
AQIA - 11613 - Sespe Consulting, Inc.
Appendix E: MDAQMD Rule Development Calendar
White Knob and White Ridge Quarries Expansion Air Quality and Greenhouse Gas Impact Assessment County of San Bernardino
AQIA - 11613 - Sespe Consulting, Inc.
Appendix F: MDAQMD Mineral Industry Emissions Inventory Guidelines
White Knob and White Ridge Quarries Expansion Air Quality and Greenhouse Gas Impact Assessment County of San Bernardino
AQIA - 11613 - Sespe Consulting, Inc.
Appendix G: Baseline Data from Omya

White Knob and White Ridge Quarries Expansion Air Quality and Greenhouse Gas Impact Assessment County of San Bernardino
AQIA - 11613 - Sespe Consulting, Inc.
Appendix H: Baseline Emissions Calculations
White Knob and White Ridge Quarries Expansion Air Quality and Greenhouse Gas Impact Assessment County of San Bernardino
AQIA - 11613 - Sespe Consulting, Inc.
Appendix I: Project Emissions
White Knob and White Ridge Quarries Expansion Air Quality and Greenhouse Gas Impact Assessment County of San Bernardino
AQIA - 11613 - Sespe Consulting, Inc.
Appendix J: Mitigated Emissions
White Knob and White Ridge Quarries Expansion Air Quality and Greenhouse Gas Impact Assessment County of San Bernardino
AQIA - 11613 - Sespe Consulting, Inc.
Appendix K: Modeling Files on Electronic Media
White Knob and White Ridge Quarries Expansion Air Quality and Greenhouse Gas Impact Assessment County of San Bernardino
AQIA - 11613 - Sespe Consulting, Inc.
![Greenhouse Gas Emissions and Emissions Trading in North … · 2020. 2. 23. · 2002] Stephenson-Greenhouse Gas Emissions, Kyoto and U.S. Response 45 greenhouse gas molecules. This](https://img.pdfslide.net/doc/110x75/60facf56e286b02f9b10de99/greenhouse-gas-emissions-and-emissions-trading-in-north-2020-2-23-2002-stephenson-greenhouse.jpg)