Embed Size (px)
Citation preview
C.3-1 HILLSBORO AIRPORT PARALLEL RUNWAY 12L/30R ENVIRONMENTAL ASSESSMENT APPENDIX C.3
Appendix C.3 Air Quality
Contents Existing Conditions
Air Quality Analysis Assumptions Technical Memorandum


Existing Conditions

1
Air Quality Existing Conditions
Hillsboro Airport is located in Washington County in the city of Hillsboro, about 15 miles west of downtown Portland. The Airport and its surrounding communities are part of the Portland/Vancouver attainment/maintenance region for the carbon monoxide (CO) standard. The State of Oregon’s SIP for this area includes a regional maintenance plan for CO demonstrating that it will continue to achieve attainment for carbon monoxide. The following subsections summarize existing conditions with a review of available air quality monitoring data in the general vicinity of the Airport and estimates of emissions for existing (2007) Airport operations.
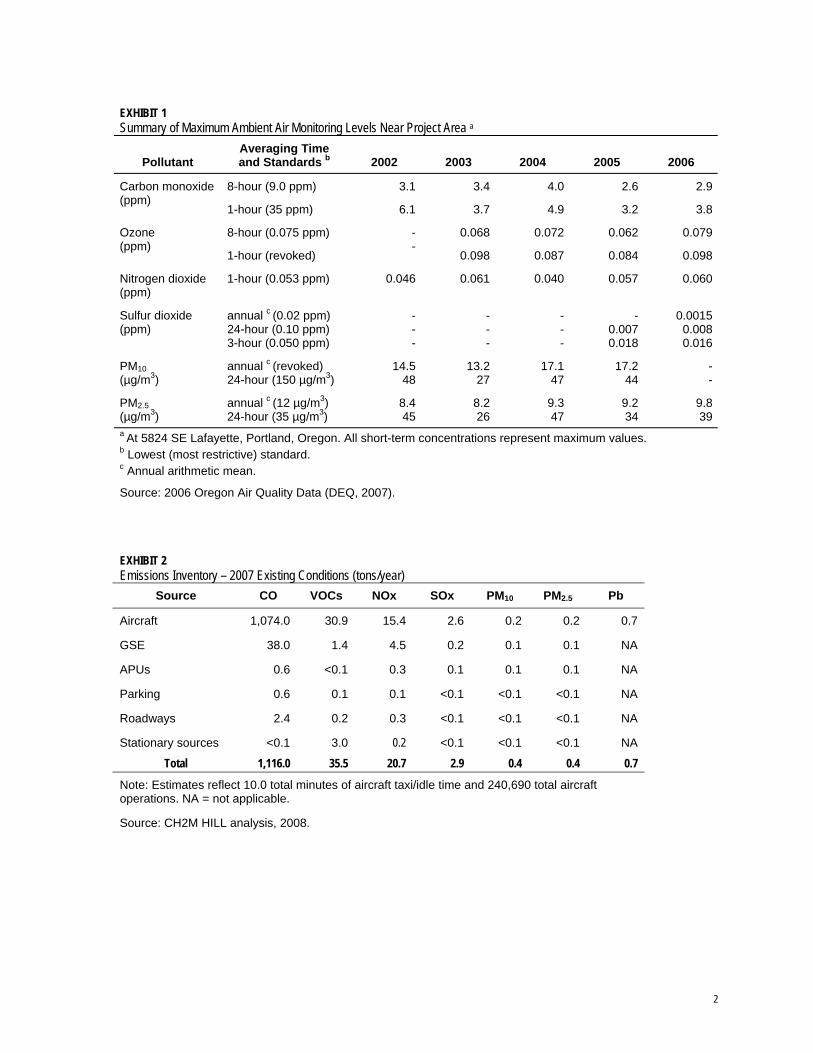
Regional Air Quality Monitoring The Oregon DEQ operates a network of ambient air monitoring stations throughout the Portland-Vancouver Air Quality Management Area. Exhibit 1 lists the maximum measured pollutant levels for the pollutants of interest for this project, measured at the nearest monitoring location from 2002 to 2006. The southeast Lafayette air quality monitor is the nearest fully instrumented site, but it is located about 17 miles east of Hillsboro. Compliance with air quality standards is based on a statistical summary of concentrations, which varies by pollutant and averaging time.
Airport Emissions Inventory Emission estimates for existing conditions using operational data from 2007 are shown in Exhibit 2. The Air Quality Analysis Assumptions Technical Memorandum in this appendix describes the assumptions incorporated in this emissions inventory. Aircraft activity represents the largest source of all criteria pollutants. Aircraft piston engines require leaded aviation gasoline and are the only source of lead emissions at HIO. Although only aircraft-related emissions would differ among the alternatives under consideration, the inventory in Exhibit 2 also includes emissions from ground support equipment (GSE) and auxiliary power units (APU), surface vehicle parking and on airport roadways, and stationary sources.
2
EXHIBIT 1 Summary of Maximum Ambient Air Monitoring Levels Near Project Area a
Pollutant Averaging Time and Standards b 2002 2003 2004 2005 2006
Carbon monoxide (ppm)
8-hour (9.0 ppm)
1-hour (35 ppm)
3.1
6.1
3.4
3.7
4.0
4.9
2.6
3.2
2.9
3.8
Ozone (ppm)
8-hour (0.075 ppm)
1-hour (revoked)
--
0.068
0.098
0.072
0.087
0.062
0.084
0.079
0.098
Nitrogen dioxide (ppm)
1-hour (0.053 ppm) 0.046 0.061 0.040 0.057 0.060
Sulfur dioxide (ppm)
annual c (0.02 ppm) 24-hour (0.10 ppm) 3-hour (0.050 ppm)
---
---
---
- 0.007 0.018
0.00150.0080.016
PM10 (µg/m3)
annual c (revoked) 24-hour (150 µg/m3)
14.548
13.227
17.147
17.2 44
--
PM2.5 (µg/m3)
annual c (12 µg/m3) 24-hour (35 µg/m3)
8.445
8.226
9.347
9.2 34
9.839
a At 5824 SE Lafayette, Portland, Oregon. All short-term concentrations represent maximum values. b Lowest (most restrictive) standard. c Annual arithmetic mean.
Source: 2006 Oregon Air Quality Data (DEQ, 2007).
EXHIBIT 2 Emissions Inventory – 2007 Existing Conditions (tons/year)
Source CO VOCs NOx SOx PM10 PM2.5 Pb
Aircraft 1,074.0 30.9 15.4 2.6 0.2 0.2 0.7
GSE 38.0 1.4 4.5 0.2 0.1 0.1 NA
APUs 0.6 <0.1 0.3 0.1 0.1 0.1 NA
Parking 0.6 0.1 0.1 <0.1 <0.1 <0.1 NA
Roadways 2.4 0.2 0.3 <0.1 <0.1 <0.1 NA
Stationary sources <0.1 3.0 0.2 <0.1 <0.1 <0.1 NA
Total 1,116.0 35.5 20.7 2.9 0.4 0.4 0.7
Note: Estimates reflect 10.0 total minutes of aircraft taxi/idle time and 240,690 total aircraft operations. NA = not applicable.
Source: CH2M HILL analysis, 2008.

Air Quality Analysis Assumptions Technical Memorandum


1
T E C H N I C A L M E M O R A N D U M
Air Quality Analysis Assumptions PREPARED FOR: Port of Portland
PREPARED BY: Jim Humphries, CH2M HILL and Bill Willkie, CH2M HILL DATE: March 31, 2009
This technical memorandum documents the assumptions used in the air quality analysis for the Environmental Assessment (EA) of the proposed airfield improvements at Hillsboro Airport (HIO). This appendix provides the following information.
• Operational Emissions Modeling Methods and Assumptions • Toxic Air Contaminants • Construction Emissions
1. Operational Emission Modeling Methods and Assumptions This section describes the methods and assumptions used to estimate emissions attributed to airport related emission sources. The ongoing operation of aircraft, ground support equipment (GSE), surface vehicles, and stationary sources represent permanent or continuous sources of air emissions at HIO. All of the alternatives under consideration would experience the same level of aircraft activity. The numbers of passengers, pilots, and support personnel using the Airport would therefore be the same for all of the alternatives. Similarly, GSE and stationary sources such as generators and fuel tanks would experience the same level of activity for all of the alternatives. The emissions associated with the alternatives under consideration would differ only in terms of the amount of time (a function of congestion and delay) that aircraft at HIO require to conduct operations.
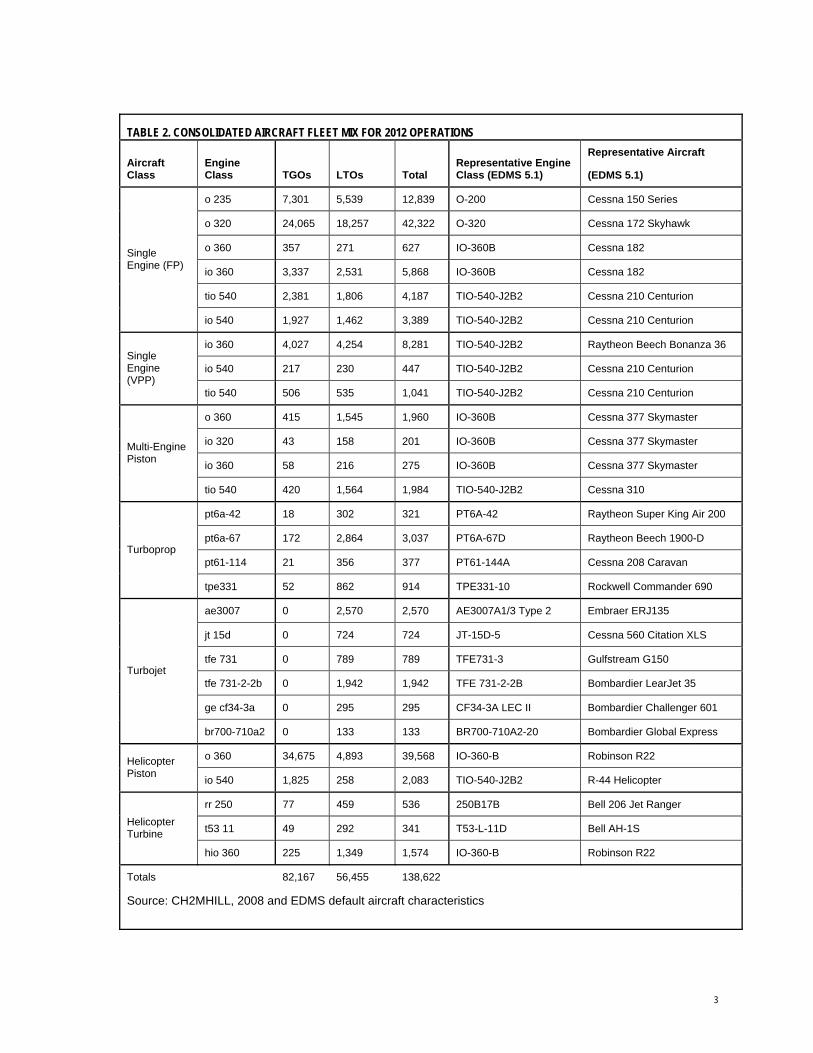
1.1 Aircraft Fleet Mix Aircraft emissions were estimated using the FAA’s Emissions and Dispersion Modeling System (EDMS) Version 5.1 (FAA, 2008). CH2M HILL reviewed the analysis documented in the HIO Master Plan (Port of Portland, 2005), and the FAA Terminal Area Forecast (TAF) for 2008 (FAA, December 2007). The TAF provides existing and future aircraft operations by generalized aircraft categories: air carrier, commercial, air taxi, general aviation, and military. The HIO Master Plan provided additional detail regarding the operation of single-engine fixed propeller, single-engine variable propeller, multi-engine piston, turboprop, turbojet, helicopter piston, and helicopter turbine aircraft. More detailed existing fleet mix data were obtained from 12 months of Flight Aware data (Flight Aware, 2008) which lists aircraft filing a flight plan either originating or terminating at HIO. The Flight Aware data included operations of over 100 specific types of aircraft. Because the EDMS model does not contain every type of aircraft, representative aircraft were consolidated by engine type to develop the EDMS input. Table 1 shows the existing fleet mix. This fleet mix was expanded to represent the number and types of aircraft operations forecast for 2012 and 2015 in the Master Plan as shown in Tables 2 and 3, respectively.

AIR QUALITY ANALYSIS ASSUMPTIONS
2
TABLE 1. CONSOLIDATED AIRCRAFT FLEET MIX FOR 2007 EXISTING OPERATIONS
Aircraft Class Engine Class TGOs LTOs Total
Representative Engine Class (EDMS 5.1)
Representative Aircraft (EDMS 5.1)
o 235 5,474 4,259 9,733 O-200 Cessna 150 Series
o 320 18,042 14,037 32,079 O-320 Cessna 172 Skyhawk
o 360 268 209 477 IO-360B Cessna 182
io 360 2,502 1,947 4,450 IO-360B Cessna 182
tio 540 1,786 1,389 3,175 TIO-540-J2B2 Cessna 210 Centurion
Single Engine (Fixed Prop)
io 540 1,447 1,126 2,573 TIO-540-J2B2 Cessna 210 Centurion
io 360 2,912 3,348 6,260 TIO-540-J2B2 Raytheon Beech Bonanza 36
io 540 157 181 339 TIO-540-J2B2 Cessna 210 Centurion Single Engine
(Variable Prop)
tio 540 366 421 787 TIO-540-J2B2 Cessna 210 Centurion
o 360 236 1,253 1,489 IO-360B Cessna 377 Skymaster
io 320 24 129 153 IO-360B Cessna 377 Skymaster
io 360 33 175 208 IO-360B Cessna 377 Skymaster
Multi-Engine Piston
tio 540 238 1,263 1,501 TIO-540-J2B2 Cessna 310
pt6a-42 11 228 240 PT6A-42 Raytheon Super King Air 200
pt6a-67 107 2,142 2,249 PT6A-67D Raytheon Beech 1900-D
pt61-114 13 270 284 PT61-144A Cessna 208 Caravan Turboprop
tpe331 32 652 684 TPE331-10 Rockwell Commander 690
ae3007 0 1,389 1,389 AE3007A1/3 Type 2 Embraer ERJ135
jt 15d 0 397 397 JT-15D-5 Cessna 560 Citation XLS
tfe 731 0 432 432 TFE731-3 Gulfstream G150
tfe 731-2-2b 0 1,058 1,058 TFE 731-2-2B Bombardier LearJet 35
ge cf34-3a 0 163 163 CF34-3A LEC II Bombardier Challenger 601
Turbojet
br700-710a2 0 73 73 BR700-710A2-20 Bombardier Global Express
o 360 35,145 10,177 45,322 IO-360-B Robinson R22 Helicopter Piston io 540 1,849 536 2,385 TIO-540-J2B2 R-44 Helicopter
rr 250 77 454 531 250B17B Bell 206 Jet Ranger
t53 11 50 294 345 T53-L-11D Bell AH-1S Helicopter Turbine
hio 360 229 1,346 1,575 IO-360-B Robinson R22
Totals 71,001 49,344 120,345
Source: CH2MHILL, 2008 and EDMS default aircraft characteristics
3
TABLE 2. CONSOLIDATED AIRCRAFT FLEET MIX FOR 2012 OPERATIONS
Aircraft Class
Engine Class TGOs LTOs Total
Representative Engine Class (EDMS 5.1)
Representative Aircraft
(EDMS 5.1)
o 235 7,301 5,539 12,839 O-200 Cessna 150 Series
o 320 24,065 18,257 42,322 O-320 Cessna 172 Skyhawk
o 360 357 271 627 IO-360B Cessna 182
io 360 3,337 2,531 5,868 IO-360B Cessna 182
tio 540 2,381 1,806 4,187 TIO-540-J2B2 Cessna 210 Centurion
Single Engine (FP)
io 540 1,927 1,462 3,389 TIO-540-J2B2 Cessna 210 Centurion
io 360 4,027 4,254 8,281 TIO-540-J2B2 Raytheon Beech Bonanza 36
io 540 217 230 447 TIO-540-J2B2 Cessna 210 Centurion Single Engine (VPP)
tio 540 506 535 1,041 TIO-540-J2B2 Cessna 210 Centurion
o 360 415 1,545 1,960 IO-360B Cessna 377 Skymaster
io 320 43 158 201 IO-360B Cessna 377 Skymaster
io 360 58 216 275 IO-360B Cessna 377 Skymaster
Multi-Engine Piston
tio 540 420 1,564 1,984 TIO-540-J2B2 Cessna 310
pt6a-42 18 302 321 PT6A-42 Raytheon Super King Air 200
pt6a-67 172 2,864 3,037 PT6A-67D Raytheon Beech 1900-D
pt61-114 21 356 377 PT61-144A Cessna 208 Caravan Turboprop
tpe331 52 862 914 TPE331-10 Rockwell Commander 690
ae3007 0 2,570 2,570 AE3007A1/3 Type 2 Embraer ERJ135
jt 15d 0 724 724 JT-15D-5 Cessna 560 Citation XLS
tfe 731 0 789 789 TFE731-3 Gulfstream G150
tfe 731-2-2b 0 1,942 1,942 TFE 731-2-2B Bombardier LearJet 35
ge cf34-3a 0 295 295 CF34-3A LEC II Bombardier Challenger 601
Turbojet
br700-710a2 0 133 133 BR700-710A2-20 Bombardier Global Express
o 360 34,675 4,893 39,568 IO-360-B Robinson R22 Helicopter Piston io 540 1,825 258 2,083 TIO-540-J2B2 R-44 Helicopter
rr 250 77 459 536 250B17B Bell 206 Jet Ranger
t53 11 49 292 341 T53-L-11D Bell AH-1S Helicopter Turbine
hio 360 225 1,349 1,574 IO-360-B Robinson R22
Totals 82,167 56,455 138,622
Source: CH2MHILL, 2008 and EDMS default aircraft characteristics

AIR QUALITY ANALYSIS ASSUMPTIONS
4
TABLE 3. CONSOLIDATED AIRCRAFT FLEET MIX FOR 2015 OPERATIONS Aircraft Class
Engine Class TGOs LTOs Total
Representative Engine Class (EDMS 5.1)
Representative Aircraft (EDMS 5.1)
o 235 7,703 5,844 13,547 O-200 Cessna 150 Series
o 320 25,392 19,264 44,657 O-320 Cessna 172 Skyhawk
o 360 376 286 662 IO-360B Cessna 182
io 360 3,520 2,671 6,191 IO-360B Cessna 182
tio 540 2,512 1,906 4,418 TIO-540-J2B2 Cessna 210 Centurion
Single Engine (FP)
io 540 2,033 1,542 3,575 TIO-540-J2B2 Cessna 210 Centurion
io 360 4,268 4,506 8,774 TIO-540-J2B2 Raytheon Beech Bonanza 36
io 540 230 243 474 TIO-540-J2B2 Cessna 210 Centurion Single Engine (VPP)
tio 540 536 566 1,103 TIO-540-J2B2 Cessna 210 Centurion
o 360 438 1,630 2,068 IO-360B Cessna 377 Skymaster
io 320 45 167 212 IO-360B Cessna 377 Skymaster
io 360 61 228 290 IO-360B Cessna 377 Skymaster
Multi-Engine Piston
tio 540 443 1,650 2,093 TIO-540-J2B2 Cessna 310
pt6a-42 20 328 348 PT6A-42 Raytheon Super King Air 200
pt6a-67 187 3,112 3,299 PT6A-67D Raytheon Beech 1900-D
pt61-114 23 386 409 PT61-144A Cessna 208 Caravan Turboprop
tpe331 56 936 992 TPE331-10 Rockwell Commander 690
ae3007 0 2,754 2,754 AE3007A1/3 Type 2 Embraer ERJ135
jt 15d 0 775 775 JT-15D-5 Cessna 560 Citation XLS
tfe 731 0 846 846 TFE731-3 Gulfstream G150
tfe 731-2-2b 0 2,082 2,082 TFE 731-2-2B Bombardier LearJet 35
ge cf34-3a 0 316 316 CF34-3A LEC II Bombardier Challenger 601
Turbojet
br700-710a2 0 143 143 BR700-710A2-20 Bombardier Global Express
o 360 34,675 4,893 39,568 IO-360-B Robinson R22 Helicopter Piston io 540 1,825 258 2,083 TIO-540-J2B2 R-44 Helicopter
rr 250 77 459 536 250B17B Bell 206 Jet Ranger
t53 11 49 292 341 T53-L-11D Bell AH-1S Helicopter Turbine
hio 360 225 1,349 1,574 IO-360-B Robinson R22
Totals 84,695 59,430 144,125
Source: CH2MHILL, 2008 and EDMS default aircraft characteristics

5
1.2 Aircraft Times in Mode All of the alternatives under consideration would accommodate the forecast levels of aviation activity, although without airfield improvements, congestion and delay would increase. Table 4 shows that under Alternative 1, the No Action Alternative, aircraft would require more time to taxi in and out than under Alternatives 2 or 3 because congestion and delay would increase without the addition of runway capacity.
TABLE 4. SUMMARY OF EDMS INPUTS AND ASSUMPTIONS
Year Scenario
Annual Aircraft Operations (Helicopter
and Fixed Wing)
TGO Cycles LTO
Cycles Average Aircraft Taxi-
In/Out (minutes)
2007 Existing Condition 240,690 71,001 49,344 10.0
2012 Alternative 1 277,244 82,167 56,455 11.1
2012 Alternatives 2 & 3 277,244 82,167 56,455 9.1
2015 Alternative 1 288,250 84,695 59,430 12.4
2015 Alternatives 2 & 3 288,250 84,695 59,430 9.1
Source: CH2M HILL Analysis
By 2012, HIO is forecast to accommodate 277,244 aircraft operations annually. By 2015, annual operations are forecast to reach 288,250. As the volume of aircraft operations would not be affected by the proposed project, the alternatives under consideration would not differ with respect to the fleet mix of aircraft types using HIO.
At present, the average delay per aircraft is about 1 minute, contributing to a total taxi in and out time of 10 minutes. Without the proposed capacity improvements, delays would increase by an additional 1.1 minutes, contributing to a total taxi in and out time of 11.1 minutes. Either of the project alternatives would reduce annual delay per aircraft to less than 1 minute. This reduction in aircraft delay would decrease aircraft emissions relative to the No Action Alternative.
Aircraft emissions were computed by EDMS for each aircraft on a landing take-off (LTO) or touch and go (TGO) cycle basis. An aircraft LTO consists of two operations; a landing, and a take-off. A complete LTO cycle consists of the following modes:
• Approach - from the time that an aircraft descends below the mixing level (assumed to be 3,000 feet above ground level) until the aircraft exits the runway.
• Taxi/idle ground time - the time required for an aircraft to taxi from the runway to the gate, including delays, and the time required to taxi from the gate to the runway, including delays. Observed ground times of 10-minutes were used to estimate taxi/idle times for existing (2007) conditions. As noted above, these values were adjusted to account for the increased delay associated with each alternative for the future years.
• Take-off – from the time the aircraft applies take-off power until it reaches approximately 800 feet above ground level. This analysis used the EDMS default assumptions.

AIR QUALITY ANALYSIS ASSUMPTIONS
6
• Climb-out – from the time the aircraft reaches 800 feet above ground level until it reaches 3,000 feet above ground level. This analysis used the EDMS default assumptions.
Many aircraft also perform pilot training activities by conducting a series of continuous take-offs and landings, called touch and go cycles (TGOs). The TGOs also comprise two operations consisting of the same aircraft modes, except that there is no taxi/idle time while the aircraft is on the ground. Hillsboro Airport experiences many flight training activities, especially helicopter TGOs. Piston aircraft are commonly used to minimize training costs.
The amount of engine thrust required for each of the LTO and TGO modes influences emissions. The amount of time that each type of aircraft typically spends in each of the modes is used to calculate emissions. The EDMS calculations assumed default time values for the airborne times in mode (approach, take-off, and climb-out). These values are specific to the performance characteristics of each type of aircraft. The estimated total taxi in/out times ranged from 10 minutes in 2007 to 12.4 minutes in 2015 without the project
EDMS computes criteria pollutant emissions for each mode of operation for each aircraft type, and sums them to provide a total of pollutants. The amount of fuel burned by each aircraft is also computed by EDMS, and serves as an indicator of the amount of Greenhouse gasses produced. Because the piston engines utilized in the majority of the general aviation aircraft are older technology, they require lead (Pb) in their fuel. Estimates of lead emitted from the piston engines were based upon the lead content of Avgas burned during the LTO or TGO cycle. The lead content of Avgas was specified at 0.0046 pounds/gallon by the American Standards for Testing and Materials (ASTM, 2005). Annual Pb emissions from the operations of piston aircraft were estimated by multiplying the annual amount of Avgas burned, by the fraction of lead contained in the fuel.
2. Toxic Air Contaminants Toxic air contaminants (TAC) comprise approximately 400 chemicals listed and regulated under the state and local air toxics regulations, while HAPs are comprised of 189 chemicals regulated by the federal CAA. Because the list of TACs includes all HAPs, the term TACs is used here to represent both. TACs are components of volatile organic compounds (VOCs) and particulate matter (PM). For example, a small fraction of the total PM emissions from diesel exhaust may be cadmium, and a small portion of the VOC is toluene. TAC emissions are, therefore, proportional to VOC and PM emissions.
Because the data available for estimating TACs from aircraft and other on-airport activities are severely limited, VOC and PM are used as an indicator of the effect of airport improvements on toxic air pollutant emissions. In 2012 operation of the parallel runway in Alternatives 2 or 3 would slightly decrease aircraft VOC and PM emissions by reducing congestion and delay. Emissions of TACs would therefore be decrease as well. Likewise, because the predicted emissions of VOC and PM are lower for the project than under No Action in 2015 TAC, emissions for Alternatives 2 or 3 would also be lower than for Alternative 1.

7
3. Construction Emissions Construction emissions would be short-term in nature. CH2M HILL estimated construction emissions on the basis of a preliminary (20 to 25 percent) design for the Alternatives 2 and 3. These designs were used to develop a “Class Three” cost estimate as defined by the American Association of Cost Estimators (AACE), which provided the basis for estimates of construction vehicle activity. Material quantities developed for the costs estimates were used to develop estimates of construction vehicle activity associated with site grading, demolition, asphalt paving, truck hauling, and fuel combustion in gasoline and diesel-fueled vehicles and construction equipment.
3.1 Emissions Factors The EDMS does not calculate air emissions associated with construction activity. As shown in Table 5, criteria pollutant emissions from construction activity were estimated using emission factors from the EPA Compilation of Air Pollutant emission factors, Volume 1 (AP-42) (EPA, 1995), the EPA NONROAD2005 Model, and on-road mobile source emission factors from the MOBILE6.21 Mobile Source Emissions Model developed by the EPA (EPA, 2004).
TABLE 5. CONSTRUCTION EMISSION FACTOR SOURCES Construction Activity Emission Factor Source
Site grading – fugitive dust EPA AP-42 Emission Factors
Demolition – fugitive dust EPA AP-42 Emission Factors
Asphalt paving EPA AP-42 Emission Factors
Truck hauling and worker commute vehicle exhaust EPA MOBILE6.2 Model
Diesel-fueled equipment exhaust EPA NONROAD2005 Model
3.2 Construction Vehicle Activity Estimates Construction-related emissions were estimated for the peak year identified based on a review of the project phasing and selection of the year with the greatest amount of construction activity. Quantities for the analysis were prepared by CH2M HILL in developing the Class Three cost estimate (see Attachment 1). The quantities of work include those for all the major construction activities, including earthwork, pipe installation, subgrade stabilization, base course paving, asphalt paving, and electrical installation.
Construction emissions estimates included heavy truck trips involved in hauling building materials from the material supplier to the site, as well as the heavy equipment that will be used to place the material. These emissions calculations are based on the estimated distance of major material suppliers from the Airport. The haul distance was calculated at between 15 miles and 35 miles depending on the material supplier location. On-site material such as earthwork/excavation did not include truck trips to the site, as this material is already at the site. The average speed of the trucks was estimated at 30 miles per hour, which allows for both on site driving and highway driving for the haul.
1 EPA, February 2004, MOBILE6.2 Users Guide.

AIR QUALITY ANALYSIS ASSUMPTIONS
8
The hours of equipment operation required to construct the project is based on CH2M HILL’s historical production rate for the airfield improvements to be constructed. The production rates in quantities per hour are considered conservative. For instance, for asphalt paving, 100 tons per hour equates to 1,000 tons in a 10 hour paving day. It is typical for an actual day of asphalt paving to be between 1,500 tons and 2,000 tons, especially on long straight pulls such as that for the runway at HIO. It is important to note that each piece of equipment should be able to meet the production rates shown, so in the event of two graders on site for the earthwork, the work would get done in half the time as one grader, therefore the hours of operation of the grader to complete the work would be the same.
The calculations assumed the type of equipment required by the FAA specifications and historically used for the construction of these types of items. For instance, lime stabilized subgrade would require the use of heavy trucks to haul the lime to the site, a mixer to mix the lime into the soil in-situ, a grader to finish grade the material to the plan elevations, and a roller to smooth out the material for acceptance and placement of the base course on top. The breakdown of equipment required to perform each item is included with the equipment operating calculations.
Once the total hours of operation for each piece of equipment were calculated, the hours were then placed into the spreadsheet for emissions calculations. Values for the typical emission rates per hour of operation were taken from the U.S. Environmental Protection Agency’s NONROAD model, which establishes standards for the maximum allowable emissions for non-road engines. In instances where the type of equipment is not rated by the US EPA (paver, rotomill, broom) emissions rates were estimated based on professional judgment.
Additional spreadsheets estimated emissions from off airport traffic worker commute trips using light-duty vehicle emission factors from MOBILE6. Worker commute trips were assumed for 200 employees traveling 25 miles round-trip to and from the airport for 200 days. Fugitive dust emissions from construction were calculated based on the volume of materials and the emission factors for PM10 from AP-42. Fugitive dust emissions from the construction sites were assumed to be reduced by 50 percent by watering the exposed areas three times a day. Currently, no emission factors are available to calculate the fugitive PM2.5 emissions. It was conservatively assumed that the PM2.5 emissions would be the same as the PM10 emissions.
The following attachments document the information used in developing the construction emissions estimates:
1. Alternative 2 Cost Estimates – identifies quantities of materials
2. Alternative 3 Cost Estimates – identifies quantities of materials
3. Construction Equipment Production Rates – estimates construction equipment effort required for specified quantities of materials
4. Construction Emissions – calculates construction emissions based on quantities, production rates, and emissions factors
5. HIO Construction Employee Commute and Dust Emissions

Attachment 1 Alternative 2 Cost Estimates

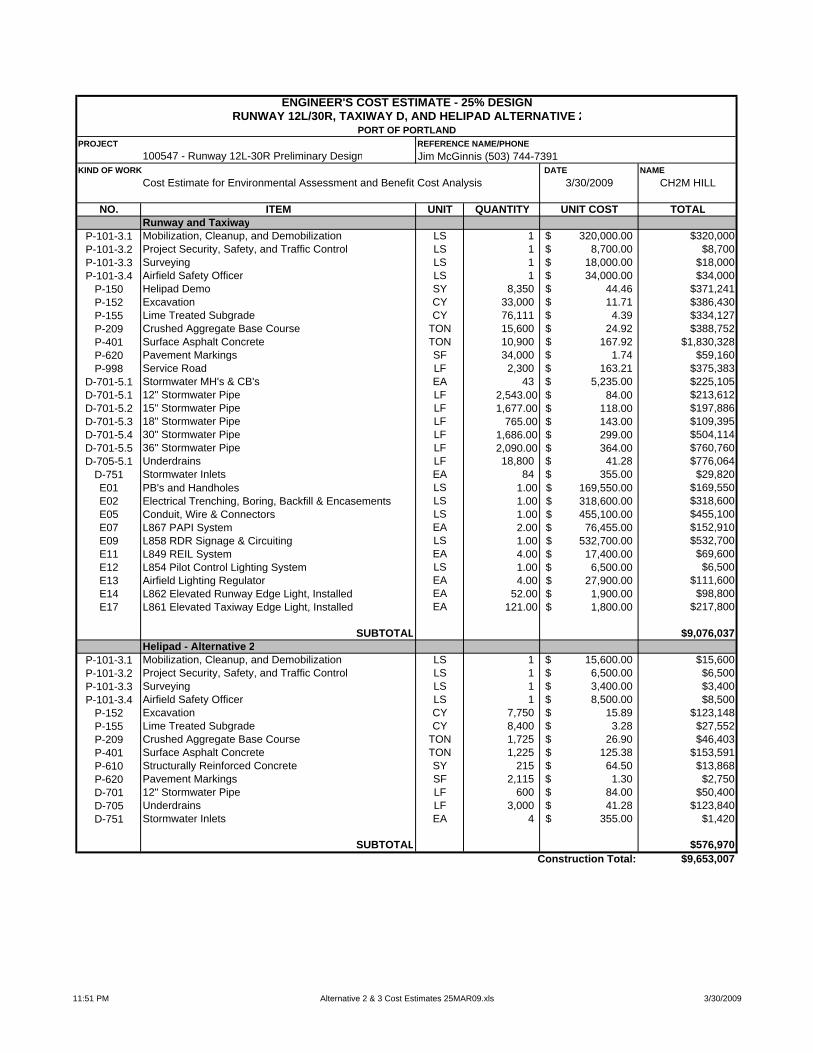
PROJECT REFERENCE NAME/PHONE100547 - Runway 12L-30R Preliminary Design Jim McGinnis (503) 744-7391
KIND OF WORK DATE NAME3/30/2009 CH2M HILL
NO. ITEM UNIT QUANTITY UNIT COST TOTAL Runway and Taxiway
P-101-3.1 Mobilization, Cleanup, and Demobilization LS 1 320,000.00$ $320,000P-101-3.2 Project Security, Safety, and Traffic Control LS 1 8,700.00$ $8,700P-101-3.3 Surveying LS 1 18,000.00$ $18,000P-101-3.4 Airfield Safety Officer LS 1 34,000.00$ $34,000
P-150 Helipad Demo SY 8,350 44.46$ $371,241P-152 Excavation CY 33,000 11.71$ $386,430P-155 Lime Treated Subgrade CY 76,111 4.39$ $334,127P-209 Crushed Aggregate Base Course TON 15,600 24.92$ $388,752P-401 Surface Asphalt Concrete TON 10,900 167.92$ $1,830,328P-620 Pavement Markings SF 34,000 1.74$ $59,160P-998 Service Road LF 2,300 163.21$ $375,383
D-701-5.1 Stormwater MH's & CB's EA 43 5,235.00$ $225,105D-701-5.1 12" Stormwater Pipe LF 2,543.00 84.00$ $213,612D-701-5.2 15" Stormwater Pipe LF 1,677.00 118.00$ $197,886D-701-5.3 18" Stormwater Pipe LF 765.00 143.00$ $109,395D-701-5.4 30" Stormwater Pipe LF 1,686.00 299.00$ $504,114D-701-5.5 36" Stormwater Pipe LF 2,090.00 364.00$ $760,760D-705-5.1 Underdrains LF 18,800 41.28$ $776,064
D-751 Stormwater Inlets EA 84 355.00$ $29,820E01 PB's and Handholes LS 1.00 169,550.00$ $169,550E02 Electrical Trenching, Boring, Backfill & Encasements LS 1.00 318,600.00$ $318,600E05 Conduit, Wire & Connectors LS 1.00 455,100.00$ $455,100E07 L867 PAPI System EA 2.00 76,455.00$ $152,910E09 L858 RDR Signage & Circuiting LS 1.00 532,700.00$ $532,700E11 L849 REIL System EA 4.00 17,400.00$ $69,600E12 L854 Pilot Control Lighting System LS 1.00 6,500.00$ $6,500E13 Airfield Lighting Regulator EA 4.00 27,900.00$ $111,600E14 L862 Elevated Runway Edge Light, Installed EA 52.00 1,900.00$ $98,800E17 L861 Elevated Taxiway Edge Light, Installed EA 121.00 1,800.00$ $217,800
SUBTOTAL $9,076,037 Helipad - Alternative 2
P-101-3.1 Mobilization, Cleanup, and Demobilization LS 1 15,600.00$ $15,600P-101-3.2 Project Security, Safety, and Traffic Control LS 1 6,500.00$ $6,500P-101-3.3 Surveying LS 1 3,400.00$ $3,400P-101-3.4 Airfield Safety Officer LS 1 8,500.00$ $8,500
P-152 Excavation CY 7,750 15.89$ $123,148P-155 Lime Treated Subgrade CY 8,400 3.28$ $27,552P-209 Crushed Aggregate Base Course TON 1,725 26.90$ $46,403P-401 Surface Asphalt Concrete TON 1,225 125.38$ $153,591P-610 Structurally Reinforced Concrete SY 215 64.50$ $13,868P-620 Pavement Markings SF 2,115 1.30$ $2,750D-701 12" Stormwater Pipe LF 600 84.00$ $50,400D-705 Underdrains LF 3,000 41.28$ $123,840D-751 Stormwater Inlets EA 4 355.00$ $1,420
SUBTOTAL $576,970Construction Total: $9,653,007
Cost Estimate for Environmental Assessment and Benefit Cost Analysis
ENGINEER'S COST ESTIMATE - 25% DESIGN
PORT OF PORTLANDRUNWAY 12L/30R, TAXIWAY D, AND HELIPAD ALTERNATIVE 2
11:51 PM Alternative 2 & 3 Cost Estimates 25MAR09.xls 3/30/2009


Attachment 2 Alternative 3 Cost Estimates


PROJECT REFERENCE NAME/PHONE100547 - Runway 12L-30R Preliminary Design Jim McGinnis (503) 744-7391
KIND OF WORK DATE NAME3/30/2009 CH2M HILL
NO. ITEM UNIT QUANTITY UNIT COST TOTAL Runway and Taxiway
P-101-3.1 Mobilization, Cleanup, and Demobilization LS 1 320,000.00$ $320,000P-101-3.2 Project Security, Safety, and Traffic Control LS 1 8,700.00$ $8,700P-101-3.3 Surveying LS 1 18,000.00$ $18,000P-101-3.4 Airfield Safety Officer LS 1 34,000.00$ $34,000
P-150 Helipad Demo SY 8,350 44.46$ $371,241P-152 Excavation CY 33,000 11.71$ $386,430P-155 Lime Treated Subgrade CY 76,111 4.39$ $334,127P-209 Crushed Aggregate Base Course TON 15,600 24.92$ $388,752P-401 Surface Asphalt Concrete TON 10,900 167.92$ $1,830,328P-620 Pavement Markings SF 34,000 1.74$ $59,160P-998 Service Road LF 2,300 163.21$ $375,383
D-701-5.1 Stormwater MH's & CB's EA 43 5,235.00$ $225,105D-701-5.1 12" Stormwater Pipe LF 2,543.00 84.00$ $213,612D-701-5.2 15" Stormwater Pipe LF 1,677.00 118.00$ $197,886D-701-5.3 18" Stormwater Pipe LF 765.00 143.00$ $109,395D-701-5.4 30" Stormwater Pipe LF 1,686.00 299.00$ $504,114D-701-5.5 36" Stormwater Pipe LF 2,090.00 364.00$ $760,760D-705-5.1 Underdrains LF 18,800 41.28$ $776,064
D-751 Stormwater Inlets EA 84 355.00$ $29,820E01 PB's and Handholes LS 1.00 169,550.00$ $169,550E02 Electrical Trenching, Boring, Backfill & Encasements LS 1.00 318,600.00$ $318,600E05 Conduit, Wire & Connectors LS 1.00 455,100.00$ $455,100E07 L867 PAPI System EA 2.00 76,455.00$ $152,910E09 L858 RDR Signage & Circuiting LS 1.00 532,700.00$ $532,700E11 L849 REIL System EA 4.00 17,400.00$ $69,600E12 L854 Pilot Control Lighting System LS 1.00 6,500.00$ $6,500E13 Airfield Lighting Regulator EA 4.00 27,900.00$ $111,600E14 L862 Elevated Runway Edge Light, Installed EA 52.00 1,900.00$ $98,800E17 L861 Elevated Taxiway Edge Light, Installed EA 121.00 1,800.00$ $217,800
SUBTOTAL $9,076,037 Helipad - Alternative 3
P-101-3.1 Mobilization, Cleanup, and Demobilization LS 1 15,600.00$ $15,600P-101-3.2 Project Security, Safety, and Traffic Control LS 1 6,500.00$ $6,500P-101-3.3 Surveying LS 1 3,400.00$ $3,400P-101-3.4 Airfield Safety Officer LS 1 8,500.00$ $8,500
P-152 Excavation CY 7,800 15.89$ $123,942P-155 Lime Treated Subgrade CY 8,400 3.28$ $27,552P-209 Crushed Aggregate Base Course TON 1,725 26.90$ $46,403P-401 Surface Asphalt Concrete TON 1,225 125.38$ $153,591P-610 Structurally Reinforced Concrete SY 215 64.50$ $13,868P-620 Pavement Markings SF 2,115 1.30$ $2,750D-701 12" Stormwater Pipe LF 600 84.00$ $50,400D-705 Underdrains LF 3,000 41.28$ $123,840D-751 Stormwater Inlets EA 4 355.00$ $1,420
SUBTOTAL $577,764Construction Total: $9,653,801
Cost Estimate for Environmental Assessment and Benefit Cost Analysis
ENGINEER'S COST ESTIMATE - 25% DESIGN
PORT OF PORTLANDRUNWAY 12L/30R, TAXIWAY D, AND HELIPAD ALTERNATIVE 3
11:53 PM Alternative 2 & 3 Cost Estimates 25MAR09.xls 3/30/2009


Attachment 3 Construction Equipment Production Rates

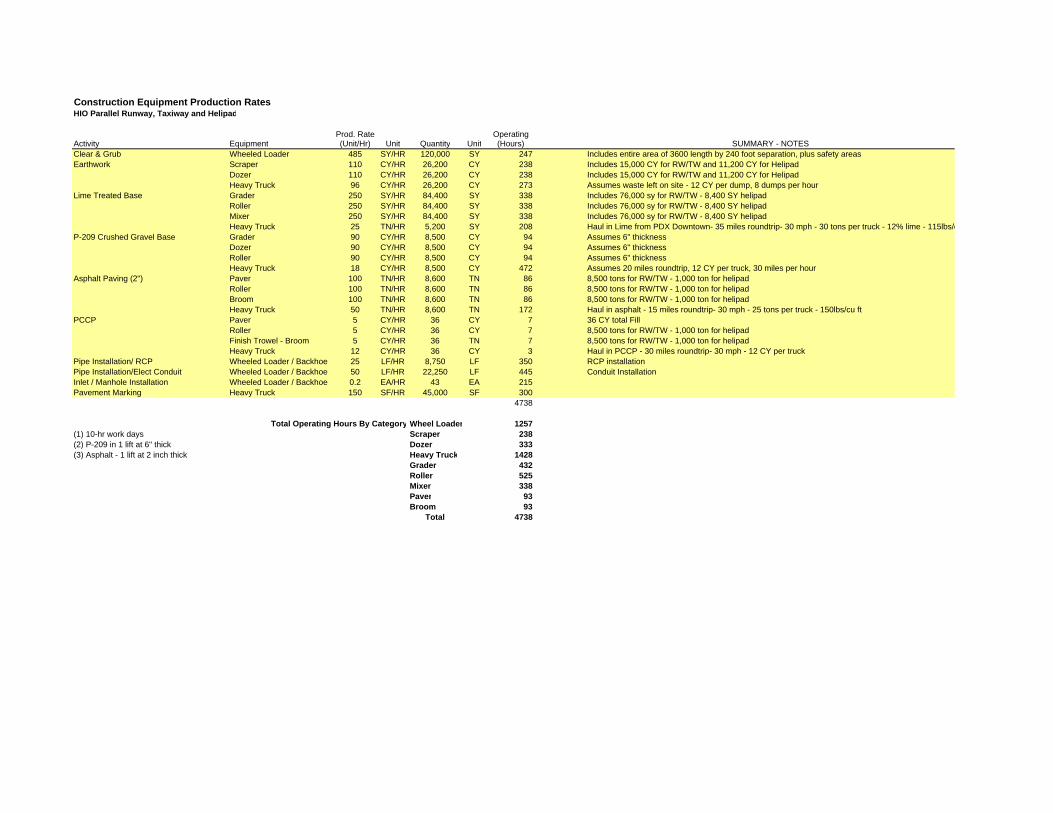
Construction Equipment Production Rates HIO Parallel Runway, Taxiway and Helipad
Prod. Rate OperatingActivity Equipment (Unit/Hr) Unit Quantity Unit (Hours) SUMMARY - NOTESClear & Grub Wheeled Loader 485 SY/HR 120,000 SY 247 Includes entire area of 3600 length by 240 foot separation, plus safety areasEarthwork Scraper 110 CY/HR 26,200 CY 238 Includes 15,000 CY for RW/TW and 11,200 CY for Helipad
Dozer 110 CY/HR 26,200 CY 238 Includes 15,000 CY for RW/TW and 11,200 CY for HelipadHeavy Truck 96 CY/HR 26,200 CY 273 Assumes waste left on site - 12 CY per dump, 8 dumps per hour
Lime Treated Base Grader 250 SY/HR 84,400 SY 338 Includes 76,000 sy for RW/TW - 8,400 SY helipadRoller 250 SY/HR 84,400 SY 338 Includes 76,000 sy for RW/TW - 8,400 SY helipadMixer 250 SY/HR 84,400 SY 338 Includes 76,000 sy for RW/TW - 8,400 SY helipadHeavy Truck 25 TN/HR 5,200 SY 208 Haul in Lime from PDX Downtown- 35 miles roundtrip- 30 mph - 30 tons per truck - 12% lime - 115lbs/c
P-209 Crushed Gravel Base Grader 90 CY/HR 8,500 CY 94 Assumes 6" thickness Dozer 90 CY/HR 8,500 CY 94 Assumes 6" thickness Roller 90 CY/HR 8,500 CY 94 Assumes 6" thickness Heavy Truck 18 CY/HR 8,500 CY 472 Assumes 20 miles roundtrip, 12 CY per truck, 30 miles per hour
Asphalt Paving (2") Paver 100 TN/HR 8,600 TN 86 8,500 tons for RW/TW - 1,000 ton for helipadRoller 100 TN/HR 8,600 TN 86 8,500 tons for RW/TW - 1,000 ton for helipadBroom 100 TN/HR 8,600 TN 86 8,500 tons for RW/TW - 1,000 ton for helipadHeavy Truck 50 TN/HR 8,600 TN 172 Haul in asphalt - 15 miles roundtrip- 30 mph - 25 tons per truck - 150lbs/cu ft
PCCP Paver 5 CY/HR 36 CY 7 36 CY total FillRoller 5 CY/HR 36 CY 7 8,500 tons for RW/TW - 1,000 ton for helipadFinish Trowel - Broom 5 CY/HR 36 TN 7 8,500 tons for RW/TW - 1,000 ton for helipadHeavy Truck 12 CY/HR 36 CY 3 Haul in PCCP - 30 miles roundtrip- 30 mph - 12 CY per truck
Pipe Installation/ RCP Wheeled Loader / Backhoe 25 LF/HR 8,750 LF 350 RCP installationPipe Installation/Elect Conduit Wheeled Loader / Backhoe 50 LF/HR 22,250 LF 445 Conduit InstallationInlet / Manhole Installation Wheeled Loader / Backhoe 0.2 EA/HR 43 EA 215Pavement Marking Heavy Truck 150 SF/HR 45,000 SF 300
4738
Total Operating Hours By Category Wheel Loader 1257(1) 10-hr work days Scraper 238(2) P-209 in 1 lift at 6" thick Dozer 333(3) Asphalt - 1 lift at 2 inch thick Heavy Truck 1428
Grader 432Roller 525Mixer 338Paver 93Broom 93
Total 4738


Attachment 4 Construction Emissions

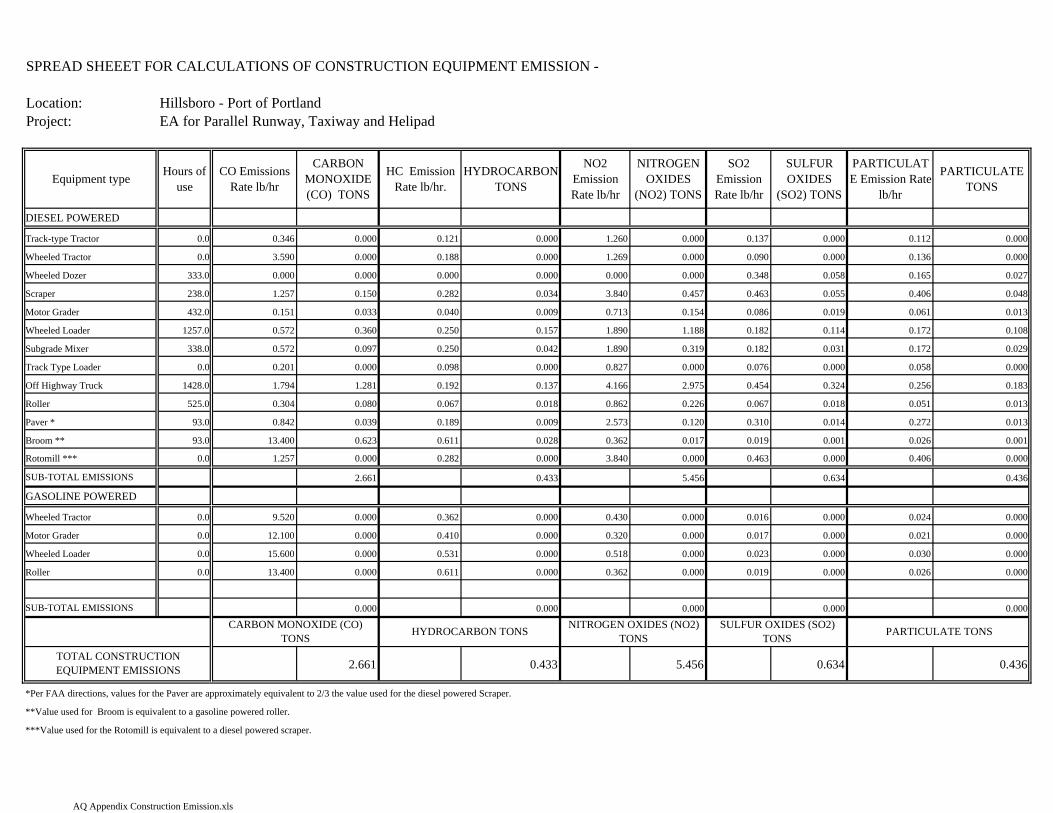
SPREAD SHEEET FOR CALCULATIONS OF CONSTRUCTION EQUIPMENT EMISSION -
Location: Hillsboro - Port of PortlandProject: EA for Parallel Runway, Taxiway and Helipad
Equipment type Hours of use
CO Emissions Rate lb/hr
CARBON MONOXIDE (CO) TONS
HC Emission Rate lb/hr.
HYDROCARBON TONS
NO2 Emission Rate lb/hr
NITROGEN OXIDES
(NO2) TONS
SO2 Emission Rate lb/hr
SULFUR OXIDES
(SO2) TONS
PARTICULATE Emission Rate
lb/hr
PARTICULATE TONS
DIESEL POWERED
Track-type Tractor 0.0 0.346 0.000 0.121 0.000 1.260 0.000 0.137 0.000 0.112 0.000
Wheeled Tractor 0.0 3.590 0.000 0.188 0.000 1.269 0.000 0.090 0.000 0.136 0.000
Wheeled Dozer 333.0 0.000 0.000 0.000 0.000 0.000 0.000 0.348 0.058 0.165 0.027
Scraper 238.0 1.257 0.150 0.282 0.034 3.840 0.457 0.463 0.055 0.406 0.048
Motor Grader 432.0 0.151 0.033 0.040 0.009 0.713 0.154 0.086 0.019 0.061 0.013
Wheeled Loader 1257.0 0.572 0.360 0.250 0.157 1.890 1.188 0.182 0.114 0.172 0.108
Subgrade Mixer 338.0 0.572 0.097 0.250 0.042 1.890 0.319 0.182 0.031 0.172 0.029
Track Type Loader 0.0 0.201 0.000 0.098 0.000 0.827 0.000 0.076 0.000 0.058 0.000
Off Highway Truck 1428.0 1.794 1.281 0.192 0.137 4.166 2.975 0.454 0.324 0.256 0.183
Roller 525.0 0.304 0.080 0.067 0.018 0.862 0.226 0.067 0.018 0.051 0.013
Paver * 93.0 0.842 0.039 0.189 0.009 2.573 0.120 0.310 0.014 0.272 0.013
Broom ** 93.0 13.400 0.623 0.611 0.028 0.362 0.017 0.019 0.001 0.026 0.001
Rotomill *** 0.0 1.257 0.000 0.282 0.000 3.840 0.000 0.463 0.000 0.406 0.000
SUB-TOTAL EMISSIONS 2.661 0.433 5.456 0.634 0.436
GASOLINE POWERED
Wheeled Tractor 0.0 9.520 0.000 0.362 0.000 0.430 0.000 0.016 0.000 0.024 0.000
Motor Grader 0.0 12.100 0.000 0.410 0.000 0.320 0.000 0.017 0.000 0.021 0.000
Wheeled Loader 0.0 15.600 0.000 0.531 0.000 0.518 0.000 0.023 0.000 0.030 0.000
Roller 0.0 13.400 0.000 0.611 0.000 0.362 0.000 0.019 0.000 0.026 0.000
SUB-TOTAL EMISSIONS 0.000 0.000 0.000 0.000 0.000
2.661 0.433 5.456 0.634 0.436
*Per FAA directions, values for the Paver are approximately equivalent to 2/3 the value used for the diesel powered Scraper.
**Value used for Broom is equivalent to a gasoline powered roller.
***Value used for the Rotomill is equivalent to a diesel powered scraper.
NITROGEN OXIDES (NO2) TONS
SULFUR OXIDES (SO2) TONS PARTICULATE TONS
TOTAL CONSTRUCTION EQUIPMENT EMISSIONS
CARBON MONOXIDE (CO) TONS HYDROCARBON TONS
AQ Appendix Construction Emission.xls


Attachment 5 HIO Construction Employee Commute and Dust Emissions


ON ROAD VEHICLE EMISSION ESTIMATESUSING EDMS VEHICLE RATES FROM MOBILE 6.2
ON ROAD VEHICLE ACTIVITIESRunway/Taxiway 2010 Helipad 2014
200 workers commutting 100 workers commutting25 miles RT 25 miles RT
200 days 120 days1,000,000 total VMT 300,000 total VMT
MOBILE 6.2 EMISSION RATES FROM EDMS RUN FOR HIOGR/MILE 2010
CO VOC NOX SOX PM10 PM2.5LT DUTY CARS 3.317 0.049 0.017 0.0075 0.0247 0.0112HD TRUCKS CLS7 0.3356 0.4146 2.4317 0.0092 0.0358 0.0188HD TRUCKS CLS8 0.5065 0.5221 2.8895 0.011 0.0636 0.0283
WORKERS EMISSIONS SUMMARYLT DUTY CARS CO VOC NOX SOX PM10 PM2.5
2010 7306.2 107.9 37.4 16.5 54.4 24.7 lbs3.65 0.05 0.02 0.01 0.03 0.01 tons
2014 2191.9 32.4 11.2 5.0 16.3 7.4 lbs1.10 0.02 0.01 0.00 0.01 0.00 tons
FUGITIVE DUST EMISSION SUMMARY AP-42
2010 ACTIVITY runway/taxiway AMOUNT RATE TONS/YREXCAVATE AND 150,000 tons 0.098 lb/ton 7.4MOVE FILL DIRT ON-SITE
Assume 50% Reduction by Watering 3.7