Embed Size (px)
Citation preview

•
APPENDIXVOLUME II
CITY OF TEMPEMARICOPA COUNTYSTATE OF ARIZONA
NIPJIDJE§ IPJE~IMIll1f AIPJ1D]LITcel~1rE(O)]fJ
]FCCDJ]S, JD)ll§ecJHIAn~HGJm;§ JFillCOJ]Ml JMIU. f~1TI(CrrLP%IL
§JEJFAmAilIE s)1r(OJffilR1I §]EWJE]A «I~Y101rr~)\0J
Property ofFI od Control Di~~t1'ict (f !'viC Library
F'lease P,cturr~ lC
280 I 'W L.; •.'r«n~,0
• Phoenix, AZ 85009
•
•
•
•
•
•
I•
•rGr .I City of Tempe
• 1199.013•.•.1 •••• 'f!I!lf!:I.
•
•
•
•
•
•
•
•
•
•
•
APPENDIX
VOLUME II
/

•ID
AP-01
Outfall Name
NORTH ADOT PIT
Area
182.696
Outfall Size
CHANNEL
Parent Id
• Landuse Retention Population Area % Tot Area COE CA Avg COE
Unknown 100 year on Site 0 13.596 7.44% .001 .014Comm Auto,Gas Sta,Pk Lot 100 year on Site 0 3.500 1.92% .001 .004Ind Park-l ight 100 year on Site 0 8.585 4.70% .001 .009Ind Park-l ight 100 year on Site 0 8.439 4.62% .001 .008
• Ind Large Site-Medium 100 year on Site 0 33.848 18.53% .001 .034Vacant Land Vacant Land 100 yr Retent 0 2.836 1.55% .001 .003
Summary for AP-01
•UnknownComm Auto,Gas Sta,Pk LotInd Park-l ightInd Large Site-MediumVacant LandTotal Street Area
100 year on Site100 year on Site100 year on Site100 year on SiteVacant Land 100 yr Retent
oooooo
13.5963.500
17.02433.848
2.836111.892
7.44%1.92%9.32%
18.53%1.55%
61.24%
.014
.004
.017
.034
.003106.297
0.0010.0010.0010.0010.0010.950
• AP-01 Drainage Area Totals
•
•
•
•
•
•
o 182.696 100.00% 106.369 0.582

•ID Outfall Name Area Outfall Size Parent Id
---------------------------------------------------------------------------------------_._----------------------------------------AP-02 SOUTH ADOT PIT 516.568 60----------------------------------------------------------------------------------------------------------------------------------
• Landuse Retention Population Area %Tot Area COE CA Avg COE-------------------------------------------------------------------------------------------------------------------------------Residential Low Density o year to Retention Basin 0 2.397 0.46% .200 .479Residential Low Density 100 year on Site 0 1.062 0.21% .001 .001Comm Hotels,Restraunts 100 year on Site 0 2.181 0.42% .001 .002Comm Auto,Gas Sta,Pk Lot o year to Retention Basin 0 12.994 2.52% .950 12.345
• Comm Auto,Gas Sta,Pk Lot 100 year on Lot 0 1.256 0.24% .001 .001Comm Auto,Gas Sta,Pk Lot 100 year on Site 0 1.251 0.24% .001 .001Comm Auto,Gas Sta,Pk Lot 100 year on Site 0 1.814 0.35% .001 .002Ind Park-light 100 year on Site 0 8.681 1.68% .001 .009Ind Park-light 100 year on Site 0 1.262 0.24% .001 .001Ind Park-l ight 100 year on Site 0 .966 0.19% .001 .001
• Ind Park-light 100 year on Site 0 .488 0.09% .001 .000Ind Park-light 100 year on Site 0 2.048 0.40% .001 .002Ind Park-light 100 year on Site 0 1.856 0.36% .001 .002Ind Park-light 100 year on Site 0 3.933 0.76% .001 .004Ind Park-light 100 year on Site 0 2.805 0.54% .001 .003Ind Park-light 100 year on Site 0 1.965 0.38% .001 .002
• Ind Park-l ight 100 year on Site 0 .691 0.13% .001 .001Ind Park-light 100 year on Site 0 1.239 0.24% .001 .001Ind Park-light 100 year on Site 0 1.665 0.32% .001 .002Ind Park-li ght 100 year on Site 0 2.374 0.46% .001 .002Ind Park-light 100 year on Site 0 5.375 1.04% .001 .005Ind Park-light 100 year on Site 0 2.344 0.45% .001 .002
• Ind Park-light 100 year on Site 0 3.039 0.59% .001 .003Ind Park-light 100 year on Site 0 2.509 0.49% .001 .003Ind Foundry,Elec,PPs 100 year on Site 0 1.010 0.20% .001 .001Ind Foundry,Elec,PPs 100 year on Site 0 .161 0.03% .001 .000Agricultural Vacant Land 100 yr Retent 0 141.333 27.36% .001 .141Vacant Land Retention Basin 0 36.800 7.12% 1.000 36.800
• Vacant Land Vacant Land 0 yr Retentio 0 2.597 0.50% .200 .519Vacant Land Vacant Land 0 yr Retentio 0 11.612 2.25% .200 2.322Vacant Land Vacant Land 100 yr Retent 0 2.388 0.46% .001 .002Vacant Land Vacant Land 100 yr Retent 0 .273 0.05% .001 .000Vacant Land Vacant Land 100 yr Retent 0 2.630 0.51% .001 .003Vacant Land Vacant Land 100 yr Retent 0 12.586 2.44% .001 .013
• Vacant Land Vacant Land 100 yr Retent 0 20.234 3.92% .001 .020Vacant Land Vacant Land 100 yr Retent 0 1.568 0.30% .001 .002Vacant Land Vacant Land 100 yr Retent 0 28.577 5.53% .001 .029Vacant Land Vacant Land 100 yr Retent 0 1.517 0.29% .001 .002Vacant Land Vacant Land 100 yr Retent 0 3.063 0.59% .001 .003Vacant Land Vacant Land 100 yr Retent 0 1.547 0.30% .001 .002
• Vacant Land Vacant Land 100 yr Retent 0 1.473 0.29% .001 .001Vacant Land Vacant Land 100 yr Retent 0 1.229 0.24% .001 .001Vacant Land Vacant Land 100 yr Retent 0 3.348 0.65% .001 .003Vacant Land Vacant Land 100 yr Retent 0 4.858 0.94% .001 .005Vacant Land Vacant Land 100 yr Retent 0 5.449 1.05% .001 .005Vacant Land Vacant Land 100 yr Retent 0 46.462 8.99% .001 .046
• Vacant Land Vacant Land 100 yr Retent 0 4.772 0.92% .001 .005Vacant Land Vacant Land 100 yr Retent 0 1.802 0.35% .001 .002
•

-------------------------------------------------------------------------------------------------------------------------------
----------------------------------------------------------------------------------------------------------------------------------Landuse
•
•
ID
AP-02
Outfall Name
SOUTH ADOT PIT
Retention
Area
516.568
Population Area
Outfall Size
60
%Tot Area COE CA
Parent Id
Avg COE
•
•
•
Summary, for AP-02
-------------------------------------------------------------------------------------------------------------------------------Residential Low Density o year to Retention Basin 0 2.397 .46% .479 0.200Residential Low Density 100 year on Site 0 1.062 .21% .001 0.001Comm Hotels,Restraunts 100 year on Site 0 2.181 .42% .002 0.001Comm Auto,Gas Sta,Pk Lot o year to Retention Basin 0 12.994 2.52% 12.345 0.950Comm Auto,Gas Sta,Pk Lot 100 year on Lot 0 1.256 .24% .001 0.001Comm Auto,Gas Sta,Pk Lot 100 year on Site 0 3.064 .59% .003 0.001Ind Park-light 100 year on Site 0 43.241 8.37% .043 0.001Ind Foundry,Elec,PPs 100 year on Site 0 1.171 .23% .001 0.001Agricultural Vacant Land 100 yr Retent 0 141.333 27.36% .141 0.001Vacant Land Retention Basin 0 36.800 7.12% 36.800 1.000Vacant Land Vacant Land 0 yr Retentio 0 14.209 2.75% 2.842 0.200Vacant Land Vacant Land 100 yr Retent 0 143.774 27.83% .144 0.001Total Street Area 0 113.086 21.89% 107.431 0.950
AP-02 Drainage Area Totals-------------------------------------------------------------------------------------------------------------------------------
•
•
•
•
•
•
o 516.568 100.00% 160.233 0.310

•10 Outfall Name Area Outfall Size Parent Id
•AP-02-A AUTOPLEX
Landuse Retention
99.546
Population Area
INDV RET
% Tot Area COE CA
AP-02
Avg COE
Comm Auto,Gas Sta,Pk Lot 100 year on Site 0 5.499 5.52% .001 .005Comm Auto,Gas Sta,Pk Lot 100 year on Site 0 5.342 5.37".4 .001 .005Comm Auto,Gas Sta,Pk Lot 100 year on Site 0 3.001 3.01% .001 .003Vacant Land Vacant Land 100 yr Retent 0 4.978 5.00% .001 .005
• Vacant Land Vacant Land 100 yr Retent 0 25.008 25.12% .001 .025Vacant Land Vacant Land 100 yr Retent 0 23.868 23.98% .001 .024Vacant Land Vacant Land 100 yr Retent 0 27.928 28.06% .001 .028Vacant Land Vacant Land 100 yr Retent 0 3.704 3.72% .001 .004
Summary for AP-02-A
•
•
•
•
•
•
•
•
Comm Auto,Gas Sta,Pk Lot 100 year on SiteVacant Land Vacant Land 100 yr RetentTotal Street Area
AP-02-A Drainage Area Totals)
ooo
o
13.84285.486
.218
99.546
13.91%85.88%
.22%
100.00%
.014
.085
.207
.306
0.0010.0010.950
0.003

•ID OutfaLL Name Area OutfaLL Size Parent Id
----------------------------------------------------------------------------------------------------------------------------------
-------------------------------------------------------------------------------------------------------------------------------
AP-02-B WARNER 1-10 COM CEN
• Landuse Retention
159.650
PopuLatioh Area
INDV RET
% Tot Area COE CA
AP-02
Avg COE
•
•
Ind Park-Light 100 year on Site 0 2.303 1.44% .001 .002Ind Park-Light 100 year on Site 0 1.483 0.93% .001 .001Ind Park-Light 100 year on Site 0 7.120 4.46% .001 .007AgricuLturaL Vacant Land 100 yr Retent 0 3.437 2.15% .001 .003AgricuLturaL Vacant Land 100 yr Retent 0 27.848 17.44% .001 .028AgricuLturaL Vacant Land 100 yr Retent 0 8.165 5.11% .001 .008AgricuLturaL Vacant Land 100 yr Retent 0 25.509 15.98% .001 .026AgricuLturaL Vacant Land 100 yr Retent 0 23.350 14.63% .001 .023Vacant Land Vacant Land 100 yr Retent 0 16.240 10.17"10 .001 .016Vacant Land Vacant Land 100 yr Retent 0 5.720 3.58% .001 .006Vacant Land Vacant Land 100 yr Retent 0 2.003 1.25% .001 .002
Summary for AP-02-B
-------------------------------------------------------------------------------------------------------------------------------
•Ind Park-LightAgricuLturaLVacant LandTotaL Street Area
100 year on SiteVacant Land 100 yr RetentVacant Land 100 yr Retent
oooo
10.90588.30923.96336.473
6.83%55.31%15.01%22.85%
.011
.088
.02434.649
0.0010.0010.0010.950
-------------------------------------------------------------------------------------------------------------------------------
•
•
•
•
•
•
AP-02-B Drainage Area TotaLs
o 159.650 100.00% 34.772 0.218

•ID Outfall Name Area Outfall Size Parent Id
----------------------------------------------------------------------------------------------------------------------------------
-------------------------------------------------------------------------------------------------------------------------------
----------------------------------------------------------------------------------------------------------------------------------AP-02-C SEC WARNER RD &HARDY SR
• Landuse Retention
43.650
Population Area
INDV RET
%Tot Area COE CA
QP-02
Avg COE
•
•
Ind Park-light o year to Retention Basin 0 .669 1.53% .350 .234Ind Park-light o year to Retention Basin 0 4.666 10.69% .200 .933Ind Park-light o year to Retention Basin 0 1.438 3.29% .300 .432Ind Park-l ight o year to Retention Basin 0 4.420 10.13% .250 1.105Ind Park-light o year to Retention Basin 0 1.737 3.98% .200 .347Ind Park-light o year to Retention Basin 0 1.158 2.65% .300 .347Ind Park-l ight 5 year on Si te 0 5.086 11.65% .002 .010Ind Park-light 100 year on Site 0 2.529 5.79% .001 .003Ind Park-light 100 year on Site 0 2.778 6.36% .001 .003Ind Park-light 100 year on Site 0 1.573 3.60% .001 .002Ind Park-light 100 year on Site 0 10.741 24.61% .001 .011Vacant Land Vacant Land 0 yr Retentio 0 .962 2.20% .200 .192
Summary for AP-02-C
-------------------------------------------------------------------------------------------------------------------------------Ind Park-light o year to Retention Basin 0 14.089 32.28% 3.399 0.241
• Ind Park-light 5 year on Si te 0 5.086 11.65% .010 0.002Ind Park-l ight 100 year on Site 0 17.622 40.37% .018 0.001Vacant Land Vacant Land 0 yr Retentio 0 .962 2.20% .192 0.200Total Street Area 0 5.891 13.50% 5.596 0.950
AP-02-C Drainage Area Totals
-----------------------------------------------------------------------------~-------------------------------------------------•
•
•
•
•
•
o 43.650 100.00% 9.215 0.211

Landuse
•
•
10
CP-01
Outfall Name
CANAL PARK LAKE
Retention
Area
8.187
Population Area
Outfall Size
ON-SITE RET
%Tot Area COE CA
Parent Id
Avg COE
•
Open Space, Pks, Golf
Summary for CP-01
Open Space, Pks, GolfTotal Street Area
o year to Waters of u.S.
o year to Waters of u.S.
o
oo
8.187
8.187.000
100.00%
100.00%.00%
1.000 8.187
8.187
.0001.0000.950
•
•
•
•
•
•
•
•
CP-01 Drainage Area Totals
o 8.187 100.00% 8.187 1.000

Landuse
•
•
10
GR-01
Outfall Name
RAY RD &SPRR
Retention
Area
167.435
Population Area
Outfall Size
N/A
% Tot Area COE CA
Parent Id
Avg COE
•
•
Residential Low Density Retention Basin 0 .056 0.03% 1.000 .056Residential Low Density Retention Basin 0 .056 0.03% 1.000 .056Residential Low Density Retention Basin 0 .116 0.07"" 1.000 .116Residential Low Density Retention Basin 0 .169 0.10% 1.000 .169Ind Foundry,Elec,PPs 100 year on Site 0 7.021 4.19% .001 .007Agricultural 100 year on Site 0 155.477 92.86% .001 .155Agricultural Vacant Land 100 yr Retent 0 3.884 2.32% .001 .004Vacant Land Retention Basin 0 .056 0.03% 1.000 .056Vacant Land Retention Basin 0 .056 0.03% 1.000 .056Vacant Land Retention Basin 0 .116 0.07"-' 1.000 .116
Summary for GR-01
Residential Low Density Retention Basin 0 .397 .24% .397 1.000Ind Foundry,Elec,PPs 100 year on Site 0 7.021 4.19% .007 0.001Agricultural • 100 year on Site 0 155.477 92.86% .155 0.001
• Agricultural Vacant Land 100 yr Retent 0 3.884 2.32% .004 0.001Vacant Land Retention Basin 0 .228 .14% .228 1.000Total Street Area 0 .428 .26% .407 0.950
GR-01 Drainage Area Totals
•
•
•
•
•
•
o 167.435 100.00% 1.198 0.007

•ID Outfall Name Area Outfall Size Parent Id
~----------------------------------------------------- ----------------------------------------------------------------------------
GR-02 RAY RD &MILL AVE 212.679 N/A----------------------------------------------------------------------------------------------------------------------------------
• Landuse Retention Population Area %Tot Area COE CA Avg COE-------------------------------------------------------------------------------------------------------------------------------Residential Low Density o year to Retention Basin 0 1.146 0.54% .550 .630Residential Low Density o year to Retention Basin 0 6.790 3.19% .550 3.735Residential Low Density o year to Retention Basin 0 1.799 0.85% .550 .989Residential Low Density o year to Retention Basin 0 3.367 1.58% .550 1.852
• Residential Low Density o year to Retention Basin 0 .958 0.45% .550 .527Residential Low Density o year to Retention Basin 0 3.517 1.65% .550 1.934Residential Low Density o year to Retention Basin 0 6.657 3.13% .550 3.661Residential Low Density o year to Retention Basin 0 2.940 1.38% .• 550 1.617Residential Low Density o year to Retention Basin 0 2.861 1.35% .550 1.574Residential Low Density o year to Retention Basin 0 .672 0.32% .550 .369
• Residential Low Density o year to Retention Basin 0 1.681 0.79% .550 .925Residential Low Density o year to Retention Basin 0 1.814 0.85% .550 .998Residential Low Density o year to Retention Basin 0 2.234 1.05% .550 1.229Residential Low Density o year to Retention Basin 0 1.902 0.89% .550 1.046Residential Low Density- o year to Retention Basin 0 1.281 0.60% .550 .705Residential Low Density o year to Retention Basin 0 1.179 0.55% .550 .649
• Residential Low Density o year to Retention Basin 0 1.683 0.79% .550 .926Residential Low Density o year to Retention Basin 0 2.167 1.02% .550 1.192Residential Low Density o year to Retention Basin 0 2.883 1.36% .550 1.586Residential Low Density o year to Retention Basin 0 4.633 2.18% .550 2.548Residential Low Density 100 year on Lot 0 16.849 7.92% .001 .017Comm Res Office, Church 100 year on Site 0 11.685 5.49% .001 .012
• Vacant Land Vacant Land 100 yr Retent 0 11.452 5.38% .001 .011Open Space, Pks, Golf Retention Basin 0 .138 0.06% 1.000 .138Open Space, Pks, Golf Retention Basin 0 1.489 0.70% 1.000 1.489Open Space, Pks, Golf Retention Basin 0 4.112 1.93% 1.000 4.112Open Space, School 100 year on Site 0 26.006 12.23% .001 .026Open Space, School 100 year on Site 0 48.855 22.97% .001 .049
• Summary for GR-02
-------------------------------------------------------------------------------------------------------------------------------Residential Low Density o year to Retention Basin 0 52.164 24.53% 28.690 0.550Residential Low Density 100 year on Lot 0 16.849 7.92% .017 0.001Comm Res Office, Church 100 year on Site 0 11.685 5.49% .012 0.001
• Vacant Land Vacant Land 100 yr Retent 0 11.452 5.38% .011 0.001Open Space, Pks, Golf Retention Basin 0 5.739 2.70% 5.739 1.000Open Space, School 100 year on Site 0 74.862 35.20% .075 0.001Total Street Area 0 39.928 18.77"1. 37.932 0.950
GR-02 Drainage Area Totals
-------------------------------------------------------------------------------------------------------------------------------•
•
•
o 212.679 100.00% 72.476 0.341

•ID
GR-03
Outfall Name
ALTA MIRA DEV
Area
150.794
Outfall Size
RET BASIN
Parent Id
• Landuse Retention Population Area %Tot Area COE CA Avg COE
-~---------------------------------------------------- -------------------------------------------------------------------------
Residential Low Density o year to Retention Basin 0 6.445 4.27% .550 3.545Residential Low Density o year to Retention Basin 0 7.103 4.71% .550 3.907Residential Low Density o year to Retention Basin 0 9.762 6.47"1. .550 5.369Residential Low Density o year to Retention Basin 0 3.359 2.23% .550 1.848
• Residential Low Density o year to Retention Basin 0 3.172 2.10% .550 1.744Residential Low Density o year to Retention Basin 0 2.795 1.85% .550 1.537Residential Low Density o year to Retention Basin 0 3.364 2.23% .550 1.850Residential Low Density o year to Retention Basin 0 5.864 3.89% .550 3.225Residential Low Density o year to Retention Basin 0 7.574 5.02% .550 4.166Residential Low Density o year to Retention Basin 0 5.160 3.42% .550 2.838
• Residential Low Density o year to Retention Basin 0 4.715 3.13% .550 2.593Residential Low Density o year to Retention Basin 0 4.774 3.17% .550 2.625Residential Low Density o year to Retention Basin 0 5.676 3.76% .550 3.122Residential Low Density o year to Retention Basin 0 4.503 2.99% .550 2.477Residential Low Density o year to Retention Basin 0 3.289 2.18% .550 1.809Residential Low Density o year to Retention Basin 0 8.995 5.97"1. .550 4.947
• Residential Low Density 5 year on Lot 0 8.915 5.91% .002 .018Residential Low Density 100 year on Site 0 18.893 12.53% .001 .019Residential Low Density Retention Basin 0 7.389 4.90% .550 4.064
Summary for GR-03-------------------------------------------------------------------------------------------------------------------------------
• Residential Low Density o year to Retention Basin 0 86.548 57.39% 47.602 0.550Residential Low Density 5 year on Lot 0 8.915 5.91% .018 0.002Residential Low Density 100 year on Site 0 18.893 12.53% .019 0.001Residential Low Density Retention Basin 0 7.389 4.90% 4.064 0.550Total Street Area 0 29.049 19.26% 27.597 0.950
• GR-03 Drainage Area Totals
-------------------------------------------------------------------------------------------------------------------------------0 150.794 100.00% 79.300 0.526
•
•
•
•

•ID
GR-04
Outfall Name
CIRCLE G RANCHES
Area
146.455
Outfall Size
INDV RET
Parent Id
• Landuse Retention Population Area %Tot Area COE CA Avg COE
•
Residential Low DensityVacant Land
Summary for GR-04
Residential Low DensityVacant LandTotal Street Area
100 year on Lot100 year on Site
100 year on Lot100 year on Site
oo
ooo
141.0535.379
141.0535.379
.023
96.31%3.67"1.
96.31%3.67%
.02%
.001
.001.141.005
.141
.005
.022
0.0010.0010.950
•
•
•
•
•
•
•
•
GR-04 Drainage Area Totals
o 146.455 100.00% .168 0.001

Landuse
•
•
ID
GR-05
Outfall Name
McCLINTOCK &KNOX
Retention
Area
3.318
Population Area
Outfall Size
N/A
% Tot Area COE CA
Parent Id
Avg COE
•Summary for GR-05
Vacant LandTotal Street Area
100 year on Site oo
.0003.318
.00%100.00%
.0003.152
0.0000.950
•
•
•
•
•
•
•
•
GR-05 Drainage Area Totals
o 3.318 100.00% 3.152 0.950

Landuse
•
•
ID
GR-06
Outfall Name
KNOX & LAKESHORE
Retention
Area
3.415
Population Area
Outfall Size
INDV RET
% Tot Area COE CA
Parent Id
Avg COE
•Summary for GR-06
Vacant LandTotal Street Area
100 year on Site oo
.0003.415
.00%100.00%
.0003.245
0.0000.950
•
•
•
•
•
•
•
•
GR-06 Drainage Area Totals
o 3.415 100.00% 3.245 0.950

•ID Outfall Name Area Outfall Size Parent Id
----------------------------------------------------------------------------------------------------------------------------------HP-01 HANGER PARK WEST 268.762 60----------------------------------------------------------------------------------------------------------------------------------
• Landuse Retention Population Area %Tot Area COE CA Avg COE
-------------------------------------------------------------------------------------------------------------------------------Residential Low Density o year to Retention Basin 0 .448 0.17% .550 .246Residential Low Density o year to Retention Basin 0 .458 0.17% .550 .252Residential Low Density o year to Retention Basin 0 .854 0.32% .550 .470Residential Low Density o year to Retention Basin 0 5.759 2.14% .550 3.167
• Residential Low Density o year to Retention Basin 0 6.572 2.45% .550 3.615Residential Low Density o year to Retention Basin 0 2.581 0.96% .650 1.678Residential Low Density o year to Retention Basin 0 2.963 1.10% .550 1.630Residential Low Density o year to Retention Basin 0 1.085 0.40% .550 .597Residential Low Density o year to Retention Basin 0 1.787 0.66% .550 .983Residential Low Density o year to Retention Basin 0 1.985 0.74% .550 1.092
• Residential Low Density o year to Retention Basin 0 .516 0.19% .650 .335Residential Low Density o year to Retention Basin 0 1.835 0.68% .650 1.193Residential Low Density o year to Retention Basin 0 1.527 0.57"1. .550 .840Residential Low Density o year to Retention Basin 0 1.693 0.63% .650 1.100Residential Low Density o year to Retention Basin 0 1.994 0.74% .650 1.296Residential Low Density o year to Retention Basin 0 1.297 0.48% .550 .713
• Residential Low Density o year to Retention Basin 0 .540 0.20% .550 .297Residential Low Density o year to Retention Basin 0 .507 0.19% .550 .279Residential Low Density o year to Retention Basin 0 1.018 0.38% .650 .662Residential Low Density o year to Retention Basin 0 .319 0.12% .650 .207Residential Low Density o year to Retention Basin 0 .000 0.00% .650 .000Residential Low Density o year to Retention Basin 0 .071 0.03% .650 .046
• Residential Low Density o year to Retention Basin 0 1.311 0.49% .650 .852Residential Low Density o year to Retention Basin 0 1.906 0.71% .650 1.239Residential Low Density o year to Retention Basin 0 1.666 0.62% .600 1.000Residential Low Density o year to Retention Basin 0 .977 0.36% .650 .635Residential Low Density o year to Retention Basin 0 1.606 0.60% .650 1.044Residential Low Density o year to Retention Basin 0 1.532 0.57"1. .650 .996
• Residential Low Density o year to Retention Basin 0 4.350 1.62% .650 2.827Residential Low Density o year to Retention Basin 0 .324 0.12% .650 .210Residential Low Density o year to Retention Basin 0 .220 0.08% .650 .143Residential Low Density o year to Retention Basin 0 .360 0.13% .650 .234Residential Low Density o year to Retention Basin 0 .778 0.29% .650 .505Residential Low Density o year to Retention Basin 0 .752 0.28% .650 .489
• Residential Low Density o year to Retention Basin 0 .459 0.17% .550 .252Residential Low Density o year to Retention Basin 0 .865 0.32% .650 .562Residential Low Density o year to Retention Basin 0 2.201 0.82% .550 1.211Residential Low Density o year to Retention Basin 0 2.306 0.86% .550 1.268Residential Low Density o year to Retention Basin 0 1.897 0.71% .550 1.044Residential Low Density o year to Retention Basin 0 2.240 0.83% .550 1.232
• Residential Low Density o year to Retention Basin 0 3.m 1.41% .550 2.077Residential Low Density o year to Retention Basin 0 6.296 2.34% .600 3.778Residential Low Density o year to Retention Basin 0 4.725 1.76% .550 2.599Residential Low Density o year to Retention Basin 0 9.620 3.58% .550 5.291Residential Low Density o year to Retention Basin 0 1.293 0.48% .650 .840Residential Low Density o year to Retention Basin 0 1.333 0.50% .650 .866
• Residential Low Density o year to Retention Basin 0 .368 0.14% .650 .239Residential Low Density o year to Retention Basin 0 2.456 0.91% .650 1.597Residential Low Density o year to Retention Basin 0 .555 0.21% .650 .361Residential Low Density o year to Retention Basin 0 3.222 1.20% .650 2.095
•

•1D Outfall Name Area Outfall Size Parent 1d
--------------------------------------------------------------------------------------.-------------------------------------------HP-01 HANGER PARK WEST 268.762 60------------------------------------------------------------------_.--------------------------------------------------------------
• Landuse Retention Population Area % Tot Area COE CA Avg COE-------------------------------------------------------------------------------------------------------------------------------Residential Low Density o year to Retention Basin 0 .955 0.36% .650 .620Residential Low Density o year to Retention Basin 0 21.313 7.93% .550 11.722Residential Low Density o year to Retention Basin 0 1.988 0.74% .550 1.094Residential Low Density o year to Retention Basin 0 3.426 1.27% .650 2.227
• Residential Low Density o year to Retention Basin 0 .969 0.36% .550 .533Residential Low Density o year to Retention Basin 0 .721 0.27% .550 .397Residential Low Density o year to Retention Basin 0 .648 0.24% .650 .421Residential Low Density o year to Retention Basin 0 .860 0.32% .550 .473Residential Low Density o year to Retention Basin 0 2.150 0.80% .650 1.397Residential Low Density o year to Retention Basin 0 .814 0.30% .650 .529
• Residential Low Density o year to Retention Basin 0 .759 0.28% .650 .493Residential Low Density o year to Retention Basin 0 .772 0.29% .650 .502Residential Low Density o year to Retention Basin 0 5.299 1. 97";' .550 2.915Residential Low Density o year to Retention Basin 0 .089 0.03% .650 .058Residential Low Density o year to Retention Basin 0 1.673 0.62% .550 .920Residential Low Density o year to Retention Basin 0 2.433 0.91% .550 1.338
• Residential Low Density o year to Retention Basin 0 .546 0.20% .650 .355Residential Low Density o year to Retention Basin 0 .892 0.33% .650 .580Residential Low Density 5 year on Lot 0 .774 0.29% .002 .002Residential Low Density 5 year on Lot 0 1.929 0.72% .002 .004Residential Low Density 5 year on Lot 0 .425 0.16% .002 .001Residential Low Density 5 year on Lot 0 2.809 1.05% .002 .006
• Residential Low Density 5 year on Lot 0 1. 712 0.64% .002 .003Residential Low Density Retention Basin 0 .522 0.19% 1.000 .522Comm Res Office, Church 100 year on Site 0 1.992 0.74% .001 .002Vacant Land 100 year on Site 0 3.606 1.34% .001 .004Vacant Land Vacant Land 100 yr Retent 0 2.954 1.10% .001 .003Open Space, Pks, Golf Detention Basin· 0 14.996 5.58% 1.000 14.996
• Open Space, Pks, Golf Retention Basin 0 .997 0.37% 1.000 .997Open Space, Pks, Golf Retention Basin 0 .844 0.31% 1.000 .844Open Space, Pks, Golf Retention Basin 0 .712 0.26% 1.000 .712Open Space, Pks, Golf Retention Basin 0 .013 0.00% 1.000 .013Open Space, Pks, Golf Retention Basin 0 .488 0.18% 1.000 .488Open Space, Pks, Golf Retention Basin 0 1.357 0.50% 1.000 1.357
• Open Space, Pks, Golf Retention Basin 0 4.979 1.85% 1.000 4.979Open Space, Pks, Golf Retention Basin 0 .574 0.21% 1.000 .574Open Space, Pks, Golf Retention Basin 0 .155 0.06% 1.000 .155Open Space, Pks, Golf Retention Basin 0 .472 0.18% 1.000 .472Open Space, Pks, Golf Retention Basin 0 3.436 1.28% 1.000 3.436Open Space, Pks, Golf Retention Basin 0 1.953 0.73% 1.000 1.953
• Open Space, Pks, Golf Retention Basin 0 1.696 0.63% 1.000 1.696Open Space, Pks, Golf Retention Basin 0 4.159 1.55% 1.000 4.159Open Space, Pks, Golf Retention Basin 0 2.945 1.10% 1.000 2.945Open Space, School 100 year on Lot 0 4.052 1.51% .001 .004Open Space, School 100 year on Site 0 .915 0.34% .001 .001Open Space, School 100 year on Site 0 6.001 2.23% .001 .006
• Summary for HP-01
-----------------------------------------------------------------------------------------------------------------------------_.Residential Low Density o year to Retention Basin 0 141.509 52.65% 82.756 0.585
•

•10
HP-01
Outfall Name
HANGER PARK WEST
Area
268.762
Outfall Size
60
Parent Id
• Landuse Retention Population Area %Tot Area COE CA Avg COE
Residential Low Density 5 year on Lot 0 7.650 2.85% .015 0.002Residential Low Density Retention Basin 0 .522 .19% .522 1.000Comm Res Office, Church 100 year on Site 0 1.992 .74% .002 0.001Vacant Land 100 year on Site 0 3.606 1.34% .004 0.001
• Vacant Land Vacant Land 100 yr Retent 0 2.954 1.10% .003 0.001Open Space, Pks, Golf Detention Basin 0 14.996 5.58% 14.996 1.000Open Space, Pks, Golf Retention Basin 0 24.780 9.22% 24.780 1.000Open Space, School 100 year on Lot 0 4.052 1.51% .004 0.001Open Space, School 100 year on Site 0 6.915 2.57% .007 0.001Total Street Area 0 59.786 22.24% 56.797 0.950
• HP-01 Drainage Area Totals
•
•
•
•
•
•
•
o 268.762 100.00% 179.886 0.669

•10 Outfall Name Area Outfall Size Parent Id
HP-01-A GROVE PRKY DEV 215.094 INDIV RET----------------------------------------------------------------------------------------------------------------------------------
• Landuse Retention Population Area % Tot Area CaE CA Avg CaE-------------------------------------------------------------------------------------------------------------------------------Residential High Density 100 year on Site 0 14.493 6.74% .001 .014Residential High Density 100 year on Site 0 9.814 4.56% .001 .010Residential High Density 100 year on Site 0 10.053 4.67% .001 .010Vacant Land o year to Waters of U.S. 0 1.179 0.55% .001 .001
• Vacant Land 100 year on Site 0 .152 0.07% .001 .000Vacant Land 100 year on Site 0 1.373 0.64% .001 .001Vacant Land 100 year on Site 0 .904 0.42% .001 .001Vacant Land Vacant Land 100 yr Retent 0 13.181 6.13% .001 .013Vacant Land Vacant Land 100 yr Retent 0 31.939 14.85% .001 .032Vacant Land Vacant Land 100 yr Retent 0 4.721 2.19% .001 .005
• Vacant Land Vacant Land 100 yr Retent 0 9.800 4.56% .001 .010Vacant Land Vacant Land 100 yr Retent 0 12.792 5.95% .001 .013Vacant Land Vacant Land 100 yr Retent 0 2.654 1.23% .001 .003Vacant Land Vacant Land 100 yr Retent 0 9.652 4.49% .001 .010Vacant Land Vacant Land 100 yr Retent 0 8.413 3.91% .001 .008
• Summary for HP-01-A
-------------------------------------------------------------------------------------------------------------------------------Residential High Density 100 year on Site 0 34.360 15.97% .034 0.001Vacant Land o year to Waters of U.S. 0 1.179 .55% .001 0.001Vacant Land 100 year on Site 0 2.430 1.13% .002 0.001Vacant Land Vacant Land 100 yr Retent 0 93.152 43.31% .093 0.001
• Total Street Area 0 83.973 39.04% 79.775 0.950
HP-01-A Drainage Area Totals
-------------------------------------------------------------------------------------------------------------------------------
•
•
•
•
•
o 215.094 100.00% 79.905 0.371

•ID Outfall Name Area Outfall Size Parent Id
.-.-------------------------------------------------------------------------------------------------------------------------------HP-01-B KNOX AND DATELAND 1062.371 54 HP-01------,----------------------------------------------------------------------------------------------------------------------------
• Landuse Retention Population Area %Tot Area COE CA Avg COE-----------------------------------------------------------------------------------------------------.------------------------.Residential Low Density o year to Retention Basin 0 .780 0.07"1. .400 .312Residential Low Density 100 year on Lot 0 16.670 1. 57"1. .001 .017Residential Low Density 100 year on Lot 0 4.491 0.42% .001 .004Residential Low Density 100 year on Lot 0 7.466 0.70% .001 .007
• Residential Low Density 100 year on Lot 0 4.358 0.41% .001 .004Residential Low Density 100 year on Lot 0 5.441 0.51% .001 .005Comm Res Office, Church 100 year on Site 0 1.797 0.17"1. .001 .002Comm Mall, Strp Cntr,Ret 100 year on Site 0 39.491 3.72% .001 .039Comm Mall, Strp Cntr,Ret 100 year on Site 0 27.275 2.57"1. .001 .027Comm Auto,Gas Sta,Pk Lot 100 year on Site 0 1.152 0.11% .001 .001
• Ind Park-light 100 year on Site 0 3.083 0.29% .001 .003Ind Park-light 100 year on Site 0 5.658 0.53% .001 .006Ind Large Site-Medium 100 year on Site 0 139.674 13.15% .001 .140Ind Large Site-Medium 100 year on Site 0 5.745 0.54% .001 .006Ind Foundry,Elec,PPs 100 year on Site 0 2.451 0.23% .001 .002Ind Foundry,Elec,PPs 100 year on Site 0 23.779 2.24% .001 .024
• Agricultural 100 year on Site 0 20.572 1.94% .001 .021Agricultural Vacant Land 100 yr Retent 0 32.393 3.05% .001 .032Agricultural Vacant Land 100 yr Retent 0 126.191 11.88% .001 .126Agricultural Vacant Land 100 yr Retent 0 77.463 7.29% .001 .077Agricultural Vacant Land 100 yr Retent 0 73.040 6.88% .001 .073Agricultural Vacant Land 100 yr Retent 0 110.132 10.37"1. .001 .110
• Agricultural Vacant Land 100 yr Retent 0 46.503 4.38% .001 .047Vacant Land Vacant Land 100 yr Retent 0 22.331 2.10% .001 .022Vacant Land Vacant Land 100 yr Retent 0 12.707 1.20% .001 .013Vacant Land Vacant Land 100 yr Retent 0 14.400 1.36% .001 .014Vacant Land Vacant Land 100 yr Retent 0 95.714 9.01% .001 .096Vacant Land Vacant Land 100 yr Retent 0 2.007 0.19% .001 .002
• Open Space, Pks, Golf 100 year on Site 0 2.468 0.23% .001 .002Open Space, School 100 year on Site 0 13.200 1.24% .001 .013Open Space, School 100 year on Site 0 8.510 0.80% .001 .009Municpal Facilities 100 year on Site 0 14.682 1.38% .001 .015
Summary for HP-01-B
• -------------------------------------------------------------------------------------------------------------------------------Residential Low Density o year to Retention Basin 0 .780 .07% .312 0.400Residential Low Density 100 year on Lot 0 38.426 3.62% .038 0.001Comm Res Office, Church 100 year on Site 0 1;797 •17"1. .002 0.001Comm Mall, Strp Cntr,Ret 100 year on Site 0 66.766 6.28% .067 0.001Comm Auto,Gas Sta,Pk Lot 100 year on Site 0 1.152 .11% .001 0.001
• Ind Park-light 100 year on Site 0 8.741 .82% .009 0.001Ind Large Site-Medium 100 year on Site 0 145.418 13.69% .145 0.001Ind Foundry,Elec,PPs 100 year on Site 0 26.230 2.47"1. .026 0.001Agricultural 100 year on Site 0 20.572 1.94% .021 0.001Agricultural Vacant Land 100 yr Retent 0 465.721 43.84% .466 0.001Vacant Land Vacant Land 100 yr Retent 0 147.158 13.85% .147 0.001
• Open Space, Pks, Golf 100 year on Site 0 2.468 .23% .002 0.001Open Space, School 100 year on Site 0 21.709 2.04% .022 0.001Municpal Facilities 100 year on Site 0 14.682 1.38% .015 0.001
•

•ID Outfall Name Area Outfall Size Parent Id
Landuse•HP-01-B KNOX AND DATELAND
Retention
1062.371
Population Area
54
%Tot Area COE
HP-01
CA Avg COE
Total Street Area o 100.751 9.48% 95.713 0.950
•
•
•
•
•
•
•
•
•
HP-01-B Drainage Area Totals
o 1062.371 100.00% 96.986 0.091

•ID Outfall Name Area Outfall Size Parent Id
•HP-01-C WARNER RD BUS PARK
Landuse Retention
101.826
Population Area
INDV RET
% Tot Area COE
HP-01
CA Avg COE
Comm Mall, Strp Cntr,Ret 100 year on Site 0 15.812 15.53% .001 .016Ind Park-light 100 year on Site 0 2.172 2.13% .001 .002Ind Park-light 100 year on Site 0 2.166 2.13% .001 .002Vacant Land Vacant Land 100 yr Retent 0 15.858 15.57% .001 .016
• Vacant Land Vacant Land 100 yr Retent 0 21.752 21.36% .001 .022Vacant Land Vacant Land 100 yr Retent 0 4.065 3.99% .001 .004Vacant Land Vacant Land 100 yr Retent 0 7.472 7.34% .001 .007Vacant Land Vacant Land 100 yr Retent 0 11.092 10.89% .001 .011Vacant Land Vacant Land 100 yr Retent 0 11.312 11.11% .001 .011
• Summary for HP-01-C-----------------------------------------------.-------------------------------------------------------------------------------Comm Mall, Strp Cntr,Ret 100 year on Site 0 15.812 15.53% .016 0.001Ind Park-light 100 year on Site 0 4.338 4.26% .004 0.001Vacant Land Vacant Land 100 yr Retent 0 71.552 70.27% .072 0.001Total Street Area 0 10.124 9.94% 9.618 0.950
• HP-01-C Drainage Area Totals
•
•
•
•
•
•
o 101.826 100.00% 9.710 0.095

•ID Outfall Name Area Outfall Size Parent Id
~.- .._._---------------------------------------------- ----------------------------------------------------------------------.-----HP-02 HANGER PARK EAST 1579.274 INDV RET----------------------------------------------------------------------------------------------------------------------------------
• Landuse Retention Population Area %Tot Area COE CA Avg COE----------------------------------------------------------------------------------------------------------------.--------------Residential Low Density 5 year on Lot 0 4.874 0.31% .002 .010
Residential Low Density 100 year on Lot 0 23.493 1.49% .001 .023
Residential Low Density 100 year on Lot 0 14.611 0.93% .001 .015
Residential Low Density 100 year on Lot 0 33.215 2.10% .001 .033
• Residential Low Density 100 year on Lot 0 144.557 9.15% .001 .145
Residential Low Density 100 year on Lot 0 76.481 4.84% .001 .076
Residential Low Density 100 year on Lot 0 1.683 0.11% .001 .002
Residential Low Density 100 year on Lot 0 18.798 1.19% .001 .019
Residential Low Density 100 year on Lot 0 68.070 4.31% .001 .068
Residential Low Density 100 year on Lot 0 18.681 1.18% .001 .019
• Residential Low Density 100 year on Lot 0 71.717 4.54% .001 .072
Residential Low Density 100 year on Lot 0 4.595 0.29% .001 .005
Residential Low Density 100 year on Lot 0 57.046 3.61% .001 .057
Residential Low Density 100 year on Lot 0 97.858 6.20% .001 .098
Residential Low Density 100 year on Lot 0 27.934 1. 77"1. .001 .028
Residential Low Density 100 year on Lot 0 3.477 0.22% .001 .003
• Residential Low Density 100 year on Lot 0 39.337 2.49% .001 .039
Residential Low Density 100 year on Lot 0 19.159 1.21% .001 .019
Residential Low Density 100 year on Site 0 16.184 1.02% .001 .016
Residential Low Density 100 year on Site 0 16.977 1. 07"10 .001 .017
Residential Low Density 100 year on Site 0 16.889 1.07% .001 .017
Residential Low Density 100 year on Site 0 17.709 1.12% .001 .018
• Residential Low Density 100 year on Site 0 2.640 0.17"10 .001 .003
Residential Low Density 100 year on Site 0 11.441 0.72% .001 .011
Residential Low Density 100 year on Site 0 3.625 0.23% .001 .004
Residential Low Density 100 year on Site 0 4.134 0.26% .001 .004Residential Low Density 100 year on Site 0 9.029 0.57% .001 .009
Comm Res Office, Church 100 year on Site 0 3.830 0.24% .001 .004
• Comm Res Office, Church 100 year on Site 0 2.607 0.17"10 .001 .003Comm Res Office, Church 100 year on Site 0 4.545 0.29% .001 .005Comm Res Office, Church 100 year on Site 0 11.451 0.73% .001 .011Comm Res Office, Church 100 year on Site 0 .997 0.06% .001 .001Comm Res Office, Church 100 year on Site 0 4.764 0.30% .001 .005Comm Res Office, Church 100 year on Site 0 3.981 0.25% .001 .004
• Comm Res Office, Church 100 year on Site 0 3.941 0.25% .001 .004Comm Res Office, Church 100 year on Site 0 .867 0.05% .001 .001Comm Res Office, Church Vacant Land 100 yr Retent 0 2.008 0.13% .001 .002Comm Mall, Strp Cntr,Ret 100 year on Site 0 7.246 0.46% .001 .007Comm Mall, Strp Cntr,Ret 100 year on Site 0 3.443 0.22% .001 .003Comm Mall, Strp Cntr,Ret 100 year on Site 0 4.038 0.26% .001 .004
• Comm Mall, Strp Cntr,Ret 100 year on Site 0 8.910 0.56% .001 .009Comm Mall, Strp Cntr,Ret 100 year on Site 0 10.027 0.63% .001 .010Comm Mall, Strp Cntr,Ret 100 year on Site 0 15.100 0.96% .001 .015Comm Mall, Strp Cntr,Ret 100 year on Site 0 10.096 0.64% .001 .010Comm Auto,Gas Sta,Pk Lot 100 year on Site 0 1.128 0.07"10 .001 .001Comm Auto,Gas Sta,Pk Lot 100 year on Site 0 .592 0.04% .001 .001
• Comm Auto,Gas Sta,Pk Lot 100 year on Site 0 .815 0.05% .001 .001Comm Auto,Gas Sta,Pk Lot 100 year on Site 0 .904 0.06% .001 .001Comm Auto,Gas Sta,Pk Lot 100 year on Site 0 1.028 0.07% .001 .001Comm Auto,Gas Sta,Pk Lot Detention Area on Site 0 .913 0.06% .900 .821
•

•ID
HP-02
Outfall Name
HANGER PARK EAST
Area
1579.274
Outfall Size
INDV RET
Parent Id
• Landuse Retention Population Area %Tot Area CaE CA Avg CaE-------------------------------------------------------------------------------------------------------------------------------Ind Foundry,Elec,PPs 100 year on Site 0 5.645 0.36% .001 .006Ind Foundry,Elec,PPs 100 year on Site 0 105.557 6.68% .001 .106Ind Foundry,Elec,PPs 100 year on Site 0 12.401 0.79% .001 .012Ind Foundry,Elec,PPs 100 year on Site 0 3.174 0.20% .001 .003
• Agricultural 100 year on Lot 0 20.215 1.28% .001 .020Agricultural 100 year on Lot 0 9.549 0.60% .001 .010Agricultural Vacant Land 100 yr Retent 0 90.866 5.75% .001 .091Agricultural Vacant Land 100 yr Retent 0 14.340 0.91% .001 .014Vacant Land 100 year on Site 0 14.830 0.94% .001 .015Vacant Land Vacant Land 0 yr Retentio 0 7.508 0.48% .250 1.877
• Vacant Land Vacant Land 0 yr Retentio 0 7.446 0.47% .250 1.861Vacant Land Vacant Land 5 yr Retentio 0 .388 0.02% .002 .001Vacant Land Vacant Land 100 yr Retent 0 2.502 0.16% .001 .003Vacant Land Vacant Land 100 yr Retent 0 151.669 9.60% .001 .152Open Space, Pks, Golf 100 year on Site 0 4.868 0.31% .001 .005Open Space, School 100 year on Site 0 12.431 0.79% .001 .012
• Open Space, School 100 year on Site 0 12.483 0.79% .001 .012Municpal Facilities 100 year on Site 0 .066 0.00% .001 .000
Summary for HP-02-------------------------------------------------------------------------------------------------------------------------------
•
•
•
•
Residential Low Density 5 year on Lot 0 4.874 .31% .010 0.002Residential Low Density 100 year on Lot 0 720.712 45.64% .721 0.001Residential Low Density 100 year on Site 0 98.628 6.25% .099 0.001Comm Res Office, Church 100 year on Site 0 36.984 2.34% .037 0.001Comm Res Office, Church Vacant Land 100 yr Retent 0 2.008 .13% .002 0.001Comm Mall, Strp Cntr,Ret 100 year on Site 0 58.861 3.73% .059 0.001Comm Auto,Gas Sta,Pk Lot 100 year on Site 0 4.469 .28% .004 0.001Comm Auto,Gas Sta,Pk Lot Detention Area on Site 0 .913 .06% .821 0.899Ind Foundry,Elec,PPs 100 year on Site 0 126.776 8.03% .127 0.001Agricultural 100 year on Lot 0 29.763 1.88% .030 0.001Agricultural Vacant Land 100 yr Retent 0 105.206 6.66% .105 0.001Vacant Land 100 year on Site 0 14.830 .94% .015 0.001Vacant Land Vacant Land 0 yr Retentio 0 14.954 .95% 3.738 0.250Vacant Land Vacant Land 5 yr Retentio 0 .388 .02% .001 0.003Vacant Land Vacant Land 100 yr Retent 0 154.171 9.76% .154 0.001Open Space, Pks, Golf 100 year on Site 0 4.868 .31% .005 0.001Open Space, School 100 year on Site 0 24.914 1.58% .025 0.001Municpal Facilities 100 year on Site 0 .066 .00% .000 0.000Total Street Area 0 175.889 11.14% 167.095 0.950
HP-02 Drainage Area Totals
•
•
o 1579.274 100.00% 173.048 0.110

•ID Outfall Name Area Outfall Size Parent Id
•HP-02-A COLLEGE LANE SUB
Landuse Retention
9.554
Population Area
INDV RET
%Tot Area COE CA
HP-02
Avg COE
•
•
•
•
•
•
•
•
•
Residential Low Density 100 year on Site
Summary for HP-02-A
Residential Low Density 100 year on SiteTotal Street Area
HP-02-A Drainage Area Totals
o
oo
o
7.952
7.9521.602
9.554
83.23%
83.23%16.77%
100.00%
.001 .008
.0081.522
1.530
0.0010.950
0.160

•ID Outfall Name Area Outfall Size Parent Id
•HP-02-B GRAYSTONE SUB
Landuse Retention
33.671
Population Area
INDV RET
%Tot Area COE
HP-02
CA Avg COE
Residential Low Density 100 year on SiteResidential Low Density 100 year on SiteResidential Low Density 100 year on Site
• Summary for HP-02-B
Residential Low Density 100 year on SiteTotal Street Area
HP-02-B Drainage Area Totals
•
•
•
•
•
•
•
•
ooo
oo
o
17.0194.2677.441
28.7274.944
33.671
50.54%12.67%22.10%
85.32%14.68%
100.00%
.001
.001
.001
.017
.004
.007
.0294.697
4.726
0.0010.950
0.140

•ID Outfall Name Area Outfall Size Parent Id
HP-02-C PECAN GROVE VILLAGE SUB 79.347 INDV RET HP-02
• Landuse Retention Population Area %Tot Area CaE CA Avg CaE
Residential Low Density o year to Retention Basin 0 1.223 1.54% .600 .734Residential Low Density o year to Retention Basin 0 .469 0.59% .600 .281Residential Low Density o year to Retention Basin 0 1.233 1.55% .600 .740Residential Low Density o year to Retention Basin 0 1.251 1.58% .600 .750
• Residential Low Density o year to Retention Basin 0 1.574 1.98% .600 .945Residential Low Density o year to Retention Basin 0 5.604 7.06% .600 3.363Residential Low Density o year to Retention Basin 0 3.080 3.88% .600 1.848Residential Low Density o year to Retention Basin 0 2.230 2.81% .600 1.338Residential Low Density o year to Retention Basin 0 .947 1.19% .600 .568Residential Low Density 5 year on Lot 0 2.630 3.31% .002 .005
• Residential Low Density 5 year on Lot 0 9.980 12.58% .002 .020Residential Low Density 5 year on Lot 0 2.190 2.76% .002 .004Residential Low Density 5 year on Lot 0 2.618 3.30% .002 .005Residential Low Density 5 year on Lot 0 3.128 3.94% .002 .006Residential Low Density 5 year on Lot 0 5.290 6.67"1. .002 .011Residential Low Density 5 year on Lot 0 8.812 11.11% .002 .018
• Open Space, Pks, Golf Retention Basin 0 1.471 1.85% 1.000 1.471Open Space, Pks, Golf Retention Basin 0 .659 0.83% 1.000 .659Open Space, Pks, Golf Retention Basin 0 2.007 2.53% 1.000 2.007Open Space, Pks, Golf Retention Basin 0 .604 0.76% 1.000 .604Open Space, Pks, Golf Retention Basin 0 .725 0.91% 1.000 .725Open Space, Pks, Golf Retention Basin 0 1.872 2.36% 1.000 1.872
• Summary for HP-02-C
-------------------------------------------------------------------------------------------------------------------------------Residential Low Density o year to Retention Basin 0 17.610 22.19% 10.566 0.600Residential Low Density 5 year on Lot 0 34.648 43.67"1. .069 0.002Open Space, Pks, Golf Retention Basin 0 7.338 9.25% 7.338 1.000
• Total Street Area 0 19.751 24.89% 18.763 0.950
HP-02-C Drainage Area Totals-------------------------------------------------------------------------------------------------------------------------------
0 79.347 100.00% 36.736 0.463
•
•
•
•

•ID Outfall Name Area Outfall Size Parent Id
HP-02-D CARVER RANCH ESTATES SUB
• Landuse Retention
19.418
Population Area
INDV RET
%Tot Area COE
HP-02
CA Avg COE
•
•
•
•
•
•
•
•
•
Residential Low Density 100 year on SiteResidential Low Density 100 year on Site
Summary for HP-02-D
Residential Low Density 100 year on SiteTotal Street Area
HP-02-D Drainage Area Totals
oo
oo
o
9.8356.003
15.8383.580
19.418
50.65%30.91%
81.56%18.44%
100.00%
.001
.001.010.006
.0163.401
3.417
0.0010.950
0.176

•ID Outfall Name Area Outfall Size Parent Id
-------------------------------------------------------------------------------------------------------------------------------
----------------------------------------------------------------------------------------------------------------------------------
•HP-02-E RAINTREESUB
Landuse Retention
62.897
Population Area
INDV RET
%Tot Area COE CA
HP-02
Avg COE
Residential Low Density 100 year on Lot 0 6.454 10.26% .001 .006Residential Low Density 100 year on Lot 0 12.570 19.99% .001 .013Residential Low Density 100 year on Lot 0 4.681 7.44% .001 .005Residential Low Density 100 year on Lot 0 7.312 11.63% .001 .007
• Residential Low Density 100 year on Lot 0 13.332 21.20% .001 .013Residential Low Density 100 year on Lot 0 3.749 5.96% .001 .004Residential Low Density 100 year on Lot 0 2.969 4.72% .001 .003
Summary for HP-02-E-------------------------------------------------------------------------------------------------------------------------------
• Residential Low Density 100 year on LotTotal Street Area
HP-02-E Drainage Area Totals
oo
51.06811.829
81.19%18.81%
.05111.237
0.0010.950
-------------------------------------------------------------------------------------------------------------------------------
•
•
•
•
•
•
•
o 62.897 100.00% 11.288 0.179

•ID Outfall Name Area Outfall Size Parent Id
•HP-02-F SANDAHL HOMES SUB
Landuse Retention
94.272
Population Area
RET BASIN
%Tot Area . COE
HP-02
CA Avg COE
•
•
Residential Low Density 5 year on Lot 0 5.481 5.81% .002 .011Residential Low Density 5 year on Lot 0 17.771 18.85% .002 .036Residential Low Density 5 year on Lot 0 5.045 5.35% .002 .010Residential Low Density 5 year on Lot 0 3.788 4.02% .002 .008Residential Low Density 5 year on Lot 0 7.690 8.16% .002 .015Residential Low Density 5 year on Lot 0 8.151 8.65% .002 .016Residential Low Density 5 year on Lot 0 4.025 4.27% .002 .008Residential Low Density 5 year on Lot 0 6.167 6.54% .002 .012Residential Low Density 5 year on Lot 0 4.648 4.93% .002 .009Residential Low Density 5 year on Lot 0 3.669 3.89% .002 .007Residential Low Density 5 year on Lot 0 1.738 1.84% .002 .003Open Space, Pks, Golf Retention Basin 0 3.376 3.58% 1.000 3.376
Summary for HP-02-F
-----------------------------------------------~------ -------------------------------------------------------------------------
•Residential Low DensityOpen Space, Pks, GolfTotal Street Area
5 year on LotRetention Basin
ooo
68.1733.376
22.723
72.31%3.58%
24.10%
.1363.376
21.587
0.0021.0000.950
•
•
•
•
•
•
HP-02-F Drainage Area Totals
o 94.272 100.00% 25.099 0.266

•10 OutfaL L Name Area OutfaLL Size Parent Id
~.--------------------------------------------------------------------------------------------------------------------------------
HP-02-G HAMILTON HOMES SUB 33.457 RET BASIN HP-02
-------------------------------------------------------------------------------------------------------------------------------
----------------------------------------------------------------------------------------------------------------------------------
• Landuse Retention PopuLation Area % Tot Area COE CA Avg COE
ResidentiaL Low Density 5 year on Lot 0 4.770 14.26% .002 .010ResidentiaL Low Density 5 year on Lot 0 4.100 12.25% .002 .008ResidentiaL Low Density 5 year on Lot 0 3.542 10.59% .002 .007ResidentiaL Low Density 100 year on Lot 0 8.048 24.05% .001 .008
• ResidentiaL Low Density 100 year on Lot 0 1.049 3.14% .001 .001ResidentiaL Low Density Retention Basin 0 1.214 3.63% .000 .000Open Space, Pks, GoLf Retention Basin 0 1.216 3.63% 1.000 1.216
Summary for HP-02-G
-------------------------------------------------------------------------------------------------------------------------------ResidentiaL Low Density 5 year on Lot 0 12.412 37.10% .025 0.002ResidentiaL Low Density 100 year on Lot 0 9.097 27.19% .009 0.001ResidentiaL Low Density Retention Basin 0 1.214 3.63% .000 0.000Open Space, Pks, GoLf Retention Basin 0 1.216 3.63% 1.216 1.000TotaL Street Area 0 9.518 28.45% 9.042 0.950
HP-02-G Drainage Area TotaLs
•
· -------------------------------------------------------------------------------------------------------------------------------o 33.457 100.00% 10.292 0.308
•
•
•
•
•
•

•ID Outfall Name Area Outfall Size Parent Id
--------------------------------------------------------------------------------------------------------_.------------------------HP-02-H CORBELL PARK 233.404 RET BASIN HP-02
----------------------------------------------------------------------------------------------------------------------------------
• Landuse Retention Population Area % Tot Area CaE CA Avg CaE-------------------------------------------------------------------------------------------------------------------------------Residential Low Density 5 year on Lot 0 12.921 5.54% .002 .026Residential Low Density 5 year on Lot 0 4.892 2.10% .002 .010Residential Low Density 5 year on Lot 0 4.186 1.79% .002 .008Residential Low Density 5 year on Lot 0 6.691 2.87"1. .002 .013
• Residential Low Density 5 year on Lot 0 9.250 3.96% .002 .019Residential Low Density 5 year on Lot 0 5.626 2.41% .002 .011Residential Low Density 5 year on Lot 0 4.620 1.98% .002 .009Residential Low Density 5 year on Lot 0 7.977 3.42% .002 .016Residential Low Density 5 year on Lot 0 4.792 2.05% .002 .010Residential Low Density 5 year on Lot 0 5.080 2.18% .002 .010
• Residential Low Density 5 year on Lot 0 7.849 3.36% .002 .016Residential Low Density 5 year on Lot 0 3.222 1.38% .002 .006Residential Low Density 5 year on Lot 0 8.664 3.71% .002 .017Residential Low Density 5 year on Lot 0 1.829 0.78% .002 .004Residential Low Density 5 year on Lot 0 4.070 1.74% .002 .008Residential Low Density 5 year on Lot 0 4.962 2.13% .002 .010
• Residential Low Density 5 year on Lot 0 1.311 0.56% .002 .003Residential Low Density 5 year on Lot 0 6.099 2.61% .002 .012Residential Low Density 5 year on Lot 0 11.617 4.98% .002 .023Residential Low Density 5 year on Lot 0 .769 0.33% .002 .002Residential Low Density 5 year on Lot 0 1.108 0.47% .002 .002Residential Low Density 5 year on Lot 0 5.049 2.16% .002 .010
• Residential Low Density 5 year on Lot 0 7.435 3.19% .002 .015Residential Low Density 5 year on Lot 0 6.505 2.79% .002 .013Residential Low Density 5 year on Lot 0 6.952 2.98% .002 .014Residential Low Density 5 year on Lot 0 3.769 1.61% .002 .008Ind Foundry,Elec,PPs 100 year on Site 0 .849 0.36% .001 .001Vacant Land Vacant Land 100 yr Retent 0 15.048 6.45% .001 .015
• Open Space, Pks, Golf Retention Basin 0 13.609 5.83% 1.000 13.609Open Space, School o year to Retention Basin 0 .214 0.09% .950 .204Open Space, School o year to Retention Basin 0 .148 0.06% .950 .141Open Space, School o year to Retention Basin 0 .576 0.25% .950 .547Open Space, School 100 year on Site 0 1.975 0.85% .001 .002Open Space, School 100 year on Site 0 8.993 3.85% .001 .009
• Summary for HP-02-H-------------------------------------------------------------------------------------------------------------------------------Residential Low Density 5 year on Lot 0 147.246 63.09% .294 0.002Ind Foundry,Elec,PPs 100 year on Site 0 .849 .36% .001 0.001Vacant Land Vacant Land 100 yr Retent 0 15.048 6.45% .015 0.001
• Open Space, Pks, Golf Retention Basin 0 13.609 5.83% 13.609 1.000Open Space, School o year to Retention Basin 0 .938 .40% .891 0.950Open Space, School 100 year on Site 0 10.968 4.70% .011 0.001Total Street Area 0 44.746 19.17% 42.509 0.950
HP-02-H Drainage Area Totals
• -------------------------------------------------------------------------------------------------------------------------------0 233.404 100.00% 57.330 0.246
•

•ID Outfall Name Area Outfall Size Parent Id
----------------------------------------------------------------------------------------------------------------------------------
--------------------------------------------------------------------------_._._---------------------------------------------------
•
•
HP-02-1 MOTOROLA FACILITY
Landuse
Ind Large Site-Medium
Summary for HP-02-1
Ind Large Site-MediumTotal Street Area
Retention
100 year on Site
100 year on Site
162.201
Population Area
o 149.167
o 149.167o 13.034
ON-SITE RET
%Tot Area
91.96%
91.96%8.04%
COE
.001
HP-02
CA
.149
.14912.383
Avg COE
0.0010.950
•
•
•
•
•
•
•
•
HP-02-1 Drainage Area Totals
o 162.201 100.00% 12.532 0.077

•ID Outfall Name Area Outfall Size Parent Id
-----------------------------------------------------------------------------------------------------------------------------.----HP-02-J ESTRADA PARK 287.552 RET BASIN HP-02
----------------------------------------------------------------------------------------------------------------------------------
• Landuse Retention Population Area % Tot Area COE CA Avg COE
-------------------------------------------------------------------------------------------------------------------------------Residential Low Density o year to Retention Basin 0 3.685 1.28% .700 2.579Residential Low Density o year to Retention Basin 0 4.049 1.41% .700 2.834Residential Low Density o year to Retention Basin 0 .409 0.14% .700 .286Residential Low Density o year to Retention Basin 0 .774 0.27% .500 .387
• Residential Low Density 5 year on· Lot 0 6.656 2.31% .002 .013Residential Low Density 5 year on Lot 0 2.041 0.71% .002 .004Residential Low Density 5 year on Lot 0 9.003 3.13% .002 .018
Residential Low Density 5 year on Lot 0 2.280 0.79% .002 .005Residential Low Density 5 year on Lot 0 6.404 2.23% .002 .013Residential Low Density 5 year on Lot 0 8.925 3.10% .002 .018
• Residential Low Density 5 year on Lot 0 7.649 2.66% .002 .015Residential Low Density 5 year on Lot 0 6.005 2.09% .002 .012Residential Low Density 5 year on Lot 0 2.751 0.96% .002 .006Residential Low Density 5 year on Lot 0 6.971 2.42% .002 .014Residential Low Density 5 year on Lot 0 5.135 1.79% .002 .010Residential Low Density 5 year on Lot 0 15.892 5.53% .002 .032
• Residential Low Density 5 year on Lot 0 6.500 2.26% .002 .013Residential Low Density 5 year on Lot 0 4.588 1.60% .002 .009Residential Low Density 5 year on Lot 0 3.058 1.06% .002 .006Residential Low Density 5 year on Site 0 3.004 1.04% .002 .006Residential Low Density 5 year on Site 0 4.693 1.63% .002 .009Residential Low Density 100 year on Lot 0 1.593 0.55% .001 .002
• Residential Low Density 100 year on Lot 0 5.655 1.97"1. .001 .006Residential Low Density 100 year on Lot 0 3.757 1.31% .001 .004Residential Low Density 100 year on Lot 0 19.755 6.87"1. .001 .020Residential Low Density 100 year on Lot 0 5.255 1.83% .001 .005Residential Low Density 100 year on Lot 0 6.335 2.20% .001 .006Residential Low Density 100 year on Lot 0 5.406 1.88% .001 .005
• Residential Low Density 100 year on Lot 0 4.985 1.73% .001 .005Residential Low Density 100 year on Lot 0 7.167 2.49% .001 .007Residential Low Density 100 year on Lot 0 4.743 1.65% .001 .005Residential Low Density 100 year on Lot 0 3.312 1.15% .001 .003Residential Low Density 100 year on Site 0 11.955 4.16% .001 .012Residential Low Density 100 year on Site 0 19.456 6.77"1. .001 .019
• Residential Low Density 100 year on Site 0 10.462 3.64% .001 .010Residential Low Density 100 year on Site 0 .791 0.28% .001 .001Vacant Land Vacant Land 0 yr Retentio 0 1.601 0.56% .350 .560Open Space, Pks, Golf Retention Basin 0 8.378 2.91% 1.000 8.378
Summary for HP-02-J
• -------------------------------------------------------------------------------------.---------------------- ------------------~
Residential Low Density o year to Retention Basin 0 8.918 3.10% 6.087 0.683Residential Low Density 5 year on Lot 0 93.857 32.64% .188 0.002Residential Low Density 5 year on Site 0 7.696 2.68% .015 0.002Residential Low Density 100 year on Lot 0 67.963 23.64% .068 0.001Residential Low Density 100 year on Site 0 42.664 14.84% .043 0.001
•
•

•10 Outfall Name Area Outfall Size Parent Id
----------------------------------------------------------------------------------------------------------------------------------
---------~---------------------------------------------------------------------------------------------------------------------•HP-02-J ESTRADA PARK
Landuse Retention
287.552
Population Area
RET BASIN
%Tot Area COE CA
HP-02
Avg COE
Vacant LandOpen Space, Pks, GolfTotal Street Area
Vacant Land 0 yr RetentioRetention Basin
ooo
1.6018.378
56.475
.56%2.91%
19.64%
.5608.378
53.651
0.3501.0000.950
• HP-02-J Drainage Area Totals-------------------------------------------------------------------------------------------------------------------------------
•
•
•
•
•
•
•
•
o 287.552 100.00% 68.990 0.240

•ID Outfall Name Area Outfall Size Parent Id
•HP-02-K ASU RESEARCH PARK
Landuse Retention
332.150
Population Area
RET BASIN
%Tot Area COE
HP-02
CA Avg COE
•
•
Comm Res Office, Church 100 year on Site 0 47.913 14.43% .001 .048Comm Res Office, Church 100 year on Site 0 13.206 3.98% .001 .013Ind Large Site-Medium 100 year on Site 0 38.751 11.67% .001 .039Ind Large Site-Medium 100 year on Site 0 34.986 10.53% .001 .035Vacant Land 100 year on Site 0 32.473 9.78% .001 .032Vacant Land 100 year on Site 0 42.013 12.65% .001 .042Vacant Land 100 year on Site 0 3.454 1.04% .001 .003Vacant Land 100 year on Site 0 8.369 2.52% .001 .008Vacant Land 100 year on Site 0 19.645 5.91% .001 .020Vacant Land 100 year on Site 0 46.867 14.11% .001 .047
Summary for HP-02-K
•Comm Res Office, ChurchInd Large Site-MediumVacant LandTotal Street Area
100 year on Site100 year on Site100 year on Site
oooo
61.11973.736
152.82144.474
18.40%22.20%46.01%13.39%
.061
.074
.15342.250
0.0010.0010.0010.950
•
•
•
•
•
•
HP-02-K Drainage Area Totals
o 332.150 100.00% 42.538 0.128

•ID Outfall Name Area Outfall Size Parent Id
----------------------------------------------------------------------------------------------------------------------------------
-------------------------------------------------------------------------------------------------------------------------------•HP-02-L DUSKFIRE 1 SUB
Landuse Retention
40.954
Population Area
INDV RET
%Tot Area COE CA
HP-02
Avg COE
Residential Low Density 100 year on Site 0 4.035 9.85% .001 .004Residential Low Density 100 year on Site 0 3.416 8.34% .001 .003Residential Low Density 100 year on Site 0 2.310 5.64% .001 .002Residential Low Density Vacant Land 100 yr Retent 0 23.283 56.85% .001 .023
• Summary for HP-02-L
-------------------------------------------------------------------------------------------------------------------------------
•
Residential Low Density 100 year on SiteResidential Low Density Vacant Land 100 yr RetentTotal Street Area
HP-02-L Drainage Area Totals
ooo
9.76123.2837.910
23.83%56.85%19.31%
.010
.0237.514
0.0010.0010.950
-------------------------------------------------------------------------------------------------------------------------------
•
•
•
•
•
•
•
o 40.954 100.00% 7.547 0.184

Landuse
•
•
ID
18-01
Outfall Name
SOUTH OF MCKELLIPS
Retention
Area
0.380
Population Area
Outfall Size
42
%Tot Area COE CA
Parent Id
Avg COE
•
•
•
•
•
•
•
•
•
Summary for 18-01
Residential Low Density Vacant Land 100 yr RetentTotal Street Area
18-01 Drainage Area Totals
oo
o
.000
.380
.380
.00%100.00%
100.00%
.000
.361
.361
0.0000.950
0.950
Landuse
•
•
ID
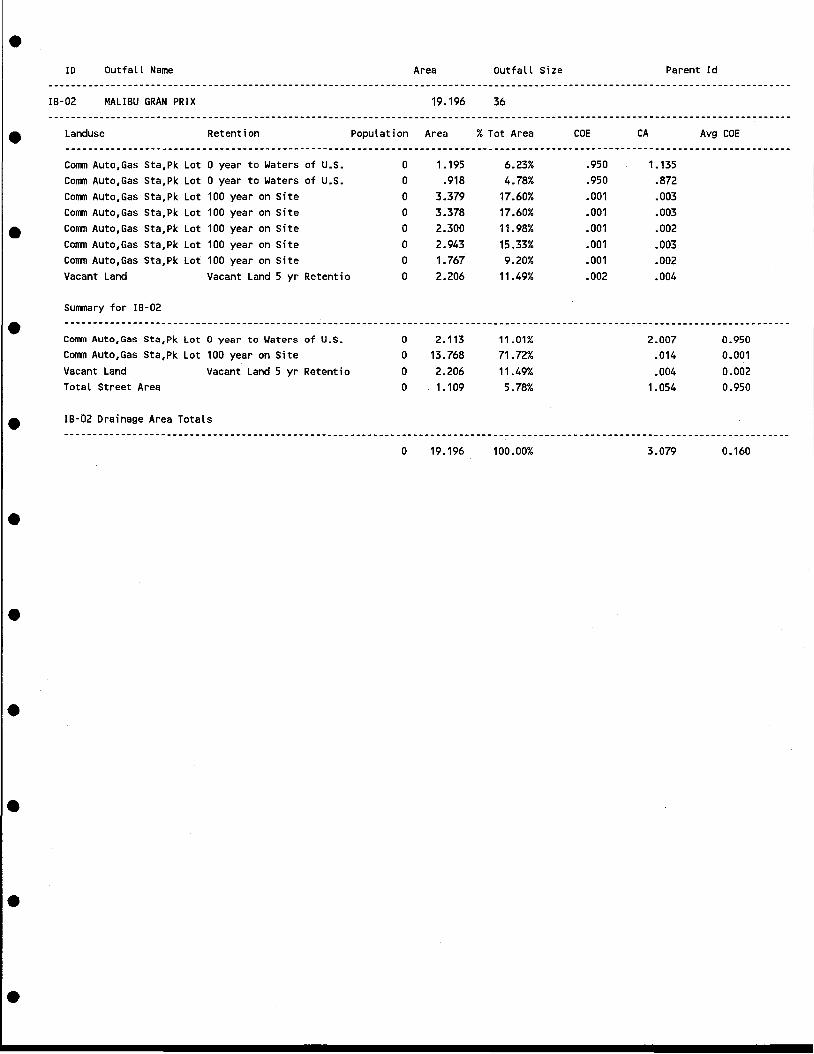
IB-02
Outfall Name
MALI BU GRAN PR 1X
Retention
Area
19.196
Population Area
Outfall Size
36
%Tot Area COE CA
Parent Id
Avg COE
Comm Auto,Gas Sta,Pk Lot o year to Waters of u.S. 0 1.195 6.23% .950 1.135Comm Auto,Gas Sta,Pk Lot o year to Waters of U.S. 0 .918 4.78% .950 .872Comm Auto,Gas Sta,Pk Lot 100 year on Site 0 3.379 17.60% .001 .003Comm Auto,Gas Sta,Pk Lot 100 year on Site 0 3.378 17.60% .001 .003
• Comm Auto,Gas Sta,Pk Lot 100 year on Site 0 2.300 11.98% .001 .002Comm Auto,Gas Sta,Pk Lot 100 year on Site 0 2.943 15.33% .001 .003Comm Auto,Gas Sta,Pk Lot 100 year on Site 0 1.767 9.20% .001 .002Vacant Land Vacant Land 5 yr Retentio 0 2.206 11.49% .002 .004
Summary for IB-02
• Comm Auto,Gas Sta,Pk Lot 0 year to Waters of u.s.Comm Auto,Gas Sta,Pk Lot 100 year on SiteVacant Land Vacant Land 5 yr RetentioTotal Street Area
oooo
2.113
13.7682.2061.109
11.01%
71.72%11.49%5.78%
2.007.014.004
1.054
0.950
0.0010.0020.950
• IB-02 Drainage Area Totals
•
•
•
•
•
•
o 19.196 100.00% 3.079 0.160

Landuse
•
•
ID
IB-03
Outfall Name
BIG SURF
Retention
Area
27.180
Population Area
Outfall Size
42
%Tot Area COE CA
Parent Id
Avg COE
Comm Mall, Strp Cntr,Ret 100 year on SiteVacant Land Vacant Land 100 yr RetentOpen Space, Pks, Golf 5 year on Site
• Summary for IB-03.
ooo
13.2368.1165.815
48.70%29.86%21.39%
.001
.001
.002
.013
.008
.012
Comm Mall, Strp Cntr,RetVacant LandOpen Space, Pks, GolfTotal Street Area
•
100 year on SiteVacant Land 100 yr Retent5 year on Site
oooo
13.2368.1165.815
.013
48.70%29.86%21.39%
.05%
.013
.008
.012
.013
0.0010.0010.0020.950
18-03 Drainage Area Totals
•
•
•
•
•
•
•
o 27.180 100.00% .046 0.002

Landuse
•
•
ID
18-04
Outfall Name
PROPERTY NORTH OF CURRY
Retention
Area
0.773
Population Area
Outfall Size
36
%Tot Area COE CA
Parent Id
Avg COE
•
•
•
•
•
•
•
•
•
Comm Auto,Gas Sta,Pk Lot 0 year to Waters of U.S.
Summary for 18-04
Comm Auto,Gas Sta,Pk Lot 0 year to Waters of U.s.Total Street Area
18-04 Drainage Area Totals
o
oo
o
.m
.773
.000
.m
100.00%
100.00%.00%
100.00%
.950 .734
.734
.000
.734
0.9500.950
0.950

•ID Outfall Name Area Outfall Size Parent Id
----------------------------------------------------------------------------------------------------------------------------------18-05 CURRY ROAD &STADUM 65.960 48-------------------------------------------------------------------------------------------------------------------.--------------
• Landuse Retention Population Area %Tot Area COE CA Avg COE-------------------------------------------------------------------------------------------------------------------------------Comm Res Office, Church 100 year on Site 0 .482 0.73% .001 .000Comm Mall, Strp Cntr,Ret 100 year on Site 0 1.397 2.12% .001 .001Comm Auto,Gas Sta,Pk Lot o year to Waters of U.S. 0 5.791 8.78% .950 5.501Comm Auto,Gas Sta,Pk Lot o year to Waters of U.S. 0 .386 0.59% .450 .174
• Comm Auto,Gas Sta,Pk Lot o year to Waters of U.S. 0 .222 0.34% .950 .211Comm Auto,Gas Sta,Pk Lot o year to Waters of U.S. 0 .922 1.40% .900 .829Comm Auto,Gas Sta,Pk Lot o year to Waters of U.S. 0 2.008 3.04% .950 1.907Comm Auto,Gas Sta,Pk Lot o year to Waters of U.S. 0 2.696 4.09% .950 2.561Comm Auto,Gas Sta,Pk Lot o year to Waters of U.S. 0 .910 1.38% .950 .864Comm Auto,Gas Sta,Pk Lot o year to Waters of U.S. 0 .196 0.30% .950 .186
• Comm Auto,Gas Sta,Pk Lot o year to Waters of U.S. 0 .424 0.64% .950 .403Comm Auto,Gas Sta,Pk Lot o year to Waters of U.s. 0 .478 0.72% .950 .454Comm Auto,Gas Sta,Pk Lot o year to Waters of U.S. 0 .482 0.73% .950 .458Comm Auto,Gas Sta,Pk Lot 5 year on Site 0 1.006 1.53% .002 .002Comm Auto,Gas Sta,Pk Lot 100 year on Site 0 1.378 2.09% .001 .001Ind Park-light o year to Waters of U.S. 0 2.130 3.23% .950 2.023
• lnd Park-li ght o year to Waters of U.S. 0 1.449 2.20% .950 1.376Ind Park-li ght o year to Waters of U.S. 0 .587 0.89% .950 .557Ind Park-light o year to Waters of U.S. 0 2.499 3.79% .950 2.374Ind Park-light o year to Waters of U.S. 0 .639 0.97";' .950 .607Ind Park-light 100 year on Site 0 1.092 1.66% .001 .001Ind Park-light 100 year on Site 0 1.802 2.73% .001 .002
• Ind Park-light 100 year on Site 0 1. 719 2.61% .001 .002Ind Foundry,Elec,PPs o year to Waters of U.S. 0 .754 1.14% .950 .716Ind Foundry,Elec,PPs o year to Waters of U.S. 0 .711 1.08% .950 .676Ind Foundry,Elec,PPs o year to Waters of U.S. 0 .597 0.91% .950 .567Ind Foundry,Elec,PPs o year to Waters of U.S. 0 2.464 3.74% .950 2.341Ind Foundry,Elec,PPs o year to Waters of U.S. 0 .298 0.45% .950 .283
• Ind Foundry,Elec,PPs 5 year on Site 0 .783 1.19% .002 .002Ind Foundry,Elec,PPs 5 year on Site 0 .880 1.33% .002 .002Ind Foundry,Elec,PPs 100 year on Site 0 2.008 3.04% .001 .002Ind Foundry,Elec,PPs 100 year on Site 0 1.700 2.58% .001 .002Ind Foundry,Elec,PPs 100 year on Site 0 .670 1.02% .001 .001Ind Foundry,Elec,PPs 100 year on Site 0 .672 1.02% .001 .001
• Vacant Land o year to Waters of U.S. 0 2.392 3.63% .450 1.076Vacant Land Vacant Land 0 yr Retentio 0 8.566 12.99% .200 1.713Vacant Land Vacant Land 0 yr Retentio 0 .763 1.16% .950 .725
Summary for 18-05
-------------------------------------------------------------------------------------------------------------------------------
• Comm Res Office, Church 100 year on Site 0 .482 .73% .000 0.000Comm Mall, Strp Cntr,Ret 100 year on Site 0 1.397 2.12% .001 0.001Comm Auto,Gas Sta,Pk Lot 0 year to Waters of U.S. 0 14.513 22.00% 13.548 0.934Comm Auto,Gas Sta,Pk Lot 5 year on Site 0 1.006 1.53% .002 0.002Comm Auto,Gas Sta,Pk Lot 100 year on Site 0 1.378 2.09% .001 0.001
•
•

•ID Outfa II Name Area Outfall Size Parent Id
----------------------------------------------------------------------------------------------------------------------------------
-------------------------------------------------------------------------------------------------------------------------------
----------------------------------------------------------------------------------------------------------------------------------Landuse•
18-05 CURRY ROAD &STADUM
Retention
65.960
Population Area
48
% Tot Area COE CA Avg COE
Ind Park-l ight o year to Waters of U.S. 0 7.303 11.07% 6.938 0.950Ind Park-light 100 year on Site 0 4.613 6.99% .005 0.001Ind Foundry,Elec,PPs o year to Waters of U.S. 0 4.824 7.31% 4.583 0.950Ind Foundry,Elec,PPs 5 year on Site 0 1.663 2.52% .003 0.002
• Ind Foundry,Elec,PPs 100 year on Site 0 5.050 7.66% .005 0.001Vacant Land o year to Waters of U.S. 0 2.392 3.63% 1.076 0.450Vacant Land Vacant Land 0 yr Retentio 0 9.330 14.14% 2.439 0.261Total Street Area 0 12.009 18.21% 11.409 0.950
18-05 Drainage Area Totals
-------------------------------------------------------------------------------------------------------------------------------•
•
•
•
•
•
•
•
o 65.960 100.00% 40.010 0.607

Landuse
•
•
ID
IB-06
Outfall Name
FUTURE ADOT
Retention
Area
10.235
Population Area
Outfall Size
o
%Tot Area COE CA
Parent Id
Avg COE
•
•
•
•
•
•
•
•
•
Comm Hotels,Restraunts 0 year to Waters of U.s.Comm Auto,Gas Sta,Pk Lot 0 year to Waters of U.s.
Summary for IB-06
Comm Hotels,Restraunts 0 year to Waters of U.s.Comm Auto,Gas Sta,Pk Lot 0 year to Waters of U.s.Total Street Area
18-06 Drainage Area Totals
oo
ooo
o
1.2631.755
1.2631.7557.217
10.235
12.34%17.15%
12.34%17.15%70.51%
100.00%
.950
.9501.2001.667
1.2001.6676.856
9.723
0.9500.9500.950
0.950

•ID
IB-07
Outfall Name
SOUTH OF MCKELLIPS
Area
1.280
Outfall Size
48
Parent Id
• Landuse
Summary for IB-07
Retention Population Area %Tot Area COE CA Avg COE
•
•
•
•
•
•
•
•
•
Comm Auto,Gas Sta,Pk Lot 0 year to Waters of U.S.Total Street Area
IB-07 Drainage Area Totals
oo
o
.0001.280
1.280
.00%100.00%
100.00%
.0001.216
1.216
0.0000.950
0.950

Landuse
•
•
10
IB-08
Outfall Name
SCOTTSDALE YARD (RV)
Retention
Area
25.492
Population Area
Outfall Size
TWIN 36
%Tot Area COE CA
Parent Id
Avg COE
Comm Auto,Gas Sta,Pk Lot o year to Waters of u.S. 0 17.756 69.65% .900 15.981Comm Auto,Gas Sta,Pk Lot o year to Waters of u.S. 0 5.759 22.59% .950 5.471Agricultural 5 year on Site 0 1.857 7.28% .002 .004Municpal Facilities o year to Waters of u.S. 0 .119 0.47"" .900 .107
• Summary for IB-08
•Comm Auto,Gas Sta,Pk LotAgriculturalMunicpal FacilitiesTotal Street Area
o year to Waters of u.S.5 year on Siteo year to Waters of u.S.
oooo
23.5151.857
.119
.001
92.24%7.28%
.47%
.00%
21.452.004.107.001
0.9120.0020.8990.950
•
•
•
•
•
•
•
IB-08 Drainage Area Totals
o 25.492 100.00% 21.564 0.846

•ID Outfall Name Area Outfall Size Parent Id
IB-D9 WEBER DRIVE 18.909 54
-------------------------------------------------------------------------------------------------------------------------------• Landuse Retention Population Area %Tot Area COE CA Avg COE
-------------------------------------------------------------------------------------------------------------------------------
•
•
•
•
•
•
•
•
•
Residential High Density 0 year to Waters of u.S.Vacant Land Vacant Land 0 yr Retentio
Summary for IB-09
Residential High Density 0 year to Waters of u.S.Vacant Land Vacant Land 0 yr RetentioTotal Street Area
IB-09 Drainage Area Totals
oo
ooo
o
13.6723.107
13.6723.1072.130
18.909
72.31%16.43%
72.31%16.43%11.26%
100.00%
.850
.20011.621
.621
11.621.621
2.023
14.265
0.8500.2000.950
0.754

•ID Outfall Name Area Outfall Size Parent Id
IB-10 NORTH OF CURRY ROAD 57.848 42
~._--------------------------------------------------- ----------------------------------------------------------------------------
• Landuse Retention Population Area %Tot Area COE CA Avg COE-----------------.-------------------------------------------------------------------------------------------------------------Residential Low Density o year to Waters of U.S. 0 1.639 2.83% .510 .836Residential Low Density o year to Waters of U.S. 0 1.923 3.32% .460 .884Residential Low Density o year to Waters of U.S. 0 3.511 6.07"1. .460 1.615Residential Low Density o year to Waters of U.S. 0 3.537 6.11% .460 1.627
• Residential Low Density o year to Waters of U.S. 0 1.821 3.15% .460 .838Residential Low Density o year to Waters of U.S. 0 1.500 2.59% .480 .720Residential Low Density o year to Waters of U.S. 0 1.034 1.79% .660 .683Residential Low Density o year to Waters of U.S. 0 .206 0.36% .660 .136Residential Low Density o year to Waters of U.S. 0 1.020 1.76% .660 .673Residential Low Density o year to Waters of U.S. 0 .205 0.35% .660 .136
• Residential Low Density 5 year on Site 0 .195 0.34% .002 .000Residential Low Density 5 year on Site 0 .197 0.34% .002 .000Residential Low Density 100 year on Lot 0 .453 0.78% .001 .000Residential Low Density 100 year on Lot 0 2.041 3.53% .001 .002Residential Low Density 100 year on Lot 0 1.109 1.92% .001 .001Residential High Density 5 year on Site 0 3.487 6.03% .002 .007
• Residential High Density 100 year on Site 0 .377 0.65% .001 .000Comm Res Office, Church 100 year on Site 0 .282 0.49% .001 .000Ind Foundry,Elec,PPs o year to Waters of U.S. 0 .812 1.40% .950 .772Ind Foundry,Elec,PPs o year to Waters of U.S. 0 .460 0.80% .950 .437Ind Foundry,Elec,PPs o year to Waters of U.S. 0 .459 0.79% .950 .436Ind Foundry,Elec,PPs o year to Waters of U.S. 0 .459 0.79% .950 .436
• Ind Foundry,Elec,PPs 100 year on Site 0 1.404 2.43% .001 .001Ind Foundry,Elec,PPs 100 year on Site 0 .962 1.66% .001 .001Agricultural o year to Waters of U.S. 0 1.194 2.06% .400 .478Vacant Land Vacant Land 0 yr Retentio 0 .231 0.40% .200 .046Vacant Land Vacant Land 0 yr Retentio 0 .486 0.84% .200 .097Vacant Land Vacant Land 5 yr Retentio 0 .360 0.62% .002 .001
• Open Space, Pks, Golf 100 year on Site 0 7.224 12.49% .001 .007
Summary for IB-10
-------------------------------------------------------------------------------------------------------------------------------Residential Low Density o year to Waters of U.S. 0 16.396 28.34% 8.147 0.497Residential Low Density 5 year on Site 0 .392 .68% .001 0.003
• Residential Low Density 100 year on Lot 0 3.604 6.23% .004 0.001Residential High Density 5 year on Site 0 3.487 6.03% .007 0.002Residential High Density 100 year on Site 0 .377 .65% .000 0.000Comm Res Office, Church 100 year on Site 0 .282 .49% .000 0.000Ind Foundry,Elec,PPs o year to Waters of U.S. 0 2.191 3.79% 2.081 0.950Ind Foundry,Elec,PPs 100 year on Site 0 2.366 4.09% .002 0.001
• Agricultural o year to Waters of U.S. 0 1.194 2.06% .478 0.400Vacant Land Vacant Land 0 yr Retentio 0 .717 1.24% .143 0.199Vacant Land Vacant Land 5 yr Retentio 0 .360 .62% .001 0.003Open Space, Pks, Golf 100 year on Site 0 7.224 12.49% .007 0.001Total Street Area 0 19.258 33.29% 18.295 0.950
• IB-10 Drainage Area Totals-------------------------------------------------------------------------------------------------------------------------------
0 57.848 100.00% 29.166 0.504
•

Landuse
•
•
10
IB-11
OutfaLL Name
SOUTH OF CURRY ROAD
Retention
Area
3.817
PopuLation Area
OutfaLL Size
36
%Tot Area COE CA
Parent Id
Avg COE
Comm Auto,Gas Sta,Pk Lot o year to Waters of U.S. 0 .667 17.48% .200 .133Ind Foundry,ELec,PPs o year to Waters of U.S. 0 .867 22.72% .200 .173Ind Foundry,ELec,PPs o year to Waters of U.S. 0 .791 20.72% .950 .751Ind Foundry,ELec,PPs 100 year on Site 0 .344 9.01% .001 .000
• Summary for IB-11
•
Comm Auto,Gas Sta,Pk LotInd Foundry,ELec,PPsInd Foundry,ELec,PPsTotaL Street Area
o year to Waters of U.S.o year to Waters of U.S.100 year on Site
oooo
.6671.657
.3441.149
17.48%43.41%9.01%
30.10%
.133
.924
.0001.091
0.1990.5580.0000.950
•
•
•
•
•
•
•
IB-11 Drainage Area TotaLs
o 3.817 100.00% 2.148 0.563

Landuse
•
•
ID
IB-12
Outfall Name
GILBERT DRIVE
Retention
Area
6.336
Population Area
Outfall Size
48
% Tot Area COE CA
Parent Id
Avg COE
Comm Auto,Gas Sta,Pk Lot o year to Waters of u.S. 0 1.464 23.11% .950 1.391Ind Foundry,Elec,PPs o year to Waters of u.S. 0 .365 5.76% .900 .328Ind Foundry,Elec,PPs o year to Waters of u.S. 0 .840 13.26% .900 .756Ind Foundry,Elec,PPs o year to Waters of u.S. 0 .000 0.00% .950 .000
• Ind Foundry,Elec,PPs o year to Waters of u.S. 0 .401 6.33% .900 .361Ind Foundry,Elec,PPs 100 year on Site 0 2.566 40.50% .001 .003
Summary for IB-12
Comm Auto,Gas Sta,Pk Lot o year to Waters of u.S. 0 1.464 23.11% 1.391 0.950
• Ind Foundry,Elec,PPs o year to Waters of u.S. 0 1.606 25.35% 1.446 0.900Ind Foundry,Elec,PPs 100 year on Site 0 2.566 40.50% .003 0.001Total Street Area 0 .700 11.04% .665 0.950
IB-12 Drainage Area Totals
•
•
•
•
•
•
•
o 6.336 100.00% 3.505 0.553

•ID Outfall Name Area Outfall Size Parent Id
--~--------------------------------------------------- ------------------------------------------------------------------.---------
KM-01 N KEN MCDONALD G.C. LAKE 483.285 54----------------------------------------------------------------------------------------------------------------------------------
• Landuse Retention Population Area %Tot Area COE CA Avg COE
-------------------------------------------------------------------------------------------------------------------------------Residential Low Density o year to Retention Basin 0 4.853 1.00% .560 2.717
Residential Low Density o year to Retention Basin 0 6.030 1.25% .560 3.377
Residential Low Density o year to Retention Basin 0 3.184 0.66% .560 1.783
Residential Low Density o year to Retention Basin 0 2.010 0.42% .560 1.125
• Residential Low Density o year to Retention Basin 0 2.101 0.43% .560 1.176
Residential Low Density o year to Retention Basin 0 4.682 0.97"1. .560 2.622
Residential Low Density o year to Retention Basin 0 6.235 1.29% .810 5.050
Residential Low Density o year to Retention Basin 0 3.328 0.69% .740 2.463
Residential Low Density o year to Retention Basin 0 3.292 0.68% .770 2.535
Residential Low Density o year to Retention Basin 0 2.664 0.55% .730 1.945
• Residential Low Density o year to Retention Basin 0 9.077 1.88% .560 5.083
Residential Low Density o year to Retention Basin 0 .966 0.20% .560 .541
Residential Low Density 5 year on Lot 0 1.408 0.29% .002 .003
Residential Low Density 5 year on Lot 0 2.767 0.57% .002 .006
Residential Low Density 5 year on Lot 0 2.767 0.57"1. .002 .006
Residential Low Density 5 year on Lot 0 .992 0.21% .002 .002
• Residential Low Density 5 year on Lot 0 3.031 0.63% .002 .006
Residential Low Density 5 year on Lot 0 5.074 1.05% .002 .010
Residential Low Density 5 year on Lot 0 13.935 2.88% .002 .028
Residential Low Density 5 year on Lot 0 3.959 0.82% .002 .008
Residential Low Density 5 year on Lot 0 7.981 1.65% .002 .016
Residential Low Density 5 year on Lot 0 .231 0.05% .002 .000
• Residential Low Density 5 year on Lot 0 5.708 1.18% .002 .011
Residential Low Density 5 year on Lot 0 4.670 0.97"1. .002 .009
Residential Low Density 5 year on Lot 0 5.313 1.10% .002 .011
Residential Low Density 5 year on Lot 0 12.567 2.60% .002 .025
Residential Low Density 5 year on Lot 0 7.196 1.49% .002 .014
Residential Low Density 5 year on Lot 0 6.889 1.43% .002 .014
• Residential Low Density 5 year on Lot 0 6.914 1.43% .002 .014
Residential Low Density 5 year on Lot 0 1.367 0.28% .002 .003
Residential Low Density 5 year on Lot 0 7.967 1.65% .002 .016Residential Low Density 5 year on Lot 0 3.031 0.63% .002 .006
Residential Low Density 5 year on Lot 0 2.317 0.48% .002 .005
Residential Low Density 5 year on Lot 0 2.810 0.58% .002 .006
• Residential Low Density 5 year on Lot 0 2.700 0.56% .002 .005Residential Low Density 5 year on Lot 0 2.767 0.57% .002 .006
Residential Low Density 5 year on Lot 0 7.829 1.62% .002 .016Residential Low Density 5 year on Site 0 7.355 1.52% .002 .015
Residential Low Density 5 year on Site 0 7.521 1.56% .002 .015
Residential Low Density 5 year on Site 0 5.977 1.24% .002 .012
• Residential Low Density 5 year on Site 0 2.462 0.51% .002 .005
Residential Low Density 5 year on Si te 0 5.878 1.22% .002 .012
Residential Low Density 5 year on Site 0 1.154 0.24% .002 .002
Residential Low Density 100 year on Site 0 .783 0.16% .001 .001
Residential Low Density 100 year on Site 0 .000 0.00% .001 .000
Residential High Density Detention Area on Site 0 14.550 3.01% .670 9.749
• Residential High Density Detention Area on Site 0 23.030 4.77% .800 18.424Residential High Density Detention Area on Site 0 13.109 2.71% .770 10.094
Comm Res Office, Church o year to Retention Basin 0 .638 0.13% .510 .325Comm Res Office, Church o year to Retention Basin 0 .411 0.09% .700 .288
•

•10 Outfall Name Area Outfall Size Parent Id
.. __ ... ---------------------------------------------------------------------------------------------------------------------------KM-01 N KEN MCDONALD G.C. LAKE 483.285 54-------------------------------------------------------------------------------------------'._-------------------------------------
• Landuse Retention Population Area %Tot Area COE CA Avg COE-------------------------------------------------------------------------------------------------------------------------------Comm Res Office, Church o year to Retention Basin 0 .577 0.12% .900 .519Comm Res Office, Church o year to Retention Basin 0 .503 0.10% .900 .453Comm Res Office, Church o year to Retention Basin 0 2.061 0.43% .410 .845Comm Res Office, Church 5 year on Lot 0 1.517 0.31% .002 .003
• Comm Res Office, Church 5 year on Site 0 .621 0.13% .002 .001Comm Res Office, Church 5 year on Site 0 .812 0.17"10 .002 .002Comm Res Office, Church 5 year on Site 0 .958 0.20% .002 .002Comm Res Office, Church 100 year on Site 0 .868 0.18% .001 .001Comm Res Office, Church 100 year on Site 0 .655 0.14% .001 .001Comm Res Office, Church 100 year on Site 0 .935 0.19% .001 .001
• Comm Res Office, Church 100 year on Site 0 .564 0.12% .001 .001Comm Res Office, Church 100 year on Site 0 .570 0.12% .001 .001Comm Res Office, Church 100 year on Site 0 .641 0.13% .001 .001Comm Res Office, Church 100 year on Site 0 .577 0.12% .001 .001Comm Res Office, Church 100 year on Site 0 .588 0.12% .001 .001Comm Res Office, Church 100 year on Site 0 .566 0.12% .001 .001
• Comm Res Office, Church 100 year on Site 0 .603 0.12% .001 .001Comm Res Office, Church 100 year on Site 0 .603 0.12% .001 .001Comm Res Office, Church 100 year on Site 0 1.205 0.25% .001 .001Comm Res Office, Church 100 year on Site 0 1.492 0.31% .001 .001Comm Res Office, Church 100 year on Site 0 .633 0.13% .001 .001Comm Hotels,Restraunts 100 year on Site 0 1.060 0.22% .001 .001
• Comm Hotels,Restraunts 100 year on Site 0 .503 0.10% .001 .001Comm Hotels,Restraunts 100 year on Site 0 .578 0.12% .001 .001Comm Mall, Strp Cntr,Ret o year to Retention Basin 0 3.693 0.76% .950 3.508Comm Mall, Strp Cntr ,Ret 100 year on Site 0 5.600 1.16% .001 .006Comm Mall, Strp Cntr ,Ret 100 year on Site 0 9.991 2.07% .001 .010Comm Mall, Strp Cntr,Ret Detention Area on Site 0 1.360 0.28% .950 1.292
• Comm Auto,Gas Sta,Pk Lot 100 year on Site 0 .891 0.18% .001 .001Ind Foundry,Elec,PPs 100 year on Site 0 10.037 2.08% .001 .010Vacant Land 100 year on Site 0 1.871 0.39% .001 .002Vacant Land Vacant Land 0 yr Retentio 0 1.085 0.22% .200 .217Open Space, Pks, Golf 100 year on Site 0 8.870 1.84% .001 .009Open Space, Pks, Golf 100 year on Site 0 3.817 0.79% .001 .004
• Open Space, Pks, Golf Retention Basin 0 59.196 12.25% 1.000 59.196Open Space, School o year to Retention Basin 0 .354 0.07% .950 .337Open Space, School 100 year on Site 0 7.872 1.63% .001 .008
Summary for KM-01---------------------------------------------------------------------------------------------------------------------------_._.
• Residential Low Density o year to Retention Basin 0 48.422 10.02% 30.418 0.628Residential Low Density 5 year on Lot 0 122.190 25.28% .244 0.002Residential Low Density 5 year on Site 0 30.347 6.28% .061 0.002Residential Low Density 100 year on Site 0 .783 .16% .001 0.001Residential High Density Detention Area on Site 0 50.689 10.49% 38.267 0.755Comm Res Office, Church o year to Retention Basin 0 4.189 .87% 2.429 0.580
• Comm Res Office, Church 5 year on Lot 0 1.517 .31% .003 0.002Comm Res Office, Church 5 year on Site 0 2.391 .49% .005 0.002Comm Res Office, Church 100 year on Site 0 10.501 2.17% .011 0.001Comm Hotels,Restraunts 100 year on Site 0 2.142 .44% .002 0.001
•

Landuse
•
•
ID
KM-01
Outfall Name
N KEN MCDONALD G.C. LAKE
Retention
Area
483.285
Population Area
Outfall Size
54
%Tot Area COE CA
Parent Id
Avg COE
•
Comm Mall, Strp Cntr,Ret 0 year to Retention Basin 0 3.693 .76% 3.508 0.950Comm Mall, Strp Cntr,Ret 100 year on Site 0 15.591 3.23% .016 0.001Comm Mall, Strp Cntr,Ret Detention Area on Site 0 1.360 .28% 1.292 0.950Comm Auto,Gas Sta,Pk Lot 100 year on Site 0 .891 .18% .001 0.001Ind Foundry,Elec,PPs 100 year on Site 0 10.037 2.08% .010 0.001Vacant Land 100 year on Site 0 1.871 .39% .002 0.001Vacant Land Vacant Land 0 yr Retentio 0 1.085 .22% .217 0.200Open Space, Pks, Golf 100 year on Site 0 12.686 2.62% .013 0.001Open Space, Pks, Golf Retention Basin 0 59.196 12.25% 59.196 1.000Open Space, School o year to Retention Basin 0 .354 .07% .337 0.952Open Space, School 100 year on Site 0 7.872 1.63% .008 0.001Total Street Area 0 95.478 19.76% 90.704 0.950
KM-01 Drainage Area Totals
•
•
•
•
•
•
•
o 483.285 100.00% 226.745 0.469

•ID Outfall Name Area Outfall Size Parent Id
---------------------------------------------------------------------------------------------------------------------.------------KM-01-A STROUD PARK 199.689 RET BASIN KM-01----------------------------------------------------------------------------------------------------------------------------------
• Landuse Retention Population Area %Tot Area COE CA Avg COE-------------------------------------------------------------------------------------------------------------------------------Residential Low Density o year to Retention Basin 0 4.011 2.01% .650 2.607
Residential Low Density o year to Retention Basin 0 .094 0.05% .650 .061
Residential Low Density o year to Retention Basin 0 6.543 3.28% .650 4.253Residential Low Density o year to Retention Basin 0 8.902 4.46% .650 5.787
• Residential Low Density o year to Retention Basin 0 9.153 4.58% .650 5.949Residential Low Density o year to Retention Basin 0 4.875 2.44% .650 3.169
Residential Low Density o year to Retention Basin 0 13.695 6.86% .650 8.902
Residential Low Density o year to Retention Basin 0 1.149 0.58% .650 .747
Residential Low Density o year to Retention Basin 0 5.065 2.54% .650 3.293Residential Low Density o year to Retention Basin 0 1.212 0.61% .650 .788
• Residential Low Density o year to Retention Basin 0 3.989 2.00% .650 2.593Residential Low Density o year to Retention Basin 0 6.291 3.15% .650 4.089Residential Low Density o year to Retention Basin 0 6.419 3.21% .650 4.172Residential Low Density o year to Retention Basin 0 6.096 3.05% .650 3.963Residential Low Density o year to Retention Basin 0 6.735 3.37";' .650 4.378Residential Low Density o year to Retention Basin 0 9.019 4.52% .650 5.863
• Residential Low Density o year to Retention Basin 0 1.107 0.55% .650 .720Residential Low Density 5 year on Lot 0 1.781 0.89% .002 .004Residential Low Density 5 year on Lot 0 14.687 7.35% .000 .000Residential Low Density 5 year on Lot 0 .370 0.19% .000 .000Residential Low Density 5 year on Lot 0 3.216 1.61% .000 .000Residential Low Density 5 year on Site 0 9.137 4.58% .002 .018
• Residential Low Density 100 year on Site 0 1.407 0.70% .001 .001Residential High Density 100 year on Site 0 10.180 5.10% .001 .010Residential High Density 100 year on Site 0 6.799 3.40% .001 .007Residential High Density 100 year on Site 0 13.466 6.74% .001 .013Comm Res Office, Church o year to Retention Basin 0 1.103 0.55% .390 .430Open Space, Pks, Golf Retention Basin 0 5.668 2.84% 1.000 5.668
• Summary for KM-01-A
Residential Low Density o year to Retention Basin 0 94.356 47.25% 61.331 0.650Residential Low Density 5 year on Lot 0 20.053 10.04% .004 0.000Residential Low Density 5 year on Si te 0 9.137 4.58% .018 0.002
• Residential Low Density 100 year on Site 0 1.407 .70% .001 0.001Residential High Density 100 year on Site 0 30.446 15.25% .030 0.001Comm Res Office, Church o year to Retention Basin 0 1.103 .55% .430 0.390Open Space, Pks, Golf Retention Basin 0 5.668 2.84% 5.668 1.000Total Street Area 0 37.519 18.79% 35.643 0.950
• KM-01-A Drainage Area Totals
•
•
o 199.689 100.00% 103.125 0.516

•10 Outfall Name Area Outfall Size Parent Id
KM-01-B SO WATER TREATMENT PLANT 74.741 ON-LOT RET KM-01
• Landuse Retention Population Area %Tot Area COE CA Avg COE
•
Municpal Facilities
Sunmary for KM-01-B
Municpal FacilitiesTotal Street Area
100 year on Site
100 year on Site
o
oo
60.029
60.02914.712
80.32%
80.32%19.68%
.001 .060
.06013.977
0.0010.950
•
•
•
•
•
•
•
•
KM-01-B Drainage Area Totals
o 74.741 100.00% 14.037 0.188

Landuse
•
•
ID
KM-02
Outfall Name
SO KEN MCDONALD G.C. LAKE
Retention
Area
166.555
Population Area
Outfall Size
42
%Tot Area CaE CA
Parent Id
Avg CaE
•
•
•
Residential Low Density o year to Retention Basin 0 6.758 4.06% .480 3.244Residential Low Density o year to Retention Basin 0 3.567 2.14% .480 1.712Residential Low Density o year to Retention Basin 0 5.745 3.45% .480 2.758Residential Low Density 5 year on Lot 0 1.774 1.07"1. .002 .004Residential Low Density 5 year on Lot 0 3.354 2.01% .002 .007Residential Low Density 5 year on Lot 0 12.592 7.56% .002 .025Residential Low Density 5 year on Lot 0 4.647 2.79% .002 .009Residential Low Density 5 year on Lot 0 3.371 2.02% .002 .007Residential Low Density 5 year on Lot 0 5.799 3.48% .002 .012Open Space, Pks, Golf o year to Retention Basin 0 5.534 3.32% .950 5.258Open Space, Pks, Golf 100 year on Site 0 21.549 12.94% .001 .022Open Space, Pks, Golf 100 year on Site 0 9.377 5.63% .001 .009Open Space, Pks, Golf 100 year on Site 0 16.736 10.05% .001 .017Open Space, Pks, Golf 100 year on Site 0 8.687 5.22% .001 .009Open Space, Pks, Golf Retention Basin 0 42.480 25.51% 1.000 42.480Municpal Faci l ities 100 year on Site 0 1.665 1.00% .001 .002
Summary for KM-02-------------------------------------------------------------------------------------------------------------------------------Residential Low Density o year to Retention Basin 0 16.070 9.65% 7.714 0.480Residential Low Density 5 year on Lot 0 31.535 18.93% .063 0.002Open Space, Pks, Golf o year to Retention Basin 0 5.534 3.32% 5.258 0.950
• Open Space, Pks, Golf 100 year on Site 0 56.349 33.83% .056 0.001Open Space, Pks, Golf Retention Basin 0 42.480 25.51% 42.480 1.000Municpal Facilities 100 year on Site 0 1.665 1.00% .002 0.001Total Street Area 0 12.922 7.76% 12.276 0.950
KM-02 Drainage Area Totals
•
•
•
•
•
o 166.555 100.00% 67.849 0.407

•ID Outfall Name Area Outfall Size Parent Id
.-------------------------------------------------------------------------_._.----------------------------------------------------KP-01 MILL AVE/KIWANIS PARK LAKE 389.578 54--------------------.-------------------------------------------------------------------------------------------------------------
• Landuse Retention Population Area %Tot Area COE CA Avg COE
-------------------------------------------------------------------------------------------------------------------------------Residential Low Density o year to Retention Basin 0 4.417 1.13% .450 1.988
Residential Low Density o year to Retention Basin 0 .145 0.04% .450 .065
Residential Low Density o year to Retention Basin 0 .013 0.00% .450 .006
Residential Low Density o year to Retention Basin 0 3.054 0.78% .450 1.374
• Residential Low Density o year to Retention Basin 0 1.510 0.39% .450 .680
Residential Low Density o year to Retention Basin 0 .809 0.21% .450 .364
Residential Low Density o year to Retention Basin 0 4.608 1.18% .450 2.074
Residential Low Density o year to Retention Basin 0 3.840 0.99% .650 2.496
Residential Low Density o year to Retention Basin 0 5.398 1.39% .450 2.429
Residential Low Density o year to Retention Basin 0 .757 0.19% .650 .492
• Residential Low Density o year to Retention Basin 0 7.105 1.82% .450 3.197
Residential Low Density o year to Retention Basin 0 2.882 0.74% .450 1.297
Residential Low Density o year to Retention Basin 0 2.405 0.62% .450 1.082
Residential Low Density o year to Retention Basin 0 4.913 1.26% .450 2.211
Residential Low Density o year to Retention Basin 0 3.840 0.99% .650 2.496
Residential Low Density o year to Retention Basin 0 4.768 1.22% .450 2.146
• Residential Low Density o year to Retention Basin 0 5.083 1.30% .450 2.287
Residential Low Density o year to Retention Basin 0 6.157 1.58% .450 2.771
Residential Low Density o year to Retention Basin 0 2.467 0.63% .450 1.110
Residential Low Density o year to Retention Basin 0 4.968 1.28% .450 2.236
Residential Low Density o year to Retention Basin 0 5.656 1.45% .450 2.545
Residential Low Density o year to Retention Basin 0 3.242 0.83% .450 1.459
• Residential Low Density o year to Retention Basin 0 9.431 2.42% .450 4.244
Residential Low Density o year to Retention Basin 0 6.606 1.70% .450 2.973
Residential Low Density o year to Retention Basin 0 6.003 1.54% .450 2.701
Residential Low Density o year to Retention Basin 0 1.576 0.40% .450 .709
Residential Low Density o year to Retention Basin 0 2.181 0.56% .450 .981
Residential Low Density o year to Retention Basin 0 2.793 0.72% .450 1.257
• Residential Low Density o year to Retention Basin 0 4.763 1.22% .450 2.143
Residential Low Density o year to Retention Basin 0 4.529 1.16% .450 2.038
Residential Low Density o year to Retention Basin 0 4.746 1.22% .450 2.136
Residential Low Density o year to Retention Basin 0 3.713 0.95% .450 1.671
Residential Low Density o year to Retention Basin 0 4.689 1.20% .450 2.110
Residential Low Density o year to Retention Basin 0 5.065 1.30% .450 2.279
• Residential Low Density o year to Retention Basin 0 2.174 0.56% .450 .979Residential Low Density o year to Retention Basin 0 2.467 0.63% .450 1.110Residential Low Density o year to Retention Basin 0 3.298 0.85% .450 1.484
Residential Low Density o year to Retention Basin 0 4.558 1.17% .450 2.051Residential Low Density o year to Retention Basin 0 4.675 1.20% .450 2.104
Residential Low Density o year to Retention Basin 0 5.119 1.31% .450 2.303
• Residential Low Density o year to Retention Basin 0 6.456 1.66% .450 2.905Residential High Density 5 year on Site 0 8.224 2.11% .002 .016Comm Res Office, Church 100 year on Site 0 1.474 0.38% .001 .001Comm Mall, Strp Cntr,Ret 100 year on Site 0 2.667 0.68% .001 .003Comm Mall, Strp Cntr,Ret 100 year on Site 0 8.097 2.08% .001 .008Comm Mall, Strp Cntr,Ret 100 year on Site 0 4.195 1.08% .001 .004
• Comm Mall, Strp Cntr,Ret 100 year on Site 0 4.071 1.04% .001 .004Open Space, Pks, Golf o year to Retention Basin 0 .822 0.21% .400 .329
Open Space, Pks, Golf o year to Retention Basin 0 4.088 1.05% .150 .613Open Space, Pks, Golf o year to Retention Basin 0 2.833 0.73% .150 .425
•

I
I
•ID
KP-01
Outfall Name
MILL AVE/KIWANIS PARK LAKE
Area
389.578
Outfall Size
54
Parent Id
• Landuse Retention Population Area %Tot Area CaE CA Avg CaE
Open Space, Pks, Golf o year to Retention Basin 0 3.979 1.02% .150 .597Open Space, Pks, Golf o year to Retention Basin 0 3.106 0.80% .150 .466Open Space, Pks, Golf o year to Retention Basin 0 18.607 4.78% .400 7.443Open Space, Pks, Golf o year to Retention Basin 0 5.059 1.30% .800 4.047
• Open Space, Pks, Golf Retention Basin 0 10.647 2.73% 1.000 10.647Open Space, Pks, Golf Retention Basin 0 18.660 4.79% 1.000 18.660Open Space, Pks, Golf Retention Basin 0 53.065 13.62% 1.000 53.065Open Space, School 100 year on Site 0 9.305 2.39% .001 .009
Summary for KP-01
•
•
•
•
•
•
•
•
Residential Low Density 0 year to Retention BasinResidential High Density,S year on SiteComm Res Office, Church 100 year on SiteComm Mall, Strp Cntr,Ret 100 year on SiteOpen Space, Pks, Golf 0 year to Retention BasinOpen Space, Pks, Golf Retention BasinOpen Space, School 100 year on SiteTotal Street Area
KP-01 Drainage Area Totals
o 162.880o 8.224o 1.474o 19.030o 38.494o 82.372o 9.305o 67.799
o 389.578
41.81%2.11%
.38%4.88%9.88%
21.14%2.39%
17.40%
100.00%
74.983.016.001.019
13.92082.372
.00964.409
235.729
0.4600.0020.0010.0010.3621.0000.0010.950
0.605

Landuse
•
•
ID
KP-01
Outfall Name
MILL AVE/KIWANIS PARK LAKE
Retention
Area
389.578
Population Area
Outfall Size
54
%Tot Area CaE CA
Parent Id
Avg CaE
Open Space, Pks, Golf o year to Retention Basin 0 3.979 1.02% .150 .597Open Space, Pks, Golf o year to Retention Basin 0 3.106 0.80% .150 .466Open Space, Pks, Golf o year to Retention Basin 0 18.607 4.78% .400 7.443Open Space, Pks, Golf o year to Retention Basin 0 5.059 1.30% .800 4.047
• Open Space, Pks, Golf Retention Basin 0 10.647 2.73% 1.000 10.647Open Space, Pks, Golf Retention Basin 0 18.660 4.79% 1.000 18.660Open Space, Pks, Golf Retention Basin 0 53.065 13.62% 1.000 53.065Open Space, School 100 year on Site 0 9.305 2.39% .001 .009
Summary for KP-01
•
•
•
•
•
•
•
•
Residential Low Density 0 year to Retention BasinResidential High Density 5 year on SiteComm Res Office, Church 100 year on SiteComm Mall, Strp Cntr,Ret 100 year on SiteOpen Space, Pks, Golf 0 year to Retention BasinOpen Space, Pks, Golf Retention BasinOpen Space, School 100 year on SiteTotal Street Area
KP-01 Drainage Area Totals
o 162.880o 8.224o 1.474o 19.030o 38.494o 82.372o 9.305o 67.799
o 389.578
41.81%2.11%
.38%4.88%9.88%
21.14%2.39%
17.40%
100.00%
74.983.016.001.019
13.92082.372
.00964.409
235.729
0.4600.0020.0010.0010.3621.0000.0010.950
0.605

•Parent Idoutfall SizeAreaoutfall NameID
~-------~--------------------------------------------- ----------------------------------------------------------------------------
0.973
Avg COE
436.385
CACOE
100.00%
% Tot Area
448.702
o 448.702
Population AreaRetention
SOUTH SALT RIVER
-------------------------------------------------------------------------------------------------------------------------------
-------------------------------------------------------------------------------------------------------------------------------
---------------------_ .•. _-----------------------------------------------------------------------------------------------------Landuse
RB-01
Vacant Land Vacant Land 0 yr Retentio 0 1.576 0.35% .200 .315
Vacant Land Vacant Land 0 yr Retentio 0 .326 0.07"1. .200 .065
Vacant Land Vacant Land 100 yr Retent 0 10.806 2.41% .001 .011.. Open Space, Pks, Golf o year to Waters of U.S. 0 435.994 97.17% 1.000 435.994
Summary for RB-01
Vacant Land Vacant Land 0 yr Retentio 0 1.902 .42% .380 0.200
Vacant Land Vacant Land 100 yr Retent 0 10.806 2.41% .011 0.001.. Open Space, Pks, Golf o year to Waters of U.S. 0 435.994 97.17% 435.994 1.000
Total Street Area 0 .000 .00% .000 0.950
RB-01 Drainage Area Totals
•
.. ----------------------------------------------------------------------------------------------------------------------------------
•
•
•
•

•ID Outfall Name Area Outfall Size Parent Id
RB-01-A SHEET FLOW TO SALT RIVER SO.
• Landuse Retention
395.202
Population Area %Tot Area COE
RB-01
CA Avg COE
Vacant Land 100 year on Site 0 .535 0.14% .001 .001Vacant Land Vacant Land 100 yr Retent 0 63.212 15.99% .001 .063Open Space, Pks, Golf 100 year on Site 0 27.830 7.04% .001 .028Municpal Facilities 100 year on Site 0 8.365 2.12% .001 .008
• Municpal Facilities 100 year on Site 0 39.306 9.95% .001 .039ADOT Jurisdiction ADOT information 0 13.557 3.43% .200 2.711
Summary for RB-01-A
•
•
•
Residential High Density 100 year on Site 0 2.273 .58% .002 0.001Comm Res Office, Church 100 year on Site 0 1.002 .25% .001 0.001Comm Auto,Gas Sta,Pk Lot 0 year to Waters of u.s. 0 4.102 1.04% 3.692 0.900Comm Auto,Gas Sta,Pk Lot 100 year on Site 0 38.200 9.67% .038 0.001Ind Park-light o year to Waters of u.S. 0 16.722 4.23% 4.180 0.250Ind Park-l ight 100 year on Site 0 9.771 2.47"1. .010 0.001Ind Foundry,Elec,PPs o year to Waters of u.S. 0 4.344 1.10% 2.844 0.655Ind Foundry,Elec,PPs 100 year on Site 0 57.334 14.51% .057 0.001Vacant Land o year to Waters of u.S. 0 18.872 4.78% 5.487 0.291Vacant Land 100 year on Site 0 44.429 11.24% .044 0.001Vacant Land Vacant Land 100 yr Retent 0 63.212 15.99% .063 0.001Open Space, Pks, Golf 100 year on Site 0 27.830 7.04% .028 0.001Muni cpa l Facilities 100 year on Site 0 47.672 12.06% .048 0.001ADOT Jurisdiction ADOT information 0 13.557 3.43% 2.711 0.200Total Street Area 0 45.882 11.61% 43.588 0.950
RB-01-A Drainage Area Totals
•
•
•
•
•
o 395.202 100.00% 62.793 0.159

•ID
RB-02
Outfall Name
NORTH SALT RIVER
Area
358.195
Outfall Size Parent Id
• Landuse Retention Population Area %Tot Area COE CA Avg COE
Vacant Land Vacant Land 0 yr Retentio 0 1.972 0.55% .300 .592Vacant Land Vacant Land 0 yr Retentio 0 .305 0.09% .350 .107Vacant Land Vacant Land 0 yr Retentio 0 2.761 0.77"" .250 .690Open Space, Pks, Golf o year to Waters of u.S. 0 352.220 98.33% 1.000 352.220
• ADOT Jurisdiction ADOT information 0 .937 0.26% .500 .468
Summary for RB-02
•Vacant LandOpen Space, Pks, GolfADOT JurisdictionTotal Street Area
Vacant Land 0 yr Retentioo year to Waters of u.S.ADOT information
o 5.038o 352.220o .937o .000
1.41%98.33%
.26%
.00%
1.389352.220
.468
.000
0.2761.0000.4990.950
•
•
•
•
•
•
•
RB-02 Drainage Area Totals
o 358.195 100.00% 354.0n • 0.989

•ID Outfall Name Area Outfall Si ze Parent Id
RB-02-A SHEET FLOW TO SALT RIVER NO 42.458 RB-02
• Landuse Retention Population Area %Tot Area COE CA Avg COE
•
•
Comm Auto,Gas Sta,Pk Lot o year to Waters of u.S. 0 1.846 4.35% .950 1.754Comm Auto,Gas Sta,Pk Lot 5 year on Site 0 2.814 6.63% .002 .006Comm Auto,Gas Sta,Pk Lot 5 year on Site 0 .193 0.45% .002 .000Comm Auto,Gas Sta,Pk Lot 100 year on Site 0 .759 1.79% .001 .001Ind Foundry,Elec,PPs 5 year on Si te 0 15.997 37.68% .002 .032Ind Foundry,Elec,PPs 100 year on Site 0 .957 2.25% .001 .001Ind Foundry,Elec,PPs 100 year on Site 0 5.382 12.68% .001 .005Vacant Land Vacant Land 0 yr Retentio 0 13.001 30.62% .200 2.600Vacant Land Vacant Land 5 yr Retentio 0 .818 1.93% .002 .002
Summary for RB-02-A
Comm Auto,Gas Sta,Pk Lot o year to Waters of u.S. 0 1.846 4.35% 1.754 0.950Comm Auto,Gas Sta,Pk Lot 5 year on Site 0 3.007 7.08% .006 0.002Comm Auto,Gas Sta,Pk Lot 100 year on Site 0 .759 1.79% .001 0.001Ind Foundry,Elec,PPs 5 year on Site 0 15.997 37.68% .032 0.002
• Ind Foundry,Elec,PPs 100 year on Site 0 6.340 14.93% .006 0.001Vacant Land Vacant Land 0 yr Retentio 0 13.001 30.62% 2.600 0.200Vacant Land Vacant Land 5 yr Retentio 0 .818 1.93% .002 0.002Total Street Area 0 .690 1.63% .656 0.950
RB-02-A Drainage Area Totals
•
•
•
•
•
•
o 42.458 100.00% 5.057 0.119

•ID
SR-01
Outfall Name
PRIEST BRIDGE
Area
67.552
Outfall Size
36
Parent Id
• Landuse Retention Population Area %Tot Area COE CA Avg COE-------------------------------------------------------------------------.-----------------------------------------------------Residential Low Density o year to Waters of u.S. 0 1.302 1.93% .400 .521Residential Low Density o year to Waters of u.S. 0 3.915 5.80% .470 1.840Residential Low Density o year to Waters of u.S. 0 .624 0.92% .650 .406Residential Low Density o year to Waters of u.S. 0 4.249 6.29% .470 1.997
• Residential Low Density 100 year on Site 0 .926 1.37"1. .001 .001Residential High Density 0 year to Waters of u.S. 0 2.775 4.11% .800 2.220Residential High Density 0 year to Waters of u.S. 0 1.569 2.32% .850 1.334Residential High Density 0 year to Waters of u.S. 0 1.760 2.61% .850 1.496Residential High Density 0 year to Waters of u.S. 0 3.507 5.19% .750 2.630Residential High Density 5 year on Lot 0 .302 0.45% .002 .001
• Residential High Density 5 year on Lot 0 .305 0.45% .002 .001Residential High Density 5 year on Lot 0 .306 0.45% .002 .001Residential High Density 5 year on Lot 0 1.828 2.71% .002 .004Residential High Density 5 year on Lot 0 .303 0.45% .002 .001Residential High Density 5 year on Lot 0 .634 0.94% .002 .001Residential High Density 5 year on Lot 0 .541 0.80% .002 .001
• Residential High Density 100 year on Site 0 2.995 4.43% .001 .003Residential High Density 100 year on Site 0 1.120 1.66% .001 .001Residential High Density 100 year on Site 0 1.225 1.81% .001 .001Residential High Density 100 year on Site 0 6.687 9.90% .001 .007Vacant Land Vacant Land 0 yr Retentio 0 4.987 7.38% .200 .997Municpal Facilities o year to Waters of u.S. 0 3.069 4.54% .950 2.916
• Summary for SR-01-------------------------------------------------------------------------------------------------------------------------------Residential Low Density o year to Waters of u.S. 0 10.092 14.94% 4.764 0.472Residential Low Density 100 year on Site 0 .926 1.37% .001 0.001Residential High Density 0 year to Waters of u.S. 0 9.610 14.23% 7.679 0.799
• Residential High Density 5 year on Lot 0 4.219 6.25% .008 0.002Residential High Density 100 year on Site 0 12.026 17.80% .012 0.001Vacant Land Vacant Land 0 yr Retentio 0 4.987 7.38% .997 0.200Municpal Faci l ities o year to Waters of u.S. 0 3.069 4.54% 2.916 0.950Total Street Area 0 22.623 33.49% 21.492 0.950
• SR-01 Drainage Area Totals
----------------------------------------------------------------------------------------------------------------.--------------0 67.552 100.00% 37.869 0.561
•
•
•

Landuse
•
•
ID
SR-02
Outfall Name
CITY YARD
Retention
Area
14.671
Population Area
Outfall Size
24
%Tot Area COE CA
Parent Id
Avg COE
•
Municpal Facilities
Summary for SR-02
Municpal FacilitiesTotal Street Area
o year to Waters of u.S.
o year to Waters of U.S.
o
oo
14.670
14.670.001
99.99%
99.99%.01%
.950 13.937
13.937.001
0.9500.950
•
•
•
•
•
•
SR-02 Drainage Area Totals
o 14.671 100.00% 13.938 0.950

Landuse
•
•
ID
SR-03
Outfall Name
E/O CITY YARD
Retention
Area
79.209
Population Area
Outfall Size
36
%Tot Area COE CA
Parent Id
Avg COE
•
•
•
•
Ind Park-light o year to Waters of u.S. 0 .753 0.95% .950 .715Ind Park-light 100 year on Site 0 2.745 3.47"-' .001 .003Ind Park-l ight 100 year on Site 0 1.131 1.43% .001 .001Vacant Land 100 year on Site 0 2.011 2.54% .001 .002Vacant Land Vacant Land 0 yr Retentio 0 1.246 1. 57"-' .200 .249Vacant Land Vacant Land 100 yr Retent 0 36.885 46.57% .001 .037Vacant Land Vacant Land 100 yr Retent 0 1.124 1.42% .001 .001Vacant Land Vacant Land 100 yr Retent 0 2.713 3.43% .001 .003Vacant Land Vacant Land 100 yr Retent 0 17.415 21.99% .001 .017Muni cpa l Facilities o year to Waters of U.,S. 0 2.988 3.77% .950 2.839Municpal Facilities 100 year on Site 0 2.681 3.38% .001 .003
Summary for SR-03
Ind Park-light o year to Waters of u.S. 0 .753 .95% .715 0.950Ind Park-light 100 year on Site 0 3.876 4.89% .004 0.001Vacant Land 100 year on Site 0 2.011 2.54% .002 0.001Vacant Land Vacant Land 0 yr Retentio 0 1.246 1.57% .249 0.200Vacant Land Vacant Land 100 yr Retent 0 58.137 73.40% .058 0.001Municpal Facilities o year to Waters of u.s. 0 2.988 3.77"-' 2.839 0.950Muni cpa l Facilities 100 year on Site 0 2.681 3.38% .003 0.001Total Street Area 0 7.517 9.49% 7.141 0.950
SR-03 Drainage Area Totals
•
•
•
•
•
o 79.209 100.00% 11.011 0.139

•10
SR-04
Outfall Name
FARMER AVE
Area
79.357
Outfall Size
72
Parent Id
-~~----------_._----------------------------------------------------------------------------------------------------------------
• Landuse Retention Population Area % Tot Area COE CA Avg COE----------------------------------------------------------------------------------------------------------------------------Residential Low Density o year to Waters of U.S. 0 .504 0.64% .380 .192Residential Low Density o year to Waters of U.S. 0 .544 0.69% .500 .272Residential Low Density 100 year on Site 0 .472 0.59% .001 .000Residential High Density 0 year to Waters of U.S. 0 1.374 1.73% .750 1.031
• Residential High Density 0 year to Waters of u.s. 0 1.074 1.35% .800 .859Residential High Density 0 year to Waters of U.S. 0 .047 0.06% .950 .045Residential High Density 5 year on Site 0 6.001 7.56% .002 .012Residential High Density 5 year on Site 0 .142 0.18% .002 .000Residential High Density 100 year on Site 0 .943 1.19% .001 .001Comm Hotels,Restraunts o year to Waters of U.S. 0 1.013 1.28% .950 .962
• Ind Park-light o year to Waters of U.S. 0 1.506 1.90% .600 .903Ind Park-light D year to Waters of U.S. 0 2.516 3.17"1. .900 2.265Ind Park-l ight o year to Waters of U.S. 0 1.003 1.26% .950 .952Ind Park-light o year to Waters of U.S. 0 1.310 1.65% .950 1.245Ind Park-light o year to Waters of U.S. 0 1.042 1.31% .400 .417Ind Park-light o year to Waters of U.S. 0 1.105 1.39% .950 1.050
• Ind Park-light o year to Waters of U.S. 0 .948 1.19% .950 .901Ind Park-light 5 year on Site 0 .996 1.26% .002 .002Ind Park-l ight 100 year on Site 0 1.781 2.24% .001 .002Ind Park-light 100 year on Site 0 .943 1.19% .001 .001Ind Park-light 100 year on Site 0 2.148 2.71% .001 .002Ind Park-l ight 100 year on Site 0 .930 1•17"1. .001 .001
• Ind Park-light 100 year on Site 0 .857 1.08% .001 .001Ind Park-light 100 year on Site 0 1.072 1.35% .001 .001Ind Park-light 100 year on Site 0 .874 1.10% .001 .001Ind Park-light 100 year on Site 0 .753 0.95% .001 .001Ind Park-light 100 year on Site 0 .753 0.95% .001 .001Ind Foundry,Elec,PPs o year to Waters of U.S. 0 1.023 1.29% .250 .256
• Vacant Land Vacant Land 0 yr Retentio 0 1.805 2.27"1. .200 .361Vacant Land Vacant Land 0 yr Retentio 0 .523 0.66% .200 .105Vacant Land Vacant Land 0 yr Retentio 0 .963 1.21% .200 .193Vacant Land Vacant Land 0 yr Retentio 0 2.603 3.28% .200 .521Vacant Land Vacant Land 0 yr Retentio 0 .237 0.30% .200 .047Vacant Land Vacant Land 0 yr Retentio 0 .516 0.65% .200 .103
• Vacant Land Vacant Land 100 yr Retent 0 15.447 19.47% .001 .015Vacant Land Vacant Land 100 yr Retent 0 7.088 8.93% .001 .007Vacant Land Vacant Land 100 yr Retent 0 .835 1.05% .001 .001
Summary for SR-04
------------------------------------------------------------------------------------------------------------ ----------------~
• Residential Low Density o year to Waters of U.S. 0 1.048 1.32% .464 0.443Residential Low Density 100 year on Site 0 .472 .59% .000 0.000Residential High Density 0 year to Waters of U.S. 0 2.496 3.15% 1.935 0.775Residential High Density 5 year on Site 0 6.143 7.74% .012 0.002Residential High Density 100 year on Site 0 .943 1.19% .001 0.001
•
•

•10 Outfall Name Area Outfall Size Parent Id
--_._.-------------------------------------------------------------------------------------------------------------------------
----------------------------------------------------------------------------------------------------------------------------
----------------------------------------------------------------------------------------------------------------------------Landuse•
SR-04 FARMER AVE
Retention
79.357
Population Area
72
% Tot Area COE CA Avg COE
Comm Hotels,Restraunts o year to Waters of U.S. 0 1.013 1.28% .962 0.950
Ind Park-light o year to Waters of U.S. 0 9.430 11.88% 7.733 0.820
Ind Park-light 5 year on Site 0 .996 1.26% .002 0.002
Ind Park-light 100 year on Site 0 10.111 12.74% .010 0.001
• Ind Foundry,Elec,PPs o year to Waters of U.S. 0 1.023 1.29% .256 0.250
Vacant Land Vacant Land 0 yr Retentio 0 6.647 8.38% 1.329 0.200
Vacant Land Vacant Land 100 yr Retent 0 23.370 29.45% .023 0.001
Total Street Area 0 15.665 19.74% 14.882 0.950
SR-04 Orainage Area Totals----------------------------------------------------------------------------------------------------------------------------•
•
•
•
•
•
•
•
o 79.357 100.00% 27.609 0.348

•ID Outfall Name Area Outfall Size Parent Id
... -----------.----------------------------------------------------------------------------------------------------------------SR-04-A UNNIVERSITY &SPRR 947.708 72 SR-04
-------------------------------------------------------------------------------------------------------------------------------
• Landuse Retention Population Area % Tot Area COE CA Avg COE
----------------------------------------------------------------------------------------------------------------------------Residential Low Density o year to Waters of U.S. 0 9.612 1.01% .540 5.190
Residential Low Density o year to Waters of u.s. 0 6.925 0.73% .540 3.739
Residential Low Density o year to Waters of u.s. 0 5.197 0.55% .540 2.806
Residential Low Density o year to Waters of u.s. 0 3.093 0.33% .540 1.670
• Residential Low Density o year to Waters of u.s. 0 6.919 0.73% .540 3.736
Residential Low Density o year to Waters of u.s. 0 3.575 0.38% .500 1.788
Residential Low Density o year to Waters of U.S. 0 6.051 0.64% .500 3.025
Residential Low Density o year to Waters of u.s. 0 .256 0.03% .400 .102
Residential Low Density o year to Waters of u.s. 0 2.551 0.27"1. .400 1.021
Residential Low Density o year to Waters of U.S. 0 1.885 0.20% .540 1.018
• Residential Low Density o year to Waters of U.S. 0 2.698 0.28% .430 1.160Residential Low Density o year to Waters of u.s. 0 3.609 0.38% .470 1.696
Residential Low Density o year to Waters of u.s. 0 4.707 0.50% .470 2.212
Residential Low Density o year to Waters of u.s. 0 4.731 0.50% .470 2.224
Residential Low Density o year to Waters of u.s. 0 1.030 0.11% .800 .824
Residential Low Density o year to Waters of U.S. 0 .507 0.05% .800 .406
• Residential Low Density o year to Waters of u.s. 0 2.980 0.31% .800 2.384
Residential Low Density o year to Waters of u.s. 0 5.105 0.54% .500 2.552
Residential Low Density o year to Waters of u.s. 0 .577 0.06% .850 .490
Residential Low Density o year to Waters of u.s. 0 4.647 0.49% .430 1.998
Residential Low Density o year to Waters of u.s. 0 .626 0.07"1. .430 .269
Residential Low Density o year to Waters of u.s. 0 2.238 0.24% .430 .962
• Residential Low Density o year to Waters of u.s. 0 2.323 0.25% .430 .999
Residential Low Density o year to Waters of U.S. 0 5.101 0.54% .430 2.193
Residential Low Density o year to Waters of u.s. 0 3.095 0.33% .540 1.671
Residential Low Density o year to Waters of u.s. 0 4.464 0.47"1. .400 1.786
Residential Low Density o year to Waters of U.S. 0 .178 0.02% .500 .089
Residential Low Density o year to Waters of U.S. 0 7.881 0.83% .430 3.389
• Residential Low Density o year to Waters of U.S. 0 2.435 0.26% .430 1.047
Residential Low Density o year to Waters of u.s. 0 1.390 0.15% .500 .695
Residential Low Density o year to Waters of u.s. 0 .194 0.02% .500 .097Residential Low Density o year to Waters of u.s. 0 1.379 0.15% .430 .593Residential Low Density o year to Waters of u.s. 0 2.097 0.22% .540 1.133
Residential Low Density o year to Waters of u.s. 0 2.895 0.31% .540 1.563
• Residential Low Density o year to Waters of U.S. 0 1.683 0.18% .540 .909Residential Low Density o year to Waters of u.s. 0 4.443 0.47"1. .500 2.221
Residential Low Density o year to Waters of u.s. 0 .180 0.02% .950 . 171Residential Low Density o year to Waters of u.s. 0 2.261 0.24% .390 .882
Residential Low Density 5 year on Lot 0 4.205 0.44% .002 .008Residential Low Density 5 year on Lot 0 .603 0.06% .002 .001
• Residential Low Density 5 year on Lot 0 .210 0.02% .002 .000Residential Low Density 5 year on Lot 0 .306 0.03% .002 .001Residential Low Density 5 year on Lot 0 2.165 0.23% .002 .004Residential Low Density 5 year on Lot 0 .325 0.03% .002 .001Residential Low Density 5 year on Lot 0 1.710 0.18% .002 .003
Residential Low Density 5 year on Lot 0 3.485 0.37"1. .002 .007
• Residential Low Density 5 year on Lot 0 4.676 0.49% .002 .009
Residential Low Density 5 year on Lot 0 .613 0.06% .002 .001
Residential Low Density 5 year on Lot 0 2.961 0.31% .002 .006Residential Low Density 5 year on Lot 0 2.033 0.21% .002 .004
•

•10 Outfall Name Area Outfall Size Parent Id
_.-----------------------------------------------------------------------------------------------------------------------------SR-04-A UNNIVERSITY &SPRR 947.708 72 SR-04
-------------------------------------------------------------------------------------------------------------------------------
• Landuse Retention Population Area %Tot Area COE CA Avg COE----------------------------------------------------------------------------------------------------------------------------Residential Low Density 5 year on Lot 0 2.535 0.27"-' .002 .005
Residential Low Density 5 year on Lot 0 2.445 0.26% .002 .005
Residential Low Density 5 year on Lot 0 2.392 0.25% .002 .005
Residential Low Density 5 year on Lot 0 2.393 0.25% .002 .005
• Residential Low Density 5 year on Lot 0 6.100 0.64% .002 .012
Residential Low Density 5 year on Lot 0 .911 0.10% .002 .002
Residential Low Density 5 year on Lot 0 6.218 0.66% .002 .012Residential Low Density 5 year on Lot 0 .665 0.07% .002 .001Residential Low Density 5 year on Lot 0 2.064 0.22% .002 .004Residential Low Density 5 year on Lot 0 3.845 0.41% .002 .008
• Residential Low Density 5 year on Lot 0 3.510 0.37"-' .002 .007Residential Low Density 5 year on Lot 0 .451 0.05% .002 .001Residential Low Density 100 year on Lot 0 8.754 0.92% .001 .009
Residential Low Density 100 year on Lot 0 2.576 0.27"-' .001 .003Residential Low Density 100 year on Lot 0 3.623 0.38% .001 .004
Residential Low Density 100 year on Lot 0 3.267 0.34% .001 .003
• Residential Low Density 100 year on Lot 0 3.352 0.35% .001 .003Residential Low Density 100 year on Lot 0 1.543 0.16% .001 .002Residential Low Density 100 year on Lot 0 1.446 0.15% .001 .001Residential Low Density 100 year on Lot 0 1.643 0.17"-' .001 .002Residential Low Density 100 year on Lot 0 1.543 0.16% .001 .002
Residential Low Density 100 year on Lot 0 1.235 0.13% .001 .001
• Residential Low Density 100 year on Lot 0 2.837 0.30% .001 .003Residential Low Density 100 year on Lot 0 2.083 0.22% .001 .002Residential Low Density 100 year on Lot 0 4.402 0.46% .001 .004Residential Low Density 100 year on Lot 0 3.714 0.39% .001 .004Residential Low Density 100 year on Lot 0 9.722 1.03% .001 .010Residential Low Density 100 year on Lot 0 7.311 0.77% .001 .007
• Residential Low Density 100 year on Lot 0 9.107 0.96% .001 .009Residential Low Density 100 year on Lot 0 4.086 0.43% .001 .004Residential Low Density 100 year on Lot 0 3.071 0.32% .001 .003Residential Low Density 100 year on Lot 0 2.320 0.24% .001 .002Residential Low Density 100 year on Lot 0 6.676 0.70% .001 .007Residential Low Density 100 year on Lot 0 5.977 0.63% .001 .006
• Residential Low Density 100 year on Lot 0 9.081 0.96% .001 .009Residential Low Density 100 year on Lot 0 1.279 0.13% .001 .001Residential Low Density 100 year on Lot 0 2.066 0.22% .001 .002Residential Low Density 100 year on Lot 0 .747 0.08% .001 .001Residential Low Density 100 year on Lot 0 1.401 0.15% .001 .001Residential Low Density 100 year on Lot 0 .296 0.03% .001 .000
• Residential Low Density 100 year on Lot 0 2.899 0.31% .001 .003Residential Low Density 100 year on Lot 0 .682 0.07"-' .001 .001Residential Low Density 100 year on Lot 0 1.526 0.16% .001 .002Residential Low Density 100 year on Lot 0 .250 0.03% .001 .000Residential Low Density 100 year on Site 0 3.584 0.38% .001 .004Residential Low Density 100 year on Site 0 .671 0.07"" .001 .001
• Residential Low Density 100 year on Site 0 .448 0.05% .001 .000Residential Low Density 100 year on Site 0 .918 0.10% .001 .001Residential Low Density 100 year on Site 0 .717 0.08% .001 .001Residential Low Density 100 year on Site 0 4.267 0.45% .001 .004
•

•ID Outfall Name Area Outfall Size Parent Id
-------------------------------------------------------------------------------------------------------------------------------SR-04-A UNNIVERSITY &SPRR 947.708 72 SR-04
-------------------------------------------------------------------------------------------------------------------------------
• Landuse Retention Population Area % Tot Area COE CA Avg COE----------------------------------------------------------------------------------------------------------------------------Residential Low Density 100 year on Site 0 5.335 0.56% .001 .005
Residential Low Density 100 year on Site 0 2.571 0.27"1. .001 .003
Residential Low Density 100 year on Site 0 2.066 0.22% .001 .002
Residential Low Density 100 year on Site 0 3.159 0.33% .001 .003
• Residential Low Density 100 year on Site 0 1.891 0.20% .001 .002
Residential Low Density 100 year on Site 0 1.194 0.13% .001 .001
Residential Low Density 100 year on Site 0 2.066 0.22% .001 .002
Residential Low Density 100 year on Site 0 2.755 0.29% .001 .003
Residential Low Density 100 year on Site 0 1.338 0.14% .001 .001Residential Low Density 100 year on Site 0 .968 0.10% .001 .001
• Residential Low Density 100 year on Site 0 4.271 0.45% .001 .004Residential Low Density 100 year on Site 0 .746 0.08% .001 .001Residential Low Density 100 year on Site 0 1.722 0.18% .001 .002
Residential Low Density 100 year on Site 0 .895 0.09% .001 .001Residential Low Density 100 year on Site 0 1.521 0.16% .001 .002Residential Low Density 100 year on Site 0 5.851 0.62% .001 .006
• Residential Low Density 100 year on Site 0 .327 0.03% .001 .000Residential Low Density 100 year on Site 0 2.693 0.28% .001 .003Residential High Density 0 year to Waters of U.S. 0 1.848 0.19% .950 1.755Residential High Density 0 year to Waters of U.S. 0 .433 0.05% .800 .346Residential High Density 0 year to Waters of U.S. 0 .859 0.09% .950 .816Residential High Density 0 year to Waters of U.S. 0 2.387 0.25% .300 .716
• Residential High Density 0 year to Waters of U.S. 0 .721 0.08% .950 .685Residential High Density 0 year to Waters of U.S. 0 .599 0.06% .550 .330Residential High Density 0 year to Waters of U.S. 0 3.666 0.39% .900 3.300Residential High Density 0 year to Waters of U.S. 0 7.626 0.80% .790 6.025Residential High Density 0 year to Waters of U.S. 0 1.501 0.16% .900 1.351Residential High Density 0 year to Waters of U.S. 0 4.216 0.44% .950 4.005
• Residential High Density 0 year to Waters of U.S. 0 .680 0.07"1. .950 .646Residential High Density 0 year to Waters of U.S. 0 .578 0.06% .650 .376Residential High bensity 0 year to Waters of U.S. 0 1.147 0.12% .850 .975Residential High Density 0 year to Waters of U.S. 0 1.518 0.16% .750 1.139Residential High Density 5 year on Lot 0 2.138 0.23% .002 .004Residential High Density 5 year on Lot 0 1.853 0.20% .002 .004
• Residential High Density 5 year on Lot 0 .910 0.10% .002 .002Residential High Density 5 year on Lot 0 .631 0.07% .002 .001Residential High Density 5 year on Lot 0 2.410 0.25% .002 .005Residential High Density 5 year on Site 0 .877 0.09% .002 .002Residential High Density 5 year on Site 0 4.198 0.44% .002 .008Residential High Density 100 year on Site 0 3.452 0.36% .001 .003
• Residential High Density 100 year on Site 0 2.375 0.25% .001 .002Residential High Density 100 year on Site 0 .237 0.03% .001 .000Residential High Density 100 year on Site 0 2.110 0.22% .001 .002Comm Res Office, Church o year to Waters of U.S. 0 .164 0.02% .540 .089Comm Res Office, Church o year to Waters of U.S. 0 .477 0.05% .950 .454Comm Res Office, Church o year to Waters of U.S. 0 .895 0.09% .950 .850
• Comrn Res Office, Church o year to Waters of U.S. 0 .358 0.04% .950 .340Comrn Res Office, Church o year to Waters of U.S. 0 .224 0.02% .950 .213Comm Res Office, Church o year to Waters of U.S. 0 1.383 0.15% .600 .830Comm Res Office, Church o year to Waters of U.S. 0 1.331 0.14% .550 .732
•

•ID Outfall Name Area Outfall Size Parent Id
-------------------------------------------------------------------------------------------------------------------------------.SR-04-A UNNIVERSITY &SPRR 947.708 72 SR-04
-------------------------------------------------------------------------------------------------------------------------------
• Landuse Retention Population Area % Tot Area COE CA Avg COE----------------------------------------------------------------------------------------------------------------------------Comm Res Office, Church o year to Waters of u.s. 0 .267 0.03% .800 .214Comm Res Office, Church o year to Waters of u.s. 0 2.145 0.23% .820 1.759Comm Res Office, Church o year to Waters of u.s. 0 6.787 0.72% .790 5.361Comm Res Office, Church o year to Waters of u.s. 0 .354 0.04% .950 .336
• Comm Res Office, Church o year to Waters of u.s. 0 .446 0.05% .800 .357Comm Res Office, Church o year to Waters of u.s. 0 1.779 0.19% .950 1.690Comm Res Office, Church o year to Waters of u.s. 0 .000 0.00% .900 .000Comm Res Office, Church o year to Waters of u.s. 0 .662 0.07% .950 .629Comm Res Office, Church o year to Waters of u.s. 0 .402 0.04% .950 .382Comm Res Office, Church o year to Waters of u.s. 0 .458 0.05% .950 .435
• Comm Res Office, Church o year to Waters of u.s. 0 .610 0.06% .950 .579Comm Res Office, Church o year to Waters of u.s. 0 .478 0.05% .850 .406Comm Res Office, Church o year to Waters of u.s. 0 .218 0.02% .900 .196Comm Res Office, Church o year to Waters of u.s. 0 .431 0.05% .850 .367Comm Res Office, Church o year to Waters of u.s. 0 .408 0.04% .000 .000Comm Res Off ice, Church o year to Waters of u.s. 0 .854 0.09% .850 .726
• Comm Res Office, Church o year to Waters of u.s. 0 .262 0.03% .950 .249Comm Res Office, Church o year to Waters of u.s. 0 .815 0.09% .500 .407Comm Res Office, Church o year to Waters of u.s. 0 .308 0.03% .850 .262Comm Res Office, Church o year to Waters of u.s. 0 .242 0.03% .950 .230Comm Res Office, Church o year to Waters of u.s. 0 .366 0.04% .800 .293Comm Res Office, Church 5 year on Lot 0 .245 0.03% .002 .000
• Comm Res Office, Church 5 year on Lot 0 1.205 0.13% .002 .002Comm Res Office, Church 5 year on Lot 0 .208 0.02% .002 .000Comm Res Office, Church 5 year on Lot 0 .245 0.03% .002 .000Comm Res Office, Church 5 year on Lot 0 .228 0.02% .002 .000Comm Res Office, Church 5 year on Lot 0 .436 0.05% .002 .001Comm Res Office, Church 5 year on Lot 0 .218 0.02% .002 .000
• Comm Res Office, Church 5 year on Lot 0 .361 0.04% .002 .001Comm Res Office, Church 5 year on Lot 0 .365 0.04% .002 .001Comm Res Office, Church 5 year on Site 0 .215 0.02% .002 .000Comm Res Office, Church 100 year on Lot 0 .803 0.08% .001 .001Comm Res Office, Church 100 year on Lot 0 9.996 1.05% .001 .010Comm Res Office, Church 100 year on Site 0 .264 0.03% .001 .000
• Comm Res Office, Church 100 year on Site 0 .200 0.02% .001 .000Comm Res Office, Church 100 year on Site 0 2.760 0.29% .001 .003Comm Res Office, Church 100 year on Site 0 1.119 0.12% .001 .001Comm Res Office, Church Detention Area on Site 0 2.684 0.28% .550 1.476Comm Hotels,Restraunts o year to Waters of u.S. 0 2.064 0.22% .900 1.858Comm Hotels,Restraunts o year to Waters of u.S. 0 1.000 0.11% .900 .900
• Comm Hotels,Restraunts o year to Waters of u.S. 0 .791 0.08% .800 .633Comm Hotels,Restraunts o year to Waters of u.S. 0 .321 0.03% .850 .273Comm Hotels,Restraunts o year to Waters of u.S. 0 .299 0.03% .950 .284Comm Hotels,Restraunts o year to Waters of u.S. 0 .256 0.03% .950 .243Comm Hotels,Restraunts o year to Waters of u.S. 0 .321 0.03% .900 .289Comm Mall, Strp Cntr,Ret 0 year to Waters of u.S. 0 3.955 0.42% .950 3.757
• Comm Mall, Strp Cntr,Ret 0 year to Waters of u.S. 0 4.524 0.48% .950 4.298Comm Mall, Strp Cntr,Ret 0 year to Waters of u.S. 0 9.828 1.04% .950 9.336Comm Mall, Strp Cntr,Ret 0 year to Waters of u.S. 0 3.623 0.38% .950 3.442Comm Mall, Strp Cntr,Ret 0 year to Waters of u.S. 0 .294 0.03% .950 .280
•

•ID Outfall Name Area Outfall Size Parent Id
-------------------------------------------------------------------------------------------------------------------------------SR-04-A UNNIVERSITY &SPRR 947.708 72 SR-04
-------------------------------------------------------------------------------------------------------------------------------
• Landuse Retention Population Area % Tot Area CaE CA Avg CaE
----------------------------------------------------------------------------------------------------------------------------Comm Mall, Strp Cntr,Ret 0 year to Waters of U.S. 0 1.355 0.14% .950 1.288
Comm Mall, Strp Cntr,Ret 5 year on Site 0 7.956 0.84% .002 .016
Comm Auto,Gas Sta,Pk Lot 0 year to Waters of u.s. 0 .480 0.05% .950 .456
Comm Auto,Gas Sta,Pk Lot 0 year to Waters of u.s. 0 .502 0.05% .950 .477
• Comm Auto,Gas Sta,Pk Lot 0 year to Waters of u.s. 0 .428 0.05% .950 .407
Comm Auto,Gas Sta,Pk Lot 0 year to Waters of u.s. 0 .522 0.06% .950 .496
Vacant Land o year to Waters of u.S. 0 2.025 0.21% .250 .506
Vacant Land o year to Waters of U.S. 0 .363 0.04% .200 .073
Vacant Land o year to Waters of U.S. 0 .329 0.03% .200 .066
Vacant Land o year to Waters of u.s. 0 .357 0.04% .200 .071
• Vacant Land o year to Waters of u.s. 0 .919 0.10% .200 .184Open Space, Pks, Golf 100 year on Lot 0 13.549 1.43% .001 .014Open Space, Pks, Golf 100 year on Site 0 .232 0.02% .001 .000
Open Space, Pks, Golf 100 year on Site 0 1.995 0.21% .001 .002
Open Space, Pks, Golf 100 year on Site 0 .295 0.03% .001 .000
Open Sp.ace, School o year to Waters of U.S. 0 2.281 0.24% .900 2.053
• Open Space, School o year to Waters of u.S. 0 10.801 1.14% .800 8.641
Open Space, School o year to Waters of u.S. 0 5.584 0.59% .700 3.909
Open Space, School o year to Waters of u.S. 0 5.187 0.55% .750 3.890
Open Space, School o year to Waters of u.S. 0 1.000 0.11% .900 .900
Open Space, School o year to Waters of u.S. 0 2.564 0.27"-' .750 1.923
Open Space, School o year to Waters of u.S. 0 1.239 0.13% .900 1.115
• Open Space, School o year to Waters of u.S. 0 1.548 0.16% .650 1.006
Open Space, School o year to Waters of u.S. 0 .943 0.10% .900 .849
Open Space, School o year to Waters of u.S. 0 2.648 0.28% .600 1.589
Open Space, School o year to Waters of u.S. 0 .130 0.01% .950 .123
Open Space, School o year to Waters of u.S. 0 1.995 0.21% .800 1.596
Open Space, School o year to Waters of u.S. 0 3.061 0.32% .600 1.837
• Open Space, School o year to Waters of u.S. 0 .771 0.08% .900 .694
Open Space, School o year to Waters of u.S. 0 4.338 0.46% .760 3.297
Open Space, School o year to Waters of u.S. 0 3.075 0.32% .600 1.845
Open Space, School a year to Waters of u.S. 0 2.059 0.22% .900 1.853
Open Space, School o year to Waters of u.S. 0 5.813 0.61% .850 4.941
Open Space, School o year to Waters of u.S. 0 1.000 0.11% .800 .800
• Open Space, School o year to Waters of u.S. 0 3.620 0.38% .900 3.258
Open Space, School o year to Waters of u.S. 0 10.456 1.10% .950 9.933
Open Space, School o year to Waters of u.S. 0 .796 0.08% .950 .757
Open Space, School o year to Waters of u.S. 0 .000 0.00% .600 .000Open Space, School o year to Waters of u.S. 0 .496 0.05% .900 .446
Open Space, School 5 year on Site 0 6.103 0.64% .002 .012
• Open Space, School 5 year on Site 0 3.138 0.33% .002 .006
Open Space, School 5 year on Site 0 1.237 0.13% .002 .002Open Space, School 5 year on Site 0 .495 0.05% .002 .001
Open Space, School 5 year on Site 0 1.609 0.17"-' .002 .003
Open Space, School 5 year on Site 0 1.056 0.11% .002 .002
Open Space, School 100 year on Lot 0 38.778 4.09% .001 .039
• Open Space, School 100 year on Site 0 .563 0.06% .001 .001
Open Space, School 100 year on Site 0 2.429 0.26% .001 .002
Open Space, School 100 year on Site 0 2.110 0.22% .001 .002Open Space, School 100 year on Site 0 1.692 0.18% .001 .002
•

•Ii ID Outfall Name Area Outfall Size Parent Id
----~--------------------------------------------------------------------------------------------------------------------------
----------------------------------------------------------------------------------------------------------------------------
-------------------------------------------------------------------------------------------------------------------------------
•SR-04-A UNNIVERSITY &SPRR
Landuse Retention
947.708
Population Area
72
%Tot Area CaE CA
SR-04
Avg CaE
•
•
Open Space, School 100 year on Site 0 17.083 1.80% .001 .017
Open Space, School 100 year on Site 0 6.409 0.68% .001 .006
Open Space, School 100 year on Site 0 7.906 0.83% .001 .008
Open Space, School 100 year on Site 0 2.697 0.28% .001 .003
Open Space, School 100 year on Site 0 3.442 0.36% .001 .003
Open Space, school 100 year on Site 0 21.343 2.25% .001 .021
Open Space, School 100 year on Site 0 1.724 0.18% .001 .002
Open Space, School 100 year on Site 0 8.512 0.90% .001 .009
Open Space, School 100 year on Site 0 4.890 0.52% .001 .005
Open Space, School 100 year on Site 0 8.777 0.93% .001 .009
Open Space, School 100 year on Site 0 13.950 1.47"1. .001 .014
Summary for SR-04-A----------------------------------------------------------------------------------------------------------------------------Residential Low Density o year to Waters of U.S. 0 121.514 12.82% 60.711 0.500
Residential Low Density 5 year on Lot 0 56.826 6.00% .114 0.002
• Residential Low Density 100 year on Lot 0 110.515 11.66% .111 0.001
Residential Low Density 100 year on Site 0 51.974 5.48% .052 0.001
Residential High Density 0 year to Waters of U.S. 0 27.779 2.93% 22.464 0.809
Residential High Density 5 year on Lot 0 7.942 .84% .016 0.002
Residential High Density 5 year on Site 0 5.075 .54% .010 0.002
Residential High Density 100 year on Site 0 8.174 .86% .008 0.001
• Comm Res Office, Church o year to Waters of U.S. 0 23.123 2.44% 18.384 0.795
Comm Res Office, Church 5 year on Lot 0 3.511 .37"1. .007 0.002
Comm Res Office, Church 5 year on Site 0 .215 .02% .000 0.000
Comm Res Office, Church 100 year on Lot 0 10.799 1.14% .011 0.001
Comm Res Offi ce, Church 100 year on Site 0 4.342 .46% .004 0.001
Comm Res Office, Church Detention Area on Site 0 2.684 .28% 1.476 0.550
• Comm Hotels,Restraunts o year to Waters of U.S. 0 5.053 .53% 4.480 0.887
Comm Mall, Strp Cntr,Ret 0 year to Waters of U.S. 0 23.580 2.49% 22.401 0.950
Comm Mall, Strp Cntr,Ret 5 year on Site 0 7.956 .84% .016 0.002
Comm Auto,Gas Sta,Pk Lot 0 year to Waters of U.S. 0 1.932 .20% 1.835 0.950
Vacant Land o year to Waters of U.S. 0 3.992 .42% .900 0.225
Open Space, Pks, Golf 100 year on Lot 0 13.549 1.43% .014 0.001
• Open Space, Pks, Golf 100 year on Site 0 2.522 .27"1. .003 0.001
Open Space, School o year to Waters of U.S. 0 71.404 7.53% 57.254 0.802
Open Space, School 5 year on Site 0 13.638 1.44% .027 0.002
Open Space, School 100 year on Lot 0 38.778 4.09% .039 0.001
Open Space, School 100 year on Site 0 103.526 10.92% .104 0.001
Total Street Area 0 227.305 23.98% 215.939 0.950
• SR-04-A Drainage Area Totals--------------------------------------------------------------------------------------------------------------------------_.
0 947.708 100.00% 406.380 0.429
•
•

•ID Outfall Name Area Outfall Size Parent ld
-------------------------------------------------------------------------------------------------------------------------------SR-05 ASH AVE 155.195 54------------------------------------------------------------------------------------------------------------------------------
• Landuse Retention Population Area % Tot Area COE CA Avg COE--------------------------------------------------------------------------------------------------------------------------.-Residential Low Density o year to Waters of u.s. 0 .310 0.20% .750 .233
Residential Low Density 100 year on Site 0 .770 0.50% .001 .001
Residential Low Density 100 year on Site 0 .276 0.18% .001 .000
Residential High Density 0 year to Waters of u.S. 0 .227 0.15% .470 .107
• Residential High Density 0 year to Waters of u.S. 0 .208 0.13% .470 .098
Residential High Density 0 year to Waters of u.S. 0 .399 0.26% .850 .339
Residential High Density 0 year to Waters of u.S. 0 2.235 1.44% .950 2.123
Comm Res Office, Church o year to Waters of u.S. 0 .448 0.29% .950 .426
Comm Res Office, Church o year to Waters of u.S. 0 .276 0.18% .950 .262
Comm Res Office, Church o year to Waters of u.S. 0 .660 0.43% .650 .429
• Comm Res Office, Church o year to Waters of u.S. 0 .182 0.12% .950 .173Comm Res Office, Church o year to Waters of u.S. 0 .311 0.20% .950 .296Comm Res Office, Church o year to Waters of u.S. 0 .279 0.18% .950 .265
Comm Res Office, Church o year to Waters of u.S. 0 2.249 1.45% .700 1.575Comm Res Office, Church o year to Waters of u.S. 0 .765 0.49% .950 .727
Comm Res Office, Church o year to Waters of u.S. 0 .658 0.42% .950 .625
• Comm Res Office, Church o year to Waters of u.S. 0 .665 0.43% .950 .632Comm Res Office, Church o year to Waters of u.S. 0 .667 0.43% .950 .633
Comm Res Office, Church o year to Waters of u.S. 0 .063 0.04% .950 .060
Comm Res Office, Church o year to Waters of u.S. 0 .278 0.18% .950 .264
Comm Res Office, Church 100 year on Site 0 1.006 0.65% .001 .001Comm Res Office, Church 100 year on Site 0 .353 0.23% .001 .000
• Comm Res Office, Church 100 year on Site 0 1.162 0.75% .001 .001
Comm Res Office, Church 100 year on Site 0 .460 0.30% .001 .000Comm Res Office, Church Detention Area on Site 0 1.005 0.65% .950 .955Comm Res Office, Church Detention Area on Site 0 .433 0.28% .950 .412
Comm Hotels,Restraunts o year to Waters of u.S. 0 1.578 1.02% .950 1.499Comm Hotels,Restraunts o year to Waters of u.S. 0 .258 0.17"-' .950 .245
• Comm Hotels,Restraunts o year to Waters of u.S. 0 .356 0.23% .950 .338
Comm Hotels,Restraunts o year to Waters of u.S. 0 .599 0.39% .950 .569
Comm Hotels,Restraunts o year to Waters of u.S. 0 .331 0.21% .950 .315Comm Hotels,Restraunts o year to Waters of u.S. 0 .353 0.23% .950 .335Comm Hotels,Restraunts o year to Waters of u.S. 0 .499 0.32% .950 .474Comm Hotels,Restraunts o year to Waters of u.S. 0 .138 0.09% .800 .110
• Comm Hotels,Restraunts o year to Waters of u.S. 0 .243 0.16% .950 .230Comm Hotels,Restraunts o year to Waters of u.S. 0 .427 0.28% .950 .406Comm Hotels,Restraunts o year to Waters of u.S. 0 .750 0.48% .950 .713Comm Hotels,Restraunts o year to Waters of u.S. 0 1.295 0.83% .950 1.230Comm Hotels,Restraunts o year to Waters of ~.S. 0 .480 0.31% .950 .456Comm Hotels,Restraunts o year to Waters of u.S. 0 .624 0.40% .950 .593
• Comm Hotels,Restraunts o year to Waters of u.S. 0 1.481 0.95% .950 1.407Comm Hotels,Restraunts 5 year on Site 0 2.477 1.60% .002 .005Comm Hotels,Restraunts 100 year on Site 0 .648 0.42% .001 .001Comm Hotels,Restraunts 100 year on Site 0 1.129 0.73% .001 .001Comm Hotels,Restraunts 100 year on Site 0 .732 0.47"-' .001 .001Comm Mall, Strp Cntr,Ret o year to Waters of u.S. 0 8.854 5.71% .950 8.411
• Comm Mall, Strp Cntr,Ret o year to Waters of u.S. 0 6.812 4.39% .950 6.471Comm Mall, Strp Cntr,Ret o year to Waters of u.S. 0 2.194 1.41% .950 2.084
Comm Mall, Strp Cntr,Ret o year to Waters of u.s. 0 1.100 0.71% .950 1.045Comm Mall, Strp Cntr,Ret o year to Waters of u.s. 0 2.325 1.50% .950 2.208
•
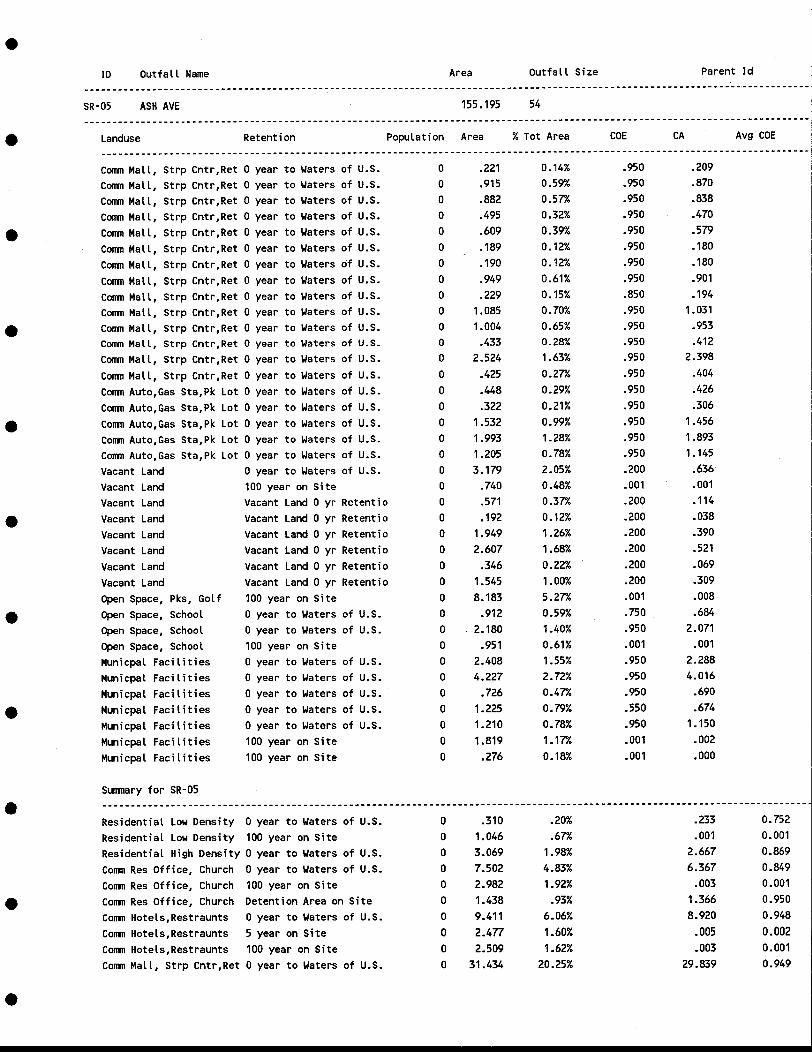
•ID Outfall Name Area Outfall Size Parent Id
M~ -------------------------------------------------------------------------
SR-05 ASH AVE 155.195 54-------------------------------------------------------------------------------------------------------------------------------
• Landuse Retention Population Area % Tot Area COE CA Avg COE
----------------------------------------------------------------------------------------------------------------------------Comm Mall, Strp Cntr,Ret 0 year to Waters of u.s. 0 .221 0.14% .950 .209
Comm Mall, Strp Cntr,Ret 0 year to Waters of u.s. 0 .915 0.59% .950 .870
Comm Mall, Strp Cntr,Ret 0 year to Waters of u.s. 0 .882 0.57"1. .950 .838
Comm Mall, Strp Cntr,Ret 0 year to Waters of U.S. 0 .495 0.32% .950 .470
• Comm Mall, Strp Cntr,Ret 0 year to Waters of u.s. 0 .609 0.39% .950 .579
Comm Mall, Strp Cntr,Ret 0 year to Waters of u.s. 0 .189 0.12% .950 .180
Comm Mall, Strp Cntr,Ret 0 year to Waters of u.s. 0 .190 0.12% .950 .180
Comm Mall, Strp Cntr,Ret 0 year to Waters of u.s. 0 .949 0.61% .950 .901
Comm Mall, Strp Cntr,Ret 0 year to Waters of u.s. 0 .229 0.15% .850 .194
Comm Mall, Strp Cntr,Ret 0 year to Waters of u.s. 0 1.085 0.70% .950 1.031
• Comm Mall, Strp Cntr,Ret 0 year to Waters of u.s. 0 1.004 0.65% .950 .953
Comm Mall, Strp Cntr,Ret 0 year to Waters of U.S. 0 .433 0.28% .950 .412
Comm Mall, Strp Cntr,Ret 0 year to Waters of u.s. 0 2.524 1.63% .950 2.398
Comm Mall, Strp Cntr,Ret 0 year to Waters of u.s. 0 .425 0.27"1. .950 .404
Comm Auto,Gas Sta,Pk Lot 0 year to Waters of u.s. 0 .448 0.29% .950 .426
Comm Auto,Gas Sta,Pk Lot 0 year to Waters of u.s. 0 .322 0.21% .950 .306
• Comm Auto,Gas Sta,Pk Lot 0 year to Waters of u.s. 0 1.532 0.99% .950 1.456
Comm Auto,Gas Sta,Pk Lot 0 year to Waters of u.s. 0 1.993 1.28% .950 1.893
Comm Auto,Gas Sta,Pk Lot 0 year to Waters of U.S. 0 1.205 0.78% .950 1.145
Vacant Land o year to Waters of U.S. 0 3.179 2.05% .200 .636
Vacant Land 100 year on Site 0 .740 0.48% .001 .001
Vacant Land Vacant Land 0 yr Retentio 0 .571 0.37% .200 .114
• Vacant Land Vacant Land 0 yr Retentio 0 .192 0.12% .200 .038
Vacant Land Vacant Land 0 yr Retentio 0 1.949 1.26% .200 .390
Vacant Land Vacant Land 0 yr Retentio 0 2.607 1.68% .200 .521
Vacant Land Vacant Land 0 yr Retentio 0 .346 0.22% .200 .069
Vacant Land Vacant Land 0 yr Retentio 0 1.545 1.00% .200 .309
Open Space, Pks, Golf 100 year on Site 0 8.183 5.27"1. .001 .008
• Open Space, School o year to Waters of U.S. 0 .912 0.59% .750 .684
Open Space, School o year to Waters of U.S. 0 2.180 1.40% .950 2.071
Open Space, School 100 year on Site 0 .951 0.61% .001 .001
Municpal Facilities o year to Waters of U.S. 0 2.408 1.55% .950 2.288
Municpal Facilities o year to Waters of U.S. 0 4.227 2.72% .950 4.016
Municpal Facilities o year to Waters of U.S. 0 .726 0.47% .950 .690
• Municpal Facilities o year to Waters of U.S. 0 1.225 0.79% .550 .674
Municpal Facilities o year to Waters of U.S. 0 1.210 0.78% .950 1.150
Municpal Facilities 100 year on Site 0 1.819 1.17% .001 .002
Municpal Faci l ities 100 year on Site 0 .276 0.18% .001 .000
Summary for SR-05
• ---------------------------------------------------------------------------------------------------------------------_._ .. -
Residential Low Density o year to Waters of U.S. 0 .310 .20% .233 0.752
Residential Low Density 100 year on Site 0 1.046 .67"1. .001 0.001
Residential High Density 0 year to Waters of U.S. 0 3.069 1.98% 2.667 0.869
Comm Res Office, Church o year to Waters of U.S. 0 7.502 4.83% 6.367 0.849
Comm Res Office, Church 100 year on Site 0 2.982 1.92% .003 0.001
• Comm Res Office, Church Detention Area on Site 0 1.438 .93% 1.366 0.950
Comm Hotels,Restraunts o year to Waters of U.S. 0 9.411 6.06% 8.920 0.948
Comm Hotels,Restraunts 5 year on Site 0 2.477 1.60% .005 0.002
Comm Hotels,Restraunts 100 year on Site 0 2.509 1.62% .003 0.001
Comm Mall, Strp Cntr,Ret 0 year to Waters of U.S. 0 31.434 20.25% 29.839 0.949
•

Landuse
•
•
•
•
ID
SR-05
Outfall Name
ASH AVE
Retention
Area
155.195
Population Area
Outfall Size
54
% Tot Area COE CA
Parent Id
Avg COE
•
•
•
•
•
•
•
o 155.195 100.00% 117.946 0.760

•10 Outfall Name Area Outfall Size Parent Id
-------------------------------------------------------------------------------------------------------------------------------
----------------------------------------------------------------------------------------------------------------------------
-------------------------------------------------------------------------------------------------------------------------------Landuse•
SR-06 MILL AVENUE
Retention
65.713
Population Area
24
% Tot Area CaE CA Avg CaE
•
•
•
•
Comm Mall, Strp Cntr,Ret 0 year to Waters of U.S. 0 .430 0.65% .950 .409
Comm Mall, Strp Cntr,Ret 100 year on Site 0 4.535 6.90% .001 .005
Comm Auto,Gas Sta,Pk Lot 0 year to Waters of U.S. 0 1.796 2.73% .950 1.706
Ind Park-li ght o year to Waters of U.S. 0 3.079 4.69% .900 2.771
Ind Large Site-Medium o year to Waters of U.S. 0 1.249 1.90% .950 1.187
Vacant Land Vacant Land 0 yr Retentio 0 .614 0.93% .350 .215
Vacant Land Vacant Land 0 yr Retentio 0 29.122 44.32% .650 18.929
Vacant Land Vacant Land 100 yr Retent 0 6.091 9.27"10 .001 .006
Vacant Land Vacant Land 100 yr Retent 0 9.085 13.83% .001 .009
Vacant Land Vacant Land 100 yr Retent 0 4.266 6.49% .001 .004
Summary for SR-06---------------------------------------------------------------------------------------------------------------------------Comm Mall, Strp Cntr,Ret o year to Waters of U.S. 0 .430 .65% .409 0.951
Comm Mall, Strp Cntr,Ret 100 year on Site 0 4.535 6.90% .005 0.001
Comm Auto,Gas Sta,Pk Lot o year to Waters of U.S. 0 1.796 2.73% 1.706 0.950
Ind Park-light o year to Waters of U.S. 0 3.079 4.69% 2.771 0.900
Ind Large Site-Medium o year to Waters of U.S. 0 1.249 1.90% 1.187 0.950
Vacant Land Vacant Land 0 yr Retentio 0 29.735 45.25% 19.144 0.644
Vacant Land Vacant Land 100 yr Retent 0 19.442 29.59% .019 0.001
Total Street Area 0 5.447 8.29% 5.174 0.950
SR-06 Drainage Area Totals--------------------------------------------------------------------------------------------------------------------------_.
•
•
•
•
•
o 65.713 100.00% 30.415 0.463
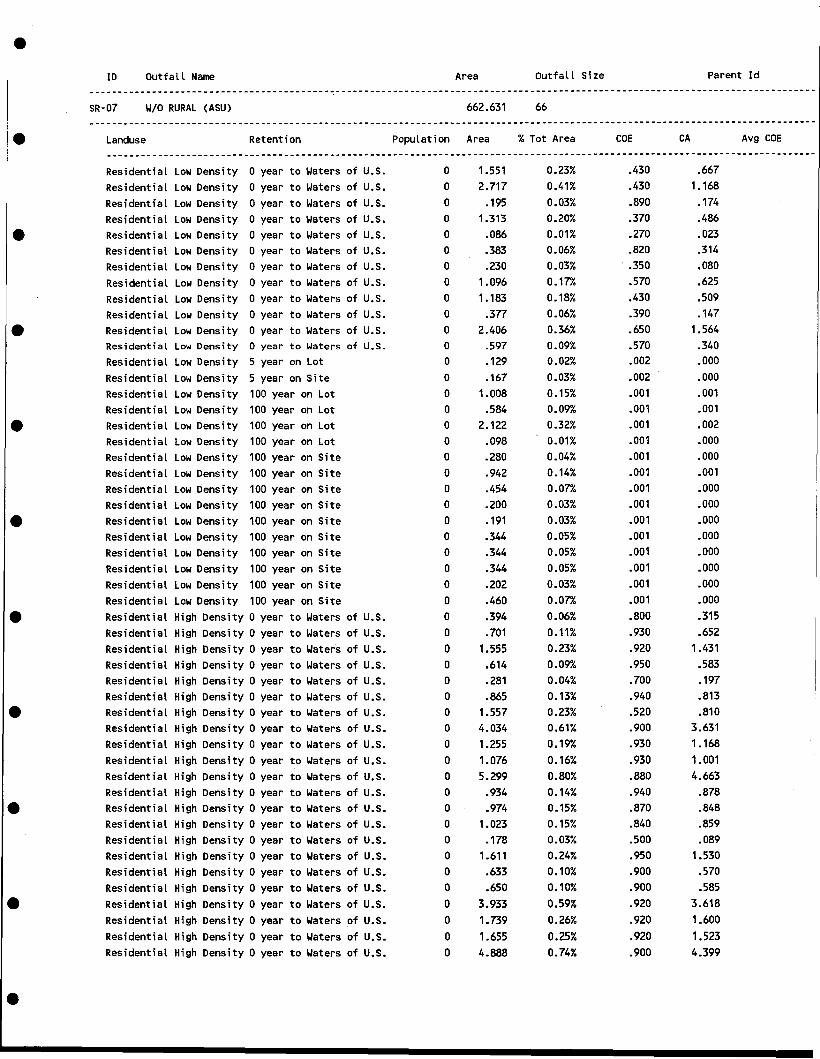

•10 Outfall Name Area Outfall Size Parent Id
-------------------------------------------------------------------------------------------------------------------------------SR-07 WIO RURAL (ASU) 662.631 66-------------------------------------------------------------------------------------------------------------------------------
• Landuse Retention Population Area %Tot Area COE CA Avg COE----------------------------------------------------------------------------------------------------------------------------Residential High Density 0 year to Waters of U.S. 0 1.881 0.28% .910 1.711
Residential High Density 0 year to Waters of U.S. 0 .846 0.13% .950 .803
Residential High Density 0 year to Waters of U.S. 0 3.018 0.46% .950 2.867
Residential High Density 0 year to Waters of U.S. 0 4.408 0.67"-' .650 2.865
• Residential High Density 0 year to Waters of U.S. 0 .694 0.10% .880 .610Residential High Density 0 year to Waters of U.S. 0 .683 0.10% .800 .546Residential High Density 0 year to Waters of U.S. 0 .518 0.08% .800 .415
Residential High Density 0 year to Waters of U.S. 0 2.088 0.32% .900 1.879
Residential High Density 0 year to Waters of U.S. 0 1.849 0.28% .850 1.571
Residential High Density 0 year to Waters of u.s. 0 .783 0.12% .550 .431
• Residential High Density 0 year to Waters of U.S. 0 10.436 1.57"-' .800 8.349Residential High Density 0 year to Waters of U.S. 0 .254 0.04% .950 .241Residential High Density 0 year to Waters of U.S. 0 .319 0.05% .820 .262
Residential High Density 0 year to Waters of U.S. 0 .998 0.15% .840 .838Residential High Density 0 year to Waters of U.S. 0 .587 0.09% .950 .557Residential High Density 0 year to Waters of U.S. 0 .145 0.02% .480 .070
• Residential High Density 0 year to Waters of U.S. 0 1.170 0.18% .920 1.077Residential High Density 0 year to Waters of U.S. 0 1.451 0.22% .930 1.349Residential High Density 0 year to Waters of U.S. 0 1.937 0.29% .910 1.763Residential High Density 5 year on Lot 0 .615 0.09% .002 .001
Residential High Density 5 year on Lot 0 .499 0.08% .002 .001Residential High Density 5 year on Site 0 .755 0.11% .002 .002
• Residential High Density 5 year on Site 0 .497 0.08% .002 .001Residential High Density 5 year on Site 0 2.297 0.35% .002 .005Residential High Density 5 year on Site 0 .598 0.09% .002 .001Residential High Density 5 year on Site 0 .682 0.10% .002 .001Residential High Density 5 year on Site 0 .861 0.13% .002 .002Residential High Density 5 year on Site 0 .972 0.15% .002 .002
• Residential High Density 5 year on Site 0 .409 0.06% .002 .001Residential High Density 5 year on Site 0 .442 0.07"-' .002 .001Residential High Density 100 year on Lot 0 .268 0.04% .001 .000Residential High Density 100 year on Lot 0 .172 0.03% .001 .000Residential High Density 100 year on Lot 0 .242 0.04% .001 .000Residential High Density 100 year on Lot 0 .239 0.04% .001 .000
• Residential High Density 100 year on Lot 0 .374 0.06% .001 .000Residential High Density 100 year on Lot 0 2.587 0.39% .001 .003Residential High Density 100 year on Lot 0 1.259 0.19% .001 .001Residential High Density 100 year on Lot 0 5.122 0.77"-' .001 .005Residential High Density 100 year on Site 0 7.010 1.06% .001 .007Residential High Density 100 year on Site 0 .272 0.04% .001 .000
• Residential High Density 100 year on Site 0 3.862 0.58% .001 .004Residential High Density 100 year on Site 0 2.746 0.41% .001 .003Residential High Density 100 year on Site 0 3.424 0.52% .001 .003Residential High Density 100 year on Site 0 .264 0.04% .001 .000Residential High Density 100 year on Site 0 .308 0.05% .001 .000Residential High Density 100 year on Site 0 .344 0.05% .001 .000
• Residential High Density 100 year on Site 0 .919 0.14% .001 .001Residential High Density 100 year on Site 0 .583 0.09% .001 .001Residential High Density 100 year on Site 0 .330 0.05% .001 .000Residential High Density 100 year on Site 0 .275 0.04% .001 .000
•

•ID Outfall Name Area Outfall Size Parent Id
--_.---------------------------------------------------------------------------------------------------------------------------SR-07 WIO RURAL (ASU) 662.631 66-------------------------------------------------------------------------------------------------------------------------------
• Landuse Retention Population Area % Tot Area COE CA Avg COE----------------------------------------------------------------------------------------------------------------------------Residential High Density 100 year on Site 0 7.761 1.17% .001 .008Residential High Density 100 year on Site 0 .581 0.09% .001 .001Residential High Density 100 year on Site 0 .815 0.12% .001 .001
Residential High Density 100 year on Site 0 .512 0.08% .001 .001
• Residential High Density 100 year on Site 0 9.144 1.38% .001 .009Residential High Density 100 year on Site 0 2.015 0.30% .001 .002Residential High Density 100 year on Site 0 18.014 2.72% .001 .018Residential High Density 100 year on Site 0 5.859 0.88% .001 .006Residential High Density 100 year on Site 0 2.627 0.40% .001 .003Residential High Density Detention Area on Site 0 .644 0.10% .000 .000
• Comm Res Office, Church o year to Waters of U.S. 0 1.660 0.25% .950 1.577Comm Res Office, Church o year to Waters of U.S. 0 1.362 0.21% .930 1.267Comm Res Office, Church o year to Waters of U.S. 0 1.094 0.1r;. .950 1.039Comm Res Office, Church 100 year on Site 0 12.596 1.90% .001 .013Comm Res Office, Church 100 year on Site 0 .712 0.11% .001 .001Comm Res Office, Church Detention Area on Site 0 .891 0.13% .940 .838
• Comm Hotels,Restraunts o year to Waters of U.S. 0 .698 0.11% .950 .663Comm Hotels,Restraunts o year to Waters of U.S. 0 1.495 0.23% .250 .374Comm Hotels,Restraunts o year to Waters of U.S. 0 1.691 0.26% .250 .423Comm Hotels,Restraunts o year to Waters of U.S. 0 .427 0.06% .900 .384Comm Hotels,Restraunts o year to Waters of U.S. 0 .396 0.06% .900 .356Comm Hotels,Restraunts o year to Waters of U.S. 0 4.013 0.61% .820 3.291i. Comm Hotels,Restraunts o year to Waters of U.S. 0 .725 0.11% .900 .653Comm Hotels,Restraunts o year to Waters of U.S. 0 .959 0.14% .950 .911Comm Hotels,Restraunts o year to Waters of U.S. 0 .744 0.11% .900 .669Comm Hotels,Restraunts o year to Waters of U.S. 0 .943 0.14% .950 .896Comm Hotels,Restraunts o year to Waters of U.S. 0 1.388 0.21% .950 1.318Comm Hotels,Restraunts o year to Waters of U.S. 0 .416 0.06% .950 .395
• Comm Hotels,Restraunts o year to Waters of U.S. 0 .474 O. or;. .950 .450Comm Hotels,Restraunts o year to Waters of U.S. 0 .573 0.09% .950 .544Comm Hotels,Restraunts o year to Waters of U.S. 0 .829 0.13% .300 .249Comm Hotels,Restraunts o year to Waters of U.S. 0 .432 O. or;. .950 .410Comm Hotels,Restraunts o year to Waters of U.S. 0 .690 0.10% .950 .656Comm Hotels,Restraunts o year to Waters of U.S. 0 1.353 0.20% .950 1.286
• Comm Hotels,Restraunts o year to Waters of U.S. 0 1.183 0.18% .950 1.124Comm Hotels,Restraunts 5 year on Lot 0 .676 0.10% .002 .001Comm Hotels,Restraunts 5 year on Site 0 .921 0.14% .002 .002Comm Hotels,Restraunts 100 year on Site 0 1.070 0.16% .001 .001Comm Hotels,Restraunts 100 year on Site 0 .238 0.04% .001 .000Comm Hotels,Restraunts 100 year on Site 0 .811 0.12% .001 .001
• Comm Hotels,Restraunts 100 year on Site 0 1.150 0.1r;. .001 .001Comm Hotels,Restraunts 100 year on Site 0 1.033 0.16% .001 .001Comm Hotels,Restraunts 100 year on Site 0 .437 0.07% .001 .000Comm Hotels,Restraunts 100 year on Site 0 .533 0.08% .001 .001Comm Hotels,Restraunts 100 year on Site 0 .482 O. or;. .001 .000Comm Mall, Strp Cntr,Ret o year to Waters of U.S. 0 .704 0.11% .950 .669
• Comm Mall, Strp Cntr,Ret o year to Waters of U.S. 0 .277 0.04% .950 .263Comm Mall, Strp Cntr,Ret o year to Waters of U.S. 0 1.009 0.15% .950 .958Comm Mall, Strp Cntr,Ret o year to Waters of U.S. 0 .911 0.14% .910 .829Comm Mall, Strp Cntr,Ret o year to Waters of U.S. 0 .161 0.02% .950 .153
•

•ID Outfall Name Area Outfall Size Parent Id
-------------------------------------------------------------------------------------------------------------------------------SR-07 WIO RURAL CASU) 662.631 66-------------------------------------------------------------------------------------------------------------------------------
• Landuse Retention Population Area % Tot Area CaE CA Avg CaE----------------------------------------------------------------------------------------------------------------------------Comm Mall, Strp Cntr,Ret 0 year to Waters of U.S. 0 .482 0.07"10 .950 .458
Comm Mall, Strp Cntr,Ret 0 year to Waters of U.S. 0 1.150 0.17% .950 1.092
Comm Mall, Strp Cntr,Ret 0 year to Waters of U.S. 0 .690 0.10% .900 .621
Comm Mall, Strp Cntr,Ret 0 year to Waters of U.S. 0 .243 0.04% .950 .231
• Comm Mall, Strp Cntr,Ret 0 year to Waters of U.S. 0 .596 0.09% .950 .566Comm Mall, Strp Cntr,Ret 0 year to Waters of U.S. 0 .373 0.06% .950 .354Comm Mall, Strp Cntr,Ret 5 year on Lot 0 10.374 1. 57"10 .002 .021
Comm Mall, Strp Cntr,Ret 5 year on Site 0 1.974 0.30% .002 .004Comm Mall, Strp Cntr,Ret 5 year on Site 0 .947 0.14% .002 .002Comm Mall, Strp Cntr,Ret 100 year on Site 0 1.269 0.19% .001 .001
• Comm Mall, Strp Cntr,Ret 100 year on Site 0 .823 0.12% .001 .001Comm Mall, Strp Cntr,Ret Vacant Land 0 yr Retentio 0 .606 0.09% .200 .121Comm Auto,Gas Sta,Pk Lot 0 year to Waters of U.S. 0 .446 0.07"10 .950 .423
Comm Auto,Gas Sta,Pk Lot 0 year to Waters of U.S. 0 .501 0.08% .950 .476Comm Auto,Gas Sta,Pk Lot 0 year to Waters of U.S. 0 1.022 0.15% .950 .971Comm Auto,Gas Sta,Pk Lot 0 year to Waters of U.S. 0 .324 0.05% .950 .307
• Comm Auto,Gas Sta,Pk Lot 0 year to Waters of U.S. 0 .646 0.10% .950 .613Comm Auto,Gas Sta,Pk Lot 0 year to Waters of U.S. 0 .577 0.09% .950 .548Comm Auto,Gas Sta,Pk Lot 0 year to Waters of U.S. 0 .478 0.07"10 .950 .454Comm Auto,Gas Sta,Pk Lot 0 year to Waters of U.S. 0 .367 0.06% .950 .349Comm Auto,Gas Sta,Pk Lot 0 year to Waters of U.S. 0 .321 0.05% .950 .305
Comm Auto,Gas Sta,Pk Lot 5 year on Site 0 .428 0.06% .002 .001
• Comm Auto,Gas Sta,Pk Lot 100 year on Site 0 4.859 0.73% .001 .005Comm Auto,Gas Sta,Pk Lot 100 year on Site 0 1.122 0.17"10 .001 .001Ind Park-light o year to Waters of U.S. 0 6.088 0.92% .930 5.662Ind Park-light o year to Waters of U.S. 0 2.947 0.44% .950 2.799Ind Foundry,Elec,PPs 100 year on Site 0 .538 0.08% .001 .001Vacant Land 5 year on Site 0 1.130 0.17"10 .002 .002
• Vacant Land 100 year on Site 0 30.674 4.63% .001 .031Vacant Land 100 year on Site 0 1.977 0.30% .001 .002Vacant Land Vacant Land 0 yr Retentio 0 1.331 0.20% .200 .266Vacant Land Vacant Land 5 yr Retentio 0 6.559 0.99% .002 .013Vacant Land Vacant Land 5 yr Retentio 0 3.431 0.52% .002 .007Vacant Land Vacant Land 5 yr Retentio 0 4.991 0.75% .002 .010
• Vacant Land Vacant Land 100 yr Retent 0 .344 0.05% .001 .000Vacant Land Vacant Land 100 yr Retent 0 .395 0.06% .001 .000Vacant Land Vacant Land 100 yr Retent 0 1.467 0.22% .001 .001Vacant Land Vacant Land 100 yr Retent 0 1.960 0.30% .001 .002Vacant Land Vacant Land 100 yr Retent 0 .257 0.04% .001 .000Vacant Land Vacant Land 100 yr Retent 0 .880 0.13% .001 .001
• Vacant Land Vacant Land 100 yr Retent 0 .172 0.03% .001 .000Vacant Land Vacant Land 100 yr Retent 0 .324 0.05% .001 .000Open Space, Pks, Golf o year to Waters of U.S. 0 8.631 1.30% .200 1.726Open Space, Pks, Golf 100 year Qn Site 0 28.850 4.35% .001 .029Open Space, Pks, Golf 100 year on Site 0 63.955 9.65% .001 .064Open Space, Pks, Golf Detention Area on Site 0 3.778 0.57"10 .950 3.589
• Open Space, School a year to Waters of U.S. a 2.748 0.41% .950 2.611Open Space, School o year to Waters of U.S. 0 81.236 12.26% .950 77.174Open Space, School 100 year on Site 0 19.670 2.97"10 .001 .020Open Space, School 100 year on Site 0 35.221 5.32% .001 .035
•

•10 Outfall Name Area Outfall Si ze Parent Id
-------------------------------------------------------------------------------------------------------------------------------
SR-07 W/O RURAL CASU) 662.631 66
-------------------------------------------------------------------------------------------------------------------------------
• Landuse Retention Population Area % Tot Area COE CA Avg COE
----------------------------------------------------------------------------------------------------------------------------Open Space, School 100 year on Site 0 11.739 1.77% .001 .012
Municpal Facil i ti es o year to Waters of U.S. 0 1.515 0.23% .880 1.333
Municpal Facilities 5 year on Lot 0 .826 0.12% .002 .002
Municpal Facilities 100 year on Site 0 .182 0.03% .001 .000
• Municpal Facilities 100 year on Site 0 3.852 0.58% .001 .004
Summary for SR-07----------------------------------------------------------------------------------------------------------------------------Residential Low Density o year to Waters of U.S. 0 12.135 1.83% 6.098 0.503
Residential Low Density 5 year on Lot 0 .129 .02% .000 0.000
• Residential Low Density 5 year on Site 0 .167 .03% .000 0.000
Residential Low Density 100 year on Lot 0 3.812 .58% .004 0.001
Residential Low Density 100 year on Site 0 3.761 .57% .004 0.001
Residential High Density 0 year to Waters of u.S. 0 69.917 10.55% 59.970 0.858
Residential High Density 5 year on Lot 0 1.114 .17% .002 0.002
Residential High Density 5 year on Site 0 7.513 1.13% .015 0.002
• Residential High Density 100 year on Lot 0 10.262 1.55% .010 0.001
Residential High Density 100 year on Site 0 67.666 10.21% .068 0.001
Residential High Density Detention Area on Site 0 .644 .10% .000 0.000
Comm Res Office, Church o year to Waters of U.S. 0 4.116 .62% 3.883 0.943
Comm Res Office, Church 100 year on Site 0 13.308 2.01% .013 0.001
Comm Res Office, Church Detention Area on Site 0 .891 .13% .838 0.941
• Comm Hotels,Restraunts o year to Waters of U.S. 0 19.429 2.93% 15.051 0.775
Comm Hotels,Restraunts 5 year on Lot 0 .676 .10% .001 0.001
Comm Hotels,Restraunts 5 year on Site 0 .921 .14% .002 0.002
Comm Hotels,Restraunts 100 year on Site 0 5.754 .87"1. .006 0.001
Comm Mall, Strp Cntr,Ret 0 year to Waters of U.S. 0 6.595 1.00% 6.194 0.939
Comm Mall, Strp Cntr,Ret 5 year on Lot 0 10.374 1.57"1. .021 0.002
• Comm Mall, Strp Cntr,Ret 5 year on Site 0 2.921 .44% .006 0.002
Comm Mall, Strp Cntr,Ret 100 year on Site 0 2.093 .32% .002 0.001
Comm Mall, Strp Cntr,Ret Vacant Land 0 yr Retentio 0 .606 .09% .121 0.200
Comm Auto,Gas Sta,Pk Lot 0 year to Waters of u.S. 0 4.682 .71% 4.448 0.950
Comm Auto,Gas Sta,Pk Lot 5 year on Site 0 .428 .06% .001 0.002
Comm Auto,Gas Sta,Pk Lot 100 year on Site 0 5.981 .90% .006 0.001
• Ind Park-light o year to Waters of U.S. 0 9.035 1.36% 8.461 0.936
Ind Foundry,Elec,PPs 100 year on Site 0 .538 .08% .001 0.002
Vacant Land 5 year on Site 0 1.130 •17"1. .002 0.002
Vacant Land 100 year on Site 0 32.651 4.93% .033 0.001
Vacant Land Vacant Land 0 yr Retentio 0 1.331 .20% .266 0.200
Vacant Land Vacant Land 5 yr Retentio 0 14.981 2.26% .030 0.002
• Vacant Land Vacant Land 100 yr Retent 0 5.800 .88% .006 0.001
Open Space, Pks, Golf o year to Waters of U.S. 0 8.631 1.30% 1.726 0.200
Open Space, Pks, Golf 100 year on Site 0 92.805 14.01% .093 0.001
Open Space, Pks, Golf Detention Area on Site 0 3.778 .57"1. 3.589 0.950
Open Space, School o year to Waters of u.S. 0 83.984 12.67"1. 79.785 0.950
Open Space, School 100 year on Site 0 66.630 10.06% .067 0.001
• Municpal Facilities o year to Waters of U.S. 0 1.515 .23% 1.333 0.880
Muni cpa l Faci l ities 5 year on Lot 0 .826 .12% .002 0.002
Municpal Facilities 100 year on Site 0 4.034 .61% .004 0.001
Total Street Area 0 79.067 11.93% 75.114 0.950
SR-07 Drainage Area Totals
• ---------------------------------------------------------------------------------------------------------------------------

•
•
•
•
•
•
•
•
•
•
•
o 662.631 100.00% 267.276 0.403

•ID Outfall Name Area Outfall Size Parent Id
~-----------------------------------------------------------------------------------------------------------------------------
------------------------------------------------------------------------------------------------------------------------------
---------------------------------------------------------------------------------------------------------------------------
SR-07-A OCOTILLO POWER PLANT
• Landuse Retention
122.976
Population Area
ON-SITE RET
% Tot Area COE CA
SR-07
Avg COE
Ind Foundry,Elec,PPs 100 year on Site o 122.976 100.00% .001 .123
0.0010.950
.123
.000100.00%
.00%o 122.976o .000
100 year on SiteInd Foundry,Elec,PPsTotal Street Area
---------------------------------------------------------------------------------------------------------------------------Summary for SR-07-A
•SR-07-A Drainage Area Totals---------------------------------------------------------------------------------------------------------------------------
•o 122.976 100.00% .123 0.001
•
•
•
•
•
•
•

•ID Outfall Name Area Outfall Size Parent Id
-------------------------------------------------------------------------------------------------------------------------------SR-07-B APACHE &McCLINTOCK 107.434 24 SR-07-------------------------------------------------------------------------------------------------------------------------------
• Landuse Retention Population Area % Tot Area COE CA Avg ·COE
----------------------------------------------------------------------------------------------------------------------------Residential Low Density 100 year on Lot 0 1.349 1.26% .001 .001Residential Low Density 100 year on Lot 0 2.698 2.51% .001 .003Residential Low Density 100 year on Lot 0 5.295 4.93% .001 .005Residential Low Density 100 year on Lot 0 1.337 1.24% .001 .001
• Residential Low Density 100 year on Site 0 .509 0.47"1. .001 .001Residential Low Density 100 year on Site 0 .593 0.55% .001 .001Residential High Density 0 year to Waters of U.S. 0 8.853 8.24% .680 6.020Residential High Density 5 year on Site 0 1.105 1.03% .002 .002Residential High Density 5 year on Site 0 1.547 1.44% .002 .003Residential High Density 100 year on Site 0 .716 0.67"1. .001 .001
• Residential High Density 100 year on Site 0 4.004 3.73% .001 .004Residential High Density 100 year on Site 0 3.306 3.08% .001 .003Residential High Density 100 year on Site 0 2.066 1.92% .001 .002Residential High Density 100 year on Site 0 1.336 1.24% .001 .001Residential High Density 100 year on Site 0 .716 0.67"1. .001 .001Residential High Density 100 year on Site 0 1.279 1.19% .001 .001
• Residential High Density 100 year on Site 0 .716 0.67% .001 .001Residential High Density 100 year on Site 0 .716 0.67"1. .001 .001Comm Res Office, Church o year to Waters of U.S. 0 .379 0.35% .900 .341Comm Res Office, Church 100 year on Site 0 .953 0.89% .001 .001Comm Res Office, Church 100 year on Site 0 1.203 1.12% .001 .001Comm Hotels,Restraunts 5 year on Site 0 .716 0.67"1. .002 .001
• Comm Hotels,Restraunts 5 year on Site 0 .716 0.67"1. .002 .001Comm Hotels,Restraunts 100 year on Site 0 .689 0.64% .001 .001Comm Hotels,Restraunts 100 year on Site 0 1.034 0.96% .001 .001Comm Hotels,Restraunts 100 year on Site 0 .716 0.67"1. .001 .001Comm Hotels,Restraunts 100 year on Site 0 .716 0.67% .001 .001Comm Hotels,Restraunts 100 year on Site 0 .686 0.64% .001 .001
• Comm Hotels,Restraunts 100 year on Site 0 .337 0.31% .001 .000Comm Mall, Strp Cntr,Ret 5 year on Site 0 1.607 1.50% .002 .003Comm Mall, Strp Cntr,Ret 100 year on Site 0 .716 0.67"1. .001 .001Comm Mall, Strp Cntr,Ret 100 year on Site 0 1.500 1.40% .001 .001Comm Mall, Strp Cntr,Ret 100 year on Site 0 1.433 1.33% .001 .001Comm Mall, Strp Cntr,Ret 100 year on Site 0 2.452 2.28% .001 .002
• Comm Auto,Gas Sta,Pk Lot 0 year to Waters of U.S. 0 1.031 0.96% .950 .979Comm Auto,Gas Sta,Pk Lot 0 year to Waters of U.S. 0 1.099 1.02% .950 1.044Comm Auto,Gas Sta,Pk Lot 0 year to Waters of U.S. 0 .397 0.37"1. .950 .377Comm Auto,Gas Sta,Pk Lot 0 year to Waters of U.S. 0 2.020 1.88% .950 1.919Comm Auto,Gas Sta,Pk Lot 0 year to Waters of U.S. 0 .400 0.37"1. .950 .380Comm Auto,Gas Sta,Pk Lot 0 year to Waters of U.S. 0 1.303 1.21% .950 1.238
• Comm Auto,Gas Sta,Pk Lot 0 year to Waters of U.S. 0 .393 0.37"1. .950 .374Comm Auto,Gas Sta,Pk Lot 100 year on Site 0 1.663 1.55% .001 .002Comm Auto,Gas Sta,Pk Lot 100 year on Site 0 1.433 1.33% .001 .001Comm Auto,Gas Sta,Pk Lot 100 year on Site 0 .277 0.26% .001 .000Comm Auto,Gas Sta,Pk Lot 100 year on Site 0 4.376 4.07"1. .001 .004Comm Auto,Gas Sta,Pk Lot 100 year on Site 0 4.314 4.02% .001 .004
• Comm Auto,Gas Sta,Pk Lot 100 year on Site 0 .981 0.91% .001 .001Ind Large Site-Medium 5 year on Site 0 1.654 1.54% .002 .003Ind Foundry,Elec,PPs o year to Waters of U.S. 0 1.383 1.29% .750 1.037Vacant Land 5 year on Site 0 .534 0.50% .002 .001
•

•ID Outfall Name Area Outfall Size Parent Id
~--_.------------------------------------------------- -------------------------------------------------------------------------
SR-07-B APACHE &McCLINTOCK 107.434 24 SR-07
-------------------------------------------------------------------------------------------------------------------------------
• Landuse Retention Population Area % Tot Area COE CA Avg COE
----------------------------------------------------------------------------------------------------------------------------Vacant Land 100 year on Site 0 1.011 0.94% .001 .001
Vacant Land Vacant Land 100 yr Retent 0 .716 0.67"1. .001 .001
Summary for SR-07-B
• -------------------------------------------------------------------------------------------------------------------------Residential Low Density 100 year on Lot 0 10.678 9.94% .011 0.001
Residential Low Density 100 year on Site 0 1.102 1.03% .001 0.001
Residential High Density 0 year to Waters of u.S. 0 8.853 8.24% 6.020 0.680
Residential High Density 5 year on Site 0 2.652 2.47"1. .005 0.002
Residential High Density 100 year on Site 0 14.856 13.83% .015 0.001
• Comm Res Office, Church o year to Waters of u.S. 0 .379 .35% .341 0.900
Comm Res Office, Church 100 year on Site 0 2.156 2.01% .002 0.001
Comm Hotels,Restraunts 5 year on Site 0 1.432 1.33% .003 0.002
Comm Hotels,Restraunts 100 year on Site 0 4.179 3.89% .004 0.001
Comm Mall, Strp Cntr,Ret 5 year on Site 0 1.607 1.50% .003 0.002
Comm Mall, Strp Cntr,Ret 100 year on Site 0 6.100 5.68% .006 0.001
• Comm Auto,Gas Sta,Pk Lot o year to Waters of U~S. 0 6.642 6.18% 6.310 0.950
Comm Auto,Gas Sta,Pk Lot 100 year on Site 0 13.044 12.14% .013 0.001
Ind Large Site-Medium 5 year on Site 0 1.654 1.54% .003 0.002
Ind Foundry,Elec,PPs o year to Waters of u.S. 0 1.383 1.29% 1.037 0.750
Vacant Land 5 year on Site 0 .534 .50% .001 0.002
Vacant Land 100 year on Site 0 1.011 .94% .001 0.001
• Vacant Land Vacant Land 100 yr Retent 0 .716 .67"1. .001 0.001
Total Street Area 0 28.456 26.49% 27.033 0.950
SR-07-B Drainage Area Totals----------------------------------------------------------------------------------------------------------------------------
•
•
•
•
•
o 107.434 100.00% 40.810 0.380

•ID Outfa II Name Area Outfall Size Parent Id
-------------------------------------------------------------------------------------------------------------------------------
----------------------------------------------------------------------------------------------------------------------------
-------------------------------------------------------------------------------------------------------------------------------
•SR-07-BA 1975 E WILDERMUTH
Landuse Retention
14.606
Population Area
RET BASIN
% Tot Area COE CA
SR-07-B
Avg COE
----------------------------------------------------------------------------------------------------------------------------
•
Ind Park-light
Summary for SR-07-BA
Ind Park-lightTotal Street Area
100 year on Site
100 year on Site
o
oo
14.160
14.160.446
96.95%
96.95%3.05%
.001 .014
.014
.4240.0010.950
SR-07-BA Drainage Area Totals______________________________________ ~~~~~~~~~~~~~~~~~~~~~ __ ~ ~ ~~~~~ __ ~~~~~_~~_~~~MM_~~~~~~~ __ ~~~~~ ~~~~~ ~~_
•
•
•
•
•
•
•
•
o 14.606 100.00% .438 0.030

•ID Outfall Name Area Outfall Size Parent Id
SR-07-BB PRICE RD BUS. PARK 37.444 RET BASIN SR-07-B
• Landuse Retention Population Area % Tot Area COE CA Avg COE----------------------------------------------------------------------------------------------------------------------------Ind Park-light 100 year on Site 0 4.607 12.30% .001 .005Ind Park-light 100 year on Site 0 1.001 2.67"1. .001 .001Ind Park-light 100 year on Site 0 1.024 2.73% .001 .001Ind Park-light 100 year on Site 0 .996 2.66% .001 .001
• Ind Park-l ight Retention Basin 0 .510 1.36% 1.000 .510Ind Large Site-Medium 100 year on Site 0 1.858 4.96% .001 .002Ind Large Site-Medium 100 year on Site 0 1.002 2.68% .001 .001Ind Large Site-Medium 100 year on Site 0 2.001 5.34% .001 .002Ind Large Site-Medium 100 year on Site 0 2.004 5.35% .001 .002Ind Large Site-Medium 100 year on Site 0 2.011 5.37"1. .001 .002
• Ind Foundry,Elec,PPs 100 year on Site 0 1.002 2.68% .001 .001Vacant Land Vacant Land 5 yr Retentio 0 1.107 2.96% .002 .002Vacant Land Vacant Land 5 yr Retentio 0 1.002 2.68% .002 .002Vacant Land Vacant Land 5 yr Retentio 0 1.002 2.68% .002 .002Vacant Land Vacant Land 100 yr Retent 0 2.345 6.26% .001 .002Vacant Land Vacant Land 100 yr Retent 0 4.188 11.18% .001 .004
• Vacant Land Vacant Land 100 yr Retent 0 1.031 2.75% .001 .001Vacant Land Vacant Land 100 yr Retent 0 3.679 9.83% .001 .004
Summary for SR-07-BB-----------------------------------------------------------------------------------------------------------------------------Ind Park-light 100 year on Site 0 7.628 20.37% .008 0.001
• Ind Park-light Retention Basin 0 .510 1.36% .510 1.000Ind Large Site-Medium 100 year on Site 0 8.876 23.70% .009 0.001Ind Foundry,Elec,PPs 100 year on Site 0 1.002 2.68% .001 0.001Vacant Land Vacant Land 5 yr Retentio 0 3.111 8.31% .006 0.002Vacant Land Vacant Land 100 yr Retent 0 11.242 30.02% .011 0.001Total Street Area 0 5.075 13.55% 4.821 0.950
• SR-07-BB Drainage Area Totals----------------------------------------------------------------------------------------------------------------------------.
0 37.444 100.00% 5.366 0.143
•
•
•
•

•ID Outfall Name Area Outfall Size Parent Id
~--~-------------------------------------------------- -------------------------------------------------------------------------
----------------------------------------------------------------------------------------------------------------------------
----------~--------------------------------------------------------------------------------------------------------------------
Landuse•SR-08 DORSEY LANE
Retention
34.240
Population Area
66
% Tot Area CaE CA Avg CaE
Vacant Land Vacant Land 5 yr Retentio 0 19.265 56.26% .002 .039
Open Space, School o year to Waters of U.S. 0 1.677 4.90% .950 1.593
Open Space, School o year to Waters of U.S. 0 3.887 11.35% .950 3.693
Municpal Facilities o year to Waters of U.S. 0 3.070 8.97"1. .250 .767
• Summary for SR-08----------------------------------------------------------------------------------------------------------------------------Vacant Land Vacant Land 5 yr Retentio 0 19.265 56.26% .039 0.002
Open Space, School o year to Waters of U.S. 0 5.564 16.25% 5.286 0.950
Municpal Facilities o year to Waters of U.S. 0 3.070 8.97"1. .767 0.250'. Total Street Area 0 6.341 18.52% 6.024 0.950
SR-08 Drainage Area Totals----------------------------------------------------------------------------------------------------------------------------
•
•
•
•
•
•
•
o 34.240 100.00% 12.116 0.354

•ID Outfall Name Area Outfall Size Parent Id
------------------------------------------------------------_._-----~---------------------------------------------------------
SR-08-A APACHE &CEDAR 1731.150 66 SR-08
----------------------------------------------~------- ------------------------------------------------------------------------
• Landuse Retention Population Area %Tot Area COE CA Avg COE----------------------------------------------------------------------------------------------------------------.----------Residential Low Density o year to Waters of U.S. 0 3.905 0.23% .470 1.835
Residential Low Density o year to Waters of U.S. 0 3.065 0.18% .470 1.440
Residential Low Density o year to Waters of U.S. 0 6.972 0.40% .470 3.2n
Residential Low Density o year to Waters of U.S. 0 3.408 0.20% .470 1.602
• Residential Low Density o year to Waters of U.S. 0 1.647 0.10% .480 .791Residential Low Density o year to Waters of U.S. 0 2.007 0.12% .900 1.806
Residential Low Density o year to Waters of U.S. 0 5.723 0.33% .520 2.976
Residential Low Density o year to Waters of U.S. 0 6.499 0.38% .520 3.379
Residential Low Density o year to Waters of U.S. 0 3.497 0.20% .520 1.819
Residential Low Density o year to Waters of U.S. 0 5.204 0.30% .520 2.706
• Residential Low Density o year to Waters of U.S. 0 4.109 0.24% .500 2.054Residential Low Density o year to Waters of U.S. 0 4.486 0.26% .500 2.243Residential Low Density o year to Waters of u.s. 0 5.780 0.33% .500 2.890
Residential Low Density o year to Waters of u.s. 0 2.355 0.14% .500 1.1n
Residential Low Density o year to Waters of U.S. 0 2.332 0.13% .500 1.166
Residential Low Density o year to Waters of U.S. 0 1.592 0.09% .500 .796
• Residential Low Density o year to Waters of U.S. 0 5.769 0.33% .500 2.885
Residential Low Density o year to Waters of U.S. 0 .305 0.02% .250 .076Residential Low Density o year to Waters of U.S. 0 6.910 0.40% .640 4.423Residential Low Density o year to Waters of U.S. 0 10.324 0.60% .500 5.162
Residential Low Density o year to Waters of U.S. 0 1.896 0.11% .800 1.517
Residential Low Density o year to Waters of U.S. 0 5.980 0.35% .500 2.990
• Residential Low Density o year to Waters of U.S. 0 7.916 0.46% .500 3.958Residential Low Density o year to Waters of U.S. 0 7.527 0.43% .450 3.387Residential Low Density o year to Waters of U.S. 0 3.m 0.22% .500 1.889Residential Low Densi~y o year to Waters of u.s. 0 2.527 0.15% .500 1.264
Residential Low Density o year to Waters of u.s. 0 8.9n 0.52% .540 4.848
Residential Low Density o year to Waters of U.S. 0 1.430 0.08% .870 1.244
• Residential Low Density o year to Waters of U.S. 0 3.459 0.20% .520 1.799
Residential Low Density o year to Waters of U.S. 0 2.725 0.16% .850· 2.317Residential Low Density o year to Waters of U.S. 0 3.n1 0.22% .520 1.961Residential Low Density o year to Waters of U.S. 0 2.534 0.15% .520 1.318Residential Low Density o year to Waters of U.S. 0 3.815 0.22% .870 : 3.319Residential Low Density o year to Waters of U.S. 0 2.018 0.12% .520 1.049
• Residential Low Density o year to Waters of U.S. 0 3.230 0.19% .470 1.518Residential Low Density o year to Waters of U.S. 0 4.123 0.24% .470 1.938Residential Low Density o year to Waters of U.S. 0 4.596 0.27% .470 2.160Residential Low Density o year to Waters of U.S. 0 4.837 0.28% .470 2.274Residential Low Density o year to Waters of u.s. 0 4.361 0.25% .470 2.050Residential Low Density o year to Waters of U.S. 0 5.522 0.32% .470 2.596
• Residential Low Density o year to Waters of U.S. 0 2.172 0.13% .540 1.173Residential Low Density o year to Waters of U.S. 0 .998 0.06% .540 .539Residential Low Density o year to Waters of u.s. 0 7.355 0.42% .520 3.825Residential Low Density o year to Waters of U.S. 0 9.250 0.53% .520 4.810Residential Low Density o year to Waters of U.S. 0 4.113 0.24% .520 2.139Residential Low Density o year to Waters of U.S. 0 2.715 0.16% .780 2.117
• Residential Low Density o year to Waters of U.S. 0 3.120 0.18% .470 1.467Residential Low Density o year to Waters of U.S. 0 1.611 0.09% .700 1.128Residential Low Density o year to Waters of U.S. 0 2.213 0.13% .700 1.549Residential Low Density o year to Waters of U.S. 0 10.557 0.61% .570 6.018
•

•ID Outfall Name Area Outfall Size Parent Id
-------------------------------------------------------------------------------------------------------------------------------SR-08-A APACHE &CEDAR 1731.150 66 SR-08
-------------------------------------------------------------------------------------------------------------------------------
• Landuse Retention Population Area % Tot Area COE CA Avg COE----------------------------------------------------------------------------------------------------------------------------Residential Low Density o year to Waters of U.S. 0 1.903 0.11% .470 .894Residential Low Density o year to Waters of U.S. 0 1.022 0.06% .470 .481Residential Low Density o year to Waters of U.S. 0 4.331 0.25% .500 2.165Residential Low Density o year to Waters of U.S. 0 3.403 0.20% .500 1.701
• Residential Low Density o year to Waters of U.S. 0 6.775 0.39% .500 3.387Residential Low Density o year to Waters of U.S. 0 10.006 0.58% .500 5.003
Residential Low Density o year to Waters of U.S. 0 1.633 0.09% .530 .865
Residential Low Density o year to Waters of U.S. 0 1.454 0.08% .550 .800
Residential Low Density o year to Waters of U.S. 0 3.731 0.22% .550 2.052Residential Low Density o year to Waters of U.S. 0 .856 0.05% .700 .599
• Residential Low Density o year to Waters of U.S. 0 .247 0.01% .700 .173Residential Low Density o year to Waters of u.s. 0 2.226 0.13% .700 1.558Residential Low Density o year to Waters of u.s. 0 7.382 0.43% .540 3.987
Residential Low Density o year to Waters of U.S. 0 3.686 0.21% .470 1.733Residential Low Density o year to Waters of U.S. 0 5.370 0.31% .470 2.524Residential Low Density o year to Waters of U.S. 0 4.489 0.26% .470 2.110
• Residential Low Density o year to Waters of U.S. 0 2.505 0.14% .500 1.252Residential Low Density o year to Waters of U.S. 0 2.703 0.16% .500 1.351Residential Low Density o year to Waters of U.S. 0 .004 0.00% .470 .002Residential Low Density o year to Waters of U.S. 0 2.847 0.16% .470 1.338Residential Low Density o year to Waters of U.S. 0 4.708 0.27"" .520 2.448Residential Low Density o year to Waters of U.S. 0 3.394 0.20% .520 1.765
• Residential Low Density o year to Waters of U.S. 0 4.050 0.23% .520 2.106Residential Low Density o year to Waters of U.S. 0 10.977 0.63% .550 6.037Residential Low Density o year to Waters of U.S. 0 2.852 0.16% .450 1.283Residential Low Density o year to Waters of U.S. 0 2.836 0.16% .900 2.553Residential Low Density o year to Waters of U.S. 0 12.011 0.69% .480 5.765Residential Low Density o year to Waters of U.S. 0 3.305 0.19% .520 1.719
• Residential Low Density o year to Waters of U.S. 0 10.906 0.63% .550 5.998Residential Low Density o year to Waters of U.S. 0 6.482 0.37"" .470 3.046Residential Low Density o year to Waters of U.S. 0 1.200 0.07"" .470 .564Residential Low Density o year to Waters of U.S. 0 .770 0.04% .470 .362Residential Low Density o year to Waters of U.S. 0 1.303 0.08% .470 .613Residential Low Density o year to Waters of U.S. 0 6.181 0.36% .520 3.214
• Residential Low Density o year to Waters of U.S. 0 14.437 0.83% .790 11.405Residential Low Density o year to Waters of U.S. 0 2.429 0.14% .520 1.263Residential Low Density o year to Waters of U.S. 0 12.147 0.70% .520 6.316Residential Low Density o year to Waters of U.S. 0 5.196 0.30% .520 2.702Residential Low Density o year to Waters of U.S. 0 5.656 0.33% .520 2.941Residential Low Density o year to Waters of U.S. 0 7.156 0.41% .520 3.721
• Residential Low Density o year to Waters of U.S. 0 10.398 0.60% .520 5.407Residential Low Density o year to Waters of U.S. 0 2.388 0.14% .520 1.242Residential Low Density o year to Waters of U.S. 0 8.591 0.50% .520 4.467Residential Low Density o year to Waters of U.S. 0 2.429 0.14% .540 1.311Residential Low Density o year to Waters of U.S. 0 5.040 0.29% .540 2.722Residential Low Density o year to Waters of U.S. 0 2.821 0.16% .540 1.523
• Residential Low Density o year to Waters of U.S. 0 1.847 0.11% .540 .997Residential Low Density o year to Waters of U.S. 0 .216 0.01% .540 .116Residential Low Density o year to Waters of U.S. 0 10.462 0.60% .470 4.917Residential Low Density o year to Waters of U.S. 0 3.671 0.21% .470 1.726
•

•ID Outfa II Name Area Outfall Size Parent Id
--------------------------------------------------------------------------------------------------------------------------------SR-08-A APACHE &CEDAR 1731.150 66 SR-08
---._--------------------------------------------------------------------------------------------------------------------------
• Landuse Retention Population Area % Tot Area COE CA Avg COE
---------------------------------------------------------------------------------------------------------------------.------Residential Low Density o year to Waters of u.S. 0 4.788 0.28% .470 2.251Residential Low Density o year to Waters of u.S. 0 3.837 0.22% .520 1.995Residential Low Density o year to Waters of u.S. 0 3.341 0.19% .520 1.737Residential Low Density o year to Waters of u.S. 0 4.060 0.23% .520 2.111
• Residential Low Density o year to Waters of u.S. 0 6.473 0.37"1. .520 3.366Residential Low Density o year to Waters of u.S. 0 15.267 0.88% .610 9.313Residential Low Density o year to Waters of u.S. 0 3.623 0.21% .900 3.261
Residential Low Density o year to Waters of u.S. 0 5.199 0.30% .900 4.679
Residential Low Density o year to Waters of u.S. 0 1.735 0.10% .520 .902Residential Low Density o year to Waters of u.S. 0 4.974 0.29% .480 2.388
• Residential Low Density o year to Waters of u.S. 0 4.230 0.24% .480 2.031Residential Low Density o year to Waters of u.S. 0 1.655 0.10% .480 .794Residential Low Density o year to Waters of u.S. 0 .775 0.04% .480 .372Residential Low Density o year to Waters of u.S. 0 3.908 0.23% .520 2.032Residential Low Density o year to Waters of u.S. 0 2.867 0.17"1. .710 2.036Residential Low Density o year to Waters of u.S. 0 6.684 0.39% .520 3.476
• Residential Low Density o year to Waters of u.S. 0 5.269 0.30% .500 2.635Residential Low Density o year to Waters of u.S. 0 3.523 0.20% .500 1.762Residential Low Density o year to Waters of u.S. 0 2.055 0.12% .500 1.027Residential Low Density o year to Waters of u.S. 0 2.363 0.14% .800 1.890Residential Low Density o year to Waters of u.S. 0 8.064 0.47"1. .520 4.194Residential Low Density o year to Waters of u.S. 0 2.339 0.14% .520 1.216
• Residential Low Density o year to Waters of u.S. 0 5.878 0.34% .540 3.174Residential Low Density o year to Waters of u.S. 0 6.656 0.38% .540 3.594Residential Low Density o year to Waters of u.S. 0 7.977 0.46% .500 3.988Residential Low Density o year to Waters of u.S. 0 2.803 0.16% .500 1.401Residential Low Density o year to Retention Basin 0 2.262 0.13% .550 1.244Residential Low Density o year to Retention Basin 0 4.329 0.25% .550 2.381
• Residential Low Density o year to Retention Basin 0 5.828 0.34% .550 3.205Residential Low Density 5 year on Lot 0 .502 0.03% .002 .001Residential Low Density 5 year on Lot 0 4.348 0.25% .002 .009Residential Low Density 5 year on Lot 0 1.386 0.08% .002 .003Residential Low Density 5 year on Lot 0 7.472 0.43% .002 .015Residential Low Density 5 year on Lot 0 2.030 0.12% .002 .004
• Residential Low Density 5 year on Lot 0 1.161 0.07"1. .002 .002Residential Low Density 5 year on Lot 0 1.256 0.07% .002 .003Residential Low Density 5 year on Site 0 .246 0.01% .002 .000Residential Low Density 100 year on Lot 0 1.410 0.08% .001 .001Residential Low Density 100 year on Lot 0 1.260 0.07"1. .001 .001Residential Low Density 100 year on Lot 0 1.135 0.07"1. .001 .001
• Residential Low Density 100 year on Lot 0 1. 722 0.10% .001 .002Residential Low Density 100 year on Lot 0 3.453 0.20% .001 .003Residential Low Density 100 year on Lot 0 3.449 0.20% .001 .003Residential Low Density 100 year on Lot 0 1.723 0.10% .001 .002Residential Low Density 100 year on Lot 0 3.058 0.18% .001 .003Residential Low Density 100 year on Lot 0 .798 0.05% .001 .001
• Residential Low Density 100 year on Lot 0 4.098 0.24% .001 .004Residential Low Density 100 year on Lot 0 1.336 0.08% .001 .001Residential Low Density 100 year on Lot 0 1.'371 0.08% .001 .001Residential Low Density 100 year on Lot 0 1.338 0.08% .001 .001
•

•ID Outfall Name Area Outfall Si ze Parent Id
-------------------------------------------------------------------------------------------------------------------------------SR-08-A APACHE &CEDAR 1731.150 66 SR-08
-------------------------------------------------------------------------------------------------------------------------------
• Landuse Retention Population Area %Tot Area COE CA Avg COE----------------------------------------------------------------------------------------------------------------------------Residential Low Density 100 year on Lot 0 5.101 0.29% .001 .005
Residential Low Density 100 year on Lot 0 2.588 0.15% .001 .003
Residential Low Density 100 year on Lot 0 5.425 0.31% .001 .005
Residential Low Density 100 year on Lot 0 2.498 0.14% .001 .002
• Residential Low Density 100 year on Lot 0 3.444 0.20% .001 .003
Residential Low Density 100 year on Lot 0 3.444 0.20% .001 .003
Residential Low Density 100 year on Lot 0 3.333 0.19% .001 .003
Residential Low Density 100 year on Lot 0 2.064 0.12% .001 .002
Residential Low Density 100 year on Lot 0 1.729 0.10% .001 .002
Residential Low Density 100 year on Lot 0 1.145 0.07% .001 .001
• Residential Low Density 100 year on Lot 0 2.610 0.15% .001 .003Residential Low Density 100 year on Lot 0 2.678 0.15% .001 .003Residential Low Density 100 year on Site 0 1.445 0.08% .001 .001
Residential High Density 0 year to Waters of u.s. 0 3.721 0.21% .820 3.051
Residential High Density 0 year to Waters of u.S. 0 9.488 0.55% .860 8.159
Residential High Density 0 year to Waters of u.s. 0 2.594 0.15% .880 2.283
• Residential High Density 0 year to Waters of u.s. 0 4.131 0.24% .840 3.470
Residential High Density 0 year to Waters of u.s. 0 1.377 0.08% .920 1.267
Residential High Density 0 year to Waters of u.s. 0 .918 0.05% .920 .845
Residential High Density 0 year to Waters of u.s. 0 2.100 0.12% .900 1.890
Residential High Density 0 year to Waters of u.s. 0 .537 0.03% .950 .510
Residential High Density 0 year to Waters of u.s. 0 .974 0.06% .780 .760
• Residential High Density 0 year to Waters of u.s. 0 1.216 0.07% .950 1.155
Residential High Density 0 year to Waters of u.s. 0 1.592 0.09% .780 1.242
Residential High Density 0 year to Waters of u.s. 0 1.343 0.08% .780 1.047
Residential High Density 0 year to Waters of u.s. 0 .474 0.03% .900 .427
Residential High Density 0 year to Waters of u.s. 0 3.234 0.19% .860 2.781
Residential High Density 0 year to Waters of u.s. 0 10.455 0.60% .790 8.259
• Residential High Density 0 year to Waters of u.s. 0 13.062 0.75% .900 11. 756Residential High Density 0 year to Waters of u.s. 0 12.504 0.72% .900 11.254Residential High Density 0 year to Waters of u.s. 0 1.262 o.or" .950 1.199Residential High Density 0 year to Waters of u.s. 0 5.232 0.30% .810 4.238
Residential High Density 5 year on Lot 0 .205 0.01% .002 .000
Residential High Density 5 year on Site 0 8.207 0.47% .002 .016
• Residential High Density 5 year on Site 0 10.236 0.59% .002 .020Residential High Density 5 year on Site 0 2.288 0.13% .002 .005Residential High Density 5 year on Site 0 12.544 0.72% .002 .025Residential High Density 5 year on Site 0 1.396 0.08% .002 .003Residential High Density 5 year on Site 0 18.368 1.06% .002 .037Residential High Density 5 year on Site 0 12.619 0.73% .002 .025
• Residential High Density 5 year on Site 0 4.049 0.23% .002 .008Residential High Density 100 year on Site 0 17.944 1.04% .001 .018
Residential High Density 100 year on Site 0 .689 0.04% .001 .001Residential High Density 100 year on Site 0 .689 0.04% .001 .001
Residential High Density 100 year on Site 0 1.652 0.10% .001 .002
Residential High Density 100 year on Site 0 4.831 0.28% .001 .005
• Residential High Density 100 year on Site 0 .912 0.05% .001 .001Residential High Density 100 year on Site 0 29.728 1.72% .001 .030
Residential High Density 100 year on Site 0 .000 0.00% .001 .000Comm Res Office, Church o year to Waters of u.S. 0 .688 0.04% .800 .551
•

•ID Outfall Name Area Outfall Size Parent Id
~----------------------------------------------------- -------------------------------------------------------------------------
SR-08-A APACHE &CEDAR 1731.150 66 SR-08
-------------------------------------------------------------------------------------------------------------------------------'. Landuse Retention Population Area % Tot Area COE CA Avg COE
----------------------------------------------------------------------------------------------------------------------------Comm Res Office, Church o year to Waters of U.S. 0 1.068 0.06% .740 .790
Comm Res Office, Church o year to Waters of u.s. 0 .519 0.03% .950 .493Comm Res Office, Church o year to Waters of u.s. 0 6.644 0.38% .930 6.179
Comm Res Office, Church o year to Waters of u.s. 0 3.024 0.17"-' .730 2.207
• Comm Res Office, Church o year to Waters of u.s. 0 .805 0.05% .850 .685
Comm Res Office, Church o year to Waters of u.s. 0 .665 0.04% .950 .632
Comm Res Office, Church o year to Waters of u.s. 0 1.980 0.11% .820 1.623
Comm Res Office, Church o year to Waters of u.s. 0 2.055 0.12% .600 1.233
Comm Res Office, Church o year to Waters of u.s. 0 3.264 0.19% .900 2.938
Comm Res Office, Church o year to Waters of u.s. 0 1.455 0.08% .870 1.266
• Comm Res Office, Church o year to Waters of u.s. 0 .363 0.02% .900 .327Comm Res Office, Church o year to Waters of u.s. 0 .465 0.03% .870 .405Comm Res Office, Church o year to Waters of u.s. 0 2.519 0.15% .880 2.216
Comm Res Office, Church o year to Waters of u.s. 0 1.334 0.08% .800 1.068Comm Res Office, Church o year to Waters of u.s. 0 .354 0.02% .650 .230
Comm Res Office, Church o year to Waters of u.s. 0 2.157 0.12% .900 1.941
• Comm Res Office, Church o year to Waters of u.s. 0 .809 0.05% .950 .769
Comm Res Office, Church o year to Waters of u.s. 0 .534 0.03% .950 .507Comm Res Office, Church o year to Waters of u.s. 0 1.443 0.08% .930 1.342
Comm Res Office, Church o year to Waters of u.s. 0 1.423 0.08% .650 .925Comm Res Office, Church o year to Waters of u.s. 0 .493 0.03% .950 .468Comm Res Office, Church o year to Waters of u.s. 0 .448 0.03% .900 .403
• Comm Res Office, Church o year to Waters of u.s. 0 2.127 0.12% .830 1.766
Comm Res Office, Church o year to Waters of u.s. 0 .810 0.05% .870 .705Comm Res Office, Church 5 year on Lot 0 1.611 0.09% .002 .003
Comm Res Office, Church 5 year on Lot 0 .665 0.04% .002 .001Comm Res Office, Church 5 year on Site 0 1.456 0.08% .002 .003Comm Res Office, Church 5 year on Site 0 4.035 0.23% .002 .008
• Comm Res Office, Church 5 year on Site 0 2.639 0.15% .002 .005Comm Res Office, Church 5 year on Site 0 .568 0.03% .002 .001Comm Res Office, Church 5 year on Site 0 3.166 0.18% .002 .006Comm Res Office, Church 5 year on Site 0 1.277 0.07"-' .002 .003Comm Res Office, Church 5 year on Site 0 15.100 0.87"-' .002 .030Comm Res Office, Church 5 year on Site 0 .844 0.05% .002 .002
• Comm Res Office, Church 5 year on Site 0 1.453 0.08% .002 .003Comm Res Office, Church 100 year on Site 0 .661 0.04% .001 .001Comm Res Office, Church 100 year on Site 0 .660 0.04% .001 .001Comm Res Office, Church 100 year on Site 0 .749 0.04% .001 .001Comm Res Office, Church 100 year on Site 0 .701 0.04% .001 .001Comm Res Office, Church 100 year on Site 0 .940 0.05% .001 .001
• Comm Res Office, Church 100 year on Site 0 3.550 0.21% .001 .004Comm Res Office, Church 100 year on Site 0 12.806 0.74% .001 .013Comm Res Office, Church 100 year on Site 0 .988 0.06% .001 .001Comm Res Office, Church 100 year on Site 0 1.902 0.11% .001 .002Comm Res Office, Church 100 year on Site 0 2.423 0.14% .001 .002Comm Res Office, Church 100 year on Site 0 .341 0.02% .001 .000
• Comm Res Office, Church 100 year on Site 0 2.290 0.13% .001 .002Comm Res Office, Church 100 year on Site 0 5.029 0.29% .001 .005Comm Res Office, Church 100 year on Site 0 .832 0.05% .001 .001Comm Hotels,Restraunts o year to Waters of u.S. 0 .962 0.06% .780 .750
•

•ID Outfall Name Area Outfall Size Parent Id
-------------------------------------------------------------------------------------------------------------------------------SR-08-A APACHE &CEDAR 1731.150 66 SR-08
.--------------_._.------------------------------------------------------------------------------------------------------------
• Landuse Retention Population Area % Tot Area COE CA Avg COE----------------------------------------------------------------------------------------------------------------------------Comm Hotels,Restraunts o year to Waters of u.s. 0 .368 0.02% .950 .350
Comm Hotels,Restraunts o year to Waters of u.s. 0 5.541 0.32% .950 5.264
Comm Hotels,Restraunts o year to Waters of u.s. 0 .890 0.05% .950 .846
Comm Hotels,Restraunts o year to Waters of u.s. 0 2.196 0.13% .950 2.086
• Comm Hotels,Restraunts 100 year on Site 0 1.747 0.10% .001 .002
Comm Hotels,Restraunts 100 year on Site 0 .877 0.05% .001 .001
Comm Mall, Strp Cntr,Ret 0 year to Waters of u.S. 0 7.104 0.41% .950 6.749,
Comm Mall, Strp Cntr,Ret 0 year to Waters of u.S. 0 .000 0.00% .930 .000
Comm Mall, Strp Cntr,Ret 0 year to Waters of u.S. 0 3.319 0.19% .950 3.153
Comm Mall, Strp Cntr,Ret 0 year to Waters of u.S. 0 .688 0.04% .950 .654'. Comm Mall, Strp Cntr,Ret 0 year to Waters of u.S. 0 1.141 0.07% .930 1.061Comm Mall, Strp Cntr,Ret 0 year to Waters of u.S. 0 1.722 0.10% .950 1.636Comm Mall, Strp Cntr,Ret 5 year on Site 0 1.686 0.10% .002 .003
Comm Mall, Strp Cntr,Ret 5 year on Site 0 .916 0.05% .002 .002Comm Mall, Strp Cntr,Ret 100 year on Site 0 1.017 0.06% .001 .001Comm Mall, Strp Cntr,Ret 100 year on Site 0 4.387 0.25% .001 .004'. Comm Mall, Strp Cntr,Ret 100 year on Site 0 4.800 0.28% .001 .005
I
Comm Mall, Strp Cntr,Ret 100 year on Site 0 4.418 0.26% .001 .004Comm Mall, Strp Cntr,Ret Detention Basin 0 1.294 0.07"1. .900 1.164Comm Mall, Strp Cntr,Ret Detention Area on Site 0 40.553 2.34% .920 37.309Comm Auto,GasSta,Pk Lot 0 year to Waters of u.S. 0 .739 0.04% .950 .702
Comm Auto,Gas Sta,Pk Lot 0 year to Waters of u.S. 0 .936 0.05% .950 .889
• Comm Auto,Gas Sta,Pk Lot 0 year to Waters of u.S. 0 .958 0.06% .740 .709
Comm Auto,Gas Sta,Pk Lot 0 year to Waters of u.S. 0 .571 0.03% .950 .543Comm Auto,Gas Sta,Pk Lot 0 year to Waters of u.S. 0 .457 0.03% .950 .434Comm Auto,Gas Sta,Pk Lot 0 year to Waters of u.S. 0 .693 0.04% .950 .658Comm Auto,Gas Sta,Pk Lot 100 year on Site 0 1.022 0.06% .001 .001Comm Auto,Gas Sta,Pk Lot 100 year on Site 0 .868 0.05% .001 .001
• Ind Park-light 5 year on Site 0 1.465 0.08% .002 .003Ind Park-light 5 year on Site 0 .910 0.05% .002 .002Ind Park-light 5 year on Site 0 1.007 0.06% .002 .002Ind Park-light 5 year on Site 0 2.945 0.17"1. .002 .006Ind Park-light 100 year on Site 0 1.903 0.11% .001 .002Ind Park-light 100 year on Site 0 4.240 0.24% .001 .004
• Ind Large Site-Medium o year to Waters of u.S. 0 5.845 0.34% .950 5.553Ind Large Site-Medium o year to Waters of u.S. 0 1.129 0.07"1. .900 1.016Ind Large Site-Medium o year to Waters of u.S. 0 .218 0.01% .950 .208Ind Large Site-Medium o year to Waters of u.S. 0 1.534 0.09% .950 1.457Ind Large Site-Medium 5 year on Site 0 2.550 0.15% .002 .005Ind Large Site-Medium 5 year on Site 0 7.832 0.45% .002 .016
• Ind Large Site-Medium 5 year on Site 0 1.593 0.09% .002 .003Ind Large Site-Medium 5 year on Site 0 5.618 0.32% .002 .011Ind Large Site-Medium 100 year on Site 0 1.261 0.07"1. .001 .001Ind Large Site-Medium 100 year on Site 0 2.081 0.12% .001 .002Ind Large Site-Medium 100 year on Site 0 1.792 0.10% .001 .002Ind Large Site-Medium 100 year on Site 0 1.198 0.07"1. .001 .001
• Ind Large Site-Medium 100 year on Site 0 4.608 0.27% .001 .005Ind Large Site-Medium 100 year on Site 0 9.197 0.53% .001 .009Ind Large Site-Medium 100 year on Site 0 4.692 0.27"1. .001 .005Ind Large Site-Medium Detention Area on Site 0 2.981 0.17"1. .000 .000
•

•ID Outfall Name Area Outfall Size Parent Id
-----------------------------------------------------------------------------------------------------------------------------_.-SR-08-A APACHE &CEDAR 1731.150 66 SR-08
-----------------~------------------------------------ -------------------------------------------------------------------------
• Landuse Retention Population Area % Tot Area CaE CA Avg CaE----------------------------------------------------------------------------------------------------------------------------Ind Foundry,Elec,PPs o year to Waters of U.S. 0 4.997 0.29% .950 4.747Ind Foundry,Elec,PPs o year to Waters of U.S. 0 3.278 0.19% .950 3.114Ind Foundry,Elec,PPs o year to Waters of U.S. 0 8.181 0.47"" .350 2.863Ind Foundry,Elec,PPs o year to Waters of u.s. 0 .689 0.04% .900 .620
• Ind Foundry,Elec,PPs 5 year on Site 0 .965 0.06% .002 .002Ind Foundry,Elec,PPs 5 year on Site 0 1.519 0.09% .002 .003Ind Foundry,Elec,PPs 5 year on Site 0 2.277 0.13% .002 .005Ind Foundry,Elec,PPs 100 year on Site 0 27.462 1.59% .001 .027Ind Foundry,Elec,PPs 100 year on Site 0 3.660 0.21% .001 .004Vacant Land o year to Waters of U.S. 0 .742 0.04% .200 .148'. Vacant Land o year to Waters of U.S. 0 .389 0.02% .200 .078Vacant Land o year to Waters of u.S. 0 .483 0.03% .200 .097Vacant Land o year to Waters of u.S. 0 3.300 0.19% .200 .660Vacant Land o year to Waters of u.S. 0 8.331 0.48% .250 2.083Vacant Land o year to Waters of u.S. 0 1.333 0.08% .930 1.240Vacant Land o year to Waters of u.S. 0 1.064 0.06% .200 .213
• Vacant Land 5 year on Site 0 1.595 0.09% .002 .003Vacant Land 5 year on Site 0 .753 0.04% .002 .002Vacant Land 5 year on Site 0 1.047 0.06% .002 .002Vacant Land 5 year on Site 0 2.429 0.14% .002 .005Vacant Land 5 year on Site 0 .758 0.04% .002 .002Vacant Land 5 year on Site 0 .969 0.06% .002 .002
• Vacant Land 100 year on Site 0 8.945 0.52% .001 .009Vacant Land 100 year on Site 0 15.705 0.91% .001 .016Vacant Land Vacant Land 0 yr Retentio 0 .346 0.02% .200 .069Vacant Land Vacant Land 0 yr Retentio 0 .906 0.05% .200 .181Vacant Land Vacant Land 0 yr Retentio 0 .448 0.03% .200 .090Vacant Land Vacant Land '5 yr Retentio 0 1.276 0.07% .002 .003
• Vacant Land Vacant Land 5 yr Retentio 0 3.925 0.23% .002 .008Open Space, Pks, Golf o year to Waters of u.S. 0 .035 0.00% .200 .007Open Space, Pks, Golf 100 year on Site 0 42.325 2.44% .001 .042Open Space, Pks, Golf 100 year on Site 0 8.544 0.49% .001 .009Open Space, Pks, Golf 100 year on Site 0 7.876 0.45% .001 .008Open Space, Pks, Golf 100 year on Site 0 6.371 0.37"" .001 .006
• Open Space, Pks, Golf 100 year on Site 0 .552 0.03% .001 .001Open Space, Pks, Golf Retention Basin 0 4.304 0.25% 1.000 4.304Open Space, School o year to Waters of u.S. 0 .588 0.03% .950 .558Open Space, School o year to Waters of u.S. 0 .264 0.02% .950 .251Open Space, School o year to Waters of u.S. 0 .205 0.01% .950 .194Open Space, School o year to Waters of u.S. 0 1.455 0.08% .950 1.382
• Open Space, School o year to Waters of u.S. 0 2.856 0.16% .950 2.713Open Space, School o year to Waters of u.S. 0 .516 0.03% .950 .490Open Space, School o year to Waters of u.S. 0 .953 0.06% .920 .877Open Space, School 5 year on Site 0 4.839 0.28% .002 .010Open Space, School 100 year on Site 0 32.622 1.88% .001 .033Open Space, School 100 year on Site 0 8.988 0.52% .001 .009
• Open Space, School 100 year on Site 0 6.685 0.39% .001 .007Open Space, School 100 year on Site 0 7.685 0.44% .001 .008Open Space, School 100 year on Site 0 6.887 0.40% .001 .007
•

•ID Outfall Name Area Outfall Si ze Parent Id
SR-08-A APACHE &CEDAR 1731.150 66 SR-08
------------------------------------------.------------------------------------------------------------------------------------
• Landuse Retention Population Area %Tot Area COE CA Avg COE----------------------------------------------------------------------------------------------------------------------------
Summary for SR-08-A----------------------------------------------------------------------------------------------------------------------------Residential Low Density o year to Waters of U.S. 0 567.790 32.80% 306.511 0.540
• Residential Low Density o year to Retention Basin 0 12.419 .72% 6.830 0.550Residential Low Density 5 year on Lot 0 18.155 1.05% .036 0.002Residential Low Density 5 year on Site 0 .246 .01% .000 0.000Residential Low Density 100 year on Lot 0 62.209 3.59% .062 0.001Residential Low Density 100 year on Site 0 1.445 .08% .001 0.001Residential High Density 0 year to Waters of U.S. 0 76.214 4.40% 65.593 0.861
• Residential High Density 5 year on Lot 0 .205 .01% .000 0.000Residential High Density 5 year on Site 0 69.709 4.03% .139 0.002Residential High Density 100 year on Site 0 56.444 3.26% .056 0.001Comm Res Office, Church o year to Waters of U.S. 0 37.448 2.16% 31.669 0.846Comm Res Office, Church 5 year on Lot 0 2.276 .13% .005 0.002Comm Res Office, Church 5 year on Site 0 30.538 1. 76% .061 0.002
• Comm Res Office, Church 100 year on Site 0 33.873 1.96% .034 0.001Comm Hotels,Restraunts o year to Waters of U.S. 0 9.958 .58% 9.296 0.934Comm Hotels,Restraunts 100 year on Site 0 2.623 .15% .003 0.001Comm Mall, Strp Cntr,Ret 0 year to Waters of U.S. 0 13.974 .81% 13.252 0.948Comm Mall, Strp Cntr,Ret 5 year on Site 0 2.603 .15% .005 0.002Comm Mall, Strp Cntr,Ret 100 year on Site 0 14.623 .84% .015 0.001
• Comm Mall, Strp Cntr,Ret Detention Basin 0 1.294 .07"1. 1.164 0.900Comm Mall, Strp Cntr,Ret Detention Area on Site 0 40.553 2.34% 37.309 0.920Comm Auto,Gas Sta,Pk Lot 0 year to Waters of U.S. 0 4.353 .25% 3.934 0.904Comm Auto,Gas Sta,Pk Lot 100 year on Site 0 1.890 .11% .002 0.001lrid Park-light 5 year on Site 0 6.328 .37"1. .013 0.002Ind Park-light 100 year on Site 0 6.144 .35% .006 0.001
• Ind Large Site-Medium o year to Waters of U.S. 0 8.727 .50% 8.234 0.944Ind Large Site-Medium 5 year on Site 0 17.592 1.02% .035 0.002Ind Large Site-Medium 100 year on Site 0 24.829 1.43% .025 0.001Ind Large Site-Medium Detention Area on Site 0 2.981 .17% .000 0.000Ind Foundry,Elec,PPs o year to Waters of U.S. 0 17.144 .99% 11.344 0.662Ind Foundry,Elec,PPs 5 year on Site 0 4.761 .28% .010 0.002
• Ind Foundry,Elec,PPs 100 year on Site 0 31.122 1.80% .031 0.001Vacant Land o year to Waters of U.S. 0 15.642 .90% 4.518 0.289Vacant Land 5 year on Site 0 7.552 .44% .015 0.002Vacant Land 100 year on Site 0 24.650 1.42% .025 0.001Vacant Land Vacant Land 0 yr Retentio 0 1.700 .10% .340 0.200Vacant Land Vacant Land 5 yr Retentio 0 5.201 .30% .010 0.002
• Open Space, Pks, Golf o year to Waters of U.S. 0 .035 .00% .007 0.200Open Space, Pks, Golf 100 year on Site 0 65.668 3.79% .066 0.001Open Space, Pks, Golf Retention Basin 0 4.304 .25% 4.304 1.000Open Space, School o year to Waters of U.S. 0 6.836 .39% 6.466 0.946Open Space, School 5 year on Site 0 4.839 .28% .010 0.002Open Space, School 100 year on Site 0 62.868 3.63% .063 0.001
• o year to Waters of U.S. 0 11.394 .66% .000 0.000Total Street Area 0 339.991 19.64% 322.991 0.950
SR-08-A Drainage Area Totals
---------------------------------------------------------------------------------------------------------------------------~
0 1731.150 100.00% 834.490 0.482
•

•10 Outfall Name Area Outfall Size Parent Id
SR-08-AA SOUTHERN & HOLBROOK
• Landuse Retention
10.597
Population Area
15
% Tot Area CaE CA
SR-08-A
Avg CaE
•
•
•
•
•
•
•
•
Residential Low Density 0 year to Waters of U.S.
Summary for SR-08-AA
Residential Low Density 0 year to Waters of U.S.Total Street Area
SR-08-AA Drainage Area Totals
o
oo
o
9.380
9.3801.217
10.597
88.52%
88.52%11.48%
100.00%
.480 4.503
4.5031.156
5.659
0.4800.950
0.534

•ID Outfall Name Area Outfall Size Parent Id
SR-08-AB SOUTHERN & LOS FELIZ 59.783 15 SR-08-A
• Landuse Retention Population Area % Tot Area CaE CA Avg CaE
Residential Low Density o year to Waters of U.S. 0 6.698 11.20% .480 3.215Residential Low Density o year to Waters of U.S. 0 2.934 4.91% .480 1.408Residential Low Density o year to Waters of U.S. 0 6.251 10.46% .480 3.001Residential Low Density o year to Waters of U.S. 0 13.941 23.32% .480 6.692
• Residential Low Density o year to Waters of U.S. 0 6.816 11.40% .480 3.271Open Space, School o year to Waters of U.S. 0 .438 0.73% .950 .416Open Space, School 100 year on Site 0 6.925 11.58% .001 .007
Summary for SR-08-AB
• Residential Low DensityOpen Space, SchoolOpen Space, SchoolTotal Street Area
o year to Waters of U.S.o year to Waters of U.S.100 year on Site
oooo
36.639.438
6.92515.781
61.29%.73%
11.58%26.40%
17.587.416.007
14.992
0.4800.9500.0010.950
:.I
•
•
•
•
•
•
SR-08-AB Drainage Area Totals
o 59.783 100.00% 33.002 0.552

Landuse
•
•
ID
SR-09
Outfall Name
KARSTEN GOLF COURSE at ASU
Retention
Area
78.347
Population Area
Outfall Size
30
% Tot Area COE CA
Parent Id
Avg COE
•
Vacant LandOpen Space, Pks, GolfMunicpal Facilities
Summary for SR-09
Vacant LandOpen Space, Pks, GolfMunicpal FacilitiesTotal Street Area
Vacant Land 100 yr Retent100 year on Site100 year on Site
Vacant Land 100 yr Retent100 year on Site100 year on Site
ooo
oooo
14.37056.5112.113
14.37056.5112.1135.353
18.34%72.13%2.70%
18.34%72.13%
2.70%6.83%
.001
.001
.001
,014.057.002
.014
.057
.0025.085
0.0010.0010.0010.950
•
•
•
•
•
•
•
SR-09 Drainage Area Totals
o 78.347 100.00% 5.158 0.066

•10 Outfall Name Area Outfall Si ze Parent Id
-------------------------------------------------------------------------------------------------------------------------------SR-10 WEST OF McCLINTOCK DRIVE 395.576 36-------------------------------------------------------------------------------------------------------------------------------
• Landuse Retention Population Area % Tot Area COE CA Avg COE----------------------------------------------------------------------------------------------------------------------------Residential Low Density o year to Waters of u.s. 0 .162 0.04% .400 .065Residential Low Density o year to Waters of U.S. 0 5.157 1.30% .400 2.063Residential Low Density o year to Waters of U.S. 0 1.064 0.27"1. .520 .553Residential Low Density o year to Waters of U.S. 0 .402 0.10% .420 .169
• Residential Low Density o year to Waters of U.S. 0 3.421 0.86% .460 1.574Residential Low Density o year to Waters of U.S. 0 .927 0.23% .480 .445Residential Low Density o year to Waters of U.S. 0 3.399 0.86% .460 1.564
Residential Low Density o year to Waters of U.S. 0 3.557 0.90% .590 2.099
Residential Low Density o year to Waters of u.s. 0 .544 0.14% .400 .218Residential Low Density o year to Waters of U.S. 0 .950 0.24% .400 .380
• Residential Low Density o year to Waters of U.S. 0 .196 0.05% .450 .088Residential Low Density o year to Waters of U.S. 0 .189 0.05% .950 .180Residential Low Density o year to Waters of U.S. 0 .492 0.12% .370 .182Residential Low Density o year to Waters of U.S. 0 .246 0.06% .380 .094Residential Low Density o year to Waters of U.S. 0 .495 0.13% .400 .198Residential Low Density o year to Waters of U.S. 0 .446 0.11% .500 .223
• Residential Low Density o year to Waters of U.S. 0 .207 0.05% .410 .085Residential Low Density o year to Waters of U.S. 0 .776 0.20% .310 .240Residential Low Density o year to Waters of U.S. 0 .790 0.20% .280 .221Residential Low Density o year to Waters of U.S. 0 .246 0.06% .380 .094Residential Low Density o year to Waters of U.S. 0 .156 0.04% .900 .140Residential Low Density o year to Waters of U.S. 0 1.286 0.33% .730 .939
• Residential Low Density o year to Waters of U.S. 0 1.720 0.43% .500 .860Residential Low Density o year to Waters of U.S. 0 .245 0.06% .400 .098Residential Low Density o year to Waters of U.S. 0 .162 0.04% .400 .065Residential Low Density o year to Waters of U.S. 0 .158 0.04% .400 .063Residential Low Density o year to Waters of U.S. 0 .138 0.03% .400 .055Residential Low Density o year to Waters of U.S. 0 .181 0.05% .400 .073
• Residential Low Density o year to Waters of U.S. 0 .214 0.05% .400 .086Residential Low Density o year to Waters of U.S. 0 2.927 0.74% .400 1.171Residential Low Density o year to Waters of U.S. 0 1.561 0.39% .460 .718Residential Low Density o year to Waters of U.S. 0 .985 0.25% .580 .571Residential Low Density o year to Waters of U.S. 0 1.590 0.40% .650 1.034Residential Low Density o year to Waters of U.S. 0 .492 0.12% .430 .212
• Residential Low Density o year to Waters of U.S. 0 .205 0.05% .620 .127Residential Low Density o year to Waters of U.S. 0 .209 0.05% .620 .130Residential Low Density o year to Waters of U.S. 0 .815 0.21% .920 .749Residential Low Density 5 year on Lot 0 .720 0.18% .002 .001Residential Low Density 100 year on Lot 0 .507 0.13% .001 .001Residential Low Density 100 year on Lot 0 .540 0.14% .001 .001
• Residential Low Density 100 year on Lot 0 .492 0.12% .001 .000Residential Low Density 100 year on Lot 0 .492 0.12% .001 .000Residential Low Density 100 year on Lot 0 .434 0.11% .001 .000Residential Low Density 100 year on Lot 0 .551 0.14% .001 .001Residential Low Density 100 year on Lot 0 .139 0.04% .001 .000Residential Low Density 100 year on Lot 0 2.226 0.56% .001 .002
• Residential Low Density 100 year on Lot 0 7.286 1.84% .001 .007Residential Low Density 100 year on Lot 0 7.885 1.99% .001 .008Residential Low Density 100 year on Lot 0 6.776 1. 71% .001 .007Residential Low Density 100 year on Lot 0 1.516 0.38% .001 .002
•

•ID Outfall Name Area Outfall Size Parent Id
.-_._--------------------------------------------------------------------------------------------------------------------------SR-10 WEST OF McCLINTOCK DRIVE 395.576 36-------------------------------------------------------------------------------------------------------------------------------
• Landuse Retention Population Area % Tot Area COE CA Avg COE----------------------------------------------------------------------------------------------------------------------------Residential Low Density 100 year on Lot 0 .761 0.19% .001 .001Residential Low Density 100 year on Lot 0 .724 0.18% .001 .001Residential Low Density 100 year on Lot 0 5.501 1.39% .001 .006Residential Low Density 100 year on Lot 0 .482 0.12% .001 .000
• Residential Low Density 100 year on Lot 0 .503 0.13% .001 .001Residential Low Density 100 year on Lot 0 .862 0.22% .001 .001Residential Low Density 100 year on Lot 0 1.026 0.26% .001 .001Residential Low Density 100 year on Lot 0 .878 0.22% .001 .001Residential Low Density 100 year on Lot 0 .985 0.25% .001 .001Residential Low Density 100 year on Site 0 .507 0.13% .001 .001
• Residential Low Density 100 year on Site 0 .577 0.15% .001 .001Residential Low Density 100 year on Site 0 .990 0.25% .001 .001Residential Low Density 100 year on Site 0 .358 0.09% .001 .000Residential Low Density 100 year on Site 0 .677 0.17% .001 .001Residential Low Density 100 year on Site 0 .501 0.13% .001 .001Residential Low Density 100 year on Site 0 3.081 0.78% .001 .003
• Residential Low Density 100 year on Site 0 .943 0.24% .001 .001Residential Low Density 100 year on Site 0 .395 0.10% .001 .000Residential Low Density 100 year on Site 0 .987 0.25% .001 .001Residential Low Density Vacant Land 5 yr Retentio 0 .134 0.03% .002 .000Residential High Density 0 year to Waters of u.S. 0 3.351 0.85% .922 3.089Residential High Density 0 year to Waters of U.S. 0 .493 0.12% .380 .187
• Residential High Density 0 year to Waters of u.S. 0 .504 0.13% .950 .478Residential High Density 0 year to Waters of u.S. 0 .202 0.05% .870 .176Residential High Density 0 year to Waters of u.S. 0 .516 0.13% .900 .464Residential High Density 0 year to Waters of u.S. 0 .639 0.16% .950 .607Residential High Density 0 year to Waters of u.S. 0 .473 0.12% .900 .425Residential High Density 0 year to Waters of u.S. 0 .997 0.25% .780 .777
• Residential High Density 0 year to Waters of u.S. 0 .610 0.15% .900 .549Residential High Density 0 year to Waters of U.S. 0 3.765 0.95% .920 3.464Residential High Density 0 year to Waters of u.S. 0 1.276 0.32% .780 .995Residential High Density 0 year to Waters of U.S. 0 .941 0.24% .950 .894Residential High Density 0 year to Waters of U.S. 0 3.877 0.98% .920 3.567Residential High Density 5 year on Lot 0 .475 0.12% .002 .001
• Residential High Density 5 year on Lot 0 .607 0.15% .002 .001Residential High Density 5 year on Site 0 .578 0.15% .002 .001Residential High Density 5 year on Site 0 2.873 0.73% .002 .006Residential High Density 5 year on Site 0 .359 0.09% .002 .001Residential High Density 5 year on Site 0 .315 0.08% .002 .001Residential High Density 5 year on Site 0 .253 0.06% .002 .001
• Residential High Density 5 year on Site 0 1.023 0.26% .002 .002Residential High Density 5 year on Site 0 4.835 1.22% .002 .010Residential High Density 100 year on Lot 0 .516 0.13% .001 .001Residential High Density 100 year on Lot 0 .473 0.12% .001 .000Residential High Density 100 year on Lot 0 .607 0.15% .001 .001Residential High Density 100 year on Lot 0 .804 0.20% .001 .001
• Residential High Density 100 year on Lot 0 .504 0.13% .001 .001Residential High Density 100 year on Site 0 7.363 1.86% .001 .007Residential High Density 100 year on Site 0 8.794 2.22% .001 .009Residential High Density 100 year on Site 0 .759 0.19% .001 .001
•

•ID Outfall Name Area Outfall Size Parent Id
----------------------------------------------------------------------------------------------------------------_.-.---------_.-SR-10 WEST OF McCLINTOCK DRIVE 395.576 36------------------------------------------------------------------------------------------------------------------.-------------
• Landuse Retention Population Area % Tot Area COE CA Avg COE---------------------------------------------------------------------------------------------------------------------------_.Residential High Density 100 year on Site 0 1.351 0.34% .001 .001
Residential High Density 100 year on Site 0 2.072 0.52% .001 .002
Residential High Density 100 year on Site 0 .561 0.14% .001 .001
Residential High Density 100 year on Site 0 1.598 0.40% .001 .002
• Residential High Density 100 year on Site 0 1.005 0.25% .001 .001
Residential High Density 100 year on Site 0 2.525 0.64% .001 .003
Residential High Density 100 year on Site 0 9.077 2.29% .001 .009
Residential High Density 100 year on Site 0 1.685 0.43% .001 .002
Residential High Density 100 year on Site 0 2.140 0.54% .001 .002
Residential High Density 100 year on Site 0 2.110 0.53% .001 .002
• Residential High Density 100 year on Site 0 2.132 0.54% .001 .002Residential High Density 100 year on Site 0 1.205 0.30% .001 .001Residential High Density 100 year on Site 0 .567 0.14% .001 .001
Residential High Density 100 year on Site 0 2.797 0.71% .001 .003
Residential High Density 100 year on Site 0 .855 0.22% .001 .001
Residential High Density 100 year on Site 0 11.714 2.96% .001 .012
• Residential High Density 100 year on Site 0 4.612 1. 17"1. .001 .005
Residential High Density 100 year on Site 0 5.193 1.31% .001 .005Residential High Density 100 year on Site 0 .203 0.05% .001 .000
Residential High Density 100 year on Site 0 .487 0.12% .001 .000
Residential High Density 100 year on Site 0 12.542 3.17"1. .001 .013
Residential High Density 100 year on Site 0 4.141 1.05% .001 .004
• Comm Res Office, Church o year to Waters of U.S. 0 .431 0.11% .920 .396Comm Res Office, Church o year to Waters of U.S. 0 .393 0.10% .950 .374Comm Res Office, Church o year to Waters of U.S. 0 .289 0.07"1. .950 .274Comm Res Office, Church 5 year on Site 0 .455 0.12% .002 .001Comm Res Office, Church 5 year on Site 0 .621 0.16% .002 .001Comm Res Office, Church 100 year on Site 0 .716 0.18% .001 .001
• Comm Res Office, Church 100 year on Site 0 .228 0.06% .001 .000Comm Res Office, Church 100 year on Site 0 .661 0.17"1. .001 .001
Comm Res Office, Church 100 year on Site 0 .975 0.25% .001 .001Comm Res Office, Church 100 year on Site 0 .491 0.12% .001 .000Comm Hotels,Restraunts o year to Waters of u.S. 0 .401 0.10% .950 .381Comm Hotels,Restraunts o year to Waters of u.S. 0 .589 0.15% .950 .560
• Comm Hotels,Restraunts 5 year on Site 0 .765 0.19% .002 .002Comm Hotels,Restraunts 5 year on Site 0 .700 0.18% .002 .001Comm Hotels,Restraunts 100 year on Site 0 .561 0.14% .001 .001Comm Hotels,Restraunts 100 year on Site 0 .716 0.18% .001 .001Comm Hotels,Restraunts 100 year on Site 0 .716 0.18% .001 .001Comm Hotels,Restraunts 100 year on Site 0 .715 0.18% .001 .001
• Comm Hotels,Restraunts 100 year on Site 0 .715 0.18% .001 .001Comm Hotels,Restraunts 100 year on Site 0 .720 0.18% .001 .001Comm Hotels,Restraunts 100 year on Site 0 .714 0.18% .001 .001Comm Hotels,Restraunts 100 year on Site 0 .478 0.12% .001 .000Comm Hotels,Restraunts 100 year on Site 0 .597 0.15% .001 .001Comm Hotels,Restraunts 100 year on Site 0 .715 0.18% .001 .001
• Comm Hotels,Restraunts 100 year on Site 0 .703 0.18% .001 .001Comm Hotels,Restraunts 100 year on Site 0 .840 0.21% .001 .001Comm Hotels,Restraunts 100 year on Site 0 2.248 0.57"1. .001 .002Comm Hotels,Restraunts 100 year on Site 0 .728 0.18% .001 .•001
•

•10
SR-10
Outfall Name
WEST OF McCLINTOCK DRIVE
Area
395.576
Outfall Size
36
Parent Id
--------------------------------------------------------------------------------------------------------------------------------
• Landuse Retention Population Area % Tot Area COE CA Avg COE-----------------------------------------------------------------------------------------------------------------------------Comm Hotels,Restraunts 100 year on Site 0 .503 0.13% .001 .001
Comm Mall, Strp Cntr,Ret 0 year to Waters of U.S. 0 .238 0.06% .950 .226
Comm Mall, Strp Cntr,Ret 0 year to Waters of U.S. 0 .469 0.12% .950 .446
Comm Mall, Strp Cntr,Ret 5 year on Site 0 1.804 0.46% .002 .004
• Comm Mall, Strp Cntr,Ret 5 year on Site 0 .282 0.07"" .002 .001Comm Mall, Strp Cntr,Ret 5 year on Site 0 2.005 0.51% .002 .004Comm Mall, Strp Cntr,Ret 100 year on Site 0 1.294 0.33% .001 .001
Comm Mall, Strp Cntr,Ret 100 year on Site 0 1.311 0.33% .001 .001Comm Mall, Strp Cntr,Ret 100 year on Site 0 3.728 0.94% .001 .004Comm Auto,Gas Sta,Pk Lot 0 year to Waters of U.S. 0 2.510 0.63% .950 2.385
• Comm Auto,Gas Sta,Pk Lot 0 year to Waters of U.S. 0 .492 0.12% .950 .467Comm Auto,Gas Sta,Pk Lot 0 year to Waters of U.S. 0 1.362 0.34% .950 1.294Comm Auto,Gas Sta,Pk Lot 0 year to Waters of U.S. 0 .693 0.18% .950 .658
Comm Auto,Gas Sta,Pk Lot 0 year to Waters of U.S. 0 1.112 0.28% .950 1.056Comm Auto,Gas Sta,Pk Lot 0 year to Waters of U.S. 0 .485 0.12% .950 .461Comm Auto,Gas Sta,Pk Lot 0 year to Waters of U.S. 0 4.073 1.03% .900 3.666
• Comm Auto,Gas Sta,Pk Lot 0 year to Waters of U.S. Q .620 0.16% .950 .589Comm Auto,Gas Sta,Pk Lot 0 year to Waters of U.S. 0 1.369 0.35% .950 1.300Comm Auto,Gas Sta,Pk Lot 5 year on Site 0 2.353 0.59% .002 .005Comm Auto,Gas Sta,Pk Lot 5 year on Site 0 .846 0.21% .002 .002Comm Auto,Gas Sta,Pk Lot 100 year on Site 0 .482 0.12% .001 .000Comm Auto,Gas Sta,Pk Lot 100 year on Site 0 .837 0.21% .001 .001
• Comm Auto,Gas Sta,Pk Lot 100 year on Site 0 1.390 0.35% .001 .001Comm Auto,Gas Sta,Pk Lot 100 year on Site 0 .639 0.16% .001 .001Comm Auto,Gas Sta,Pk Lot 100 year on Site 0 .358 0.09% .001 .000Comm Auto,Gas Sta,Pk Lot 100 year on Site 0 1.428 0.36% .001 .001Ind Park-li ght o year to Waters of U.S. 0 .413 0.10% .950 .393Ind Park-light o year to Waters of U.S. 0 .628 0.16% .950 .597
• Ind Park-light o year to Waters of U.S. 0 .477 0.12% .950 .454Ind Park-li ght o year to Waters of U.S. 0 .492 0.12% .950 .468Ind Park-light o year to Waters of U.S. 0 .628 0.16% .950 .597Ind Park-light o year to Waters of U.S. 0 .488 0.12% .950 .463Ind Park-li ght o year to Waters of U.S. 0 .741 0.19% .950 .704Ind Park-light o year to Waters of U.S. 0 .519 0.13% .950 .493
• Ind Park-light o year to Waters of U.S. 0 .930 0.24% .950 .884Ind Park-li ght o year to Waters of U.S. 0 .628 0.16% .950 .597Ind Park-li ght o year to Waters of U.S. 0 1.074 0.27"" .950 1.020Ind Park-light o year to Waters of U.S. 0 2.961 0.75% .950 2.813Ind Park-light o year to Waters of U.S. 0 .454 0.11% .650 .295Ind Park-li ght 5 year on Site 0 .477 0.12% .002 .001
• Ind Park-light 100 year on Site 0 1.414 0.36% .001 .001Ind Park-li ght 100 year on Site 0 .184 0.05% .001 .000Ind Park-li ght 100 year on Site 0 .207 0.05% .001 .000Ind Park-light 100 year on Site 0 .628 0.16% .001 .001Ind Park-light 100 year on Site 0 .702 0.18% .001 .001Ind Large Site-Medium o year to Waters of U.S. 0 .293 0.07"" .950 .279
• Ind Large Site-Medium 5 year on Site 0 2.634 0.67"" .002 .005Ind Foundry,Elec,PPs o year to Waters of U.S. 0 .220 0.06% .950 .209Ind Foundry,Elec,PPs o year to Waters of U.S. 0 .730 0.18% .950 .693Ind Foundry,Elec,PPs o year to Waters of U.S. 0 1.256 0.32% .950 1.193
•
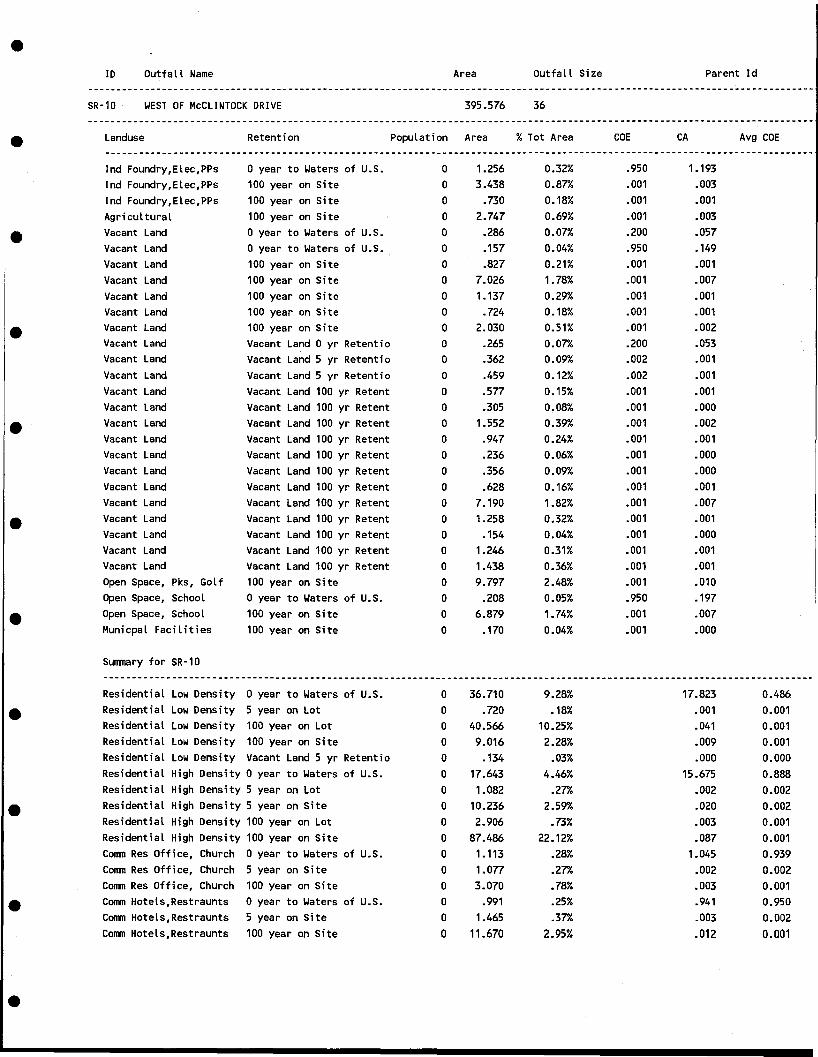
•ID Outfall Name Area Outfall Size Parent Id
~----------------------------------------------------- -------------------------------------------------------------------------
SR-10 WEST OF McCLINTOCK DRIVE 395.576 36-------------------------------------------------------------------------------------------------------------------------------
• Landuse Retention Population Area %Tot Area COE CA Avg COE---------------------------------------.------------------------------------------------------------------------------------Ind Foundry,Elec,PPs o year to Waters of u.s. 0 1.256 0.32% .950 1.193Ind Foundry,Elec,PPs 100 year on Site 0 3.438 0.87"1. .001 .003Ind Foundry,Elec,PPs 100 year on Site 0 .730 0.18% .001 .001Agricultural 100 year on Site 0 2.747 0.69% .001 .003
• Vacant Land o year to Waters of u.S. 0 .286 0.07% .200 .057Vacant Land o year to Waters of u.S. 0 .157 0.04% .950 .149Vacant Land 100 year on Site 0 .827 0.21% .001 .001Vacant Land 100 year on Site 0 7.026 1.78% .001 .007Vacant Land 100 year on Site 0 1.137 0.29% .001 .001Vacant Land 100 year on Site 0 .724 0.18% .001 .001
• Vacant Land 100 year on Site 0 2.030 0.51% .001 .002Vacant Land Vacant Land 0 yr Retentio 0 .265 0.07"1. .200 .053Vacant Land Vacant Land 5 yr Retentio 0 .362 0.09% .002 .001Vacant Land Vacant Land 5 yr Retentio 0 .459 0.12% .002 .001Vacant Land Vacant Land 100 yr Retent 0 .577 0.15% .001 .001Vacant Land Vacant Land 100 yr Retent 0 .305 0.08% .001 .000
• Vacant Land Vacant Land 100 yr Retent 0 1.552 0.39% .001 .002Vacant Land Vacant Land 100 yr Retent 0 .947 0.24% .001 .001Vacant Land Vacant Land 100 yr Retent 0 .236 0.06% .001 .000Vacant Land Vacant Land 100 yr Retent 0 .356 0.09% .001 .000Vacant Land Vacant Land 100 yr Retent 0 .628 0.16% .001 .001Vacant Land Vacant Land 100 yr Retent 0 7.190 1.82% .001 .007
• Vacant Land Vacant Land 100 yr Retent 0 1.258 0.32% .001 .001Vacant Land Vacant Land 100 yr Retent 0 .154 0.04% .001 .000Vacant Land Vacant Land 100 yr Retent 0 1.246 0.31% .001 .001Vacant Land Vacant Land 100 yr Retent 0 1.438 0.36% .001 .001Open Space, Pks, Golf 100 year on Site 0 9.797 2.48% .001 .010Open Space, School o year to Waters of u.S. 0 .208 0.05% .950 .197
• Open Space, School 100 year on Site 0 6.879 1.74% .001 .007Muni cpa l Facil i ties 100 year on Site 0 .170 0.04% .001 .000
Summary for SR-10
----------------------------------------------------------------------------------------------------------------------------Residential Low Density o year to Waters of u.S. 0 36.710 9.28% 17.823 0.486
• Residential Low Density 5 year on Lot 0 .720 .18% .001 0.001Residential Low Density 100 year on Lot 0 40.566 10.25% .041 0.001Residential Low Density 100 year on Site 0 9.016 2.28% .009 0.001Residential Low Density Vacant Land 5 yr Retentio 0 .134 .03% .000 0.000Residential High Density 0 year to Waters of u.S. 0 17.643 4.46% 15.675 0.888Residential High Density 5 year on Lot 0 1.082 .27"1. .002 0.002
• Residential High Density 5 year on Site 0 10.236 2.59% .020 0.002Residential High Density 100 year on Lot 0 2.906 .73% .003 0.001Residential High Density 100 year on Site 0 87.486 22.12% .087 0.001Comm Res Office, Church o year to Waters of U~S. 0 1.113 .28% 1.045 0.939Comm Res Office, Church 5 year on Site 0 1.077 .27"1. .002 0.002Comm Res Office, Church 100 year on Site 0 3.070 .78% .003 0.001
• Comm Hotels,Restraunts o year to Waters of u.S. 0 .991 .25% .941 0.950Comm Hotels,Restraunts 5 year on Site 0 1.465 .37"1. .003 0.002Comm Hotels,Restraunts 100 year on Site 0 11.670 2.95% .012 0.001
•

•
•
•
•
•
ID
SR-10
Outfall Name
WEST OF McCLINTOCK DRIVE
Area
395.576
Outfall Size
36
Parent Id

•ID Outfall Name Area Outfall Size Parent Id
-------------------------------------------------------------------------------------------------------------------------------
SR-10-A 1st ST &PERRY 28.868 INDIV RET SR-10
-------------------------------------------------------------------------------------------------------------------------------
• Landuse Retention Population Area % Tot Area COE CA Avg COE
----------------------------------------------------------------------------------------------------------------------------Residential Low Density 100 year on Site 0 .747 2.59% .001 .001
Residential Low Density 100 year on Site 0 2.587 8.96% .001 .003
Ind Park-light 100 year on Site 0 2.001 6.93% .001 .002
Ind Park-light 100 year on Site 0 .483 1.67% .001 .000
• Ind Park-light 100 year on Site 0 1.113 3.86% .001 .001
Ind Park-light 100 year on Site 0 4.058 14.06% .001 .004
Ind Park-light Vacant Land 100 yr Retent 0 .331 1.15% .001 .000
Ind Large Site-Medium 100 year on Site 0 3.030 10.50% .001 .003
Ind Foundry,Elec,PPs 100 year on Site 0 .311 1.08% .001 .000
Ind Foundry,Elec,PPs 100 year on Site 0 1.345 4.66% .001 .001
• Ind Foundry,Elec,PPs 100 year on Site 0 .172 0.60% .001 .000
Ind Foundry,Elec,PPs 100 year on Site 0 2.380 8.24% .001 .002
Ind Foundry,Elec,PPs 100 year on Site 0 1.343 4.65% .001 .001
Ind Foundry,Elec,PPs 100 year on Site 0 .253 0.88% .001 .000
Vacant Land o year to Waters of u.S. 0 .159 0.55% .950 .151
Vacant Land o year to Waters of u.S. 0 .389 1.35% .950 .370
• Vacant Land o year to Waters of u.S. 0 .131 0.45% .950 .124
Vacant Land o year to Waters of u.S. 0 .471 1.63% .950 .447
Vacant Land Vacant Land 0 yr Retentio 0 .387 1.34% .200 .077•
Vacant Land Vacant Land 100 yrRetent 0 .229 0.79% .001 .000
Vacant Land Vacant Land 100 yr Retent 0 3.382 11.72% .001 .003
•
•
•
Summary for SR-10-A----------------------------------------------------------------------------------------------------------------------------Residential Low Density 100 year on Site 0 3.335 11.55% .003 0.001
Ind Park-li ght 100 year on Site 0 7.654 26.51% .008 0.001
Ind Park-light Vacant Land 100 yr Retent 0 .331 1.15% .000 0.000
Ind Large Site-Medium 100 year on Site 0 3.030 10.50% .003 0.001
Ind Foundry,Elec,PPs 100 year on Site 0 5.803 20.10% .006 0.001
Vacant Land o year to Waters of u.S. 0 1.150 . 3.98% 1.092 0.950
Vacant Land Vacant' Land 0 yr Retentio 0 .387 1.34% .077 0.199
Vacant Land Vacant Land 100 yr Retent 0 3.610 12.51% .004 0.001
Total Street Area 0 3.568 12.36% 3.389 0.950
SR-10-A Drainage Area Totals----------------------------------------------------------------------------------------------------------------------------
•
•
•
o 28.868 100.00% 4.582 0.159

•ID Outfa II Name Area Outfall Size Parent Id
•SR-10-B 3rd ST &PERRY
Landuse Retention
53.016
Population Area
INDIV RET
% Tot Area COE
SR-10
CA Avg COE
•
•
•
•
•
•
Residential Low Density 100 year on Site 0 3.405 6.42% .001 .003Residential High Density 5 year on Site 0 4.161 7.85% .002 .008Corom Auto,Gas Sta,Pk Lot 100 year on Site 0 .483 0.91% .001 .000Ind Park-light o year to Waters of U.S. 0 .602 1.14% .950 .571Ind Park-light 5 year on Site 0 .678 1.28% .002 .001Ind Park-light 100 year on Site 0 6.093 11.49% .001 .006Ind Park-light 100 year on Site 0 .986 1.86% .001 .001Ind Park-light 100 year on Site 0 2.339 4.41% .001 .002Ind Park-light 100 year on Site 0 1.497 2.82% .001 .001Ind Large Site-Medium 5 year on Site 0 4.761 8.98% .002 .010Ind FoundrY,Elec,PPs 5 year on Site 0 .521 0.98% .002 .001Ind FoundrY,Elec,PPs 100 year on Site 0 3.063 5.78% .001 .003Ind FoundrY,Elec,PPs 100 year on Site 0 .758 1.43% .001 .001Ind FoundrY,Elec,PPs 100 year on Site 0 4.479 8.45% .001 .004Ind FoundrY,Elec,PPs 100 year on Site 0 .642 1.21% .001 .001Vacant Land Vacant Land 0 yr Retentio 0 1.579 2.98% .000 .000Vacant Land Vacant Land 100 yr Retent 0 7.262 13.70% .001 .007Vacant Land Vacant Land 100 yr Retent 0 .681 1.28% .001 .001Vacant Land Vacant Land 100 yr Retent 0 2.863 5.40% .001 .003
Summary for SR-10-B------------------------------------------------------------------------------------------------------------.---------------Residential Low Density 100 year on Site 0 3.405 6.42% .003 0.001Residential High Density 5 year on Site 0 4.161 7.85% .008 0.002Corom Auto,Gas Sta,Pk Lot 100 year on Site 0 .483 .91% .000 0.000Ind Park-light o year to Waters of U.S. 0 .602 1.14% .571 0.949Ind Park-light 5 year on Site 0 .678 1.28% .001 0.001Ind Park-light 100 year on Site 0 10.915 20.59% .011 0.001Ind Large Site-Medium 5 year on Site 0 4.761 8.98% .010 0.002Ind FoundrY,Elec,PPs 5 year on Site 0 .521 .98% .001 0.002Ind FoundrY,Elec,PPs 100 year on Site 0 8.942 16.87% .009 0.001Vacant Land Vacant Land 0 yr Retentio 0 1.579 2.98% .000 0.000Vacant Land Vacant Land 100 yr Retent 0 10.805 20.38% .011 0.001Total Street Area 0 6.164 11.63% 5.856 0.950
SR-10-B Drainage Area Totals
•
•
•
o 53.016 100.00% 6.481 0.122

•ID Outfall Name Area Outfall Size Parent Id
SR-10-C EMKAY BUS. PARK 24.929 INDIV RET SR-10
• Landuse Retention Population Area % Tot Area COE CA Avg COE----------------------------------------------------------------------------------------------------------------------------Comm Mall, Strp Cntr,Ret 100 year on Site 0 1.293 5.19% .001 .001Comm Auto,Gas Sta,Pk Lot 100 year on Site 0 .983 3.94% .001 .001Ind Park-light 100 year on Site 0 .768 3.08% .001 .001Ind Park-light 100 year on Site 0 .720 2.89% .001 .001
• Ind Park-light 100 year on Site 0 .718 2.88% .001 .001Ind Large Site-Medium 100 year on Site 0 .797 3.20% .001 .001Ind Large Site-Medium 100 year on Site 0 .871 3.49% .001 .001Ind Foundry,Elec,PPs 100 year on Site 0 1.464 5.87% .001 .001Ind Foundry,Elec,PPs 100 year on Site 0 .757 3.04% .001 .001Ind Foundry,Elec,PPs 100 year on Site 0 .841 °3.37% .001 .001
• Ind Foundry,Elec,PPs 100 year on Site 0 1.287 5.16% .001 .001Ind Foundry,Elec,PPs 100 year on Site 0 1.968 7.89% .001 .002Ind Foundry,Elec,PPs 100 year on Site 0 1.451 5.82% .001 .001Ind Foundry,Elec,PPs 100 year on Site 0 .764 3.06% .001 .001Ind Foundry,Elec,PPs 100 year on Site 0 .784 3.14% .001 .001Ind Foundry,Elec,PPs 100 year on Site 0 2.752 11.04% .001 .003
• Ind Foundry,Elec,PPs 100 year on Site 0 1.232 4.94% .001 .001Ind Foundry,Elec,PPs 100 year on Site 0 .838 3.36% .001 .001Vacant Land Retention Basin 0 .305 1.22% 1.000 .305Vacant Land Vacant Land 5 yr Retentio 0 1.289 5.17"1. .002 .003
Summary for SR-10-C
• -----------.----------------------------------------------------------------------------------------------------------------Comm Mall, Strp Cntr,Ret 100 year on Site 0 1.293 5.19% .001 0.001Comm Auto,Gas Sta,Pk Lot 100 year on Site 0 .983 3.94% .001 0.001Ind Park-light 100 year on Site 0 2.205 8.85% .002 0.001Ind Large Site-Medium 100 year on Site 0 1.668 6.69% .002 0.001Ind Foundry,Elec,PPs 100 year on Site 0 14.138 56.71% .014 0.001
• Vacant Land Retention Basin 0 .305 1.22% .305 1.000Vacant Land Vacant Land 5 yr Retentio 0 1.289 5.17% .003 0.002Total Street Area 0 3.048 12.23% 2.896 0.950
SR-10-C Drainage Area Totals-----------------------------------------------------------------------------------------------------------------------------
•
•
•
•
o 24.929 100.00% 3.224 0.129

•10 Outfall Name Area Outfall Size Parent Id
------------------------------------------------------------------------------------------------------------.------------------SR-10-0 165.346 SR-10
-------------------------------------------------------------------------------------------------------------------------------
• Landuse Retention Population Area % Tot Area COE CA Avg COE----------------------------------------------------------------------------------------------------------------------------Unknown 100 year on Site 0 .816 0.49% .001 .001
Unknown 100 year on Site 0 .703 0.43% .001 .001
Comm Res Office, Church 100 year on Site 0 1.258 0.76% .001 .001Ind Park-light 100 year on Site 0 1.135 0.69% .001 .001
• Ind Park-light 100 year on Site 0 1.092 0.66% .001 .001Ind Park-light 100 year on Site 0 1.092 0.66% .001 .001
Ind Park-light 100 year on Site 0 1.134 0.69% .001 .001
Ind Park-light 100 year on Site 0 .544 0.33% .001 .001
Ind Park-light 100 year on Site 0 .668 0.40% .001 .001
Ind Park-light 100 year on Site 0 .544 0.33% .001 .001
• Ind Park-l ight 100 year on Site 0 1.092 0.66% .001 .001Ind Park-light 100 year on Site 0 1.092 0.66% .001 .001Ind Park-light 100 year on Site 0 2.203 1.33% .001 .002
Ind Park-light 100 year on Site 0 1.103 0.67'1. .001 .001Ind Park-light 100 year on Site 0 .408 0.25% .001 .000Ind Park-light 100 year on Site 0 .552 0.33% .001 .001
• Ind Park-light 100 year on Site 0 .552 0.33% .001 .001Ind Park-light 100 year on Site 0 .552 0.33% .001 .001Ind Park-light 100 year on Site 0 1.315 0.80% .001 .001Ind Park-l ight 100 year on Site 0 .599 0.36% .001 .001Ind Park-light 100 year on Site 0 1.103 0.67'1. .001 .001Ind Park-light 100 year on Site 0 .890 0.54% .001 .001
• Ind Park-l ight 100 year on Site 0 .551 0.33% .001 .001Ind Park-light 100 year on Site 0 .549 0.33% .001 .001Ind Park-light 100 year on Site 0 .552 0.33% .001 .001Ind Park-light 100 year on Site 0 .552 0.33% .001 .001Ind Park-light 100 year on Site 0 1.114 0.67'1. .001 .001Ind Park-l ight 100 year on Site 0 .594 0.36% .001 .001
• Ind Park-light 100 year on Site 0 3.394 2.05% .001 .003Ind Park-light 100 year on Site 0 2.246 1.36% .001 .002Ind Park-l ight 100 year on Site 0 1.234 0.75% .001 .001Ind Park-light 100 year on Site 0 1.103 0.67% .001 .001Ind Park-light 100 year on Site 0 .551 0.33% .001 .001Ind Park-light 100 year on Site 0 1.265 0.77% .001 .001
• Ind Park-light 100 year on Site 0 2.226 1.35% .001 .002Ind Park-light 100 year on Site 0 .970 0.59% .001 .001Ind Park-light 100 year on Site 0 .549 0.33% .001 .001Ind Park-light 100 year on Site 0 .769 0.47'1. .001 .001Ind Park-light 100 year on Site 0 .546 0.33% .001 .001Ind Park-light 100 year on Site 0 1.092 0.66% .001 .001
• Ind Park-li ght 100 year on Site 0 .971 0.59% .001 .001Ind Park-light 100 year on Site 0 .770 0.47'1. .001 .001Ind Park-light 100 year on Site 0 .574 0.35% .001 .001Ind Park-light 100 year on Site 0 .877 0.53% .001 .001Ind Park-light 100 year on Site 0 .770 0.47'1. .001 .001Ind Park-light 100 year on Site 0 .803 0.49% .001 .001
• Ind Park-light 100 year on Site 0 .878 0.53% .001 .001Ind Park-light 100 year on Site 0 1.092 0.66% .001 .001Ind Park-light 100 year on Site 0 1.092 0.66% .001 .001Ind Large Site-Medium 100 year on Site 0 2.186 1.32% .001 .002
•

•10 Outfall Name Area Outfall Size Parent Id
~ ...._.. ---------------------------------------------- -------------------------------------------------------------------------SR-10-0 165.346 SR-10-------------------------------------------------------------------------------------------------------------------------------
• Landuse Retention Population Area % Tot Area COE CA Avg COE----------------------------------------------------------------------------------------------------------------------------Ind Large Site-Medium 100 year on Site 0 3.309 2.00% .001 .003Ind Large Site-Medium 100 year (on Site 0 1.100 0.67% .001 .001Ind Large Site-Medium 100 year 'on Site 0 2.206 1.33% .001 .002Ind Large Site-Medium 100 year on Site 0 2.160 1.31% .001 .002
• Ind Foundry,Elec,PPs 100 year on Site 0 2.011 1.22% .001 .002Ind Foundry,Elec,PPs 100 year on Site 0 2.839 1.72% .001 .003Ind Foundry,Elec,PPs 100 year on Site 0 .517 0.31% .001 .001Ind Foundry,Elec,PPs 100 year on Site 0 6.881 4.16% .001 .007Ind Foundry,Elec,PPs 100 year on Site 0 2.118 1.28% .001 .002Ind Foundry,Elec,PPs 100 year on Site 0 .863 0.52% .001 .001
• Ind Foundry,Elec,PPs 100 year on Site 0 1.873 1.13% .001 .002Ind FoundrY,Elec,PPs 100 year on Site 0 1.395 0.84% .001 .001Ind Foundry,Elec,PPs 100 year on Site 0 11.503 6.96% .001 .012Ind Foundry,Elec,PPs 100 year on Site 0 3.162 1.91% .001 .003Ind Foundry,Elec,PPs 100 year on Site 0 2.361 1.43% .001 .002Ind Foundry,Elec,PPs 100 year on Site 0 2.074 1.25% .001 .002
• Ind Foundry,Elec,PPs 100 year on Site 0 .517 0.31% .001 .001Ind Foundry,Elec,PPs 100 year on Site 0 1.093 0.66% .001 .001Ind Foundry,Elec,PPs 100 year on Site 0 1.088 0.66% .001 .001Ind Foundry,Elec,PPs 100 year on Site 0 2.885 1.74% .001 .003Ind Foundry,Elec,PPs 100 year on Site 0 2.860 1.73% .001 .003Ind Foundry,Elec,PPs 100 year on Site 0 2.890 1.75% .001 .003
• Ind Foundry,Elec,PPs 100 year on Site 0 3.596 2.17% .001 .004Ind Foundry,Elec,PPs 100 year on Site 0 4.278 2.59% .001 .004Vacant Land Retention Basin 0 1.070 0.65% 1.000 1.070Vacant Land Vacant Land 0 yr Retentio 0 2.747 1.66% .200 .549Vacant Land Vacant Land 5 yr Retentio 0 2.350 1.42% .002 .005Vacant Land Vacant Land 100 yr Retent 0 1.743 1.05% .001 .002
• Vacant Land Vacant Land 100 yr Retent 0 .546 0.33% .001 .001Vacant Land Vacant Land 100 yr Retent 0 1.639 0.99% .001· .002Vacant Land Vacant Land 100 yr Retent 0 1.103 0.67"1. .001 .001Vacant Land Vacant Land 100 yr Retent 0 6.191 3.74% .001 .006Vacant Land Vacant Land 100 yr Retent 0 .552 0.33% .001 .001Vacant Land Vacant Land 100 yr Retent 0 .704 0.43% .001 .001
• Vacant Land Vacant Land 100 yr Retent 0 1.100 0.67"1. .001 .001Vacant Land Vacant Land 100 yr Retent 0 .552 0.33% .001 .001Vacant Land Vacant Land 100 yr Retent 0 .215 0.13% .001 .000Vacant Land Vacant Land 100 yr Retent 0 .552 0.33% .001 .001Vacant Land Vacant Land 100 yr Retent 0 1.430 0.86% .001 .001
• Summary for SR-1O-0-----------------------------------------------------------------------------------------------------------------.----------_.Unknown 100 year on Site 0 1.519 .92% .002 0.001Comm Res Office, Church 100 year on Site 0 1.258 .76% .001 0.001Ind Park-light 100 year on Site 0 45.356 27.43% .045 0.001Ind Large Site-Medium 100 year on Site 0 10.962 6.63% .011 0.001
• Ind Foundry,Elec,PPs 100 year on Site 0 56.803 34.35% .057 0.001Vacant Land Retention Basin 0 1.070 .65% 1.070 1.000Vacant Land Vacant Land 0 yr Retentio 0 2.747 1.66% .549 0.200Vacant Land Vacant Land 5 yr Retentio 0 2.350 1.42% .005 0.002Vacant Land Vacant Land 100 yr Retent 0 16.326 9.87"1. .016 0.001Total Street Area 0 26.955 16.30% 25.607 0.950
•

•
•
•
•
•
•
•
•
•
•
SR-10-D Drainage Area Totals
o 165.346 100.00% 27.363 0.165

•ID Outfall Name Area Outfall Size Parent Id
._------------------------------------------------------------------------------------------------------------.-.---.----------SR-12 ADOT TUNNEL 967.183 18 FT DIA-------------------------------------------------------------------------------------------------------------------------------
• Landuse Retention Population Area % Tot Area COE CA Avg COE----------------------------------------------------------------------------------------------------------------------------Residential Low Density o year to Waters of u.s. 0 1.026 0.11% .540 .554
Residential Low Density o year to Waters of u.s. 0 2.298 0.24% .540 1.241
Residential Low Density o year to Waters of u.s. 0 11.853 1.23% .540 6.400
Residential Low Density o year to Waters of u.s. 0 5.033 0.52% .540 2.718
• Residential Low Density o year to Waters of U.S. 0 4.861 0.50% .540 2.625
Residential Low Density o year to Waters of u.s. 0 7.059 0.73% .540 3.812
Residential Low Density o year to Waters of u.s. 0 3.961 0.41% .540 2.139Residential Low Density o year to Waters of u.s. 0 9.142 0.95% .540 4.937
Residential Low Density o year to Waters of u.s. 0 2.674 0.28% .540 1.444Residential Low Density o year to Waters of u.s. 0 6.421 0.66% .540 3.468
• Residential Low Density o year to Waters of u.s. 0 .369 0.04% .450 .166Residential Low Density o year to Waters of u.s. 0 4.568 0.47"" .430 1.964Residential Low Density o year to Waters of u.s. 0 .615 0.06% .470 .289Residential Low Density o year to Waters of U.S. 0 5.715 0.59% .420 2.400Residential Low Density o year to Waters of u.s. 0 5.329 0.55% .450 2.398Residential Low Density o year to Waters of u.s. 0 .879 0.09% .440 .387
• Residential Low Density o year to Waters of U.S. 0 .729 0.08% .520 .379Residential Low Density o year to Waters of u.s. 0 9.428 0.97"" .540 5.091Residential Low Density o year to Waters of U.S. 0 4.101 0.42% .540 2.215Residential Low Density o year to Waters of u.s. 0 2.697 0.28% .480 1.294Residential Low Density o year to Waters of U.S. 0 1.883 0.19% .530 .998Residential Low Density o year to Waters of u.s. 0 .994 0.10% .520 .517
• Residential Low Density o year to Waters of u.s. 0 3.303 0.34% .430 1.420Residential Low Density o year to Waters of u.s. 0 3.770 0.39% .430 1.621Residential Low Density o year to Waters of u.s. 0 2.628 0.27"" .540 1.419Residential Low Density o year to Waters of u.s. 0 3.148 0.33% .430 1.354Residential Low Density o year to Waters of u.s. 0 .379 0.04% .540 .205Residential Low Density o year to Waters of u.s. 0 5.095 0.53% .450 2.293
• Residential Low Density o year to Waters of u.s. 0 1.529 0.16% .440 .673Residential Low Density o year to Waters of u.s. 0 .848 0.09% .450 .382Residential Low Density o year to Waters of u.s. 0 .638 0.07"" .470 .300Residential Low Density o year to Waters of u.s. 0 3.036 0.31% .450 1.366Residential Low Density o year to Waters of u.s. 0 .597 0.06% .470 .281Residential Low Density o year to Waters of u.s. 0 5.843 0.60% .540 3.155
• Residential Low Density o year to Waters of u.s. 0 1.670 0.17"" .540 .902Residential Low Density o year to Waters of u.s. 0 6.613 0.68% .540 3.571Residential Low Density o year to Waters of u.s. 0 1.504 0.16% .480 .722Residential Low Density o year to Waters of u.s. 0 1.883 0.19% .440 .829Residential Low Density o year to Waters of U.S. 0 1.591 0.16% .560 .891Residential Low Density o year to Retention Basin 0 4.820 0.50% .550 2.651
• Residential Low Density o year to Retention Basin 0 4.612 0.48% .550 2.537Residential Low Density o year to Retention Basin 0 8.528 0.88% .550 4.690Residential Low Density o year to Retention Basin 0 13.363 1.38% .550 7.350Residential Low Density o year to Retention Basin 0 5.722 0.59% .550 3.147Residential Low Density o year to Retention Basin 0 4.717 0.49% .550 2.594Residential Low Density o year to Retention Basin 0 4.187 0.43% .550 2.303
• Residential Low Density o year to Retention Basin 0 3.693 0.38% .550 2.031Residential Low Density o year to Retention Basin 0 3.922 0.41% .550 2.157Residential Low Density o year to Retention Basin 0 4.806 0.50% .550 2.643Residential Low Density o year to Retention Basin 0 2.253 0.23% .550 1.239
•
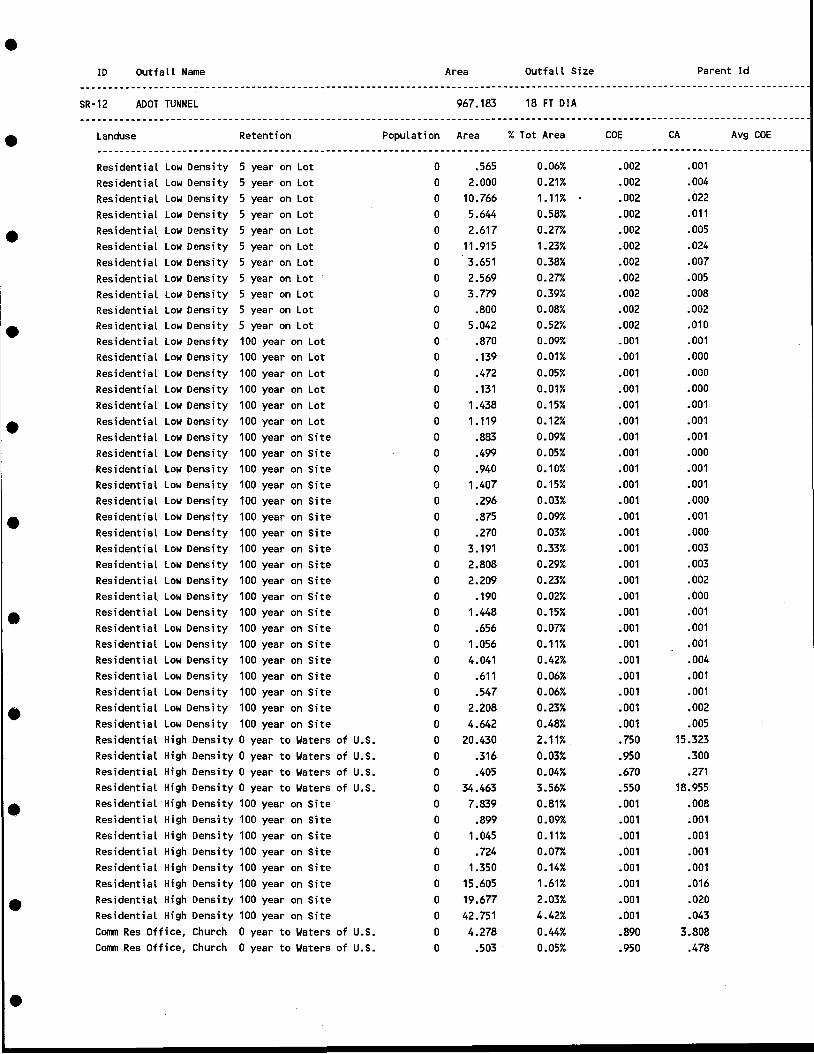
•ID Outfall Name Area Outfall Size Parent Id
----------------------------------------------------------------------_.-_._-----------------------------------------------------SR-12 ADOT TUNNEL 967.183 18 FT DlA
--------------------------------------------------------------------------------------------------------------------------------
• Landuse Retention Population Area % Tot Area COE CA Avg COE-----------------------------------------------------------------------------------------------------------------------------Residential Low Density 5 year on Lot 0 .565 0.06% .002 .001
Residential Low Density 5 year on Lot 0 2.000 0.21% .002 .004
Residential Low Density 5 year on Lot 0 10.766 1.11% .002 .022
Residential Low Density 5 year on Lot 0 5.644 0.58% .002 .011
• Residential Low Density 5 year on Lot 0 2.617 0.27"1. .002 .005Residential Low Density 5 year on Lot 0 11.915 1.23% .002 .024Residential Low Density 5 year on Lot 0 3.651 0.38% .002 .007
Residential Low Density 5 year on Lot 0 2.569 0.27"1. .002 .005
Residential Low Density 5 year on Lot 0 3.779 0.39% .002 .008Residential Low Density 5 year on Lot 0 .800 0.08% .002 .002
• Residential Low Density 5 year on Lot 0 5.042 0.52% .002 .010Residential Low Density 100 year on Lot 0 .870 0.09% .001 .001Residential Low Density 100 year on Lot 0 .139 0.01% .001 .000Residential Low Density 100 year on Lot 0 .472 0.05% .001 .000Residential Low Density 100 year (m Lot 0 .131 0.01% .001 .000Residential Low Density 100 year on Lot 0 1.438 0.15% .001 .001
• Residential Low Density 100 year on Lot 0 1.119 0.12% .001 .001
Residential Low Density 100 year on Site 0 .883 0.09% .001 .001Residential Low Density 100 year on Site 0 .499 0.05% .001 .000Residential Low Density 100 year on Site 0 .940 0.10% .001 .001Residential Low Density 100 year on Site 0 1.407 0.15% .001 .001Residential Low Density 100 year on Site 0 .296 0.03% .001 .000
• Residential Low Density 100 year on Site 0 .875 0.09% .001 .001Residential Low Density 100 year on Site 0 .270 0.03% .001 .000Residential Low Density 100 year on Site 0 3.191 0.33% .001 .003Residential Low Density 100 year on Site 0 2.808 0.29% .001 .003Residential Low Density 100 year on Site 0 2.209 0.23% .001 .002Residential Low Density 100 year on Site 0 .190 0.02% .001 .000
• Residential Low Density 100 year on Site 0 1.448 0.15% .001 .001Residential Low Density 100 year on Site 0 .656 0.07% .001 .001Residential Low Density 100 year on Site 0 1.056 0.11% .001 .001Residential Low Density 100 year on Site 0 4.041 0.42% .001 .004Residential Low Density 100 year on Site 0 .611 0.06% .001 .001Residential Low Density 100 year on Site 0 .547 0.06% .001 .001
• Residential Low Density 100 year on Site 0 2.208 0.23% .001 .002Residential Low Density 100 year on Site 0 4.642 0.48% .001 .005Residential High Density 0 year to Waters of U.S. 0 20.430 2.11% .750 15.323Residential High Density 0 year to Waters of U.S. 0 .316 0.03% .950 .300Residential High Density 0 year to Waters of U.S. 0 .405 0.04% .670 .271Residential High Density 0 year to Waters of U.S. 0 34.463 3.56% .550 18.955
• Residential High Density 100 year on Site 0 7.839 0.81% .001 .008Residential High Density 100 year on Site 0 .899 0.09% .001 .001Residential High Density 100 year on Site 0 1.045 0.11% .001 .001Residential High Density 100 year on Site 0 .724 0.07"1. .001 .001Residential High Density 100 year on Site 0 1.350 0.14% .001 .001Residential High Density 100 year on Site 0 15.605 1.61% .001 .016
• Residential High Density 100 year on Site 0 19.677 2.03% .001 .020Residential High Density 100 year on Site 0 42.751 4.42% .001 .043Comm Res Office, Church o year to Waters of U.S. 0 4.278 0.44% .890 3.808Comm Res Office, Church o year to Waters of U.S. 0 .503 0.05% .950 .478
•

•ID Outfall Name Area Outfall Size Parent Id
-------------------------------------------------------------------------------------------------------------------------------SR-12 ADOT TUNNEL 967.183 18 FT DIA
-----------------------------------------------------------------------------------------------------------------------------.-
• Landuse Retention Population Area % Tot Area COE CA Avg COE
----------------------------------------------------------------------------------------------------------------------------Comm Res Office, Church o year to Waters of U.S. 0 .715 0.07"1. .900 .644Comm Res Office, Church o year to Waters of U.S. 0 .348 0.04% .950 .330Comm Res Office, Church o year to Waters of U.S. 0 .673 0.07"1. .570 .384Comm Res Office, Church o year to Waters of U.S. 0 3.117 0.32% .930 2.899
• Comm Res Office, Church 100 year on Site 0 .9,57 0.10% .001 .001Comm Res Office, Church 100 year on Site 0 .542 0.06% .001 .001Comm Res Office, Church 100 year on Site 0 1.806 0.19% .001 .002
Comm Res Office, Church 100 year on Site 0 1.472 0.15% .001 .001Comm Res Office, Church 100 year on Site 0 2.978 0.31% .001 .003Comm Res Office, Church 100 year on Site 0 1.324 0.14% .001 .001
:. Comm Res Office, Church 100 year on Site 0 .777 0.08% .001 .001Comm Res Office, Church 100 year on Site 0 .813 0.08% .001 .001Comm Res Office, Church 100 year on Site 0 .813 0.08% .001 .001Comm Res Office, Church 100 year on Site 0 3.108 0.32% .001 .003Comm Res Office, Church 100 year on Site 0 .910 0.09% .001 .001Comm Res Office, Church 100 year on Site 0 1.121 0.12% .001 .001
• Comm Res Office, Church 100 year on Site 0 1.286 0.13% .001 .001Comm Res Office, Church 100 year on Site 0 3.134 0.32% .001 .003Comm Res Office, Church 100 year on Site 0 1.313 0.14% .001 .001Comm Res Office, Church Detention Area on Site 0 .839 0.09% .950 .797Comm Hotels,Restraunts o year to Waters of U.S. 0 .615 0.06% .950 .584Comm Hotels,Restraunts o year to Waters of U.S. 0 .703 0.07"1. .950 .668
• Comm Hotels,Restraunts o year to Waters of U.S. 0 .208 0.02% .950 .198Comm Hotels,Restraunts 100 year on Site 0 .875 0.09% .001 .001Comm Hotels,Restraunts 100 year on Site 0 2.881 0.30% .001 .003Comm Mall, Strp Cntr,Ret o year to Waters of U.S. 0 .420 0.04% .950 .399Comm Mall, Strp Cntr,Ret 100 year on Site 0 6.808 0.70% .001 .007Comm Mall, Strp Cntr,Ret 100 year on Site 0 .874 0.09% .001 .001
• Comm Mall, Strp Cntr,Ret 100 year on Site 0 7.769 0.80% .001 .008Comm Auto,Gas Sta,Pk Lot o year to Waters of U.S. 0 .710 0.07"1. .950 .675Comm Auto,Gas Sta,Pk Lot 5 year on Site 0 1.414 0.15% .002 .003Comm Auto,Gas Sta,Pk Lot 100 year on Lot 0 .409 0.04% .001 .000Comm Auto,Gas Sta,Pk Lot 100 year on Site 0 2.027 0.21% .001 .002Comm Auto,Gas Sta,Pk Lot 100 year on Site 0 .942 0.10% .001 .001
• Comm Auto,Gas Sta,Pk Lot 100 year on Site 0 1.402 0.14% .001 .001Comm Auto,Gas Sta,Pk Lot 100 year on Site 0 1.904 0.20% .001 .002Comm Auto,Gas Sta,Pk Lot 100 year on Site 0 .881 0.09% .001 .001Comm Auto,Gas Sta,Pk Lot 100 year on Site 0 1.062 0.11% .001 .001Comm Auto,Gas Sta,Pk Lot 100 year on Site 0 .881 0.09% .001 .001Comm Auto,Gas Sta,Pk Lot 100 year on Site 0 1.473 0.15% .001 .001
• Comm Auto,Gas Sta,Pk Lot 100 year on Site 0 2.674 0.28% .001 .003Comm Auto,Gas Sta,Pk Lot 100 year on Site 0 .814 0.08% .001 .001Ind Park-light 100 year on Site 0 .797 0.08% .001 .001Ind Park-light 100 year on Site 0 1.029 0.11% .001 .001Ind Large Site-Medium o year to Waters of U.S. 0 2.551 0.26% .000 .000Ind Large Site-Medium o year to Waters of U.S. 0 .274 0.03% .950 .261
• Ind Large Site-Medium 100 year on Site 0 .883 0.09% .001 .001Ind Foundry,Elec,PPs 100 year on Site 0 .974 0.10% .001 .001Agricultural o year to Waters of U.S. 0 1.621 0.17% .200 .324Agricultural 100 year on Site 0 .351 0.04% .001 .000
•
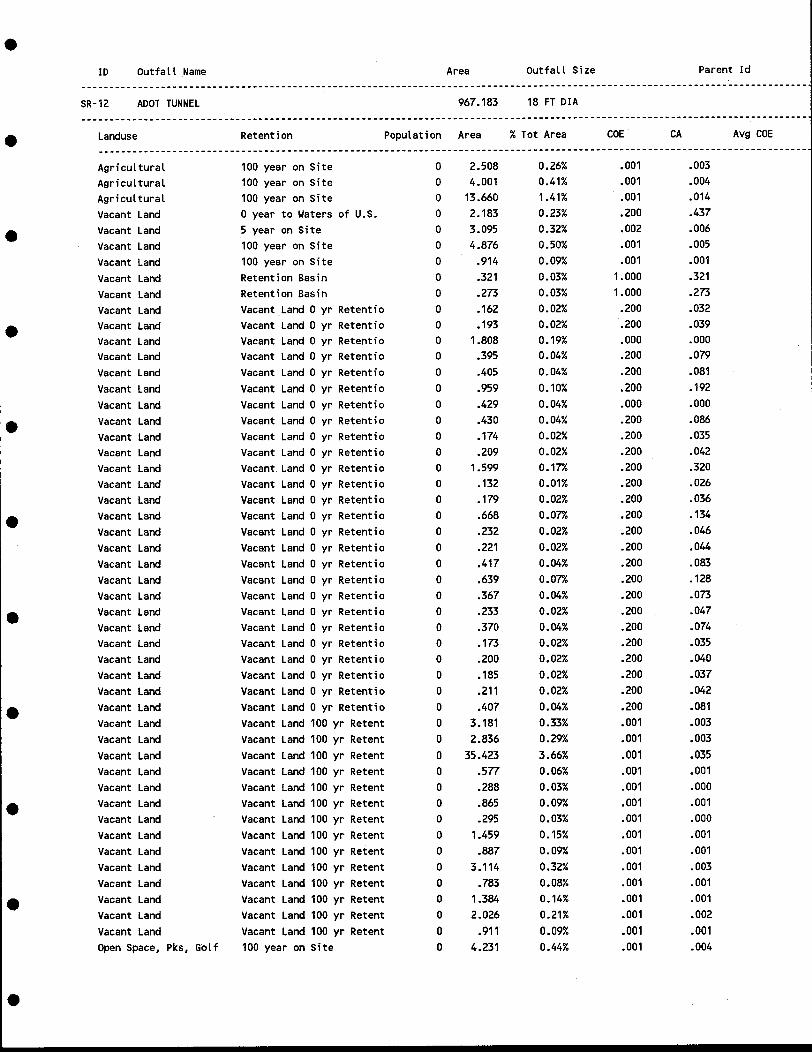
•ID Outfall Name Area Outfall Size Parent Id
-------------------------------------------------------------------------------------------------------------------------------SR-12 ADOT TUNNEL 967.183 18 FT DIA
-------------------------------------------------------------------------------------------------------------------------------
• Landuse Retention Population Area % Tot Area COE CA Avg COE
----------------------------------------------------------------------------------------------------------------------------Agricultural 100 year on Site 0 2.508 0.26% .001 .003
Agricultural 100 year on Site 0 4.001 0.41% .001 .004
Agricultural 100 year on Site 0 13.660 1.41% .001 .014
Vacant Land o year to Waters of U.S. 0 2.183 0.23% .200 .437
• Vacant Land 5 year on Site 0 3.095 0.32% .002 .006
Vacant Land 100 year on Site 0 4.876 0.50% .001 .005
Vacant Land 100 year on Site 0 .914 0.09% .001 .001
Vacant Land Retention Basin 0 .321 0.03% 1.000 .321
Vacant Land Retention Basin 0 .273 0.03% 1.000 .273
Vacant Land Vacant_Land 0 yr Retentio 0 .162 0.02% .200 .032
• Vacant Land Vacant Land 0 yr Retentio 0 .193 0.02% .200 .039Vacant Land Vacant Land 0 yr Retentio 0 1.808 0.19% .000 .000Vacant Land Vacant Land 0 yr Retentio 0 .395 0.04% .200 .079
Vacant Land Vacant Land 0 yr Retentio 0 .405 0.04% .200 .081
Vacant Land Vacant Land 0 yr Retentio 0 .959 0.10% .200 .192
Vacant Land Vacant Land 0 yr Retentio 0 .429 0.04% .000 .000
• Vacant Land Vacant Land 0 yr Retentio 0 .430 0.04% .200 .086
Vacant Land Vacant Land 0 yr Retentio 0 .174 0.02% .200 .035
Vacant Land Vacant Land 0 yr Retentio 0 .209 0.02% .200 .042Vacant Land Vacant_ Land 0 yr Retentio 0 1.599 0.17"'<; .200 .320
Vacant Land Vacant Land 0 yr Retentio 0 .132 0.01% .200 .026
Vacant Land Vacant Land 0 yr Retentio 0 .179 0.02% .200 .036
• Vacant Land Vacant Land 0 yr Retentio 0 .668 0.07"'<; .200 .134
Vacant Land Vacant Land 0 yr Retentio 0 .232 0.02% .200 .046
Vacant Land Vacant Land 0 yr Retentio 0 .221 0.02% .200 .044
Vacant Land Vacant Land 0 yr Retentio 0 .417 0.04% .200 .083
Vacant Land Vacant Land 0 yr Retentio 0 .639 0.07% .200 .128
Vacant Land Vacant Land 0 yr Retentio 0 .367 0.04% .200 .073
• Vacant Land Vacant Land 0 yr Retentio 0 .233 0.02% .200 .047
Vacant Land Vacant Land 0 yr Retentio 0 .370 0.04% .200 .074Vacant Land Vacant Land 0 yr Retentio 0 .173 0.02% .200 .035Vacant Land Vacant Land 0 yr Retentio 0 .200 0.02% .200 .040
Vacant Land Vacant Land 0 yr Retentio 0 .185 0.02% .200 .037
Vacant Land Vacant Land 0 yr Retentio 0 .211 0.02% .200 .042
• Vacant Land Vacant Land 0 yr Retentio 0 .407 0.04% .200 .081Vacant Land Vacant Land 100 yr Retent 0 3.181 0.33% .001 .003Vacant Land Vacant Land 100 yr Retent 0 2.836 0.29% .001 .003
Vacant Land Vacant Land 100 yr Retent 0 35.423 3.66% .001 .035Vacant Land Vacant Land 100 yr Retent 0 .577 0.06% .001 .001Vacant Land Vacant Land 100 yr Retent 0 .288 0.03% .001 .000
• Vacant Land Vacant Land 100 yr Retent 0 .865 0.09% .001 .001Vacant Land Vacant Land 100 yr Retent 0 .295 0.03% .001 .000
Vacant Land Vacant Land 100 yr Retent 0 1.459 0.15% .001 .001Vacant Land Vacant Land 100 yr Retent 0 .887 0.09% .001 .001
Vacant Land Vacant Land 100 yr Retent 0 3.114 0.32% .001 .003Vacant Land Vacant Land 100 yr Retent 0 .783 0.08% .001 .001
• Vacant Land Vacant Land 100 yr Retent 0 1.384 0.14% .001 .001Vacant Land Vacant Land 100 yr Retent 0 2.026 0.21% .001 .002
Vacant Land Vacant Land 100 yr Retent 0 .911 0.09% .001 .001Open Space, Pks, Golf 100 year on Site 0 4.231 0.44% .001 .004
•

•ID Outfall Name Area Outfall Size Parent Id
-------------------------------------------------------------------------------------------------------------------------------SR-12 ADOT TUNNEL 967.183 18 FT DIA-------------------------------------------------------------------------------------------------------------------------------
• Landuse Retention Population Area % Tot Area COE CA Avg COE----------------------------------------------------------------------------------------------------------------------------Open Space, Pks, Golf Retention Basin 0 6.206 0.64% 1.000 6.206Open Space, School 100 year on Site 0 9.370 0.97"1. .001 .009ADOT Jurisdiction ADOT information 0 51.772 5.35% .500 25.886ADOT Jurisdiction ADOT information 0 31.663 3.27% .500 15.832
• ADOT Jurisdiction ADOT information 0 29.592 3.06% .950 28.113ADOT Jurisdiction ADOT information 0 10.590 1.09% .500 5.295ADOT Jurisdiction ADOT information 0 18.501 1.91% .500 9.251ADOT Jurisdiction ADOT information 0 12.195 1.26% .500 6.097ADOT Jurisdiction ADOT information 0 14.029 1.45% .500 7.015
• Summary for SR-12----------------------------------------------------------------------------------------------------------------------------ResidentiaL Low Density o year to Waters of U.S. 0 135.711 14.03% 68.818 0.507Residential Low Density o year to Retention Basin 0 60.622 6.27"1. 33.342 0.550ResidentiaL Low Density 5 year on Lot 0 49.349 5.10% .0~9 0.002ResidentiaL Low Density 100 year on Lot 0 4.169 .43% .004 0.001
• Residential Low Density 100 year on Site 0 28.778 2.98% .029 0.001ResidentiaL High Density 0 year to Waters of U.S. 0 55.614 5.75% 34.849 0.627Residential High Density 100 year on Site 0 89.890 9.29% .090 0.001Comm Res Office, Church o year to Waters of U.S. 0 9.635 1.00% 8.543 0.887Comm Res Office, Church 100 year on Site 0 22.355 2.31% .022 0.001Comm Res Office, Church Detention Area on Site 0 .839 .09% .797 0.950
• Comm HoteLs,Restraunts o year to Waters of U.S. 0 1.526 .16% 1.450 0.950Comm HoteLs,Restraunts 100 year on Site 0 3.756 .39% .004 0.001Comm MaLL, Strp Cntr,Ret o year to Waters of U.S. 0 .420 .04% .399 0.950Comm MaLL, Strp Cntr,Ret 100 year on Site 0 15.451 1.60% .015 0.001Comm Auto,Gas Sta,Pk Lot o year to Waters of U.S. 0 .710 .07% .675 0.951Comm Auto,Gas Sta,Pk Lot 5 year on Site 0 1.414 .15% .003 0.002
• Comm Auto,Gas Sta,Pk Lot 100 year on Lot 0 .409 .04% .000 0.000Comm Auto,Gas Sta,Pk Lot 100 year on Site 0 14.060 1.45% .014 0.001Ind Park-light 100 year on Site 0 1.826 .19% .002 0.001Ind Large Site-Medium o year to Waters of U.S. 0 2.826 .29% .261 0.092Ind Large Site-Medium 100 year on Site 0 .883 .09% .001 0.001Ind Foundry,ELec,PPs 100 year on Site 0 .974 .10% .001 0.001
• AgricuLtural o year to Waters of U.S. 0 1.621 •17"1. .324 0.200AgriculturaL 100 year on Site 0 20.520 2.12% .021 0.001Vacant Land o year to Waters of U.S. 0 2.183 .23% .437 0.200Vacant Land 5 year on Site 0 3.095 .32% .006 0.002Vacant Land 100 year on Site 0 5.790 .60% .006 0.001Vacant Land Retention Basin 0 .595 .06% .595 1.000
• Vacant Land Vacant Land 0 yr Retentio 0 11.399 1.18% 1.832 0.161Vacant Land Vacant Land 100 yr Retent 0 54.029 5.59% .054 0.001Open Space, Pks, Golf 100 year on Site 0 4.231 .44% .004 0.001Open Space, Pks, GoLf Retention Basin 0 6.206 .64% 6.206 1.000Open Space, School 100 year on Site 0 9.370 .97"1. .009 0.001ADOT Jurisdiction ADOT information 0 168.343 17.41% 97.488 0.579
•
•

•ID
SR-12
Outfall Name
ADOT TUNNEL
Area
967.183
Outfall Size
18 FT DIA
Parent Id
• Landuse
Total Street Area
Retention Population Area
o 178.584
% Tot Area
18.46%
COE CA
169.655
Avg COE
0.950
•
I.
•
•
•
•
•
•
•
SR-12 Drainage Area Totals
o 967.183 100.00% 426.055 0.441

•10 Outfall Name Area Outfall Size Parent Id
•SR-12-A PRICE &ALAMEDA
Landuse Retention
11.228
Population Area
2-18
% Tot Area COE CA
SR-12
Avg COE
•
•
•
•
•
•
•
•
Residential Low Density 100 year on LotResidential Low Density 100 year on Site
Summary for SR-12-A
Residential Low Density 100 year on LotResidential Low Density 100 year on SiteTotal Street Area
SR-12-A Drainage Area Totals
oo
ooo
o
3.0996.856
3.0996.8561.273
11.228
27.60%61.06%
27.60%61.06%11.33%
100.00%
.001
.001.003.007
.003
.0071.209
1.219
0.0010.0010.950
0.109

•ID
SR-16
Outfall Name
WEST OF PRE 1ST DRIVE
Area
182.471
Outfall Size
96
Parent Id
• Landuse Retention Population Area % Tot Area COE CA Avg COE---------------------------------------------------------------------------------------------------------.------------------Residential Low Density 100 year on Site 0 7.270 3.98% .001 .007Ind Foundry,Elec,PPs o year to Waters of U.S. 0 3.567 1.95% .200 .713Ind Foundry,Elec,PPs o year to Waters of U.S. 0 4.145 2.27% .200 .829Ind Foundry,Elec,PPs o year to Waters of U.S. 0 .461 0.25% .200 .092
• Ind Foundry,Elec,PPs 100 year on Site 0 1.001 0.55% .001 .001Ind Foundry,Elec,PPs 100 year on Site 0 9.486 5.20% .001 .009Agricultural 100 year on Site 0 17.226 9.44% .001 .017Vacant Land Vacant Land 0 yr Retentio 0 20.029 10.98% .250 5.007Vacant Land Vacant Land 0 yr Retentio 0 .672 0.37"" .200 .134Vacant Land Vacant Land 0 yr Retentio 0 3.789 2.08% .250 .947
I. Vacant Land vacant Land 0 yr Retentio 0 .612 0.34% .250 .153Vacant Land Vacant Land 0 yr Retentio 0 13.896 7.62% .250 3.474Vacant Land Vacant Land 0 yr Retentio 0 2.192 1.20% .250 .548Vacant Land Vacant Land 0 yr Retentio 0 1.448 0.79% .250 .362Vacant Land Vacant Land 0 yr Retentio 0 14.583 7.99% .250 3.646Vacant Land Vacant Land 0 yr Retentio 0 20.058 10.99% .200 4.012
• Vacant Land Vacant Land 0 yr Retentio 0 12.190 6.68% .250 3.048Vacant Land Vacant Land 0 yr Retentio 0 .870 0.48% .200 .174Municpal Fad l Hies o year to Waters of U.S. 0 22.405 12.28% .950 21.285
Summary for SR-16----------------------------------------------------------------------------------------------------------------------------
• Residential Low Density 100 year on Site 0 7.270 3.98% .007 0.001Ind Foundry,Elec,PPs o year to Waters of U.S. 0 8.173 4.48% 1.635 0.200Ind Foundry,Elec,PPs 100 year on Site 0 10.487 5.75% .010 0.001Agricultural 100 year on Site 0 17.226 9.44% .017 0.001Vacant Land Vacant Land 0 yr Retentio 0 90.338 49.51% 21.505 0.238Municpal Fad l Hies o year to Waters of U.S. 0 22.405 12.28% 21.285 0.950
• Total Street Area 0 26.572 14.56% 25.244 0.950
SR-16 Drainage Area Totals
-----------------------------------------------------------------------------------------------------------------------------0 182.471 100.00% 69.703 0.382
•
•
•
•

Landuse
•
•
ID
SR-17
Outfall Name
ADOT DRAIN
Retention
Area
38.023
Population Area
Outfall Size
36
%Tot Area COE CA
Parent Id
Avg COE
•
ADOT JurisdictionADOT Jurisdiction
Summary for SR-17
ADOT JurisdictionTotal Street Area
ADOT informationADOT information
ADOT information
oo
oo
32.2151.501
33.7154.308
84.73%3.95%
88.67"1.
11.33%
.500
.50016.107
.750
16.8584.092
0.5000.950
•
•
•
•
•
•
SR-17 Drainage Area Totals
o 38.023 100.00% 20.950 0.551

•ID OutfaL l Name Area Outfall Size Parent Id
SR-17-A 991 WWASHINGTON(V&P NURSERY) 36.751 ON-SIT RET SR-17
• Landuse Retention Population Area % Tot Area COE CA Avg COE
•
Vacant LandADOT Jurisdiction
Summary for SR-17-A
Vacant LandADOT JurisdictionTotal Street Area
Vacant Land 0 yr RetentioADOT information
Vacant Land 0 yr RetentioADOT information
oo
ooo
3.63510.064
3.63510.06423.052
9.89%27.38%
9.89%27.38%62.72%
.250
.500.909
5.032
.9095.032
21.899
0.2500.5000.950
•
•
•
•
•
•
•
SR-17-A Drainage Area Totals
o· 36.751 100.00% 27.840 0.758

•ID Outfall Name Area Outfall Size Parent Id
SR-17-B RED MOUNTAIN FREEWAY 19.386 NO OUTLET SR-17
• Landuse Retention Population Area % Tot Area COE CA Avg COE
Residential Low Density 100 year on Site 0 10.718 55.29% .001 .011Ind Foundry,Elec,PPs o year to Waters of U.S. 0 2.530 13.05% .200 .506Ind Foundry,Elec,PPs 100 year on Site 0 1.899 9.80% .001 .002Vacant Land Vacant Land 0 yr Retentio 0 4.177 21.55% .200 .835
• Summary for SR-17-B
Residential Low Density 100 year on Site 0 10.718 55.29% .011 0.001Ind Foundry,Elec,PPs o year to Waters of U.S. 0 2.530 13.05% .506 0.200Ind Foundry,Elec,PPs 100 year on Site 0 1.899 9.80% .002 0.001
• Vacant Land Vacant Land 0 yr Retentio 0 4.177 21.55% .835 0.200Total Street Area 0 .062 .32% .059 0.950
SR-17-B Drainage Area Totals
•
•
•
•
•
•
•
o 19.386 100.00% 1.413 0.073

•ID
SR-18
Outfall Name
PAPAGO CENTER
Area
370.315
Outfall Size
102
Parent Id
---._--------------------------------------------.-------------------------------------------------------------------.----------
• Landuse Retention Population Area % Tot Area COE CA Avg COE---------------------------------------------------------------------------------------------------------------------------_.Comm Res Office, Church o year to Waters of U.S. 0 6.135 1.66% .600 3.681Comm Res Office, Church o year to Waters of U.S. 0 6.856 1.85% .950 6.513Comm Res Office, Church o year to Waters of U.S. 0 7.525 2.03% .800 6.020Comm Res Office, Church o year to Waters of u.s. 0 2.665 0.72% .950 2.531
• Comm Res Office, Church 100 year on Site 0 14.516 3.92% .001 .015Ind Large Site-Medium o year to Waters of U.S. 0 44.518 12.02% .950 42.293Vacant Land o year to Waters of U.S. 0 4.744 1.28% 1.000 4.744Vacant Land 100 year on Site 0 2.428 0.66% .001 .002Vacant Land Vacant Land 0 yr Retentio 0 5.127 1.38% .250 1.282Vacant Land Vacant Land 0 yr Retentio 0 2.139 0.58% .250 .535
• Vacant Land Vacant Land 0 yr Retentio 0 17.857 4.82% .250 4.464Vacant Land Vacant Land 0 yr Retentio 0 3.232 0.87"" .250 .808Vacant Land Vacant Land 0 yr Retentio 0 .625 0.17"" .350 .219Vacant Land Vacant Land 0 yr Retentio 0 2.244 0.61% .350 .786Vacant Land Vacant Land 0 yr Retentio 0 7.326 1.98% .350 2.564
i Vacant Land Vacant Land 0 yr Retentio 0 15.562 4.20% .350 5.447I Vacant Land Vacant Land 0 yr Retentio 0 5.155 1.39% .250 1.289• Vacant Land Vacant Land 0 yr Retentio 0 16.848 4.55% .350 5.897
Vacant Land Vacant Land 0 yr Retentio 0 .317 0.09% .200 .063Open Space, Pks, Golf o year to Waters of U.S. 0 27.499 7.43% .550 15.124Open Space, Pks, Golf 100 year on Site 0 7.385 1.99% .001 .007Open Space, Pks, Golf 100 year on Site 0 47.902 12.94% .001 .048
• Open Space, Pks, Golf 100 year on Site 0 21.861 5.90% .001 .022Open Space, Pks, Golf 100 year on Site 0 19.987 5.40% .001 .020Open Space, Pks, Golf Detention Basin 0 2.225 0.60% 1.000 2.225Municpal Faci l ities 100 year on Site 0 15.801 4.27"" .001 .016
Summary for SR-18-----------------------------------------------------------------------------------------------------------------------------• Comm Res Office, Church o year to Waters of U.S. 0 23.181 6.26% 18.745 0.809Comm Res Office, Church 100 year on Site 0 14.516 3.92% .015 0.001Ind Large Site-Medium o year to Waters of U.S. 0 44.518 12.02% 42.293 0.950Vacant Land o year to Waters of U.S. 0 4.744 1.28% 4.744 1.000Vacant Land 100 year on Site 0 2.428 .66% .002 0.001
• Vacant Land Vacant Land 0 yr Retentio 0 76.432 20.64% 23.353 0.306Open Space, Pks, Golf o year to Waters of U.S. 0 27.499 7.43% 15.124 0.550Open Space, Pks, Golf 100 year on Site 0 97.135 26.23% .097 0.001Open Space, Pks, Golf Detention Basin 0 2.225 .60% 2.225 1.000Municpal Facilities 100 year on Site 0 15.801 4.27"" .016 0.001Total Street Area 0 61.836 16.70% 58.744 0.950
• SR-18 Drainage Area Totals------------------------------------------------------------------------------------------------------------------------------
0 370.315 100.00% 165.358 0.447
•
•
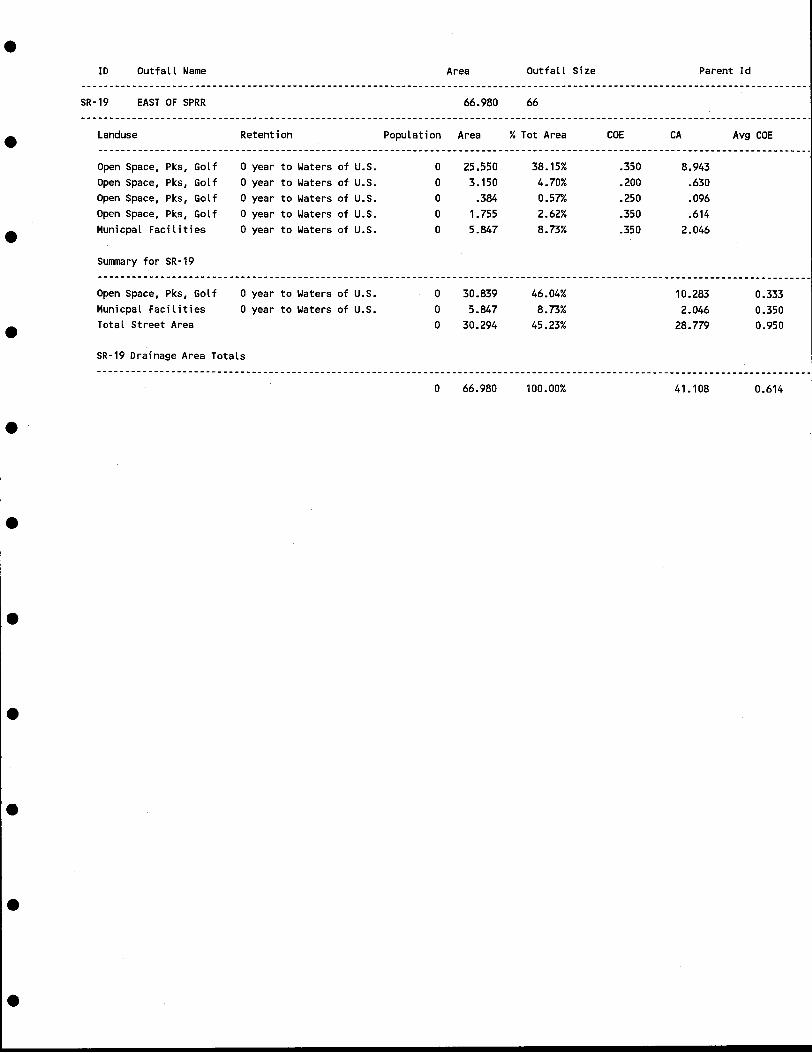
•ID
SR-19
Outfall Name
EAST OF SPRR
Area
66.980
Outfall Size
66
Parent Id
• Landuse Retention Population Area %Tot Area COE CA Avg COE
Open Space, Pks, Golf o year to Waters of u.S. 0 25.550 38.15% .350 8.943Open Space, Pks, Golf o year to Waters of u.S. 0 3.150 4.70% .200 .630Open Space, Pks, Golf o year to Waters of u.S. 0 .384 0.57"1. .250 .096Open Space, Pks, Golf o year to Waters of u.S. 0 1.755 2.62% .350 .614
• Municpal Facilities o year to Waters of u.S. 0 5.847 8.73% .350 2.046
Summary for SR-19
•Open Space, Pks, GolfMunicpal FacilitiesTotal Street Area
o year to Waters of u.S.o year to Waters of u.S.
ooo
30.8395.847
30.294
46.04%8.73%
45.23%
10.2832.046
28.779
0.3330.3500.950
•
•
•
•
•
•
SR-19 Drainage Area Totals
o 66.980 100.00% 41.108 0.614

Landuse
•
•
ID
SR-20
Outfall Name
NORTHEAST OF MILL AVENUE
Retention
Area
55.130
Population Area
Outfall Size
48
%Tot Area COE CA
Parent Id
Avg COE
•
Summary for SR-20
Municpal FacilitiesTotal Street Area
o year to Waters of U.S. oo
.00055.130
.00%100.00%
.00052.373
0.0000.950
•I
•
•
•
•
•
•
•
SR-20 Drainage Area Totals
o 55.130 100.00% 52.373 0.950

•ID
SR-21
Outfall Name
ADOT FREEWAY
Area
38.266
Outfall Size
TWIN 8X8 BOX
Parent Id
• Landuse Retention Population Area % Tot Area COE CA Avg COE
SR-21 Drainage Area Totals
•
•
•
•
•
•
•
•
•
Vacant LandVacant LandVacant Land
Summary for SR-21
Vacant LandVacant LandTotal Street Area
100 year on Site100 year on SiteVacant Land 0 yr Retentio
100 year on SiteVacant Land 0 yr Retentio
ooo
ooo
o
12.4794.640
.590
17.119.590
20.557
38.266
32.61%12.13%1.54%
44.74%1.54%
53.72%
100.00%
.001
.001
.300
.012
.005
.177
.017
.17719.529
19.723
0.0010.3000.950
0.515

•ID Outfall Name Area Outfall Size Parent Id
Landuse•SR-22 COLLEGE AVENUE COT
Retention
28.240
Population Area
48
%Tot Area COE CA Avg COE
Residential High Density 0 year to Waters of U.S. 0 1.406 4.98% .950 1.336Residential High Density 0 year to Waters of U.S. 0 9.331 33.04% .750 6.998Residential High Density 100 year on Site 0 2.969 10.51% .001 .003Residential High Density 100 year on Site 0 3.937 13.94% .001 .004
• Comm Res Office, Church 100 year on Site 0 3.375 11.95% .001 .003Ind Park-l ight o year to Waters of U.S. 0 1.238 4.38% .950 1.176Vacant Land Vacant Land 0 yr Retentio 0 .814 2.88% .200 .163
Summary for SR-22
~.
•
•
•
•
•
•
•
Residential High Density 0 year to Waters of U.S.Residential High Density 100 year on SiteComm Res Office, Church 100 year on SiteInd Park-light 0 year to Waters of U.S.Vacant Land Vacant Land 0 yr RetentioTotal Street Area
SR-22 Drainage Area Totals
oooooo
o
10.7376.9063.3751.238
.8145.170
28.240
38.02%24.45%11.95%4.38%2.88%
18.31%
100.00%
8.334.007.003
1.176.163
4.912
14.595
0.7760.0010.0010.9500.2000.950
0.517

•ID Outfall Name Area Outfall Size Parent Id
-------------------------------------------------------------------------------------------------------------------------------
------------------------------------------------------------------------------------------------------------------------------ ..
SR-22-A COLLEGE AVENUE ADOT
• Landuse Retention
10.916
Population Area
48
%Tot Area COE CA
SR-22
Avg COE--------------------------------------------------------------------------------------------------------------------------_.-
Summary for SR-22-A
---------------------------------------------------------------------------------------------------------------------------_ .
•Vacant LandTotal Street Area
Vacant Land 0 yr Retentio oo
.00010.916
•00%100.00%
.00010.370
0.0000.950
SR-22-A Drainage Area Totals
-----------------------------------------------------------------------------------------------------------------------------
•
•
•
•
•
•
•
•
o 10.916 100.00% 10.370 0.950

•ID Outfall Name Area Outfall Size Parent Id
-------------------------------------------------------------------------------------------------------------------------------
----------------------------------------------------------------------------------------------------------------------------
------------------------------------------------------------------------------------------------------------------------------Landuse•
SR-23 WEST OF SCOTTSDALE ROAD
Retention
23.196
Population Area
42
%Tot Area COE CA Avg COE
Summary for SR-23
------------------------------------_.'._------------------------------------------------------------------------------------
•Vacant LandTotal Street Area
Vacant Land 0 yr Retentio oo
.00023.196
.00%100.00%
.00022.036
0.0000.950
SR-23 Drainage Area Totals
----------------------------------------------------------------------------------------------------------------------------
•
•
•
•I
I
•
•
•
•
o 23.196 100.00% 22.036 0.950

•ID Outfall Name Area Outfall Size Parent Id
~----------------------------------------------------- ------------------------------------------------------------------------_.
SR-24 MARY ST STORM DRAIN 906.282 TWIN 8X8 BOX
-----------------------------------------------------------------------------------------------------------------------_.-------
• Landuse Retention Population Area % Tot Area COE CA Avg COE-------------------------------------------------------------------------------------------------------------------------- ...
Residential Low Density o year to Waters of U.S. 0 3.435 0.38% •460 1.580
Residential Low Density o year to Waters of U.S. 0 2.195 0.24% .480 1.053
Residential Low Density o year to Waters of U.S. 0 1.751 0.19% .480 .840
Residential Low Density o year to Waters of U.S. 0 1.881 0.21% .510 .959
• Residential Low Density o year to Waters of U.S. 0 2.159 0.24% .480 1.036
Residential Low Density o year to Waters of U.S. 0 4.392 0.48% .480 2.108
Residential Low Density o year to Waters of U.S. 0 1.048 0.12% .480 .503
Residential Low Density o year to Waters of U.S. 0 2.725 0.30% .480 1.308
Residential Low Density o year to Waters of U.S. 0 .324 0.04% .350 .113Residential Low Density o year to Waters of U.S. 0 3.546 0.39% .480 1.702
• Residential Low Density o year to Waters of U.S. 0 .553 0.06% .550 .304Residential Low Density o year to Waters of U.S. 0 4.774 0.53% .480 2.291Residential Low Density o year to Waters of U.S. 0 1.303 0.14% .550 .717Residential Low Density o year to Waters of U.S. 0 .923 0.10% .550 .508
Residential Low Density o year to Waters of U.S. 0 2.686 0.30% .480 1.289
Residential Low Density o year to Waters of U.S. 0 1.168 0.13% .550 .642
• Residential Low Density o year to Waters of U.S. 0 1.701 0.19% .550 .936
Residential Low Density o year to Waters of U.S. 0 .635 0.07% .550 .349
Residential Low Density o year to Waters of U.S. 0 2.387 0.26% .480 1.146Residential Low Density o year to Waters of U.S. 0 3.985 0.44% .480 1.913
Residential Low Density o year to Waters of U.S. 0 4.009 0.44% .480 1.924Residential Low Density o year to Waters of U.S. 0 .765 0.08% .550 .421
• Residential Low Density o year to Waters of U.S. 0 1.386 0.15% .550 .762Residenti al Low Density o year to Waters of U.S. 0 .337 0.04% .550 .185Residential Low Density o year to Waters of U.S. 0 3.563 0.39% .480 1. 710Residential Low Density o year to Waters of U.S. 0 .284 0.03% .550 .156Residential Low Density o year to Waters of U.S. 0 2.193 0.24% .460 1.009Residential Low Density o year to Waters of U.S. 0 1.575 0.17",( .460 .724
• Residential Low Density o year to Waters of U.S. 0 4.885 0.54% .460 2.247Residential Low Density o year to Waters of U.S. 0 2.480 0.27",( .460 1.141Residential Low Density o year to Waters of U.S. 0 3.604 0.40% .460 1.658Residential Low Density o year to Waters of U.S. 0 2.298 0.25% .420 .965Residential Low Density o year to Waters of U.S. 0 3.280 0.36% .460 1.509Residential Low Density o year to Waters of U.S. 0 6.374 0.70% .460 2.932I. Residential Low Density o year to Waters of U.S. 0 11.915 1.31% .460 5.481Residential Low Density o year to Waters of U.S. 0 5.862 0.65% .460 2.696Residential Low Density o year to Waters of U.S. 0 4.927 0.54% .460 2.266Residential Low Density o year to Waters of U.S. 0 1.364 0.15% .480 .655Residential Low Density o year to Waters of U.S. 0 1.626 0.18% .480 .780Residential Low Density o year to Waters of U.S. 0 .657 0.07",( .550 .361
I. Residential Low Density o year to Waters of U.S. 0 .202 0.02% .550 .111Residential Low Density o year to Waters of U.S. 0 .653 0.07% .540 .353Residential Low Density o year to Waters of U.S. 0 4.897 0.54% .420 2.057Residential Low Density o year to Waters of U.S. 0 6.097 0.67% .420 2.561Residential Low Density o year to Waters of U.S. 0 3.553 0.39% .420 1.492Residential Low Density o year to Waters of U.S. 0 .238 0.03% .450 .107
• Res ident ial Low Density o year to Waters of U.S. 0 .088 0.01% .900 .079Residential Low Density o year to Waters of U.S. 0 6.742 0.74% .420 2.831Residential Low Density o year to Waters of U.S. 0 6.593 0.73% .420 2.769Residential Low Density o year to Waters of U.S. 0 5.472 0.60% .420 2.298
•

•10 Outfall Name Area Outfall Size Parent Id
-------------------------------------------------------------------------------------------------------------------------------SR-24 MARY ST STORM DRAIN 906.282 TWIN 8X8 BOX------------------------------------------------------------------------------------------------------------------------------_.
• Landuse Retention Population Area % Tot Area COE CA Avg COE---------------------------.---------------------------------------------.-------------------------------------------------.-Residential Low Density o year to Waters of u.s. 0 5.424 0.60% .420 2.278Residential Low Density o year to Waters of u.s. 0 3.390 0.37"1. .420 1.424Residential Low Density o year to Waters of u.s. 0 3.393 0.37"1. .420 1.425Residential Low Density o year to Waters of u.s. 0 2.101 0.23% .420 .883
• Residential Low Density o year to Waters of u.s. 0 4.890 0.54% .420 2.054Residential Low Density o year to Waters of u.s. 0 18.659 2.06% .380 7.090Residential Low Density o year to Waters of u.s. 0 3.718 0.41% .450 1.673
Residential Low Density o year to Waters of u.S. 0 3.697 0.41% .470 1.738
Residential Low Density o year to Waters of u.s. 0 3.712 0.41% .550 2.041Residential Low Density o year to Waters of u.S. 0 3.362 0.37% .660 2.219
• Residential Low Density o year to Waters of u.s. 0 .437 0.05% .530 .231Residential Low Density o year to Waters of u.s. 0 5.221 0.58% .460 2.402Residential Low Density o year to Waters of u.s. 0 10.278 1.13% .420 4.317Residential Low Density o year to Waters of u.s. 0 6.105 0.67% .420 2.564Residential Low Density o year to Waters of u.s. 0 6.085 0.67"1. .420 2.556Residential Low Density o year to Waters of u.S. 0 5.989 0.66% .420 2.515
• Residential Low Density o year to Waters of u.s. 0 5.984 0.66% .420 2.513Residential Low Density o year to Waters of u.s. 0 2.987 0.33% .420 1.255Residential Low Density o year to Waters of u.s. 0 3.554 0.39% .420 1.493Residential Low Density o year to Waters of u.s. 0 6.883 0.76% .420 2.891Residential Low Density o year to Waters of u.s. 0 5.481 0.60% .420 2.302Residential Low Density o year to Waters of u.S. 0 .530 0.06% .420 .223
• Residential Low Density o year to Waters of u.S. 0 .366 0.04% .560 .205Residential Low Density o year to Waters of u.S. 0 .223 0.02% .560 .125Residential Low Density o year to Waters of u.s. 0 4.962 0.55% .510 2.531Residential Low Density o year to Waters of u.s. 0 .445 0.05% .400 .178Residential Low Density o year to Waters of u.S. 0 .444 0.05% .420 .187Residential Low Density o year to Waters of u.S. 0 .391 0.04% .420 .164
• Residential Low Density o year to Waters of u.s. 0 .186 0.02% .350 .065Residential Low Density o year to Waters of u.s. 0 3.320 0.37"1. .480 1.593Residential Low Density o year to Waters of U.S. 0 1.234 0.14% .480 .593Residential Low Density o year to Waters of u.s. 0 2.319 0.26% .550 1.276Residential Low Density o year to Waters of u.s. 0 2.178 0.24% .540 1.176Residential Low Density o year to Waters of u.s. 0 3.019 0.33% .550 1.661
• Residential Low Density o year to Waters of u.s. 0 2.242 0.25% .530 1.188Residential Low Density o year to Waters of u.s. 0 1.958 0.22% .500 .979Residential Low Density o year to Waters of u.s. 0 5.359 0.59% .570 3.055Residential Low Density o year to Waters of u.s. 0 5.457 0.60% .430 2.346Residential Low Density o year to Waters of u.s. 0 .177 0.02% .920 .163Residential Low Density o year to Waters of u.s. 0 .325 0.04% .350 .114
I. Residential Low Density 5 year on Site 0 .172 0.02% .002 .000Residential Low Density 5 year on Site 0 .174 0.02% .002 .000Residential Low Density 5 year on Site 0 .186 0.02% .002 .000Residential Low Density 5 year on Site 0 1.738 0.19% .002 .003Residential Low Density 5 year on Site 0 .184 0.02% .002 .000Residential Low Density 5 year on Site 0 .175 0.02% .002 .000
• Residential Low Density 5 year on Site 0 .175 0.02% .002 .000Residential Low Density 100 year on Lot 0 3.542 0.39% .001 .004Residential Low Density 100 year on Lot 0 2.749 0.30% .001 .003Residential Low Density 100 year on Lot 0 1.828 0.20% .001 .002
•

•ID Outfall Name Area Outfall Size Parent Id
------------------------------------------------------------------------------------------------------------------------.-----_.SR-24 MARY ST STORM DRAIN 906.282 TWIN 8X8 BOX-----------------------------------------------------------------------------------------------------------------------------_.-
• Landuse Retention Population Area % Tot Area COE CA Avg COE-----------------------------------------------------------------------------------------------------------------------------Residential Low Density 100 year on Lot 0 3.520 0.39% .001 .004
Residential Low Density 100 year on Site 0 1.828 0.20% .001 .002
Residential Low Density 100 year on Site 0 .199 0.02% .001 .000
Residential Low Density 100 year on Site 0 .673 o. or;. .001 .001
• Residential Low Density 100 year on Site 0 2.329 0.26% .001 .002
Residential Low Density Vacant Land 5 yr Retentio 0 1.108 0.12% .002 .002
Residential High Density 0 year to Waters of u.S. 0 3.151 0.35% .910 2.867
Residential High Density 0 year to Waters of u.S. 0 1.077 0.12% .900 .969Residential High Density 0 year to Waters of u.S. 0 1.643 0.18% .900 1.479
Residential High Density 0 year to Waters of u.S. 0 17.241 1.90% .850 14.655
• Residential High Density 0 year to Waters of u.S. 0 8.566 0.95% .800 6.853Residential High Density 0 year to Waters of u.S. 0 23.077 2.55% .900 20.769Residential High Density 0 year to Waters of u.S. 0 .425 0.05% .900 .383
Residential High Density 0 year to Waters of u.S. 0 .726 0.08% .900 .654
Residential High Density 0 year to Waters of U.S. 0 .867 0.10% .950 .824
Residential High Density 5 year on Lot 0 1.685 0.19% .002 .003
• Residential High Density 5 year on Site 0 4.788 0.53% .002 .010Comm Res Office, Church o year to Waters of u.S. 0 .733 0.08% .950 .696Comm Res Office, Church o year to Waters of u.S. 0 1.215 0.13% .950 1. 154Comm Res Office, Church o year to Waters of u.S. 0 .138 0.02% .950 .131Comm Res Office, Church o year to Waters of u.S. 0 .444 0.05% .400 .178
Comm Res Office, Church o year to Waters of u.S. 0 .137 0.02% .950 .130
• Comm Res Office, Church o year to Waters of u.S. 0 .780 0.09% .950 .741Comm Res Office, Church o year to Waters of u.S. 0 1.023 0.11% .950 .972Comm Res Office, Church o year to Waters of U.S. 0 2.425 0.2r;. .800 1.940Comm Res Office, Church o year to Waters of u.S. 0 1.124 0.12% .200 .225Comm Res Office, Church o year to Waters of u.S. 0 .442 0.05% .950 .420Comm Res Office, Church o year to Waters of u.S. 0 .882 0.10% .950 .838
• Comm Res Office, Church 5 year on Site 0 .849 0.09"10 .002 .002Comm Res Office, Church 100 year on Site 0 1.127 0.12% .001 .001Comm Res Office, Church 100 year on Site 0 .360 0.04% .001 .000Comm Hotels,Restraunts o year to Waters of u.S. 0 1.600 0.18% .950 1.520Comm Hotels,Restraunts o year to Waters of u.S. 0 .371 0.04% .950 .353Comm Hotels,Restraunts o year to Waters of U.S. 0 1.447 0.16% .950 1.375
• Comm Hotels,Restraunts o year to Waters of u.S. 0 .434 0.05% .950 .412Comm Hotels,Restraunts o year to Waters of U.S. 0 .217 0.02% .950 .206Comm Hotels,Restraunts o year to Waters of U.S. 0 .308 0.03% .950 .293Comm Hotels,Restraunts o year to Waters of u.s. 0 .429 0.05% .950 .407Comm Hotels,Restraunts 100 year on Site 0 .519 0.06% .001 .001Comm Mall, Strp Cntr,Ret 0 year to Waters of u.S. 0 7.324 0.81% .950 6.958I. Comm Mall, Strp Cntr,Ret 0 year to Waters of u.S. 0 10m 0.20% .950 1.688Comm Mall, Strp Cntr,Ret 0 year to Waters of u.S. 0 .366 0.04% .950 .348Comm Mall, Strp Cntr,Ret 0 year to Waters of u.s. 0 .149 0.02% .950 .142Comm Mall, Strp Cntr,Ret 0 year to Waters of u.S. 0 .181 0.02% .950 .172Comm Mall, Strp Cntr,Ret 0 year to Waters of u.S. 0 1.406 0.16% .950 1.336Comm Mall, Strp Cntr,Ret 0 year to Waters of u.s. 0 .149 0.02% .950 .142
• Comm Mall, Strp Cntr,Ret 0 year to Waters of u.S. 0 .503 0.06% .950 .478Comm Mall, Strp Cntr,Ret 5 year on Site 0 .508 0.06% .002 .001Comm Mall, Strp Cntr,Ret 5 year on Site 0 .384 0.04% .002 .001Comm Mall, Strp Cntr,Ret 5 year on Site 0 6.188 0.68% .002 .012
•

•10 Outfall Name Area Outfall Size Parent Id
-------------------------------------------------------------------------------------------------------------------------------,SR-24 MARY ST STORM DRAIN 906.282 TWIN 8X8 BOX
--------------------------------------------------------------------------------------------------------------------------------
• Landuse Retention Population Area % Tot Area CaE CA Avg CaE----------------------------------------------------------------------------------------------------------------------------Comm Mall, Strp Cntr,Ret 5 year on Site 0 7.801 0.86% .002 .016
Comm Mall, Strp Cntr,Ret 5 year on Site 0 4.261 0.47"1. .002 .009
Comm Mall, Strp Cntr,Ret 5 year on Site 0 7.736 0.85% .002 .015
Comm Mall, Strp Cntr,Ret 5 year on Site 0 7.330 0.81% .002 .015
• Comm Mall, Strp Cntr,Ret 5 year on Site 0 .306 0.03% .002 .001
Comm Mall, Strp Cntr,Ret 100 year on Site 0 .290 0.03% .001 .000
Comm Auto,Gas Sta,Pk Lot o year to Waters of U.S. 0 1.822 0.20% .950 1.730
Comm Auto,Gas Sta,Pk Lot o year to Waters of U.S. 0 .644 0.07% .950 .612
Comm Auto,Gas Sta,Pk Lot o year to Waters of U.S. 0 .531 0.06% .950 .504
Comm Auto,Gas Sta,Pk Lot o year to Waters of U.S. 0 .446 0.05% .950 .424
• Comm Auto,Gas Sta,Pk Lot o year to Waters of U.S. 0 .000 0.00% .950 .000
Comm Auto,Gas Sta,Pk Lot o year to Waters of U.S. 0 9.615 1.06% .750 7.211Comm Auto,Gas Sta,Pk Lot o year to Waters of U.S. 0 .179 0.02% .950 .170Comm Auto,Gas Sta,Pk Lot o year to Waters of U.S. 0 .458 0.05% .950 .435Comm Auto,Gas Sta,Pk Lot o year to Waters of U.S. 0 .208 0.02% .950 .198
Comm Auto,Gas Sta,Pk Lot o year to Waters of U.S. 0 .217 0.02% .410 .089
• Comm Auto,Gas Sta,Pk Lot o year to Waters of U.S. 0 .364 0.04% .470 .171Comm Auto,Gas Sta,Pk Lot o year to Waters of U.S. 0 .790 0.09% .950 .750Comm Auto,Gas Sta,Pk Lot o year to Waters of U.S. 0 3.724 0.41% .800 2.979Comm Auto,Gas.Sta,Pk Lot o year to Waters of U.S. 0 1.351 0.15% .950 1.283
Comm Auto,Gas Sta,Pk Lot o year to Waters of U.S. 0 .881 0.10% .950 .837
Comm Auto,Gas Sta,Pk Lot o year to Waters of U.S. 0 .551 0.06% .950 .523
• Comm Auto,Gas Sta,Pk Lot o year to Waters of U.S. 0 .445 0.05% .950 .422Comm Auto,Gas Sta,Pk Lot o year to Waters of U.S. 0 .964 0.11% .820 .791Comm Auto,Gas Sta,Pk Lot o year to Waters of U.S. 0 .717 0.08% .950 .681Comm Auto,Gas Sta,Pk Lot o year to Waters of U.S. 0 .974 0.11% .950 .925Comm Auto,Gas Sta,Pk Lot o year to Waters of U.S. 0 .179 0.02% .950 .171Comm Auto,Gas Sta,Pk Lot o year to Waters of U.S. 0 1.353 0.15% .950 1.286
• Comm Auto,Gas Sta,Pk Lot o year to Waters of U.S. 0 .653 0.07% .950 .620Comm Auto,Gas Sta,Pk Lot o year to Waters of U.S. 0 .464 0.05% .950 .441Comm Auto,Gas Sta,Pk Lot 5 year on Lot 0 .644 0.07% .002 .001Comm Auto,Gas Sta,Pk Lot 5 year on Site 0 .684 0.08% .002 .001
Comm Auto,Gas Sta,Pk Lot 5 year on Site 0 1.710 0.19% .002 .003Comm Auto,Gas Sta,Pk Lot 5 year on Site 0 4.514 0.50% .002 .009
• Comm Auto,Gas Sta,Pk Lot 100 year on Lot 0 .516 0.06% .001 .001Comm Auto,Gas Sta,Pk Lot 100 year on Site 0 .699 0.08% .001 .001Comm Auto,Gas Sta,Pk Lot 100 year on Site 0 .636 0.07"1. .001 .001Comm Auto,Gas Sta,Pk Lot 100 year on Site 0 1.114 0.12% .001 .001Comm Auto,Gas Sta,Pk Lot 100 year on Site 0 .222 0.02% .001 .000Comm Auto,Gas Sta,Pk Lot 100 year on Site 0 .358 0.04% .001 .000
• Ind Large Site-Medium 5 year on Site 0 2.118 0.23% .002 .004Ind Foundry,Elec,PPs o year to Waters of U.S. 0 .069 0.01% .950 .066Ind Foundry,Elec,PPs o year to Waters of U.S. 0 .243 0.03% .950 .231Ind Foundry,Elec,PPs o year to Waters of U.S. 0 2.494 0.28% .950 2.369Ind Foundry,Elec,PPs o year to Waters of U.S. 0 1.128 0.12% .350 .395Ind Foundry,Elec,PPs o year to Waters of U.S. 0 .546 0.06% .950 .519
• Ind Foundry,Elec,PPs o year to Waters of U.S. 0 .517 0.06% .850 .440Ind Foundry,Elec,PPs o year to Waters of U.S. 0 .458 0.05% .950 .435Ind Foundry,Elec,PPs o year to Waters of U.S. 0 .436 0.05% .950 .414Ind Foundry,Elec,PPs o year to Waters of U.S. 0 .314 0.03% .950 .298
•

•ID Outfall Name Area Outfall Size Parent Id
-~ ..-------------------------------------------------- -------------------------------------------------------------------------SR-24 MARY ST STORM DRAIN 906.282 TWIN 8X8 BOX-------------------------------------------------------------------------------------------------------------------------------
• Landuse Retention Population Area %Tot Area COE CA Avg COE---------------------------------------------------------------------------------------------------------------------------_.Ind Foundry,Elec,PPs o year to Waters of u.S. 0 2.697 0.30% .950 2.562Ind Foundry,Elec,PPs o year to Waters of u.S. 0 2.034 0.22% .350 .712Ind Foundry,Elec,PPs o year to Waters of u.S. 0 1.099 0.12% .950 1.044Ind Foundry,Elec,PPs o year to Waters of u.S. 0 .174 0.02% .900 .156
• Ind Foundry,Elec,PPs 5 year on Site 0 3.041 0.34% .002 .006Agricultural 5 year on Site 0 5.299 0.58% .002 .011vacant Land o year to Waters of u.S. 0 .665 0.07"1. .200 .133Vacant Land 5 year on Site 0 9.264 1.02% .002 .019Vacant Land Vacant Land 0 yr Retentio 0 .568 0.06% .200 .114Vacant Land Vacant Land 0 yr Retentio 0 .657 0.07"1. .200 .131
• Vacant Land Vacant Land 0 yr Retentio 0 1.114 0.12% .200 .223Vacant Land Vacant Land 0 yr Retentio 0 .172 0.02% .200 .034Vacant Land Vacant Land 0 yr Retentio 0 1.038 0.11% .450 .467Vacant Land Vacant Land 0 yr Retentio 0 .169 0.02% .200 .034Vacant Land Vacant Land 0 yr Retentio 0 .170 0.02% .200 .034Vacant Land Vacant Land 0 yr Retentio 0 .867 0.10% .250 .217
• Vacant Land Vacant Land 0 yr Retentio 0 .318 0.04% .200 .064Vacant Land Vacant Land 0 yr Retentio 0 .549 0.06% .200 .110Vacant Land Vacant Land 5 yr Retentio 0 .697 0.08% .002 .001Vacant Land Vacant Land 100 yr Retent 0 26.815 2.96% .001 .027Open Space, Pks, Golf o year to Waters of u.S. 0 8.140 0.90% .350 2.849Open Space, Pks, Golf o year to Waters of u.S. 0 44.651 4.93% .300 13.395
• Open Space, Pks, Golf o year to Waters of u.S. 0 25.120 2.77"1. .300 7.536Open Space, Pks, Golf o year to Waters of u.S. 0 .625 0.07"1. .250 .156Open Space, Pks, Golf o year to Waters of u.S. 0 25.794 2.85% .250 6.449Open Space, Pks, Golf Detention Basin 0 4.296 0.47"1. 1.000 4.296Open Space, Pks, Golf Detention Basin 0 1.879 0.21% 1.000 1.879Open Space, Pks, Golf Detention Basin 0 1.545 0.17"1. 1.000 1.545:. Open Space, Pks, Golf Detention Basin 0 3.892 0.43% 1.000 3.892Open Space, Pks, Golf Detention Basin 0 1.883 0.21% 1.000 1.883Open Space, Pks, Golf Detention Basin 0 2.104 0.23% .001 .002Open Space, School o year to Waters of u.S. 0 .476 0.05% .950 .453Open Space, School 100 year on Site 0 10.354 1.14% .001 .010Open Space, School 100 year on Site 0 22.308 2.46% .001 .022
• Municpal Facilities o year to Waters of u.S. 0 .162 0.02"1. .950 .154Municpal Facit ities o year to Waters of U.S. 0 13.707 1.51% .350 4.797Municpal Facilities o year to Waters of u.S. 0 26.285 2.90% .900 23.656ADOT Jurisdiction ADOT information 0 19.951 2.20% .500 9.976
Summary for SR-24
• -----------------------------------------------------------------------------------------------------------------------------Residential Low Density o year to Waters of u.S. 0 287.976 31.78% 131.226 0.456Residential Low Density 5 year on Site 0 2.804 .31% .006 0.002Residential Low Density 100 year on Lot 0 11.639 1.28% .012 0.001Residential Low Density 100 year on Site 0 5.028 .55% .005 0.001Residential Low Density Vacant Land 5 yr Retentio 0 1.108 .12% .002 0.002
• Residential High Density 0 year to Waters of u.S. 0 56.773 6.26% 49.452 0.871Residential High Density 5 year on Lot 0 1.685 .19% .003 0.002
•

Landuse
•
•
10
SR-24
Outfall Name
MARY ST STORM DRAIN
Retention
Area
906.282
Population Area
Outfall Size
TWIN 8X8 BOX
%Tot Area COE CA
Parent Id
Avg COE
•
•
•
•
•
Residential High Density 5 year on Site 0 4.788 .53% .010 0.002Comm Res Office, Church o year to Waters of U.S. 0 9.343 1.03% 7.425 0.795Comm Res Office, Church 5 year on Site 0 .849 .09% .002 0.002Comm Res Office, Church 100 year on Site 0 1.486 .16% .001 0.001Comm Hotels,Restraunts o year to Waters of U.S. 0 4.806 .53% 4.566 0.950Comm Hotels,Restraunts 100 year on Site 0 .519 .06% .001 0.002Comm Mall, Strp Cntr,Ret 0 year to Waters of u.S. 0 11.855 1.31% 11.263 0.950Comm Mall, Strp Cntr,Ret 5 year on Site 0 34.514 3.81% .069 0.002Comm Mall, Strp Cntr,Ret 100 year on Site 0 .290 .03% .000 0.000Comm Auto,Gas Sta,Pk Lot 0 year to Waters of u.S. 0 27.529 3.04% 23.254 0.845Comm Auto,Gas Sta,Pk Lot 5 year on Lot 0 .644 .07"1. .001 0.002Comm Auto,Gas Sta,Pk Lot 5 year on Site 0 6.909 .76% .014 0.002Comm Auto,Gas Sta,Pk Lot 100 year on Lot 0 .516 .06% .001 0.002Comm Auto,Gas Sta,Pk Lot 100 year on Site 0 3.030 .33% .003 0.001Ind Large Site-Medium 5 year on Site 0 2.118 .23% .004 0.002Ind Foundry,Elec,PPs o year to Waters of u.S. 0 12.208 1.35% 9.640 0.790Ind Foundry,Elec,PPs 5 year on Site 0 3.041 .34% .006 0.002Agricultural 5 year on Site 0 5.299 .58% .011 0.002Vacant Land o year to Waters of u.S. 0 .665 .07"1. .133 0.200Vacant Land 5 year on Site 0 9.264 1.02% .019 0.002Vacant Land Vacant Land 0 yr Retentio 0 5.621 .62% 1.427 0.254Vacant Land Vacant Land 5 yr Retentio 0 .697 .08% .001 0.001Vacant Land Vacant Land 100 yr Retent 0 26.815 2.96% .027 ·0.001Open Space, Pks, Golf o year to Waters of U.S. 0 104.331 11.51% 30.385 0.291Open Space, Pks, Golf Detention Basin 0 15.599 1.72% 13.497 0.865Open Space, School o year to Waters of u.S. 0 .476 .05% .453 0.952Open Space, School 100 year on Site 0 32.662 3.60% .033 0.001Municpal Facilities o year to Waters of u.S. 0 40.154 4.43% 28.608 0.712ADOT Jurisdiction ADOT information 0 19.951 2.20% 9.976 0.500Total Street Area 0 153.290 16.91% 145.626 0.950
SR-24 Drainage Area Totals
-----------------------------------------------------------------------------------------------------------------------------
•
•
•
•
o 906.282 100.00% 467.162 0.515

Landuse
•
•
10
SR-25
Outfall Name
TEMPE REFLECTIONS
Retention
Area
6.848
Population Area
Outfall Size
NO OUTLET
%Tot Area COE CA
Parent Id
Avg COE
•
•
•
•
•
•
•
•
Comm Mall, Strp Cntr,Ret 0 year to Waters of u.S.Comm Mall, Strp Cntr,Ret 0 year to Waters of u.S.
Summary for SR-25
Comm Mall, Strp Cntr,Ret 0 year to Waters of u.S.Total Street Area
SR-25 Drainage Area Totals
oo
oo
o
4.7062.142
6.848.000
6.848
68.72%31.28%
100.00%.00%
100.00%
.890
.9504.1892.035
6.223.000
6.223
0.9090.950
0.909

•ID OutfaL L Name Area OutfaLL Size Parent Id
-------------------------------------------------------------------------------------------------------,------------------------
----------------------------------------------------------------------------------------------------------------------------
---------------------------------------------------------------------------------------------------------------~---------------
Landuse•SR-26 CLUB RIO
Retention
14.900
PopuLation Area
NO OUTLET
% Tot Area CaE CA Avg CaE
----------------------------------------------------------------------------------------------------------------------------•
Comm HoteLs,RestrauntsVacant Land
Summary for SR-26
Comm HoteLs,RestrauntsVacant LandTotaL Street Area
Detention Area on SiteVacant Land 100 yr Retent
Detention Area on SiteVacant Land 100 yr Retent
oo
ooo
8.7226.179
8.7226.179- .001
58.54%41.47"10
58.54%41.47%
- .01%
.950
.0018.286
.006
8.286.006
- .001
0.9500.0010.950
--------------------------------------~--~~~~--~~-~-------------------~~~~~~-~~~-~~~----------~~~~~-~-~-------------~----~~~.•
•
•
•
•
•
•
•
SR-26 Drainage Area TotaLs
o 14.900 100.00% 8.291 0.556

•ID
SR-27
Outfall Name
PAPAGO PARK LAKE
Area
175.635
outfall Size
30
Parent Id
• Landuse Retention Population Area % Tot Area CaE CA Avg CaE--------------------------------------------------------------------------------------------------------------------------- ..
Residential Low Density o year to Waters of u.S. 0 8.739 4.98% .350 3.059Vacant Land 100 year on Site 0 .329 0.19% .001 .000Vacant Land 100 year on Site 0 2.454 1.40% .001 .002Vacant Land Vacant Land 0 yr Retentio 0 11.304 6.44% .300 3.391
• Open Space, Pks, Golf o year to Waters of U.S. 0 39.786 22.65% .350 13.925Open Space, Pks, Golf o year to Waters of u.S. 0 29.360 16.72% .350 10.276Open Space, Pks, Golf o year to Waters of u.S. 0 28.887 16.45% .350 10.110Open Space, Pks, Golf o year to Waters of u.S. 0 36.673 20.88% .200 7.335Municpal Facil ities o year to Waters of V.S. 0 .960 0.55% .950 .912Municpal Faci l ities o year to Waters of u.S. 0 1.721 0.98% .900 1.549
• Summary for SR-27
Residential Low Density o year to Waters of u.S. 0 8.739 4.98% 3.059 0.350Vacant Land 100 year on Site 0 2.783 1.58% .003 0.001Vacant Land Vacant Land 0 yr Retentio 0 11.304 6.44% 3.391 0.300
• Open Space, Pks, Golf o year to Waters of u.S. 0 134.705 76.70% 41.646 0.309Municpal Facilities o year to Waters of u.S. 0 2.681 1.53% 2.461 0.918Total Street Area 0 15.423 8.78% 14.652 0.950
SR-27 Drainage Area Totals
•
•
•
•
•
o 175.635 100.00% 65.212 0.371

•ID Outfall Name Area Outfall Size Parent Id
-------------------------------------------------------------------------------------------------------------------------------~
ro-D1 48TH STREET 596.864 102in. x 90in.------------_.---------------------------------------------------------------------------------------------------------------_ ..
• Landuse Retention Population Area % Tot Area COE CA Avg COE---------------.----------.--------------------------------------------------------------------------------------------------Residential Low Density o year to Waters of u.S. 0 1.561 0.26% .410 .640Residential Low Density o year to Retention Basin 0 4.361 0.73% .420 1.832Residential High Density Detention Basin 0 .000 0.00% .001 .000Residential High Density Detention Basin 0 51.637 8.65% .001 .052
• Comm Res Office, Church 5 year on Lot 0 2.315 0.39% .002 .005Comm Res Office, Church 5 year on Lot 0 2.998 0.50% .002 .006Comm Res Office, Church 5 year on Site 0 9.968 1.67% .002 .020Comm Res Office, Church 100 year on Site 0 13.892 2.33% .001 .014Comm Res Office, Church 100 year on Site 0 4.226 0.71% .001 .004Comm Res Office, Church 100 year on Site 0 3.965 0.66% .001 .004
• Comm Res Office, Church 100 year on Site 0 5.269 0.88% .001 .005Comm Res Office, Church 100 year on Site 0 3.303 0.55% .001 .003Comm Res Office, Church 100 year on Site 0 4.250 0.71% .001 .004Comm Res Office, Church 100 year on Site 0 2.298 0.39% .001 .002Comm Res Office, Church 100 year on Site 0 1.319 0.22% .001 .001Comm Hotels,Restraunts o year to Retention Basin 0 2.203 0.37"" .850 1.873
• Comm Hotels,Restraunts 100 year on Site 0 .407 0.07"" .001 .000Comm Hotels,Restraunts 100 year on Site 0 1.254 0.21% .001 .001Comm Hotels,Restraunts 100 year on Site 0 1.175 0.20% .001 .001Comm Hotels,Restraunts 100 year on Site 0 .712 0.12% .001 .001Comm Hotels,Restraunts Detention Area on Site 0 9.992 1.67"" .950 9.492Comm Mall, Strp Cntr,Ret 100 year on Site 0 7.603 1. 27"" .001 .008
• Comm Mall, Strp Cntr,Ret 100 year on Site 0 1.772 0.30% .001 .002Comm Mall, Strp Cntr,Ret 100 year on Site 0 1.444 0.24% .001 .001Comm Mall, Strp Cntr,Ret Detention Basin 0 8.167 1.37"" .950 7.759Comm Auto,Gas Sta,Pk Lot 100 year on Site 0 .363 0.06% .001 .000Comm Auto,Gas Sta,Pk Lot 100 year on Site 0 .582 0.10% .001 .001Ind Park-light o year to Waters of u.S. 0 7.178 1.20% .950 6.819
• Ind Park-light 5 year on Lot 0 4.367 0.73% .002 .009Ind Park-l ight 5 year on Site 0 .629 0.11% .002 .001Ind Park-light 5 year on Site 0 9.212 1.54% .002 .018Ind Park-l ight 5 year on Site 0 2.607 0.44% .002 .005Ind Park-light 5 year on Site 0 .525 0.09% .002 .001Ind Park-light 100 year on Site 0 1.053 0.18% .001 .001
• Ind Park-light 100 year on Site 0 .517 0.09% .001 .001Ind Park-light 100 year on Site 0 3.741 0.63% .001 .004Ind Park-l ight 100 year on Site 0 2.112 0.35% .001 .002Ind Park-light 100 year on Site 0 .612 0.10% .001 .001Ind Park-light 100 year on Site 0 2.963 0.50% .001 .003Ind Park-light 100 year on Site 0 .855 0.14% .001 .001
• Ind Park-light 100 year on Site 0 1.014 0.17"" .001 .001Ind Park-light 100 year on Site 0 .868 0.15% .001 .001Ind Park-light 100 year on Site 0 1.986 0.33% .001 .002Ind Park-light 100 year on Site 0 4.259 0.71% .001 .004Ind Park-light 100 year on Site 0 1.130 0.19% .001 .001Ind Park-light 100 year on Site 0 .688 0.12% .001 .001
• Ind Park-light 100 year on Site 0 1.747 0.29% .001 .002Ind Park-light 100 year on Site 0 1.045 0.18% .001 .001Ind Park-light 100 year on Site 0 .903 0.15% .001 .001Ind Park-light 100 year on Site 0 2.645 0.44% .001 .003
•

•10 Outfall Name Area Outfall Size Parent Id
-----------------------------------------------------------------------------------------------------------------------------.-TO-01 48TH STREET 596.864 102in. x 90in.-------------------------------------------------------------------------------------------------------------------------------
• Landuse Retention Population Area % Tot Area COE CA Avg COE----------------------------------------------------------------------------------------------------------------------------Ind Park-light 100 year on Site 0 6.264 1.05% .001 .006Ind Park-light 100 year on Site 0 1.424 0.24% .001 .001
Ind Park-light 100 year on Site 0 .835 0.14% .001 .001
Ind Park-light 100 year on Site 0 4.101 0.69% .001 .004
• Ind Park-light 100 year on Site 0 3.463 0.58% .001 .003Ind Park-light 100 year on Site 0 3.230 0.54% .001 .003Ind Park-light 100 year on Site 0 .949 0.16% .001 .001Ind Park-light 100 year on Site 0 1.131 0.19% .001 .001Ind Park-light 100 year on Site 0 1.198 0.20% .001 .001Ind Park-light 100 year on Site 0 .935 0.16% .001 .001
• Ind Park-light 100 year on Site 0 .992 0.17"-' .001 .001Ind Park-l ight 100 year on Site 0 .918 0.15% .001 .001Ind Park-l ight 100 year on Site 0 2.064 0.35% .001 .002Ind Park-light 100 year on Site 0 1.033 0.17"-' .001 .001Ind Park-light 100 year on Site 0 .528 0.09% .001 .001Ind Park-l ight 100 year on Site 0 7.608 1.27"-' .001 .008
• Ind Park-light 100 year on Site 0 1.343 0.23% .001 .001Ind Park-light 100 year on Site 0 5.175 0.87% .001 .005Ind Large Site-Medium 100 year on Site 0 13.183 2.21% .001 .013Ind Large Site-Medium 100 year on Site 0 14.227 2.38% .001 .014Vacant Land o year to Retention Basin 0 .772 0.13% .250 .193Vacant Land 5 year on Site 0 3.248 0.54% .002 .006
• Vacant Land 100 year on Site 0 .585 0.10% .001 .001Vacant Land 100 year on Site 0 1.427 0.24% .001 .001Vacant Land 100 year on Site 0 1.080 0.18% .001 .001Vacant Land 100 year on Site 0 18.573 3.11% .001 .019Vacant Land 100 year on Site 0 .494 0.08% .001 .000Vacant Land 100 year on Site 0 2.144 0.36% .001 .002
• Vacant Land 100 year on Site 0 .928 0.16% .001 .001Vacant Land 100 year on Site 0 1.267 0.21% .001 .001Vacant Land 100 year on Site 0 1.739 0.29% .001 .002Vacant Land Vacant Land 100 yr Retent 0 .955 0.16% .001 .001Vacant Land Vacant Land 100 yr Retent 0 2.897 0.49% .001 .003Vacant Land Vacant Land 100 yr Retent 0 9.552 1.60% .001 .010
• Vacant Land Vacant Land 100 yr Retent 0 3.904 0.65% .001 .004Vacant Land Vacant Land 100 yr Retent 0 14.843 2.49% .001 .015Vacant Land Vacant Land 100 yr Retent 0 8.565 1.44% .001 .009Vacant Land Vacant Land 100 yr Retent 0 3.556 0.60% .001 .004Municpal Facilities o year to Waters of u.S. 0 2.718 0.46% .200 .544Muni cpa l Faci l ities o year to Waters of u.S. 0 21.151 3.54% .000 .000
• Municpal Faci l ities 100 year on Site 0 23.113 3.87"-' .001 .023Municpal Facilities 100 year on Site 0 12.261 2.05% .001 .012Municpal Facilities 100 year on Site 0 5.607 0.94% .001 .006Municpal Faci lities 100 year on Site 0 34.876 5.84% .001 .035
Summary for TO-01
• ---------------------------------------------------------------------------------------------------------------------------_.Residential Low Oensity o year to Waters of u.S. 0 1.561 .26% .640 0.410
•

•ID
TD-01
Outfall Name
48TH STREET
Area
596.864
Outfall Size
102in. x 90in.
Parent Id
• Landuse Retention Population Area %Tot Area COE CA Avg COE----------------------------------------------------------------------------------------------------------------------------Residential Low Density o year to Retention Basin 0 4.361 .73% 1.832 0.420Residential High Density Detention Basin 0 51.637 8.65% .052 0.001Comm Res Office, Church 5 year on Lot 0 5.313 .89% .011 0.002Comm Res Office, Church 5 year on Site 0 9.968 1.67% .020 0.002
• Comm Res Office, Church 100 year on Site 0 38.523 6.45% .039 0.001Comm Hotels,Restraunts o year to Retention Basin 0 2.203 .37% 1.873 0.850Comm Hotels,Restraunts 100 year on Site 0 3.548 .59% .004 0.001Comm Hotels,Restraunts Detention Area on Site 0 9.992 1.67% 9.492 0.950
Comm Mall, Strp Cntr,Ret 100 year on Site 0 10.819 1.81% .011 0.001Comm Mall, Strp Cntr,Ret Detention Basin 0 8.167 1.37"1. 7.759 0.950
• Comm Auto,Gas Sta,Pk Lot 100 year on Site 0 .945 .16% .001 0.001Ind Park-light o year to Waters of U.S. 0 7.178 1.20% 6.819 0.950Ind Park-light 5 year on Lot 0 4.367 .73% .009 0.002
Ind Park-light 5 year on Site 0 12.973 2.17"1. .026 0.002Ind Park-light 100 year on Site 0 71.329 11.95% .071 0.001Ind Large Site-Medium 100 year on Site 0 27.409 4.59% .027 0.001
• Vacant Land o year to Retention Basin 0 .772 .13% .193 0.250Vacant Land 5 year on Site 0 3.248 .54% .006 0.002Vacant Land 100 year on Site 0 28.238 4.73% .028 0.001
Vacant Land Vacant Land 100 yr Retent 0 44.271 7.42% .044 0.001
Municpal Facilities o year to Waters of U.S. 0 23.869 4.00% .544 0.023Muni cpa l Facilities 100 year on Site 0 75.856 12.71% .076 0.001
• Total Street Area 0 150.317 25.18% 142.801 0.950
TD-01 Drainage Area Totals----------------------------------------------------------------------------------------------------------------------------
•
•
•
•
•
o 596.864 100.00% 172.378 0.289

•10 Outfall Name Area Outfall Size Parent Id
Population Area
TO-01-A 1-10 FRWY OET BASIN
• Landuse Retention
294.159 DET BASIN
% Tot Area COE
TO-01
CA Avg COE
Vacant Land o year to Waters of u.S. 0 4.956 1.68% .300 1.487
Vacant Land o year to Waters of u.S. 0 2.521 0.86% .350 .882
Vacant Land o year to Waters of U.S. 0 5.157 1.75% .300 1.547
Vacant Land o year to Waters of U.S. 0 2.138 0.73% .350 .748
• Vacant Land Vacant Land 0 yr Retentio 0 1.633 0.56% .250 .408AOOT Jurisdiction ADOT information 0 8.739 2.97"1. .950 8.302
Summary for TD-01-A
•Vacant LandVacant LandADOT JurisdictionTotal Street Area
o year to Waters of u.S.Vacant Land 0 yr RetentioADOT information
o 14.771o 1.633o 8.739o 269.016
5.02%.56%
2.97"1.91.45%
4.664.408
8.302255.565
0.3160.2500.9500.950
----------------------------------------------------.-----------------------------------------------------------------------~
•
•
•
•
•
•
•
TD-01-A Drainage Area Totals
o 294.159 100.00% 268.939 0.914

•10 Outfall Name Area Outfall Size Parent Id
TD-01-AA FOUNTAINHEAD SUBDIV 104.828 24 TO-01-A
• Landuse Retention Population Area % Tot Area COE CA Avg COE
•
•
Comm Res Office, Church 100 year on Site 0 4.980 4.75% .001 .005Comm Res Office, Church 100 year on Site 0 5.843 5.57% .001 .006Comm Res Office, Church 100 year on Site 0 12.402 11.83% .001 .012Comm Res Office, Church 100 year on Site 0 3.630 3.46% .001 .004Comm Res Office, Church 100 year on Site 0 3.672 3.50% .001 .004Comm Res Office, Church 100 year on Site 0 6.348 6.06% .001 .006Comm Hotels,Restraunts 100 year on Site 0 27.996 26.71% .001 .028Vacant Land 100 year on Site 0 6.653 6.35% .001 .007Vacant Land 100 year on Site 0 8.129 7.75% .001 .008Vacant Land 100 year on Site 0 6.130 5.85% .001 .006Vacant Land 100 year on Site 0 5.957 5.68% .001 .006Muni cpa l Facilities o year to Waters of U.S. 0 5.866 5.60% .200 1.173
Summary for TD-01-AA
Comm Res Office, Church 100 year on Site 0 36.874 35.18% .037 0.001
• Comm Hotels,Restraunts 100 year on Site 0 27.996 26.71% .028 0.001Vacant Land 100 year on Site 0 26.870 25.63% .027 0.001Municpal Facilities o year to Waters of U.S. 0 5.866 5.60% 1.173 0.200Total Street Area 0 7.222 6.89% 6.861 0.950
TD-01-AA Drainage Area Totals
•
•
•
•
•
•
o 104.828 100.00% 8.126 0.078

•lD Outfall Name Area Outfall Size Parent Id
TD-01-B PETERSON PARK SUBDIV 105.347 30 TO-01
• Landuse Retention Population Area % Tot Area COE CA Avg COE
.~~--------------------------------------------------- ----------------------------------------------------------------------
Residential Low Density o year to Waters of u.S. 0 9.190 8.72% .430 3.952Residential Low Density o year to Waters of u.S. 0 3.330 3.16% .430 1.432Residential Low Density o year to Waters of u.S. 0 2.912 2.76% .430 1.252Residential Low Density o year to Waters of u.S. 0 3.314 3.15% .430 1.425
• Residential Low Density o year to Waters of u.S. 0 1.313 1.25% .430 .565Residential Low Density o year to Waters of u.S. 0 2.261 2.15% .430 .972Residential Low Density o year to Waters of u.S. 0 2.358 2.24% .430 1.014Residential Low Density o year to Waters of u.S. 0 5.802 5.51% .430 2.495Residential Low Density o year to Waters of u.S. 0 3.305 3.14% .430 1.421Residential Low Density o year to Waters of u.S. 0 1.046 0.99% .430 .450
• Comm Res Office, Church o year to Waters of u.S. 0 1.019 0.97"1. .750 .764Comm Res Office, Church 100 year on Site 0 10.342 9.82% .001 .010Comm Res Offi ce, Church 100 year on Site 0 23.622 22.42% .001 .024Vacant Land 5 year on Site 0 3.508 3.33% .002 .007Vacant Land 100 year on Site 0 3.830 3.64% .001 .004Vacant Land Vacant Land 100 yr Retent 0 13.032 12.37% .001 .013
• Summary for TD-01-B--------------------------------------------------------------------------------------------------------------------------_ ..
Residential Low Density o year to Waters of u.S. 0 34.831 33.06% 14.978 0.430Comm Res Office, Church o year to Waters of u.S. 0 1.019 .97% .764 0.750Comm Res Office, Church 100 year on Site 0 33.964 32.24% .034 0.001
• Vacant Land 5 year on Site 0 3.508 3.33% .007 0.002Vacant Land 100 year on Site 0 3.830 3.64% .004 0.001Vacant Land Vacant Land 100 yr Retent 0 13.032 12.37"1. .013 0.001Total Street Area 0 15.163 14.39% 14.405 0.950
TD-01-B Drainage Area Totals
• --------------------------------------------------------------------------------------------------------------------------_ ..
0 105.347 100.00% 30.205 0.287
•
•
•
•

•ID Outfall Name Area Outfall Size Parent Id
TD-01-C SVOB PARK 204.883 DET BASIN TD-01---._-------------------------------------------------------------------------------------------------------------------------_.
• Landuse Retention Population Area % Tot Area COE CA Avg COE--------------------------------------------------------------------------------------------------------------------------_ ..
Residential Low Density o year to Retention Basin 0 1.692 0.83% .410 .694Residential Low Density o year to Retention Basin 0 .223 0.11% .420 .094Residential Low Density o year to Retention Basin 0 3.294 1.61% .410 1.350Residential Low Density o year to Retention Basin 0 8.195 4.00% .420 3.442
• Residential Low Density o year to Retention Basin 0 2.350 1.15% .420 .987Residential Low Density o year to Retention Basin 0 8.005 3.91% .410 3.282Residential Low Density o year to Retention Basin 0 3.130 1.53% .680 2.128Residential Low Density o year to Retention Basin 0 2.618 1.28% .680 1.780Residential Low Density o year to Retention Basin 0 8.400 4.10% .410 3.444Residential Low Density o year to Retention Basin 0 6.714 3.28% .410 2.753
• Residential Low Density o year to Retention Basin 0 3.724 1.82% .420 1.564Residential Low Density o year to Retention Basin 0 5.011 2.45% .420 2.105Residential Low Density o year to Retention Basin 0 7.299 3.56% .400 2.919Residential Low Density o year to Retention Basin 0 2.642 1.29% .410 1.083Residential Low Density o year to Retention Basin 0 4.765 2.33% .680 3.240Residential Low Density o year to Retention Basin 0 2.481 1.21% .420 1.042
• Residential Low Density o year to Retention Basin 0 3.666 1.79% .420 1.540Residential Low Density o year to Retention Basin 0 4.759 2.32% .420 1.999Residential Low Density 5 year on Lot 0 2.581 1.26% .002 .005Residential Low Density 5 year on Lot 0 .n1 0.38% .002 .002Residential Low Density 5 year on Lot 0 .882 0.43% .002 .002Residential Low Density 100 year on Site 0 .538 0.26% .001 .001
• Residential Low Density 100 year on Site 0 2.800 1.37"" .001 .003Residential High Density 100 year on Site 0 8.101 3.95% .001 .008Comm Res Office, Church 100 year on Site 0 9.663 4.72% .001 .010Comm Mall, Strp Cntr,Ret 100 year on Site 0 .985 0.48% .001 .001Vacant Land o year to Waters of U.S. 0 28.502 13.91% .200 5.700Vacant Land o year to Retention Basin 0 8.975 4.38% .200 1. 795
• Vacant Land 100 year on Site 0 6.011 2.93% .001 .006Vacant Land Vacant Land 0 yr Retentio 0 10.346 5.05% .250 2.587Open Space, Pks, Golf Detention Basin 0 6.692 3.27% 1.000 6.692
Summary for TD-01-C
----------------------------------------------------------------------------------------------------------------------------.
• Residential Low Density o year to Retention Basin 0 78.968 38.54% 35.447 0.449Residential Low Density 5 year on Lot 0 4.234 2.07"" .008 0.002Residential Low Density 100 year on Site 0 3.338 1.63% .003 0.001Residential High Density 100 year on Site 0 8.101 3.95% .008 0.001Comm Res Office, Church 100 year on Site 0 9.663 4.72% .010 0.001Comm Mall, Strp Cntr,Ret 100 year on Site 0 .985 .48% .001 0.001
• Vacant Land o year to Waters of U.S. 0 28.502 13.91% 5.700 0.200Vacant Land o year to Retention Basin 0 8.975 4.38% 1. 795 0.200Vacant Land 100 year on Site 0 6.011 2.93% .006 0.001Vacant Land Vacant Land 0 yr Retentio 0 10.346 5.05% 2.587 0.250Open Space, Pks, Golf Detention Basin 0 6.692 3.27% 6.692 1.000Total Street Area 0 39.068 19.07% 37.114 0.950
• TD-01-C Drainage Area Totals
-----------------------------------------------------------------------------------------------------------------------------0 204.883 100.00% 89.371 0.436
•

•ID
TD-03
Outfall Name
48th ST AND DITCH
Area
27.324
Outfall Size
10 x 4
Parent Id
• Landuse Retention Population Area % Tot Area COE CA Avg COE
•
•
•
•
Comm Hotels,Restraunts o year to Waters of u.S. 0 2.154 7.88% .700 1.508Comm Hotels,Restraunts 5 year on Site 0 1.700 6.22% .002 .003Ind Park-light o year to Waters of u.S. 0 1.367 5.00% .950 1.299Ind Park-light o year to Waters of u.S. 0 3.385 12.39% .950 3.215Ind Park-light o year to Waters of u.S. 0 1.107 4.05% .950 1.051Ind Park-light o year to Waters of u.S. 0 1.722 6.30% .950 1.636Ind Park-li ght o year to Waters of u.S. 0 2.445 8.95% .950 2.322Ind Park-light o year to Waters of u.S. 0 .842 3.08% .950 .800Ind Park-l ight 5 year on Site 0 3.157 11.55% .002 .006Ind Large Site-Medium o year to Waters of u.S. 0 2.458 9.00% .950 2.335Vacant Land Vacant Land 0 yr Retentio 0 .828 3.03% .200 .166
Summary for TD-03
Comm Hotels,Restraunts o year to Waters of u.S. 0 2.154 7.88% 1.508 0.700Comm Hotels,Restraunts 5 year on Site 0 1.700 6.22% .003 0.002Ind Park-li ght o year to Waters of u.S. 0 10.867 39. Trio 10.323 0.950Ind Park-light 5 year on Site 0 3.157 11.55% .006 0.002Ind Large Site-Medium o year to Waters of u.S. 0 2.458 9.00% 2.335 0.950Vacant Land Vacant Land 0 yr Retentio 0 .828 3.03% .166 0.200Total Street Area 0 6.160 22.54% 5.852 0.950
TD-03 Drainage Area Totals
•
•
•
•
•
o 27.324 100.00% 20.193 0.739

•ID Outfall Name Area Outfall Size Parent Id
-------------------------------------------------------------------------------------------------------------------------------TD-04 52nd St and DITCH 668.750 54-------------------------------------------------------------------------------------------------------------------------------
Landuse Retention Population Area % Tot Area COE CA Avg COE• ------------------------------------------------------------------------------------------------.---------------------------Residential Low Density o year to Waters of u.s. 0 .614 0.09"1. .390 .239
Residential Low Density o year to Waters of u.s. 0 .613 0.09% .390 .239
Residential Low Density o year to Waters of u.s. 0 3.225 0.48% .390 1.258Residential Low Density o year to Waters of u.s. 0 1.511 0.23% .390 .589Residential Low Density o year to Waters of u.s. 0 3.345 0.50% .390 1.305• Residential Low Density o year to Waters of u.s. 0 3.249 0.49% .390 1.267Residential Low Density o year to Waters of u.s. 0 .433 0.06% .320 .139
Residential Low Density o year to Waters of u.s. 0 .896 0.13% .390 .349
Residential Low Density o year to Waters of u.s. 0 .351 0.05% .390 .137
Residential Low Density o year to Waters of u.s. 0 1.381 0.21% .•390 .539
Residential Low Density o year to Waters of u.s. 0 2.962 0.44% .390 1.155• Residential Low Density o year to Waters of u.s. 0 3.252 0.49% .390 1.268Residential Low Density o year to Waters of U.S. 0 2.728 0.41% .390 1.064
Residential Low Density o year to Waters of u.s. 0 3.057 0.46% .390 1.192Residential Low Density o year to Waters of u.s. 0 3.065 0.46% .390 1.195Residential Low Density o year to Waters of u.s. 0 3.076 0.46% .390 1.200Residential Low Density o year to Waters of u.s. 0 3.087 0.46% .390 1.204• Residential Low Density o year to Waters of u.s. 0 3.880 0.58% .390 1.513Residential Low Density o year to Waters of u.s. 0 .966 0.14% .380 .367Residential Low Density o year to Waters of u.s. 0 .865 0.13% .800 .692Residential Low Density o year to Waters ~f u.s. 0 .262 0.04% .650 .171Residential Low Density o year to Waters of u.s. 0 .264 0.04% .650 .172Residential Low Density o year to Waters of u.s. 0 1.230 0.18% .650 .800• Residential Low Density o year to Waters of u.s. 0 1.384 0.21% .410 .567Residential Low Density o year to Waters of u.s. 0 2.994 0.45% .250 .749Residential Low Density o year to Waters of u.s. 0 2.461 0.37"1. .410 1.009Residential Low Density o year to Waters of u.s. 0 1.602 0.24% .650 1.042Residential Low Density o year to Waters of u.s. 0 .406 0.06% .470 . 191Residential Low Density o year to Waters of u.s. 0 5.947 0.89% .390 2.319• Residential Low Density o year to Waters of u.s. 0 3.016 0.45% .390 1.176Residential Low Density o year to Waters of u.s. 0 3.086 0.46% .390 1.203Residential Low Density o year to Waters of u.s. 0 2.923 0.44% .480 1.403Residential Low Density o year to Waters of u.S. 0 3.437 0.51% .410 1.409Residential Low Density o year to Waters of u.s. 0 3.393 0.51% .410 1.391Residential Low Density o year to Waters of u.s. 0 3.343 0.50% .410 1.370• Residential Low Density o year to Waters of u.s. 0 3.333 0.50% .410 1.367Residential Low Density o year to Waters of u.s. 0 3.635 0.54% .650 2.363Residential Low Density o year to Waters of u.s. 0 .873 0.13% .410 .358Residential Low Density o year to Waters of u.s. 0 1.939 0.29% .410 .795Residential Low Density o year to Waters of u.s. 0 1.223 0.18% .320 .391Residential Low Density o year to Waters of u.s. 0 1.172 0.18% .520 .609• Residential Low Density o year to Waters of u.s. 0 .n2 0.12% .390 .301Residential Low Density o year to Waters of u.s. 0 3.614 0.54% .410 1.482Residential Low Density o year to Waters of u.s. 0 .591 0.09% .410 .242Residential Low Density o year to Waters of u.s. 0 1.730 0.26% .410 .709Residential Low Density o year to Waters of u.s. 0 6.033 0.90% .410 2.474
• Residential Low Density o year to Waters of u.s. 0 1.559 0.23% .410 .639Residential Low Density o year to Waters of u.s. 0 1.047 0.16% .350 .366Residential Low Density o year to Waters of U.S. 0 .499 0.07"1. .650 .324Residential Low Density o year to Waters of u.s. 0 .562 0.08% .360 .202
•

•ID Outfall Name Area Outfall Size Parent Id
------------_.------------------------------------------------------------------------------------------------------------------TD-04 52nd St and DITCH 668.750 54
------------------------------------------------------------------------------------------------------------ -------------------~
• Landuse Retention Population Area % Tot Area COE CA Avg COE
-----------------------------------------------------------------------------------------------------------------------------Residential Low Density o year to Waters of u.s. 0 3.837 0.57"1. .370 1.420
Residential Low Density o year to Waters of u.s. 0 1.129 0.17"1. .370 .418
Residential Low Density o year to Waters of u.s. 0 .252 0.04% .450 .114Residential Low Density o year to Waters of u.s. 0 .288 0.04% .500 .144
• Residential Low Density o year to Waters of u.s. 0 3.351 0.50% .380 1.273Residential Low Density o year to Waters of u.s. 0 1.937 0.29% .410 .794Residential Low Density o year to Waters of u.s. 0 2.057 0.31% .410 .843Residential Low Density o year to Waters of u.s. 0 .939 0.14% .410 .385
Residential Low Density o year to Waters of u.s. 0 .200 0.03% .450 .090Residential Low Density o year to Waters of u.s. 0 5.943 0.89% .390 2.318
• Residential Low Density o year to Waters of u.s. 0 3.274 0.49% .390 1.277Residential Low Density o year to Waters of u.s. 0 3.081 0.46% .390 1.201Residential Low Density o year to Waters of u.s. 0 3.066 0.46% .380 1.165Residential Low Density o year to Waters of u.s. 0 3.271 0.49% .390 1.276Residential Low Density o year to Waters of u.s. 0 3.303 0.49% .390 1.288Residential Low Density o year to Waters of u.s. 0 1.725 0.26% .320 .552
• Residential Low Density 5 year on Lot 0 .310 0.05% .002 .001Residential Low Density 5 year on Lot 0 •191 0.03% .002 .000Residential Low Density 5 year on Lot 0 .218 0.03% .002 .000Residential Low Density 5 year on Lot 0 .182 0.03% .002 .000Residential Low Density 5 year on Lot 0 .194 0.03% .002 .000Residential Low Density 5 year on Site 0 .200 0.03% .002 .000
• Residential Low Density 100 year on Lot 0 5.182 0.77% .001 .005Residential Low Density 100 year on Lot 0 .339 0.05% .001 .000Residential Low Density 100 year on Lot 0 1.129 0.17"1. .001 .001Residential Low Density 100 year on Lot 0 .165 0.02% .001 .000Residential Low Density 100 year on Lot 0 .797 0.12% .001 .001Residential Low Density 100 year on Site 0 .192 0.03% .001 .000
• Residential Low Density 100 year on Site 0 .240 0.04% .001 .000Residential Low Density 100 year on Site 0 1.183 0.18% .001 .001Residential Low Density 100 year on Site 0 1.349 0.20% .001 .001Residential Low Density 100 year on Site 0 .451 0.07% .001 .000Residential Low Density 100 year on Site 0 .198 0.03% .001 .000Residential Low Density 100 year on Site 0 1.255 0.19% .001 .001
• Residential Low Density 100 year on Site 0 1.256 0.19% .001 .001Residential Low Density 100 year on Site 0 .296 0.04% .001 .000Residential Low Density 100 year on Site 0 .342 0.05% .001 .000Residential Low Density 100 year on Site 0 1.243 0.19% .001 .001Residential Low Density 100 year on Site 0 .240 0.04% .001 .000Residential Low Density 100 year on Site 0 2.020 0.30% .001 .002
• Residential Low Density 100 year on Site 0 3.080 0.46% .001 .003Residential Low Density 100 year on Site 0 .886 0.13% .001 .001Residential Low Density 100 year on Site 0 1.309 0.20% .001 .001Residential Low Density 100 year on Site 0 2.033 0.30% .001 .002Residential Low Density 100 year on Site 0 .189 0.03% .001 .000Residential Low Density 100 year on Site 0 1.415 0.21% .001 .001
• Residential Low Density 100 year on Site 0 1.046 0.16% .001 .001Residential Low Density 100 year on Site 0 1.718 0.26% .001 .002Residential Low Density 100 year on Site 0 .344 0.05% .001 .000Residential Low Density 100 year on Site 0 .507 0.08% .001 .001
•

•10 Outfall Name Area Outfall Size Parent Id
--------------------------------------------------------------------------------------------------------------------------------TD-04 52nd St and DITCH 668.750 54--------------------------------------------------------------------------------------------------------------------------------
Landuse Retention Population Area % Tot Area COE CA Avg COE• -----------------------------------------------------------------------------------------------------------------------------Residential Low Density 100 year on Site 0 .234 0.03% .001 .000Residential Low Density 100 year on Site 0 .409 0.06% .001 .000Residential Low Density 100 year on Site 0 .314 0.05% .001 .000Residential Low Density 100 year on Site 0 3.285 0.49% .001 .003Residential Low Density 100 year on Site 0 .234 0.03% .001 .000• Residential Low Density 100 year on Site 0 1.121 0.17"1. .001 .001Residential Low Density 100 year on Site 0 .915 0.14% .001 .001Residential Low Density 100 year on Site 0 .366 0.05% .001 .000Residential Low Density 100 year on Site 0 .243 0.04% .001 .000Residential Low Density 100 year on Site 0 .242 0.04% .001 .000Residential Low Density 100 year on Site 0 .310 0.05% .001 .000• Residential Low Density 100 year on Site 0 .441 0.07% .001 .000Residential Low Density 100 year on Site 0 2.361 0.35% .001 .002Residential Low Density 100 year on Site 0 1.178 0.18% .001 .001Residential Low Density 100 year on Site 0 3.673 0.55% .001 .004Residential Low Density 100 year on Site 0 .391 0.06% .001 .000Residential Low Density 100 year on Site 0 .240 0.04% .001 .000• Resident ial Low Density 100 year on Site 0 .765 0.11% .001 .001Residential Low Density 100 year on Site 0 3.336 0.50% .001 .003Residential Low Density 100 year on Site 0 3.673 0.55% .001 .004Residential Low Density 100 year on Site 0 1.021 0.15% .001 .001Residential Low Density 100 year on Site 0 .515 0.08% .001 .001Residential Low Density 100 year on Site 0 .758 0.11% .001 .001• Residential Low Density 100 year on Site 0 1.879 0.28% .001 .002Residential High Density 0 year to Waters of u.S. 0 .717 0.11% .800 .574Residential High Density 0 year to Waters of u.S. 0 2.643 0.40% .750 1.982Residential High Density 0 year to Waters of u.S. 0 .838 0.13% .750 .629Residential High Density 0 year to Waters of u.S. 0 1.800 0.27"1. .900 1.620Residential High Density 0 year to Waters of u.S. 0 1.671 0.25% .650 1.086• Residential High Density 0 year to Waters of U.S. 0 .320 0.05% .650 .208Residential High Density 0 year to Waters of u.S. 0 .161 0.02% .650 .104Residential High Density 0 year to Waters of u.S. 0 1.569 0.23% .650 1.020Residential High Density 0 year to Waters of u.S. 0 8.959 1.34% .900 8.063Residential High Density 0 year to Waters of u.S. 0 1.989 0.30% .820 1.631Residential High Density 0 year to Waters of u.S. 0 1.002 0.15% .650 .651• Residential High Density 0 year to Waters of u.S. 0 2.427 0.36% .800 1.941Residential High Density 0 year to Waters of u.S. 0 1.411 0.21% .850 1.199Residential High Density 0 year to Waters of u.S. 0 .515 0.08% .950 .490Residential High Density 0 year to Waters of u.S. 0 1.084 0.16% .950 1.030Residential High Density 0 year to Waters of u.S. 0 .428 0.06% .800 .342
• Residential High Density 0 year to Waters of u.S. 0 1.713 0.26% .750 1.285Residential High Density 0 year to Waters of u.S. 0 1.517 0.23% .750 1.138Residential High Density 0 year to Waters of u.S. 0 .474 0.07% .790 .374Residential High Density 0 year to Waters of u.S. 0 10.681 1.60% .950 10.147Residential High Density 0 year to Waters of u.S. 0 1.068 0.16% .950 1.015Residential High Density 0 year to Waters of u.S. 0 6.646 0.99% .800 5.317
• Residential High Density 0 year to Waters of u.S. 0 .782 0.12% .790 .618Residential High Density 0 year to Waters of u.S. 0 .963 0.14% .750 .722Residential High Density 0 year to Waters of U.S. 0 1.354 0.20% .950 1.286Residential High Density 0 year to Waters of u.S. 0 1.094 0.16% .950 1.039
•

•ID Outfall Name Area Outfall Size Parent Id
-----------------------------------------------------------------------------------------------------------------------------TD-04 52nd St and DITCH 668.750 54-------------------------------------------------------------------------------------------------------------------------------
• Landuse Retention Population Area % Tot Area COE CA Avg COE
------------------------------------------------------------------------------------------------------------ ----------------~
Residential High Density 0 year to Waters of u.s. 0 1.062 0.16% .750 .796
Residential High Density 0 year to Waters of u.s. 0 1.429 0.21% .950 1.357
Residential High Density 0 year to Waters of u.s. 0 .924 0.14% .950 .877Residential High Density 5 year on Lot 0 .710 0.11% .002 .001
• Residential High Density 5 year on Lot 0 3.652 0.55% .002 .007
Residential High Density 5 year on Lot 0 .497 0.07"1. .002 .001
Residential High Density 5 year on Lot 0 1.063 0.16% .002 .002
Residential High Density 5 year on Lot 0 .258 0.04% .002 .001
Residential High Density 5 year on Lot 0 1.179 0.18% .002 .002Residential High Density 5 year on Lot 0 .710 0.11% .002 .001
• Residential High Density 5 year on Site 0 .253 0.04% .002 .001
Residential High Density 5 year on Site 0 2.856 0.43% .002 .006
Residential High Density 5 year on Site 0 .628 0.09% .002 .001
Residential High Density 5 year on Site 0 .628 0.09% .002 .001
Residential High Density 5 year on Site 0 4.685 0.70% .002 .009
Residential High Density 5 year on Site 0 1.186 0.18% .002 .002
• Residential High Density 5 year on Site 0 .564 0.08% .002 .001
Residential High Density 5 year on Site 0 .214 0.03% .002 .000
Residential High Density 100 year on Site 0 .434 0.06% .001 .000
Residential High Density 100 year on Site 0 .241 0.04% .001 .000
Residential High Density 100 year on Site 0 1.024 0.15% .001 .001
Residential High Density 100 year on Site 0 .584 0.09% .001 .001
• Residential High Density 100 year on Site 0 3.472 0.52% .001 .003
Residential High Density 100 year on Site 0 1.728 0.26% .001 .002
Residential High Density 100 year on Site 0 1.868 0.28% .001 .002Residential High Density Detention Basin 0 .803 0.12% .950 .763Comm Res Office, Church o year to Waters of u.S. 0 .126 0.02% .900 .113Comm Res Office, Church o year to Waters of u.S. 0 .100 0.01% .950 .095
• Comm Res Office, Church o year to Waters of u.S. 0 .327 0.05% .950 .311Comm Res Office, Church o year to Waters of u.S. 0 .415 0.06% .900 .374Comm Res Office, Church o year to Waters of u.S. 0 .226 0.03% .500 .113Comm Res Office, Church o year to Waters of u.S. 0 .763 0.11% .800 .610Comm Res Office, Church o year to Waters of u.S. 0 .258 0.04% .900 .232Comm Res Office, Church o year to Waters of u.S. 0 1.003 0.15% .950 .953r. Comm Res Office, Church o year to Waters of u.S. 0 .156 0.02%· .950 .148Comm Res Office, Church o year to Waters of u.S. 0 .484 0.07% .900 .436Comm Res Office, Church o year to Waters of u.S. 0 .129 0.02% .900 .116Comm Res Office, Church o year to Waters of u.S. 0 .499 0.07"1. .950 .474Comm Res Office, Church o year to Waters of u.S. 0 4.047 0.61% .950 3.845Comm Res Office, Church o year to Waters of u.S. 0 .647 0.10% .950 .614
• Comm Res Office, Church o year to Waters of u.S. 0 .264 0.04% .950 .251Comm Res Office, Church 5 year on Site 0 1.704 0.25% .002 .003Comm Res Office, Church 5 year on Site 0 5.051 0.76% .002 .010Comm Res Office, Church 5 year on Site 0 9.076 1.36% .002 .018Comm Res Office, Church 100 year on Site 0 1.018 0.15% .001 .001Comm Res Office, Church 100 year on Site 0 20.534 3.07"1. .001 .021
• Comm Res Office, Church 100 year on Site 0 .572 0.09% .001 .001Comm Res Office, Church 100 year on Site 0 .436 0.07% .001 .000Comm Res Office, Church 100 year on Site 0 6.718 1.00% .001 .007Comm Res Office, Church 100 year on Site 0 .360 0.05% .001 .000
•

•10 Outfall Name Area Outfall Size Parent Id
------------------------------------------------------------------------------------------------------------.---------.-------_.TD-04 52nd St and DITCH 668.750 54--------------------------------------------------------------------------------.---------------------------.----------------_.-
Landuse Retention Population Area % Tot Area COE CA Avg COE• ---------------------------------------------------------------------------------------------------------------------------_ .
Comm Res Office, Church 100 year on Site 0 .320 0.05% •001 .000Comm Res Office, Church 100 year on Site 0 .328 0.05% .001 .000Comm Hotels,Restraunts o year to Waters of u.S. 0 .297 0.04% .900 .267
Comm Hotels,Restraunts 5 year on Lot 0 .918 0.14% .002 .002
Comm Hotels,Restraunts 5 year on Site 0 .127 0.02% .002 .000• Comm Hotels,Restraunts 100 year on Site 0 .587 0.09% .001 .001
Comm Hotels,Restraunts 100 year on Site 0 .631 0.09% .001 .001
Comm Mall, Strp Cntr,Ret o year to Waters of u.S. 0 2.006 0.30% .900 1.805
Comm Mall, Strp Cntr,Ret o year to Waters of u.S. 0 1.334 0.20% .950 1.268
Comm Mall, Strp Cntr,Ret o year to Waters of u.S. 0 1.126 0.17% .950 1.069
Comm Mall, Strp Cntr,Ret 5 year on Lot 0 1.561 0.23% .002 .003• Comm Mall, Strp Cntr,Ret 100 year on Site 0 2.690 0.40% .001 .003
Comm Mall, Strp Cntr,Ret 100 year on Site 0 1.296 0.19% .001 .001
Comm Auto,Gas Sta,Pk Lot 0 year to Waters of u.S. 0 1.035 0.15% .950 .983
Comm Auto,Gas Sta,Pk Lot 0 year to Waters of u.S. 0 .487 0.07"1. .950 .462
Comm Auto,Gas Sta,Pk Lot 0 year to Waters of u.S. 0 .572 0.09% .950 .543Comm Auto,Gas Sta,Pk Lot 0 year to Waters of u.S. 0 .384 0.06% .950 .365• Comm Auto,Gas Sta,Pk Lot 0 year to Waters of u.S. 0 9.164 1.37% .950 8.706Comm Auto,Gas Sta,Pk Lot 0 year to Waters of u.S. 0 .932 0.14% .950 .886Comm Auto,Gas Sta,Pk Lot 5 year on Site 0 2.283 0.34% .002 .005Comm Auto,Gas Sta,Pk Lot 100 year on Site 0 .546 0.08% .001 .001Comm Auto,Gas Sta,Pk Lot 100 year on Site 0 .803 0.12% .001 .001
• Ind Park-l ight o year to Waters of u.S. 0 .848 0.13% .950 .805Ind Park-light o year to Waters of u.S. 0 .960 0.14% .950 .912Ind Park-light o year to Waters of U.S. 0 .754 0.11% .950 .716Ind Park-l ight o year to Waters of u.S. 0 2.339 0.35% .950 2.222Ind Park-light o year to Waters of u.S. 0 .620 0.09% .950 .589Ind Park-li ght o year to Waters of u.S. 0 5.016 0.75% .950 4.766Ind Park-light o year to Waters of u.S. 0 2.573 0.38% .950 2.444• Ind Park-light o year to Waters of u.S. 0 .384 0.06% .950 .365Ind Park-light o year to Waters of u.S. 0 1.022 0.15% .950 .971Ind Park-light o year to Waters of u.S. 0 .956 0.14% .950 .908Ind Park-light o year to Waters of u.S. 0 4.472 0.67% .950 4.249Ind Park-l ight o year to Waters of u.S. 0 2.179 0.33% .950 2.070Ind Park-L; ght o year to Waters of u.S. 0 .179 0.03% .950 .170• Ind Park-light o year to Waters of u.S. 0 2.362 0.35% .950 2.244Ind Park-light o year to Waters of u.S. 0 1.046 0.16% .950 .994Ind Park-li ght o year to Waters of u.S. 0 1.395 0.21% .950 1.325Ind Park-L; ght o year to Waters of u.S. 0 5.140 0.77% .950 4.883Ind Park-light o year to Waters of u.S. 0 1.152 0.17"1. .950 1.094
• Ind Park-light o year to Waters of u.S. 0 1.019 0.15% .950 .968Ind Park-l ight 5 year on Site 0 .724 0.11% .002 .001Ind Park-light 5 year on Site 0 1.541 0.23% .002 .003Ind Park-light 5 year on Site 0 1.429 0.21% .002 .003Ind Park-light 5 year on Site 0 4.969 0.74% .002 .010Ind Park-li ght 100 year on Site 0 .511 0.08% .001 .001
• Ind Park-light 100 year on Site 0 3.802 0.57"1. .001 .004Ind Park-l ight 100 year on Site 0 .630 0.09% .001 .001Ind Park-light 100 year on Site 0 5.014 0.75% .001 .005Ind Park-l ight 100 year on Site 0 5.250 0.79% .001 .005
•

•10 Outfall Name Area Outfall Size Parent Id
---------------------------------------------------------------------------------------------------------------------------.-.-.TD-04 52nd St and DITCH 668.750 54------------------.----------------------------------------------------------------------------------------------------------_.-
• Landuse Retention Population Area % Tot Area COE CA Avg COE-----------------------------------------------------------------------------------------------------------------------------Ind Park-light 100 year on Site 0 1.020 0.15% .001 .001Ind Park-light 100 year on Site 0 .638 0.10% .001 .001Ind Large Site-Medium o year to Waters of u.S. 0 2.796 0.42% .950 2.656Ind Large Site-Medium o year to Waters of u.S. 0 4.430 0.66% .950 4.208
• Ind Large Site-Medium o year to Waters of u.S. 0 3.963 0.59% .950 3.764Ind Large Site-Medium 100 year on Site 0 2.744 0.41% .001 .003Vacant Land o year to Waters of u.S. 0 .436 0.07"-' .200 .087Vacant Land o year to Waters of u.S. 0 .239 0.04% .250 .060Vacant Land o year to Waters of u.S. 0 .256 0.04% .200 .051Vacant Land Vacant Land 0 yr Retentio 0 .265 0.04% .200 .053
• Vacant Land Vacant Land 0 yr Retentio 0 .517 0.08% .200 .103Vacant Land Vacant Land 0 yr Retentio 0 2.792 0.42% .200 .558Vacant Land Vacant Land 0 yr Retentio 0 1.798 0.27% .000 .000Vacant Land Vacant Land 0 yr Retentio 0 2.277 0.34% .200 .455Vacant Land Vacant Land 0 yr Retentio 0 1.820 0.27"-' .200 .364Vacant Land Vacant Land 0 yr Retentio 0 .142 0.02% .200 .028
• Vacant Land Vacant Land 0 yr Retentio 0 1.505 0.23% .200 .301Vacant Land Vacant Land 0 yr Retentio 0 .889 0.13% .200 .178Vacant Land Vacant Land 0 yr Retentio 0 .527 0.08% .200 .105Vacant Land Vacant Land 0 yr Retentio 0 .448 0.07% .200 .090Vacant Land Vacant Land 0 yr Retentio 0 .192 0.03% .200 .038Vacant Land Vacant Land 0 yr Retentio 0 .488 0.07"-' .200 .098
• Vacant Land Vacant Land 0 yr Retentio 0 .344 0.05% .200 .069Vacant Land Vacant Land 0 yr Retentio 0 1.790 0.27"-' .250 .447Vacant Land Vacant Land 0 yr Retentio 0 .167 0.02% .250 .042Vacant Land Vacant Land 0 yr Retentio 0 1.675 0.25% .250 .419Open Space, Pks, Golf 100 year on Site 0 9.064 1.36% .001 .009Open Space, Pks, Golf 100 year on Site 0 2.455 0.37"-' .001 .002
• Open Space, Pks, Golf 100 year on Site 0 4.270 0.64% .001 .004Open Space, School 100 year on Site 0 6.023 0.90% .001 .006Open Space, School 100 year on Site 0 14.753 2.21% .001 .015Open Space, School 100 year on Site 0 3.417 0.51% .001 .003Municpal Faci l ities o year to Waters of u.S. 0 2.122 0.32% .950 2.016
• Summary for TD-04-----------------------------------------------------------------------------------------------------------------------------Residential Low Density o year to Waters of u.S. 0 144.538 21.61% 59.064 0.409Residential Low Density 5 year on Lot 0 1.095 .16% .002 0.002Residential Low Density 5 year on Site 0 .200 .03% .000 0.000Residential Low Density 100 year on Lot 0 7.613 1.14% .008 0.001
• Residential Low Density 100 year on Site 0 50.694 7.58% .051 0.001Residential High Density 0 year to Waters of u.S. 0 57.241 8.56% 48.544 0.848Residential High Density 5 year on Lot 0 8.068 1.21% .016 0.002Residential High Density 5 year on Site 0 11.013 1.65% .022 0.002Residential High Density 100 year on Site 0 9.351 1.40% .009 0.001Residential High Density Detention Basin 0 .803 .12% .763 0.950
• Comm Res Office, Church o year to Waters of u.S. 0 9.445 1.41% 8.686 0.920Comm Res Office, Church 5 year on Site 0 15.831 2.37% .032 0.002
•

•ID Outfall Name Area Outfall Size Parent Id
------------------------------------------------------------------------------------------------------------------------------TD-04 52nd St and DITCH 668.750 54
----------------------------------------------------------------------------------------------------------------------------
---------------------------------------------------------------------------------------------------------------------------
• Landuse Retention Population Area % Tot Area COE CA Avg COE
•
•
•
•
Comm Res Office, Church 100 year on Site 0 30.287 4.53% .030 0.001Comm Hotels,Restraunts o year to Waters of U.S. 0 .297 .04% .267 0.899Comm Hotels,Restraunts 5 year on Lot 0 .918 .14% .002 0.002Comm Hotels,Restraunts 5 year on Site 0 .127 .02% .000 0.000Comm Hotels,Restraunts 100 year on Site 0 1.218 .18% .001 0.001Comm Mall, Strp Cntr,Ret 0 year to Waters of U.S. 0 4.466 .6.,.;' 4.142 0.927Comm Mall, Strp Cntr,Ret 5 year on Lot 0 1.561 .23% .003 0.002Comm Mall, Strp Cntr,Ret 100 year on Site 0 3.986 .60% .004 0.001Comm Auto,Gas Sta,Pk Lot 0 year to Waters of U.S. 0 12.574 1.88% 11.945 0.950Comm Auto,Gas Sta,Pk Lot 5 year on Site 0 2.283 .34% .005 0.002Comm Auto,Gas Sta,Pk Lot 100 year on Site 0 1.349 .20% .001 0.001Ind Park-l ight o year to Waters of U.S. 0 34.419 5.15% 32.698 0.950Ind Park-light 5 year on Site 0 8.664 1.30% .017 0.002Ind Park-l ight 100 year on Site 0 16.864 2.52% .017 0.001Ind Large Site-Medium o year to Waters of U.S. 0 11.188 1.67% 10.629 0.950Ind Large Site-Medium 100 year on Site 0 2.744 .41% .003 0.001Vacant Land o year to Waters of U.S. 0 .931 .14% .198 0.213Vacant Land Vacant Land 0 yr Retentio 0 17.635 2.64% 3.349 0.190Open Space, Pks, Golf 100 year on Site 0 15.788 2.36% .016 0.001Open Space, School 100 year on Site 0 24.192 3.62% .024 0.001Municpal Facilities o year to Waters of U.S. 0 2.122 .32% 2.016 0.950Total Street Area 0 159.245 23.81% 151.283 0.950
TD-04 Drainage Area Totals
-----------------------------------------------------------------------------------------------------------------------------
•
•
•
•
•
o 668.750 100.00% 333.847 ,0.499

•10 Outfall Name Area Outfall Size Parent Id
------------------------------------------------------------------------------------------------------------------------.-------TD-05 52nd ST and DITCH 2133.320 102------------------------------------------------------------------------------------------------------------------------------_.P
• Landuse Retention Population Area % Tot Area COE CA Avg COE
-----------------------------------------------------------------------------------------------------------------------------Residential Low Density o year to Waters of U.S. 0 .895 0.04% .350 .313
Residential Low Density o year to Waters of U.S. 0 1.081 0.05% .700 .757
Residential Low Density o year to Waters of u.s. 0 1.134 0.05% .700 .794
Residential Low Density o year to Waters of U.S. 0 1.324 0.06% .700 .927
• Residential Low Density o year to Waters of U.S. 0 .487 0.02% .700 .341Residential Low Density o year to Waters of U.S. 0 1.802 0.08% .700 1.261
Residential Low Density o year to Waters of U.S. 0 4.313 0.20% .390 1.682
Residential Low Density o year to Waters of U.S. 0 3.123 0.15% .430 1.343
Residential Low Density o year to Waters of U.S. 0 1.942 0.09% .350 .680Residential Low Density o year to Waters of U.S. 0 1.359 0.06% .480 .652
• Residential Low Density o year to Waters of u.s. 0 7.923 0.37"-' .410 3.249
Residential Low Density o year to Waters of u.s. 0 2.478 0.12% .390 .966Residential Low Density o year to Waters of u.s. 0 5.226 0.24% .390 2.038Residential Low Density o year to Waters of U.S. 0 5.228 0.25% .390 2.039Residential Low Density o year to Waters of u.s. 0 5.330 0.25% .390 2.079Residential Low Density o year to Waters of u.s. 0 .968 0.05% .650 .629
• Residential Low Density o year to Waters of u.s. 0 1.306 0.06% .350 .457
Residential Low Density o year to Waters of u.s. 0 2.735 0.13% .390 1.067Residential Low Density o year to· Waters of u.s. 0 .222 0.01% .410 .091Residential Low Density o year to Waters of u.s. 0 1.688 0.08% .410 .692Residential Low Density o year to Waters of u.s. 0 2.423 0.11% .410 .993Residential Low Density o year to Waters of u.s. 0 4.310 0.20% .410 1.767
• Residential Low Density o year to Waters of u.s. 0 7.684 0.36% .410 3.150Residential Low Density o year to Waters of u.s. 0 3.763 0.18% .480 1.806Residential Low Density o year to Waters of u.s. 0 1.094 0.05% .800 .875Residential Low Density o year to Waters of u.s. 0 4.029 0.19% .800 3.223Residential Low Density o year to Waters of u.s. 0 3.646 0.17% .800 2.917Residential Low Density o year to Waters of u.s. 0 1.639 0.08% .800 1.311
• Residential Low Density o year to Waters of u.s. 0 4.714 0.22% .590 2.781Residential Low Density o year to Waters of u.s. 0 3.099 0.15% .430 1.333Residential Low Density o year to Waters of u.s. 0 5.034 0.24% .390 1.963Residential Low Density o year to Waters of u.s. 0 1.285 0.06% .350 .450Residential Low Density o year to Waters of u.s. 0 2.650 0.12% .650 1.722Residential Low Density o year to Waters of u.s. 0 6.513 0.31% .650 4.233
• Residential Low Density o year to Waters of u.s. 0 2.300 0.11% .430 .989Residential Low Density o year to Waters of u.s. 0 4.432 0.21% .390 1.729Residential Low Density o year to Waters of u.s. 0 2.529 0.12% .830 2.099Residential Low Density o year to Waters of u.s. 0 2.352 0.11% .750 1.764Residential Low Density o year to Waters of u.s. 0 .255 0.01% .800 .204Residential Low Density o year to Waters of u.s. 0 4.004 0.19% .800 3.203
• Residential Low Density o year to Waters of u.s. 0 3.766 0.18% .410 1.544Residential Low Density o year to Waters of u.s. 0 6.135 0.29"-' .410 2.515Residential Low Density o year to Retention Basin 0 .373 0.02% .800 .298Residential Low Density 5 year on Lot 0 2.302 0.11% .002 .005Residential Low Density 5 year on Lot 0 7.747 0.36% .002 .015Residential Low Density 5 year on Lot 0 .884 0.04% .002 .002
• Residential Low Density 5 year on Lot 0 1.828 0.09% .002 .004Residential Low Density 5 year on Lot 0 1.074 0.05% .002 .002Residential Low Density 5 year on Lot 0 .285 0.01% .002 .001Residential Low Density 5 year on Lot 0 .036 0.00% .002 .000
•

•10 Outfa II Name Area Outfall Size Parent Id
._----------------------------------------------------------------------------------------------------------.-----------.-----_.TO-OS 52nd ST and DITCH 2133.320 102
-----------------------------------------~------------ ------------------------------------------------------.-----------------_.
• Landuse Retention Population Area % Tot Area COE CA Avg COE---------------------------------------------------------------------------------------------------------------------------.-Residential Low Density 5 year on Lot 0 4.991 0.23% .002 .010
Residential Low Density 5 year on Lot 0 2.789 0.13% .002 .006
Residential Low Density 5 year on Lot 0 2.839 0.13% .002 .006
Residential Low Density 5 year on Lot 0 1.880 0.09% .002 .004Residential Low Density 5 year on Lot 0 4.275 0.20% .002 .009• Residential Low Density 5 year on Lot 0 1.883 0.09% .002 .004
Residential Low Density 5 year on Lot 0 .036 0.00% .002 .000Residential Low Density 5 year on Lot 0 4.247 0.20% .002 .008Residential Low Density 5 year on Lot 0 6.957 0.33% .002 .014Residential Low Density 5 year on Lot 0 3.831 0.18% .002 .008Residential Low Density 5 year on Lot 0 4.430 0.21% .002 .009• Residential Low Density 5 year on Lot 0 2.658 0.12% .002 .005Residential Low Density 5 year on Lot 0 2.251 0.11% .002 .005
Residential Low Density 5 year on Lot 0 2.293 0.11% .002 .005Residential Low Density 5 year on Lot 0 4.975 0.23% .002 .010
Residential Low Density 5 year on Lot 0 6.705 0.31% .002 .013Residential Low Density 5 year on Lot 0 2.465 0.12% .002 .005• Residential Low Density 5 year on Lot 0 8.375 0.39% .002 .017Residential Low Density 5 year on Lot 0 2.429 0.11% .002 .005Residential Low Density 5 year on Lot 0 6.056 0.28% .002 .012Residential Low Density 5 year on Lot 0 3.607 0.17""'; .002 .007Residential Low Density 5 year on Lot 0 4.025 0.19% .002 .008Residential Low Density 5 year on Lot 0 4.441 0.21% .002 .009• Residential Low Density 5 year on Lot 0 1.629 0.08% .002 .003Residential Low Density 5 year on Lot 0 10.216 0.48% .002 .020Residential Low Density 5 year on Lot 0 1.346 0.06% .002 .003Residential Low Density 5 year on Lot 0 4.996 0.23% .002 .010Residential Low Density 5 year on Lot 0 2.199 0.10% .002 .004Residential Low Density 5 year on Lot 0 2.782 0.13% .002 .006• Residential Low Density 5 year on Lot 0 8.347 0.39% .002 .017Residential Low Density 5 year on Lot 0 7.161 0.34% .002 .014Residential Low Density 5 year on Lot 0 5.306 0.25% .002 .011Residential Low Density 5 year on Lot 0 .161 0.01% .002 .000Residential Low Density 5 year on Lot 0 .340 0.02% .002 .001
• Residential Low Density 5 year on Lot 0 5.020 0.24% .002 .010Residential Low Density 5 year on Lot 0 6.652 0.31% .002 .013Residential Low Density 5 year on Lot 0 3.484 0.16% .002 .007Residential Low Density 5 year on Lot 0 8.187 0.38% .002 .016Residential Low Density 5 year on Lot 0 6.971 0.33% .002 .014Residential Low Density 5 year on Lot 0 6.819 0.32% .002 .014Residential Low Density 5 year on Lot 0 2.195 0.10% .002 .004• Residential Low Density 5 year on Site 0 1.273 0.06% .002 .003Residential Low Density 5 year on Site 0 2.298 0.11% .002 .005Residential Low Density 5 year on Site 0 1.134 0.05% .002 .002Residential Low Density 5 year on Site 0 .514 0.02% .002 .001Residential Low Density 5 year on Site 0 2.087 0.10% .002 .004
• Residential Low Density 5 year on Site 0 1.780 0.08% .002 .004Residential Low Density 5 year on Site 0 12.659 0.59% .002 .025Residential Low Density 5 year on Site 0 8.001 0.38% .002 .016Residential Low Density 5 year on Site 0 .314 0.01% .002 .001
•

•ID Outfall Name Area Outfall Size Parent Id
-----------------------------------------------------------------------------------------------------------------------------TD-05 52nd ST and DITCH 2133.320 102------------------------------------------------------------------------------------------------------------------------------
• Landuse Retention Population Area % Tot Area COE CA Avg COE------------------------------------------------------------------------------------------------------------------------Residential Low Density 5 year on Site 0 4.944 0.23% .002 .010Residential Low Density 5 year on Site 0 4.966 0.23% .002 .010Residential Low Density 5 year on Site 0 2.671 0.13% .002 .005Residential Low Density 5 year on Site 0 2.867 0.13% .002 .006
• Residential Low Density 5 year on Site 0 7.596 0.36% .002 .015Residential Low Density 5 year on Site 0 1.583 0.07% .002 .003Residential Low Density 5 year on Site 0 .109 0.01% .002 .000Residential Low Density 5 year on Site 0 .698 0.03% .002 .001Residential Low Density 5 year on Site 0 3.748 0.18% .002 .007Residential Low Density 5 year on Site 0 2.405 0.11% .002 .005
• Residential Low Density 100 year on Lot 0 7.585 0.36% .001 .008Residential Low Density 100 year on Lot 0 3.720 0.17"" .001 .004Residential Low Density 100 year on Lot 0 3.719 0.17"" .001 .004Residential Low Density 100 year on Site 0 1.218 0.06% .001 .001Residential Low Density 100 year on Site 0 3.010 0.14% .001 .003Residential Low Density 100 year on Site 0 .542 0.03% .001 .001
• Residential Low Density 100 year on Site 0 1.827 0.09% .001 .002Residential Low Density Detention Area on Site 0 37.503 1.76% .500 18.751Residential High Density 0 year to Waters of U.S. 0 9.092 0.43% .750 6.819Residential High Density 0 year to Waters of U.S. 0 2.656 0.12% .550 1.461Residential High Density 0 year to Waters of U.S. 0 .887 0.04% .650 .577Residential High Density 0 year to Waters of U.S. 0 .775 0.04% .850 .659
• Residential High Density 0 year to Waters of U.S. 0 .514 0.02% .850 .437Residential High Density 5 year on Lot 0 4.870 0.23% .002 .010Residential High Density. 100 year on Site 0 9.998 0.47"1. .001 .010Residential High Density 100 year on Site 0 13.907 0.65% .001 .014Residential High Density 100 year on Site 0 9.398 0.44% .001 .009Residential High Density 100 year on Site 0 15.868 0.74% .001 .016
• Residential High Density 100 year on Site 0 13.157 0.62% .001 .013Residential High Density 100 year on Site 0 13.457 0.63% .001 .013Residential High Density 100 year on Site 0 9.560 0.45% .001 .010Residential High Density 100 year on Site 0 15.218 0.71% .001 .015Residential High Density 100 year on Site 0 9.252 0.43% .001 .009Residential High Density 100 year on Site 0 8.957 0.42% .001 .009
• Residential High Density 100 year on Site 0 8.920 0.42% .001 .009Residential High Density 100 year on Site 0 9.283 0.44% .001 .009Comm Res Office, Church o year to Waters of U.S. 0 .779 0.04% .900 .701Comm Res Office, Church o year to Waters of U.S. 0 1.146 0.05% .900 1.032Comm Res Office, Church o year to Waters of U.S. 0 .994 0.05% .850 .845Comm Res Office, Church o year to Waters of U.S. 0 .570 0.03% .350 .199
• Comm Res Office, Church o year to Waters of U.S. 0 .918 0.04% .950 .872Comm Res Office, Church o year to Waters of U.S. 0 .674 0.03% .800 .539Comm Res Office, Church o year to Waters of U.S. 0 .512 0.02% .900 .461Comm Res Office, Church o year to Waters of U.S. 0 .752 0.04% .950 .714Comm Res Office, Church o year to Waters of U.S. 0 .305 0.01% .950 .289Comm Res Office, Church o year to Waters of U.S. 0 1.021 0.05% .750 .766
• Comm Res Office, Church o year to Waters of U.S. 0 .558 0.03% .900 .502Comm Res Office, Church o year to Waters of U.S. 0 .422 0.02% .950 .401Comm Res Office, Church o year to Waters of U.S. 0 5.689 0.27"1. .950 5.404Comm Res Office, Church o year to Waters of U.S. 0 .572 0.03% .950 .543
•

•ID Outfall Name Area Outfall Size Parent Id
------------_.-_._._-----------------------------------------------------------------------------------------------------------TO-D5 52nd ST and DITCH 2133.320 102--------------------------------------------------------------------------------------------------------------------------------
• Landuse Retention Population Area % Tot Area COE CA Avg COE------------------------------------------------------------------------------------------------------------------_.-------_.Comm Res Office, Church o year to Waters of u.s. 0 .379 0.02% .850 .322Comm Res Office, Church o year to Waters of u.s. 0 .325 0.02% .850 .277Comm Res Office, Church o year to Waters of u.s. 0 .493 0.02% .850 .419Comm Res Office, Church o year to Waters of U.S. 0 1.929 0.09% .900 1.737Comm Res Office, Church o year to Waters of u.s. 0 .991 0.05% .900 .892• Comm Res Office, Church o year to Waters of U.S. 0 1.454 0.07"1. .900 1.308Comm Res Office, Church o year to Waters of U.S. 0 .730 0.03% .900 .657
Comm Res Office, Church o year to Waters of u.S. 0 .996 0.05% .800 .797Comm Res Office, Church o year to Retention Basin 0 2.079 0.10% .500 1.040Comm Res Office, Church 5 year on Lot 0 .328 0.02% .002 .001Comm Res Office, Church 5 year on Lot 0 1.395 0.07"1. .002 .003• Comm Res Office, Church 5 year on Lot 0 1.545 0.07% .002 .003Comm Res Office, Church 5 year on Lot 0 8.695 0.41% .002 .017Comm Res Office, Church 5 year on Lot 0 .700 0.03% .002 .001Comm Res Office, Church 5 year on Lot 0 1.823 0.09% .002 .004Comm Res Office, Church 5 year on Site 0 12.410 0.58% .002 .025Comm Res Office, Church 5 year on Site 0 2.521 0.12% .002 .005• Comm Res Office, Church 5 year on Site 0 3.744 0.18% .002 .007Comm Res Office, Church 5 year on Site 0 19.459 0.91% .002 .039Comm Res Office, Church 5 year on Site 0 5.949 0.28% .002 .012Comm Res Office, Church 100 year on Site 0 .546 0.03% .001 .001Comm Res Office, Church 100 year on Site 0 11.726 0.55% .001 .012Comm Res Office, Church 100 year on Site 0 1.264 0.06% .001 .001• Comm Res Office, Church 100 year on Site 0 .609 0.03% .001 .001Comm Res Office, Church Detention Area on Site 0 2.790 0.13% .950 2.650Comm Res Office, Church Detention Area on Site 0 4.011 0.19% .950 3.810Comm Res Office, Church Detention Area on Site 0 3.115 0.15% .950 2.959Comm Res Office, Church Detention Area on Site 0 3.369 0.16% .950 3.201Comm Res Office, Church Detention Area on Site 0 7.412 0.35% .950 7.042• Comm Hotels,Restraunts o year to Waters of U.S. 0 .000 0.00% .800 .000Comm Hotels,Restraunts o year to Waters of U.S. 0 1.341 0.06% .800 1.072Comm Hotels,Restraunts o year to Waters of U.S. 0 1.075 0.05% .950 1.021Comm Hotels,Restraunts o year to Waters of U.S. 0 1.014 0.05% .950 .964Comm Hotels,Restraunts o year to Waters of U.S. 0 .935 0.04% .950 .888
• Comm Hotels,Restraunts o year to Waters of U.S. 0 .723 0.03% .850 .614Comm Hotels,Restraunts o year to Waters of U.S. 0 .354 0.02% .950 .336Comm Hotels,Restraunts o year to Waters of U.S. 0 1.578 0.07% .950 1.500Comm Hotels,Restraunts o year to Waters of U.S. 0 2.849 0.13% .950 2.706Comm Hotels,Restraunts o year to Waters of U.S. 0 .933 0.04% .900 .840Comm Hotels,Restraunts o year to Waters of U.S. 0 2.074 0.10% .500 1.037Comm Hotels,Restraunts o year to Waters of U.S. 0 1.010 0.05% .900 .909• Comm Hotels,Restraunts o year to Waters of U.S. 0 .498 0.02% .900 .448Comm Hotels,Restraunts o year to Retention Basin 0 .909 0.04% .950 .864Comm Hotels,Restraunts o year to Retention Basin 0 4.575 0.21% .950 4.346Comm Hotels,Restraunts 5 year on Lot 0 5.324 0.25% .002 .011Comm Hotels,Restraunts 5 year on Lot 0 .844 0.04% .002 .002Comm Hotels,Restraunts 5 year on Site 0 1.274 0.06% .002 .003• Comm Hotels,Restraunts 5 year on Site 0 .684 0.03% .002 .001Comm Hotels,Restraunts 5 year on Site 0 .778 0.04% .002 .002Comm Hotels,Restraunts 100 year on Site 0 3.232 0.15% .001 .003
•
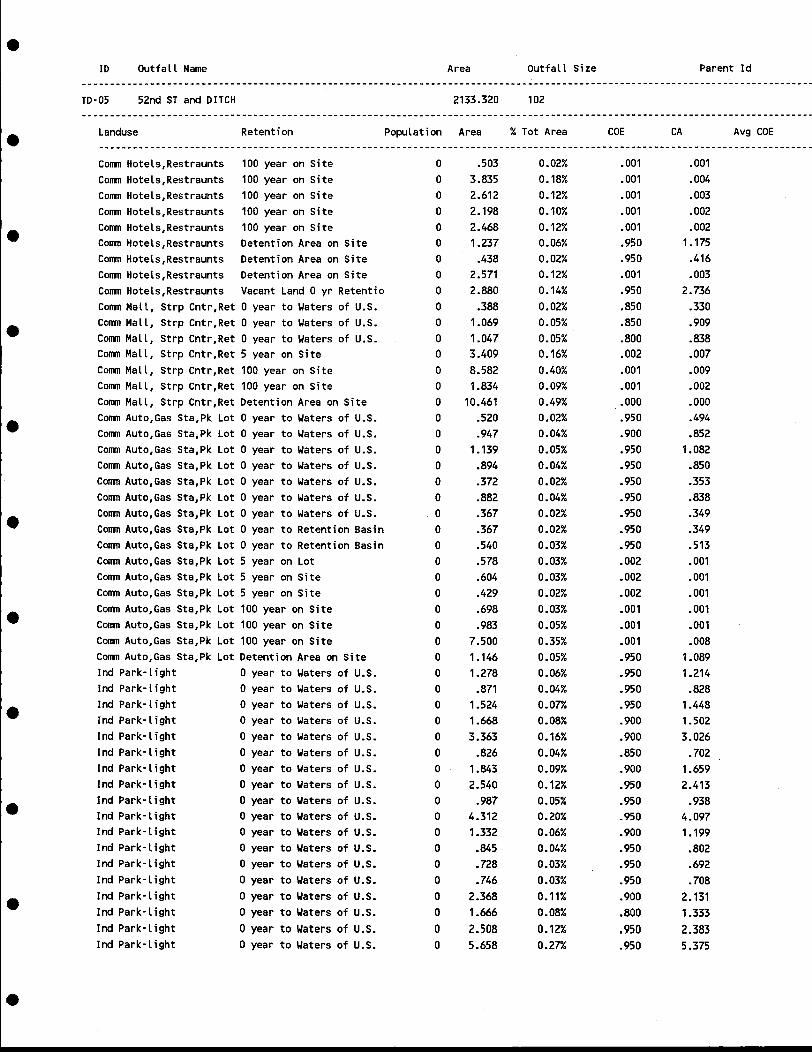
•ID Outfall Name Area Outfall Size Parent Id
-------------------------------------------------------------------------------------------------------------------------------TO-05 52nd ST and DITCH 2133.320 102-------------------------------------------------------------------------------------------------------------------------------
• Landuse Retention Population Area % Tot Area COE CA Avg COE----------------------------------------------------------------------------------------------------------------------------Comm Hotels,Restraunts 100 year on Site 0 .503 0.02% .001 .001Comm Hotels,Restraunts 100 year on Site 0 3.835 0.18% .001 .004Comm Hotels,Restraunts 100 year on Site 0 2.612 0.12% .001 .003Comm Hotels,Restraunts 100 year on Site 0 2.198 0.10% .001 .002
• Comm Hotels,Restraunts 100 year on Site 0 2.468 0.12% .001 .002Comm Hotels,Restraunts Detention Area on Site 0 1.237 0.06% .950 1.175Comm Hotels,Restraunts Detention Area on Site 0 .438 0.02% .950 .416Comm Hotels,Restraunts Detention Area on Site 0 2.571 0.12% .001 .003Comm Hotels,Restraunts Vacant Land 0 yr Retentio 0 2.880 0.14% .950 2.736Comm Mall, Strp Cntr,Ret 0 year to Waters of U.S. 0 .388 0.02% .850 .330
• Comm Mall, Strp Cntr,Ret 0 year to Waters of U.S. 0 1.069 0.05% .850 .909Comm Mall, Strp Cntr,Ret 0 year to Waters of U.S. 0 1.047 0.05% .800 .838Comm Mall, Strp Cntr,Ret 5 year on Site 0 3.409 0.16% .002 .007Comm Mall, Strp Cntr,Ret 100 year on Site 0 8.582 0.40% .001 .009Comm Mall, Strp Cntr,Ret 100 year on Site 0 1.834 0.09% .001 .002Comm Mall, Strp Cntr,Ret Detention Area on Site 0 10.461 0.49% .000 .000
• Comm Auto,Gas Sta,Pk Lot 0 year to Waters of U.S. 0 .520 0.02% .950 .494Comm Auto,Gas Sta,Pk Lot 0 year to Waters of U.S. 0 .947 0.04% .900 .852Comm Auto,Gas Sta,Pk Lot 0 year to Waters of U.S. 0 1.139 0.05% .950 1.082Comm Auto,Gas Sta,Pk Lot 0 year to Waters of U.S. 0 .894 0.04% .950 .850Comm Auto,Gas Sta,Pk Lot 0 year to Waters of U.S. 0 .372 0.02% .950 .353Comm Auto,Gas Sta,Pk Lot 0 year to Waters of U.S. 0 .882 0.04% .950 .838
• Comm Auto,Gas Sta,Pk Lot 0 year to Waters of U.S. 0 .367 0.02% .950 .349Comm Auto,Gas Sta,Pk Lot 0 year to Retention Basin 0 .367 0.02% .950 .349Comm Auto,Gas Sta,Pk Lot 0 year to Retention Basin 0 .540 0.03% .950 .513Comm Auto,Gas Sta,Pk Lot 5 year on Lot 0 .578 0.03% .002 .001Comm Auto,Gas Sta,Pk Lot 5 year on Site 0 .604 0.03% .002 .001Comm Auto,Gas Sta,Pk Lot 5 year on Site 0 .429 0.02% .002 .001
• Comm Auto,Gas Sta,Pk Lot 100 year on Site 0 .698 0.03% .001 .001Comm Auto,Gas Sta,Pk Lot 100 year on Site 0 .983 0.05% .001 .001Comm Auto,Gas Sta,Pk Lot 100 year on Site 0 7.500 0.35% .001 .008Comm Auto,Gas Sta,Pk Lot Detention Area on Site 0 1.146 0.05% .950 1.089Ind Park-li ght o year to Waters of U.S. 0 1.278 0.06% .950 1.214Ind Park-light o year to Waters of U.S. 0 .871 0.04% .950 .828
• Ind Park-light o year to Waters of U.S. 0 1.524 0.07"1. .950 1.448Ind Park-light o year to Waters of U.S. 0 1.668 0.08% .900 1.502Ind Park-light o year to Waters of U.S. 0 3.363 0.16% .900 3.026Ind Park-light o year to Waters of U.S. 0 .826 0.04% .850 .702Ind Park-light o year to Waters of U.S. 0 1.843 0.09% .900 1.659Ind Park-light o year to Waters of U.S. 0 2.540 0.12% .950 2.413
• Ind Park-light o year to Waters of U.S. 0 .987 0.05% .950 .938Ind Park-light o year to Waters of U.S. 0 4.312 0.20% .950 4.097Ind Park-light o year to Waters of U.S. 0 1.332 0.06% .900 1.199Ind Park-light o year to Waters of U.S. 0 .845 0.04% .950 .802100 Park-light o year to Waters of U.S. 0 .728 0.03% .950 .692100 Park-l ight o year to Waters of U.S. 0 .746 0.03% .950 .708
• 100 Park-l ight o year to Waters of U.S. 0 2.368 0.11% .900 2.131100 Park-l ight o year to Waters of U.S. 0 1.666 0.08% .800 1.333100 Park-light o year to Waters of U.S. 0 2.508 0.12% .950 2.383100 Park-light o year to Waters of U.S. 0 5.658 0.27% .950 5.375
•

•ID Outfall Name Area Outfall Size Parent Id
--------------------------------------------------------------------------------_._._------------------------------------------TO-05 52nd ST and DITCH 2133.320 102-------------------------------------------------------------------------------------------------------------------------------
Landuse Retention Population Area % Tot Area COE CA Avg COE• ----------------------------------------------------------------------------------------------------------------------------Ind Park-light o year to Waters of u.s. 0 3.983 0.19"1. .950 3.784
Ind Park-light o year to Waters of u.s. 0 .459 0.02% .500 .230
Ind Park-light o year to Waters of u.s. 0 .505 0.02% .900 .455
Ind Park-light o year to Waters of u.s. 0 2.316 0.11% .950 2.200
Ind Park-light o year to Waters of u.s. 0 1.781 0.08% .950 1.692• Ind Park-light o year to Waters of u.s. 0 1.788 0.08% .950 1.699
Ind Park-l ight o year to Waters of u.s. 0 2.172 0.10% .950 2.063
Ind Park-light o year to Waters of u.s. 0 1.537 0.07''1. .900 1.384
Ind Park-li ght o year to Waters of u.s. 0 1.962 0.09% .900 1.766
Ind Park-light o year to Waters of u.s. 0 2.066 0.10% .950 1.962
Ind Park-light o year to Waters of u.s. 0 1.620 0.08% .950 1.539• Ind Park-light o year to Waters of u.s. 0 1.847 0.09% .950 1.754Ind Park-light o year to Waters of u.s. 0 1.866 0.09% .870 1.624
Ind Park-light o year to Waters of u.s. 0 3.237 0.15% .950 3.075
Ind Park-light o year to Waters of u.s. 0 2.002 0.09% .950 1.901
Ind Park-light o year to Waters of u.s. 0 .811 0.04% .950 .771
• Ind Park-light o year to Waters of u.s. 0 .953 0.04% .950 .905Ind Park-light o year to Waters of u.s. 0 9.031 0.42% .950 8.579Ind Park-light o year to Waters of u.s. 0 .383 0.02% .950 .363Ind Park-l ight o year to Waters of u.s. 0 1.683 0.08% .950 1.599Ind Park-light o year to Waters of u.s. 0 1.013 0.05% .950 .962Ind Park-light o year to Waters of u.s. 0 3.942 0.18% .950 3.745
Ind Park-light o year to Waters of u.s. 0 1.983 0.09% .950 1.884• Ind Park-l ight o year to Waters of u.s. 0 2.125 0.10% .950 2.019Ind Park-light o year to Waters of u.s. 0 1.555 0.07% .950 1.477
Ind Park-l ight o year to Waters of u.s. 0 1.621 0.08% .950 1.540Ind Park-light o year to Waters of u.s. 0 .635 0.03% .950 .603Ind Park-light o year to Waters of u.s. 0 7.889 0.37''1. .950 7.494Ind Park-light o year to Waters of u.s. 0 1.599 0.07% .950 1.519• Ind Park-light o year to Waters of u.s. 0 4.944 0.23% .950 4.697Ind Park-l ight o year to Waters of u.s. 0 3.946 0.18% .950 3.748Ind Park-light o year to Waters of u.s. 0 1.954 0.09% .950 1.856Ind Park-light o year to Waters of u.s. 0 2.971 0.14% .950 2.822Ind Park-light o year to Waters of u.s. 0 1.151 0.05% .950 1.093
• Ind Park-light o year to Waters of u.s. 0 2.242 0.11% .950 2.129Ind Park-light o year to Waters of u.s. 0 1.533 0.07% .900 1.380100 Park-light o year to Waters of u.s. 0 .458 0.02% .950 .435Ind Park-light o year to Waters of u.s. 0 .459 0.02% .950 .436Ind Park-light o year to Waters of u.s. 0 2.102 0.10% .950 1.997Ind Park-light o year to Waters of u.s. 0 2.431 0.11% .950 2.309
• Ind Park-light o year to Waters of u.s. 0 4.051 0.19% .950 3.848Ind Park-l ight o year to Waters of u.s. 0 4.879 0.23% .950 4.635Ind Park-light o year to Waters of u.s. 0 .767 0.04% .950 .729Ind Park-light o year to Waters of u.s. 0 1.648 0.08% .600 .989100 Park-light o year to Waters of u.s. 0 .436 0.02% .950 .414Ind Park-light o year to Waters of u.s. 0 .637 0.03% .750 .478
• Ind Park-l ight o year to Waters of u.s. 0 1.498 0.07% .950 1.423Ind Park-light o year to Waters of u.s. 0 1.942 0.09% .950 1.845Ind Park-l ight o year to Waters of U.S. 0 2.499 0.12% .550 1.375Ind Park-light o year to Waters of U.S. 0 2.992 0.14% .570 1.705
•

•ID Outfall Name Area Outfall Size Parent Id
------------------------------------------------------------------------------------------------------------------.------------TO-05 52nd ST and DITCH 2133.320 102-------------------------------------------------------------------------------------------------------------------------------
• Landuse Retention Population Area % Tot Area COE CA Avg COE----------------------------------------------------------------------------------------.-----------------------------------Ind Park-light o year to Waters of U.S. 0 1.718 0.08% .950 1.632Ind Park-l ight o year to Waters of U.S. 0 4.032 0.19% .950 3.830Ind Park-light o year to Waters of U.S. 0 1.208 0.06% .950 1.147Ind Park-light o year to Waters of U.S. 0 1.006 0.05% .750 .754
• Ind Park-light o year to Waters of U.S. 0 4.509 0.21% .950 4.284Ind Park-light o year to Retention Basin 0 1.812 0.08% .900 1.631Ind Park-light 5 year on Lot 0 .473 0.02% .002 .001Ind Park-light 5 year on Lot 0 .386 0.02% .002 .001Ind Park-l ight 5 year on Lot 0 .387 0.02% .002 .001Ind Park-light 5 year on Lot 0 6.821 0.32% .002 .014
• Ind Park-light 5 year on Lot 0 .626 0.03% .002 .001Ind Park-light 5 year on Lot 0 1.068 0.05% .002 .002Ind Park-light 5 year on Lot 0 3.081 0.14% .002 .006Ind Park-light 5 year on Site 0 2.037 0.10% .002 .004Ind Park-light 5 year on Site 0 1.485 0.07% .002 .003Ind Park-light 5 year on Site 0 2.236 0.10% .002 .004
• Ind Park-light 5 year on Site 0 2.503 0.12% .002 .005Ind Park-light 5 year on Site 0 1.565 0.07"-' .002 .003Ind Park-light 5 year on Site 0 .830 0.04% .002 .002Ind Park-l ight 5 year on Site 0 1.819 0.09% .002 .004Ind Park-light 5 year on Site 0 .768 0.04% .002 .002Ind Park-light 5 year on Site 0 2.805 0.13% .002 .006
• Ind Park-light 5 year on Site 0 .860 0.04% .002 .002Ind Park-light 5 year on Site 0 1.028 0.05% .002 .002Ind Park-light 5 year on Site 0 4.650 0.22% .002 .009Ind Park-light 5 year on Site 0 8.436 0.40% .002 .017Ind Park-light 5 year on Site 0 .860 0.04% .002 .002Ind Park-light 5 year on Site 0 4.268 0.20% .002 .009
• Ind Park-light 5 year on Site 0 1.221 0.06% .002 .002Ind Park-light 5 year on Site 0 5.832 0.27"-' .002 .012Ind Park-light 5 year on Site 0 .651 0.03% .002 .001Ind Park-light 5 year on Site 0 1.909 0.09% .002 .004Ind Park-light 5 year on Site 0 2.817 0.13% .002 .006Ind Park-light 5 year on Site 0 .138 0.01% .002 .000
• Ind Park-light 5 year on Site 0 1.953 0.09% .002 .004Ind Park-light 5 year on Site 0 .833 0.04% .002 .002Ind Park-light 5 year on Site 0 1.030 0.05% .002 .002Ind Park-l ight 5 year on Site 0 .856 0.04% .002 .002Ind Park-light 5 year on Site 0 1.521 0.07% .002 .003Ind Park-light 5 year on Site 0 .856 0.04% .002 .002
• Ind Park-l ight 5 year on Site 0 1.028 0.05% .002 .002Ind Park-light 5 year on Site 0 1.031 0.05% .002 .002Ind Park-l ight 5 year on Site 0 1.157 0.05% .002 .002Ind Park-l ight 5 year on Site 0 1.376 0.06% .002 .003Ind Park-l ight 5 year on Site 0 1.193 0.06% .002 .002Ind Park-light 5 year on Site 0 .878 0.04% .002 .002
• Ind Park-light 5 year on Site 0 1.997 0.09% .002 .004Ind Park-light 5 year on Site 0 1.706 0.08% .002 .003Ind Park-light 5 year on Site 0 .850 0.04% .002 .002Ind Park-light 5 year on Site 0 .928 0.04% .002 .002
•

•ID Outfall Name Area Outfall Size Parent Id
------------------------------------------------------------------------------------------------------------------------------.TO-05 52nd ST and DITCH 2133.320 102---------------------------------_.--------------------------------------------------------------------------------------------
Landuse Retention Population Area % Tot Area COE CA Avg COE• ---------------------------------------------------------------------------------------------------------------------.------Ind Park-light 5 year on Site 0 2.588 0.12% .002 .005
Ind Park-light 5 year on Site 0 2.811 0.13% .002 .006
Ind Park-light 5 year on Site 0 .773 0.04% .002 .002
Ind Park-light 5 year on Site 0 2.457 0.12% .002 .005
Ind Park-light 5 year on Site 0 .897 0.04% .002 .002• Ind Park-light 5 year on Site 0 1.040 0.05% .002 .002
Ind Park-light 5 year on Site 0 1.441 0.07"1. .002 .003
Ind Park-light 5 year on Site 0 4.601 0.22% .002 .009
Ind Park-light 5 year on Site 0 3.341 0.16% .002 .007
Ind Park-light 5 year on Site 0 2.707 0.13% .002 .005
Ind Park-light 5 year on Site 0 1.791 0.08% .002 .004• Ind Park-light 100 year on Site 0 2.765 0.13% .001 .003Ind Park-light 100 year on Site 0 5.366 0.25% .001 .005
Ind Park-light 100 year on Site 0 9.520 0.45% .001 .010
~nd Park-light 100 year on Sjte 0 2.295 0.11% .001 .002
Ind Park-light 100 year on Site 0 6.808 0.32% .001 .007
Ind Park-light 100 year on Site 0 12.659 0.59% .001 .013• Ind Park-light 100 year on Site 0 2.388 0.11% .001 .002IOO Park-l ight 100 year on Site 0 .788 0.04% .001 .001Ind Park-light 100 year on Site 0 2.478 0.12% .001 .002Ind Park-l ight 100 year on Site 0 .703 0.03% .001 .001Ind Park-light 100 year on Site 0 .944 0.04% .001 .001Ind Park-light 100 year on Site 0 4.706 0.22% .001 .005• Ind Park-l ight 100 year on Site 0 .847 0.04% .001 .001
Ind Park-light 100 year on Site 0 2.007 0.09% .001 .002Ind Park-light 100 year on Site 0 7.296 0.34% .001 .007Ind Park-light 100 year on Site 0 8.005 0.38% .001 .008Ind Park-light 100 year on Site 0 3.025 0.14% .001 .003Ind Park-light 100 year on Site 0 9.736 0.46% .001 .010• Ind Park-light 100 year on Site 0 1.158 0.05% .001 .001IOO Park-light 100 year on Site 0 1.295 0.06% .001 .001Ind Park-light 100 year on Site 0 1.428 0.07"1. .001 .001Ind Park-light 100 year on Site 0 .646 0.03% .001 .001Ind Park-l ight 100 year on Site 0 .722 0.03% .001 .001Ind Park-light 100 year on Site 0 .646 0.03% .001 .001• Ind Park-light 100 year on Site 0 .646 0.03% .001 .001Ind Park-light 100 year on Site 0 1.091 0.05% .001 .001Ind Park-light 100 year on Site 0 .935 0.04% .001 .001Ind Park-light 100 year on Site 0 3.568 0.17"1. .001 .004Ind Park-l ight 100 year on Site 0 2.701 0.13% .001 .003
• Ind Park-light 100 year on Site 0 4.234 0.20% .001 .004Ind Park-l i ght 100 year on Site 0 1.288 0.06% .001 .001Ind Park-light 100 year on Site, 0 .594 0.03% .001 .001Ind Park-light 100 year on Site 0 .670 0.03% .001 .001Ind Park-light 100 year on Site 0 .594 0.03% .001 .001Ind Park-light 100 year on Site 0 .594 0.03% .001 .001
• Ind Park-light 100 year on Site 0 .719 0.03% .001 .001Ind Park-light 100 year on Site 0 .791 0.04% .001 .001Ind Park-light 100 year on Site 0 .708 0.03% .001 .001Ind Park-light 100 year on Site 0 2.911 0.14% .001 .003
•

•ID Outfall Name Area Outfall Size Parent Id
-------------------------------------------------------------------------------------------------------------------------------TO-Os 52nd ST and DITCH 2133.320 102-------------------------------------------------------------------------------------------------------------------------------
• Landuse Retention Population Area % Tot Area COE CA Avg COE---------------------------------------------------------------------------------------------------------------.---------Ind Park-light 100 year on Site 0 1.734 0.08% .001 .002Ind Park-light 100 year on Site 0 .987 0.05% .001 .001Ind Park-l ight 100 year on Site 0 1.379 0.06% .001 .001Ind Park-li ght 100 year on Site 0 1.550 0.07% .001 .002
• Ind Park-light 100 year on Site 0 1.904 0.09% .001 .002Ind Park-light 100 year on Site 0 1.550 0.07"" .001 .002Ind Park-light 100 year on Site 0 2.027 0.10% .001 .002Ind Park-light 100 year on Site 0 5.547 0.26% .001 .006Ind Park-light 100 year on Site 0 4.627 0.22% .001 .005Ind Park-light 100 year on Site 0 5.076 0.24% .001 .005
• Ind Park-l ight 100 year on Site 0 4.702 0.22% .001 .005Ind Park-light 100 year on Site 0 2.716 0.13% .001 .003Ind Park-light 100 year on Site 0 3.306 0.15% .001 .003Ind Park-light 100 year on Site 0 3.133 0.15% .001 .003Ind Park-light 100 year on Site 0 4.704 0.22% .001 .005Ind Park-light 100 year on Site 0 1.648 0.08% .001 .002
• Ind Park-light 100 year on Site 0 7.944 0.37"" .001 .008Ind Park-l ight 100 year on Site 0 2.401 0.11% .001 .002Ind Park-light Detention Basin 0 3.649 0.17% .950 3.466Ind Park-light Detention Basin 0 1.900 0.09% .950 1.805Ind Park-light Detention Area on Site 0 1.543 0.07"" .950 1.466Ind Park-li ght Vacant Land 100 yr Retent 0 8.152 0.38% .001 .008
• Ind Large Site-Medium o year to Waters of u.S. 0 9.727 0.46% .950 9.240Ind Large Site-Medium o year to Waters of u.S. 0 4.384 0.21% .950 4.164Ind Large Site-Medium o year to Waters of u.S. 0 15.941 0.75% .950 15.144Ind Large Site-Medium o year to Waters of u.S. 0 4.456 0.21% .950 4.233Ind Large Site-Medium o year to Waters of u.S. 0 1.492 0.07% .900 1.343Ind Large Site-Medium o year to Waters of u.S. 0 9.048 0.42% .950 8.596
• Ind Large Site-Medium 5 year on Site 0 10.227 0.48% .002 .020Ind Large Site-Medium 5 year on Site 0 1.135 0.05% .002 .002Ind Large Site-Medium 5 year on Site 0 3.273 0.15% .002 .007Ind Large Site-Medium 100 year on Site 0 29.189 1.37"" .001 .029Ind Large Site-Medium 100 year on Site 0 4.043 0.19% .001 .004Ind Large Site-Medium Detention Basin 0 13.584 0.64% .950 12.905
• Ind Large Site-Medium Detention Area on Site 0 .299 0.01% .950 .285Ind Foundry,Elec,PPs o year to Waters of u.S. 0 4.327 0.20% .001 .004Ind Foundry,Elec,PPs 100 year on Site 0 .985 0.05% .001 .001Agricultural 100 year on Site 0 7.320 0.34% .001 .007Vacant Land o year to Waters of U.S. 0 1.158 0.05% .250 .289Vacant Land o year to Waters of U.S. 0 1.338 0.06% .200 .268
• Vacant Land o year to Waters of U.S. 0 2.725 0.13% .200 .545Vacant Land o year to Waters of u.S. 0 .861 0.04% .200 .172Vacant Land o year to Waters of U.S. 0 5.358 0.25% .200 1.072Vacant Land o year to Waters of U.S. 0 3.989 0.19% .200 .798Vacant Land o year to Waters of U.S. 0 5.591 0.26% .200 1.118Vacant Land o year to Waters of U.S. 0 .689 0.03% .200 .138
• Vacant Land o year to Waters of U.S. 0 25.236 1.18% .200 5.047Vacant Land o year to Waters of U.S. 0 93.686 4.39% .200 18.737Vacant Land o year to Waters of u.S. 0 1.410 0.07"10 .200 .282Vacant Land o year to Waters of U.S. 0 2.565 0.12% .200 .513
•

•ID Outfall Name Area Outfall Size Parent Id
.. _-~------------------------------------------------------------------------------------------------------------------------_.. -
TO-05 52nd ST and DITCH 2133.320 102
----------------------------------------------------~- ------------------------------------------------------ -------------------~
• Landuse Retention Population Area % Tot Area COE CA Avg COE------------------------------------------------------------------------------------------------------------------------------Vacant Land o year to Waters of U.S. 0 4.994 0.23% .200 .999
Vacant Land o year to Waters of u.s. 0 2.777 0.13% .200 .555
Vacant Land 100 year on Site 0 1.824 0.09% .001 .002
Vacant Land 100 year on Site 0 1.917 0.09% .001 .002
• Vacant Land 100 year on Site 0 7.888 0.37% .001 .008Vacant Land 100 year on Site 0 .852 0.04% .001 .001
Vacant Land 100 year on Site 0 1.160 0.05% .001 .001
Vacant Land 100 year on Site 0 1.960 0.09% .001 .002
Vacant Land 100 year on Site 0 .259 0.01% .001 .000
Vacant Land 100 year on Site 0 2.283 0.11% .001 .002
• Vacant Land 100 year on Site 0 .517 0.02% .001 .001Vacant Land 100 year on Site 0 1.257 0.06% .001 .001Vacant Land Vacant Land 0 yr Retentio 0 .500 0.02% .200 .100
Vacant Land Vacant Land 0 yr Retentio 0 1.800 0.08% .200 .360
Vacant Land Vacant Land 0 yr Retentio 0 1.378 0.06% .200 .276Vacant Land Vacant Land 0 yr Retentio 0 .546 0.03% .250 .137
• Vacant Land Vacant Land 0 yr Retentio 0 1.624 0.08% .250 .406
Vacant Land Vacant Land 0 yr Retentio 0 1.741 0.08% .250 .435Vacant Land Vacant Land 0 yr Retentio 0 1.590 0.07"1. .200 .318Vacant Land Vacant Land 0 yr Retentio 0 .867 0.04% .200 .173Vacant Land Vacant Land 0 yr Retentio 0 1.474 0.07% .200 .295Vacant Land Vacant Land 0 yr Retentio 0 5.551 0.26% .200 1.110
• Vacant Land Vacant Land 0 yr Retentio 0 1.491 0.07"1. .200 .298Vacant Land Vacant Land 0 yr Retentio 0 4.596 0.22% .250 1.149Vacant Land Vacant Land 0 yr Retentio 0 3.892 0.18% .250 .973Vacant Land Vacant Land 0 yr Retentio 0 .489 0.02% .200 .098Vacant Land Vacant Land 0 yr Retentio 0 4.840 0.23% .450 2.178Vacant Land Vacant Land 0 yr Retentio 0 1.011 0.05% .200 .202
• Vacant Land Vacant Land 100 yr Retent 0 .296 0.01% .001 .000Vacant Land Vacant Land 100 yr Retent 0 4.337 0.20% .001 .004Vacant Land Vacant Land 100 yr Retent 0 9.103 0.43% .001 .009Vacant Land Vacant Land 100 yr Retent 0 10.799 0.51% .001 .011Vacant Land Vacant Land 100 yr Retent 0 13.092 0.61% .001 .013Vacant Land Vacant Land 100 yr Retent 0 5.113 0.24% .001 .005
• Vacant Land Vacant Land 100 yr Retent 0 10.961 0.51% .001 .011Vacant Land Vacant Land 100 yr Retent 0 7.695 0.36% .001 .008Vacant Land Vacant Land 100 yr Retent 0 3.095 0.15% .001 .003Vacant Land Vacant Land 100 yr Retent 0 4.905 0.23% .001 .005Vacant Land Vacant Land 100 yr Retent 0 9.667 0.45% .001 .010Vacant Land Vacant Land 100 yr Retent 0 10.125 0.47"1. .001 .010
• Open Space, Pks, Golf o year to Waters of U.S. 0 1.969 0.09% .200 .394Open Space, Pks, Golf 100 year on Site 0 .230 0.01% .001 .000Open Space, Pks, Golf 100 year on Site 0 6.660 0.31% .001 .007Open Space, School o year to Waters of U.S. 0 3.318 0.16% .001 .003Open Space, School 5 year on Site 0 3.150 0.15% .002 .006Open Space, School 100 year on Site 0 36.094 1.69% .001 .036
• Open Space, School 100 year on Site 0 4.435 0.21% .001 .004Municpal Faci l ities 100 year on Site 0 1.047 0.05% .001 .001Municpal Facilities 100 year on Site 0 2.996 0.14% .001 .003Municpal Facilities 100 year on Site 0 5.110 0.24% .001 .005
•

•10 Outfall Name Area Outfall Size Parent Id
------------_.----------------._---------.-------------------------------------------------------------------------------------TO-Os 52nd ST and DITCH 2133.320 102--------------------------------------------------------------------------------------------------------------.----------------
:. Landuse Retention Population Area % Tot Area COE CA Avg COE----------------------------------------------------------------------------------------------------------------------------
Summary for TO-OS
-------------------------------------------------------------------------.--------------------------------------------------Residential Low Density o year to Waters of u.s. 0 128.218 6.01% 64.629 0.504Residential Low Density o year to Retention Basin 0 .373 .02% .298 0.799• Residential Low Density 5 year on Lot 0 186.403 8.74% .373 0.002Residential Low Density 5 year on Site 0 61.647 2.89% .123 0.002Residential Low Density 100 year on Lot 0 15.024 .70% .015 0.001Residential Low Density 100 year on Site 0 6.597 .31% .007 0.001Residential Low Density Detention Area on Site 0 37.503 1.76% 18.751 0.500Residential High Density 0 year to Waters of u.S. 0 13.924 .65% 9.952 0.715• Residential High Density 5 year on Lot 0 4.870 .23% .010 0.002Residential High Density 100 year on Site 0 136.973 6.42% .137 0.001Comm Res Office, Church o year to Waters of u.S. 0 22.209 1.04% 19.677 0.886Comm Res Office, Church o year to Retention Basin 0 2.079 .10% 1.040 0.500Comm Res Office, Church 5 year on Lot 0 14.486 .68% .029 0.002Comm Res Office, Church 5 year on Site 0 44.083 2.07% .088 0.002• Comm Res Office, Church 100 year on Site 0 14.146 .66% .014 0.001Camm Res Office, Church Detention Area on Site 0 20.696 .97";' 19.661 0.950Camm Hotels,Restraunts o year to Waters of u.S. 0 14.385 .67";' 12.337 0.858Camm Hotels,Restraunts o year to Retention Basin 0 5.484 .26% 5.210 0.950Comm Hotels,Restraunts 5 year on Lot 0 6.169 .29% .012 0.002Comm Hotels,Restraunts 5 year on Site 0 2.737 .13% .005 0.002• Comm Hotels,Restraunts 100 year on Site 0 14.849 .70% .015 0.001Camm Hotels,Restraunts Detention Area on Site 0 4.246 .20% 1.594 0.375Camm Hotels,Restraunts Vacant Land 0 yr Retentio 0 2.880 .14% 2.736 0.950Camm Mall, Strp Cntr,Ret 0 year to Waters of u.S. 0 2.504 .12% 2.076 0.829Comm Mall, Strp Cntr,Ret 5 year on Site 0 3.409 .16% .007 0.002Comm Mall, Strp Cntr,Ret 100 year on Site 0 10.416 .49% .010 0.001• Camm Mall, Strp Cntr,Ret Detention Area on Site 0 10.461 .49% .000 0.000Comm Auto,Gas Sta,Pk Lot 0 year to Waters of u.S. 0 5.121 .24% 4.817 0.941Comm Auto,Gas Sta,Pk Lot 0 year to Retention Basin 0 .907 .04% .862 0.950Comm Auto,Gas Sta,Pk Lot 5 year on Lot 0 .578 .03% .001 0.002Comm Auto,Gas Sta,Pk Lot 5 year on Site 0 1.033 .05% .002 0.002
• Comm Auto,Gas Sta,Pk Lot 100 year on Site 0 9.181 .43% .009 0.001Camm Auto,Gas Sta,Pk Lot Detention Area on Site 0 1.146 .05% 1.089 0.950Ind Park-light o year to Waters of u.S. 0 157.435 7.38% 145.027 0.921Ind Park-light o year to Retention Basin 0 1.812 .08% 1.631 0.900Ind Park-light 5 year on Lot 0 12.842 .60% .026 0.002Ind Park-light 5 year on Site 0 92.357 4.33% .185 0.002Ind Park-light 100 year on Site 0 167.210 7.84% .167 0.001• Ind Park-light Detention Basin 0 5.549 .26% 5.271 0.950Ind Park-l i ght Detention Area on Site 0 1.543 .07";' 1.466 0.950Ind Park-light Vacant Land 100 yr Retent 0 8.152 .38% .008 0.001Ind Large Site-Medium o year to Waters of u.S. 0 45.048 2.11% 42.721 0.948Ind Large Site-Medium 5 year on Site 0 14.635 .69% .029 0.002
• Ind Large Site-Medium 100 year on Site 0 33.232 1.56% .033 0.001Ind Large Site-Medium Detention Basin 0 13.584 .64% 12.905 0.950Ind Large Site-Medium Detention Area on Site 0 .299 .01% .285 0.953
•

•10
TO-05
Outfall Name
52nd ST and DITCH
Area
2133.320
Outfall Size
102
Parent Id
• Landuse Retention Population Area % Tot Area COE CA Avg COE----------------------------------------------------------------------------------------------------------------------------Ind Foundry,Elec,PPs o year to Waters of U.S. 0 4.327 .20% .004 0.001Ind Foundry,Elec,PPs 100 year on Site 0 .985 .05% .001 0.001Agricultural 100 year on Site 0 7.320 .34% .007 0.001Vacant Land o year to Waters of U.S. 0 152.376 7.14% 30.533 0.200
• Vacant Land 100 year on Site 0 19.916 .93% .020 0.001Vacant Land Vacant Land 0 yr Retentio 0 33.391 1. 57"10 8.508 0.255Vacant Land Vacant Land 100 yr Retent 0 89.186 4.18% .089 0.001Open Space, Pks, Golf o year to Waters of U.S. 0 1.969 .09% .394 0.200Open Space, Pks, Golf 100 year on Site 0 6.890 .32% .007 0.001Open Space, School o year to Waters of U.S. 0 3.318 .16% .003 0.001
• Open Space, School 5 year on Site 0 3.150 .15% .006 0.002Open Space, School 100 year on Site 0 40.529 1.90% .041 0.001Municpal Fad l ities 100 year on Site 0 9.152 .43% .009 0.001Total Street Area 0 402.376 18.86% 382.257 0.950
TD-05 Drainage Area Totals
•
•
•
•
•
•
o 2133.320 100.00% 797.219 0.374

•ID Outfa II Name Area Outfall Size Parent Id
------------------------------------------------------------------------------------------------------------------------------_.TO-05 52nd St and DITCH 2133.320 102-----------------------------------------------------------------------------------------------------------------------------_.-:. Landuse Retention Population Area %Tot Area COE CA Avg COE
--------------------------------------------------------------------------------------------------------------------------_ ..
Residential Low Density o year to Waters of U.S. 0 .895 0.04% .350 .313Residential Low Density o year to Waters of U.S. 0 1.081 0.05% .700 .757Residential Low Density o year to Waters of u.s. 0 1.134 0.05% .700 .794Residential Low Density o year to Waters of u.s. 0 1.324 0.06% .700 .927
• Residential Low Density o year to Waters of U.S. 0 .487 0.02% .700 .341
Residential Low De!"lsity o year to Waters of u.s. 0 1.802 0.08% .700 1.261
Residential Low Density o year to Waters of u.s. 0 4.313 0.20% .390 1.682
Residential Low Density o year to Waters of u.s. 0 3.123 0.15% .430 1.343Residential Low Density o year to Waters of u.s. 0 1.942 0.09% .350 .680Residential Low Density o year to Waters of u.s. 0 1.359 0.06% .480 .652'. Residential Low Density o year to Waters of u.s. 0 7.923 0.37"1. .410 3.249Residential Low Density o year to Waters of U.S. 0 2.478 0.12% .390 .966Residential Low Density o year to Waters of u.s. 0 5.226 0.24% .390 2.038Residential Low Density o year to Waters of u.s. 0 5.228 0.25% .390 2.039Residential Low Density o year to Waters of u.s. 0 5.330 0.25% .390 2.079Residential Low Density o year to Waters of u.s. 0 .968 0.05% .650 .629
• Residential Low Density o year to Waters of u.s. 0 1.306 0.06% .350 .457Residential Low Density o year to Waters of u.s. 0 2.735 0.13% .390 1.067Residential Low Density o year to Waters of U.S. 0 .222 0.01% .410 .091Residential Low Density o year to Waters of u.s. 0 1.688 0.08% .410 .692Residential Low Density o year to Waters of U.S. 0 2.423 0.11% .410 .993Residential Low Density o year to Waters of U.S. 0 4.310 0.20% .410 1.767
• Residential Low Density o year to Waters of U.S. 0 7.684 0.36% .410 3.150
Residential Low Density o year to Waters of U.S. 0 3.763 0.18% .480 1.806Residential Low Density o year to Waters of U.S. 0 1.094 0.05% .800 .875Residential Low Density o year to Waters of U.S. 0 4.029 0.19% .800 3.223Residential Low Density o year to Waters of U.S. 0 3.646 0.17% .800 2.917Residential Low Density o year to Waters of U.S. 0 1.639 0.08% .800 1.311
• Residential Low Density o year to Waters of U.S. 0 4.714 0.22% .590 2.781Residential Low Density o year to Waters of U.S. 0 3.099 0.15% .430 1.333Residential Low Density o year to Waters of U.S. 0 5.034 0.24% .390 1.963Residential Low Density o year to Waters of U.S. 0 1.285 0.06% .350 .450Residential Low Density o year to Waters of U.S. 0 2.650 0.12% .650 1. 722Residential Low Density o year to Waters of U.S. 0 6.513 0.31% .650 4.233
• Residential Low Density o year to Waters of U.S. 0 2.300 0.11% .430 .989Residential Low Density o year to Waters of U.S. 0 4.432 0.21% .390 1.729Residential Low Density o year to Waters of U.S. 0 2.529 0.12% .830 2.099Residential Low Density o year to Waters of U.S. 0 2.352 0.11% .750 1.764Residential Low Density o year to Waters of U.S. 0 .255 0.01% .800 .204Residential Low Density o year to Waters of U.S. 0 4.004 0.19% .800 3.203
• Residential Low Density o year to Waters of U.S. 0 3.766 0.18% .410 1.544Residential Low Density o year to Waters of U.S. 0 6.135 0.29% .410 2.515Residential Low Density o year to Retention Basin 0 .373 0.02% .800 .298Residential Low Density 5 year on Lot 0 2.302 0.11% .002 .005Residential Low Density 5 year on Lot 0 7.747 0.36% .002 .015Residential Low Density 5 year on Lot 0 .884 0.04% .002 .002
• Residential Low Density 5 year on Lot 0 1.828 0.09% .002 .004Residential Low Density 5 year on Lot 0 1.074 0.05% .002 .002Residential Low Density 5 year on Lot 0 .285 0.01% .002 .001Residential Low Density 5 year on Lot 0 .036 0.00% .002 .000
•

•ID Outfall Name Area Outfall Size Parent Id
-~_ .._------------------------------------------------ ------------------------------------------------------------------------_.TO-Os 52nd St and DITCH 2133.320 102--------------------------------------------------------------------------------------------------------------------------------
!. Landuse Retention Population Area %Tot Area COE CA Avg COE
-----------------------------------------------------------------------------------------------------------------------------Residential Low Density 5 year on Lot 0 4.991 0.23% .002 .010Residential Low Density 5 year on Lot 0 2.789 0.13% .002 .006Residential Low Density 5 year on Lot 0 2.839 0.13% .002 .006Residential Low Density 5 year on Lot 0 1.880 0.09% .002 .004Residential Low Density 5 year on Lot 0 4.275 0.20% .002 .009• Residential Low Density 5 year on Lot 0 1.883 0.09% .002 .004Residential Low Density 5 year on Lot 0 .036 0.00% .002 .000Residential Low Density 5 year on Lot 0 4.247 0.20% .002 .008Residential Low Density 5 year on Lot 0 6.957 0.33% .002 .014Residential Low Density 5 year on Lot 0 3.831 0.18% .002 .008
• Residential Low Density 5 year on Lot 0 4.430 0.21% .002 .009Residential Low Density 5 year on Lot 0 2.658 0.12% .002 .005Residential Low Density 5 year on Lot 0 2.251 0.11% .002 .005Residential Low Density 5 year on Lot 0 2.293 0.11% .002 .005Residential Low Density 5 year on Lot 0 4.975 0.23% .002 .010Residential Low Density 5 year on Lot 0 6.705 0.31% .002 .013
• Residential Low Density 5 year on Lot 0 2.465 0.12% .002 .005Residential Low Density 5 year on Lot 0 8.375 0.39% .002 .017Residential Low Density 5 year on Lot 0 2.429 0.11% .002 .005Residential Low Density 5 year on Lot 0 6.056 0.28% .002 .012Residential Low Density 5 year on Lot 0 3.607 0.17% .002 .007Residential Low Density 5 year on Lot 0 4.025 0.19% .002 .008
• Residential Low Density 5 year on Lot 0 4.441 0.21% .002 .009Residential Low Density 5 year on Lot 0 1.629 0.08% .002 .003Residential Low Density 5 year on Lot 0 10.216 0.48% .002 .020Residential Low Density 5 year on Lot 0 1.346 0.06% .002 .003Residential Low Density 5 year on Lot 0 4.996 0.23% .002 .010Residential Low Density 5 year on Lot 0 2.199 0.10% .002 .004
• Residential Low Density 5 year on Lot 0 2.782 0.13% .002 .006Residential Low Density 5 year on Lot 0 8.347 0.39% .002 .017Residential Low Density 5 year on Lot 0 7.161 0.34% .002 .014Residential Low Density 5 year on Lot 0 5.306 0.25% .002 .011Residential Low Density 5 year on Lot 0 .161 0.01% .002 .000Residential Low Density 5 year on Lot 0 .340 0.02% .002 .001
• Residential Low Density 5 year on Lot 0 5.020 0.24% .002 .010Residential Low Density 5 year on Lot 0 6.652 0.31% .002 .013Residential Low Density 5 year on Lot 0 3.484 0.16% .002 .007Residential Low Density 5 year on Lot 0 8.187 0.38% .002 .016Residential Low Density 5 year on Lot 0 6.971 0.33% .002 .014Residential Low Density 5 year on Lot 0 6.819 0.32% .002 .014
• Residential Low Density 5 year on Lot 0 2.195 0.10% .002 .004Residential Low Density 5 year on Site 0 1.273 0.06% .002 .003Residential Low Density 5 year on Site 0 2.298 0.11% .002 .005Residential Low Density 5 year on Site 0 1.134 0.05% .002 .002Residential Low Density 5 year on Site 0 .514 0.02% .002 .001Residential Low Density 5 year on Site 0 2.087 0.10% .002 .004
• Residential Low Density 5 year on Site 0 1.780 0.08% .002 .004Residential Low Density 5 year on Site 0 12.659 0.59% .002 .025Residential Low Density 5 year on Site 0 8.001 0.38% .002 .016Residential Low Density 5 year on Site 0 .314 0.01% .002 .001
•

•ID Outfall Name Area Outfall Size Parent Id
------------------------------------------------------------------------------------------------------------.-._--------------_.TD-05 52nd St and DITCH 2133.320 102------------------------------------------------------------------------------------------------------------.------.---------_ ..I. Landuse Retention Population Area % Tot Area COE CA Avg COE
---------------------------------------------------------------------------------------------------------------------------_.Residential Low Density 5 year on Site 0 4.944 0.23% .002 .010Residential Low Density 5 year on Site 0 4.966 0.23% .002 .010
Residential Low Density 5 year on Site 0 2.671 0.13% .002 .005Residential Low Density 5 year on Site 0 2.867 0.13% .002 .006
• Residential Low Density 5 year on Site 0 7.596 0.36% .002 .015Residential Low Density 5 year on Site 0 1.583 0.07% .002 .003Residential Low Density 5 year on Site 0 .109 0.01% .002 .000Residential Low Density 5 year on Site 0 .698 0.03% .002 .001Residential Low Density 5 year on Site 0 3.748 0.18% .002 .007Residential Low Density 5 year on Site 0 2.405 0.11% .002 .005
• Residential Low Density 100 year on Lot 0 7.585 0.36% .001 .008Residential Low Density 100 year on Lot 0 3.720 0.17% .001 .004Residential Low Density 100 year on Lot 0 3.719 0.17"10 .001 .004Residential Low Density 100 year on Site 0 1.218 0.06% .001 .001Residential Low Density 100 year on Site 0 3.010 0.14% .001 .003Residential Low Density 100 year on Site 0 .542 0.03% .001 .001
• Residential Low Density 100 year on Site 0 1.827 0.09% .001 .002Residential Low Density Detention Area on Site 0 37.503 1.76% .500 18.751Residential High Density 0 year to Waters of u.S. 0 9.092 0.43% .750 6.819Residential High Density 0 year to Waters of u.S. 0 2.656 0.12% .550 1.461Residential High Density 0 year to Waters of u.S. 0 .887 0.04% .650 .577Residential High Density 0 year to Waters of u.S. 0 .775 0.04% .850 .659
• Residential High Density 0 year to Waters of u.S. 0 .514 0.02% .850 .437Residential High Density 5 year on Lot 0 4.870 0.23% .002 .010Residential High Density 100 year on Site 0 9.998 0.47"10 .001 .010Residential High Density 100 year on Site 0 13.907 0.65% .001 .014Residential High Density 100 year on Site 0 9.398 0.44% .001 .009Residential High Density 100 year on Site 0 15.868 0.74% .001 .016
• Residential High Density 100 year on Site 0 13.157 0.62% .001 .013Residential High Density 100 year on Site 0 13.457 0.63% .001 .013Residential High Density 100 year on Site 0 9.560 0.45% .001 .010Residential High Density 100 year on Site 0 15.218 0.71% .001 .015Residential High Density 100 year on Site 0 9.252 0.43% .001 .009Residential High Density 100 year on Site 0 8.957 0.42% .001 .009
• Residential High Density 100 year on Site 0 8.920 0.42% .001 .009Residential High Density 100 year on Site 0 9.283 0.44% .001 .009Comm Res Office, Church o year to Waters of u.S. 0 .779 0.04% .900 .701Comm Res Office, Church o year to Waters of u.S. 0 1.146 0.05% .900 1.032Comm Res Office, Church o year to Waters of U.S. 0 .994 0.05% .850 .845Comm Res Office, Church o year to Waters of u.S. 0 .570 0.03% .350 .199
• Comm Res Office, Church o year to Waters of u.S. 0 .918 0.04% .950 .872Comm Res Office, Church o year to Waters of u.S. 0 .674 0.03% .800 .539Comm Res Office, Church o year to Waters of u.S. 0 .512 0.02% .900 .461Comm Res Office, Church o year to Waters of u.S. 0 .752 0.04% .950 .714Comm Res Office, Church o year to Waters of u.S. 0 .305 0.01% .950 .289Comm Res Office, Church o year to Waters of u.S. 0 1.021 0.05% .750 .766
• Comm Res Office, Church o year to Waters of u.S. 0 .558 0.03% .900 .502Comm Res Office, Church o year to Waters of u.S. 0 .422 0.02% .950 .401Comm Res Office, Church o year to Waters of u.S. 0 5.689 0.27% .950 5.404Comm Res Office, Church o year to Waters of u.S. 0 .572 0.03% .950 .543
•

•ID Outfall Name Area Outfall Size Parent Id
-------------.----------------------------------------------------------------------------------------------.------------------TO-Os 52nd St and DITCH 2133.320 102--------------------------------.---------------------------------------------------------------------------.------------------
i.Landuse Retention Population Area % Tot Area COE CA Avg COE----------------------------------------------------------------------------------------------------------------------------Comm Res Office, Church o year to Waters of u.s. 0 .379 0.02% .850 .322Comm Res Office, Church o year to Waters of u.s. 0 .325 0.02% .850 .277Comm Res Office, Church o year to Waters of u.s. 0 .493 0.02% .850 .419
Comm Res Office, Church o year to Waters of u.s. 0 1.929 0.09% .900 1.737
Comm Res Office, Church o year to Waters of u.s. 0 .991 0.05% .900 .892• Comm Res Office, Church o year to Waters of u.s. 0 1.454 0.07"1. .900 1.308
Comm Res Office, Church o year to Waters of u.s. 0 .730 0.03% .900 .657
Comm Res Office, Church o year to Waters of u.s. 0 .996 0.05% .800 .797
Comm Res Office, Church o year to Retention Basin 0 2.079 0.10% .500 1.040
Comm Res Office, Church 5 year on Lot 0 .328 0.02% .002 .001Comm Res Office, Church 5 year on Lot 0 1.395 0.07"1. .002 .003• Comm Res Office, Church 5 year on Lot 0 1.545 0.07"1. .002 .003Comm Res Office, Church 5 year on Lot 0 8.695 0.41% .002 .017
Comm Res Office, Church 5 year on Lot 0 .700 0.03% .002 .001Comm Res Office, Church 5 year on Lot 0 1.823 0.09% .002 .004Comm Res Office, Church 5 year on Site 0 12.410 0.58% .002 .025Comm Res Office, Church 5 year on Site 0 2.521 0.12% .002 .005• Comm Res Office, Church 5 year on Site 0 3.744 0.18% .002 .007
Comm Res Office, Church 5 year on Site 0 19.459 0.91% .002 .039Comm Res Office, Church 5 year on Site 0 5.949 0.28% .002 .012Comm Res Office, Church 100 year on Site 0 .546 0.03% .001 .001Comm Res Office, Church 100 year on Site 0 11.726 0.55% .001 .012Comm Res Office, Church 100 year on Site 0 1.264 0.06% .001 .001• Comm Res Office, Church 100 year on Site 0 .609 0.03% .001 .001Comm Res Office, Church Detention Area on Site 0 2.790 0.13% .950 2.650Comm Res Office, Church Detention Area on Site 0 4.011 0.19% .950 3.810Comm Res Office, Church Detention Area on Site 0 3.115 0.15% .950 2.959Comm Res Office, Church Detention Area on Site 0 3.369 0.16% .950 3.201Comm Res Office, Church Detention Area on Site 0 7.412 0.35% .950 7.042• Comm Hotels,Restraunts o year to Waters of u.S. 0 .000 0.00% .800 .000Comm Hotels,Restraunts o year to Waters of U.S. 0 1.341 0.06% .800 1.072Comm Hotels,Restraunts o year to Waters of u.S. 0 1.075 0.05% .950 1.021Comm Hotels,Restraunts o year to Waters of u.S. 0 1.014 0.05% .950 .964Comm Hotels,Restraunts o year to Waters of u.S. 0 .935 0.04% .950 .888Comm Hotels,Restraunts o year to Waters of u.S. 0 .723 0.03% .850 .614• Comm Hotels,Restraunts o year to Waters of u.S. 0 .354 0.02% .950 .336Comm Hotels,Restraunts o year to Waters of u.S. 0 1.578 0.07% .950 1.500Comm Hotels,Restraunts o year to Waters of u.S. 0 2.849 0.13% .950 2.706Comm Hotels,Restraunts o year to Waters of u.S. 0 .933 0.04% .900 .840Comm Hotels,Restraunts o year to Waters of u.S. 0 2.074 0.10% .500 1.037
• Comm Hotels,Restraunts o year to Waters of u.S. 0 1.010 0.05% .900 .909Comm Hotels,Restraunts o year to Waters of u.S. 0 .498 0.02% .900 .448Comm Hotels,Restraunts o year to Retention Basin 0 .909 0.04% .950 .864Comm Hotels,Restraunts o year to Retention Basin 0 4.575 0.21% .950 4.346Comm Hotels,Restraunts 5 year on Lot 0 5.324 0.25% .002 .011Comm Hotels,Restraunts 5 year on Lot 0 .844 0.04% .002 .002
• Comm Hotels,Restraunts 5 year on Site 0 1.274 0.06% .002 .003Comm Hotels,Restraunts 5 year on Site 0 .684 0.03% .002 .001Comm Hotels,Restraunts 5 year on Site 0 .778 0.04% .002 .002Comm Hotels,Restraunts 100 year on Site 0 3.232 0.15% .001 .003
•

•ID Outfall Name Area Outfall Size Parent Id
----------------------------------------------------------------------------------------------_._._----------------------------TO-05 52nd St and DITCH 2133.320 102-------------------------.----------------------------------------------------------------------------------------------_._. __ .-I. Landuse Retention Population Area % Tot Area COE CA Avg COE
------------------------------------------------------------------------------_._-----------------------------------------_ ..
Comm Hotels,Restraunts 100 year on Site 0 .503 0.02% .001 .001Comm Hotels,Restraunts 100 year on Site 0 3.835 0.18% .001 .004Comm Hotels,Restraunts 100 year on Site 0 2.612 0.12% .001 .003Comm Hotels,Restraunts 100 year on Site 0 2.198 0.10% .001 .002
• Comm Hotels,Restraunts 100 year on Site 0 2.468 0.12% .001 .002Comm Hotels,Restraunts Detention Area on Site 0 1.237 0.06% .950 1.175Comm Hotels,Restraunts Detention Area on Site 0 .438 0.02% .950 .416Comm Hotels,Restraunts Detention Area on Site 0 2.571 0.12% .001 .003Comm Hotels,Restraunts Vacant Land 0 yr Retentio 0 2.880 0.14% .950 2.736Comm Mall, Strp Cntr,Ret 0 year to Waters of u.S. 0 .388 0.02% .850 .330
• Comm Mall, Strp Cntr,Ret 0 year to Waters of u.S. 0 1.069 0.05% .850 .909Comm Mall, Strp Cntr,Ret 0 year to Waters of u.S. 0 1.047 0.05% .800 .838Comm Mall, Strp Cntr,Ret 5 year on Site 0 3.409 0.16% .002 .007Comm Mall, Strp Cntr,Ret 100 year on Site 0 8.582 0.40% .001 .009Comm Mall, Strp Cntr,Ret 100 year on Site 0 1.834 0.09% .001 .002Comm Mall, Strp Cntr,Ret Detention Area on Site 0 10.461 0.49% .000 .000
• Comm Auto,Gas Sta,Pk Lot 0 year to Waters of u.S. 0 .520 0.02% .950 .494Comm Auto,Gas Sta,Pk Lot 0 year to Waters of u.S. 0 .947 0.04% .900 .852Comm Auto,Gas Sta,Pk Lot 0 year to Waters of u.S. 0 1.139 0.05% .950 1.082Comm Auto,Gas Sta,Pk Lot 0 year to Waters of u.S. 0 .894 0.04% .950 .850Comm Auto,Gas Sta,Pk Lot 0 year to Waters of u.S. 0 .372 0.02% .950 .353Comm Auto,Gas Sta,Pk Lot 0 year to Waters of u.S. 0 .882 0.04% .950 .838
• Comm Auto,Gas Sta,Pk Lot 0 year to Waters of u.S. 0 .367 0.02% .950 .349Comm Auto,Gas Sta,Pk Lot 0 year to Retention Basin 0 .367 0.02% .950 .349Comm Auto,Gas Sta,Pk Lot 0 year to Retention Basin 0 .540 0.03% .950 .513Comm Auto,Gas Sta,Pk Lot 5 year on Lot 0 .578 0.03% .002 .001Comm Auto,Gas Sta,Pk Lot 5 year on Site 0 .604 0.03% .002 .001Comm Auto,Gas Sta,Pk Lot 5 year on Site 0 .429 0.02% .002 .001
• Comm Auto,Gas Sta,Pk Lot 100 year on Site 0 .698 0.03% .001 .001Comm Auto,Gas Sta,Pk Lot 100 year on Site 0 .983 0.05% .001 .001Comm Auto,Gas Sta,Pk Lot 100 year on Site 0 7.500 0.35% .001 .008Comm Auto,Gas Sta,Pk Lot Detention Area on Site 0 1.146 0.05% .950 1.089Ind Park-light o year to Waters of u.S. 0 1.278 0.06% .950 1.214Ind Park-l i ght o year to Waters of u.S. 0 .871 0.04% .950 .828
• Ind Park-l ight o year to Waters of u.S. 0 1.524 0.07"" .950 1.448Ind Park-light o year to Waters of u.S. 0 1.668 0.08% .900 1.502Ind Park-light o year to Waters of u.S. 0 3.363 0.16% .900 3.026Ind Park-light o year to Waters of u.S. 0 .826 0.04% .850 .702Ind Park-light o year to Waters of u.S. 0 1.843 0.09% .900 1.659Ind Park-l ight o year to Waters of u.S. 0 2.540 0.12% .950 2.413
• Ind Park-light o year to Waters of u.S. 0 .987 0.05% .950 .938Ind Park-light o year to Waters of u.S. 0 4.312 0.20% .950 4.097Ind Park-light o year to Waters of u.S. 0 1.332 0.06% .900 1.199Ind Park-light o year to Waters of u.S. 0 .845 0.04% .950 .802Ind Park-light o year to Waters of u.S. 0 .728 0.03% .950 .692Ind Park-light o year to Waters of u.S. 0 .746 0.03% .950 .708
• Ind Park-light o year to Waters of u.S. 0 2.368 0.11% .900 2.131Ind Park-light o year to Waters of u.S. 0 1.666 0.08% .800 1.333Ind Park-light o year to Waters of U.S. 0 2.508 0.12% .950 2.383Ind Park-li ght o year to Waters of u.S. 0 5.658 0.27"" .950 5.375
•
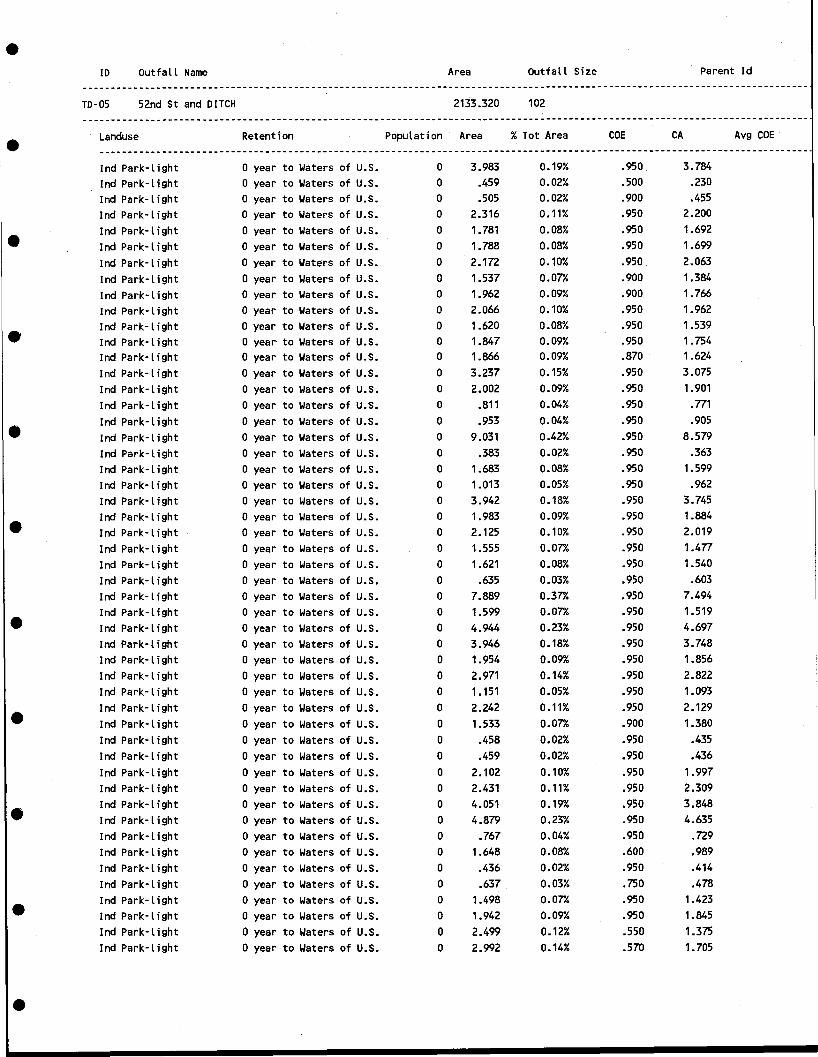
•ID OutfaL L Name Area OutfaLL Size Parent Id
M _____________________________________________________ ------------------------------------------------------------------------.
TO-Os 52nd St and DITCH 2133.320 102-------------------------------------------------------------------------------------------------------------------------------
• Landuse Retention PopuLation Area %Tot Area COE CA Avg COE----------------------------------------------------------------------------------------------------------------------------Ind Park-Light o year to Waters of u.s. 0 3.983 0.19% .950 3.784Ind Park-Light o year to Waters of u.s. 0 .459 0.02% .500 .230Ind Park-Light o year to Waters of u.s. 0 .505 0.02% .900 .455Ind Park- Light o year to Waters of u.s. 0 2.316 0.11% .950 2.200
Ind Park-Light o year to Waters of u.s. 0 1.781 0.08% .950 1.692• Ind Park-Light o year to Waters of u.s. 0 1.788 0.08% .950 1.699
Ind Park-Light o year to Waters of u.s. 0 2.172 0.10% .950 2.063
Ind Park-Light o year to Waters of u.s. 0 1.537 0.07% .900 1.384Ind Park-Light o year to Waters of u.S. 0 1.962 0.09% .900 1.766
Ind Park-Light o year to Waters of u.s. 0 2.066 0.10% .950 1.962Ind Park-Light o year to Waters of u.s. 0 1.620 0.08% .950 1.539• Ind Park- Light o year to Waters of u.s. 0 1.847 0.09% .950 1.754Ind Park-Light o year to Waters of u.s. 0 1.866 0.09% .870 1.624Ind Park-Light o year to Waters of u.s. 0 3.237 0.15% .950 3.075
Ind Park-Light o year to Waters of u.S. 0 2.002 0.09% .950 1.901Ind Park- Light o year to Waters of u.s. 0 .811 0.04% .950 .771
• Ind Park-Light o year to Waters of u.s. 0 .953 0.04% .950 .905
Ind Park-light o year to Waters of u.s. 0 9.031 0.42% .950 8.579Ind Park-light o year to Waters of u.s. 0 .383 0.02% .950 .363Ind Park- Light o year to Waters of u.s. 0 1.683 0.08% .950 1.599Ind Park-Light o year to Waters of u.s. 0 1.013 0.05% .950 .962Ind Park-l ight o year to Waters of u.s. 0 3.942 0.18% .950 3.745Ind Park-Light o year to Waters of u.s. 0 1.983 0.09% .950 1.884• Ind Park-Light o year to Waters of u.S. 0 2.125 0.10% .950 2.019Ind Park-light o year to Waters of u.s. 0 1.555 0.07% .950 1.477Ind Park-light o year to Waters of u.s. 0 1.621 0.08% .950 1.540Ind Park-Light o year to Waters of u.s. 0 .635 0.03% .950 .603Ind Park-Light o year to Waters of u.s. 0 7.889 0.37"" .950 7.494Ind Park-Light o year to Waters of u.s. 0 1.599 0.07"" .950 1.519• Ind Park-Light o year to Waters of u.s. 0 4.944 0.23% .950 4.697Ind Park-Light o year to Waters of u.s. 0 3.946 0.18% .950 3.748Ind Park-Light o year to Waters of u.S. 0 1.954 0.09% .950 1.856Ind Park-Light o year to Waters of u.s. 0 2.971 0.14% .950 2.822Ind Park-Light o year to Waters of u.S. 0 1.151 0.05% .950 1.093
• Ind Park- Light o year to Waters of u.s. 0 2.242 0.11% .950 2.129Ind Park-light o year to Waters of u.S. 0 1.533 0.07"" .900 1.380Ind Park-light o year to Waters of u.s. 0 .458 0.02% .950 .435Ind Park-light o year to Waters of u.s. 0 .459 0.02% .950 .436Ind Park-light o year to Waters of u.s. 0 2.102 0.10% .950 1.997Ind Park-light o year to Waters of u.S. 0 2.431 0.11% .950 2.309
• Ind Park-light o year to Waters of u.S. 0 4.051 0.19% .950 3.848Ind Park-l ight o year to Waters of u.s. 0 4.879 0.23% .950 4.635Ind Park-light o year to Waters of u.s. 0 .767 0.04% .950 .729Ind Park-light o year to Waters of u.s. 0 1.648 0.08% .600 .989Ind Park-light o year to Waters of u.s. 0 .436 0.02% .950 .414Ind Park-light o year to Waters of u.s. 0 .637 0.03% .750 .478
• Ind Park-light o year to Waters of u.s. 0 1.498 0.07"" .950 1.423Ind Park-light o year to Waters of u.s. 0 1.942 0.09% .950 1.845Ind Park-light o year to Waters of U.S. 0 2.499 0.12% .550 1.375Ind Park-light o year to Waters of u.S. 0 2.992 0.14% .570 1.705
•

•ID Outfall Name Area Outfall Size Parent Id
-------------------------------------------------------------------------------------------------------------------------------TO-05 52nd St and DITCH 2133.320 102----------------------------------------------------------------------------------------------------------------------------
• Landuse Retention Population Area %Tot Area COE CA Avg COE
----------------------------------------------------------------------------------------------------------------------------Ind Park-l ight o year to Waters of u.s. 0 1. 718 0.08% .950 1.632Ind Park-light o year to Waters of u.s. 0 4.032 0.19% .950 3.830Ind Park-light o year to Waters of u.s. 0 1.208 0.06% .950 1.147Ind Park-light o year to Waters of u.s. 0 1.006 0.05% .750 .754
• Ind Park-light o year to Waters of u.s. 0 4.509 0.21% .950 4.284Ind Park-l ight o year to Retention Basin 0 1.812 0.08% .900 1.631Ind Park-light 5 year on Lot 0 .473 0.02% .002 .001Ind Park-light 5 year on Lot 0 .386 0.02% .002 .001Ind Park-light 5 year on Lot 0 .387 0.02% .002 .001Ind Park-light 5 year on Lot 0 6.821 0.32% .002 .014
• Ind Park-l ight 5 year on Lot 0 .626 0.03% .002 .001Ind Park-l ight 5 year on Lot 0 1.068 0.05% .002 .002Ind Park-l ight 5 year on Lot 0 3.081 0.14% .002 .006Ind Park-light 5 year on Site 0 2.037 0.10% .002 .004Ind Park-l ight 5 year on Site 0 1.485 0.07"10 .002 .003Ind Park-light 5 year on Site 0 2.236 0.10% .002 .004
• Ind Park-light 5 year on Site 0 2.503 0.12% .002 .005Ind Park-light 5 year on Site 0 1.565 0.07"10 .002 .003Ind Park-light 5 year on Site 0 .830 0.04% .002 .002Ind Park-light 5 year on Site 0 1.819 0.09% .002 .004Ind Park-light 5 year on Site 0 .768 0.04% .002 .002Ind Park-light 5 year on Site 0 2.805 0.13% .002 .006
• Ind Park-light 5 year on Site 0 .860 0.04% .002 .002Ind Park-light 5 year on Site 0 1.028 0.05% .002 .002Ind Park-light 5 year on Site 0 4.650 0.22% .002 .009Ind Park-light 5 year on Site 0 8.436 0.40% .002 .017Ind Park-light 5 year on Site 0 .860 0.04% .002 .002Ind Park-light 5 year on Site 0 4.268 0.20% .002 .009
• Ind Park-light 5 year on Site 0 1.221 0.06% .002 .002Ind Park-light 5 year on Site 0 5.832 0.27% .002 .012Ind Park-light 5 year on Site 0 .651 0.03% .002 .001Ind Park-l ight 5 year on Site 0 1.909 0.09% .002 .004Ind Park-light 5 year on Site 0 2.817 0.13% .002 .006Ind Park-light 5 year on Site 0 .138 0.01% .002 .000
• Ind Park-light 5 year on Site 0 1.953 0.09% .002 .004Ind Park-light 5 year on Site 0 .833 0.04% .002 .002Ind Park-light 5 year on Si te 0 1.030 0.05% .002 .002Ind Park-light 5 year on Site 0 .856 0.04% .002 .002Ind Park-light 5 year on Site 0 1.521 0.07% .002 .003Ind Park-light 5 year on Site 0 .856 0.04% .002 .002
• Ind Park-light 5 year on Site 0 1.028 0.05% .002 .002Ind Park-light 5 year on Site 0 1.031 0.05% .002 .002Ind Park-light 5 year on Site 0 1.157 0.05% .002 .002Ind Park-light 5 year on Site 0 1.376 0.06% .002 .003Ind Park-light 5 year on Site 0 1.193 0.06% .002 .002Ind Park-light 5 year on Site 0 .878 0.04% .002 .002
• Ind Park-light 5 year on Site 0 1.997 0.09% .002 .004Ind Park-light 5 year on Site 0 1.706 0.08% .002 .003Ind Park-light 5 year on Site 0 .850 0.04% .002 .002Ind Park-light 5 year on Site 0 .928 0.04% .002 .002
•

•10 Outfall Name Area Outfall Size Parent Id
-------------------------------------------------------------------------------------------------------------------------------TO-OS 52nd St and DITCH 2133.320 102
-------------------------------------------------------------------------------------------------------------------------------Landuse Retention Population Area % Tot Area COE CA Avg COE• ----------------------------------------------------------------------------------------------------------------------------Ind Park-light 5 year on Site 0 2.588 0.12% .002 .005
Ind Park-light 5 year on Site 0 2.811 0.13% .002 .006
Ind Park-light 5 year on Site 0 .773 0.04% .002 .002
Ind Park-light 5 year on Site 0 2.457 0.12% .002 .005
Ind Park-light 5 year on Site 0 .897 0.04% .002 .002• Ind Park-l ight 5 year on Si te 0 1.040 0.05% .002 .002
Ind Park-l ight 5 year on Site 0 1.441 0.07"1. .002 .003
Ind Park-l ight 5 year on Site 0 4.601 0.22% .002 .009
Ind Park-light 5 year on Site 0 3.341 0.16% .002 .007
Ind Park-light 5 year on Site 0 2.707 0.13% .002 .005
Ind Park-light 5 year on Site 0 1.791 0.08% .002 .004• Ind Park-l ight 100 year on Site O· 2.765 0.13% .001 .003Ind Park-light 100 year on Site 0 5.366 0.25% .001 .005
Ind Park-l ight 100 year on Site 0 9.520 0.45% .001 .010Ind Park-light 100 year on Site 0 2.295 0.11% .001 .002Ind Park-light 100 year on Site 0 6.808 0.32% .001 .007
Ind Park-light 100 year on Site 0 12.659 0.59% .001 .013• Ind Park-light 100 year on Site 0 2.388 0.11% .001 .002Ind Park-light 100 year on Site 0 .788 0.04% .001 .001Ind Park-light 100 year on Site 0 2.478 0.12% .001 .002Ind Park-light 100 year on Site 0 .703 0.03% .001 .001Ind Park-light 100 year on Site 0 .944 0.04% .001 .001Ind Park-light 100 year on Site 0 4.706 0.22% .001 .005• Ind Park-light 100 year on Site 0 .847 0.04% .001 .001Ind Park-light 100 year on Site 0 2.007 0.09% .001 .002Ind Park-l ight 100 year on Site 0 7.296 0.34% .001 .007Ind Park-light 100 year on Site 0 8.005 0.38% .001 .008Ind Park-light 100 year on Site 0 3.025 0.14% .001 .003Ind Park-light 100 year on Site 0 9.736 0.46% .001 .010• Ind Park-light 100 year on Site 0 1.158 0.05% .001 .001Ind Park-light 100 year on Site 0 1.295 0.06% .001 .001Ind Park-light 100 year on Site 0 1.428 0.07% .001 .001Ind Park-light 100 year on Site 0 .646 0.03% .001 .001Ind Park-light 100 year on Site 0 .722 0.03% .001 .001
• Ind Park-light 100 year on Site 0 .646 0.03% .001 .001Ind Park-light 100 year on Site 0 .646 0.03% .001 .001Ind Park-light 100 year on Site 0 1.091 0.05% .001 .001Ind Park-light 100 year on Site 0 .935 0.04% .001 .001Ind Park-light 100 year on Site 0 3.568 0.17"1. .001 .004Ind Park-light 100 year on Site 0 2.701 0.13% .001 .003
• Ind Park-light 100 year on Site 0 4.234 0.20% .001 .004Ind Park-light 100 year on Site 0 1.288 0.06% .001 .001Ind Park-light 100 year on Site 0 .594 0.03% .001 .001Ind Park-l ight 100 year on Site 0 .670 0.03% .001 .001Ind Park-light 100 year on Site 0 .594 0.03% .001 .001Ind Park-light 100 year on Site 0 .594 0.03% .001 .001
• Ind Park-light 100 year on Site 0 .719 0.03% .001 .001Ind Park-light 100 year on Site 0 .791 0.04% .001 .001Ind Park-light 100 year on Site 0 .708 0.03% .001 .001Ind Park-light 100 year on Site 0 2.911 0.14% .001 .003
•

•ID Outfall Name Area Outfall Size Parent Id
-----------------------------------------------------------------------------------------------------------------------------_.-TO-05 52nd St and DITCH 2133.320 102--------------------------------------------------------------------------------------------------------------------------------
• Landuse Retention Population Area % Tot Area COE CA Avg COE------------------------------------------------------------------------------------.--------------------------.--.-------_ ..
Ind Park-light 100 year on Site 0 1.734 0.08% .001 •002Ind Park-light 100 year on Site 0 .987 0.05% .001 .001Ind Park-light 100 year on Site 0 1.379 0.06% .001 .001Ind Park-light 100 year on Site 0 1.550 0.07% .001 .002
• Ind Park-light 100 year on Site 0 1.904 0.09% .001 .002Ind Park-light 100 year on Site 0 1.550 0.07% .001 .002Ind Park-light 100 year on Site 0 2.027 0.10% .001 .002Ind Park-light 100 year on Site 0 5.547 0.26% .001 .006Ind Park-light 100 year on Site 0 4.627 0.22% .001 .005Ind Park-light 100 year on Site 0 5.076 0.24% .001 .005
• Ind Park-light 100 year on Site 0 4.702 0.22% .001 .005Ind Park-light 100 year on Site 0 2.716 0.13% .001 .003Ind Park-light 100 year on Site 0 3.306 0.15% .001 .003Ind Park-light 100 year on Site 0 3.133 0.15% .001 .003Ind Park-light 100 year on Site 0 4.704 0.22% .001 .005Ind Park-light 100 year on Site 0 1.648 0.08% .001 .002
• Ind Park-light 100 year on Site 0 7.944 0.37% .001 .008Ind Park-light 100 year on Site 0 2.401 0.11% .001 .002Ind Park-light Detention Basin 0 3.649 0.17"-' .950 3.466Ind Park-light Detention Basin 0 1.900 0.09% .950 1.805Ind Park-light Detention Area on Site 0 1.543 0.07"-' .950 1.466Ind Park-l ight Vacant Land 100 yr Retent 0 8.152 0.38% .001 .008
• Ind Large Site-Medium o year to Waters of u.S. 0 9.727 0.46% .950 9.240Ind Large Site-Medium o year to Waters of u.S. 0 4.384 0.21% .950 4.164Ind Large Site-Medium o year to Waters of u.S. 0 15.941 0.75% .950 15.144Ind Large Site-Medium o year to Waters of u.S. 0 4.456 0.21% .950 4.233Ind Large Site-Medium o year to Waters of u.S. 0 1.492 0.07% .900 1.343Ind Large Site-Medium o year to Waters of u.S. 0 9.048 0.42% .950 8.596
• Ind Large Site-Medium 5 year on Site 0 10.227 0.48% .002 .020Ind Large Site-Medium 5 year on Site 0 1.135 0.05% .002 .002Ind Large Site-Medium 5 year on Site 0 3.273 0.15% .002 .007Ind Large Site-Medium 100 year on Site 0 29.189 1.37"-' .001 .029Ind Large Site-Medium 100 year on Site 0 4.043 0.19% .001 .004Ind Large Site-Medium Detention Basin 0 13.584 0.64% .950 12.905
• Ind Large Site-Medium Detention Area on Site 0 .299 0.01% .950 .285Ind Foundry,Elec,PPs o year to Waters of u.S. 0 4.327 0.20% .001 .004Ind Foundry,Elec,PPs 100 year on Site 0 .985 0.05% .001 .001Agricultural 100 year on Site 0 7.320 0.34% .001 .007Vacant Land o year to Waters of u.S. 0 1.158 0.05% .250 .289Vacant Land o year to Waters of u.S. 0 1.338 0.06% .200 .268
• Vacant Land o year to Waters of u.S. 0 2.725 0.13% .200 .545Vacant Land o year to Waters of u.S. 0 .861 0.04% .200 .172Vacant Land o year to Waters of u.S. 0 5.358 0.25% .200 1.072Vacant Land o year to Waters of u.S. 0 3.989 0.19% .200 .798Vacant Land o year to Waters of u.S. 0 5.591 0.26% .200 1.118Vacant Land o year to Waters of u.S. 0 .689 0.03% .200 .138
• Vacant Land o year to Waters of u.S. 0 25.236 1.18% .200 5.047Vacant Land o year to Waters of u.S. 0 93.686 4.39% .200 18.737Vacant Land o year to Waters of u.S. 0 1.410 0.07% .200 .282Vacant Land o year to Waters of u.S. 0 2.565 0.12% .200 .513
•

•10 Outfall Name Area Outfall Size Parent Id
_~w ____ w ______________________________________________ ______________________________________________________ -----------------
TO-05 52nd St and DITCH 2133.320 102-------------------------------------------------------------------------------------------------------------------------------
• Landuse Retention Population Area % Tot Area COE CA Avg COE----------------------------------------------------------------------------------------------------------------------------Vacant Land o year to Waters of u.s. 0 4.994 0.23% .200 .999
Vacant Land o year to Waters of u.s. 0 2.777 0.13% .200 .555Vacant Land 100 year on Site 0 1.824 0.09% .001 .002
Vacant Land 100 year on Site 0 1.917 0.09% .001 .002
• Vacant Land 100 year on Site 0 7.888 0.37"1. .001 .008Vacant Land 100 year on Site 0 .852 0.04% .001 .001Vacant Land 100 year on Site 0 1.160 0.05% .001 .001
Vacant Land 100 year on Site 0 1.960 0.09% .001 .002
Vacant Land 100 year on Site 0 .259 0.01% .001 .000
Vacant Land 100 year on Site 0 2.283 0.11% .001 .002
• Vacant Land 100 year on Site 0 .517 0.02% .001 .001Vacant Land 100 year on Site 0 1.257 0.06% .001 .001Vacant Land Vacant Land 0 yr Retentio 0 .500 0.02% .200 .100
Vacant Land Vacant Land 0 yr Retentio 0 1.800 0.08% .200 .360Vacant Land Vacant Land 0 yr Retentio 0 1.378 0.06% .200 .276Vacant Land Vacant Land 0 yr Retentio 0 .546 0.03% .250 .137
• Vacant Land Vacant Land 0 yr Retentio 0 1.624 0.08% .250 .406
Vacant Land Vacant Land 0 yr Retentio 0 1.741 0.08% .250 .435Vacant Land Vacant Land 0 yr Retentio 0 1.590 0.07"1. .200 .318Vacant Land Vacant Land 0 yr Retentio 0 .867 0.04% .200 .173Vacant Land Vacant Land 0 yr Retentio 0 1.474 0.07"1. .200 .295Vacant Land Vacant Land 0 yr Retentio 0 5.551 0.26% .200 1.110
• Vacant Land Vacant Land 0 yr Retentio 0 1.491 0.07"1. .200 .298Vacant Land Vacant Land 0 yr Retentio 0 4.596 0.22% .250 1.149Vacant Land Vacant Land 0 yr Retentio 0 3.892 0.18% .250 .973Vacant Land Vacant Land 0 yr Retentio 0 .489 0.02% .200 .098Vacant Land Vacant Land 0 yr Retentio 0 4.840 0.23% .450 2.178Vacant Land Vacant Land 0 yr Retentio 0 1.011 0.05% .200 .202
• Vacant Land Vacant Land 100 yr Retent 0 .296 0.01% .001 .000Vacant Land Vacant Land 100 yr Retent 0 4.337 0.20% .001 .004Vacant Land Vacant Land 100 yr Retent 0 9.103 0.43% .001 .009Vacant Land Vacant Land 100 yr Retent 0 10.799 0.51% .001 .011Vacant Land Vacant Land 100 yr Retent 0 13.092 0.61% .001 .013Vacant Land Vacant Land 100 yr Retent 0 5.113 0.24% .001 .005
• Vacant Land Vacant Land 100 yr Retent 0 10.961 0.51% .001 .011Vacant Land Vacant Land 100 yr Retent 0 7.695 0.36% .001 .008Vacant Land Vacant Land 100 yr Retent 0 3.095 0.15% .001 .003Vacant Land Vacant Land 100 yr Retent 0 4.905 0.23% .001 .005Vacant Land Vacant Land 100 yr Retent 0 9.667 0.45% .001 .010Vacant Land Vacant Land 100 yr Retent 0 10.125 0.47% .001 .010
• Open Space, Pks, Golf o year to Waters of u.S. 0 1.969 0.09% .200 .394Open Space, Pks, Golf 100 year on Site 0 .230 0.01% .001 .000Open Space, Pks, Golf 100 year on Site 0 6.660 0.31% .001 .007Open Space, School o year to Waters of u.S. 0 3.318 0.16% .001 .003Open Space, School 5 year on Site 0 3.150 0.15% .002 .006Open Space, School 100 year on Site 0 36.094 1.69% .001 .036
• Open Space, School 100 year on Site 0 4.435 0.21% .001 .004Municpal Faci l ities 100 year on Site 0 1.047 0.05% .001 .001Municpal Facilities 100 year on Site 0 2.996 0.14% .001 .003Municpal Facilities 100 year on Site 0 5.110 0.24% .001 .005
•

•ID Outfall Name Area Outfall Size Parent Id
-----------------------~------------------------------ -------------------------------------------------------------------------
TD-05 52nd St and DITCH 2133.320 102--------------------------------------------------------------------------------------------------------------------------------
• Landuse Retention Population Area % Tot Area COE CA Avg COE-----------------------------------------------------------------------------------------------------------------------------
Summary for TD-05-----------------------------------------------------------------------------------------------------------------------------Residential Low Density o year to Waters of U.S. 0 128.218 6.01% 64.629 0.504
• Residential Low Density o year to Retention Basin 0 .373 .02% .298 0.799Residential Low Density 5 year on Lot 0 186.403 8.74% .373 0.002Residential Low Density 5 year on Site 0 61.647 2.89% .123 0.002Residential Low Density 100 year on Lot 0 15.024 .70% .015 0.001Residential Low Density 100 year on Site 0 6.597 .31% .007 0.001Residential Low Density Detention Area on Site 0 37.503 1.76% 18.751 0.500
• Residential High Density 0 year to Waters of U.S. 0 13.924 .65% 9.952 0.715Residential High Density 5 year on Lot 0 4.870 .23% .010 0.002Residential High Density 100 year on Site 0 136.973 6.42% .137 0.001Comm Res Office, Church o year to Waters of U.S. 0 22.209 1.04% 19.677 0.886Comm Res Office, Church o year to Retention Basin 0 2.079 .10% 1.040 0.500Comm Res Office, Church 5 year on Lot 0 14.486 .68% .029 0.002
• Comm Res Office, Church 5 year on Site 0 44.083 2.07"1. .088 0.002Comm Res Office, Church 100 year on Site 0 14.146 .66% .014 0.001Comm Res Office, Church Detention Area on Site 0 20.696 .97% 19.661 0.950Comm Hotels,Restraunts o year to Waters of U.S. 0 14.385 .67"1. 12.337 0.858Comm Hotels,Restraunts o year to Retention Basin 0 5.484 .26% 5.210 0.950Comm Hotels,Restraunts 5 year on Lot 0 6.169 .29% .012 0.002
• Comm Hotels,Restraunts 5 year on Site 0 2.737 .13% .005 0.002Camm Hotels,Restraunts 100 year on Site 0 14.849 .70% .015 0.001Camm Hotels,Restraunts Detention Area on Site 0 4.246 .20% 1.594 0.375Comm Hotels,Restraunts Vacant Land 0 yr Retentio 0 2.880 .14% 2.736 0.950Comm Mall, Strp Cntr,Ret 0 year to Waters of U.S. 0 2.504 .12% 2.076 0.829Camm Mall, Strp Cntr,Ret 5 year on Site 0 3.409 .16% .007 0.002
• Comm Mall, Strp Cntr,Ret 100 year on Site 0 10.416 .49% .010 0.001Comm Mall, Strp Cntr,Ret Detention Area on Site 0 10.461 .49% .000 0.000Camm Auto,Gas Sta,Pk Lot 0 year to Waters of U.S. 0 5.121 .24% 4.817 0.941Camm Auto,Gas Sta,Pk Lot 0 year to Retention Basin 0 .907 .04% .862 0.950Comm Auto,Gas Sta,Pk Lot 5 year on Lot 0 .578 .03% .001 0.002Comm Auto,Gas Sta,Pk Lot 5 year on Site 0 1.033 .05% .002 0.002
• Comm Auto,Gas Sta,Pk Lot 100 year on Site 0 9.181 .43% .009 0.001Comm Auto,Gas Sta,Pk Lot Detention Area on Site 0 1.146 .05% 1.089 0.950Ind Park-light o year to Waters of U.S. 0 157.435 7.38% 145.027 0.921Ind Park-light o year to Retention Basin 0 1.812 .08% 1.631 0.900Ind Park-l ight 5 year on Lot 0 12.842 .60% .026 0.002Ind Park-l ight 5 year on Site 0 92.357 4.33% .185 0.002
• Ind Park-light 100 year on Site 0 167.210 7.84% .167 0.001Ind Park-light Detention Basin 0 5.549 .26% 5.271 0.950Ind Park-light Detention Area on Site 0 1.543 .07% 1.466 0.950Ind Park-light Vacant Land 100 yr Retent 0 8.152 .38% .008 0.001Ind Large Site-Medium o year to Waters of U.S. 0 45.048 2.11% 42.721 0.948Ind Large Site-Medium 5 year on Site 0 14.635 .69% .029 0.002
• Ind Large Site-Medium 100 year on Site 0 33.232 1.56% .033 0.001Ind Large Site-Medium Detention Basin 0 13.584 .64% 12.905 0.950Ind Large Site-Medium Detention Area on Site 0 .299 .01% .285 0.953
•

ID
TO-OS
Outfall Name
52nd St and DITCH
Area
2133.320
Outfall Size
102
Parent Id
• Landuse Retention Population Area % Tot Area COE CA Avg COE-----------------------------------------------------------------------------------------------------------------------------Ind FoundrY,Elec,PPs o year to Waters of u.S. 0 4.327 .20% .004 0.001Ind FoundrY,Elec,PPs 100 year on Site 0 .985 .05% .001 0.001Agricultural 100 year on Site 0 7.320 .34% .007 0.001Vacant Land o year to Waters of u.S. 0 152.376 7.14% 30.533 0.200
• Vacant Land 100 year on Site 0 19.916 .93% .020 0.001Vacant Land Vacant Land 0 yr Retentio 0 33.391 1.57% 8.508 0.255Vacant Land Vacant Land 100 yr Retent 0 89.186 4.18% .089 0.001Open Space, Pks, Golf' o year to Waters of u.S. 0 1.969 .09% .394 0.200Open Space, Pks, Golf 100 year on Site 0 6.890 .32% .007 0.001Open Space, School o year to Waters of u.S. 0 3.318 .16% .003 0.001
• Open Space, School 5 year on Site 0 3.150 .15% .006 0.002Open Space, School 100 year on Site 0 40.529 1.90% .041 0.001Municpal Faci l ities 100 year on Site 0 9.152 .43% .009 0.001Total Street Area 0 402.376 18.86% 382.257 0.950
TO~05 Drainage Area Totals
• -----------------------------------------------------------------------------------------------------------------------------0 2133.320 100.00% 797.219 0.374
•
•
•
•
•
•
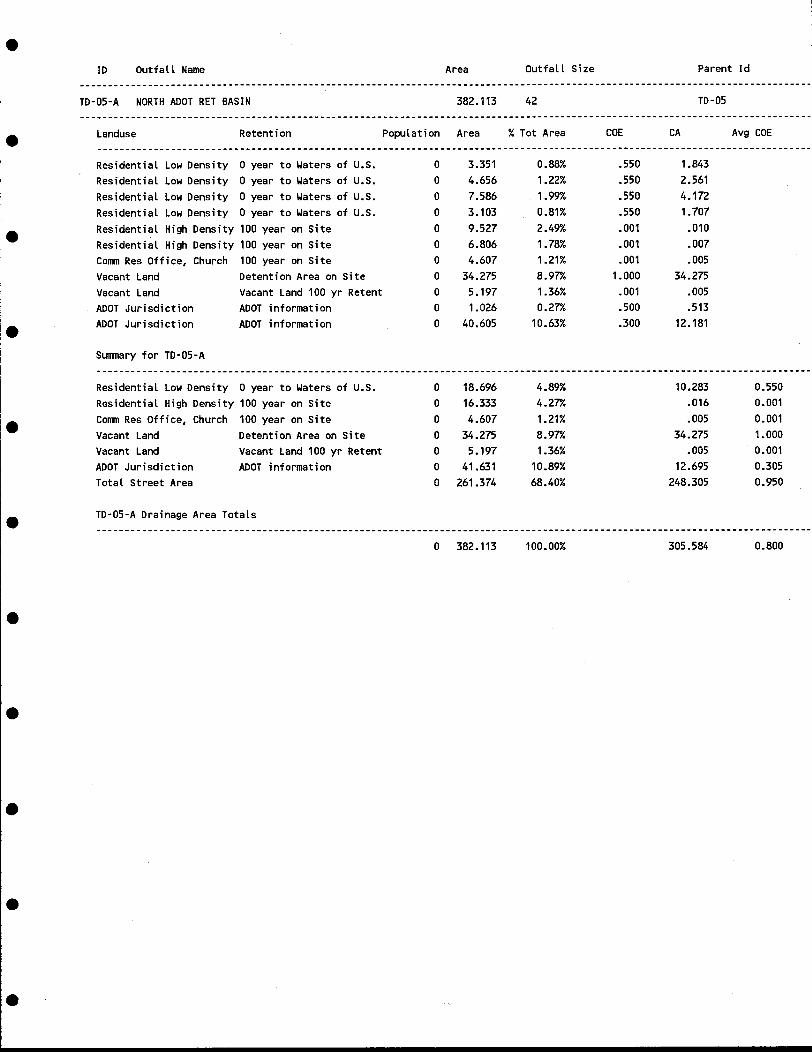
•ID Outfall Name Area Outfall Size Parent Id
TD-05-A NORTH ADOT RET BASIN 382.113 42 TD-05
•
•
•
Landuse Retention Population Area % Tot Area COE CA Avg COE-----------------------------------------------------------------------------------------------------------------------------Residential Low Density o year to Waters of U.S. 0 3.351 0.88% .550 1.843Residential Low Density o year to Waters of U.S. 0 4.656 1.22% .550 2.561Residential Low Density o year to Waters of U.S. 0 7.586 1.99% .550 4.172Residential Low Density o year to Waters of U.S. 0 3.103 0.81% .550 1.707
Residential High Density 100 year on Site 0 9.527 2.49% .001 .010Residential High Density 100 year on Site 0 6.806 1.78% .001 .007Comm Res Office, Church 100 year on Site 0 4.607 1.21% .001 .005Vacant Land Detention Area on Site 0 34.275 8.97"1. 1.000 34.275Vacant Land Vacant Land 100 yr Retent 0 5.197 1.36% .001 .005ADOT Jurisdiction ADOT information 0 1.026 0.27"1. .500 .513ADOT Jurisdiction ADOT information 0 40.605 10.63% .300 12.181
Summary for TD-05-A
•
•
•
•
•
•
•
Residential Low Density 0 year to Waters of U.S.Residential High Density 100 year on SiteComm Res Office, Church 100 year on SiteVacant Land Detention Area on SiteVacant Land Vacant Land 100 yr RetentADOT Jurisdiction ADOT informationTotal Street Area
TD-05-A Drainage Area Totals
o 18.696o 16.333o 4.607o 34.275o 5.197o 41.631o 261.374
o 382.113
4.89%4.27%1.21%8.97"1.
1.36%10.89%68.40%
100.00%
10.283.016.005
34.275.005
12.695248.305
305.584
0.5500.0010.0011.0000.0010.3050.950
0.800

•ID Outfall Name Area Outfall Size Parent Id
TD-05-AA KYRENE S of US 60 44.795 12 TD-05-A
•
•
•
•
Landuse Retention Population Area % Tot Area COE CA Avg COE
~-~._------------------------------------------------- ----------------------------------------------------------------------
Residential Low Density 100 year on Site 0 9.776 21.82% .001 .010Residential Low Density 100 year on Site 0 .585 1.31% .001 .001Residential Low Density 100 year on Site 0 1.655 3.69% .001 .002Residential Low Density 100 year on Site 0 1.477 3.30% .001 .001Residential Low Density 100 year on Site 0 .998 2.23% .001 .001Residential Low Density 100 year on Site 0 2.077 4.64% .001 .002Residential Low Density 100 year on Site 0 1.329 2.97"1. .001 .001Residential Low Density 100 year on Site 0 1.329 2.97"1. .001 .001Residential Low Density 100 year on Site 0 1.934 4.32% .001 .002Residential Low Density 100 year on Site 0 2.734 6.10% .001 .003Residential Low Density 100 year on Site 0 2.000 4.46% .001 .002Residential Low Density 100 year on Site 0 2.637 5.89% .001 .003Residential Low Density 100 year on Site 0 2.104 4.70% .001 .002Residential Low Density 100 year on Site 0 3.510 7.84% .001 .004Residential Low Density 100 year on Site 0 1.329 2.97"1. .001 .001
Summary for TD-05-AA-----------------------------------------------------------------------------------------------------------------------------
•
•
•
•
•
•
Residential Low Density 100 year on SiteTotal Street Area
TD-05-AA Drainage Area Totals
oo
o
35.4759.320
44.795
79.19%20.81%
100.00%
.0358.854
8.889
0.0010.950
0.198

•10 Outfa II Name Area Outfall Size Parent Id
TD-05-AB MILL S US 60 137.344 42 24 TD-05-A
• Landuse Retention Population Area % Tot Area COE CA Avg COE
~----------------------------------------------------- ---------------------------------------------------------------------_.
Residential Low Density o year to Waters of u.S. 0 9.157 6.67% .440 4.029Residential Low Density o year to Waters of U.S. 0 11.847 8.63% .410 4.857Residential Low Density o year to Waters of U.S. 0 8.398 6.11% .440 3.695Residential Low Density o year to Waters of U.S. 0 2.914 2.12% .440 1.282
• Residential High Density 0 year to Waters of U.S. 0 19.294 14.05% .800 15.435Residential High Density 100 year on Site 0 17.242 12.55% .001 .017Comm Res Office, Church 5 year on Lot 0 .367 0.27"1. .002 .001Comm Res Office, Church 100 year on Site 0 6.864 5.00% .001 .007Comm Res Office, Church 100 year on Site 0 9.259 6.74% .001 .009Comm Res Office, Church 100 year on Site 0 8.428 6.14% .001 .008
• Comm Res Office, Church 100 year on Site 0 1.165 0.85% .001 .001Comm Res Office, Church 100 year on Site 0 1.366 0.99% .001 .001Comm Res Office, Church 100 year on Site 0 2.358 1.72% .001 .002Comm Res Office, Church 100 year on Site 0 6.974 5.08% .001 .007Comm Res Office, Church 100 year on Site 0 1.129 0.82% .001 .001Comm Auto,Gas Sta,Pk Lot 0 year to Waters of u.S. 0 .554 0.40% .950 .526
• Comm Auto,Gas Sta,Pk Lot 5 year on Lot 0 .920 0.67"1. .002 .002Ind Foundry,Elec,PPs 100 year on Site 0 .000 0.00% .001 .000Vacant Land o year to Waters of U.S. 0 1.357 0.99% .200 .271
Summary for TD-05-AB-----------------------------------------------------------------------------------------------------------------------------
• Residential Low Density o year to Waters of u.S. 0 32.317 23.53% 13.864 0.429Residential High Density 0 year to Waters of u.S. 0 19.294 14.05% 15.435 0.800Residential High Density 100 year on Site 0 17.242 12.55% .017 0.001Comm Res Office, Church 5 year on Lot 0 .367 .27"1. .001 0.003Comm Res Office, Church 100 year on Site 0 37.543 27.34% .038 0.001Comm Auto,Gas Sta,Pk Lot 0 year to Waters of u.S. 0 .554 .40% .526 0.949
• Comm Auto,Gas Sta,Pk Lot 5 year on Lot 0 .920 .67"1. .002 0.002Ind Foundry,Elec,PPs 100 year on Site 0 .000 .00% .000 0.000Vacant Land o year to Waters of U.S. 0 1.357 .99% .271 0.200Total Street Area 0 27.750 20.20% 26.362 0.950
TD-05-AB Drainage Area Totals
• -----------------------------------------------------------------------------------------------------------------------------0 137.344 100.00% 56.516 0.411
•
•
•

•ID Outfall Name Area Outfall Size Parent Id
TD-05-AC COLLEGE S US 60 105.311 36 27 TD-05-A
• Landuse Retention Population Area % Tot Area COE CA Avg COE----------------------------------------------------------------------------------------------------------------------------Residential Low Density o year to Wat~rs of u.s. 0 1.451 1.38% .420 .609Residential Low Density o year to Waters of u.s. 0 2.322 2.20% .440 1.022Residential Low Density o year to Waters of u.s. 0 6.447 6.12% .410 2.643Residential Low Density o year to Waters of u.s. 0 6.854 6.51% .410 2.810
• Residential Low Density o year to Waters of u.s. 0 1.880 1.79% .410 .771Residential Low Density o year to Waters of u.s. 0 2.752 2.61% .410 1.128Residential Low Density o year to Waters of u.s. 0 1.289 1.22% .420 .541Residential Low Density o year to Waters of u.s. 0 3.565 3.39% .410 1.462Residential Low Density o year to Waters of u.s. 0 7.563 7.18% .410 3.101Residential Low Density o year to Waters of u.s. 0 5.808 5.52% .410 2.381
• Residential Low Density o year to Waters of u.s. 0 4.863 4.62% .410 1.994Residential High Density 0 year to Waters of u.s. 0 9.982 9.48% .600 5.989Residential High Density 0 year to Waters of u.s. 0 3.717 3.53% .600 2.230Comm Res Office, Church o year to Waters of u.s. 0 1.066 1.01% .950 1.013Comm Res Office, Church Detention Area on Site 0 1.067 1.01% .950 1.014Comm Mall, Strp Cntr,Ret Detention Area on Site 0 6.178 5.87"10 .950 5.869
• Comm Auto,Gas Sta,Pk Lot 0 year to Waters of u.s. 0 .918 0.87% .950 .872Vacant Land o year to Waters of u.s. 0 .791 0.75% .200 .158Open Space, Pks, Golf 100 year on Site 0 4.289 4.07% .001 .004Open Space, School 100 year on Site 0 8.359 7.94% .001 .008
Summary for TD-05-AC-------------------------------------------------------------------------------------.---------------------------------------• Residential Low Density o year to Waters of u.s. 0 44.794 42.53% 18.463 0.412Residential High Density 0 year to Waters of u.s. 0 13.700 13.01% 8.220 0.600Comm Res Office, Church o year to Waters of u.s. 0 1.066 1.01% 1.013 0.950Comm Res Office, Church Detention Area on Site 0 1.067 1.01% 1.014 0.950Comm Mall, Strp Cntr,Ret Detention Area on Site 0 6.178 5.87"10 5.869 0.950
• Comm Auto,Gas Sta,Pk Lot 0 year to Waters of u.s. 0 .918 .87"10 .872 0.950Vacant Land o year to Waters of u.s. 0 .791 .75% .158 0.200Open Space, Pks, Golf 100 year on Site 0 4.289 4.07"10 .004 0.001Open Space, School 100 year on Site 0 8.359 7.94% .008 0.001Total Street Area 0 24.149 22.93% 22.942 0.950
• TD-05-AC Drainage Area Totals
----------------------------------------------------------------------------------------------------------------------------~
0 105.311 100.00% 58.563 0.556
•
•
•

•ID Outfall Name Area Outfall Size Parent Id
TD-05-ACA BASELINE W/O LAKESHORE 57.666 30 TD-05-AC
• Landuse Retention Population Area % Tot Area COE CA Avg COE
•
•
•
•
Residential Low Density 5 year on Lot 0 1.495 2.59% .002 .003Residential Low Density 5 year on Site 0 2.305 4.00% .002 .005Residential High Density 0 year to Retention Basin 0 10.261 17.79% .900 9.235Comm Mall, Strp Cntr,Ret 0 year to Waters of U.S. 0 1.798 3.12% .950 1.708Comm Mall, Strp Cntr,Ret 0 year to Waters of U.S. 0 1.287 2.23% .950 1.223Comm Mall, Strp Cntr,Ret 0 year to Retention Basin 0 7.677 13.31% .950 7.293Comm Mall, Strp Cntr,Ret 100 year on Site 0 4.334 7.52% .001 .004Comm Auto,Gas Sta,Pk Lot 0 year to Waters of U.S. 0 .536 0.93% .950 .509Comm Auto,Gas Sta,Pk Lot 0 year to Retention Basin 0 .851 1.48% .950 .809
Summary for TD-05-ACA
Residential Low Density 5 year on Lot 0 1.495 2.59% .003 0.002Residential Low Density 5 year on Site 0 2.305 4.00% .005 0.002Residential High Density 0 year to Retention Basin 0 10.261 17.79% 9.235 0.900Comm Mall, Strp Cntr,Ret 0 year to Waters of u.S. 0 3.085 5.35% 2.930 0.950Comm Mall, Strp Cntr,Ret 0 year to Retention Basin 0 7.677 13.31% 7.293 0.950Comm Mall, Strp Cntr,Ret 100 year on Site 0 4.334 7.52% .004 0.001Comm Auto,Gas Sta,Pk Lot 0 year to Waters of u.S. 0 .536 .93% .509 0.950Comm Auto,Gas Sta,Pk Lot 0 year to Retention Basin 0 .851 1.48% .809 0.951Total Street Area 0 27.122 47.03% 25.766 0.950
TD-05-ACA Drainage Area Totals
•
•
•
•
•
o 57.666 100.00% 46.554 0.807

•ID Outfall Name Area Outfall Size Parent Id
TD-05-AD GREENWAY & LA CORTA 28.138 18 TD-05-A
• Landuse Retention Population Area % Tot Area COE CA Avg COE
•
•
•
•
•
•
•
•
•
Residential Low Density 0 year to Waters of u.s.Residential Low Density 0 year to Waters of u.s.Residential High Density 0 year to Waters of u.s.
Summary for TD-05-AD
Residential Low Density 0 year to Waters of u.s.Residential High Density 0 year to Waters of u.s.Total Street Area
TD-05-AD Drainage Area Totals
ooo
ooo
o
5.9059.1948.138
15.1008.1384.900
28.138
20.99%32.67"1.
28.92%
53.66%28.92%17.42%
100.00%
.410
.410
.700
2.4213.7705.696
6.1915.6964.655
16.542
0.4100.7000.950
0.588

•ID Outfall Name Area Outfall Size Parent Id
•TD-05-AE 4400 S RURAL
Landuse Retention
12.669
Population Area
18
% Tot Area COE CA
TD-05-A
Avg COE
•
Comm Res Office, ChurchComm Hotels,Restraunts
Summary for TD-05-AE
Comm Res Office, ChurchComm Hotels,RestrauntsTotal Street Area
100 year on Site5 year on Site
100 year on Site5 year on Site
oo
ooo
4.4168.253
4.4168.253
.000
34.86%65.14%
34.86%65.14%
.00%
.001
.002.004.017
.004
.017
.000
0.0010.0020.950
•
•
•
•
•
•
•
•
TD-05-AE Drainage Area Totals
o 12.669 100.00% .021 0.002

•ID Outfall Name Area Outfall Size Parent Id
~._----------------------------------------------------------------------------------------------------------------------------
TD-05-AF RURAL S OF US 60 525.629 54 TD-05-A
-------------------------------------------------------------------------------------------------------------------------------
• Landuse Retention Population Area % Tot Area COE CA Avg COE----------------------------------------------------------------------------------------------------------------------------Residential Low Density o year to Waters of U.S. 0 2.130 0.41% .730 1.555
Residential Low Density o year to Waters of U.S. 0 2.035 0.39% .730 1.485
Residential Low Density o year to Waters of U.S. 0 2.446 0.47"10 .730 1.786
Residential Low Density o year to Waters of U.S. 0 2.142 0.41% .640 1.371
• Residential Low Density o year to Waters of U.S. 0 2.184 0.42% .730 1.594
Residential Low Density o year to Waters of U.S. 0 1.957 0.37% .730 1.428
Residential Low Density o year to Waters of U.S. 0 15.283 2.91% .560 8.558
Residential Low Density o year to Waters of U.S. 0 9.593 1.83% .560 5.372
Residential Low Density o year to Waters of U.S. 0 2.698 0.51% .560 1.511
Residential Low Density o year to Waters of U.S. 0 6.312 1.20% .560 3.535
• Residential Low Density o year to Waters of U.S. 0 5.832 1.11% .560 3.266
Residential Low Density o year to Waters of U.S. 0 8.078 1.54% .560 4.523Residential Low Density o year to Waters of U.S. 0 1.222 0.23% .560 .684
Residential Low Density o year to Waters of U.S. 0 1.214 0.23% .560 .680
Residential Low Density o year to Waters of U.S. 0 1.593 0.30% .560 .892
Residential Low Density o year to Waters of U.S. 0 2.271 0.43% .560 1.272
• Residential Low Density o year to Waters of U.S. 0 6.147 1.17% .560 3.442Residential Low Density o year to Waters of U.S. 0 11.072 2.11% .560 6.200Residential Low Density o year to Waters of U.S. 0 5.425 1.03% .560 3.038Residential Low Density o year to Waters of U.S. 0 11.276 2.15% .560 6.315
Residential Low Density o year to Waters of U.S. 0 26.141 4.97% .730 19.083
Residential Low Density o year to Waters of U.S. 0 8.761 1.67% .560 4.906
• Residential Low Density o year to Waters of U.S. 0 2.606 0.50% .560 1.460Residential Low Density o year to Waters of U.S. 0 4.120 0.78% .560 2.307Residential Low Density o year to Waters of U.S. 0 3.200 0.61% .560 1.792Residential Low Density o year to Waters of U.S. 0 1.860 0.35% .560 1.041
Residential Low Density o year to Waters of U.S. 0 5.661 1.08% .560 3.170Residential Low Density o year to Retention Basin 0 5.397 1.03% .640 3.454
• Residential Low Density o year to Retention Basin 0 5.566 1.06% .520 2.894Residential Low Density o year to Retention Basin 0 15.563 2.96% .560 8.715Residential Low Density 5 year on Lot 0 9.458 1.80% .002 .019Residential Low Density 5 year on Lot 0 11.168 2.12% .002 .022Residential Low Density 5 year on Lot 0 6.640 1.26% .002 .013Residential Low Density 5 year on Lot 0 8.699 1.65% .002 .017
• Residential Low Density 5 year on Lot 0 14.853 2.83% .002 .030Residential Low Density 100 year on Site 0 2.630 0.50% .001 .003Residential High Density 0 year to Waters of U.S. 0 3.494 0.66% .670 2.341Comm Res Office, Church o year to Waters of U.S. 0 1.265 0.24% .950 1.202Comm Res Office, Church o year to Waters of U.S. 0 1.686 0.32% .950 1.602Comm Res Office, Church o year to Waters of U.S. 0 .700 0.13% .930 .651
• Comm Res Office, Church o year to Waters of U.S. 0 .793 0.15% .800 .634Comm Res Office, Church o year to Waters of U.S. 0 1.144 0.22% .950 1.087Comm Res Office, Church o year to Waters of U.S. 0 .745 0.14% .950 .707Comm Res Office, Church o year to Waters of U.S. 0 1.458 0.28% .910 1.327Comm Res Office, Church o year to Waters of U.S. 0 1.402 0.27"10 .950 1.332Comm Res Office, Church o year to Waters of U.S. 0 2.092 0.40% .900 1.883
• Comm Res Office, Church o year to Waters of U.S. 0 .934 0.18% .920 .859Comm Res Office, Church o year to Waters of U.S. 0 1.714 0.33% .900 1.543Comm Res Office, Church o year to Waters of U.S. 0 1.605 0.31% .550 .883Comm Res Office, Church o year to Waters of U.S. 0 .688 0.13% .950 .654
•

•ID Outfall Name Area Outfall Size Parent Id
------------------------------------------------------------------------------------------------------------------------------_.TD-05-AF RURAL S OF US 60 525.629 54 TD-05-A
i.-----------------------------------------------------------------------------------------------------------------------------_.-
Landuse Retention Population Area %Tot Area COE CA Avg COE-----------------------------------------------------------------------------------------------------------.--------------_ ..
Comm Res Office, Church o year to Retention Basin 0 .919 0.17"10 .800 .735Comm Res Office, Church 5 year on Lot 0 .754 0.14% .002 .002Comm Res Office, Church 5 year on Site 0 1.916 0.36% .002 .004Comm Res Office, Church 5 year on Site 0 1.631 0.31% .002 .003
• Comm Res Office, Church 5 year on Site 0 .459 0.09% .002 .001Comm Res Office, Church 5 year on Site 0 .612 0.12% .002 .001Comm Res Office, Church 5 year on Site 0 .702 0.13% .002 .001Comm Res Office, Church 5 year on Site 0 1.377 0.26% .002 .003Comm Res Office, Church 5 year on Site 0 4.059 0.77"10 .002 .008Comm Res Office, Church 5 year on Site 0 .710 0.14% .002 .001
• Comm Res Office, Church 5 year on Site 0 2.062 0.39% .002 .004Camm Res Office. Church 100 year on Site 0 .679 0.13% .001 .001Comm Res Office, Church 100 year on Site 0 .679 0.13% .001 .001Comm Res Office, Church 100 year on Site 0 .693 0.13% .001 .001Comm Res Office, Church 100 year on Site 0 1.515 0.29% .001 .002Comm Res Office, Church 100 year on Site 0 1.358 0.26% .001 .001
• Camm Res Office, Church 100 year on Site 0 1.664 0.32% .001 .002Comm Res Office, Church 100 year on Site 0 .916 0.17"10 .001 .001Comm Res Office, Church 100 year on Site 0 3.372 0.64% .001 .003Comm Hotels,Restraunts o year to Waters of U.S. 0 1.148 0.22% .950 1.090Comm Hotels,Restraunts o year to Waters of U.S. 0 1.485 0.28% .950 1.411Comm Hotels,Restraunts o year to Retention Basin 0 1.268 0.24% .950 1.205
• Comm Hotels,Restraunts 5 year on Site 0 .840 0.16% .002 .002Comm Mall, Strp Cntr,Ret o year to Waters of U.S. 0 22.537 4.29% .950 21.411Comm Mall, Strp Cntr,Ret o year to Waters of U.S. 0 5.368 1.02% .950 5.099Comm Mall, Strp Cntr,Ret 100 year on Site 0 5.498 1.05% .001 .005Comm Mall, Strp Cntr,Ret 100 year on Site 0 .642 0.12% .001 .001Comm Mall, Strp Cntr,Ret 100 year on Site 0 2.631 0.50% .001 .003
• Comm Auto,Gas Sta,Pk Lot 0 year to Waters of U.S. 0 .337 0.06% .950 .320Comm Auto,Gas Sta,Pk Lot 0 year to Retention Basin 0 .902 0.17% .950 .857Comm Auto,Gas Sta,Pk Lot 5 year on Site 0 .896 0.17"10 .002 .002Comm Auto,Gas Sta,Pk Lot 100 year on Site 0 24.356 4.63% .001 .024Vacant Land o year to Waters of U.S. 0 .156 0.03% .300 .047Vacant Land o year to Waters of U.S. 0 7.995 1.52% .200 1.599
• Vacant Land o year to Waters of U.S. 0 3.423 0.65% .200 .685Vacant Land o year to Retention Basin 0 1.831 0.35% .250 .458Vacant Land 5 year on Site 0 .788 0.15% .002 .002Vacant Land 5 year on Site 0 2.162 0.41% .001 .002Vacant Land 100 year on Site 0 1.624 0.31% .001 .002Vacant Land Vacant Land 0 yr Retentio 0 11.349 2.16% .200 2.270
• Open Space, Pks, Golf 100 year on Site 0 3.668 0.70% .001 .004Open Space, School o year to Waters of U.S. 0 .443 0.08"10 .950 .421Open Space, School o year to Retention Basin 0 .447 0.09% .950 .425Open Space, School o year to Retention Basin 0 13.502 2.57% .950 12.827Open Space, School 100 year on Site 0 18.440 3.51% .001 .018Open Space, School 100 year on Site 0 7.680 1.46% .001 .008
• Open Space, School 100 year on Site 0 4.466 0.85% .001 .004
Summary for TD-05-AF
------------------------------------------------------------------------------------------------------------ -----------------~
Residential Low Density o year to Waters of U.S. 0 153.259 29.16% 92.268 0.602
•

•ID Outfall Name Area Outfall Size Parent Id
TD-05-AF RURAL S OF US 60 525.629 54 TD-05-A-._--------------------------------------------------------------------------------------------------------- -------------------~
• Landuse Retention Population Area % Tot Area COE CA Avg COE--------------------------------------------------------------------------------------------------------------------------_ ..
Residential Low Density o year to Retention Basin 0 26.525 5.05% 15.063 0.568Residential Low Density 5 year on Lot 0 50.819 9.67% .102 0.002Residential Low Density 100 year on Site 0 2.630 .50% .003 0.001Residential High Density 0 year to Waters of U.S. 0 3.494 .66% 2.341 0.670
• Comm Res Office, Church o year to Waters of U.S. 0 16.226 3.09% 14.363 0.885Comm Res Office, Church o year to Retention Basin 0 .919 .17% .735 0.800Comm Res Office, Church 5 year on Lot 0 .754 .14% .002 0.003Comm Res Office, Church 5 year on Site 0 13.528 2.57"10 .027 0.002Comm Res Office, Church 100 year on Site 0 10.876 2.07"10 .011 0.001Comm Hotels,Restraunts o year to Waters of U.S. 0 2.633 .50% 2.501 0.950
• Comm Hotels,Restraunts o year to Retention Basin 0 1.268 .24% 1.205 0.950Comm Hotels,Restraunts 5 year on Site 0 .840 .16% .002 0.002Comm Mall, Strp Cntr,Ret 0 year to Waters of U.S. 0 27.905 5.31% 26.510 0.950Comm Mall, Strp Cntr,Ret 100 year on Site 0 8.770 1.67% .009 0.001Comm Auto,Gas Sta,Pk Lot 0 year to Waters of U.S. 0 .337 .06% .320 0.950Comm Auto,Gas Sta,Pk Lot 0 year to Retention Basin 0 .902 • 17"10 .857 0.950
• Comm Auto,Gas Sta,Pk Lot 5 year on Site 0 .896 • 17"10 .002 0.002Comm Auto,Gas Sta,Pk Lot 100 year on Site 0 24.356 4.63% .024 0.001Vacant Land o year to Waters of U.S. 0 11.573 2.20% 2.330 0.201Vacant Land o year to Retention Basin 0 1.831 .35% .458 0.250Vacant Land 5 year on Site 0 2.951 .56% .004 0.001Vacant Land 100 year on Site 0 1.624 .31% .002 0.001
• Vacant Land Vacant Land 0 yr Retentio 0 11.349 2.16% 2.270 0.200Open Space, Pks, Golf 100 year on Site 0 3.668 .70% .004 0.001Open Space, School o year to Waters of U.S. 0 .443 .08% .421 0.950Open Space, School o year to Retention Basin 0 13.950 2.65% 13.252 0.950Open Space, School 100 year on Site 0 30.586 5.82% .031 0.001Total Street Area 0 100.717 19.16% 95.681 0.950
• TD-05-AF Drainage Area Totals-----------------------------------------------------------------------------------------------------------------------------
0 525.629 100.00% 270.798 0.515
•
•
•
•
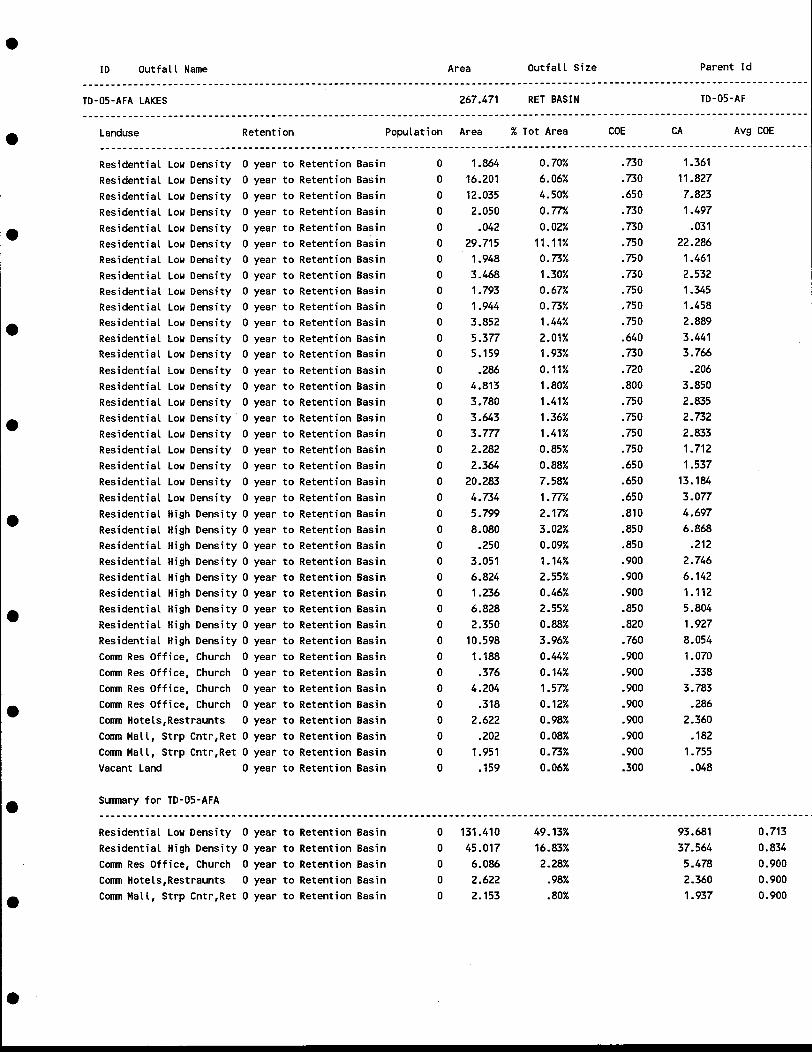
•ID Outfall Name Area Outfall Size Parent Id
-------------------------------------------------------------------------------------------------------------------------------TD-05-AFA LAKES 267.471 RET BASIN TD-05-AF-------------------------------------------------------------------------------------------------------------------------------
• Landuse Retention Population Area % Tot Area COE CA Avg COE--------------------------------------------------------------------------------------------------------------------------_.-Residential Low Density o year to Retention Basin 0 1.864 0.70% .730 1.361
Residential Low Density o year to Retention Basin 0 16.201 6.06% .730 11.827
Residential Low Density o year to Retention Basin 0 12.035 4.50% .650 7.823
Residential Low Density o year to Retention Basin 0 2.050 0.77"1. .730 1.497
• Residential Low Density o year to Retention Basin 0 .042 0.02% .730 .031
Residential Low Density o year to Retention Basin 0 29.715 11. 11% .750 22.286
Residential Low Density o year to Retention Basin 0 1.948 0.73% .750 1.461
Residential Low Density o year to Retention Basin 0 3.468 1.30% .730 2.532
Residential Low Density o year to Retention Basin 0 1.793 0.67% .750 1.345Residential Low Density o year to Retention Basin 0 1.944 0.73% .750 1.458
• Residential Low Density o year to Retention Basin 0 3.852 1.44% .750 2.889
Residential Low Density o year to Retention Basin 0 5.377 2.01% .640 3.441Residential Low Density o year to Retention Basin 0 5.159 1.93% .730 3.766
Residential Low Density o year to Retention Basin 0 .286 0.11% .720 .206
Residential Low Density o year to Retention Basin 0 4.813 1.80% .800 3.850
Residential Low Density o year to Retention Basin 0 3.780 1.41% .750 2.835
• Residential Low Density o year to Retention Basin 0 3.643 1.36% .750 2.732
Residential Low Density o year to Retention Basin 0 3.m 1.41% .750 2.833Residential Low Density o year to Retention Basin 0 2.282 0.85% .750 1.712Residential Low Density o year to Retention Basin 0 2.364 0.88% .650 1.537Residential Low Density o year to Retention Basin 0 20.283 7.58% .650 13.184
Residential Low Density o year to Retention Basin 0 4.734 1.77"1. .650 3.077
• Residential High Density 0 year to Retention Basin 0 5.799 2.17% .810 4.697
Residential High Density 0 year to Retention Basin 0 8.080 3.02% .850 6.868Residential High Density 0 year to Retention Basin 0 .250 0.09% .850 .212Residential High Density 0 year to Retention Basin 0 3.051 1.14% .900 2.746Residential High Density 0 year to Retention Basin 0 6.824 2.55% .900 6.142Residential High Density 0 year to Retention Basin 0 1.236 0.46% .900 1.112
• Residential High Density 0 year to Retention Basin 0 6.828 2.55% .850 5.804Residential High Density 0 year to Retention Basin 0 2.350 0.88% .820 1.927Residential High Density 0 year to Retention Basin 0 10.598 3.96% .760 8.054Comm Res Office, Church o year to Retention Basin 0 1.188 0.44% .900 1.070Comm Res Office, Church o year to Retention Basin 0 .376 0.14% .900 .338Comm Res Office, Church o year to Retention Basin 0 4.204 1. 57'Y. .900 3.783
• Comm Res Office, Church o year to Retention Basin 0 .318 0.12% .900 .286Comm Hotels,Restraunts o year to Retention Basin 0 2.622 0.98% .900 2.360Comm Mall, Strp Cntr,Ret o year to Retention Basin 0 .202 0.08% .900 .182Comm Mall, Strp Cntr,Ret o year to Retention Basin 0 1.951 0.73% .900 1.755Vacant Land o year to Retention Basin 0 .159 0.06% .300 .048
• Summary for TD-05-AFA-----------------------------------------------------------------------------------------------------------------------------Residential Low Density o year to Retention Basin 0 131.410 49.13% 93.681 0.713Residential High Density 0 year to Retention Basin 0 45.017 16.83% 37.564 0.834Comm Res Offi ce, Church o year to Retention Basin 0 6.086 2.28% 5.478 0.900Comm Hotels,Restraunts o year to Retention Basin 0 2.622 .98% 2.360 0.900
• Comm Mall, Strp Cntr,Ret 0 year to Retention Basin 0 2.153 .80% 1.937 0.900
•

•ID Outfall Name Area Outfall Size Parent Id
•TD-05-AFA LAKES
Landuse Retention
267.471
Population Area
RET BASIN
% Tot Area COE CA
TD-05-AF
Avg COE
Vacant LandTotal Street Area
o year to Retention Basin oo
.15980.024
.06%29.92%
.04876.022
0.3020.950
I •
•
•
•
•
•
•
•
•
TD-05-AFA Drainage Area Totals
o 267.471 100.00% 217.090 0.812

•10 Outfall Name Area Outfall Size Parent Id
TD-05-AFB SCUDDER PARK 104.839 RET BASIN TD-05-AF
• Landuse Retention . Population Area % Tot Area COE CA Avg COE--------------------------------------------------------------------------------------.-.-----------------------------------,-Residential Low Density 5 year on Lot 0 3.075 2.93% .002 .006Residential Low Density 5 year on Lot 0 4.494 4.29% .002 .009Residential Low Density 5 year on Lot 0 11.264 10.74% .002 .023Residential Low Density 5 year on Lot 0 8.875 8.47% .002 .018
• Residential Low Density 5 year on Lot 0 .237 0.23% .002 .000Residential Low Density 5 year on Lot 0 3.455 3.30% .002 .007Residential Low Density 5 year on Lot 0 12.794 12.20% .002 .026Residential Low Density 5 year on Lot 0 4.059 3.87"1. .002 .008Residential Low Density 5 year on Lot 0 2.132 2.03% .002 .004Residential Low Density 5 year on Lot 0 3.273 3.12% .002 .007
• Residential Low Density 5 year on Lot 0 2.708 2.58% .002 .005Residential Low Density 5 year on Lot 0 4.545 4.34% .002 .009Residential Low Density 5 year on Lot 0 4.660 4.44% .002 .009Residential Low Density Vacant Land 0 yr Retentio 0 .476 0.45% .200 .095Residential Low Density Vacant Land 0 yr Retentio 0 .284 0.27"1. .200 .057Residential High Density 100 year on Site 0 6.638 6.33% .001 .007
• Comm Res Office, Church 5 year on Site 0 3.777 3.60% .002 .008Comm Res Office, Church 100 year on Site 0 3.766 3.59% .001 .004Open Space, Pks, Golf Retention Basin 0 3.055 2.91% 1.000 3.055Open Space, School 100 year on Site 0 2.996 2.86% .001 .003
Summary for TD-05-AFB
• --------------------------------------- ________________________________________________________________________________ e ____,_
Residential Low Density 5 year on Lot 0 65.569 62.54% .131 0.002Residential Low Density Vacant Land 0 yr Retentio 0 .760 .72% .152 0.200Residential High Density 100 year on Site 0 6.638 6.33% .007 0.001Comm Res Office, Church 5 year on Site 0 3.777 3.60% .008 0.002Comm Res Office, Church 100 year on Site 0 3.766 3.59% .004 0.001
• Open Space, Pks, Golf Retention Basin 0 3.055 2.91% 3.055 1.000Open Space, School 100 year on Site 0 2.996 2.86% .003 0.001Total Street Area 0 18.278 17.43% 17.364 0.950
TD-05-AFB Drainage Area Totals----------------------------------------------------------------------------------------------------------------------------,--
• 0 104.839 100.00% 20.724 0.198
•
•
•

•ID Outfall Name Area Outfall Size Parent Id
TD-05-AFC OPTIMIST PARK NO. 174.354 RET BASIN TD-05-AF_____ e _________________________________________________________________________________________________________________________ .
• Landuse Retention Population Area % Tot Area COE CA Avg COE-----------------------------------------------------------------------------------------------------------------------------Residential Low Density o year to Retention Basin 0 6.208 3.56% .750 4.656Residential Low Density o year to Retention Basin 0 2.750 1.58% .750 2.063Residential Low Density 5 year on Lot 0 11.069 6.35% .002 .022Residential Low Density 5 year on Lot 0 5.017 2.88% .002 .010
• Residential Low Density 5 year on Lot 0 3.137 1.80% .002 .006Residential Low Density 5 year on Lot 0 2.994 1.72% .002 .006Residential Low Density 5 year on Lot 0 2.355 1.35% .002 .005Residential Low Density 5 year on Lot 0 3.318 1.90% .002 .007Residential Low Density 5 year on Lot 0 12.075 6.93% .002 .024Residential Low Density 5 year on Lot 0 .017 0.01% .002 .000
• Residential Low Density 5 year on Lot 0 1.745 1.00% .002 .003Residential Low Density 5 year on Lot 0 2.856 1.64% .002 .006Residential Low Density 5 year on Lot 0 1.636 0.94% .002 .003Residential Low Density 5 year on Lot 0 4.084 2.34% .002 .008Residential Low Density 5 year on Lot 0 6.566 3.77% .002 .013Residential Low Density 5 year on Lot 0 2.902 1.66% .002 .006
• Residential Low Density 5 year on Lot 0 5.603 3.21% .002 .011Residential Low Density 5 year on Lot 0 2.965 1.70% .002 .006Residential Low Density 5 year on Lot 0 4.221 2.42% .002 .008Residential Low Density 5 year on Lot 0 4.670 2.68% .002 .009Residential Low Density 5 year on Lot 0 3.068 1.76% .002 .006Residential Low Density 5 year on Lot 0 3.121 1.79% .002 .006
• Residential Low Density 5 year on Lot 0 5.027 2.88% .002 .010Residential Low Density 5 year on Lot 0 4.993 2.86% .002 .010Residential Low Density 5 year on Lot 0 3.679 2.11% .002 .007Residential Low Density 5 year on Lot 0 3.384 1.94% .002 .007Residential Low Density 5 year on Lot 0 4.844 2.78% .002 .010Residential Low Density 5 year on Lot 0 4.168 2.39% .002 .008
• Residential Low Density 5 year on Lot 0 3.703 2.12% .002 .007Residential Low Density 5 year on Lot 0 6.407 3.67"" .002 .013Residential Low Density 5 year on Lot 0 3.420 1.96% .002 .007Vacant Land 100 year on Site 0 1.350 0.77"" .001 .001Open Space, Pks, Golf Retention Basin 0 1.390 0.80% 1.000 1.390Open Space, Pks, Golf Retention Basin 0 2.978 1.71% 1.000 2.978
• Open Space, School 100 year on Site 0 9.516 5.46% .001 .010
Summary for TD-05-AFC
-----------------------------------------------------------------------------------------------------------------------------Residential Low Density o year to Retention Basin 0 8.958 5.14% 6.719 0.750Residential Low Density 5 year on Lot 0 123.045 70.57"" .246 0.002
• Vacant Land 100 year on Site 0 1.350 .77"10 .001 0.001Open Space, Pks, Golf Retention Basin 0 4.369 2.51% 4.369 1.000Open Space, School 100 year on Site 0 9.516 5.46% .010 0.001Total Street Area 0 27.116 15.55% 25.760 0.950
TD-05-AFC Drainage Area Totals
• -----------------------------------------------------------------------------------------------------------------------------0 174.354 100.00% 37.105 0.213
•

•10 Outfall Name Area Outfall Si ze Parent Id
TD-05-AFD OPTIMIST PARK SO. 131.506 RET BASIN TD-05-AF
• Landuse Retention Population Area %Tot Area COE CA Avg COE---------------------------------------------------------------.-------------------------------------------------------------Residential Low Density 5 year on Lot 0 2.052 1.56% .002 .004Residential Low Density 5 year on Lot 0 8.238 6.26% .002 .016Residential Low Density 5 year on Lot 0 6.336 4.82% .002 .013Residential Low Density 5 year on Lot 0 7.341 5.58% .002 .015
• Residential Low Density 5 year on Lot 0 6.196 4.71% .002 .012Residential Low Density 5 year on Lot 0 7.648 5.82% .002 .015Residential Low Density 5 year on Lot 0 6.806 5.18% .002 .014Residential Low Density 5 year on Lot 0 5.437 4.13% .002 .011Residential Low Density 5 year on Lot 0 10.058 7.65% .002 .020Residential Low Density 5 year on Lot 0 6.907 5.25% .002 .014
• Residential Low Density 5 year on Lot 0 7.529 5.73% .002 .015Residential Low Density 5 year on Lot 0 7.202 5.48% .002 .014Comm Res Office, Church 100 year on Site 0 1.644 1.25% .001 .002Comm Res Office, Church 100 year on Site 0 11.434 8.69% .001 .011Vacant Land o year to Retention Basin 0 5.004 3.81% .200 1.001Open Space, Pks, Golf Retention Basin 0 5.535 4.21% 1.000 5.535
• Open Space, School 5 year on Site 0 5.056 3.84% .002 .010
Summary for TD-05-AFD
-----------------------------------------------------------------------------------------------------------------------------Residential Low Density 5 year on Lot 0 81.749 62.16% .163 0.002Comm Res Office, Church 100 year on Site 0 13.079 9.95% .013 0.001
• Vacant Land o year to Retention Basin 0 5.004 3.81% 1.001 0.200Open Space, Pks, Golf Retention Basin 0 5.535 4.21% 5.535 1.000Open Space, School 5 year on Site 0 5.056 3.84% .010 0.002Total Street Area 0 21.083 16.03% 20.028 0.950
TD-05-AFD Drainage Area Totals
•
•
•
•
•
o 131.506 100.00% 26.750 0.203

•ID Outfall Name Area Outfall Size Parent Id
------------ .._------------.---------------------------------------------------------------------------------------------------TD-05-AFE SOUTHSHORE & LAKESHORE 403.955 39 TD-05-A
-------------------------------------------------------------------------------------.-----------------------------------------Landuse Retention Population Area % Tot Area COE CA Avg COE• ---------------------------------------------------------------------------------_.---------------------------------------._.Residential Low Density 5 year on Lot 0 .892 0.22% .002 .002Residential Low Density 5 year on Lot 0 3.236 0.80% .002 .006Residential Low Density 5 year on Lot 0 4.415 1.09% .002 .009
Residential Low Density 5 year on Lot 0 4.355 1.08% .002 .009
Residential Low Density 5 year on Lot 0 2.980 0.74% .002 .006• Residential Low Density 5 year on Lot 0 3.191 0.79% .002 .006
Residential Low Density 5 year on Lot 0 3.319 0.82% .002 .007
Residential Low Density 5 year on Lot 0 5.371 1.33% .002 .011Residential Low Density 5 year on Lot 0 6.775 1.68% .002 .014Residential Low Density 5 year on Lot 0 2.928 0.72% .002 .006Residential Low Density 5 year on Lot 0 7.414 1.84% .002 .015• Residential Low Density 5 year on Lot 0 5.791 1.43% .002 .012Residential Low Density 5 year on Lot 0 2.973 0.74% .002 .006
Residential Low Density 5 year on Lot 0 3.149 0.78% .002 .006Residential Low Density 5 year on Lot 0 3.147 0.78% .002 .006Residential Low Density 5 year on Lot 0 3.752 0.93% .002 .008Residential Low Density 5 year on Lot 0 4.523 1.12% .002 .009• Residential Low Density 5 year on Lot 0 4.609 1.14% .002 .009Resident ial Low Density 5 year on Lot 0 3.197 0.79"1. .002 .006Residential Low Density 5 year on Lot 0 9.029 2.24% .002 .018Residential Low Density 5 year on Lot 0 7.390 1.83% .002 .015Residential Low Density 5 year on Lot 0 2.261 0.56% .002 .005Residential Low Density 5 year on Lot 0 3.647 0.90% .002 .007• Residential Low Density 5 year on Lot 0 2.183 0.54% .002 .004Residential Low Density 5 year on Lot 0 3.817 0.94% .002 .008Residential Low Density 5 year on Lot 0 5.371 1.33% .002 .011Residential Low Density 5 year on Lot 0 3.573 0.88% .002 .007Residential Low Density 5 year on Lot 0 4.229 1.05% .002 .008Residential Low Density 5 year on Lot 0 8.208 2.03% .002 .016• Residential Low Density 5 year on Lot 0 5.969 1.48% .002 .012Residential Low Density 5 year on Lot 0 3.535 0.88% .002 .007Residential Low Density 5 year on Lot 0 2.701 0.67% .002 .005Residential Low Density 5 year on Lot 0 9.146 2.26% .002 .018Residential Low Density 5 year on Lot 0 6.641 1.64% .002 .013Residential Low Density 5 year on Lot 0 3.838 0.95% .002 .008• Residential Low Density 5 year on Lot 0 6.891 1.71% .002 .014Residential Low Density 5 year on Lot 0 6.021 1.49% .002 .012Comm Res Office, Church o year to Retention Basin 0 4.522 1.12% .950 4.296Comm Res Office, Church o year to Retention Basin 0 .582 0.14% .800 .465Comm Res Office, Church o year to Retention Basin 0 1.561 0.39% .650 1.014
• Comm Res Office, Church o year to Retention Basin 0 .735 0.18% .800 .588Comm Res Office, Church 5 year on Site 0 4.678 1.16% .002 .009Comm Res Office, Church 5 year on Site 0 .916 0.23% .002 .002Comm Res Office, Church 5 year on Site 0 .418 0.10% .002 .001Comm Res Office, Church 5 year on Site 0 3.050 0.76% .002 .006Comm Res Office, Church 100 year on Site 0 3.255 0.81% .001 .003Comm Res Office, Church 100 year on Site 0 1.101 0.27''1. .001 .001• Comm Res Office, Church 100 year on Site 0 1.573 0.39% .001 .002Comm Res Office, Church 100 year on Site 0 2.750 0.68% .001 .003Comm Res Office, Church 100 year on Site 0 1.859 0.46% .001 .002
•

•ID Outfall Name Area Outfall Size Parent Id
TD-05-AFE SOUTHSHORE & LAKESHORE 403.955 39 TD-05-A
• Landuse Retention Population Area % Tot Area COE CA Avg COE------------------------------------------------------------------------------_._._-------------------.-------------------_ ..
Comm Mall, Strp Cntr,Ret 0 year to Retention Basin 0 .438 0.11% .950 .416Comm Mall, Strp Cntr,Ret 100 year on Site 0 3.999 0.99% .001 .004Comm Mall, Strp Cntr,Ret 100 year on Site 0 18.511 4.58% .001 .019Comm Auto,Gas Sta,Pk Lot 5 year on Site 0 .891 0.22% .002 .002
• Comm Auto,Gas Sta,Pk Lot 100 year on Site 0 11. 172 2.77% .001 .011Comm Auto,Gas Sta,Pk Lot 100 year on Site 0 1.005 0.25% .001 .001Vacant Land 100 year on Site 0 1.821 0.45% .001 .002Vacant Land 100 year on Site 0 1.019 0.25% .001 .001Vacant Land 100 year on Site 0 1.616 0.40% .001 .002Vacant Land 100 year on Site 0 .392 0.10% .001 .000
• Vacant Land 100 year on Site 0 2.271 0.56% .001 .002Vacant Land Vacant Land 0 yr Retentio 0 .601 0.15% .200 .120Vacant Land Vacant Land 0 yr Retentio 0 8.232 2.04% .200 1.646Vacant Land Vacant Land 100 yr Retent 0 7.570 1.87% .001 .008Open Space, Pks, Golf 5 year on Lot 0 .262 0.06% .002 .001Open Space, Pks, Golf Retention Basin 0 2.182 0.54% 1.000 2.182
• Open Space, School 100 year on Site 0 27.008 6.69% .001 .027Municpal Facilities o year to Retention Basin 0 .872 0.22% .900 .785
Summary for TD-05-AFE-----------------------------------------------------------------------------------------------------------------------------Residential Low Density 5 year on Lot D 170.467 42.20% .341 0.002
• Comm Res Offi ce, Church o year to Retention Basin 0 7.399 1.83% 6.364 0.860Comm Res Office, Church 5 year on Site 0 9.062 2.24% .018 0.002Comm Res Office, Church 100 year on Site 0 10.538 2.61% .011 0.001Comm Mall, Strp Cntr,Ret o year to Retention Basin 0 .438 .11% .416 0.950Comm Mall, Strp Cntr,Ret 100 year on Site 0 22.510 5.57% .023 0.001Comm Auto,Gas Sta,Pk Lot 5 year on Site 0 .891 .22% .002 0.002
• Comm Auto,Gas Sta,Pk Lot 100 year on Site 0 12.177 3.01% .012 0.001Vacant Land 100 year on Site 0 7.119 1.76% .007 0.001Vacant Land Vacant Land 0 yr Retentio 0 8.834 2.19% 1.767 0.200Vacant Land Vacant Land 100 yr Retent 0 7.570 1.87"-' .008 0.001Open Space, Pks, Golf 5 year on Lot 0 .262 .06% .001 0.004Open Space, Pks, Golf Retention Basin 0 2.182 .54% 2.182 1.000
• Open Space, School 100 year on Site 0 27.008 6.69% .027 0.001Municpal Facilities o year to Retention Basin 0 .872 .22% .785 0.900Total Street Area 0 116.626 28.87% 110.795 0.950
TD-05-AFE Drainage Area Totals
------------------------------------------------------------------------------------------------------------------------.----
• 0 403.955 100.00% 122.759 0.304
•
•

•ID Outfall Name Area Outfall Size Parent Id
---------------------------------.-------------------.-------------------------------------------------------------------------~
TD-05-AG McCLINTOCK S/O US 60 134.798 30 TD-05-A--------------------------------------------------------------------------------------------------------------------------------
• Landuse Retention Population Area % Tot Area COE CA Avg COE---------------------------------------------------------------------------------------------------------------------------_.-Residential Low Density o year to Waters of U.S. 0 .874 0.65% .510 .446Residential Low Density o year to Waters of U.S. 0 1.209 0.90% .510 .617Residential Low Density o year to Waters of U.S. 0 4.650 3.45% .510 2.372Residential Low Density o year to Waters of U.S. 0 10.771 7.99% .510 5.493Residential Low Density o year to Waters of U.S. 0 3.592 2.66% .510 1.832• Residential Low Density o year to Waters of U.S. 0 5.411 4.01% .510 2.760Residential Low Density o year to Waters of U.S. 0 6.295 4.67% .510 3.210Residential Low Density o year to Waters of U.S. 0 8.039 5.96% .510 4.100Residential Low Density o year to Waters of U.S. 0 2.694 2.00% .510 1.374Residential Low Density o year to Waters of U.S. 0 3.976 2.95% .510 2.028Residential Low Density o year to Waters of U.S. 0 6.637 4.92% .510 3.385• Residential Low Density o year to Waters of U.S. 0 2.968 2.20% .510 1.514Residential Low Density o year to Waters of U.s. 0 3.341 2.48% .510 1.704Residential Low Density o year to Waters of U.s. 0 3.315 2.46% .510 1.691Residential Low Density o year to Waters of U.S. 0 3.165 2.35% .510 1.614Residential Low Density o year to Waters of U.S. 0 5.333 3.96% .510 2.720
• Residential Low Density o year to Waters of U.s. 0 7.864 5.83% .510 4.011Comm Res Office, Church o year to Waters of U.S. 0 3.518 2.61% .900 3.166Comm Res Office, Church 100 year on Site 0 2.601 1.93% .001 .003Comm Res Office, Church 100 year on Site 0 .696 0.52% .001 .001Comm Res Office, Church 100 year on Site 0 2.372 1.76% .001 .002Comm Res Office, Church 100 year on Site 0 4.399 3.26% .001 .004Comm Mall, Strp Cntr,Ret Detention Area on Site 0 10.250 7.60% .950 9.737• Vacant Land Vacant Land 0 yr Retentio 0 3.410 2.53% .200 .682Vacant Land Vacant Land 100 yr Retent 0 1.743 1.29% .001 .002
Summary for TD-05-AG
----------------------------------------------------------------------------------------------------------------------------_.Residential Low Density o year to Waters of U.S. 0 80.133 59.45% 40.868 0.510• Comm Res Office, Church o year to Waters of U.S. 0 3.518 2.61% 3.166 0.900Comm Res Office, Church 100 year on Site 0 10.068 7.47"1. .010 0.001Comm Mall, Strp Cntr,Ret Detention Area on Site 0 10.250 7.60% 9.737 0.950Vacant Land Vacant Land 0 yr Retentio 0 3.410 2.53% .682 0.200Vacant Land Vacant Land 100 yr Retent 0 1.743 1.29% .002 0.001Total Street Area 0 25.676 19.05% 24.392 0.950•TD-05-AG Drainage Area Totals----------------------------------------------------------------------------------------------------------------------------_.
•
•
•
o 134.798 100.00% 78.857 0.585

•ID Outfall Name Area· Outfall Si ze Parent Id
TD-05-AH COUNTRY CLUB S OF US 60 44.357 27 TD-05-A
• Landuse Retention Population Area % Tot Area COE CA Avg COE
•
•
Residential Low Density o year to Waters of U.S. 0 8.485 19.13% .510 4.328Residential Low Density o year to Waters of U.S. 0 3.264 7.36% .510 1.664Residential Low Density o year to Waters of U.S. 0 2.463 5.55% .510 1.256Residential Low Density o year to Waters of U.S. 0 3.778 8.52% .510 1.927Residential Low Density o year to Waters of U.S. 0 3.103 7.00% .510 1.583Residential Low Density o year to Waters of U.S. 0 2.901 6.54% .510 1.479Residential Low Density o year to Waters of U.S. 0 4.779 10.77% .510 2.437Open Space, School o year to Waters of U.S. 0 .579 1.31% .950 .550Open Space, School 100 year on Site 0 7.546 17.01% .001 .008
Summary for TD-05-AH
TD-05-AH Drainage Area Totals•
•
•
•
•
•
•
Residential Low DensityOpen Space, SchoolOpen Space, SchoolTotal Street Area
o year to Waters of U.S.o year to Waters of U.s.100 year on Site
oooo
o
28.773.579
7.5467.459
44.357
64.87"1.
1.31%17.01%16.82%
100.00%
14.674.550.008
7.086
22.318
0.5100.9500.0010.950
0.503

ID Outfall Name Area Outfall Size Parent Id
TD-05-AI FAIRFIELD AND GREENWAY 75.942 36 TD-05-A
• Landuse Retention Population Area % Tot Area COE CA Avg COE
•
•
Residential Low Density o year to Waters of U.S. 0 3.534 4.65% .510 1.802Residential Low Density o year to Waters of U.S. 0 5.607 7.38% .510 2.859Residential Low Density o year to Waters of U.S. 0 3.838 5.05% .510 1.957Residential Low Density o year to Waters of U.S. 0 6.298 8.29% .510 3.212Residential Low Density o year to Waters of U.S. 0 .785 1.03% .510 .400Residential Low Density o year to Waters of U.S. 0 8.156 10.74% .510 4.159Residential Low Density o year to Waters of U.S. 0 4.996 6.58% .510 2.548Residential Low Density o year to Waters of U.S. 0 6.600 8.69% .510 3.366Residential Low Density o year to Waters of U.S. 0 2.343 3.09% .510 1.195Residential Low Density o year to Waters of U.S. 0 1.392 1.83% .510 .710Residential Low Density o year to Waters of U.S. 0 8.423 11.09% .510 4.296Comm Mall, Strp Cntr,Ret 100 year on Site 0 7.799 10.27"1. .001 .008
Summary for TD-05-AI
•
•
•
•
•
•
•
Residential Low Density 0 year to Waters of U.S.Comm Mall, Strp Cntr,Ret 100 year on SiteTotal Street Area
TD-05-AI Drainage Area Totals
ooo
o
51.9717.799
16.172
75.942
68.43%10.27"1.
21.30%
100.00%
26.505.008
15.364
41.877
0.5100.0010.950
0.551

•ID Outfall Name Area Outfall Size Parent Id
•TD-05-AJ RIVER N/O US 60
Landuse Retention
37.818
Population Area
18
%Tot Area COE CA
TD-05-A
Avg COE
Residential Low Density o year to Waters of u.S. 0 4.005 10.59% .470 1.882Residential Low Density o year to Waters of u.S. 0 2.188 5.79% .470 1.028Residential Low Density o year to Waters of u.S. 0 3.666 9.69% .470 1.723Residential Low Density o year to Waters of u.S. 0 3.361 8.89"-' .470 1.580
• Residential Low Density 5 year on Lot 0 5.572 14.73% .002 .011Residential Low Density 5 year on Lot 0 6.081 16;08% .002 .012Residential Low Density 5 year on Lot 0 5.607 14.83% .002 .011
Summary for TD-05-AJ
•
•
•
•
•
•
•
•
Residential Low Density 0 year to Waters of u.s.Residential Low Density 5 year on LotTotal Street Area
TD-05-AJ Drainage Area Totals
ooo
o
13.22117.2607.337
37.818
34.96%45.64%19.40%
100.00%
6.214.035
6.970
13.219
0.4700.0020.950
0.350

•ID Outfall Name Area Outfall Size Parent Id
TD-05-AK RIVIERA &COUNTRY CLUB 13.217 18 TD-05-A
• Landuse Retention Population Area %Tot Area ceE CA Avg ceE
Residential Low Density o year to Waters of U.S. 0 1.615 12.22% .470 .759Residential Low Density o year to Waters of U.S. 0 3.889 29.43% .470 1.828Residential Low Density o year to Waters of U.S. 0 2.593 19.62% .470 1.219Open Space, Pks, Golf 100 year on Site 0 2.939 22.24% .001 .003
• Summary for TD-05-AK
•
•
•
•
•
•
•
•
Residential Low Density 0 year to Waters of U.S.Open Space, Pks, Golf 100 year on SiteTotal Street Area
TD-05-AK Drainage Area Totals
ooo
o
8.0972.9392.181
13.217
61.26%22.24%16.50%
100.00%
3.806.003
2.072
5.881
0.4700.0010.950
0.445

•ID Outfall Name Area Outfall Size Parent Id
-------------------------------------------------------------------------------------------------------------------------------
----------------------------------------------------------------------------------------------------------------------------
-------------------------------------------------------------------------------------------------------------------------------
•TD-05-AL COLE PARK
Landuse Retention
13.741
Population Area
RET BASIN
% Tot Area CaE CA
TD-05-A
Avg CaE
Residential Low Density o year to Retention Basin 0 2.036 14.82% .510 1.039Residential Low Density o year to Retention Basin 0 .806 5.87"10 .510 .411Residential Low Density o year to Retention Basin 0 2.249 16.37"10 .510 1.147Residential Low Density o year to Retention Basin 0 1.497 10.89% .510 .764
• Residential Low Density o year to Retention Basin 0 1.007 7.33% .510 .513Open Space, Pks, Golf o year to Retention Basin 0 3.199 23.28% 1.000 3.199
Summary for TD-05-AL
----------------------------------------------------------------------------------------------------------------------------
•Residential Low Density 0 year to Retention BasinOpen Space, Pks, Golf 0 year to Retention BasinTotal Street Area
TD-05-AL Drainage Area Totals
ooo
7.5953.1992.947
55.27%23.28%21.45%
3.8743.1992.800
0.5101.0000.950
----------------------------------------------------------------------------------------------------------------------------
•
•
•
•
•
•
•
o 13.741 100.00% 9.873 0.718

•ID Outfall Name Area Outfall Size Parent Id
------------------------------------.--------------------------------------------------------------------------------------------TD-05-B PEPPERWOOD SUBDIVISION 246.433 RET BAS TD-05
--------------------------------------------------------------------------------------------------------------------------------
• Landuse Retention Population Area %Tot Area COE CA Avg COE
-----------------------------------------------------------------------------------------------------------------------"._----Residential Low Density o year to Retention Basin 0 2.243 0.91% .450 1.009Residential Low Density o year to Retention Basin 0 3.671 1.49% .450 1.652Residential Low Density o year to Retention Basin 0 4.628 1.88% .450 2.083Residential Low Density o year to Retention Basin 0 3.619 1.47"1. .450 1.628
• Residential Low Density o year to Retention Basin 0 3.534 1.43% .700 2.474Residential Low Density o year to Retention Basin 0 1.116 0.45% .450 .502Residential Low Density o year to Retention Basin 0 1.991 0.81% .450 .896Residential Low Density o year to Retention Basin 0 3.974 1.61% .450 1.788Residential Low Density o year to Retention Basin 0 6.360 2.58% .450 2.862Residential Low Density o year to Retention Basin 0 5.650 2.29% .450 2.543
• Residential Low Density o year to Retention Basin 0 2.537 1.03% .450 1.142Residential Low Density o year to Retention Basin 0 3.463 1.41% .450 1.558Residential Low Density o year to Retention Basin 0 1.020 0.41% .450 .459Residential Low Density o year to Retention Basin 0 1.746 0.71% .450 .786Residential Low Density o year to Retention Basin 0 1.004 0.41% .450 .452Residential Low Density o year to Retention Basin 0 3.209 1.30% .450 1.444
• Residential Low Density o year to Retention Basin 0 1.907 0.77"1. .450 .858Residential Low Density o year to Retention Basin 0 1.841 0.75% .700 1.288Residential Low Density o year to Retention Basin 0 1.326 0.54% .450 .597Residential Low Density o year to Retention Basin 0 5.219 2.12% .450 2.349Residential Low Density o year to Retention Basin 0 6.511 2.64% .450 2.930Residential Low Density o year to Retention Basin 0 1.546 0.63% .450 .696Residential Low Density o year to Retention Basin 0 2.835 1.15% .450 1.276• Residential Low Density o year to Retention Basin 0 .496 0.20% .450 .223Residential Low Density o year to Retention Basin 0 6.521 2.65% .700 4.565Residential Low Density o year to Retention Basin 0 5.070 2.06% .700 3.549Residential Low Density o year to Retention Basin 0 2.968 1.20% .700 2.078Residential Low Density o year to Retention Basin 0 .619 0.25% .450 .278Residential Low Density o year to Retention Basin 0 4.114 1.67% .450 1.851• Residential Low Density o year to Retention Basin 0 2.275 0.92% .450 1.024Residential Low Density o year to Retention Basin 0 .525 0.21% .450 .236Residential Low Density o year to Retention Basin 0 1.931 0.78% .450 .869Residential Low Density o year to Retention Basin 0 4.687 1.90% .450 2.109Residential Low Density o year to Retention Basin 0 5.603 2.27"1. .450 2.522
• Residential Low Density o year to Retention Basin 0 5.669 2.30% .450 2.551Residential Low Density o year to Retention Basin 0 5.603 2.27"1. .450 2.521Residential Low Density 5 year on Lot 0 3.000 1.22% .002 .006Residential Low Density 5 year on Lot 0 2.386 0.97"1. .002 .005Residential Low Density 5 year on Lot 0 1.487 0.60% .002 .003Residential Low Density 5 year on Lot 0 2.146 0.87% .002 .004
• Residential Low Density 5 year on Lot 0 2.833 1.15% .002 .006Comm Mall, Strp Cntr,Ret 0 year to Retention Basin 0 8.294 3.37% .950 7.879Vacant Land 100 year on Site 0 .992 0.40% .001 .001Vacant Land 100 year on Site 0 .383 0.16% .001 .000Vacant Land 100 year on Site 0 .363 0.15% .001 .000Vacant Land 100 year on Site 0 .427 0.17% .001 .000
• Vacant Land 100 year on Site 0 .208 0.08% .001 .000Vacant Land 100 year on Site 0 .215 0.09% .001 .000Vacant Land Vacant Land 100 yr Retent 0 5.837 2.37"1. .001 .006Vacant Land Vacant Land 100 yr Retent 0 1.891 0.77% .001 .002
•

•10 Outfall Name Area Outfall Size Parent Id
----------------------------------------------------------------------------------------------------------------------------
TO-05-B PEPPERWOOD SUBOIVISION
• Landuse Retention
246.433
Population Area
RET BAS
% Tot Area CaE CA
TO-05
Avg CaE
Open Space, Pks, Golf 100 year on Site 0 2.833 1.15% .001 .003Open Space, Pks, Golf 100 year on Site 0 6.280 2.55% .001 .006Open Space, Pks, Golf Retention Basin 0 31.132 12.63% 1.000 31.132Open Space, School 100 year on Site 0 5.129 2.08% .001 .005
• Summary for TD-05-B----------------------------------------------------------------------------------------------------------------------------Residential Low Density o year to Retention Basin 0 117.031 47.49% 57.647 0.493Residential Low Density 5 year on Lot 0 11.854 4.81% .024 0.002Comm Mall, Strp Cntr,Ret 0 year to Retention Basin 0 8.294 3.37"1. 7.879 0.950
• Vacant Land 100 year on Site 0 2.588 1.05% .003 0.001Vacant Land Vacant Land 100 yr Retent 0 7.727 3.14% .008 0.001Open Space, Pks, Golf 100 year on Site 0 9.113 3.70% .009 0.001Open Space, Pks, Golf Retention Basin 0 31.132 12.63% 31.132 1.000Open Space, School 100 year on Site 0 5.129 2.08% .005 0.001Total Street Area 0 53.565 21.74% 50.887 0.950
• TD-05-B Drainage Area Totals
-----------------------------------------------------------------------------------------------------------------------------
•
•
•
•
•
•
o 246.433 100.00% 147.594 0.599

•10 Outfa II Name Area Outfall Size Parent Id
TD-05-C TEMPE ROYAL ESTATES SUB 120.976 RET BASIN TD-05
• Landuse Retention Population Area % Tot Area COE CA Avg COE--------------------------------------------.-------------------------------------------------------------------------------Residential Low Density o year to Retention Basin 0 11.439 9.46% .550 6.292Residential Low Density o year to Retention Basin 0 4.214 3.48% .550 2.318Residential Low Density o year to Retention Basin 0 .445 0.37"1. .550 .245Residential Low Density o year to Retention Basin 0 .441 0.36% .550 .243
• Residential Low Density o year to Retention Basin 0 .010 0.01% .000 .000Residential Low Density o year to Retention Basin 0 2.584 2.14% .550 1.421Residential Low Density o year to Retention Basin 0 2.577 2.13% .550 1.418Residential Low Density o year to Retention Basin 0 5.882 4.86% .550 3.235Residential Low Density o year to Retention Basin 0 .958 0.79% .550 .527Residential Low Density o year to Retention Basin 0 4.894 4.05% .550 2.692
• Residential Low Density o year to Retention Basin 0 6.559 5.42% .550 3.608Residential Low Density o year to Retention Basin 0 2.309 1.91% .550 1.270Residential Low Density o year to Retention Basin 0 3.597 2.97% .550 1.978Residential Low Density o year to Retention Basin 0 3.368 2.78% .550 1.852Residential Low Density o year to Retention Basin 0 3.350 2.77"1. .550 1.842Residential Low Density o year to Retention Basin 0 3.673 3.04% .550 2.020
• Residential Low Density o year to Retention Basin 0 4.269 3.53% .550 2.348Residential Low Density o year to Retention Basin 0 7.713 6.38% .550 4.242Residential Low Density o year to Retention Basin 0 1.309 1.08% .550 .720Residential Low Density o year to Retention Basin 0 3.155 2.61% .550 1.735Residential Low Density o year to Retention Basin 0 5.816 4.81% .550 3.199Residential Low Density o year to Retention Basin 0 1.209 1.00% .550 .665
• Residential Low Density o year to Retention Basin 0 2.086 1.72% .550 1.147Residential Low Density o year to Retention Basin 0 2.467 2.04% .550 1.357Residential Low Density o year to Retention Basin 0 3.505 2.90% .550 1.928Open Space, Pks, Golf Retention Basin 0 5.479 4.53% 1.000 5.479
Summary for TD-05-C
• -----------------------------------------------------------------------------------------------------------------------------Residential Low Density o year to Retention Basin 0 87.827 72.60% 48.300 0.550Open Space, Pks, Golf Retention Basin 0 5.479 4.53% 5.479 1.000Total Street Area 0 27.670 22.87"1. 26.286 0.950
TD-05-C Drainage Area Totals
• ------------------------------------------------------------------------------------------------------------------------0 120.976 100.00% 80.065 0.662
•
•
•

•10 Outfall Name Area Outfall Size Parent Id
--------------------------------------------------------------------------------------------------------------------------------TD-05-D BROADWAY &SPRR 540.091 66 TD-05
--------------------------------------------------------------------------------------------------------------------------------
• Landuse Retention Population Area % Tot Area COE CA Avg COE
-----------------------------------------------------------------------------------------------------------------------------Residential Low Density o year to Waters of U.S. 0 .719 0.13% .550 .395
Residential Low Density o year to Waters of u.s. 0 1.167 0.22% .400 .467
Residential Low Density o year to Waters of u.s. 0 3.722 0.69% .000 .000
Residential Low Density o year to Waters of u.s. 0 5.042 0.93% .650 3.277
• Residential Low Density o year to Waters of U.S. 0 .176 0.03% .500 .088
Residential Low Density o year to Waters of U.S. 0 .375 0.07"1. .400 .150
Residential Low Density o year to Waters of U.S. 0 .179 0.03% .400 .072
Residential Low Density o year to Waters of U.S. 0 2.708 0.50% .650 1.760
Residential Low Density o year to Waters of U.S. 0 .867 0.16% .700 .607
Residential Low Density o year to Waters of U.S. 0 .366 0.07"1. .400 .146
• Residential Low Density o year to Waters of U.S. 0 14.574 2.70% .530 7.724
Residential Low Density o year to Waters of U.S. 0 5.558 1.03% .530 2.946Residential Low Density o year to Waters of u.s. 0 2.350 0.44% .530 1.246
Residential Low Density o year to Waters of U.S. 0 1.028 0.19% .500 .514
Residential Low Density o year to Waters of U.S. 0 2.614 0.48% .500 1.307
Residential Low Density o year to Waters of U.S. 0 2.996 0•.55% .530 1.588
• Residential Low Density o year to Waters of u.s. 0 .859 0.16% .700 .601
Residential Low Density o year to Waters of u.S. 0 .991 0.18% .700 .694
Residential Low Density o year to Waters of u.S. 0 13.606 2.52% .430 5.850
Residential Low Density o year to Waters of u.S. 0 4.771 0.88% .430 2.052Residential Low Density o year to Waters of u.S. 0 4.722 0.87"1. .430 2.030
Residential Low Density o year to Waters of u.S. 0 4.602 0.85% .430 1.979
• Residential Low Density o year to Waters of u.S. 0 11. 116 2.06% .430 4.780
Residential Low Density o year to Waters of u.S. 0 3.059 0.57"1. .530 1.621
Residential Low Density o year to Waters of u.S. 0 3.114 0.58% .530 1.651
Residential Low Density o year to Waters of u.S. 0 7.833 1.45% .530 4.151
Residential Low Density o year to Waters of u.S. 0 5.607 1.04% .480 2.692Residential Low Density o year to Waters of u.S. 0 3.611 0.67% .480 1.733
• Residential Low Density o year to Waters of u.s. 0 3.394 0.63% .480 1.629Residential Low Density o year to Waters of u.s. 0 5.925 1.10% .430 2.548Residential Low Density o year to Waters of u.s. 0 4.917 0.91% .480 2.360Residential Low Density o year to Waters of u.S. 0 4.241 0.79% .430 1.823Residential Low Density o year to Waters of u.S. 0 5.590 1.04% .480 2.683Residential Low Density o year to Waters of u.s. 0 9.986 1.85% .430 4.294
• Residential Low Density o year to Waters of u.S. 0 3.697 0.68% .430 1.590Residential Low Density o year to Waters of u.S. 0 8.928 1.65% .430 3.839Residential Low Density o year to Waters of u.S. 0 3.456 0.64% .430 1.486Residential Low Density o year to Waters of u.S. 0 3.396 0.63% .480 1.630Residential Low Density o year to Waters of u.S. 0 2.721 0.50% .430 1.170Residential Low Density o year to Waters of u.S. 0 5.506 1.02% .530 2.918
• Residential Low Density o year to Waters of u.s. 0 5.543 1.03% .530 2.938Residential Low Density o year to Waters of u.s. 0 5.883 1.09% .530 3.118Residential Low Density o year to Waters of u.S. 0 8.090 1.50% .530 4.288Residential Low Density o year to Waters of u.S. 0 7.518 1.39% .530 3.985Residential Low Density o year to Waters of u.S. 0 14.499 2.68% .430 6.234Residential Low Density o year to Waters of u.S. 0 14.669 2.72% .430 6.308
• Resident ial Low Density o year to Waters of u.S. 0 4.833 0.89'Yo .430 2.078Residential Low Density o year to Waters of u.s. 0 5.116 0.95% .500 2.558Residential Low Density o year to Waters of u.S. 0 11.997 2.22% .430 5.159Residential Low Density o year to Waters of u.S. 0 4.283 0.79% .480 2.056
•

•10 Outfall Name Area Outfall Size Parent 1d
_.~-~------------------------------------------------- -------------------------------------------------------------------------
TO-05-D BROADWAY &SPRR 540.091 66 TO-05
-------------------------------------------------------------------------------------------------------------------------------
• Landuse Retention Population Area % Tot Area COE CA Avg COE----------------------------------------------------------------------------------------------------------------------------Residential Low Density o year to Waters of u.S. 0 3.113 0.58% .480 1.494Residential Low Density o year to Waters of u.S. 0 9.194 1.70% .430 3.953Residential Low Density o year to Waters of u.S. 0 1.397 0.26% .400 .559Residential Low Density o year to Waters of U.S. 0 .187 0.03% .400 .075
• Residential Low Density o year to Waters of u.S. 0 .187 0.03% .400 .075Residential Low Density o year to Waters of u.S. 0 .922 0.17% .400 .369Residential Low Density o year to Waters of u.S. 0 .196 0.04% .400 .078Residential Low Density o year to Waters of u.S. 0 .809 0.15% .400 .324Residential Low Density o year to Waters of u.S. 0 .185 0.03% .400 .074Residential Low Density o year to Waters of u.S. 0 .860 0.16% .700 .602
• Residential Low Density o year to Waters of u.S. 0 1.936 0.36% .530 1.026Residential Low Density o year to Waters of u.S. 0 6.025 1.12% .530 3.193Residential Low Density o year to Waters of u.S. 0 3.916 0.73% .530 2.076Residential Low Density o year to Waters of u.S. 0 4.812 0.89% .650 3.128Residential Low Density o year to Waters of u.S. 0 2.843 0.53% .480 1.365Residential Low Density o year to Waters of u.S. 0 2.135 0.40% .480 1.025
• Residential Low Density o year to Waters of u.S. 0 .819 0.15% .430 .352Residential Low Density 5 year on Lot 0 1.262 0.23% .002 .003Residential Low Density 5 year on Lot 0 .197 0.04% .002 .000Residential Low Density 5 year on Lot 0 .197 0.04% .002 .000Residential Low Density 5 year on Lot 0 .197 0.04% .002 .000Residential Low Density 5 year on Lot 0 .179 0.03% .002 .000
• Residential Low Density 5 year on Lot 0 .202 0.04% .002 .000Residential Low Density 5 year on Lot 0 .527 0.10% .002 .001Residential Low Density 5 year on Lot 0 .226 0.04% .002 .000Residential Low Density 5 year on Lot 0 .449 0.08% .002 .001Residential Low Density 5 year on Lot 0 2.696 0.50% .002 .005Residential Low Density 5 year on Lot 0 .367 0.07"1. .002 .001
• Residential Low Density 5 year on Lot 0 .525 0.10% .002 .001Residential Low Density 5 year on Lot 0 .140 0.03% .002 .000Residential Low Density 5 year on Lot •0 .020 0.00% .002 .000Residential Low Density 5 year on Lot 0 .467 0.09% .002 .001Residential Low Density 5 year on Lot 0 .478 0.09% .002 .001Residential Low Density 5 year on Lot 0 1.164 0.22% .002 .002
• Residential Low Density 5 year on Lot 0 .197 0.04% .002 .000Residential Low Density 5 year on Lot 0 .813 0.15% .002 .002Residential Low Density 5 year on Lot 0 .562 0.10% .002 .001Residential Low Density 5 year on Lot 0 .375 0.07"1. .002 .001Residential Low Density 5 year on Lot 0 .221 0.04% .002 .000Residential Low Density 5 year on Lot 0 .880 0.16% .002 .002
• Residential Low Density 5 year on Lot 0 .197 0.04% .002 .000Residential Low Density 5 year on Lot 0 .108 0.02% .002 .000Residential Low Density 5 year on Lot 0 1.329 0.25% .002 .003Residential Low Density 5 year on Lot 0 2.587 0.48% .002 .005Residential Low Density 5 year on Lot 0 2.195 0.41% .002 .004Residential Low Density 5 year on Lot 0 5.147 0.95% .002 .010
• Residential Low Density 5 year on Lot 0 4.989 0.92% .002 .010Residential Low Density 5 year on Lot 0 6.847 1.27"1. .002 .014Residential Low Density 5 year on Site 0 1.511 0.28% .002 .003Residential Low Density 5 year on Site 0 1.414 0.26% .002 .003
•

•ID Outfall Name Area Outfall Size Parent ld
----_.--.----------------------------------------------------------------------------------------------------------------------TD-05-D BROADWAY & SPRR 540.091 66 TD-05
-------------------------------------------------------------------------------------------------------------------------------
• Landuse Retention Population Area % Tot Area COE CA Avg COE._._---------------------------------------------------------.---------------------------------------------------------------Residential Low Density 5 year on Site 0 2.433 0.45% .002 .005Residential Low Density Vacant Land 0 yr Retentio 0 .731 0.14% .200 .146Residential High Density 0 year to Waters of U.S. 0 1.423 0.26% .750 1.067Residential High Density 0 year to Waters of u.s. 0 5.302 0.98% .650 3.446
• Residential High Density 0 year to Retention Basin 0 2.585 0.48% .820 2.120Residential High Density 0 year to Retention Basin 0 3.314 0.61% .760 2.518Residential High Density 5 year on Lot 0 1.613 0.30% .002 .003Residential High Density 100 year on Site 0 3.930 0.73% .001 .004Residential High Density 100 year on Site 0 7.949 1.47% .001 .008Comm Res Office, Church o year to Waters of U.S. 0 .708 0.13% .950 .673
• Comm Res Office, Church o year to Waters of U.S. 0 .199 0.04% .900 .180Comm Res Office, Church o year to Waters of U.S. 0 .243 0.04% .900 .219Comm Res Office, Church o year to Waters of U.S. 0 .996 0.18% .850 .847Comm Res Office, Church o year to Waters of U.S. 0 .354 0.07% .850 .301Comm Res Office, Church o year to Waters of U.S. 0 .199 0.04% .950 .190Comm Res Office, Church o year to Waters of U.S. 0 .249 0.05% .850 .212
• Comm Res Office, Church o year to Waters of U.S. 0 .900 0.17"1. .920 .828Comm Res Office, Church o year to Waters of U.S. 0 .191 0.04% .900 .172Comm Res Office, Church o year to Waters of U.S. 0 .427 0.08% .900 .385Comm Res Office, Church o year to Waters of U.S. 0 .850 0.16% .850 .723Comm Res Office, Church o year to Waters of U.S. 0 3.959 0.73% .800 3.167Comm Res Office, Church 5 year on Lot 0 .690 0.13% .002 .001
• Comm Res Office, Church 5 year on Site 0 3.547 0.66% .002 .007Comm Res Office, Church 100 year on Lot 0 .161 0.03% .001 .000Comm Res Office, Church 100 year on Site 0 1.410 0.26% .001 .001Comm Res Office, Church 100 year on Site 0 .856 0.16% .001 .001Comm Res Office, Church 100 year on Site 0 2.622 0.49% .001 .003Comm Res Office, Church 100 year on Site 0 2.849 0.53% .001 .003Comm Res Office, Church 100 year on Site 0 .991 0.18% .001 .001• Comm Res Office, Church 100 year on Site 0 .491 0.09% .001 .000Comm Hotels,Restraunts o year to Waters of U.S. 0 1.557 0.29% .950 1.479Comm Mall, Strp Cntr,Ret 100 year on Site 0 2.710 0.50% .001 .003Comm Mall, Strp Cntr,Ret Detention Area on Site 0 1.719 0.32% .950 1.634Comm Mall, Strp Cntr,Ret Detention Area on Site 0 7.293 1.35% .950 6.929
• Comm Mall, Strp Cntr,Ret Detention Area on Site 0 3.809 0.71% .950 3.618Comm Mall, Strp Cntr,Ret Detention Area on Site 0 .657 0.12% .950 .624lnd Park-light Detention Area on Site 0 2.956 0.55% .950 2.808Vacant Land o year to Waters of U.S. 0 .200 0.04% .000 .000Vacant Land 100 year on Lot 0 .525 0.10% .001 .001Vacant Land Vacant Land 0 yr Retentio 0 .256 0.05% .200 .051
• Summary for TD-05-D
-----------------------------------------------------------------------------------------------------------------------------Residential Low Density o year to Waters of U.S. 0 292.052 54.07"1. 138.578 0.474Residential Low Density 5 year on Lot 0 35.741 6.62% .071 0.002Residential Low Density 5 year on Site 0 5.358 .99% .011 0.002
• Residential Low Density Vacant Land 0 yr Retentio 0 .731 .14% .146 0.200Residential High Density 0 year to Waters of U.S. 0 6.724 1.24% 4.513 0.671Residential High Density 0 year to Retention Basin 0 5.899 1.09% 4.638 0.786
•

•ID Outfall Name Area Outfall Size Parent Id
•TO-05-0 BROADWAY &SPRR
Landuse 'Retention
540.091
Population Area
66
% Tot Area COE
TO-05
CA Avg COE
•
•
•
Residential High Density 5 year on Lot 0 1.613 .30% .003 0.002Residential High Density 100 year on Site 0 11.880 2.20% .012 0.001Comm Res Office, Church o year to Waters of U.S. 0 9.277 1.72% 7.894 0.851Comm Res Office, Church 5 year on Lot 0 .690 .13% .001 0.001Comm Res Office, Church 5 year on Site 0 3.547 .66% .007 0.002Comm Res Office, Church 100 year on Lot 0 .161 .03% .000 0.000Comm Res Office, Church 100 year on Site 0 9.219 1.71% .009 0.001Comm Hotels,Restraunts o year to Waters of U.S. 0 1.557 .29% 1.479 0.950Comm Mall, Strp Cntr,Ret 100 year on Site 0 2.710 .50% .003 0.001Comm Mall, Strp Cntr,Ret Detention Area on Site 0 13.478 2.50% 12.805 0.950Ind Park-light Detention Area on Site 0 2.956 .55% 2.808 0.950Vacant Land o year to Waters of U.S. 0 .200 .04% .000 0.000Vacant Land 100 year on Lot 0 .525 .10% .001 0.002Vacant Land Vacant Land 0 yr Retentio 0 .256 .05% .051 0.199Total Street Area 0 135.517 25.09% 128.741 0.950
TO-05-0 Drainage Area Totals
•
•
•
•
•
•
o 540.091 100.00% 301.771 0.559

•10 Outfall Name Area Outfall Size Parent Id
--------------------------------------------------------------------------------------------------------------------------------TD-05-E SOUTHERN &SPRR 500.578 36 TO-OS
----------------------------------------------------------------------------------------------_._._---------_.'._----------------
• Landuse Retention Population Area % Tot Area COE CA Avg COE
-----------------------------------------------------------------------------------------------------------------------------Residential Low Density o year to Waters of u.s. 0 7.912 1.58% .550 4.352
Residential Low Density o year to Waters of u.s. 0 2.822 0.56% .550 1.552
Residential Low Density o year to Waters of u.s. 0 4.655 0.93% .550 2.560
Residential Low Density o year to Waters of u.s. 0 1.604 0.32% .550 .882
• Residential Low Density o year to Waters of u.s. 0 4.080 0.82% .550 2.244
Residential Low Density o year to Waters of u.s. 0 9.756 1.95% .550 5.366
Residential Low Density o year to Waters of u.s. 0 4.842 0.97% .550 2.663
Residential Low Density o year to Waters of u.s. 0 4.994 1.00% .440 2.198
Residential Low Density o year to Waters of u.s. 0 3.630 0.73% .550 1.997Residential Low Density o year to Waters of u.s. 0 5.951 1.19% .530 3.154
• Residential Low Density o year to Waters of u.s. 0 .926 0.18% .530 .491Residential Low Density o year to Waters of u.s. 0 1.795 0.36% .420 .754Residential Low Density o year to Waters of u.s. 0 6.600 1.32% .420 2.772
Residential Low Density o year to Waters of u.s. 0 6.081 1.21% .420 2.554
Residential Low Density o year to Waters of U.S. 0 1.532 0.31% .420 .644Residential Low Density o year to Waters of U.S. 0 3.433 0.69% .420 1.442
• Residential Low Density o year to Waters of u.s. 0 3.218 0.64% .420 1.352Residential Low Density o year to Waters of u.s. 0 6.632 1.32% .550 3.648Residential Low Density o year to Waters of u.s. 0 2.842 0.57"1. .550 1.563Residential Low Density o year to Waters of u.s. 0 1.695 0.34% .550 .932Residential Low Density o year to Waters of u.s. 0 14.059 2.81% .550 7.732Residential Low Density o year to Waters of u.s. 0 7.628 1.52% .550 4.196
• Residential Low Density o year to Waters of u.s. 0 5.152 1.03% .550 2.834Residential Low Density o year to Waters of u.s. 0 5.229 1.04% .480 2.510Residential Low Density o year to Waters of u.s. 0 3.841 0.77% .530 2.036Residential Low Density o year to Waters of U.S. 0 7.142 1.43% .420 3.000Residential Low Density o year to Waters of U.S. 0 3.929 0.78% .420 1.650Residential Low Density o year to Waters of u.s. 0 8.735 1.74% .420 3.669
• Residential Low Density o year to Waters of u.s. 0 3.171 0.63% .420 1.332Residential Low Density o year to Waters of U.S. 0 2.482 0.50% .420 1.042Residential Low Density o year to Waters of U.S. 0 4.202 0.84% .420 1.765Residential Low Density o year to Waters of U.S. 0 6.767 1.35% .440 2.978Residential Low Density o year to Waters of u.s. 0 3.094 0.62% .440 1.361Residential Low Density o year to Waters of u.s. 0 6.751 1.35% .420 2.835
• Residential Low Density o year to Waters of U.S. 0 10.490 2.10% .420 4.406Residential Low Density o year to Waters of U.S. 0 10.378 2.07"1. .420 4.359Residential Low Density o year to Waters of U.S. 0 3.323 0.66% .440 1.462Residential Low Density o year to Waters of u.s. 0 5.317 1.06% .440 2.339Residential Low Density o year to Waters of u.s. 0 5.261 1.05% .440 2.315Residential Low Density o year to Waters of u.s. 0 5.317 1.06% .440 2.339
• Residential High Density 0 year to Waters of u.s. 0 3.243 0.65% .830 2.691Residential High Density 0 year to Waters of u.s. 0 4.315 0.86% .830 3.582Residential High Density 0 year to Waters of u.s. 0 5.058 1.01% .800 4.046Residential High Density 0 year to Waters of U.S. 0 50.704 10.13% .700 35.493Residential High Density 0 year to Waters of u.s. 0 6.337 1•27"1. .800 5.069Residential High Density 100 year on Site 0 7.005 1.40% .001 .007
• Residential High Density 100 year on Site 0 9.890 1.98% .001 .010Comm Res Office, Church o year to Waters of u.s. 0 .740 0.15% .950 .703Comm Res Office, Church o year to Waters of U.S. 0 4.899 0.98% .950 4.654Comm Res Office, Church o year to Retention Basin 0 .968 0.19% .700 .677
•

•10 Outfall Name Area Outfall Size Parent Id
-------------------------------------------------------------------------------------------------------------------------------TD-05-E SOUTHERN &SPRR 500.578 36 TO-OS-------------------------------------------------------------------------------------------------------------------------------
Landuse Retention Population Area % Tot Area COE CA Avg COE• ----------------------------------------------------------------------------------------------------------------------------Comm Res Office, Church o year to Retention Basin 0 10.306 2.06% .760 7.832Comm Res Office, Church 5 year on Site 0 1.523 0.30% .002 .003Comm Res Office, Church 5 year on Site 0 2.668 0.53% .002 .005Comm Res Office, Church 100 year on Site 0 .697 0.14% .001 .001Comm Res Office, Church 100 year on Site 0 1.178 0.24% .001 .001• Comm Res Office, Church 100 year on Site 0 3.315 0.66% .001 .003Comm Res Office, Church 100 year on Site 0 1.415 0.28% .001 .001Comm Res Office, Church Detention Basin 0 5.318 1.06% .950 5.052Comm Hotels,Restraunts o year to Waters of U.S. 0 .589 0.12% .950 .559Comm Hotels,Restraunts o year to Waters of U.S. 0 .667 0.13% .950 .633Comm Mall, Strp Cntr,Ret 0 year to Waters of U.S. 0 14.424 2.88% .950 13.703• Comm Mall, Strp Cntr,Ret 0 year to Waters of U.S. 0 1.089 0.22% .950 1.035Comm Mall, Strp Cntr,Ret 5 year on Site 0 .788 0.16% .002 .002Comm Mall, Strp Cntr,Ret 5 year on Site 0 10.484 2.09% .002 .021Comm Mall, Strp Cntr,Ret 100 year on Site 0 2.750 0.55% .001 .003Comm Auto,Gas Sta,Pk Lot 0 year to Waters of U.S. 0 .513 0.10% .950 .487Comm Auto,Gas Sta,Pk Lot 0 year to Waters of U.S. 0 .512 0.10% .950 .486• Comm Auto,Gas Sta,Pk Lot 0 year to Waters of U.S. 0 .723 0.14% .950 .687Comm Auto,Gas Sta,Pk Lot 100 year on Site 0 .445 0.09% .001 .000Ind Park-light 100 year on Site 0 2.559 0.51% .001 .003Ind Park-light 100 year on Site 0 2.559 0.51% .001 .003Vacant Land o year to Waters of U.S. 0 .575 0.11% .200 .115Vacant Land 5 year on Site 0 .775 0.15% .002 .002• Vacant Land 100 year on Site 0 1.756 0.35% .001 .002Open Space, Pks, Golf 100 year on Site 0 4.058 0.81% .001 .004Open Space, Pks, Golf 100 year on Site 0 3.899 0.78% .001 .004Open Space, School 100 year on Site 0 7.768 1.55% .001 .008Municpal Facilities 100 year on Site 0 15.470 3.09% .001 .015
• Municpal Facilities Detention Area on Site 0 6.157 1.23% .450 2.771
Summary for TD-05-E-----------------------------------------------------------------------------------------------------------------------------Residential Low Density o year to Waters of U.S. 0 207.269 41.41% 99.277 0.479Residential High Density 0 year to Waters of U.S. 0 69.657 13.92% 50.882 0.730
• Residential High Density 100 year on Site 0 16.894 3.37"10 .017 0.001Comm Res Office, Church o year to Waters of U.S. 0 5.638 1.13% 5.356 0.950Comm Res Office, Church o year to Retention Basin 0 11.273 2.25% 8.510 0.755Comm Res Office, Church 5 year on Site 0 4.190 .84% .008 0.002Comm Res Office, Church 100 year on Site 0 6.605 1.32% .007 0.001Comm Res Office, Church Detention Basin 0 5.318 1.06% 5.052 0.950
• Comm Hotels,Restraunts o year to Waters of U.S. 0 1.255 .25% 1.192 0.950Comm Mall, Strp Cntr,Ret 0 year to Waters of U.S. 0 15.513 3.10% 14.738 0.950Comm Mall, Strp Cntr,Ret 5 year on Site 0 11.271 2.25% .023 0.002Comm Mall, Strp Cntr,Ret 100 year on Site 0 2.750 .55% .003 0.001Comm Auto,Gas Sta,Pk Lot 0 year to Waters of U.S. 0 1.748 .35% 1.660 0.950Comm Auto,Gas Sta,Pk Lot 100 year on Site 0 .445 .09% .000 0.000
• Ind Park-light 100 year on Site 0 5.117 1.02% .005 0.001Vacant Land o year to Waters of U.S. 0 .575 .11% .115 0.200Vacant Land 5 year on Site 0 .775 .15% .002 0.003Vacant Land 100 year on Site 0 1.756 .35% .002 0.001Open Space, Pks, Golf 100 year on Site 0 7.957 1.59% .008 0.001
•

•ID Outfall Name Area Outfall Size Parent Id
•TD-05-E SOUTHERN &SPRR
Landuse Retention
500.578
Population Area
36
% Tot Area COE
TD-05
CA Avg COE
TD-05-E Drainage Area Totals•
Open Space, SchoolMuni cpa l FacilitiesMunicpal FacilitiesTotal Street Area
100 year on Site100 year on SiteDetention Area on Site
oooo
7.76815.4706.157
95.177
1.55%3.09%1.23%
19.01%
.008
.0152.771
90.418
0.0010.0010.4500.950
•
•
•
•
•
•
•
•
o 500.578 100.00% 280.069 0.559

•10 Outfall Name Area Outfall Size Parent 1d
•TD-05-EA SOUTHERN &BUTTE
Landuse Retention
1.465
Population Area
18
% Tot Area COE CA
TD-05-E
Avg COE
•
•
•
•
•
•
•
•
•
Residential High Density 0 year to Waters of U.S.
Summary for TD-05-EA
Residential High Density 0 year to Waters of U.S.Total Street Area
TD-05-EA Drainage Area Totals
o
oo
o
.840
.840
.625
1.465
57.34%
57.34%42.66%
100.00%
.820 .688
.688
.594
1.282
0.8190.950
0.875

•ID Outfall Name Area Outfall Size Parent Id
•TD-05-EB SOUTHERN &SHANNON
Landuse Retention
13.379
Population Area
18
% Tot Area COE CA
TD-05-E
Avg COE
Unknown 100 year on Site 0 .057 0.43% .001 .000Comm Res Office, Church 5 year on Site 0 5.760 43.05% .002 .012Comm Res Office, Church 100 year on Site 0 2.778 20.76% .001 .003Comm Mall, Strp Cntr,Ret 0 year to Waters of U.S. 0 .706 5.28% .950 .671
• Comm Auto,Gas Sta,Pk Lot 100 year on Site 0 .639 4.78% .001 .001
Summary for TD-05-EB
Unknown 100 year on Site 0 .057 .43% .000 0.000Comm Res Office, Church 5 year on Site 0 5.760 43.05% .012 0.002Comm Res Office, Church 100 year on Site 0 2.778 20.76% .003 0.001• Comm Mall, Strp Cntr,Ret o year to Waters of U.S. 0 .706 5.28% .671 0.950Comm Auto,Gas Sta,Pk Lot 100 year on Site 0 .639 4.78% .001 0.002Total Street Area 0 3.439 25.70% 3.267 0.950
TD-05-EB Drainage Area Totals-----------------------------------------------------------------------------------------------------------------------------:•
•
•
•
•
•
•
o 13.379 100.00% 3.954 0.296
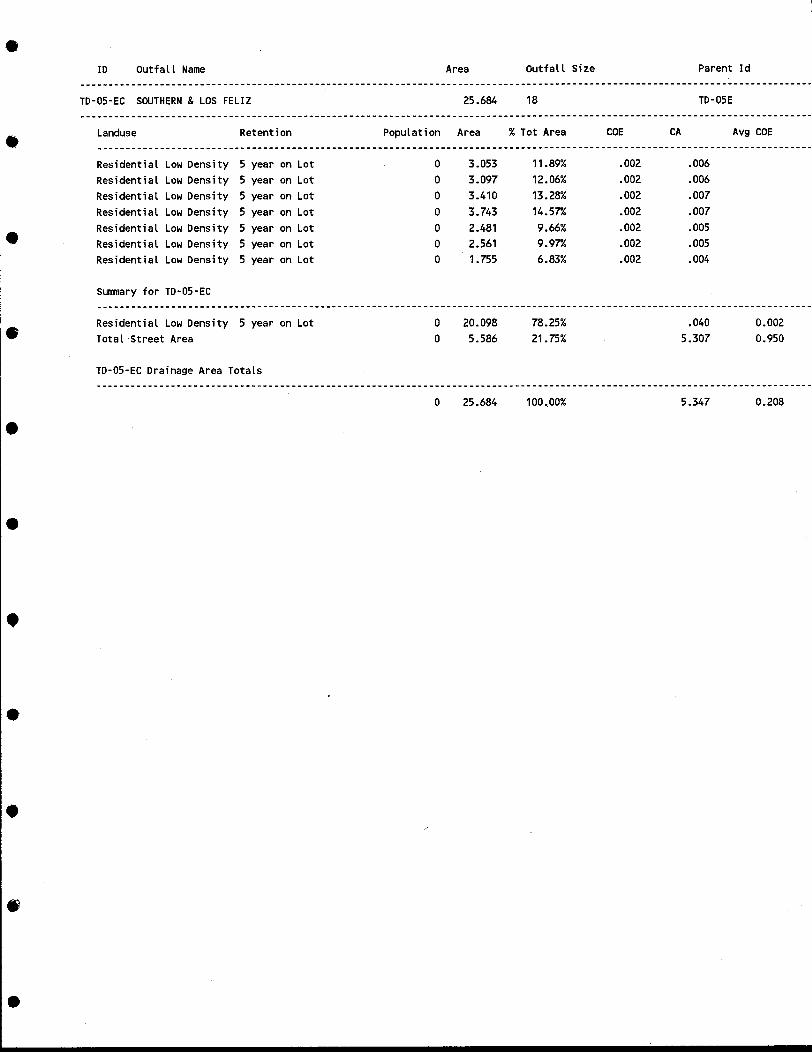
•ID Outfall Name Area Outfall Size Parent Id
TD-05-EC SOUTHERN & LOS FELIZ 25.684 18 TD-05E
• Landuse Retention Population Area %Tot Area COE CA Avg COE
Residential Low Density 5 year on Lot 0 3.053 11.89% .002 .006Residential Low Density 5 year on Lot 0 3.097 12.06% .002 .006Residential Low Density 5 year on Lot 0 3.410 13.28% .002 .007Residential Low Density 5 year on Lot 0 3.743 14.57";' .002 .007
• Residential Low Density 5 year on Lot 0 2.481 9.66% .002 .005Residential Low Density 5 year on Lot 0 2.561 9.97";' .002 .005Residential Low Density 5 year on Lot 0 1.755 6.83% .002 .004
Summary for TD-05-EC
•
•
•
•
•
•
•
Residential Low Density 5 year on LotTotal 'Street Area
TD-05-EC Drainage Area Totals
oo
o
20.0985.586
25.684
78.25%21.75%
100.00%
.0405.307
5.347
0.0020.950
0.208

•ID Outfall Name Area Outfall Si ze Parent Id
TD-OS-ED SOUTHERN & FAIRFIELD 19.026 18 TD-05-E
• Landuse Retention Population Area % Tot Area COE CA Avg COE
Residential Low Density o year to Waters of U.S. 0 .S82 3.06% .470 .274Residential Low Density o year to Waters of U.S. 0 .311 1.63% .470 .146Residential Low Density 5 year on Lot 0 3.779 19.86% .002 .008Residential Low Density 5 year on Lot 0 1.263 6.64% .002 .003
• Residential Low Density 5 year on Lot 0 4.618 24.27"10 .002 .009Comm Res Office, Church 100 year on Site 0 .901 4.74% .001 .001Comm Res Office, Church 100 year on Site 0 2.61S 13.74% .001 .003
Summary for TD-OS-ED
•
•
•
•
•
•
•
Residential Low Density 0 year to Waters of u.s.Residential Low Density 5 year on LotComm Res Office, Church 100 year on SiteTotal Street Area
TD-OS-ED Drainage Area Totals
oooo
o
.8939.6593.5164.958
19.026
4.69%50.77%18.48%26.06%
100.00%
.420
.019
.0044.710
5.153
0.4700.0020.0010.950
0.271

•10 Outfall Name Area Outfall Size Parent Id
TD-05-F TEMPE COMMERCE CENTER 105.485 RET BASIN TD-05------------------------------------------------------------------------------------------------------------------------------_.
• Landuse Retention Population Area % Tot Area COE CA Avg COE--------------------------------------------------------------------------------------------------------------------------_.-Comm Res Office, Church 100 year on Site 0 6.814 6.46% .001 .007Comm Res Office, Church 100 year on Site 0 10.007 9.49% .001 .010Comm Res Office, Church 100 year on Site 0 1.364 1.29% .001 .001Comm Res Office, Church 100 year on Site 0 4.071 3.86% .001 .004
• Comm Res Office, Church 100 year on Site 0 1.314 1.25% .001 .001Comm Res Office, Church 100 year on Site 0 2.407 2.28% .001 .002Comm Res Office, Church 100 year on Site 0 1.262 1.20% .001 .001Comm Auto,Gas Sta,Pk Lot 100 year on Site 0 2.190 2.08% .001 .002Ind Park-light 100 year on Site 0 1.022 0.97"1. .001 .001Ind Park-light 100 year on Site 0 .588 0.56% .001 .001
• Ind Park-l ight 100 year on Site 0 1.051 1.00% .001 .001Ind Park-light 100 year on Site 0 .667 0.63% .001 .001Ind Park-light 100 year on Site 0 1.420 1.35% .001 .001Ind Park-light 100 year on Site 0 1.413 1.34% .001 .001Ind Large Site-Medium 100 year on Site 0 3.264 3.09% .001 .003Ind Large Site-Medium 100 year on Site 0 5.196 4.93% .001 .005
• Ind Foundry,Elec,PPs 100 year on Site 0 20.712 19.63% .001 .021Vacant Land o year to Retention Basin 0 .631 0.60% .250 .158Vacant Land 100 year on Site 0 8.286 7.86% .000 .000Vacant Land 100 year on Site 0 8.493 8.05% .001 .008Vacant Land Vacant Land 0 yr Retentio 0 .931 0.88% .250 .233Vacant Land Vacant Land 0 yr Retentio 0 .814 0.77"1. .250 .203
• Vacant Land Vacant Land 100 yr Retent 0 .741 0.70% .001 .001Open Space, Pks, Golf Retention Basin 0 .844 0.80% 1.000 .844
Summary for TD-05-F
-----------------------------------------------------------------------------------------------------------------------------Comm Res Office, Church 100 year on Site 0 27.238 25.82% .027 0.001
• Comm Auto,Gas Sta,Pk Lot 100 year on Site 0 2.190 2.08% .002 0.001Ind Park-li ght 100 year on Site 0 6.161 5.84% .006 0.001Ind Large Site-Medium 100 year on Site 0 8.460 8.02% .008 0.001Ind Foundry,Elec,PPs 100 year on Site 0 20.712 19.63% .021 0.001Vacant Land o year to Retention Basin 0 .631 .60% .158 0.250Vacant Land 100' year on Site 0 16.779 15.91% .008 0.000
• Vacant Land Vacant Land 0 yr Retentio 0 1.745 1.65% .436 0.250Vacant Land Vacant Land 100 yr Retent 0 .741 .70% .001 0.001Open Space, Pks, Golf Retention Basin 0 .844 .80% .844 1.000Total Street Area 0 19.984 18.95% 18.985 0.950
TD-05-F Drainage Area Totals
-----------------------------------------------------------------------------------------------------------------------------• 0 105.485 100.00% 20.496 0.194
•
•

•10 Outfa II Name Area Outfall Size Parent Id
TD-05-G LA ESTANCIA INO PARK 99.666 INO RET TO-OS
• Landuse Retention Population Area % Tot Area COE CA Avg COE
Residential High Density 100 year on Site 0 16.291 16.35% .001 .016Ind Park-light 100 year on Site 0 .538 0.54% .001 .001Vacant Land Vacant Land 100 yr Retent 0 18.012 18.07"1. .001 .018Vacant Land Vacant Land 100 yr Retent 0 7.780 7.81% .001 .008
• Vacant Land Vacant Land 100 yr Retent 0 4.613 4.63% .001 .005Vacant Land Vacant Land 100 yr Retent 0 2.471 2.48% .001 .002Open Space, Pks, Golf 100 year on Site 0 25.362 25.45% .001 .025Muni cpa l Facilities 100 year on Site 0 9.815 9.85% .001 .010
Summary for TO-05-G
•
•
•
•
•
•
•
•
Residential High Density 100 year on SiteInd Park-light 100 year on SiteVacant Land Vacant Land 100 yr RetentOpen Space, Pks, Golf 100 year on SiteMunicpal Facilities 100 year on SiteTotal Street Area
TD-05-G Drainage Area Totals
oooooo
o
16.291.538
32.87625.3629.815
14.784
99.666
16.35%.54%
32.99%25.45%9.85%
14.83%
100.00%
.016
.001
.033
.025
.01014.045
14.130
0.0010.0020.0010.0010.0010.950
0.142

•ID Outfall Name Area Outfall Size Parent Id
•TD-05-H TERRACE WALK SUB
Landuse Retention
13.408
Population Area
RET BASIN
% Tot Area COE
TD-05
CA Avg COE
•
•
•
•
•
•
•
•
•
Residential Low Density 100 year on SiteResidential Low Density 100 year on SiteResidential Low Density 100 year on Site
Summary for TD-05-H
Residential Low Density 100 year on SiteTotal Street Area
TD-05-H Drainage Area Totals
ooo
oo
o
6.1502.2281.292
9.6703.738
13.408
45.81";'16.62%9.64%
72.12%27.88%
100.00%
.001
.001
.001
.006
.002
.001
.0103.551
3.561
0.0010.950
0.266

•ID Outfall Name Area Outfall Si ze Parent Id
Population Area•TD-05-1 DWIGHT PARK
Landuse Retention
44.890 RET BASIN
%Tot Area COE
TO-Os
CA Avg COE
•
Residential Low DensityResidential Low DensityResidential Low DensityResidential Low DensityResidential Low DensityResidential Low DensityResidential Low DensityResidential Low DensityResidential Low DensityOpen Space, Pks, Golf
Summary for TD-05-1
o year to Retention Basino year to Retention Basino year to Retention Basino year to Retention Basino year to Retention Basino year to Retention Basin5 year on Lot5 year on Lot100 year on SiteRetention Basin
oooooooooo
4.0883.5803.4561.9332.889
11.2931.310
.9811.3094.046
9.11%7.98%7.70%4.31%6.44%
25.16%2.92%2.19%2.92%9.01%
.400
.400
.400
.800
.400
.350
.002
.002
.0011.000
1.6351.4321.3821.5461.1563.953
.003
.002
.0014.046
Residential Low Density o year to Retention Basin 0 27.238 60.68% 11.104 0.408Residential Low Density 5 year on Lot 0 2.291 5.10% .005 0.002Residential Low Density 100 year on Site 0 1.309 2.92% .001 0.001
• Open Space, Pks, Golf Retention Basin 0 4.046 9.01% 4.046 1.000Total Street Area 0 10.006 22.29% 9.505 0.950
TD-05-1 Drainage Area Totals
•
•
•
•
•
•
o 44.890 100.00% 24.661 0.549

•10
TD-06
Outfall Name
52nd St and DITCH
Area
25.614
Outfall Size
36
Parent Id
• Landuse Retention Population Area % Tot Area COE CA Avg COE
Residential Low Density o year to Waters of U.S. 0 5.438 21.23% .430 2.338Ind Park-light o year to Waters of U.S. 0 4.097 15.99% .950 3.893Ind Park-light 5 year on Site 0 1.773 6.92% .002 .004Ind Park-light 5 year on Site 0 2.406 9.39% .002 .005
• Ind Large Site-Medium 5 year on Site 0 6.065 23.68% .002 .012
Summary for TD-06
•Residential Low DensityInd Park-lightInd Park-lightInd Large Site-MediumTotal Street Area
o year to Waters of U.S.o year to Waters of U.S.5 year on Site5 year on Site
ooooo
5.4384.0974.1796.0655.835
21.23%15.99%16.32%23.68%22.78%
2.3383.893
.008
.0125.544
0.4300.9500.0020.0020.950
•
•
•
•
•
•
•
TD-06 Drainage Area Totals
o 25.614 100.00% 11.795 0.460

•10 Outfall Name Area Outfall Size Parent Id
------------------------------------------------------------------------------------------------------------------.------------TD-06-A 12th ST &PRIEST 256.017 36 TD-06
----------------------------------------------~------- -------------------------------------------------------------------------
• Landuse Retention Population Area % Tot Area COE CA Avg COE
----------------------------------------------------------------------------------------------------------------------------Residential Low Density o year to Waters of U.S. 0 4.540 1. 77"-' .430 1.952
Residential Low Density o year to Waters of U.S. 0 4.037 1.58% .430 1.736
Residential Low Density o year to Waters of U.S. 0 3.105 1.21% .430 1.335
Residential Low Density o year to Waters of U.S. 0 7.506 2.93% .430 3.227
• Residential Low Density o year to Waters of U.S. 0 2.649 1.03% .430 1.139
Residential Low Density o year to Waters of U.S. 0 8.563 3.34% .430 3.682
Residential Low Density o year to Waters of U.S. 0 3.940 1.54% .430 1.694
Residential Low Density o year to Waters of U.S. 0 2.921 1.14% .320 .935
Residential Low Density o year to Waters of U.S. 0 3.292 1.29% .390 1.284
Residential Low Density o year to Waters of U.S. 0 3.296 1.29% .390 1.285
• Residential Low Density o year to Waters of U.S. 0 1.668 0.65% .430 .717Residential Low Density o year to Waters of U.S. 0 2.211 0.86% .390 .862Residential Low Density o year to Waters of U.S. 0 4.802 1.88% .390 1.873Residential Low Density o year to Waters of u.S. 0 4.941 1.93% .390 1.927Residential Low Density o year to Waters of u.S. 0 6.418 2.51% .430 2.760Residential Low Density o year to Waters of u.S. 0 6.038 2.36% .390 2.355
• Residential Low Density o year to Waters of u.S. 0 .871 0.34% .350 .305Residential Low Density o year to Waters of u.S. 0 1.184 0.46% .490 .580
Residential Low Density o year to Waters of u.S. 0 11.534 4.51% .390 4.498Residential Low Density o year to Waters of u.S. 0 2.280 0.89% .390 .889Residential Low Density o year to Waters of u.S. 0 1.346 0.53% .490 .660Residential Low Density o year to Waters of u.S. 0 10.084 3.94% .390 3.933
• Residential Low Density o year to Waters of u.S. 0 2.866 1.12% .390 1.118Residential Low Density o year to Waters of u.S. 0 6.246 2.44% .390 2.436Residential Low Density o year to Waters of u.S. 0 5.465 2.13% .430 2.350Residential Low Density o year to Waters of u.S. 0 6.121 2.39% .430 2.632Residential Low Density o year to Waters of u.S. 0 .515 0.20% .490 .252Residential Low Density 5 year on Lot 0 5.423 2.12% .002 .011
• Residential Low Density 5 year on Lot 0 .257 0.10% .002 .001Residential Low Density 100 year on Lot 0 1.882 0.74% .001 .002Residential Low Density 100 year on Lot 0 4.995 1.95% .001 .005Residential Low Density 100 year on Lot 0 2.698 1.05% .001 .003Residential Low Density 100 year on Site 0 1.420 0.55% .001 .001Residential Low Density 100 year on Site 0 1.099 0.43% .001 .001
• Residential Low Density 100 year on Site 0 1.332 0.52% .001 .001Residential Low Density 100 year on Site 0 1.764 0.69% .001 .002Residential Low Density 100 year on Site 0 2.434 0.95% .001 .002Residential Low Density 100 year on Site 0 3.105 1.21% .001 .003Residential Low Density 100 year on Site 0 1.679 0.66% .001 .002Residential Low Density 100 year on Site 0 .611 0.24% .001 .001
• Residential Low Density 100 year on Site 0 .058 0.02% .001 .000Residential High Density 0 year to Waters of u.S. 0 6.646 2.60% .500 3.323Residential High Density 0 year to Waters of u.S. 0 1.315 0.51% .750 .986Residential High Density 0 year to Waters of u.S. 0 .197 0.08% .950 .187Residential High Density 5 year on Site 0 .414 0.16% .002 .001Residential High Density 5 year on Site 0 9.439 3.69% .002 .019
• Comm Res Office, Church 100 year on Site 0 3.585 1.40% .001 .004Comm Res Office, Church 100 year on Site 0 3.738 1.46% .001 .004Vacant Land Vacant Land 0 yr Retentio 0 .173 0.07"-' .200 .035Vacant Land Vacant Land 5 yr Retentio 0 1.658 0.65% .002 .003
•

•10 Outfa II Name Area Outfall Size Parent Id
Population Area•TD-06-A 12th ST &PRIEST
Landuse Retention
256.017 36
% Tot Area COE
TD-06
CA Avg COE
•
Vacant LandOpen Space, SchoolOpen Space, School
Summary for TD-06-A
Vacant Land 5 yr Retentio100 year on Site100 year on Site
ooo
.46014.1429.133
0.18%5.52%3.57%
.002
.001
.001
.001
.014
.009
•
•
Residential Low Density o year to Waters of u.S. 0 118.441 46.26% 48.418 0.409Residential Low Density 5 year on Lot 0 5.680 2.22% .011 0.002Residential Low Density 100 year on Lot 0 9.574 3.74% .010 0.001Residential Low Density 100 year on Site 0 13.503 5.27"1. .014 0.001Residential High Density 0 year to Waters of u.S. 0 8.158 3.19% 4.496 0.551Residential High Density 5 year on Site 0 9.853 3.85% .020 0.002Comm Res Office, Church 100 year on Site 0 7.323 2.86% .007 0.001Vacant Land Vacant Land 0 yr Retentio 0 .173 .07% .035 0.202Vacant Land Vacant Land 5 yr Retentio 0 2.118 .83% .004 0.002Open Space, School 100 year on Site 0 23.275 9.09% .023 0.001Total Street Area 0 57.919 22.62% 55.023 0.950
TD-06-A Drainage Area Totals
•
•
•
•
•
•
o 256.017 100.00% 108.061 0.422

•ID
TO-O?
Outfall Name
1224 S 52nd ST ON-SITE DET
Area
14.225
Outfall Size
2-12
Parent Id
• Landuse Retention Population Area % Tot Area COE CA Avg COE
•
Ind Large Site-Medium
Summary for TD-O?
Ind Large Site-MediumTotal Street Area
Detention Area on Site
Detention Area on Site
o
oo
14.221
14.221.004
99.97%
99.97%.03%
.950 13.510
13.510.004
0.9500.950
•
•
•
•
•
•
•
•
TD-O? Drainage Area Totals
o 14.225 100.00% 13.514 0.950

•10
TO-08
Outfall Name
HOHOKAM INO PARK
Area
28.151
Outfall Size
21
Parent Id
• Landuse Retention Population Area %Tot Area COE CA Avg COE
•
Comm Res Office, Church 5 year on Site 0 3.761 13.36% .002 .008Ind Park-light o year to Waters of U.S. 0 3.674 13.05% .950 3.490Ind Park-l ight o year to Waters of U.S. 0 .502 1.78% .950 .477Ind Park-l ight o year to Waters of U.S. 0 2.717 9.65% .950 2.581Ind Park-light o year to Waters of U.S. 0 .755 2.68% .950 .718Ind Park-light o year to Waters of U.S. 0 1.396 4.96% .950 1.326Ind Park-light o year to Waters of U.S. 0 .733 2.60% .950 .6961nd Park-li ght o year to Waters of U.S. 0 1.235 4.39% .950 1.173Ind Park-li ght o year to Waters of U.S. 0 4.084 14.51% .950 3.880Ind Park-light 100 year on Site 0 1.256 4.46% .001 .001Ind Large Site-Medium o year to Waters of U.S. 0 3.435 12.20% .950 3.263Vacant Land Vacant Land 0 yr Retentio 0 1.561 5.55% .210 .328
Summary for TO-08
•Comm Res Office, ChurchInd Park-lightInd Park-lightInd Large Site-MediumVacant LandTotal Street Area
5 year on Siteo year to Waters of U.S.100 year on Siteo year to Waters of U.S.Vacant Land 0 yr Retentio
oooooo
3.76115.0961.2563.4351.5613.042
13.36%53.63%4.46%
12.20%5.55%
10.81%
.00814.341
.0013.263
.3282.890
0.002:0.9500.0010.9500.2100.950
•
•
•
•
•
•
TO-08 Drainage Area Totals
o 28.151 100.00% 20.831 0.740

•ID
TD-09
Outfall Name
VILLA IND PARK
Area
23.206
Outfall Size
24
Parent Id
• Landuse Retention Population Area % Tot Area COE CA Avg COE
Comm Auto,Gas Sta,Pk Lot o year to Waters of U.S. 0 5.553 23.93% .950 5.276Ind Park-light o year to Waters of U.S. 0 3.651 15.73% .950 3.469Ind Park-light o year to Waters of U.S. 0 4.233 18.24% .950 4.021Ind Park-light 5 year on Site 0 1.058 4.56% .002 .002
• Ind Park-light 5 year on Site 0 2.541 10.95% .002 .005Vacant Land Vacant Land 0 yr Retentio 0 1.480 6.38% .200 .296
Summary for TD-09
•
•
•
•
•
•
•
•
Comm Auto,Gas Sta,Pk Lot 0 year to Waters of U.S.Ind Park-light 0 year to Waters of U.S.Ind Park-light 5 year on SiteVacant Land Vacant Land 0 yr RetentioTotal Street Area
TD-09 Drainage Area Totals
ooooo
o
5.5537.8843.6001.4804.688
23.206
23.93%33.97"1.
15.51%6.38%
20.20%
100.00%
5.2767.490
.007
.2964.454
17.523
0.9500.9500.0020.2000.950
0.755

•10
TO-10
Outfa II Name
1025 S 48th ST-on site
Area
3.040
Outfall Size
12
Parent Id
• Landuse Retention Population Area %Tot Area COE CA Avg COE
•
Ind Park-light
Summary for TO-10
Ind Park-lightTotal Street Area
o year to Waters of u.s.
o year to Waters of u.s.
o
oo
3.040
3.040.000
99.99%
99.99%.01%
.950 2.888
2.888.000
0.9500.950
•
•
•
•
•
•
•
•
TO-10 Orainage Area Totals
o 3.040 100.00% 2.888 0.950
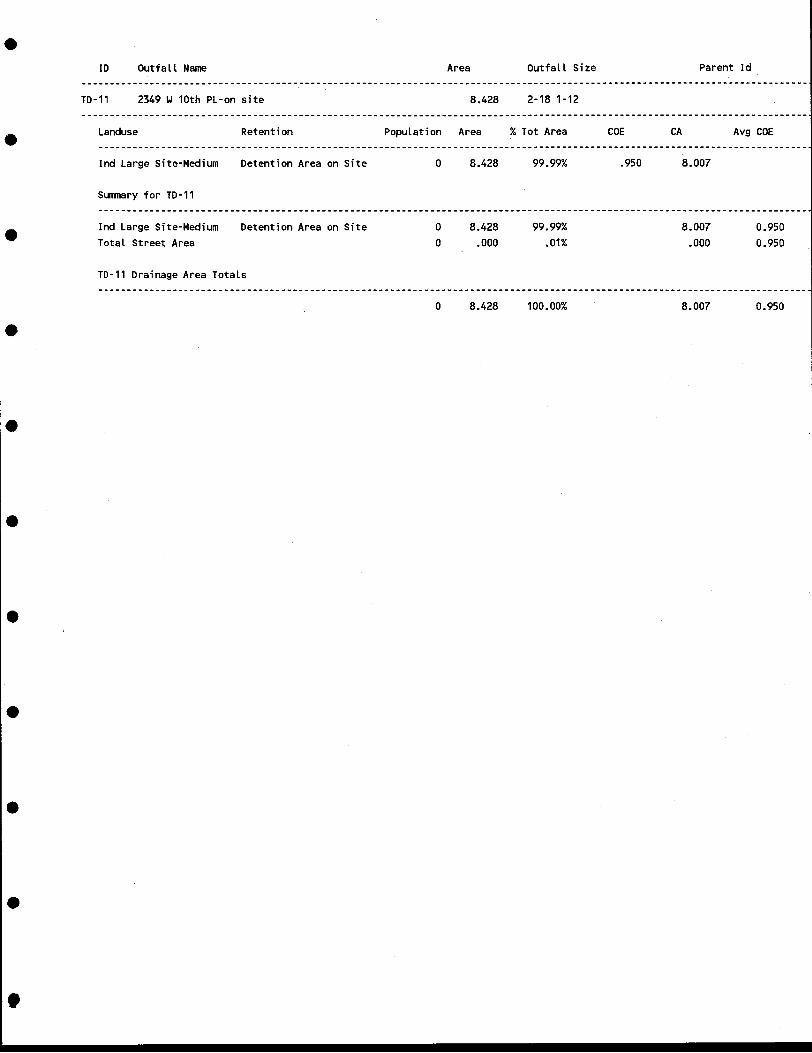
Landuse
•
•
10
TD-11
Outfall Name
2349 W10th PL-on site
Retention
Area
8.428
Population Area
Outfall Size
2-18 1-12
% Tot Area COE CA
Parent Id
Avg COE
•
Ind Large Site-Medium
Summary for TD-11
Ind Large Site-MediumTotal Street Area
Detention Area on Site
Detention Area on Site
o
oo
8.428
8.428.000
99.99%
99.99%.01%
.950 8.007
8.007.000
0.9500.950
•
•
•
•
•
•
•
TD-11 Drainage Area Totals
o 8.428 100.00% 8.007 0.950

Landuse
•
•
10
TO-12
Outfall Name
2001 W10th PL(ON SITE DET)
Retention
Area
14.225
Population Area
Outfall Size
18
% Tot Area COE CA
Parent Id
Avg COE
•
Vacant Land
Summary for TD-12
Vacant LandTotal Street Area
Detention Area on Site
Detention Area on Site
o
oo
1.989
1.98912.236
13.98%
13.98%86.02%
.950 1.890
1.89011.624
0.9500.950
•
•
•
•
•
•
•
•
TD-12 Drainage Area Totals
o 14.225 100.00% 13.514 0.950

Landuse
•
•
ID
TD-13
Outfall Name
2402 W12th ST(ON SITE DET)
Retention
Area
8.112
Population Area
Outfall Size
2-12
% Tot Area COE CA
Parent Id
Avg COE
~.
Ind Park-l ight
Summary for TD-13
Ind Park-lightTotal Street Area
5 year on Site
5 year on Site
o
oo
8.112
8.112.000
100.00%
100.00%.00%
.002 .016
.016
.0000.0020.950
•
•
•
•
•
•
•
•
TD-13 Drainage Area Totals
o 8.112 100.00% .016 0.002

•ID Outfall Name Area Outfall Size Parent Id
----------------------.----------------------------------------------------------------------------------------------------.---VOR-01 RIO SALADO RIPARIAN AREA 338.676 NONE-------------------------------------------------------------------------------------------------------------------------------
• Landuse Retention Population Area % Tot Area COE CA Avg COE-------------------------------------------------------------------------------------------.--------------------------------_.Unknown 100 year on Site 0 6.860 2.03% .001 .007Comm Res Office, Church 100 year on Site 0 13.684 4.04% .001 .014Comm Res Office, Church 100 year on Site 0 2.571 0.76% .001 .003
~Comm Res Office, Church 100 year on Site 0 3.411 1.01% .001 .003Comm Auto,Gas Sta,Pk Lot 100 year on Site 0 2.360 0.70% .001 .002Comm Auto,Gas Sta,Pk Lot 100 year on Site 0 2.406 0.71% .001 .002Ind Park-light o year to Waters of U.S. 0 1.852 0.55% .950 1.760Ind Park-li ght o year to Waters of U.S. 0 2.211 0.65% .950 2.101Ind Park-light o year to Waters of U.S. 0 1.632 0.48% .950 1.550Ind Park-light o year to Waters of U.S. 0 .691 0.20% .950 .657
• Ind Park-light o year to Waters of U.S. 0 1.507 0.44% .950 1.432Ind Park-light 100 year on Site 0 2.732 0.81% .001 .003Ind Park-light 100 year on Site 0 3.587 1.06% .001 .004Ind Park-l ight 100 year on Site 0 6.710 1.98% .001 .007Ind Park-light 100 year on Site 0 1.002 0.30% .001 .001Ind Park-light 100 year on Site 0 5.852 1.73% .001 .006
• Ind Park-light 100 year on Site 0 .663 0.20% .001 .001Ind Park-light 100 year on Site 0 1.064 0.31% .001 .001Ind Park-l ight 100 year on Site 0 .826 0.24% .001 .001Ind Park-light 100 year on Site 0 2.328 0.69% .001 .002Ind Park-light 100 year on Site 0 2.887 0.85% .001 .003Ind Park-light 100 year on Site 0 1.286 0.38% .001 .001
• Ind Park-light 100 year on Site 0 1.683 0.50% .001 .002Ind Park-light 100 year on Site 0 3.698 1.09% .001 .004Ind Park-li ght 100 year on Site 0 3.027 0.89% .001 .003Ind Park-light 100 year on Site 0 1.236 0.36% .001 .001Ind Park-li ght 100 year on Site 0 1.286 0.38% .001 .001Ind Park-li ght 100 year on Site 0 2.344 0.69% .001 .002
• Ind Large Site-Medium o year to Waters of U.S. 0 1.951 0.58% .950 1.854Ind Large Site-Medium o year-to Waters of U.S. 0 2.884 0.85% .950 2.739Ind Large Site-Medium o year to Waters of U.S. 0 3.812 1.13% .950 3.622Ind Large Site-Medium 100 year on Site 0 3.825 1.13% .001 .004Vacant Land 100 year on Site 0 2.393 0.71% .001 .002Vacant Land Vacant Land 0 yr Retentio 0 6.864 2.03% .200 1.373
• Vacant Land Vacant Land 0 yr Retentio 0 .686 0.20% .200 .137Vacant Land Vacant Land 0 yr Retentio 0 5.524 1.63% .200 1.105Vacant Land Vacant Land 0 yr Retentio 0 3.031 0.89% .200 .606Vacant Land Vacant Land 100 yr Retent 0 1.978 0.58% .001 .002Vacant Land Vacant Land 100 yr Retent 0 2.524 0.75% .001 .003Vacant Land Vacant Land 100 yr Retent 0 4.033 1.19% .001 .004
• Vacant Land Vacant Land 100 yr Retent 0 5.373 1.59% .001 .005Vacant Land Vacant Land 100 yr Retent 0 80.311 23.71% .001 .080Vacant Land Vacant Land 100 yr Retent 0 100.501 29.67"1. .001 .101Vacant Land Vacant Land 100 yr Retent 0 8.152 2.41% .001 .008ADOT Jurisdiction ADOT information 0 2.396 0.71% .500 1.198ADOT Jurisdiction ADOT information 0 16.183 4.78% .500 8.092
•
•

Landuse
•
•
ID
VOR-01
Outfall Name
RIO SALADO RIPARIAN AREA
Retention
Area
338.676
Population Area
Outfall Size
NONE
%Tot Area COE CA
Parent Id
Avg COE
Summary for VOR-01
Unknown 100 year on Site 0 6.860 2.03% .007 0.001Comm Res Office, Church 100 year on Site 0 19.665 5.81% .020 0.001Comm Auto,Gas Sta,Pk Lot 100 year on Site 0 4.766 1.41% .005 0.001Ind Park-light o year to Waters of U.S. 0 7.893 2.33% 7.499 0.950Ind Park-light 100 year on Site 0 42.211 12.46% .042 0.001Ind Large Site-Medium o year to Waters of U.S. 0 8.647 2.55% 8.215 0.950Ind Large Site-Medium 100 year on Site 0 3.825 1.13% .004 0.001Vacant Land 100 year on Site 0 2.393 .71% .002 0.001• Vacant Land Vacant Land 0 yr Retentio 0 16.106 4.76% 3.221 0.200Vacant Land Vacant Land 100 yr Retent 0 202.873 59.90% .203 0.001ADOT Jurisdiction ADOT information 0 18.580 5.49% 9.290 0.500Total Street Area 0 4.857 1.43% 4.614 0.950
VOR-01 Drainage Area Totals• ---------------------------------------------------------------------------------------------------------------------------
•
•
•
•
•
•
o 338.676 100.00% 33.122 0.098

• 10 Outfall Name Area Outfall Size Parent Id
•VOR-01-A 52nd ST AND 1st ST
Landuse Retention
60.535
Population Area
24
% Tot Area COE
VOR-01
CA Avg COE
Comm Res Office, Church 100 year on Site 0 1.712 2.83% .001 .002Comm Res Office, Church 100 year on Site 0 1.074 1. 77"1. .001 .001Ind Park-light 100 year on Site 0 .815 1.35% .001 .001Ind Park-light 100 year on Site 0 3.391 5.60% .001 .003Ind Park-light 100 year on Site 0 2.409 3.98% .001 .002Ind Park-l ight 100 year on Site 0 7.287 12.04% .001 .007Ind Park-light 100 year on Site 0 .862 1.42% .001 .001Ind Park-light 100 year on Site 0 8.646 14.28% .001 .009Ind Park-light 100 year on Site 0 .799 1.32% .001 .001Ind Park-light Detention Basin 0 .243 0.40% .950 .231Ind Large Site-Medium 100 year on Site 0 6.014 9.93% .001 .006• Ind Large Site-Medium 100 year on Site 0 5.732 9.47"1. .001 .006Vacant Land Vacant Land 100 yr Retent 0 .645 1.07% .001 .001Vacant Land Vacant Land 100 yr Retent 0 8.012 13.24% .001 .008Vacant Land Vacant Land 100 yr Retent 0 2.991 4.94% .001 .003
Summary for VOR-01-A• Comm Res Office, Church 100 year on Site 0 2.786 4.60% .003 0.001Ind Park-light 100 year on Site 0 24.209 39.99% .024 0.001Ind Park-light Detention Basin 0 .243 .40% .231 0.951Ind Large Site-Medium ' 100 year on Site 0 11.746 19.40% .012 0.001Vacant Land Vacant Land 100 yr Retent 0 11.648 19.24% .012 0.001• Total Street Area 0 9.903 16.36% 9.407 0.950
VOR-01-A Drainage Area Totals
•
•
•
•
o 60.535 100.00% 9.689 0.160