Embed Size (px)
Citation preview

APPENDIX D
ABC CHALLENGES AND LESSONS LEARNED
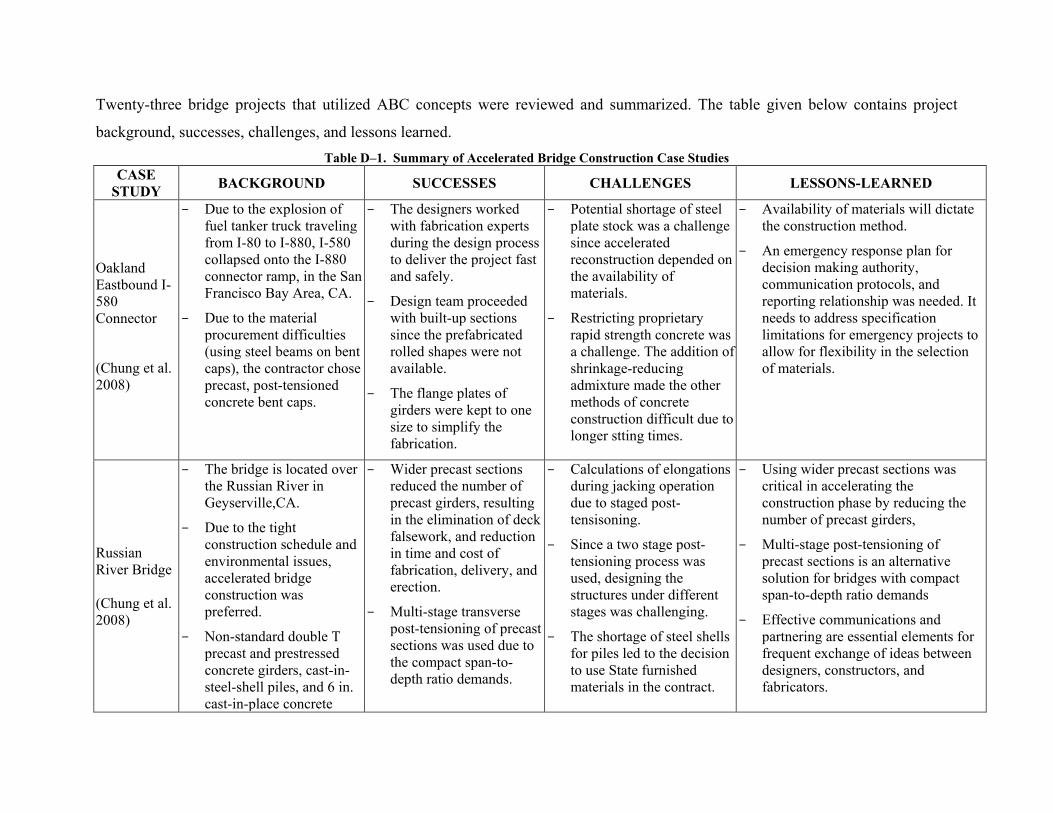
Twenty-three bridge projects that utilized ABC concepts were reviewed and summarized. The table given below contains project
background, successes, challenges, and lessons learned. Table D–1. Summary of Accelerated Bridge Construction Case Studies
CASE STUDY BACKGROUND SUCCESSES CHALLENGES LESSONS-LEARNED
Oakland Eastbound I-580 Connector
(Chung et al. 2008)
- Due to the explosion of fuel tanker truck traveling from I-80 to I-880, I-580 collapsed onto the I-880 connector ramp, in the San Francisco Bay Area, CA.
- Due to the material procurement difficulties (using steel beams on bent caps), the contractor chose precast, post-tensioned concrete bent caps.
- The designers worked with fabrication experts during the design process to deliver the project fast and safely.
- Design team proceeded with built-up sections since the prefabricated rolled shapes were not available.
- The flange plates of girders were kept to one size to simplify the fabrication.
- Potential shortage of steel plate stock was a challenge since accelerated reconstruction depended on the availability of materials.
- Restricting proprietary rapid strength concrete was a challenge. The addition of shrinkage-reducing admixture made the other methods of concrete construction difficult due to longer stting times.
- Availability of materials will dictate the construction method.
- An emergency response plan for decision making authority, communication protocols, and reporting relationship was needed. It needs to address specification limitations for emergency projects to allow for flexibility in the selection of materials.
Russian River Bridge (Chung et al. 2008)
- The bridge is located over the Russian River in Geyserville,CA.
- Due to the tight construction schedule and environmental issues, accelerated bridge construction was preferred.
- Non-standard double T precast and prestressed concrete girders, cast-in-steel-shell piles, and 6 in. cast-in-place concrete
- Wider precast sections reduced the number of precast girders, resulting in the elimination of deck falsework, and reduction in time and cost of fabrication, delivery, and erection.
- Multi-stage transverse post-tensioning of precast sections was used due to the compact span-to-depth ratio demands.
- Calculations of elongations during jacking operation due to staged post-tensisoning.
- Since a two stage post-tensioning process was used, designing the structures under different stages was challenging.
- The shortage of steel shells for piles led to the decision to use State furnished materials in the contract.
- Using wider precast sections was critical in accelerating the construction phase by reducing the number of precast girders,
- Multi-stage post-tensioning of precast sections is an alternative solution for bridges with compact span-to-depth ratio demands
- Effective communications and partnering are essential elements for frequent exchange of ideas between designers, constructors, and fabricators.
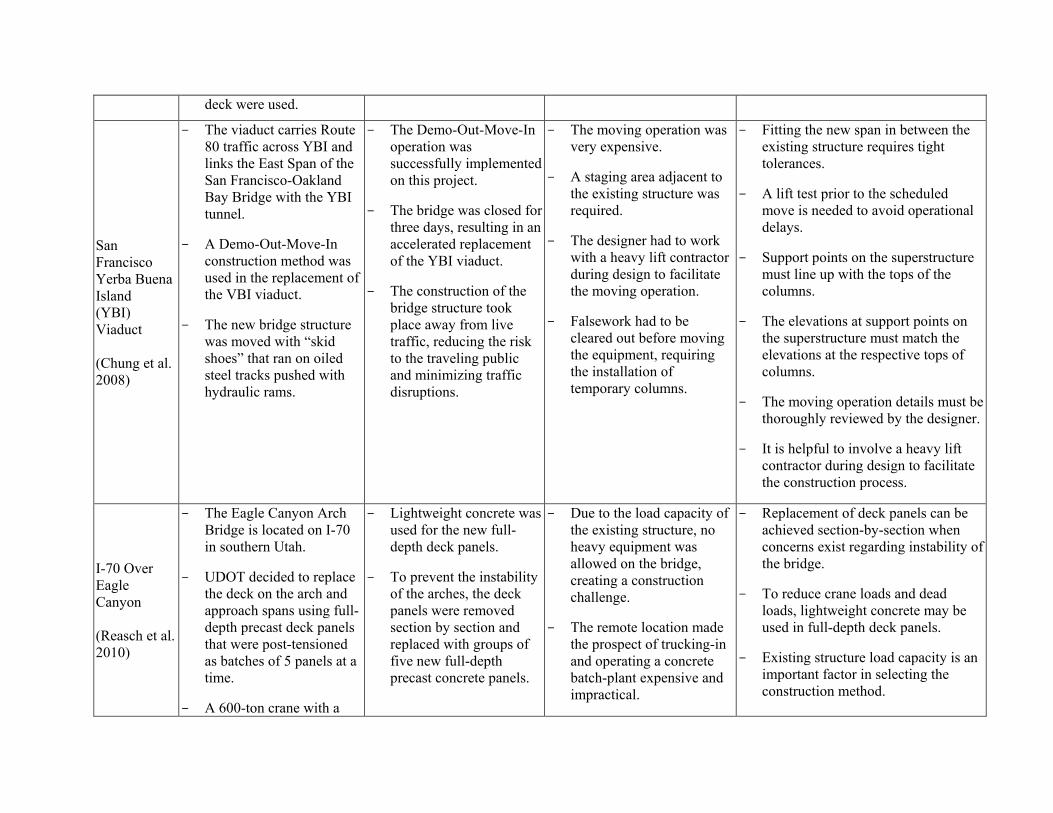
deck were used.
San Francisco Yerba Buena Island (YBI) Viaduct (Chung et al. 2008)
- The viaduct carries Route 80 traffic across YBI and links the East Span of the San Francisco-Oakland Bay Bridge with the YBI tunnel.
- A Demo-Out-Move-In construction method was used in the replacement of the VBI viaduct.
- The new bridge structure was moved with “skid shoes” that ran on oiled steel tracks pushed with hydraulic rams.
- The Demo-Out-Move-In operation was successfully implemented on this project.
- The bridge was closed for three days, resulting in an accelerated replacement of the YBI viaduct.
- The construction of the bridge structure took place away from live traffic, reducing the risk to the traveling public and minimizing traffic disruptions.
- The moving operation was very expensive.
- A staging area adjacent to the existing structure was required.
- The designer had to work with a heavy lift contractor during design to facilitate the moving operation.
- Falsework had to be cleared out before moving the equipment, requiring the installation of temporary columns.
- Fitting the new span in between the existing structure requires tight tolerances.
- A lift test prior to the scheduled move is needed to avoid operational delays.
- Support points on the superstructure must line up with the tops of the columns.
- The elevations at support points on the superstructure must match the elevations at the respective tops of columns.
- The moving operation details must be thoroughly reviewed by the designer.
- It is helpful to involve a heavy lift contractor during design to facilitate the construction process.
I-70 Over Eagle Canyon (Reasch et al. 2010)
- The Eagle Canyon Arch Bridge is located on I-70 in southern Utah.
- UDOT decided to replace the deck on the arch and approach spans using full-depth precast deck panels that were post-tensioned as batches of 5 panels at a time.
- A 600-ton crane with a
- Lightweight concrete was used for the new full-depth deck panels.
- To prevent the instability of the arches, the deck panels were removed section by section and replaced with groups of five new full-depth precast concrete panels.
- Due to the load capacity of the existing structure, no heavy equipment was allowed on the bridge, creating a construction challenge.
- The remote location made the prospect of trucking-in and operating a concrete batch-plant expensive and impractical.
- Replacement of deck panels can be achieved section-by-section when concerns exist regarding instability of the bridge.
- To reduce crane loads and dead loads, lightweight concrete may be used in full-depth deck panels.
- Existing structure load capacity is an important factor in selecting the construction method.
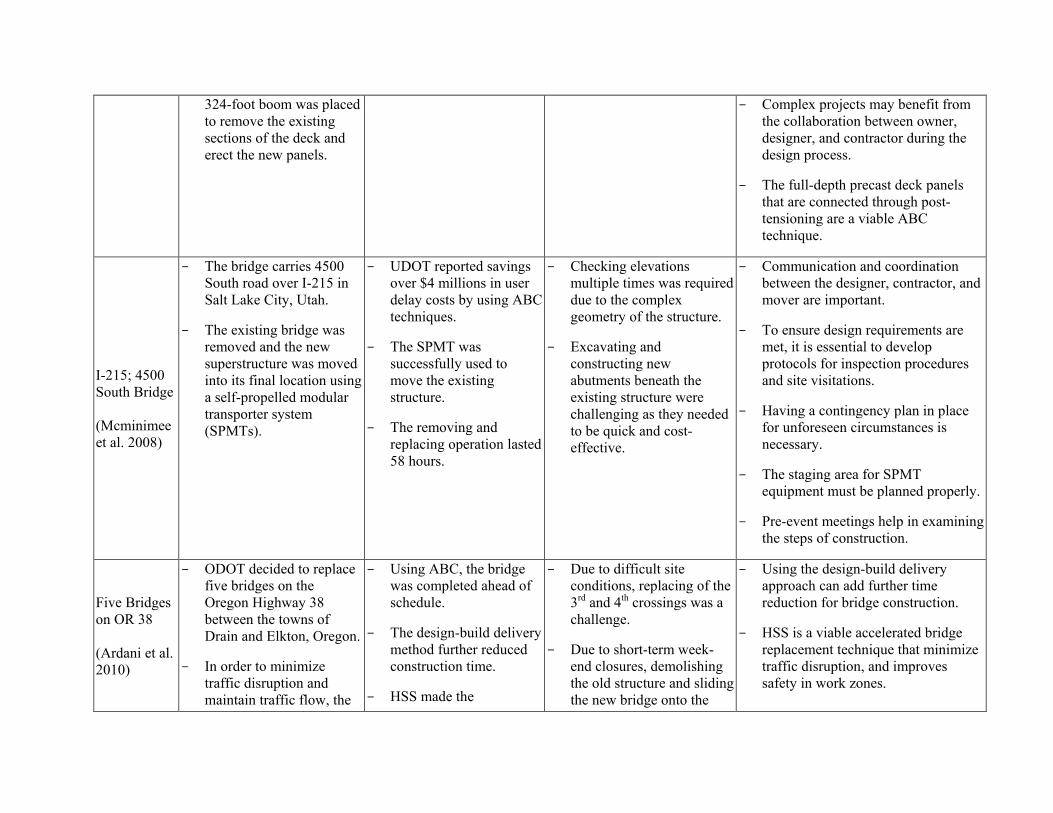
324-foot boom was placed to remove the existing sections of the deck and erect the new panels.
- Complex projects may benefit from the collaboration between owner, designer, and contractor during the design process.
- The full-depth precast deck panels that are connected through post-tensioning are a viable ABC technique.
I-215; 4500 South Bridge (Mcminimee et al. 2008)
- The bridge carries 4500 South road over I-215 in Salt Lake City, Utah.
- The existing bridge was removed and the new superstructure was moved into its final location using a self-propelled modular transporter system (SPMTs).
- UDOT reported savings over $4 millions in user delay costs by using ABC techniques.
- The SPMT was successfully used to move the existing structure.
- The removing and replacing operation lasted 58 hours.
- Checking elevations multiple times was required due to the complex geometry of the structure.
- Excavating and constructing new abutments beneath the existing structure were challenging as they needed to be quick and cost-effective.
- Communication and coordination between the designer, contractor, and mover are important.
- To ensure design requirements are met, it is essential to develop protocols for inspection procedures and site visitations.
- Having a contingency plan in place for unforeseen circumstances is necessary.
- The staging area for SPMT equipment must be planned properly.
- Pre-event meetings help in examining the steps of construction.
Five Bridges on OR 38 (Ardani et al. 2010)
- ODOT decided to replace five bridges on the Oregon Highway 38 between the towns of Drain and Elkton, Oregon.
- In order to minimize traffic disruption and maintain traffic flow, the
- Using ABC, the bridge was completed ahead of schedule.
- The design-build delivery method further reduced construction time.
- HSS made the
- Due to difficult site conditions, replacing of the 3rd and 4th crossings was a challenge.
- Due to short-term week-end closures, demolishing the old structure and sliding the new bridge onto the
- Using the design-build delivery approach can add further time reduction for bridge construction.
- HSS is a viable accelerated bridge replacement technique that minimize traffic disruption, and improves safety in work zones.
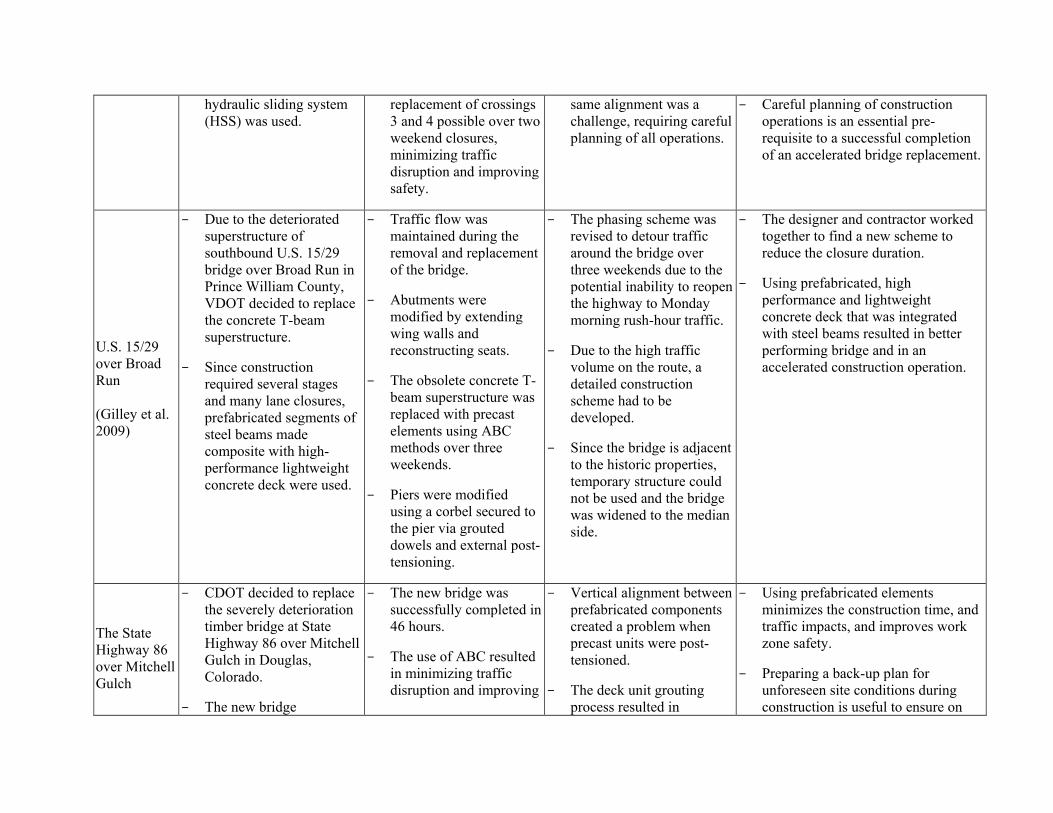
hydraulic sliding system (HSS) was used.
replacement of crossings 3 and 4 possible over two weekend closures, minimizing traffic disruption and improving safety.
same alignment was a challenge, requiring careful planning of all operations.
- Careful planning of construction operations is an essential pre-requisite to a successful completion of an accelerated bridge replacement.
U.S. 15/29 over Broad Run (Gilley et al. 2009)
- Due to the deteriorated superstructure of southbound U.S. 15/29 bridge over Broad Run in Prince William County, VDOT decided to replace the concrete T-beam superstructure.
- Since construction required several stages and many lane closures, prefabricated segments of steel beams made composite with high-performance lightweight concrete deck were used.
- Traffic flow was maintained during the removal and replacement of the bridge.
- Abutments were modified by extending wing walls and reconstructing seats.
- The obsolete concrete T-beam superstructure was replaced with precast elements using ABC methods over three weekends.
- Piers were modified using a corbel secured to the pier via grouted dowels and external post-tensioning.
- The phasing scheme was revised to detour traffic around the bridge over three weekends due to the potential inability to reopen the highway to Monday morning rush-hour traffic.
- Due to the high traffic volume on the route, a detailed construction scheme had to be developed.
- Since the bridge is adjacent to the historic properties, temporary structure could not be used and the bridge was widened to the median side.
- The designer and contractor worked together to find a new scheme to reduce the closure duration.
- Using prefabricated, high performance and lightweight concrete deck that was integrated with steel beams resulted in better performing bridge and in an accelerated construction operation.
The State Highway 86 over Mitchell Gulch
- CDOT decided to replace the severely deterioration timber bridge at State Highway 86 over Mitchell Gulch in Douglas, Colorado.
- The new bridge
- The new bridge was successfully completed in 46 hours.
- The use of ABC resulted in minimizing traffic disruption and improving
- Vertical alignment between prefabricated components created a problem when precast units were post-tensioned.
- The deck unit grouting process resulted in
- Using prefabricated elements minimizes the construction time, and traffic impacts, and improves work zone safety.
- Preparing a back-up plan for unforeseen site conditions during construction is useful to ensure on
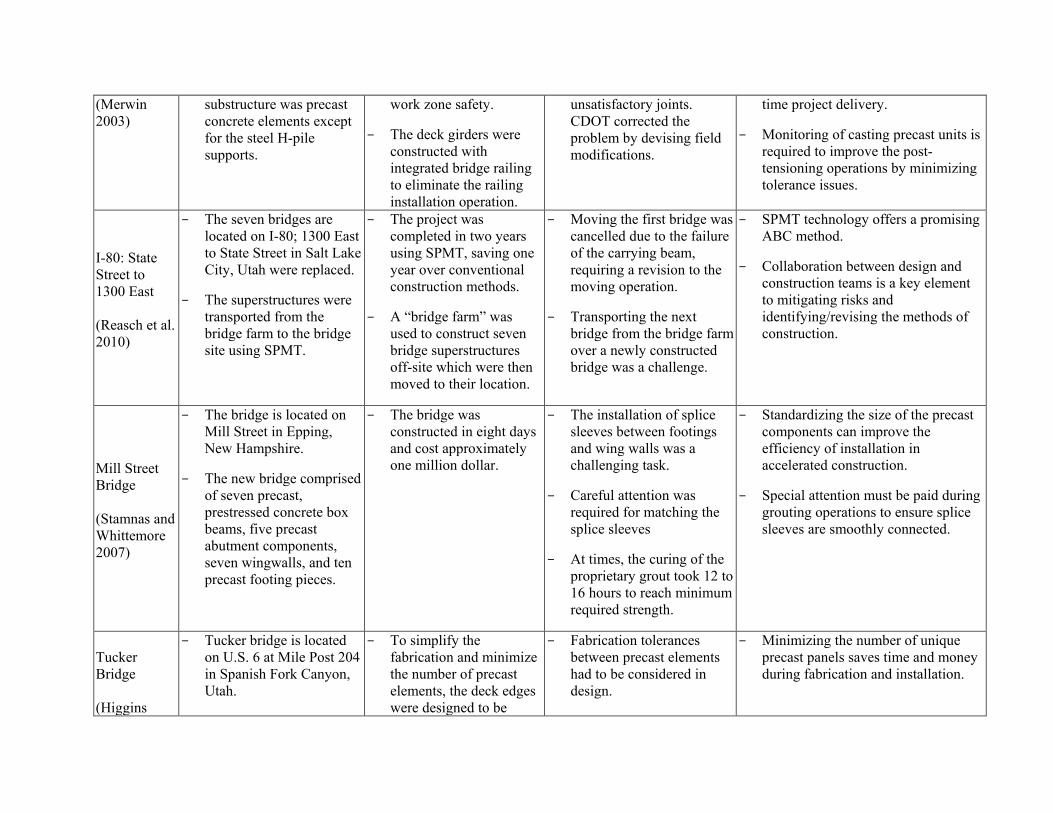
(Merwin 2003)
substructure was precast concrete elements except for the steel H-pile supports.
work zone safety.
- The deck girders were constructed with integrated bridge railing to eliminate the railing installation operation.
unsatisfactory joints. CDOT corrected the problem by devising field modifications.
time project delivery.
- Monitoring of casting precast units is required to improve the post-tensioning operations by minimizing tolerance issues.
I-80: State Street to 1300 East (Reasch et al. 2010)
- The seven bridges are located on I-80; 1300 East to State Street in Salt Lake City, Utah were replaced.
- The superstructures were transported from the bridge farm to the bridge site using SPMT.
- The project was completed in two years using SPMT, saving one year over conventional construction methods.
- A “bridge farm” was used to construct seven bridge superstructures off-site which were then moved to their location.
- Moving the first bridge was cancelled due to the failure of the carrying beam, requiring a revision to the moving operation.
- Transporting the next bridge from the bridge farm over a newly constructed bridge was a challenge.
- SPMT technology offers a promising ABC method.
- Collaboration between design and construction teams is a key element to mitigating risks and identifying/revising the methods of construction.
Mill Street Bridge (Stamnas and Whittemore 2007)
- The bridge is located on Mill Street in Epping, New Hampshire.
- The new bridge comprised of seven precast, prestressed concrete box beams, five precast abutment components, seven wingwalls, and ten precast footing pieces.
- The bridge was constructed in eight days and cost approximately one million dollar.
- The installation of splice sleeves between footings and wing walls was a challenging task.
- Careful attention was required for matching the splice sleeves
- At times, the curing of the proprietary grout took 12 to 16 hours to reach minimum required strength.
- Standardizing the size of the precast components can improve the efficiency of installation in accelerated construction.
- Special attention must be paid during grouting operations to ensure splice sleeves are smoothly connected.
Tucker Bridge (Higgins
- Tucker bridge is located on U.S. 6 at Mile Post 204 in Spanish Fork Canyon, Utah.
- To simplify the fabrication and minimize the number of precast elements, the deck edges were designed to be
- Fabrication tolerances between precast elements had to be considered in design.
- Minimizing the number of unique precast panels saves time and money during fabrication and installation.
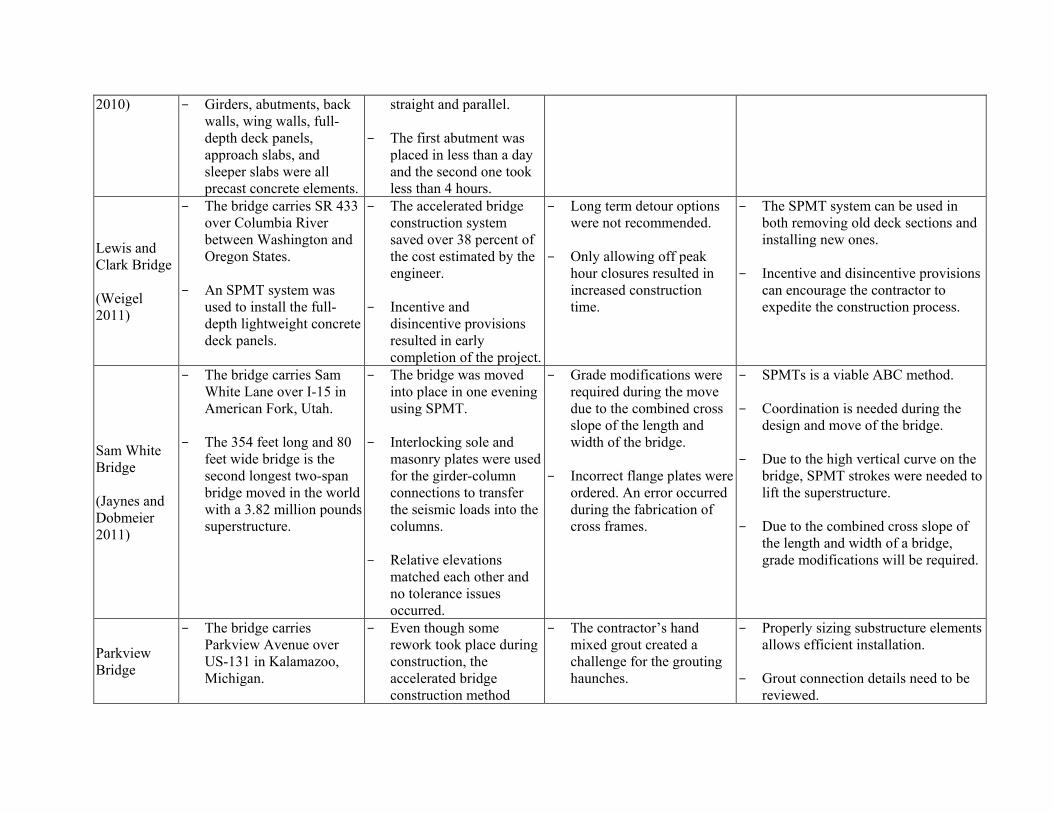
2010)
- Girders, abutments, back walls, wing walls, full-depth deck panels, approach slabs, and sleeper slabs were all precast concrete elements.
straight and parallel.
- The first abutment was placed in less than a day and the second one took less than 4 hours.
Lewis and Clark Bridge (Weigel 2011)
- The bridge carries SR 433 over Columbia River between Washington and Oregon States.
- An SPMT system was used to install the full-depth lightweight concrete deck panels.
- The accelerated bridge construction system saved over 38 percent of the cost estimated by the engineer.
- Incentive and disincentive provisions resulted in early completion of the project.
- Long term detour options were not recommended.
- Only allowing off peak
hour closures resulted in increased construction time.
- The SPMT system can be used in both removing old deck sections and installing new ones.
- Incentive and disincentive provisions can encourage the contractor to expedite the construction process.
Sam White Bridge (Jaynes and Dobmeier 2011)
- The bridge carries Sam White Lane over I-15 in American Fork, Utah.
- The 354 feet long and 80 feet wide bridge is the second longest two-span bridge moved in the world with a 3.82 million pounds superstructure.
- The bridge was moved into place in one evening using SPMT.
- Interlocking sole and masonry plates were used for the girder-column connections to transfer the seismic loads into the columns.
- Relative elevations matched each other and no tolerance issues occurred.
- Grade modifications were required during the move due to the combined cross slope of the length and width of the bridge.
- Incorrect flange plates were ordered. An error occurred during the fabrication of cross frames.
- SPMTs is a viable ABC method.
- Coordination is needed during the design and move of the bridge.
- Due to the high vertical curve on the bridge, SPMT strokes were needed to lift the superstructure.
- Due to the combined cross slope of the length and width of a bridge, grade modifications will be required.
Parkview Bridge
- The bridge carries Parkview Avenue over US-131 in Kalamazoo, Michigan.
- Even though some rework took place during construction, the accelerated bridge construction method
- The contractor’s hand mixed grout created a challenge for the grouting haunches.
- Properly sizing substructure elements allows efficient installation.
- Grout connection details need to be reviewed.
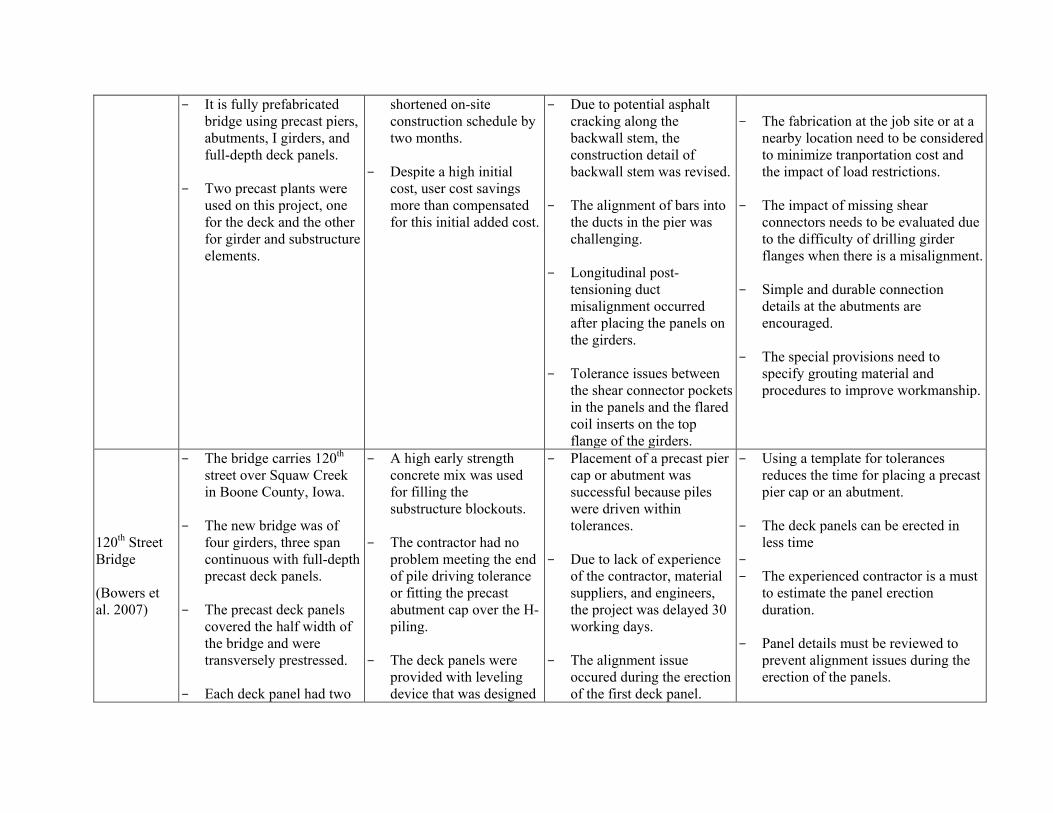
- It is fully prefabricated bridge using precast piers, abutments, I girders, and full-depth deck panels.
- Two precast plants were used on this project, one for the deck and the other for girder and substructure elements.
shortened on-site construction schedule by two months.
- Despite a high initial cost, user cost savings more than compensated for this initial added cost.
- Due to potential asphalt cracking along the backwall stem, the construction detail of backwall stem was revised.
- The alignment of bars into the ducts in the pier was challenging.
- Longitudinal post-tensioning duct misalignment occurred after placing the panels on the girders.
- Tolerance issues between the shear connector pockets in the panels and the flared coil inserts on the top flange of the girders.
- The fabrication at the job site or at a
nearby location need to be considered to minimize tranportation cost and the impact of load restrictions.
- The impact of missing shear connectors needs to be evaluated due to the difficulty of drilling girder flanges when there is a misalignment.
- Simple and durable connection details at the abutments are encouraged.
- The special provisions need to specify grouting material and procedures to improve workmanship.
120th Street Bridge (Bowers et al. 2007)
- The bridge carries 120th street over Squaw Creek in Boone County, Iowa.
- The new bridge was of four girders, three span continuous with full-depth precast deck panels.
- The precast deck panels covered the half width of the bridge and were transversely prestressed.
- Each deck panel had two
- A high early strength concrete mix was used for filling the substructure blockouts.
- The contractor had no problem meeting the end of pile driving tolerance or fitting the precast abutment cap over the H-piling.
- The deck panels were provided with leveling device that was designed
- Placement of a precast pier cap or abutment was successful because piles were driven within tolerances.
- Due to lack of experience of the contractor, material suppliers, and engineers, the project was delayed 30 working days.
- The alignment issue occured during the erection of the first deck panel.
- Using a template for tolerances reduces the time for placing a precast pier cap or an abutment.
- The deck panels can be erected in less time
- - The experienced contractor is a must
to estimate the panel erection duration.
- Panel details must be reviewed to prevent alignment issues during the erection of the panels.
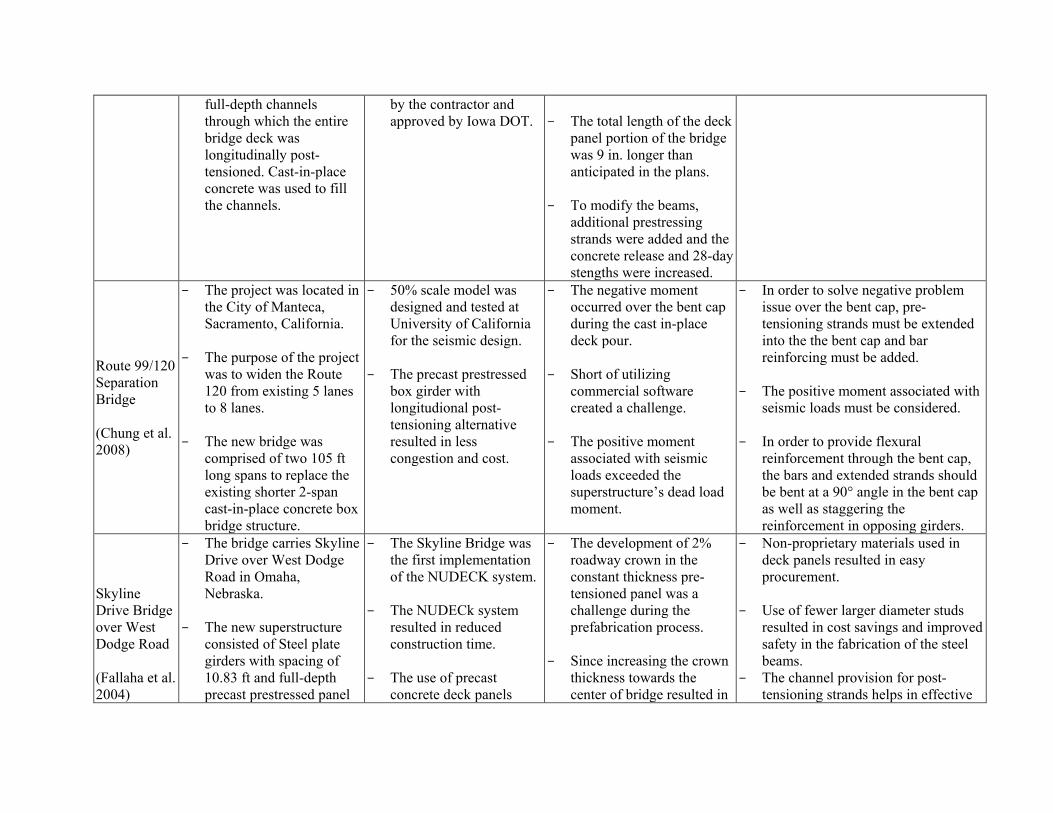
full-depth channels through which the entire bridge deck was longitudinally post-tensioned. Cast-in-place concrete was used to fill the channels.
by the contractor and approved by Iowa DOT.
- The total length of the deck
panel portion of the bridge was 9 in. longer than anticipated in the plans.
- To modify the beams, additional prestressing strands were added and the concrete release and 28-day stengths were increased.
Route 99/120 Separation Bridge (Chung et al. 2008)
- The project was located in the City of Manteca, Sacramento, California.
- The purpose of the project was to widen the Route 120 from existing 5 lanes to 8 lanes.
- The new bridge was comprised of two 105 ft long spans to replace the existing shorter 2-span cast-in-place concrete box bridge structure.
- 50% scale model was designed and tested at University of California for the seismic design.
- The precast prestressed box girder with longitudional post-tensioning alternative resulted in less congestion and cost.
- The negative moment occurred over the bent cap during the cast in-place deck pour.
- Short of utilizing commercial software created a challenge.
- The positive moment associated with seismic loads exceeded the superstructure’s dead load moment.
- In order to solve negative problem issue over the bent cap, pre-tensioning strands must be extended into the the bent cap and bar reinforcing must be added.
- The positive moment associated with seismic loads must be considered.
- In order to provide flexural reinforcement through the bent cap, the bars and extended strands should be bent at a 90° angle in the bent cap as well as staggering the reinforcement in opposing girders.
Skyline Drive Bridge over West Dodge Road (Fallaha et al. 2004)
- The bridge carries Skyline Drive over West Dodge Road in Omaha, Nebraska.
- The new superstructure consisted of Steel plate girders with spacing of 10.83 ft and full-depth precast prestressed panel
- The Skyline Bridge was the first implementation of the NUDECK system.
- The NUDECk system resulted in reduced construction time.
- The use of precast concrete deck panels
- The development of 2% roadway crown in the constant thickness pre-tensioned panel was a challenge during the prefabrication process.
- Since increasing the crown thickness towards the center of bridge resulted in
- Non-proprietary materials used in deck panels resulted in easy procurement.
- Use of fewer larger diameter studs resulted in cost savings and improved safety in the fabrication of the steel beams.
- The channel provision for post-tensioning strands helps in effective
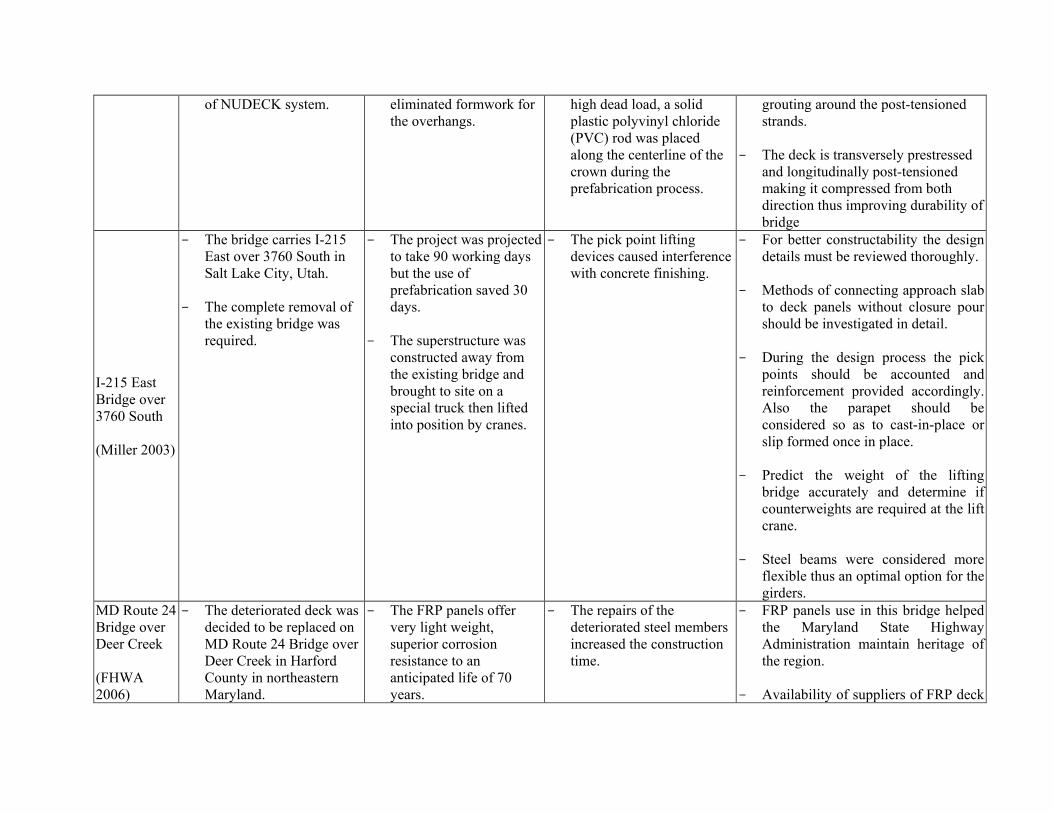
of NUDECK system.
eliminated formwork for the overhangs.
high dead load, a solid plastic polyvinyl chloride (PVC) rod was placed along the centerline of the crown during the prefabrication process.
grouting around the post-tensioned strands.
- The deck is transversely prestressed and longitudinally post-tensioned making it compressed from both direction thus improving durability of bridge
I-215 East Bridge over 3760 South (Miller 2003)
- The bridge carries I-215 East over 3760 South in Salt Lake City, Utah.
- The complete removal of the existing bridge was required.
- The project was projected to take 90 working days but the use of prefabrication saved 30 days.
- The superstructure was
constructed away from the existing bridge and brought to site on a special truck then lifted into position by cranes.
- The pick point lifting devices caused interference with concrete finishing.
- For better constructability the design details must be reviewed thoroughly.
- Methods of connecting approach slab to deck panels without closure pour should be investigated in detail.
- During the design process the pick points should be accounted and reinforcement provided accordingly. Also the parapet should be considered so as to cast-in-place or slip formed once in place.
- Predict the weight of the lifting bridge accurately and determine if counterweights are required at the lift crane.
- Steel beams were considered more flexible thus an optimal option for the girders.
MD Route 24 Bridge over Deer Creek (FHWA 2006)
- The deteriorated deck was decided to be replaced on MD Route 24 Bridge over Deer Creek in Harford County in northeastern Maryland.
- The FRP panels offer very light weight, superior corrosion resistance to an anticipated life of 70 years.
- The repairs of the deteriorated steel members increased the construction time.
- FRP panels use in this bridge helped the Maryland State Highway Administration maintain heritage of the region.
- Availability of suppliers of FRP deck
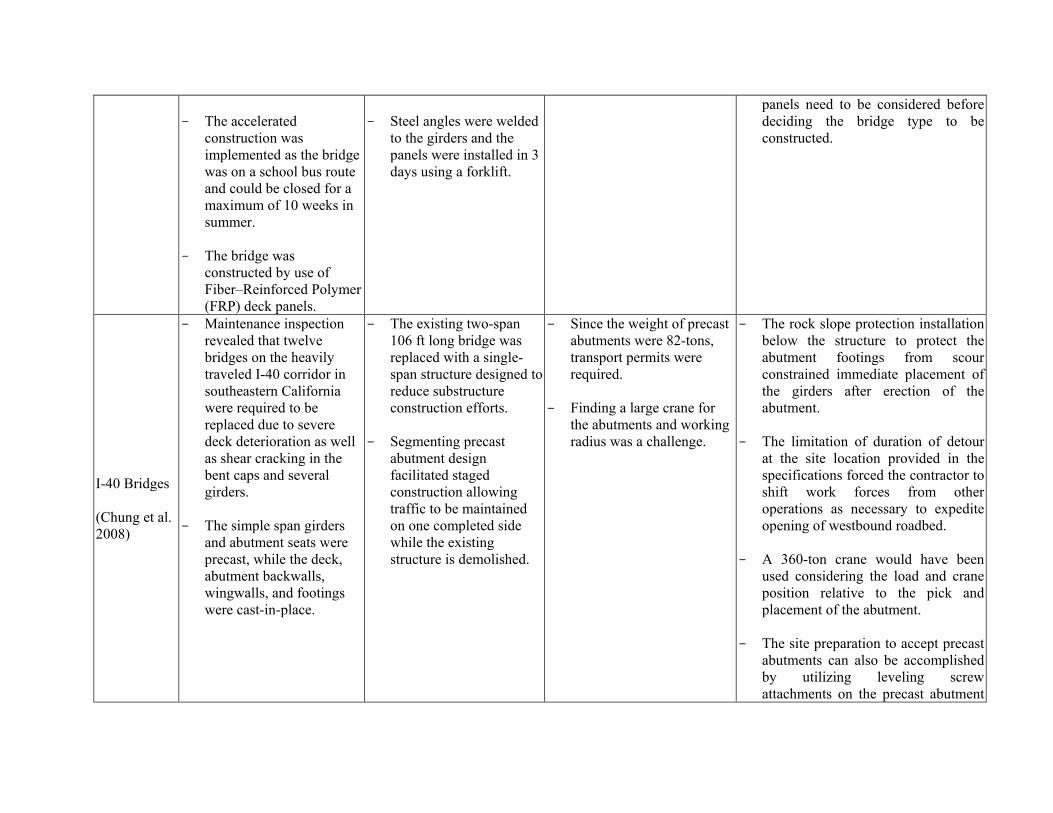
- The accelerated
construction was implemented as the bridge was on a school bus route and could be closed for a maximum of 10 weeks in summer.
- The bridge was constructed by use of Fiber–Reinforced Polymer (FRP) deck panels.
- Steel angles were welded
to the girders and the panels were installed in 3 days using a forklift.
panels need to be considered before deciding the bridge type to be constructed.
I-40 Bridges (Chung et al. 2008)
- Maintenance inspection revealed that twelve bridges on the heavily traveled I-40 corridor in southeastern California were required to be replaced due to severe deck deterioration as well as shear cracking in the bent caps and several girders.
- The simple span girders and abutment seats were precast, while the deck, abutment backwalls, wingwalls, and footings were cast-in-place.
- The existing two-span 106 ft long bridge was replaced with a single-span structure designed to reduce substructure construction efforts.
- Segmenting precast abutment design facilitated staged construction allowing traffic to be maintained on one completed side while the existing structure is demolished.
- Since the weight of precast abutments were 82-tons, transport permits were required.
- Finding a large crane for the abutments and working radius was a challenge.
- The rock slope protection installation below the structure to protect the abutment footings from scour constrained immediate placement of the girders after erection of the abutment.
- The limitation of duration of detour at the site location provided in the specifications forced the contractor to shift work forces from other operations as necessary to expedite opening of westbound roadbed.
- A 360-ton crane would have been used considering the load and crane position relative to the pick and placement of the abutment.
- The site preparation to accept precast abutments can also be accomplished by utilizing leveling screw attachments on the precast abutment
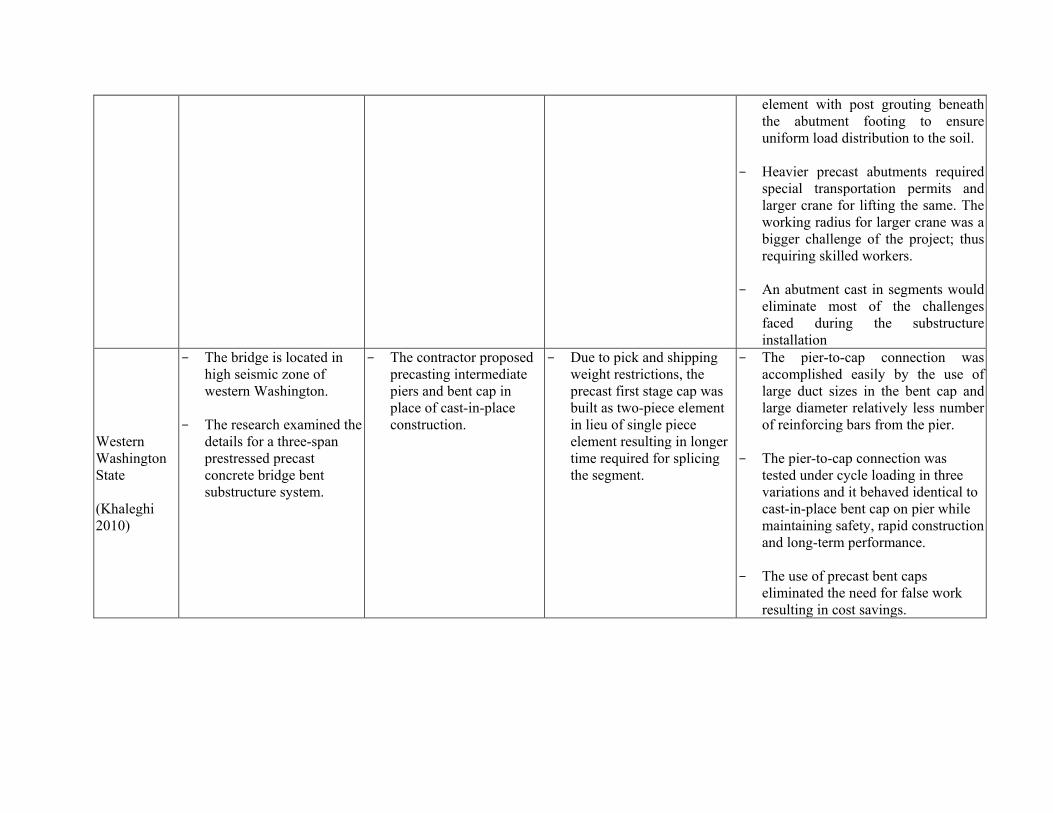
element with post grouting beneath the abutment footing to ensure uniform load distribution to the soil.
- Heavier precast abutments required special transportation permits and larger crane for lifting the same. The working radius for larger crane was a bigger challenge of the project; thus requiring skilled workers.
- An abutment cast in segments would eliminate most of the challenges faced during the substructure installation
Western Washington State (Khaleghi 2010)
- The bridge is located in high seismic zone of western Washington.
- The research examined the details for a three-span prestressed precast concrete bridge bent substructure system.
- The contractor proposed precasting intermediate piers and bent cap in place of cast-in-place construction.
- Due to pick and shipping weight restrictions, the precast first stage cap was built as two-piece element in lieu of single piece element resulting in longer time required for splicing the segment.
- The pier-to-cap connection was accomplished easily by the use of large duct sizes in the bent cap and large diameter relatively less number of reinforcing bars from the pier.
- The pier-to-cap connection was tested under cycle loading in three variations and it behaved identical to cast-in-place bent cap on pier while maintaining safety, rapid construction and long-term performance.
- The use of precast bent caps eliminated the need for false work resulting in cost savings.
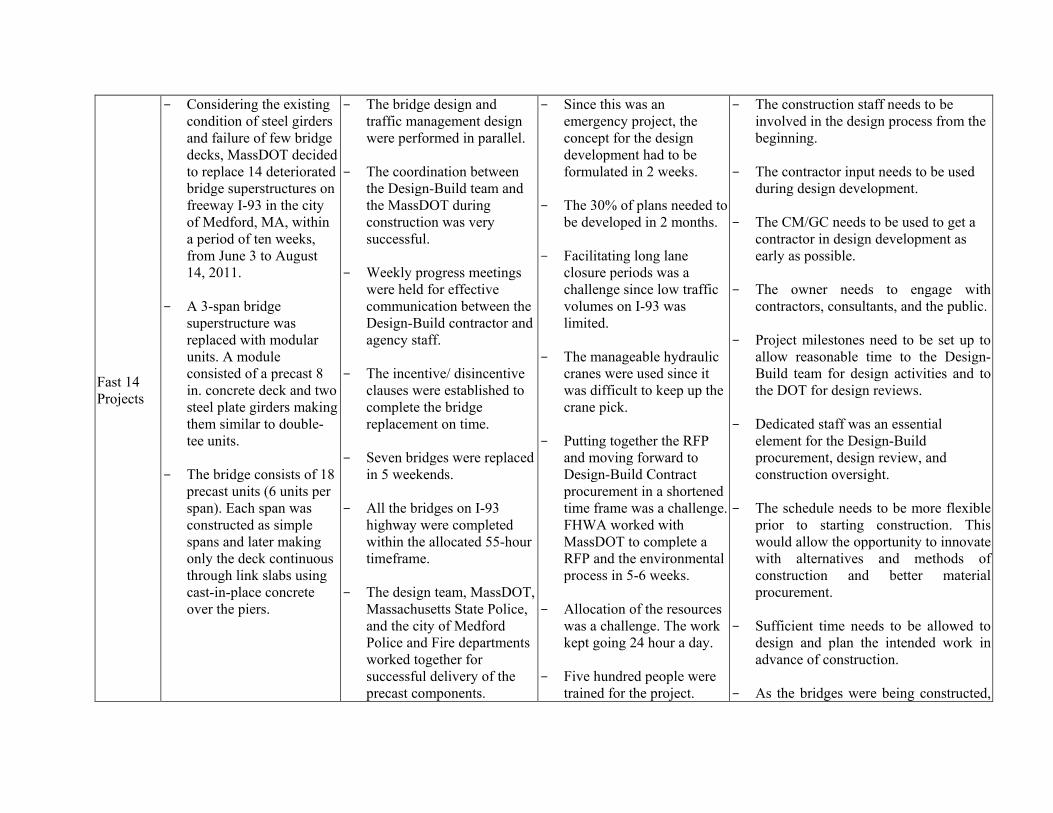
Fast 14 Projects
- Considering the existing condition of steel girders and failure of few bridge decks, MassDOT decided to replace 14 deteriorated bridge superstructures on freeway I-93 in the city of Medford, MA, within a period of ten weeks, from June 3 to August 14, 2011.
- A 3-span bridge superstructure was replaced with modular units. A module consisted of a precast 8 in. concrete deck and two steel plate girders making them similar to double-tee units.
- The bridge consists of 18 precast units (6 units per span). Each span was constructed as simple spans and later making only the deck continuous through link slabs using cast-in-place concrete over the piers.
- The bridge design and traffic management design were performed in parallel.
- The coordination between
the Design-Build team and the MassDOT during construction was very successful.
- Weekly progress meetings
were held for effective communication between the Design-Build contractor and agency staff.
- The incentive/ disincentive
clauses were established to complete the bridge replacement on time.
- Seven bridges were replaced in 5 weekends.
- All the bridges on I-93 highway were completed within the allocated 55-hour timeframe.
- The design team, MassDOT, Massachusetts State Police, and the city of Medford Police and Fire departments worked together for successful delivery of the precast components.
- Since this was an emergency project, the concept for the design development had to be formulated in 2 weeks.
- The 30% of plans needed to be developed in 2 months.
- Facilitating long lane closure periods was a challenge since low traffic volumes on I-93 was limited.
- The manageable hydraulic cranes were used since it was difficult to keep up the crane pick.
- Putting together the RFP and moving forward to Design-Build Contract procurement in a shortened time frame was a challenge. FHWA worked with MassDOT to complete a RFP and the environmental process in 5-6 weeks.
- Allocation of the resources was a challenge. The work kept going 24 hour a day.
- Five hundred people were trained for the project.
- The construction staff needs to be involved in the design process from the beginning.
- The contractor input needs to be used during design development.
- The CM/GC needs to be used to get a contractor in design development as early as possible.
- The owner needs to engage with
contractors, consultants, and the public.
- Project milestones need to be set up to allow reasonable time to the Design-Build team for design activities and to the DOT for design reviews.
- Dedicated staff was an essential element for the Design-Build procurement, design review, and construction oversight.
- The schedule needs to be more flexible prior to starting construction. This would allow the opportunity to innovate with alternatives and methods of construction and better material procurement.
- Sufficient time needs to be allowed to design and plan the intended work in advance of construction.
- As the bridges were being constructed,
- The cross-section and
construction sequence of the units needed to be revised. Since the existing approach spans were used to support the crane for the erection of the center span, the center span was built in one weekend and the approach spans were built following two weekends.
the contractor gained the comfort level each weekend and pushed the limit of faster construction.
- Contractor needs to be aware of the demand on resources required to keep pace with the project.
- The importance of substantial public outreach and coordination with state agencies are essential.
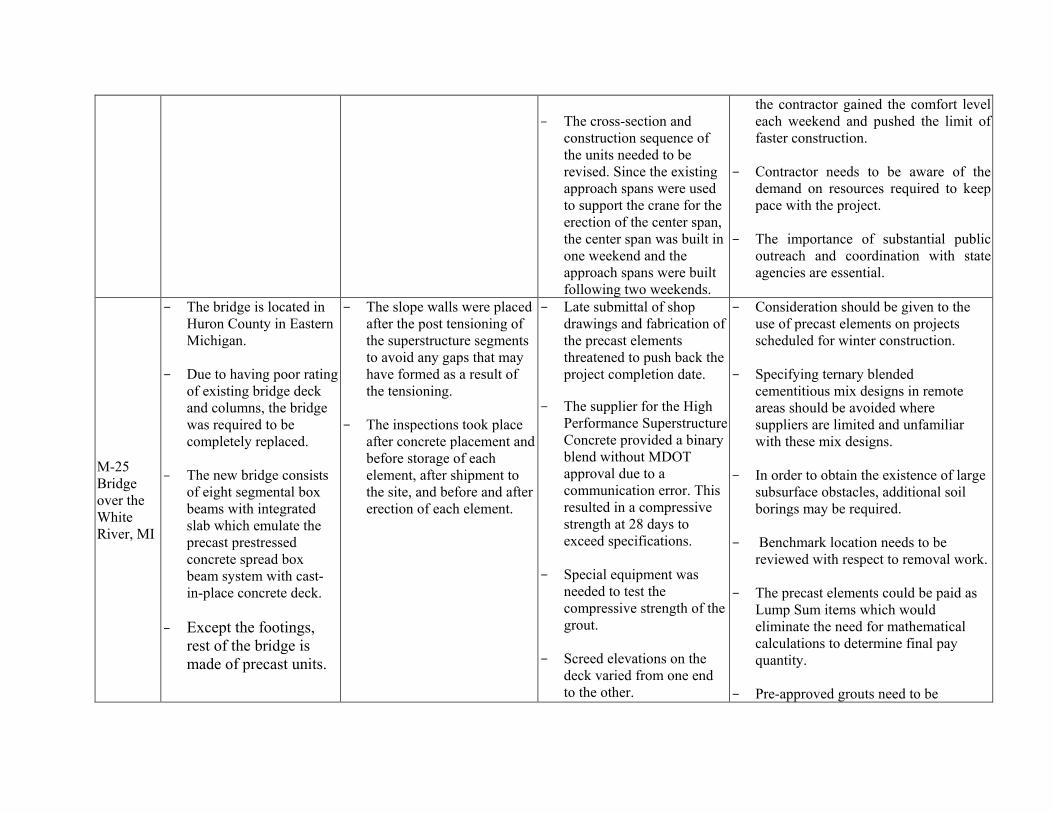
M-25 Bridge over the White River, MI
- The bridge is located in Huron County in Eastern Michigan.
- Due to having poor rating of existing bridge deck and columns, the bridge was required to be completely replaced.
- The new bridge consists of eight segmental box beams with integrated slab which emulate the precast prestressed concrete spread box beam system with cast-in-place concrete deck.
- Except the footings,
rest of the bridge is made of precast units.
- The slope walls were placed after the post tensioning of the superstructure segments to avoid any gaps that may have formed as a result of the tensioning.
- The inspections took place after concrete placement and before storage of each element, after shipment to the site, and before and after erection of each element.
- Late submittal of shop drawings and fabrication of the precast elements threatened to push back the project completion date.
- The supplier for the High Performance Superstructure Concrete provided a binary blend without MDOT approval due to a communication error. This resulted in a compressive strength at 28 days to exceed specifications.
- Special equipment was needed to test the compressive strength of the grout.
- Screed elevations on the deck varied from one end to the other.
- Consideration should be given to the use of precast elements on projects scheduled for winter construction.
- Specifying ternary blended cementitious mix designs in remote areas should be avoided where suppliers are limited and unfamiliar with these mix designs.
- In order to obtain the existence of large subsurface obstacles, additional soil borings may be required.
- Benchmark location needs to be reviewed with respect to removal work.
- The precast elements could be paid as Lump Sum items which would eliminate the need for mathematical calculations to determine final pay quantity.
- Pre-approved grouts need to be
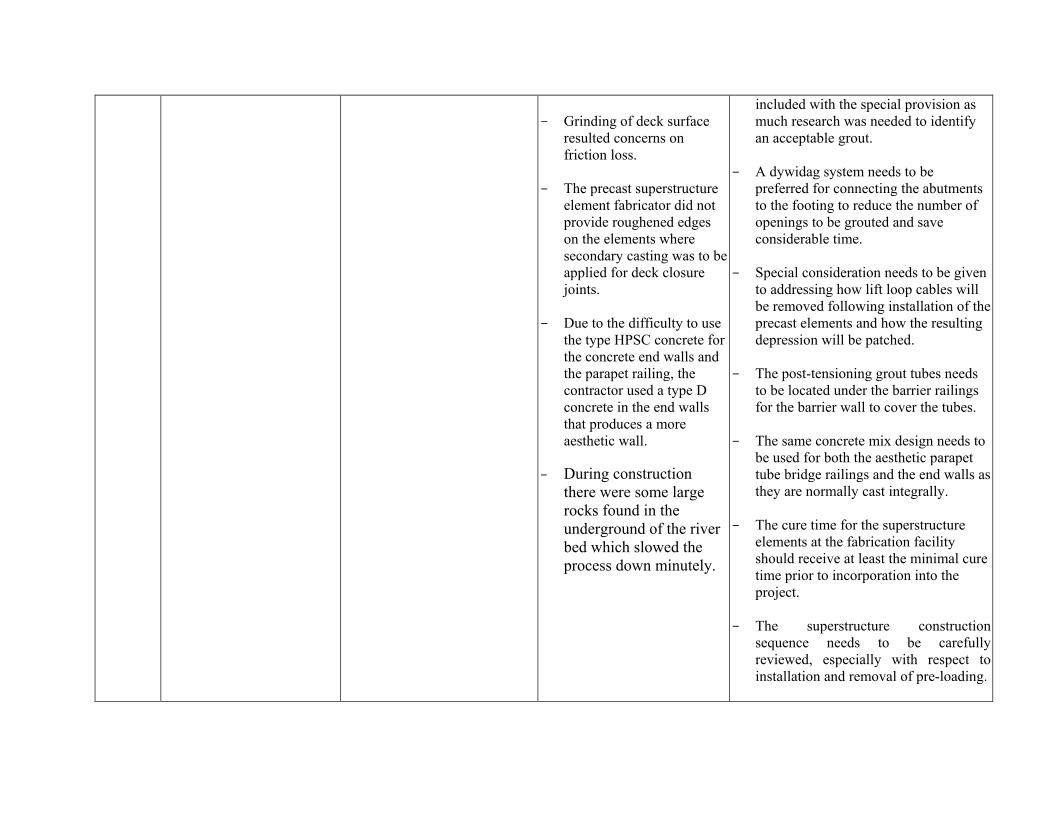
- Grinding of deck surface
resulted concerns on friction loss.
- The precast superstructure element fabricator did not provide roughened edges on the elements where secondary casting was to be applied for deck closure joints.
- Due to the difficulty to use the type HPSC concrete for the concrete end walls and the parapet railing, the contractor used a type D concrete in the end walls that produces a more aesthetic wall.
- During construction
there were some large rocks found in the underground of the river bed which slowed the process down minutely.
included with the special provision as much research was needed to identify an acceptable grout.
- A dywidag system needs to be preferred for connecting the abutments to the footing to reduce the number of openings to be grouted and save considerable time.
- Special consideration needs to be given to addressing how lift loop cables will be removed following installation of the precast elements and how the resulting depression will be patched.
- The post-tensioning grout tubes needs to be located under the barrier railings for the barrier wall to cover the tubes.
- The same concrete mix design needs to be used for both the aesthetic parapet tube bridge railings and the end walls as they are normally cast integrally.
- The cure time for the superstructure elements at the fabrication facility should receive at least the minimal cure time prior to incorporation into the project.
- The superstructure construction
sequence needs to be carefully reviewed, especially with respect to installation and removal of pre-loading.

- Expectations for compressive strength determinations of post-tensioning grout prior to removal of pre-loading needs to be detailed.
- A portion of the joint between the
precast slope wall and the underlying abutment wall was not covered by embankment. It may be aesthetically desirable to address this joint differently.
- Fabricator needs to maintain the alignment of the reinforcement steel during fabrication.
- To reduce cracking in the concrete end walls, a minimum of one expansion slice sleeve needs to be installed in the metal railings of each barrier wall, regardless of length.
- Placing vertical curve crests or low points near concrete to HMA transition joints should be avoided to improve ride quality.
- A thin epoxy polymer bridge deck
overlay needs to be included as part of original contract on projects where pre-cast superstructure elements are used.
APPENDIX E
Mi-ABCD USER MANUAL

MiABCD USERS’ MANUAL Project: Improving Bridges with Prefabricated Precast
Concrete Systems
Project Manager: Mr. David Juntunen, P.E.
Submitted to:
Submitted by:
Dr. Haluk Aktan, P.E. Professor (269) – 276 – 3206 [email protected]
Dr. Upul Attanayake, P.E. Assistant Professor (269) – 276 – 3217 [email protected]
Mr. Abdul Wahed Mohammed, E.I.T. Doctoral Research Assistant (269) – 276 – 3204 [email protected]
Western Michigan University Department of Civil & Construction Engineering
College of Engineering and Applied Sciences Kalamazoo, MI 49008
Fax: (269) – 276 – 3211
ii
DISCLAIMER The content of this report reflects the views of the authors, who are responsible for the facts
and accuracy of the information presented herein. This document is disseminated under the
sponsorship of the Michigan Department of Transportation in the interest of information
exchange. The Michigan Department of Transportation assumes no liability for the content
of this report or its use thereof.
iii
ACKNOWLEDGEMENTS
This project is funded by the Michigan Department of Transportation. The authors would
like to acknowledge the support and effort of Mr. David Juntunen for initiating this research.
The authors also wish to acknowledge the continuing assistance of the Research Advisory
Panel (RAP) members in contributing to the advancement of this study.
iv
TABLE OF CONTENTS
ACKNOWLEDGEMENTS ............................................................................. iii
TABLE OF CONTENTS ................................................................................. iv
LIST OF TABLES ............................................................................................ vi
LIST OF FIGURES ......................................................................................... vii
1 Introduction .................................................................................................... 1
1.1 Purpose of User Manual............................................................................................. 1
1.2 About MiABCD ......................................................................................................... 8
1.2.1 MiABCD Graphical User Interface (GUI) .................................................... 8
1.2.2 Default MiABCD File.................................................................................. 11
2 Installation .................................................................................................... 12
2.1 System Requirements............................................................................................... 12
2.2 Program Installation Package .................................................................................. 12
2.3 Setup/Trouble Shooting Instructions ....................................................................... 12
2.3.1 Enabling Full Access to VBA Algorithms (for Microsoft Excel 2010) ....... 12
2.3.2 Disabling Acrobat…..COM Addin (for Microsoft Excel 2010) .................. 13
2.3.3 Restoring Default MiABCD File ................................................................. 14
3 MiABCD Graphical User Interface (GUI) ................................................ 15
3.1 Start Menu ................................................................................................................ 15
3.2 File Saving Options.................................................................................................. 17
3.2.1 Using the Save As Option after Starting the Program .................................. 17
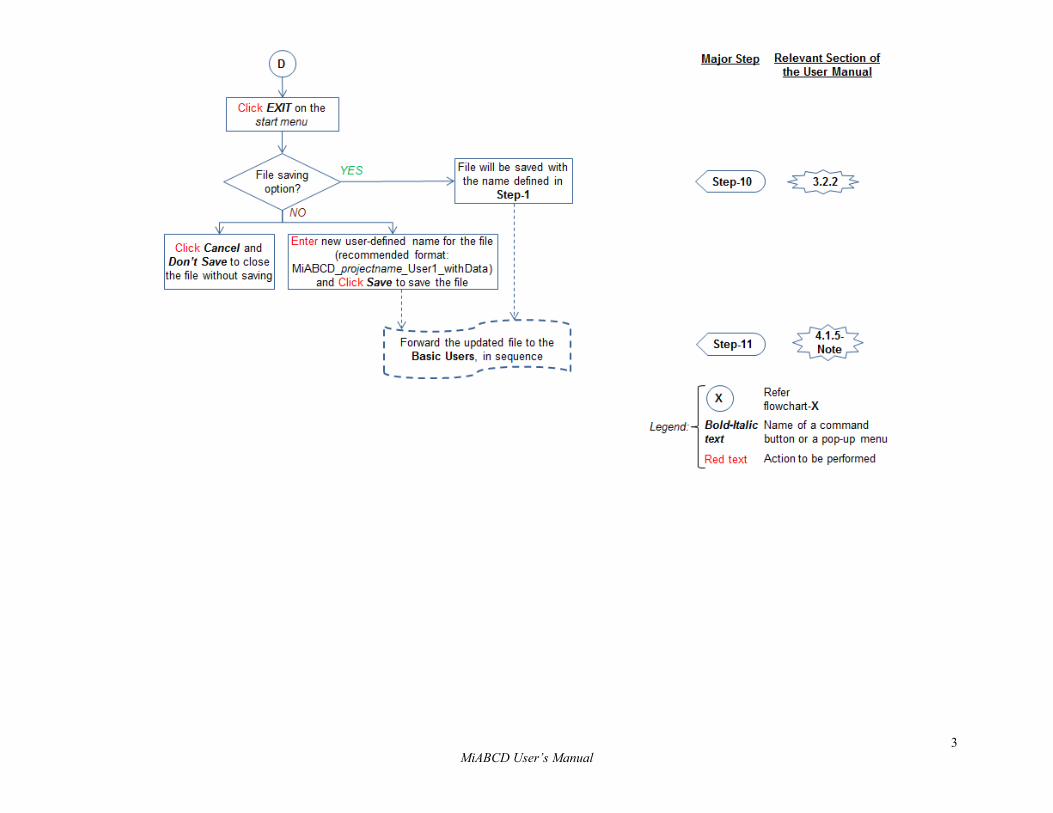
3.2.2 Exiting the Program with Save/Save As Option ........................................... 18
3.2.3 Using Save Option during Intermediary Steps ............................................. 19
3.3 Advanced User Menu .............................................................................................. 19
3.3.1 Project Details Menu.................................................................................... 20
3.4 Basic User Menu ...................................................................................................... 21
4 MiABCD Basic Operations ......................................................................... 23
4.1 Data Entering Process .............................................................................................. 23
4.1.1 Project Details .............................................................................................. 23
v
4.1.2 Site-Specific Data ........................................................................................ 31
4.1.3 Traffic Data .................................................................................................. 32
4.1.4 Life-Cycle Cost Data ................................................................................... 33
4.1.5 Preference Ratings ....................................................................................... 34
4.2 AHP Analysis........................................................................................................... 38
4.3 Analysis Results ....................................................................................................... 40
5 References ..................................................................................................... 45
Appendix – EA .................................................................................................. 46
Appendix – EB .................................................................................................. 49
Appendix – EC .................................................................................................. 58
vi
LIST OF TABLES
Table B1. Site-Specific Data, Traffic Data and Life-Cycle Cost Data for the Stadium Drive
Bridge .................................................................................................................. 50
Table B2. Preference Ratings of Three Users ........................................................................ 51
Table B3. Assigning Ordinal Scale Ratings to Site-Specific Data ........................................ 52
Table B4. Converting Ordinal Scale Rating to Pair-Wise Comparison Rating ..................... 52
Table B5. Sub-Parameters Grouping Based on Their Characteristics ................................... 55
vii
LIST OF FIGURES
Figure 1. Sample popup menus and datasheet ......................................................................... 8
Figure 2. Example pop-up menus and key features ............................................................... 10
Figure 3. An example datasheet and its features .................................................................... 11
Figure 4. Start menu of the decision-making model .............................................................. 15
Figure 5. User Selection Menu of the decision-making model .............................................. 15
Figure 6. Description of the Advanced User option .............................................................. 16
Figure 7. Description of the Basic User option ..................................................................... 16
Figure 8. Using Save As option from the Excel menu ........................................................... 17
Figure 9. Exiting the decision-making model by (a) saving on the current file or (b) saving as
a different file ...................................................................................................... 18
Figure 10. Using Save option from the Excel menu .............................................................. 19
Figure 11. Accessing the Advanced User Menu .................................................................... 20
Figure 12. Accessing the Project Details Menu .................................................................... 21
Figure 13. Accessing the Basic User Menu ........................................................................... 22
Figure 14. Advanced User Manu with five commands buttons used for data input .............. 23
Figure 15. Project Details Menu ............................................................................................ 24
Figure 16. Project Information datasheet .............................................................................. 25
Figure 17. Selecting project type and feature intersected from Project Category field ........ 25
Figure 18. Datasheet of decision-making parameters for highway over highway project .... 27
Figure 19. Add/Remove Sub-Parameters menu ..................................................................... 28
Figure 20. Adding an additional sub-parameter, “Scour,” using the Add/Remove Sub-
Parameter Menu .................................................................................................. 28
Figure 21. Wage and cost data table ...................................................................................... 30
Figure 22. Significance of MOT classification based on LOS definition .............................. 31
Figure 23. Example tables for the model presets ................................................................... 31
Figure 24. Site-specific datasheet for Highway over Highway project ................................. 32
Figure 25. Highway over Highway project traffic data .......................................................... 33
Figure 26. Life-cycle cost data ............................................................................................... 34
Figure 27. Datasheet to assign preference ratings ................................................................. 35
Figure 28. Use of dropdown menu on preference ratings datasheet ...................................... 36
viii
Figure 29. Preference ratings datasheet when accessed using Basic User Menu .................. 37
Figure 30. Preference ratings datasheet with two sub-parameters added by the Advanced
User ...................................................................................................................... 38
Figure 31. Preference ratings datasheet showing the analysis command button ................... 39
Figure 32. Preference Ratings button to access the data analysis command button (a)
Advanced User Menu and (b) Basic User Menu ................................................. 40
Figure 33. Result command button to access analysis results (a) Advance User Menu and (b)
Basic User Manu ................................................................................................. 41
Figure 34. Analysis results presented as charts ..................................................................... 42
Figure 35. Analysis results presented in tabular format ........................................................ 43
1 MiABCD User’s Manual
1 INTRODUCTION
1.1 PURPOSE OF USER MANUAL
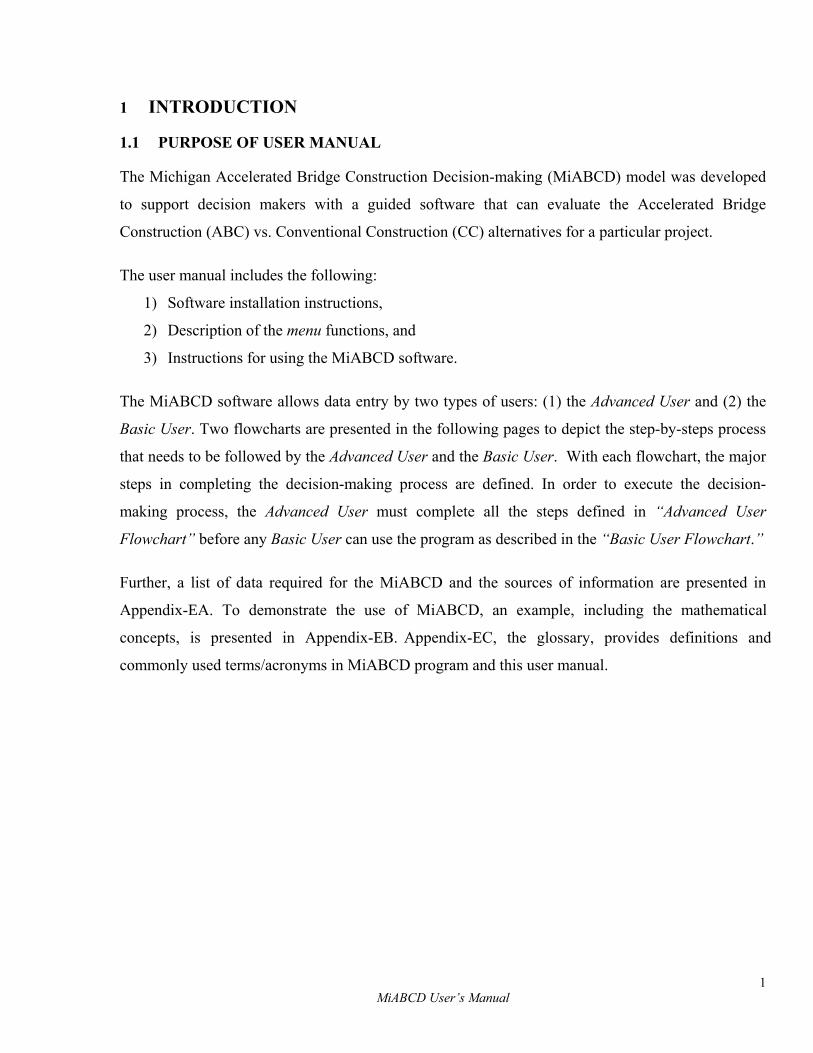
The Michigan Accelerated Bridge Construction Decision-making (MiABCD) model was developed
to support decision makers with a guided software that can evaluate the Accelerated Bridge
Construction (ABC) vs. Conventional Construction (CC) alternatives for a particular project.
The user manual includes the following:
1) Software installation instructions,
2) Description of the menu functions, and
3) Instructions for using the MiABCD software.
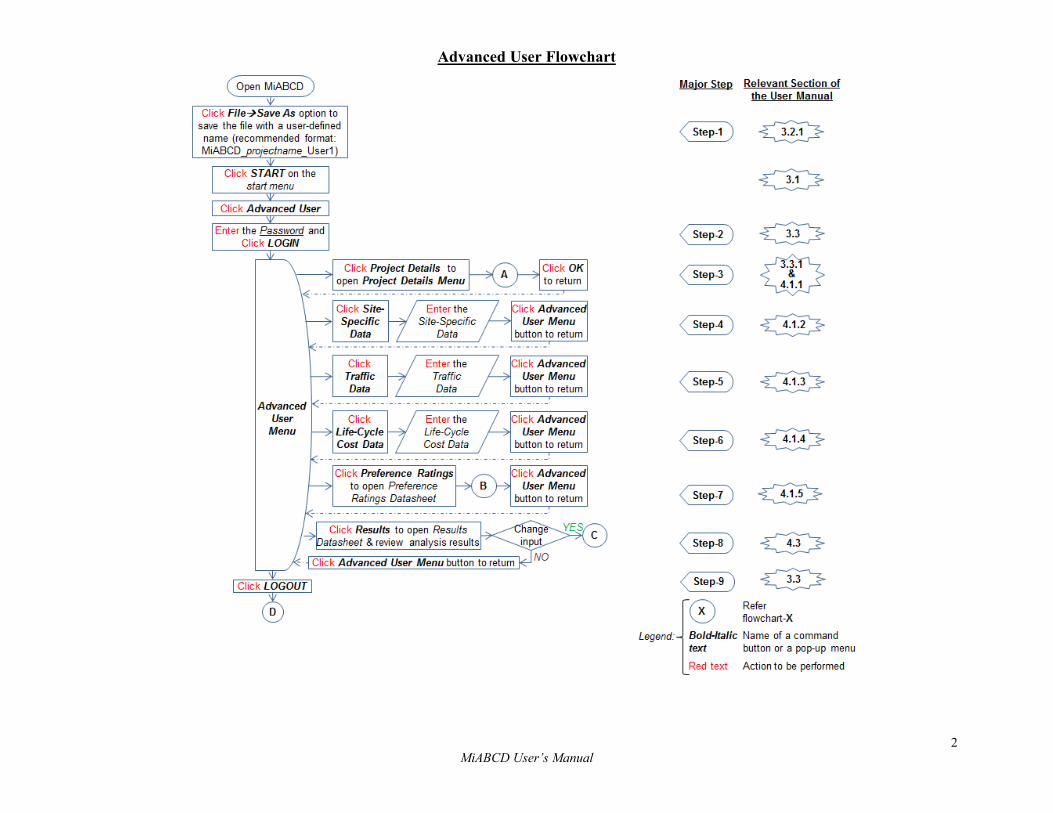
The MiABCD software allows data entry by two types of users: (1) the Advanced User and (2) the
Basic User. Two flowcharts are presented in the following pages to depict the step-by-steps process
that needs to be followed by the Advanced User and the Basic User. With each flowchart, the major
steps in completing the decision-making process are defined. In order to execute the decision-
making process, the Advanced User must complete all the steps defined in “Advanced User
Flowchart” before any Basic User can use the program as described in the “Basic User Flowchart.”
Further, a list of data required for the MiABCD and the sources of information are presented in
Appendix-EA. To demonstrate the use of MiABCD, an example, including the mathematical
concepts, is presented in Appendix-EB. Appendix-EC, the glossary, provides definitions and
commonly used terms/acronyms in MiABCD program and this user manual.
2 MiABCD User’s Manual
Advanced User Flowchart
3 MiABCD User’s Manual
4 MiABCD User’s Manual
5 MiABCD User’s Manual
6 MiABCD User’s Manual
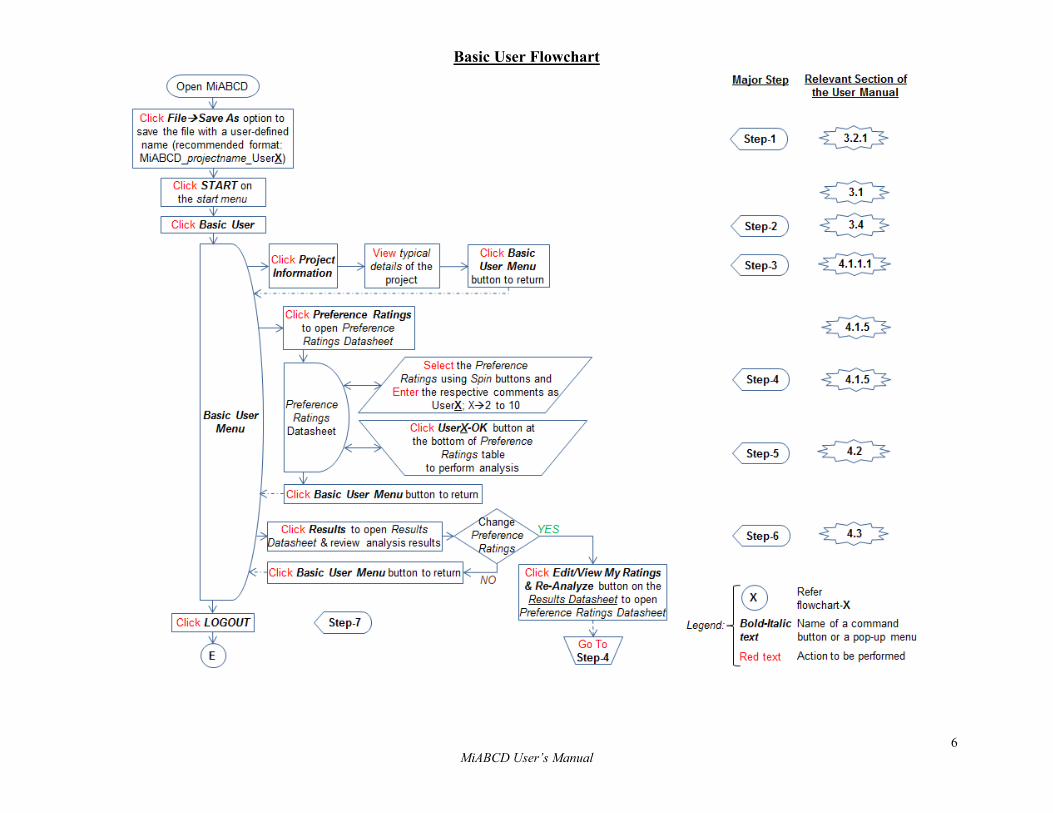
Basic User Flowchart
7 MiABCD User’s Manual
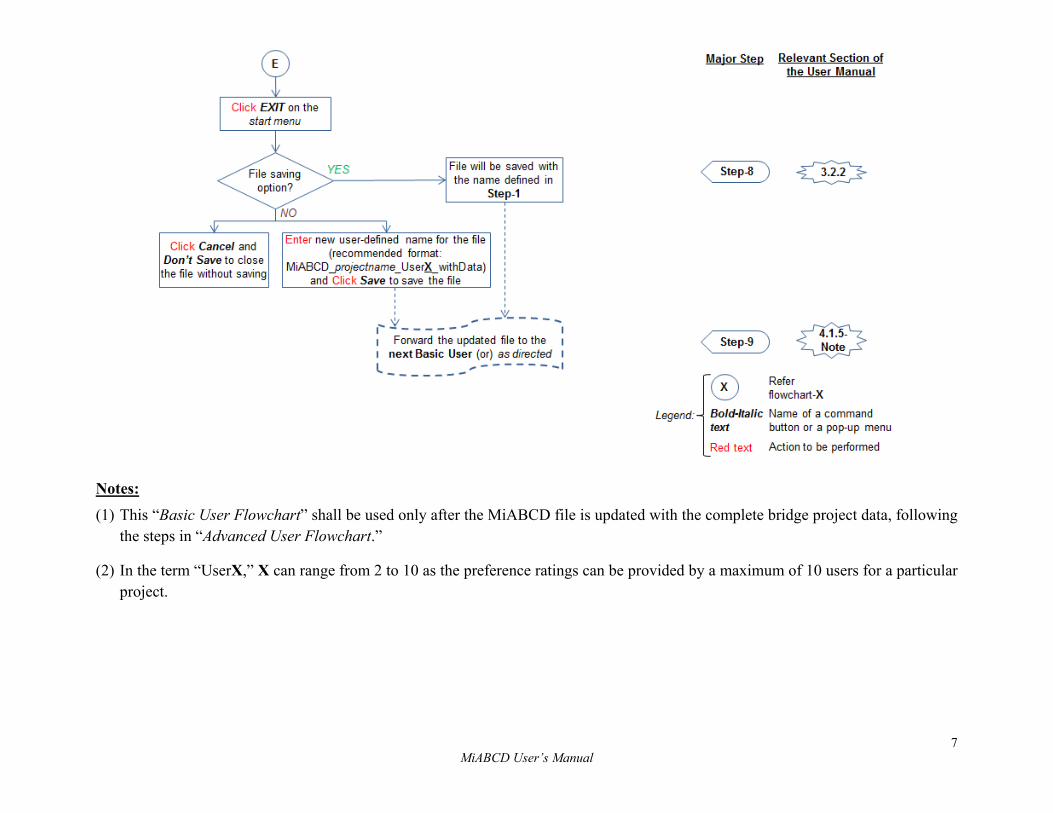
Notes: (1) This “Basic User Flowchart” shall be used only after the MiABCD file is updated with the complete bridge project data, following
the steps in “Advanced User Flowchart.”
(2) In the term “UserX,” X can range from 2 to 10 as the preference ratings can be provided by a maximum of 10 users for a particular project.
8 MiABCD User’s Manual
1.2 ABOUT MiABCD
The decision-making model is developed by the Civil and Construction Engineering Department at
Western Michigan University, Kalamazoo, MI, under the Michigan Department of Transportation
(MDOT) funded project “Improving Bridges with Prefabricated Precast Concrete Systems.”
The model is developed envisioning the need to incorporate project-specific data and available user-
cost and life-cycle cost models to facilitate the decision makers with quantitative data to make
informed decisions on bridge construction alternatives. The software is developed using available
programming platforms of Microsoft Excel and Visual Basic.
Only the Superstructure Replacement decisions can be evaluated using the current version of the
software.
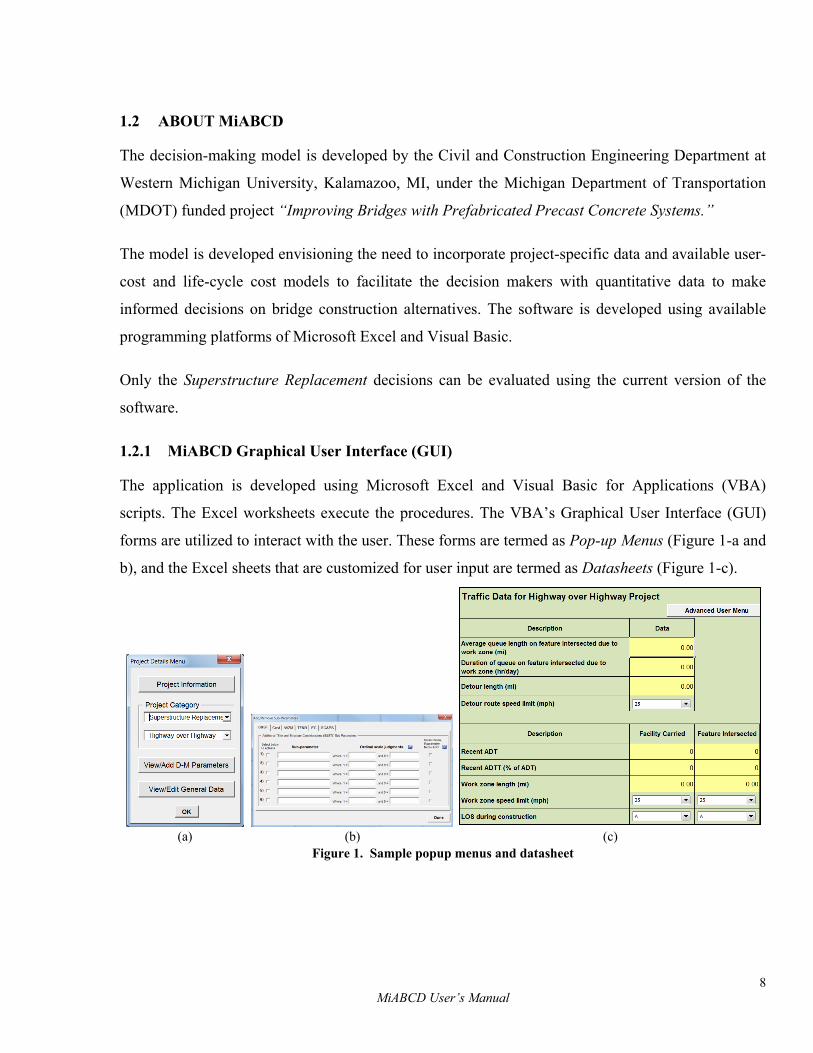
1.2.1 MiABCD Graphical User Interface (GUI)
The application is developed using Microsoft Excel and Visual Basic for Applications (VBA)
scripts. The Excel worksheets execute the procedures. The VBA’s Graphical User Interface (GUI)
forms are utilized to interact with the user. These forms are termed as Pop-up Menus (Figure 1-a and
b), and the Excel sheets that are customized for user input are termed as Datasheets (Figure 1-c).
(a)
(b)
(c)
Figure 1. Sample popup menus and datasheet
9 MiABCD User’s Manual
1.2.1.1 Pop-up Menus
The main features of the pop-up menu are to provide (1) Command buttons, (2) Dropdown menus,
(3) Tabs, (4) Text fields, (5) Check boxes, and (6) an Additional information button ( ). The most
commonly used features are the command buttons and dropdown menus. A few examples of pop-up
menus, along with their features, are shown in Figure 2. A description of each key feature is given
below:
1) Command buttons: A command button is used to execute an embedded VBA script to run an
algorithm or direct the user to a pop-up menu or a specific datasheet.
2) Dropdown menus: A dropdown menu is used to select a desired option from a predefined list
of options.
3) Tabs: Tabs are used to switch between options that are predefined on a pop-up menu.
4) Text fields: Text fields allow incorporating user-defined sub-parameters in the decision-
making process. Once defined, the text will be visible in the corresponding datasheet.
5) Check boxes: A check box allows either activating or deactivating a subroutine.
6) Additional information button ( ): This button allows a user to receive additional
information to navigate through the pop-up menu or to complete the datasheet.
Note: In subsequent sections of the user manual, Bold-Italic text is used to represent the names of
the pop-up menus and command buttons.
10 MiABCD User’s Manual
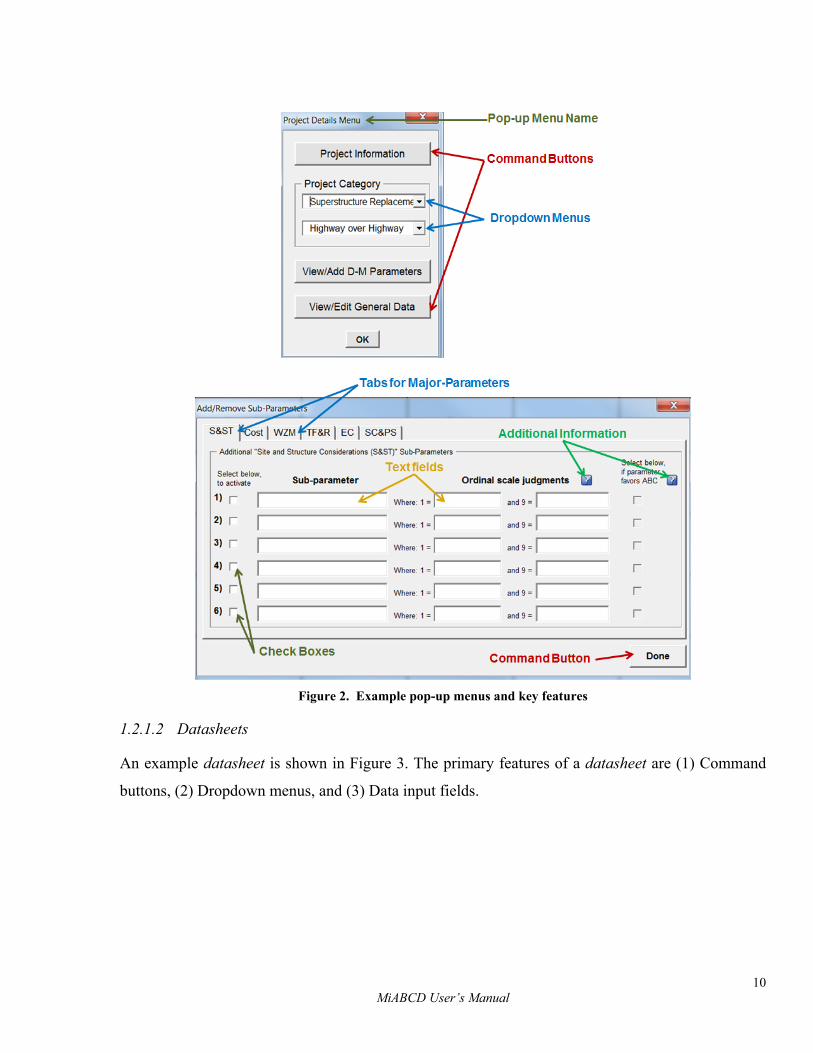
Figure 2. Example pop-up menus and key features
1.2.1.2 Datasheets
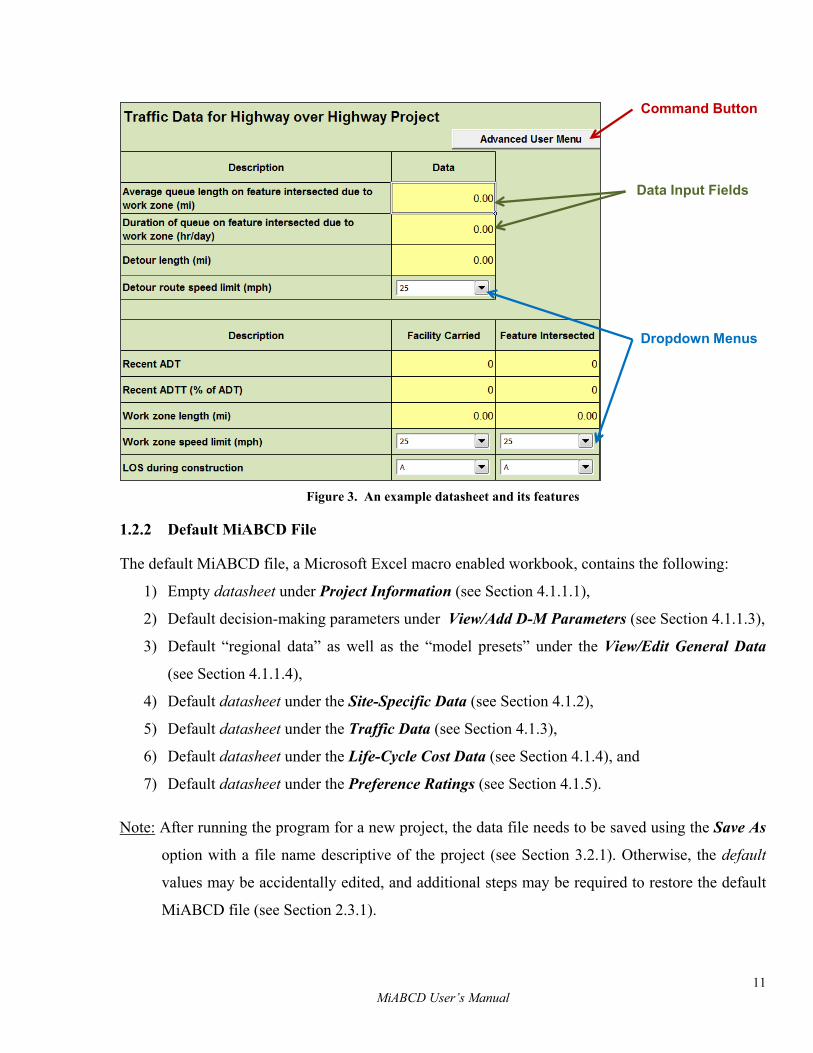
An example datasheet is shown in Figure 3. The primary features of a datasheet are (1) Command
buttons, (2) Dropdown menus, and (3) Data input fields.
11 MiABCD User’s Manual
Figure 3. An example datasheet and its features
1.2.2 Default MiABCD File
The default MiABCD file, a Microsoft Excel macro enabled workbook, contains the following:
1) Empty datasheet under Project Information (see Section 4.1.1.1),
2) Default decision-making parameters under View/Add D-M Parameters (see Section 4.1.1.3),
3) Default “regional data” as well as the “model presets” under the View/Edit General Data
(see Section 4.1.1.4),
4) Default datasheet under the Site-Specific Data (see Section 4.1.2),
5) Default datasheet under the Traffic Data (see Section 4.1.3),
6) Default datasheet under the Life-Cycle Cost Data (see Section 4.1.4), and
7) Default datasheet under the Preference Ratings (see Section 4.1.5).
Note: After running the program for a new project, the data file needs to be saved using the Save As
option with a file name descriptive of the project (see Section 3.2.1). Otherwise, the default
values may be accidentally edited, and additional steps may be required to restore the default
MiABCD file (see Section 2.3.1).
Data Input Fields
Dropdown Menus
Command Button

12 MiABCD User’s Manual
2 INSTALLATION
2.1 SYSTEM REQUIREMENTS
The MiABCD software program is designed to run on the Microsoft Excel platform with up-to-date
service packs. The minimum system requirements for installation are as follows:
• Microsoft Excel 2007 (or later) • Windows XP (or later) • 500 MHz Processor • 512 MB Memory (RAM) • Hard disk 2 GB • Display 1024 × 768
2.2 PROGRAM INSTALLATION PACKAGE
The program installation package, Setup MiABCD, will extract the following files to a specified
folder:
1) MiABCD_v2.0.xlsm,
2) MiABCD_v2.0_backup.xlsm,
3) MiABCD_User Manual.xlsm, and
4) MiABCD_ReadMe.xlsm.
2.3 SETUP/TROUBLE SHOOTING INSTRUCTIONS
2.3.1 Enabling Full Access to VBA Algorithms (for Microsoft Excel 2010)
When the MiABCD software program is executed for the first time, the following steps need to be
performed to prevent VBA runtime errors
1) From Excel menu, go to File Excel Options.
2) In the Excel Options window, go to Trust Center tab on left. Click on Trust Center Settings… button on right.
3) In the Trust Center window, go to ActiveX Settings tab on left. Select the option Enable all controls without restrictions and without prompting.
4) In the Trust Center window go to Macro Settings tab on left. Select the option Enable all macros. Check the box for Trust access to the VBA project object model.
5) In the Trust Center window, go to Protected View tab on left.
13 MiABCD User’s Manual
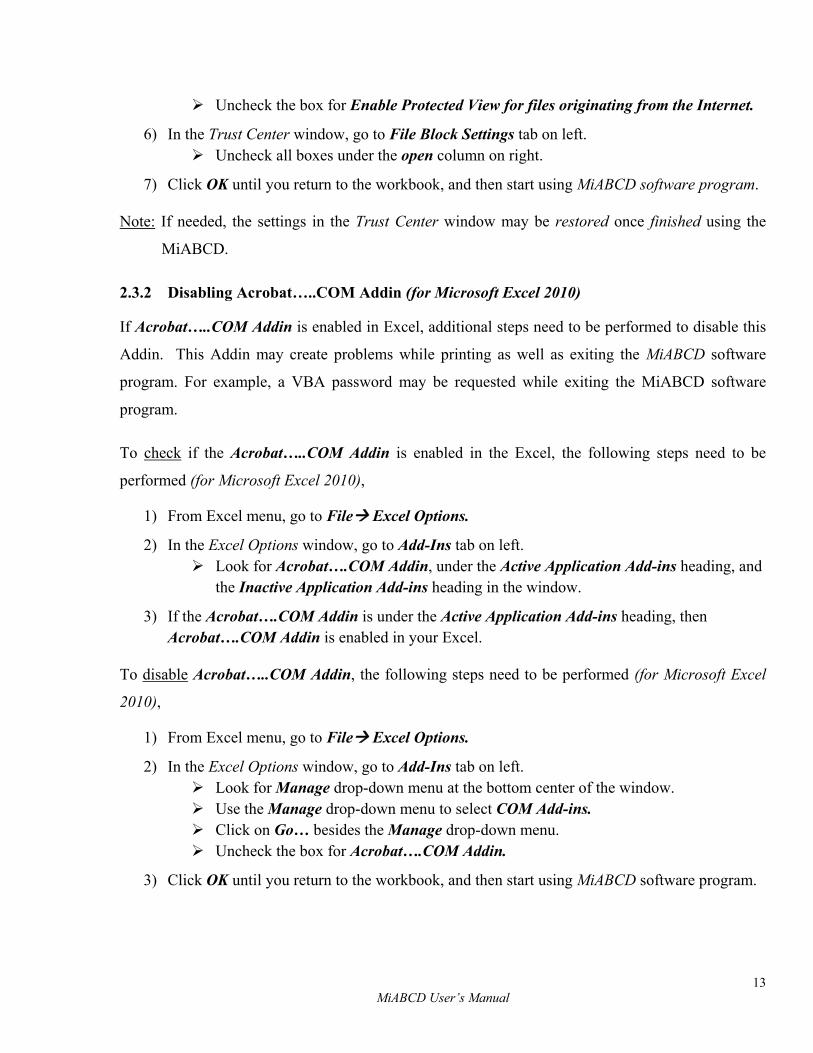
Uncheck the box for Enable Protected View for files originating from the Internet.
6) In the Trust Center window, go to File Block Settings tab on left. Uncheck all boxes under the open column on right.
7) Click OK until you return to the workbook, and then start using MiABCD software program.
Note: If needed, the settings in the Trust Center window may be restored once finished using the
MiABCD.
2.3.2 Disabling Acrobat…..COM Addin (for Microsoft Excel 2010)
If Acrobat…..COM Addin is enabled in Excel, additional steps need to be performed to disable this
Addin. This Addin may create problems while printing as well as exiting the MiABCD software
program. For example, a VBA password may be requested while exiting the MiABCD software
program.
To check if the Acrobat…..COM Addin is enabled in the Excel, the following steps need to be
performed (for Microsoft Excel 2010),
1) From Excel menu, go to File Excel Options.
2) In the Excel Options window, go to Add-Ins tab on left. Look for Acrobat….COM Addin, under the Active Application Add-ins heading, and
the Inactive Application Add-ins heading in the window.
3) If the Acrobat….COM Addin is under the Active Application Add-ins heading, then Acrobat….COM Addin is enabled in your Excel.
To disable Acrobat…..COM Addin, the following steps need to be performed (for Microsoft Excel
2010),
1) From Excel menu, go to File Excel Options.
2) In the Excel Options window, go to Add-Ins tab on left. Look for Manage drop-down menu at the bottom center of the window. Use the Manage drop-down menu to select COM Add-ins. Click on Go… besides the Manage drop-down menu. Uncheck the box for Acrobat….COM Addin.
3) Click OK until you return to the workbook, and then start using MiABCD software program.

14 MiABCD User’s Manual
2.3.3 Restoring Default MiABCD File
The default MiABCD file may be restored using the backup file, MiABCD_v2.0_backup, from the
directory where the MiABCD files were extracted. To restore the file, the following steps need to be
performed:
1) Delete the file MiABCD_v2.0 from the respective directory.
2) Create a copy of the file MiABCD_v2.0_backup in the respective directory.
3) Rename the newly created file to MiABCD_v2.0; this shall be used to run the MiABCD software program.
15 MiABCD User’s Manual
3 MiABCD GRAPHICAL USER INTERFACE (GUI)
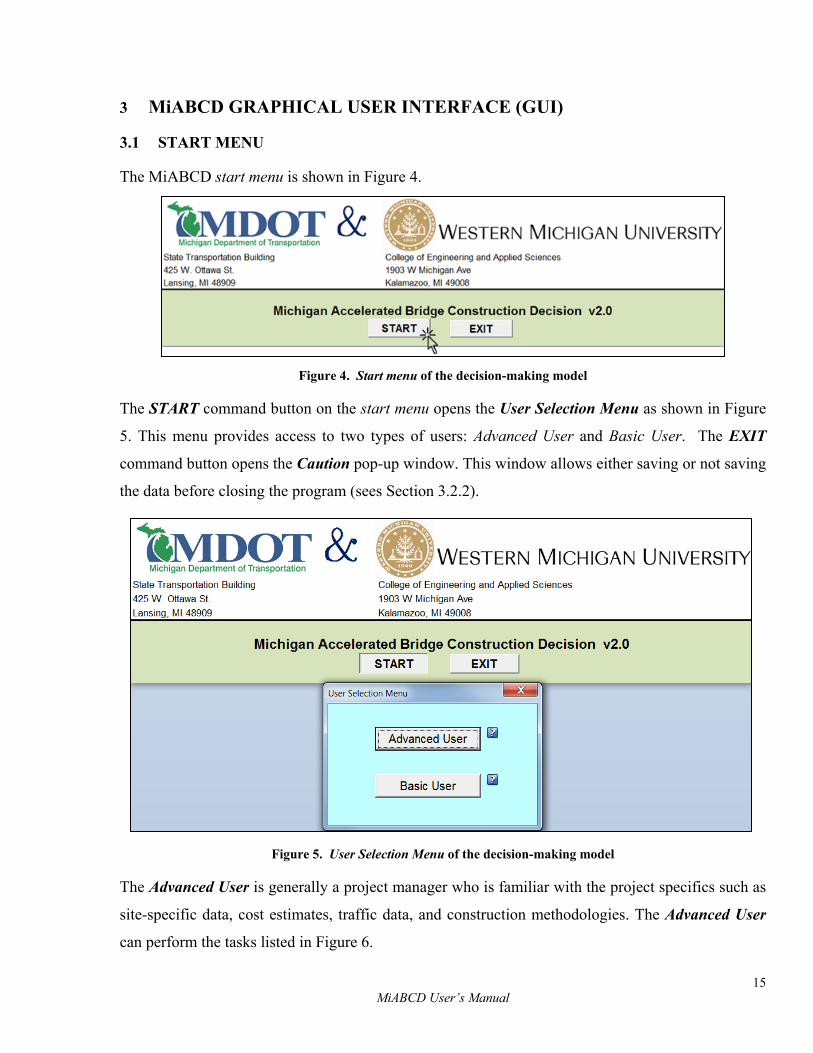
3.1 START MENU
The MiABCD start menu is shown in Figure 4.
Figure 4. Start menu of the decision-making model
The START command button on the start menu opens the User Selection Menu as shown in Figure
5. This menu provides access to two types of users: Advanced User and Basic User. The EXIT
command button opens the Caution pop-up window. This window allows either saving or not saving
the data before closing the program (sees Section 3.2.2).
Figure 5. User Selection Menu of the decision-making model
The Advanced User is generally a project manager who is familiar with the project specifics such as
site-specific data, cost estimates, traffic data, and construction methodologies. The Advanced User
can perform the tasks listed in Figure 6.
16 MiABCD User’s Manual
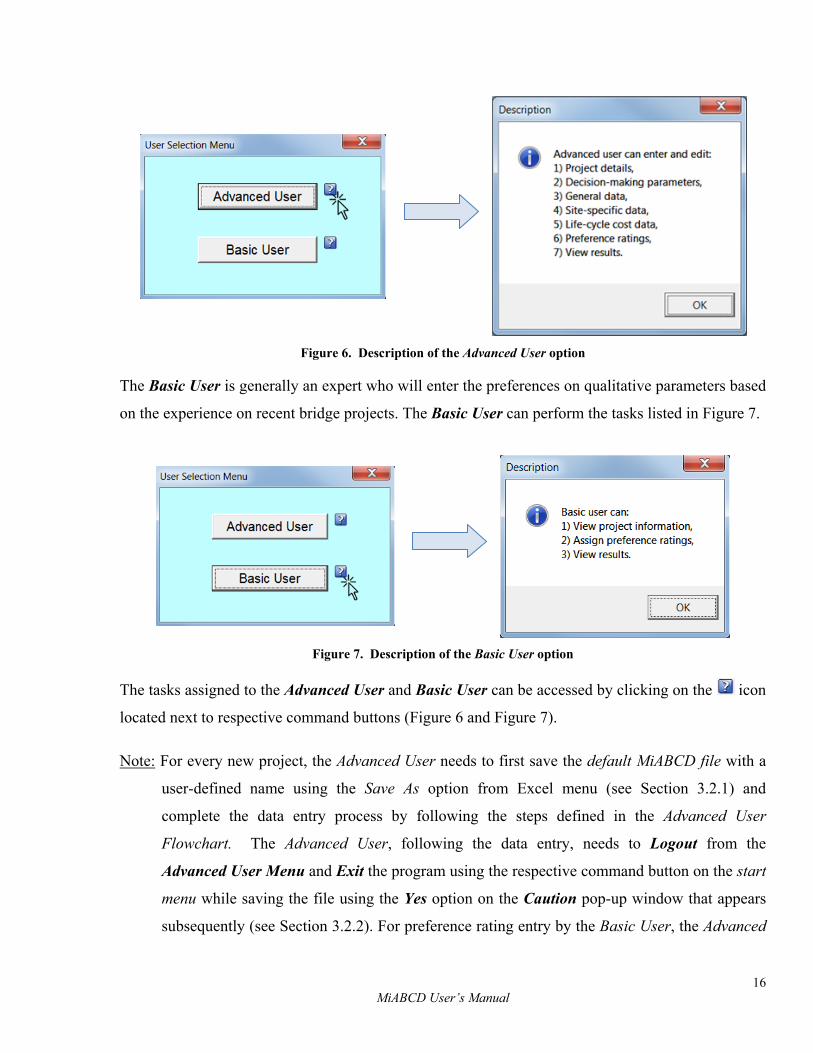
Figure 6. Description of the Advanced User option
The Basic User is generally an expert who will enter the preferences on qualitative parameters based
on the experience on recent bridge projects. The Basic User can perform the tasks listed in Figure 7.
Figure 7. Description of the Basic User option
The tasks assigned to the Advanced User and Basic User can be accessed by clicking on the icon
located next to respective command buttons (Figure 6 and Figure 7).
Note: For every new project, the Advanced User needs to first save the default MiABCD file with a
user-defined name using the Save As option from Excel menu (see Section 3.2.1) and
complete the data entry process by following the steps defined in the Advanced User
Flowchart. The Advanced User, following the data entry, needs to Logout from the
Advanced User Menu and Exit the program using the respective command button on the start
menu while saving the file using the Yes option on the Caution pop-up window that appears
subsequently (see Section 3.2.2). For preference rating entry by the Basic User, the Advanced
17 MiABCD User’s Manual
User needs to forward the file in a sequential order (i.e., sending the file to expert-1; then after
his/her input, sending the file to expert-2, and so on), for obtaining their qualitative
judgments. These experts, who are specialized in various aspects of a bridge construction
project, are described as Basic Users since their task is limited to entering preference ratings
of qualitative parameters (see Section 4.1.5).
3.2 FILE SAVING OPTIONS
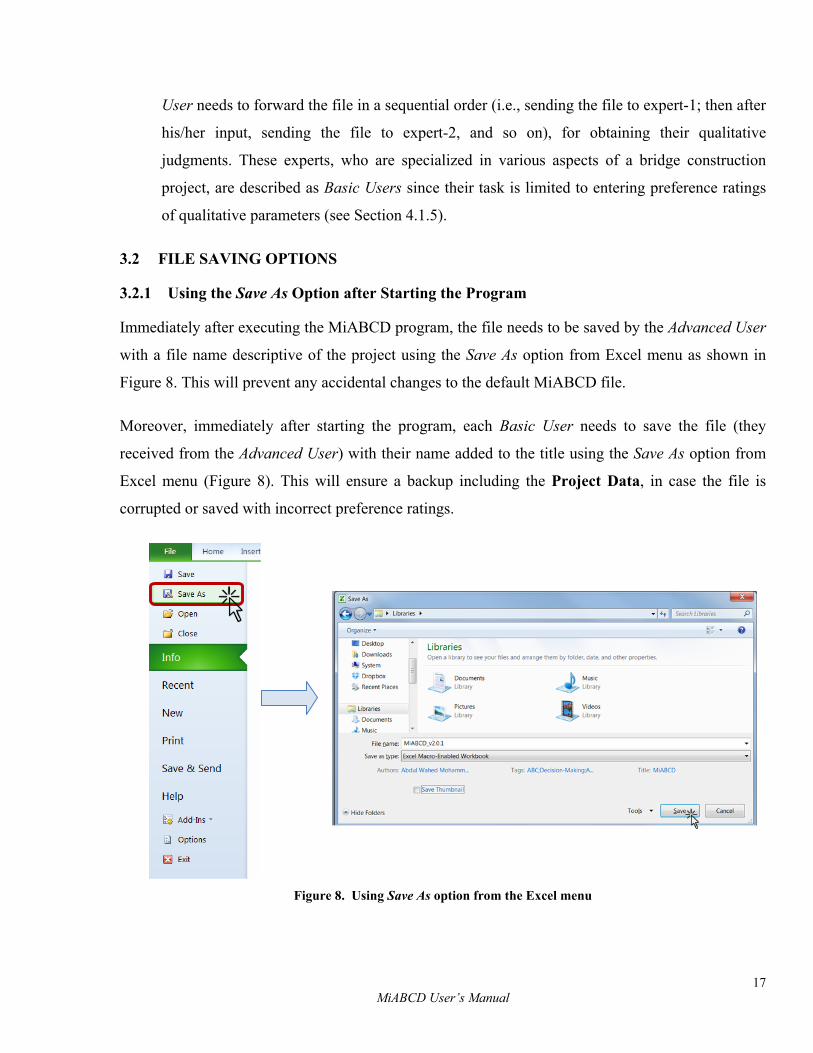
3.2.1 Using the Save As Option after Starting the Program
Immediately after executing the MiABCD program, the file needs to be saved by the Advanced User
with a file name descriptive of the project using the Save As option from Excel menu as shown in
Figure 8. This will prevent any accidental changes to the default MiABCD file.
Moreover, immediately after starting the program, each Basic User needs to save the file (they
received from the Advanced User) with their name added to the title using the Save As option from
Excel menu (Figure 8). This will ensure a backup including the Project Data, in case the file is
corrupted or saved with incorrect preference ratings.
Figure 8. Using Save As option from the Excel menu

18 MiABCD User’s Manual
3.2.2 Exiting the Program with Save/Save As Option
The EXIT command button on the start menu of the decision-making model will open the Caution
pop-up window as shown in Figure 9a. The pop-up window options are Yes and No. If the file was
saved earlier using a user-defined name (see Section 3.2.1), select Yes (Figure 9a). This will save the
current data (or any modifications) and exit MiABCD. However, if the file was not saved after
starting the program (see Section 3.2.1), select No. This will open up another pop-up window to use
the Save As option to save the current data to a “new file” with a user-defined name (Figure 9b).
(a)
(b)
Figure 9. Exiting the decision-making model by (a) saving on the current file or (b) saving as a different file
19 MiABCD User’s Manual
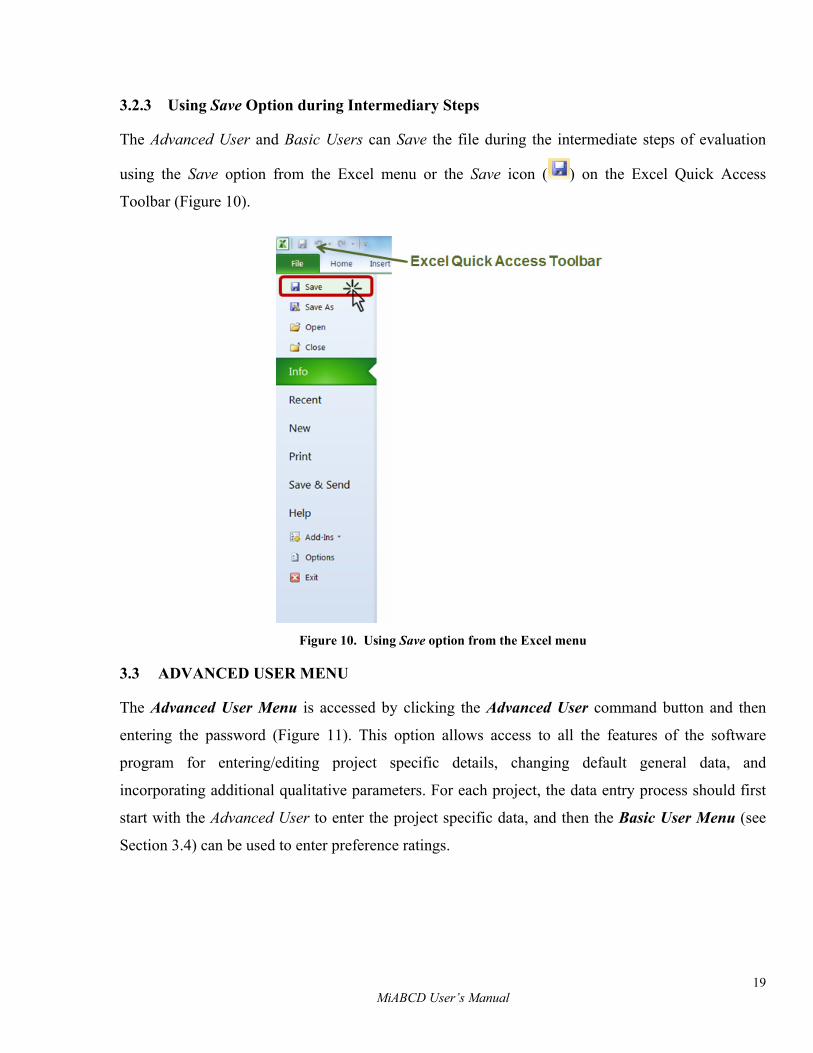
3.2.3 Using Save Option during Intermediary Steps
The Advanced User and Basic Users can Save the file during the intermediate steps of evaluation
using the Save option from the Excel menu or the Save icon ( ) on the Excel Quick Access
Toolbar (Figure 10).
Figure 10. Using Save option from the Excel menu
3.3 ADVANCED USER MENU
The Advanced User Menu is accessed by clicking the Advanced User command button and then
entering the password (Figure 11). This option allows access to all the features of the software
program for entering/editing project specific details, changing default general data, and
incorporating additional qualitative parameters. For each project, the data entry process should first
start with the Advanced User to enter the project specific data, and then the Basic User Menu (see
Section 3.4) can be used to enter preference ratings.
20 MiABCD User’s Manual
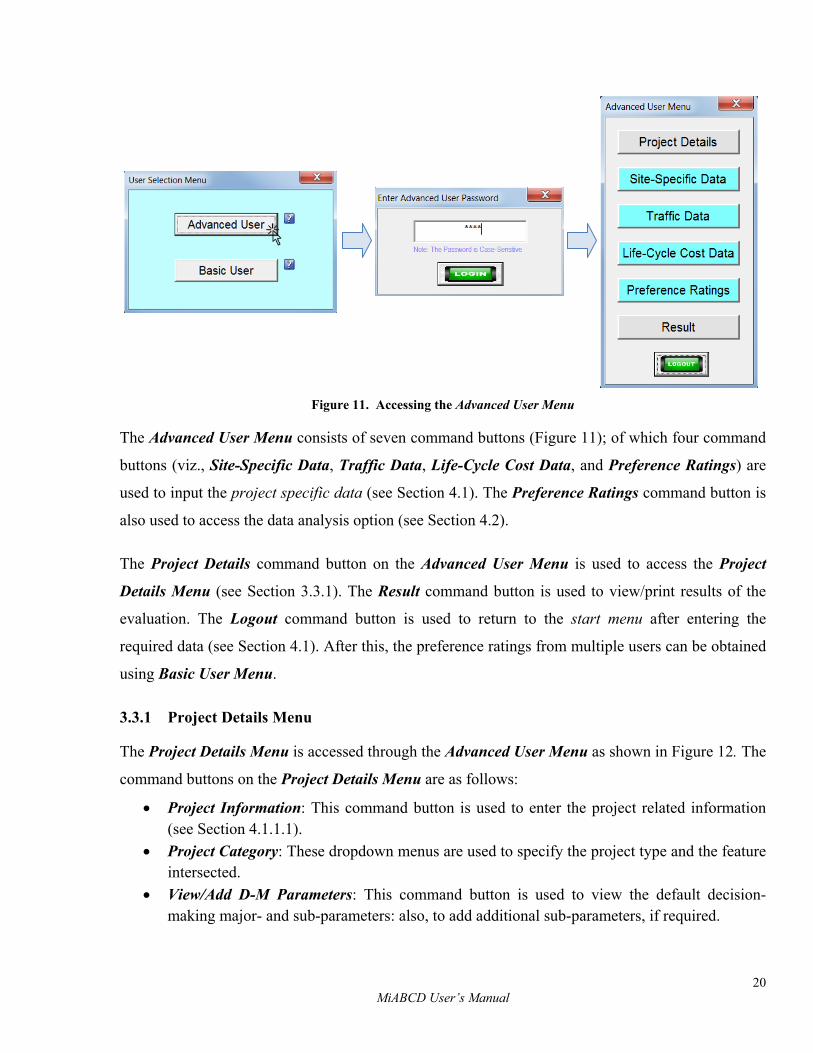
Figure 11. Accessing the Advanced User Menu
The Advanced User Menu consists of seven command buttons (Figure 11); of which four command
buttons (viz., Site-Specific Data, Traffic Data, Life-Cycle Cost Data, and Preference Ratings) are
used to input the project specific data (see Section 4.1). The Preference Ratings command button is
also used to access the data analysis option (see Section 4.2).
The Project Details command button on the Advanced User Menu is used to access the Project
Details Menu (see Section 3.3.1). The Result command button is used to view/print results of the
evaluation. The Logout command button is used to return to the start menu after entering the
required data (see Section 4.1). After this, the preference ratings from multiple users can be obtained
using Basic User Menu.
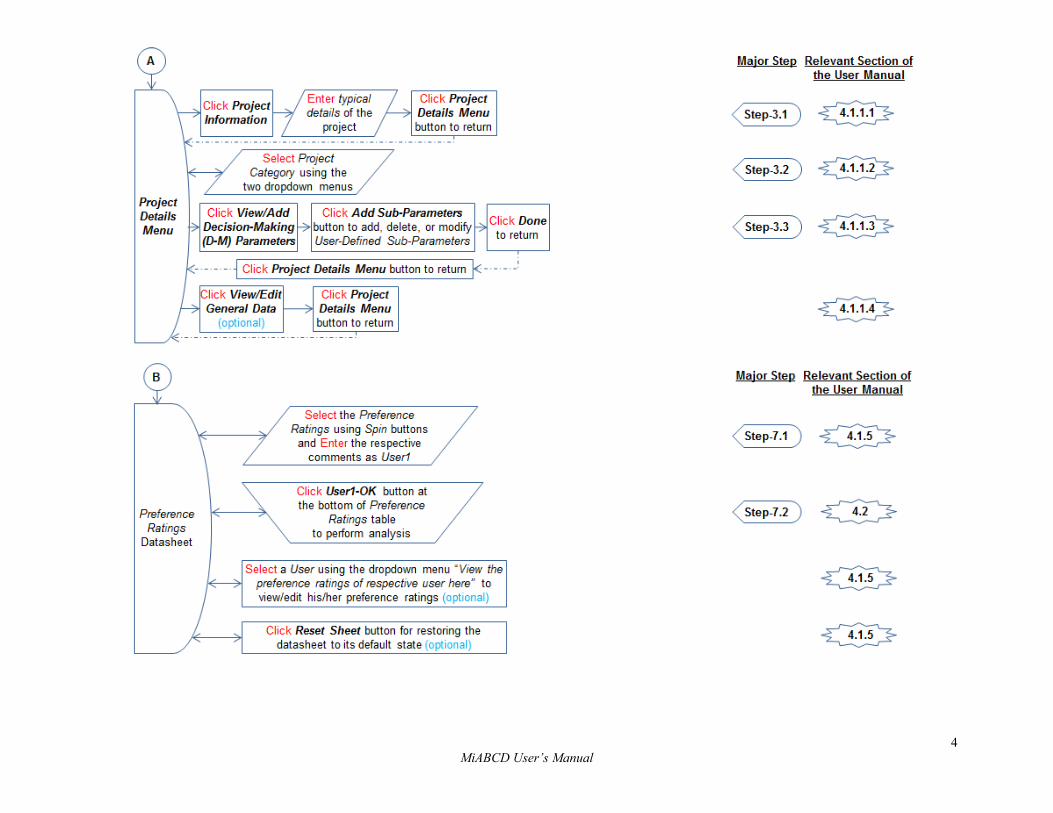
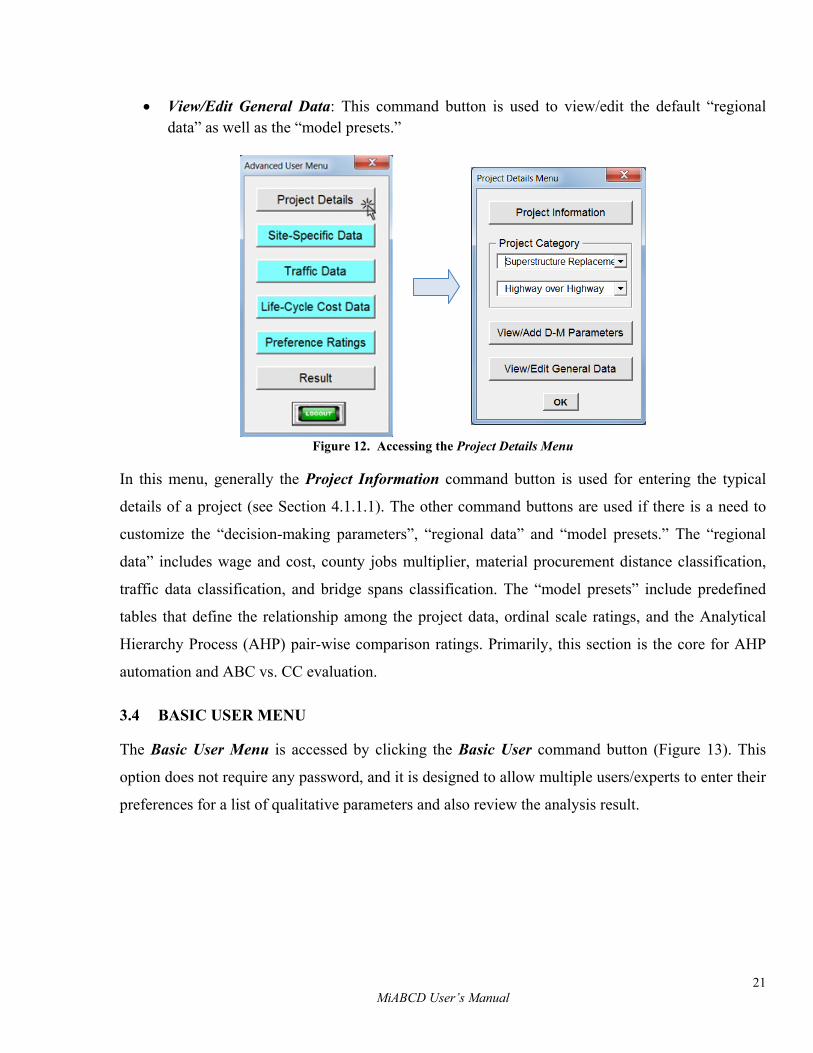
3.3.1 Project Details Menu
The Project Details Menu is accessed through the Advanced User Menu as shown in Figure 12. The
command buttons on the Project Details Menu are as follows:
• Project Information: This command button is used to enter the project related information (see Section 4.1.1.1).
• Project Category: These dropdown menus are used to specify the project type and the feature intersected.
• View/Add D-M Parameters: This command button is used to view the default decision-making major- and sub-parameters: also, to add additional sub-parameters, if required.
21 MiABCD User’s Manual
• View/Edit General Data: This command button is used to view/edit the default “regional data” as well as the “model presets.”
Figure 12. Accessing the Project Details Menu
In this menu, generally the Project Information command button is used for entering the typical
details of a project (see Section 4.1.1.1). The other command buttons are used if there is a need to
customize the “decision-making parameters”, “regional data” and “model presets.” The “regional
data” includes wage and cost, county jobs multiplier, material procurement distance classification,
traffic data classification, and bridge spans classification. The “model presets” include predefined
tables that define the relationship among the project data, ordinal scale ratings, and the Analytical
Hierarchy Process (AHP) pair-wise comparison ratings. Primarily, this section is the core for AHP
automation and ABC vs. CC evaluation.
3.4 BASIC USER MENU
The Basic User Menu is accessed by clicking the Basic User command button (Figure 13). This
option does not require any password, and it is designed to allow multiple users/experts to enter their
preferences for a list of qualitative parameters and also review the analysis result.
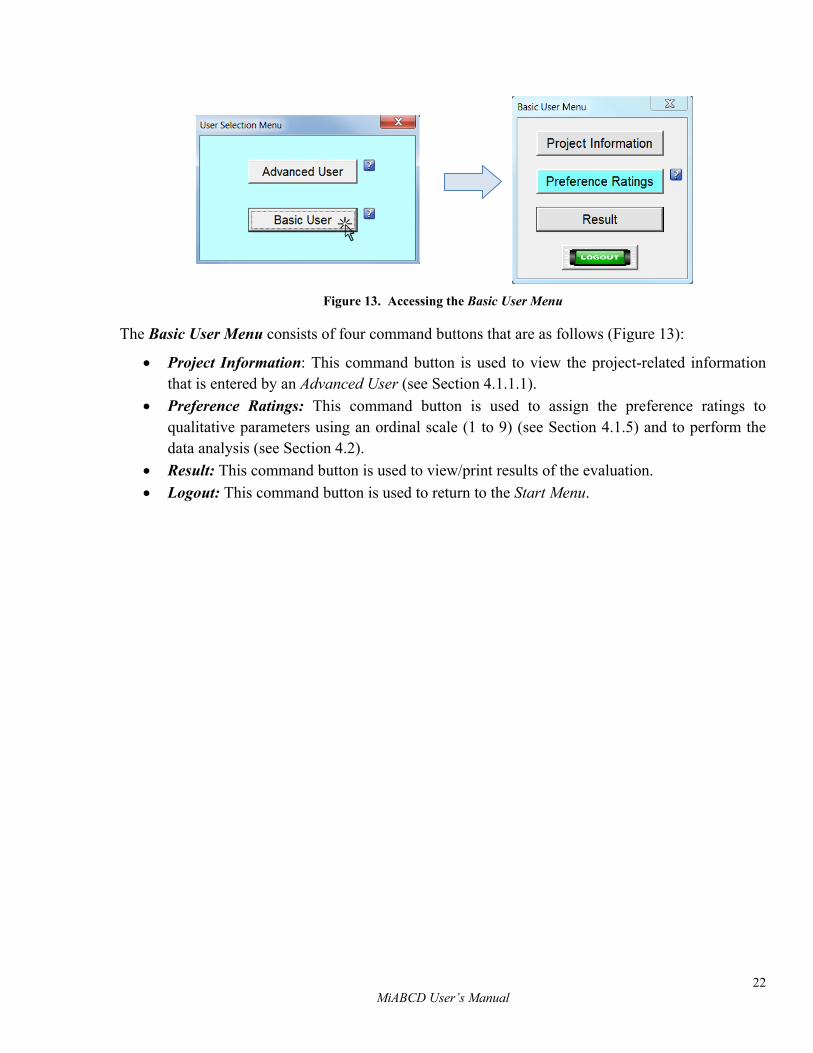
22 MiABCD User’s Manual
Figure 13. Accessing the Basic User Menu
The Basic User Menu consists of four command buttons that are as follows (Figure 13):
• Project Information: This command button is used to view the project-related information that is entered by an Advanced User (see Section 4.1.1.1).
• Preference Ratings: This command button is used to assign the preference ratings to qualitative parameters using an ordinal scale (1 to 9) (see Section 4.1.5) and to perform the data analysis (see Section 4.2).
• Result: This command button is used to view/print results of the evaluation. • Logout: This command button is used to return to the Start Menu.
23 MiABCD User’s Manual
4 MiABCD BASIC OPERATIONS
The major steps of the MiABCD are (1) data input, (2) data analysis, and (3) reviewing analysis
results. First, an Advanced User needs to perform these three steps for each new project using the
Advanced User Menu options. Afterwards, Basic User Menu options are accessed to enter
preference ratings, perform data analysis, and review analysis results. Sections 4.1, 4.2, and 4.3
provide detailed explanations of the major steps performed by an Advanced User. Also, the steps
that need to be followed by a Basic User are described in Sections 4.1.1.1, 4.1.5, 4.2, and 4.3.
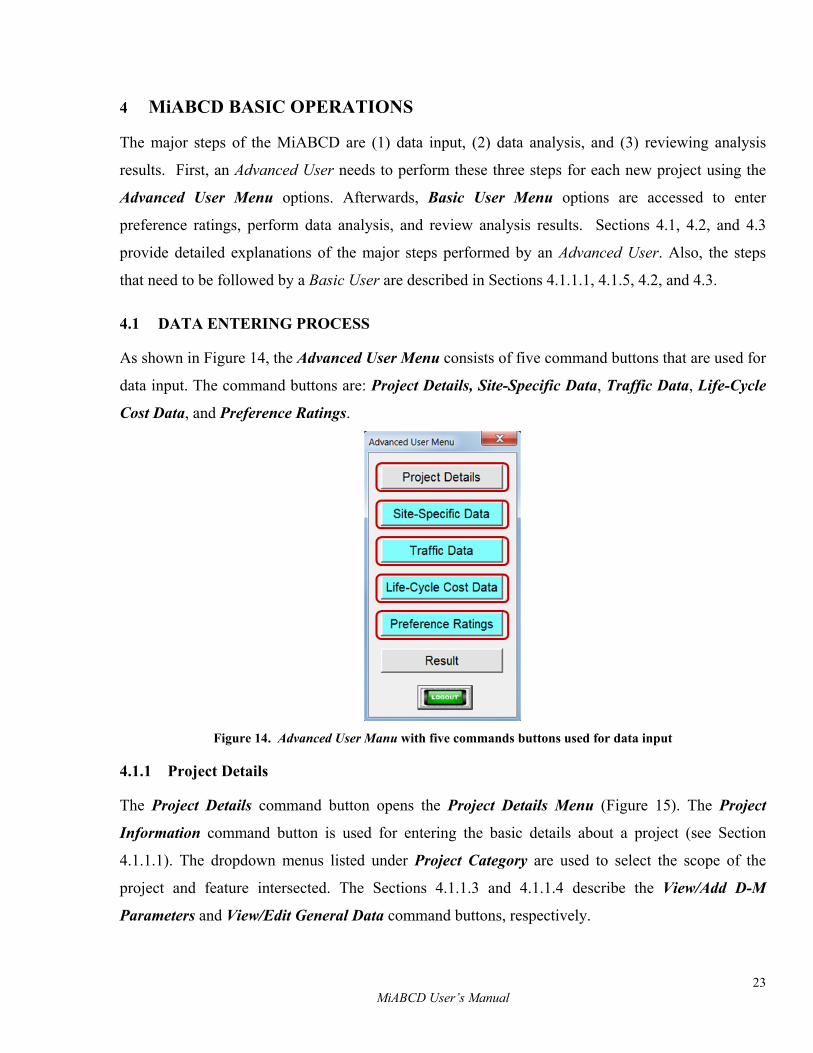
4.1 DATA ENTERING PROCESS
As shown in Figure 14, the Advanced User Menu consists of five command buttons that are used for
data input. The command buttons are: Project Details, Site-Specific Data, Traffic Data, Life-Cycle
Cost Data, and Preference Ratings.
Figure 14. Advanced User Manu with five commands buttons used for data input
4.1.1 Project Details
The Project Details command button opens the Project Details Menu (Figure 15). The Project
Information command button is used for entering the basic details about a project (see Section
4.1.1.1). The dropdown menus listed under Project Category are used to select the scope of the
project and feature intersected. The Sections 4.1.1.3 and 4.1.1.4 describe the View/Add D-M
Parameters and View/Edit General Data command buttons, respectively.
24 MiABCD User’s Manual
Figure 15. Project Details Menu
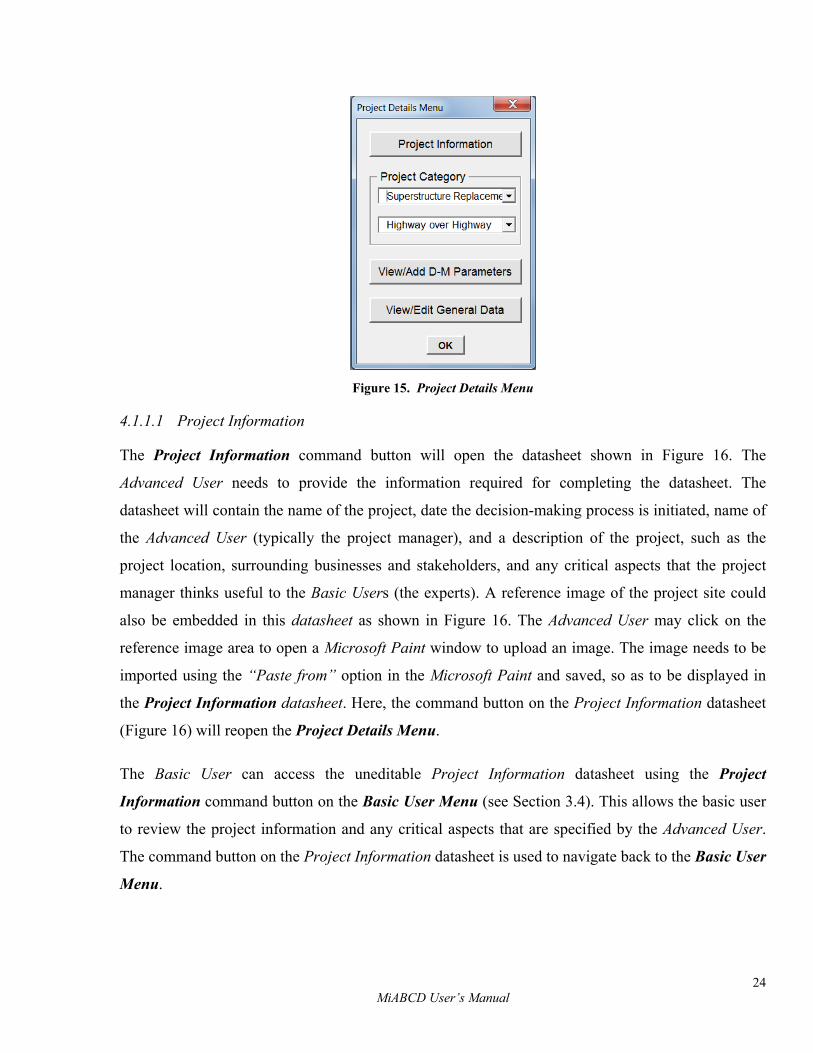
4.1.1.1 Project Information
The Project Information command button will open the datasheet shown in Figure 16. The
Advanced User needs to provide the information required for completing the datasheet. The
datasheet will contain the name of the project, date the decision-making process is initiated, name of
the Advanced User (typically the project manager), and a description of the project, such as the
project location, surrounding businesses and stakeholders, and any critical aspects that the project
manager thinks useful to the Basic Users (the experts). A reference image of the project site could
also be embedded in this datasheet as shown in Figure 16. The Advanced User may click on the
reference image area to open a Microsoft Paint window to upload an image. The image needs to be
imported using the “Paste from” option in the Microsoft Paint and saved, so as to be displayed in
the Project Information datasheet. Here, the command button on the Project Information datasheet
(Figure 16) will reopen the Project Details Menu.
The Basic User can access the uneditable Project Information datasheet using the Project
Information command button on the Basic User Menu (see Section 3.4). This allows the basic user
to review the project information and any critical aspects that are specified by the Advanced User.
The command button on the Project Information datasheet is used to navigate back to the Basic User
Menu.
25 MiABCD User’s Manual
Figure 16. Project Information datasheet
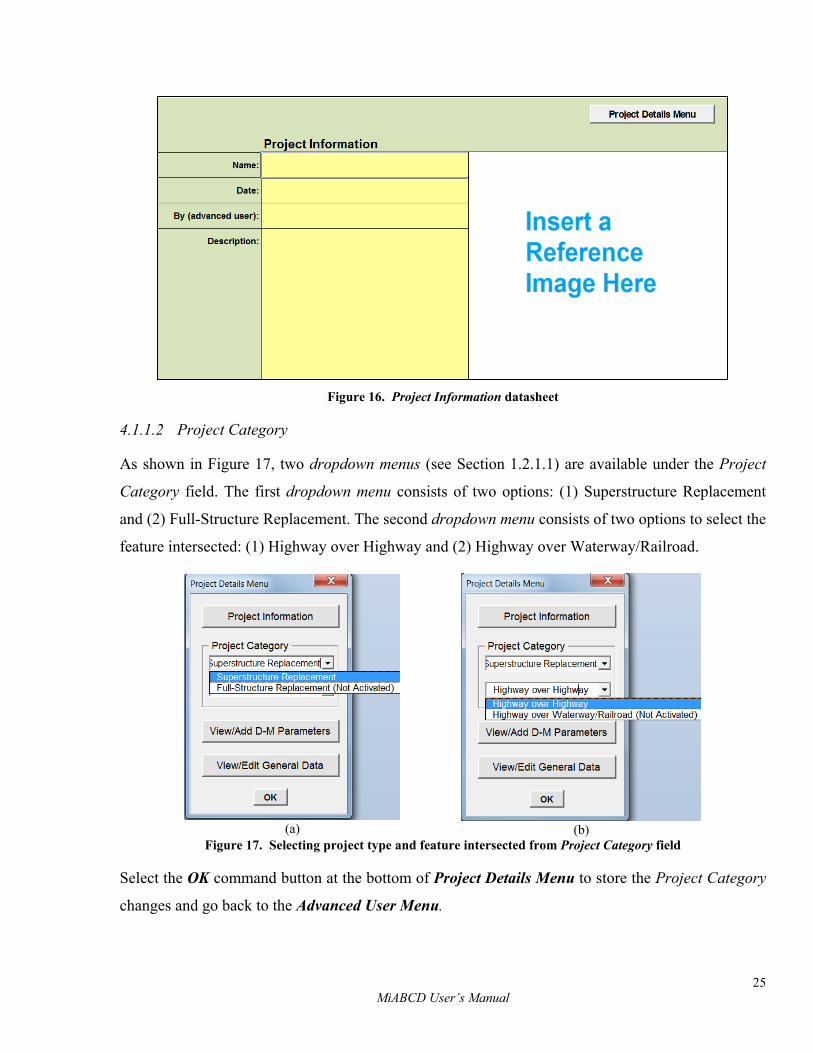
4.1.1.2 Project Category
As shown in Figure 17, two dropdown menus (see Section 1.2.1.1) are available under the Project
Category field. The first dropdown menu consists of two options: (1) Superstructure Replacement
and (2) Full-Structure Replacement. The second dropdown menu consists of two options to select the
feature intersected: (1) Highway over Highway and (2) Highway over Waterway/Railroad.
(a)
(b)
Figure 17. Selecting project type and feature intersected from Project Category field
Select the OK command button at the bottom of Project Details Menu to store the Project Category
changes and go back to the Advanced User Menu.
26 MiABCD User’s Manual
Warning: Closing the Project Details Menu using icon will not save the changes made under
the Project Category field.
Note: The options available under Project Category dropdown menus in MiABCD v2.0 or its
updates, such as, v2.1 etc., are limited to “Superstructure Replacement” and “Highway over
Highway.”
4.1.1.3 View/Add Decision-Making Parameters
The View/Add D-M Parameters command button on the Project Details Menu opens the datasheet
with default decision-making parameters (Figure 18). Apart from the default sub-parameters under
each major-parameter, an Advanced User can add up to six additional sub-parameters under each
major parameter. Therefore, a total of 36 (i.e., 6×6) additional sub-parameters can be incorporated in
the analysis.
Note: The additional sub-parameters defined by the Advanced User can be removed or modified;
whereas, the default sub-parameters cannot be changed.
27 MiABCD User’s Manual
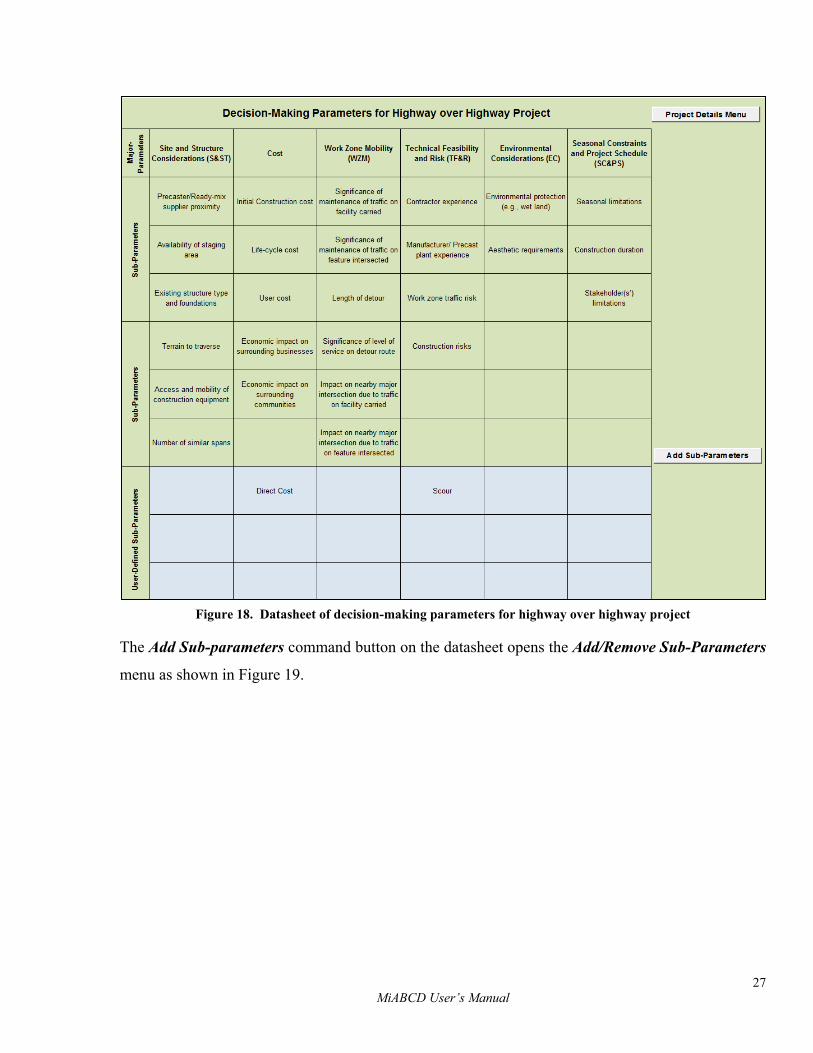
Figure 18. Datasheet of decision-making parameters for highway over highway project
The Add Sub-parameters command button on the datasheet opens the Add/Remove Sub-Parameters
menu as shown in Figure 19.
28 MiABCD User’s Manual
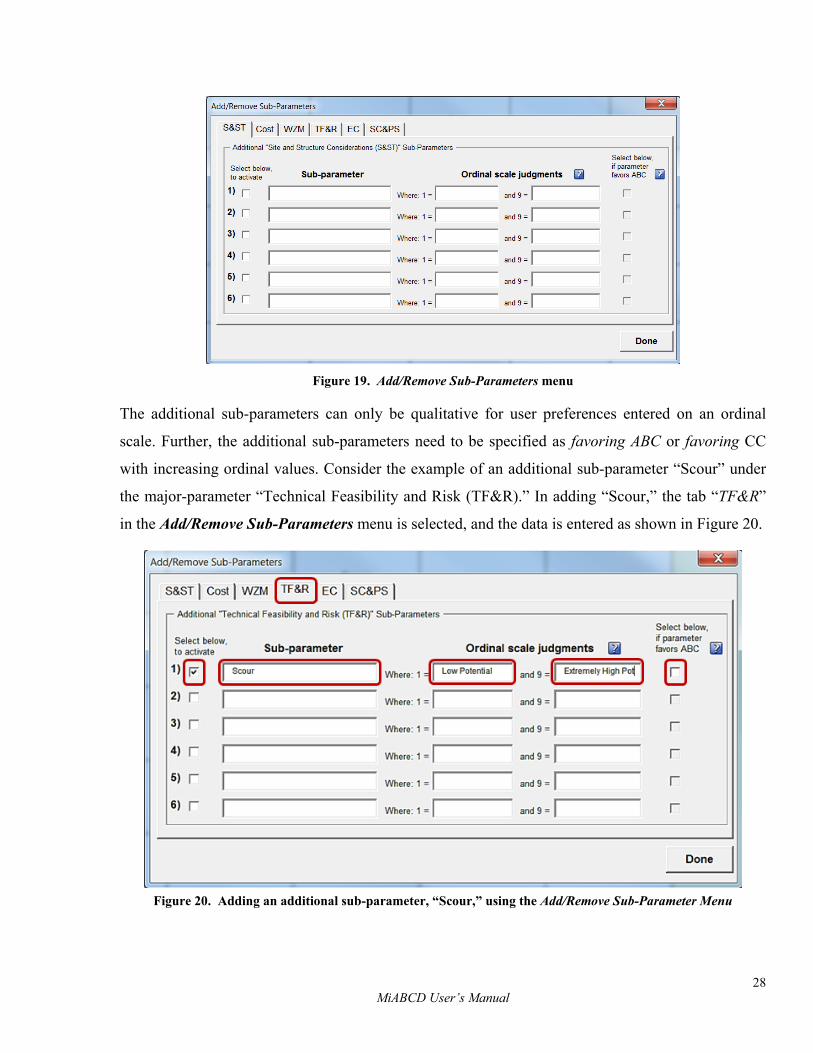
Figure 19. Add/Remove Sub-Parameters menu
The additional sub-parameters can only be qualitative for user preferences entered on an ordinal
scale. Further, the additional sub-parameters need to be specified as favoring ABC or favoring CC
with increasing ordinal values. Consider the example of an additional sub-parameter “Scour” under
the major-parameter “Technical Feasibility and Risk (TF&R).” In adding “Scour,” the tab “TF&R”
in the Add/Remove Sub-Parameters menu is selected, and the data is entered as shown in Figure 20.
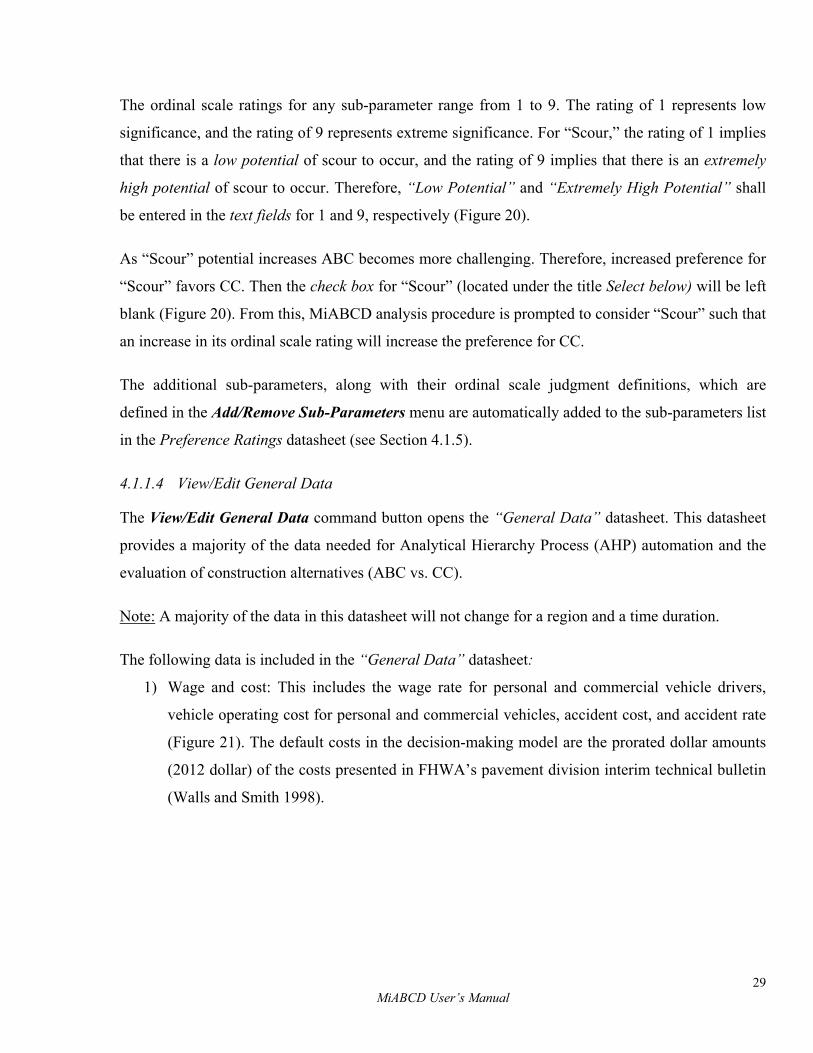
Figure 20. Adding an additional sub-parameter, “Scour,” using the Add/Remove Sub-Parameter Menu
29 MiABCD User’s Manual
The ordinal scale ratings for any sub-parameter range from 1 to 9. The rating of 1 represents low
significance, and the rating of 9 represents extreme significance. For “Scour,” the rating of 1 implies
that there is a low potential of scour to occur, and the rating of 9 implies that there is an extremely
high potential of scour to occur. Therefore, “Low Potential” and “Extremely High Potential” shall
be entered in the text fields for 1 and 9, respectively (Figure 20).
As “Scour” potential increases ABC becomes more challenging. Therefore, increased preference for
“Scour” favors CC. Then the check box for “Scour” (located under the title Select below) will be left
blank (Figure 20). From this, MiABCD analysis procedure is prompted to consider “Scour” such that
an increase in its ordinal scale rating will increase the preference for CC.
The additional sub-parameters, along with their ordinal scale judgment definitions, which are
defined in the Add/Remove Sub-Parameters menu are automatically added to the sub-parameters list
in the Preference Ratings datasheet (see Section 4.1.5).
4.1.1.4 View/Edit General Data
The View/Edit General Data command button opens the “General Data” datasheet. This datasheet
provides a majority of the data needed for Analytical Hierarchy Process (AHP) automation and the
evaluation of construction alternatives (ABC vs. CC).
Note: A majority of the data in this datasheet will not change for a region and a time duration.
The following data is included in the “General Data” datasheet:
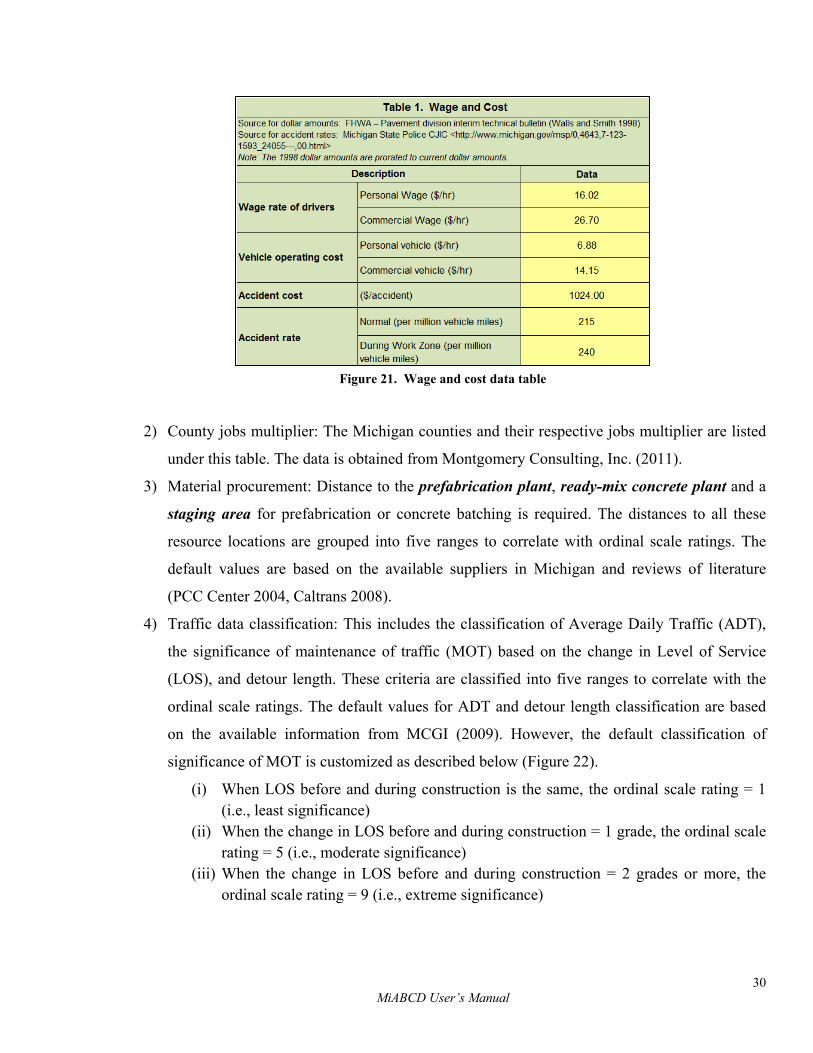
1) Wage and cost: This includes the wage rate for personal and commercial vehicle drivers,
vehicle operating cost for personal and commercial vehicles, accident cost, and accident rate
(Figure 21). The default costs in the decision-making model are the prorated dollar amounts
(2012 dollar) of the costs presented in FHWA’s pavement division interim technical bulletin
(Walls and Smith 1998).
30 MiABCD User’s Manual
Figure 21. Wage and cost data table
2) County jobs multiplier: The Michigan counties and their respective jobs multiplier are listed
under this table. The data is obtained from Montgomery Consulting, Inc. (2011).
3) Material procurement: Distance to the prefabrication plant, ready-mix concrete plant and a
staging area for prefabrication or concrete batching is required. The distances to all these
resource locations are grouped into five ranges to correlate with ordinal scale ratings. The
default values are based on the available suppliers in Michigan and reviews of literature
(PCC Center 2004, Caltrans 2008).
4) Traffic data classification: This includes the classification of Average Daily Traffic (ADT),
the significance of maintenance of traffic (MOT) based on the change in Level of Service
(LOS), and detour length. These criteria are classified into five ranges to correlate with the
ordinal scale ratings. The default values for ADT and detour length classification are based
on the available information from MCGI (2009). However, the default classification of
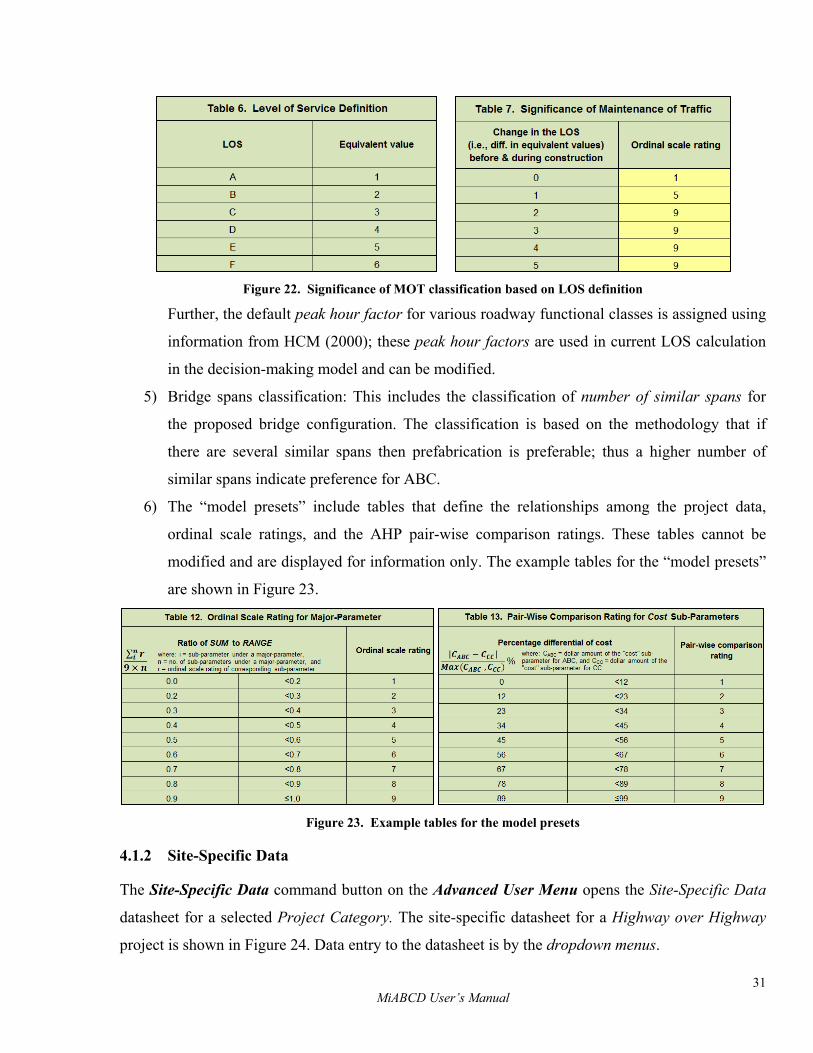
significance of MOT is customized as described below (Figure 22).
(i) When LOS before and during construction is the same, the ordinal scale rating = 1 (i.e., least significance)
(ii) When the change in LOS before and during construction = 1 grade, the ordinal scale rating = 5 (i.e., moderate significance)
(iii) When the change in LOS before and during construction = 2 grades or more, the ordinal scale rating = 9 (i.e., extreme significance)
31 MiABCD User’s Manual
Figure 22. Significance of MOT classification based on LOS definition
Further, the default peak hour factor for various roadway functional classes is assigned using
information from HCM (2000); these peak hour factors are used in current LOS calculation
in the decision-making model and can be modified.
5) Bridge spans classification: This includes the classification of number of similar spans for
the proposed bridge configuration. The classification is based on the methodology that if
there are several similar spans then prefabrication is preferable; thus a higher number of
similar spans indicate preference for ABC.
6) The “model presets” include tables that define the relationships among the project data,
ordinal scale ratings, and the AHP pair-wise comparison ratings. These tables cannot be
modified and are displayed for information only. The example tables for the “model presets”
are shown in Figure 23.
Figure 23. Example tables for the model presets
4.1.2 Site-Specific Data
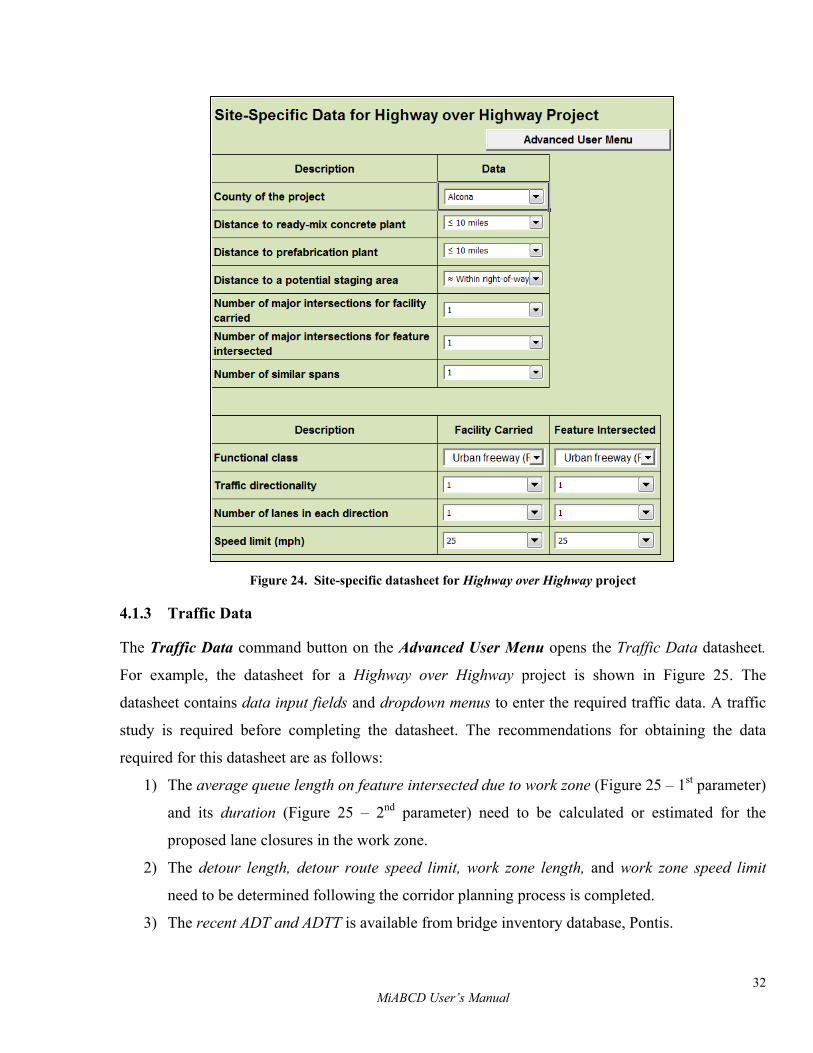
The Site-Specific Data command button on the Advanced User Menu opens the Site-Specific Data
datasheet for a selected Project Category. The site-specific datasheet for a Highway over Highway
project is shown in Figure 24. Data entry to the datasheet is by the dropdown menus.
32 MiABCD User’s Manual
Figure 24. Site-specific datasheet for Highway over Highway project
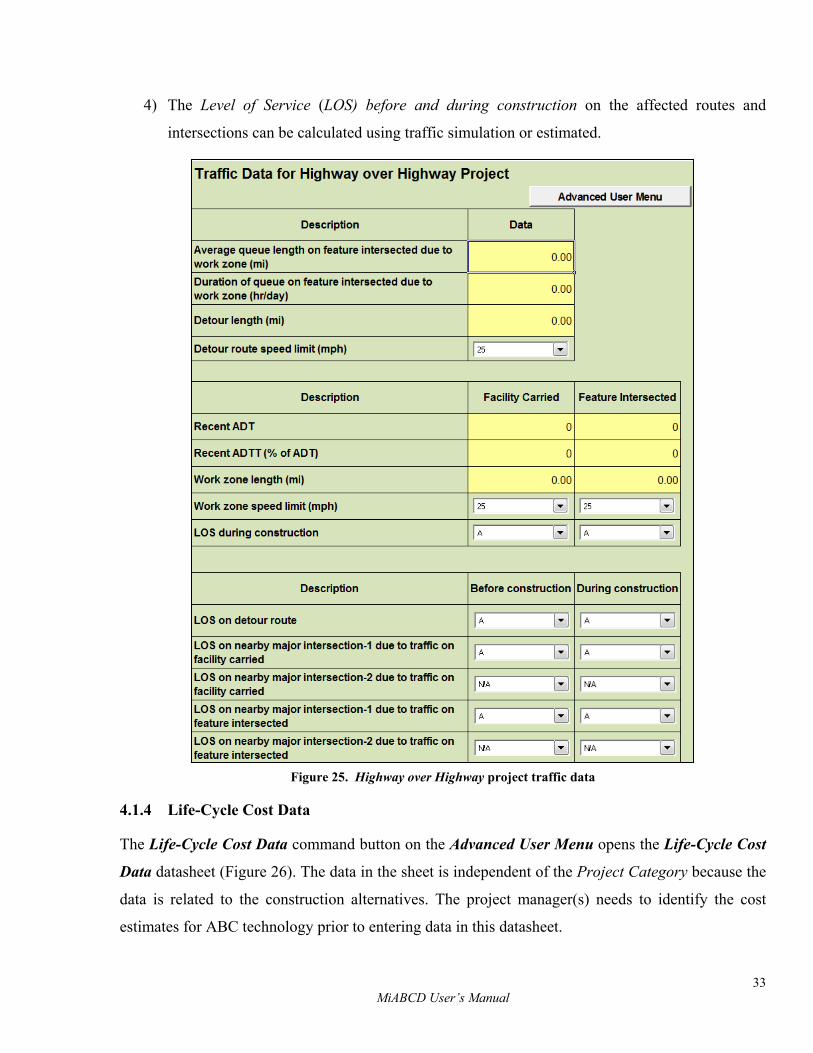
4.1.3 Traffic Data
The Traffic Data command button on the Advanced User Menu opens the Traffic Data datasheet.
For example, the datasheet for a Highway over Highway project is shown in Figure 25. The
datasheet contains data input fields and dropdown menus to enter the required traffic data. A traffic
study is required before completing the datasheet. The recommendations for obtaining the data
required for this datasheet are as follows:
1) The average queue length on feature intersected due to work zone (Figure 25 – 1st parameter)
and its duration (Figure 25 – 2nd parameter) need to be calculated or estimated for the
proposed lane closures in the work zone.
2) The detour length, detour route speed limit, work zone length, and work zone speed limit
need to be determined following the corridor planning process is completed.
3) The recent ADT and ADTT is available from bridge inventory database, Pontis.
33 MiABCD User’s Manual
4) The Level of Service (LOS) before and during construction on the affected routes and
intersections can be calculated using traffic simulation or estimated.
Figure 25. Highway over Highway project traffic data
4.1.4 Life-Cycle Cost Data
The Life-Cycle Cost Data command button on the Advanced User Menu opens the Life-Cycle Cost
Data datasheet (Figure 26). The data in the sheet is independent of the Project Category because the
data is related to the construction alternatives. The project manager(s) needs to identify the cost
estimates for ABC technology prior to entering data in this datasheet.
34 MiABCD User’s Manual
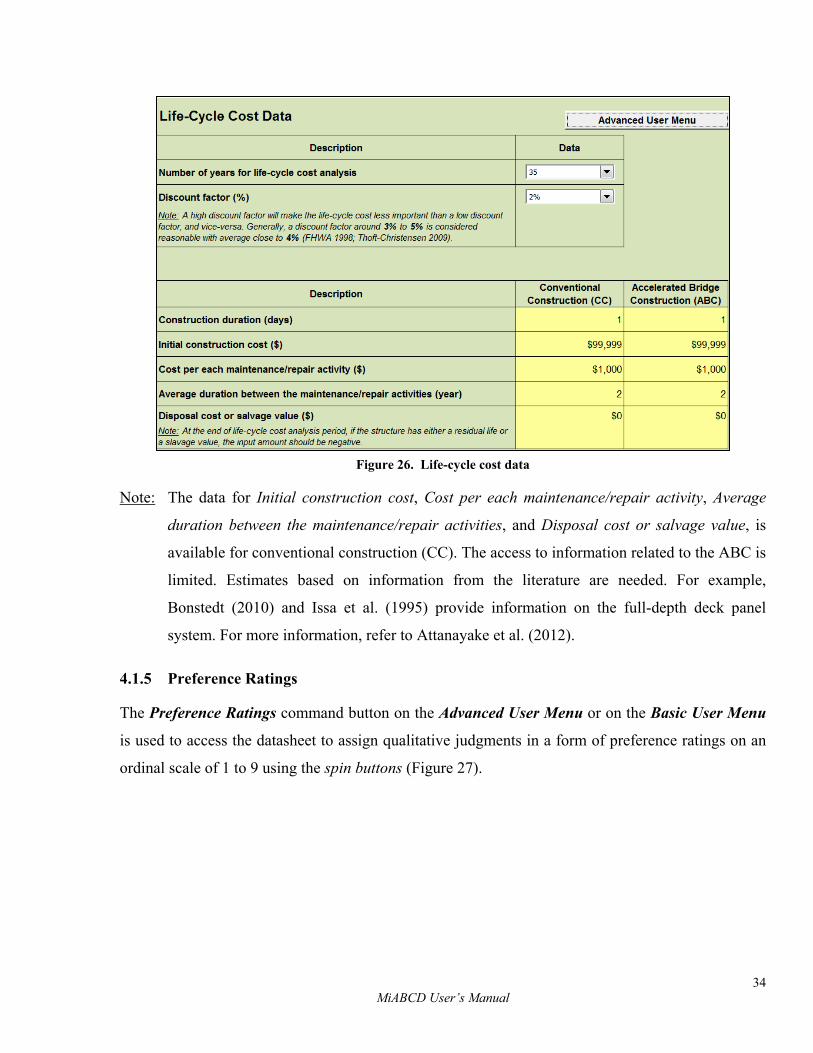
Figure 26. Life-cycle cost data
Note: The data for Initial construction cost, Cost per each maintenance/repair activity, Average
duration between the maintenance/repair activities, and Disposal cost or salvage value, is
available for conventional construction (CC). The access to information related to the ABC is
limited. Estimates based on information from the literature are needed. For example,
Bonstedt (2010) and Issa et al. (1995) provide information on the full-depth deck panel
system. For more information, refer to Attanayake et al. (2012).
4.1.5 Preference Ratings
The Preference Ratings command button on the Advanced User Menu or on the Basic User Menu
is used to access the datasheet to assign qualitative judgments in a form of preference ratings on an
ordinal scale of 1 to 9 using the spin buttons (Figure 27).
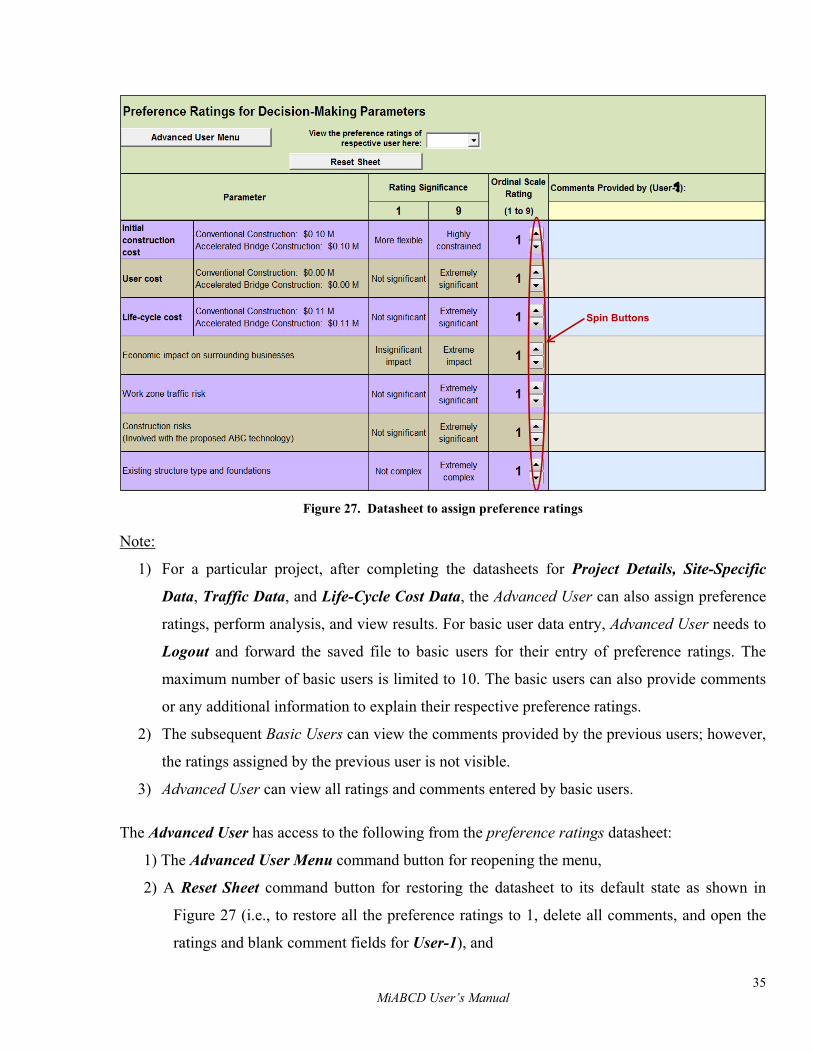
35 MiABCD User’s Manual
Figure 27. Datasheet to assign preference ratings
Note:
1) For a particular project, after completing the datasheets for Project Details, Site-Specific
Data, Traffic Data, and Life-Cycle Cost Data, the Advanced User can also assign preference
ratings, perform analysis, and view results. For basic user data entry, Advanced User needs to
Logout and forward the saved file to basic users for their entry of preference ratings. The
maximum number of basic users is limited to 10. The basic users can also provide comments
or any additional information to explain their respective preference ratings.
2) The subsequent Basic Users can view the comments provided by the previous users; however,
the ratings assigned by the previous user is not visible.
3) Advanced User can view all ratings and comments entered by basic users.
The Advanced User has access to the following from the preference ratings datasheet:
1) The Advanced User Menu command button for reopening the menu,
2) A Reset Sheet command button for restoring the datasheet to its default state as shown in
Figure 27 (i.e., to restore all the preference ratings to 1, delete all comments, and open the
ratings and blank comment fields for User-1), and
Spin Buttons
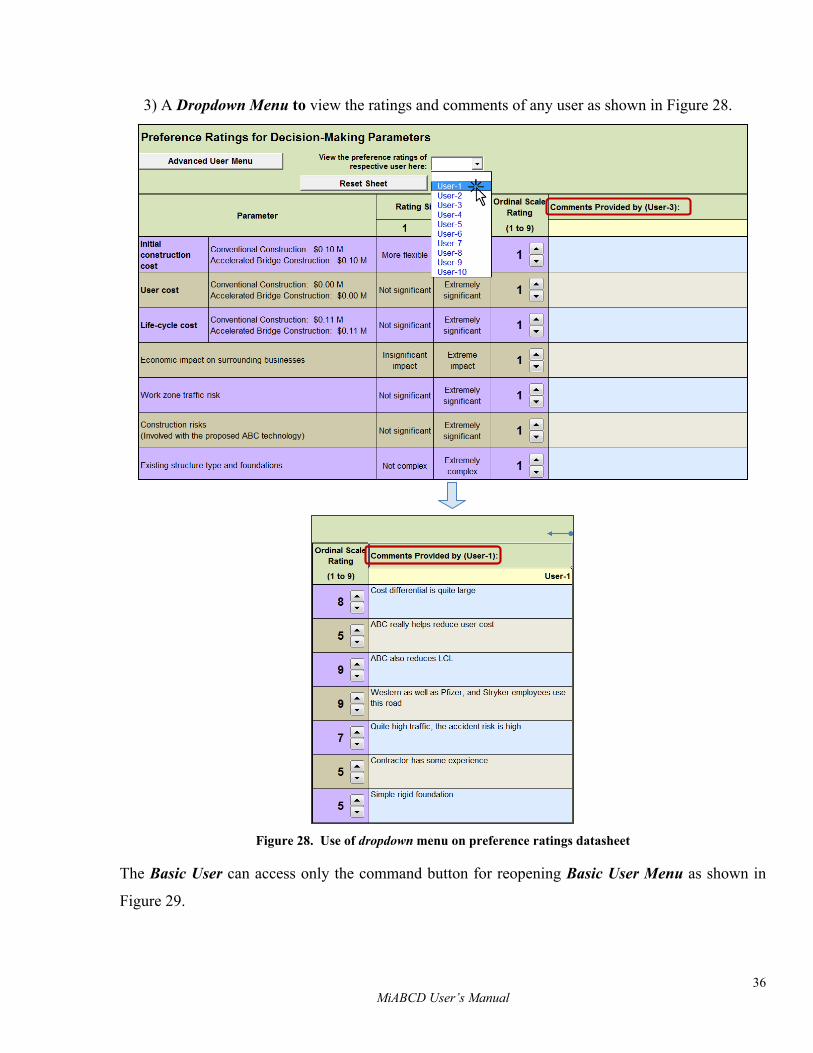
36 MiABCD User’s Manual
3) A Dropdown Menu to view the ratings and comments of any user as shown in Figure 28.
Figure 28. Use of dropdown menu on preference ratings datasheet
The Basic User can access only the command button for reopening Basic User Menu as shown in
Figure 29.
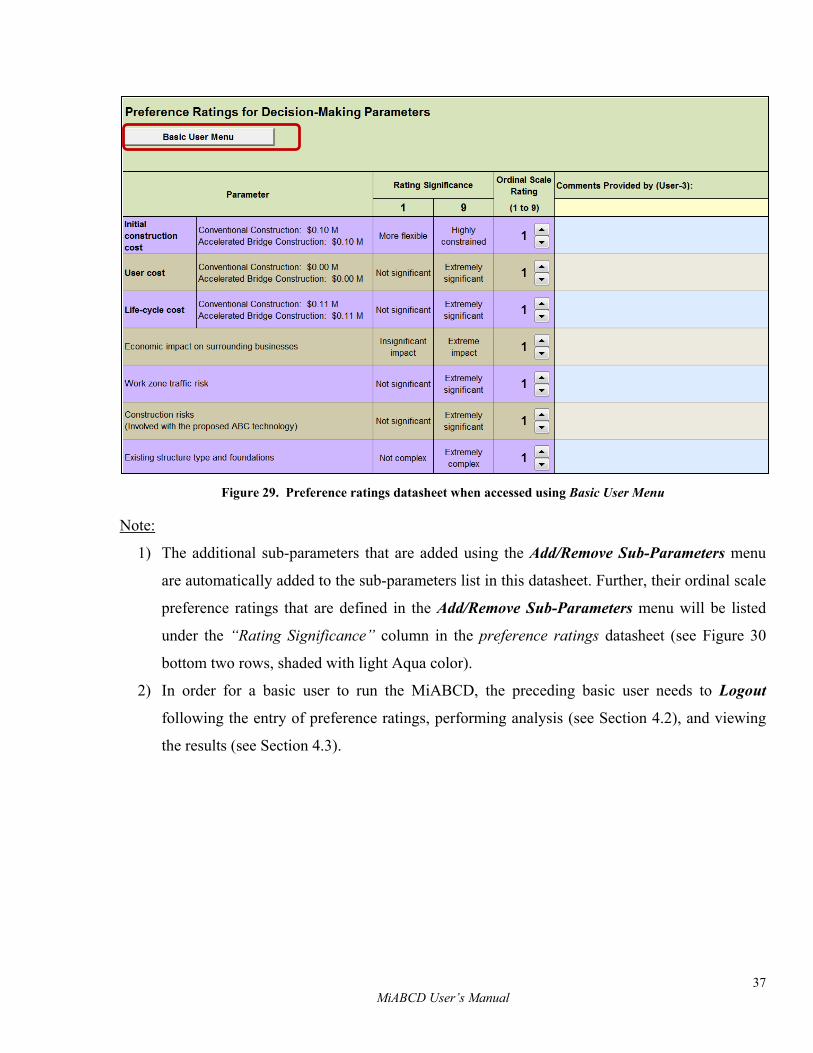
37 MiABCD User’s Manual
Figure 29. Preference ratings datasheet when accessed using Basic User Menu
Note:
1) The additional sub-parameters that are added using the Add/Remove Sub-Parameters menu
are automatically added to the sub-parameters list in this datasheet. Further, their ordinal scale
preference ratings that are defined in the Add/Remove Sub-Parameters menu will be listed
under the “Rating Significance” column in the preference ratings datasheet (see Figure 30
bottom two rows, shaded with light Aqua color).
2) In order for a basic user to run the MiABCD, the preceding basic user needs to Logout
following the entry of preference ratings, performing analysis (see Section 4.2), and viewing
the results (see Section 4.3).
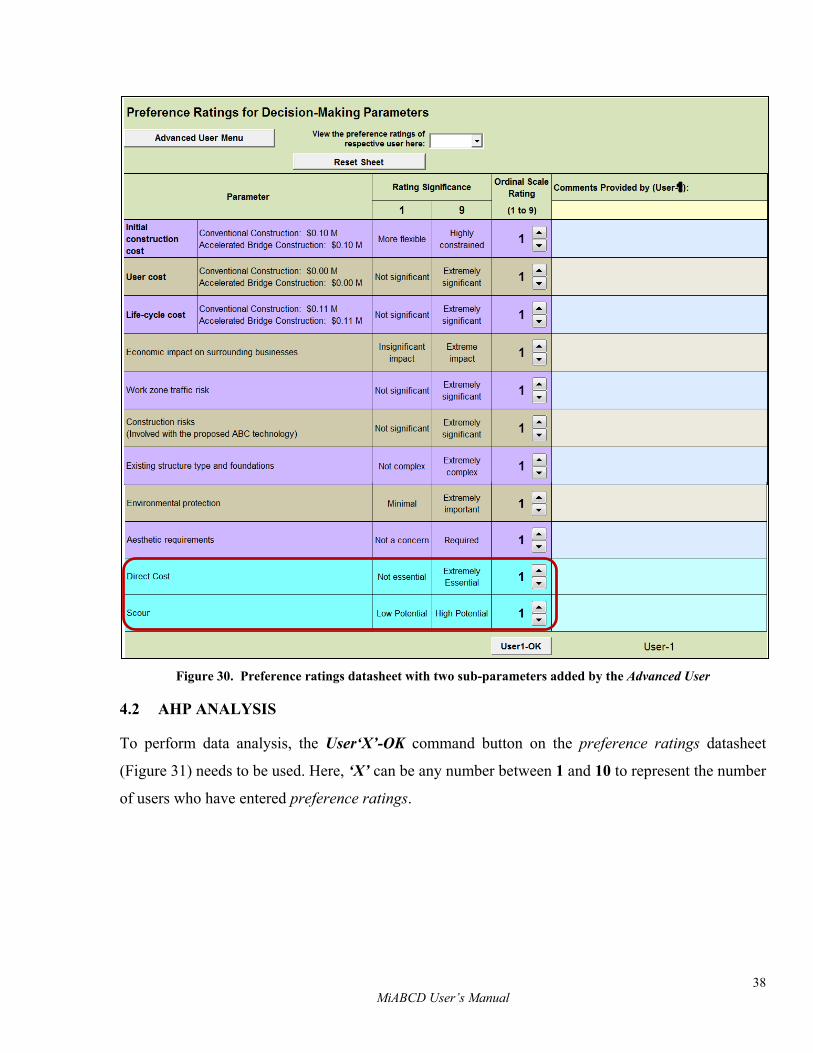
38 MiABCD User’s Manual
Figure 30. Preference ratings datasheet with two sub-parameters added by the Advanced User
4.2 AHP ANALYSIS
To perform data analysis, the User‘X’-OK command button on the preference ratings datasheet
(Figure 31) needs to be used. Here, ‘X’ can be any number between 1 and 10 to represent the number
of users who have entered preference ratings.
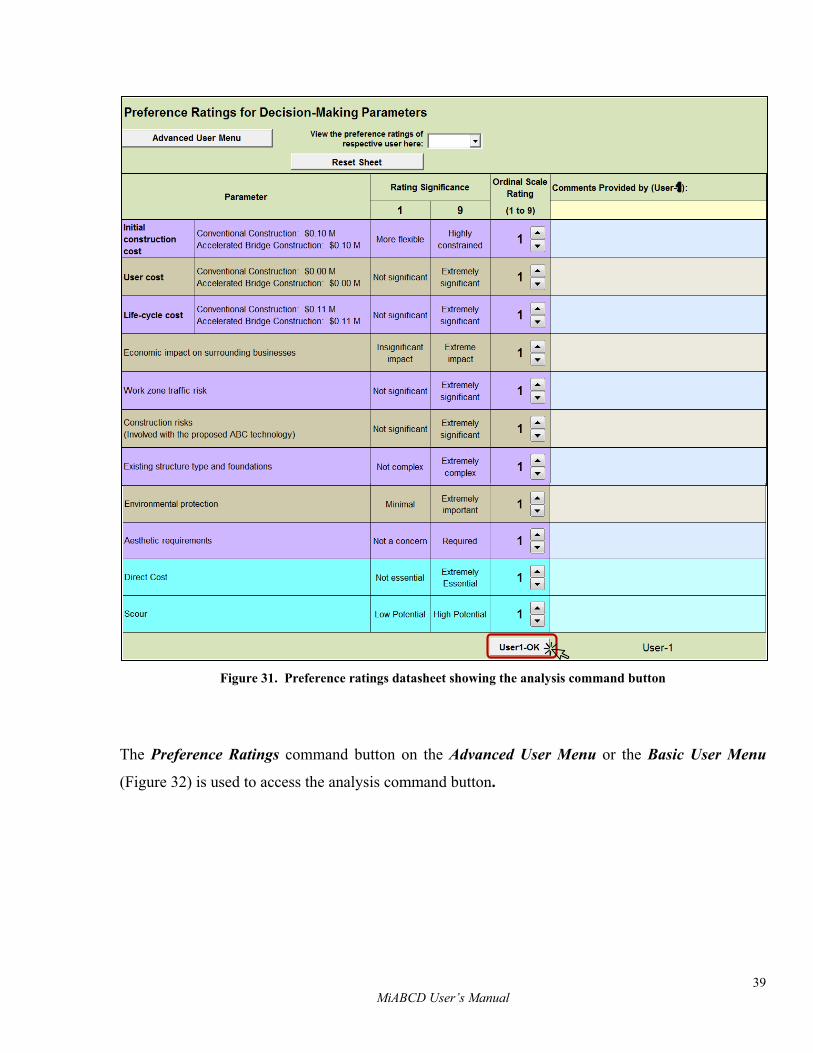
39 MiABCD User’s Manual
Figure 31. Preference ratings datasheet showing the analysis command button
The Preference Ratings command button on the Advanced User Menu or the Basic User Menu
(Figure 32) is used to access the analysis command button.
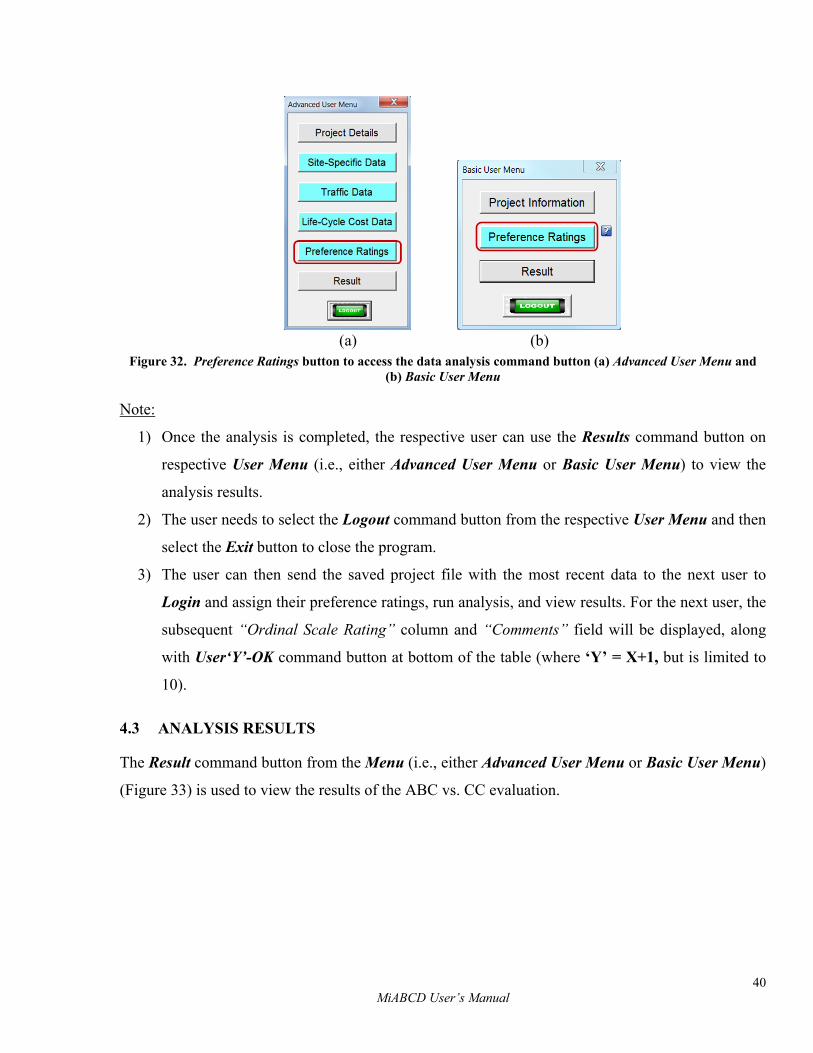
40 MiABCD User’s Manual
(a) (b)
Figure 32. Preference Ratings button to access the data analysis command button (a) Advanced User Menu and (b) Basic User Menu
Note:
1) Once the analysis is completed, the respective user can use the Results command button on
respective User Menu (i.e., either Advanced User Menu or Basic User Menu) to view the
analysis results.
2) The user needs to select the Logout command button from the respective User Menu and then
select the Exit button to close the program.
3) The user can then send the saved project file with the most recent data to the next user to
Login and assign their preference ratings, run analysis, and view results. For the next user, the
subsequent “Ordinal Scale Rating” column and “Comments” field will be displayed, along
with User‘Y’-OK command button at bottom of the table (where ‘Y’ = X+1, but is limited to
10).
4.3 ANALYSIS RESULTS
The Result command button from the Menu (i.e., either Advanced User Menu or Basic User Menu)
(Figure 33) is used to view the results of the ABC vs. CC evaluation.
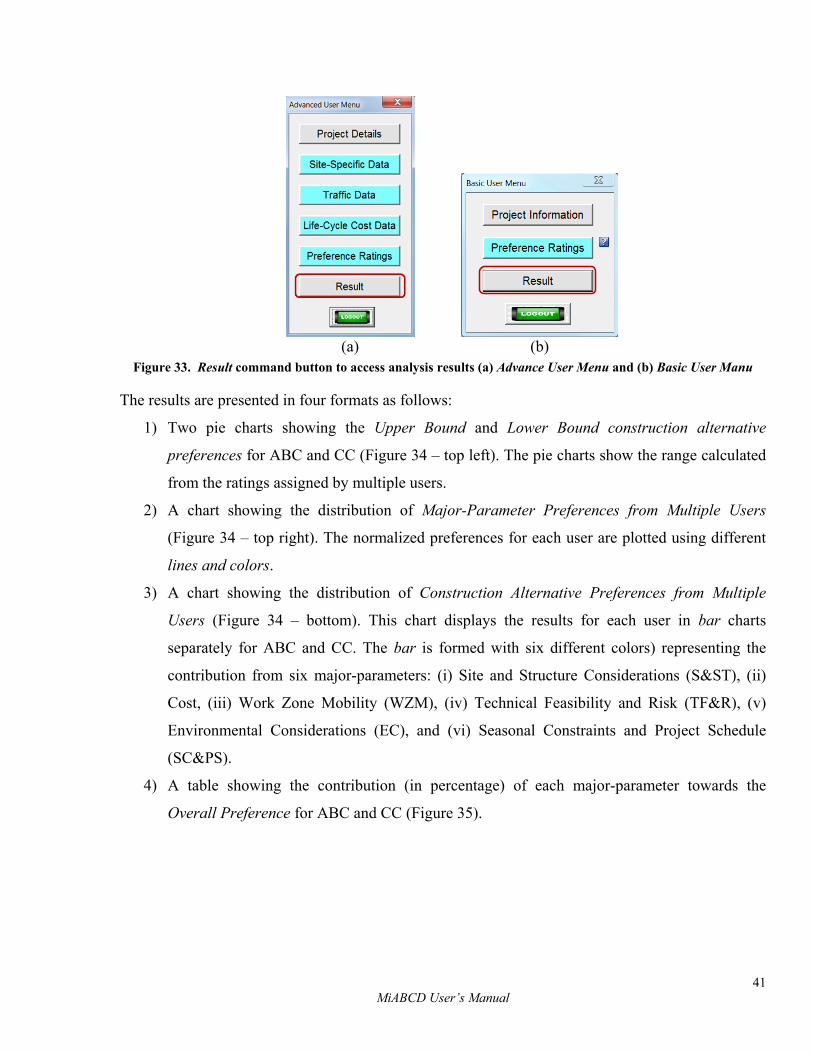
41 MiABCD User’s Manual
(a) (b)
Figure 33. Result command button to access analysis results (a) Advance User Menu and (b) Basic User Manu
The results are presented in four formats as follows:
1) Two pie charts showing the Upper Bound and Lower Bound construction alternative
preferences for ABC and CC (Figure 34 – top left). The pie charts show the range calculated
from the ratings assigned by multiple users.
2) A chart showing the distribution of Major-Parameter Preferences from Multiple Users
(Figure 34 – top right). The normalized preferences for each user are plotted using different
lines and colors.
3) A chart showing the distribution of Construction Alternative Preferences from Multiple
Users (Figure 34 – bottom). This chart displays the results for each user in bar charts
separately for ABC and CC. The bar is formed with six different colors) representing the
contribution from six major-parameters: (i) Site and Structure Considerations (S&ST), (ii)
Cost, (iii) Work Zone Mobility (WZM), (iv) Technical Feasibility and Risk (TF&R), (v)
Environmental Considerations (EC), and (vi) Seasonal Constraints and Project Schedule
(SC&PS).
4) A table showing the contribution (in percentage) of each major-parameter towards the
Overall Preference for ABC and CC (Figure 35).
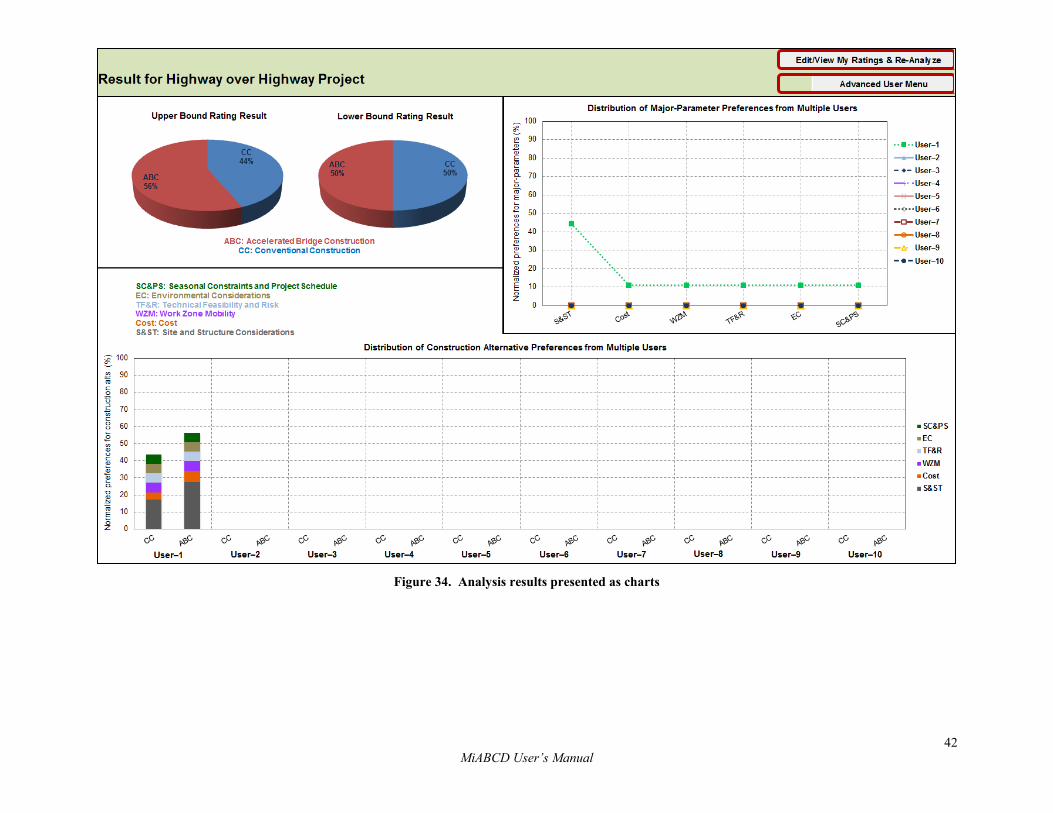
42 MiABCD User’s Manual
Figure 34. Analysis results presented as charts
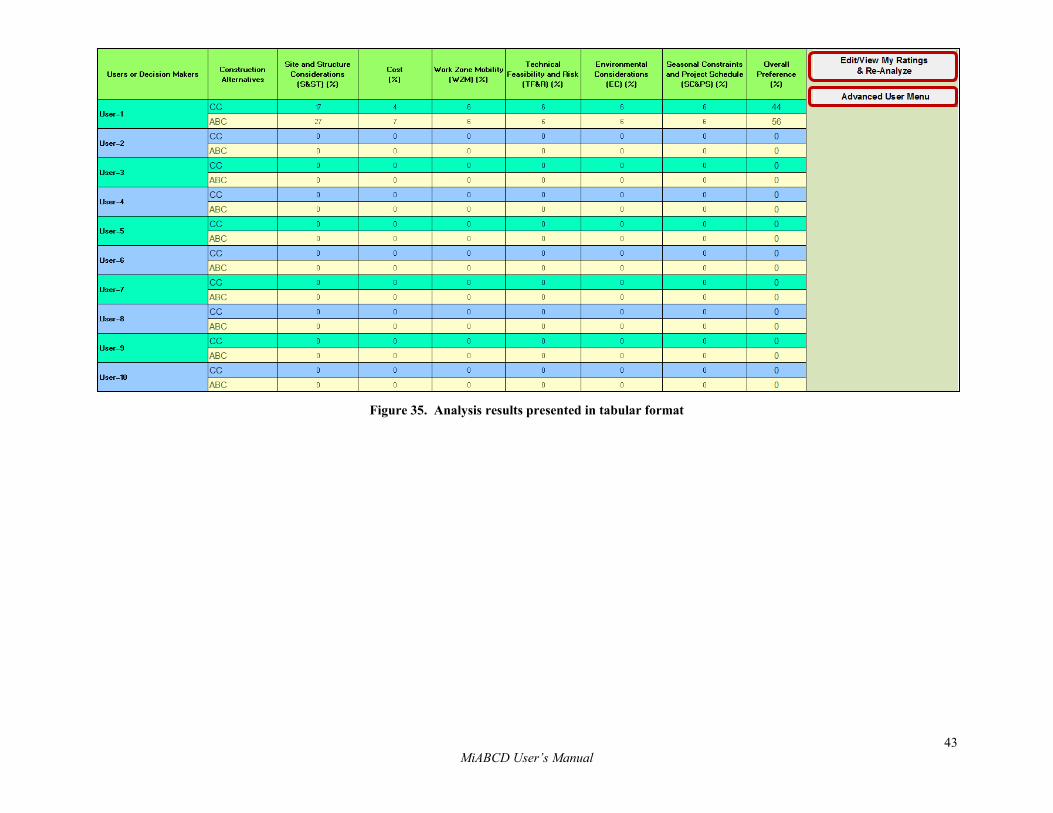
43 MiABCD User’s Manual
Figure 35. Analysis results presented in tabular format

44 MiABCD Users’ Manual
Note:
1) The Edit/View My Ratings & Re-Analyze command button available with the results (Figure
34 and Figure 35) will direct the user back to his/her own preference ratings, so that the
preference ratings can be revised. The user, following the revision of their preference ratings,
needs to run the analysis before viewing the results with updated ratings.
2) Advanced User Menu or Basic User Menu command button is available with the analysis
results based on the user type. As an example, Figure 34 and Figure 35 show the Advanced
User Menu button.
3) The Advanced User can change the data in any of the datasheets and rerun the analysis.
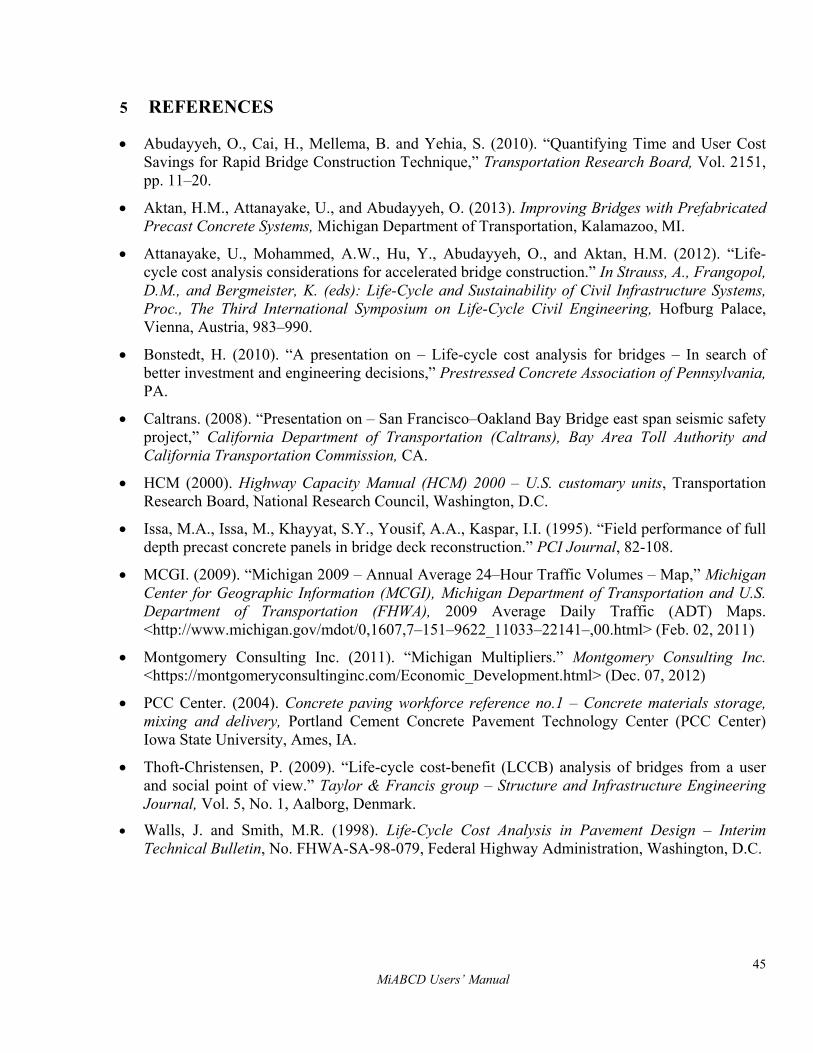
45 MiABCD Users’ Manual
5 REFERENCES
• Abudayyeh, O., Cai, H., Mellema, B. and Yehia, S. (2010). “Quantifying Time and User Cost Savings for Rapid Bridge Construction Technique,” Transportation Research Board, Vol. 2151, pp. 11–20.
• Aktan, H.M., Attanayake, U., and Abudayyeh, O. (2013). Improving Bridges with Prefabricated Precast Concrete Systems, Michigan Department of Transportation, Kalamazoo, MI.
• Attanayake, U., Mohammed, A.W., Hu, Y., Abudayyeh, O., and Aktan, H.M. (2012). “Life-cycle cost analysis considerations for accelerated bridge construction.” In Strauss, A., Frangopol, D.M., and Bergmeister, K. (eds): Life-Cycle and Sustainability of Civil Infrastructure Systems, Proc., The Third International Symposium on Life-Cycle Civil Engineering, Hofburg Palace, Vienna, Austria, 983–990.
• Bonstedt, H. (2010). “A presentation on – Life-cycle cost analysis for bridges – In search of better investment and engineering decisions,” Prestressed Concrete Association of Pennsylvania, PA.
• Caltrans. (2008). “Presentation on – San Francisco–Oakland Bay Bridge east span seismic safety project,” California Department of Transportation (Caltrans), Bay Area Toll Authority and California Transportation Commission, CA.
• HCM (2000). Highway Capacity Manual (HCM) 2000 – U.S. customary units, Transportation Research Board, National Research Council, Washington, D.C.
• Issa, M.A., Issa, M., Khayyat, S.Y., Yousif, A.A., Kaspar, I.I. (1995). “Field performance of full depth precast concrete panels in bridge deck reconstruction.” PCI Journal, 82-108.
• MCGI. (2009). “Michigan 2009 – Annual Average 24–Hour Traffic Volumes – Map,” Michigan Center for Geographic Information (MCGI), Michigan Department of Transportation and U.S. Department of Transportation (FHWA), 2009 Average Daily Traffic (ADT) Maps. <http://www.michigan.gov/mdot/0,1607,7–151–9622_11033–22141–,00.html> (Feb. 02, 2011)
• Montgomery Consulting Inc. (2011). “Michigan Multipliers.” Montgomery Consulting Inc. <https://montgomeryconsultinginc.com/Economic_Development.html> (Dec. 07, 2012)
• PCC Center. (2004). Concrete paving workforce reference no.1 – Concrete materials storage, mixing and delivery, Portland Cement Concrete Pavement Technology Center (PCC Center) Iowa State University, Ames, IA.
• Thoft-Christensen, P. (2009). “Life-cycle cost-benefit (LCCB) analysis of bridges from a user and social point of view.” Taylor & Francis group – Structure and Infrastructure Engineering Journal, Vol. 5, No. 1, Aalborg, Denmark.
• Walls, J. and Smith, M.R. (1998). Life-Cycle Cost Analysis in Pavement Design – Interim Technical Bulletin, No. FHWA-SA-98-079, Federal Highway Administration, Washington, D.C.
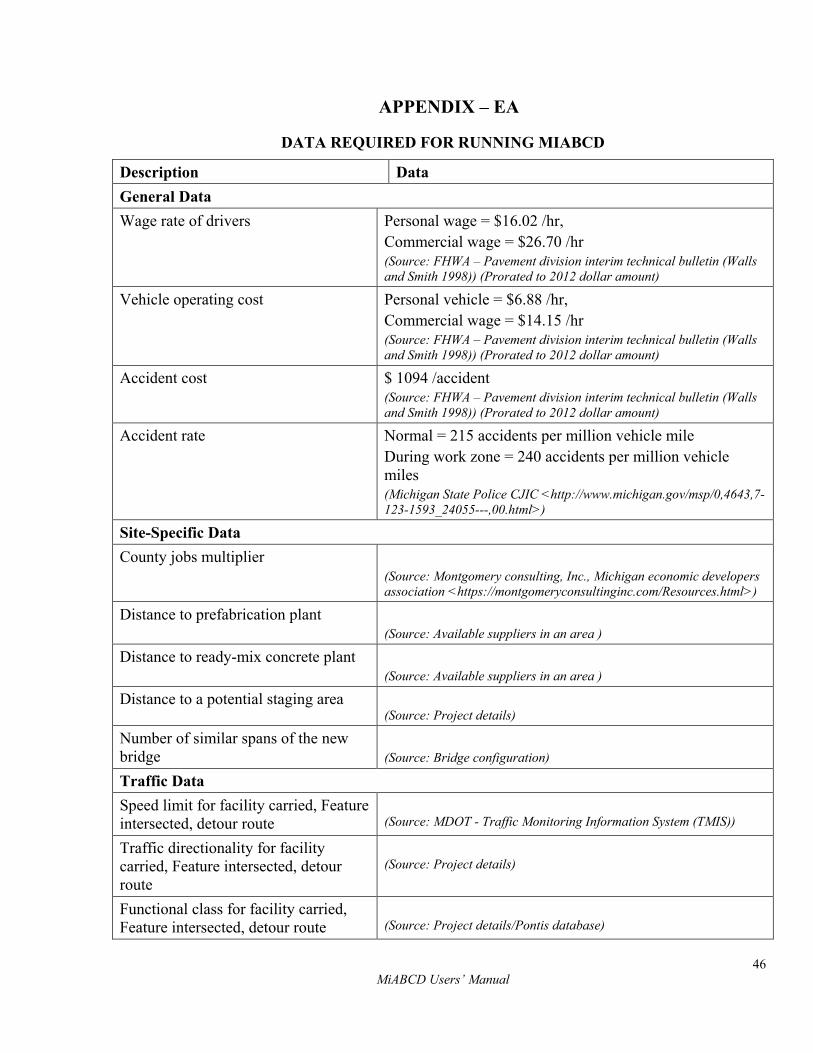
46 MiABCD Users’ Manual
APPENDIX – EA
DATA REQUIRED FOR RUNNING MIABCD
Description Data General Data Wage rate of drivers Personal wage = $16.02 /hr,
Commercial wage = $26.70 /hr (Source: FHWA – Pavement division interim technical bulletin (Walls and Smith 1998)) (Prorated to 2012 dollar amount)
Vehicle operating cost Personal vehicle = $6.88 /hr, Commercial wage = $14.15 /hr (Source: FHWA – Pavement division interim technical bulletin (Walls and Smith 1998)) (Prorated to 2012 dollar amount)
Accident cost $ 1094 /accident (Source: FHWA – Pavement division interim technical bulletin (Walls and Smith 1998)) (Prorated to 2012 dollar amount)
Accident rate Normal = 215 accidents per million vehicle mile During work zone = 240 accidents per million vehicle miles (Michigan State Police CJIC <http://www.michigan.gov/msp/0,4643,7-123-1593_24055---,00.html>)
Site-Specific Data County jobs multiplier
(Source: Montgomery consulting, Inc., Michigan economic developers association <https://montgomeryconsultinginc.com/Resources.html>)
Distance to prefabrication plant (Source: Available suppliers in an area )
Distance to ready-mix concrete plant (Source: Available suppliers in an area )
Distance to a potential staging area (Source: Project details)
Number of similar spans of the new bridge
(Source: Bridge configuration)
Traffic Data Speed limit for facility carried, Feature intersected, detour route
(Source: MDOT - Traffic Monitoring Information System (TMIS))
Traffic directionality for facility carried, Feature intersected, detour route
(Source: Project details)
Functional class for facility carried, Feature intersected, detour route
(Source: Project details/Pontis database)
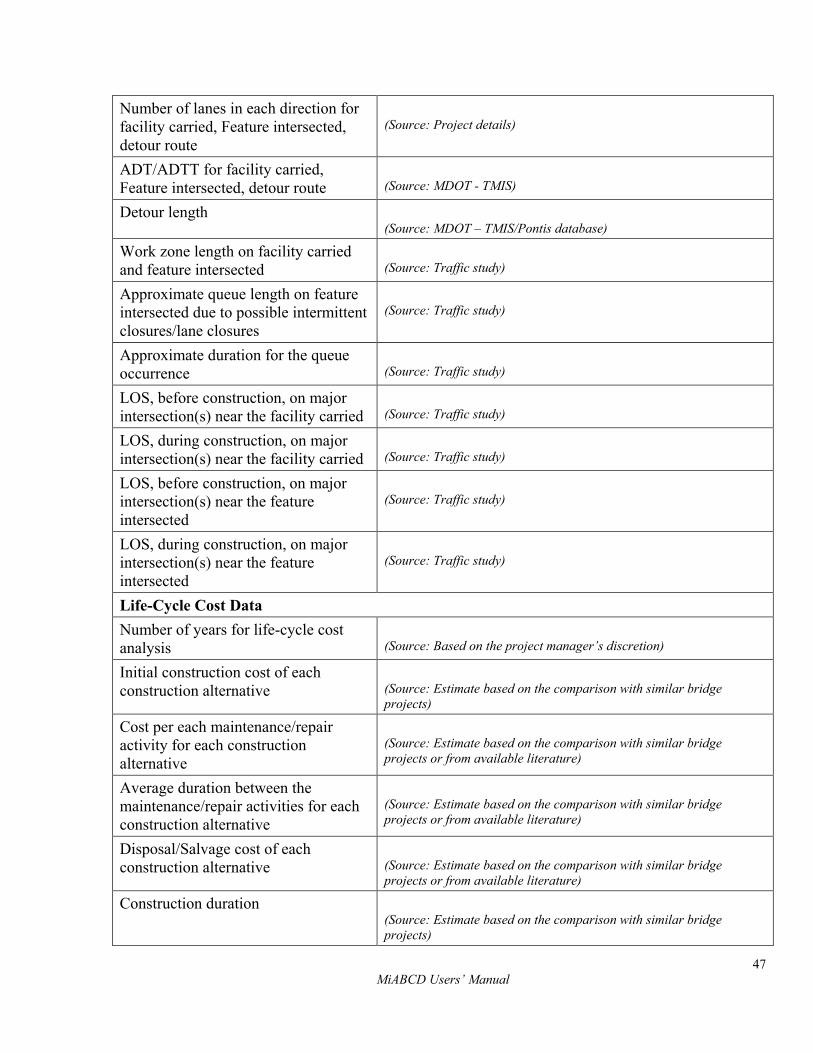
47 MiABCD Users’ Manual
Number of lanes in each direction for facility carried, Feature intersected, detour route
(Source: Project details)
ADT/ADTT for facility carried, Feature intersected, detour route
(Source: MDOT - TMIS)
Detour length (Source: MDOT – TMIS/Pontis database)
Work zone length on facility carried and feature intersected
(Source: Traffic study)
Approximate queue length on feature intersected due to possible intermittent closures/lane closures
(Source: Traffic study)
Approximate duration for the queue occurrence
(Source: Traffic study)
LOS, before construction, on major intersection(s) near the facility carried
(Source: Traffic study)
LOS, during construction, on major intersection(s) near the facility carried
(Source: Traffic study)
LOS, before construction, on major intersection(s) near the feature intersected
(Source: Traffic study)
LOS, during construction, on major intersection(s) near the feature intersected
(Source: Traffic study)
Life-Cycle Cost Data Number of years for life-cycle cost analysis
(Source: Based on the project manager’s discretion)
Initial construction cost of each construction alternative
(Source: Estimate based on the comparison with similar bridge projects)
Cost per each maintenance/repair activity for each construction alternative
(Source: Estimate based on the comparison with similar bridge projects or from available literature)
Average duration between the maintenance/repair activities for each construction alternative
(Source: Estimate based on the comparison with similar bridge projects or from available literature)
Disposal/Salvage cost of each construction alternative
(Source: Estimate based on the comparison with similar bridge projects or from available literature)
Construction duration (Source: Estimate based on the comparison with similar bridge projects)
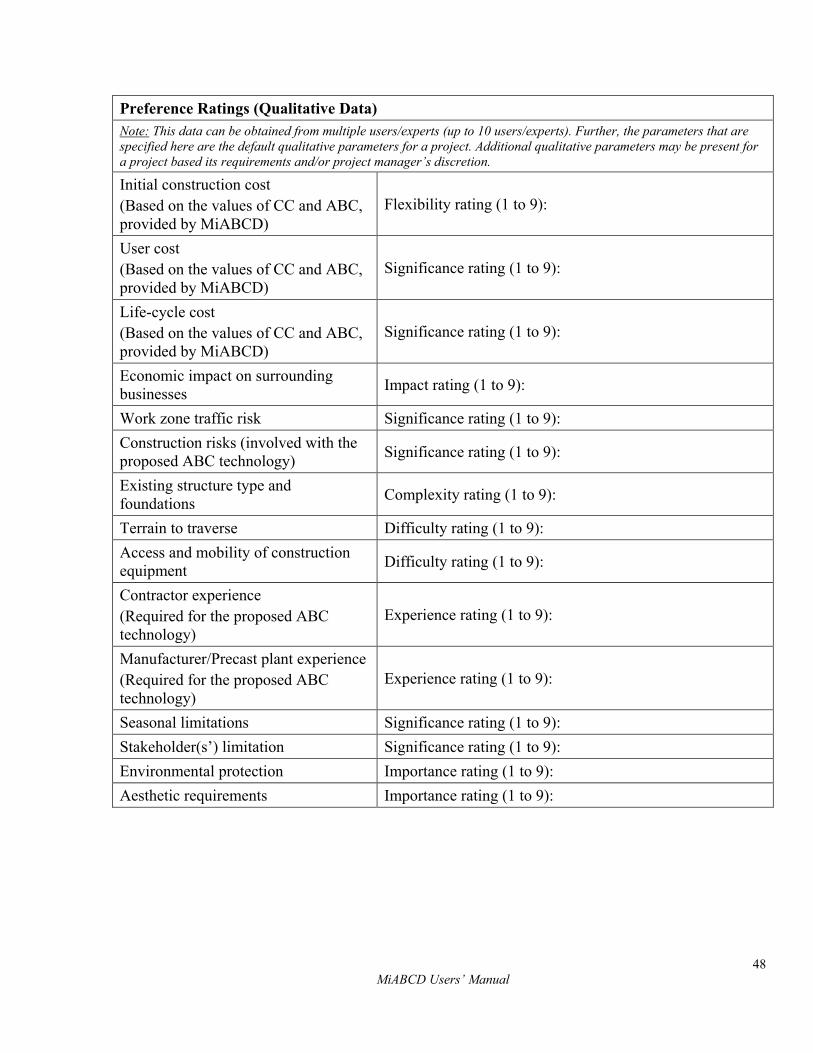
48 MiABCD Users’ Manual
Preference Ratings (Qualitative Data) Note: This data can be obtained from multiple users/experts (up to 10 users/experts). Further, the parameters that are specified here are the default qualitative parameters for a project. Additional qualitative parameters may be present for a project based its requirements and/or project manager’s discretion. Initial construction cost (Based on the values of CC and ABC, provided by MiABCD)
Flexibility rating (1 to 9):
User cost (Based on the values of CC and ABC, provided by MiABCD)
Significance rating (1 to 9):
Life-cycle cost (Based on the values of CC and ABC, provided by MiABCD)
Significance rating (1 to 9):
Economic impact on surrounding businesses Impact rating (1 to 9):
Work zone traffic risk Significance rating (1 to 9): Construction risks (involved with the proposed ABC technology) Significance rating (1 to 9):
Existing structure type and foundations Complexity rating (1 to 9):
Terrain to traverse Difficulty rating (1 to 9): Access and mobility of construction equipment Difficulty rating (1 to 9):
Contractor experience (Required for the proposed ABC technology)
Experience rating (1 to 9):
Manufacturer/Precast plant experience (Required for the proposed ABC technology)
Experience rating (1 to 9):
Seasonal limitations Significance rating (1 to 9): Stakeholder(s’) limitation Significance rating (1 to 9): Environmental protection Importance rating (1 to 9): Aesthetic requirements Importance rating (1 to 9):
49 MiABCD Users’ Manual
APPENDIX – EB
EXAMPLE DECISION-MAKING EVALUATION USING MIABCD
To demonstrate the decision-making model process, as an example, the Stadium Drive Bridge
project in Kalamazoo, Michigan is utilized. The bridge carries Stadium Drive (I-94 BR) over US
131 in Kalamazoo County, Michigan. The authors were familiar with the project site and its details;
thus, the decision-making model was implemented to evaluate among CC and ABC, as the
construction alternatives.
For the Stadium Drive Bridge, the site-specific data, traffic data, and life-cycle cost data (shown in
Table B1) were obtained from the project engineer and other resources. The life-cycle cost data,
such as initial construction cost and construction duration for each construction alternative, is
estimated based on comparison with similar bridge project reported in the literature and Parkview
bridge data. The rehabilitation/repair cost and disposal/salvage cost for each construction alternative
is estimated based on information from Bonstedt (2010) and Issa et al. (1995). The ABC
disposal/salvage cost is negative because a remaining life of 25 years is expected at the end of life-
cycle analysis period (i.e., 75 years Bonstedt (2010). The preference ratings were obtained from
three users as shown in Table B2.
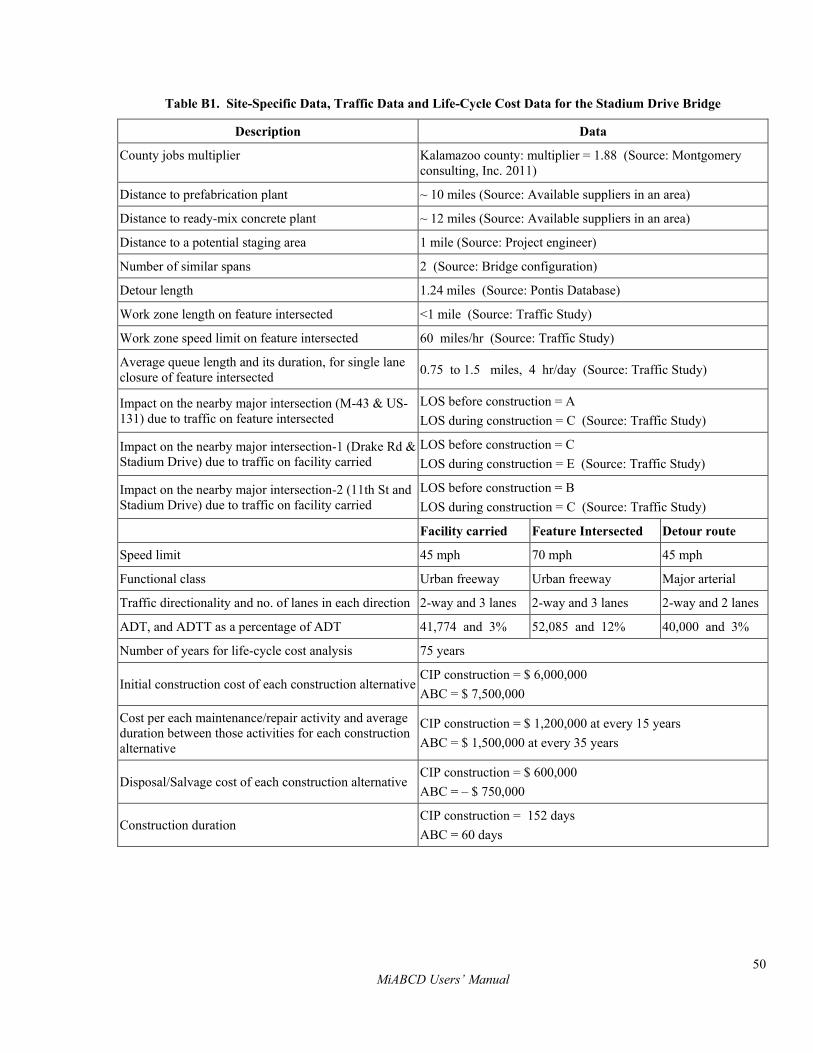
50 MiABCD Users’ Manual
Table B1. Site-Specific Data, Traffic Data and Life-Cycle Cost Data for the Stadium Drive Bridge
Description Data
County jobs multiplier Kalamazoo county: multiplier = 1.88 (Source: Montgomery consulting, Inc. 2011)
Distance to prefabrication plant ~ 10 miles (Source: Available suppliers in an area)
Distance to ready-mix concrete plant ~ 12 miles (Source: Available suppliers in an area)
Distance to a potential staging area 1 mile (Source: Project engineer)
Number of similar spans 2 (Source: Bridge configuration)
Detour length 1.24 miles (Source: Pontis Database)
Work zone length on feature intersected <1 mile (Source: Traffic Study)
Work zone speed limit on feature intersected 60 miles/hr (Source: Traffic Study)
Average queue length and its duration, for single lane closure of feature intersected 0.75 to 1.5 miles, 4 hr/day (Source: Traffic Study)
Impact on the nearby major intersection (M-43 & US-131) due to traffic on feature intersected
LOS before construction = A LOS during construction = C (Source: Traffic Study)
Impact on the nearby major intersection-1 (Drake Rd & Stadium Drive) due to traffic on facility carried
LOS before construction = C LOS during construction = E (Source: Traffic Study)
Impact on the nearby major intersection-2 (11th St and Stadium Drive) due to traffic on facility carried
LOS before construction = B LOS during construction = C (Source: Traffic Study)
Facility carried Feature Intersected Detour route
Speed limit 45 mph 70 mph 45 mph
Functional class Urban freeway Urban freeway Major arterial
Traffic directionality and no. of lanes in each direction 2-way and 3 lanes 2-way and 3 lanes 2-way and 2 lanes
ADT, and ADTT as a percentage of ADT 41,774 and 3% 52,085 and 12% 40,000 and 3%
Number of years for life-cycle cost analysis 75 years
Initial construction cost of each construction alternative CIP construction = $ 6,000,000 ABC = $ 7,500,000
Cost per each maintenance/repair activity and average duration between those activities for each construction alternative
CIP construction = $ 1,200,000 at every 15 years ABC = $ 1,500,000 at every 35 years
Disposal/Salvage cost of each construction alternative CIP construction = $ 600,000 ABC = – $ 750,000
Construction duration CIP construction = 152 days ABC = 60 days
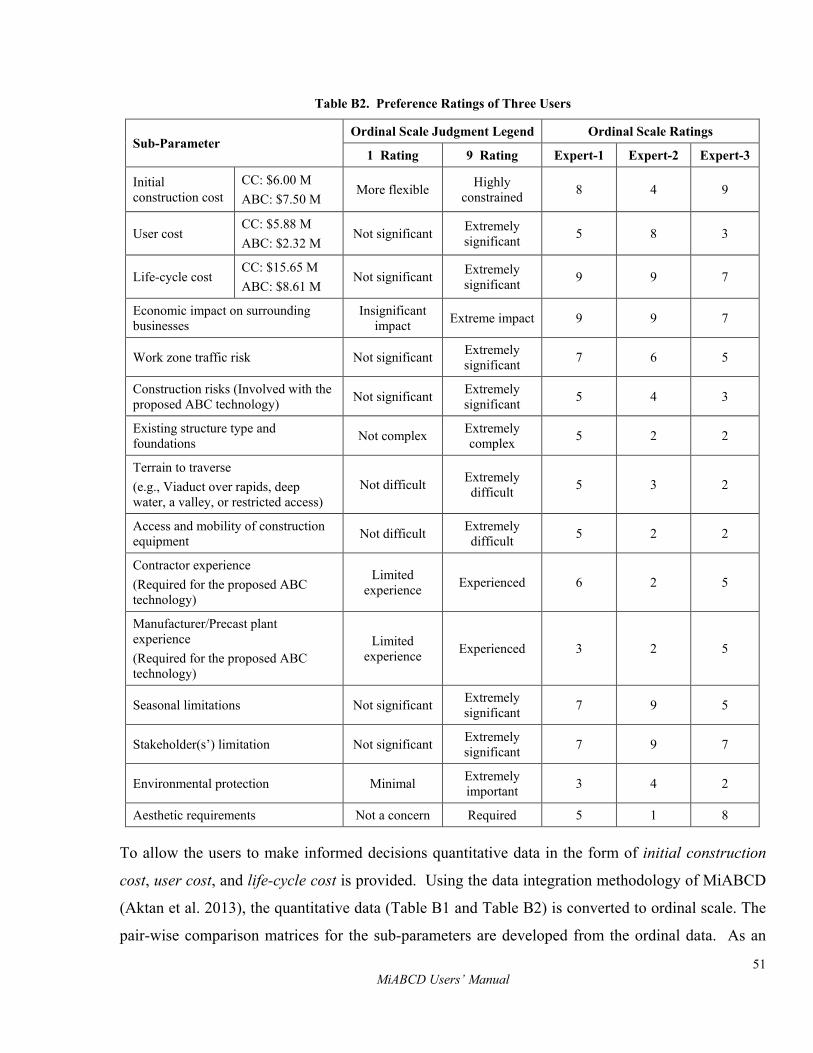
51 MiABCD Users’ Manual
Table B2. Preference Ratings of Three Users
Sub-Parameter Ordinal Scale Judgment Legend Ordinal Scale Ratings
1 Rating 9 Rating Expert-1 Expert-2 Expert-3
Initial construction cost
CC: $6.00 M ABC: $7.50 M
More flexible Highly constrained 8 4 9
User cost CC: $5.88 M ABC: $2.32 M
Not significant Extremely significant 5 8 3
Life-cycle cost CC: $15.65 M ABC: $8.61 M
Not significant Extremely significant 9 9 7
Economic impact on surrounding businesses
Insignificant impact Extreme impact 9 9 7
Work zone traffic risk Not significant Extremely significant 7 6 5
Construction risks (Involved with the proposed ABC technology) Not significant Extremely
significant 5 4 3
Existing structure type and foundations Not complex Extremely
complex 5 2 2
Terrain to traverse (e.g., Viaduct over rapids, deep water, a valley, or restricted access)
Not difficult Extremely difficult 5 3 2
Access and mobility of construction equipment Not difficult Extremely
difficult 5 2 2
Contractor experience (Required for the proposed ABC technology)
Limited experience Experienced 6 2 5
Manufacturer/Precast plant experience (Required for the proposed ABC technology)
Limited experience Experienced 3 2 5
Seasonal limitations Not significant Extremely significant 7 9 5
Stakeholder(s’) limitation Not significant Extremely significant 7 9 7
Environmental protection Minimal Extremely important 3 4 2
Aesthetic requirements Not a concern Required 5 1 8
To allow the users to make informed decisions quantitative data in the form of initial construction
cost, user cost, and life-cycle cost is provided. Using the data integration methodology of MiABCD
(Aktan et al. 2013), the quantitative data (Table B1 and Table B2) is converted to ordinal scale. The
pair-wise comparison matrices for the sub-parameters are developed from the ordinal data. As an
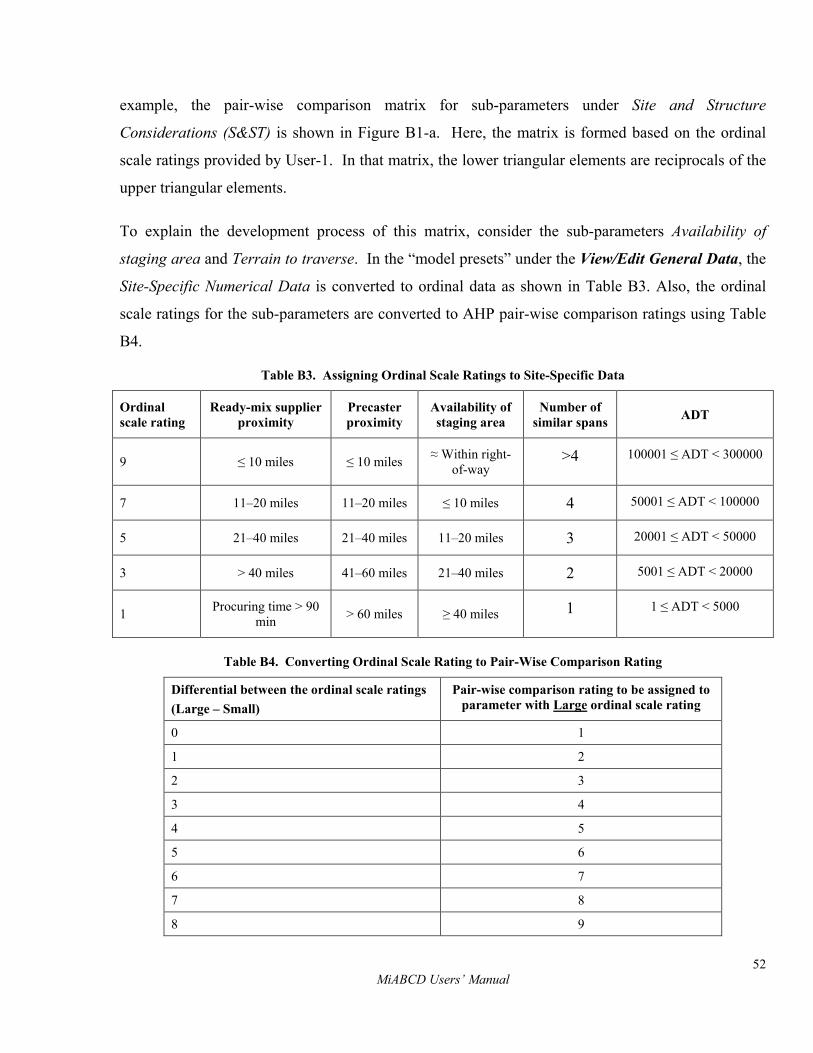
52 MiABCD Users’ Manual
example, the pair-wise comparison matrix for sub-parameters under Site and Structure
Considerations (S&ST) is shown in Figure B1-a. Here, the matrix is formed based on the ordinal
scale ratings provided by User-1. In that matrix, the lower triangular elements are reciprocals of the
upper triangular elements.
To explain the development process of this matrix, consider the sub-parameters Availability of
staging area and Terrain to traverse. In the “model presets” under the View/Edit General Data, the
Site-Specific Numerical Data is converted to ordinal data as shown in Table B3. Also, the ordinal
scale ratings for the sub-parameters are converted to AHP pair-wise comparison ratings using Table
B4.
Table B3. Assigning Ordinal Scale Ratings to Site-Specific Data
Ordinal scale rating
Ready-mix supplier proximity
Precaster proximity
Availability of staging area
Number of similar spans ADT
9 ≤ 10 miles ≤ 10 miles ≈ Within right-of-way
>4 100001 ≤ ADT < 300000
7 11–20 miles 11–20 miles ≤ 10 miles 4 50001 ≤ ADT < 100000
5 21–40 miles 21–40 miles 11–20 miles 3 20001 ≤ ADT < 50000
3 > 40 miles 41–60 miles 21–40 miles 2 5001 ≤ ADT < 20000
1 Procuring time > 90 min > 60 miles ≥ 40 miles 1 1 ≤ ADT < 5000
Table B4. Converting Ordinal Scale Rating to Pair-Wise Comparison Rating
Differential between the ordinal scale ratings (Large – Small)
Pair-wise comparison rating to be assigned to parameter with Large ordinal scale rating
0 1
1 2
2 3
3 4
4 5
5 6
6 7
7 8
8 9
53 MiABCD Users’ Manual
From the site-specific data, the Availability of staging area will receive an ordinal scale rating of 7
(refer Table B1 row-4 and Table B3 row-2), and Terrain to traverse was assigned an ordinal rating
of 5 by User-1. Using Table B4, a pair-wise comparison rating of 3 is assigned to Availability of
staging area and the reciprocal rating 1/3 is assigned to Terrain to traverse. In a similar manner, the
pair-wise comparison matrix is compiled for S&ST. Similarly, the matrices for sub-parameters
under Cost, Work Zone Mobility (WZM), Technical Feasibility and Risk (TF&R), Environmental
Considerations (EC), and Seasonal Constraints and Project Schedule (SC&PS) are developed.
These matrices represent the first set of pair-wise comparison matrices of the AHP.
The second set of AHP matrices are the sub-parameter pair-wise comparison matrices of
construction alternatives. These are developed using the ordinal scale ratings of each sub-parameter
and considering the relation between sub-parameters and construction alternatives as shown Table
B5. As an example, the pair-wise comparison matrix for construction alternatives for Terrain to
traverse is shown in Figure B1-b. Here, the sub-parameter with increased preference favors CC
(Table B5); therefore, the ordinal scale rating of 5 (i.e., assigned by User-1) is the pair-wise
comparison rating for CC, and the reciprocal rating 1/5 is for ABC. In a similar fashion, the
construction alternative pair-wise comparison matrices are developed for the remainder of the sub-
parameters.
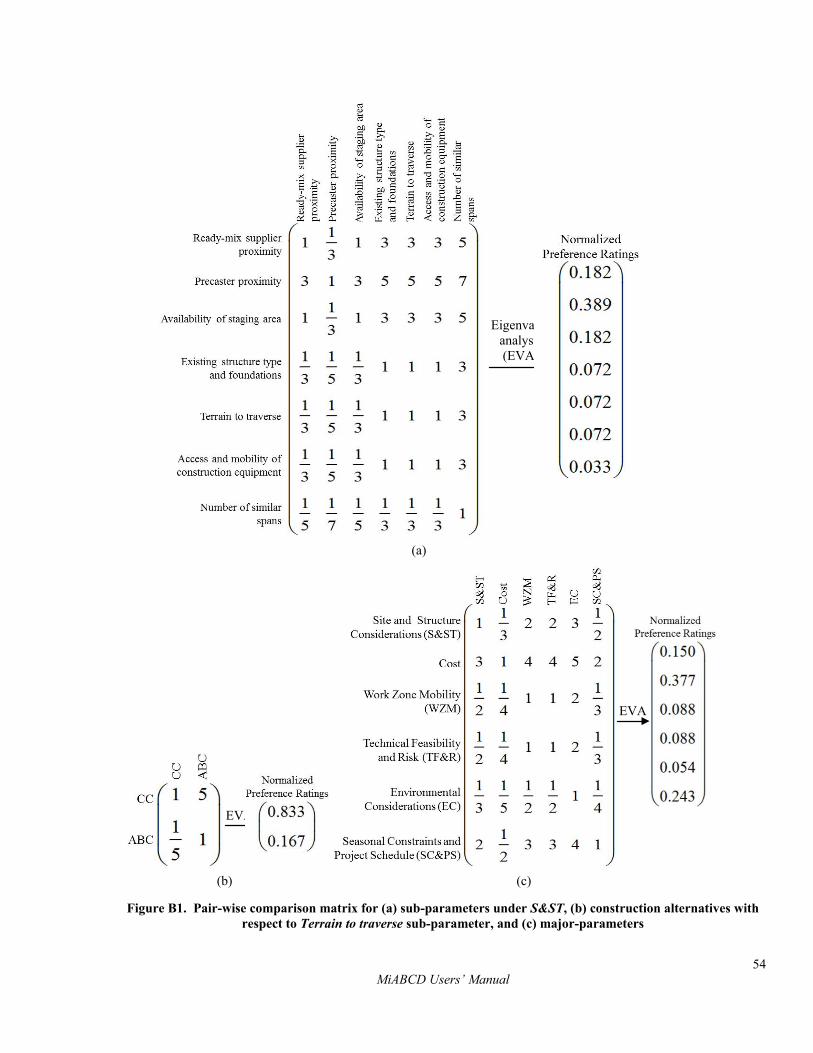
54 MiABCD Users’ Manual
(a)
(b)
(c)
Figure B1. Pair-wise comparison matrix for (a) sub-parameters under S&ST, (b) construction alternatives with respect to Terrain to traverse sub-parameter, and (c) major-parameters
Eigenvalue analysis (EVA)
EVA
EVA
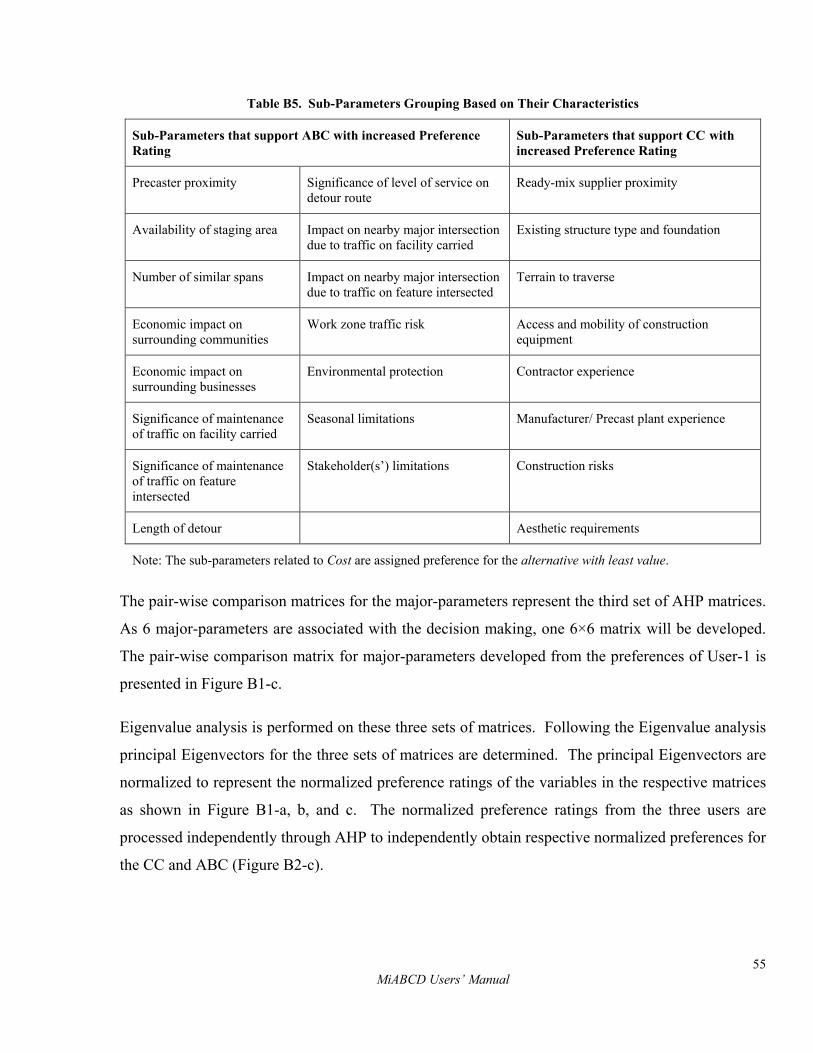
55 MiABCD Users’ Manual
Table B5. Sub-Parameters Grouping Based on Their Characteristics
Sub-Parameters that support ABC with increased Preference Rating
Sub-Parameters that support CC with increased Preference Rating
Precaster proximity Significance of level of service on detour route
Ready-mix supplier proximity
Availability of staging area Impact on nearby major intersection due to traffic on facility carried
Existing structure type and foundation
Number of similar spans Impact on nearby major intersection due to traffic on feature intersected
Terrain to traverse
Economic impact on surrounding communities
Work zone traffic risk Access and mobility of construction equipment
Economic impact on surrounding businesses
Environmental protection Contractor experience
Significance of maintenance of traffic on facility carried
Seasonal limitations Manufacturer/ Precast plant experience
Significance of maintenance of traffic on feature intersected
Stakeholder(s’) limitations Construction risks
Length of detour Aesthetic requirements
Note: The sub-parameters related to Cost are assigned preference for the alternative with least value.
The pair-wise comparison matrices for the major-parameters represent the third set of AHP matrices.
As 6 major-parameters are associated with the decision making, one 6×6 matrix will be developed.
The pair-wise comparison matrix for major-parameters developed from the preferences of User-1 is
presented in Figure B1-c.
Eigenvalue analysis is performed on these three sets of matrices. Following the Eigenvalue analysis
principal Eigenvectors for the three sets of matrices are determined. The principal Eigenvectors are
normalized to represent the normalized preference ratings of the variables in the respective matrices
as shown in Figure B1-a, b, and c. The normalized preference ratings from the three users are
processed independently through AHP to independently obtain respective normalized preferences for
the CC and ABC (Figure B2-c).
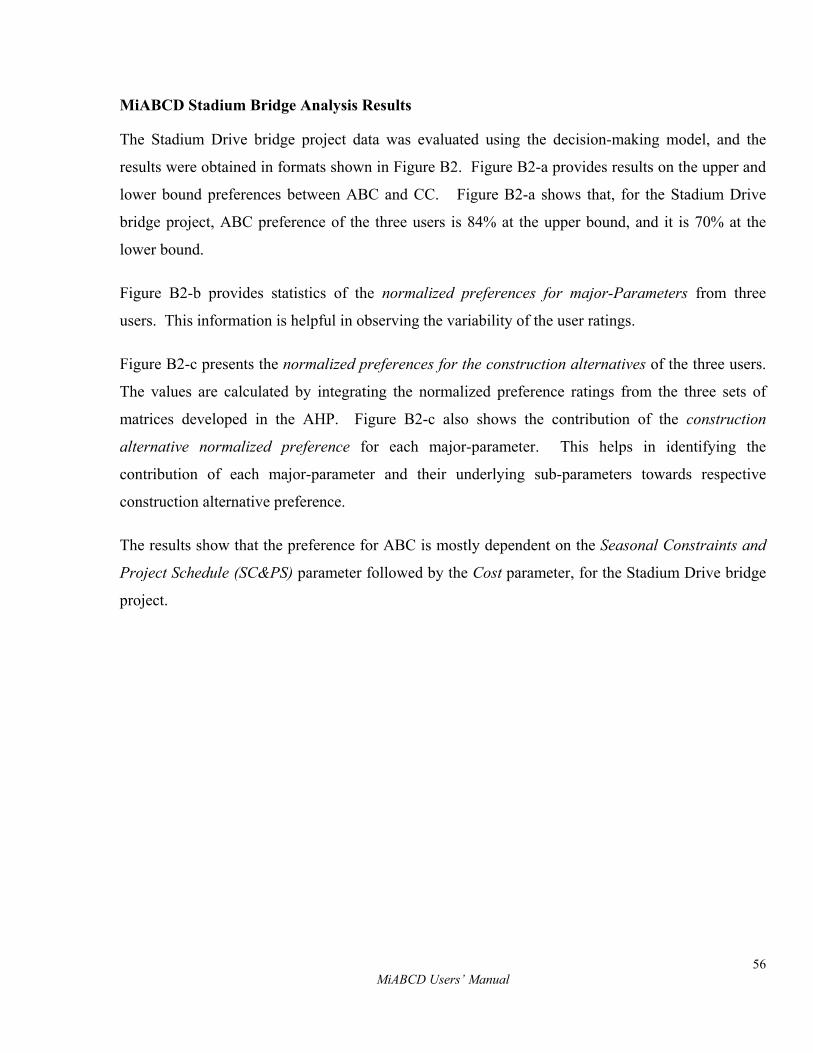
56 MiABCD Users’ Manual
MiABCD Stadium Bridge Analysis Results
The Stadium Drive bridge project data was evaluated using the decision-making model, and the
results were obtained in formats shown in Figure B2. Figure B2-a provides results on the upper and
lower bound preferences between ABC and CC. Figure B2-a shows that, for the Stadium Drive
bridge project, ABC preference of the three users is 84% at the upper bound, and it is 70% at the
lower bound.
Figure B2-b provides statistics of the normalized preferences for major-Parameters from three
users. This information is helpful in observing the variability of the user ratings.
Figure B2-c presents the normalized preferences for the construction alternatives of the three users.
The values are calculated by integrating the normalized preference ratings from the three sets of
matrices developed in the AHP. Figure B2-c also shows the contribution of the construction
alternative normalized preference for each major-parameter. This helps in identifying the
contribution of each major-parameter and their underlying sub-parameters towards respective
construction alternative preference.
The results show that the preference for ABC is mostly dependent on the Seasonal Constraints and
Project Schedule (SC&PS) parameter followed by the Cost parameter, for the Stadium Drive bridge
project.
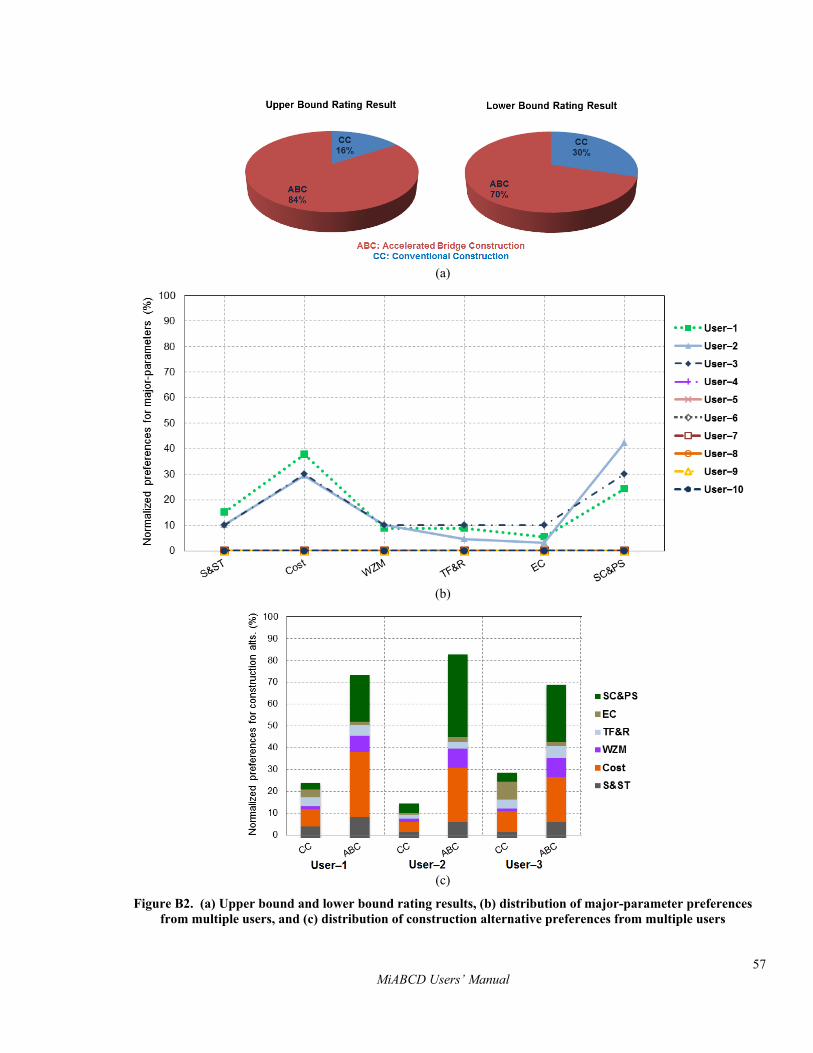
57 MiABCD Users’ Manual
(a)
(b)
(c)
Figure B2. (a) Upper bound and lower bound rating results, (b) distribution of major-parameter preferences from multiple users, and (c) distribution of construction alternative preferences from multiple users
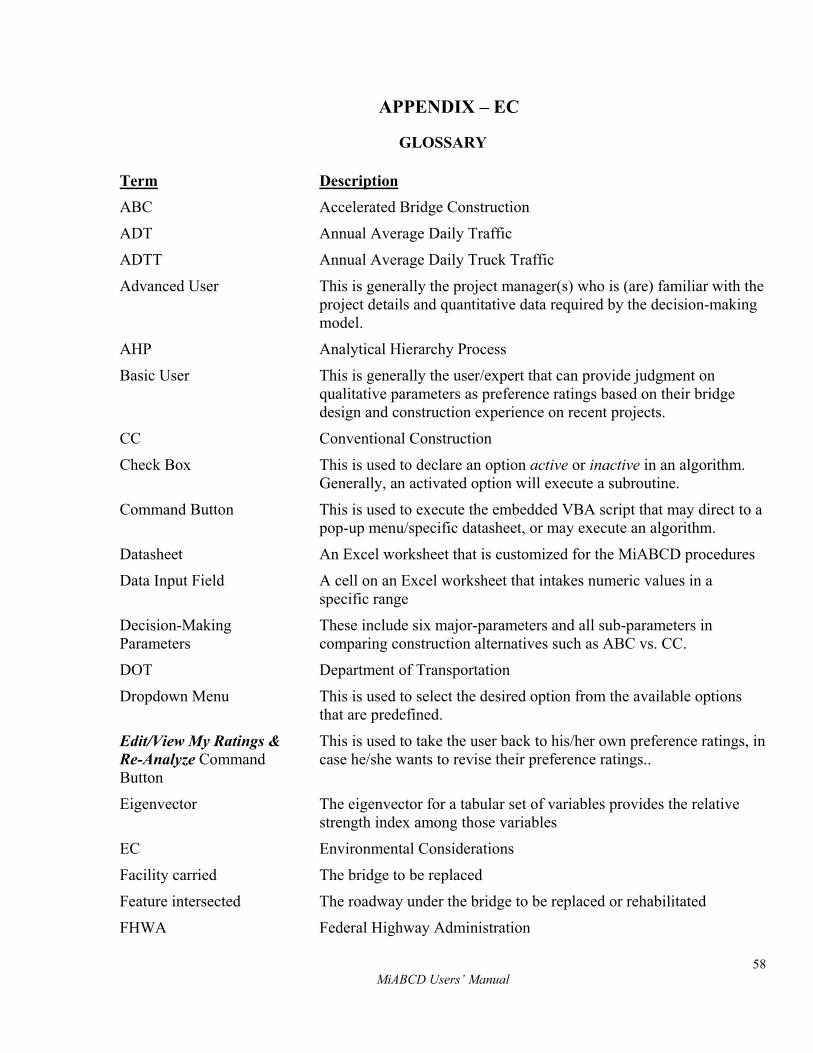
58 MiABCD Users’ Manual
APPENDIX – EC
GLOSSARY
Term Description ABC Accelerated Bridge Construction
ADT Annual Average Daily Traffic
ADTT Annual Average Daily Truck Traffic
Advanced User This is generally the project manager(s) who is (are) familiar with the project details and quantitative data required by the decision-making model.
AHP Analytical Hierarchy Process
Basic User This is generally the user/expert that can provide judgment on qualitative parameters as preference ratings based on their bridge design and construction experience on recent projects.
CC Conventional Construction
Check Box This is used to declare an option active or inactive in an algorithm. Generally, an activated option will execute a subroutine.
Command Button This is used to execute the embedded VBA script that may direct to a pop-up menu/specific datasheet, or may execute an algorithm.
Datasheet An Excel worksheet that is customized for the MiABCD procedures
Data Input Field A cell on an Excel worksheet that intakes numeric values in a specific range
Decision-Making Parameters
These include six major-parameters and all sub-parameters in comparing construction alternatives such as ABC vs. CC.
DOT Department of Transportation
Dropdown Menu This is used to select the desired option from the available options that are predefined.
Edit/View My Ratings & Re-Analyze Command Button
This is used to take the user back to his/her own preference ratings, in case he/she wants to revise their preference ratings..
Eigenvector The eigenvector for a tabular set of variables provides the relative strength index among those variables
EC Environmental Considerations
Facility carried The bridge to be replaced
Feature intersected The roadway under the bridge to be replaced or rehabilitated
FHWA Federal Highway Administration

59 MiABCD Users’ Manual
GUI Graphical User Interface
LOS Level of Service
MDOT Michigan Department of Transportation
MOT Maintenance of Traffic
MiABCD Michigan Accelerated Bridge Construction Decision
Model Presets This include predefined tables that define the relationship among the project data, ordinal scale ratings, and the Analytical Hierarchy Process (AHP) pair-wise comparison ratings
Pop-Up Menu A GUI form of the VBA
Question Icon The icon on any pop-up menu or datasheet will provide description of the corresponding “item”
Regional Data This includes wage and cost, county jobs multiplier, material procurement distance classification, traffic data classification, and bridge spans classification
S&ST Site and Structure Considerations
SC&PS Seasonal Constraints and Project Schedule
Tab This is used to switch between different criteria, such as in MiABCD the tabs allow switching between the major-parameters on a pop-up menu
Text Field This is used to input text, such as sub-parameter name, etc., that will be transferred to a corresponding datasheet
TF&R Technical Feasibility and Risk
VBA Visual Basic for Applications
WZM Work Zone Mobility