Embed Size (px)
Citation preview
Regional Wet Weather Characterization Program Final Monitoring Report
Appendix D
City of Fort Worth
2010 Bioassessment Report

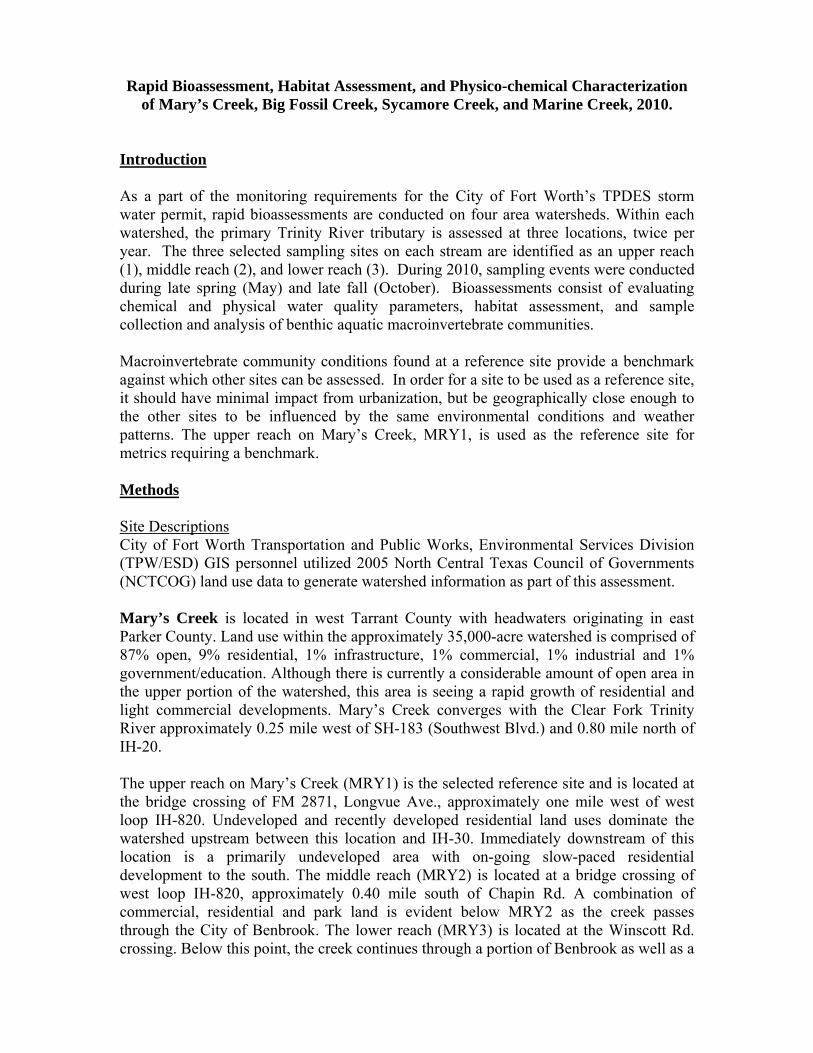
Rapid Bioassessment, Habitat Assessment, and Physico-chemical Characterization of Mary’s Creek, Big Fossil Creek, Sycamore Creek, and Marine Creek, 2010.
Introduction As a part of the monitoring requirements for the City of Fort Worth’s TPDES storm water permit, rapid bioassessments are conducted on four area watersheds. Within each watershed, the primary Trinity River tributary is assessed at three locations, twice per year. The three selected sampling sites on each stream are identified as an upper reach (1), middle reach (2), and lower reach (3). During 2010, sampling events were conducted during late spring (May) and late fall (October). Bioassessments consist of evaluating chemical and physical water quality parameters, habitat assessment, and sample collection and analysis of benthic aquatic macroinvertebrate communities. Macroinvertebrate community conditions found at a reference site provide a benchmark against which other sites can be assessed. In order for a site to be used as a reference site, it should have minimal impact from urbanization, but be geographically close enough to the other sites to be influenced by the same environmental conditions and weather patterns. The upper reach on Mary’s Creek, MRY1, is used as the reference site for metrics requiring a benchmark. Methods Site Descriptions City of Fort Worth Transportation and Public Works, Environmental Services Division (TPW/ESD) GIS personnel utilized 2005 North Central Texas Council of Governments (NCTCOG) land use data to generate watershed information as part of this assessment. Mary’s Creek is located in west Tarrant County with headwaters originating in east Parker County. Land use within the approximately 35,000-acre watershed is comprised of 87% open, 9% residential, 1% infrastructure, 1% commercial, 1% industrial and 1% government/education. Although there is currently a considerable amount of open area in the upper portion of the watershed, this area is seeing a rapid growth of residential and light commercial developments. Mary’s Creek converges with the Clear Fork Trinity River approximately 0.25 mile west of SH-183 (Southwest Blvd.) and 0.80 mile north of IH-20. The upper reach on Mary’s Creek (MRY1) is the selected reference site and is located at the bridge crossing of FM 2871, Longvue Ave., approximately one mile west of west loop IH-820. Undeveloped and recently developed residential land uses dominate the watershed upstream between this location and IH-30. Immediately downstream of this location is a primarily undeveloped area with on-going slow-paced residential development to the south. The middle reach (MRY2) is located at a bridge crossing of west loop IH-820, approximately 0.40 mile south of Chapin Rd. A combination of commercial, residential and park land is evident below MRY2 as the creek passes through the City of Benbrook. The lower reach (MRY3) is located at the Winscott Rd. crossing. Below this point, the creek continues through a portion of Benbrook as well as a
private golf course and residential area prior to its convergence with the Clear Fork Trinity River. Big Fossil Creek begins in northwest Tarrant County and flows southeast through north Fort Worth between the cities of Haslet and Saginaw. The 40,000-acre watershed includes land uses of approximately 59% open, 27% residential, 4% industrial, 3% government/education, 3% commercial, 3% water, and 1% infrastructure. Much of the currently undeveloped land in the upper portions of this watershed is slated for development or is currently under construction. The majority of development in this area is single family residential with supporting retail centers. The confluence of Big Fossil Creek with the West Fork Trinity River is approximately one mile west of east loop IH-820 and 1.3 miles north of IH-30. The upper reach on Big Fossil Creek (BFC1) is located west of Pepperidge Ln., east of the city of Saginaw and approximately one mile downstream of Walnut Lake. Much of the watershed upstream of BFC1 is rural or undeveloped while downstream is an area of single-family residential development. The middle reach (BFC2) is located north of Western Center Blvd. at the IH-35W crossing. Below BFC2, the watershed is fully developed with land uses including residential, commercial, and industrial. The lower reach (BFC3) is located at Beach St., north of Fossil Creek Blvd. Below this point, the creek flows through the cities of Haltom City, North Richland Hills and Richland Hills before converging with Little Fossil Creek and the West Fork Trinity River. Sycamore Creek begins in south Fort Worth and flows to the northeast through the south central part of the city. The watershed covers approximately 22,000 acres including land uses of 40% open, 37% residential, 7% government/education, 7% industrial, 4% commercial, 4% water, and 1% infrastructure. The confluence of Sycamore Creek with the West Fork Trinity River is located approximately 1.5 miles east of IH-35W, 0.25 mile north of IH-30 and 0.25 mile west of Beach St. The upper reach on Sycamore Creek (SYC1) is located at the intersection of southeast loop IH-820 and IH-35W approximately 0.75 mile north of Altamesa Blvd. The developed portion of the watershed upstream of this location is a mix of residential, commercial, and industrial uses. Downstream of SYC1, Sycamore Creek drains an area of residential, commercial, industrial and park land uses. The middle reach (SYC2) is located in Cobb Park south of SH-287. Below SYC2, the watershed is developed with a mix of residential, commercial, and industrial land uses. The lower reach (SYC3) is located approximately 0.40 mile west of Beach St. at the dead end of Scott Ave. Sycamore Creek flows from this point approximately 0.30 mile north to its confluence with the West Fork Trinity River. Marine Creek originates in northwest Fort Worth and flows south for approximately 3 miles before it joins with an unnamed tributary to form Marine Creek Lake. Marine Creek Lake, which is owned and operated by the Tarrant Regional Water District (TRWD), is located northwest of IH-820 between the cities of Lake Worth and Saginaw. From the containment dam on the south side of Marine Creek Lake, Marine Creek flows southeast through northwest Fort Worth until it enters the West Fork Trinity River near Samuels Ave. The Marine Creek watershed includes approximately 14,000 acres with
land uses including 55% open, 22% residential, 7.5% water, 5% airports, 4% government/education, 3% industrial, 2% infrastructure, and 1.5% commercial. Within the Marine Creek watershed, the upper reach (MAR1) is located at the Angle Ave. crossing in Buck Sansom Park. Marine Creek meanders through undeveloped land and a city park below MAR1. The middle reach (MAR2) is located north of the NW 28th
St. bridge in Lincoln Park. Surrounding watershed influences above MAR2 include single-family residential and runoff from Meacham International Airport. Potential commercial impacts, including the Fort Worth Stockyards National Historic District, increase in the lower reach (MAR3). MAR3 is accessed through Saunders Park on the south end of the Fort Worth Stockyards and north of the NE 23rd St. bridge crossing. Marine Creek flows approximately 0.45 mile southeast from this point to its confluence with the West Fork Trinity River. Habitat Assessments and Water Quality Characterization Chemical and physical parameters collected and analyzed with portable meters include pH, dissolved oxygen, turbidity, specific conductance, water temperature and air temperature. Colorimetric test kits were used to analyze nutrient concentrations of ammonia-nitrogen, phosphate, and nitrate-nitrogen. Escherichia coli bacteria sampling was included at all sites during the 2010 sampling. E. coli samples were processed in the City of Fort Worth’s TPW/ESD storm water lab according to the current Standard Operating Procedures (SOP). Habitat assessment is an integral part of bioassessment as it aids in the interpretation of differences in community composition and provides characterization of the ability of a stream to support aquatic life. Physical stream habitat characteristics such as surrounding land use, amount of stream side riparian cover, channel alteration, and substrate characteristics can strongly affect the benthic macroinvertebrate community assemblage. When physical habitat is similar between the reference site and sample site, water quality parameters are considered when determining stress causation to biological communities. Habitat assessments were performed at each site following guidelines for high gradient streams in Chapter 5 of USEPA’s Rapid Bioassessment Protocols for Use in Streams and Wadeable Rivers, Second Edition1. This assessment includes scoring 10 different habitat factors with available scores ranging from 0 to 20, with 0 representing poor conditions and 20 representing optimal habitat. Parameters evaluated in habitat assessments include bottom substrate and available cover suitability for colonization, embeddedness, flow regimes present, bottom scouring and sediment deposition, channel alteration and flow status, frequency of riffles or bends, stream bank stability, vegetative protection and riparian vegetative zone width. Individual scores for these 10 factors are totaled to produce the overall habitat score.
1 Barbour, M.T., J. Gerritsen, B.D. Snyder, and J.B. Stribling. 1999. Rapid Bioassessment Protocols for Use in Streams and Wadeable Rivers: Periphyton, Benthic Macroinvertebrates and Fish, Second Edition. EPA 841-B-99-002. U.S. Environmental Protection Agency; Office of Water; Washington, D.C.
Bioassessments Rapid bioassessments were performed on all stream sites during two separate sampling events occurring during late spring (May) and fall (October). Macroinvertebrates were collected from riffle areas at each site using Surber samplers, with a 500μm mesh. Bottom substrate within the 12”x12” Surber frame area (0.09m2) was disturbed to dislodge organisms. Three replicate samples were collected within each reach, and individual sample locations were recorded. Collected samples were transferred from the Surber sampler to sample containers and preserved in the field with 95% ethanol. Following transport to an in-house laboratory, macroinvertebrates in the samples were separated from the debris and identified. Most organisms were identified to family level with several noted exceptions. In accordance with the current City of Fort Worth SOP, Chironomidae was identified to sub-family, Turbellaria and Hirudinea were identified to class, and Nematoda was identified to phylum. Macroinvertebrate Data Analysis Two separate methods were used for macroinvertebrate data analysis: the USEPA protocol and the Texas Index of Biotic Integrity (TX-IBI). The USEPA protocol has been used in all previous reports and the TX-IBI has been added to the analysis suite this year. Both methods use a series of community metrics to determine a score for each site. The primary difference in the two methods is in how the score is used to assess stream health. The USEPA protocol uses a comparison of test site scores to the score at a reference site to assess the degree of impairment at the test sites, while the TX-IBI uses a comparison to guidelines established by TCEQ to determine an aquatic life use rating for each site. The USEPA protocol for aquatic macroinvertebrate community data analysis includes eight structural and functional feeding group biometric calculations. Each test site biometric value is then compared to the reference site value, expressed as a percentage: the ratio of test site to reference site for values expected to increase with improving conditions or the ratio of the reference site to the test site for values expected to decrease with improving conditions. The percent comparison is used to assign each test site metric a score based on a predetermined scoring index (the reference site is assigned the highest possible score for each metric). Scores for individual metrics are totaled to calculate an overall site score. Degree of impairment at a site is determined based on percentage comparison of the test site score to the reference score. The TX-IBI methodology is found in the TCEQ’s Surface Water Quality Monitoring Procedures, Volume 22, and utilizes eleven macroinvertebrate community structural and functional metrics for the assessment of biotic integrity. The TX-IBI is a quantitative method designed for use with macroinvertebrates collected with a Surber sampling device, calculating biological metrics with the resulting data, and generating a score for each individual site. Scores generated at each site are compared to values in TCEQ guidelines to determine an aquatic life use rating. This method is included as part of the assessment as it generates an individual value for each site without a direct comparison to the reference site. Accordingly, individual sites may be compared to themselves year to
2 TCEQ, June 2007. Surface Water Quality Monitoring Procedures, Volume 2: Methods for Collecting and Analyzing Biological Assemblage and Habitat Data. TCEQ Surface Water Quality Monitoring Program. TCEQ RG-416. June 2007.
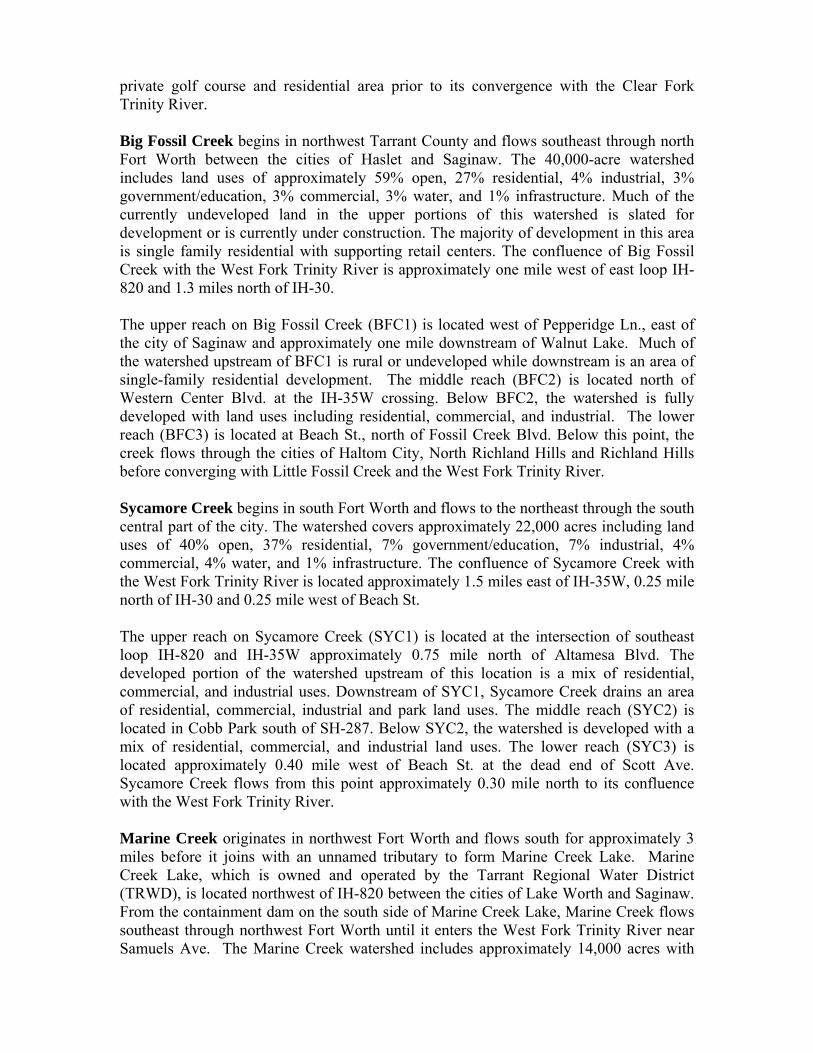
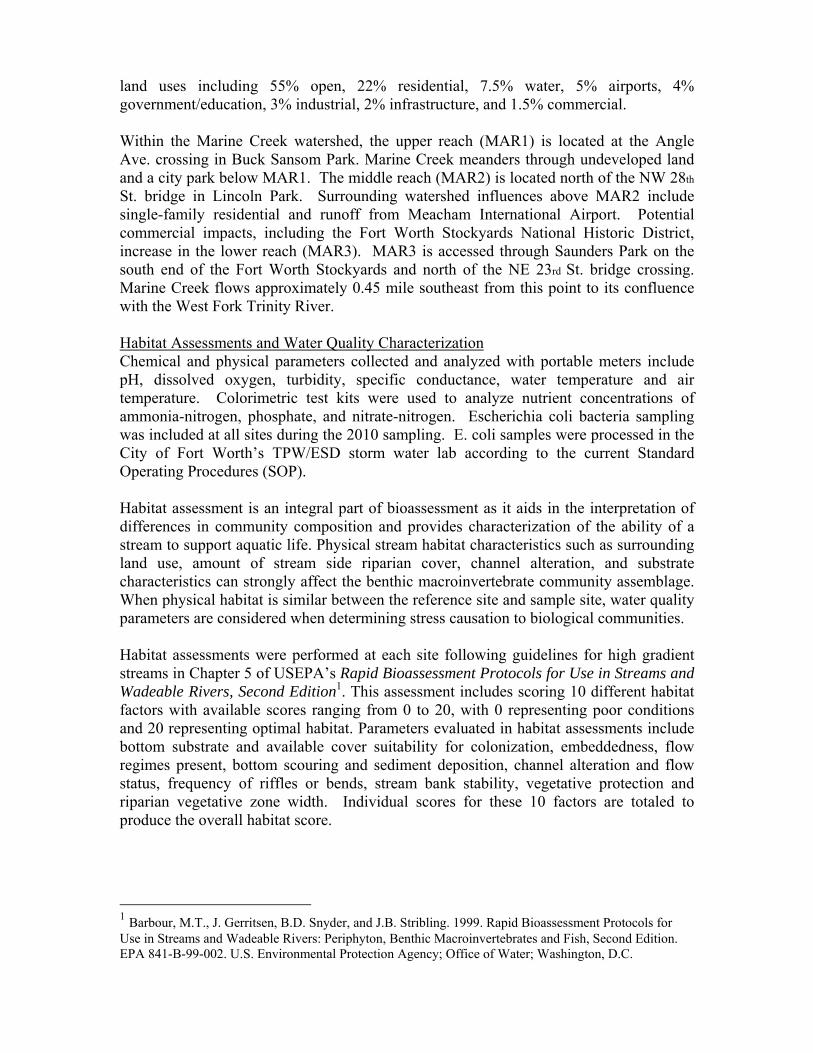
year on a seasonal basis (spring to spring and fall to fall) to demonstrate biological community changes within each reach. Results and Discussion Habitat Assessments and Water Quality Characterization Overall scores for habitat assessments conducted in 2010 are included in Table 1 as well as Figures 1 and 2, with measured physico-chemical parameters presented in Tables 4 and 5. Habitat assessment scores were ranked in the sub-optimal or marginal categories for all sites during both sampling seasons and were within normal habitat score fluctuations for the sites. The middle reach on Sycamore Creek (SYC2) indicated an improved habitat score between the spring (102, marginal) and fall (112, sub-optimal) sampling events, while the lower reaches on Mary’s Creek (MRY3) and Big Fossil Creek (BFC3) showed decreases in the scores between the spring (MRY3:112, sub-optimal; BFC3:123, sub-optimal) and fall (MRY3:102, marginal; BFC3:108, marginal) sampling events. Overall habitat score at SYC2 increased during fall sampling because of higher ratings in the individual parameters of epifaunal substrate/available cover, embeddedness, and sediment deposition. The area may have been scoured of deposited sediments during rain events that occurred between the bioassessment sampling events, allowing for more amenable substrate available for colonization. The decreased habitat score at MRY3 between spring and fall sampling events is attributed to decreased ratings in the individual parameters of epifaunal substrate/available cover, velocity/depth regime, and channel flow status. The overall habitat at MRY3 is primarily bedrock, with small areas of boulder/cobble/gravel. Because bedrock is an unstable habitat, the habitat available for colonization is patchy and changes over time. During fall sampling, areas that were sampled during the spring were either dry, missing, or had very little flow. Measured velocity during fall sampling (0.20 m/s) was less than half the velocity measured during spring sampling (0.41 m/s). The habitat score at BFC3 was lower during the fall sampling event than during the spring sampling events because of the decreased scores in the individual parameters of embeddedness, frequency of riffles or bends, and vegetative protection. The available habitat at BFC3 is characterized by bedrock with patches of boulder/cobble/gravel. During fall sampling, it was observed that the stream had seen a high flow event which removed streamside vegetation and washed part of the available cobble/gravel habitat downstream of the sampling reach. As such, a riffle area sampled in spring no longer exists. Habitat assessment scores at SYC1, MRY2 and BFC2 indicated marginal ratings during both spring and fall. These three sites are located underneath and directly adjacent to interstate highways and the natural channels of the streams at these locations have been altered. The overall marginal ratings result from low scores in the categories of sediment deposition (BFC2), channel alteration, bank stability (MRY2 and SYC1), vegetative protection, and riparian (stream side) vegetative zone width.
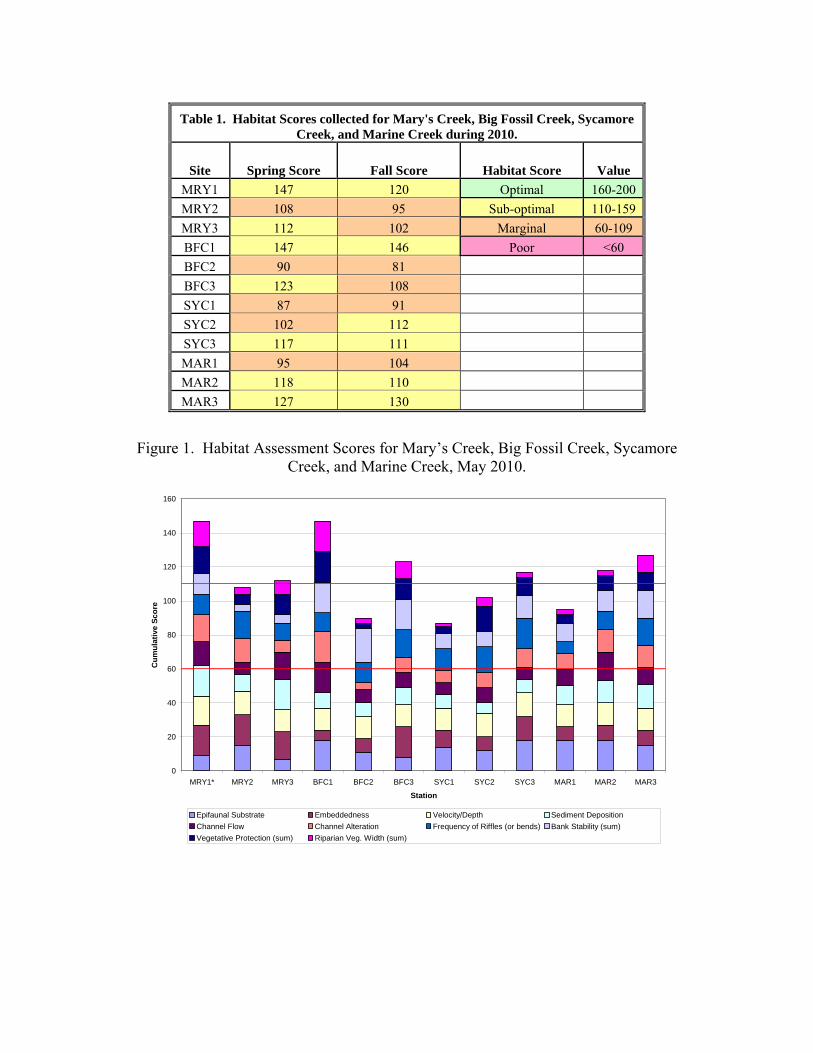
Table 1. Habitat Scores collected for Mary's Creek, Big Fossil Creek, Sycamore Creek, and Marine Creek during 2010.
Site Spring Score Fall Score Habitat Score Value MRY1 147 120 Optimal 160-200 MRY2 108 95 Sub-optimal 110-159 MRY3 112 102 Marginal 60-109 BFC1 147 146 Poor <60 BFC2 90 81 BFC3 123 108 SYC1 87 91 SYC2 102 112 SYC3 117 111 MAR1 95 104 MAR2 118 110 MAR3 127 130
Figure 1. Habitat Assessment Scores for Mary’s Creek, Big Fossil Creek, Sycamore Creek, and Marine Creek, May 2010.
0
20
40
60
80
100
120
140
160
MRY1* MRY2 MRY3 BFC1 BFC2 BFC3 SYC1 SYC2 SYC3 MAR1 MAR2 MAR3
Station
Cum
ulat
ive
Scor
e
Epifaunal Substrate Embeddedness Velocity/Depth Sediment DepositionChannel Flow Channel Alteration Frequency of Riffles (or bends) Bank Stability (sum)Vegetative Protection (sum) Riparian Veg. Width (sum)
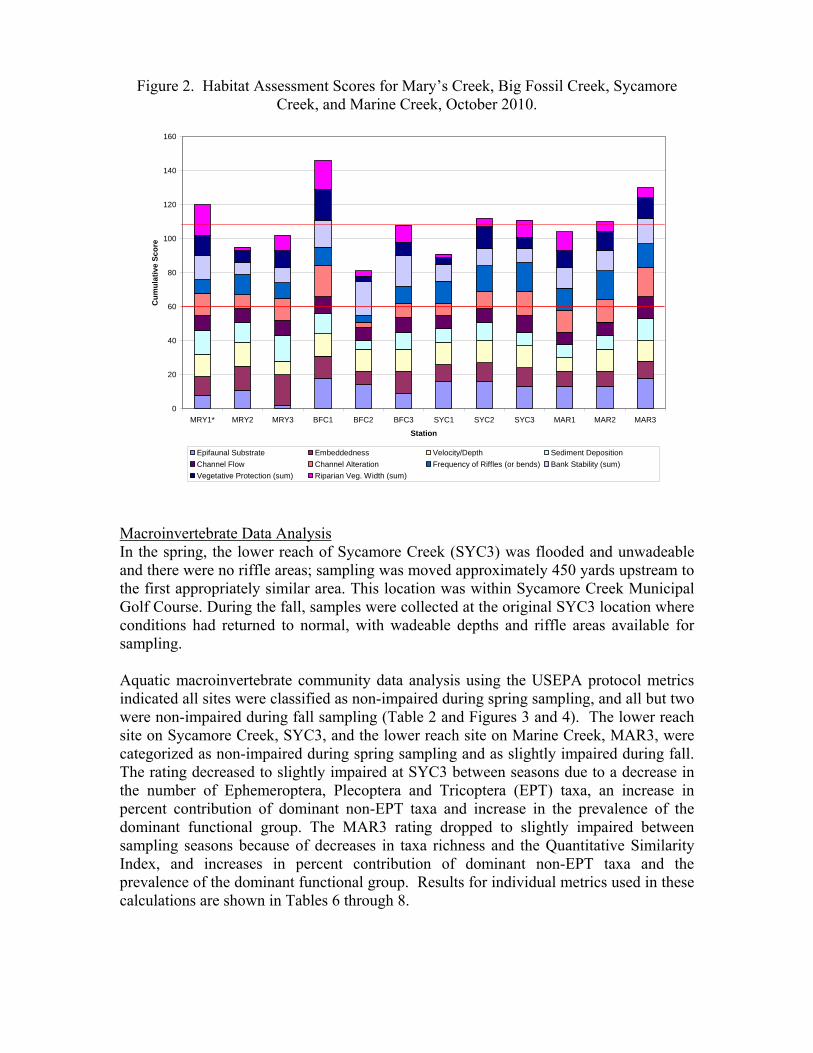
Figure 2. Habitat Assessment Scores for Mary’s Creek, Big Fossil Creek, Sycamore Creek, and Marine Creek, October 2010.
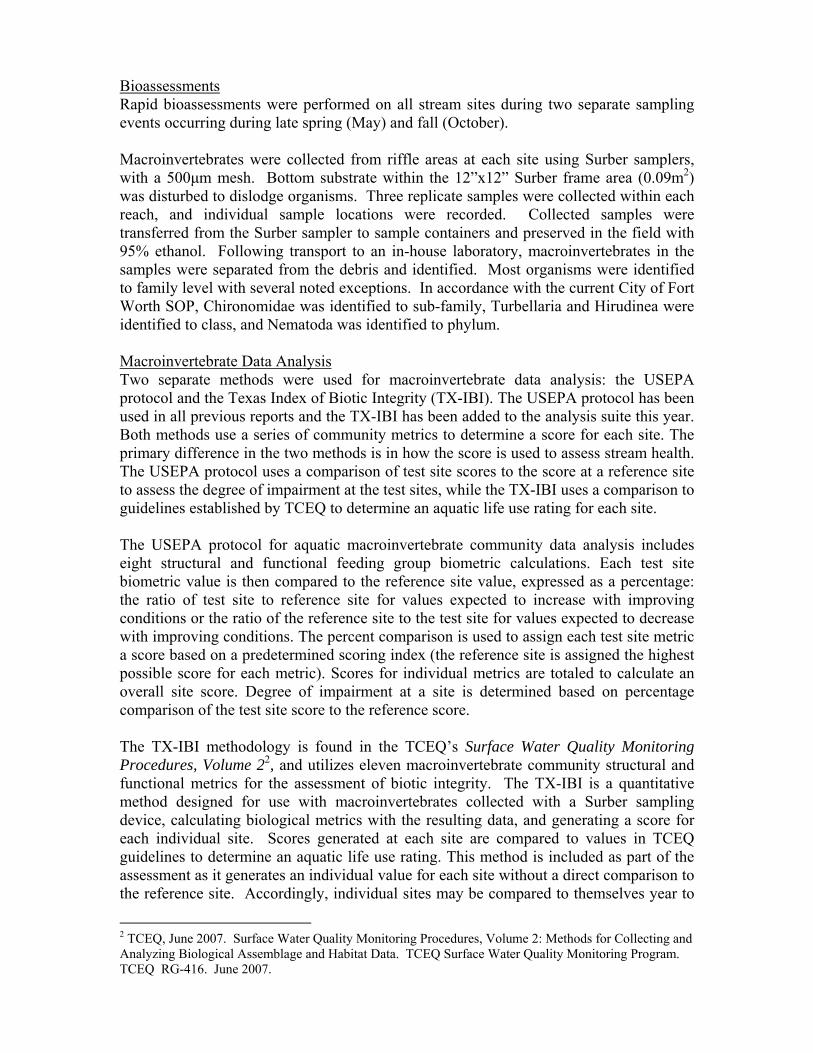
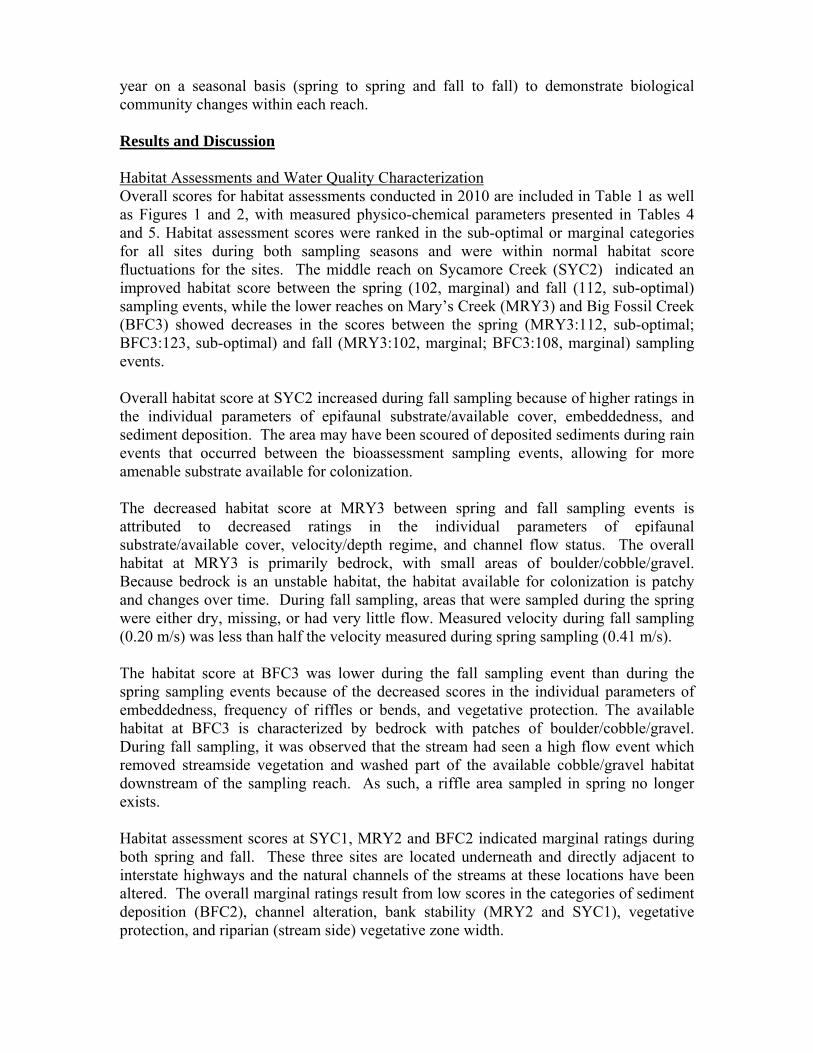
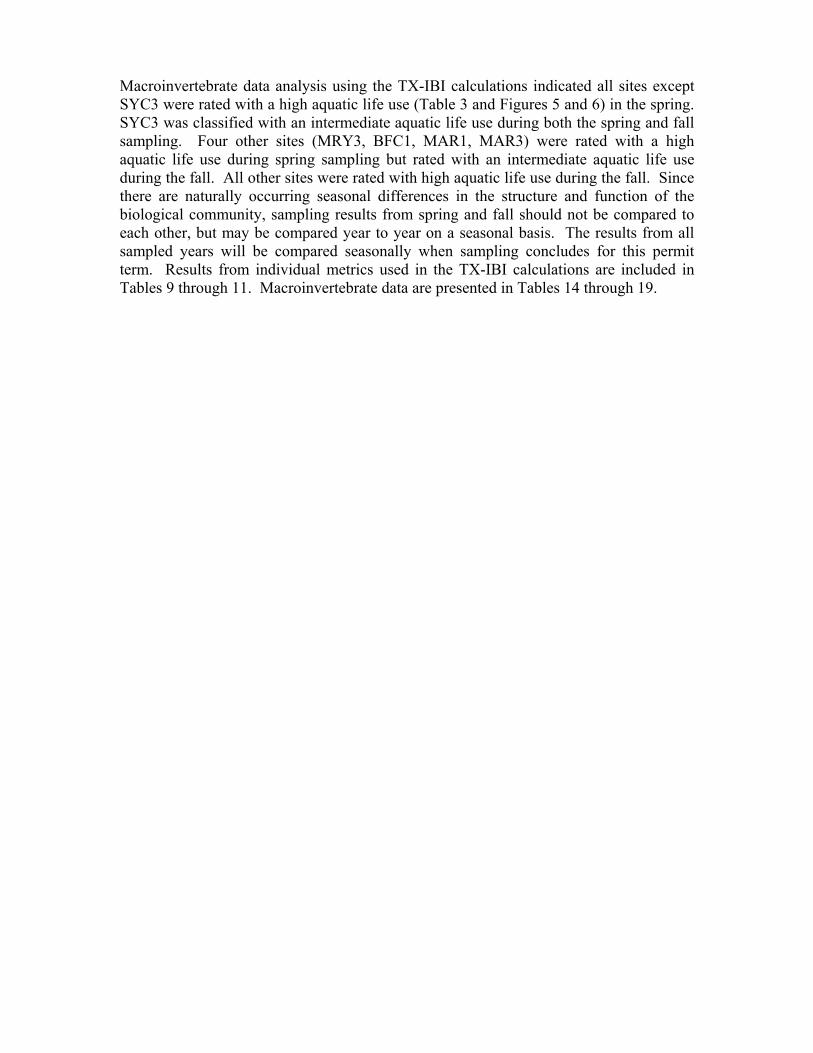
Macroinvertebrate Data Analysis In the spring, the lower reach of Sycamore Creek (SYC3) was flooded and unwadeable and there were no riffle areas; sampling was moved approximately 450 yards upstream to the first appropriately similar area. This location was within Sycamore Creek Municipal Golf Course. During the fall, samples were collected at the original SYC3 location where conditions had returned to normal, with wadeable depths and riffle areas available for sampling. Aquatic macroinvertebrate community data analysis using the USEPA protocol metrics indicated all sites were classified as non-impaired during spring sampling, and all but two were non-impaired during fall sampling (Table 2 and Figures 3 and 4). The lower reach site on Sycamore Creek, SYC3, and the lower reach site on Marine Creek, MAR3, were categorized as non-impaired during spring sampling and as slightly impaired during fall. The rating decreased to slightly impaired at SYC3 between seasons due to a decrease in the number of Ephemeroptera, Plecoptera and Tricoptera (EPT) taxa, an increase in percent contribution of dominant non-EPT taxa and increase in the prevalence of the dominant functional group. The MAR3 rating dropped to slightly impaired between sampling seasons because of decreases in taxa richness and the Quantitative Similarity Index, and increases in percent contribution of dominant non-EPT taxa and the prevalence of the dominant functional group. Results for individual metrics used in these calculations are shown in Tables 6 through 8.
0
20
40
60
80
100
120
140
160
MRY1* MRY2 MRY3 BFC1 BFC2 BFC3 SYC1 SYC2 SYC3 MAR1 MAR2 MAR3
Station
Cum
ulat
ive
Scor
e
Epifaunal Substrate Embeddedness Velocity/Depth Sediment DepositionChannel Flow Channel Alteration Frequency of Riffles (or bends) Bank Stability (sum)Vegetative Protection (sum) Riparian Veg. Width (sum)
Macroinvertebrate data analysis using the TX-IBI calculations indicated all sites except SYC3 were rated with a high aquatic life use (Table 3 and Figures 5 and 6) in the spring. SYC3 was classified with an intermediate aquatic life use during both the spring and fall sampling. Four other sites (MRY3, BFC1, MAR1, MAR3) were rated with a high aquatic life use during spring sampling but rated with an intermediate aquatic life use during the fall. All other sites were rated with high aquatic life use during the fall. Since there are naturally occurring seasonal differences in the structure and function of the biological community, sampling results from spring and fall should not be compared to each other, but may be compared year to year on a seasonal basis. The results from all sampled years will be compared seasonally when sampling concludes for this permit term. Results from individual metrics used in the TX-IBI calculations are included in Tables 9 through 11. Macroinvertebrate data are presented in Tables 14 through 19.
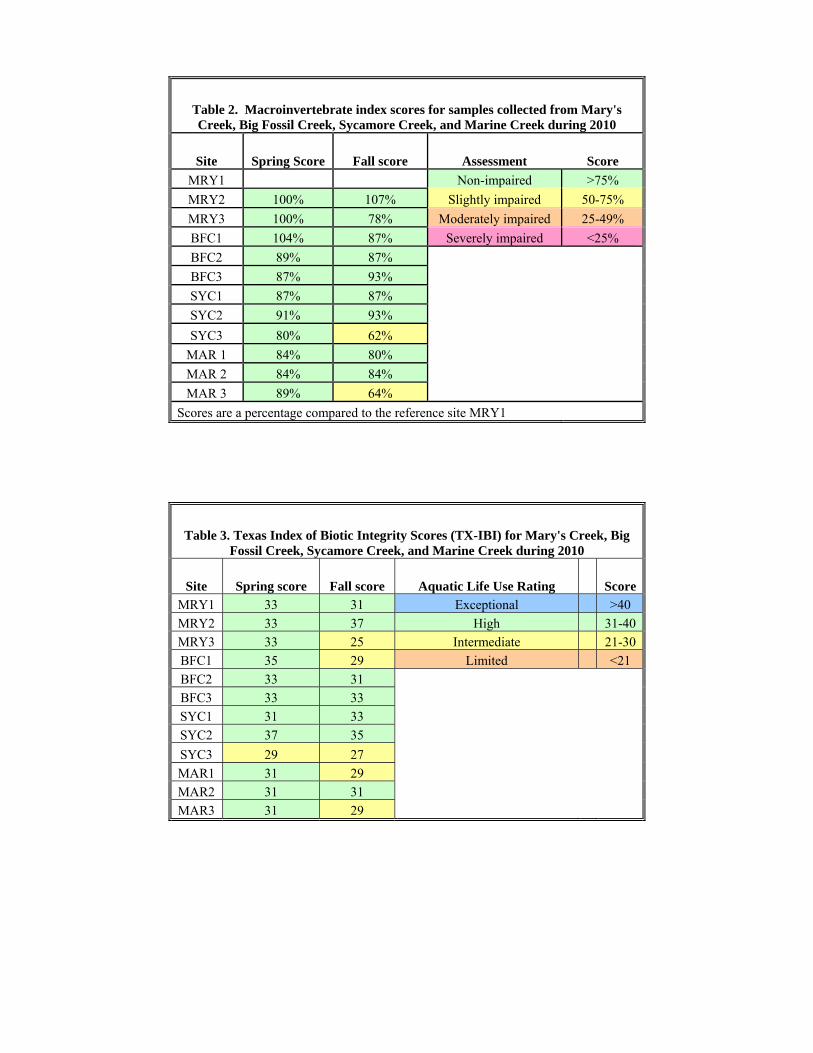
Table 2. Macroinvertebrate index scores for samples collected from Mary's Creek, Big Fossil Creek, Sycamore Creek, and Marine Creek during 2010
Site Spring Score Fall score Assessment Score MRY1 Non-impaired >75% MRY2 100% 107% Slightly impaired 50-75% MRY3 100% 78% Moderately impaired 25-49% BFC1 104% 87% Severely impaired <25% BFC2 89% 87% BFC3 87% 93% SYC1 87% 87% SYC2 91% 93% SYC3 80% 62%
MAR 1 84% 80% MAR 2 84% 84% MAR 3 89% 64%
Scores are a percentage compared to the reference site MRY1
Table 3. Texas Index of Biotic Integrity Scores (TX-IBI) for Mary's Creek, Big Fossil Creek, Sycamore Creek, and Marine Creek during 2010
Site Spring score Fall score Aquatic Life Use Rating Score MRY1 33 31 Exceptional >40 MRY2 33 37 High 31-40 MRY3 33 25 Intermediate 21-30 BFC1 35 29 Limited <21 BFC2 33 31 BFC3 33 33 SYC1 31 33 SYC2 37 35 SYC3 29 27 MAR1 31 29 MAR2 31 31 MAR3 31 29
Conclusion During spring and fall 2010, rapid bioassessments were conducted at 12 sites along four Trinity River tributaries in Fort Worth. Habitat assessment scores were rated in the sub-optimal and marginal categories during both seasons. Macroinvertebrate scores using USEPA protocol metrics indicate macroinvertebrate communities at all sites rated non-impaired during spring sampling. TX-IBI metrics produced ratings at all but one site (SYC3) with high aquatic life use during spring sampling. During fall sampling, SYC3 was rated as slightly impaired with the USEPA protocol. Utilizing the TX-IBI metric, it scored in the intermediate aquatic life use range. All other sites were rated in the USEPA non-impaired category and indicated high aquatic life use on the TX-IBI. MRY3, BFC1, MAR1, and MAR3 were rated intermediate for aquatic life use in the fall. Lower scores at SYC3 and MAR3 on both the USEPA and TX-IBI rating scales may be attributed to physical changes in the habitat and flow regimes as well as seasonal differences in the structural and functional groups of the macroinvertebrate community.
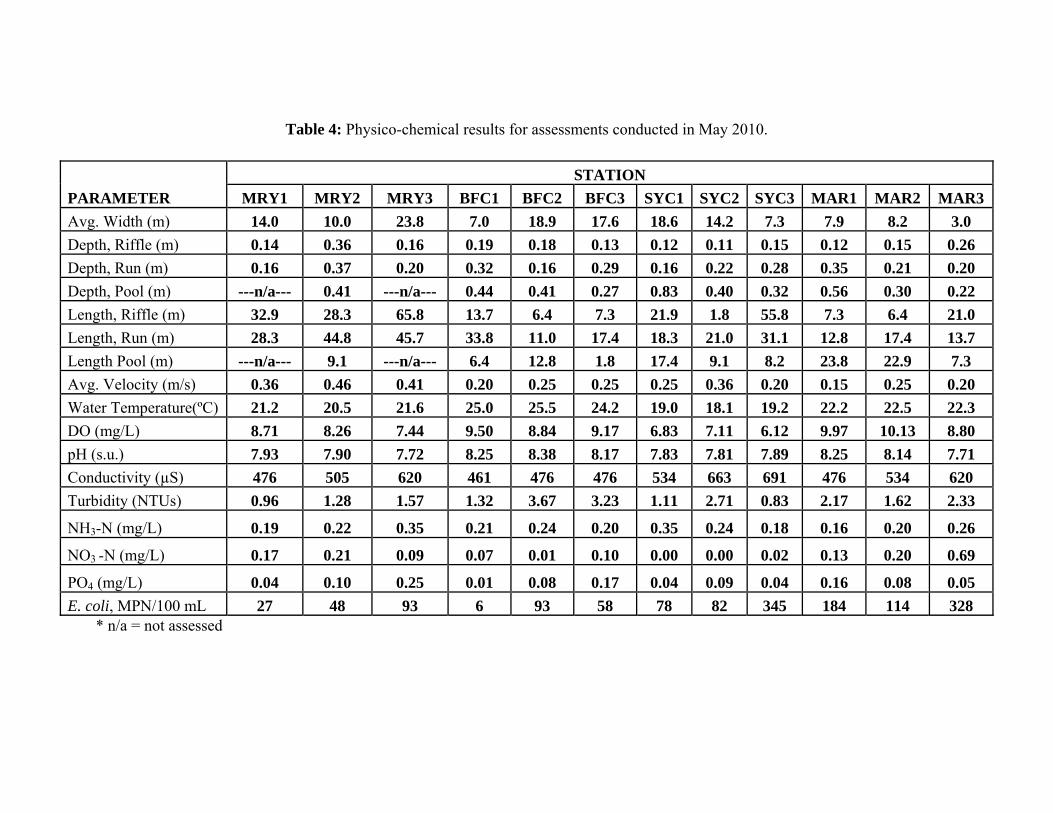
Table 4: Physico-chemical results for assessments conducted in May 2010.
PARAMETER STATION
MRY1 MRY2 MRY3 BFC1 BFC2 BFC3 SYC1 SYC2 SYC3 MAR1 MAR2 MAR3 Avg. Width (m) 14.0 10.0 23.8 7.0 18.9 17.6 18.6 14.2 7.3 7.9 8.2 3.0 Depth, Riffle (m) 0.14 0.36 0.16 0.19 0.18 0.13 0.12 0.11 0.15 0.12 0.15 0.26 Depth, Run (m) 0.16 0.37 0.20 0.32 0.16 0.29 0.16 0.22 0.28 0.35 0.21 0.20 Depth, Pool (m) ---n/a--- 0.41 ---n/a--- 0.44 0.41 0.27 0.83 0.40 0.32 0.56 0.30 0.22 Length, Riffle (m) 32.9 28.3 65.8 13.7 6.4 7.3 21.9 1.8 55.8 7.3 6.4 21.0 Length, Run (m) 28.3 44.8 45.7 33.8 11.0 17.4 18.3 21.0 31.1 12.8 17.4 13.7 Length Pool (m) ---n/a--- 9.1 ---n/a--- 6.4 12.8 1.8 17.4 9.1 8.2 23.8 22.9 7.3 Avg. Velocity (m/s) 0.36 0.46 0.41 0.20 0.25 0.25 0.25 0.36 0.20 0.15 0.25 0.20 Water Temperature(ºC) 21.2 20.5 21.6 25.0 25.5 24.2 19.0 18.1 19.2 22.2 22.5 22.3 DO (mg/L) 8.71 8.26 7.44 9.50 8.84 9.17 6.83 7.11 6.12 9.97 10.13 8.80 pH (s.u.) 7.93 7.90 7.72 8.25 8.38 8.17 7.83 7.81 7.89 8.25 8.14 7.71 Conductivity (µS) 476 505 620 461 476 476 534 663 691 476 534 620 Turbidity (NTUs) 0.96 1.28 1.57 1.32 3.67 3.23 1.11 2.71 0.83 2.17 1.62 2.33
NH3-N (mg/L) 0.19 0.22 0.35 0.21 0.24 0.20 0.35 0.24 0.18 0.16 0.20 0.26
NO3 -N (mg/L) 0.17 0.21 0.09 0.07 0.01 0.10 0.00 0.00 0.02 0.13 0.20 0.69
PO4 (mg/L) 0.04 0.10 0.25 0.01 0.08 0.17 0.04 0.09 0.04 0.16 0.08 0.05 E. coli, MPN/100 mL 27 48 93 6 93 58 78 82 345 184 114 328
* n/a = not assessed
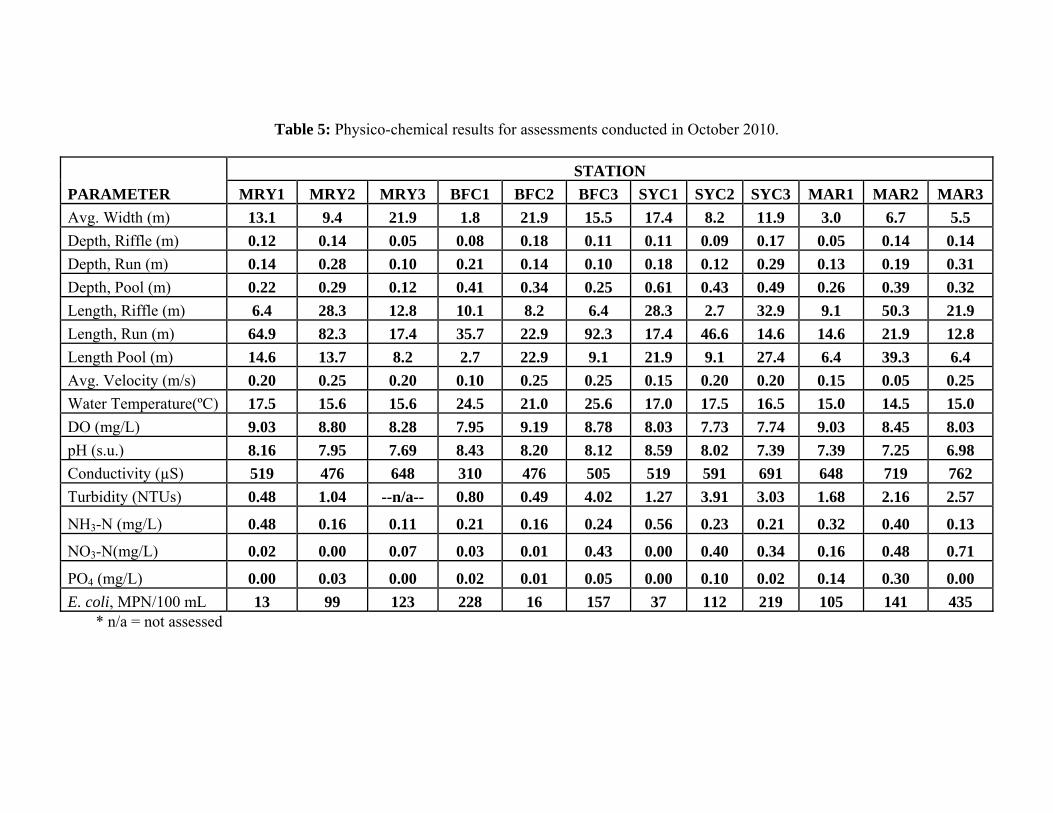
Table 5: Physico-chemical results for assessments conducted in October 2010.
PARAMETER STATION
MRY1 MRY2 MRY3 BFC1 BFC2 BFC3 SYC1 SYC2 SYC3 MAR1 MAR2 MAR3 Avg. Width (m) 13.1 9.4 21.9 1.8 21.9 15.5 17.4 8.2 11.9 3.0 6.7 5.5 Depth, Riffle (m) 0.12 0.14 0.05 0.08 0.18 0.11 0.11 0.09 0.17 0.05 0.14 0.14 Depth, Run (m) 0.14 0.28 0.10 0.21 0.14 0.10 0.18 0.12 0.29 0.13 0.19 0.31 Depth, Pool (m) 0.22 0.29 0.12 0.41 0.34 0.25 0.61 0.43 0.49 0.26 0.39 0.32 Length, Riffle (m) 6.4 28.3 12.8 10.1 8.2 6.4 28.3 2.7 32.9 9.1 50.3 21.9 Length, Run (m) 64.9 82.3 17.4 35.7 22.9 92.3 17.4 46.6 14.6 14.6 21.9 12.8 Length Pool (m) 14.6 13.7 8.2 2.7 22.9 9.1 21.9 9.1 27.4 6.4 39.3 6.4 Avg. Velocity (m/s) 0.20 0.25 0.20 0.10 0.25 0.25 0.15 0.20 0.20 0.15 0.05 0.25 Water Temperature(ºC) 17.5 15.6 15.6 24.5 21.0 25.6 17.0 17.5 16.5 15.0 14.5 15.0 DO (mg/L) 9.03 8.80 8.28 7.95 9.19 8.78 8.03 7.73 7.74 9.03 8.45 8.03 pH (s.u.) 8.16 7.95 7.69 8.43 8.20 8.12 8.59 8.02 7.39 7.39 7.25 6.98 Conductivity (µS) 519 476 648 310 476 505 519 591 691 648 719 762 Turbidity (NTUs) 0.48 1.04 --n/a-- 0.80 0.49 4.02 1.27 3.91 3.03 1.68 2.16 2.57
NH3-N (mg/L) 0.48 0.16 0.11 0.21 0.16 0.24 0.56 0.23 0.21 0.32 0.40 0.13
NO3-N(mg/L) 0.02 0.00 0.07 0.03 0.01 0.43 0.00 0.40 0.34 0.16 0.48 0.71
PO4 (mg/L) 0.00 0.03 0.00 0.02 0.01 0.05 0.00 0.10 0.02 0.14 0.30 0.00 E. coli, MPN/100 mL 13 99 123 228 16 157 37 112 219 105 141 435
* n/a = not assessed

Table 6: USEPA bioassessment metric calculations for macroinvertebrate community samples collected from Mary’s Creek, Big Fossil Creek, Sycamore Creek and Marine Creek in May 2010.
Bioassessment Metrics MRY1 MRY2 MRY3 BFC1 BFC2 BFC3 SYC1 SYC2 SYC3 MAR1 MAR2 MAR3
Taxa Richness (Family) 31 30 30 27 22 28 19 25 16 23 27 24
EPT Index (Family) 11 10 10 7 6 10 4 4 6 3 7 5
Community Balance Metrics
Hilsenhoff Biotic Index (Family) 5.1 4.7 4.8 4.3 4.4 3.4 4.4 4.5 4.6 4.2 4.8 4.5
%Contribution of Dominant non EPT Taxa 43% 36% 32% 12% 22% 73% 14% 16% 19% 30% 24% 24%
EPT/(Chironomidae + EPT) Abundances 0.40 0.52 0.59 0.75 0.67 0.79 0.83 0.75 0.58 0.72 0.70 0.53
Functional Feeding Group Metrics
Quantitative Similarity Index - Functional Groups N/A 94% 92% 92% 95% 45% 74% 79% 85% 76% 72% 85%
Prevalence of Dominant Functional Group 58% 58% 59% 65% 55% 79% 48% 51% 65% 48% 86% 60%
%FPOM Collectors (Col + Fil + Min) 82% 88% 90% 88% 82% 97% 91% 88% 97% 94% 94% 97%
Metric Value Comparison with Reference Data MRY1 MRY2 MRY3 BFC1 BFC2 BFC3 SYC1 SYC2 SYC3 MAR1 MAR2 MAR3
Taxa Richness (Family)* - 97% 97% 87% 71% 90% 61% 81% 52% 74% 87% 77%
EPT Index* - 91% 91% 64% 55% 91% 36% 36% 55% 27% 64% 45%
Community Balance Metrics
Hilsenhoff Biotic Index (Family)* - 109% 108% 119% 116% 152% 118% 114% 111% 122% 107% 114%
%Contribution of Dominant non EPT Taxa** - 119% 134% 355% 200% 59% 316% 276% 228% 145% 182% 180%
EPT/(Chironomid + EPT) Abundances* - 130% 146% 189% 169% 199% 207% 188% 146% 179% 174% 134%
Functional Feeding Group Metrics
Prevalence of Dominant Functional Group** - 99% 98% 89% 106% 73% 119% 114% 89% 120% 67% 96%
%FPOM Collectors (Col + Fil + Min)** - 93% 91% 93% 100% 84% 89% 92% 84% 87% 87% 84%
*Ratio of the study site to the reference site expressed as a percentage.
**Ratio of the reference site to the study site expressed as a percentage.
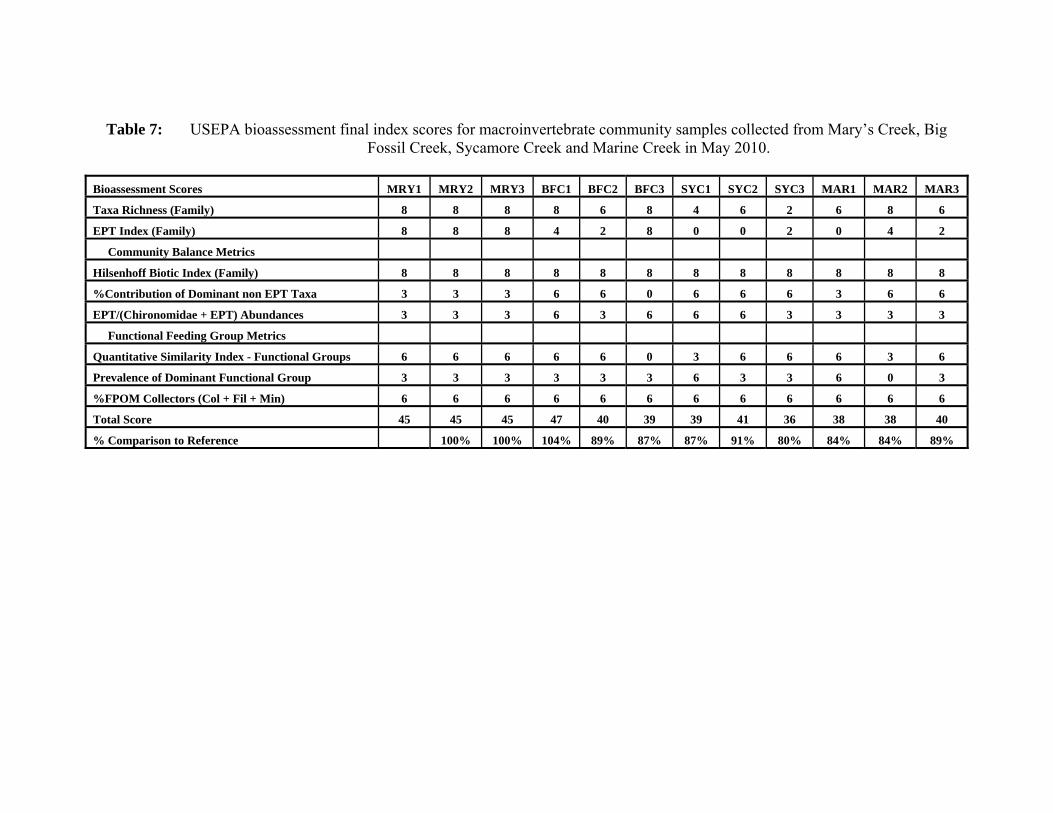
Table 7: USEPA bioassessment final index scores for macroinvertebrate community samples collected from Mary’s Creek, Big Fossil Creek, Sycamore Creek and Marine Creek in May 2010.
Bioassessment Scores MRY1 MRY2 MRY3 BFC1 BFC2 BFC3 SYC1 SYC2 SYC3 MAR1 MAR2 MAR3
Taxa Richness (Family) 8 8 8 8 6 8 4 6 2 6 8 6
EPT Index (Family) 8 8 8 4 2 8 0 0 2 0 4 2
Community Balance Metrics
Hilsenhoff Biotic Index (Family) 8 8 8 8 8 8 8 8 8 8 8 8
%Contribution of Dominant non EPT Taxa 3 3 3 6 6 0 6 6 6 3 6 6
EPT/(Chironomidae + EPT) Abundances 3 3 3 6 3 6 6 6 3 3 3 3
Functional Feeding Group Metrics
Quantitative Similarity Index - Functional Groups 6 6 6 6 6 0 3 6 6 6 3 6
Prevalence of Dominant Functional Group 3 3 3 3 3 3 6 3 3 6 0 3
%FPOM Collectors (Col + Fil + Min) 6 6 6 6 6 6 6 6 6 6 6 6
Total Score 45 45 45 47 40 39 39 41 36 38 38 40
% Comparison to Reference 100% 100% 104% 89% 87% 87% 91% 80% 84% 84% 89%
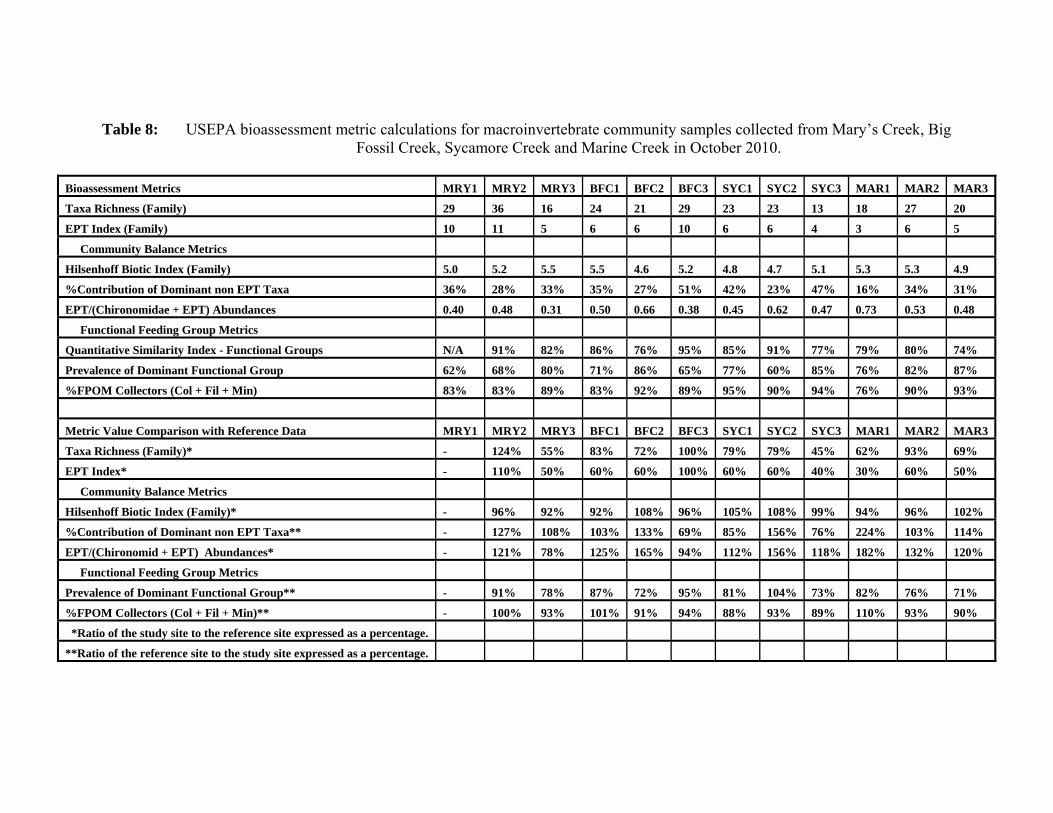
Table 8: USEPA bioassessment metric calculations for macroinvertebrate community samples collected from Mary’s Creek, Big Fossil Creek, Sycamore Creek and Marine Creek in October 2010.
Bioassessment Metrics MRY1 MRY2 MRY3 BFC1 BFC2 BFC3 SYC1 SYC2 SYC3 MAR1 MAR2 MAR3
Taxa Richness (Family) 29 36 16 24 21 29 23 23 13 18 27 20
EPT Index (Family) 10 11 5 6 6 10 6 6 4 3 6 5
Community Balance Metrics
Hilsenhoff Biotic Index (Family) 5.0 5.2 5.5 5.5 4.6 5.2 4.8 4.7 5.1 5.3 5.3 4.9
%Contribution of Dominant non EPT Taxa 36% 28% 33% 35% 27% 51% 42% 23% 47% 16% 34% 31%
EPT/(Chironomidae + EPT) Abundances 0.40 0.48 0.31 0.50 0.66 0.38 0.45 0.62 0.47 0.73 0.53 0.48
Functional Feeding Group Metrics
Quantitative Similarity Index - Functional Groups N/A 91% 82% 86% 76% 95% 85% 91% 77% 79% 80% 74%
Prevalence of Dominant Functional Group 62% 68% 80% 71% 86% 65% 77% 60% 85% 76% 82% 87%
%FPOM Collectors (Col + Fil + Min) 83% 83% 89% 83% 92% 89% 95% 90% 94% 76% 90% 93%
Metric Value Comparison with Reference Data MRY1 MRY2 MRY3 BFC1 BFC2 BFC3 SYC1 SYC2 SYC3 MAR1 MAR2 MAR3
Taxa Richness (Family)* - 124% 55% 83% 72% 100% 79% 79% 45% 62% 93% 69%
EPT Index* - 110% 50% 60% 60% 100% 60% 60% 40% 30% 60% 50%
Community Balance Metrics
Hilsenhoff Biotic Index (Family)* - 96% 92% 92% 108% 96% 105% 108% 99% 94% 96% 102%
%Contribution of Dominant non EPT Taxa** - 127% 108% 103% 133% 69% 85% 156% 76% 224% 103% 114%
EPT/(Chironomid + EPT) Abundances* - 121% 78% 125% 165% 94% 112% 156% 118% 182% 132% 120%
Functional Feeding Group Metrics
Prevalence of Dominant Functional Group** - 91% 78% 87% 72% 95% 81% 104% 73% 82% 76% 71%
%FPOM Collectors (Col + Fil + Min)** - 100% 93% 101% 91% 94% 88% 93% 89% 110% 93% 90%
*Ratio of the study site to the reference site expressed as a percentage.
**Ratio of the reference site to the study site expressed as a percentage.

Table 9: USEPA bioassessment final index scores for macroinvertebrate community samples collected from Mary’s Creek, Big Fossil Creek, Sycamore Creek and Marine Creek in October 2010.
Bioassessment Scores MRY1 MRY2 MRY3 BFC1 BFC2 BFC3 SYC1 SYC2 SYC3 MAR1 MAR2 MAR3
Taxa Richness (Family) 8 8 4 6 6 8 6 6 2 4 8 4
EPT Index (Family) 8 8 2 4 4 8 4 4 0 0 4 2
Community Balance Metrics
Hilsenhoff Biotic Index (Family) 8 8 8 8 8 8 8 8 8 8 8 8
%Contribution of Dominant non EPT Taxa 3 6 3 3 6 0 3 6 3 6 3 3
EPT/(Chironomidae + EPT) Abundances 3 3 3 3 3 3 3 3 3 3 3 3
Functional Feeding Group Metrics
Quantitative Similarity Index - Functional Groups 6 6 6 6 6 6 6 6 6 6 6 3
Prevalence of Dominant Functional Group 3 3 3 3 0 3 3 3 0 3 0 0
%FPOM Collectors (Col + Fil + Min) 6 6 6 6 6 6 6 6 6 6 6 6
Total Score 45 48 35 39 39 42 39 42 28 36 38 29
% Comparison to Reference 107% 78% 87% 87% 93% 87% 93% 62% 80% 84% 64%
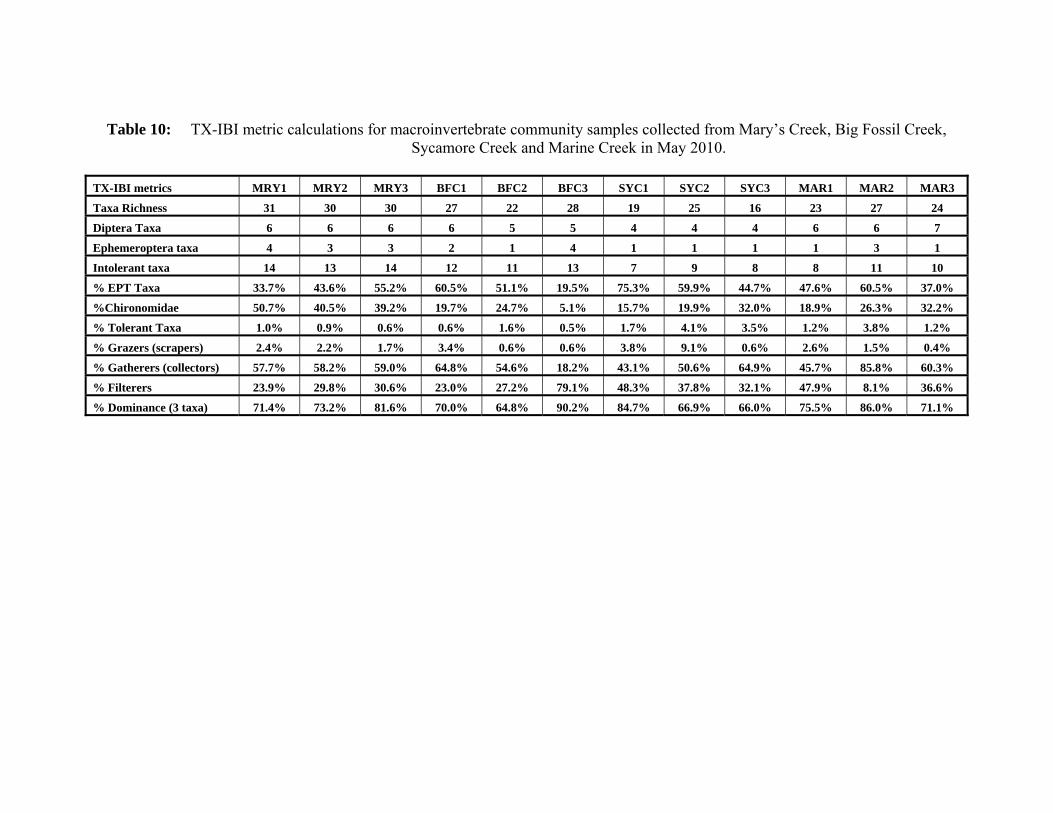
Table 10: TX-IBI metric calculations for macroinvertebrate community samples collected from Mary’s Creek, Big Fossil Creek, Sycamore Creek and Marine Creek in May 2010.
TX-IBI metrics MRY1 MRY2 MRY3 BFC1 BFC2 BFC3 SYC1 SYC2 SYC3 MAR1 MAR2 MAR3
Taxa Richness 31 30 30 27 22 28 19 25 16 23 27 24
Diptera Taxa 6 6 6 6 5 5 4 4 4 6 6 7
Ephemeroptera taxa 4 3 3 2 1 4 1 1 1 1 3 1
Intolerant taxa 14 13 14 12 11 13 7 9 8 8 11 10
% EPT Taxa 33.7% 43.6% 55.2% 60.5% 51.1% 19.5% 75.3% 59.9% 44.7% 47.6% 60.5% 37.0%
%Chironomidae 50.7% 40.5% 39.2% 19.7% 24.7% 5.1% 15.7% 19.9% 32.0% 18.9% 26.3% 32.2%
% Tolerant Taxa 1.0% 0.9% 0.6% 0.6% 1.6% 0.5% 1.7% 4.1% 3.5% 1.2% 3.8% 1.2%
% Grazers (scrapers) 2.4% 2.2% 1.7% 3.4% 0.6% 0.6% 3.8% 9.1% 0.6% 2.6% 1.5% 0.4%
% Gatherers (collectors) 57.7% 58.2% 59.0% 64.8% 54.6% 18.2% 43.1% 50.6% 64.9% 45.7% 85.8% 60.3%
% Filterers 23.9% 29.8% 30.6% 23.0% 27.2% 79.1% 48.3% 37.8% 32.1% 47.9% 8.1% 36.6%
% Dominance (3 taxa) 71.4% 73.2% 81.6% 70.0% 64.8% 90.2% 84.7% 66.9% 66.0% 75.5% 86.0% 71.1%

Table 11: TX-IBI scores for macroinvertebrate community samples collected from Mary’s Creek, Big Fossil Creek, Sycamore Creek and Marine Creek in May 2010.
TX-IBI Scores MRY1 MRY2 MRY3 BFC1 BFC2 BFC3 SYC1 SYC2 SYC3 MAR1 MAR2 MAR3
Taxa Richness 3 3 3 3 3 3 3 3 1 3 3 3
Diptera Taxa 3 3 3 3 3 3 3 3 3 3 3 3
Ephemeroptera taxa 3 3 3 3 1 3 1 1 1 1 3 1
Intolerant taxa 5 5 5 5 5 5 3 5 3 3 5 5
% EPT Taxa 5 5 5 5 5 3 5 5 5 5 5 5
%Chironomidae 1 1 1 3 1 3 3 3 1 3 1 1
% Tolerant Taxa 3 3 3 3 3 3 3 3 3 3 3 3
% Grazers (scrapers) 1 1 1 1 1 1 1 3 1 1 1 1
% Gatherers (collectors) 5 5 5 5 5 5 5 5 5 5 5 5
% Filterers 3 3 3 3 3 3 3 3 3 3 1 3
% Dominance (3 taxa) 1 1 1 1 3 1 1 3 3 1 1 1
Total Score 33 33 33 35 33 33 31 37 29 31 31 31
Aquatic Life Use Rating High High High High High High High High Intermediate High High High
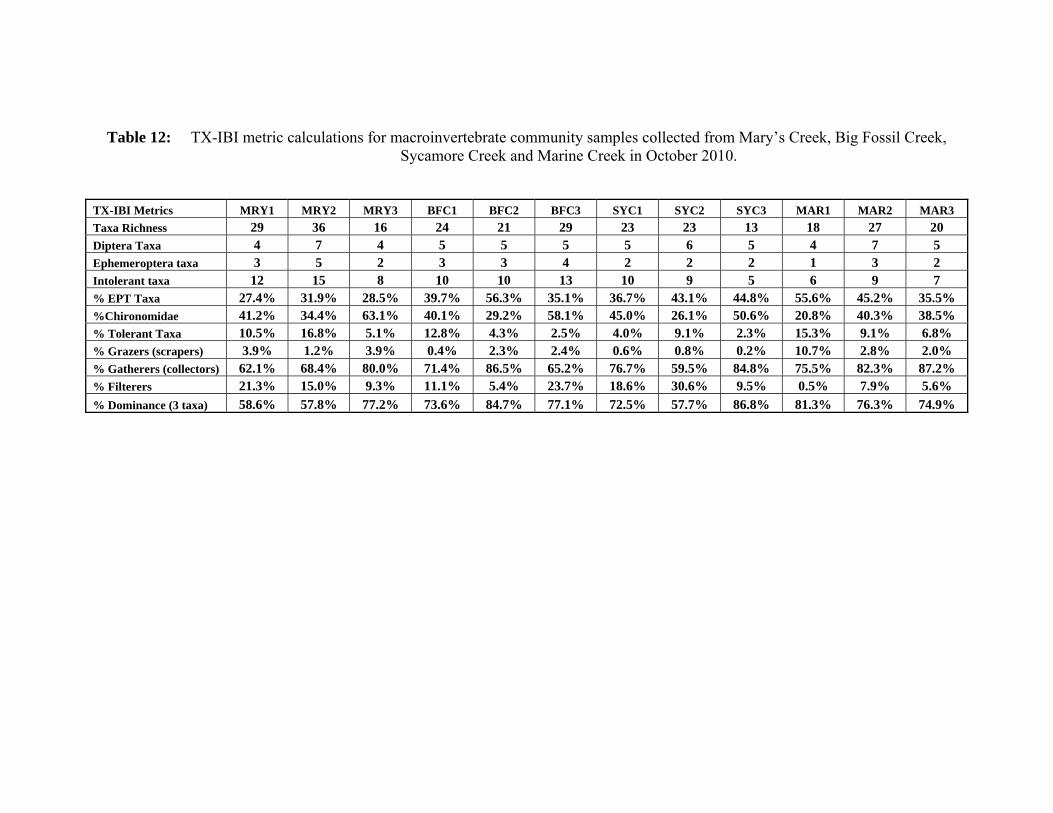
Table 12: TX-IBI metric calculations for macroinvertebrate community samples collected from Mary’s Creek, Big Fossil Creek, Sycamore Creek and Marine Creek in October 2010.
TX-IBI Metrics MRY1 MRY2 MRY3 BFC1 BFC2 BFC3 SYC1 SYC2 SYC3 MAR1 MAR2 MAR3 Taxa Richness 29 36 16 24 21 29 23 23 13 18 27 20 Diptera Taxa 4 7 4 5 5 5 5 6 5 4 7 5 Ephemeroptera taxa 3 5 2 3 3 4 2 2 2 1 3 2 Intolerant taxa 12 15 8 10 10 13 10 9 5 6 9 7 % EPT Taxa 27.4% 31.9% 28.5% 39.7% 56.3% 35.1% 36.7% 43.1% 44.8% 55.6% 45.2% 35.5% %Chironomidae 41.2% 34.4% 63.1% 40.1% 29.2% 58.1% 45.0% 26.1% 50.6% 20.8% 40.3% 38.5% % Tolerant Taxa 10.5% 16.8% 5.1% 12.8% 4.3% 2.5% 4.0% 9.1% 2.3% 15.3% 9.1% 6.8% % Grazers (scrapers) 3.9% 1.2% 3.9% 0.4% 2.3% 2.4% 0.6% 0.8% 0.2% 10.7% 2.8% 2.0% % Gatherers (collectors) 62.1% 68.4% 80.0% 71.4% 86.5% 65.2% 76.7% 59.5% 84.8% 75.5% 82.3% 87.2% % Filterers 21.3% 15.0% 9.3% 11.1% 5.4% 23.7% 18.6% 30.6% 9.5% 0.5% 7.9% 5.6% % Dominance (3 taxa) 58.6% 57.8% 77.2% 73.6% 84.7% 77.1% 72.5% 57.7% 86.8% 81.3% 76.3% 74.9%
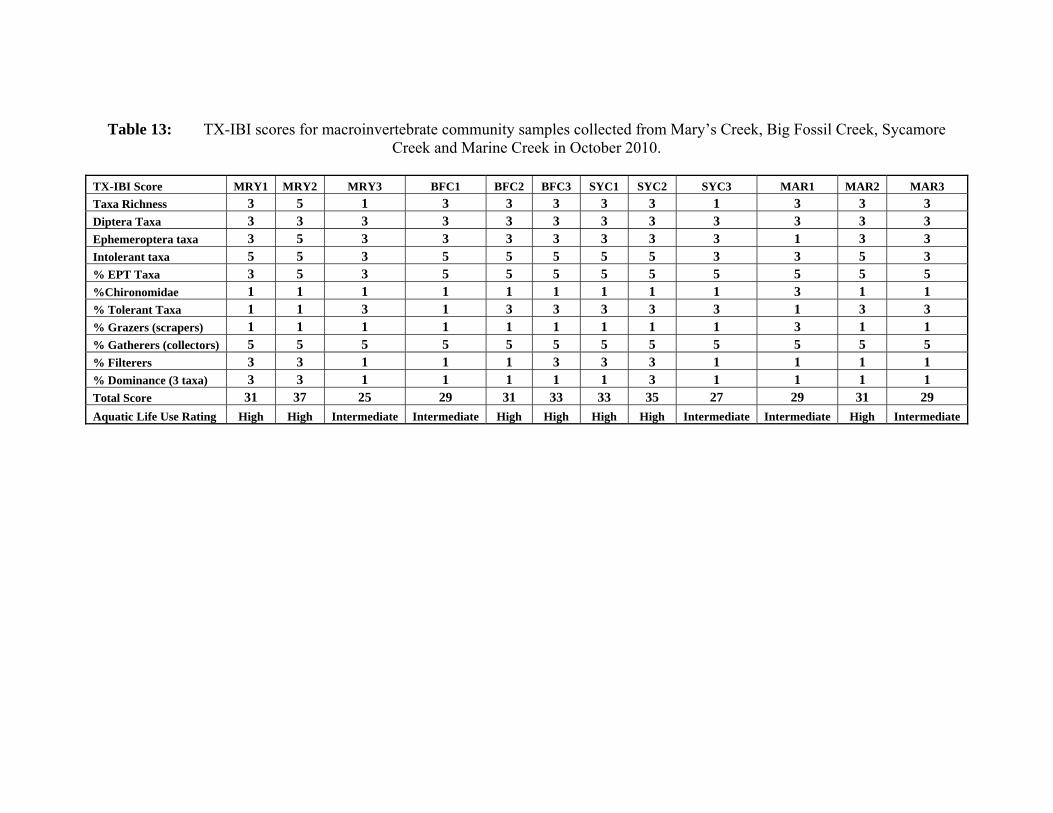
Table 13: TX-IBI scores for macroinvertebrate community samples collected from Mary’s Creek, Big Fossil Creek, Sycamore Creek and Marine Creek in October 2010.
TX-IBI Score MRY1 MRY2 MRY3 BFC1 BFC2 BFC3 SYC1 SYC2 SYC3 MAR1 MAR2 MAR3 Taxa Richness 3 5 1 3 3 3 3 3 1 3 3 3 Diptera Taxa 3 3 3 3 3 3 3 3 3 3 3 3 Ephemeroptera taxa 3 5 3 3 3 3 3 3 3 1 3 3 Intolerant taxa 5 5 3 5 5 5 5 5 3 3 5 3 % EPT Taxa 3 5 3 5 5 5 5 5 5 5 5 5 %Chironomidae 1 1 1 1 1 1 1 1 1 3 1 1 % Tolerant Taxa 1 1 3 1 3 3 3 3 3 1 3 3 % Grazers (scrapers) 1 1 1 1 1 1 1 1 1 3 1 1 % Gatherers (collectors) 5 5 5 5 5 5 5 5 5 5 5 5 % Filterers 3 3 1 1 1 3 3 3 1 1 1 1 % Dominance (3 taxa) 3 3 1 1 1 1 1 3 1 1 1 1 Total Score 31 37 25 29 31 33 33 35 27 29 31 29 Aquatic Life Use Rating High High Intermediate Intermediate High High High High Intermediate Intermediate High Intermediate
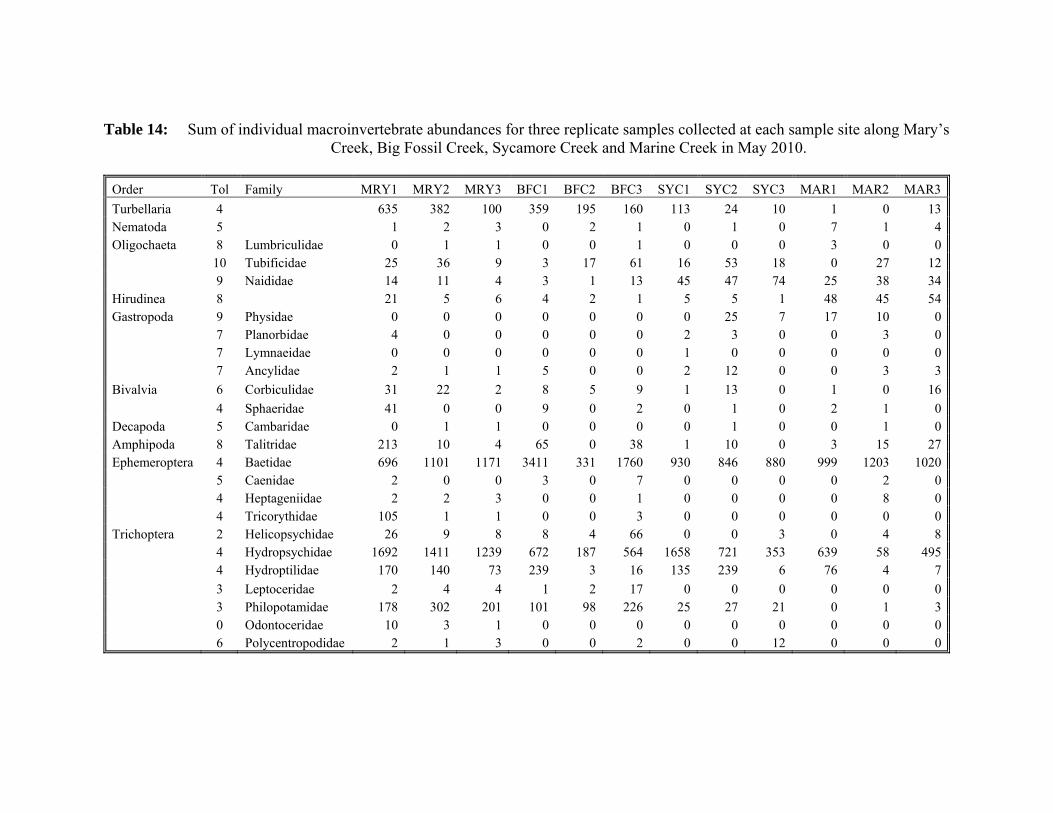
Table 14: Sum of individual macroinvertebrate abundances for three replicate samples collected at each sample site along Mary’s Creek, Big Fossil Creek, Sycamore Creek and Marine Creek in May 2010.
Order Tol Family MRY1 MRY2 MRY3 BFC1 BFC2 BFC3 SYC1 SYC2 SYC3 MAR1 MAR2 MAR3Turbellaria 4 635 382 100 359 195 160 113 24 10 1 0 13Nematoda 5 1 2 3 0 2 1 0 1 0 7 1 4Oligochaeta 8 Lumbriculidae 0 1 1 0 0 1 0 0 0 3 0 0 10 Tubificidae 25 36 9 3 17 61 16 53 18 0 27 12 9 Naididae 14 11 4 3 1 13 45 47 74 25 38 34Hirudinea 8 21 5 6 4 2 1 5 5 1 48 45 54Gastropoda 9 Physidae 0 0 0 0 0 0 0 25 7 17 10 0 7 Planorbidae 4 0 0 0 0 0 2 3 0 0 3 0 7 Lymnaeidae 0 0 0 0 0 0 1 0 0 0 0 0 7 Ancylidae 2 1 1 5 0 0 2 12 0 0 3 3Bivalvia 6 Corbiculidae 31 22 2 8 5 9 1 13 0 1 0 16 4 Sphaeridae 41 0 0 9 0 2 0 1 0 2 1 0Decapoda 5 Cambaridae 0 1 1 0 0 0 0 1 0 0 1 0Amphipoda 8 Talitridae 213 10 4 65 0 38 1 10 0 3 15 27Ephemeroptera 4 Baetidae 696 1101 1171 3411 331 1760 930 846 880 999 1203 1020 5 Caenidae 2 0 0 3 0 7 0 0 0 0 2 0 4 Heptageniidae 2 2 3 0 0 1 0 0 0 0 8 0 4 Tricorythidae 105 1 1 0 0 3 0 0 0 0 0 0Trichoptera 2 Helicopsychidae 26 9 8 8 4 66 0 0 3 0 4 8 4 Hydropsychidae 1692 1411 1239 672 187 564 1658 721 353 639 58 495 4 Hydroptilidae 170 140 73 239 3 16 135 239 6 76 4 7 3 Leptoceridae 2 4 4 1 2 17 0 0 0 0 0 0 3 Philopotamidae 178 302 201 101 98 226 25 27 21 0 1 3 0 Odontoceridae 10 3 1 0 0 0 0 0 0 0 0 0 6 Polycentropodidae 2 1 3 0 0 2 0 0 12 0 0 0

Table 14: Sum of individual macroinvertebrate abundances for three replicate samples collected at each sample site along Mary’s Creek, Big Fossil Creek, Sycamore Creek and Marine Creek in May 2010, continued.
Order Tol Family MRY1 MRY2 MRY3 BFC1 BFC2 BFC3 SYC1 SYC2 SYC3 MAR1 MAR2 MAR3Anisoptera 1 Gomphidae 0 0 0 1 0 0 0 0 0 0 0 0Zygoptera 9 Coenagrionidae 47 14 14 38 0 1 0 1 0 0 5 4 5 Calopterygidae 0 0 0 1 0 0 0 0 0 0 0 0Hemiptera 9 Corixidae 0 0 0 0 1 0 0 0 0 0 0 0 5 Gerridae 0 0 0 0 0 0 0 0 0 0 0 1 5 Hebridae 0 0 0 0 0 1 0 2 0 0 3 0 5 Notonectidae 0 0 0 0 1 0 1 0 0 0 0 0 5 Veliidae 0 0 0 0 0 0 0 0 0 1 0 0Coleoptera 4 Carabidae 0 0 0 0 1 0 0 1 0 1 0 0 5 Chrysomelidae 0 0 0 0 1 0 0 1 0 1 0 0 2 Elmidae 108 249 50 47 26 20 61 24 11 6 9 93 5 Hydrophilidae 32 3 2 3 0 0 0 0 0 3 0 0Lepidoptera 4 Pyralidae 4 6 13 4 0 1 0 0 0 0 3 11Diptera 5 Ceratopogonidae 33 7 0 4 0 2 0 0 0 0 0 3 6 Empididae 17 36 7 3 0 0 0 0 0 4 0 1 3 Simuliidae 106 300 57 898 42 10014 78 394 543 1082 111 1002 7 Stratiomyidae 0 0 0 0 0 0 0 0 0 1 1 0 4 Tipulidae 0 0 1 0 1 0 0 0 0 0 1 1 6 Chironominae 3716 2482 1587 824 266 455 502 482 460 596 504 926 6 Tanypodinae 568 203 271 221 12 127 53 41 44 73 40 21 6 Orthocladiinae 50 73 59 399 24 109 19 87 410 13 13 386 Number of Individuals 8553 6818 4896 7334 1222 13678 3648 3061 2853 3602 2114 4145
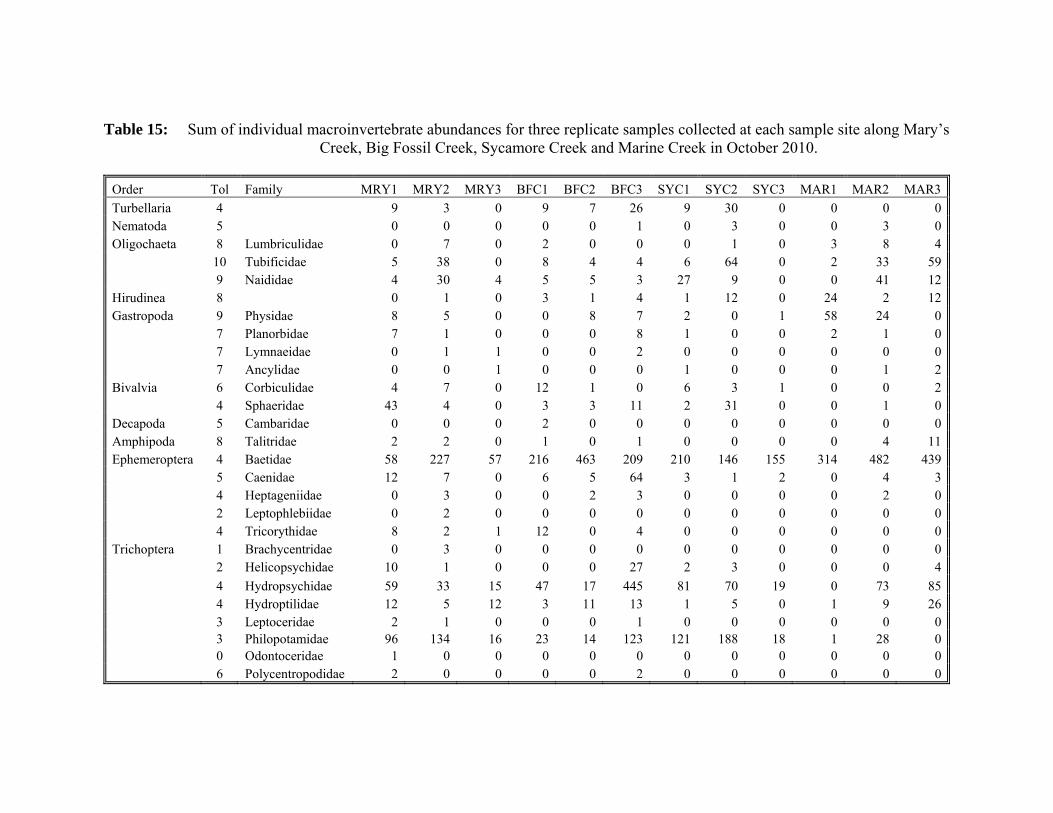
Table 15: Sum of individual macroinvertebrate abundances for three replicate samples collected at each sample site along Mary’s Creek, Big Fossil Creek, Sycamore Creek and Marine Creek in October 2010.
Order Tol Family MRY1 MRY2 MRY3 BFC1 BFC2 BFC3 SYC1 SYC2 SYC3 MAR1 MAR2 MAR3Turbellaria 4 9 3 0 9 7 26 9 30 0 0 0 0Nematoda 5 0 0 0 0 0 1 0 3 0 0 3 0Oligochaeta 8 Lumbriculidae 0 7 0 2 0 0 0 1 0 3 8 4 10 Tubificidae 5 38 0 8 4 4 6 64 0 2 33 59 9 Naididae 4 30 4 5 5 3 27 9 0 0 41 12Hirudinea 8 0 1 0 3 1 4 1 12 0 24 2 12Gastropoda 9 Physidae 8 5 0 0 8 7 2 0 1 58 24 0 7 Planorbidae 7 1 0 0 0 8 1 0 0 2 1 0 7 Lymnaeidae 0 1 1 0 0 2 0 0 0 0 0 0 7 Ancylidae 0 0 1 0 0 0 1 0 0 0 1 2Bivalvia 6 Corbiculidae 4 7 0 12 1 0 6 3 1 0 0 2 4 Sphaeridae 43 4 0 3 3 11 2 31 0 0 1 0Decapoda 5 Cambaridae 0 0 0 2 0 0 0 0 0 0 0 0Amphipoda 8 Talitridae 2 2 0 1 0 1 0 0 0 0 4 11Ephemeroptera 4 Baetidae 58 227 57 216 463 209 210 146 155 314 482 439 5 Caenidae 12 7 0 6 5 64 3 1 2 0 4 3 4 Heptageniidae 0 3 0 0 2 3 0 0 0 0 2 0 2 Leptophlebiidae 0 2 0 0 0 0 0 0 0 0 0 0 4 Tricorythidae 8 2 1 12 0 4 0 0 0 0 0 0Trichoptera 1 Brachycentridae 0 3 0 0 0 0 0 0 0 0 0 0 2 Helicopsychidae 10 1 0 0 0 27 2 3 0 0 0 4 4 Hydropsychidae 59 33 15 47 17 445 81 70 19 0 73 85 4 Hydroptilidae 12 5 12 3 11 13 1 5 0 1 9 26 3 Leptoceridae 2 1 0 0 0 1 0 0 0 0 0 0 3 Philopotamidae 96 134 16 23 14 123 121 188 18 1 28 0 0 Odontoceridae 1 0 0 0 0 0 0 0 0 0 0 0 6 Polycentropodidae 2 0 0 0 0 2 0 0 0 0 0 0

Table 15: Sum of individual macroinvertebrate abundances for three replicate samples collected at each sample site along Mary’s Creek, Big Fossil Creek, Sycamore Creek and Marine Creek in October 2010, continued.
Order Tol Family MRY1 MRY2 MRY3 BFC1 BFC2 BFC3 SYC1 SYC2 SYC3 MAR1 MAR2 MAR3Anisoptera 1 Gomphidae 1 3 0 0 0 0 0 0 0 3 0 0 9 Libellulidae 0 0 0 0 0 0 0 1 0 0 0 0Zygoptera 9 Coenagrionidae 82 144 14 86 22 49 10 13 9 26 23 36 9 Lestidae 1 0 0 0 0 0 0 0 0 1 0 0Hemiptera 10 Belostomatidae 0 3 0 0 0 0 0 0 0 0 0 0 5 Veliidae 4 1 1 0 0 0 0 0 0 0 0 0Coleoptera 5 Dytiscidae 1 0 0 0 0 0 0 0 0 1 0 0 2 Elmidae 123 163 5 18 64 18 138 122 5 10 37 245 5 Hydrophilidae 2 5 0 2 0 15 0 0 0 2 5 0Megaloptera 5 Corydalidae 0 3 0 0 0 0 0 0 0 0 0 0Lepidoptera 4 Pyralidae 0 0 2 1 2 1 1 0 0 0 2 21Diptera 5 Ceratopogonidae 1 2 0 4 1 1 2 5 1 0 2 0 6 Sciomyzidae 0 0 0 0 0 0 0 1 0 0 1 1 3 Simuliidae 0 16 2 1 14 23 2 1 3 2 3 1 7 Stratiomyidae 0 1 0 0 0 0 0 0 0 0 2 0 7 Tabanidae 0 2 0 0 0 0 0 0 0 0 0 0 6 Chironominae 337 367 117 268 243 1304 478 219 202 90 455 489 6 Tanypodinae 16 34 7 27 20 123 23 22 14 18 55 10 6 Orthocladiinae 38 49 100 15 2 47 12 9 3 10 23 105 Number of Individuals 948 1310 355 774 909 2539 1139 959 433 568 1324 1567
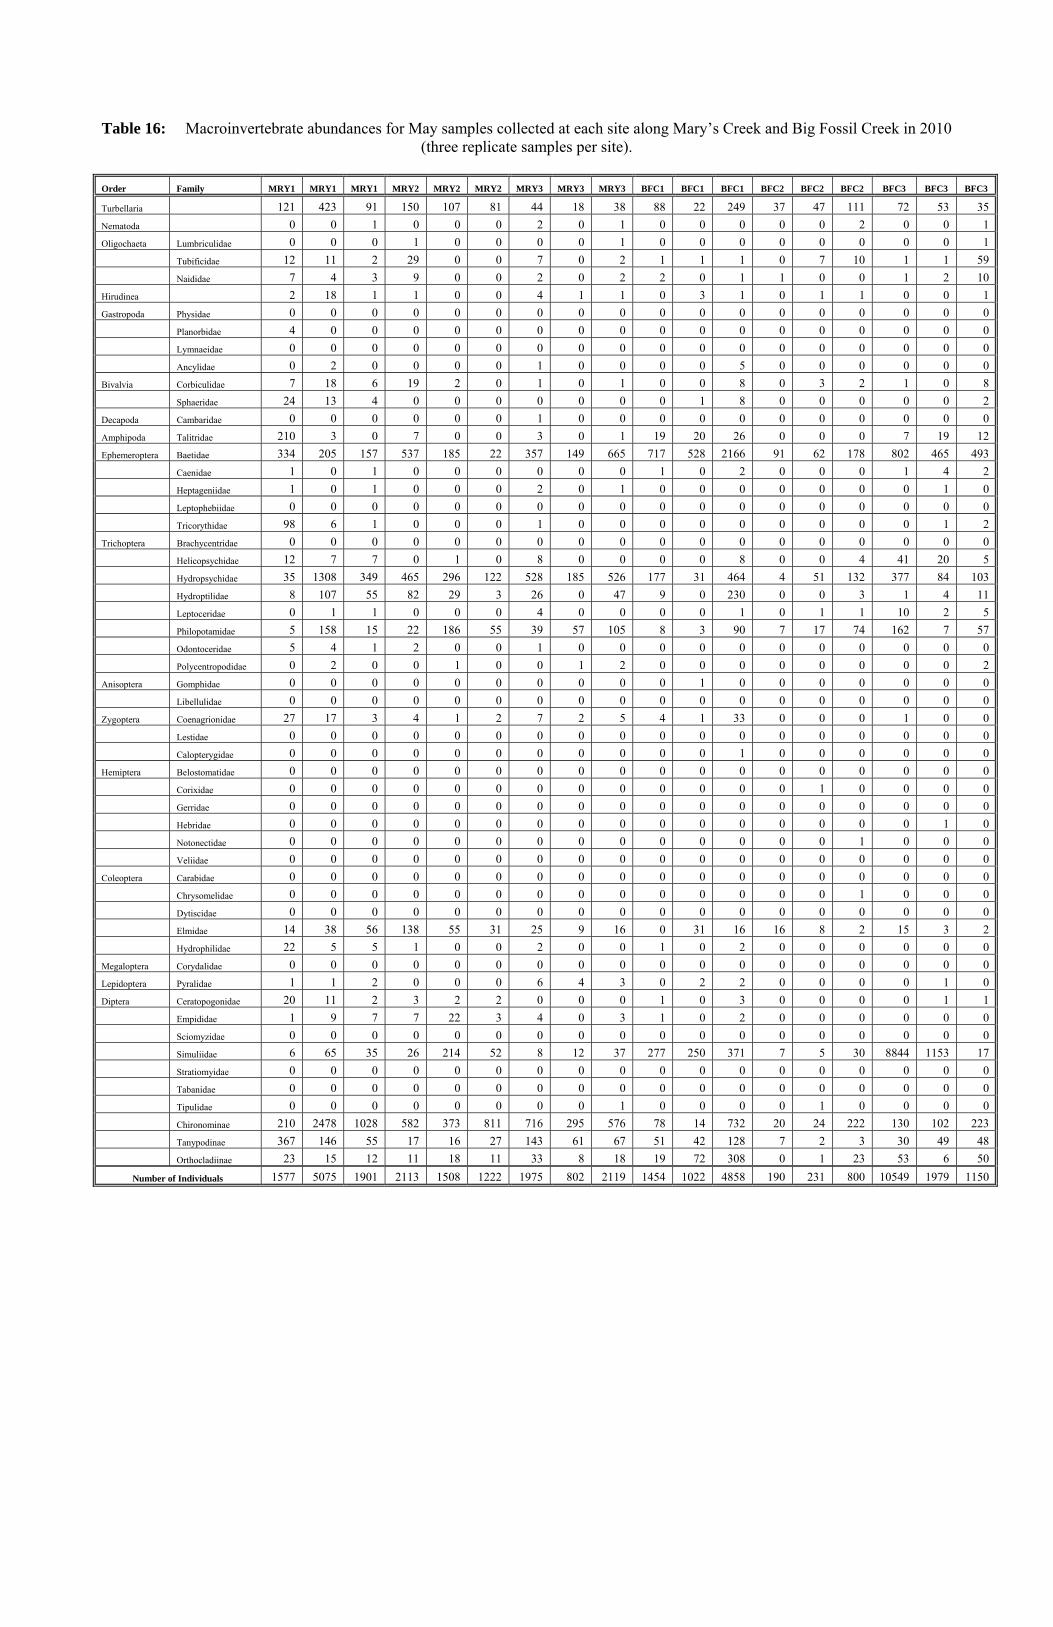
Table 16: Macroinvertebrate abundances for May samples collected at each site along Mary’s Creek and Big Fossil Creek in 2010 (three replicate samples per site).
Order Family MRY1 MRY1 MRY1 MRY2 MRY2 MRY2 MRY3 MRY3 MRY3 BFC1 BFC1 BFC1 BFC2 BFC2 BFC2 BFC3 BFC3 BFC3
Turbellaria 121 423 91 150 107 81 44 18 38 88 22 249 37 47 111 72 53 35 Nematoda 0 0 1 0 0 0 2 0 1 0 0 0 0 0 2 0 0 1 Oligochaeta Lumbriculidae 0 0 0 1 0 0 0 0 1 0 0 0 0 0 0 0 0 1 Tubificidae 12 11 2 29 0 0 7 0 2 1 1 1 0 7 10 1 1 59 Naididae 7 4 3 9 0 0 2 0 2 2 0 1 1 0 0 1 2 10 Hirudinea 2 18 1 1 0 0 4 1 1 0 3 1 0 1 1 0 0 1 Gastropoda Physidae 0 0 0 0 0 0 0 0 0 0 0 0 0 0 0 0 0 0 Planorbidae 4 0 0 0 0 0 0 0 0 0 0 0 0 0 0 0 0 0 Lymnaeidae 0 0 0 0 0 0 0 0 0 0 0 0 0 0 0 0 0 0 Ancylidae 0 2 0 0 0 0 1 0 0 0 0 5 0 0 0 0 0 0 Bivalvia Corbiculidae 7 18 6 19 2 0 1 0 1 0 0 8 0 3 2 1 0 8 Sphaeridae 24 13 4 0 0 0 0 0 0 0 1 8 0 0 0 0 0 2 Decapoda Cambaridae 0 0 0 0 0 0 1 0 0 0 0 0 0 0 0 0 0 0 Amphipoda Talitridae 210 3 0 7 0 0 3 0 1 19 20 26 0 0 0 7 19 12 Ephemeroptera Baetidae 334 205 157 537 185 22 357 149 665 717 528 2166 91 62 178 802 465 493 Caenidae 1 0 1 0 0 0 0 0 0 1 0 2 0 0 0 1 4 2 Heptageniidae 1 0 1 0 0 0 2 0 1 0 0 0 0 0 0 0 1 0 Leptophebiidae 0 0 0 0 0 0 0 0 0 0 0 0 0 0 0 0 0 0 Tricorythidae 98 6 1 0 0 0 1 0 0 0 0 0 0 0 0 0 1 2 Trichoptera Brachycentridae 0 0 0 0 0 0 0 0 0 0 0 0 0 0 0 0 0 0 Helicopsychidae 12 7 7 0 1 0 8 0 0 0 0 8 0 0 4 41 20 5 Hydropsychidae 35 1308 349 465 296 122 528 185 526 177 31 464 4 51 132 377 84 103 Hydroptilidae 8 107 55 82 29 3 26 0 47 9 0 230 0 0 3 1 4 11 Leptoceridae 0 1 1 0 0 0 4 0 0 0 0 1 0 1 1 10 2 5 Philopotamidae 5 158 15 22 186 55 39 57 105 8 3 90 7 17 74 162 7 57 Odontoceridae 5 4 1 2 0 0 1 0 0 0 0 0 0 0 0 0 0 0 Polycentropodidae 0 2 0 0 1 0 0 1 2 0 0 0 0 0 0 0 0 2 Anisoptera Gomphidae 0 0 0 0 0 0 0 0 0 0 1 0 0 0 0 0 0 0 Libellulidae 0 0 0 0 0 0 0 0 0 0 0 0 0 0 0 0 0 0 Zygoptera Coenagrionidae 27 17 3 4 1 2 7 2 5 4 1 33 0 0 0 1 0 0 Lestidae 0 0 0 0 0 0 0 0 0 0 0 0 0 0 0 0 0 0 Calopterygidae 0 0 0 0 0 0 0 0 0 0 0 1 0 0 0 0 0 0 Hemiptera Belostomatidae 0 0 0 0 0 0 0 0 0 0 0 0 0 0 0 0 0 0 Corixidae 0 0 0 0 0 0 0 0 0 0 0 0 0 1 0 0 0 0 Gerridae 0 0 0 0 0 0 0 0 0 0 0 0 0 0 0 0 0 0 Hebridae 0 0 0 0 0 0 0 0 0 0 0 0 0 0 0 0 1 0 Notonectidae 0 0 0 0 0 0 0 0 0 0 0 0 0 0 1 0 0 0 Veliidae 0 0 0 0 0 0 0 0 0 0 0 0 0 0 0 0 0 0 Coleoptera Carabidae 0 0 0 0 0 0 0 0 0 0 0 0 0 0 0 0 0 0 Chrysomelidae 0 0 0 0 0 0 0 0 0 0 0 0 0 0 1 0 0 0 Dytiscidae 0 0 0 0 0 0 0 0 0 0 0 0 0 0 0 0 0 0 Elmidae 14 38 56 138 55 31 25 9 16 0 31 16 16 8 2 15 3 2 Hydrophilidae 22 5 5 1 0 0 2 0 0 1 0 2 0 0 0 0 0 0 Megaloptera Corydalidae 0 0 0 0 0 0 0 0 0 0 0 0 0 0 0 0 0 0 Lepidoptera Pyralidae 1 1 2 0 0 0 6 4 3 0 2 2 0 0 0 0 1 0 Diptera Ceratopogonidae 20 11 2 3 2 2 0 0 0 1 0 3 0 0 0 0 1 1 Empididae 1 9 7 7 22 3 4 0 3 1 0 2 0 0 0 0 0 0 Sciomyzidae 0 0 0 0 0 0 0 0 0 0 0 0 0 0 0 0 0 0 Simuliidae 6 65 35 26 214 52 8 12 37 277 250 371 7 5 30 8844 1153 17 Stratiomyidae 0 0 0 0 0 0 0 0 0 0 0 0 0 0 0 0 0 0 Tabanidae 0 0 0 0 0 0 0 0 0 0 0 0 0 0 0 0 0 0 Tipulidae 0 0 0 0 0 0 0 0 1 0 0 0 0 1 0 0 0 0 Chironominae 210 2478 1028 582 373 811 716 295 576 78 14 732 20 24 222 130 102 223 Tanypodinae 367 146 55 17 16 27 143 61 67 51 42 128 7 2 3 30 49 48 Orthocladiinae 23 15 12 11 18 11 33 8 18 19 72 308 0 1 23 53 6 50
Number of Individuals 1577 5075 1901 2113 1508 1222 1975 802 2119 1454 1022 4858 190 231 800 10549 1979 1150
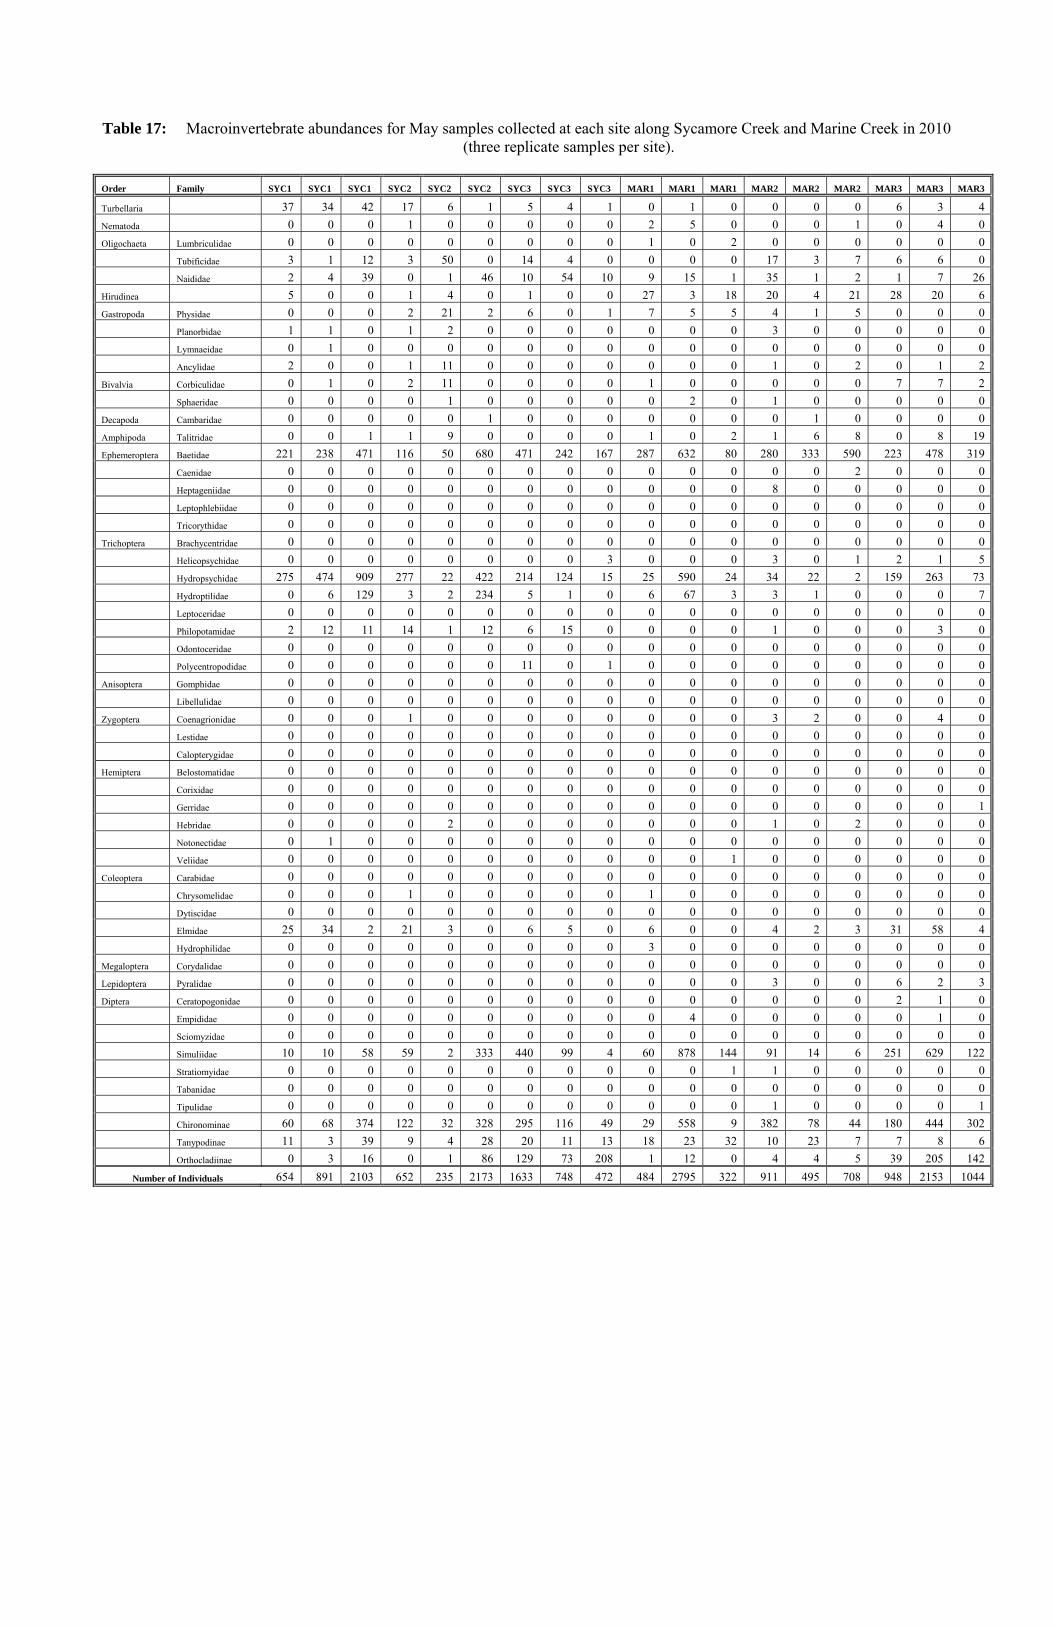
Table 17: Macroinvertebrate abundances for May samples collected at each site along Sycamore Creek and Marine Creek in 2010 (three replicate samples per site).
Order Family SYC1 SYC1 SYC1 SYC2 SYC2 SYC2 SYC3 SYC3 SYC3 MAR1 MAR1 MAR1 MAR2 MAR2 MAR2 MAR3 MAR3 MAR3
Turbellaria 37 34 42 17 6 1 5 4 1 0 1 0 0 0 0 6 3 4 Nematoda 0 0 0 1 0 0 0 0 0 2 5 0 0 0 1 0 4 0 Oligochaeta Lumbriculidae 0 0 0 0 0 0 0 0 0 1 0 2 0 0 0 0 0 0 Tubificidae 3 1 12 3 50 0 14 4 0 0 0 0 17 3 7 6 6 0 Naididae 2 4 39 0 1 46 10 54 10 9 15 1 35 1 2 1 7 26 Hirudinea 5 0 0 1 4 0 1 0 0 27 3 18 20 4 21 28 20 6 Gastropoda Physidae 0 0 0 2 21 2 6 0 1 7 5 5 4 1 5 0 0 0 Planorbidae 1 1 0 1 2 0 0 0 0 0 0 0 3 0 0 0 0 0 Lymnaeidae 0 1 0 0 0 0 0 0 0 0 0 0 0 0 0 0 0 0 Ancylidae 2 0 0 1 11 0 0 0 0 0 0 0 1 0 2 0 1 2 Bivalvia Corbiculidae 0 1 0 2 11 0 0 0 0 1 0 0 0 0 0 7 7 2 Sphaeridae 0 0 0 0 1 0 0 0 0 0 2 0 1 0 0 0 0 0 Decapoda Cambaridae 0 0 0 0 0 1 0 0 0 0 0 0 0 1 0 0 0 0 Amphipoda Talitridae 0 0 1 1 9 0 0 0 0 1 0 2 1 6 8 0 8 19 Ephemeroptera Baetidae 221 238 471 116 50 680 471 242 167 287 632 80 280 333 590 223 478 319 Caenidae 0 0 0 0 0 0 0 0 0 0 0 0 0 0 2 0 0 0 Heptageniidae 0 0 0 0 0 0 0 0 0 0 0 0 8 0 0 0 0 0 Leptophlebiidae 0 0 0 0 0 0 0 0 0 0 0 0 0 0 0 0 0 0 Tricorythidae 0 0 0 0 0 0 0 0 0 0 0 0 0 0 0 0 0 0 Trichoptera Brachycentridae 0 0 0 0 0 0 0 0 0 0 0 0 0 0 0 0 0 0 Helicopsychidae 0 0 0 0 0 0 0 0 3 0 0 0 3 0 1 2 1 5 Hydropsychidae 275 474 909 277 22 422 214 124 15 25 590 24 34 22 2 159 263 73 Hydroptilidae 0 6 129 3 2 234 5 1 0 6 67 3 3 1 0 0 0 7 Leptoceridae 0 0 0 0 0 0 0 0 0 0 0 0 0 0 0 0 0 0 Philopotamidae 2 12 11 14 1 12 6 15 0 0 0 0 1 0 0 0 3 0 Odontoceridae 0 0 0 0 0 0 0 0 0 0 0 0 0 0 0 0 0 0 Polycentropodidae 0 0 0 0 0 0 11 0 1 0 0 0 0 0 0 0 0 0 Anisoptera Gomphidae 0 0 0 0 0 0 0 0 0 0 0 0 0 0 0 0 0 0 Libellulidae 0 0 0 0 0 0 0 0 0 0 0 0 0 0 0 0 0 0 Zygoptera Coenagrionidae 0 0 0 1 0 0 0 0 0 0 0 0 3 2 0 0 4 0 Lestidae 0 0 0 0 0 0 0 0 0 0 0 0 0 0 0 0 0 0 Calopterygidae 0 0 0 0 0 0 0 0 0 0 0 0 0 0 0 0 0 0 Hemiptera Belostomatidae 0 0 0 0 0 0 0 0 0 0 0 0 0 0 0 0 0 0 Corixidae 0 0 0 0 0 0 0 0 0 0 0 0 0 0 0 0 0 0 Gerridae 0 0 0 0 0 0 0 0 0 0 0 0 0 0 0 0 0 1 Hebridae 0 0 0 0 2 0 0 0 0 0 0 0 1 0 2 0 0 0 Notonectidae 0 1 0 0 0 0 0 0 0 0 0 0 0 0 0 0 0 0 Veliidae 0 0 0 0 0 0 0 0 0 0 0 1 0 0 0 0 0 0 Coleoptera Carabidae 0 0 0 0 0 0 0 0 0 0 0 0 0 0 0 0 0 0 Chrysomelidae 0 0 0 1 0 0 0 0 0 1 0 0 0 0 0 0 0 0 Dytiscidae 0 0 0 0 0 0 0 0 0 0 0 0 0 0 0 0 0 0 Elmidae 25 34 2 21 3 0 6 5 0 6 0 0 4 2 3 31 58 4 Hydrophilidae 0 0 0 0 0 0 0 0 0 3 0 0 0 0 0 0 0 0 Megaloptera Corydalidae 0 0 0 0 0 0 0 0 0 0 0 0 0 0 0 0 0 0 Lepidoptera Pyralidae 0 0 0 0 0 0 0 0 0 0 0 0 3 0 0 6 2 3 Diptera Ceratopogonidae 0 0 0 0 0 0 0 0 0 0 0 0 0 0 0 2 1 0 Empididae 0 0 0 0 0 0 0 0 0 0 4 0 0 0 0 0 1 0 Sciomyzidae 0 0 0 0 0 0 0 0 0 0 0 0 0 0 0 0 0 0 Simuliidae 10 10 58 59 2 333 440 99 4 60 878 144 91 14 6 251 629 122 Stratiomyidae 0 0 0 0 0 0 0 0 0 0 0 1 1 0 0 0 0 0 Tabanidae 0 0 0 0 0 0 0 0 0 0 0 0 0 0 0 0 0 0 Tipulidae 0 0 0 0 0 0 0 0 0 0 0 0 1 0 0 0 0 1 Chironominae 60 68 374 122 32 328 295 116 49 29 558 9 382 78 44 180 444 302 Tanypodinae 11 3 39 9 4 28 20 11 13 18 23 32 10 23 7 7 8 6 Orthocladiinae 0 3 16 0 1 86 129 73 208 1 12 0 4 4 5 39 205 142
Number of Individuals 654 891 2103 652 235 2173 1633 748 472 484 2795 322 911 495 708 948 2153 1044
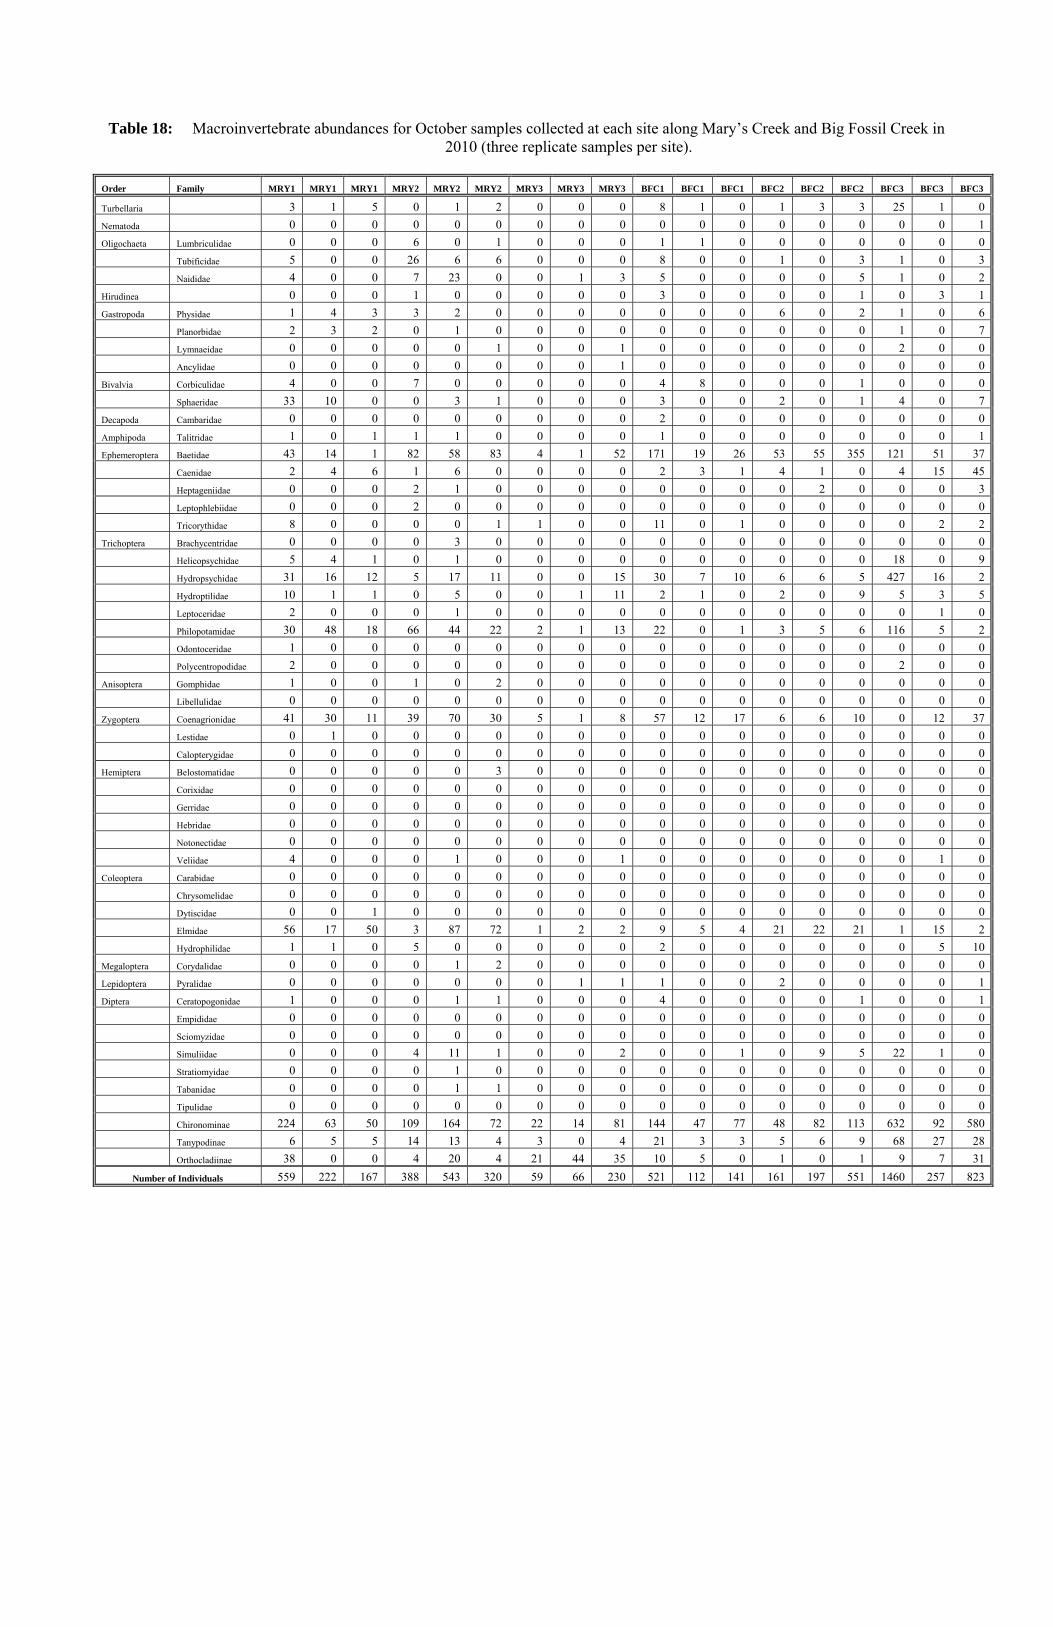
Table 18: Macroinvertebrate abundances for October samples collected at each site along Mary’s Creek and Big Fossil Creek in 2010 (three replicate samples per site).
Order Family MRY1 MRY1 MRY1 MRY2 MRY2 MRY2 MRY3 MRY3 MRY3 BFC1 BFC1 BFC1 BFC2 BFC2 BFC2 BFC3 BFC3 BFC3
Turbellaria 3 1 5 0 1 2 0 0 0 8 1 0 1 3 3 25 1 0 Nematoda 0 0 0 0 0 0 0 0 0 0 0 0 0 0 0 0 0 1 Oligochaeta Lumbriculidae 0 0 0 6 0 1 0 0 0 1 1 0 0 0 0 0 0 0 Tubificidae 5 0 0 26 6 6 0 0 0 8 0 0 1 0 3 1 0 3 Naididae 4 0 0 7 23 0 0 1 3 5 0 0 0 0 5 1 0 2 Hirudinea 0 0 0 1 0 0 0 0 0 3 0 0 0 0 1 0 3 1 Gastropoda Physidae 1 4 3 3 2 0 0 0 0 0 0 0 6 0 2 1 0 6 Planorbidae 2 3 2 0 1 0 0 0 0 0 0 0 0 0 0 1 0 7 Lymnaeidae 0 0 0 0 0 1 0 0 1 0 0 0 0 0 0 2 0 0 Ancylidae 0 0 0 0 0 0 0 0 1 0 0 0 0 0 0 0 0 0 Bivalvia Corbiculidae 4 0 0 7 0 0 0 0 0 4 8 0 0 0 1 0 0 0 Sphaeridae 33 10 0 0 3 1 0 0 0 3 0 0 2 0 1 4 0 7 Decapoda Cambaridae 0 0 0 0 0 0 0 0 0 2 0 0 0 0 0 0 0 0 Amphipoda Talitridae 1 0 1 1 1 0 0 0 0 1 0 0 0 0 0 0 0 1 Ephemeroptera Baetidae 43 14 1 82 58 83 4 1 52 171 19 26 53 55 355 121 51 37 Caenidae 2 4 6 1 6 0 0 0 0 2 3 1 4 1 0 4 15 45 Heptageniidae 0 0 0 2 1 0 0 0 0 0 0 0 0 2 0 0 0 3 Leptophlebiidae 0 0 0 2 0 0 0 0 0 0 0 0 0 0 0 0 0 0 Tricorythidae 8 0 0 0 0 1 1 0 0 11 0 1 0 0 0 0 2 2 Trichoptera Brachycentridae 0 0 0 0 3 0 0 0 0 0 0 0 0 0 0 0 0 0 Helicopsychidae 5 4 1 0 1 0 0 0 0 0 0 0 0 0 0 18 0 9 Hydropsychidae 31 16 12 5 17 11 0 0 15 30 7 10 6 6 5 427 16 2 Hydroptilidae 10 1 1 0 5 0 0 1 11 2 1 0 2 0 9 5 3 5 Leptoceridae 2 0 0 0 1 0 0 0 0 0 0 0 0 0 0 0 1 0 Philopotamidae 30 48 18 66 44 22 2 1 13 22 0 1 3 5 6 116 5 2 Odontoceridae 1 0 0 0 0 0 0 0 0 0 0 0 0 0 0 0 0 0 Polycentropodidae 2 0 0 0 0 0 0 0 0 0 0 0 0 0 0 2 0 0 Anisoptera Gomphidae 1 0 0 1 0 2 0 0 0 0 0 0 0 0 0 0 0 0 Libellulidae 0 0 0 0 0 0 0 0 0 0 0 0 0 0 0 0 0 0 Zygoptera Coenagrionidae 41 30 11 39 70 30 5 1 8 57 12 17 6 6 10 0 12 37 Lestidae 0 1 0 0 0 0 0 0 0 0 0 0 0 0 0 0 0 0 Calopterygidae 0 0 0 0 0 0 0 0 0 0 0 0 0 0 0 0 0 0 Hemiptera Belostomatidae 0 0 0 0 0 3 0 0 0 0 0 0 0 0 0 0 0 0 Corixidae 0 0 0 0 0 0 0 0 0 0 0 0 0 0 0 0 0 0 Gerridae 0 0 0 0 0 0 0 0 0 0 0 0 0 0 0 0 0 0 Hebridae 0 0 0 0 0 0 0 0 0 0 0 0 0 0 0 0 0 0 Notonectidae 0 0 0 0 0 0 0 0 0 0 0 0 0 0 0 0 0 0 Veliidae 4 0 0 0 1 0 0 0 1 0 0 0 0 0 0 0 1 0 Coleoptera Carabidae 0 0 0 0 0 0 0 0 0 0 0 0 0 0 0 0 0 0 Chrysomelidae 0 0 0 0 0 0 0 0 0 0 0 0 0 0 0 0 0 0 Dytiscidae 0 0 1 0 0 0 0 0 0 0 0 0 0 0 0 0 0 0 Elmidae 56 17 50 3 87 72 1 2 2 9 5 4 21 22 21 1 15 2 Hydrophilidae 1 1 0 5 0 0 0 0 0 2 0 0 0 0 0 0 5 10 Megaloptera Corydalidae 0 0 0 0 1 2 0 0 0 0 0 0 0 0 0 0 0 0 Lepidoptera Pyralidae 0 0 0 0 0 0 0 1 1 1 0 0 2 0 0 0 0 1 Diptera Ceratopogonidae 1 0 0 0 1 1 0 0 0 4 0 0 0 0 1 0 0 1 Empididae 0 0 0 0 0 0 0 0 0 0 0 0 0 0 0 0 0 0 Sciomyzidae 0 0 0 0 0 0 0 0 0 0 0 0 0 0 0 0 0 0 Simuliidae 0 0 0 4 11 1 0 0 2 0 0 1 0 9 5 22 1 0 Stratiomyidae 0 0 0 0 1 0 0 0 0 0 0 0 0 0 0 0 0 0 Tabanidae 0 0 0 0 1 1 0 0 0 0 0 0 0 0 0 0 0 0 Tipulidae 0 0 0 0 0 0 0 0 0 0 0 0 0 0 0 0 0 0 Chironominae 224 63 50 109 164 72 22 14 81 144 47 77 48 82 113 632 92 580 Tanypodinae 6 5 5 14 13 4 3 0 4 21 3 3 5 6 9 68 27 28 Orthocladiinae 38 0 0 4 20 4 21 44 35 10 5 0 1 0 1 9 7 31
Number of Individuals 559 222 167 388 543 320 59 66 230 521 112 141 161 197 551 1460 257 823
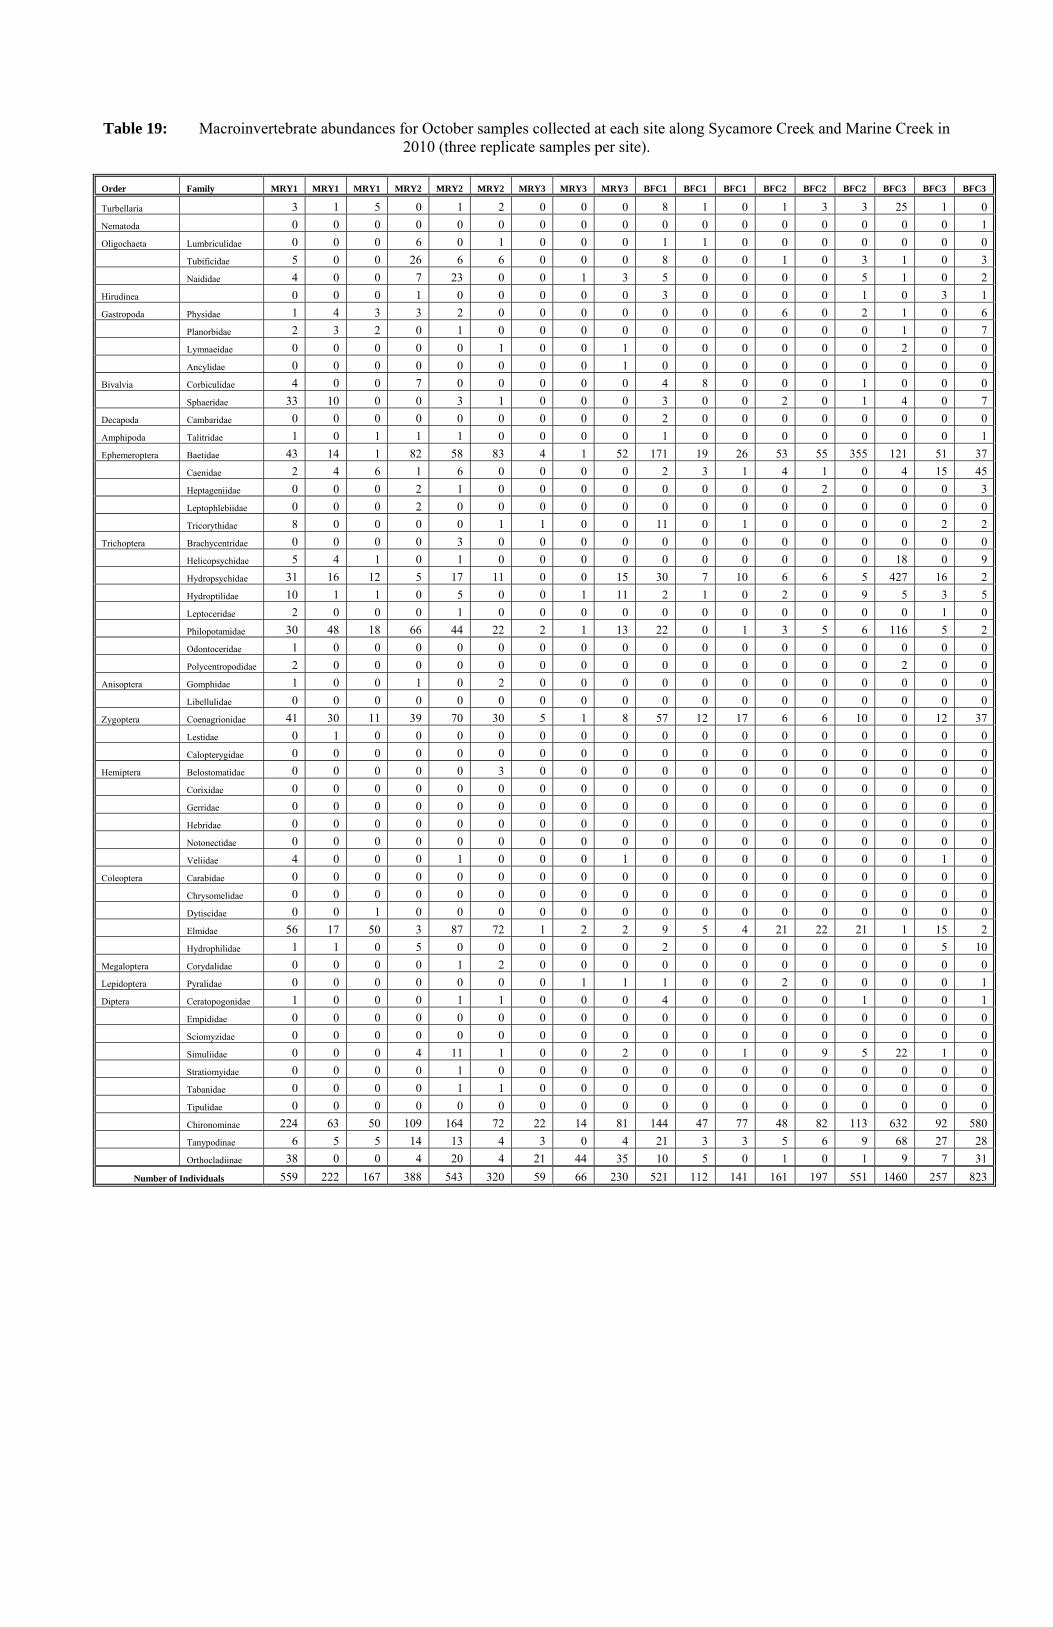
Table 19: Macroinvertebrate abundances for October samples collected at each site along Sycamore Creek and Marine Creek in 2010 (three replicate samples per site).
Order Family MRY1 MRY1 MRY1 MRY2 MRY2 MRY2 MRY3 MRY3 MRY3 BFC1 BFC1 BFC1 BFC2 BFC2 BFC2 BFC3 BFC3 BFC3
Turbellaria 3 1 5 0 1 2 0 0 0 8 1 0 1 3 3 25 1 0 Nematoda 0 0 0 0 0 0 0 0 0 0 0 0 0 0 0 0 0 1 Oligochaeta Lumbriculidae 0 0 0 6 0 1 0 0 0 1 1 0 0 0 0 0 0 0 Tubificidae 5 0 0 26 6 6 0 0 0 8 0 0 1 0 3 1 0 3 Naididae 4 0 0 7 23 0 0 1 3 5 0 0 0 0 5 1 0 2 Hirudinea 0 0 0 1 0 0 0 0 0 3 0 0 0 0 1 0 3 1 Gastropoda Physidae 1 4 3 3 2 0 0 0 0 0 0 0 6 0 2 1 0 6 Planorbidae 2 3 2 0 1 0 0 0 0 0 0 0 0 0 0 1 0 7 Lymnaeidae 0 0 0 0 0 1 0 0 1 0 0 0 0 0 0 2 0 0 Ancylidae 0 0 0 0 0 0 0 0 1 0 0 0 0 0 0 0 0 0 Bivalvia Corbiculidae 4 0 0 7 0 0 0 0 0 4 8 0 0 0 1 0 0 0 Sphaeridae 33 10 0 0 3 1 0 0 0 3 0 0 2 0 1 4 0 7 Decapoda Cambaridae 0 0 0 0 0 0 0 0 0 2 0 0 0 0 0 0 0 0 Amphipoda Talitridae 1 0 1 1 1 0 0 0 0 1 0 0 0 0 0 0 0 1 Ephemeroptera Baetidae 43 14 1 82 58 83 4 1 52 171 19 26 53 55 355 121 51 37 Caenidae 2 4 6 1 6 0 0 0 0 2 3 1 4 1 0 4 15 45 Heptageniidae 0 0 0 2 1 0 0 0 0 0 0 0 0 2 0 0 0 3 Leptophlebiidae 0 0 0 2 0 0 0 0 0 0 0 0 0 0 0 0 0 0 Tricorythidae 8 0 0 0 0 1 1 0 0 11 0 1 0 0 0 0 2 2 Trichoptera Brachycentridae 0 0 0 0 3 0 0 0 0 0 0 0 0 0 0 0 0 0 Helicopsychidae 5 4 1 0 1 0 0 0 0 0 0 0 0 0 0 18 0 9 Hydropsychidae 31 16 12 5 17 11 0 0 15 30 7 10 6 6 5 427 16 2 Hydroptilidae 10 1 1 0 5 0 0 1 11 2 1 0 2 0 9 5 3 5 Leptoceridae 2 0 0 0 1 0 0 0 0 0 0 0 0 0 0 0 1 0 Philopotamidae 30 48 18 66 44 22 2 1 13 22 0 1 3 5 6 116 5 2 Odontoceridae 1 0 0 0 0 0 0 0 0 0 0 0 0 0 0 0 0 0 Polycentropodidae 2 0 0 0 0 0 0 0 0 0 0 0 0 0 0 2 0 0 Anisoptera Gomphidae 1 0 0 1 0 2 0 0 0 0 0 0 0 0 0 0 0 0 Libellulidae 0 0 0 0 0 0 0 0 0 0 0 0 0 0 0 0 0 0 Zygoptera Coenagrionidae 41 30 11 39 70 30 5 1 8 57 12 17 6 6 10 0 12 37 Lestidae 0 1 0 0 0 0 0 0 0 0 0 0 0 0 0 0 0 0 Calopterygidae 0 0 0 0 0 0 0 0 0 0 0 0 0 0 0 0 0 0 Hemiptera Belostomatidae 0 0 0 0 0 3 0 0 0 0 0 0 0 0 0 0 0 0 Corixidae 0 0 0 0 0 0 0 0 0 0 0 0 0 0 0 0 0 0 Gerridae 0 0 0 0 0 0 0 0 0 0 0 0 0 0 0 0 0 0 Hebridae 0 0 0 0 0 0 0 0 0 0 0 0 0 0 0 0 0 0 Notonectidae 0 0 0 0 0 0 0 0 0 0 0 0 0 0 0 0 0 0 Veliidae 4 0 0 0 1 0 0 0 1 0 0 0 0 0 0 0 1 0 Coleoptera Carabidae 0 0 0 0 0 0 0 0 0 0 0 0 0 0 0 0 0 0 Chrysomelidae 0 0 0 0 0 0 0 0 0 0 0 0 0 0 0 0 0 0 Dytiscidae 0 0 1 0 0 0 0 0 0 0 0 0 0 0 0 0 0 0 Elmidae 56 17 50 3 87 72 1 2 2 9 5 4 21 22 21 1 15 2 Hydrophilidae 1 1 0 5 0 0 0 0 0 2 0 0 0 0 0 0 5 10 Megaloptera Corydalidae 0 0 0 0 1 2 0 0 0 0 0 0 0 0 0 0 0 0 Lepidoptera Pyralidae 0 0 0 0 0 0 0 1 1 1 0 0 2 0 0 0 0 1 Diptera Ceratopogonidae 1 0 0 0 1 1 0 0 0 4 0 0 0 0 1 0 0 1 Empididae 0 0 0 0 0 0 0 0 0 0 0 0 0 0 0 0 0 0 Sciomyzidae 0 0 0 0 0 0 0 0 0 0 0 0 0 0 0 0 0 0 Simuliidae 0 0 0 4 11 1 0 0 2 0 0 1 0 9 5 22 1 0 Stratiomyidae 0 0 0 0 1 0 0 0 0 0 0 0 0 0 0 0 0 0 Tabanidae 0 0 0 0 1 1 0 0 0 0 0 0 0 0 0 0 0 0 Tipulidae 0 0 0 0 0 0 0 0 0 0 0 0 0 0 0 0 0 0 Chironominae 224 63 50 109 164 72 22 14 81 144 47 77 48 82 113 632 92 580 Tanypodinae 6 5 5 14 13 4 3 0 4 21 3 3 5 6 9 68 27 28 Orthocladiinae 38 0 0 4 20 4 21 44 35 10 5 0 1 0 1 9 7 31
Number of Individuals 559 222 167 388 543 320 59 66 230 521 112 141 161 197 551 1460 257 823
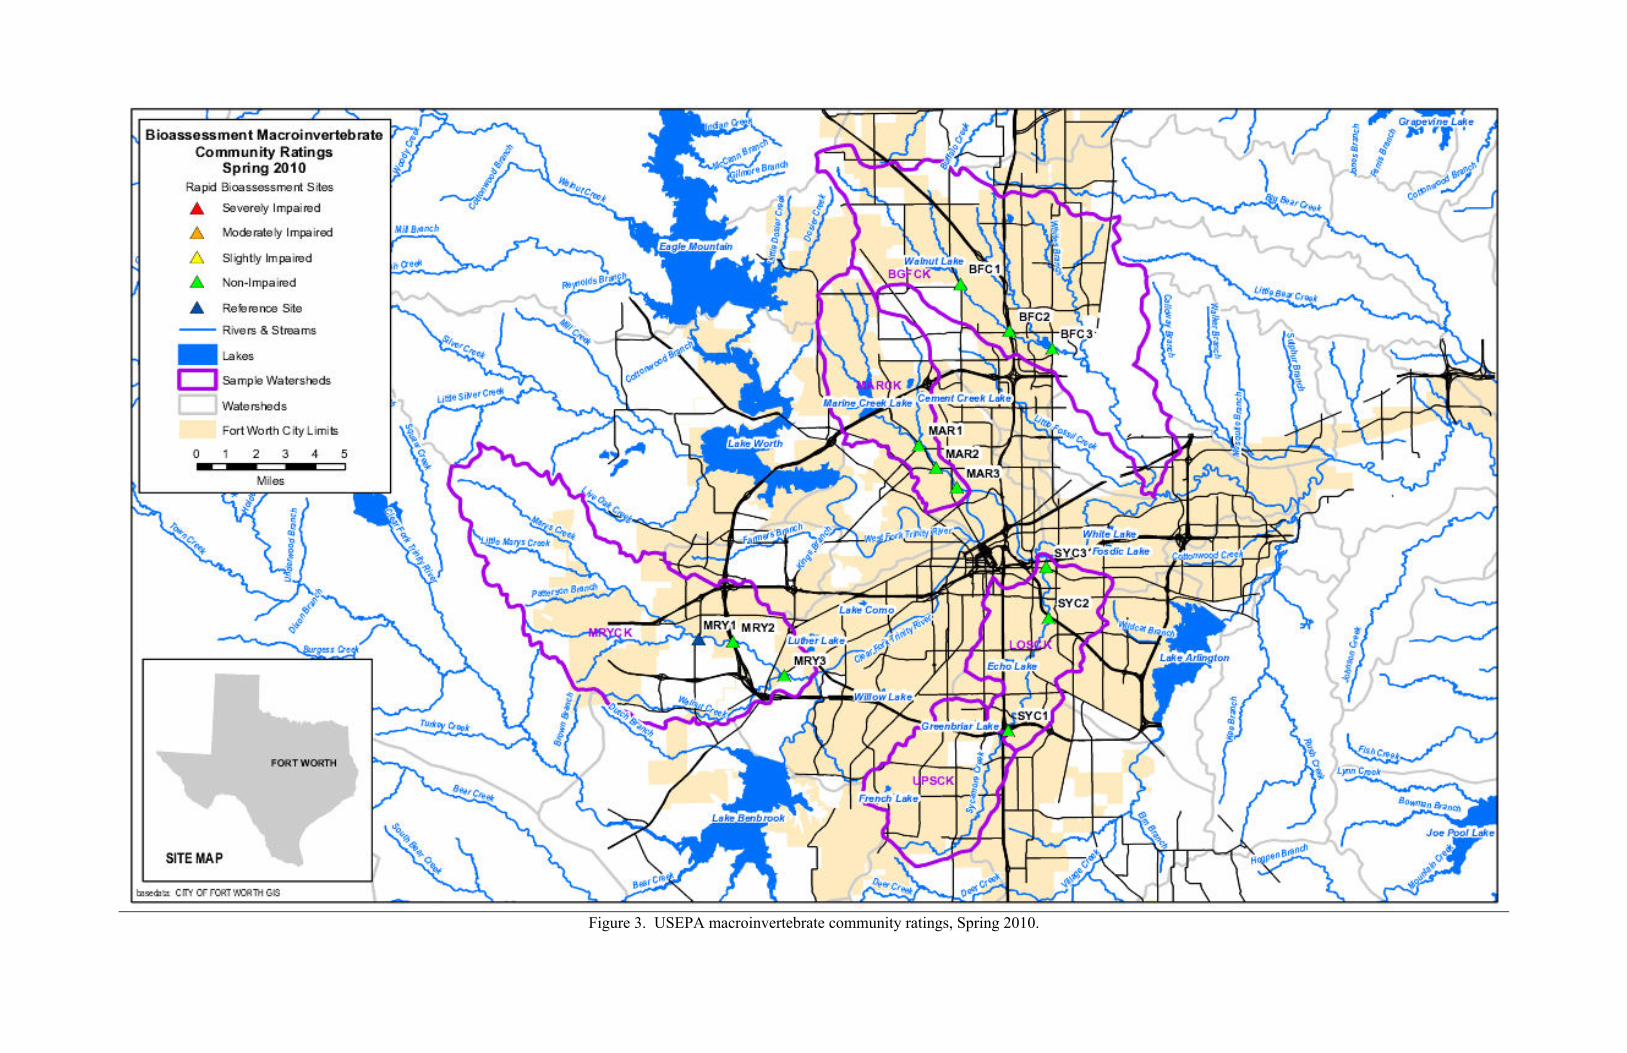
Figure 3. USEPA macroinvertebrate community ratings, Spring 2010.
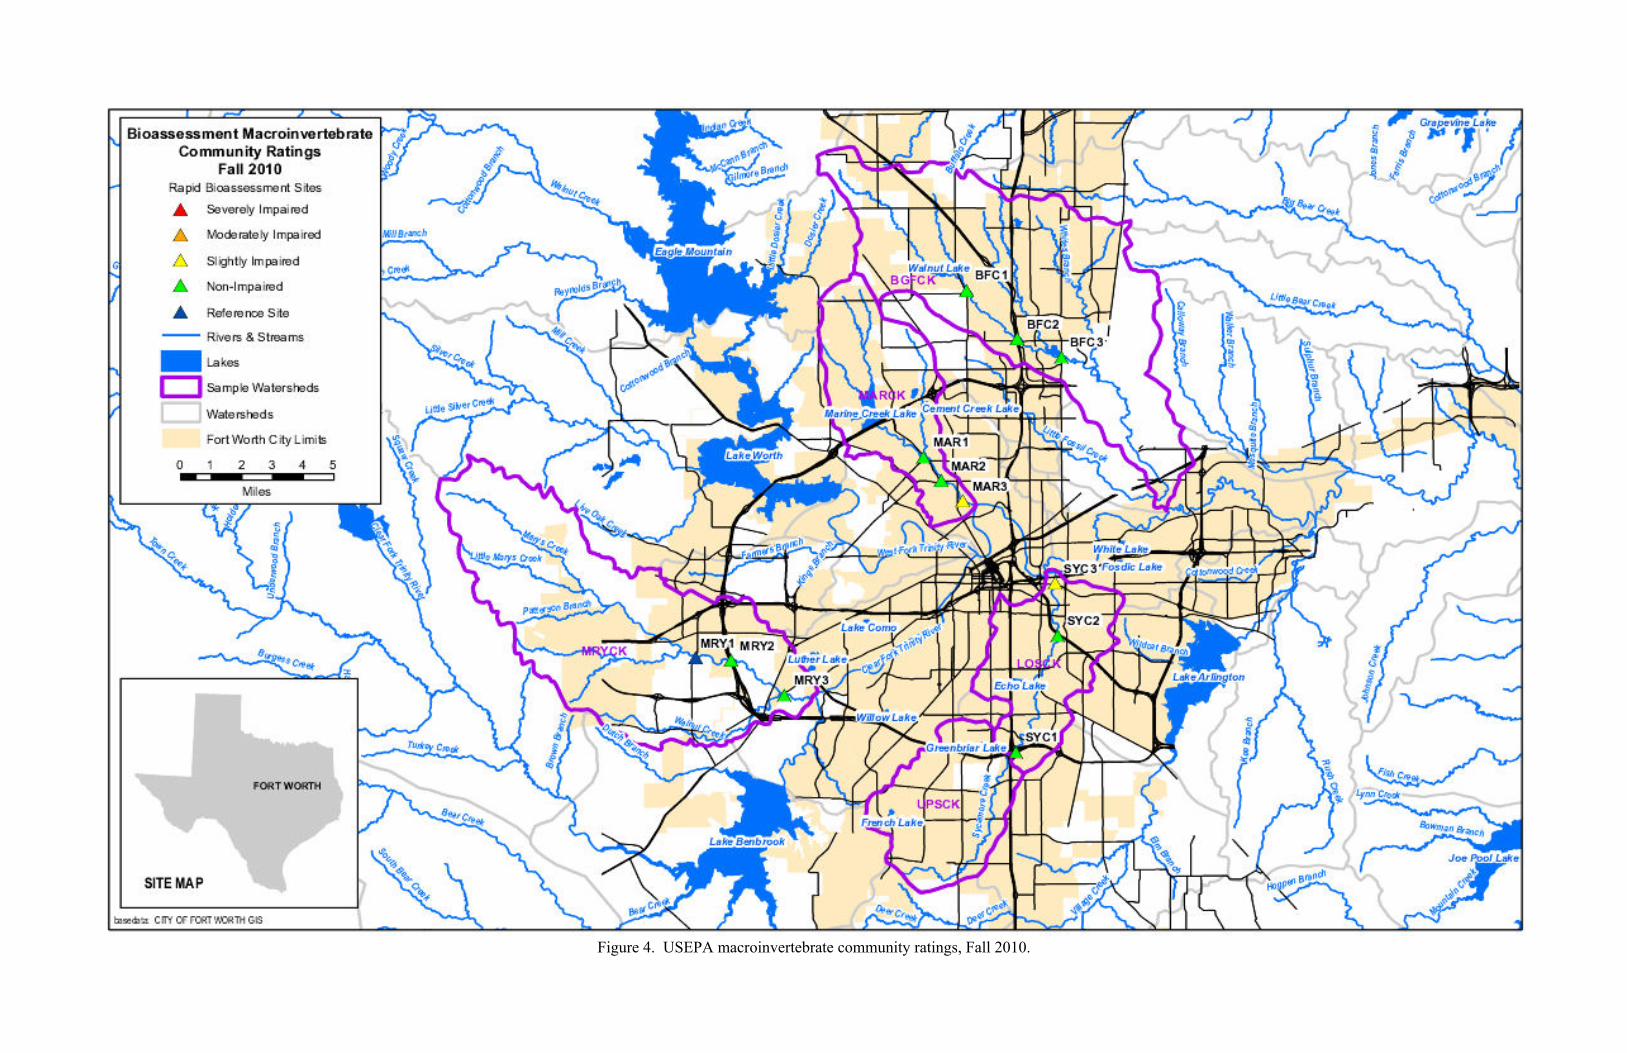
Figure 4. USEPA macroinvertebrate community ratings, Fall 2010.

Figure 5. TX-IBI aquatic life use ratings, Spring 2010.
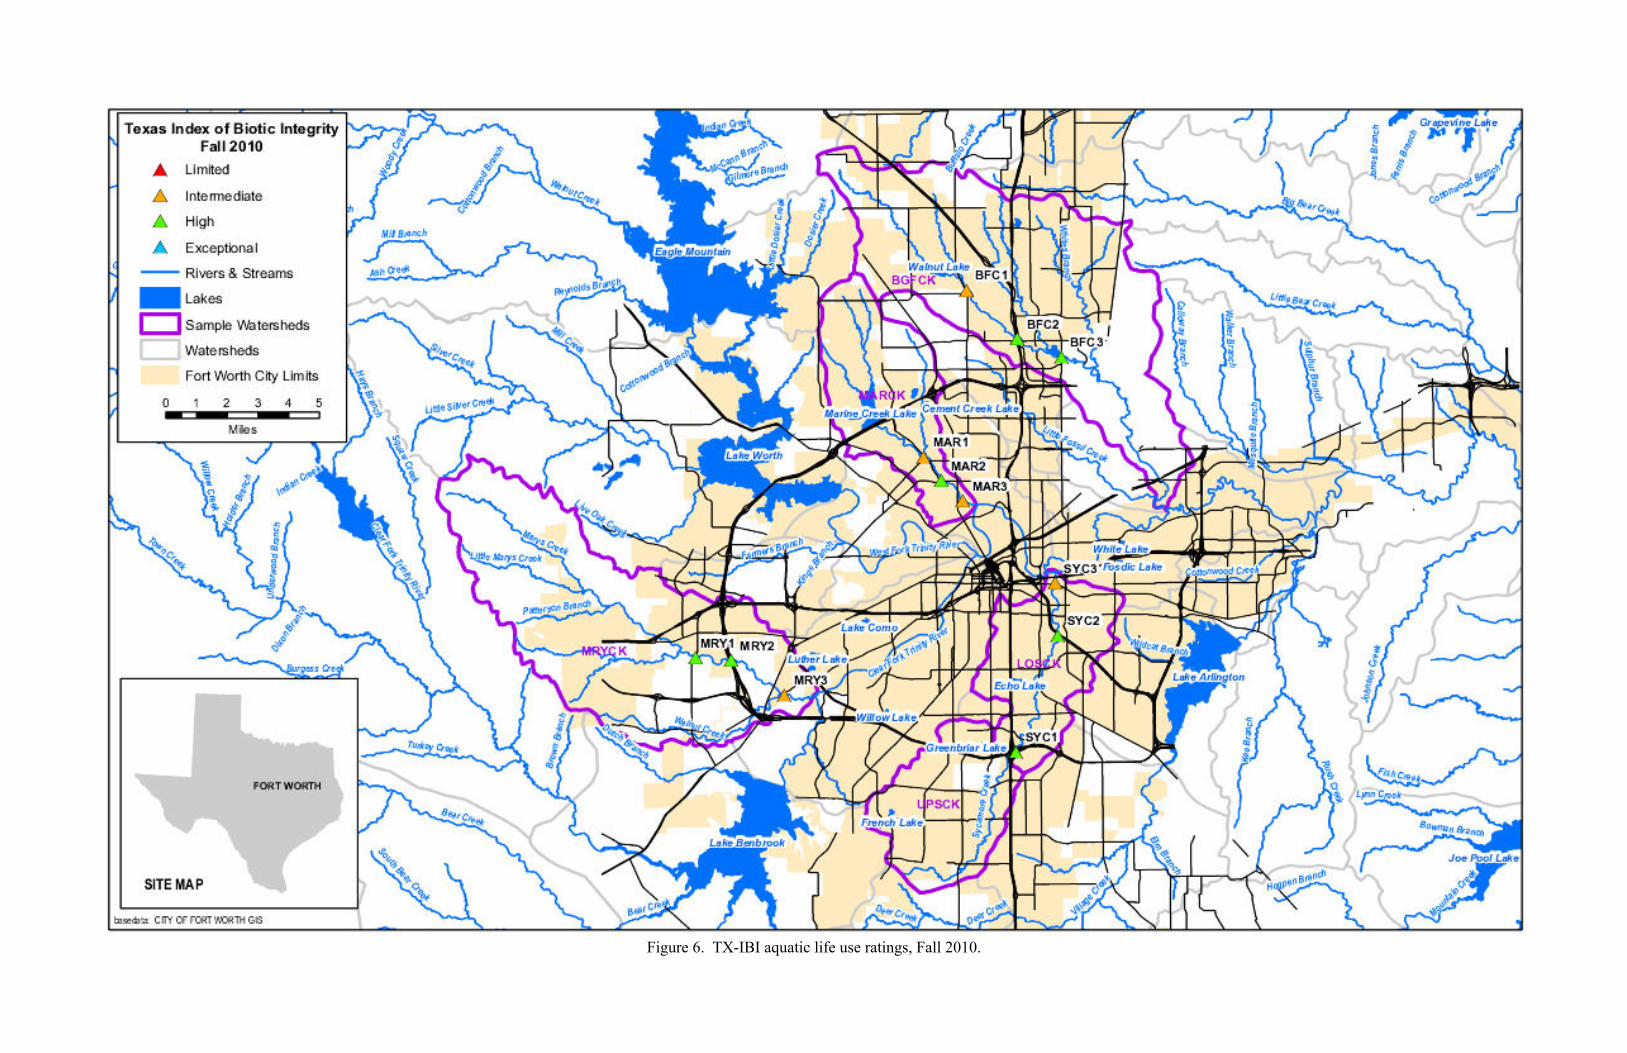
Figure 6. TX-IBI aquatic life use ratings, Fall 2010.