Embed Size (px)
Citation preview
Appendix D
INTEC Injection Well: Summary of Historical Information and Groundwater Quality Trends,
EDF-3943, Revision 0
D- 1

D-2

Engineering Design File
Document ID: EDF-3943
Effective Date: 1211 8/03 Revision ID:O
Project No. 23502
INTEC Injection Well: Summary of Historical Information and Groundwater Quality Trends
Prepared for: US. Department of Energy Idaho Operations office Idaho Falls, Idaho
Form 412.14 10/9/2003 Rev. 05
431.02 01 13012003 Rev. 11
ENGINEERING DESIGN FILE EDF-3943 Revision 0
Page 1 of 93
EDFNo.: 3943 EDF Rev. No.: 0 Project File No.: 23502
1. Title: INTEC Injection Well: Summary of Historical Information and Groundwater Quality Trends 2. Index Codes:
Building/Type CPP-23 SSC ID Site Area INTEC
3. NPH Performance Category: or N/A
4. EDF Safety Category: or N/A SCC Safety Category: or IX1 N/A
5. Summary: This Engineering Design File summarizes existing information regarding the history of the former CPP-23 injection well at the Idaho Nuclear Technology and Engineering Center. The injection well received service waste from 1952 through 1986 and was plugged in 1989. This document also includes historical information regarding composition of service waste stream and groundwater quality trends in the Snake River Plain Aquifer downgradient of the injection well.
6. Review (R) and Approval (A) and Acceptance (Ac) Signatures:
H. DoornbodORB Review
\I \
Doc. Control Ae Rfiul. / ,7 / / 4 3 7. Distribution:
(Name and Mail Stop) I 8. Does document contain sensitive unclassified information?
If Yes, what category:
9. Can document be externally distributed? Yes 0 No 10. Uniform File Code: UFC-6102 Disposition Authority: ENVl -h-1
0 Yes No
Cutoff at submission of final financial status report for the site, or after resolution of all issues rising from litigation, claim, negotiation, audit, cost recovery, or other action, whichever is later. Destroy 10 years after cutoff
Record Retention Period: with written approval from EPA award official.
Item and activity to which the QA Record apply: 11. For QA Records Classification Only:
12. NRC related? 0 Yes No
0 Lifetime Nonpermanent 0 Permanent N/A

431.02 01 /30/2003 Rev. 1 1
ENGINEERING DESIGN FILE EDF-3943 Revision 0
Page 2 of 93
EDFNo.: 3943 EDF Rev. No.: 0 Project File No.: 23502
. Title: INTEC Injection Well: Summary of Historical Information and Groundwater Quality Trends !. Index Codes:
Buildingnype CPP-23 SSC ID Site Area INTEC
3. Registered Professional Engineer's Stamp (if required) N/A

431.02 01/30/2003 Rev. 11
ENGINEERING DESIGN FILE
EXECUTIVE SUMMARY
EDF-3943 Revision 0
Page 3 of 93
The former Idaho Nuclear Technology and Engineering Center (INTEC) injection well was routinely used to discharge INTEC service wastewater to the Snake River Plain Aquifer (SRPA) from 1952 to February 1984. During its operation, the injection well constituted a source of low-level radioactivity to the aquifer. The principal radionuclides of environmental significance discharged to the injection well were tritium (H-3), strontium-90 (Sr-90), iodine-1 29 (I-129), and cesium-137 (Cs-l37), with tritium accounting for the vast majority of the total curies.
This Engineering Design File (EDF) document summarizes known historical information regarding the installation, construction, reconstruction, and decommissioning of the former INTEC injection well. Available information regarding the composition of the service wastewater discharged to the injection well was summarized and used to calculate a revised estimate of the total amount of 1-129 discharged to the injection well. Groundwater quality impacts and trends in the SRPA downgradient of the former injection well are also summarized.
The results of these studies indicate that
The service waste stream contained very little suspended solids, and “sludge” did not accumulate in the injection well.
Solid material that remained at the bottom of the injection well in 1989 at the time the well was plugged consisted of sloughed well filter pack material and interbed sediments (not “sludge” derived from the service waste).
The amount of I- 129 previously assumed to have been discharged to the injection well during its operation was approximately 40% too high. A revised estimate of the total amount of 1-129 discharged to the injection well indicates a total of approximately 0.86 Ci (as opposed to the previous estimate of 1.39 Ci).
Tritium activities have declined below the drinking water maximum contaminant level (MCL) in all downgradient aquifer monitor wells and in nearly all perched water monitor wells at INTEC.
Sr-90 levels in perched water monitor wells closest to the former injection well are at or below the MCL. However, Sr-90 activities in several aquifer monitor wells downgradient of the former injection well remain up to five times higher than the drinking water MCL, and two perched water monitor wells close to the tank farm contain very high Sr-90 activities. The distribution of Sr-90 strongly suggests that the primary source of Sr-90 in the perched water is contaminated soils in the vicinity of the tank farm, not the former injection well.
Iodine-129 activities in the aquifer have declined below the MCL in all SRPA monitor wells and in all the perched water monitor wells. Given the low 1-129 activities that currently exist in the aquifer, there is no evidence

431.02 01 130/2003 Rev. 11
ENGINEERING DESIGN FILE EDF-3943 Revision 0
Page 4 of 93
that there is a significant 1-129 source near the INTEC injection well. If a residual 1-129 source still exists, the data indicate that it is releasing 1-129 at a very slow rate, and significant future increases in 1-129 activity in the groundwater are not likely.
0 Volatile organic compound (VOC) concentrations in the aquifer at and downgradient of the former injection well are far below MCLs for all compounds. Based on process knowledge and groundwater monitoring results, there is no evidence that the injection well was ever used for routine disposal of organic compounds, and there is no indication of any significant historical or existing source of VOCs in the vadose zone or groundwater near the former injection well.
In summary, tritium and 1-129 activities are already below their respective MCLs in the aquifer downgradient of INTEC, and no significant residual sources of these two radionuclides appear to exist at or near the former injection well. Sr-90 activities in the aquifer currently exceed the MCL downgradient of INTEC, and vadose zone and aquifer matrix materials near the tank farm appear to constitute a residual secondary source of Sr-90 to groundwater. However, Sr-90 concentrations are slowly declining in wells near and downgradient of INTEC, and groundwater quality trends indicate that Sr-90 activities in groundwater outside the INTEC security fence will decline below the MCL by 2095. The remedial investigation of the tank farm being performed under Operable Unit 3-14 will address future impacts of contaminated tank farm soils on the aquifer, including residual Sr-90 in the shallow perched water.

431.02 01i3Ol2003
ENGINEERING DESIGN FILE EDF-3943 Revision 0
Rev . 11 Page 5 of 93
CONTENTS
EXECUTIVE SUMMARY ........................................................................................................................... 3
ACRONYMS ................................................................................................................................................ 7
1 . INTRODUCTION ............................................................................................................................ 9
2 .
3 .
HISTORICAL SUMMARY OF INTEC INJECTION WELL ........................................................ 9
INTEC SERVICE WASTE COMPOSITION ................................................................................ 12
4 . INJECTION WELL 1-129 SOURCE TERM ................................................................................. 13
5 . GROUNDWATER QUALITY NEAR FORMER INJECTION WELL ....................................... 15
6 . CONCLUSIONS ............................................................................................................................ 17
7 . REFERENCES ............................................................................................................................... 18
Appendix A . History of the INTEC Injection Well ................................................................................... 19
Appendix B . Service Waste Composition Graphs ..................................................................................... 49
Appendix C . Iodine-129 Source Term Evaluation for Operable Unit 3.13. Group 5 . Snake River Plain Aquifer ............................................................................................................................................... 55
Appendix D . Groundwater Quality and Trends ......................................................................................... 73
Appendix E . Letter from Allied Chemical ................................................................................................ 87
FIGURES
1 . Map of INTEC showing former injection well (CPP-03) and nearby groundwater monitor wells .................................................................................................................................................. 10
2 . INTEC service waste flow rate to injection well .............................................................................. 11
TABLES
1 . Reported activity of selected radionuclides discharged to the INTEC injection well during the time period when records were kept ................................................................................................. 12

431.02 01130/2003 Rev. 1 1
ENGINEERING DESIGN FILE EDF-3943 Revision 0
Page 6 of 93
This page is intentionally left blank.

431.02 01 I3012003 Rev. 11
bls
COC
CPP
EDF
FFNCO
HLLW
ICPP
INEEL
INTEC
MCL
ou PEW
RAO
RYBRA
SRPA
TCA
USGS
voc WCF
ENGINEERING DESIGN FILE
ACRONYMS
below land surface
contaminant of concern
Chemical Processing Plant (designation for buildings and areas at INTEC)
Engineering Design File
Federal Facility Agreement and Consent Order
high-level liquid waste
Idaho Chemical Processing Plant (now INTEC)
Idaho National Engineering and Environmental Laboratory
Idaho Nuclear Technology and Engineering Center
maximum contaminant level
operable unit
process equipment waste
remedial action objective
remedial investigationhaseline risk assessment
Snake River Plain Aquifer
trichloroe thane
United States Geological Survey
volatile organic compound
Waste Calcining Facility (CPP-633)
EDF-3943 Revision 0
Page 7 of 93

431.02 01 I3012003 Rev. 11
ENGINEERING DESIGN FILE EDF-3943 Revision 0
Page 8 of 93
This page is intentionally left blank.

431.02 01 l30l2003 Rev. 11
ENGINEERING DESIGN FILE EDF-3943 Revision 0
Page 9 of 93
INTEC Injection Well: Summary of Historical Information and Groundwater Quality Trends
1. INTRODUCTION
The former Idaho Nuclear Technology and Engineering Center (INTEC) injection well, located at the north edge of Building CPP-666 (Figure I), was routinely used to discharge INTEC service wastewater to the Snake River Plain Aquifer (SRPA) from 1952 to February 1984. When it was in operation, the injection well constituted a source of low-level radioactivity to the aquifer. The principal radionuclides of environmental significance discharged to the injection well were tritium (H-3), strontium-90 (Sr-90), iodine-129 (I-129), and cesium-137 (Cs-137), with tritium accounting for the vast majority of the total curies.
Because the injection well discharged radionuclides directly to the aquifer, it has long been the focus of environmental scrutiny. As a result of lingering questions and concerns regarding the possibility that the former injection well might constitute a significant residual source of contaminants to the aquifer, a review of historical information and files was conducted. This Engineering Design File (EDF) summarizes known historical information regarding the installation, construction, reconstruction, and decommissioning of the former INTEC injection well. Available information regarding the composition of the service wastewater discharged to the injection well is summarized and used to calculate a revised estimate of the 1-129 discharged to the injection well. Groundwater quality impacts and trends in the SRPA downgradient of the former injection well are also summarized.
2. HISTORICAL SUMMARY OF INTEC INJECTION WELL
The former injection well was used routinely from 1952 to February 1984 to dispose of service wastewater from INTEC operations to the SRPA. Over the years, the injection well has been variously referred to as Well CPP-03, as Well MEH-FE-PL-304, and by its Federal Facility Agreement and Consent Order (FFNCO) site designation, CPP-23.
The injection well was drilled during 1950-5 1 to a total depth of 597 Et below land surface (bls). Beginning in 1952, the injection well received an average of approximately 1 million gallons per day (MGD) of service wastewater. The service waste stream consisted of primarily plant cooling water, demineralizer and boiler blowdown water, and process equipment waste (PEW) evaporator condensates. Figure 2 shows the service waste flow rate into the injection well over its operational lifetime. A total volume of approximately 12 billion gallons of service wastewater was disposed to the injection well during its lifetime.
Two major well failures and reconstruction efforts were conducted during the history of the INTEC injection well. The first reconstruction took place during the fall of 1970 and spring of 1971 upon discovering the injection well was blocked at 226 ft bls. The injection well continued to receive service waste during this reconstruction effort, and emergency discharge lines that had been routed to wells USGS-47 and USGS-48 were never used. The injection well was cleaned to a depth of 596 ft bls and a 9-7/8411. (inner diameter) polyvinyl chloride (PVC) liner was installed at the conclusion of the 1970-7 1 reconstruction. Following these repairs, the injection well appears to have operated normally over the next 10 years.

,431.02 01/30/2003 I
P (:'
Figure 1. Map of lNTEC showing former injection well (CPP-03) and nearby groundmter monitor welh.

f

431.02 01 13012003 Rev. 11
ENGINEERING DESIGN FILE EDF-3943 Revision 0
Page 12 of 93
In September 1981, the well was again found to be blocked, at a depth of 534 ft bls. In July 1982, the liner was found to be completely collapsed at a depth of 435 A bls. The service waste stream was diverted to a gravel pit (CPP-37A, Figure 1) located east of INTEC during this reconstruction effort. The well was cleaned to a depth of 585 ft bls during this reconstruction but sand and silt (formation material) continued to flow into the well throughout this effort. Sand was repeatedly bailed from the well, pumped to the gravel pit east of INTEC, and was later boxed and shipped to the Radioactive Waste Management Complex for burial. Efforts to locate information regarding the total volume and any characterization data for the sand have been unsuccessful. At the conclusion of the 1982 reconstruction effort, a 10-in.-diameter polyethylene liner was placed in the well to a depth of 560 ft.
On February 7, 1984, the injection well was taken out of routine service, and Percolation Ponds 1 and 2 located south of the INTEC facility began receiving the service waste stream. Small amounts of service waste were intermittently disposed of at the injection well during 1984 and 1985, with no use of the well after 1986. The injection well was pressure-grouted with cement and abandoned in October 1989. At that time, the well contained sloughed material below a depth of 475 ft bls. This material consisted of well construction and formation material that entered the well from outside the casing. Appendix A contains additional details regarding the history of the injection well, including the 197 1 and 1982 well reconstruction efforts.
3. INTEC SERVICE WASTE COMPOSITION
The service wastewater was composed of a dilute sodium chloride solution that contained lesser amounts of various other inorganic constituents and radionuclides. Radioactive constituents in the service waste were derived primarily fi-om the PEW evaporator condensate waste stream, including tritium (H-3), strontium-90 (Sr-90), iodine-129 (1-129), and cesium-137 (Cs-137). The Remedial InvestigatiorBaseline Risk Assessment (RYBRA) (DOE-ID 1997) reported the total activity of each of these radionuclides that was reported to have been discharged to the injection well during the time period for which records are available (Table 1).
Table 1. Reported activity of selected radionuclides discharged to the INTEC injection well during the time period when records were kept.a
Radionuclide Half-life (yr) Total Activity Injected (Ci) First Monthly Sampling Date
H-3 12.3 21,300 Jan 1962
Sr-90 28.6 16.0 Jan 1962
I- 129 15,700,000 0.278 May 1976 (3-137 30.2 20.5 Jan 1962 a. Source: Radioactive Waste Management Information System database, as shown in Table 4-1 (DOE-ID 1997).
The total tritium activity sent to the injection well during its operation represents approximately 96% of the total curies (DOE-ID 1997). Various other short-lived radionuclides were also present in the waste stream (e.g., cerium-144), but the half-lives of these are so short (<I year) that they have long since decayed away (DOE-ID 1997). In addition, Cs-137 is not considered to be an injection well contaminant of concern (COC) because of its low solubility and mobility (DOE-ID 1997, Appendix F). Therefore, H-3, Sr-90, and 1-129 are the principal radionuclide COCs associated with service waste disposal in the former injection well.

431.02 01 l30l2003 Rev. 11
ENGINEERING DESIGN FILE EDF-3943 Revision 0
Page 13 of 93
Appendix B includes graphs of the monthly totals of selected radionuclides discharged to the injection well over the period for which records are available. These data are derived from the Idaho Chemical Processing Plant (ICPP) production monthly reports. Note that data for 1-129 in service waste are only available beginning in 1976, whereas the activities of tritium and Sr-90 in the service waste have been monitored since 1962. The lack of 1-129 data before 1976 is in part because, prior to that time, laboratory analytical techniques were not yet available to detect the low 1-129 activities present in the service waste, as compared to the much higher activities of the other radionuclides.
Examination of the graphs of total monthly discharge to the service waste stream and the injection well show that the rate of discharge of the various radionuclides varied significantly from month to month and year to year (Appendix B). As shown on the graphs, numerous pulses of tritium, Sr-90, and 1-129 occurred over time in the service waste stream. These pulses are believed to represent batches or slugs of PEW evaporator condensate that mixed with a much larger volumetric flow of service waste containing very little radioactivity. The PEW condensate was itself of variable composition, depending largely on the particular processes being conducted at INTEC during that month. For example, facility decontamination activities following a fuel reprocessing campaign would be expected to release fission products to the PEW condensate, including Sr-90 and I- 129. However, because of the complex operational history of INTEC, it is difficult to determine the exact cause of each of the many activity peaks observed in service waste composition time-series plots.
There appears to be little temporal correlation between the observed pulses for tritium, Sr-90, and 1-129. This is not surprising considering the difference in the behavior of these three radionuclides during spent fuel reprocessing. Although Sr-90 and 1-129 are both fission products derived from spent fuel dissolution, these two elements became separated from one another as a result of their differing physico-chemical properties. For example, iodine is quite volatile, but strontium is not. This difference in volatility resulted in more carryover of 1-129 across the PEW evaporator as compared to Sr-90.
4. INJECTION WELL 1-129 SOURCE TERM
With respect to the former INTEC injection well, 1-129 has become the primary focus of concern among the regulatory agencies because of its long half-life. The maximum contaminant level (MCL) is 1 pCi/L. Because 1-129 data for the service waste are only available since 1976, it has been necessary to estimate the quantity of 1-129 that went to the injection well prior to 1976. Such an estimate was made during the groundwater modeling performed for the RVBRA (DOE-ID 1997, Appendix F). The approach taken at that time was to calculate the average monthly 1-129 discharge to the injection well over the period for which records exist (1976 to 1985). The monthly average 1-129 discharge over the period of record was calculated to be 3.57 mCi/month. This value was then assumed to apply to the earlier period for which no 1-129 records exist (1953 to 1976). The total 1-129 inventory sent to the injection well during its lifetime was then estimated to be 1.39 Ci (DOE-ID 1997, Appendix F). The groundwater modeling performed during the RVBRA then used these values to model the injection well 1-129 source.
The previous estimate of the total amount of 1-129 assumed to have been discharged to the injection well during its operation are believed to be too high because
0 Groundwater monitoring results (Beasley, Dixon, and Mann 1998) show far less 1-129 present in groundwater than the 1.39 Ci of 1-129 that was assumed to have been discharged to the injection well during the RVBRA modeling.
0 Previous estimates were based on averaging the 1-129 activity in service wastewater over the period for which records were available, but this period includes a time during 1978-79 when I- 129 releases to service waste were much higher than normal.

431.02 01 /30/2003 Rev. 11
ENGINEERING DESIGN FILE EDF-3943 Revision 0
Page 14 of 93
0 Process knowledge indicates that prior to startup of the Waste Calcining Facility (WCF) in 1963, most of the 1-129 released during spent fuel reprocessing would have accumulated in the high-level liquid wastes stored at the tank farm. Therefore, previous estimates of 1-129 releases to the injection well for the years 1953 to 1963 were much too high.
Based on the above, another evaluation of 1-129 discharges to the injection well was performed. This approach to this problem and the results of the revised injection well 1-129 source assessment are presented below, with additional details included in Appendix C. The results of this assessment show that the amount of 1-129 previously assumed to have been discharged to the injection well during its operation was approximately 40% too high. A revised estimate of the total amount of 1-129 discharged to the injection well indicates a total of approximately 0.86 Ci (as opposed to the previous estimate of 1.39 Ci).
As a fission product, the 1-129 present at INTEC is entirely attributable to its liberation during dissolution of the spent fuel during reprocessing. Essentially all of the 1-129 was present within the spent fuel brought to INTEC for processing; virtually no 1-129 was produced at INTEC. Therefore, it is possible to calculate the approximate total 1-129 inventory that has been present at INTEC based on the total quantity of spent fuel reprocessed. Cordes (1978) performed such an analysis using the “fissions processed” approach, along with the 1-129 fission yield. Using this approach, Cordes (1978) estimated that a total of approximately 5 Ci of 1-1 29 were present in the fuel processed between 1953 and 1977. Virtually all of this total would have been released to the first-cycle product during spent fuel dissolution. Following its liberation from the spent fuel, the 1-129 would have ended up at one of the following four destinations:
1. Temporary storage in tank farm liquid wastes
2. Atmospheric discharge from the main stack
3. Groundwater discharge of PEW to the injection well
4. Storage in solid calcine material in WCF bins.
McManus et al. (1982) performed a detailed study of the fate of 1-129 at INTEC and determined that the vast majority of the 1-129 was discharged to the atmosphere through the main stack (approximately 81%). A much lesser quantity of 1-129 went to the injection well (approximately 18%) and only a small quantity would have ended up in the solid waste (calcine) (approximately 1%).
McManus et al. (1 982) also investigated the relationship between the plant processes and 1-1 29 activity in service waste. Among other findings, their study demonstrated that 1-129 releases from INTEC were related primarily to (1) WCF operation and (2) high-level liquid waste (HLLW) evaporator operation. When the WCF was operating, overall 1-129 discharges to both the atmosphere (via the main stack) and to service waste were higher. When the HLLW evaporator was operating, 1-129 activities in service waste increased by approximately a factor of 10, as compared to periods when the HLLW evaporator was not operating.
Appendix C includes historical information on WCF and HLLW evaporator operational periods and the correlation between operational status of these two facilities and 1-129 activities in service waste. Using this information, the total 1-129 activity discharged to the former injection well during its lifetime has been recalculated. These calculations are based on historical records of the operational status of the WCF (or New Waste Calcining Facility) and the HLLW evaporator, coupled with the observed 1-129 activities in the service waste during periods when the WCF and/or HLLW evaporator were operating (or not). Calculations indicate that a maximum of 0.86 Ci 1-129 were discharged to groundwater through the

431.02 01 /30/2003 Rev. 1 1
ENGINEERING DESIGN FILE EDF-3943 Revision 0
Page 15 of 93
former injection well during its lifetime. This value is approximately 62% of the previous estimate of 1.39 Ci 1-129 used in the Operable Unit (OU) 3-13 RVBRA modeling. While the new estimate still appears too large based on the amount of 1-129 present in the aquifer, it nevertheless appears to be more realistic than the W R A total 1-129 value. Appendix C details the calculations and assumptions, along with additional supporting information regarding the factors affecting the disposition of I- 129 at INTEC during spent fuel reprocessing.
5. GROUNDWATER QUALITY NEAR FORMER INJECTION WELL
During its operation, the injection well was a known source of low-level radioactivity to the aquifer, and the primary radionuclides of environmental significance were tritium, Sr-90, and 1-129. For each of these three radionuclides, the groundwater plumes that have developed downgradient (south) of the injection well source have been well documented and delineated over the past 50 years by the United States Geological Survey (USGS) and the Idaho National Engineering and Environmental Laboratory (INEEL). Numerous reports have been prepared over the years by the USGS, INEEL, the State of Idaho INEEL Oversight Program, and others to summarize INEEL impacts to groundwater quality, including impacts from INTEC and the former injection well.
Under the Comprehensive Environmental Response, Compensation and Liability Act, the OU 3-13 Final Record of Decision established remedial action objectives (RAOs) for the INTEC-derived contaminant plume within the SRPA and outside the INTEC security fence (DOE-ID 1999). These RAOs are as follows:
1. Prior to 2095, prevent current on-Site workers and general public from ingesting SRPA groundwater that exceeds a cumulative carcinogenic risk of 1 x or applicable State of Idaho groundwater quality standards (i.e., maximum contaminant levels [MCLs])
a total hazard index of 1,
2. In 2095 and beyond, ensure that SRPA groundwater does not exceed a cumulative carcinogenic risk of 1 x standards (i.e., MCLs).
a total Hazard Index of 1; or applicable State of Idaho groundwater quality
RAO #1 is currently being achieved and maintained through the use of institutional controls (i.e., land use restrictions and INEEL security fence) to prevent access by the general public. To protect workers, water quality is monitored in drinking water supply wells. For risk assessment purposes, however, all institutional controls are assumed to end in the year 2095 (100 years after implementation of the Group 5 remedy). Compliance with drinking water MCLs is a more stringent requirement than compliance with the cumulative carcinogenic risk or total Hazard Index criteria. Therefore, RAO #2 requires that by the year 2095, groundwater within the INTEC-derived contaminant plume must not exceed drinking water MCLs for any of the contaminants of potential concern associated with past operations at INTEC.
The three COC radionuclides associated with past use of the injection well, along with their respective MCLs, are tritium (20,000 pCi/L), Sr-90 (8 pCi/L), and 1-129 (1 pCi/L). Both groundwater monitoring and groundwater modeling are being used to assess future water quality within the SRPA. Modeling results are presented elsewhere (DOE-ID 1997,2002) and will not be discussed further here.
Existing groundwater data downgradient of INTEC were reviewed to assess whether RAO #2 will be achieved by 2095. Appendix D includes concentration trend plots for each of the three principal radionuclides in USGS monitor wells located near and downgradient of the former INTEC injection well.

431.02 01l3Ol2003 Rev. 11
ENGINEERING DESIGN FILE EDF-3943 Revision 0
Page 16 of 93
It should be noted that most of the USGS monitor wells of interest have long open intervals from which groundwater samples are collected. Monitor well completion information is summarized elsewhere (DOE-ID 2003) but a typical USGS well is completed with an open hole through the basalt from approximately 450 to 650 ft in depth. Depths to groundwater are currently approximately 465 ft near the injection well.
To address possible dilution effects from sampling of USGS monitor wells that have long open intervals, depth-specific groundwater samples have been collected periodically over the years using a straddle packer or thief sampler. McCurry and Welhan (1 996) performed such an investigation of several monitor wells close to INTEC during 1992-1994. More recently, depth-discrete groundwater samples were collected from above, within, and below the HI sedimentary interbed in four borings to determine whether elevated 1-129 levels were present downgradient of INTEC (DOE-ID 2002 and the Group 5 Monitoring Report/Decision Summarya). None of the analytical results from these depth-specific groundwater samples collected from wells near INTEC have exceeded the 1-129 MCL of 1 pCfi . Finally, during July-August 2003, groundwater samples were collected below the HI interbed using an inflatable packer at monitor Wells USGS-41, USGS-48, and USGS-59, as required in the Group 5 Long-Term Monitoring Plan (DOE-ID 2003). Iodine-129 concentrations in groundwater from beneath the HI interbed were less than the MCL (1 .O pCi/L) in all of the wells. Among the three wells, USGS-48 showed the highest 1-129 activity (0.25 *0.05 pCiL). USGS-48 is located approximately 950 ft downgradient of the former injection well, making it among the closest wells to Site CPP-23. The observation that the 1-129 concentration in groundwater beneath the HI interbed in this well is currently less than 50% of the MCL provides strong evidence that no significant residual deep source of 1-129 exists at the former injection well. Furthermore, tritium and Tc-99 activities were likewise far below their MCLs in each of the wells (900 pCi/L and 20,000 pCi/L, respectively). The highest tritium activity observed was 2,080 pCi/L (USGS-48), and the highest Tc-99 activity was 36.9 pCi/L (USGS-59). The only COC that exceeded the MCL below the HI interbed was Sr-90. Sr-90 activities were slightly above the MCL (8 pCi/L) in each of the three wells, with the highest Sr-90 activity reported for USGS-59 (9.91 *1.49 pCiL). However, Sr-90 concentrations in groundwater at and downgradient of INTEC have been steadily declining, and are predicted to decline below the MCL long before the year 2095.
In the past, the regulatory Agencies have expressed concern about the possibility that organic compounds may have been disposed to the former INTEC injection well. While it is possible that organic constituents were inadvertently discharged to the well upon occasion, there is no evidence that the injection well was ever used for routine disposal of organic constituents to groundwater. During injection well closure in 1989, groundwater samples were collected from INTEC water supply Well CPP-01 and nearby monitor Wells USGS-40 and 47. No organic compounds were detected, and all volatile organic compounds (VOCs) were below the lO-pg/L reporting limit.
Appendix D contains a summary of available VOC results for groundwater monitor wells near INTEC. Trace concentrations of 1, 1,l -trichloroethane (TCA) have occasionally been detected in groundwater and perched water but the observed concentrations were more than 100-fold below drinking water MCLs. Based on both process knowledge and groundwater monitoring results, there is no evidence that the injection well was ever used for routine disposal of organic compounds, and there is no indication of any significant historical or existing source of VOCs in the vadose zone or groundwater near the former injection well.
a. “Monitoring RepodDecision Summary for Operable Unit 3-13, Group 5, Snake River Plain Aquifer” (report in progress; final version is to be released January 2004).

431.02 01 /30/2003 Rev. 11
ENGINEERING DESIGN FILE EDF-3943 Revision 0
Page 17 of93
6. CONCLUSIONS
Groundwater monitoring results collected to date demonstrate the following:
Tritium activities have declined below the drinking water MCL (20,000 pCi/L) in all nearby SRPA downgradient monitor wells (USGS-40 to USGS-49), but remain slightly above the MCL in a few perched water wells within the INTEC security fence (33-2, MW-17, USGS-50).
Sr-90 activities in some SRPA monitor wells downgradient of the former injection well remain above the drinking water MCL (e.g., 45 pCi/L in Well USGS-47 in 2001). However, Sr-90 levels in perched wells closest to the former injection well (USGS-50, MW-1) are at or below the MCL (8 pCi/L), but some perched monitor wells close to the tank farm contain very high Sr-90 activities (e.g., 147,000 pCi/L Sr-90 in MW-2 in 2003). The distribution of Sr-90 strongly suggests that the primary source of Sr-90 in the perched water is contaminated soils in the vicinity of the tank farm, not the former injection well. The latter source will be addressed during the RI for OU 3-14.
Iodine-129 activities have declined below the MCL (1 pCi/L) in all downgradient SRPA monitor wells and in all the nearby perched wells (USGS-50, MW-1). These data include vertical profile samples from discrete zones in four SRPA monitor wells and deep groundwater samples from four boreholes drilled through the HI sedimentary interbed.
Given the low 1-129 activities that currently exist in the aquifer, no evidence exists for a significant 1-129 source near the INTEC injection well. However, if such a source were to exist, the data indicate it is releasing its activity at a very slow rate and significant future increases in 1-129 activity in the groundwater are not likely.
VOC concentrations in the aquifer at and downgradient of the former injection well are far below MCLs for all compounds; there is no evidence that the injection well ever constituted a significant source of VOCs or other organic compounds to the aquifer.
Material remaining in the former injection well in 1989 at the time of well closure consisted of sloughed well filter pack material and interbed sediments, not “sludge” derived from the service waste.
In summary, tritium and 1-129 activities are already below their respective MCLs in the SRPA downgradient of INTEC, and no significant residual sources of tritium and 1-129 appear to exist at or near the former injection well. Sr-90 activities in the aquifer currently exceed the MCL downgradient of INTEC and vadose zone, and aquifer matrix materials near the tank farm appear to constitute a residual secondary source of Sr-90 to groundwater. However, Sr-90 concentrations are slowly declining in wells near and downgradient of INTEC, and groundwater quality trends indicate that Sr-90 activities in groundwater outside the INTEC security fence will decline below the MCL by 2095. Groundwater modeling being performed under OU 3-13, Group 5, will provide estimates of future Sr-90 concentrations in the aquifer. Elevated Sr-90 activities present in tank farm soils will be addressed under the RI for OU 3-14.

431.02 01 l30l2003 Rev. 11
ENGINEERING DESIGN FILE EDF-3943 Revision 0
Page 18 of 93
7. REFERENCES
Beasley, T.M., P. R. Dixon, and L. J. Mann, 1998, “99T~, 23’?J, and 237Np in the Snake River Plain Aquifer at the Idaho National Engineering and Environmental Laboratory, Idaho Falls, Idaho,” Environmental Science & Technology, Vol. 32, No. 24, pp. 3875-3881.
Cordes, Ormand L., Allied Chemical, to Jack T. Barraclough, USGS, April 18, 1978, “1-129 in Liquid and Airborne Effluents,” Cord-53-78. [also see Appendix E of this document]
DOE-ID, 1978, Recovery of ICPP from Criticality Event of October 17, 1978, ACI-362, Allied Chemical Idaho Chemical Programs, November 1978.
DOE-ID, 1997, Comprehensive M/FS for the Idaho Chemical Processing Plant OU 3-13 at the INEEL-Part A, RI/BRA Report (Final), DOEAD-10534, Rev. 0, U.S. Department of Energy Idaho Operations Office, November 1997.
DOE-ID, 1999, Final Record of Decision Idaho Nuclear Technology and Engineering Center, Operable Unit 3-13, DOE/ID-10660, Rev. 0, U.S. Department of Energy Idaho Operations Office, October 1999.
DOE-ID, 2002, Plume Evaluation Field Sampling Plan for Operable Unit 3-13, Group 5, Snake River Plain Aquifer, DOE/ID-10784, Rev. 2, U.S. Department of Energy Idaho Operations Office, July 2002.
DOE-ID, 2003, Long-Term Monitoring Plan for Operable Unit 3-13, Group 5 Snake River Plain Aquifer, DOE/ID-10783, Rev. 2, U.S. Department of Energy Idaho Operations Office, March 2003.
McCurry, Michael, and J.A. Welhan, 1996, “Summary of Analytical Results for Hydrologic Studies of Wells Open Through Large Intervals of the Snake River Plain Aquifer at the Idaho National Engineering Laboratory,” DOE Grant: DE-FG07-9 1 1D-13042, July 1996.
McManus, G.J., F.A. Duce, S.J. Femandez, and L.P. Murphy, 1982, A model of iodine-129process distributions in a nuclear fuel reprocessingplant, ENICO-1108, Exxon Nuclear Idaho Company, Inc., April 1982.

431.02 01 13012003 Rev. 11
ENGINEERING DESIGN FILE
Appendix A
History of the INTEC Injection Well
EDF-3943 Revision 0
Page 19 of 93

431.02 0113Ol2003 Rev. 11
ENGINEERING DESIGN FILE
This page is intentionally left blank.
EDF-3943 Revision 0
Page 20 of 93

431.02 01 /30/2003 Rev. 11
ENGINEERING DESIGN FILE EDF-3943 Revision 0
Page 21 of 93
The former Idaho Nuclear Technology and Engineering Center (INTEC) injection well, located north of Building CPP-666, was used to routinely discharge service wastewater to the Snake River Plain Aquifer (SRPA) from 1952 to February 1984. The injection well has been referred to as Well CPP-03, as Well MEH-FE-PL-304, and by its Federal Facility Agreement and Consent Order (FFNCO) site designation, CPP-23. The injection well was drilled during 1950-5 1, and, beginning in 1952, the well received an average of 1 million gallons per day (MGD) of service wastewater consisting of plant cooling water, demineralizer and boiler blowdown water, and process equipment waste (PEW) evaporator condensates. On February 7, 1984, the injection well was taken out of routine service, and Percolation Ponds 1 and 2 located south of the INTEC facility began receiving the service waste stream. Small amounts of service waste were intermittently disposed of at the injection well during 1984 to 1986, with no use of the well after 1986. The injection well was pressure-grouted with cement and abandoned in October of 1989. Further investigation of the injection well as a source of contamination to the SRPA has been performed through the FFNCO. This paper is an attempt to pull together known historical information regarding the construction, reconstruction, and use of the injection well in support of the FFNCO investigation of the injection well.
Two major well reconstruction efforts were conducted during the operational lifetime of the INTEC injection well. The first reconstruction took place during the fall of 1970 and spring of 1971 upon discovering the injection well was blocked at 226 ft below land surface (bls). The injection well continued to receive service waste during this reconstruction effort, and emergency discharge lines that had been routed to United States Geological Survey (USGS) Wells USGS-47 and USGS-48 were never used. The injection well was cleaned to a depth of 596 ft below land surface (bls) and a 9-7/8411. inner diameter polyvinyl chloride (PVC) liner was installed at the conclusion of the 1970-71 reconstruction. In September 1981, the well was again found to be blocked, at a depth of 534 ft bls, and the liner found to be completely collapsed at a depth of 435 ft bls in July 1982. The service waste stream was diverted to a gravel pit located east of INTEC during this reconstruction effort. The well was cleaned to a depth of 585 ft bls during this reconstruction, but sand and silt (formation material) continued to flow into the well throughout this effort. Sand was repeatedly bailed from the well and pumped to the gravel pit east of INTEC and was later boxed and shipped to the Radioactive Waste Management Complex (RWMC) for burial. Efforts to locate information regarding the total volume and any characterization data for the sand have been unsuccessful. At the conclusion of the 1982 reconstruction effort, a 10-in.-diameter polyethylene liner was placed in the well to a depth of 560 ft.
The service wastewater discharged to the injection well contained radionuclides, including tritium (H-3), strontium-90 (Sr-90), cesium- 137 (Cs-l37), and iodine-129 (1-129). The wastewater also contained minor amounts of various other chemical constituents. Organic constituents were an insignificant component of the service waste. Even though the PEW liquid waste stream carries the F001, F002, F005, and U134 US. Environmental Protection Agency (EPA) hazardous waste numbers; these hazardous waste numbers were

431.02 01 l30l2003 Rev. 11
ENGINEERING DESIGN FILE
assigned to PEW evaporator condensates through application of the “derived from” rule. Suspended solids are also insignificant in the service waste stream, based upon knowledge of the processes that contributed to the service waste stream and limited analytical data.
When the injection well was grouted and abandoned in 1989 at the direction of the State of Idaho, the well contained sloughed material below a depth of 475 ft bls. This material is composed of well construction and formation material, as becomes evident upon review of the 1970-71 and 198 1-82 reconstruction activities and service waste composition. Although the injection well was a significant source of contaminants to the SRPA during its operation, it is highly unlikely that the plugged well constitutes a continuing source of contamination to the SRPA.
EDF-3943 Revision 0
Page 22 of 93
431.02 01 I3012003 Rev . 11
ENGINEERING DESIGN FILE EDF-3943 Revision 0
Page 23 of 93
CONTENTS
EXECUTIVE SUMMARY ......................................................................................................................... 21
ACRONYMS .............................................................................................................................................. 25
A.1 .
A.2 .
A.3 .
A.4 .
A.5 .
INTRODUCTION .......................................................................................................................... 27
INJECTION WELL CONSTRUCTION HISTORY ..................................................................... 27
A-2.1 1950 Drilling ..................................................................................................................... 27
195 1 DRILLING ............................................................................................................................ 28
1969 INTAKE VAULT CONSTRUCTION .................................................................................. 29
A-4.1
A-4.2
A-4.3
A 4 4
A-4.5
A-4.6
A-4.7
A-4.8
1970 Inspection ................................................................................................................. 29
1970 and 197 1 Reconstruction .......................................................................................... 31
1971 Liner Installation ...................................................................................................... 33
1981/1982 Inspections ....................................................................................................... 33
1982 Reconstruction .......................................................................................................... 33
1989 Abandonment ........................................................................................................... 35
A-4.6.1 East Side Waste ............................................................................................... 37 A-4.6.2 A-4.6.3 A-4.6.4 20-in . Fiberglass Reinforced Plastic ............................................................... 37 A-4.6.5 West Side Wastes ............................................................................................ 37
Construction History Discrepancies .................................................................................. 37
A-4.7.1 Borehole Size .................................................................................................. 37 A-4.7.2 Depth of HDPE Liner ...................................................................................... 38 A-4.7.3 Eighteen Inch Diameter Casing ...................................................................... 38
24-In . Clay Tile Line ....................................................................................... 37 10-In . Pipe ....................................................................................................... 37
A-4.7.4 USGS-50 ......................................................................................................... 38
Construction Summary ...................................................................................................... 39
INJECTION WELL WASTE STREAM ........................................................................................ 40
A-5.1 Injection Well Piping ......................................................................................................... 40
A-5.2 Chemistry of Wastewater .................................................................................................. 42
A-5.3 RCRA Constituents ........................................................................................................... 42
A-5.4 Suspended Solids ............................................................................................................... 43
431.02 01/30/2003 Rev . 11
ENGINEERING DESIGN FILE EDF-3943 Revision 0
Page 24 of 93
A.6 .
A.7 .
A.1 .
A.2 .
A.3 .
A 4 .
A.5 .
A.6 .
ORIGIN OF WELL SEDIMENTS ................................................................................................ 43
A-6.1 597 to 598 ft ...................................................................................................................... 43
A-6.2 596.4 to 597 ft ................................................................................................................... 43
A-6.3 588 to 596.4 ft ................................................................................................................... 43
A-6.4 585 to 588 ft ...................................................................................................................... 44
A-6.5 560 to 585 ft ...................................................................................................................... 44
REFERENCES ............................................................................................................................... 46
FIGURES
Most likely as-built condition of the injection well after construction in 195 1 ................................ 30
As-built condition of the INTEC injection well after the 197 1 reconstruction ................................. 34
As-built condition of the INTEC injection well after the 1982 reconstruction ................................. 36
Flow paths for service waste entering the injection well .................................................................. 41
Origin of the injection well sediments .............................................................................................. 44
Rate of sediment accumulation in injection well .............................................................................. 45
TABLES
A.1 . Sediment depth .................................................................................................................................. 45

431.02 01 /30/2003 Rev. 1 1
bls
CERCLA
CFA
CPP
EINCO
EPA
FAST
FFA/CO
HDPE
ICPP
ID
INEEL
INTEC
LDU
LET&D
MGD
NWCF
OD
PEW
PVC
RAL
RCRA
RWMC
RWMIS
SRPA
ENGINEERING DESIGN FILE
ACRONYMS
below land surface
Comprehensive Environmental Response, Compensation and Liability Act
Central Facilities Area
Chemical Processing Plant (designation for buildings and areas at INTEC)
Exxon Idaho Nuclear Company, Incorporated
Environmental Protection Agency
Fluorine1 Dissolution and Storage Facility
Federal Facility Agreement and Consent Order
high-density polyethylene
Idaho Chemical Processing Plant (now INTEC)
inside diameter
Idaho National Engineering and Environmental Laboratory
Idaho Nuclear Technology and Engineering Center
land disposal unit
Liquid EMuent Treatment and Disposal (facility)
million gallons per day
New Waste Calcining Facility
outside diameter
process equipment waste
polyvinyl chloride
Remote Analytical Laboratory
Resource Conservation and Recovery Act
Radioactive Waste Management Complex
Radioactive Waste Management Information System
Snake River Plain Aquifer
EDF-3943 Revision 0
Page 25 of 93

431.02 01 13012003 Rev. 11
ENGINEERING DESIGN FILE
TAN Test Area North
TCLP toxicity characteristic leaching procedure
TSS total suspended solids
WCF Waste Calcining Facility
WINCO
USGS United States Geological Survey
Westinghouse Idaho Nuclear Company, Incorporated
EDF-3943 Revision 0
Page 26 of 93

431.02 01130/2003 Rev. 1 1
ENGINEERING DESIGN FILE EDF-3943 Revision 0
Page 27 of 93
A-I. INTRODUCTION
Processes at the Idaho Nuclear Technology and Engineering Center (INTEC) have generated large volumes of service wastewater, including plant cooling waters, demineralizer and boiler blowdown, and process equipment waste condensates. The INTEC injection well, located north of Building CPP-666, was used to discharge the service wastewater to the aquifer from 1952 to February 1984. The injection well has been referred to as Well CPP-03, as Well MEH-FE-PL-304, and by its Federal Facility Agreement and Consent Order (FFNCO) Comprehensive Environmental Response, Compensation and Liability Act (CERCLA) site designation, CPP-23 (land disposal unit).
On February 7, 1984, the injection well was taken out of routine service, and wastewater was pumped from two parallel collection vaults to Percolation Ponds 1 and 2 located south of the INTEC facility. Disposal of wastewater to the injection well was very limited after the use of the Percolation Ponds began. Minor amounts of wastewater were discharged to the injection well in 1986. No wastewater was discharged to the well after that year. The well was plugged with cement grout in October of 1989 (DOE-ID 1997; WINCO 1990). Details of the well construction and maintenance history are provided in Section A-2. Section A-3 summarizes information on the composition of wastewater discharged to the well during its operation, and Section A-4 discusses the origin of material remaining in the injection well at the time it was plugged in 1989.
A-2. INJECTION WELL CONSTRUCTION HISTORY
A-2.1 1950 Drilling
Cable tool drilling began on Well CPP-03 on September 3, 1950, by the R.J. Strausser Drilling Company of Portland, Oregonb. During a phone conversation with Idaho Nuclear Company personnel in 1970, Mr. Strausser explained that the well was originally intended to have been a water production well (Micum, 197 1 a, Daily Log for 10/23/70). The borehole had been advanced to a depth of 2 12 ft below land surface (bls) by September 20, 1950, at which time a determination was made to terminate drilling on this borehole, as it was not a good location for a production well, and to move the drill rig to another location. The borehole was then filled with gravel to 20 ft below land surface and all but the upper 20 ft of steel surface casing was removed”. The drill rig was moved off of the borehole on September 25,1950. No mention is made in the drillers log as to the size of the borehole diameter although the drillers log states that 20 ft of “starter casing” was left in place in order to prevent the caving of surficial sediments into the hole as the borehole was abandoned. Additionally, the log states that this was done in order to prevent the drill rig from falling into the hole. Records from later work in this well show that this “starter casing” was 20-in.-diameter pipe (Strausser 1950).
b. The as-built drawn by the USGS sometime after well construction and a USGS memo by H. G. Sisco in September of 1951 show the R.J. Strausser Drilling Company as being located in Portland, Oregon. However, the logbooks for the 1970/1971 reconstruction of the injection well indicate that the R.J. Strausser Drilling Company was located in Burley, Idaho. The reconstruction logbook indicates that several conference calls were made to Mr. Strausser in Burley, Idaho, during the 1970/1971 reconstruction.
c. The driller referred to this as “starter pipe.” He left it in the ground to control caving around the rig as considerable subsidence was occurring.

431.02 0113012003 Rev. 11
ENGINEERING DESIGN FILE EDF-3943 Revision 0
Page 28 of 93
A-3. 1951 DRILLING
The R.J. Strausser Drilling Company continued drilling on Well CPP-03 beginning on June 8, 195 1, for the purpose of completing it as an injection well. The total depth of 598 ft below land surface was reached on August 25, 195 1. Considerable difficulty was encountered during drilling in the 270-ft to 320-ft bls zones.d
During a conference telephone call on November 2,1970, Mr. Strausser explained that cement grout had been placed into the well at the depths where “redrilled well” is indicated. He further stated that the driller had gathered up all the loose scrap iron around the drill site and “dropped it down the well with the concrete” in the intervals where “iron” is listed in the log (Micum, 197 1 a, Daily Log for 11/2/70). Scrap iron was apparently utilized at that time to assist in advancing boreholes when using a cable tool drilling rig.
No borehole diameter is listed in the 1950 or 1951 driller’s logs. Several as-built well drawings drawn by the USGS at a later date show the borehole to be 24 in. in diameter. No mention is made of the 20-in.-diameter “starter casing.” Caliper logging conducted during the 1970 reconstruction clearly shows the 20-in.-diameter surface casing extending to the bottom of the alluvium at 41 ft bls. The caliper log also shows a 20-in. casing or borehole diameter to at least 90 ft bls where remnants of the 16-in. casing began (Barraclough 1970 and Micum 1971a, construction diagrams). The caliper log also shows 20-in.-diameter hole through “hard basalt” at deeper depths once the 16-in. casing was removed. Mr. Strausser stated that the 20-in. casing had been used as surface casing and that the well had been advanced below the casing as a 20-in.-diameter borehole. Mr. Strausser could not explain how or why the USGS logs indicated a 24-in.-diameter borehole” (Micum 1971, Daily Log for 1 1/2/70). The USGS stated in 197 1 that they did not have the original construction logs for the injection well. They reported that all original logs were abstracted, summarized, and then “retired.” The summarized logs describe the borehole lithology with depth but provide very limited data on drilling method, drilling problems, or construction (Gildersleeve 1971).
d. The following excerpts are from the drillers logs (Strausser, 195 1):
1. 2. 3. 4. 5. 6. 7. 8. 9. 10. 11. 12. 13. 14. 15. 16. 17.
6/20/5 1 Shot hole (using dynamite) from 270 to 279 and backfilled to 278, 6/21/51 Shot hole and redrilled from 280 to 281, 6/22/5 1 Shot hole and redrilled from 281 to 283, 6/23/5 1 Redrilled hole from 283 to 286, 6/25/5 1 Cleaned out hole from 287 to 290, 6/28/5 1 Redrilled hole from 295 to 297 Shot hole three times, 6/29/5 1 Redrilled hole from 297 to 301 Shot hole twice, 6/30/5 1 Redrilled hole from 301 to 306 Shot hole once, 7/3/5 1 Shot good hole at 3 10 with 90 sticks 60% (dynamite), 7/76 1 3 10-3 1 1 ft. Drilled up 100 Ibs iron, 7/9/5 1 3 12-3 13 ft. Drilled up 150 Ibs iron, 7/10/51 313-314 ft. Drilled up 100 lbs iron, 7/11/51 313-315 ft. Drilled up 150 lbs iron, 7/12/51 Shot hole 313 to315, 7/13/51 316-318 ft. Drilled up 50 Ibs iron, 7/14/5 1 3 18-321 ft. Drilled up 50 Ibs iron, 7/16/51 321-322 ft. Drilled up 50 Ibs iron.
e. It would be impossible to drill a hole larger than 20 in. below a 20-in.-diameter casing with a cable tool drill rig. Therefore, the construction diagrams presented here show a 24-in.diameter borehole through the alluvium with a 20-in.-diameter surface casing. The borehole diameter in the bedrock (below the 20-in. surface casing) is believed to be 20 in. in diameter.

43 1.02 01 13012003 Rev. 11
ENGINEERING DESIGN FILE EDF-3943 Revision 0
Page 29 of 93
One foot of cement grout was placed in the bottom of the well and then 15-7/8-in.-outside-diameter, 5/16-in.-wall-thickness carbon steel casing was installed from the bottom of the well to 2 ft above land surface. The annular space from the cement plug at 597 ft bls to 400 ft bls was filled with gravel that is less than 1-1/2 in. in diameter. The annular space from 400 ft bls to the land surface was filled with pit-run gravel.
The casing was perforated from 593 f t bls to 490 ft bls. A decision was made to perforate an additional section of casing after performing a water injection test on September 27, 195 1. An additional 40 ft of casing was perforated at a depth of 452 ft bls to 412 ft bls.
Figure A-1 shows the most likely as-built well condition at the end of construction in 1951 given the conflicting existing information.
A 4 1969 INTAKE VAULT CONSTRUCTION
The earliest well construction as-built drawings show the 15-7/8-in.-diameter well casing extending from 598 ft bls to the ground surface (USGS 195 1). A construction diagram shows a “well pit” with a depth of 15 ft below surface in 1956 (Nace et al. 1956). It is likely that the driller left the well in the condition shown on the USGS diagrams and that the well pit was added sometime before the facility began “hot” operations in 1953. Photos taken in late 1969 and early 1970 show construction of the “current” 21-ft-deep injection well vault. The actual construction records for this activity have not been located. However, several as-built diagrams and construction photos clearly show the structure and dimensions of the vault.
The specifics of piping entering the vault and injection well are described in Section A-4.7.
A 4 1 1970 Inspection
The USGS and the Findlay Well Drilling Company conducted geophysical and video logging of the CPP-03 well between June 12 and June 15, 1970. The caliper log‘ shows that the 15-7/8-in.-diameter casing (hereafter referred to as “1 6-in.’’ for simplicity) was missing from the bottom of the vault at 2 1 ft bls to 90 ft bls (Barraclough 1970). Earlier USGS caliper logs taken in 1968 show that the 16-im-diameter casing had already corroded away to a depth of 90 ft at that time but indicated that the well was still open to its total drilled depth (Gildersleeve 1971; Robertson et al. 1974).
The 16-in.-diameter casing was also found to be corroded through at 102 to 107 ft, 126 to 138 ft, 182 to 202 ft, and 205 to 226 ft bls. The well was blocked at a depth of 226 ft bls. The static water level within the well was found to be 193 to 200 ft bls when a flow of 500 gallons per minute (gpm) was injected into the well (normal flow rate), indicating that discharge was occurring into the vadose zone. When flow was reduced to 50 gpm the static water level dropped to 210 ft over a period of 17 minutes (Barraclough 1970).
f. The caliper tool indicated that the hole diameter below the vault was 19-3/4 in. This may indicate that the hole had been cased with 20-in.-diameter casing to at least 90 ft bls or that the borehole had been drilled to an approximate 20-im-diameter size. The use of 20-in.-diameter “starter casing” in 195 1 likely indicates that the actual borehole diameter within the basalt below that “starter casing” was approximately 20 in. This then indicates that the borehole through the alluvium was a 24-in.-diameter borehole, 20-in. surface casing was placed to the top of the basalt, and then a 20-in.-diameter borehole was advanced to the total depth of 598 ft.

/
- '. '7. I . -
431.02
Rev. 11 ' 0113o12003
. . .
so-
loo -
EDF-3843 Revision 0
Page 30 of93
Land S u h 247 inch dhmeter borehole (0 to 41 fl) 20 Inch s u h e aaslng (0 to 413 ft)
2Q inch dlameter borehole (41 lo 5Q8 fl)
1671800Xfi116wallcasing
~
Pit Run 0raV;el Fill (0 to 404 ft) P
I . . .". Perforatims (41 2 to 452)
1 1/2 inch mlnuar gravel 1111 (a to 5B7 ft)
550 A
.... Cement ffll placed from (597 to 5Q8) R
...,
,- Total hpih of Boreholekisfl.
B o d
Figure A-l . Most likely as-built condition of the injection well after construction in 1951.

431.02 01/30/2003 Rev. 1 1
ENGINEERING DESIGN FILE EDF-3943 Revision 0
Page 3 1 of 93
The Findlay Well Drilling Company cleaned the well from 226 ft to 27 1 ft bls by June 17, 1970. Materials removed from the well during this cleaning included red and brown clay, gravel, steel casing fragments, and corrosion products of rust and rusty pipe (Gildersleeve 197 I).
A 4 2 1970 and 1971 Reconstruction
Well reconstruction took place from August 17, 1970, to April 14, 1971. Cleaning of the well began with the mobilization of a propane-powered 28 L B u c p s Erie cable tool rig onto the site on August 17, 1970. Aluminum irrigation pipe (6- and 8-in.-diameter) was installed from the injection well to two USGS wells (USGS-47 and USGS-48) in the event that emergency discharge to these wells was necessary. However, the emergency pipeline was never used, and the injection well continued to accept the service waste stream during the reconstruction period.
Cleaning of the borehole began with the removal of the badly corroded 16-h-diameter casing utilizing a casing spear. Cleaning was then attempted with the advancement of a 12-in-diameter temporary casing after the removal of the 16-in. casing. Considerable difficulty in cleaning was encountered due to gravel slough entering the well from the surficial alluvium zone. The sloughing of surficial gravels was due to corrosion of holes through the 20-in.-diameter surface casing. A temporary 1/4-in.-walI, 18-indiameter casing was then installed to 58 ft bls in an attempt to limit the caving from the surficial sediment zone. The 12-in.-diameter temporary casing was then advanced to 499 ft bls, with cleaning of the well progressing to 566 ft bls by October 2, 1970.
Substantial material from the 140-to-170-ft bls interbed was found to be sloughing into the borehole from behind the 12-h-diarneter temporary casing. The 12-in. casing could not be advanced any deeper into the well due to slough material bridging behind the casing. The 12-in.-diameter casing was removed from the well on October 7, 1970, by applying 60,000 lb of pullback force in order to let the slough “pass.” The well filled with caved material to 109 ft bls after the removal of the 12-in. casing. A 17- 1/2-in. bit was then used to clean the borehole of the slough material and any remnants of the 195 1 completion 16-in.-diameter casing. The temporary 18-in. steel casing was advanced behind the bit as the well cleaning progressed deeper. The 18 in.-casing was advanced to a total depth of 18 1.9 ft bls in an attempt to reduce the caving of material from the 140-to-1 70-ft interbedg. The 18-in. casing was hung from brackets placed on the floor of the injection wall vault in order to allow the continued use of the injection well during the work-over. The service wastewater was directed down the 18-in.-diameter casing.
Considerable difficulty was encountered in drilling from 270 to 325 ft in depth during October and November 1970. Concrete, iron, and grout continued to cave into the well from this zone. The borehole was so oversized in diameter through this section that it allowed the 10-in.-diameter bailer and the 17-1/2411. bit to pass each other in the borehole. Review of the original drillers log for this portion of the borehole shows considerable redrilling, blasting, and the addition of “iron” to the fill material. The log entries are included in Section A-2. Drilling proceeded slowly due to the large amount of iron and concrete sloughing into the borehole from this oversized portion.
g. The last five sections (approximately 100 ft) of 18-in.-diameter pipe placed into the well had a wall thickness of 5/16 in. This is not relevant to final construction diagram as this 18411. casing was later removed.
431.02 01 /30/2003 Rev. 11
ENGINEERING DESIGN FILE EDF-3943 Revision 0
Page 32 of 93
The lack of fine material in the slough made it difficult to pick up the ’material with the downhole bailer. A total of several hundred pounds of bentonite and 10 yd’ of clay hauled from near Test Area North (TAN) were added to the well during October and November 1970 in an attempt to provide enough fine material to make mud and facilitate the removal of the slough material.
A 16-in.-diameter casing was advanced to refusal at 320 ft bls on November 30 in an attempt to reduce the caving from the oversized hole from 270 to 320 ft bls. The injection well wastewater was directed into the annular space between the 16- and 18-in.-diameter casings. The bottom 20 ft of 16-in. casing had a wall thickness of 0.375 in., and the remaining 16-in. casing had a wall thickness of 0.219 in.
A temporary 12-3/4-in.-outside-diameter steel casing was advanced on December 16, 1970, to refusal at 490 ft bls. The borehole was cleaned to 594 ft bls by January 13, 197 1. Caving grout and sand behind the 12-in.-diameter temporary casing caused difficulties during the removal of the temporary casing from the well on January 13, 197 1. After removal of the 12-in. casing, red sand and grout caved into the well on January 19, filling the well below 553 ft bls.
The well was then cleaned to a depth of 596 ft bls (within 1 A of the cement plug at 597 ft) and 9-7/8-in.-inside-diameter polyvinyl chloride (PVC) plastic pipe was installed into the well to a depth of 596.4 A bls. The PVC was reported to have 11-3/4-in.-outside-diarneter couplings with the bottom 120 ft perforated. The size of the perforations was not found in the reconstruction log books. Twenty cubic yards of “concrete aggregate” were procured from a stockpile at the Central Facilities Area (CFA) for use in gravel packing outside of the PVC liner. The PVC pipe severed and/or collapsed during filling of the annular space on January 27. The collapse may have been caused by the addition of the gravel pack or the hydrostatic pressure caused by the injection well wastewater being placed in the annular space outside of the PVC. The top of the gravel fill within the well borehole was measured at 375 ft bls after the collapse.
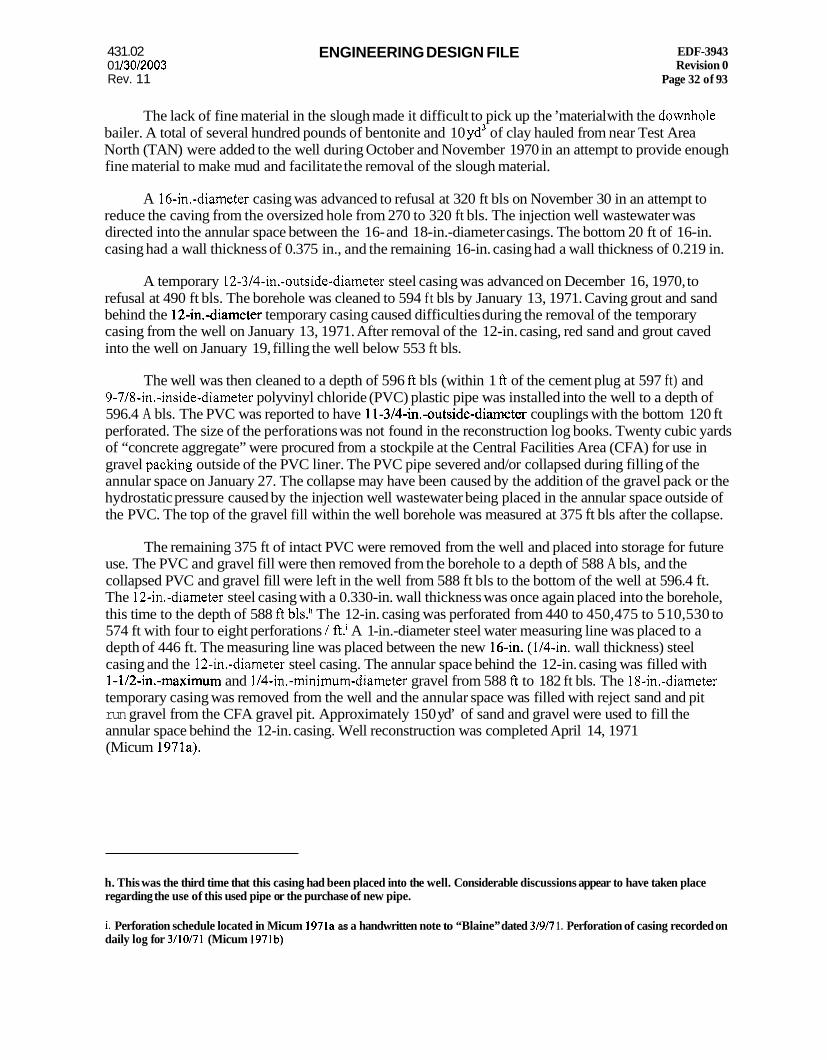
The remaining 375 ft of intact PVC were removed from the well and placed into storage for future use. The PVC and gravel fill were then removed from the borehole to a depth of 588 A bls, and the collapsed PVC and gravel fill were left in the well from 588 ft bls to the bottom of the well at 596.4 ft. The 12-in.-diameter steel casing with a 0.330-in. wall thickness was once again placed into the borehole, this time to the depth of 588 ft bls.” The 12-in. casing was perforated from 440 to 450,475 to 5 10,530 to 574 ft with four to eight perforations / depth of 446 ft. The measuring line was placed between the new 16411. (U4-in. wall thickness) steel casing and the 12-in.-diameter steel casing. The annular space behind the 12-in. casing was filled with 1-1/2-in.-maximum and 1/4-in.-minimum-diameter gravel from 588 ft to 182 ft bls. The 18-in.-diameter temporary casing was removed from the well and the annular space was filled with reject sand and pit run gravel from the CFA gravel pit. Approximately 150 yd’ of sand and gravel were used to fill the annular space behind the 12-in. casing. Well reconstruction was completed April 14, 1971 (Micum 1971a).
A 1 -in.-diameter steel water measuring line was placed to a
h. This was the third time that this casing had been placed into the well. Considerable discussions appear to have taken place regarding the use of this used pipe or the purchase of new pipe.
i. Perforation schedule located in Micum 1971a as a handwritten note to “Blaine” dated 3/9/7 1 . Perforation of casing recorded on daily log for 340171 (Micum 1971b)

431.02 Q I I3Ql2QQ3 Rev. 11
ENGINEERING DESIGN FILE EDF-3943 Revision 0
Page 33 of 93
A 4 3 1971 Liner Installation
An additional contract was issued to install a PVC liner into the well in August of 1971 during a general facility shutdown. The purpose of performing this work during the shutdown was to eliminate the wastewater entering the injection well and therefore reduce the problem of hydrostatic pressure on the outside of the PVC casing. The limited amount of service wastewater generated from the facility during the plant shutdown was directed to perched zone monitor well USGS-50 (Amberson 1971).
The driller arrived onsite on August 16, 1970, and cleaned approximately 1 ft of gravel and rust from the inside of the 12-in. casing. The 350 ft of intact PVC from the previous installation was reused with the addition of another 233-1/2 ft of new pipe. The PVC liner was installed with perforations from 448 to 588 and 41 1 to 415 ft bls (Micum 1971~). Figure A-2 shows the as-built well condition at the end of construction in 197 1.
A 4 4 1981/1982 Inspections
The USGS conducted a caliper log of Well CPP-03 on September 17, 1981. The caliper log indicated that the well was bridged or filled to 534 ft bls. The log also shows that the PVC liner had a “rough” condition from 22 to 80 ft, a smooth section from 80 to 180 ft, rough from 180 to 220 ft, and alternating smooth and rough from 220 to 385 ft. The liner was smooth from 385 to 460 ft, rough from 460 to 480 ft, and smooth from 480 to 534 ft. The USGS reported that they believed the PVC liner was deteriorating.
A caliper log was run again on July 8, 1982. The caliper log indicated that there was a separation in the PVC liner at 135 ft bls and that the liner had totally collapsed at approximately 435 ft bls (Barraclough 1982).
A 4 5 1982 Reconstruction
A second injection well reconstruction effort occurred in the fall of 1982. The reconstruction by McCabe Brothers drilling began on September 7, 1982. The injection well service waste stream was diverted to the gravel pit located east of the INTEC (FFNCO Site CPP-37) through an g-in.-diarneter aluminum surface laid pipe.
Through the use of a drilling %pear,” the drilling company was able to remove all of the PVC liner down to 190 ft bls. The remaining PVC could not be removed with the spear or “jars.” A decision was made to drill out the remainder of the PVC. In order to drill the PVC, it was necessary to fill the well to the 1904 level with gravel. The gravel was placed into the liner with 416 ft of 6-in.-diameter tremmie pipe. Drilling out of the PVC began on September 19,1982. Drilling out of the PVC and gravel had progressed to 584 ft by October 9 (within 13 ft of the bottom). Video logging of the well on Monday, October 11, revealed that the well had filled with silty material back up to a depth of 555 ft bls. Additionally, the video revealed that nearly all perforations were filled with silt and holes were visible in the steel casing at 420 and 460 ft bls. The logbook states that most of the material that “silted” into the well at this time was plastic particles from the PVC. The borehole had sloughed in to a depth of 534 ft by October 13 despite continual cleaning.
Field radiation surveys conducted by the onsite Health Physics personnel indicated that the material being removed from the well had contact radiation levels of 300 to 500 counts per minute (cpm) with occasional radiation levels up to 3,000 cpm above background levels. One reading of 6,000 cpm was recorded on October 30.

431.02 0113o/2003 Rev. 11
0 - I I 1 L
150 -
300 -
450 -
550 -
Land atface
247 Inch diameter brehde molt lo 41 ft) 20 Inch aurface casing mutt to 417 ft)
h u l l (0 to 22 fi)
20 inch diameter borehole (41 to 5Q8 ft)
18 OD X -21 9 wall casing (22 to 300 ft)
Plt Run Gmwl Flll(0 to 145 ft)
+- , I
16 00 X -375 wan caslng (300 to 320 ft)
0 7/8 la& ID PVC Caslng (Pehmtad 411 to 415 and 44Bto588 feet)
BDF-3W3 Reviiiw 0
Page 34 of 93
Ortglnal 16 Inch Caslng (395 to 445) Origlnal Owel Fill 1 tR minus (behind 16 inch casing)
12 Inch 00 X .330 wall cmlng (22 to 588 ft Perlorations 440 to 460.475 to 610,530 to 674)
Orlglnal 1 6 Inch Caslng (490 to 598)
Original Gravel Fill 1 1/2 mlnua (behind 16 Inch caslng)
W C fmgments and gmwl fill Material from 1908 aollapw
Figure A-2. As-built condition of the INTEC injection well after the 1971 reconstruction.

431.02 0 1 /30/2003 Rev. 1 1
ENGINEERING DESIGN FILE EDF-3943 Revision 0
Page 35 of 93
The holes in the 12-in.-diameter well casing were lined with 10-ft-long sections of casing sleeving. An additional 10 ft of sleeving fell to 500 ft bls during the sleeving operation. After the sleeving of the 12-in.-diameter casing, the well was cleaned to a depth of 585 ft. This depth is within 3 ft of the depth of the PVC fragments left in 197 1. The casing was then perforated with three shots of explosive casing perforator cord. Each shot consisted of 25 ft of 50-graidft Detoprime (logbook spelling is unclear) explosive perforator. The logbook states that the shot cord perforations were placed at 470,525, and 540 ft bls. It appears that this indicates the top of the 2 5 4 perforated zone. The shot bucket used to drop the explosive charges was forced to the bottom of the well and stuck at 584 ft bls.
Testing revealed that the well would not accept sufficient quantities of water after the explosive shot perforation. Therefore, a decision was made to gun-perforate a larger portion of the well casing. A gun perforator was lowered into the well and the casing was perforated with rows of 1/2-in.-diameter holes spaced 2 ft apart at 90 degree angles from each other. The casing was perforated with 136 holes from 510 to 565 Et and 160 holes from 470 to 510 ft on October 28, 1982.
The well began filling with sand almost immediately after the gun perforating. The reconstruction logbook indicates that sand was bailed from the well, 24 hours a day, for 4 days with no progress made in deepening the well. A sand pump was then lowered into the well and sand slurry was pumped to the gravel pit east of the INTEC beginning on November 2 and ending on November 6. The bottom of the well was tagged at 560 ft bls following the sand pumping. The sand was later removed from the gravel pit, boxed, and then shipped to the Radioactive Waste Management Complex (RWMC) for burial. Efforts to locate analytical results for sand sent to RWMC have been unsuccessful.
A 10-in.-diameter, 1-in.-wall-thickness, polyethylene liner was then placed in the well from 20 ft bls to a depth of 560 ft. The liner was high-density polyethylene (HDPE) plastic welded together on the surface by Catalytic Corporation and then run into the well in one piece. The liner was perforated with a 2-in.-diameter hole saw prior to installation in the well. Two holes were placed 180 degrees apart every foot with the sets of two holes also being staggered every foot by 90 degrees. The bottom 110 ft of the liner, 450 to 560 ft bls, were perforated. (Gibeault and Phillips 1982; Gibeault 1982; McCabe 1982). Figure A-3 shows the as-built well condition at the end of construction in 1982.
A 4 6 1989 Abandonment
The INTEC injection well was pressure-grouted from the 475-ft bls level to the bottom of the vault at 2 1 ft bls in October of 1989. The vault was then filled with gravel to within 2 ft of the surface. The remaining 2 ft were then filled with concrete. The material below 475 ft bls was believed to be silt and sand (formation material) that entered the well from outside the casing. Silt and sand entering the well are consistent with the well’s history of repeated sloughing of formation material into the well.
Samples were collected from the surface of the sediment column by a USGS sample team prior to abandonment on August 3 1, 1989. The sampling effort took approximately 4 hours to complete due to the difficulty in retrieving material, over which time the sample material was left in a stainless steel sample bowl. Radiological smears and field screening of the sampled material revealed no field-detectable levels of radionuclides. The sampled material was composed of sand and silt less than 1/8 in. in diameter (Harmel 1989).
The material was analyzed by Enwright Environmental Consulting Laboratories, Inc. of Greenville, South Carolina. Analytical results from the sampling of the well sediment are presented in the “Closure Plan for Land Disposal Unit (LDU) CPP-23 Injection Well (MAH-FE-PL-304)” report (WINCO 1990). Three radionuclides were detected in the sediment sample: cesium-137 (100 pCi/g), europium-152 (3.8 pCi/g), and europium-154 (2.5 pCi/g).
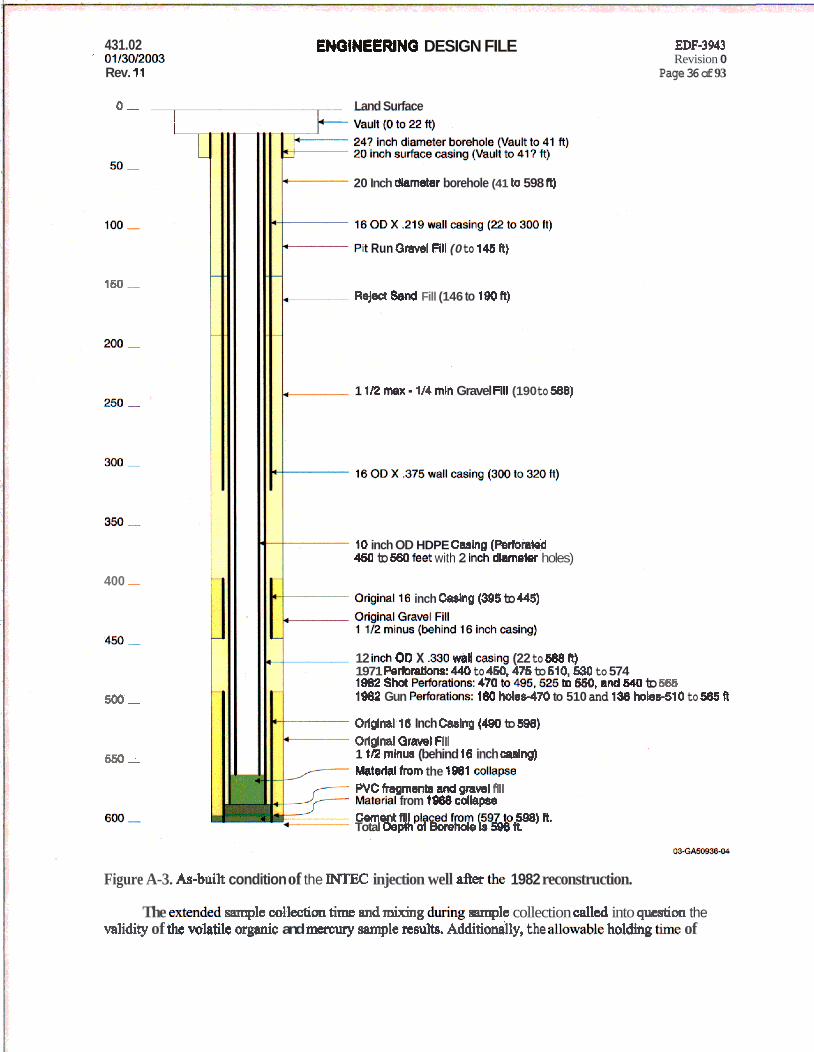
431.02 ’ 0 1 m I M
Rev. j 1
ENOINEERINO DESIGN FILE
0 - Land Surface - 150 -
400 -
500-
550-
EDF-3943 Revision 0
Page 36 of 93
20 Inch &mater borehole (41 to 598 ft)
16ODX.219waH~ing~22to300n)
Pit Run Gravel MI (0 to 145 fl)
R e j a 8end Fill (146 to 190 ft)
1 112 max. 114 mln Gravel FIII (190 to 588)
ldODX.375waRcashg(300to3Mft)
10 inch OD HDPE Casing (Palforat4 450 to 580 feet with 2 inch diameter holes)
OrlqhllB inch W n g (395 to 445)
12 inch 00 x .a mtl Cwing (22 to 588 rt) 1971 Perkratlons: 440 to 460,476 to 610,630 to 574 1882 Shea P*rDoratlonr: 470 to495,525 to 550, and 540 to 585 1982 Gun Fe&m?ionr: 160 hdes-470 to 510 and 198 hotet~i-510 to 565 R
Ollglnal16 Inch Caslng (480 to 596) Ollglnal Grml F 111 1 tR minus (behind 16 inch W n g ) h4aterlEll imm the 1 W l Conape WC fragrnenb and gmwl flll Matedd from t9W edlapm cementftll phad from (597tO 598) R. - Total Depth of BoFehole b 5 1 ft.
Figure A-3. As-built condition of the INTEC injection well after the 1982 reconstruction.
validity of the volatile organic and mercllty sample resub. Additidly, the dhwabk holding ti= of The extendd sample collection time andmixing dumg sample collection called into question the

431.02 01 /30/2003 Rev. 1 1
ENGINEERING DESIGN FILE EDF-3943 Revision 0
Page 37 of 93
14 days for purgeable organic compounds was exceeded by 4 days at the analyhcal laboratory (Lane 1990) These discrepancies did not affect the validity of the other metals and radionuclide analysis.
A-4.6.1 East Side Waste
East side waste was collected in CPP-709 and then sent to the injection well through a variety of different pipes over the course of the injection well’s use. East side waste originated in Buildings CPP-601 , CPP-604, CPP-606, CPP-659 (New Waste Calcine Facility [NWCF]), CPP-633 (WCF), CPP-684 (Remote Analytical Laboratory [RAL]), and CPP-666 (Fluorine1 Dissolution and Storage Facility [FAST]).
A-4.6.2 24-111. Clay Tile Line
The original line to the injection well was a 24-in-diameter clay tile line from CPP-709 to the injection well that was constructed in 1951. This line served as a backup line to a new 10-in. line after 1965 and was abandoned in 1983 (see Section A4.6.3). The 24-in. clay tile line has been approximately 20% removed and approximately 80% filled with concrete for stability (WINCO 1991).
A-4.6.3 10-In. Pipe
This line connected the vault at CPP-709 to the injection well. The line has been approximately 5% removed, approximately 10% abandoned in place, and approximately 85% filled with cement (WINCO 1991).
A 10-in.-diameter line was placed in service in the early 1960s and removed from service in 1983.
A-4.6.4 2041. Fiberglass Reinforced Plastic
A 20-in.-diameter reinforced plastic line was installed between CPP-709 and the injection well in 1983 to replace the 24-in. and 10-in. service waste lines.
A-4.6.5 West Side Waste
West side waste was collected in CPP-734 before being sent to the injection well. West side waste originated in Buildings CPP-603 , CPP-637, CPP-640, and CPP-687.
A 4 7 Construction H istory Disc re pancies
Discrepancies existed within the various historical records regarding some aspects of INTEC injection well construction specifics. The most notable discrepancies and explanations are discussed below.
A-4.7.1 Borehole Size
The borehole size of the INTEC injection well is shown in the INEEL comprehensive well survey and in several other reports as being 24 in. in diameter. The early USGS as-builts show the borehole as a 24411. diameter but no original drillers construction logs or diagrams could be found. The original drilling logs state that a “starter casing” was placed into the borehole to stabilize the alluvium before drilling into the underlying basalts. It is clear that this casing was left in place after the drilling of 1950. It is difficult to visualize a hole drilled into the basalts any larger than the inside diameter of this “starter casing.” If the 20-in.-diameter surface casing found in the well in 1971 is this referenced “starter casing,” then the borehole size would be limited to approximately 20 in. in diameter. Additionally, Mr. Strausser, the original driller,

431.02 01/30/2003 Rev. 1 1
ENGINEERING DESIGN FILE EDF-3943 Revision 0
Page 38 of 93
stated that he drilled the well to a 20-in. diameter when asked specifically that question during a telephone conference call in 197 1. (Strausser 1950, Micum 197 1 b)
The borehole below the surface casing to as deep as 320 ft was repeatedly measured during the 197 1 reconstruction as 20 in. in diameter by caliper logging. It is possible, but unlikely, that this could be a second, unreported casing string within a 24-in. borehole. However, it is unlikely that this casing would remain intact while all other casings corroded.
Based on these two lines of evidence, it seems very likely that the actual borehole diameter within the basalts is 20 in. as depicted on the as-built diagrams prepared for this document.
A-4.7.2 Depth of HDPE Liner
The reconstruction logbook of 1982 lists the borehole depth prior to placement of the HDPE liner as 560 ft. The well depth was once again tagged as 560 ft after placing of the liner. However, the as-built well diagram Drawing 172090 dated March 22,1989, (EG&G 1989) shows the depth to the bottom of the HDPE liner as 540 ft. The construction logbook for the 1982 reconstruction indicates that an additional 20 ft of liner were welded onto the liner string on November 7, 1982, shortly before installation into the well. This made a total HDPE liner length of 540 ft. The liner was then placed into the well with the top of the liner at the bottom of the 20-ft-deep well vault. The person who prepared the 1989 as-built diagram either missed the addition of the 20 ft of liner shortly before installation or failed to take into account that the top of the 540-ft-long liner was placed at 20 ft bls. Based on this evidence, the as-built diagrams in this document show the HDPE liner bottom at 560 ft bls. (Gibeault and Phillips 1982; Gibeault 1983)
A-4.7.3 Eighteen Inch Diameter Casing
The as-built well diagram Drawing 172090 dated March 22, 1989, (EG&G 1989) shows an 18-in-diameter steel casing from the bottom of the injection vault to 182 ft bls. The 1971 notes and completion diagrams show this casing string as a temporary casing that was removed from the borehole on March 17, 1971. Additionally, the 1971 pay vouchers go into some detail describing the cost effects of this casing being contaminated upon its removal from the well. Based on this evidence, the as-built diagrams in this document show the 18-in.-diameter steel casing as having been removed from the well (Micum 197 1 a; Micum 197 lb).
A-4.7.4 USGS-50
Several documents generated at a later date indicate that the service waste was injected into Well USGS-50 during the 1970 reconstruction effort. No evidence of this use of USGS-50 could be found in the construction documents. The waste stream was directed to the INTEC injection well during the entire reconstruction effort according to the reconstruction logs. This was quite problematic for the cleaning efforts and ultimately lead to the failure of the PVC liner as excessive hydrostatic pressures from the injection water being placed outside of the liner may have caused its collapse. Log book entries and pay vouchers indicate that two separate backup discharge lines were constructed for the 197 1 reconstruction effort in the event that the injection well would fail to accept the waste stream. The 6-in. and 8-in. aluminum backup discharge lines were directed to USGS-47 and USGS-48 but apparently were never used (Micum 1971a; Micum 1971b). Service wastewater continued to be discharged to the injection well during the entire well reconstruction period. However, records do indicate that service wastewater was directed to USGS-50 for a brief time during the PVC liner installation in late August of 1971 (Amberson 197 1). The plant operations were curtailed during this period to minimize the amount of water sent to USGS-50.

431.02 0113012003 Rev. 1 1
ENGINEERING DESIGN FILE EDF-3943 Revision 0
Page 39 of 93
A 4 8 Construction Summary
The following list highlights the relevant construction steps that were conducted on the INTEC injection well from its initial drilling in 1950 to its abandonment in 1989:
0 The well was drilled in 1950 to a depth of 212 ft and then backfilled with gravel. The 20-in.-diameter (nominal) surface casing was left in place.
0 The well was completed in 195 1 to a depth of 598 ft.
- 16-in.-diameter steel casing was placed to the bottom of the well to 598 ft.
- Cement was placed in the bottom of the well from 597 to 598 ft to seal the bottom of the 16-in. casing.
- The casing was perforated from 412 to 452 ft and 490 to 593 A.
0 The well was reconstructed in the fall of 1970 and the spring of 1971.
- 16-in.-diameter steel casing was placed in the well to 322 ft bls.
- The well borehole was cleaned to a depth of 596.4 ft (0.6 ft of sediment remaining from the 1968 collapse).
- 9-7/8-in.-inside-diameter PVC pipe was installed to 596.4 ft.
- The PVC collapsed due to the hydrostatic pressure of injection water on the outside of the casing.
- The upper 350 ft of PVC were removed from the well and salvaged for future use. The remaining PVC and “concrete aggregate” -sized gravel were removed to a depth of 588 ft (8.4 ft of PVC and gravel remaining).
- 12-in. x .330-in.-wall-thickness steel casing was placed in the borehole to a depth of 588 ft. The 12-in. casing was perforated from 440 to 450,475 to 5 10,530 to 574 ft with four to eight perforations per ft.
- Over 150 yd3 of annular fill were placed back into the well annulus.
0 A noncorrosive plastic liner was installed into the well in August of 197 1.
- The 350 ft of salvaged PVC and additional new PVC were installed to a depth of 588 A.
- The PVC liner was perforated from 41 1 to 415 and 448 to 588 ft bls.

431.02 01/30/2003 Rev. 1 1
ENGINEERING DESIGN FILE EDF-3943 Revision 0
Page 40 of 93
0 The well was reconstructed in the fall of 1982.
- The well was cleaned to a depth of 585 ft (3 ft of material remaining from the 1981 collapse).
- Several corroded holes found in the 12-in.-diameter casing were repaired with steel liner sleeves.
- The 12-in.-diameter casing was gun-perforated with 136 separate 1/2-in.-diameter holes from 5 10 to 565 ft and 160 holes from 470 to 5 10 ft.
- A 10-in.-diameter HDPE liner with 1-in.-thick walls was placed from the bottom of the vault to 560 ft in depth. The HDPE liner was perforated with a 2-in.-diameter hole saw from 450 ft to 560 ft in depth.
0 The injection well was taken out of routine service on February 7, 1984.
The last use of the injection well occurred in 1986 (850 gal of service waste in 1986).
0 The well was plugged by pressure-grouting in 1989.
0 Sediments were present in the well below 475 ft in depth when the well was plugged.
0 It is likely that the sediments found in the well in 1989 originated from sediments outside of the borehole entering the well through the 1/2-in.-diameter perforations in the 12-in. casing and 2-in.-diameter perforations within the HDPE liner. During the reconstruction of the well in 1982, it was observed that up to 50 ft of sediment had entered the well over single weekends. There is no evidence that this process of sand and silt heave would have stopped after the well was placed back into service.
A-5. INJECTION WELL WASTE STREAM
Wastewater from the INTEC was discharged to the injection well from the beginning of plant operations in 1954 through the discontinuation of the well in 1986. The waste stream was composed of service waste collected from various areas of the facility and sent via two collection systems to the well. Figure A-4 shows the generalized schematic of the east side and west side systems as well as the buildings and processes the systems served.
A-5.1 Injection Well Piping
Service waste was collected from several different areas of the INTEC and piped to the injection well for disposal. Figure A-4 graphically demonstrates the flow paths for waste generated at the facility and disposed to the injection well. A series of piping upgrades have been conducted since the first use of the injection well in September of 1952.
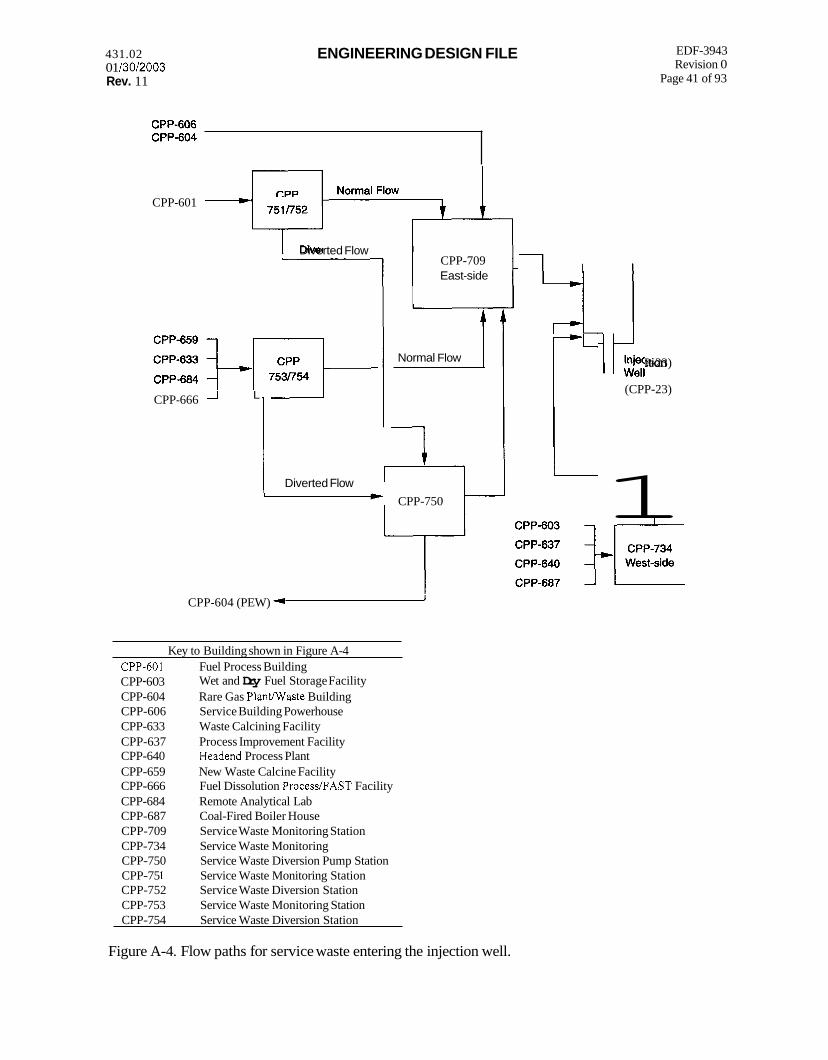
431.02 01 I3012003 Rev. 11
ENGINEERING DESIGN FILE EDF-3943 Revision 0
Page 41 of 93
751/752 CPP-601
7- Diverted Flow
L CPP-666 -I I
CPP-709 East-side
t Normal Flow I
7 CPP-750
Diverted Flow
7 r- ‘- J e l l injection (CPP-23) injection 1 J e l l (CPP-23)
1 CPP-604 (PEW) 4
1
Key to Building shown in Figure A-4 CPPdOl Fuel Process Building C P P - 6 0 3 CPP-604 Rare Gas Planwaste Building CPP-606 Service Building Powerhouse CPP-633 Waste Calcining Facility CPP-637 Process Improvement Facility CPP-640 Headend Process Plant CPP-659 New Waste Calcine Facility CPP-666 Fuel Dissolution Process/FAST Facility CPP-684 Remote Analytical Lab CPP-687 Coal-Fired Boiler House CPP-709 Service Waste Monitoring Station CPP-734 Service Waste Monitoring CPP-750 Service Waste Diversion Pump Station CPP-75 1 Service Waste Monitoring Station CPP-752 Service Waste Diversion Station CPP-753 Service Waste Monitoring Station CPP-754 Service Waste Diversion Station
Wet and Dry Fuel Storage Facility
Figure A-4. Flow paths for service waste entering the injection well.
431.02 01I30l2003 Rev. 11
ENGINEERING DESIGN FILE EDF-3943 Revision 0
Page 42 of 93
A-5.2 Chemistry of Wastewater
According to the Radioactive Waste Management Information System (RWMIS) database, it is estimated a total of 22,200 Ci (approximately 96% consisting of H-3) were discharged to the INTEC injection well during its operation. The total cumulative service wastewater flow into the well during this period was approximately 4.2 x 10” L (1.1 x 10” gal). This database provides a qualitative estimate of the activity and volume of wastewater discharged to the injection well. Based on drinking water standards, the major radionuclides of concern disposed to the injection well were H-3, Sr-90, Cs-137, and 1-129. Other short-lived radionuclides were also contained in the service waste, but the activities of these have declined to very low levels as a result of radioactive decay (DOE-ID 1997, Table 4-1). In addition, the wastewater also contained low concentrations of various other inorganic chemical constituents.
Known accidental discharges to the injection well during its operation included the following (WINCO 1992):
1.
2.
3.
4.
5.
July 1953: The contents of a tank discharged to the wastewater flowing to the well. A postdischarge analysis showed that 5 1 mCi of radioactive contaminants were released in 923,640 L (244,000 gal) of water.
December 1958: About 29 Ci of radioactive contaminants, including 7 Ci of Sr-90, were released to the well.
September 1969: Two separate releases resulted in 19 Ci of fission products released to the well. Releases included (3-137, Cs-134, Ce-144, and Sb-125 in 12.4 x lo6 L (3.28 x lo6 gal) of wastewater.
December 1969: Two releases occurred in which the quantity of Sr-90 released was higher than expected. About 1 Ci, including 30% Sr-90, was released.
March 198 1 : Mercury was detected during routine monitoring of the INTEC Service Waste System. Mercury in the form of mercuric nitrate was released fiom CPP-60 1, through the INTEC Service Waste System, to the injection well. An estimated 0.207 mg/L of mercury was detected in service waste (Resource Conservation and Recovery Act [RCRA] toxicity characteristic leaching procedure [TCLP] limit for mercury is 0.2 mg/L).
A-5.3 RCRA Constituents
Four RCRA listed hazardous waste numbers have been determined to be applicable to waste in the PEW evaporator liquid waste system. The PEW evaporator overheads (condensate) are one of the liquid waste streams that were discharged to the injection well. Although any organic constituents that caused the PEW evaporator liquid waste stream to be “listed” are not likely to be present in the PEW evaporator condensate due to evaporation, application of the “derived from” rule [40 CFR 261.3(c)-(d)] causes the same hazardous waste numbers to carry over to the PEW evaporator overhead liquid waste. The four listed hazardous waste numbers and associated constituents that caused the listing are (INEEL 1999):
0 FOO 1 (carbon tetrachloride, trichloroethylene, and 1 , l , 1-trichloroethane)
0 F002 (carbon tetrachloride, tetrachloroethylene, trichloroethylene, and 1 , 1 , 1 -trichloroethane)

431.02 01 /30/2003 Rev. 11
ENGINEERING DESIGN FILE EDF-3943 Revision 0
Page 43 of 93
0 F005 (benzene, carbon disulfide, pyridine, and toluene)
0 U134 (hydrogen fluoride).
A-5.4 Suspended Solids
The service waste stream was derived from sources that included PEW evaporator condensate, water softener regeneration fluids (backflush), cooling waters, and basin waters. Process knowledge indicates that it is unlikely that these systems would contain suspended solids. Analytical data collected from the waste stream for permitting of the new INTEC percolation ponds indicate that essentially no suspended solids are present within the waters in recent years (total suspended solids [TSS] <5 m a ) . Plant processes such as the Liquid Effluent Treatment and Disposal (LET&D) system have been put in place to reduce the radionuclides present in the waste stream, but no such changes have been made to change the presence of suspended solids. Therefore, the more recent data for suspended solids are believed to be representative of the service waste historically discharged to the well (Bechtel 2001).
The wastewater was collected in a series of vaults before being pumped or gravity-fed to the injection well. A portion of any suspended solids would have accumulated in these vaults if they were present in the waste stream. There is no indication that sedimentation was ever a problem within the vaults. An attempt was made in 1993 to sample any sediments that may have accumulated within the CPP-709 vault. Insufficient sample material was present to fill a 500-ml sample container, and the limited material that was present in one comer of the vault appeared to have been small spalled concrete pieces (Bailey 2003).
A-6. ORIGIN OF WELL SEDIMENTS
Sediment material was present in the injection well casings and/or borehole from a depth of 475 ft to 598 ft at the time of abandonment in 1989. The specific interval and source of the sediment is described below and graphically represented in Figure A-5.
A-6.1 597 to 598 ft
One foot of cement was placed into the well in 195 1 in order to seal the bottom of the well casing in place. This is standard well construction practice and is done in order to seal the casing in place and to prevent the annular fill gravel from entering the bottom portion of the well.
A-6.2 596.4 to 597 ft
The interval from 596.4 to 597 A in depth is composed of materials that collapsed into the well during the well casing failure of the late 1960s. Material above this depth was removed during the 1970 well reconstruction.
A-6.3 588 to 596.4 ft
The interval from 588 to 596.4 ft in depth is composed of 9-7/8-in.-inside-diameter PVC pipe and fragments and “concrete aggregate” -sized gravel fill resulting from the failure of the PVC liner during construction on January 27, 1971.

431.02 0113o12003 Rev. 11
600-
ENGINEERING DEkloN FILE
Origlnall6 Inch Caalng (s95 to 445)
EDF-3943 W d w 0
Page # of 93
Figure A-5. Origin of the injection well sediments.
A4.4 585 to 588 ft The intewal from 585 to 588 R in depth i s composed of materials that mlqsed into the well
during the well casing failure of 1981, Material above this depth was removed during the 1982 well recCm5bzlctiOn.
A-6.5 560 to 585 ft The material from 560 to 585 R be- accumulating immediately a h the 12-in. steel casing
wa6 gun-perforated on October 27,1982. This m e was bailed many tims and cleaned with a sand pump for wed days. Large quantities of material were mnovcd b m the well and shipped to the RWMC. A decision was made to terminate the cleaning, due to the continued heaving material, and toplace the HDPE liner to 560 fi in depth.

431.02 QlI3Ql2QQ3 Rev. 11
450
475
h a v)
8 500 c E.
3 v) c
525 b $ E 550 %
0
L3
575
600
ENGINEERING DESIGN FILE
I I I I I I I I
Minor Intermittent Use of Well -
/t Well Plugged Oct. 1989
Feb. 7,1984 Well Taken Off-line
+ Oct. 1982 well cleaned to 585 feet
+ Original TD = 597
EDF-3943 Revision 0
Page 45 of 93
The material from 475 to 560 ft in depth accumulated in the HDPE liner between the reconstruction in late 1982 and the sealing of the well in 1989. When the HDPE liner was placed into the well, it was perforated with 2-in.-diameter holes cut with a hole saw. There is no evidence to suggest that the great difficulties associated with the heaving sands encountered during the 1982 reconstruction would be mitigated by a liner with 2-in.-diameter openings. Therefore, it is reasonable to assume that this material is similar in origin to the 28 ft of material that accumulated during 19 days of construction in 1982 and that the majority of this sediment entered the well rapidly following the 1982 work-over.
Review of several video logs filmed during the time period between the reconstruction of the well in 1982 and the abandonment of the well in 1989 reveals that the well sediments began accumulating shortly after the reconstruction of the well and continued after the routine use of the well was discontinued. The video log from 1986 clearly shows sediment “stains or streamers” entering the borehole from the 2-in.-diameter HDPE liner perforations. Table A-1 indicates the depth to which sediment had accumulated at various dates following the reconstruction, and the rate of sediment accumulation in the injection well is shown graphically in Figure A-6.
Table A-1 . Sediment depth.
Date Depth to Sediment
December, 1982
March 2, 1984
March 14, 1986
July 13, 1988
October 5, 1989
560 ft below land surface
5 16 ft below land surface
483 ft below land surface
48 1 ft below land surface
475 ft below land surface
Figure A-6. Rate of sediment accumulation in injection well.

431.02 01/30/2003 Rev. 11
ENGINEERING DESIGN FILE EDF-3943 Revision 0
Page 46 of 93
A-7. REFERENCES
40 CFR 261.3,2003, “Definition of hazardous waste,” Code of Federal Regulations, Office of the Federal Register, July 2003.
Amberson, C.B., 1971, ICPP Production Monthly Report No. 137, July 27 through August 26, 1971, Allied Chemical Corporation, Amb-164-71.
Bailey, A. L., May 2003, Sampling of the CPP-709 Vault, Letter to INEEL file, May 19,2003, Located in WAG 3, 3-14 Injection Well, Project Files.
Barraclough, J. T., 1970, Letter to Dr. C.A. Pelletier, Chief Environmental Branch, AEC, NRTS, Information about the ICPP Disposal Well, USGS Well Resource Files, Russell Building, Central Facilities Area, INEEL.
Barraclough, J. T., 1981, ICPP Disposal Well - Current Conditions and Proposed Future Modifications, Letter to Warren S. Nechodom, ENICO, CPP-652, September 2 1, 198 1, Located in: CPP-03 Folder, USGS Well Resource Files, Russell Building, Central Facilities Area, INEEL.
Barraclough, J. T., 1982, ICPP Disposal Well - Deterioration of the 10-inch PVC Liner, Letter to Don Alexander, ENICO, CPP, July 15, 1982, Located in: CPP-03 Folder, USGS Well Resource Files, Russell Building, Central Facilities Area, INEEL.
Bechtel, 2001, History of INTEC Service Wastewater Characterization Activities, Engineering Design File EDF-ER-249 Rev. A, May 29,200 1.
Bechtel, 2003, Results of 2001 Groundwater Sampling in Support of Conditional No Longer Contained-In Determination for the Snake River Plain Aquifer in the Vicinity of the Idaho Nuclear Technology and Engineering Center, INEELEXT-02-00557, U.S. Department of Energy, Idaho Operations Office, April 2002.
Caudill, H. L., 1982, Environmental Evaluation for ICPP Disposal Well, Environmental Records File Number 006642, Environmental Records Center, Willow Creek Building, Idaho Falls, Idaho.
DOE-ID, November 1997, Comprehensive RI/FS for the Idaho Chemical Processing Plant OU 3-13 at the INEEL, DOE/ID-10572, U.S. Department of Energy, Idaho Operations Office.
EG&G, 1989, ICPP Injection Well Abandonment Well MAH-FE-PL-304, Drawing Number 172091, U.S. Department of Energy, Idaho Operations Office, April 1989.
EINCO, 1972, Injection Well Installation of 10” PVC Liner Drawing, Exxon Idaho Nuclear Corporation, Drawing Number 400220, USGS Well Resource Files, Russell Building, Central Facilities Area, INEEL.
EINCO, 1982, Technical Specifications, Service Waste Injection Well flushing Lines and Settling Pond, -7 S-2239 Environmental Records File Number 01241 5, Environmental Records Center, Willow Creek Building.
Gibeault, G. L. and B. L. Phillips, 1982, Daily Logs for the 1982 Reconstruction of the Injection Well, Exxon Idaho Nuclear Corporation Environmental Records File Number 0 124 13, Environmental Records Center, Willow Creek Building.

431.02 01 13012003 Rev. 11
ENGINEERING DESIGN FILE EDF-3943 Revision 0
Page 47 of 93
Gibeault, G. L., 1983, HDPE Liner Perforation Diagram, USGS Well Resource Files, Russell Building, Central Facilities Area, INEEL.
Gildersleeve, R. P. M., 1970, CPP Iniection Well- Report of the Exploration Subcontract, Letter to C. L. Murray, CPP-602, June 23, 1970, Located in: CPP-03 Folder, USGS Well Resource Files, Russell Building, Central Facilities Area, INEEL
Harmel, D. M., 1989, Summarv Report for the August 3 1, 1989 Sampling of Iniection Well CPP-23, Letter to A. R. Eberle, Manager Waste Processing Projects, Westinghouse Idaho Nuclear Company, Inc., September 26, 1989.
INEEL, 1999, “A Regulatory Analysis and Reassessment of U.S. Environmental Protection Agency Listed Hazardous Waste Numbers for Applicability to the INTEC Liquid Waste System” INEEL/EXT-98-01213 (February, 1999).
INEEL, 1997, Comprehensive RI/FS for the Idaho Chemical Processing Plant OU 3- 13 at the INEEL - Part A, RVBRA Report (Final), DOE/ID-10534, Nov. 1997.
Johnson, G. D., 1982, ICPP Disposal Well Caliper, Flow, and Video Log Summary, July 13, 1972, Located in: CPP-03 Folder, USGS Well Resource Files, Russell Building, Central Facilities Area, INEEL.
Lane, Ron, 1990, Review of Analytical Results from CPP-23 Iniection Well Abandonment / INEL, Letter to INEL File/CPP-23, State of Idaho, Division of Environmental Quality, Boise, Idaho, February 2 1, 1990.
Leenheer, Jerry A., and J.C. Bagby, 1982, IDO-22061, Organic Solutes in Groundwater at the Idaho National Engineering Laboratorv, USGS WRIR 82-1 5 .
McCabe, W. E., 1982, Daily Shift Report for the CPP#3 1982 Work-over, Environmental Records File Number 012412 (Also found as File Number 006634), Environmental Records Center, Willow Creek Building.
Micum, M. R., 1971a, Daily Logs for the Injection Well Reconstruction, USGS Well Resource Files, Russell Building, Central Facilities Area, INEEL.
Micum, M. R., 1971b, Pay Sheets, Letters to File, and Notes for the Injection Well Reconstruction, USGS Well Resource Files, Russell Building, Central Facilities Area, INEEL.
Micum, M. R., 1971c, Daily Logs for the Installation of the PVC Liner, Environmental Records File Number 006637, Environmental Records Center, Willow Creek Building.
MSE Inc., 1995, Waste Area Group 3 Remedial Investigatiofleasibility Study Final Work Plan, prepared for the U.S. Department of Energy, Idaho Operations Office, Idaho Falls, Idaho.
Nace, R. L., Morris Deutsch, and P. T. Voegeli, 1956, Geography, Geolom, and Water Resources of the National Reactor Testing Station, Idaho, IDO-22033, U.S. Geological Survey, Boise, ID.
Robertson, J. B., Robert Schoen, and J. T. Barraclough, 1974, The Influence of Liauid Waste Disposal on the Geochemistry of Water at the National Reactor Testing Station, Idaho, USGS Open File Report IDO-22053, issued by the U.S. Atomic Energy Commission, Idaho Falls, Idaho, February, 1974.
431.02 01 /30/2003 Rev. 11
ENGINEERING DESIGN FILE EDF-3943 Revision 0
Page 48 of 93
Sisco, H.G., 1951, Well Schedule for CPP #3, USGS Well Resource Files, Russell Building, Central Facilities Area, INEEL.
Stoops, Tom, 2000, Listed Waste in Groundwater at INTEC Issue Briefing, presented to State of Idaho Department of Environmental Quality, Jan. 6,2000.
Strausser, R.J., 1950, Well logs for Well Construction, USGS Well Resource Files, Russell Building, Central Facilities Area, INEEL.
Strausser, R.J., 1951, Well logs for Well Construction, USGS Well Resource Files, Russell Building, Central Facilities Area, INEEL.
United States Geological Survey, 195 l?, Various As-Built Diagrams for ICPP-03, USGS Well Resource Files, Russell Building, Central Facilities Area, INEEL.
WINCO, 1987, Closure/Post Closure Plan for the CPP-37, ICPP Gravel Pits #1 and #2, Westinghouse Idaho Nuclear Company, Inc., Idaho Falls, ID, November 6, 1987.
WINCO, 1990, Closure Plan for LDU CPP-23 Injection Well (MAH-FE-PL-3041, Westinghouse Idaho Nuclear Company, Inc., Idaho Falls, ID, March, 1990.
WINCO, 199 1, ICPP Injection Well: Mercw Release, Westinghouse Idaho Nuclear Company, Inc. Environmental Records File Number 0038 18, Environmental Records Center, Willow Creek Building.
431.02 01 /30/2003 Rev. 1 1
ENGINEERING DESIGN FILE
Appendix B
Service Waste Composition Graphs
EDF-3943 Revision 0
Page 49 of 93

431.02 01 13012003 Rev. 11
ENGINEERING DESIGN FILE EDF-3943 Revision 0
Page 50 of 93
This page is intentionally left blank.

W
LA d z (3 z W n (3 z a W W z i5 z W
I I
I

W
LL d 2 (3 z w n (3 2 a W W 2 5 2 W
0 0
0 rn 8
0 0
0 z
0

500C
4000
.C 2500
z a
2. L .-
2.
C 1500
P 1000
500
0
431.02 01/30/2003 Rev. 1 1
ENGINEERING DESIGN FILE EDF-3943 Revision 0
Page 53 of 93

0 Lo m N Lo m 0 Lo 0
Lo P P t t
Lo 7
0 7

431.02 01 /30/2003 Rev. 1 1
ENGINEERING DESIGN FILE EDF-3943 Revision 0
Page 55 of 93
Appendix C
Iodine-I29 Source Term Evaluation for Operable Unit 3-13, Group 5, Snake River Plain Aquifer

431.02 01130/2003 Rev. 11
ENGINEERING DESIGN FILE
This page is intentionally left blank.
EDF-3943 Revision 0
Page 56 of 93

431.02 0113012003 Rev. 11
ENGINEERING DESIGN FILE
ABSTRACT
The Idaho Nuclear Technology and Engineering Center located at the Idaho National Engineering and Environmental Laboratory discharged wastewater containing iodine-129 to a deep injection well from 1952 to 1986. Modeling of iodine-129 transport within the Snake River Plain Aquifer has been problematic due to uncertainty regarding the total amount of 1-129 injected to the aquifer, particularly because analyhcal data for 1-129 in the service waste are available only following 1976.
Plant processes and procedures were examined along with the existing 1-129 data to attempt to quantifl the inventory of 1-129 that was injected into the aquifer before the analysis of the waste stream began in 1976. A source term of 0.856 Ci of 1-129 was computed for the period that the injection well was in service. This value is significantly lower than that previously assumed during numerical modeling and risk assessment.
EDF-3943 Revision 0
Page 57 of 93

431.02 01l3Ol2003 Rev. 11
ENGINEERING DESIGN FILE EDF-3943 Revision 0
Page 58 of 93
This page intentionally left blank.

431.02 ENGINEERING DESIGN FILE EDF-3943 01 i30i2003 Revision 0 Rev . 11 Page 59 of 93
CONTENTS
ABSTRACT ................................................................................................................................................ 57
ACRONYMS .............................................................................................................................................. 61
c-1
c-2
c-3
C-4
c-5
c-1
c-2
c-3
INTRODUCTION .......................................................................................................................... 63
C-1.1 Site History ........................................................................................................................ 63
C-1.2 Total 1-129 at INTEC ........................................................................................................ 63
INTEC PROCESSES ..................................................................................................................... 64
c-2.1
c-2.2
C-2.3
C-2.4
(2-2.5
C-2.6
C-2.7
C-2.8
Fuel Storage ....................................................................................................................... 64
Fuel Dissolution ................................................................................................................ 64
Uranium Extraction ........................................................................................................... 64
Liquid Waste Storage ........................................................................................................ 65
High-Level Waste Evaporation ......................................................................................... 65
Calcination ........................................................................................................................ 65
Off-Gas System ................................................................................................................. 65
Process Equipment Waste Evaporator ............................................................................... 66
EVALUATION OF I- 129 DISCHARGES TO SERVICE WASTE .............................................. 66
C-3.1 Calciner Facility in the Nonoperational Mode .................................................................. 66
C-3.2 Calciner and HLLW Evaporator Operating ...................................................................... 66
1-129 SOURCE TERM TO SERVICE WASTE ............................................................................ 69
REFERENCES ............................................................................................................................... 71
FIGURES
Monthly discharge of iodine-129 to the service waste (mCi/month) plotted against INTEC operational systems ........................................................................................................................ 67
I- 129 pathways during fuel dissolution .......................................................................................... 68
I- 129 pathways during calciner and high-level waste evaporator operations ................................. 70

431.02 01/30/2003 Rev. 11
ENGINEERING DESIGN FILE EDF-3943 Revision 0
Page 60 of 93
TABLES
C-1 Ratios of airborne versus service waste 1-129 discharges during calciner shutdown ...... ..... .. . .... ... .. .. . .. . .... .. . .. .. . . . .. .. .. . .. .. .. . .. . . .. .... . .. ... . .. .... ... .... .. .. .. ... .. .. ... .. .. .. . ... . .. . . .. . .. .. .. .. . . .. .. .66
C-2 Ratios of airborne versus service waste 1-129 discharges during waste calciner operation ......................................................................................................................................... 69

I
431.02 01l30l2003 Rev. 11
ENGINEERING DESIGN FILE
ACRONYMS
APS Atmospheric Protection System
CPP Chemical Processing Plant (designation for buildings and areas at INTEC)
DOE Department of Energy
HLLW high-level liquid waste
INEEL Idaho National Engineering and Environmental Laboratory
INTEC Idaho Nuclear Technology and Engineering Center
PEW process equipment waste
EDF-3943 Revision 0
Page 61 of 93
WCF Waste Calcining Facility

431.02 01 l30l2003 Rev. 11
ENGINEERING DESIGN FILE EDF-3943 Revision 0
Page 62 of 93
This page intentionally left blank.
431.02 0113012003 Rev. 11
ENGINEERING DESIGN FILE EDF-3943 Revision 0
Page 63 of 93
1-129 Source Term Evaluation for Former INTEC Injection Well
C-I INTRODUCTION
The Idaho Nuclear Technology and Engineering Center (INTEC) located at the Idaho National Engineering and Environmental Laboratory (INEEL) discharged wastewater to a deep injection well from 1952 to 1986. Contaminants disposed in the former injection well were primarily tritium (H-3) and strontium-90 (Sr-90), although elevated levels of iodine-129 (1-129) were also present in the waste stream. Groundwater modeling has indicated that 1-129 may pose a risk to groundwater users at a future date (DOE-ID 1997). However, this modeling is based upon incomplete information regarding the amount of 1-129 disposed of through the injection well. Analfical data for 1-129 in service waste disposed of to the injection well are available only following 1976. In addition, an erroneous assumption had been made that the 1-129 discharge rate to the injection well had been constant.
Plant processes and procedures were examined along with the existing 1-129 data to attempt to quantify the inventory of 1-129 that was injected into the aquifer before 1-129 analysis of the waste stream began in 1976. This analysis yielded a revised 1-1 29 source strength that is significantly lower than that estimated previously during the RVBRA (DOE-ID 1997).
C-1.1 Site History
The INEEL is a U.S. Government-owned facility managed by the Department of Energy (DOE). INTEC has been in operation since 1952 with an original mission of research, storage of spent nuclear fuel, and reprocessing of spent nuclear fuel from defense-related projects for the recovery of enriched uranium. The DOE phased out the reprocessing operations in 1992 and redirected the plant’s mission to (1) receive and temporarily store spent nuclear fuel and other radioactive wastes for future disposition, (2) manage current and past wastes, and (3) perform remedial actions.
INTEC produces approximately 3.8 million (M) liters (1 M gal) of wastewater per day. This wastewater consists primarily of demineralizer backwash, cooling water, and steam condensate. Prior to 1984, this wastewater was disposed of to an onsite deep injection well. Routine injection to the well was discontinued in 1984 when two infiltratiodpercolation ponds were constructed. Only minor use of the injection well occurred in 1985-1986. The injection well was permanently plugged by pressure-grouting in 1989.
Analytical data for the amount and concentrations of 1-129 disposed of within the wastewater stream are available from approximately 1976 to the end of injection in 1986.1-129 activities in the service waste were not measured from 1952 to 1976. Previous attempts to model the 1-129 plume within the aquifer have used the average monthly 1-129 value for the period from 1976 to 1984 and have applied this average value to the early time period. However, due to significant changes in plant facilities and processes over this time period, this previous estimate may not be accurate.
C-1.2 Total 1-129 at INTEC
1-129 is a fission product produced during the fission of uranium in nuclear reactors. A larger quantity of 1-129 is produced in the reactor the longer fuel is allowed to fission. Attempts have been made to compute the total amount of 1-129 in the spent fuel received at the INTEC facility by computing the number of fissions that had occurred in each batch of fuel processed at the facility (Cordes 1978). This

431.02 01 /30/2003 Rev. 1 1
ENGINEERING DESIGN FILE EDF-3943 Revision 0
Page 64 of 93
computation produces an upper limit value of 5.0 Ci of 1-129 that could have been released or stored at the facility from 1953 through 1977.
The 1-129 present in the fuel enters the many plant processes and may be released to the environment through several different pathways. A portion of the 1-129 may also be stored in the liquid (tank farm) and solid (calcine) wastes. To determine the likely 1-129 release pathways at the INTEC facility, an evaluation of spent fuel reprocessing campaigns and waste calcination campaigns has been performed. An understanding of the specific chemical and physical characteristics of 1-129, as well as the plant processes, has been used to determine the fate of the 1-129 present in the fuel.
C-2 INTEC PROCESSES
The spent nuclear fuel arriving at the INTEC facility was processed to remove any remaining uranium for recycling. The liquid waste products produced from the fuel dissolution and uranium extraction processes were sent to the INTEC tank farm. Most of the liquid waste was later calcined, and the granular waste product (calcine) is currently stored in stainless steel bin sets contained in reinforced concrete vaults.
Several steps are involved from the receipt and storage of the spent fuel elements to the solidification of the waste byproducts. A review of the major steps of reprocessing is required to understand the potential pathways for release of 1-129 to the environment. The following discussion is a brief description of the spent fuel reprocessing steps conducted in the past at the INTEC facility. (McManus et al. 1982).
C-2.1 Fuel Storage
Spent fuel elements were stored in the basin waters located in Building CPP-603 near the south end of the INTEC facility during the time the injection well was used. 1-129 could enter the basin waters if fuel elements leaked or ruptured. Water was removed from the storage basins, and fresh makeup water was added in sufficient quantities to reduce concentration levels if basin water chemistry exceeded specified upper limits for a variety of analytes. Before 1964, excess basin water was sent to a shallow infiltration pit located just to the west of Building CPP-603. After 1964, waste basin water was sent to the process equipment waste (PEW) evaporator. The evaporator condensate was disposed of, along with the service waste stream, to the former injection well.
C-2.2 Fuel Dissolution
The fuel elements were dissolved in acid prior to uranium extraction. During fuel dissolution, approximately 5% of the 1-129 present in the spent fuel was lost to the atmosphere via the off-gas system (McManus et al. 1982). The remaining 95% of the 1-129 entered the uranium extraction process in Building CPP-601 in the dissolver product (McManus et al. 1982).
C-2.3 Uranium Extraction
The first-cycle extraction process removed the uranium from the dissolved fuel solution. The bulk of the 1-129, as well as other fission products in the fuel solution, remained in the residual solution referred to as first-cycle product stream. The first-cycle product contains approximately 85% of the 1-129 present in the spent fuel elements and was sent to the high-level liquid waste (HLLW) tank farm for storage. The first-cycle product solution was further processed through a series of steps to isolate the uranium.

431.02 0113012003 Rev. 11
ENGINEERING DESIGN FILE EDF-3943 Revision 0
Page 65 of 93
Additiona. purification o e uranium was performed in second- and third-cycle separations. Evaporators and steam stripping were used in the first, second, and third cycles for concentration of the uranium solutions and cleaning of the extraction solvents. The condensate from these evaporator and steam stripping operations was sent to the waste collection system.
An “upset” of the first-cycle extraction system occurred during August-October 1978, leading to a criticality event on October 7, 1978 (DOE-ID 1978). During this column upset, a higher-than-normal amount of 1-129 appears to have passed into the second- and third-cycle extraction columns. This additional 1-129 was released from the second and third cycles to the PEW evaporator and then to the injection well. This event is believed to be responsible for the anomalously high 1-129 activities discharged to the injection well during the late summer and early fall of 1978.
C-2.4 Liquid Waste Storage
Liquid waste from uranium reprocessing was sent to the tank farm where it was stored in 300,000-gal underground storage tanks. The first-cycle extraction wastes were typically stored separate from second- and third-cycle wastes, which were often stored together. Decontamination fluids and evaporator bottoms were often combined with the second- and third-cycle products.
C-2.5 High-Level Waste Evaporation
The high-level liquid waste (HLLW) evaporator was used to concentrate the more dilute wastes from the tank farm before calcination. Evaporation was often conducted on the second- and third-cycle wastes and on the decontamination solutions. Occasionally, evaporation was conducted on the first-cycle product solutions. Inspection of the tank farm records from monthly reports indicates that, during the period for which 1-129 analytical data are available (1976-1984), there were two episodes of HLLW evaporator concentration of first-cycle wastes. Heating and evaporation of the first-cycle wastes cause more of the 1-129 to volatilize and enter the PEW stream and, hence, be sent to the service waste and into the injection well.
C-2.6 Calcination
Calcining of high-level liquid waste at INTEC began in 1963 with the startup of operations in the Waste Calcining Facility (WCF). All first-cycle wastes were stored in underground tanks in the HLLW tank farm prior to the startup of this facility in 1963. The calciner heats the waste solution in a fluidized bed to form solid, granular, calcine particles, which are transferred to storage in stainless steel tanks (bins) encased in concrete vaults (bin sets). Much of the 1-129 present in the liquid waste is volatilized into the off-gas. Some of the 1-129 may have been recaptured by the atmospheric protection system (APS) and returned to the PEW evaporator. Additional 1-129 is also directed to the PEW during the dissolution of the calciner bed at the end of a run and during the associated decontamination process.
C-2.7 Off-Gas System
The APS system was installed into the off-gas waste stream in 1976. The APS condenser operated intermittently until approximately 1980 and may have been responsible for removing some 1-129 from the off-gas and directing it to the PEW and, hence, down the injection well (McManus et al. 1982).
431.02 01130/2003 Rev. 11
ENGINEERING DESIGN FILE EDF-3943 Revision 0
Page 66 of 93
C-2.8 Process Equipment Waste Evaporator
The PEW evaporator was used to reduce the volume of dilute wastes through evaporation. The concentrated evaporator bottoms were transferred to the tank farm and ultimately to the WCF calciner. The evaporated portion was condensed and directed into the service waste system. 1-129 within the waste stream volatilizes into the vapor phase and is then condensed along with the water and sent to the injection well with the service waste. Nearly all 1-129 present in the service waste is processed through the PEW evaporator. The PEW evaporator is only the final step in this waste stream, as several other systems contribute 1-1 29-contaminated waste to the PEW.
C-3 EVALUATION OF 1-129 DISCHARGES TO SERVICE WASTE
An evaluation of 1-129 transport at INTEC by McManus et al. (1982) demonstrates that most of the 1-129 released to the environment comes from a limited number of sources. The process model and analyhcal data were used to determine the likely distribution of 1-129 within the INTEC process based on the individual systems operating during any given time. The time periods that various systems were operating were plotted against the monthly discharge values of 1-129 to the service waste (Figure C-1). The graphical representation of 1-129 data indicates that the highest periods of 1-1 29 discharge correlate well with the times that the calciner or the high-level waste evaporator were operational. Therefore, 1-129 activities in the service waste and airborne discharges were computed for time periods that the calciner was either operational or nonoperational.
C-3.1 Calciner Facility in the Nonoperational Mode
Analytical data for 1-129 were compiled for the time periods that the WCF was not operating, and an average activity in service waste was computed. For the period for which analytical data are available (between 1976 and 1986), the average monthly activity of 1-129 discharged to service waste was 0.88 mCi/month. This quantity likely represents the total amount of 1-129 present in the evaporator, and strip and wash processes involved in fuel reprocessing, as well as I- 129 derived from evaporation of stored wastes through the PEW evaporator system.
Figure C-2 shows a schematic diagram of the 1-129 pathways present when the calciner is not operational, as presented by McManus et al. (1982). A comparison of airborne versus service waste discharge of 1-129 is presented in Table C-1. The ratio of observed 1-129 activities in the airborne and service waste streams at INTEC closely resembles that predicted by the McManus et al. (1982) model.
C-3.2 Calciner and HLLW Evaporator Operating
Analytical data were compiled for the time periods that the WCF and/or the high-level liquid waste evaporator was operating, and an average value for 1-129 in-service waste was computed. For the period of analytical data between 1976 and 1986, this average monthly value computed as 4.21 mCi/month of 1-129 discharged to service waste. The possible waste streams that transport 1-129 during calcination and HLLW evaporator operation are shown in Figure C-3. A comparison of airborne versus service waste discharge of 1-129 is presented in Table C-2. The ratio of airborne versus service waste 1-129 from the analysis of the waste stream at INTEC falls between the end member values postulated by McManus et al. (1982) for time periods when (1) all of the liquid waste being processed in the calciner was being directed through the HLLW evaporator and (2) the HLLW evaporator was not operating.
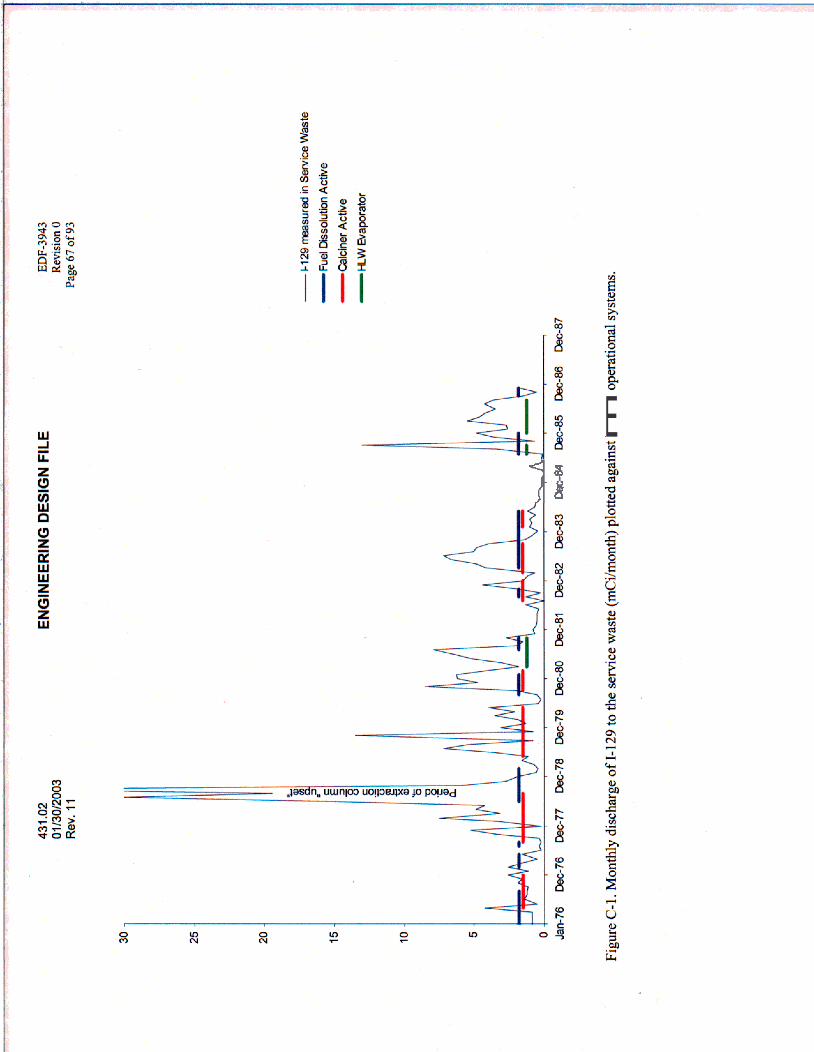
%H E

431.02 01/30/2003 Rev. 1 1
ENGINEERING DESIGN FILE
Iodine Distribution During Fuel Dissolution
Ofl
s In T T
.. I
Waste Storage
Tank Farm
86%
1 1
2nd and 3rd Cycle Extraction
EDF-3943 Revision 0
Page 68 of 93
E m Service Waste
PEW Evaporator
u -0 C
8 $ L
2nd and 3rd Cycle 601602 Deep Tanks
- 1 - Injection
Well 7 %%
Figure C-2.1-129 pathways during fuel dissolution.

431.02 01l30l2003
ENGINEERING DESIGN FILE EDF-3943 Revision 0
Rev. 11 Page 69 of 93
Table C-1. Ratios of airborne versus service waste 1-129 discharges during calciner shutdown.
Ratio of Waste Stream 1-129 Predicted Ratio Activities Measured Ratio (from McManus et al. 1982)
Service waste : airborne 1 : 1.15 1 : 1.06
Table C-2. Ratios of airborne versus service waste 1-129 discharges during waste calciner operation.
Predicted Without Ratio of Waste Stream Evaporation Predicted With Evaporation 1-129 Concentrations Measured Values (from McManus et al. 1982) (from McManus et al. 19821
Service waste : airborne 1 : 4.55 1 : 0.55 1 : 9.7
Additionally, McManus et al. (1 982) performed laboratory experiments that demonstrated that the rate of evaporation was critical to the percentage of 1-129 that volatilized into the service waste stream. The observed ratios of airborne versus service waste 1-1 29 were used to develop the numerical percentages applied to each waste stream shown in Figure C-3. It was assumed that normal plant processes would be contributing 1-1 29 at the rates computed in the previous section (approximately equal values to the service waste and airborne releases). The actual values were then estimated assuming that approximately one-fifth of the 1-129 was processed through the HLLW evaporator prior to calcination.
It should be noted that the 1-1 29 source term determination is based only on the final airborne and service waste 1-129 activities. The apportionment of 1-129 among the various waste streams within the facility does not impact the total source term, but this exercise was performed to better understand which processes contribute the most 1-129 to the service waste.
C-4 1-129 SOURCE TERM TO SERVICE WASTE
Three sets of values were used to compute the total 1-129 source term that was directed to the injection well in the service waste:
1. The actual measured discharge amounts were used for the time periods for which analytical data are available in the Radioactive Waste Management Information System (RWMIS) database. These data are available from May 1976 until use of the injection well was discontinued in 1986.
2. For the earlier time period when analytical data are not available, two separate computed values were used:
a. The average calciner nonoperating value of 0.88 mCi/month of 1-129 was used when the calciner was not operating and before it was constructed (pre-1963).
b. The average operating value of 4.2 1 mCi/month was used when the calciner andor the HLLW evaporator was operating.

431.02 01/30/2003 Rev. 1 1
Off Gas Condensate 2%
ENGINEERING DESIGN FILE
74%
74% Off gas
Treatment (APS)
EDF-3943 Revision 0
Page 70 of 93
4su Cyde Manate (Tank Fern)
PEW Bottoms 2% PEW Evaporator
Iodine Distribution During Calcination m
76%
Service Waste 11 % 4 1'
Feed 86%
Injection Well 11%
I
Off gas 1%
HLLW Overhead Condensate
11%
Recycle scrub
solution
75%
1 Calciner
Bottoms 3% 4 HLLW I , 4 15% Evaporator
71%
Calcined Solids
1% Figure C-3.1-129 pathways during calciner and high-level liquid waste evaporator operations.
431.02 0 1 13012003 Rev. 1 1
ENGINEERING DESIGN FILE EDF-3943 Revision 0
Page 71 of 93
A summation of these monthly values indicates that the total 1-129 source term to the injection well over its lifetime was 0.856 Ci.
The anomalously high 1-129 activities observed during the column “upset” during August through October 1978 were included in the calculations of monthly average 1-129 discharges, as it is believed that a similar event may have occurred in 1957.
C-5 REFERENCES
Cordes, Ormand L., Allied Chemical, to Jack T. Barraclough, USGS, April 18, 1978, “1-129 in Liquid and Airborne Effluents,” Cord-53-78.
DOE-ID, 1997, Comprehensive M/FS for the Idaho Chemical Processing Plant OU 3-1 3 at the INEEL-Part A, RI/BRA Report (FinaE), DOE/ID-10534, Rev. 0, U.S. Department of Energy Idaho Operations Office, November 1997.
DOE-ID, 1978, Recovery of ICPP from Criticality Event of October 17, 1978, prepared by Allied Chemical Idaho Chemical Programs, ACI-362, Nov. 1978.
McManus, G.J., F.A. Duce, S.J. Fernandez, and L.P. Murphy, 1982, A model of iodine-129 process distributions in a nuclear fuel reprocessing plant, Exxon Nuclear Idaho Company, Inc., ENICO-l108,41p.

431.02 0 1 l3Ol2OO3 Rev. 11
ENGINEERING DESIGN FILE EDF-3943 Revision 0
Page 72 of 93
This page intentionally le& blank.

431.02 01 I3012003 Rev. 11
ENGINEERING DESIGN FILE
Appendix D
Groundwater Quality and Trends
EDF-3943 Revision 0
Page 73 of 93
431.02 01 /30/2003 Rev. 11
ENGINEERING DESIGN FILE EDF-3943 Revision 0
Page 74 of 93
This page intentionally left blank.
431.02 0 1 /30/2003 Rev. 11
ENGINEERING DESIGN FILE
Groundwater Quality and Trends
Summary of VOC Detectbns In Groundwater for Selected Wells Downgradlent of INTEC WELL-NAME Samp Date Depth (ft) EPA MCL ((rglL)
ICPP scrvice waste 08/01/80
USGS-044 DUP USGS-044 USGS-044 DUP USGS-045
USGS-046
USGS-047
USGS-048 USGS-051 USGS-052 USGS-059 USGS-067
ICPP-1782
ICPP-1783
ICPP-I 800
ICPP-1829
ICPP-1831
SRPA Wells USGS-040 08/18/80
10/13/87 10/18/89
USGS-041 10llM90 USGS-042 10/16/90 USGS-043 08/18/80
1 0/05/87 06/21/8E
USGS-044 10/18/89 1 O R W 07/01/92 07/20/92 07/24/92 07/28/92 07/30/92 08/03/92 08/14/92 08/18/92 04/24/01 04/24/01 10/09/01 10/09/01 10126Iw 07/01/92 ow1 8/80 10/2w90 07/01/92 08/18/80 10/26/87 09/30/ea 04/25/01 1011 5/01 10/31/90 l o l l 3/87 1 011 6/90 10/06/87 O B l l 8/80 10/06/87
11/01/02 1 1 / I 5/02 10/04/02 10/18/02 11/01/02 11/15/02 10/04/02 10/18/02 11/01/02
10/04/02 10118/02
11/15/02 10/04/02 1011 8/02
11/15/02
1 oio4rnz
11/15/02
i i r n i ~ o z
i i rni ioz
456-678
426-674 452578 450-675
461550
495515 535555 557-577 580-TD 580-600 467-482 51 9-534
461-651
461-650
458-651
462-750 475-659 450-650 464-657 465-552
475-515
475-515
475-515
475-515
475-515
Perched Wells BLR-DP 06/26/01 375385 Mw-1 07/23/01 359-369 Mw-5 06/12/01 106-126 Mw-20 06/23/01 133-148 Pw-1 02/19/01 100-120 Pw-5 02/21/01 109129 USGS-50 02/26/01 357-405
Chloroform Catbon tetrachloride 100'
4 0
4 0 c0.2 4 0 <0.2 <0.2 4 0 co.2 <0.2 4 0 <0.2 4.2 <0.2 4 .2 4 .2 4 .2 4 .2 <0.2 4 .2 4 <1
4.24 <0.24 4.2 co.2 4 0 4.2 <0.2 4 0 4.2 4.2 <1
<024 co.2 4.2 4.2 <0.2 4 0 4.2 4 <1 <1 4 <1 -4 <1 4 -4 <1 4 e1 c1 <1 <1 4 4 C l
<1
5
4 0
4 0 co.2 e10 GO.2 <0.2 4 0 co.2 <0.2 4 0 c0.2 <0.2 co.2 co.2 co.2 4 . 2 4.2 qo.2 <0.2 <I .4 4 . 4 4.65 c0.65 <0.2 4.2 <lo <0.2 co.2 4 0 4.2 4.2 4 . 4 4.65 co.2 c0.2 co.2 4.2 4 0 <0.2 C l
4 <1 <1 4 <1 C l
4 <1 C l
4 <1 <1 4 <1 4 <1 <1 4
<5 <5 <5 <5 <5 <5 <5
1,l-DCA NS
4 0
4 0 <0.2 4 0 <0.2 co.2 4 0 co.2 co.2 4 0 co.2 <0.2 co.2 co.2 GO.2 co.2 <0.2 <0.2 <0.2 4 . 3 4 . 3 <0.38 c0.38 qo.2 <0.2 <lo co.2 co.2 4 0 <0.2 co.2 41.3 c0.38 <0.2 40.2 co.2 <0.2 4 0 <0.2 <1 <1 4 4 <1 C l
<1 <1 <1 -4 <1 4 <1 4 C l
<1 4 <1 4
e5 <5 <5 c5 <5 <5 <5
1,l-DCE 7
<10
4 0 <0.2 4 0 4 . 2 co.2 4 0 co.2 <0.2 4 0 co.2 <0.2 4.2 co.2 <0.2 4 2 <0.2 eo.2 co.2 4 . 5 -4.5 4 . 3 < I .3 co.2 <0.2 4 0 co.2 <0.2 4 0 <0.2 co.2 c1.5 d . 3 4.2 <0.2 <0.2 eo.2 4 0 0.2 < I <1 <1 4 <1 4 <1 <1 4 4 <1 4 <1 4 <1 <1 4 4 < l
e5 <5 <5 <5 <5 e5 <5
TCE 5
4 0
4 0 co.2 4 0 co.2 <0.2 <lo <0.2 co.2 4 0 co.2 <0.2 co.2 co.2 <0.2 4 . 2 <0.2 <0.2 4.2 c1.3 4 . 3 c0.31 <0.31 <0.2 <0.2 4 0 4.2 <0.2 4 0 <0.2 <0.2 4 . 3 0.99J <0.2 <0.2 co.2 co.2 4 0 <0.2 <1 4 4 <1 <1 <1 <1 4 <1 C l
4 <1 e1 4 <1 <1 4 <1 <1
<5 <5 e5 <5 <5 <5 <5
PCE 5
4 0
4 0 <0.2 4 0 <0.2 <0.2 4 0 4.2 <0.2 <lo <0.2 <0.2 <0.2 co.2 <0.2 c0.2 <0.2 co.2 co.2 d . 6 4 .6 <0.36 c0.36 <0.2 co.2 4 0 <0.2 co.2 <IO co.2 co.2 e l .6 c0.36 <0.2 co.2 co.2 <0.2 4 0 co.2 4 4 <I 4 4 <1 < I 4 <1 <1 4 <1 4 4 <1 4 <1 <1 4
c5 <5 c5 2J -=5 c5 <5
CFC-1 NS
4 0
4 0 <0.2 4 0 co.2 co.2 4 0 <0.2 co.2 -4 0 co.2 co.2 <0.2 co.2 co.2 <0.2 <0.2 co.2 co.2 NR NR NR NR co.2 <0.2 4 0 co.2 co.2 4 0 <0.2 co.2 NR NR <0.2 <0.2 co.2 <0.2 <io co.2 <2 <2 <2 <2 <2 -2 <2 <2 <2 <2 <2 <2 <2 <2 Q <2 <2 <2 <2
Benzene 5
4 0
4 0 eo2 4 0 eo.2 co.2 <lo <0.2 co.2 4 0 <0.2 co.2 <0.2 <0.2 co.2 <0.2 <0.2 <0.2 co.2 4 .1 4 .1 <0.37 <0.37 co.2 <0.2 < I O co.2 <0.2 e10 <0.2 co.2 4 .1 <0.37 <0.2 <0.2 co.2 <0.2 4 0 <0.2 <1 <1 <1 41 <1 4 <1 <1 4 <1 <1 4 <1 <1 C l
<1 <1 4 4
<5 45 <5 <5 <5 <5 <5
EDF-3943 Revision 0
Page 75 of 93
Toluene 1000
4 0
4 0 <0.2 4 0 <0.2 <0.2 4 0 eo.2 eo.2 4 0 co.2 co.2 0.2 1.4 0.6 1.1
co.2 <0.2 0.8 4 . 2 4 2 <0.54 e0.54 co.2 <0.2 4 0 <0.2 40.2 4 0 <0.2 co.2 4 . 2 <0.54 <0.2 <0.2 co.2 <0.2 4 0 <0.2 6.5 <1 <1 5.3
0.36 J -=1 -=l <1 < I 4 <I I .3 4 <1 4 8.6 1 .s
0.71 J 0.54 J
<5 <5 25 <5 <5 <5 <5
Data Source
IDO-22061
IDO-22061 DOWID-22074 Closure Plan for LDU CPP-23 DOWID-22104 DOWID-22104 IDO-22061 DOWID-22074 DOWID-22089 Closure Plan for LDU CPP-23 DOWID-22104 DOWID-22146 DOWID-22146 DOWID-22146 DOUlD-22146 DOWID-22146 DOWID-22146 DOWID-22146 DOWID-22146 INEEUEXT-02-00557 INEEUEXT-02-00557 INEEUEXT-02-00557 INEEUEXT-02-00557 DOWID-22104 DOWID-22146 IDO-22061 DOWID-22104 DOWID-22146 IDO-22061 DOWID-22074 DO WID-22089 INEEUEXT-02-00557 INEEUEXT-02-00557 DOWlD-22104 DOWID-22074 DOWlD-22104 DOWID-22074 IDO-22061 DOWID-22074 INEEUEXT-03-00251 INEEUEXT-03-00251 INEELEXT-03-00251 INEEUEXT-03-00251 INEELEXT-03-00251 INEEUEXT-03-00251 INEEUEXT-03-00251 INEEUEXT-03-00251 INEEUEXT-03-00251 INEEUEXT-03-00251 INEELEXT-03-00251 INEEUEXT-03-00251 INEELIEXT-03-00251 INEEUEXT-03-00251 INEEUEXT-03-00251 INEELIEXT-03-00251 INEELEXT-03-00251 INEEUEXT-03-00251 INEELEXT-03-00251
DOWID-10967 DOWID-10967 DOEAD-10967 DOWID-10967 DOWID-10967 DOWID-10967 DOWID-10967
Other
MecI=26J
CS2 = 25
MeCl = 75; CS2 = 2J Acetonitrile = 6W
NR= not reported NS = no standard establlshed for dtinklng water 'Total ttihlomethane (THM) MCL

II
Y
I
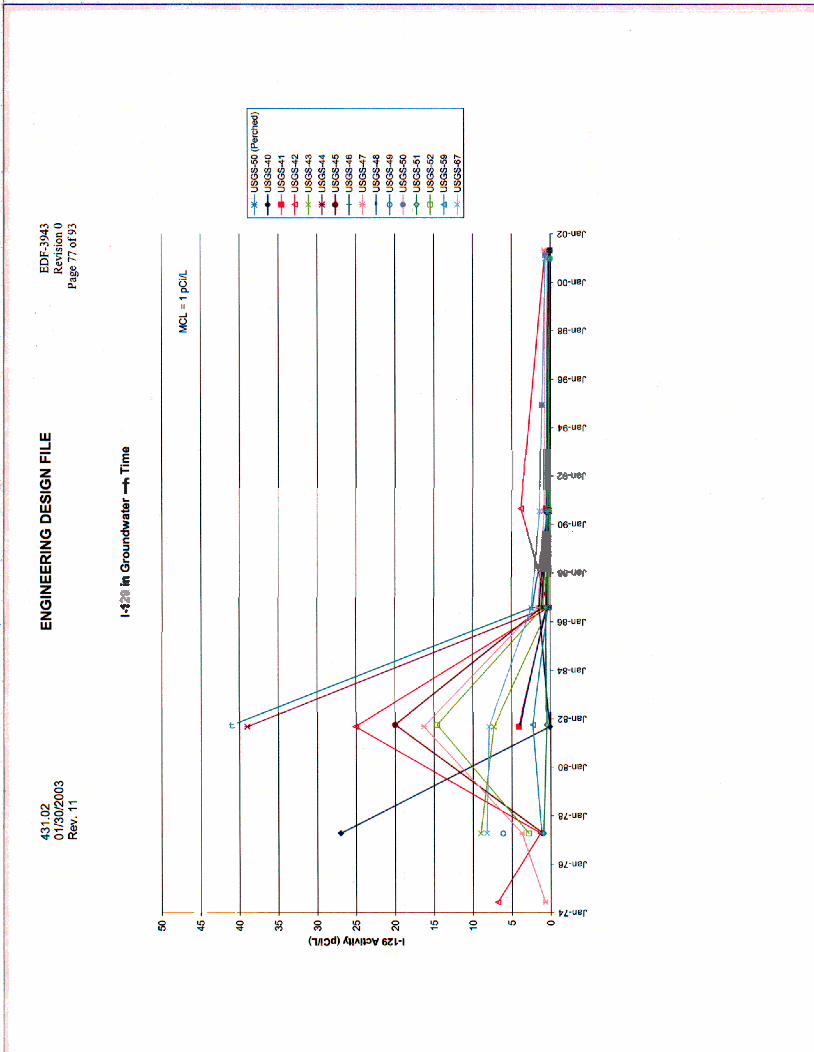
/ -
€ R f I
f
t
I I IC-
w,
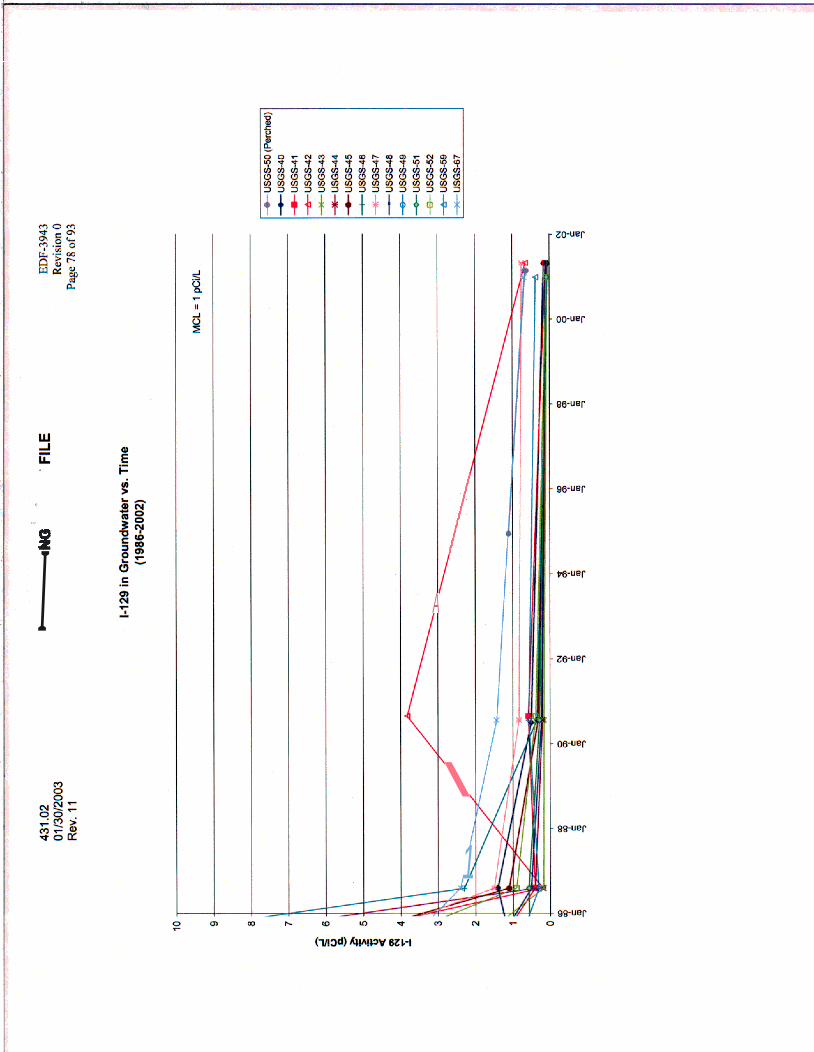
, I -
C
!!!
B
I A
I
\
1

J ami-
I

P
-a
I

431.02 01/3#2003 Rev. 11
ENGINE€RINO DESIGN FILE BDF-3943 w o n 0
Page 81 of93
. .. , . . . .. . . . - . . , .
431.02 '
01/30/2Im ENGINEER" * 3 DESION FILE BDF-3943
Revision 0 Rev. 11 Fage 82 of 93
f

431.02 0113omo3 Rev. 11
ENGINEERING DESIGN FILE
4
BDF-3843 Revision 0
Page 83 of 93
1986
INTEC,
USGS-020 *oal

.. .- . . . . . I - .
431.02 Oli3Ut20Cl3 Rev. 11
ENGINEER.. - 3 D'kSlGN FllE
us 0.c
\ '
BDF-3943 KEvision 0
Page 84 of93
- < * * ~ 1 199011991
usm-082 &llS
CFA 4

431.02 0113o)2003 Rev. 11
ENQINEERINO DESIGN FILE EDF-3943 Revision 0
Pege850f93
~as-121 ND
2001 ICPP-MOM-A-011
\.
MTEC
USPS-Ill 4.39
USGS-030, NO USOS-036
us=-034 NO
ND
U S G S ~ d 0.491
MON-A-022
UBOS-Mi ND
USQS-06B
a
0,374 USQS-122
USOS-116 0,173
as-11s
+ . P7 .098
A
I

431.02 01l3Ol2003 Rev. 11
ENGINEERING DESIGN FILE EDF-3943 Revision 0
Page 86 of 93
This page intentionally left blank.

431.02 0113012003 Rev. 11
ENGINEERING DESIGN FILE
Appendix E
Letter from Allied Chemical
EDF-3943 Revision 0
Page 87 of 93

431.02 01 13012003 Rev. 11
ENGINEERING DESIGN FILE EDF-3943 Revision 0
Page 88 of 93
This page intentionally left blank.
431.02 01 /30/2003 Rev. 11
ENGINEERING DESIGN FILE EDF-3943 Revision 0
Page 89 of 93
wwo cnemiaC M o o a A m - OMRATIONS occice
550 Srcard S l r r i t
ldrho F a l l s . ldrhr 03401
AprU 18, 1978
1-129 in Liquid and Airborne Effluents
Cord-53-78
Jack T. Barraclough U. S. Department of Interior P. 0. Box 2230 Idaho Falls, ID 83401
D e a r Mr. Barraclough:
Reference: Letter, Mr. Jack T. Barraclough to F. 8. Andareon, dated March 21, 1978
Because of the d i f f icul ty in removing and analyzing 1-129 in airborne and liquid effluents, techniques have only recently been developed a t the ICPP to accomplish these tasks. The measurement of 1-129 in our service waste began in 1976, with those praeent In our airborne dis- charges beghning in January of 1978. The following table lists the measured 1-129 releases a t the ICPP.
- Year Liquid R e l e a s e e Airborne Releases
Feb 1978 3.22 mCi Jan 1978 1.70 m C i 1977 19.82 m C i 1976 13.49 mCi
24.99 mCi 18.22 mCi I
I
The major liquid effluents discharged from the ICPP which contain 1-129 originate from the Process Equipment Waste (PEW) system. processes all of the low to intermediate-level radioactive liquid waote solutions. volumes, typically 50,000 to 1 O 0 , ~ O gal/month and consist of so1utions collected from decontamination of process equiprant, process ce l ls , and from floor drains. The 1-129 present in the liquid effluents is essentially the to ta l amount released from ICPP during normal plant ac t iv i t i e s In the absence of the Waste Calcining Facil i ty (W) operation. When the W F is operating, i t is the primary contributor of airborne 1-129 release8 a t the ICPP .
The PEW system
These radioactive waste solutions are generated i n large

I
431.02 01 /30/2003 Rev. 11
ENGINEERING DESIGN FILE
Jack T. Barraclough Cord-53-78 A p r i l 18, 1978 Page 2
Ab seen i n the above table, measureraents of X-129 i n our discharges only date back t o 1976 fo r liquid effluents and January 1978 for the airborne releases. determine the yearly liquid and airborne releases of 1-129 since 1953. However, it appears from the monthly liquid discharge levels that during fuel processing operations and decontamination ac t iv i t i e s approximately 0.5 to 2.5 m C i of 1-129 fa dlachrged monthly vi. the aqueous waste discharge systea.
The 1-3.29 levels present i n our l iquid effluent. are p r i r a r i l y dependent upon the PEW evaporator. waste is assmad to be roughly continuous, then the ICPP could have discharged as much as 750 mCi of 1-129 to the aquifer since 1953.
It is possible to calculate the approximate t o t a l 1-129 inventory a t the ICPP by two different metbods. The f i r s t method is based on the quantity of fuel proceased a t the ICPP since 1953 while the second considers the quantity of high-level l iquid waste calcined. tions and assumptions needed fo r determhing thie T-129 inventory based on the f i r s t method have been made on Attachent 1. These calculations indicate that approxiratalp 5 C i of 1-129 have been present i n processed fuel at the ICPP from 1953 t o 1977. These calculations are f a i r l y rough and should be considered an approximations.
The second method is shown i n attacheat 2 which indicates that the to ta l 1-129 inventory is approximately 6.2 C i based on a recent analysis of calcine feed from wK.185. source of airborne 1-129 releases, significant discharges to the atmos- phere only began i n 1963. these analytical results only consider the uncertainty incurred i n analysis and not the obvious uncertainty present for 1-129 i n the differ- ent calcine feeds.
Our data base is not sufficiently large t o quantitatively
If the discharge ra te of 1-129 i n the service
The calcula-
Since the W F operation is the principle
The coefficient of variations stated for
EDF-3943 Revision 0
Page 90 of 93
0 t-’
The errors expressed i n these two methods represent t h e standard deviation of the mean except fo r the t o t a l fuel burnup in a t t a c b e n t 1 and the analytical me+surements i n a t t a c b e n t 2. These latter errors are assigned based on the uncertainty in the analytical method and the quantity of fuel burned up. These errors are approxhately one standard deviation.
431.02 01 /30/2003 Rev. 11
ENGINEERING DESIGN FILE
Jack T. Barraclough Cord-53-78 April 18, 1978 Page 3
. The c h d form of 1-129 in the atmoepheric discharges bas not been determined; however, i t ha8 been postulated that mercuric iodide or methyl iodide are tha predominant epecies, but thio has not b a a confirmed.
If you have any questions conceming this matter, p l ease contact B. S. Bobertl-at at. 3560.
orvsd L. Cordea, Manager OperationiL h Emir--
Safety Office
cc: F. 8. Anderaon H. @wroski P. L. k fcml lm E. C. Ilusgra e
R. S. Robart. B. Be Wh4.t 0. L. cord- - 2
B. L. Rich. J
EDF-3943 Revision 0
Page 91 of 93
0

431.02 01 /30/2003 Rev. 11
ENGINEERING DESIGN FILE
Method 1: Total 1-129 that has been Jack T. Barraclough at the ICPP bared on fuel 0. L. Cordes proceasing operations. April 5, 1978
Page 3 Attachment 1
Fuel Type
SRP \
ICPP 1-129 Inventory from Approximately 1953 to 1977
Burnup 11-235 Product (kg) Percent U-235 (kg)
3 I Alurinum 9.85 x 10 T U 32 4.64 lo3
EDF-3943 Revision 0
Page 92 of 93
Zirconium * * 1.51 lo3
1.45 lo3 7 1.09 x lo2 EBR-I1 Stainless SIR 1 Steel
* 6.26 x lo3 kgflO% * Claraified Information
6.26 x lo6 g destroyed f 10% 5,26 lo6 wd 1.19 g U-235 dartroyad/Wd
(5.26 x lo6 XWd f 10%)(8.64 x lo4 =)(lo6 b) * 4.54 x loL7 W-sec f 10%
(4.54 x loL7 W-rec f10%)(3.12 x lolo fissionr/W-rec) - 1.42 x fissions f 10%
d.Y
1-129 firsion yield 9.92 x t 3%
(li42 x firsions i lOXl(9.92 x 23%) - 1.41 x at- of I-129*10.5%
7 Tlj2 of 1-12? = 1.64 x 10
n a = (1.41 x
1.89 x 10l1 d/r f 11.2%
years f 4 X . A - 1.34 x aec-lf 4%
at- of 1-129 i10.5%)(1.34 x 1O-l’ sec-lf 4%) =
C h
1.89 x 10l1 d/sfll.2%
3.7 x lolo d/r/Ci 5.11 Ci of 1-129*11.2%

I 1
431.02 01/30/2003 Rev. 11
ENGINEERING DESIGN FILE EDF-3943 Revision 0
Page 93 of 93
0 Method 2: Calculational airborne 1-129 . Jack T. Barraclough w
'+ WCP operatione. A p r i l 5, 1978 33
Page 4 ;n AC tachreat 2 4
releaser since 1963 baaed on Cord-53-78 '
Run #
1
2
3
4
5
6
7
8
- WCP Operation
Date of Run Hot Feed (gal)
12/8/63 -+ 10/15/64 511,000
4/1/66 -* 3/4/68 ga9,ooo
a i w a a -c 6/4/69 329,000
8/3/70 + 1/3/71 224,000
9/23/71 + 5/11/72 300,000
5/26/73 + 5/9/74 386,000
5/30/75 -* 1/24/77 375,900
9/1/77 -* 2/28/78 240,000
3 Solids ( f t
7,600
14,590
5 , 595
4,555
5,230
6,520
7,221
4 , 400
55,717 -
Recent masufementr of calciaer feed i dicated an 1-129 level of 1.36
i 8 releared t o t he atmosphere via the 8tack. estimated 1-129 releared from the ICPP stack is:
(1.36 x
The I-129 prerent in the high-level w r o t e already calcined is:
(1.36 x loo6 C i / g a l * 15%1(3,354,900 gul f 1%) - 4.56 Ci of 1-129 2 15%
Approximately 1.2 x 10 gal of bigh-level waute remainr t o be colcined. Aeouming that 1.36 vCi/gal of 1-129 i r rcproasntative of the high-level waste ye t t o be calcined, the t o t a l 1-129 in t h i s warta is:
(1.2 x 10 gal k 1%)(1.36 x Ci/galk 15%) * 1.63 Ci of 1-129 15%
In ordar to determine the t o t a l 1-129 since 1953 ao was done in method 1, it is neceeaary to campute t he 1-129 i n the high-level l iquid waste.
Thus, ths t o t a l estimated 1-129 inventory i4:
(1.63 C i f 15x1 + (4.56 C i +, 152)
MCijgal t 15% . Approximately 68% * 15% P of the iodine present i n the feed Therefore, the t o t a l
Ci/grl tL52)(.68 i i5%)(3,334,900 gal 21%) = 3.1 C i + 21%
6
6
6.19 Ci f 122
t Pcroonal c o m a i c a t i o n with 8. J. Pernandei.