Embed Size (px)
Citation preview

APPENDIX E – GREENHOUSE GAS TECHNICAL REPORT

GREENHOUSE GAS TECHNICAL REPORT
For the Proposed 1020 S. Figueroa Street Project
1020 S. Figueroa Street Los Angeles, CA
Prepared for:
HAZENS GROUP – JIA YUAN USA CO., INC. 801 South Figueroa Street, Suite 1800
Los Angeles, CA 90017
Prepared by:
ESA PCR 80 S Lake Avenue, Suite 570
Pasadena, CA 91101 TEL 626.204.6170 FAX 626.204.6171
June 2016


1020 S. Figueroa Street Project Greenhouse Gas Technical Report ESA PCR i
Table of Contents
Page
ACRONYMS AND ABBREVIATIONS .................................................................................................................................... 1
EXECUTIVE SUMMARY ..................................................................................................................................................... ES-1
1.0 INTRODUCTION ......................................................................................................................................................... 1 1.1 Existing Conditions .............................................................................................................................................................. 1 1.2 Project Description ............................................................................................................................................................... 2
1.2.1 Hotel Tower ....................................................................................................................................................................... 2 1.2.2 Residential Uses ............................................................................................................................................................... 2 1.2.3 Podium (Commercial Uses and Parking) .............................................................................................................. 2 1.2.4 Construction ...................................................................................................................................................................... 5 1.2.5 Operation ............................................................................................................................................................................ 5
1.3 Existing Site Emissions ....................................................................................................................................................... 5
2.0 REGULATORY SETTING AND SIGNIFICANCE THRESHOLDS ....................................................................... 7 2.1 Regulatory Setting ................................................................................................................................................................ 7
2.1.1 Federal ................................................................................................................................................................................. 7 2.1.2 State ...................................................................................................................................................................................... 9 2.1.3 Regional............................................................................................................................................................................ 19 2.1.4 Local ................................................................................................................................................................................... 20
2.2 Significance Threshold .................................................................................................................................................... 21 2.2.1 CEQA Guidelines, Appendix G ................................................................................................................................. 21 2.2.2 Other Greenhouse Gas Reduction Plan Considerations ............................................................................... 23
3.0 METHODOLOGY ...................................................................................................................................................... 25 3.1 Units of Measurement ...................................................................................................................................................... 25 3.2 Greenhouse Gas Emissions ............................................................................................................................................ 26
3.2.1 Construction Emissions ............................................................................................................................................. 28 3.2.2 Annual Operational Emissions ............................................................................................................................... 30 3.2.3 Land Use Characteristics and Project Design Features ................................................................................ 36
4.0 INVENTORY IN CONTEXT .................................................................................................................................... 43 4.1 Project Consistency with City Goals and Actions ...................................................................................................... 43 4.2 Calculation of Construction Emissions .......................................................................................................................... 58 4.2 Calculation of Operational Emissions ............................................................................................................................ 58 4.4 Consistency with Plans, Policies, or Regulations ...................................................................................................... 64
5.0 CUMULATIVE IMPACTS ........................................................................................................................................ 70 5.1 Project Impacts ....................................................................................................................................................................... 70
6.0 SUMMARY OF RESULTS ........................................................................................................................................ 73
APPENDICES
APPENDIX A: GREENHOUSE GAS WORKSHEETS AND OUTPUT FILES
1020 S. Figueroa Street Project Greenhouse Gas Technical Report ESA PCR ii
List of Figures
Figure Page 1 Vicinity Location Map ......................................................................................................................................................... 3 2 Aerial Photograph of Project Site and Vicinity ......................................................................................................... 4
List of Tables
Table Page 1 Estimated Existing Site Greenhouse Gas Emissions .............................................................................................. 6 2 Estimated Greenhouse Gas Emissions Reductions Required by AB 32 ...................................................... 11 3 Consistency with Applicable City of Los Angeles Green LA Plan GHG Emissions Goals and
Actions ................................................................................................................................................................................... 43 4 Consistency with Applicable City of Los Angeles Sustainable City pLAn Goals ....................................... 55 5 Estimated Unmitigated Construction Greenhouse Gas Emissions ............................................................... 59 6 Estimated Unmitigated Operational Greenhouse Gas Emissions .................................................................. 60 7 Consistency with Applicable Greenhouse Gas Reduction Strategies ........................................................... 67 8 State of California GHG Emissions .............................................................................................................................. 71

1020 S. Figueroa Street Project Greenhouse Gas Technical Report ESA PCR 1
ACRONYMS AND ABBREVIATIONS Acronym Description
AB 32 Assembly Bill 32: The Global Warming Solutions Act of 2006 AQMP Air Quality Management Plan AR4 (Intergovernmental Panel on Climate Change) Fourth Assessment Report Basin South Coast Air Basin BAU Business-as-Usual CAA Clean Air Act CAFE Corporate Average Fuel Economy CalEEMod California Emissions Estimator Model CalEPA California Environmental Protection Agency CARB California Air Resources Board CAPCOA California Air Pollution Control Officers Association CCAT California Climate Action Team CEC California Energy Commission CEQA California Environmental Quality Act CH4 methane City City of Los Angeles CO2 carbon dioxide CO2e units of equivalent mass of carbon dioxide CPUC California Public Utilities Commission DPM diesel particulate matter FY fiscal year GHG greenhouse gas GWP Global Warming Potential HFC hydrofluorocarbon HVAC heating, ventilation, and air conditioning IPCC Intergovernmental Panel on Climate Change LEED Leadership in Energy and Environmental Design LGOP Local Government Operations Protocol LUT Land Use Transportation mpg miles per gallon MPOs metropolitan planning organizations MTCO2e metric tons of carbon dioxide equivalent MMTCO2e million metric tons of carbon dioxide equivalent N2O nitrous oxide OPR Office of Planning and Research PFC Perfluorocarbon RPS Renewables Portfolios Standard RTP/SCS Regional Transportation Plan/Sustainable Communities Strategy SAR (Intergovernmental Panel on Climate Change) Second Assessment Report SCAG Southern California Association of Governments

Acronyms and Abbreviations July 2016
1020 S. Figueroa Street Project Greenhouse Gas Technical Report ESA PCR 2
Acronym Description
SCAQMD South Coast Air Quality Management District SF6 sulfur hexafluoride SIP State Implementation Plan USDOT United States Department of Transportation USEPA United States Environmental Protection Agency USGBC United States Green Building Council VMT vehicle miles traveled

1020 S. Figueroa Street Project Greenhouse Gas Technical Report ESA PCR ES-1
EXECUTIVE SUMMARY
Hazens Group – Jia Yuan USA Co., Inc., the Applicant, proposes to develop the 1020 S. Figueroa Street Project (the Project) on an approximately 2.7 acre (116,660 square feet) ‘L’-shaped site (Project Site) bounded by S. Figueroa Street to the west, S. Flower Street to the east, W. Olympic Boulevard to the north, and 11th Street to the south. In accordance with the requirements under the California Environmental Quality Act (CEQA), this Technical Report provides an estimate of the greenhouse gas (GHG) emissions for the Project and predicts the potential impacts from construction and operational activities. The report includes the categories and types of emission sources resulting from the Project, the calculation procedures used in the analysis, and any assumptions or limitations.
The Project Site is located in the southwest portion of the Downtown community of the City of Los Angeles (City) which falls within the South Park district of the Central City Community Plan Area. The Project would consist of mixed-use residential, hotel and commercial uses. Overall, the Project would a total of up to 300 hotel rooms, 650 residential condominium units, and up to approximately 80,000 sf of retail, restaurant, and other commercial uses, for a total of approximately 1,130,000 square feet of floor area. The Project includes demolition of all existing on-site buildings and features, excavation for subterranean parking, and construction of buildings.
The proposed project would introduce short-term and temporary GHG emissions from construction and long-term GHG emissions from operation. This report summarizes the potential for the Project to generate GHG emissions that may have a significant impact on the environment and its potential to conflict with any applicable plan, policy or regulation of an agency adopted for the purpose of reducing the emissions of GHGs. The findings of the analyses are as follows:
The Project would generate GHG emissions due to construction and operational activities; however, the net increase in annual GHG emissions, directly and indirectly, would be consistent with the City of Los Angeles LA Green Plan and Sustainable City pLAn. Therefore, as the Project would be consistent with the applicable City’s goals and actions for GHG emissions, GHG emissions and associated impacts would be less than significant.
The Project would be consistent with the AB 32 goals and CARB guidelines for assessing GHG emissions. Further, the Project would include land use characteristics and design features that would be consistent with State, Regional, and Local Regulations for reducing GHG emissions. Therefore, as the Project would be consistent with applicable plans, policies and regulations adopted for the purpose of reducing GHG emissions, impacts regarding GHG reduction plans would be less than significant.


1020 S. Figueroa Street Project Greenhouse Gas Technical Report ESA PCR 1
1.0 INTRODUCTION
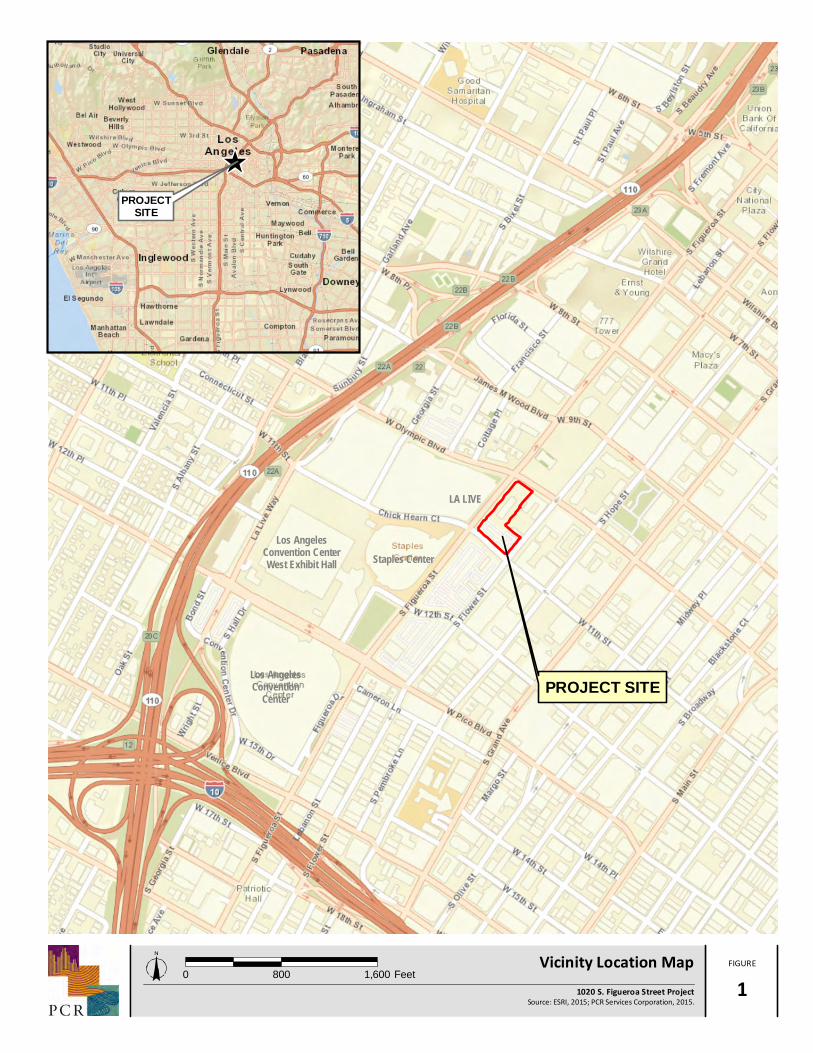
1.1 EXISTING CONDITIONS Hazens Group – Jia Yuan USA Co., Inc., the Applicant, proposes to develop the 1020 S. Figueroa Street Project (the Project) on an approximately 2.7 acre (116,660 square feet) ‘L’-shaped site (Project Site) bounded by S. Figueroa Street to the west, S. Flower Street to the east, W. Olympic Boulevard to the north, and 11th Street to the south. The Project Site is located in the southwest portion of the Downtown community of the City of Los Angeles (City) which falls within the South Park district of the Central City Community Plan Area. The Project Site shown in Figure 1, Vicinity Location Map. The Project Site is in a highly urbanized and active area adjacent to LA LIVE, Staples Center Arena, Microsoft Theater, and in close proximity to the Los Angeles Convention Center.
The Project Site is well served by a network of regional transportation facilities. The Project Site is located approximately 0.2 miles north of the Pico Station operated by the Los Angeles County Metropolitan Transportation Authority (Metro). The Pico Station serves the Blue Line and the Expo Line. The Blue Line provides rail service between the City of Long Beach and Downtown Los Angeles with connecting service to the Metro Green Line (serving Norwalk, Redondo Beach, and LAX via shuttle). Regional access to the Project Site is provided by the Pasadena/Harbor Freeway (I-110/SR 110), located approximately 0.3 miles to the west; the Santa Monica Freeway (I-10) located approximately 0.5 miles to the south; and, the Hollywood Freeway (US-101), located approximately 1.5 miles to the north. These three freeways also provide access to the Golden State/Santa Ana Freeway (I-5) to the north, and the San Bernardino Freeway (I-10) and the Pomona Freeway (SR-60) to the east and southeast, respectively.
The Project Site is currently developed with the Luxe City Center Hotel (Luxe Hotel) on the northwest portion of the Project Site with the remainder of the Project Site developed with surface parking. The Luxe Hotel is a 112,748 square foot, nine story, 100 foot tall building that includes 178 guest rooms, a main lobby, meeting rooms, an interior restaurant, an indoor/outdoor bar and lounge area (Nixon Bar and Lounge), a fitness center, and a one-level parking deck with parking below and above the deck, all of which would be demolished and removed to support development of the Project. Figure 2, Aerial Photograph of Project Site and Vicinity, shows the Project Site and surrounding land uses.
In accordance with the requirements under CEQA, this Greenhouse Gas Technical Report provides an estimate of greenhouse gas (GHG) emissions for the proposed Project and predicts the potential impacts from Project construction and operation. The report summarizes the potential for the proposed Project to generate GHG emissions that would cause a significant impact and to conflict with an applicable plan to reduce GHG emissions. The following Project-related emission sources have been evaluated:
1. Construction Activities – Fossil fueled on- and off-road vehicles and equipment needed for grading, building construction, paving, and architectural coating;
2. Direct Emission Sources – Consumption of natural gas on-site for cooking, space heating and water heating, combustion of fossil fuels for lawn care and maintenance activities, and motor vehicles; and
3. Indirect Emission Sources – Off-site electricity generation, wastewater treatment and water conveyance, and solid waste disposal.

1.0 Introduction July 2016
1020 S. Figueroa Street Project Greenhouse Gas Technical Report ESA PCR 2
The Greenhouse Gas Technical Report is based on emissions modeling methodologies from the SCAQMD CEQA Air Quality Handbook and Air Quality Analysis Guidance Handbook1 and other guidance from the California Air Resources Board (CARB), California Air Pollution Control Officers Association (CAPCOA), and United States Environmental Protection Agency (USEPA), as appropriate.
1.2 PROJECT DESCRIPTION The Project would consist of mixed-use residential, hotel and commercial uses with two residential towers and one hotel tower. Phase I of the Project would include construction of the 34 story Hotel Tower, located on the corner of 11th Street and S. Figueroa Street would include up to 300 hotel rooms, banquet, conference space and various amenities. Phase I would also include construction of the Residential Tower 1 that would include up to 290 residential units and would be located at the corner of 11th Street and S. Flower Street. During Phase 2, the Residential Tower 2 would be constructed that would include up to 360 residential units and would be located at the corner of S. Figueroa Street and W. Olympic Boulevard.
1.2.1 Hotel Tower Constructed during Phase I of the Project, on the southwest portion of the Project Site directly across from Staples Center, a 34 story Hotel Tower is proposed that would have a maximum height of 430 feet. It would be designed as a high-quality hotel with up to 300 hotel rooms, along with banquet facilities, conference space and amenities, for a total of 280,000 sf of hotel use. Additional amenities would also be located at the top/penthouse level of the Hotel Tower (Hotel Rooftop Amenity Deck), including a swimming pool, bar, spa tub, lounging area, and function space.
1.2.2 Residential Uses Developed as part of Phase 1 of the Project, Residential Tower 1 would be constructed at the southeast corner of the Project Site at the intersection of 11th Street and Flower Street. The Residential Tower 1 would be 32 stories above grade with a maximum height of 490 feet and would include up to 290 residential condominium units consisting of lofts, studios, one-bedroom, two-bedroom, three-bedroom units, and penthouse units. Phase 2 would include construction of Residential Tower 2, located on the northwestern portion of the Project Site at the intersection of S. Figueroa Street and Olympic Boulevard. Residential Tower 2 would be 38 stories above grade, with a maximum height of 540 feet. Phase 2 would include the construction of 360 units consisting of lofts, studios, one-bedroom, two-bedroom, three-bedroom units, and penthouse units. Amenities associated with the residential towers would include lobbies, fitness centers, and recreational space.
1.2.3 Podium (Commercial Uses and Parking) The Podium area would include up to 80,000 sf of commercial uses, including 40,000 sf of commercial use and 40,000 sf of restaurant uses located within two-stories fronting 11th Street, S. Figueroa Street, W. Olympic Boulevard, and S. Flower Street. The Podium would be 75 feet in height and levels three and four of the Podium would include residential units and hotel amenities.
1 South Coast Air Quality Management District, Air Quality Analysis Guidance Handbook, http://www.aqmd.gov/ceqa/hdbk.html.
Accessed August 2013.
Los AngelesConvention CenterWest Exhibit Hall
Los AngelesConvention
Center
Staples Center
LA LIVE
PROJECT SITE
FIGURE
Source: ESRI, 2015; PCR Services Corporation, 2015.
0 800 1,600 Feet1020 S. Figueroa Street Project
Vicinity Location Map1
PROJECTSITE

Olympic Boulevard
W 11th Street
W 12th Street
S Fig
ueroa
Stree
t
W 9th Street
¬«110
S Flo
wer St
reet
Staples Center
MicrosoftTheater
LA LIVE
LA LIVE
The Ritz-Carlton Residences and
JW Marriott (Hotel/Residences)
Construction
Construction
Multi-Family
Multi-Family Multi-
Family
Commercial
Retail/Parking
Multi-Family
Multi-Family Multi-
Family
Multi-Family
Multi-Family
OfficePetroleumBuilding/Office
Restaurant
Mixed Use/Multi-Family
Park
Multi-FamilyCommercial Mixed Use/
Multi-family
Multi-Family
Parking
Hotel
Hotel
OfficeOffice
MedicalOffice
Multi-Family
Salvation ArmyDepartment
of Water and Power
FIGURE
Source: Google Maps, 2015 (Aerial); PCR Services Corporation, 2016.
0 300 Feet1020 S. Figueroa Street Project
Aerial Photograph of Project Site and Vicinityo 2
Project Site

July 2016 1.0 Introduction
1020 S. Figueroa Street Project Greenhouse Gas Technical Report ESA PCR 5
1.2.4 Construction The Project will be constructed in two phases. Construction of Phase 1 of the Project is expected to commence in the third quarter of 2017 and would be completed in the second quarter of 2020. Construction of Phase 2 of the Project would begin immediately after Phase 1 and would be completed in the first quarter of 2023. Total cut would be approximately 202,000 cubic yards of soil2 and no fill would be required on the Site. A detailed discussion of the methodology used to estimate the construction GHG emissions is provided in Section 3.0, Methodology, below.
1.2.5 Operation The Project would increase the building floor area on the Site and associated vehicle trips as compared to existing conditions. Therefore, the incremental increase in air emissions is estimated for the Project. The Project would be built to meet or exceed current building energy efficiency standards, which would minimize operational emissions. A detailed discussion of the methodology used to estimate the operational GHG emissions is provided in Section 3.0, Methodology, below.
1.3 EXISTING SITE EMISSIONS The Project Site is located within the Downtown area of the City of Los Angeles, and is currently developed with the nine-story Luxe Hotel and surrounding surface parking lots, which would be demolished and removed from the Site. GHG emissions are currently associated with vehicle trips to and from the existing Project Site, on-site combustion of natural gas for heating and cooking, on-site combustion emissions from landscaping equipment, off-site combustion of fossil fuels for electricity, and off-site emissions from solid waste decomposition and wastewater treatment. GHG emissions are estimated using the California Emissions Estimator Model (CalEEMod), which is a statewide land use emissions computer model designed to provide a uniform platform for government agencies, land use planners, and environmental professionals to quantify potential criteria pollutant and GHG emissions from a variety of land use projects. CalEEMod was developed in collaboration with the air districts of California. Regional data (e.g., emission factors, trip lengths, meteorology, source inventory, etc.) have been provided by the various California air districts to account for local requirements and conditions. The model is considered to be an accurate and comprehensive tool for quantifying air quality and GHG impacts from land use projects throughout California.3 CalEEMod was used to estimate GHG emissions from electricity, natural gas, solid waste, water and wastewater, fireplaces, and landscaping equipment. Building electricity and natural gas usage rates are adjusted to account for prior Title 24 Building Energy Efficiency Standards.4 Mobile source emissions are estimated based on CARB’s updated version of the on-road vehicle emissions factor (EMFAC) model. The most recent version is EMFAC2014, which “represents ARB's current understanding of motor vehicle travel
2 Included in this calculation is a soil expansion factor of 1.25 3 See: http://www.caleemod.com. 4 California Air Resources Board, CalEEMod User's Guide, Appendix F, Section 5, July 2013, http://caleemod.com/. Accessed November
2015. Factors for the prior Title 24 standard are extrapolated based on the technical source documentation.
1.0 Introduction July 2016
1020 S. Figueroa Street Project Greenhouse Gas Technical Report ESA PCR 6
activities and their associated emission levels.”5 A detailed discussion of the methodology used to estimate the emissions is provided in Section 3.0, Methodology, below.
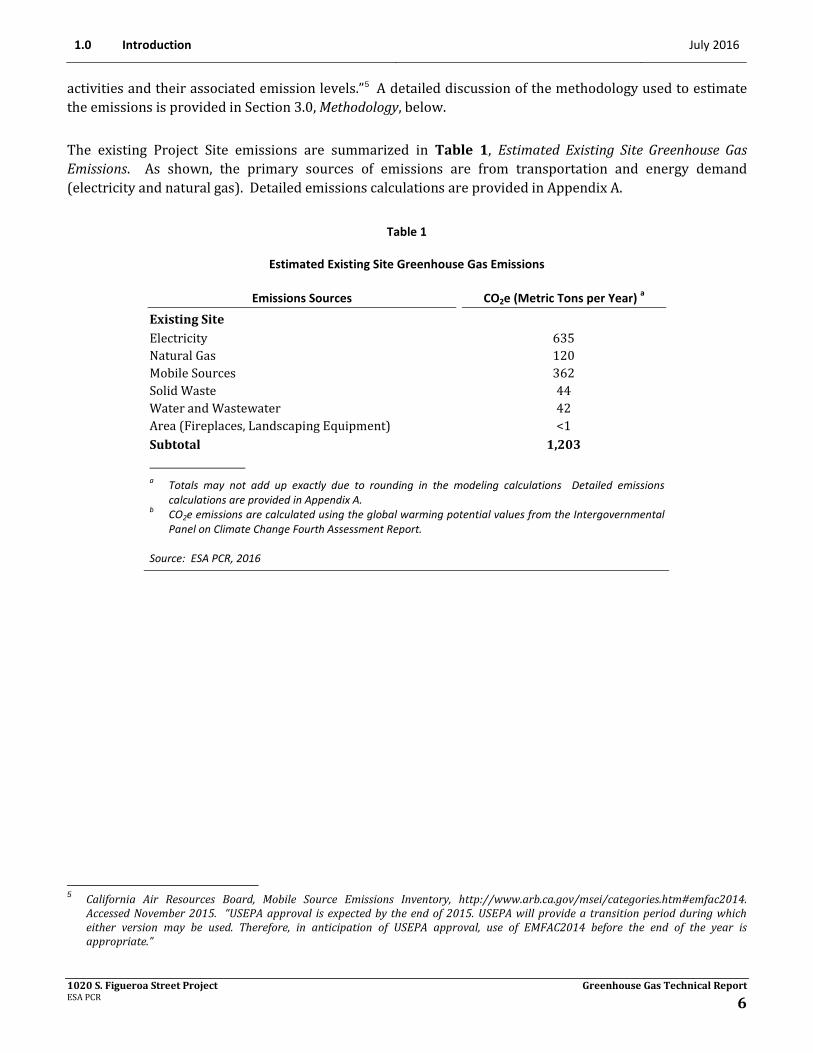
The existing Project Site emissions are summarized in Table 1, Estimated Existing Site Greenhouse Gas Emissions. As shown, the primary sources of emissions are from transportation and energy demand (electricity and natural gas). Detailed emissions calculations are provided in Appendix A.
Table 1
Estimated Existing Site Greenhouse Gas Emissions
Emissions Sources CO2e (Metric Tons per Year) a
Existing Site Electricity 635 Natural Gas 120 Mobile Sources 362 Solid Waste 44 Water and Wastewater 42 Area (Fireplaces, Landscaping Equipment) <1 Subtotal 1,203 a Totals may not add up exactly due to rounding in the modeling calculations Detailed emissions
calculations are provided in Appendix A. b CO2e emissions are calculated using the global warming potential values from the Intergovernmental
Panel on Climate Change Fourth Assessment Report. Source: ESA PCR, 2016
5 California Air Resources Board, Mobile Source Emissions Inventory, http://www.arb.ca.gov/msei/categories.htm#emfac2014.
Accessed November 2015. “USEPA approval is expected by the end of 2015. USEPA will provide a transition period during which either version may be used. Therefore, in anticipation of USEPA approval, use of EMFAC2014 before the end of the year is appropriate.”
1020 S. Figueroa Street Project Greenhouse Gas Technical Report ESA PCR 7
2.0 REGULATORY SETTING AND SIGNIFICANCE THRESHOLDS
2.1 REGULATORY SETTING
2.1.1 Federal The USEPA is responsible for implementing federal policy to address global climate change. The federal government administers a wide array of public-private partnerships to reduce the GHG intensity generated by the United States. These programs focus on energy efficiency, renewable energy, methane and other non-carbon dioxide (CO2) gases, agricultural practices, and implementation of technologies to achieve GHG reductions. The USEPA implements several voluntary programs that substantially contribute to the reduction of GHG emissions. All of these programs play a significant role in encouraging voluntary reductions from large corporations, consumers, industrial and commercial buildings, and many major industrial sectors.
In Massachusetts v. Environmental Protection Agency (Docket No. 05–1120), the U.S. Supreme Court held in April of 2007 that the USEPA has statutory authority under Section 2020 of the federal Clean Air Act (CAA) to regulate GHGs. The court did not hold that the USEPA was required to regulate GHG emissions; however, it indicated that the agency must decide whether GHGs cause or contribute to air pollution that is reasonably anticipated to endanger public health or welfare.
The President signed Executive Order 13432 on May 14, 2007, directing the USEPA, along with the Departments of Transportation, Energy, and Agriculture, to initiate a regulatory process that responds to the Supreme Court’s decision. Executive Order 13432 was codified into law by the 2009 Omnibus Appropriations Law signed on February 17, 2009. The order sets goals in the areas of energy efficiency, acquisition, renewable energy, toxics reductions, recycling, sustainable buildings, electronics stewardship, fleets, and water conservation. In addition the order requires more widespread use of Environmental Management Systems as the framework in which to manage and continually improve these sustainable practices. This Executive Order requires federal agencies to lead by example in advancing the nation’s energy security and environmental performance by achieving the following goals:
Energy Efficiency: Reduce energy intensity 30 percent by 2015, compared to a fiscal year (FY) 2003 baseline.
Greenhouse Gases: Reduce greenhouse gas emissions through reduction of energy intensity 30 percent by 2015, compared to an FY 2003 baseline.
Renewable Power: At least 50 percent of current renewable energy purchases must come from new renewable sources (in service after January 1, 1999).
Building Performance: Construct or renovate buildings in accordance with sustainability strategies, including resource conservation, reduction, and use; siting; and indoor environmental quality.
Water Conservation: Reduce water consumption intensity 16 percent by 2015, compared to an FY 2007 baseline.

2.0 Regulatory Setting and Significance Thresholds July 2016
1020 S. Figueroa Street Project Greenhouse Gas Technical Report ESA PCR 8
Vehicles: Increase purchase of alternative fuel, hybrid, and plug-in hybrid vehicles when commercially available.
Petroleum Conservation: Reduce petroleum consumption in fleet vehicles by 2 percent annually through 2015, compared to an FY 2005 baseline.
Alternative Fuel: Increase use of alternative fuel consumption by at least 10 percent annually, compared to an FY 2005 baseline.
Pollution Prevention: Reduce use of chemicals and toxic materials and purchase lower risk chemicals and toxic materials.
Procurement: Expand purchases of environmentally sound goods and services, including bio-based products.
Electronics Management: Annually, 95 percent of electronic products purchased must meet Electronic Product Environmental Assessment Tool standards where applicable; enable Energy Star® features on 100 percent of computers and monitors; and reuse, donate, sell, or recycle 100 percent of electronic products using environmentally sound management practices.
On May 19, 2009, the President announced a national policy for fuel efficiency and emissions standards in the U.S. auto industry. The policy is a collaboration between the U.S. Department of Transportation (USDOT) and the USEPA. The proposed federal standards apply to passenger cars and light-duty trucks built in model years 2012 through 2016. The proposed rule would surpass the prior Corporate Average Fuel Economy (CAFE) standards and require an average fuel economy standard of 35.5 miles per gallon (mpg) and 250 grams of CO2 per mile by model year 2016, based on USEPA calculation methods. Based on USDOT calculation methods, the standards set a requirement to meet an average fuel economy of 34.1 mpg by 2016. Although this is lower than the 35.5 mpg, the USEPA method gives automakers credits for improvements to air-conditioning systems that also reduce leakage of refrigerants into the atmosphere or reduce fuel consumption while the system is operating. The improvements to these systems equate to an overall reduction of GHGs. These standards were formally adopted by the USEPA and USDOT on April 1, 2010.
In August 2012, the USEPA and USDOT adopted standards for model year 2017 through 2025 passenger cars and light-duty trucks. By 2020, vehicles are required to achieve a combined standard of 41.7 mpg and 213 grams of CO2 per mile. By 2025, vehicles are required to achieve 54.5 mpg (if GHG reductions are achieved exclusively through fuel economy improvements) and 163 grams of CO2 per mile. According to the USEPA, a model year 2025 vehicle would emit one-half of the GHG emissions from a model year 2010 vehicle.6
On December 7, 2009, the USEPA Administrator signed two distinct findings regarding GHGs under Section 202(a) of the federal CAA. The USEPA adopted a Final Endangerment Finding for the six defined GHGs: CO2, methane (CH4), nitrous oxide (N2O), hydrofluorocarbons (HFCs), perfluorocarbons (PFCs), and sulfur hexafluoride (SF6). The Endangerment Finding is required before USEPA can regulate GHG emissions under Section 202(a)(1) of the CAA in fulfillment of the U.S. Supreme Court decision. The USEPA also adopted a Cause or Contribute Finding in which the USEPA Administrator found that GHG emissions from new motor vehicle and motor vehicle engines are contributing to air pollution, which is endangering public health and
6 U.S. Environmental Protection Agency, EPA and NHTSA Set Standards to Reduce Greenhouse Gases and Improve Fuel Economy for
Model Years 2017-2025 Cars and Light Trucks, (August 2012), http://www.epa.gov/oms/climate/documents/420f12051.pdf. Accessed August 2013.

July 2016 2.0 Regulatory Setting and Significance Thresholds
1020 S. Figueroa Street Project Greenhouse Gas Technical Report ESA PCR 9
welfare. These findings do not themselves impose any requirements on industry or other entities. However, these actions were a prerequisite for implementing GHG emissions standards for vehicles.
2.1.2 State The State of California has promulgated a number of regulations and policies to reduce statewide GHG emissions, including source-specific regulations focused on the energy-production sector, mobile sources, and buildings. Regulations that are relevant to the Project are described below.
2.1.2.1 General
(a) California Air Resources Board
CARB, a part of the California Environmental Protection Agency (CalEPA), is responsible for the coordination and administration of both federal and state air pollution control programs within California. In this capacity, CARB conducts research, sets state ambient air quality standards, compiles emission inventories, develops suggested control measures, and provides oversight of local programs. CARB establishes emissions standards for motor vehicles sold in California, consumer products (such as hairspray, aerosol paints, and barbecue lighter fluid), and various types of commercial equipment. It also sets fuel specifications to further reduce vehicular emissions. CARB has primary responsibility for the development of California’s State Implementation Plan (SIP), for which it works closely with the federal government and the local air districts. The SIP is required for the State to take over implementation of the Clean Air Act. CARB also has primary responsibility for adopting regulations to meet the State’s goal of reducing GHG emissions to 1990 levels by 2020.
(b) Executive Order S-3-05 and Executive Order B-30-15
California Governor Arnold Schwarzenegger announced on June 1, 2005, through Executive Order S-3-05, the following GHG emission reduction targets:
By 2010, California shall reduce GHG emissions to 2000 levels;
By 2020, California shall reduce GHG emissions to 1990 levels; and
By 2050, California shall reduce GHG emissions to 80 percent below 1990 levels.
In accordance with Executive Order S-3-05, The Secretary of CalEPA is required to coordinate efforts of various agencies in order to collectively and efficiently reduce GHGs. Some of the agency representatives involved in the GHG reduction plan include the Secretary of the Business, Transportation and Housing Agency, the Secretary of the Department of Food and Agriculture, the Secretary of the Resources Agency, the Chairperson of CARB, the Chairperson of the California Energy Commission, and the President of the Public Utilities Commission. Representatives from these agencies comprise the California Climate Action Team (CCAT).
The CCAT provides biennial reports to the Governor and Legislature on the state of GHG reductions in the state as well as strategies for mitigating and adapting to climate change. The first CCAT Report to the Governor and the Legislature in 2006 contained recommendations and strategies to help meet the targets in
2.0 Regulatory Setting and Significance Thresholds July 2016
1020 S. Figueroa Street Project Greenhouse Gas Technical Report ESA PCR 10
Executive Order S 3-05.7 The 2010 CCAT Report, finalized in December 2010, expands on the policy oriented 2006 assessment.8 The new information detailed in the CCAT Report includes development of revised climate and sea-level projections using new information and tools that have become available in the last two years; and an evaluation of climate change within the context of broader social changes, such as land-use changes and demographic shifts.
On April 29, 2015, California Governor Brown issued Executive Order B-30-15. Therein, Governor Brown:
Established a new interim statewide reduction target to reduce GHG emissions to 40 percent below 1990 levels by 2030.
Ordered all state agencies with jurisdiction over sources of GHG emissions to implement measures to achieve reductions of GHG emissions to meet the 2030 and 2050 reduction targets.
Directed CARB to update the Climate Change Scoping Plan to express the 2030 target in terms of million metric tons of carbon dioxide equivalent.
CARB subsequently expressed its intention to initiate the Climate Change Scoping Plan update during the Summer of 2015, with adoption scheduled for 2016.
(c) California Assembly Bill 32 (AB 32, Nunez) (Chapter 488, Statutes of 2006)
In 2006, the California State Legislature adopted the California Global Warming Solutions Act of 2006 (AB 32), focusing on reducing GHG emissions in California to 1990 levels by 2020. As required by AB 32, CARB approved the 1990 GHG emissions inventory, thereby establishing the emissions limit for 2020. The 2020 emissions limit was set at 427 million metric tons of CO2 equivalent (MMTCO2e).9 In 2014, CARB revised the 2020 emissions limit using the Global Warming Potential (GWP) values from the Intergovernmental Panel on Climate Change (IPCC) Fourth Assessment Report (AR4).10 The revised 2020 emissions limit is 431 MMTCO2e.11 CARB also projected the state’s 2020 GHG emissions under “business as usual” (BAU) conditions—that is, emissions that would occur without any plans, policies, or regulations to reduce GHG emissions. CARB originally used an average of the state’s GHG emissions from 2002 through 2004 and projected the 2020 levels at approximately 596 MMTCO2e. Therefore, under this original projection, the state must reduce its 2020 BAU emissions by 28.4 percent in order to meet the 1990 target. CARB updated their 2020 BAU emissions estimate to account for the effect of the 2007–2009 economic recession, new estimates for future fuel and energy demand, and the reductions required by regulations that were recently adopted for motor vehicles and renewable energy. In 2014, CARB also revised the 2020 BAU emissions
7 California Environmental Protection Agency, California Climate Action Team Report to the Governor and the Legislature, (2006). 8 California Environmental Protection Agency, California Climate Action Team Report to the Governor and the Legislature, (2010). 9 California Air Resources Board, Staff Report – California 1990 Greenhouse Gas Emissions Level and 2020 Emissions Limit, (2007). 10 GWPs and associated CO2e values were developed by the Intergovernmental Panel on Climate Change (IPCC), and published in its
Second Assessment Report (SAR) in, 1996. Historically, GHG emission inventories have been calculated using the GWPs from the IPCC’s SAR. The IPCC updated the GWP values based on the latest science in its Fourth Assessment Report (AR4). The California Air Resources Board (CARB) has begun reporting GHG emission inventories for California using the GWP values from the IPCC AR4.
11 California Air Resources Board, 2020 Business-as-Usual (BAU) Emissions Projection 2014 Edition, http://www.arb.ca.gov/cc/inventory/data/bau.htm. Accessed November 2015.

July 2016 2.0 Regulatory Setting and Significance Thresholds
1020 S. Figueroa Street Project Greenhouse Gas Technical Report ESA PCR 11
using the GWP values from the IPCC AR4. CARB’s revised 2020 BAU emissions estimate is 509.4 MMTCO2e.12 Therefore, the emission reductions necessary to achieve the 2020 emissions target of 431 MMTCO2e would be 78.4 MMTCO2e, or a reduction of GHG emissions by 15.4 percent. A summary of the GHG emissions reductions required under AB 32 is provided in Table 2, Estimated Greenhouse Gas Emissions Reductions Required by AB 32.
AB 32 does not establish GHG emissions reduction targets for individual sectors of emissions. The Bay Area Air Quality Management District (BAAQMD) is the only air district in California that has undertaken an analysis of land-use driven sector GHG emissions reductions attributable to CARB’s Climate Change Scoping Plan regulations. The BAAQMD estimated that a 26.2 percent reduction from statewide land use-driven GHG emissions would be necessary to meet the AB 32 goal of 1990 emissions by 2020. The BAAQMD estimated that a 23.9 percent reduction in land use-driven GHG emissions is expected to be achieved through successful implementation of the original Scoping Plan regulations. This resulted in a gap of 2.3 percent in necessary additional GHG emissions reductions to meet AB 32.
AB 32 defines GHGs as CO2, CH4, N2O, HFCs, PFCs, and SF6 and represents the first enforceable statewide program to limit emissions of these GHGs from all major industries with penalties for noncompliance. The law further required that reduction measures be technologically feasible and cost effective. Under AB 32, CARB has the primary responsibility for reducing GHG emissions. CARB is required to adopt rules and
12 California Air Resources Board, 2020 BAU Emissions by Scoping Plan Categories,
http://www.arb.ca.gov/cc/inventory/data/tables/2020_bau_forecast_by_scoping_category_2014-05-22.pdf. Accessed November 2015.
Table 2
Estimated Greenhouse Gas Emissions Reductions Required by AB 32
Emissions Category GHG Emissions (MMTCO2e) 2008 Scoping Plan (IPCC SAR) 2020 BAU Forecast (CARB 2008 Scoping Plan Estimate) 596 2020 Emissions Target Set by AB 32 (i.e., 1990 level) 427 Reduction below Business-As-Usual necessary to achieve 1990 levels by 2020 169 (28.4%)a 2011 Scoping Plan (IPCC AR4) 2020 BAU Forecast (CARB 2011 Scoping Plan Estimate) 509.4 2020 Emissions Target Set by AB 32 (i.e., 1990 level) 431 Reduction below Business-As-Usual necessary to achieve 1990 levels by 2020 78.4 (15.4%)b
MMTCO2e = million metric tons of carbon dioxide equivalents a 596 – 427 = 169 / 596 = 28.4% b 509.4 – 431 = 78.4 / 509.4 = 15.4% Source: California Air Resources Board, Final Supplement to the AB 32 Scoping Plan Functional Equivalent Document (FED),
Attachment D, August 19, 2011; California Air Resources Board, 2020 Business-as-Usual (BAU) Emissions Projection, 2014 Edition, http://www.arb.ca.gov/cc/inventory/data/bau.htm. Accessed November 2015.

2.0 Regulatory Setting and Significance Thresholds July 2016
1020 S. Figueroa Street Project Greenhouse Gas Technical Report ESA PCR 12
regulations directing state actions that would achieve GHG emissions reductions equivalent to 1990 statewide levels by 2020. On or before June 30, 2007, CARB was required to publish a list of discrete early action GHG emission reduction measures that would be implemented to be made enforceable by 2010. In 2007, CARB published its Final Report for Proposed Early Actions to Mitigate Climate Change in California.13 This report described recommendations for discrete early action measures to reduce GHG emissions as part of California’s AB 32 GHG reduction strategy. Resulting from this are three new regulations proposed to meet the definition of “discrete early action greenhouse gas reduction measures,” including the following: a low carbon fuel standard; reduction of HFC 134a emissions from non-professional servicing of motor vehicle air conditioning systems; and improved landfill methane capture. CARB estimates that by 2020, the reductions from those three measures would range from 13 to 26 MMTCO2e. Six additional early-action regulations were on October 25, 2007 that targeted: motor vehicles; auxiliary engines from docked ships; PFCs from the semiconductor industry; propellants in consumer products; automotive maintenance; and SF6 from non-electricity sectors.
(d) Senate Bill 97
SB 97, enacted in 2007, amended the CEQA to clearly establish that GHG emissions and the effects of GHG emissions are appropriate subjects for CEQA analysis. It directed the California Office of Planning and Research (OPR) to develop revisions to the State CEQA Guidelines “for the mitigation of GHG emissions or the effects of GHG emissions” and directed the Resources Agency to certify and adopt these revised State CEQA Guidelines by January 2010. The revisions were completed March 2010 and codified into the California Code of Regulations and became effective within 120 days pursuant to CEQA. The amendments provide regulatory guidance for the analysis and mitigation of the potential effects of GHG emissions. The CEQA Guidelines require:
Inclusion of GHG analyses in CEQA documents;
Determination of significance of GHG emissions; and,
If significant GHG emissions would occur, adoption of mitigation to address significant emissions.
2.1.2.2 Energy-Related Sources
(a) Renewables Portfolio Standard
Senate Bill 1078 (SB 1078) (Chapter 516, Statutes of 2002) requires retail sellers of electricity, including investor-owned utilities and community choice aggregators, to provide at least 20 percent of their supply from renewable sources by 2017. SB 107 (Chapter 464, Statutes of 2006) changed the target date to 2010. In November 2008, Governor Schwarzenegger signed Executive Order S-14-08, which expands the state's Renewables Portfolios Standard to 33 percent renewable power by 2020. Pursuant to Executive Order S-21-09, CARB was also preparing regulations to supplement the RPS with a Renewable Energy Standard that will result in a total renewable energy requirement for utilities of 33 percent by 2020. But on April 12, 2011, Governor Jerry Brown signed SB X1-2 to increase California’s RPS to 33 percent by 2020. Notably, unlike the prior 20 percent RPS, the current 33 percent RPS applies to Publicly Owned Utilities, such as Los Angeles Department of Water and Power, which is the utility provider for the City of Los Angeles. SB 350 (Chapter 547, Statues of 2015) further increased the Renewables Portfolio Standard to 50 percent by 2030.
13 California Air Resources Board, Proposed Early Actions to Mitigation Climate Change in California, (2007).
July 2016 2.0 Regulatory Setting and Significance Thresholds
1020 S. Figueroa Street Project Greenhouse Gas Technical Report ESA PCR 13
The legislation also included interim targets of 40 percent by 2024 and 45 percent by 2027. SB 350 was signed into law on October 7, 2015.
(b) California Senate Bill 1368
California SB 1368, a companion bill to AB 32, requires the California Public Utilities Commission (CPUC) and the California Energy Commission (CEC) to establish GHG emission performance standards for the generation of electricity. These standards will also generally apply to power that is generated outside of California and imported into the State. SB 1368 provides a mechanism for reducing the emissions of electricity providers, thereby assisting CARB to meet its mandate under AB 32. On January 25, 2007, the CPUC adopted an interim GHG Emissions Performance Standard, which is a facility-based emissions standard requiring that all new long-term commitments for baseload generation to serve California consumers be with power plants that have GHG emissions no greater than a combined cycle gas turbine plant. That level is established at 1,100 pounds of CO2 per megawatt-hour. Further, on May 23, 2007, the CEC adopted regulations that establish and implement an identical Emissions Performance Standard of 1,100 pounds of CO2 per megawatt-hour (see CEC Order No. 07-523-7).
2.1.2.3 Mobile Sources
(a) California Assembly Bill 1493, Greenhouse Gas Emission Standards for Automobiles (Pavley)
In response to the transportation sector accounting for more than half of California’s CO2 emissions, AB 1493 (Chapter 200, Statutes of 2002), enacted on July 22, 2002, required CARB to set GHG emission standards for passenger vehicles, light duty trucks, and other vehicles whose primary use is non-commercial personal transportation manufactured in and after 2009. In setting these standards, CARB must consider cost effectiveness, technological feasibility, economic impacts, and provide maximum flexibility to manufacturers. The State of California in 2004 submitted a request for a waiver from federal clean air regulations, which ordinarily preempts state regulation of motor vehicle emission standards, to allow the state to require reduced tailpipe emissions of CO2. In late 2007, the USEPA denied California’s waiver request. In early 2008, the state brought suit against USEPA related to this denial. In January 2009, the President directed the USEPA to assess whether its denial of the waiver was appropriate under the federal CAA. In June 2009, the USEPA granted California the waiver.
However, as discussed previously, the USEPA and USDOT have adopted federal standards for model year 2012 through 2016 light-duty vehicles. In light of the USEPA and USDOT standards, California—and states adopting California emissions standards—have agreed to defer to the proposed national standard through model year 2016. The 2016 endpoint of the federal and state standards is similar, although the federal standard ramps up slightly more slowly than required under the state standard. The state standards (called the Pavley standards) require additional reductions in CO2 emissions beyond model year 2016 (referred to as Pavley Phase II standards). As noted above, the USEPA and USDOT have adopted GHG emission standards for model year 2017 through 2025 vehicles. These standards are slightly different from the Pavley Phase II standards, but the State of California has agreed not to contest these standards, in part due to the fact that while the national standard would achieve slightly less reductions in California, it would achieve greater reductions nationally and is stringent enough to meet state GHG emission reduction goals.14 On November 14 California Air Resources Board, “Advanced Clean Cars Summary,” http://www.arb.ca.gov/msprog/clean_cars/acc%20summary-
final.pdf. Accessed June 2013.
2.0 Regulatory Setting and Significance Thresholds July 2016
1020 S. Figueroa Street Project Greenhouse Gas Technical Report ESA PCR 14
15, 2012, CARB approved an amendment that allows manufacturers to comply with the 2017-2025 national standards to meet state law.
(b) Executive Order S-01-07
Executive Order S-01-07 was enacted by the Governor on January 18, 2007. The order mandates the following: (1) that a statewide goal be established to reduce the carbon intensity of California’s transportation fuels by at least ten (10) percent by 2020; and (2) that a Low Carbon Fuel Standard (LCFS) for transportation fuels be established in California.
(c) Senate Bill 375
Senate Bill 375 (SB 375) (Chapter 728, Statutes of 2008), which establishes mechanisms for the development of regional targets for reducing passenger vehicle greenhouse gas emissions, was adopted by the state on September 30, 2008. Under SB 375, CARB is required, in consultation with the Metropolitan Planning Organization , to set regional GHG reduction targets for the passenger vehicle and light-duty truck sector for 2020 and 2035. On September 23, 2010, CARB adopted the vehicular GHG emissions reduction targets for the Southern California Association of Governments (SCAG), which is the Metropolitan Planning Organization for the region in which the City of Los Angeles is located. The target is a per capita reduction of 8 percent for 2020 and 13 percent for 2035 compared to the 2005 baseline. Of note, the proposed reduction targets explicitly exclude emission reductions expected from the AB 1493 and the low carbon fuel standard regulations.
Under SB 375, the target must be incorporated within that region’s Regional Transportation Plan (RTP), which is used for long-term transportation planning, in a Sustainable Communities Strategy (SCS). Certain transportation planning and programming activities would then need to be consistent with the SCS; however, SB 375 expressly provides that the SCS does not regulate the use of land, and further provides that local land use plans and policies (e.g., general plan) are not required to be consistent with either the RTP or SCS. On April 7, 2016, SCAG adopted the 2016-2040 Regional Transportation Plan/Sustainable Communities Strategy (RTP/SCS), which is an update to the previous 2012-2035 RTP/SCS. Using growth forecasts and economic trends, the RTP/SCS provides a vision for transportation throughout the region for the next 25 years. It considers the role of transportation in the broader context of economic, environmental, and quality-of-life goals for the future, identifying regional transportation strategies to address mobility needs. The RTP/SCS successfully achieves and exceeds the GHG emission-reduction targets set by CARB by demonstrating an 8 percent reduction by 2020 and 18 percent reduction by 2035 compared to the 2005 level on a per capita basis.
SCAG’s RTP/SCS provides specific strategies for successful implementation. These strategies include supporting projects that encourage a diverse job opportunities for a variety of skills and education, recreation and culture and a full-range of shopping, entertainment and services all within a relatively short distance; encouraging employment development around current and planned transit stations and neighborhood commercial centers; encouraging the implementation of a “Complete Streets” policy that meets the needs of all users of the streets, roads and highways including bicyclists, children, persons with disabilities, motorists, electric vehicles, movers of commercial goods, pedestrians, users of public transportation, and seniors; and supporting alternative fueled vehicles. In addition, the 2016 RTP/SCS includes new strategies to promote active transportation. It promotes short trips proposing to develop strategic framework to support local planning and projects that serve short trips, expand understanding and

July 2016 2.0 Regulatory Setting and Significance Thresholds
1020 S. Figueroa Street Project Greenhouse Gas Technical Report ESA PCR 15
consideration of public health in the development of local plans and projects, through improvements in sidewalk quality, local bike networks, and neighborhood mobility areas. It also proposes increasing access to the California Coast Trail, light rail and, bus stations and promoting corridors that support biking and walking, such as through a regional greenway network and local bike networks. The 2016 RTP/SCS proposes to better align active transportation investments with land use and transportation strategies, increase competitiveness of local agencies for federal and state funding, and to expand the potential for all people to use active transportation.
(d) California Air Resources Board Anti-Idling Measure
In 2004, CARB adopted a control measure to limit commercial heavy duty diesel motor vehicle idling in order to reduce public exposure to diesel particulate matter (DPM) and other air contaminants.15 The measure applies to diesel-fueled commercial vehicles with gross vehicle weight ratings greater than 10,000 pounds that are licensed to operate on highways, regardless of where they are registered. In general, it prohibits idling for more than 5 minutes at any location. While this measure is aimed primarily aimed at reducing air pollution, it has a co-benefit of limiting GHG emissions from unnecessary idling.
2.1.2.4 Building Standards
(a) Title 24, Building Standards Code and CALGreen Code
The California Energy Commission (CEC) first adopted Energy Efficiency Standards for Residential and Nonresidential Buildings (California Code of Regulations, Title 24, Part 6) in 1978 in response to a legislative mandate to reduce energy consumption in the state. Although not originally intended to reduce GHG emissions, increased energy efficiency, and reduced consumption of electricity, natural gas, and other fuels would result in fewer GHG emissions from residential and nonresidential buildings subject to the standard. The standards are updated periodically to allow for the consideration and inclusion of new energy efficiency technologies and methods.
Part 11 of the Title 24 Building Energy Efficiency Standards is referred to as the California Green Building Standards (CALGreen) Code. The purpose of the CALGreen Code is to “improve public health, safety and general welfare by enhancing the design and construction of buildings through the use of building concepts having a positive environmental impact and encouraging sustainable construction practices in the following categories: (1) Planning and design; (2) Energy efficiency; (3) Water efficiency and conservation; (4) Material conservation and resource efficiency; and (5) Environmental air quality.”16 The CALGreen Code is not intended to substitute for or be identified as meeting the certification requirements of any green building program that is not established and adopted by the California Building Standards Commission. When the CALGreen Code went into effect in 2009, compliance through 2010 was voluntary. As of January 1, 2011, the CALGreen Code is mandatory for all new buildings constructed in the state. The CALGreen Code establishes mandatory measures for new residential and non-residential buildings. Such mandatory measures include energy efficiency, water conservation, material conservation, planning and design and overall environmental quality.17 The CALGreen Code was most recently updated in 2013 to include new mandatory measures for 15 Calif. Code of Regulations, Title 13, Sec. 2485. See CARB, ATCM to Limit Diesel-Fueled Commercial Motor Vehicle Idling,
http://www.arb.ca.gov/regact/idling/idling.htm. Accessed August 2013. 16 California Building Standards Commission, 2010 California Green Building Standards Code, (2010). 17 California Building Standards Commission, 2010 California Green Building Standards Code, (2010).

2.0 Regulatory Setting and Significance Thresholds July 2016
1020 S. Figueroa Street Project Greenhouse Gas Technical Report ESA PCR 16
residential as well as nonresidential uses; the new measures took effect on January 1, 2014 with supplemental changes on July 1, 2015.18
2.1.2.5 Cap-and-Trade Program
The Climate Change Scoping Plan identifies a Cap-and-Trade Program as one of the strategies California will employ to reduce GHG emissions. CARB asserts that this program would help put California on the path to meet its goal of reducing GHG emissions to 1990 levels by the year 2020, and ultimately achieving an 80 percent reduction from 1990 levels by 2050. Under Cap-and-Trade, an overall limit on GHG emissions from capped sectors is established and facilities subject to the cap would be able to trade permits to emit GHGs.
CARB designed and adopted a California Cap-and-Trade Program19 pursuant to its authority under AB 32. The development of this Program included a multi-year stakeholder process and consideration of potential impacts on disproportionately impacted communities. The Cap-and-Trade Program is designed to reduce GHG emissions from major sources (deemed “covered entities”) by setting a firm cap on statewide GHG emissions and employing market mechanisms to achieve AB 32’s emission-reduction mandate of returning to 1990 levels of emissions by 2020. The statewide cap for GHG emissions from the capped sectors20 (e.g., electricity generation, petroleum refining, and cement production) commenced in 2013 and would decline over time, achieving GHG emission reductions throughout the Program’s duration.
Under the Cap-and-Trade Program, CARB issues allowances equal to the total amount of allowable emissions over a given compliance period and distributes these to regulated entities. Covered entities that emit more than 25,000 MTCO2e per year must comply with the Cap-and-Trade Program.21 Triggering of the 25,000 MTCO2e per year “inclusion threshold” is measured against a subset of emissions reported and verified under the California Regulation for the Mandatory Reporting of Greenhouse Gas Emissions (Mandatory Reporting Rule or “MRR”).22
Each covered entity with a compliance obligation is required to surrender “compliance instruments”23 for each MTCO2e of GHG they emit. Covered entities are allocated free allowances in whole or part (if eligible), buy allowances at auction, purchase allowances from others, or purchase offset credits. A “compliance period” is the time frame during which the compliance obligation is calculated. The years 2013 and 2014 are the first compliance period, the years 2015–2017 are the second compliance period, and the third compliance period is from 2018–2020. At the end of each compliance period, each facility will be required to surrender compliance instruments to CARB equivalent to their total GHG emissions throughout the compliance period. There also are requirements to surrender compliance instruments covering 30 percent of the prior year’s compliance obligation by November of each year. For example, in November 2014, a
18 California Building Standards Commission, CALGreen (Part 11 of Title 24), http://www.bsc.ca.gov/Home/CALGreen.aspx. Accessed
November 2015. 19 17 CCR §§ 95800 to 96023.
20 See generally 17 CCR §§ 95811, 95812.
21 17 CCR § 95812.
22 17 CCR §§ 95100-95158.
23 Compliance instruments are permits to emit, the majority of which will be “allowances,” but entities also are allowed to use CARB-approved offset credits to meet up to 8% of their compliance obligations.

July 2016 2.0 Regulatory Setting and Significance Thresholds
1020 S. Figueroa Street Project Greenhouse Gas Technical Report ESA PCR 17
covered entity was required to submit compliance instruments to cover 30 percent of its 2013 GHG emissions.
The Cap-and-Trade Regulation provides a firm cap, ensuring that the 2020 statewide emission limit will not be exceeded. An inherent feature of the Cap-and-Trade Program is that it does not guarantee GHG emissions reductions in any discrete location or by any particular source. Rather, GHG emissions reductions are only guaranteed on an accumulative basis. As summarized by CARB in its First Update to the Climate Change Scoping Plan:
The Cap-and-Trade Regulation gives companies the flexibility to trade allowances with others or take steps to cost-effectively reduce emissions at their own facilities. Companies that emit more have to turn in more allowances or other compliance instruments. Companies that can cut their GHG emissions have to turn in fewer allowances. But as the cap declines, aggregate emissions must be reduced.24
In other words, a covered entity theoretically could increase its GHG emissions every year and still comply with the Cap-and-Trade Program. However, as climate change is a global phenomenon and the effects of GHG emissions are considered cumulative in nature, a focus on aggregate GHG emissions reductions is warranted.
Further, the reductions in GHG emissions that would be achieved by the Cap-and-Trade Program inherently are variable and, therefore, impossible to quantify with precision:
The Cap-and-Trade Regulation is different from most of the other measures in the Scoping Plan. The [R]egulation sets a hard cap, instead of an emission limit, so the emission reductions from the program vary as our estimates of “business as usual” emissions in the future are updated. In addition, the Cap-and-Trade Program works in concert with many of the direct regulatory measures—providing an additional economic incentive to reduce emissions. Actions taken to comply with direct regulations reduce an entity’s compliance obligation under the Cap-and-Trade Regulation. So, for example, increased deployment of renewable electricity sources reduces a utility’s compliance obligation under the Cap-and-Trade Regulation.25
If California’s direct regulatory measures reduce GHG emissions more than expected, then the Cap-and-Trade Program will be responsible for relatively fewer emissions reductions. If California’s direct regulatory measures reduce GHG emissions less than expected, then the Cap-and-Trade Program will be responsible for relatively more emissions reductions. In other words, the Cap-and-Trade Program functions similarly to an insurance policy for meeting California 2020’s GHG emissions reduction mandate:
The Cap-and-Trade Program establishes an overall limit on GHG emissions from most of the California economy—the “capped sectors.” Within the capped sectors, some of the reductions are being accomplished through direct regulations, such as improved building and appliance efficiency standards, the [Low Carbon Fuel Standard] LCFS, and the 33 percent [Renewables
24 CARB, First Update to the Climate Change Scoping Plan: Building on the Framework, at 86 (May 2014) (emphasis added). 25 Ibid.
2.0 Regulatory Setting and Significance Thresholds July 2016
1020 S. Figueroa Street Project Greenhouse Gas Technical Report ESA PCR 18
Portfolio Standard] RPS. Whatever additional reductions are needed to bring emissions within the cap is accomplished through price incentives posed by emissions allowance prices. Together, direct regulation and price incentives assure that emissions are brought down cost-effectively to the level of the overall cap.26
[T]he Cap-and-Trade Regulation provides assurance that California’s 2020 limit will be met because the regulation sets a firm limit on 85 percent of California’s GHG emissions.27
In sum, the Cap-and-Trade Program will achieve aggregate, rather than site-specific or project-level, GHG emissions reductions. Also, due to the regulatory architecture adopted by CARB under AB 32, the reductions attributed to the Cap-and-Trade Program can change over time, depending on the State’s emissions forecasts and the effectiveness of direct regulatory measures.
The Cap-and-Trade Program covers the GHG emissions associated with electricity consumed in California, whether generated in-state or imported.28 Accordingly, GHG emissions associated with CEQA projects’ electricity usage are covered by the Cap-and-Trade Program.
The Cap-and-Trade Program also covers fuel suppliers (natural gas and propane fuel providers and transportation fuel providers) to address emissions from such fuels and from combustion of other fossil fuels not directly covered at large sources in the Program’s first compliance period.29 While the Cap-and-Trade Program technically covered fuel suppliers as early as 2012, they did not have a compliance obligation (i.e., they were not fully regulated) until 2015:
Suppliers of natural gas, suppliers of RBOB [Reformulated Gasoline Blendstock for Oxygenate Blending] and distillate fuel oils, suppliers of liquefied petroleum gas, and suppliers of liquefied natural gas specified in sections 95811(c), (d), (e), (f), and (g) that meet or exceed the annual threshold in section 95812(d) will have a compliance obligation beginning with the second compliance period.30
As of January 1, 2015, the Cap-and-Trade Program covered approximately 85 percent of California’s GHG emissions.
The Cap-and-Trade Program covers the GHG emissions associated with the combustion of transportation fuels in California, whether refined in-state or imported. The point of regulation for transportation fuels is when they are “supplied” (i.e., delivered into commerce). However, transportation fuels that are “supplied” in California, but can be demonstrated to have a final destination outside California, do not generate a compliance obligation. The underlying concept here is that CARB is seeking to capture tailpipe GHG emissions from the combustion of transportation fuels supplied to California end-users. Accordingly, as with
26 CARB, First Update to the Climate Change Scoping Plan: Building on the Framework, at 88 (May 2014) 27 Id. at 86-87. 28 17 CCR § 95811(b). 29 17 CCR §§ 95811, 95812(d). 30 Id. at § 95851(b)(emphasis added).

July 2016 2.0 Regulatory Setting and Significance Thresholds
1020 S. Figueroa Street Project Greenhouse Gas Technical Report ESA PCR 19
stationary source GHG emissions and GHG emissions attributable to electricity use, virtually all, if not all, of GHG emissions from CEQA projects associated with vehicle combustion of transportation fuels are covered by the Cap-and-Trade Program.
2.1.3 Regional The Project is located in the South Coast Air Basin (Air Basin), which consists of Orange County, Los Angeles County (excluding the Antelope Valley portion), and the western, non-desert portions of San Bernardino and Riverside Counties, in addition to the San Gorgonio Pass area in Riverside County. The South Coast Air Quality Management District (SCAQMD) is responsible for air quality planning in the Air Basin and developing rules and regulations to bring the area into attainment of the ambient air quality standards. This is accomplished though air quality monitoring, evaluation, education, implementation of control measures to reduce emissions from stationary sources, permitting and inspection of pollution sources, enforcement of air quality regulations, and by supporting and implementing measures to reduce emissions from motor vehicles.
The SCAQMD adopted a “Policy on Global Warming and Stratospheric Ozone Depletion” on April 6, 1990. The policy commits the SCAQMD to consider global impacts in rulemaking and in drafting revisions to the Air Quality Management Plan. In March 1992, the SCAQMD Governing Board reaffirmed this policy and adopted amendments to the policy to include the following directives:
Phase out the use and corresponding emissions of chlorofluorocarbons, methyl chloroform (1,1,1-trichloroethane or TCA), carbon tetrachloride, and halons by December 1995;
Phase out the large quantity use and corresponding emissions of hydrochlorofluorocarbons by the year 2000;
Develop recycling regulations for hydrochlorofluorocarbons (e.g., SCAQMD Rules 1411 and 1415);
Develop an emissions inventory and control strategy for methyl bromide; and
Support the adoption of a California GHG emission reduction goal.
In 2008, SCAQMD released draft guidance regarding interim CEQA GHG significance thresholds.31 Within its October 2008 document, the SCAQMD proposed the use of a percent emission reduction target to determine significance for commercial/residential projects that emit greater than 3,000 metric tons per year. On December 5, 2008, the SCAQMD Governing Board adopted the staff proposal for an interim GHG significance threshold for stationary source/industrial projects where the SCAQMD is lead agency. However, the SCAQMD has yet to adopt a GHG significance threshold for land use development projects (e.g., residential/commercial projects) and has formed a GHG Significance Threshold Working Group to further evaluate potential GHG significance thresholds.32 The aforementioned Working Group was inactive from 2011 through 2016 and the SCAQMD has not formally adopted any GHG significance threshold for land use development projects.
31 California Air Resources Board, Board Meeting, Date: December 5, 2008, Agenda No. 31,
http://www3.aqmd.gov/hb/2008/December/0812ag.html. Accessed January 2016. 32 California Air Resources Board, Greenhouse Gases CEQA Significance Thresholds,
http://www.aqmd.gov/home/regulations/ceqa/air-quality-analysis-handbook/ghg-significance-thresholds. Accessed January 2016.

2.0 Regulatory Setting and Significance Thresholds July 2016
1020 S. Figueroa Street Project Greenhouse Gas Technical Report ESA PCR 20
2.1.4 Local
2.1.4.1 City Of Los Angeles Green LA Plan
In acknowledgment of the overlap between land use and GHG emissions, the City of Los Angeles, in May 2007, published Green LA, An Action Plan to Lead the Nation in Fighting Global Warming33 (LA Green Plan), outlining the goals and actions the City has established to reduce the generation and emission of GHGs from both public and private activities. According to the LA Green Plan, the City of Los Angeles is committed to the goal of reducing emissions of CO2 to 35 percent below 1990 levels by 2030. To achieve this, the City will:
Increase the generation of renewable energy; Improve energy conservation and efficiency; and Change transportation and land use patterns to reduce dependence on automobiles.
In 2008, the City released an implementation program for the LA Green Plan referred to as ClimateLA, which provides detailed information about each action item discussed in the LA Green Plan framework. Action items range from harnessing wind power for electricity production and energy efficiency retrofits in City buildings, to converting the City’s fleet vehicles to cleaner and more efficient models, and reducing water consumption. Information about proposed and/or ongoing programs, opportunities for achieving the City’s goals, specific challenges, and a list of milestones is provided for each action item. The scope of these actions range from those impacting only municipal facilities, such as retrofitting City Hall with high efficiency lighting systems, to those facilitating changes in the private sector, such as rebates for the purchase of energy-efficient appliances. ClimateLA is a living document, reflecting a process of ongoing learning and continuous improvement as technology advances and City departments develop expertise in the methods of lowering GHG emissions.
To achieve goals outlined in the LA Green Plan, in April 2008, the City of Los Angeles adopted the Green Building Program Ordinance to address the impact on climate change from new development. In 2011, the Green Building Program Ordinance was amended for consistency with the CalGreen Building Code. As of January 1, 2011, all new buildings (residential and non-residential) would be subject to the Los Angeles Green Building Code (LAGBC). The LAGBC is based on the 2013 CalGreen Standards to increase energy efficiency, and reduce waste.34
2.1.4.2 City Of Los Angeles pLAn
The Sustainable City pLAn is a comprehensive and actionable directive from the Mayor to improve the environmental, economic, and equitable conditions in the City of Los Angeles. The pLAn is a tool that the Mayor will use to manage the City and establish visions, goals, and metrics for City Departments. The pLAn establishes the following visions for City Departments for the following categories:
Environment: Local Water (lead the nation in water conservation and source the majority of water locally); Local Solar (increase Los Angeles’ clean and resilient energy supplies by capturing energy from abundant sunshine); Energy Efficient Buildings (save money and energy by increasing the
33 See: http://environmentla.org/pdf/GreenLA_CAP_2007.pdf. 34 Los Angeles Green Building Code Ordinance, Amended 2014.
July 2016 2.0 Regulatory Setting and Significance Thresholds
1020 S. Figueroa Street Project Greenhouse Gas Technical Report ESA PCR 21
efficiency of buildings); Carbon and Climate Leadership (as a proactive leader on climate issues, strengthen Los Angeles’ economy by dramatically reducing GHG emissions and rallying other cities to follow Los Angeles’ lead); and Waste and Landfills (become the first big city in the United States to achieve zero-waste, and recycle and reuse most of its waste locally).
Economy: Housing and Development (address Los Angeles’ housing shortage, ensure that most new units are accessible to high-quality transit, and close the gap between income and rents); Mobility and Transit (invest in rail, bus lines, pedestrian/bike safety, and complete neighborhoods that provide more mobility options and reduce vehicle miles traveled); Prosperity and Green Jobs (strengthen and grow the economy including through increased jobs and investments in clean technology sectors); and Preparedness and Resiliency (prepare for natural disasters and decrease vulnerability to climate change).
Equity: Air Quality (healthy air to breathe); Environmental Justice (ensure the benefits of the pLAn extend to all Angelenos); Urban Ecosystem (have access to parks, open space, including a revitalized Los Angeles River Watershed); and Livable Neighborhoods (live in safe, vibrant, well-connected, and healthy neighborhoods).
2.1.4.3 City Of Los Angeles Health Altas
The City of Los Angeles has conducted a comprehensive health study that describes the baseline health conditions in the City and provides a context for understanding the demographic conditions, social and economic factors, physical environment, access to health care, and health behaviors contributing to the health of City residents and workers. The findings are documented in the Health Atlas for the City of Los Angeles (Health Atlas), published in June 2013. The Health Atlas is not a plan specifically developed to reduce GHG emissions. Nonetheless, while the primary focus of the Health Atlas is on factors that affect the health behaviors and health status of residents and workers, much of the data is relevant to land use GHG emissions as those emissions reflect similar issues regarding land use patterns, urban design, and transportation systems. Data in the Health Atlas is summarized by Community Plan Area. There are 35 Community Plans that guide the physical development of neighborhoods in the City by establishing the goals and policies for land use and provide specific, neighborhood-level detail, relevant policies, and implementation strategies necessary to achieve the City’s long-range overarching General Plan objectives.
2.2 SIGNIFICANCE THRESHOLD
2.2.1 CEQA Guidelines, Appendix G Until the passage of AB 32, CEQA documents generally did not evaluate GHG emissions or impacts on global climate change. Rather, the primary focus of air pollutant analysis in CEQA documents was the emission of criteria pollutants, or those identified in the California and federal Clean Air Acts as being of most concern to the public and government agencies (e.g., toxic air contaminants). With the passage of AB 32 and SB 97, CEQA documents now contain a more detailed analysis of GHG emissions. However, the analysis of GHGs is different from the analysis of criteria pollutants. Since the half-life of CO2 is approximately 100 years, GHGs affect the global climate over a relatively long timeframe. Conversely, for criteria pollutants, significance thresholds/impacts are based on daily emissions; and the determination of attainment or non-attainment are based on the daily exceedance of applicable ambient air quality standards (e.g., 1-hour and 8-hour exposures). Also, the scope of criteria pollutant impacts is local and regional, while the scope of GHG impacts is global.

2.0 Regulatory Setting and Significance Thresholds July 2016
1020 S. Figueroa Street Project Greenhouse Gas Technical Report ESA PCR 22
In its January 2008 CEQA and Climate Change white paper, the CAPCOA identified a number of potential approaches for determining the significance of GHG emissions in CEQA documents. In its white paper, CAPCOA suggests making significance determinations “on a case-by-case basis in the context of the project at the time it comes forward” when no significance thresholds have been formally adopted by a lead agency.35
Pursuant to SB 97, OPR’s recommended amendments to the CEQA Guidelines for GHGs were adopted by the Resources Agency on December 30, 2009. Analysis of GHG emissions in a CEQA document presents unique challenges to lead agencies. However, such analysis must be consistent with existing CEQA principles and, therefore, the amendments comprise relatively modest changes to various portions of the existing CEQA Guidelines. The amendments add no additional substantive requirements; rather, the Guidelines merely assist lead agencies in complying with CEQA’s existing requirements. Modifications address those issues where analysis of GHG emissions may differ in some respects from more traditional CEQA analysis. Other modifications clarify existing law that may apply both to an analysis of GHG emissions as well as more traditional CEQA analyses.
The following two questions relating to the effects of GHGs were added to the CEQA Guidelines, Appendix G (Environmental Checklist).
Would the project generate GHG emissions, either directly or indirectly, that may have a significant impact on the environment?
Would the project conflict with any applicable plan, policy or regulation of an agency adopted for the purpose of reducing the emissions of GHGs?
The CEQA Guidelines, Appendix G items are discussed in detail below.
2.2.1.1 Direct or Indirect Project GHG Emissions
Section 15064.4 of the CEQA Guidelines was adopted to assist lead agencies in determining the significance of the impacts of GHGs. Consistent with developing practice, this section urges lead agencies to quantify GHG emissions of projects where possible. In addition to quantification, this section recommends consideration of qualitative factors that may be used in the determination of significance (i.e., extent to which the project may increase or reduce GHG emissions compared to the existing environment; whether the project exceeds an applicable significance threshold; and extent to which the project complies with regulations or requirements adopted to implement a reduction or mitigation of GHGs). The amendments do not establish a threshold of significance. Lead agencies are called on to establish significance thresholds for their respective jurisdictions in which a lead agency may appropriately look to thresholds developed by other public agencies, or suggested by other experts, such as CAPCOA, so long as any threshold chosen is supported by substantial evidence (see Section 15064.7(c)). The CEQA Guidelines amendments also clarify that the effects of GHG emissions are cumulative, and should be analyzed in the context of CEQA’s requirements for cumulative impact analysis (see Section 15130(f)).36
In its January 2008 CEQA and Climate Change white paper, CAPCOA identified a number of potential approaches for determining the significance of GHG emissions in CEQA documents. CAPCOA suggests making 35 California Air Pollution Control Officer’s Association, CEQA and Climate Change, (2008) 23. 36 See generally Section 15130(f); see also Letter from Cynthia Bryant, Director of the Office of Planning and Research to Mike
Chrisman, S

July 2016 2.0 Regulatory Setting and Significance Thresholds
1020 S. Figueroa Street Project Greenhouse Gas Technical Report ESA PCR 23
significance determinations on a case-by-case basis when no significance thresholds have been formally adopted by a lead agency. Although GHG emissions can be quantified, CARB, SCAQMD and the City of Los Angeles, have yet to adopt project-level significance thresholds for GHG emissions that would be applicable to the Project. Assessing the significance of a project’s contribution to cumulative global climate change involves: (1) evaluating the project’s sources of GHG emissions; and (2) considering project consistency with applicable emission reduction strategies and goals, such as those set forth by the lead agency or other regional or state agency. Based on the foregoing, a project that generates GHG emissions, either directly or indirectly, would have a significant impact if the Project:
GHG-1 Results in GHG emissions that are not consistent with the City of Los Angeles goals and actions to reduce the generation and emission of GHGs from both public and private activities pursuant to the applicable portions of the LA Green Plan and Sustainable City pLAn.
2.2.1.2 Consistency with Greenhouse Gas Reduction Plans, Policies, and Actions
Local and regional agencies and the State recommend general policies and measures to minimize and reduce GHG emissions from land use development projects. Thus, if the Project is designed in accordance and not in conflict with applicable policies and measures, it would result in a less than significant impact since it would be consistent with the strategies and actions to reduce GHG emissions. Therefore, a significant impact would occur if the Project:
GHG-2 Conflicts with any applicable plan, policy or regulation of an agency adopted for the purpose of reducing the emissions of GHGs.
2.2.2 Other Greenhouse Gas Reduction Plan Considerations As indicated above, the CEQA Guidelines were amended in response to SB 97. In particular, the CEQA Guidelines were amended to specify that compliance with a GHG emissions reduction program renders a cumulative impact insignificant.
Per CEQA Guidelines Section 15064(h)(3), a project’s incremental contribution to a cumulative impact can be found not cumulatively considerable if the project will comply with an approved plan or mitigation program that provides specific requirements that will avoid or substantially lessen the cumulative problem within the geographic area of the project.37 To qualify, such a plan or program must be specified in law or adopted by the public agency with jurisdiction over the affected resources through a public review process to implement, interpret, or make specific the law enforced or administered by the public agency.38 Examples of such programs include a “water quality control plan, air quality attainment or maintenance plan, integrated waste management plan, habitat conservation plan, natural community conservation plan, [and] plans or regulations for the reduction of greenhouse gas emissions.”39 Put another way, CEQA Guidelines Section 15064(h)(3) allows a lead agency to make a finding of non-significance for GHG emissions if a project complies with the California Cap-and-Trade Program or other regulatory schemes to reduce GHG emissions.
37 14 CCR § 15064(h)(3). 38 Ibid. 39 Ibid. (emphasis added).

1020 S. Figueroa Street Project Greenhouse Gas Technical Report ESA PCR 25
3.0 METHODOLOGY
Global climate change refers to changes in average climatic conditions on Earth as a whole, including changes in temperature, wind patterns, precipitation and storms. Historical records indicate that global climate changes have occurred in the past due to natural phenomena; however, data indicates that the current global conditions differ from past climate changes in rate and magnitude. The current changes in global climate have been attributed to anthropogenic activities by the IPCC.40 The term GHG refers to gases that trap long-wave radiation or heat in the atmosphere, which heats the surface of the Earth. Without human intervention, the Earth maintains an approximate balance between the GHG emissions in the atmosphere and the storage of GHGs in the oceans and terrestrial ecosystems. GHGs are the result of both natural and anthropogenic activities. Forest fires, decomposition, industrial processes, landfills, and consumption of fossil fuels for power generation, transportation, heating, and cooking are the primary sources of GHG emissions.
The Federal Government and State of California recognized that anthropogenic (human-caused) GHG emissions are contributing to changes in the global climate, and that such changes are having and will have adverse effects on the environment, the economy, and public health. While worldwide contributions of GHG emissions are expected to have widespread consequences, it is not possible to link particular changes to the environment of California or elsewhere to GHGs emitted from a particular source or location. In other words, emissions of GHGs have the potential to cause global impacts rather than local impacts. Increased concentrations of GHGs in the Earth’s atmosphere have been linked to global climate change and such conditions as rising surface temperatures, melting icebergs and snowpack, rising sea levels, and the increased frequency and magnitude of severe weather conditions. Existing climate change models also show that climate warming portends a variety of impacts on agriculture, including loss of microclimates that support specific crops, increased pressure from invasive weeds and diseases, and loss of productivity due to changes in water reliability and availability. In addition, rising temperatures and shifts in microclimates associated with global climate change are expected to increase the frequency and intensity of wildfires.
3.1 UNITS OF MEASUREMENT GHGs are those compounds in the Earth’s atmosphere which play a critical role in determining temperature near the Earth’s surface. More specifically, these gases allow high-frequency shortwave solar radiation to enter the Earth’s atmosphere, but retain some of the low frequency infrared energy which is radiated back from the Earth towards space, resulting in a warming of the atmosphere. Not all GHGs possess the same ability to induce climate change; as a result, GHG contributions are commonly quantified in the units of equivalent mass of carbon dioxide (CO2e). Mass emissions are calculated by converting pollutant specific emissions to CO2e emissions by applying the proper GWP value.41 These GWP ratios are available from the IPCC. Historically, GHG emission inventories have been calculated using the GWPs from the IPCC’s Second Assessment Report (SAR). The IPCC updated the GWP values based on the latest science in its AR4. The updated GWPs in the IPCC AR4 have begun to be used in recent GHG emissions inventories. By applying the GWP ratios, project-related CO2e emissions can be tabulated in metric tons per year. Typically, the GWP
40 Intergovernmental Panel on Climate Change, Fourth Assessment Report: The Physical Science Basis, Summary for Policy Makers,
(2007). 41 GWPs and associated CO2e values were developed by the IPCC, and published in its SAR in, 1996. Historically, GHG emission
inventories have been calculated using the GWPs from the IPCC’s SAR. The IPCC updated the GWP values based on the latest science in its AR4. CARB has begun reporting GHG emission inventories for California using the GWP values from the IPCC AR4.

3.0 Methodology July 2016
1020 S. Figueroa Street Project Greenhouse Gas Technical Report ESA PCR 26
ratio corresponding to the warming potential of CO2 over a 100-year period is used as a baseline. The CO2e values are calculated for construction years as well as existing and project build-out conditions in order to generate a net change in GHG emissions for construction and operation. Compounds that are regulated as GHGs are discussed below.
Carbon Dioxide (CO2): CO2 is the most abundant GHG in the atmosphere and is primarily generated from fossil fuel combustion from stationary and mobile sources. CO2 is the reference gas (GWP of 1) for determining the GWPs of other GHGs.
Methane (CH4): CH4 is emitted from biogenic sources (i.e., resulting from the activity of living organisms), incomplete combustion in forest fires, landfills, manure management, and leaks in natural gas pipelines. The GWP of CH4 is 21 in the IPCC SAR and 25 in the IPCC AR4.
Nitrous Oxide (N2O): N2O produced by human-related sources including agricultural soil management, animal manure management, sewage treatment, mobile and stationary combustion of fossil fuel, adipic acid production, and nitric acid production. The GWP of N2O is 310 in the IPCC SAR and 298 in the IPCC AR4.
Hydrofluorocarbons (HFCs): HFCs are fluorinated compounds consisting of hydrogen, carbon, and fluorine. They are typically used as refrigerants in both stationary refrigeration and mobile air conditioning systems. The GWPs of HFCs ranges from 140 for HFC-152a to 11,700 for HFC-23 in the IPCC SAR and 124 for HFC-152a to 14,800 for HFC-23 in the IPCC AR4.
Perfluorocarbons (PFCs): PFCs are fluorinated compounds consisting of carbon and fluorine. They are primarily created as a byproduct of aluminum production and semiconductor manufacturing. The GWPs of PFCs range from 6,500 to 9,200 in the IPCC SAR and 7,390 to 17,700 in the IPCC AR4.
Sulfur Hexafluoride (SF6): SF6 is a fluorinated compound consisting of sulfur and fluoride. It is a colorless, odorless, nontoxic, nonflammable gas. It is most commonly used as an electrical insulator in high voltage equipment that transmits and distributes electricity. SF6 has a GWP of 23,900 in the IPCC SAR and 22,800 in the IPCC AR4.
3.2 GREENHOUSE GAS EMISSIONS For the purposes of this Technical Report, total GHG emissions from the Project were quantified to provide information to decision makers and the public regarding the level of the Project’s annual GHG emissions. As stated above, the mandate of AB 32 demonstrates California’s commitment to reducing GHG emissions and the state’s associated contribution to climate change, without intending to limit population or economic growth within the state.
The CCAR has prepared the General Reporting Protocol for calculating and reporting GHG emissions from a number of general and industry-specific activities.42 No specific protocols are available for land use projects, so the General Reporting Protocol has been adapted to address GHG emissions from the Project. The
42 California Climate Action Registry, General Reporting Protocol Version 3.1, (2009).
July 2016 3.0 Methodology
1020 S. Figueroa Street Project Greenhouse Gas Technical Report ESA PCR 27
information provided in this section is consistent with the General Reporting Protocol minimum reporting requirements. The General Reporting Protocol recommends the separation of GHG emissions into three categories that reflect different aspects of ownership or control over emissions. They include:
Scope 1: Direct, on-site combustion of fossil fuels (e.g., natural gas, propane, gasoline, and diesel).
Scope 2: Indirect, off-site emissions associated with purchased electricity or purchased steam.
Scope 3: Indirect emissions associated with other emissions sources, such as third-party vehicles and embodied energy.43
CARB believes that consideration of so-called indirect emissions provides a more complete picture of the GHG footprint of a facility: “As facilities consider changes that would affect their emissions – addition of a cogeneration unit to boost overall efficiency even as it increases direct emissions, for example – the relative impact on total (direct plus indirect) emissions by the facility should be monitored. Annually reported indirect energy usage also aids the conservation awareness of the facility and provides information” to CARB to be considered for future strategies by the industrial sector.44 For these reasons, CARB has proposed requiring the calculation of direct and indirect GHG emissions as part of the AB 32 reporting requirements. Additionally, the Office of Planning and Research directs lead agencies to “make a good-faith effort, based on available information, to calculate, model, or estimate…GHG emissions from a project, including the emissions associated with vehicular traffic, energy consumption, water usage and construction activities.”45 Therefore, direct and indirect emissions have been calculated for the Project.
For purposes of this analysis, it is considered reasonable and consistent with criteria pollutant calculations to consider those GHG emissions resulting from Project-related incremental (net) increase in the use of on-road mobile vehicles, electricity, and natural gas compared to existing conditions. This includes Project construction activities such as demolition, hauling, and construction worker trips. This analysis also considers indirect GHG emissions from water conveyance, wastewater generation, and solid waste handling. Since potential impacts resulting from GHG emissions are long-term rather than acute, GHG emissions are calculated on an annual basis. In order to report total GHG emissions using the CO2e metric, the GWP ratios corresponding to the warming potential of CO2 over a 100-year period is used in this analysis.
GHG emissions for the Project are estimated using the California Emissions Estimator Model (CalEEMod) (Version 2013.2.2) software, an emissions inventory software program recommended by the SCAQMD. CalEEMod is based on outputs from OFFROAD and EMFAC, which are emissions estimation models developed by CARB and used to calculate emissions from construction activities, including on- and off-road vehicles. Emissions calculations for the Project include credits or reductions for the Project Design Features and GHG reducing measures which are required by regulation, such as reductions in energy and water demand. Since the Project is subject to the City’s Green Building Code, Project Design Features will be incorporated consistent with the minimum United States Green Building Council (USGBC) Leadership in Energy and Environmental Design (LEED) Certified rating.
43 Embodied energy includes energy required for water pumping and treatment for end-uses. 44 California Air Resources Board, Initial Statement of Reasons for Rulemaking, Proposed Regulation for Mandatory Reporting of
Greenhouse Gas Emissions Pursuant to the California Global Warming Solutions Act of 2006 (AB 32), (2007). 45 Office of Planning and Research, Technical Advisory, p. 5.

3.0 Methodology July 2016
1020 S. Figueroa Street Project Greenhouse Gas Technical Report ESA PCR 28
The CAPCOA has provided guidance on mitigating or reducing GHG emissions from land use development projects. In September 2010, CAPCOA released a guidance document titled Quantifying Greenhouse Gas Mitigation Measures which provides GHG reduction values for recommended mitigation measures.46 The CAPCOA guidance document was utilized in this analysis for quantifying reductions from physical and operational Project characteristics and Project Design Features in CalEEMod.
3.2.1 Construction Emissions Construction of the proposed Project has the potential to generate GHG emissions through the use of heavy-duty construction equipment and through vehicle trips generated from construction workers traveling to and from the Project site. GHG emissions during construction were compiled using CalEEMod. The CalEEMod model is capable of evaluating various subphases during the construction process. During the grading phase, the model calculates emissions resulting from soil haul truck trips, equipment exhaust, and worker commute exhaust. The building construction phase is typically subdivided into building equipment, architectural coating, asphalt, and worker commute. Emissions from this phase of construction include equipment exhaust from building construction asphalt paving and coating, and worker commute exhaust.
Construction of the Project is estimated to begin as early as 2017. Construction of the Project would be separated into two consecutive phases. Phase 1 is estimated to take approximately 33 months, starting as early as 2017 with completion by 2020. Subphases of construction would include demolition of the associated parking, site clearing, grading, excavation, subterranean parking and building construction. Phase 2 is estimated to take approximately 31 months, starting as early as 2020 with completion by 2023. Subphases of construction would include demolition of the existing buildings and associated parking, site clearing, grading, excavation, subterranean parking and building construction. The Project would export approximately 99,800 cubic yards of soil during Phase 1 and 102,300 cubic yards of soil during Phase 2. Construction would generate approximately 16,000 square feet of paving demolition debris during Phase 1 and 353,000 square feet of demolition debris (asphalt, interior and exterior building demolition, and general construction debris) during Phase 2. The schedule is representative of a worst-case scenario with construction completed at the earliest possible date. Phases of construction would include demolition of the existing buildings and associated parking, site clearing, grading, excavation, subterranean parking and building construction. Construction may commence on a later date or construction could occur over a longer period of time than that analyzed in this GHG Assessment. If either or both of these happen, construction impacts would be less than those analyzed because a more energy efficient and cleaner burning construction equipment fleet mix is expected in future years.
Construction emissions can vary from day to day, depending on the level of activity, the specific type of operation, and the prevailing weather conditions. The number and types of construction equipment, vendor trips (e.g., transport of building materials), and worker trips were based on relatively conservative assumptions for a project of this type and scale as provided in the CalEEMod model. A complete listing of the construction equipment by phase and construction phase duration assumptions used in this analysis is included within the CalEEMod printout sheets that are provided in Appendix A.
46 California Air Pollution Control Officers Association, Quantifying Greenhouse Gas Mitigation Measures, (2010).

July 2016 3.0 Methodology
1020 S. Figueroa Street Project Greenhouse Gas Technical Report ESA PCR 29
Construction haul and vendor truck emissions during grading, concrete pour and building construction were evaluated using regional heavy-duty truck emission factors from EMFAC2014. Truck trips and default trip length data were used to assess roadway emissions from truck exhaust, as well as typical CARB idling times of local emissions on-site. Detailed calculations are provided in Appendix A.
3.2.1.1 Emissions from Construction Equipment
Construction of the Project would result in one-time GHG emissions of CO2 and smaller amounts of CH4 and N2O from heavy-duty construction equipment. Construction emissions are forecasted by assuming a conservative estimate of construction activities (i.e., assuming all construction occurs at the earliest feasible date) and applying the off-road emissions factors. The emissions are estimated using the CalEEMod tool, which incorporates the CARB OFFROAD and EMFAC models. The output values used in this analysis are adjusted to be Project-specific based on equipment types and the construction schedule. These values are applied to the construction phasing assumptions to generate GHG emissions values for each construction year. Construction GHG emissions are generally calculated in CalEEMod as follows:
Construction Off-Road Equipment:
EmissionsDiesel [MTCO2e] = ( ∑i (EFi × Popi × AvgHPi × Loadi × Activityi) ÷ 106
Where: EFi = Emission factor from OFFROAD [g/bhp-hr] Popi = Population [quantity of same equipment type] AvgHPi = Maximum rated average horsepower [hp] Loadi = Load Factor [dimensionless] Activityi = Hours of operation [hours] 106 = Conversion factor [g/MT] i = Equipment Type
The CalEEMod tool provides options for specifying equipment, horsepower ratings, load factors, and operational hours per day. Construction equipment lists for each phase of activity were provided by the applicant and/or applicant’s construction contractor(s) and architect(s).
The SCAQMD guidance, Draft Guidance Document – Interim CEQA Greenhouse Gas (GHG) Significance Threshold, recognizes that construction-related GHG emissions from projects “occur over a relatively short-term period of time” and that “they contribute a relatively small portion of the overall lifetime project GHG emissions.”47 The guidance recommends that construction project GHG emissions should be “amortized over a 30-year project lifetime, so that GHG reduction measures will address construction GHG emissions as part of the operational GHG reduction strategies.”48 In accordance with SCAQMD guidance, GHG emissions from construction have been amortized over the 30-year lifetime of the Project (i.e., total construction GHG emissions were divided by 30 to determine an annual construction emissions estimate comparable to operational emissions).
47 South Coast Air Quality Management District, Draft Guidance Document – Interim CEQA Greenhouse Gas (GHG) Significance
Threshold, (2008) 3-8. 48 South Coast Air Quality Management District, Draft Guidance Document – Interim CEQA Greenhouse Gas (GHG) Significance
Threshold, (2008) 3-8.

3.0 Methodology July 2016
1020 S. Figueroa Street Project Greenhouse Gas Technical Report ESA PCR 30
3.2.1.2 Greenhouse Gas Emissions from On-Road Trips
Construction of the Project would also contribute to regional GHG emissions from haul trucks and worker vehicles. The emissions are estimated using the CalEEMod tool, which incorporates the CARB OFFROAD and EMFAC models for on-road emission factors. Running GHG emissions were divided by the VMT of each respective vehicle class from each scenario year and adjusted for unit conversions to derive emission factors in units of grams per VMT. The emissions from mobile sources were calculated with the trip rates, trip lengths and emission factors for running from EMFAC as follows:
Construction On-Road Trips:
Emissionspollutant [MTCO2e] = (VMT × EFrunning,pollutant) ÷ 106
Where: VMT = vehicle miles traveled [miles] EFrunning,pollutant = emission factor for running emissions [g/mile]
106 = Conversion factor [g/MT]
3.2.2 Annual Operational Emissions For informational purposes, this EIR provides the existing and Project operational emissions for the Project Site, which have been estimated using the CalEEMod (Version 2013.2.2) software and the EMFAC2014 on-road emissions factor model. Sources of operational GHG emissions include Project trips, energy, waste, and water conveyance.
3.2.2.1 Area Sources
Area sources of GHG emissions resulting from the operation of the existing land uses at the Project Site under the Project include equipment used to maintain landscaping, such as lawnmowers and trimmers. The combustion of fossil fuels to operate these equipment results in GHG emissions of CO2 and smaller amounts of CH4 and N2O. The emissions occur on-site and are a direct result of activity from the existing land uses; therefore, the GHG emissions are considered to be direct. There are no other substantial stationary sources on-site, such as generators or industrial sized boilers.
The emissions of GHGs associated with operational area sources under the Project are calculated using the CalEEMod tool. The emissions for landscaping equipment are based on the size of the hotel, multi-family residential, and restaurant/retail land uses, the GHG emission factors for fuel combustion, and the GWP values for the GHGs emitted. Annual GHG emissions from landscaping equipment in units of MTCO2e are generally calculated in CalEEMod as follows:
Landscaping Equipment:
Annual Emissions [MTCO2e] = ( ∑i (Units × EFLE × ALE × GWP)i ) ÷ 106
Where: Units = Number of land use units (same land use type) [1000 sqft] EFLE = GHG emission factor [grams (g)/1000 sqft/day] ALE = Landscaping equipment operating days per year [day/year] GWP = Global warming potential [CO2 = 1, CH4 = 25, N2O = 298] 106 = Conversion factor [g/MT] i = Summation index

July 2016 3.0 Methodology
1020 S. Figueroa Street Project Greenhouse Gas Technical Report ESA PCR 31
CalEEMod uses landscaping equipment GHG emission factors from the CARB OFFROAD model and the CARB Technical Memo: Change in Population and Activity Factors for Lawn and Garden Equipment (6/13/2003).49 CalEEMod estimates that landscaping equipment operate for 250 days per year in the South Coast Air Basin.
3.2.2.2 Emissions Estimation from Energy Use
With regard to energy usage, the consumption of fossil fuels to generate electricity and to provide heating and hot water generates GHG emissions. Future fuel consumption rates are estimated based on specific square footage of the hotel, multi-family residential, retail, and restaurant land uses, as well as predicted water supply needs of the Project. Energy usage (off-site electricity generation and on-site natural gas consumption) for the Project is calculated within CalEEMod using the CEC’s California Commercial End Use Survey (CEUS) data set, which provides energy demand by building type and climate zone.50 This data set provides energy intensities of different land uses throughout the state and different climate zones. However, since the data from the CEUS is from 2002, the CalEEMod software incorporates correction factors to account for compliance with the Title 24 Building Standards Code. This assessment also includes electricity-related GHG emissions from the proposed subterranean parking, which would include elevators, lighting, and a ventilation system.
(a) Electricity
The generation of electricity in California is achieved through the combustion of fossil fuels, primarily natural gas, using steam boilers, internal combustion engines, and combustion turbines. A portion of the electricity in California is imported from outside the state and is derived from the combustion of coal and other non-gaseous fossil fuels. The combustion of fossil fuels to produce electricity results in GHG emissions of CO2 and smaller amounts of CH4 and N2O. These emissions occur due to the electrical demand of the hotel, multi-family residential, retail, and restaurant land uses that currently operate on the Project site. In addition, the existing surface parking lots generate GHG emissions from lighting electrical demand. The electricity generation occurs off-site; therefore, electricity use results in GHG emissions that are considered to be indirect.
Emissions of GHGs associated with operation of the Project are based on the size of the hotel, multi-family residential, retail, and restaurant land uses, the electrical demand factors for the land uses, the GHG emission factors for the electricity utility provider, and the GWP values for the GHGs emitted. This assessment also includes electricity-related GHG emissions from the parking lot, which would include lighting electricity. Annual electricity GHG emissions in units of MTCO2e are calculated as follows:
Electricity:
Annual Emissions [MTCO2e] = ( ∑i (Units × DE × EFE × GWP)i ) ÷ 2204.62
Where: Units = Number of land use units (same land use type) [1000 sqft] DE = Electrical demand factor [megawatt-hour (MWh)/1000 sqft/year]
49 California Air Resources Board, OFFROAD Modeling Change Technical Memo: Change in Population and Activity Factors for Lawn
and Garden Equipment, (6/13/2003), http://www.arb.ca.gov/msei/2001_residential_lawn_and_garden_changes_in_eqpt_pop_and_ act.pdf. Accessed June 2015.
50 California Energy Commission, California Commercial End-Use Survey, http://capabilities.itron.com/CeusWeb/Chart.aspx. Accessed December 2013.

3.0 Methodology July 2016
1020 S. Figueroa Street Project Greenhouse Gas Technical Report ESA PCR 32
EFE = GHG emission factor [pounds per megawatt-hour (MWh)] GWP = Global warming potential [CO2 = 1, CH4 = 25, N2O = 298] 2204.62 = Conversion factor [pounds/MT] i = Summation index
Since the Project would also be required to meet the Title 24 standards in effect at the time of building permit application, this analysis incorporates an additional correction factor to account for the updated Title 24 Building Standards Code. The correction factors are applied only to the new building construction. The Project would meet or exceed the amended standards via measures implemented to achieve the USGBC LEED rating.
The Los Angeles Department of Water and Power (LADWP) provides electric service to the Project Site. Emission factors for CO2 due to electrical generation to serve the electrical demands of the Project were obtained from the LADWP 2015 Power Integrated Resource Plan, which accounts for the generation mix using renewable and non-renewable sources.51 Emission factors for CH4 and N2O were obtained from CalEEMod. LADWP provides 20 percent of electricity via renewable sources52 but would provide an increasing percentage from renewable sources in compliance with the Renewables Portfolio Standard with 33 percent by 2020, 40 percent by 2024, 45 percent by 2027, and 50 percent by 2030. As a result, it is likely that the future year electricity GHG emissions would decline. This assessment provides the opening year GHG emissions, which provides for a conservative analysis of Project impacts.
(b) Natural Gas
Natural gas-related emissions of GHGs associated with operation of the Project are based on the size of the hotel, multi-family residential, and restaurant/retail land uses, the natural gas demand factors for the land uses, the GHG emission factors for the natural gas combustion, and the GWP values for the GHGs emitted. Annual natural gas GHG emissions in units of MTCO2e are calculated as follows:
Natural Gas:
Annual Emissions [MTCO2e] = ( ∑i (Units × DNG × EFNG × GWP)i ) ÷ 2204.62
Where: Units = Number of land use units (same land use type) [1000 sqft] DNG = Natural gas combustion factor [MMBtu/1000 sqft/year] EFNG = GHG emission factor [pounds/MMBtu] GWP = Global warming potential [CO2 = 1, CH4 = 25, N2O = 298] 2204.62 = Conversion factor [pounds/MT] i = Summation index
Natural gas demand is based on data from the CEUS, which lists energy demand by building type.53 However, since the data from the CEUS is from 2002, correction factors are applied to account for compliance with the
51 Los Angeles Department of Water and Power, 2015 Power Integrated Resource Plan, (2015) C-12. 52 Los Angeles Department of Water and Power, 2015 Power Integrated Resource Plan, (2015) ES-1. 53 California Energy Commission, California Commercial End-Use Survey,
http://capabilities.itron.com/CeusWeb/ChartsSF/Default2.aspx. Accessed March 2014.

July 2016 3.0 Methodology
1020 S. Figueroa Street Project Greenhouse Gas Technical Report ESA PCR 33
updated Title 24 Building Standards Code. The correction factors are applied only to the new building construction. The Project would meet or exceed the amended standards via measures implemented to achieve the USGBC LEED rating.
The combustion of natural gas results in relatively equal amounts of GHG emissions per unit of gas combusted in the state. Emission factors for GHGs due to natural gas combustion to serve the heating and cooking demands of the Project were obtained from the CalEEMod tool, which provides statewide emission factors.54 The emissions of GHGs due to natural gas demand would be relatively steady for the years assessed.
3.2.2.3 Water Supply, Treatment and Distribution
Water and wastewater generated from the land uses under the Project would require energy to supply, distribute and treat. The combustion of fossil fuels to produce electricity results in GHG emissions of CO2 and smaller amounts of CH4 and N2O. The electricity generation occurs off-site; therefore, the electricity use from water and wastewater results in GHG emissions that are considered to be indirect. Wastewater also results in emissions of GHGs from wastewater treatment systems (e.g., septic, aerobic, or lagoons) as well as from solids that are digested either through an anaerobic digester or with co-generation from combustion of digester gas.
The emissions of GHGs associated with wastewater treatment process emissions are also calculated using CalEEMod. The emissions are based on the type of treatment (e.g., aerobic, facultative lagoons, septic systems). The emissions are calculating using the default settings in CalEEMod for the type of wastewater treatment. Calculation formulas are described in detail in the California Emissions Estimator Model User’s Guide, Appendix A.55 Annual water demand and wastewater GHG emissions due to electricity are generally calculated in CalEEMod as follows for indoor and outdoor water demand:
Water Supply, Treatment, and Distribution; Wastewater Treatment (electricity):
Annual Emissions [MTCO2e] = ( ∑i (Units × DW × (EIW ÷ 1000) × EFW × GWP)i ) ÷ 2204.62
Where: Units = Number of land use units (same land use type) [1000 sqft] DW = Water demand factor [million gallons (Mgal)/1000 sqft/year] EIW = Electricity intensity factor [kilowatt-hours (kWh)/Mgal] 1000 = Conversion factor [kWh/MWh] EFW = GHG emission factor [pounds/MWh] GWP = Global warming potential [CO2 = 1, CH4 = 25, N2O = 298] 2204.62 = Conversion factor [pounds/MT] i = Summation index
The CEC’s estimate for energy intensity of the water use cycle in Southern California, as provided in the 2006 CEC report Refining Estimates of Water-Related Energy Use in California, is used to calculate the energy usage
54 California Air Pollution Control Officers Association, California Emissions Estimator Model, http://www.caleemod.com/. Accessed
March 2014. 55 California Air Pollution Control Officers Association, California Emissions Estimator Model User’s Guide, (2013).
3.0 Methodology July 2016
1020 S. Figueroa Street Project Greenhouse Gas Technical Report ESA PCR 34
related to water supply, treatment, and distribution and wastewater treatment.56 The same electricity GHG emissions factors discussed above are used for water and wastewater energy usage.
As stated in the User’s Guide, the GHGs emitted from each type of wastewater treatment are based on the CARB’s Local Government Operations Protocol (LGOP),57 which are in turn based on USEPA methodologies.58 The default CalEEMod settings for wastewater treatment are: 10.33 percent septic tank, 87.46 percent aerobic, 2.21 percent facultative lagoons and 100 percent anaerobic combustion of gas.
3.2.2.4 Solid Waste
The Project would generate solid waste from day-to-day operational activities, which generally consists of product packaging, grass clippings, furniture, clothing, bottles, food scraps, newspapers, plastic, and other items routinely disposed of in trash bins. A portion of the waste is diverted to waste recycling and reclamation facilities. Waste that is not diverted is usually sent to local landfills for disposal. waste that is disposed in landfills results in GHG emissions of CO2 and CH4 from the decomposition of the waste that occurs over the span of many years.
Emissions of GHGs associated with solid waste disposal under the Project are calculated using the CalEEMod tool. The emissions are based on the size of the hotel, multi-family residential, and restaurant/retail land uses, the waste disposal rate for the land uses, the waste diversion rate, the GHG emission factors for solid waste decomposition, and the GWP values for the GHGs emitted. Annual waste disposal GHG emissions in units of MTCO2e are generally calculated in CalEEMod as follows:
Waste:
Annual Emissions [MTCO2e] = ( ∑i (Units × DW × EFW × GWP)i ) ÷ 1.1023
Where: Units = Number of land use units (same land use type) [1000 sqft] DW = Waste disposal rate [tons/1000 sqft/year] EFW = GHG emission factor [tons/ton waste] GWP = Global warming potential [CO2 = 1, CH4 = 25, N2O = 298] 1.1023 = Conversion factor [tons/MT] i = Summation index
CalEEMod allows the input of several variables to quantify solid waste emissions. The model requires the amount of waste disposed, which is the product of the waste disposal rate times the land use units. The total amount of waste disposed was reduced by the diversion rate for the City of Los Angeles of 76 percent, according to the most recent data available.59 The GHG emission factors, particularly for CH4, depend on characteristics of the landfill, such as the presence of a landfill gas capture system and subsequent flaring or
56 California Energy Commission, Refining Estimates of Water-Related Energy Use in California, PIER Final Project Report, CEC-500-
2006-118, (2006). 57 California Air Resources Board, Local Government Operations Protocol, Chapter 10: Wastewater Treatment Facilities, (2008). 58 United States Environmental Protection Agency, Inventory of US Greenhouse Gas Emissions and Sinks: 1990-2006, Chapter 8: Waste,
(2008). 59 City of Los Angeles, Bureau of Sanitation, Zero Waste Progress Report, (2013).

July 2016 3.0 Methodology
1020 S. Figueroa Street Project Greenhouse Gas Technical Report ESA PCR 35
energy recovery. The default values, as provided in CalEEMod, for landfill gas capture (e.g., no capture, flaring, energy recovery), which are statewide averages, are used in this assessment.
3.2.2.5 Mobile Source Emissions
Mobile source emission calculations associated with operation of the Project are also calculated using the CalEEMod and EMFAC2014 models. In calculating mobile-source emissions, the trip length values for the mixed-use project are based on air basin-specific values in CalEEMod for the relevant land uses (hotel, multi-family residential, and restaurant/retail land uses). Trip distances in the South Coast Air Basin are slightly longer than the statewide average due to the fact that commute patterns in the South Coast Air Basin involve a substantial portion of the population commuting relatively far distances, as documented in the SCAG 2016-2040 Regional Transportation Plan (RTP)/Sustainable Communities Strategy (SCS). The RTP/SCS shows that, even under future Plan conditions, upwards of 50 percent of all work trips are 10 miles or longer.60 For the purposes of this analysis, trip distances in South Coast Air Basin are considered to be generally analogous to the statewide average given that the CalEEMod model trip distances in the South Coast Air Basin are slightly longer, but still generally similar to, the statewide average. The trip distances for the various operational activities were multiplied by the average daily trip estimates for each land use based on the data provided by the Project traffic study to estimate the VMT for the Project.61 The estimated VMT takes into account trip reductions based on applicable physical and operational Project characteristics including internal capture from co-locating commercial and residential uses on the Project Site, residential and job densities, neighborhood and site walkability and connectivity, and proximity to public transit (including high-quality rail transit via the Metro Red, Purple, Blue, and Expo Lines) and job centers. The estimated VMT reductions are calculated using the equations and methodologies prescribed in the CAPCOA guidance document, Quantifying Greenhouse Gas Mitigation Measures, which provides reduction calculation formulas for transportation characteristics and measures.62 Because CalEEMod does not incorporate CARB’s most recent on-road emissions factor model, mobile source emission factors are based on EMFAC2014. The model was run in the emissions mode (also referred to as the “Burden” mode) and used to generate South Coast Air Basin-specific vehicle fleet emission factors in units of grams or metric tons per mile, which is the same methodology used by CalEEMod to generate emission factors using the prior EMFAC2011 model. These emission factors are then applied to the annual VMT to obtain annual mobile source GHG emissions.
Emissions of GHGs associated with mobile sources from operation of the Project are based on the average daily trip rate, trip distance, the GHG emission factors for the mobile sources, and the GWP values for the GHGs emitted. The types of vehicles that would visit the Site include all vehicle types including automobiles, light-duty trucks, delivery trucks, and waste haul trucks. Modeling for the Project was conducted using the vehicle fleet mix for the South Coast Air Basin as provided in EMFAC2014. Annual mobile source GHG emissions in units of MTCO2e are generally calculated as follows:
60 Southern California Association of Governments, 2016-2040 Regional Transportation Plan (RTP)/Sustainable Communities Strategy
(SCS), Performance Measures Appendix, (2016) 13. The RTP/SCS does not specify the existing non-plan percentage of work trips greater than 10 miles in the region; however, it can be assumed that the percentage under existing non-plan conditions is greater than 50 percent since the goal of the RTP/SCS is to reduce overall VMT in the region.
61 Gibson Transportation Consulting, Inc., Traffic Study for the 6220 Yucca Street Mixed-Use Project. Hollywood, California, (2015). 62 California Air Pollution Control Officers Association, Quantifying Greenhouse Gas Mitigation Measures, (2010).

3.0 Methodology July 2016
1020 S. Figueroa Street Project Greenhouse Gas Technical Report ESA PCR 36
Mobile:
Annual Emissions [MTCO2e] = ( ∑i (Units × ADT × DTRIP × Days × EF × GWP)i ) ÷ 2204.62
Where: Units = Number of vehicles (same vehicle model year and class) ADT = Average daily trip rate [trips/day] DTRIP = Trip distance [miles/trip] Days = Number of days per year [days/year] EF = GHG emission factor [pounds per mile] GWP = Global warming potential [CO2 = 1, CH4 = 25, N2O = 298] 2204.62 = Conversion factor [pounds/MT]
i = Summation index
Emissions of GHGs from motor vehicles are dependent on model years and the specific types of vehicles that are used to travel to and from the existing Project Site. The emissions were calculated using a representative motor vehicle fleet mix for the South Coast Air Basin for the opening year of the Project. As discussed above, all vehicle types would visit the Project site; therefore, the use of the motor vehicle fleet mix for the South Coast Air Basin is an appropriate modeling parameter. The CO2 and CH4 mobile source emissions were added together, using the appropriate GWP values, to obtain emissions in units of MTCO2e (emissions of N2O are negligible and would not affect the total mobile source GHG emissions).
3.2.3 Land Use Characteristics and Project Design Features
3.2.3.1 Land Use Characteristics
The Project would represent an urban infill development, since it would be undertaken on a currently developed site, and would be located near existing off-site commercial and retail destinations and in close proximity to existing public transit stops, which would result in reduced vehicle trips and VMT. This would be in comparison to a business-as-usual project of similar size and land uses at a greenfield site without close access to off-site destinations and public transit stops. The Project would result in a corresponding reduction in transportation-related emissions compared to a business-as-usual project that is developed at a greenfield location without existing off-site destinations and public transit stops.
As discussed above, CAPCOA has provided guidance for mitigating or reducing emissions from land use development projects within its guidance document titled Quantifying Greenhouse Gas Mitigation Measures. The land use characteristics listed below are consistent with the CAPCOA guidance document, and would reduce vehicle trips to and from the Project Site and vehicle trip distances compared to a business-as-usual project without these land use characteristics and would achieve a reduction in associated transportation-related air pollutant and GHG emissions.
Increased Density: Increased density, measured in terms of persons, jobs, or dwelling units per unit area, reduces emissions associated with transportation as it reduces the distance people travel for work or services and provides a foundation for the implementation of other strategies such as enhanced transit services. This measure corresponds to CAPCOA guidance measure LUT-1.63 According to CAPCOA, the reduction in VMT from this measure applies to urban and suburban
63 California Air Pollution Control Officers Association, Quantifying Greenhouse Gas Mitigation Measures, (2010) 155-158.

July 2016 3.0 Methodology
1020 S. Figueroa Street Project Greenhouse Gas Technical Report ESA PCR 37
settings for residential, retail, office, industrial, and mixed-use projects. The Project is located in an urban infill64 location and is mixed-use; therefore, this measure applies to the Project. The Project would increase the Project Site density to approximately 241 dwelling units per acre and 206 jobs per acre (refer to Section 4.I, Population, Housing, and Employment, of this Draft EIR, which provides employment data used to estimate the number of jobs per acre).
Location Efficiency: Location efficiency describes the location of a project relative to the type of urban landscape such as an urban area, compact infill, or suburban center. In general, compared to the statewide average, a project could realize VMT reductions up to 65 percent in an urban area, up to 30 percent in a compact infill area, or up to 10 percent in a suburban center for land use/location strategies.65 This measure corresponds to CAPCOA guidance measure LUT-2.66 According to CAPCOA, the reduction in VMT from this measure applies to urban and suburban settings for residential, retail, office, industrial, and mixed-use projects. The Project is located in an urban infill location and is mixed-use; therefore, this measure applies to the Project. According to the CAPCOA guidance, factors that contribute to VMT reductions under this measure include the geographic location of the project within the region. The Project Site represents an urban infill location within the Downtown area of the City of Los Angeles. The Project Site is served by existing public transportation located within a quarter-mile. The Project Site is within an active urban center with many existing off-site commercial, entertainment, hotel, and residential buildings. The location efficiency of the Project Site would result in synergistic benefits that would reduce vehicle trips and VMT compared to the statewide and South Coast Air Basin average and would result in corresponding reductions in transportation-related emissions.
Increased Land Use Diversity and Mixed-Uses: Locating different types of land uses near one another can decrease VMT since trips between land use types are shorter and could be accommodated by alternative modes of transportation, such as public transit, bicycles, and walking. This measure corresponds to CAPCOA guidance measure LUT-3.67 According to CAPCOA, the reduction in VMT from this measure applies to urban and suburban settings (also potentially for rural master-planned communities) for mixed-use projects. The Project is located in an urban infill location and is mixed-use; therefore, this measure applies to the Project. According to the CAPCOA guidance, factors that contribute to VMT reductions under this measure include the percentage of
64 California Air Pollution Control Officers Association, Quantifying Greenhouse Gas Mitigation Measures, (2010) 59-60. The project
area meets the characteristics for an urban setting with respect to typical building heights of 6 stories or much higher, grid street pattern, minimal setbacks, constrained parking, high parking prices, high quality rail service (i.e., Metro Blue, Expo, Red and Purple Lines), location relative to regional cores (5 miles or less) and jobs/housing balance (the Central City Community Plan Area has an existing jobs/housing ratio of approximately 7.2).
65 CalEEMod, by default, assumes that trip distances in the South Coast Air Basin are slightly longer than the statewide average. This is due to the fact that commute patterns in the South Coast Air Basin involve a substantial portion of the population commuting relatively far distances, which is documented in the Southern California Association of Governments 2016-2040 Regional Transportation Plan (RTP)/Sustainable Communities Strategy (SCS). The RTP/SCS shows that, even under future Plan conditions, upwards of 50 percent of all work trips are 10 miles or longer (SCAG, Performance Measures Appendix, p. 13, 2016). The RTP/SCS does not specify the current percentage of work trips greater than 10 miles in the region, but it can be assumed that the percentage is currently greater than 50 percent since the goal of the RTP/SCS is to reduce overall VMT in the region. It is thus reasonable to assume that the trip distances in South Coast Air Basin are analogous to the statewide average given that the default model trip distances in the South Coast Air Basin are slightly longer but still generally similar to the statewide average. Therefore, projects could achieve similar levels of VMT reduction (65 percent in an urban area, 30 percent in a compact infill area, or 10 percent for a suburban center) compared to the South Coast Air Basin average.
66 California Air Pollution Control Officers Association, Quantifying Greenhouse Gas Mitigation Measures, (2010) 159-161. 67 California Air Pollution Control Officers Association, Quantifying Greenhouse Gas Mitigation Measures, (2010) 162-166.
3.0 Methodology July 2016
1020 S. Figueroa Street Project Greenhouse Gas Technical Report ESA PCR 38
each land use type in the project. The Project would co-locate complementary commercial and residential land uses in close to proximity to existing off-site commercial and residential uses. The Project would include on-site retail and residential land uses and would be located within a quarter-mile of off-site commercial and residential uses, as well as major transit facilities. The increases in land use diversity and mix of uses on the Project Site, as well as proximity to transit, would reduce vehicle trips and VMT by encouraging walking and non-automotive forms of transportation, which would result in corresponding reductions in transportation-related emissions.
Increased Destination Accessibility: This measure corresponds to CAPCOA guidance measure LUT-4.68 According to CAPCOA, the reduction in VMT from this measure applies to urban and suburban settings for residential, retail, office, industrial, and mixed-use projects. The Project is located in an urban infill location and is mixed-use, including residential and retail uses; therefore, this measure applies to the Project. According to the CAPCOA guidance, factors that contribute to VMT reductions under this measure include the distance to downtown or major job center. The Project would be located in an area that offers access to multiple other nearby destinations including restaurant, bar, office, retail, entertainment, movie theater, and residential uses. The Project Site is also located near other job centers in the region and within the Downtown area itself. The access to multiple destinations in close proximity to the Project Site would reduce vehicle trips and VMT compared to the statewide and South Coast Air Basin average, encourage walking and non-automotive forms of transportation, and would result in corresponding reductions in transportation-related emissions.
Increased Transit Accessibility: Locating a project with high density near transit facilitates encourages the use of transit by people traveling to or from a project site. This measure corresponds to CAPCOA guidance measure LUT-5.69 According to CAPCOA, the reduction in VMT from this measure applies to urban and suburban settings (also potentially for rural settings adjacent to a commuter rail station with convenient access to a major employment center) for residential, retail, office, industrial, and mixed-use projects. The Project is located in an urban infill location and is mixed-use; therefore, this measure applies to the Project. According to the CAPCOA guidance, factors that contribute to VMT reductions under this measure include the distance to transit stations near the Project. The Project would be located within a quarter-mile of public transportation, including existing Metro bus routes (e.g., 4, 28, 81, 442, 460, 701, 721, 728, 910/950, Commuter Express 422/423/438/448/534, DASH F) and the Metro Blue and Expo Lines, and nearby access to the Metro Red and Purple Lines within one-half mile.. The Project would provide access to on-site uses from existing pedestrian pathways. The Project would also provide parking for bicycles on-site to encourage utilization of alternative modes of transportation. The increased transit accessibility would reduce vehicle trips and VMT versus the statewide and South Coast Air Basin average, encourage walking and non-automotive forms of transportation, and would result in corresponding reductions in transportation-related emissions.
Improve Design of Development: Improved street network characteristics within a neighborhood enhances walkability and connectivity. Characteristics include street accessibility usually measured in terms of number of intersections (e.g., four-way intersections) per square mile. This measure corresponds to CAPCOA guidance measure LUT-9.70 According to CAPCOA, the reduction in VMT
68 California Air Pollution Control Officers Association, Quantifying Greenhouse Gas Mitigation Measures, (2010) 167-170. 69 California Air Pollution Control Officers Association, Quantifying Greenhouse Gas Mitigation Measures, (2010) 171-175. 70 California Air Pollution Control Officers Association, Quantifying Greenhouse Gas Mitigation Measures, (2010) 182-185.

July 2016 3.0 Methodology
1020 S. Figueroa Street Project Greenhouse Gas Technical Report ESA PCR 39
from this measure applies to urban and suburban settings for residential, retail, office, industrial, and mixed-use projects. The Project is located in an urban infill location and is mixed-use; therefore, this measure applies to the Project. The Project would be located in a highly street-accessible area with approximately 76 four-way intersections within a one mile area of the Project Site, which exceeds the standard intersection density assumed in baseline VMT modeling. The increased intersection density would reduce vehicle trips and VMT versus the statewide and South Coast Air Basin average, encourage walking and non-automotive forms of transportation, and would result in corresponding reductions in transportation-related emissions.
Provide Pedestrian Network Improvements: Providing pedestrian access that minimizes barriers and links a project site with existing or planned external streets encourages people to walk instead of drive. This measure corresponds to CAPCOA guidance measure SDT-1.71 According to CAPCOA, the reduction in VMT from this measure applies to urban, suburban, and rural settings for residential, retail, office, industrial, and mixed-use projects. The Project is located in an urban infill location and is mixed-use; therefore, this measure applies to the Project. According to the CAPCOA guidance, factors that contribute to VMT reductions under this measure include pedestrian access connectivity within the Project and to/from off-site destinations. As discussed in Section 4.J, Transportation and Traffic, the walkability of existing facilities is based on the availability of pedestrian routes necessary to accomplish daily tasks without the use of an automobile. These attributes are quantified by WalkScore.com and assigned a score out of 100 points. With the various commercial businesses and entertainment facilities adjacent to residential neighborhoods of the Downtown area and proximity to public transit, the walkability of the Downtown area is approximately 90 points;72 this compares to the citywide score of 64 points. As discussed in Chapter 2.0, Project Description, the Project would improve the street-level pedestrian environment and connectivity within the LA LIVE, Staples Center, the Los Angeles Convention Center and the surrounding streetscape, with the creation of new pedestrian scale features such as a public plaza along S. Figueroa with street level retail/restaurant uses, street trees and landscaping, public art, and signage and lighting. The Project would promote pedestrian activities and connections to interior uses. Pedestrian access to the Hotel Tower and lobby would be from a hotel motor-court on 11th Street and from the hotel lobby fronting S. Figueroa Street. Pedestrian access to the two stories of commercial and restaurant frontage along the periphery of the Podium fronting 11th Street, S. Figueroa Street, S. Flower Street, and Olympic Boulevard would be directly from those streets at the ground level or via elevators, stairs or escalators. Pedestrian access to the lobby for Residential Tower 1 at the corner of 11th Street and S. Flower Street would be from S. Flower Street. Pedestrian access to the lobby of Residential Tower 2 at the corner of S. Figueroa Street and Olympic Boulevard would be from Olympic Boulevard. Pedestrian access to the residential units in the Podium at the street level would be via either the Residential Tower 1 or Residential Tower 2 residential lobbies. In summary, the Project would provide an internal pedestrian network for Project visitors and residents that links to the existing off-site pedestrian network including existing off-site sidewalks, and would therefore result in some reduction in VMT and associated transportation-related emissions.
71 California Air Pollution Control Officers Association, Quantifying Greenhouse Gas Mitigation Measures, (2010) 186-189. 72 WalkScore.com(www.walkscore.com) rates the Project Site(1020 S. Figueroa Street) with a score of 90 of 100 possible points(scores
accessed on March 16, 2016 for the Downtown Los Angeles district). Walk Score calculates the walkability of specific addresses by taking into account the ease of living in the neighborhood with a reduced reliance on automobile travel.
3.0 Methodology July 2016
1020 S. Figueroa Street Project Greenhouse Gas Technical Report ESA PCR 40
3.2.3.2 Project Design Features
The Project would achieve several objectives of the City of Los Angeles General Plan Framework Element, SCAG RTP/SCS, and SCAQMD Air Quality Management Plan for establishing a regional land use pattern that promotes sustainability. The Project would support pedestrian activity in the Downtown area, and contribute to a land use pattern that addresses housing needs and reduces vehicle trips and air pollution by locating residential uses within an area that has public transit (with access to existing regional bus and rail service), and employment opportunities, restaurants and entertainment all within walking distance.
The Project would be designed to meet the standards for the equivalent of the USGC LEED Silver Certification standards through the incorporation of green building techniques and other sustainability features. Key Project Design Features that would contribute to energy efficiencies include the use of glass/window areas for ventilation and daylight accessibility, low albedo (high reflectivity) color paving to reduce heat island effect and drought tolerant landscaping. Other building features would include such items as stormwater retention; installation of heating, ventilation, and air conditioning (HVAC) systems that utilize ozone-friendly refrigerants; use of materials and finishes that emit low quantities of VOCs; use of high efficiency fixtures and appliances, water conservation features; and recycling of solid wastes. The Project would also provide bicycle parking and preferred parking for fuel efficient or electric vehicles. The Project would also be designed to comply with the City of Los Angeles Green Building Ordinance. The following Project Design Feature would reduce greenhouse gas emissions as well as air pollutant emissions:
PDF-AQ-1: Green Building Measures: The Project would be designed and operated to meet or exceed the applicable requirements of the State of California Green Building Standards Code and the City of Los Angeles Green Building Code and achieve the equivalent of the USGBC LEED Silver Certification level. Green building measures would include, but are not limited to the following:
The Project would implement a construction waste management plan to divert all mixed construction and demolition debris to City certified construction and demolition waste processors, consistent with the Los Angeles City Council approved Council File 09-3029;
The Project would be designed to optimize energy performance and reduce building energy cost by 14 percent for new construction compared to the Title 24 Building Energy Efficiency Standards as specified in the LEED 2009 Energy and Atmosphere credit 1 (EAc1);
The Project would be designed to optimize energy performance and reduce building energy cost by installing energy efficient appliances that meet the USEPA ENERGY STAR rating standards or equivalent;
The Project would include double-paned windows to keep heat out during summer months and keep heat inside during winter months.
The Project would include lighting controls with occupancy sensors to take advantage of available natural light.
The Project would reduce outdoor potable water use by a minimum of 50 percent compared to baseline water consumption. Reductions would be achieved through drought-tolerant/California native plant species selection, artificial turf, irrigation
July 2016 3.0 Methodology
1020 S. Figueroa Street Project Greenhouse Gas Technical Report ESA PCR 41
system efficiency, alternative water supplies (e.g., rainwater harvesting for use in landscaping), and/or smart irrigation systems (e.g., weather-based controls).
The Project would reduce indoor potable water use by a minimum of 40 percent compared to baseline water consumption by installing water fixtures that exceed applicable standards.
The Project would provide on-site recycling areas, consistent with City of Los Angeles strategies and ordinances, with the goal of achieving 70 percent waste diversion by 2020, and 90 percent by 2025.
To encourage carpooling and the use of electric vehicles by Project residents and visitors, the Applicant shall designate a minimum of 8 percent of on-site parking for carpool and/or alternative-fueled vehicles, and the Project design will provide for the installation of the conduit and panel capacity to accommodate future electric vehicle charging stations into 10 percent of the parking spaces.
PDF-AQ-2: Construction Measures: The Project shall utilize off-road diesel-powered construction equipment that meets or exceeds the CARB and USEPA Tier 4 off-road emissions standards for equipment rated at 50 hp or greater during Project construction. Equipment such as tower cranes, pumps, and welders shall be electric or alternative fueled (i.e., non-diesel). To the extent possible, pole power will be made available for use with electric tools, equipment, lighting, etc. These requirements shall be included in applicable bid documents and successful contractor(s) must demonstrate the ability to supply such equipment. A copy of each unit’s certified tier specification or model year specification and CARB or SCAQMD operating permit (if applicable) shall be available upon request at the time of mobilization of each applicable unit of equipment.


1020S.FigueroaStreetProject GreenhouseGasTechnicalReportESAPCR 43
4.0 INVENTORY IN CONTEXT
4.1 PROJECT CONSISTENCY WITH CITY AND REGIONAL GOALS AND ACTIONS
The Project’s significance with respect to GHG emissions is evaluated based on its consistency withapplicable GHG emissions goals and actions from the City of Los Angeles. Table 3, ConsistencywithApplicableCityofLosAngelesGreenLAPlanGHGEmissionsGoalsandActions, andTable4,ConsistencywithApplicable City of Los Angeles Sustainable City pLAn Goals, contains a list of GHG‐reducing strategiesapplicabletotheProject.TheProject‐levelanalysisdescribestheconsistencyoftheProjectwiththeseGHGemissionsreductiongoalsandactions.AsdiscussedinTable3andTable4,theProjectisconsistentwiththeapplicable goals and actions. In addition, as discussed, the Project would also result in GHG reductionsbeyondthosespecifiedby theCityandwouldminimize theGHGemissionsrelative to theexistingProjectSite conditions by incorporating energy efficient design features, and VMT reduction characteristics.Therefore, as theProject is consistentwith the applicableCity’s goals and actions forGHG emissions, theProjectwouldresultinlessthansignificantGHGemissionsandimpactswouldbelessthansignificant.
Table 3
Consistency with Applicable City of Los Angeles Green LA Plan GHG Emissions Goals and Actions
Action Description Consistency Analysis
FocusArea:EnergyE1 Meetthegoalto
increaserenewableenergyfromsolar,wind,biomass,andgeothermalsourcesto20percentby2010.
TheLADWP'sRPSgoalisoneexampleoftheDepartment'senvironmentalleadership.Thisgoalcallsforanincreaseinthesupplyofelectricityfromeligiblerenewableresourcesto20%byDecember31,2010,and35%by2020.Reducingtheamountofelectricitygeneratedbyfossilfueledpowerplantswillresultindirect,realreductionsingreenhouseemissions.
NotApplicable.ThisactionappliestoLADWPandotherutilityprovidersanddoesnotapplytotheProject.LAWDPhasachievedthe20percentby2010target.TheProjectwouldnotconflictwithorimpedetheCity’sabilitytoimplementthisaction.
E2 Increaseuseofrenewableenergyto35percentby2020.
SeeE1,above. SeeE1,above.
E3 Reducetheuseofcoal‐firedpowerplants.
Reducingtheamountofelectricityproducedbycoal,themostgreenhousegasintensiveofthefossilfuels,willreducetheCO2intensityofLADWP’spowermix.
NotApplicable.ThisactionappliestoLADWPandotherutilityprovidersanddoesnotapplytotheProject.TheProjectwouldnotconflictwithorimpedetheCity’sabilitytoimplementthisaction.
E4 Increasetheefficiencyofnaturalgas‐firedpowerplants.
TheLADWPplanstoreplacefoursteamboilerelectricgeneratingunitswithadvancedgasturbines.Replacingoldgeneratingunitswithmoreefficientgeneratingunitswillreducetheamountofnaturalgasburnedperunitofelectricenergyproduced,andwillthereforereduceGHGemissionsfromthecombustionofnaturalgas.
NotApplicable.ThisactionappliestoLADWPandotherutilityprovidersanddoesnotapplytotheProject.TheProjectwouldnotconflictwithorimpedetheCity’sabilitytoimplementthisaction.

4.0 Inventory in Context July 2016
Table 3 (Continued)
Consistency with Applicable City of Los Angeles Green LA Plan GHG Emissions Goals and Actions
1020 S. Figueroa Street Project Greenhouse Gas Technical Report ESA PCR 44
Action Description Consistency Analysis combustion of natural gas.
E5 Increase biogas co-firing of natural gas-fired power plants.
The combustion of biogas will displace a portion of natural gas usage at power plants, thus reducing GHG emissions. The following represent the City’s major projects to more fully utilize biogas emissions.
Not Applicable. This action applies to LADWP and other utility providers and does not apply to the Project. The Project would not conflict with or impede the City’s ability to implement this action.
E6 Present a comprehensive set of green building policies to guide and support private sector development.
The City embarked on an effort to establish green building requirements, paired with incentives, for medium- to large-private projects. Buildings account for a majority of electricity use. Each building site is a microcosm of the environmental issues faced by the City, so addressing each site in a comprehensive manner will provide a variety of environmental benefits.
Consistent. The Project would be designed and operated to meet or exceed the applicable requirements of the State of California Green Building Standards Code and the City of Los Angeles Green Building Code and meet the standards of the USGBC LEED Silver Certification level or its equivalent. The Project would incorporate energy efficiency measures defined in PDF-AQ-1. As a result, the Project would be consistent with City’s green building policies.
E7 Reduce energy use by all City departments to the maximum extent feasible.
This measure seeks to reduce energy use associated with the operation of streetlights and traffic signals by replacing lights with energy-efficient lighting sources, manage City computers by turning off or placing in standby computers when they are not in use, and implementing other energy saving measures.
Consistent. While this action applies to City departments, the Project would be designed and operated to meet or exceed the applicable requirements of the State of California Green Building Standards Code and the City of Los Angeles Green Building Code and meet the standards of the USGBC LEED Silver Certification level or its equivalent. The Project would incorporate energy efficiency measures defined in PDF-AQ-1. As a result, the Project would be consistent with the City’s action to reduce energy use.
E8 Complete energy efficiency retrofits of all City-owned buildings to maximize energy efficiency and reduce energy consumption.
For several years, the City has been meeting aggressive environmental standards for its new construction program, but has now also identified energy saving opportunities for 497 of the existing Council-controlled buildings that it owns and operates.
Consistent. While this action applies to City-owned buildings, the Project would be designed and operated to meet or exceed the applicable requirements of the State of California Green Building Standards Code and the City of Los Angeles Green Building Code and meet the standards of the USGBC LEED Silver Certification level or its equivalent. The Project would incorporate energy efficiency measures defined in PDF-AQ-1. As a result, the Project would be consistent with the City’s action to reduce energy use.
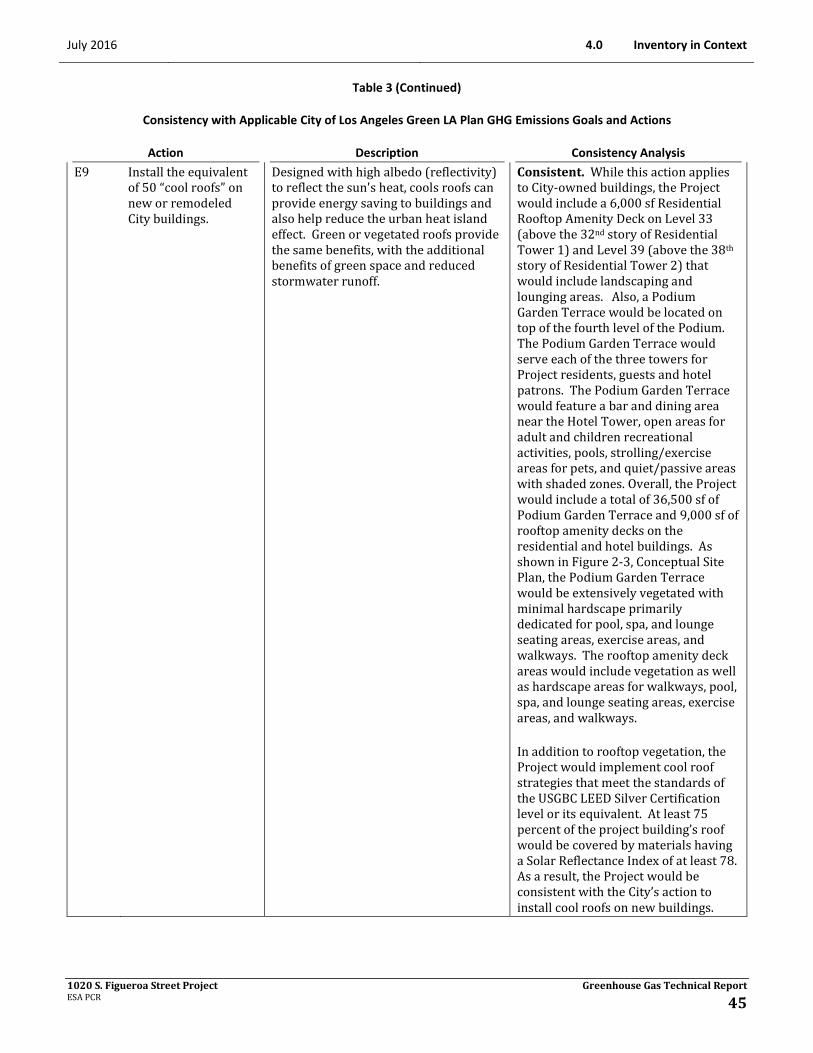
July 2016 4.0 Inventory in Context
Table 3 (Continued)
Consistency with Applicable City of Los Angeles Green LA Plan GHG Emissions Goals and Actions
1020 S. Figueroa Street Project Greenhouse Gas Technical Report ESA PCR 45
Action Description Consistency Analysis E9 Install the equivalent
of 50 “cool roofs” on new or remodeled City buildings.
Designed with high albedo (reflectivity) to reflect the sun's heat, cools roofs can provide energy saving to buildings and also help reduce the urban heat island effect. Green or vegetated roofs provide the same benefits, with the additional benefits of green space and reduced stormwater runoff.
Consistent. While this action applies to City-owned buildings, the Project would include a 6,000 sf Residential Rooftop Amenity Deck on Level 33 (above the 32nd story of Residential Tower 1) and Level 39 (above the 38th story of Residential Tower 2) that would include landscaping and lounging areas. Also, a Podium Garden Terrace would be located on top of the fourth level of the Podium. The Podium Garden Terrace would serve each of the three towers for Project residents, guests and hotel patrons. The Podium Garden Terrace would feature a bar and dining area near the Hotel Tower, open areas for adult and children recreational activities, pools, strolling/exercise areas for pets, and quiet/passive areas with shaded zones. Overall, the Project would include a total of 36,500 sf of Podium Garden Terrace and 9,000 sf of rooftop amenity decks on the residential and hotel buildings. As shown in Figure 2-3, Conceptual Site Plan, the Podium Garden Terrace would be extensively vegetated with minimal hardscape primarily dedicated for pool, spa, and lounge seating areas, exercise areas, and walkways. The rooftop amenity deck areas would include vegetation as well as hardscape areas for walkways, pool, spa, and lounge seating areas, exercise areas, and walkways. In addition to rooftop vegetation, the Project would implement cool roof strategies that meet the standards of the USGBC LEED Silver Certification level or its equivalent. At least 75 percent of the project building’s roof would be covered by materials having a Solar Reflectance Index of at least 78. As a result, the Project would be consistent with the City’s action to install cool roofs on new buildings.

4.0 Inventory in Context July 2016
Table 3 (Continued)
Consistency with Applicable City of Los Angeles Green LA Plan GHG Emissions Goals and Actions
1020 S. Figueroa Street Project Greenhouse Gas Technical Report ESA PCR 46
Action Description Consistency Analysis E10 Install solar heating
for all City-owned swimming pools.
The City has determined this measure to be infeasible because the majority of City-owned pools are seasonal and therefore not heated and the costs to retrofit the pools to operate on electricity would be extremely prohibitive. The City also found that the pools that are heated (by natural gas) are covered to retain heat, which is the most cost-effective method for heating the pools.
Consistent. While this action has been determined to be infeasible for City-owned pools, the Project would be equipped with a pool and spa that would be consistent with the City’s actions with respect to heating. The Project pool and spa would be heated by natural gas or solar and would be covered when closed to retain heat.
E11 Improve energy efficiency at drinking water treatment and distribution facilities.
This action is intended to reduce the amount of electricity used for water pumping and water treatment, thus leading to reduced GHG emissions from fossil-fueled electric power plants.
Not Applicable. This action applies to LADWP and does not apply to the Project. The Project would not conflict with or impede the City’s ability to implement this action.
E12 Maximize energy efficiency of wastewater treatment equipment.
The City of Los Angeles Bureau of Sanitation can employ direct action/s to reduce energy usage, including: a) investigate and test modifications to treatment processes that could reduce wastewater volume, electricity, and/or natural gas usage; or increase the production of biogas, which is used to produce electricity; and b) research the availability of more energy-efficient treatment equipment.
Not Applicable. This action applies to City of Los Angeles Bureau of Sanitation and does not apply to the Project. The Project would not conflict with or impede the City’s ability to implement this action.
E13 Distribute two compact fluorescent light (CFL) bulbs to each of the 1.4 million households in the City.
To reduce energy consumption and related CO2 emissions, the LADWP will purchase 2.4 million compact fluorescent light bulbs (CFLs) and distribute two bulbs to each of the City’s 1.2 million households.
Consistent. While this action applies to LAWPD, the Project would incorporate energy efficiency measures defined in PDF-AQ-1, which includes lighting controls with occupancy sensors to take advantage of available natural light. The Project would also utilize energy efficient lighting, such as CFLs, light emitting diodes (LEDs), or other energy efficient lighting technology. The Project would be consistent with the City’s action to provide energy efficient lighting to City residents.
E14 Increase the level and types of customer rebates for energy efficient appliances, windows, lighting, and heating and cooling systems.
Through implementation and aggressive promotion of existing non-residential energy efficiency programs in LADWP's service territory, energy consumption and related GHG emissions will continue to be reduced. LADWP will work closely with professional organizations, chambers of commerce, contractors, and
Consistent. While this action applies to LADWP, the Project would incorporate energy efficiency measures defined in PDF-AQ-1, which includes energy efficient lighting, lighting controls with occupancy sensors, energy efficient appliances, energy efficient windows, and energy
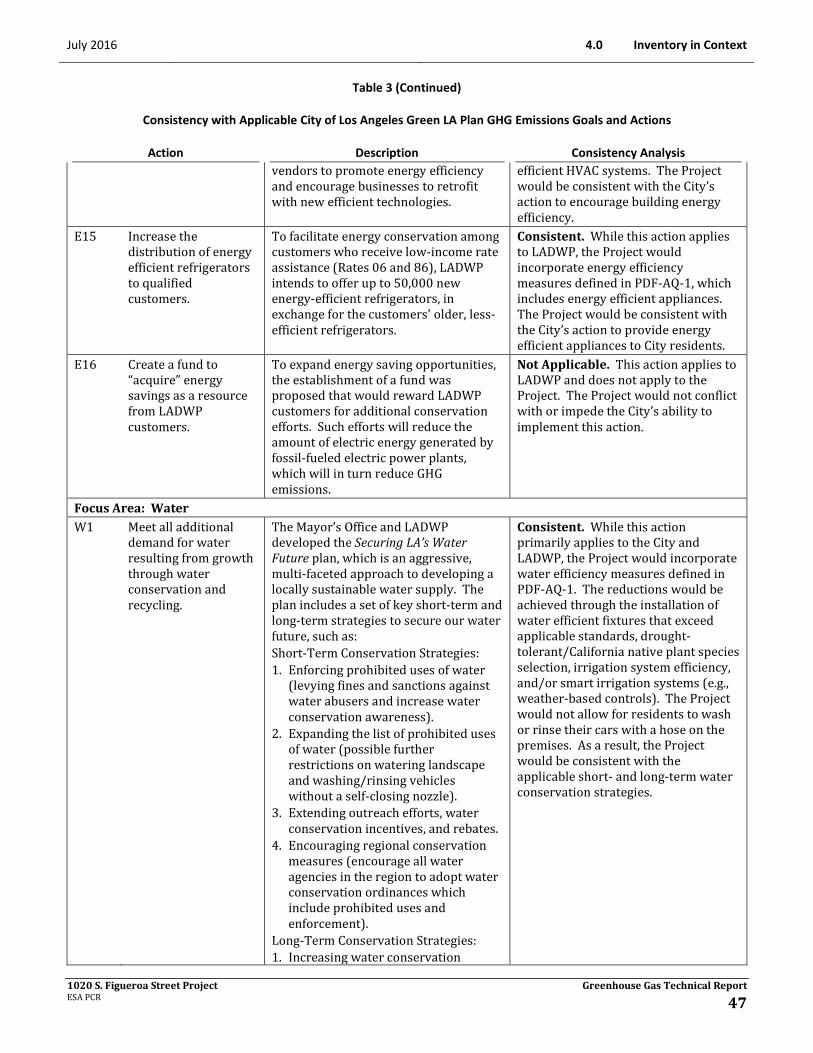
July 2016 4.0 Inventory in Context
Table 3 (Continued)
Consistency with Applicable City of Los Angeles Green LA Plan GHG Emissions Goals and Actions
1020 S. Figueroa Street Project Greenhouse Gas Technical Report ESA PCR 47
Action Description Consistency Analysis vendors to promote energy efficiency and encourage businesses to retrofit with new efficient technologies.
efficient HVAC systems. The Project would be consistent with the City’s action to encourage building energy efficiency.
E15 Increase the distribution of energy efficient refrigerators to qualified customers.
To facilitate energy conservation among customers who receive low-income rate assistance (Rates 06 and 86), LADWP intends to offer up to 50,000 new energy-efficient refrigerators, in exchange for the customers' older, less-efficient refrigerators.
Consistent. While this action applies to LADWP, the Project would incorporate energy efficiency measures defined in PDF-AQ-1, which includes energy efficient appliances. The Project would be consistent with the City’s action to provide energy efficient appliances to City residents.
E16 Create a fund to “acquire” energy savings as a resource from LADWP customers.
To expand energy saving opportunities, the establishment of a fund was proposed that would reward LADWP customers for additional conservation efforts. Such efforts will reduce the amount of electric energy generated by fossil-fueled electric power plants, which will in turn reduce GHG emissions.
Not Applicable. This action applies to LADWP and does not apply to the Project. The Project would not conflict with or impede the City’s ability to implement this action.
Focus Area: Water W1 Meet all additional
demand for water resulting from growth through water conservation and recycling.
The Mayor’s Office and LADWP developed the Securing LA’s Water Future plan, which is an aggressive, multi-faceted approach to developing a locally sustainable water supply. The plan includes a set of key short-term and long-term strategies to secure our water future, such as: Short-Term Conservation Strategies: 1. Enforcing prohibited uses of water
(levying fines and sanctions against water abusers and increase water conservation awareness).
2. Expanding the list of prohibited uses of water (possible further restrictions on watering landscape and washing/rinsing vehicles without a self-closing nozzle).
3. Extending outreach efforts, water conservation incentives, and rebates.
4. Encouraging regional conservation measures (encourage all water agencies in the region to adopt water conservation ordinances which include prohibited uses and enforcement).
Long-Term Conservation Strategies: 1. Increasing water conservation
Consistent. While this action primarily applies to the City and LADWP, the Project would incorporate water efficiency measures defined in PDF-AQ-1. The reductions would be achieved through the installation of water efficient fixtures that exceed applicable standards, drought-tolerant/California native plant species selection, irrigation system efficiency, and/or smart irrigation systems (e.g., weather-based controls). The Project would not allow for residents to wash or rinse their cars with a hose on the premises. As a result, the Project would be consistent with the applicable short- and long-term water conservation strategies.

4.0 Inventory in Context July 2016
Table 3 (Continued)
Consistency with Applicable City of Los Angeles Green LA Plan GHG Emissions Goals and Actions
1020 S. Figueroa Street Project Greenhouse Gas Technical Report ESA PCR 48
Action Description Consistency Analysis through reduction of outdoor water use and new technology.
2. Maximizing water recycling. 3. Enhancing stormwater capture 4. Accelerating clean-up of the
groundwater basin. 5. Expanding groundwater storage.
W2 Reduce per capita water consumption by 20%.
See W1, above. See W1, above.
W3 Implement the City’s innovative water and wastewater integrated resources plan that will increase conservation, and maximize use of recycled water, including capture and reuse of stormwater.
See W1, above. See W1, above.
Focus Area: Transportation T1 Require 85% of City
fleet to be powered by alternative fuels.
To reduce both air pollution and GHG emissions, City Departments will continue to acquire alternative fuel and advanced technology vehicles to replace those powered by conventional fuels.
Not Applicable. This action applies to the City and does not apply to the Project. The Project would not conflict with or impede the City’s ability to implement this action.
T2 Convert 100% of City refuse collection trucks and street sweepers to alternative fuels.
To reduce the use of conventional diesel fuel, reduce GHG and toxic air pollutant emissions, the City will continue to acquire solid resources collection vehicles (for refuse, dead animals, yard trimmings, and commingled recyclable materials) and street sweeper vehicles that are fueled by natural gas, an alternative fuel.
Not Applicable. This action applies to the City and does not apply to the Project. The Project would not conflict with or impede the City’s ability to implement this action.
T3 Convert 100% of Metropolitan Transportation Authority (MTA) buses to alternative fuels. Convert 100% of City Department of Transportation (DOT) Commuter Express
In 2011, the Los Angeles County Metropolitan Transportation Authority retired its last diesel bus and operates solely on alternative fuels – primarily compressed natural gas (CNG).73
Not Applicable. This action applies to MTA and the City and does not apply to the Project. The Project would not conflict with or impede MTA and the City’s ability to continue implementation of this action.
73 Los Angeles County Metropolitan Transportation Authority, “Metro Retires Last Diesel Bus, Becomes World’s First Major Transit
Agency to Operate Only Clean Fuel buses,” January 12, 2011. Available: https://www.metro.net/news/simple_pr/metro-retires-last-diesel-bus/.
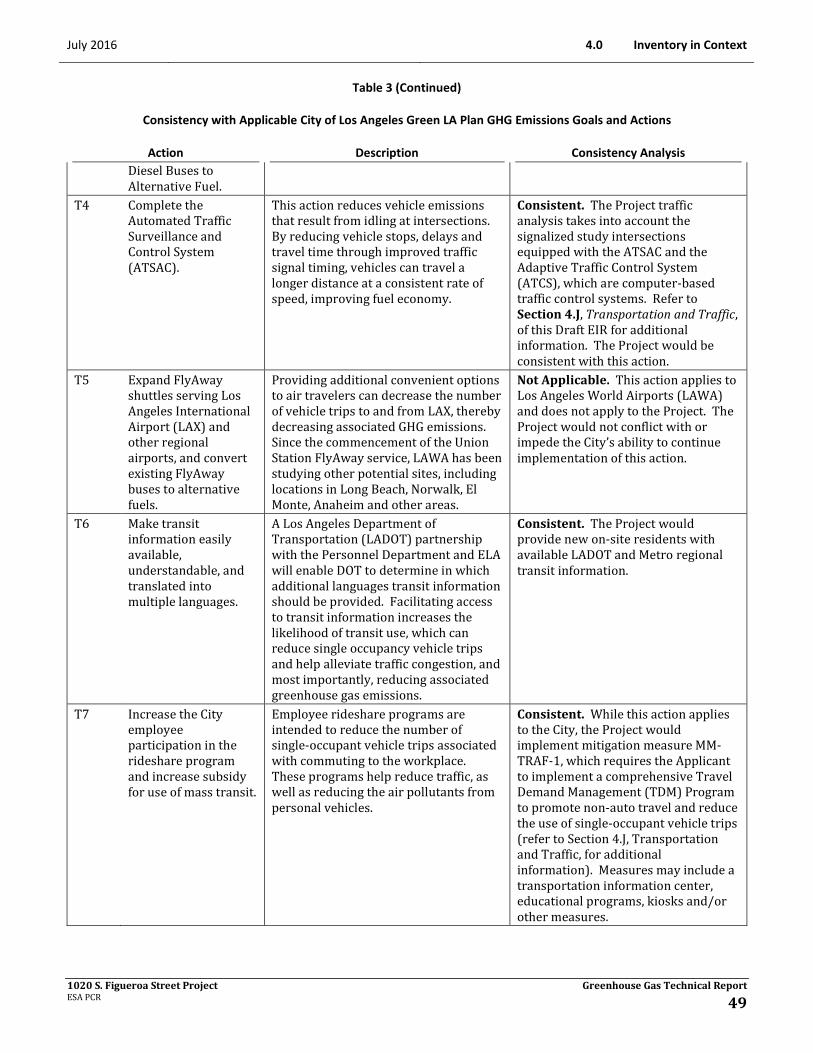
July 2016 4.0 Inventory in Context
Table 3 (Continued)
Consistency with Applicable City of Los Angeles Green LA Plan GHG Emissions Goals and Actions
1020 S. Figueroa Street Project Greenhouse Gas Technical Report ESA PCR 49
Action Description Consistency Analysis Diesel Buses to Alternative Fuel.
T4 Complete the Automated Traffic Surveillance and Control System (ATSAC).
This action reduces vehicle emissions that result from idling at intersections. By reducing vehicle stops, delays and travel time through improved traffic signal timing, vehicles can travel a longer distance at a consistent rate of speed, improving fuel economy.
Consistent. The Project traffic analysis takes into account the signalized study intersections equipped with the ATSAC and the Adaptive Traffic Control System (ATCS), which are computer-based traffic control systems. Refer to Section 4.J, Transportation and Traffic, of this Draft EIR for additional information. The Project would be consistent with this action.
T5 Expand FlyAway shuttles serving Los Angeles International Airport (LAX) and other regional airports, and convert existing FlyAway buses to alternative fuels.
Providing additional convenient options to air travelers can decrease the number of vehicle trips to and from LAX, thereby decreasing associated GHG emissions. Since the commencement of the Union Station FlyAway service, LAWA has been studying other potential sites, including locations in Long Beach, Norwalk, El Monte, Anaheim and other areas.
Not Applicable. This action applies to Los Angeles World Airports (LAWA) and does not apply to the Project. The Project would not conflict with or impede the City’s ability to continue implementation of this action.
T6 Make transit information easily available, understandable, and translated into multiple languages.
A Los Angeles Department of Transportation (LADOT) partnership with the Personnel Department and ELA will enable DOT to determine in which additional languages transit information should be provided. Facilitating access to transit information increases the likelihood of transit use, which can reduce single occupancy vehicle trips and help alleviate traffic congestion, and most importantly, reducing associated greenhouse gas emissions.
Consistent. The Project would provide new on-site residents with available LADOT and Metro regional transit information.
T7 Increase the City employee participation in the rideshare program and increase subsidy for use of mass transit.
Employee rideshare programs are intended to reduce the number of single-occupant vehicle trips associated with commuting to the workplace. These programs help reduce traffic, as well as reducing the air pollutants from personal vehicles.
Consistent. While this action applies to the City, the Project would implement mitigation measure MM-TRAF-1, which requires the Applicant to implement a comprehensive Travel Demand Management (TDM) Program to promote non-auto travel and reduce the use of single-occupant vehicle trips (refer to Section 4.J, Transportation and Traffic, for additional information). Measures may include a transportation information center, educational programs, kiosks and/or other measures.
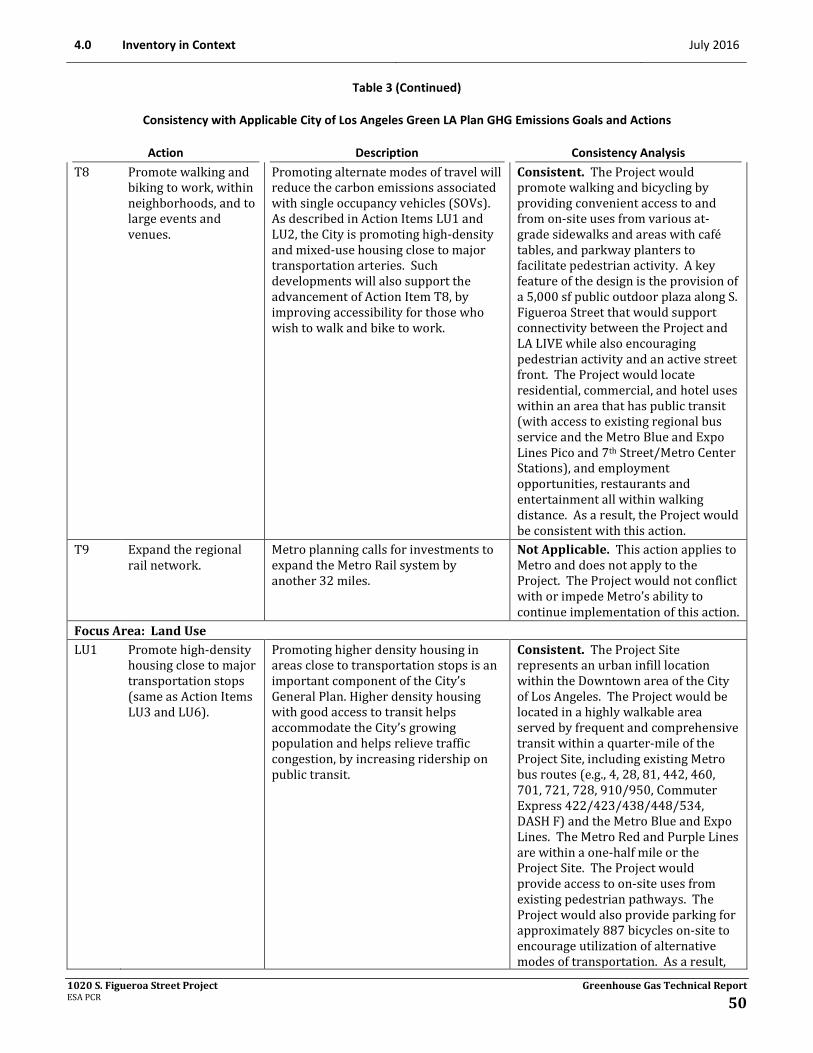
4.0 Inventory in Context July 2016
Table 3 (Continued)
Consistency with Applicable City of Los Angeles Green LA Plan GHG Emissions Goals and Actions
1020 S. Figueroa Street Project Greenhouse Gas Technical Report ESA PCR 50
Action Description Consistency Analysis T8 Promote walking and
biking to work, within neighborhoods, and to large events and venues.
Promoting alternate modes of travel will reduce the carbon emissions associated with single occupancy vehicles (SOVs). As described in Action Items LU1 and LU2, the City is promoting high-density and mixed-use housing close to major transportation arteries. Such developments will also support the advancement of Action Item T8, by improving accessibility for those who wish to walk and bike to work.
Consistent. The Project would promote walking and bicycling by providing convenient access to and from on-site uses from various at-grade sidewalks and areas with café tables, and parkway planters to facilitate pedestrian activity. A key feature of the design is the provision of a 5,000 sf public outdoor plaza along S. Figueroa Street that would support connectivity between the Project and LA LIVE while also encouraging pedestrian activity and an active street front. The Project would locate residential, commercial, and hotel uses within an area that has public transit (with access to existing regional bus service and the Metro Blue and Expo Lines Pico and 7th Street/Metro Center Stations), and employment opportunities, restaurants and entertainment all within walking distance. As a result, the Project would be consistent with this action.
T9 Expand the regional rail network.
Metro planning calls for investments to expand the Metro Rail system by another 32 miles.
Not Applicable. This action applies to Metro and does not apply to the Project. The Project would not conflict with or impede Metro’s ability to continue implementation of this action.
Focus Area: Land Use LU1 Promote high-density
housing close to major transportation stops (same as Action Items LU3 and LU6).
Promoting higher density housing in areas close to transportation stops is an important component of the City’s General Plan. Higher density housing with good access to transit helps accommodate the City’s growing population and helps relieve traffic congestion, by increasing ridership on public transit.
Consistent. The Project Site represents an urban infill location within the Downtown area of the City of Los Angeles. The Project would be located in a highly walkable area served by frequent and comprehensive transit within a quarter-mile of the Project Site, including existing Metro bus routes (e.g., 4, 28, 81, 442, 460, 701, 721, 728, 910/950, Commuter Express 422/423/438/448/534, DASH F) and the Metro Blue and Expo Lines. The Metro Red and Purple Lines are within a one-half mile or the Project Site. The Project would provide access to on-site uses from existing pedestrian pathways. The Project would also provide parking for approximately 887 bicycles on-site to encourage utilization of alternative modes of transportation. As a result,

July 2016 4.0 Inventory in Context
Table 3 (Continued)
Consistency with Applicable City of Los Angeles Green LA Plan GHG Emissions Goals and Actions
1020 S. Figueroa Street Project Greenhouse Gas Technical Report ESA PCR 51
Action Description Consistency Analysis the Project is consistent with this City action.
LU2 Promote and implement transit-oriented development (TOD).
Transit Oriented Districts (TODs) represent opportunities for creating cohesive, vibrant, walkable communities where fragmented, auto-dependent corridors now exist. TODs are a positive alternative to low-density traditional land use patterns that typically segregate housing, jobs and neighborhood services from one another. In contrast, TODs cluster these community elements in close proximity, so a greater portion of trips can be made by transit, bike, or on foot.
Consistent. The Project would co-locate complementary commercial and residential land uses in close to proximity to existing off-site commercial and residential uses. The Project would include on-site retail and residential land uses and would be located within a quarter-mile of off-site commercial and residential uses. The Project would be located in a highly walkable area served by frequent and comprehensive transit within a quarter-mile of the Project Site, including existing Metro bus routes (e.g., 4, 28, 81, 442, 460, 701, 721, 728, 910/950, Commuter Express 422/423/438/448/534, DASH F) and the Metro Blue and Expo Lines. The Metro Red and Purple Lines are within one-half mile of the Project Site. The increases in land use diversity and mix of uses on the Project Site would reduce vehicle trips and VMT by encouraging walking and non-automotive forms of transportation, which would result in corresponding reductions in transportation-related emissions. As a result, the Project is consistent with this City action.
LU3 Make available underutilized City land for housing and mixed-use development.
The City can leverage the value of its real estate assets, whether developed and unimproved lands, to further Smart Growth policies such as improving access to transportation, strengthening job/housing linkages, reducing vehicle trips, providing non-traditional open space such as linear networks, and parkland that is built upon freeway covers.
Consistent. While this action applies to City-owned land and facilities, the Project would be consistent. The Project would replace an existing surface parking lot with new development locating employment and housing opportunities within a one-quarter mile of frequent and comprehensive transit. The Project would provide sufficient parking consistent with Los Angeles Municipal Code (LAMC) requirements to the serve the new development (refer to Section 4.J, Transportation and Traffic, for an analysis of parking impacts). The Project would co-locate complementary commercial and residential land uses in close proximity to existing off-site commercial and residential uses. The Project would be
4.0 Inventory in Context July 2016
Table 3 (Continued)
Consistency with Applicable City of Los Angeles Green LA Plan GHG Emissions Goals and Actions
1020 S. Figueroa Street Project Greenhouse Gas Technical Report ESA PCR 52
Action Description Consistency Analysis located in an area accessible to alternative forms of transportation including walking, bicycling, and transit. The Project would include a public 5,000 sf of outdoor plaza along S. Figueroa Street; a 36,500 sf Podium Garden Terrace with a pool, and recreational areas; and a 6,000 sf roof garden space on the roof of both towers equipped with lounge seating, outdoor bar tops and bar stools, and pool deck. The Project further includes 27,000 sf of private residential balconies. As a result, the Project is consistent with this City action.
LU4 Make available underutilized City land for parks and open space.
See LU3, above. See LU3, above.
LU5 Clean up brownfields sites for community economic revitalization projects and open space.
Brownfields are a tremendous resource—open space in the urban core—available for redevelopment as projects, many of which confer public benefits. Each brownfield site that is successfully redeveloped can result in improved utilization of existing infrastructure, such as transit, and a concomitant decrease in vehicle trips. Brownfields can also be turned into urban parks, thereby expanding our urban forest.
Not Applicable. The Project is not a brownfield site. The Project would not conflict with or impede the City’s ability to implement this action.
LU6 Make available underutilized City land within 1,500 feet of transit for housing and mixed-use development.
See LU3, above. See LU3, above.
Focus Area: Waste WsT1 Reduce or recycle
70% of trash by 2015. Source reduction and recycling programs not only conserve natural resources and landfill space, but also confer climate benefits.
Consistent. The Project would be served by a solid waste collection and recycling service that may include mixed waste processing, and that yields waste diversion results comparable to source separation and consistent with Citywide recycling targets. According to the City of Los Angeles Zero Waste Progress Report (March 2013), the City achieved a

July 2016 4.0 Inventory in Context
Table 3 (Continued)
Consistency with Applicable City of Los Angeles Green LA Plan GHG Emissions Goals and Actions
1020 S. Figueroa Street Project Greenhouse Gas Technical Report ESA PCR 53
Action Description Consistency Analysis landfill diversion rate of approximately 76 percent by year 2012.74
Focus Area: Open Space and Greening OS/G1 Create 35 new parks. Parks and their trees, shrubs and other
vegetation help mitigate climate change impacts by absorbing CO2 and releasing oxygen into the atmosphere.
Consistent. The Project would replace an existing surface parking lot with new development that includes a total of 9,250 sf of public open space, 36,500 sf of Podium Garden Terrace, and 9,000 sf of rooftop amenity decks. The Project would provide landscaping and garden uses that would complement the aesthetic character of the Project Site and enhance its relationship to surrounding buildings. The exterior boundaries of the Project Site along S. Figueroa Street, W. 11th Street, and W. Olympic Street would include a streetscape design. All of the open spaces areas would have extensive landscaping and well-detailed hardscape. Street trees would be planted along S. Figueroa Street, W. 11th Street, and W. Olympic Street. In total, the Project would include 163 new and existing trees compared to the 22 trees existing on site and along the surrounding streets under current conditions. The Project would also pay Quimby fees pursuant to the State Quimby Act (California Government Code §66477) that would further the City’s goal of creating new parks. As a result, the Project would be consistent with this action.
OS/G2 Revitalize the Los Angeles River to create open space opportunities along the 32-mile corridor within the City of Los Angeles.
The primary goal of the Los Angeles River Revitalization Master Plan (LARRMP) is to revitalize the River by restoring some of its ecological functions. Where feasible, projects will enhance the creation and protection of habitat, floodwater retention, groundwater recharge, water quality, and other natural processes.
Not Applicable. The Los Angeles River is not a component of the Project nor is the Project Site adjacent to the Los Angeles River. The Project would not conflict with or impede the City’s ability to implement this action.
OS/G3 Plant 1 million trees throughout Los Angeles.
The Mayor launched the “Million Trees LA” (MTLA) Initiative in September 2006. The initiative is rooted in the idea
Consistent. In total, the Project would include 163 new and existing trees compared to the 22 trees existing on
74 City of Los Angeles, Zero Waste Progress Report, 2013. Accessed: http://www.lacitysan.org/solid_resources/recycling/publications/
PDFs/CLA_%20Zero_Waste_Progress_Report.pdf.
4.0 Inventory in Context July 2016
Table 3 (Continued)
Consistency with Applicable City of Los Angeles Green LA Plan GHG Emissions Goals and Actions
1020 S. Figueroa Street Project Greenhouse Gas Technical Report ESA PCR 54
Action Description Consistency Analysis that natural processes can reduce pollution and transform our city into a sustainable, green city. The one million new trees will provide shade and reduce energy costs, clean the air, absorb the GHGs that cause global warming, capture polluted urban runoff, improve water quality, provide homes for wildlife, and add beauty to neighborhoods.
site and along the surrounding streets under existing conditions. Street trees would be planted along S. Figueroa Street, W. 11th Street, and W. Olympic Street. The Project would provide landscaping and garden uses that would complement the aesthetic character of the Project Site and enhance its relationship to surrounding buildings. All of the open spaces areas would have extensive landscaping and well-detailed hardscape. As a result, the Project would be consistent with this action and help the City to achieve its goal.
OS/G4 Identify opportunities to “daylight” streams.
The "daylighting" of streams"—bringing them to above ground channels again—has been identified as a strategy the City could employ to address new regulatory requirements pertaining to stormwater runoff. The Bureau of Sanitation (BOS), with assistance from the Department of Recreation and Parks (RAP), has submitted many of the grant applications for the daylighting of streams in strategic locations. Specific daylighting projects include the Hazard Park Wetland and Stream Restoration Project and the North Atwater Creek Restoration and Water Quality Enhancement Project. These projects will restore wetlands for stormwater runoff capture and treatment and provide habitat linkage to the Los Angeles River.
Not Applicable. The City has not identified feasible Projects for the daylighting of streams in dense urban environments such as Downtown. As a result, this measure is not applicable to the Project. The Project would not conflict with or impede the City’s ability to implement this action.
OS/G5 Identify and develop promising locations for stormwater infiltration to recharge groundwater aquifers.
Stormwater infiltration is a Best Management Practice (BMP) that mirrors the natural process of infiltration found in undeveloped (or natural) watersheds. Where site conditions allow, a portion of urban stormwater runoff can be managed through infiltration, to effectively increase the volume of water returned to the soil and reduce the volume of direct runoff to streams and sewers. Increased infiltration also improves flood protection and aids in meeting local water demand by helping to recharge (replenish) underground aquifers.
Consistent. The Project would comply with City stormwater management requirements. As a result, the Project would be consistent with this action.
July 2016 4.0 Inventory in Context
Table 3 (Continued)
Consistency with Applicable City of Los Angeles Green LA Plan GHG Emissions Goals and Actions
1020 S. Figueroa Street Project Greenhouse Gas Technical Report ESA PCR 55
Action Description Consistency Analysis OS/G6 Collaborate and
partner with schools to create more parks in neighborhoods.
See OS/G1, above. See OS/G1, above.
Source: City of Los Angeles, Green LA Plan, 2008; ESA PCR, 2016.
Table 4
Consistency with Applicable City of Los Angeles Sustainable City pLAn Goals
Action Description Consistency Analysis Focus Area: Environment Local Water Lead the nation in water conservation
and source the majority of water locally. Consistent. The Project would incorporate water efficiency measures defined in PDF-AQ-1. The reductions would be achieved through the installation of water efficient fixtures that exceed applicable standards, drought-tolerant/California native plant species selection, irrigation system efficiency, and/or smart irrigation systems (e.g., weather-based controls). The Project would not conflict with the City’s and LADWP’s ability to provide locally sourced water.
Local Solar Increase Los Angeles’ clean and resilient energy supplies by capturing energy from abundant sunshine.
Consistent. Building rooftop areas without landscaping, pool, deck, garden or other improvements shall be construction as solar-ready for the future installation of on-site solar photovoltaic (PV) or solar water heating (SWH) systems.
Energy Efficient Buildings Save money and energy by increasing the efficiency of buildings.
Consistent. The Project would be designed and operated to meet or exceed the applicable requirements of the State of California Green Building Standards Code and the City of Los Angeles Green Building Code and meet the standards of the USGBC LEED Silver Certification level or its equivalent. The Project would incorporate energy efficiency measures defined in PDF-AQ-1.

4.0 Inventory in Context July 2016
Table 4 (Continued)
Consistency with Applicable City of Los Angeles Sustainable City pLan Goals
1020 S. Figueroa Street Project Greenhouse Gas Technical Report ESA PCR 56
Action Description Consistency Analysis Carbon and Climate Leadership As a proactive leader on climate issues,
strengthen Los Angeles’ economy by dramatically reducing GHG emissions and rallying other cities to follow Los Angeles’ lead.
Consistent. The Project would be designed to incorporate energy and water efficient designs that exceed the standards, which would result in substantial GHG emissions reductions. The Project would also be located in an area well served by multiple public transportation options and in a highly walkable environment, which would substantially reduce transportation-related GHG emissions.
Waste and Landfills Become the first big city in the United States to achieve zero-waste, and recycle and reuse most of its waste locally.
Consistent. The Project would be served by a solid waste collection and recycling service that may include mixed waste processing, and that yields waste diversion results comparable to source separation and consistent with Citywide recycling targets.
Focus Area: Economy Housing and Development Address Los Angeles’ housing shortage,
ensure that most new units are accessible to high-quality transit, and close the gap between income and rents.
Consistent. The Project would be located in an area well served by multiple public transportation options and in a highly walkable environment, which would substantially reduce transportation-related GHG emissions. The Project would be located in a major job center for the region, allowing residents to live close to places of work and retail, commercial, and entertainment uses.
Mobility and Transit Invest in rail, bus lines, pedestrian/bike safety, and complete neighborhoods that provide more mobility options and reduce vehicle miles traveled.
Consistent. The Project would be located in an area well served by multiple public transportation options and in a highly walkable environment, which would substantially reduce vehicle miles traveled and transportation-related GHG emissions.
Prosperity and Green Jobs Strengthen and grow the economy including through increased jobs and investments in clean technology sectors.
Consistent. The Project would provide jobs during construction, which would require technical knowledge and skills related to the installation of sustainable and energy efficient building systems. Operation of the Project would require periodic maintenance, which would require personnel with technical knowledge and skills in maintaining energy efficient building systems. The Project would also be located in a major job

July 2016 4.0 Inventory in Context
Table 4 (Continued)
Consistency with Applicable City of Los Angeles Sustainable City pLan Goals
1020 S. Figueroa Street Project Greenhouse Gas Technical Report ESA PCR 57
Action Description Consistency Analysis center for the region, allowing residents to live close to places of work allowing for increased job opportunities and improved commute patterns for residents.
Preparedness and Resiliency Prepare for natural disasters and decrease vulnerability to climate change.
Consistent. The Project would be constructed to meet or exceed City requirements for fire, earthquake, and other building safety standards.
Focus Area: Equity Air Quality Healthy air to breathe. Consistent. The Project would
implement emissions reductions measures during construction and operations to minimize air pollutant emissions, as discussed in PDF-AQ-1 and PDF-AQ-2. Implementation of these measures would ensure air quality impacts are less than significant.
Environmental Justice Ensure the benefits of the pLAn extend to all Angelenos.
Not Applicable. The City is responsible for ensuring the benefits of the pLAn extend to all Angelenos. The Project would not conflict with or impede the City’s ability to implement this action.
Urban Ecosystem Have access to parks, open space, including a revitalized Los Angeles River Watershed.
Consistent. The Project would provide a 5,000 sf public outdoor plaza along S. Figueroa Street that would support connectivity between the Project and LA LIVE while also encouraging pedestrian activity and an active street front. The outdoor plaza would incorporate landscape features, seating, and potential for public art display areas within this space. An additional 4,250 sf of street level open space would be provided for a total of 9,250 sf of public open space. Residents and guests/visitors would have access to 36,500 sf of Podium Garden Terrace, and 9,000 sf of rooftop amenity decks.
Livable Neighborhoods Live in safe, vibrant, well-connected, and healthy neighborhoods.
Consistent. The Project would provide a vibrant, safe, and well-connected neighborhood. Street trees would be planted along S. Figueroa Street, W. 11th Street, and W. Olympic Street. The Project would provide landscaping and garden uses that would complement the aesthetic

4.0 Inventory in Context July 2016
Table 4 (Continued)
Consistency with Applicable City of Los Angeles Sustainable City pLan Goals
1020 S. Figueroa Street Project Greenhouse Gas Technical Report ESA PCR 58
Action Description Consistency Analysis character of the Project Site and enhance its relationship to surrounding buildings. All of the open spaces areas would have extensive landscaping and well-detailed hardscape. The Project would improve the street-level pedestrian environment and connectivity within the LA LIVE, Staples Center, the Los Angeles Convention Center and the surrounding streetscape, with the creation of new pedestrian scale features such as a public plaza along Figueroa with street level retail/restaurant uses, street trees and landscaping, public art, and signage and appropriate street lighting.
Source: City of Los Angeles, Green LA Plan, 2008; ESA PCR, 2016.
4.2 CALCULATION OF CONSTRUCTION EMISSIONS In order to provide additional information to decision makers and the public, the emissions of GHGs associated with construction of the Project were calculated for each year of construction activity. Detailed emissions calculations are provided in Appendix A. Results of the GHG emissions calculations are presented on Table 5, Estimated Unmitigated Construction Greenhouse Gas Emissions. Although GHGs are generated during construction and are accordingly considered one-time emissions, it is important to include them when assessing all of the long-term GHG emissions associated with a project. The draft SCAQMD indicators of significance recommend that construction-related GHG emissions be amortized over a project’s 30-year lifetime in order to include these emissions as part of a project’s annualized lifetime total emissions, so that GHG reduction measures will address construction GHG emissions as part of the operational GHG reduction strategies. In accordance with this methodology, the estimated Project’s construction GHG emissions have been amortized over a 30-year period and are included in the annualized operational GHG emissions.
4.2 CALCULATION OF OPERATIONAL EMISSIONS In order to provide additional information to decision makers and the public, the emissions of GHGs associated with operation of the Project were calculated. The Project must comply with the portions of City‘s Green Building Code applicable to residential and mixed-use development. Additionally, physical and operational Project characteristics for which sufficient data is available to quantify the reductions from building energy and resource consumption have been included in the quantitative analysis, and include but are not limited to the following measures: installation of energy efficient appliances; low-water fixtures; water efficient irrigation; and reduced building energy usage by at least 14 percent compared to the ASHRAE Standard 90.1-2007 and Title 24-2005 standard as specified in the LEED 2009 Energy and Atmosphere credit 1 (EAc1).

July 2016 4.0 Inventory in Context
1020 S. Figueroa Street Project Greenhouse Gas Technical Report ESA PCR 59
Maximum annual net GHG emissions resulting from motor vehicles, energy (i.e., electricity, natural gas), water conveyance, and waste sources were calculated for the expected opening year. The maximum opening year GHG emissions from operation of the Project are shown in Table 6, Estimated Unmitigated Operational Greenhouse Gas Emissions. Emissions of GHGs were assessed for the interim year (2020) when Phase 1 would become operational and for the full Project buildout year (2023) with concurrent operation of both Phase 1 and Phase 2. To provide context for the emissions shown in Table 4.D-6, the Project’s net GHG emissions at full buildout of 5,793 MTCO2e per year, would be approximately 0.0013 percent of the State of California’s 2013 GHG emissions (See Table 4.D-2 for California 2013 GHG emissions) and 0.00001 percent of the global GHG emissions (refer to subsection 4.D.2.a(2) for global GHG emissions). Project operational-related GHG emissions would decline in future years as emissions reductions from the State’s Cap-and-Trade program are fully realized. Emissions from electricity would decline as utility providers, including LADWP, meet their Renewables Portfolio Standard obligations for 33 percent renewable electricity by 2020. Future regulations would also be implemented to increase the percentage of renewable electricity to 50 percent by 2030 consistent with SB 350, which would achieve additional reductions in emissions from electricity demand. Emissions from mobile sources would also decline in future years as older vehicles are replaced with newer vehicles resulting in a greater percentage of the vehicle fleet meeting more stringent combustion emissions standards, such as the model year 2017-2025 Pavley Phase II standards.
Transportation-related GHG emissions are the largest sector of emissions from the Project. This is consistent with regional plans, such as the SCAG RTP/SCS, which recognizes that the transportation sector is the largest contributor to the State’s GHG emissions. The purpose of the SCAG RTP/SCS is to achieve the regional per capita GHG reduction targets for the passenger vehicle and light-duty truck sector established by CARB pursuant to SB 375. SCAG’s Draft Program EIR for the RTP/SCS, released in December 2015, states that
Table 5
Estimated Unmitigated Construction Greenhouse Gas Emissions
Emission Source CO2e (Metric Tons) a,b Construction Phase 1
Year 1 214 Year 2 1,186 Year 3 1,314 Year 4 500
Construction Phase 2
Year 5 258 Year 6 763 Year 7 826 Year 8 148
Total Construction Emissions 5,208 Amortized Construction Emissions (30-years) 174 a Totals may not add up exactly due to rounding in the modeling calculations Detailed emissions calculations
are provided in Appendix A. b CO2e emissions are calculated using the global warming potential values from the Intergovernmental Panel
on Climate Change Fourth Assessment Report. Source: ESA PCR, 2016

4.0 Inventory in Context July 2016
1020 S. Figueroa Street Project Greenhouse Gas Technical Report ESA PCR 60
“[e]ach [Metropolitan Planning Organization] is required to prepare an SCS in conjunction to [sic] with the RTP in order to meet these GHG emissions reduction targets by aligning transportation, land use, and housing strategies with respect to [Senate Bill] 375.”75 SCAG’s RTP/SCS plans for regional population growth using smart land use strategies. As part of the SCS/RTP, “transportation network improvements would be included, and more compact, infill, walkable and mixed-use development strategies to accommodate new region’s growth would be encouraged to accommodate increases in population, households, employment, and travel demand.”76 Moreover, the RTP/SCS states that while “[p]opulation and job growth would induce land use change (development projects) and increase VMT, and would result in direct and indirect GHG emissions,” the RTP/SCS would “supports sustainable growth through a more compact, infill, and walkable development pattern.”77
Consistent with SCAG’s RTP/SCS alignment of transportation, land use, and housing strategies, the Project would accommodate increases in population, households, employment, and travel demand by implementing smart land use strategies. As discussed previously, the Project Site is an infill location close to jobs, housing,
75 Southern California Association of Governments, Draft Program Environmental Impact Report – 2016-2040 Regional Transportation
Plan/Sustainable Communities Strategy, (2015) 3.8-37. 76 Southern California Association of Governments, Draft Program Environmental Impact Report – 2016-2040 Regional Transportation
Plan/Sustainable Communities Strategy, (2015) 3.8-35. 77 Southern California Association of Governments, Draft Program Environmental Impact Report – 2016-2040 Regional Transportation
Plan/Sustainable Communities Strategy, (2015) 3.8-36.
Table 6
Estimated Unmitigated Operational Greenhouse Gas Emissions
Emissions Sources
Interim Year (Phase 1 Operations)
CO2e (Metric Tons per Year) a,b
Full Buildout (Phase 1 and 2 Operations)
CO2e (Metric Tons per Year) a,b Opening Operational Year
Electricity 2,558 4,365 Natural Gas 516 904 Mobile Sources 782 1,094 Solid Waste 99 192 Water and Wastewater 142 255 Area (Landscaping Equipment) 5 11
Subtotal 4,101 6,822 Existing Site 1,203 1,203 Net Increase 2,898 5,619 Amortized Construction Emissions 174 174 Total Net Emissions 3,072 5,793 a Totals may not add up exactly due to rounding in the modeling calculations Detailed emissions calculations are provided in
Appendix A. b CO2e emissions are calculated using the global warming potential values from the Intergovernmental Panel on Climate Change
Fourth Assessment Report. Source: ESA PCR, 2016

July 2016 4.0 Inventory in Context
1020 S. Figueroa Street Project Greenhouse Gas Technical Report ESA PCR 61
shopping and entertainment uses and in close proximity to existing and future public transit stops, which would result in reduced VMT, as compared to a project of similar size and land uses at a location without close and walkable access to off-site destinations and public transit stops.
The estimated reduction in VMT discussed previously in Section 3.2.3, Land Use Characteristics and Project Design Features, for the Project is supported by area-specific data in the Health Atlas for the City of Los Angeles (Health Atlas), published by the City in June 2013.78 Data collected by the City in support of its Health Atlas for the City of Los Angeles demonstrates that the Project would be located in an area that would substantially reduce mobile source GHG emissions relative to the Citywide and statewide average and that the Project would be consistent with regional planning efforts in accordance with the SCAG RTP/SCS to reduce VMT and associated emissions. The Health Atlas includes a number of findings related to land use mix and diversity, employment density, walkability, access to public transit, and other land use transportation findings organized by Community Plan Area. The Project is located in the Central City Community Plan Area. A summary and analysis of the Health Atlas findings relative to the Central City Community Plan Area are provided below.
Land Use Diversity: According to the Health Atlas, a “mix of land uses can increase walking and other physical activity” and “offer more destinations for non-automobile trips.”79 The Health Atlas evaluates land use diversity based on the presence of 19 types of uses or amenities, including supermarkets, convenience stores, banks, gyms, department stores, farmer’s markets, libraries, and parks, grouped into four categories: food retail, community-serving retail, services, civic and community facility. The Central City Community Plan Area scored relatively high out of the 35 Community Plan Areas, indicating that the area has a high number of different types of amenities available in the Community Plan Area (a score of 11, which is in the highest one-third of the scores). The data indicates that the Central City Community Plan Area has a high potential for walkability and offers a high number of destinations available for non-motorized trips. These findings are substantiated by the CAPCOA guidance, Quantifying Greenhouse Gas Mitigation Measures. CAPCOA measure LUT-3 (Increase Diversity of Urban and Suburban Developments [Mixed Use]) states that “different types of land uses near one another can decrease VMT since trips between land use types are shorter and may be accommodated by non-auto modes of transport.”80 The Health Atlas findings are also related to the goals and benefits of the SCAG RTP/SCS, which seeks improved “mobility and access by placing destinations closer together and decreasing the time and cost of traveling between them.”81 According to SCAG, incorporating “smart land use strategies encourages walking, biking, and transit use, and therefore reduces vehicular demand” and associated pollutants.82 The high scores for the number of destinations available for non-motorized trips within the Central City Community Plan Area supports the expectation that projects located in the area would achieve substantial reductions in VMT and associated mobile source emissions relative to the Citywide average. It also follows that projects located in the area would be expected to achieve substantial
78 City of Los Angeles, Health Atlas for the City of Los Angeles, (2013). 79 City of Los Angeles, Health Atlas for the City of Los Angeles, (2013) 86-87. 80 California Air Pollution Control Officers Association, Quantifying Greenhouse Gas Mitigation Measures, (2010) 162. 81 Southern California Association of Governments, 2012-2035 Regional Transportation Plan/Sustainable Communities Strategy,
(2012) 113. 82 Southern California Association of Governments, 2012-2035 Regional Transportation Plan/Sustainable Communities Strategy,
(2012) 39.
4.0 Inventory in Context July 2016
1020 S. Figueroa Street Project Greenhouse Gas Technical Report ESA PCR 62
reductions in VMT and associated mobile source emissions relative to the statewide average since the City of Los Angeles is more urbanized and has a higher diversity of land uses than the state as a whole. Therefore, based on City data and expert guidance from state and regional agencies, the Project would result in a substantial reduction in emissions from mobile sources and would have a substantially greater level of transportation efficiency when compared to the Citywide and statewide average. Furthermore, the land use diversity scores for the Central City Community Plan Area in the Health Atlas show that the Project would be located in an area consistent with the regional SCAG RTP/SCS goals to improve mobility and access to diverse destinations, and to reduce vehicular demand and associated emissions.
Employment Density: The Health Atlas recognizes that “[h]igher levels of employment density, particularly retail job densities, are associated with more walking trips” as they “allow for more frequent and comprehensive transit service.”83 In turn, “[d]enser employment districts which are rich in transit service typically result in more walking and transit use … and makes jobs more accessible to all residents.”84 The Health Atlas evaluates employment density as the number of jobs per square mile. The Central City Community Plan Area has the highest employment density of the 35 Community Plan Areas in the City with nearly 80,000 jobs per square mile. The Citywide average employee density is approximately 1,185 jobs per square mile.85 The data indicates that the Central City Community Plan Area has a high potential for walkability and making use of frequent and comprehensive transit services, such as the Metro Red Line and connecting bus lines. These findings are substantiated by the CAPCOA guidance measure LUT-1 (Increase Density), which states that “[i]ncreased densities affect the distance people travel and provide greater options for the mode of travel they choose.”86 Measure LUT-1 also states that increased densities “provides a foundation for implementation of many other strategies which would benefit from increased densities” such as “enhanced transit service.”87 The Health Atlas findings are also related to the goals and benefits of the SCAG RTP/SCS, which seeks improved mobility and access and implementation of smart land use strategies that encourage walking, biking, and transit use, resulting in reduced vehicular demand and associated pollutants. The high employment density of the Central City Community Plan Area supports the expectation that projects located in the area would have high levels of walkability and high potential for transit usage. As a result, the Project would be expected to achieve substantial reductions in VMT and associated mobile source emissions relative to the Citywide and statewide average. Therefore, based on City data and expert guidance from state and regional agencies, the Project’s location in an employment dense area would result in a substantial reduction in emissions from mobile sources and would have a substantially greater level of transportation efficiency when compared to the Citywide and statewide average. Furthermore, the land employment density score for the Central City Community Plan Area in the Health Atlas shows that the Project would be located in an area consistent with the regional SCAG RTP/SCS goals to improve mobility and access to diverse destinations, and to reduce vehicular demand and associated emissions.
Walkability: The land use mix and diversity and employment density findings indicate that the Central City Community Plan Area has a high potential for walkability. The Health Atlas also provides
83 City of Los Angeles, Health Atlas for the City of Los Angeles, (2013) 90. 84 City of Los Angeles, Health Atlas for the City of Los Angeles, (2013) 90. 85 City of Los Angeles, Health Atlas for the City of Los Angeles, (2013) 102. 86 California Air Pollution Control Officers Association, Quantifying Greenhouse Gas Mitigation Measures, (2010) 155. 87 California Air Pollution Control Officers Association, Quantifying Greenhouse Gas Mitigation Measures, (2010) 155.

July 2016 4.0 Inventory in Context
1020 S. Figueroa Street Project Greenhouse Gas Technical Report ESA PCR 63
a direct quantitative analysis of the walkability of each Community Plan Area using a Walkability Index based on four components: land use mix, residential density, retail density, and intersection density. Higher scores represent more walkable areas. The Central City Community Plan Area has the highest Walkability Index of the 35 Community Plan Areas in the City. Furthermore, as discussed in Section 4.J, Transportation and Traffic, the walkability score for the Downtown area, as quantified by WalkScore.com, is approximately 90 points out of a possible 100;88 this compares to the citywide score of 64 points. The data indicates that the Central City Community Plan Area is a highly walkable area. These findings are substantiated by the CAPCOA guidance measure LUT-9 (Improve Design of Development), which indicates that design elements that enhance walkability and connectivity, such as intersection density, reduce VMT and associated GHG emissions. The Health Atlas findings are also related to the goals and benefits of the SCAG RTP/SCS, which seeks better “placemaking,” defined as “the process of developing options for locations where they can live and work that include a pleasant and convenient walking environment that reduces their reliance on their car.”89 The high Walkability Index of the Central City Community Plan Area supports the expectation that projects located in the area would have a highly walkable environment. As a result, the Project would be expected to achieve substantial reductions in VMT and associated mobile source emissions relative to the Citywide and statewide average. Therefore, based on City data and expert guidance from state and regional agencies, the Project’s location in a walkable area would result in a substantial reduction in emissions from mobile sources and would have a substantially greater level of transportation efficiency when compared to the Citywide and statewide average. Furthermore, the land employment density score for the Central City Community Plan Area in the Health Atlas show that the Project would be located in an area consistent with the regional SCAG RTP/SCS goals to provide better “placemaking” and to reduce vehicular demand and associated emissions.
Workers Commuting by Walking, Biking, and Public Transportation: The Health Atlas also indicates that the Central City Community Plan Area has a high percentage of workers that commute to work by walking, biking, and public transportation. The Central City Community Plan Area has the 2nd highest percentage of workers that commute to work by walking, biking, and public transportation, at about 37 percent for the area as a whole, based on 2010 data (greater than the 3rd highest Westwood Community Plan Area but less than the 1st highest Westlake Community Plan Area). The statewide percentage of workers that commute to work by walking, biking, and public transportation is approximately 9 percent, based on census data for the 2010 to 2014 period.90 As discussed previously, the Central City Community Plan Area is a highly walkable area and the area is also well served by frequent and comprehensive transit including the Metro Blue, Expo, Red, Purple, and Gold Lines, which provides convenient access to locations within Downtown Los Angeles and a multitude of locations outside the Downtown area, and multiple bus lines. Thus, the data indicates that the Central City Community Plan Area substantially exceeds the statewide average for the percentage of workers that commute to work by walking, biking, and public transportation. The Health Atlas findings are further substantiated by the CAPCOA guidance measures LUT-1, LUT-3, and
88 WalkScore.com(www.walkscore.com) rates the Project Site(1020 S. Figueroa Street) with a score of 90 of 100 possible points(scores
accessed on March 16, 2016 for the Downtown Los Angeles district). Walk Score calculates the walkability of specific addresses by taking into account the ease of living in the neighborhood with a reduced reliance on automobile travel.
89 Southern California Association of Governments, 2012-2035 Regional Transportation Plan/Sustainable Communities Strategy, (2012) 112.
90 U.S. Census Bureau, American FactFinder, Data Set B08301 (Means of Transportation to Work, California, 2010-2014), http://factfinder.census.gov/faces/nav/jsf/pages/searchresults.xhtml?refresh=t. Accessed December 2015.

4.0 Inventory in Context July 2016
1020 S. Figueroa Street Project Greenhouse Gas Technical Report ESA PCR 64
LUT-9, as discussed previously, and also by LUT-5 (Increase Transit Accessibility), which indicates that “high density near transit will facilitate the use of transit by people.”91 The Health Atlas findings are also related to the goals and benefits of the SCAG RTP/SCS, which seeks “[s]trategies focused on high-quality places, compact infill development, and more housing and transportation choices.”92 The high proportion of workers that commute to work by walking, biking, and public transportation in the Central City Community Plan Area supports the expectation that projects located in the area would be accessible to alternative forms of transportation. As a result, the Project would be expected to achieve substantial reductions in VMT and associated mobile source emissions relative to the Citywide and statewide average. Therefore, based on City data and expert guidance from state and regional agencies, the Project’s location in an area accessible to alternative forms of transportation including walking, bicycling, and transit would result in a substantial reduction in emissions from mobile sources and would have a substantially greater level of transportation efficiency when compared to the Citywide and statewide average. Furthermore, the Project would be located in an area consistent with the regional SCAG RTP/SCS goals to provide more transportation choices and to reduce vehicular demand and associated emissions.
The above data from the City’s Health Atlas supports the VMT reduction findings in this analysis. The Project’s specific location in close proximity to high-quality transit, including the Metro Blue, Expo, Red and Purple Lines and multiple bus routes, its close proximity to other off-site retail, restaurant, entertainment, commercial, and job destinations, and its highly walkable environment support the finding in this analysis that the Project would achieve a reduction in VMT better than the City and statewide average.
Overall, the net increase in annual GHG emissions, directly and indirectly, would be consistent with the City of Los Angeles LA Green Plan and Sustainable City pLAn. Therefore, as the Project would be consistent with the applicable City’s goals and actions for GHG emissions, the Project would result in less than significant GHG emissions and impacts would be less than significant.
4.4 CONSISTENCY WITH PLANS, POLICIES, OR REGULATIONS Due to the complex physical, chemical and atmospheric mechanisms involved in global climate change, there is no basis for concluding that the Project's less-than-significant increase in annual GHG emissions would cause a measurable change in global GHG emissions necessary to influence global climate change. Newer construction materials and practices, energy efficiency requirements, and newer appliances tend to emit lower levels of air pollutant emissions, including GHGs, as compared to those built years ago; however, the net effect is difficult to quantify. The GHG emissions of the Project alone would not likely cause a direct physical change in the environment. According to CAPCOA, “GHG impacts are exclusively cumulative impacts; there are no non-cumulative GHG emission impacts from a climate change perspective.”93 It is global GHG emissions in their aggregate that contribute to climate change, not any single source of GHG emissions alone. Because of the less than significant annual GHG emissions estimated for this Project, the lack of evidence indicating that those emissions would cause a measurable change in global GHG emissions necessary to exacerbate global climate
91 California Air Pollution Control Officers Association, Quantifying Greenhouse Gas Mitigation Measures, (2010) 171. 92 Southern California Association of Governments, 2012-2035 Regional Transportation Plan/Sustainable Communities Strategy,
(2012) 114. 93 California Air Pollution Control Officers Association, CEQA & Climate change: Evaluating and Addressing Greenhous Gas Emissions
from Projects Subject to the California Environmental Quality Act, (2008).

July 2016 4.0 Inventory in Context
1020 S. Figueroa Street Project Greenhouse Gas Technical Report ESA PCR 65
change, and the fact that the Project incorporates physical and operational Project characteristics and Project Design Features that would ensure consistency of Project GHG emissions with City goals and actions, rendering them less than significant, the Project is considered not to conflict with the GHG reduction goals of AB 32 and associated GHG reduction plans such as SCAG’s RTP/SCS.
The Project’s estimated VMT reductions would be consistent with regional plans to reduce transportation-related GHG emissions as part of the overall statewide strategy under AB 32. The Project would be consistent with and support the goals and benefits of the SCAG RTP/SCS, which seeks improved “mobility and access by placing destinations closer together and decreasing the time and cost of traveling between them.”94 According to SCAG, incorporating “smart land use strategies encourages walking, biking, and transit use, and therefore reduces vehicular demand” and associated pollutants.95 Additionally, the SCAG RTP/SCS seeks better “placemaking,” defined as “the process of developing options for locations where [people] can live and work that include a pleasant and convenient walking environment that reduces their reliance on their car.”96 The high scores for walkability and number of destinations available for non-motorized trips within the Central City Community Plan Area (as demonstrated by data from the City’s Health Atlas) shows that the existing infrastructure and built environment is sufficiently developed that projects located in the area would be expected to achieve substantial and credible reductions in trip distances and overall VMT. The high employment density of the Central City Community Plan Area supports the expectation that projects located in the area would provide high levels of walkability and high potential for transit usage by project residents, employees, and visitors. The high number of workers that commute to work by walking, biking, and public transportation in the Central City Community Plan Area is additional proof that projects located in the area would provide access to more transportation choices for project residents, employees, and visitors and that projects would have a substantially greater level of transportation efficiency when compared to the Citywide and statewide average. The Project would therefore be consistent with the SCAG RTP/SCS goals and benefits intended to improve mobility and access to diverse destinations, provide better “placemaking,” provide more transportation choices, and reduce vehicular demand and associated emissions. As such, the Project would be consistent with regional plans to reduce VMT and associated GHG emissions.
As discussed previously, the Project would comply with the Los Angeles Green Building Code to reduce GHG emissions by increasing energy-efficiency beyond requirements, reducing indoor and outdoor water demand, installing energy-efficient appliances and equipment, and achieving equivalent to the LEED Silver Certification level. The Project would also incorporate characteristics that would reduce transportation-related GHG emissions by locating Project-related jobs and retail and restaurant, near residential and commercial uses and within a quarter-mile of high-quality transit including the Metro Expo and Blue Lines, thereby encouraging alternative forms of transportation and pedestrian activity. These measures are consistent with the City’s GHG reduction, sustainability, and smart-growth goals of improving energy and water efficiency in buildings, decreasing per-capita water use, using energy efficient appliances and equipment, and creating a more livable city.
94 Southern California Association of Governments, 2012-2035 Regional Transportation Plan/Sustainable Communities Strategy,
(2012) 113. 95 Southern California Association of Governments, 2012-2035 Regional Transportation Plan/Sustainable Communities Strategy,
(2012) 39. 96 Southern California Association of Governments, 2012-2035 Regional Transportation Plan/Sustainable Communities Strategy,
(2012) 112.
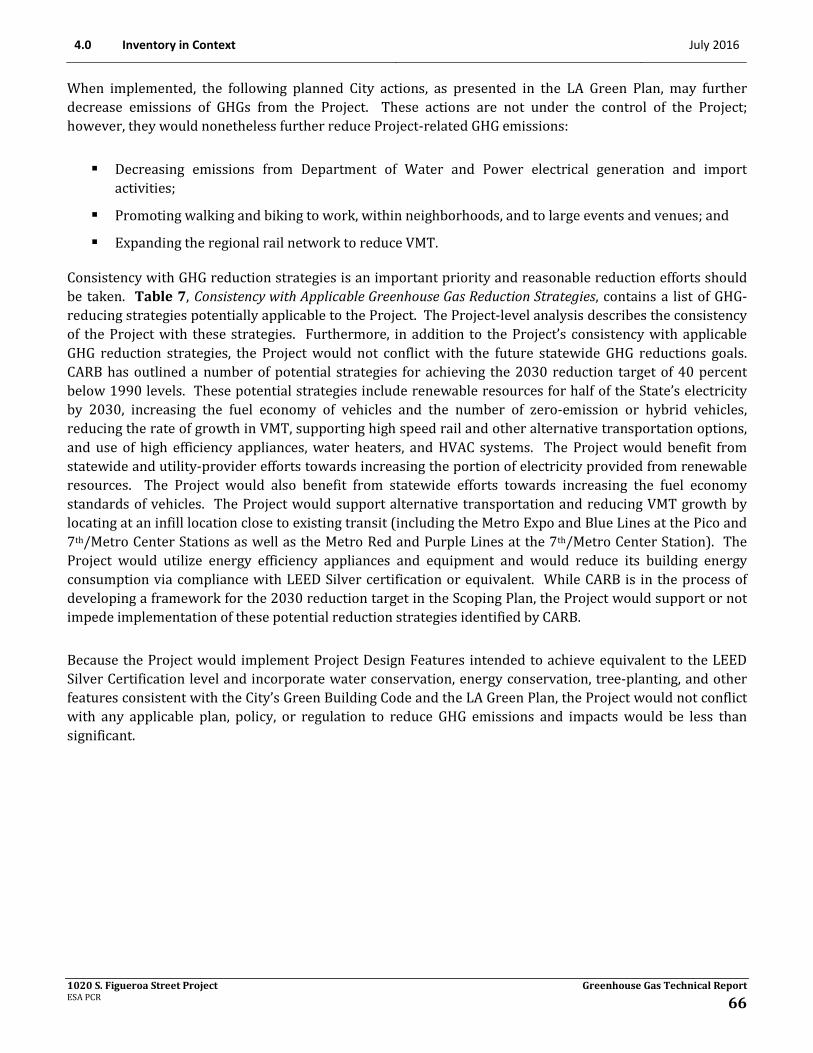
4.0 Inventory in Context July 2016
1020 S. Figueroa Street Project Greenhouse Gas Technical Report ESA PCR 66
When implemented, the following planned City actions, as presented in the LA Green Plan, may further decrease emissions of GHGs from the Project. These actions are not under the control of the Project; however, they would nonetheless further reduce Project-related GHG emissions:
Decreasing emissions from Department of Water and Power electrical generation and import activities;
Promoting walking and biking to work, within neighborhoods, and to large events and venues; and
Expanding the regional rail network to reduce VMT.
Consistency with GHG reduction strategies is an important priority and reasonable reduction efforts should be taken. Table 7, Consistency with Applicable Greenhouse Gas Reduction Strategies, contains a list of GHG-reducing strategies potentially applicable to the Project. The Project-level analysis describes the consistency of the Project with these strategies. Furthermore, in addition to the Project’s consistency with applicable GHG reduction strategies, the Project would not conflict with the future statewide GHG reductions goals. CARB has outlined a number of potential strategies for achieving the 2030 reduction target of 40 percent below 1990 levels. These potential strategies include renewable resources for half of the State’s electricity by 2030, increasing the fuel economy of vehicles and the number of zero-emission or hybrid vehicles, reducing the rate of growth in VMT, supporting high speed rail and other alternative transportation options, and use of high efficiency appliances, water heaters, and HVAC systems. The Project would benefit from statewide and utility-provider efforts towards increasing the portion of electricity provided from renewable resources. The Project would also benefit from statewide efforts towards increasing the fuel economy standards of vehicles. The Project would support alternative transportation and reducing VMT growth by locating at an infill location close to existing transit (including the Metro Expo and Blue Lines at the Pico and 7th/Metro Center Stations as well as the Metro Red and Purple Lines at the 7th/Metro Center Station). The Project would utilize energy efficiency appliances and equipment and would reduce its building energy consumption via compliance with LEED Silver certification or equivalent. While CARB is in the process of developing a framework for the 2030 reduction target in the Scoping Plan, the Project would support or not impede implementation of these potential reduction strategies identified by CARB.
Because the Project would implement Project Design Features intended to achieve equivalent to the LEED Silver Certification level and incorporate water conservation, energy conservation, tree-planting, and other features consistent with the City’s Green Building Code and the LA Green Plan, the Project would not conflict with any applicable plan, policy, or regulation to reduce GHG emissions and impacts would be less than significant.
1020 S. Figueroa Street Project Greenhouse Gas Technical Report ESA PCR 67
Table 7
Consistency with Applicable Greenhouse Gas Reduction Strategies
Source Category / Description Consistency Analysis AB 1493 (Pavley Regulations)
Reduces greenhouse gas emissions in new passenger vehicles from model year 2012 through 2016 (Phase I) and model year 2017-2025 (Phase II). Also reduces gasoline consumption to a rate of 31 percent of 1990 gasoline consumption (and associated GHG emissions) by 2020.
Consistent. The Project would not conflict with this regulation and would not conflict with implementation of the vehicle emissions standards.
SB 1368 Establishes an emissions performance standard for power plants within the State of California.
Consistent. The Project would not conflict with this regulation and would not conflict with implementation of the emissions standards for power plants.
Low Carbon Fuel Standard
Establishes protocols for measuring life-cycle carbon intensity of transportation fuels and helps to establish use of alternative fuels.
Consistent. The Project would be consistent with this regulation and would not conflict with implementation of the transportation fuel standards.
California Green Building Standards Code Requirements
All bathroom exhaust fans shall be ENERGY STAR compliant.
Consistent. The Project would utilize energy efficiency appliances and equipment and would meet or exceed the energy standards in ASHRAE 90.1, Appendix G and the Title 24 Building Energy Efficiency Standards.
HVAC Systems will be designed to meet ASHRAE standards.
Consistent. The Project would utilize energy efficiency appliances and equipment and would meet or exceed the energy standards in ASHRAE 90.1, Appendix G and the Title 24 Building Energy Efficiency Standards.
Energy commissioning shall be performed for buildings larger than 10,000 square feet.
Consistent. The Project would meet this requirement as part of its compliance with the City’s requirements and voluntary compliance with USGBC LEED Silver Certification or equivalent standards.
Air filtration systems are required to meet a minimum of MERV 8 or higher.
Consistent. The Project would meet or exceed this requirement as part of its compliance with the City’s requirements, and the CALGreen Code.
Refrigerants used in newly installed HVAC systems shall not contain any CFCs.
Consistent. The Project would meet this requirement as part of its compliance with the City’s requirements and the CALGreen Code.
Parking spaces shall be designed for carpool or alternative fueled vehicles. Up to eight percent of total parking spaces will be designed for such vehicles.
Consistent. The Project would meet this requirement as part of its compliance with the City’s requirements and the CALGreen Code.

4.0 Inventory in Context July 2016
Table 7 (Continued)
Consistency with Applicable Greenhouse Gas Reduction Strategies
1020 S. Figueroa Street Project Greenhouse Gas Technical Report ESA PCR 68
Source Category / Description Consistency Analysis Long-term and short-term bike parking shall
be provided for up to five percent of vehicle trips.
Consistent. The Project would exceed this requirement as part of the incorporated physical and operational Project characteristics to reduce vehicle trips and VMT and encourage alternative modes of transportation for patrons and employees. The Project would provide parking for approximately 887 bicycles on-site.
Stormwater Pollution Prevention Plan (SWPPP) required.
Consistent. The Project would meet this requirement via compliance with Statewide General Construction Activity Stormwater Permit (GCASP) requirements and implementation of required erosion and sediment control and pollution prevention best management practices (BMPs).
Indoor water usage must be reduced by 20% compared to current California Building Code Standards for maximum flow.
Consistent. The Project would meet this requirement as part of its compliance with the City’s requirements and the CALGreen Code
All irrigation controllers must be installed with weather sensing or soil moisture sensors.
Consistent. The Project would meet this requirement as part of its compliance with the City’s requirements and the CALGreen Code.
Wastewater usage shall be reduced by 20 percent compared to current California Building Standards.
Consistent. The Project would meet or exceed this requirement as part of its compliance with the City’s requirements and the CALGreen Code and voluntary compliance with USGBC LEED Silver Certification or equivalent standards.
Requires a minimum of 50 percent recycle or reuse of nonhazardous construction and demolition debris.
Consistent. The Project would meet or exceed this requirement as part of its compliance with the City’s requirements and the CALGreen Code and voluntary compliance with USGBC LEED Silver Certification or equivalent standards.
Requires documentation of types of waste recycled, diverted or reused.
Consistent. The Project would meet this requirement as part of its compliance with the City’s requirements and the CALGreen Code.
Requires use of low VOC coatings consistent with AQMD Rule 1168.
Consistent. The Project would be consistent with this regulation and would meet or exceed the low VOC coating requirements.
100 percent of vegetation, rocks, soils from land clearing shall be recycled or stockpiled on-site.
Consistent. The Project would meet this requirement as part of its compliance with the City’s requirements and the CALGreen Code.

July 2016 4.0 Inventory in Context
Table 7 (Continued)
Consistency with Applicable Greenhouse Gas Reduction Strategies
1020 S. Figueroa Street Project Greenhouse Gas Technical Report ESA PCR 69
Source Category / Description Consistency Analysis Climate Action Team Reduce diesel-fueled commercial motor
vehicle idling. Consistent. The Project would be consistent with the CARB Air Toxics Control Measure (ATCM) to limit heavy duty diesel motor vehicle idling to no more than 5 minutes at any given time (refer to Regulatory Compliance Measure RC-AQ-2 above, and in Section 4.B, Air Quality, of this Draft EIR).
Achieve California’s 50 percent waste diversion mandate (Integrated Waste Management Act of 1989) to reduce GHG emissions associated with virgin material extraction.
Consistent. The Project would meet this requirement as part of its compliance with the City’s requirements and the CALGreen Code.
Plant five million trees in urban areas by 2020 to effect climate change emission reductions.
Consistent. The Project would provide appropriate landscaping on the Project Site including vegetation and trees.
Implement efficient water management practices and incentives, as saving water saves energy and GHG emissions.
Consistent. The Project would meet this requirement as part of its compliance with the City’s requirements and the CALGreen Code and voluntary compliance with USGBC LEED Silver Certification or equivalent standards.
Reduce GHG emissions from electricity by reducing energy demand. The California Energy Commission updates appliance energy efficiency standards that apply to electrical devices or equipment sold in California. Recent policies have established specific goals for updating the standards; new standards are currently in development.
Consistent. The Project would utilize energy efficiency appliances and equipment and would meet or exceed the energy standards in ASHRAE 90.1, Appendix G and the Title 24 Building Energy Efficiency Standards.
Apply strategies that integrate transportation and land-use decisions, including but not limited to promoting jobs/housing proximity, high-density residential/ commercial development along transit corridors, and implementing intelligent transportation systems.
Consistent. The Project would incorporate physical and operational Project characteristics that would reduce vehicle trips and VMT and encourage alternative modes of transportation for patrons and employees.
Reduce energy use in private buildings. Consistent. The Project would utilize energy efficiency appliances and equipment and would meet or exceed the energy standards in ASHRAE 90.1, Appendix G and the Title 24 Building Energy Efficiency Standards.
Source: ESA PCR, 2016.
1020 S. Figueroa Street Project Greenhouse Gas Technical Report ESA PCR 70
5.0 CUMULATIVE IMPACTS
Worldwide man-made emissions of GHGs were approximately 49,000 MMTCO2e annually including ongoing emissions from industrial and agricultural sources and emissions from land use changes (e.g., deforestation).97 Emissions of CO2 from fossil fuel use and industrial processes account for 65 percent of the total while CO2 emissions from all sources accounts for 76 percent of the total. Methane emissions account for 16 percent and N2O emissions for 6.2 percent. In 2013, the United States was the world’s second largest emitter of carbon dioxide at 5,300 MMT (China was the largest emitter of carbon dioxide at 10,300 MMT).98
CARB compiles GHG inventories for the State of California. Based on the 2013 GHG inventory data (i.e., the latest year for which data are available from CARB), California emitted 457.2 MMTCO2e including emissions resulting from imported electrical power and 417.2 MMTCO2e excluding emissions related to imported power.99 Between 1990 and 2013, the population of California grew by approximately 8.2 million (from 29.8 to 38.0 million).100 This represents an increase of approximately 27.5 percent from 1990 population levels. In addition, the California economy, measured as gross state product, grew from $773 billion in 1990 to $2.21 trillion in 2013 representing an increase of approximately 186 percent.101 Despite the population and economic growth, California’s net GHG emissions only grew by approximately 6 percent between 1990 and 2013. The CEC attributes the slow rate of growth to the success of California’s renewable energy programs and its commitment to clean air and clean energy.102 Table 8, State of California GHG Emissions, identifies and quantifies statewide anthropogenic GHG emissions and sinks (e.g., carbon sequestration due to forest growth) in 1990 and 2013 (i.e., the most recent year in which data are available from CARB). As shown in the table, the transportation sector is the largest contributor to statewide GHG emissions at 37 percent in 2013. California emissions are due in part to its large size and large population.
5.1 PROJECT IMPACTS The emissions of a single project will not cause or exacerbate global climate change. It is possible that a substantial increase in GHG emissions from multiple projects throughout the world could result in a cumulative impact with respect to global climate change. CEQA requires that lead agencies consider evaluating the cumulative impacts of GHGs from even relatively small (on a global basis) increases in GHG emissions. Small contributions to this cumulative impact (from which significant effects are occurring and are expected to worsen over time) may be potentially considerable and therefore significant. A cumulatively considerable impact is the impact of a proposed project in addition to the related projects. However, in the
97 Intergovernmental Panel on Climate Change, Fifth Assessment Report Synthesis Report, 2014. 98 PBL Netherlands Environmental Assessment Agency and the European Commission Joint Research Center, Trends in Global CO2
Emissions 2014 Report, 2014. 99 California Air Resources Board, “California Greenhouse Gas 2000-2013 Inventory by Scoping Plan Category - Summary,”
http://www.arb.ca.gov/cc/inventory/data/tables/ghg_inventory_scopingplan_2000-13_20150831.pdf. Accessed November 2015. 100 U.S. Census Bureau, “California, Population of Counties by Decennial Census: 1900 to 1990,”
http://quickfacts.census.gov/qfd/states/06000lk.html. Accessed November 2015; California Department of Finance, “E-5 Population and Housing Estimates for Cities, Counties and the State, January 2011-2015, with 2010 Benchmark,” http://www.dof.ca.gov/research/demographic/reports/estimates/e-5/2011-20/view.php. Accessed November 2015.
101 California Department of Finance, “Financial & Economic Data: Gross Domestic Product, California,” http://www.dof.ca.gov/HTML/FS_DATA/LatestEconData/FS_Misc.htm. Accessed November 2015. Amounts are based on current dollars as of the date of the report (June 2015).
102 California Energy Commission, Inventory of California Greenhouse Gas Emissions and Sinks 1990 to 2004, (2006).

July 2016 5.0 Cumulative Impacts
1020 S. Figueroa Street Project Greenhouse Gas Technical Report ESA PCR 71
case of global climate change, the proximity of the project to other GHG-generating activities is not directly relevant to the determination of a cumulative impact. Although the State requires Metropolitan Planning Organizations and other planning agencies to consider how region-wide planning decisions can impact global climate change, there is currently no established non-speculative method to assess the cumulative impact of proposed independent private-party development projects.
Although AB 32 sets a statewide target for 2020 GHG emissions, the implementing tools of the law (e.g., CARB’s Climate Change Scoping Plan) are clear that the reductions are not expected to occur uniformly from all sources or sectors. CARB has set targets specific to the transportation sector (land use-related transportation emissions), for example, and under SB 375 SCAG must incorporate these GHG-reduction goals into the Regional Transportation Plan and demonstrate that its Sustainable Communities Strategy or Alternative Planning Strategy is consistent with the Regional Housing Needs Assessment. One of the goals of this process is to ensure that the efforts of State, regional and local planning agencies accommodate the contemporaneous increase in population and employment with a decrease in overall GHG emissions. For example, adopting zoning designations that reduce density in areas which are expected to experience growth in population and housing needs, is seen as inconsistent with anti-sprawl goals of sustainable planning. Although development under a reduced density scenario results in lower GHG emissions from the use of that land compared to what is currently or hypothetically allowed (by creating fewer units and fewer attributable vehicle trips), total regional GHG emissions will likely fail to decrease at the desired rate or, worse, increase if regional housing and employment needs of an area are met with a larger number of less-intensive
Table 8
State of California GHG Emissions
Category
Total 1990 Emissions
(MMTCO2e)
Percent of Total 1990 Emissions
Total 2013 Emissions
(MMTCO2e)
Percent of Total 2013 Emissions
Transportation 150.7 35% 169.0 37% Electric Power 110.6 26% 90.5 20%
Commercial 14.4 3% 13.3 3% Residential 29.7 7% 28.1 6% Industrial 103.0 24% 92.7 20%
Recycling and Wastea – – 8.9 2% High GWP/Non-Specifiedb 1.3 <1% 18.5 4%
Agriculture/Forestry 23.6 6% 36.2 8% Forestry Sinks -6.7 –c –
Net Total 426.6 100% 457.2 100% a Included in other categories for the 1990 emissions inventory. b High GWP gases are not specifically called out in the 1990 emissions inventory. c Forestry sinks was not calculated for 2013 pending a revised methodology under development. Sources: CARB, Staff Report – California 1990 Greenhouse Gas Emissions Level and 2020 Emissions Limit,
(2007); CARB, “California Greenhouse Gas 2000-2013 Inventory by Scoping Plan Category – Summary,” http://www.arb.ca.gov/cc/inventory/data/data.htm. Accessed November 2015.

5.0 Cumulative Impacts July 2016
1020 S. Figueroa Street Project Greenhouse Gas Technical Report ESA PCR 72
development projects. Therefore, it is not simply a cumulative increase in regional development or the resultant GHG emissions that threatens GHG reduction goals.
The land use sector can accommodate growth and still be consistent with statewide plans to reduce GHG emissions. To that end, various agencies are required to develop programs to guide future building and transportation development towards minimized resource consumption and lowered resultant pollution. As discussed above, the City has adopted a Green Building Code that includes mandatory measures. However, the Green Building Code also includes voluntary options applicable to and chosen by each individual project developer, and their efficacy in reducing GHG emissions can vary. In addition, the emissions models used for project-level evaluations may not fully reflect improvements in technology and other reductions in GHG emissions that are likely to occur in the future pursuant to State regulations, such as future model year vehicle emission standards after 2025, as well as other future federal and/or State regulations. Therefore, it is not possible or meaningful to calculate emissions from each of the identified related projects and compare that with a numeric threshold or reduction target.
As discussed in Table 7, the Project would be consistent with applicable GHG reduction strategies recommended by the City and State. In addition, the Project would support and be consistent with relevant and applicable GHG emission reduction strategies in SCAG’s Sustainable Communities Strategy. These strategies include providing residences, including retail uses in an urban infill location and within a relatively short distance of existing transit stops; providing employment near current transit stops and neighborhood commercial centers; and supporting alternative and electric vehicles via the installation of on-site electric vehicle charging stations. As a result, the Project would be consistent with the State’s goals. Furthermore, the overwhelming majority of the Project-related GHG emissions are from source sectors that include electricity generated in-state or imported and the combustion of transportation fuels. These sectors are already covered entities under the Cap-and-Trade Program and as such would be reduced sector-wide in accordance with the goals of AB 32, in addition to the previously discussed GHG emissions reductions from the Project-specific energy efficiency design features, and VMT-reducing characteristics. Given that the Project would generate GHG emissions consistent with applicable reduction plans and policies that therefore are less than significant, and given that GHG emission impacts are cumulative in nature, the Project’s incremental contribution to cumulatively significant GHG emissions would be less than cumulatively considerable, and impacts would be less than significant.

1020 S. Figueroa Street Project Greenhouse Gas Technical Report ESA PCR 73
6.0 SUMMARY OF RESULTS
In summary, construction and operation of the proposed project would result in GHG emissions that would not result in a significant impact on the environment. The Project would be consistent with local, regional, and State’s plans and programs adopted for the purpose of reducing the emissions of GHGs. Accordingly, the project would not result in a cumulatively considerable impact to global climate change.


APPENDIX A GREENHOUSE GAS WORKSHEETS AND OUTPUT FILES


1020S.FigueroaStreetProjectDraftEIRAppendixA,GreenhouseGasEmissionWorksheetsA.1 ConstructionEmissions(CalEEModandEMFAC2014)
EmissionsModelInputs
CalEEModOutput
TruckEmissions(EMFAC2014)
A.2 OperationalEmissions(CalEEMod)
EmissionsModelInputs
CalEEModOutput–Existing
CalEEModOutput–Project
A.3 OperationalEmissions(EMFAC2014)
ExistingandProject(InterimandFullBuildout)TripandVMTReductions
ExistingandProject(InterimandFullBuildout)MobileSourceEmissions

AppendixA.1ConstructionEmissions(CalEEModandEMFAC2014)
EmissionsModelInputs
CalEEModOutput
TruckEmissions(EMFAC2014)

1020 S. Figueroa Street Project EIRAir Quality and Greenhouse Gas Assessment
Project Information
Land Use Units Res. Pop.Existing Uses
Hotel 178 rooms 112,748 sf
Project Phase 1Residential + Amenities 290 DU 352,000 sf 473
Loft/Studio 141 DU1‐Bedroom 73 DU2‐Bedroom 68 DU3‐Bedroom 4 DUPenthouse 4 DU
Retail/Commercial 15.0 ksf 15,000 sfRestaurant 15.0 ksf 15,000 sf
Hotel 300 rooms 280,000 sf
Above‐Grade Parking Structure ‐ spaces ‐ sfSubterranean Parking Structure 437 spaces 174,800 sfOpen Space 29.3 ksf 0.67 acre
Project Phase 2Residential + Amenities 360 DU 418,000 sf 587
Loft/Studio 167 DU1‐Bedroom 94 DU2‐Bedroom 91 DU3‐Bedroom 4 DUPenthouse 4 DU
Commercial 25.0 ksf 25,100 sfRestaurant 25.0 ksf 25,100 sf
Above‐Grade Parking Structure ‐ spaces ‐ sfSubterranean Parking Structure 362 spaces 144,800 sfOpen Space 20.5 ksf 0.47 acrePlaza Area 5.0 ksf 5,000 sf
Lot Area (acres)/Developed Area (sf) 2.70 acres 116,660 sfSources: Hazens Group, March 2016; PCR Services Corporation, March 2016
Enclosed Parking with ElevatorUnenclosed Parking with Elevator
City Park
High‐rise Apartment
CalEEMod Land Use Type
High‐rise Apartment
Strip Mall
Hotel
Quality Restaurant
Hotel
City Park
Strip MallQuality Restaurant
Unenclosed Parking with ElevatorEnclosed Parking with Elevator
Surface Parking
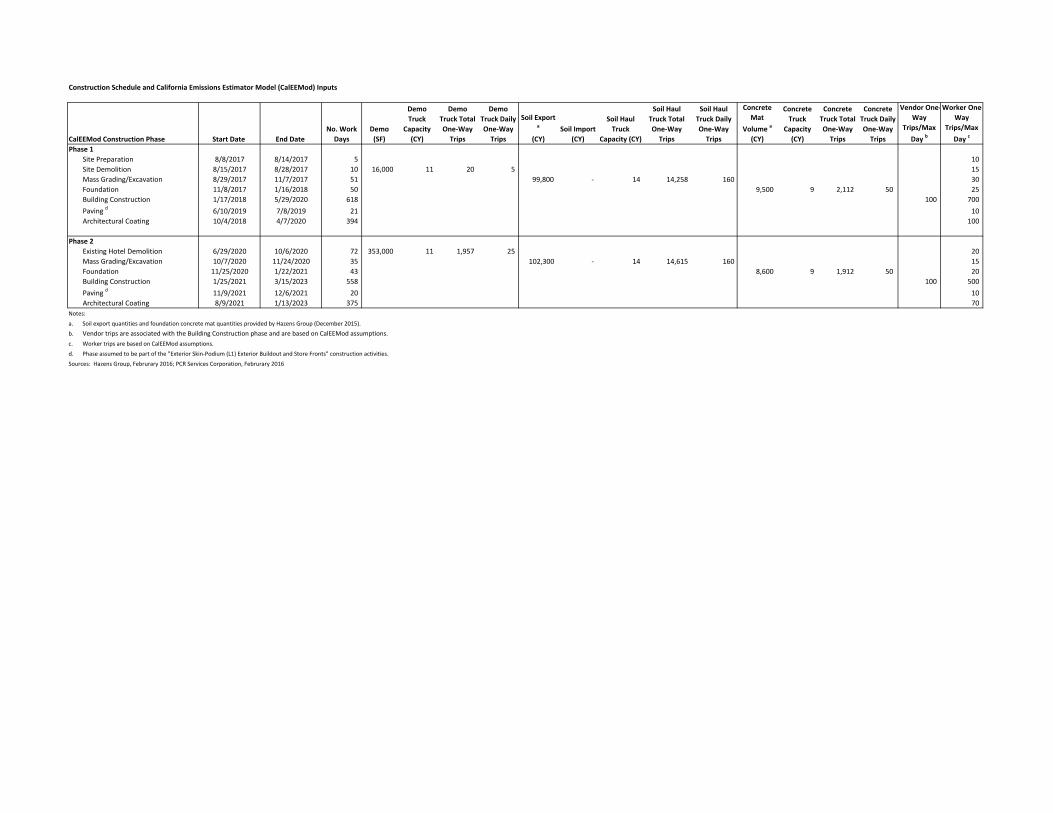
Construction Schedule and California Emissions Estimator Model (CalEEMod) Inputs
CalEEMod Construction Phase Start Date End Date No. Work Days
Demo (SF)
Demo Truck
Capacity (CY)
Demo Truck Total One‐Way Trips
Demo Truck Daily One‐Way Trips
Soil Export a
(CY)Soil Import
(CY)
Soil Haul Truck
Capacity (CY)
Soil Haul Truck Total One‐Way Trips
Soil Haul Truck Daily One‐Way Trips
Concrete Mat
Volume a
(CY)
Concrete Truck
Capacity (CY)
Concrete Truck Total One‐Way Trips
Concrete Truck Daily One‐Way Trips
Vendor One‐Way
Trips/Max Day b
Worker One‐Way
Trips/Max Day c
Phase 1Site Preparation 8/8/2017 8/14/2017 5 10 Site Demolition 8/15/2017 8/28/2017 10 16,000 11 20 5 15 Mass Grading/Excavation 8/29/2017 11/7/2017 51 99,800 ‐ 14 14,258 160 30 Foundation 11/8/2017 1/16/2018 50 9,500 9 2,112 50 25 Building Construction 1/17/2018 5/29/2020 618 100 700 Paving d 6/10/2019 7/8/2019 21 10 Architectural Coating 10/4/2018 4/7/2020 394 100
Phase 2Existing Hotel Demolition 6/29/2020 10/6/2020 72 353,000 11 1,957 25 20 Mass Grading/Excavation 10/7/2020 11/24/2020 35 102,300 ‐ 14 14,615 160 15 Foundation 11/25/2020 1/22/2021 43 8,600 9 1,912 50 20 Building Construction 1/25/2021 3/15/2023 558 100 500 Paving d 11/9/2021 12/6/2021 20 10 Architectural Coating 8/9/2021 1/13/2023 375 70
Notes:
a. Soil export quantities and foundation concrete mat quantities provided by Hazens Group (December 2015).
b. Vendor trips are associated with the Building Construction phase and are based on CalEEMod assumptions.c. Worker trips are based on CalEEMod assumptions.
d. Phase assumed to be part of the "Exterior Skin‐Podium (L1) Exterior Buildout and Store Fronts" construction activities.
Sources: Hazens Group, Februrary 2016; PCR Services Corporation, Februrary 2016
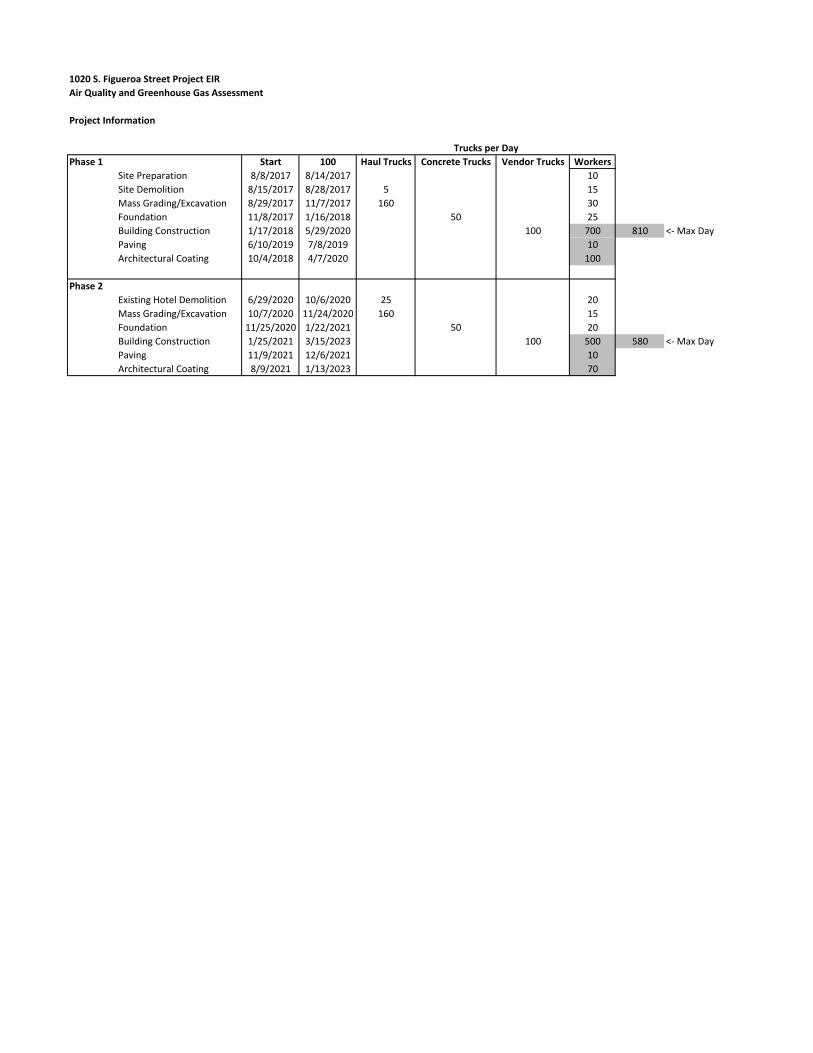
1020 S. Figueroa Street Project EIRAir Quality and Greenhouse Gas Assessment
Project Information
Phase 1 Start 100 Haul Trucks Concrete Trucks Vendor Trucks WorkersSite Preparation 8/8/2017 8/14/2017 10Site Demolition 8/15/2017 8/28/2017 5 15Mass Grading/Excavation 8/29/2017 11/7/2017 160 30Foundation 11/8/2017 1/16/2018 50 25Building Construction 1/17/2018 5/29/2020 100 700 810 <‐ Max DayPaving 6/10/2019 7/8/2019 10Architectural Coating 10/4/2018 4/7/2020 100
Phase 2Existing Hotel Demolition 6/29/2020 10/6/2020 25 20Mass Grading/Excavation 10/7/2020 11/24/2020 160 15Foundation 11/25/2020 1/22/2021 50 20Building Construction 1/25/2021 3/15/2023 100 500 580 <‐ Max DayPaving 11/9/2021 12/6/2021 10Architectural Coating 8/9/2021 1/13/2023 70
Trucks per Day
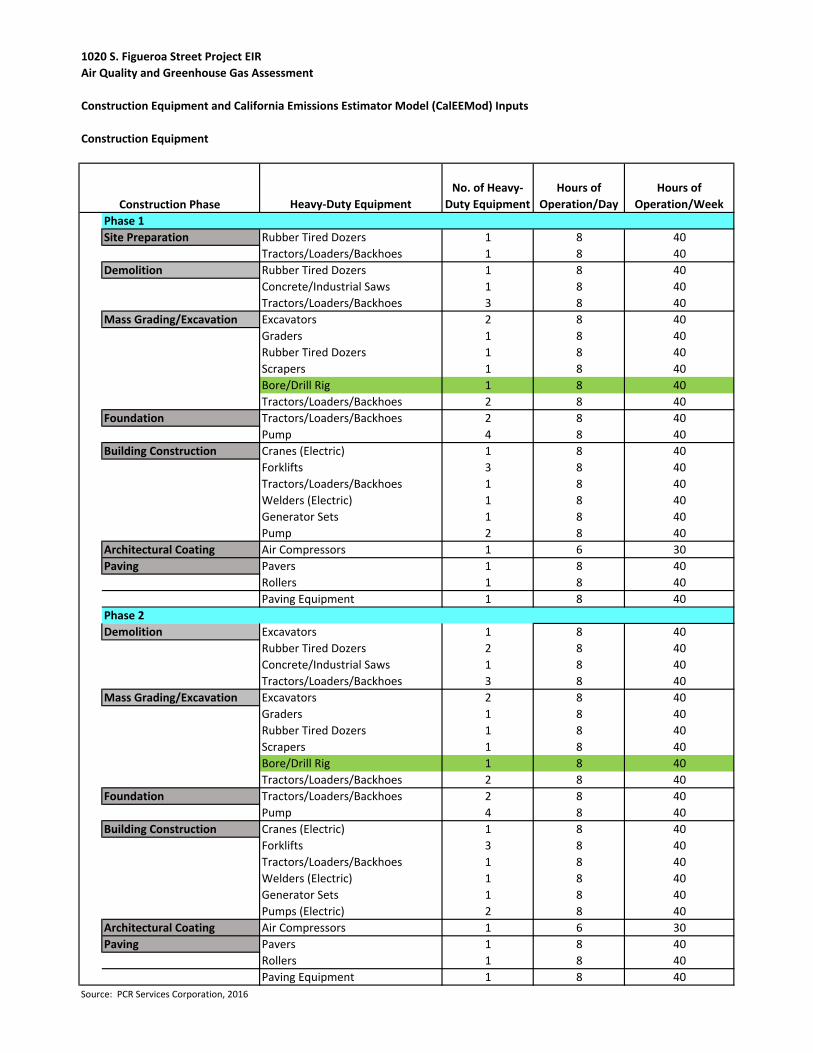
1020 S. Figueroa Street Project EIRAir Quality and Greenhouse Gas Assessment
Construction Equipment and California Emissions Estimator Model (CalEEMod) Inputs
Construction Equipment
Heavy‐Duty EquipmentNo. of Heavy‐
Duty EquipmentHours of
Operation/DayHours of
Operation/WeekPhase 1Site Preparation Rubber Tired Dozers 1 8 40
Tractors/Loaders/Backhoes 1 8 40Demolition Rubber Tired Dozers 1 8 40
Concrete/Industrial Saws 1 8 40Tractors/Loaders/Backhoes 3 8 40
Mass Grading/Excavation Excavators 2 8 40Graders 1 8 40Rubber Tired Dozers 1 8 40Scrapers 1 8 40Bore/Drill Rig 1 8 40Tractors/Loaders/Backhoes 2 8 40
Foundation Tractors/Loaders/Backhoes 2 8 40Pump 4 8 40
Building Construction Cranes (Electric) 1 8 40Forklifts 3 8 40Tractors/Loaders/Backhoes 1 8 40Welders (Electric) 1 8 40Generator Sets 1 8 40Pump 2 8 40
Architectural Coating Air Compressors 1 6 30Paving Pavers 1 8 40
Rollers 1 8 40Paving Equipment 1 8 40
Phase 2Demolition Excavators 1 8 40
Rubber Tired Dozers 2 8 40Concrete/Industrial Saws 1 8 40Tractors/Loaders/Backhoes 3 8 40
Mass Grading/Excavation Excavators 2 8 40Graders 1 8 40Rubber Tired Dozers 1 8 40Scrapers 1 8 40Bore/Drill Rig 1 8 40Tractors/Loaders/Backhoes 2 8 40
Foundation Tractors/Loaders/Backhoes 2 8 40Pump 4 8 40
Building Construction Cranes (Electric) 1 8 40Forklifts 3 8 40Tractors/Loaders/Backhoes 1 8 40Welders (Electric) 1 8 40Generator Sets 1 8 40Pumps (Electric) 2 8 40
Architectural Coating Air Compressors 1 6 30Paving Pavers 1 8 40
Rollers 1 8 40Paving Equipment 1 8 40
Source: PCR Services Corporation, 2016
Construction Phase
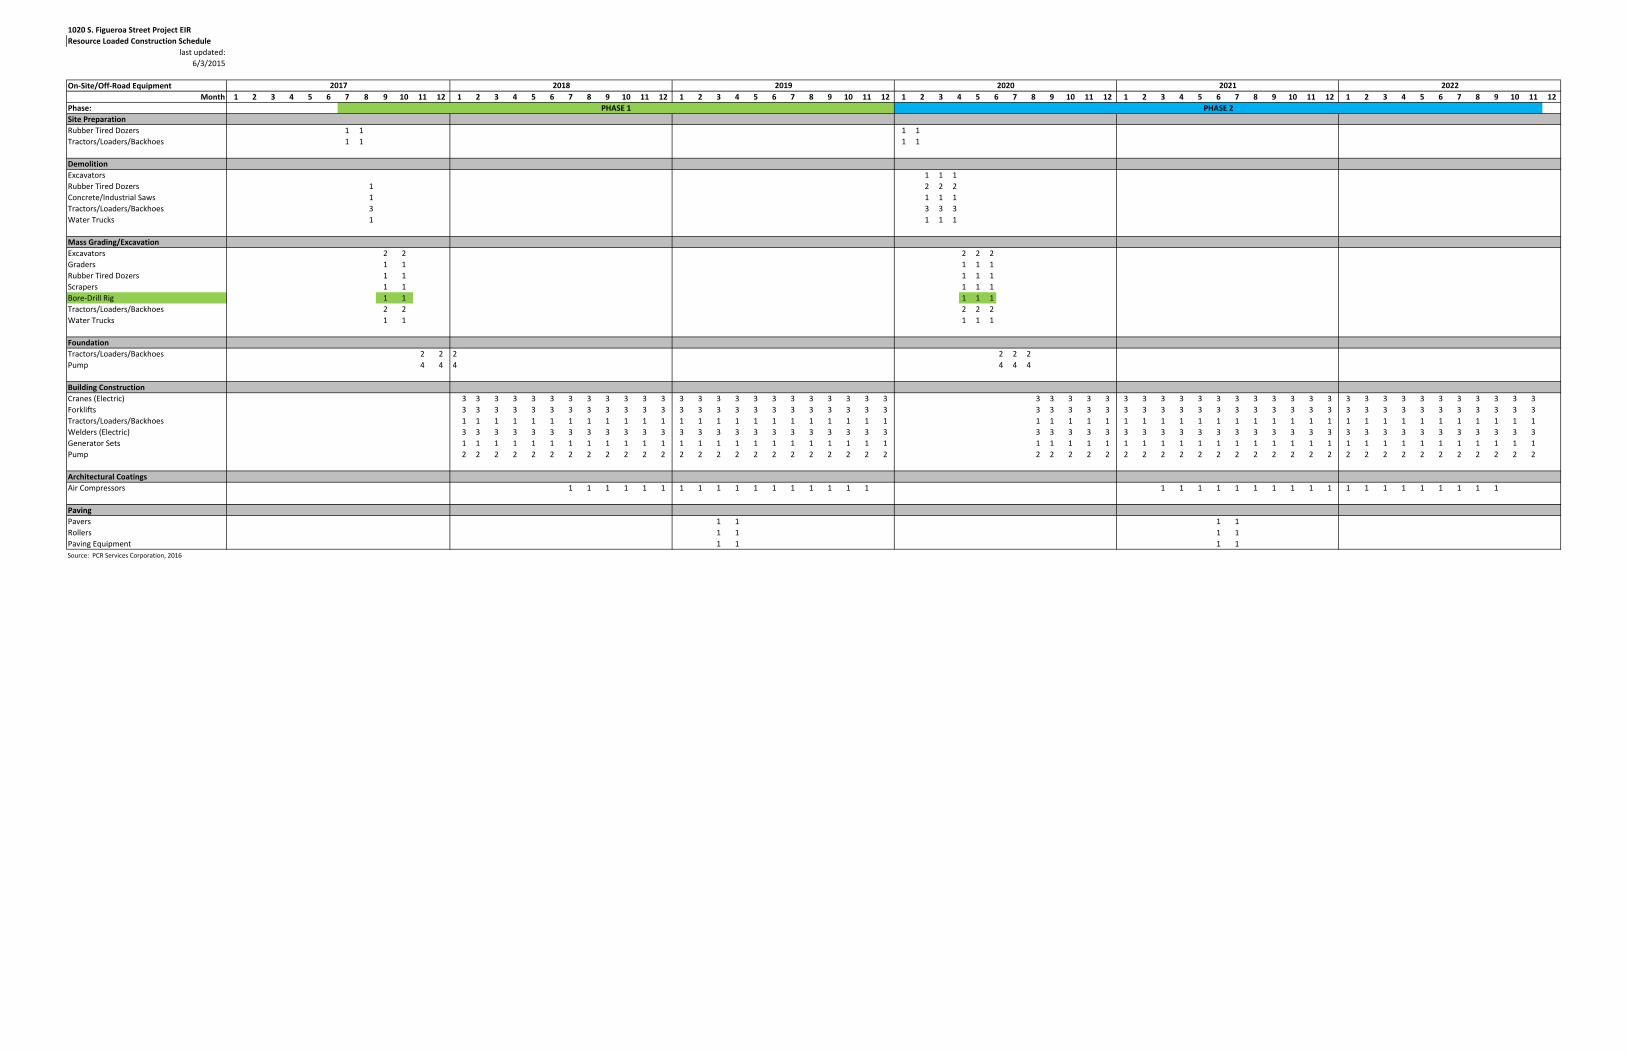
1020 S. Figueroa Street Project EIRResource Loaded Construction Schedule
last updated:6/3/2015
On‐Site/Off‐Road EquipmentMonth 1 2 3 4 5 6 7 9 10 11 12 2 3 4 5 6 7 8 9 10 11 12 1 2 3 4 5 6 7 8 9 10 11 12 1 3 5 7 9 10 11 12 1 2 3 4 5 6 7 8 9 10 11 12 1 2 3 4 5 6 7 8 9 10 11 12
Phase: PHASE 1 PHASE 2Site PreparationRubber Tired Dozers 1 1 1 1Tractors/Loaders/Backhoes 1 1 1 1
DemolitionExcavators 1 1 1Rubber Tired Dozers 1 2 2 2Concrete/Industrial Saws 1 1 1 1Tractors/Loaders/Backhoes 3 3 3 3Water Trucks 1 1 1 1
Mass Grading/ExcavationExcavators 2 2 2 2 2Graders 1 1 1 1 1Rubber Tired Dozers 1 1 1 1 1Scrapers 1 1 1 1 1Bore‐Drill Rig 1 1 1 1 1Tractors/Loaders/Backhoes 2 2 2 2 2Water Trucks 1 1 1 1 1
FoundationTractors/Loaders/Backhoes 2 2 2 2 2 2Pump 4 4 4 4 4 4
Building ConstructionCranes (Electric) 3 3 3 3 3 3 3 3 3 3 3 3 3 3 3 3 3 3 3 3 3 3 3 3 3 3 3 3 3 3 3 3 3 3 3 3 3 3 3 3 3 3 3 3 3 3 3 3 3 3 3 3Forklifts 3 3 3 3 3 3 3 3 3 3 3 3 3 3 3 3 3 3 3 3 3 3 3 3 3 3 3 3 3 3 3 3 3 3 3 3 3 3 3 3 3 3 3 3 3 3 3 3 3 3 3 3Tractors/Loaders/Backhoes 1 1 1 1 1 1 1 1 1 1 1 1 1 1 1 1 1 1 1 1 1 1 1 1 1 1 1 1 1 1 1 1 1 1 1 1 1 1 1 1 1 1 1 1 1 1 1 1 1 1 1 1Welders (Electric) 3 3 3 3 3 3 3 3 3 3 3 3 3 3 3 3 3 3 3 3 3 3 3 3 3 3 3 3 3 3 3 3 3 3 3 3 3 3 3 3 3 3 3 3 3 3 3 3 3 3 3 3Generator Sets 1 1 1 1 1 1 1 1 1 1 1 1 1 1 1 1 1 1 1 1 1 1 1 1 1 1 1 1 1 1 1 1 1 1 1 1 1 1 1 1 1 1 1 1 1 1 1 1 1 1 1 1Pump 2 2 2 2 2 2 2 2 2 2 2 2 2 2 2 2 2 2 2 2 2 2 2 2 2 2 2 2 2 2 2 2 2 2 2 2 2 2 2 2 2 2 2 2 2 2 2 2 2 2 2 2
Architectural CoatingsAir Compressors 1 1 1 1 1 1 1 1 1 1 1 1 1 1 1 1 1 1 1 1 1 1 1 1 1 1 1 1 1 1 1 1 1 1 1 1
Paving Pavers 1 1 1 1Rollers 1 1 1 1Paving Equipment 1 1 1 1Source: PCR Services Corporation, 2016
2019 20208 1 2 4 6 8
2021 20222017 2018

1020 S. Figueroa Street Project EIRAir Quality and Greenhouse Gas Assessment
Construction Equipment and California Emissions Estimator Model (CalEEMod) Inputs
Architectural Coating Area Calculations
CalEEMod assumes the total surface for architectural coating equals:
Residential Coating Area 2.7 times the floor square footage75% interior25% exterior
Nonresidential Coating Area 2 times the square footage75% interior25% exterior
Parking Lot Coating Area 6% of the square footage0% exterior for subterranean
Source: SCAQMD, CEQA Air Quality Handbook, (1993) A9‐124.
Phase 1
Area (sf) Interior (sf) Exterior (sf)Residential 352,000 712,800 237,600
Total Residential 712,800 237,600 ENTER VALUES ABOVE INTO CALEEMOD
Area (sf) Interior (sf) Exterior (sf)Hotel 280,000 420,000 140,000 Commercial 15,000 22,500 7,500 Quality Restaurant 15,000 900 7,500 Above‐Grade Parking Structure ‐ ‐ ‐ Subterranean Parking Structure 174,800 10,488 ‐
Total Non‐Residential 453,888 155,000 ENTER VALUES ABOVE INTO CALEEMOD
Non‐Residential Land Uses
Residential Land UsesLand Use
Land Use

Phase 2
Area (sf) Interior (sf) Exterior (sf)Residential 418,000 846,450 282,150
Total Residential 846,450 282,150
Area (sf) Interior (sf) Exterior (sf)Commercial 25,100 37,650 12,550 Quality Restaurant 25,100 37,650 12,550 Above‐Grade Parking Structure ‐ ‐ ‐ Subterranean Parking Structure 144,800 8,688 ‐
Total Non‐Residential 83,988 25,100 ENTER VALUES ABOVE INTO CALEEMOD
Land Use
Residential Land UsesLand Use
Non‐Residential Land Uses
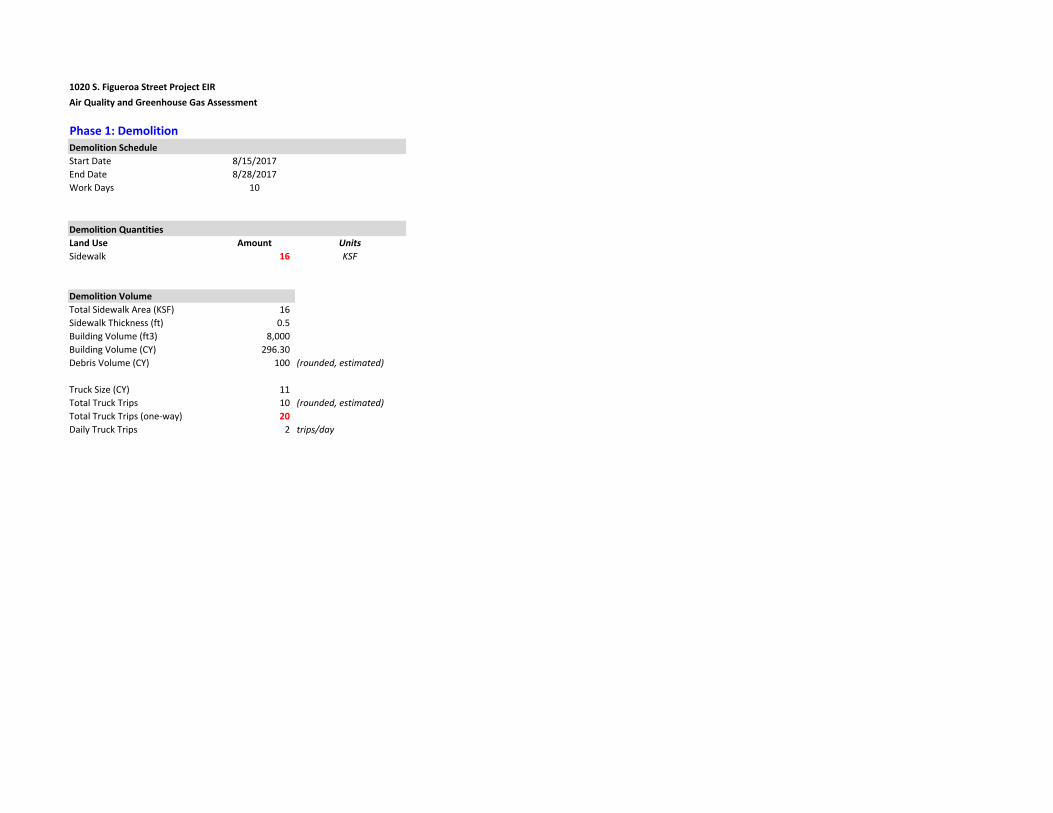
1020 S. Figueroa Street Project EIRAir Quality and Greenhouse Gas Assessment
Phase 1: DemolitionDemolition ScheduleStart Date 8/15/2017End Date 8/28/2017Work Days 10
Demolition QuantitiesLand Use Amount UnitsSidewalk 16 KSF
Demolition VolumeTotal Sidewalk Area (KSF) 16 Sidewalk Thickness (ft) 0.5 Building Volume (ft3) 8,000 Building Volume (CY) 296.30 Debris Volume (CY) 100 (rounded, estimated)
Truck Size (CY) 11 Total Truck Trips 10 (rounded, estimated)Total Truck Trips (one‐way) 20 Daily Truck Trips 2 trips/day
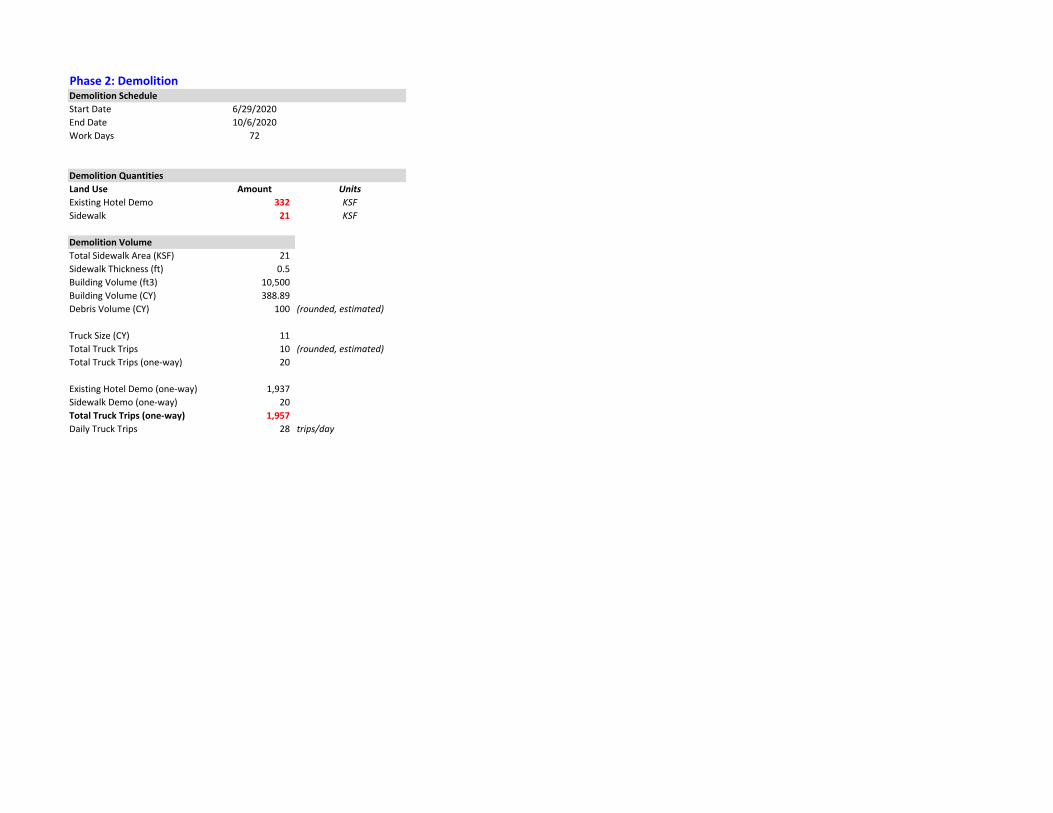
Phase 2: DemolitionDemolition ScheduleStart Date 6/29/2020End Date 10/6/2020Work Days 72
Demolition QuantitiesLand Use Amount UnitsExisting Hotel Demo 332 KSFSidewalk 21 KSF
Demolition VolumeTotal Sidewalk Area (KSF) 21 Sidewalk Thickness (ft) 0.5 Building Volume (ft3) 10,500 Building Volume (CY) 388.89 Debris Volume (CY) 100 (rounded, estimated)
Truck Size (CY) 11 Total Truck Trips 10 (rounded, estimated)Total Truck Trips (one‐way) 20
Existing Hotel Demo (one‐way) 1,937 Sidewalk Demo (one‐way) 20 Total Truck Trips (one‐way) 1,957 Daily Truck Trips 28 trips/day

Off-road Equipment - See "Hazen AQ Construction Model Inputs"
1.3 User Entered Comments & Non-Default Data
Project Characteristics -
Land Use - See "Hazen AQ Construction Model Inputs"
Construction Phase - See "Hazen AQ Construction Model Inputs"
Off-road Equipment -
Off-road Equipment - See "Hazen AQ Construction Model Inputs"
CO2 Intensity (lb/MWhr)
1227.89 CH4 Intensity (lb/MWhr)
0.029 N2O Intensity (lb/MWhr)
0.006
31
Climate Zone 11 Operational Year 2020
Utility Company Los Angeles Department of Water & Power
1.2 Other Project Characteristics
Urbanization Urban Wind Speed (m/s) 2.2 Precipitation Freq (Days)
Strip Mall 15.00 1000sqft 0.34 15,000.00 0
Apartments High Rise 290.00 Dwelling Unit 4.68 352,000.00 829
Quality Restaurant 15.00 1000sqft 0.34 15,000.00 0
Hotel 300.00 Room 10.00 280,000.00 0
City Park 0.47 Acre 0.67 20,300.00 0
Population
Enclosed Parking with Elevator 437.00 Space 3.93 174,800.00 0
1.1 Land Usage
Land Uses Size Metric Lot Acreage Floor Surface Area
CalEEMod Version: CalEEMod.2013.2.2 Page 1 of 1 Date: 4/19/2016 12:13 PM
LUXE Hotel - Phase 1 ConstructionSouth Coast Air Basin, Annual
1.0 Project Characteristics

tblConstEquipMitigation NumberOfEquipmentMitigated 0.00 1.00
tblConstEquipMitigation NumberOfEquipmentMitigated 0.00 1.00
tblConstEquipMitigation NumberOfEquipmentMitigated 0.00 1.00
tblConstEquipMitigation NumberOfEquipmentMitigated 0.00 3.00
tblConstEquipMitigation NumberOfEquipmentMitigated 0.00 1.00
tblConstEquipMitigation NumberOfEquipmentMitigated 0.00 1.00
tblConstEquipMitigation NumberOfEquipmentMitigated 0.00 2.00
tblConstEquipMitigation NumberOfEquipmentMitigated 0.00 1.00
tblConstEquipMitigation NumberOfEquipmentMitigated 0.00 1.00
tblArchitecturalCoating ConstArea_Nonresidential_Interior 757,650.00 453,888.00
tblAreaCoating Area_Nonresidential_Interior 757650 453888
Table Name Column Name Default Value New Value
tblArchitecturalCoating ConstArea_Nonresidential_Exterior 252,550.00 155,000.00
Water And Wastewater -
Solid Waste -
Construction Off-road Equipment Mitigation - See "Hazen AQ Construction Model Inputs"
Area Mitigation -
Energy Mitigation -
Water Mitigation -
Demolition - See "Hazen AQ Construction Model Inputs"
Grading - See "Hazen AQ Construction Model Inputs"
Architectural Coating - See "Hazen AQ Construction Model Inputs"
Vehicle Trips -
Woodstoves - No hearths
Area Coating - Parking lot square footage adjustment in AQ Construction Model Inputs
Off-road Equipment - See "Hazen AQ Construction Model Inputs"
Off-road Equipment - See "Hazen AQ Construction Model Inputs"
Off-road Equipment - See "Hazen AQ Construction Model Inputs"
Off-road Equipment - See "Hazen AQ Construction Model Inputs"
Trips and VMT - See "Hazen AQ Construction Model Inputs"
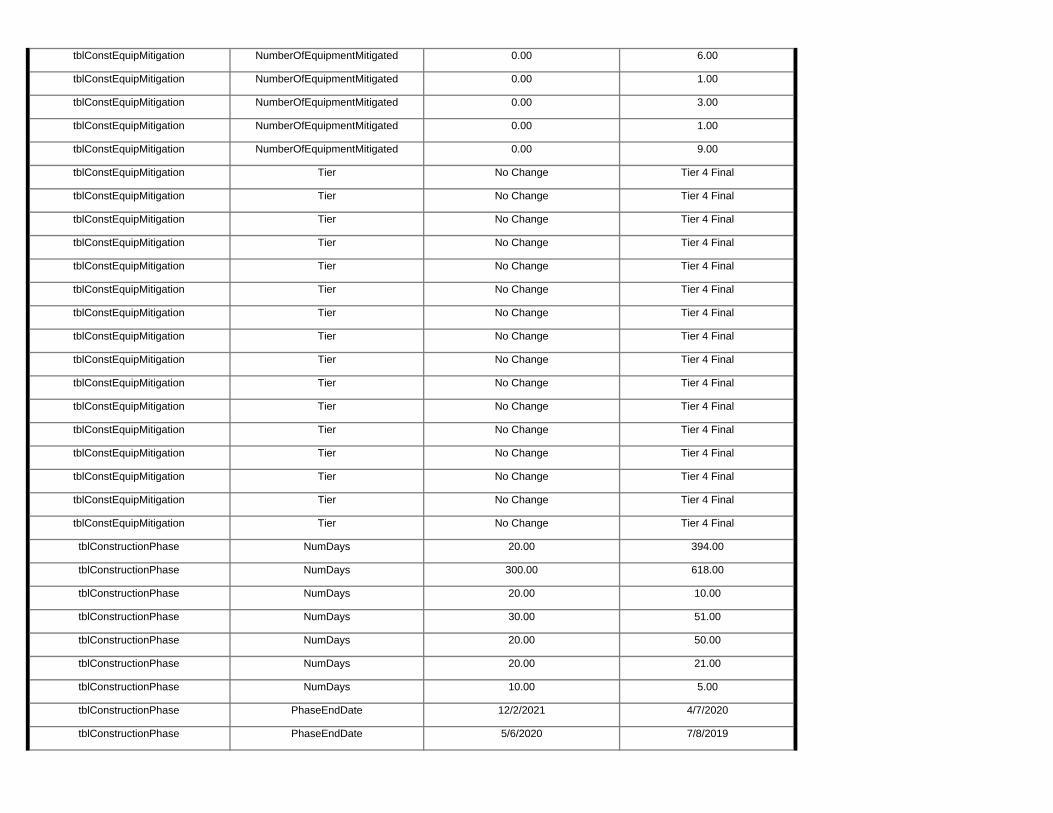
tblConstructionPhase PhaseEndDate 5/6/2020 7/8/2019
tblConstructionPhase NumDays 10.00 5.00
tblConstructionPhase PhaseEndDate 12/2/2021 4/7/2020
tblConstructionPhase NumDays 20.00 50.00
tblConstructionPhase NumDays 20.00 21.00
tblConstructionPhase NumDays 20.00 10.00
tblConstructionPhase NumDays 30.00 51.00
tblConstructionPhase NumDays 20.00 394.00
tblConstructionPhase NumDays 300.00 618.00
tblConstEquipMitigation Tier No Change Tier 4 Final
tblConstEquipMitigation Tier No Change Tier 4 Final
tblConstEquipMitigation Tier No Change Tier 4 Final
tblConstEquipMitigation Tier No Change Tier 4 Final
tblConstEquipMitigation Tier No Change Tier 4 Final
tblConstEquipMitigation Tier No Change Tier 4 Final
tblConstEquipMitigation Tier No Change Tier 4 Final
tblConstEquipMitigation Tier No Change Tier 4 Final
tblConstEquipMitigation Tier No Change Tier 4 Final
tblConstEquipMitigation Tier No Change Tier 4 Final
tblConstEquipMitigation Tier No Change Tier 4 Final
tblConstEquipMitigation Tier No Change Tier 4 Final
tblConstEquipMitigation Tier No Change Tier 4 Final
tblConstEquipMitigation Tier No Change Tier 4 Final
tblConstEquipMitigation Tier No Change Tier 4 Final
tblConstEquipMitigation Tier No Change Tier 4 Final
tblConstEquipMitigation NumberOfEquipmentMitigated 0.00 1.00
tblConstEquipMitigation NumberOfEquipmentMitigated 0.00 9.00
tblConstEquipMitigation NumberOfEquipmentMitigated 0.00 1.00
tblConstEquipMitigation NumberOfEquipmentMitigated 0.00 3.00
tblConstEquipMitigation NumberOfEquipmentMitigated 0.00 6.00

tblTripsAndVMT WorkerTripNumber 13.00 15.00
tblTripsAndVMT VendorTripNumber 114.00 0.00
tblTripsAndVMT WorkerTripNumber 5.00 10.00
tblTripsAndVMT HaulingTripNumber 73.00 0.00
tblTripsAndVMT HaulingTripNumber 12,475.00 0.00
tblOffRoadEquipment UsageHours 7.00 8.00
tblProjectCharacteristics OperationalYear 2014 2020
tblOffRoadEquipment OffRoadEquipmentUnitAmount 1.00 0.00
tblOffRoadEquipment UsageHours 7.00 8.00
tblOffRoadEquipment OffRoadEquipmentUnitAmount 3.00 1.00
tblOffRoadEquipment OffRoadEquipmentUnitAmount 4.00 1.00
tblOffRoadEquipment OffRoadEquipmentUnitAmount 3.00 1.00
tblOffRoadEquipment OffRoadEquipmentUnitAmount 2.00 1.00
tblOffRoadEquipment OffRoadEquipmentUnitAmount 2.00 1.00
tblOffRoadEquipment OffRoadEquipmentUnitAmount 2.00 1.00
tblOffRoadEquipment OffRoadEquipmentUnitAmount 2.00 1.00
tblOffRoadEquipment OffRoadEquipmentUnitAmount 2.00 0.00
tblOffRoadEquipment OffRoadEquipmentUnitAmount 2.00 1.00
tblOffRoadEquipment OffRoadEquipmentUnitAmount 2.00 0.00
tblOffRoadEquipment OffRoadEquipmentUnitAmount 3.00 0.00
tblOffRoadEquipment OffRoadEquipmentUnitAmount 2.00 0.00
tblLandUse LotAcreage 0.47 0.67
tblOffRoadEquipment OffRoadEquipmentUnitAmount 1.00 0.00
tblLandUse LandUseSquareFeet 435,600.00 280,000.00
tblLandUse LandUseSquareFeet 290,000.00 352,000.00
tblGrading MaterialExported 0.00 99,800.00
tblLandUse LandUseSquareFeet 20,473.20 20,300.00
tblConstructionPhase PhaseStartDate 4/8/2020 6/10/2019
tblGrading AcresOfGrading 76.50 2.70
tblConstructionPhase PhaseStartDate 5/30/2020 10/4/2018

0.0000 3,208.3004
3,208.3004 0.2712 0.0000 3,213.9945
2.7903 0.5557 3.3460 0.7872 0.5340 1.3212Total 6.5772 9.4728 18.5397 0.0435
0.0000 499.6637 499.6637 0.0352 0.0000 500.40320.4531 0.0632 0.5164 0.1203 0.0612 0.18152020 1.0963 1.1211 2.7489 7.1300e-003
0.0000 1,311.8354
1,311.8354 0.0956 0.0000 1,313.8421
1.1466 0.1853 1.3318 0.3045 0.1792 0.48372019 3.8744 3.1380 7.3528 0.0181
0.0000 1,184.2230
1,184.2230 0.0887 0.0000 1,186.0849
0.9924 0.1931 1.1854 0.2636 0.1867 0.45022018 1.3964 3.0982 6.8623 0.0159
0.0000 212.5783 212.5783 0.0517 0.0000 213.66430.1983 0.1141 0.3124 0.0988 0.1070 0.20582017 0.2101 2.1155 1.5757 2.3700e-003
NBio- CO2
Total CO2 CH4 N2O CO2e
Year tons/yr MT/yr
Exhaust PM10
PM10 Total
Fugitive PM2.5
Exhaust PM2.5
PM2.5 Total
Bio- CO2
2.0 Emissions Summary2.1 Overall ConstructionUnmitigated Construction
ROG NOx CO SO2 Fugitive PM10
tblTripsAndVMT WorkerTripNumber 84.00 100.00
tblTripsAndVMT WorkerTripNumber 8.00 10.00
tblTripsAndVMT WorkerTripNumber 15.00 25.00
tblTripsAndVMT WorkerTripNumber 419.00 700.00
tblTripsAndVMT WorkerTripNumber 20.00 30.00

217 Paving Paving 6/10/2019 7/8/2019 5
618
6 Architectural Coating Architectural Coating 10/4/2018 4/7/2020 5 394
5 Building Construction Building Construction 1/17/2018 5/29/2020 5
51
4 Foundation Paving 11/8/2017 1/16/2018 5 50
3 Grading Grading 8/29/2017 11/7/2017 5
5
2 Demolition Demolition 8/15/2017 8/28/2017 5 10
End Date Num Days Week
Num Days Phase Description
1 Site Preparation Site Preparation 8/8/2017 8/14/2017 5
3.0 Construction Detail
Construction Phase
Phase Number
Phase Name Phase Type Start Date
0.00 0.00 0.00 0.00 0.00 0.004.01 93.30 18.84 7.35 93.31 42.10
NBio-CO2 Total CO2 CH4 N20 CO2e
Percent Reduction
12.57 82.93 -0.33 0.00
Exhaust PM10
PM10 Total
Fugitive PM2.5
Exhaust PM2.5
PM2.5 Total
Bio- CO2ROG NOx CO SO2 Fugitive PM10
0.0000 3,208.2991
3,208.2991 0.2712 0.0000 3,213.9933
2.6783 0.0372 2.7156 0.7293 0.0357 0.7650Total 5.7503 1.6170 18.6016 0.0435
0.0000 499.6636 499.6636 0.0352 0.0000 500.40310.4531 5.7700e-003
0.4589 0.1203 5.5100e-003
0.12592020 1.0027 0.2421 2.8000 7.1300e-003
0.0000 1,311.8349
1,311.8349 0.0956 0.0000 1,313.8417
1.1466 0.0148 1.1613 0.3045 0.0141 0.31862019 3.6019 0.6503 7.4727 0.0181
0.0000 1,184.2227
1,184.2227 0.0887 0.0000 1,186.0845
0.9924 0.0132 1.0055 0.2636 0.0126 0.27612018 1.1153 0.6065 6.9508 0.0159
0.0000 212.5780 212.5780 0.0517 0.0000 213.66400.0863 3.5300e-003
0.0898 0.0409 3.5300e-003
0.04442017 0.0304 0.1181 1.3781 2.3700e-003
Total CO2 CH4 N2O CO2e
Year tons/yr MT/yr
PM10 Total
Fugitive PM2.5
Exhaust PM2.5
PM2.5 Total
Bio- CO2 NBio- CO2
Mitigated Construction
ROG NOx CO SO2 Fugitive PM10
Exhaust PM10

Building Construction Welders 0 8.00 46 0.45
Building Construction Tractors/Loaders/Backhoes 1 8.00 97 0.37
Building Construction Pumps 2 8.00 84 0.74
Building Construction Generator Sets 1 8.00 84 0.74
Building Construction Forklifts 3 8.00 89 0.20
Building Construction Cranes 0 8.00 226 0.29
Foundation Tractors/Loaders/Backhoes 2 8.00 97 0.37
Foundation Rollers 0 8.00 80 0.38
Foundation Pumps 4 8.00 84 0.74
Foundation Paving Equipment 0 8.00 130 0.36
Foundation Pavers 0 8.00 125 0.42
Grading Tractors/Loaders/Backhoes 2 8.00 97 0.37
Grading Scrapers 1 8.00 361 0.48
Grading Rubber Tired Dozers 1 8.00 255 0.40
Grading Graders 1 8.00 174 0.41
Grading Excavators 2 8.00 162 0.38
Grading Bore/Drill Rigs 1 8.00 205 0.50
Demolition Tractors/Loaders/Backhoes 3 8.00 97 0.37
Demolition Rubber Tired Dozers 1 8.00 255 0.40
Demolition Excavators 0 8.00 162 0.38
Demolition Concrete/Industrial Saws 1 8.00 81 0.73
Site Preparation Tractors/Loaders/Backhoes 1 8.00 97 0.37
Load Factor
Site Preparation Rubber Tired Dozers 1 8.00 255 0.40
OffRoad Equipment
Phase Name Offroad Equipment Type Amount Usage Hours Horse Power
Acres of Grading (Site Preparation Phase): 0
Acres of Grading (Grading Phase): 2.7
Acres of Paving: 0
Residential Indoor: 712,800; Residential Outdoor: 237,600; Non-Residential Indoor: 453,888; Non-Residential Outdoor: 155,000

Use Cleaner Engines for Construction Equipment
Use Soil Stabilizer
Water Exposed Area
Reduce Vehicle Speed on Unpaved Roads
Clean Paved Roads
6.90 20.00 LD_Mix HDT_Mix HHDT
3.1 Mitigation Measures Construction
Paving 3 10.00 0.00 0.00 14.70
14.70 6.90 20.00 LD_Mix HDT_Mix HHDT
6.90 20.00 LD_Mix HDT_Mix HHDT
Architectural Coating 1 100.00 0.00 0.00
Building Construction 7 700.00 0.00 0.00 14.70
14.70 6.90 20.00 LD_Mix HDT_Mix HHDT
6.90 20.00 LD_Mix HDT_Mix HHDT
Foundation 6 25.00 0.00 0.00
Grading 8 30.00 0.00 0.00 14.70
14.70 6.90 20.00 LD_Mix HDT_Mix HHDT
6.90 20.00 LD_Mix HDT_Mix HHDT
Demolition 5 15.00 0.00 0.00
Site Preparation 2 10.00 0.00 0.00 14.70
Worker Trip Length
Vendor Trip Length
Hauling Trip Length
Worker Vehicle Class
Vendor Vehicle Class
Hauling Vehicle Class
Trips and VMT
Phase Name Offroad Equipment Count
Worker Trip Number
Vendor Trip Number
Hauling Trip Number
Paving Rollers 1 8.00 80 0.38
Paving Paving Equipment 1 8.00 130 0.36
Paving Pavers 1 8.00 125 0.42
Architectural Coating Air Compressors 1 6.00 78 0.48
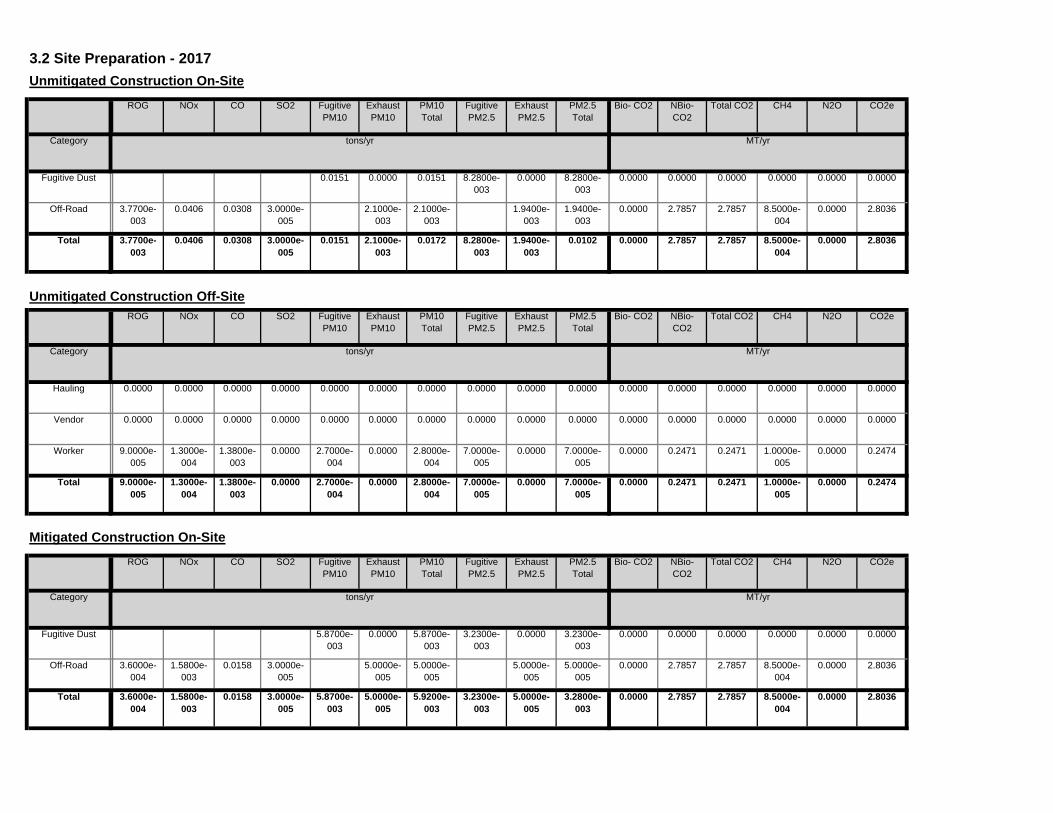
0.0000 2.7857 2.7857 8.5000e-004
0.0000 2.80365.8700e-003
5.0000e-005
5.9200e-003
3.2300e-003
5.0000e-005
3.2800e-003
Total 3.6000e-004
1.5800e-003
0.0158 3.0000e-005
0.0000 2.7857 2.7857 8.5000e-004
0.0000 2.80365.0000e-005
5.0000e-005
5.0000e-005
5.0000e-005
Off-Road 3.6000e-004
1.5800e-003
0.0158 3.0000e-005
0.0000 0.0000 0.0000 0.0000 0.0000 0.00005.8700e-003
0.0000 5.8700e-003
3.2300e-003
0.0000 3.2300e-003
Fugitive Dust
Total CO2 CH4 N2O CO2e
Category tons/yr MT/yr
PM10 Total
Fugitive PM2.5
Exhaust PM2.5
PM2.5 Total
Bio- CO2 NBio- CO2
Mitigated Construction On-Site
ROG NOx CO SO2 Fugitive PM10
Exhaust PM10
0.0000 0.2471 0.2471 1.0000e-005
0.0000 0.24742.7000e-004
0.0000 2.8000e-004
7.0000e-005
0.0000 7.0000e-005
Total 9.0000e-005
1.3000e-004
1.3800e-003
0.0000
0.0000 0.2471 0.2471 1.0000e-005
0.0000 0.24742.7000e-004
0.0000 2.8000e-004
7.0000e-005
0.0000 7.0000e-005
Worker 9.0000e-005
1.3000e-004
1.3800e-003
0.0000
0.0000 0.0000 0.0000 0.0000 0.0000 0.00000.0000 0.0000 0.0000 0.0000 0.0000 0.0000Vendor 0.0000 0.0000 0.0000 0.0000
0.0000 0.0000 0.0000 0.0000 0.0000 0.00000.0000 0.0000 0.0000 0.0000 0.0000 0.0000Hauling 0.0000 0.0000 0.0000 0.0000
Total CO2 CH4 N2O CO2e
Category tons/yr MT/yr
PM10 Total
Fugitive PM2.5
Exhaust PM2.5
PM2.5 Total
Bio- CO2 NBio- CO2
Unmitigated Construction Off-SiteROG NOx CO SO2 Fugitive
PM10Exhaust PM10
0.0000 2.7857 2.7857 8.5000e-004
0.0000 2.80360.0151 2.1000e-003
0.0172 8.2800e-003
1.9400e-003
0.0102Total 3.7700e-003
0.0406 0.0308 3.0000e-005
0.0000 2.7857 2.7857 8.5000e-004
0.0000 2.80362.1000e-003
2.1000e-003
1.9400e-003
1.9400e-003
Off-Road 3.7700e-003
0.0406 0.0308 3.0000e-005
0.0000 0.0000 0.0000 0.0000 0.0000 0.00000.0151 0.0000 0.0151 8.2800e-003
0.0000 8.2800e-003
Fugitive Dust
CH4 N2O CO2e
Category tons/yr MT/yr
Fugitive PM2.5
Exhaust PM2.5
PM2.5 Total
Bio- CO2 NBio- CO2
Total CO2
Unmitigated Construction On-Site
ROG NOx CO SO2 Fugitive PM10
Exhaust PM10
PM10 Total
3.2 Site Preparation - 2017

0.0000 11.1469 11.1469 2.8300e-003
0.0000 11.20637.8700e-003
8.0300e-003
0.0159 1.1900e-003
7.5100e-003
8.7000e-003
Total 0.0136 0.1329 0.1044 1.2000e-004
0.0000 11.1469 11.1469 2.8300e-003
0.0000 11.20638.0300e-003
8.0300e-003
7.5100e-003
7.5100e-003
Off-Road 0.0136 0.1329 0.1044 1.2000e-004
0.0000 0.0000 0.0000 0.0000 0.0000 0.00007.8700e-003
0.0000 7.8700e-003
1.1900e-003
0.0000 1.1900e-003
Fugitive Dust
Total CO2 CH4 N2O CO2e
Category tons/yr MT/yr
PM10 Total
Fugitive PM2.5
Exhaust PM2.5
PM2.5 Total
Bio- CO2 NBio- CO2
3.3 Demolition - 2017Unmitigated Construction On-Site
ROG NOx CO SO2 Fugitive PM10
Exhaust PM10
0.0000 0.2471 0.2471 1.0000e-005
0.0000 0.24742.7000e-004
0.0000 2.8000e-004
7.0000e-005
0.0000 7.0000e-005
Total 9.0000e-005
1.3000e-004
1.3800e-003
0.0000
0.0000 0.2471 0.2471 1.0000e-005
0.0000 0.24742.7000e-004
0.0000 2.8000e-004
7.0000e-005
0.0000 7.0000e-005
Worker 9.0000e-005
1.3000e-004
1.3800e-003
0.0000
0.0000 0.0000 0.0000 0.0000 0.0000 0.00000.0000 0.0000 0.0000 0.0000 0.0000 0.0000Vendor 0.0000 0.0000 0.0000 0.0000
0.0000 0.0000 0.0000 0.0000 0.0000 0.00000.0000 0.0000 0.0000 0.0000 0.0000 0.0000Hauling 0.0000 0.0000 0.0000 0.0000
Total CO2 CH4 N2O CO2e
Category tons/yr MT/yr
PM10 Total
Fugitive PM2.5
Exhaust PM2.5
PM2.5 Total
Bio- CO2 NBio- CO2
Mitigated Construction Off-Site
ROG NOx CO SO2 Fugitive PM10
Exhaust PM10

0.0000 0.7413 0.7413 4.0000e-005
0.0000 0.74218.2000e-004
1.0000e-005
8.3000e-004
2.2000e-004
1.0000e-005
2.2000e-004
Total 2.7000e-004
4.0000e-004
4.1400e-003
1.0000e-005
0.0000 0.7413 0.7413 4.0000e-005
0.0000 0.74218.2000e-004
1.0000e-005
8.3000e-004
2.2000e-004
1.0000e-005
2.2000e-004
Worker 2.7000e-004
4.0000e-004
4.1400e-003
1.0000e-005
0.0000 0.0000 0.0000 0.0000 0.0000 0.00000.0000 0.0000 0.0000 0.0000 0.0000 0.0000Vendor 0.0000 0.0000 0.0000 0.0000
0.0000 0.0000 0.0000 0.0000 0.0000 0.00000.0000 0.0000 0.0000 0.0000 0.0000 0.0000Hauling 0.0000 0.0000 0.0000 0.0000
Total CO2 CH4 N2O CO2e
Category tons/yr MT/yr
PM10 Total
Fugitive PM2.5
Exhaust PM2.5
PM2.5 Total
Bio- CO2 NBio- CO2
Mitigated Construction Off-SiteROG NOx CO SO2 Fugitive
PM10Exhaust PM10
0.0000 11.1469 11.1469 2.8300e-003
0.0000 11.20633.0700e-003
1.9000e-004
3.2600e-003
4.7000e-004
1.9000e-004
6.6000e-004
Total 1.4200e-003
6.1600e-003
0.0742 1.2000e-004
0.0000 11.1469 11.1469 2.8300e-003
0.0000 11.20631.9000e-004
1.9000e-004
1.9000e-004
1.9000e-004
Off-Road 1.4200e-003
6.1600e-003
0.0742 1.2000e-004
0.0000 0.0000 0.0000 0.0000 0.0000 0.00003.0700e-003
0.0000 3.0700e-003
4.7000e-004
0.0000 4.7000e-004
Fugitive Dust
Total CO2 CH4 N2O CO2e
Category tons/yr MT/yr
PM10 Total
Fugitive PM2.5
Exhaust PM2.5
PM2.5 Total
Bio- CO2 NBio- CO2
Mitigated Construction On-Site
ROG NOx CO SO2 Fugitive PM10
Exhaust PM10
0.0000 0.7413 0.7413 4.0000e-005
0.0000 0.74218.2000e-004
1.0000e-005
8.3000e-004
2.2000e-004
1.0000e-005
2.2000e-004
Total 2.7000e-004
4.0000e-004
4.1400e-003
1.0000e-005
0.0000 0.7413 0.7413 4.0000e-005
0.0000 0.74218.2000e-004
1.0000e-005
8.3000e-004
2.2000e-004
1.0000e-005
2.2000e-004
Worker 2.7000e-004
4.0000e-004
4.1400e-003
1.0000e-005
0.0000 0.0000 0.0000 0.0000 0.0000 0.00000.0000 0.0000 0.0000 0.0000 0.0000 0.0000Vendor 0.0000 0.0000 0.0000 0.0000
0.0000 0.0000 0.0000 0.0000 0.0000 0.00000.0000 0.0000 0.0000 0.0000 0.0000 0.0000Hauling 0.0000 0.0000 0.0000 0.0000
Total CO2 CH4 N2O CO2e
Category tons/yr MT/yr
PM10 Total
Fugitive PM2.5
Exhaust PM2.5
PM2.5 Total
Bio- CO2 NBio- CO2
Unmitigated Construction Off-Site
ROG NOx CO SO2 Fugitive PM10
Exhaust PM10
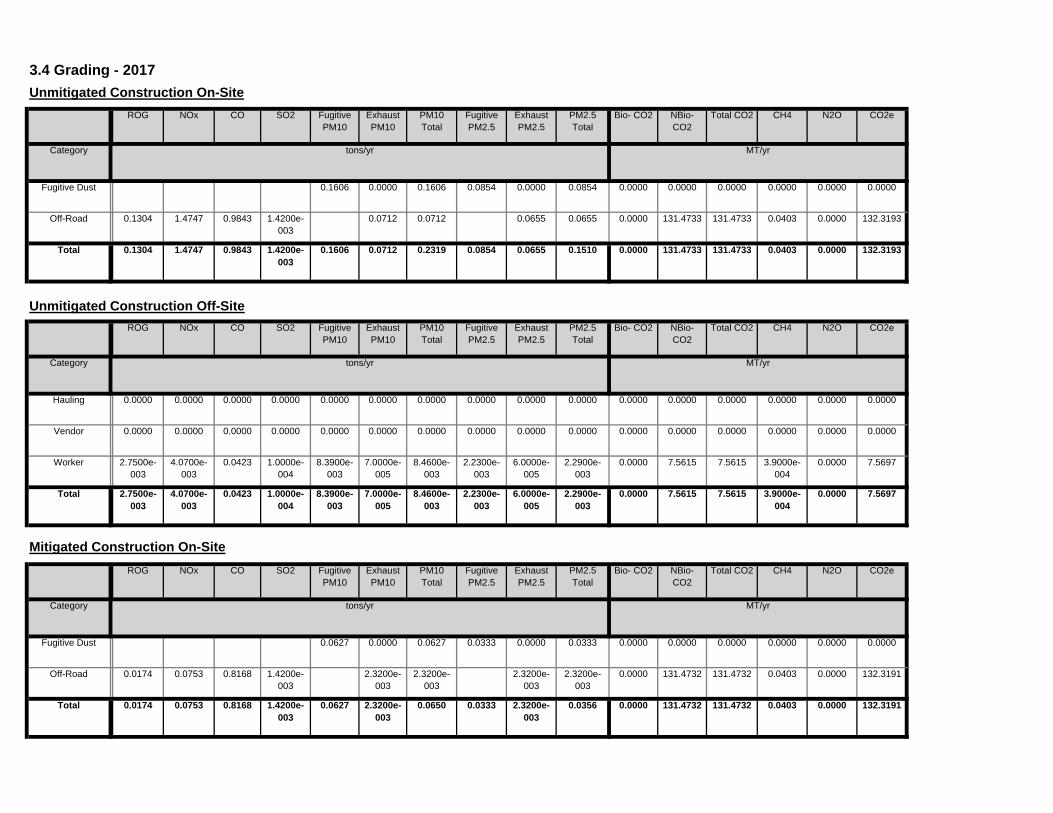
0.0000 131.4732 131.4732 0.0403 0.0000 132.31910.0627 2.3200e-003
0.0650 0.0333 2.3200e-003
0.0356Total 0.0174 0.0753 0.8168 1.4200e-003
0.0000 131.4732 131.4732 0.0403 0.0000 132.31912.3200e-003
2.3200e-003
2.3200e-003
2.3200e-003
Off-Road 0.0174 0.0753 0.8168 1.4200e-003
0.0000 0.0000 0.0000 0.0000 0.0000 0.00000.0627 0.0000 0.0627 0.0333 0.0000 0.0333Fugitive Dust
Total CO2 CH4 N2O CO2e
Category tons/yr MT/yr
PM10 Total
Fugitive PM2.5
Exhaust PM2.5
PM2.5 Total
Bio- CO2 NBio- CO2
Mitigated Construction On-SiteROG NOx CO SO2 Fugitive
PM10Exhaust PM10
0.0000 7.5615 7.5615 3.9000e-004
0.0000 7.56978.3900e-003
7.0000e-005
8.4600e-003
2.2300e-003
6.0000e-005
2.2900e-003
Total 2.7500e-003
4.0700e-003
0.0423 1.0000e-004
0.0000 7.5615 7.5615 3.9000e-004
0.0000 7.56978.3900e-003
7.0000e-005
8.4600e-003
2.2300e-003
6.0000e-005
2.2900e-003
Worker 2.7500e-003
4.0700e-003
0.0423 1.0000e-004
0.0000 0.0000 0.0000 0.0000 0.0000 0.00000.0000 0.0000 0.0000 0.0000 0.0000 0.0000Vendor 0.0000 0.0000 0.0000 0.0000
0.0000 0.0000 0.0000 0.0000 0.0000 0.00000.0000 0.0000 0.0000 0.0000 0.0000 0.0000Hauling 0.0000 0.0000 0.0000 0.0000
Total CO2 CH4 N2O CO2e
Category tons/yr MT/yr
PM10 Total
Fugitive PM2.5
Exhaust PM2.5
PM2.5 Total
Bio- CO2 NBio- CO2
Unmitigated Construction Off-SiteROG NOx CO SO2 Fugitive
PM10Exhaust PM10
0.0000 131.4733 131.4733 0.0403 0.0000 132.31930.1606 0.0712 0.2319 0.0854 0.0655 0.1510Total 0.1304 1.4747 0.9843 1.4200e-003
0.0000 131.4733 131.4733 0.0403 0.0000 132.31930.0712 0.0712 0.0655 0.0655Off-Road 0.1304 1.4747 0.9843 1.4200e-003
0.0000 0.0000 0.0000 0.0000 0.0000 0.00000.1606 0.0000 0.1606 0.0854 0.0000 0.0854Fugitive Dust
Total CO2 CH4 N2O CO2e
Category tons/yr MT/yr
PM10 Total
Fugitive PM2.5
Exhaust PM2.5
PM2.5 Total
Bio- CO2 NBio- CO2
3.4 Grading - 2017Unmitigated Construction On-Site
ROG NOx CO SO2 Fugitive PM10
Exhaust PM10

0.0000 4.6951 4.6951 2.4000e-004
0.0000 4.70025.2100e-003
4.0000e-005
5.2500e-003
1.3800e-003
4.0000e-005
1.4200e-003
Total 1.7100e-003
2.5300e-003
0.0263 6.0000e-005
0.0000 4.6951 4.6951 2.4000e-004
0.0000 4.70025.2100e-003
4.0000e-005
5.2500e-003
1.3800e-003
4.0000e-005
1.4200e-003
Worker 1.7100e-003
2.5300e-003
0.0263 6.0000e-005
0.0000 0.0000 0.0000 0.0000 0.0000 0.00000.0000 0.0000 0.0000 0.0000 0.0000 0.0000Vendor 0.0000 0.0000 0.0000 0.0000
0.0000 0.0000 0.0000 0.0000 0.0000 0.00000.0000 0.0000 0.0000 0.0000 0.0000 0.0000Hauling 0.0000 0.0000 0.0000 0.0000
Total CO2 CH4 N2O CO2e
Category tons/yr MT/yr
PM10 Total
Fugitive PM2.5
Exhaust PM2.5
PM2.5 Total
Bio- CO2 NBio- CO2
Unmitigated Construction Off-SiteROG NOx CO SO2 Fugitive
PM10Exhaust PM10
0.0000 53.9273 53.9273 7.0700e-003
0.0000 54.07570.0326 0.0326 0.0319 0.0319Total 0.0575 0.4601 0.3822 6.2000e-004
0.0000 0.0000 0.0000 0.0000 0.0000 0.00000.0000 0.0000 0.0000 0.0000Paving 0.0000
0.0000 53.9273 53.9273 7.0700e-003
0.0000 54.07570.0326 0.0326 0.0319 0.0319Off-Road 0.0575 0.4601 0.3822 6.2000e-004
Total CO2 CH4 N2O CO2e
Category tons/yr MT/yr
PM10 Total
Fugitive PM2.5
Exhaust PM2.5
PM2.5 Total
Bio- CO2 NBio- CO2
3.5 Foundation - 2017Unmitigated Construction On-Site
ROG NOx CO SO2 Fugitive PM10
Exhaust PM10
0.0000 7.5615 7.5615 3.9000e-004
0.0000 7.56978.3900e-003
7.0000e-005
8.4600e-003
2.2300e-003
6.0000e-005
2.2900e-003
Total 2.7500e-003
4.0700e-003
0.0423 1.0000e-004
0.0000 7.5615 7.5615 3.9000e-004
0.0000 7.56978.3900e-003
7.0000e-005
8.4600e-003
2.2300e-003
6.0000e-005
2.2900e-003
Worker 2.7500e-003
4.0700e-003
0.0423 1.0000e-004
0.0000 0.0000 0.0000 0.0000 0.0000 0.00000.0000 0.0000 0.0000 0.0000 0.0000 0.0000Vendor 0.0000 0.0000 0.0000 0.0000
0.0000 0.0000 0.0000 0.0000 0.0000 0.00000.0000 0.0000 0.0000 0.0000 0.0000 0.0000Hauling 0.0000 0.0000 0.0000 0.0000
Total CO2 CH4 N2O CO2e
Category tons/yr MT/yr
PM10 Total
Fugitive PM2.5
Exhaust PM2.5
PM2.5 Total
Bio- CO2 NBio- CO2
Mitigated Construction Off-SiteROG NOx CO SO2 Fugitive
PM10Exhaust PM10

0.0000 16.9699 16.9699 2.0900e-003
0.0000 17.01378.8700e-003
8.8700e-003
8.6900e-003
8.6900e-003
Total 0.0160 0.1318 0.1194 2.0000e-004
0.0000 0.0000 0.0000 0.0000 0.0000 0.00000.0000 0.0000 0.0000 0.0000Paving 0.0000
0.0000 16.9699 16.9699 2.0900e-003
0.0000 17.01378.8700e-003
8.8700e-003
8.6900e-003
8.6900e-003
Off-Road 0.0160 0.1318 0.1194 2.0000e-004
Total CO2 CH4 N2O CO2e
Category tons/yr MT/yr
PM10 Total
Fugitive PM2.5
Exhaust PM2.5
PM2.5 Total
Bio- CO2 NBio- CO2
3.5 Foundation - 2018Unmitigated Construction On-Site
ROG NOx CO SO2 Fugitive PM10
Exhaust PM10
0.0000 4.6951 4.6951 2.4000e-004
0.0000 4.70025.2100e-003
4.0000e-005
5.2500e-003
1.3800e-003
4.0000e-005
1.4200e-003
Total 1.7100e-003
2.5300e-003
0.0263 6.0000e-005
0.0000 4.6951 4.6951 2.4000e-004
0.0000 4.70025.2100e-003
4.0000e-005
5.2500e-003
1.3800e-003
4.0000e-005
1.4200e-003
Worker 1.7100e-003
2.5300e-003
0.0263 6.0000e-005
0.0000 0.0000 0.0000 0.0000 0.0000 0.00000.0000 0.0000 0.0000 0.0000 0.0000 0.0000Vendor 0.0000 0.0000 0.0000 0.0000
0.0000 0.0000 0.0000 0.0000 0.0000 0.00000.0000 0.0000 0.0000 0.0000 0.0000 0.0000Hauling 0.0000 0.0000 0.0000 0.0000
Total CO2 CH4 N2O CO2e
Category tons/yr MT/yr
PM10 Total
Fugitive PM2.5
Exhaust PM2.5
PM2.5 Total
Bio- CO2 NBio- CO2
Mitigated Construction Off-SiteROG NOx CO SO2 Fugitive
PM10Exhaust PM10
0.0000 53.9273 53.9273 7.0700e-003
0.0000 54.07568.6000e-004
8.6000e-004
8.6000e-004
8.6000e-004
Total 6.4400e-003
0.0279 0.3973 6.2000e-004
0.0000 0.0000 0.0000 0.0000 0.0000 0.00000.0000 0.0000 0.0000 0.0000Paving 0.0000
0.0000 53.9273 53.9273 7.0700e-003
0.0000 54.07568.6000e-004
8.6000e-004
8.6000e-004
8.6000e-004
Off-Road 6.4400e-003
0.0279 0.3973 6.2000e-004
Total CO2 CH4 N2O CO2e
Category tons/yr MT/yr
PM10 Total
Fugitive PM2.5
Exhaust PM2.5
PM2.5 Total
Bio- CO2 NBio- CO2
Mitigated Construction On-Site
ROG NOx CO SO2 Fugitive PM10
Exhaust PM10

0.0000 1.4273 1.4273 7.0000e-005
0.0000 1.42881.6500e-003
1.0000e-005
1.6600e-003
4.4000e-004
1.0000e-005
4.5000e-004
Total 4.8000e-004
7.2000e-004
7.5100e-003
2.0000e-005
0.0000 1.4273 1.4273 7.0000e-005
0.0000 1.42881.6500e-003
1.0000e-005
1.6600e-003
4.4000e-004
1.0000e-005
4.5000e-004
Worker 4.8000e-004
7.2000e-004
7.5100e-003
2.0000e-005
0.0000 0.0000 0.0000 0.0000 0.0000 0.00000.0000 0.0000 0.0000 0.0000 0.0000 0.0000Vendor 0.0000 0.0000 0.0000 0.0000
0.0000 0.0000 0.0000 0.0000 0.0000 0.00000.0000 0.0000 0.0000 0.0000 0.0000 0.0000Hauling 0.0000 0.0000 0.0000 0.0000
Total CO2 CH4 N2O CO2e
Category tons/yr MT/yr
PM10 Total
Fugitive PM2.5
Exhaust PM2.5
PM2.5 Total
Bio- CO2 NBio- CO2
Mitigated Construction Off-SiteROG NOx CO SO2 Fugitive
PM10Exhaust PM10
0.0000 16.9699 16.9699 2.0900e-003
0.0000 17.01372.7000e-004
2.7000e-004
2.7000e-004
2.7000e-004
Total 2.0300e-003
8.8200e-003
0.1255 2.0000e-004
0.0000 0.0000 0.0000 0.0000 0.0000 0.00000.0000 0.0000 0.0000 0.0000Paving 0.0000
0.0000 16.9699 16.9699 2.0900e-003
0.0000 17.01372.7000e-004
2.7000e-004
2.7000e-004
2.7000e-004
Off-Road 2.0300e-003
8.8200e-003
0.1255 2.0000e-004
Total CO2 CH4 N2O CO2e
Category tons/yr MT/yr
PM10 Total
Fugitive PM2.5
Exhaust PM2.5
PM2.5 Total
Bio- CO2 NBio- CO2
Mitigated Construction On-Site
ROG NOx CO SO2 Fugitive PM10
Exhaust PM10
0.0000 1.4273 1.4273 7.0000e-005
0.0000 1.42881.6500e-003
1.0000e-005
1.6600e-003
4.4000e-004
1.0000e-005
4.5000e-004
Total 4.8000e-004
7.2000e-004
7.5100e-003
2.0000e-005
0.0000 1.4273 1.4273 7.0000e-005
0.0000 1.42881.6500e-003
1.0000e-005
1.6600e-003
4.4000e-004
1.0000e-005
4.5000e-004
Worker 4.8000e-004
7.2000e-004
7.5100e-003
2.0000e-005
0.0000 0.0000 0.0000 0.0000 0.0000 0.00000.0000 0.0000 0.0000 0.0000 0.0000 0.0000Vendor 0.0000 0.0000 0.0000 0.0000
0.0000 0.0000 0.0000 0.0000 0.0000 0.00000.0000 0.0000 0.0000 0.0000 0.0000 0.0000Hauling 0.0000 0.0000 0.0000 0.0000
Total CO2 CH4 N2O CO2e
Category tons/yr MT/yr
PM10 Total
Fugitive PM2.5
Exhaust PM2.5
PM2.5 Total
Bio- CO2 NBio- CO2
Unmitigated Construction Off-Site
ROG NOx CO SO2 Fugitive PM10
Exhaust PM10

0.0000 298.5393 298.5393 0.0430 0.0000 299.44124.8400e-003
4.8400e-003
4.8400e-003
4.8400e-003
Total 0.0363 0.1574 2.2405 3.4100e-003
0.0000 298.5393 298.5393 0.0430 0.0000 299.44124.8400e-003
4.8400e-003
4.8400e-003
4.8400e-003
Off-Road 0.0363 0.1574 2.2405 3.4100e-003
Total CO2 CH4 N2O CO2e
Category tons/yr MT/yr
PM10 Total
Fugitive PM2.5
Exhaust PM2.5
PM2.5 Total
Bio- CO2 NBio- CO2
Mitigated Construction On-SiteROG NOx CO SO2 Fugitive
PM10Exhaust PM10
0.0000 829.2697 829.2697 0.0413 0.0000 830.13700.9562 7.6300e-003
0.9638 0.2539 7.0600e-003
0.2610Total 0.2812 0.4203 4.3620 0.0117
0.0000 829.2697 829.2697 0.0413 0.0000 830.13700.9562 7.6300e-003
0.9638 0.2539 7.0600e-003
0.2610Worker 0.2812 0.4203 4.3620 0.0117
0.0000 0.0000 0.0000 0.0000 0.0000 0.00000.0000 0.0000 0.0000 0.0000 0.0000 0.0000Vendor 0.0000 0.0000 0.0000 0.0000
0.0000 0.0000 0.0000 0.0000 0.0000 0.00000.0000 0.0000 0.0000 0.0000 0.0000 0.0000Hauling 0.0000 0.0000 0.0000 0.0000
Total CO2 CH4 N2O CO2e
Category tons/yr MT/yr
PM10 Total
Fugitive PM2.5
Exhaust PM2.5
PM2.5 Total
Bio- CO2 NBio- CO2
Unmitigated Construction Off-Site
ROG NOx CO SO2 Fugitive PM10
Exhaust PM10
0.0000 298.5397 298.5397 0.0430 0.0000 299.44150.1715 0.1715 0.1659 0.1659Total 0.2950 2.4671 2.1574 3.4100e-003
0.0000 298.5397 298.5397 0.0430 0.0000 299.44150.1715 0.1715 0.1659 0.1659Off-Road 0.2950 2.4671 2.1574 3.4100e-003
Total CO2 CH4 N2O CO2e
Category tons/yr MT/yr
PM10 Total
Fugitive PM2.5
Exhaust PM2.5
PM2.5 Total
Bio- CO2 NBio- CO2
3.6 Building Construction - 2018Unmitigated Construction On-Site
ROG NOx CO SO2 Fugitive PM10
Exhaust PM10

0.0000 836.1520 836.1520 0.0405 0.0000 837.00301.0022 7.8500e-003
1.0101 0.2662 7.2800e-003
0.2735Total 0.2707 0.4040 4.1925 0.0123
0.0000 836.1520 836.1520 0.0405 0.0000 837.00301.0022 7.8500e-003
1.0101 0.2662 7.2800e-003
0.2735Worker 0.2707 0.4040 4.1925 0.0123
0.0000 0.0000 0.0000 0.0000 0.0000 0.00000.0000 0.0000 0.0000 0.0000 0.0000 0.0000Vendor 0.0000 0.0000 0.0000 0.0000
0.0000 0.0000 0.0000 0.0000 0.0000 0.00000.0000 0.0000 0.0000 0.0000 0.0000 0.0000Hauling 0.0000 0.0000 0.0000 0.0000
Total CO2 CH4 N2O CO2e
Category tons/yr MT/yr
PM10 Total
Fugitive PM2.5
Exhaust PM2.5
PM2.5 Total
Bio- CO2 NBio- CO2
Unmitigated Construction Off-SiteROG NOx CO SO2 Fugitive
PM10Exhaust PM10
0.0000 311.4313 311.4313 0.0431 0.0000 312.33550.1553 0.1553 0.1502 0.1502Total 0.2737 2.3579 2.2408 3.5800e-003
0.0000 311.4313 311.4313 0.0431 0.0000 312.33550.1553 0.1553 0.1502 0.1502Off-Road 0.2737 2.3579 2.2408 3.5800e-003
Total CO2 CH4 N2O CO2e
Category tons/yr MT/yr
PM10 Total
Fugitive PM2.5
Exhaust PM2.5
PM2.5 Total
Bio- CO2 NBio- CO2
3.6 Building Construction - 2019Unmitigated Construction On-Site
ROG NOx CO SO2 Fugitive PM10
Exhaust PM10
0.0000 829.2697 829.2697 0.0413 0.0000 830.13700.9562 7.6300e-003
0.9638 0.2539 7.0600e-003
0.2610Total 0.2812 0.4203 4.3620 0.0117
0.0000 829.2697 829.2697 0.0413 0.0000 830.13700.9562 7.6300e-003
0.9638 0.2539 7.0600e-003
0.2610Worker 0.2812 0.4203 4.3620 0.0117
0.0000 0.0000 0.0000 0.0000 0.0000 0.00000.0000 0.0000 0.0000 0.0000 0.0000 0.0000Vendor 0.0000 0.0000 0.0000 0.0000
0.0000 0.0000 0.0000 0.0000 0.0000 0.00000.0000 0.0000 0.0000 0.0000 0.0000 0.0000Hauling 0.0000 0.0000 0.0000 0.0000
Total CO2 CH4 N2O CO2e
Category tons/yr MT/yr
PM10 Total
Fugitive PM2.5
Exhaust PM2.5
PM2.5 Total
Bio- CO2 NBio- CO2
Mitigated Construction Off-Site
ROG NOx CO SO2 Fugitive PM10
Exhaust PM10

0.0000 128.0528 128.0528 0.0172 0.0000 128.41350.0558 0.0558 0.0540 0.0540Total 0.1019 0.8929 0.9208 1.4800e-003
0.0000 128.0528 128.0528 0.0172 0.0000 128.41350.0558 0.0558 0.0540 0.0540Off-Road 0.1019 0.8929 0.9208 1.4800e-003
Total CO2 CH4 N2O CO2e
Category tons/yr MT/yr
PM10 Total
Fugitive PM2.5
Exhaust PM2.5
PM2.5 Total
Bio- CO2 NBio- CO2
3.6 Building Construction - 2020Unmitigated Construction On-Site
ROG NOx CO SO2 Fugitive PM10
Exhaust PM10
0.0000 836.1520 836.1520 0.0405 0.0000 837.00301.0022 7.8500e-003
1.0101 0.2662 7.2800e-003
0.2735Total 0.2707 0.4040 4.1925 0.0123
0.0000 836.1520 836.1520 0.0405 0.0000 837.00301.0022 7.8500e-003
1.0101 0.2662 7.2800e-003
0.2735Worker 0.2707 0.4040 4.1925 0.0123
0.0000 0.0000 0.0000 0.0000 0.0000 0.00000.0000 0.0000 0.0000 0.0000 0.0000 0.0000Vendor 0.0000 0.0000 0.0000 0.0000
0.0000 0.0000 0.0000 0.0000 0.0000 0.00000.0000 0.0000 0.0000 0.0000 0.0000 0.0000Hauling 0.0000 0.0000 0.0000 0.0000
Total CO2 CH4 N2O CO2e
Category tons/yr MT/yr
PM10 Total
Fugitive PM2.5
Exhaust PM2.5
PM2.5 Total
Bio- CO2 NBio- CO2
Mitigated Construction Off-Site
ROG NOx CO SO2 Fugitive PM10
Exhaust PM10
0.0000 311.4309 311.4309 0.0431 0.0000 312.33515.0800e-003
5.0800e-003
5.0800e-003
5.0800e-003
Total 0.0381 0.1650 2.3485 3.5800e-003
0.0000 311.4309 311.4309 0.0431 0.0000 312.33515.0800e-003
5.0800e-003
5.0800e-003
5.0800e-003
Off-Road 0.0381 0.1650 2.3485 3.5800e-003
Total CO2 CH4 N2O CO2e
Category tons/yr MT/yr
PM10 Total
Fugitive PM2.5
Exhaust PM2.5
PM2.5 Total
Bio- CO2 NBio- CO2
Mitigated Construction On-Site
ROG NOx CO SO2 Fugitive PM10
Exhaust PM10

0.0000 331.9394 331.9394 0.0159 0.0000 332.27290.4147 3.2300e-003
0.4180 0.1101 2.9900e-003
0.1131Total 0.1049 0.1550 1.6146 5.0800e-003
0.0000 331.9394 331.9394 0.0159 0.0000 332.27290.4147 3.2300e-003
0.4180 0.1101 2.9900e-003
0.1131Worker 0.1049 0.1550 1.6146 5.0800e-003
0.0000 0.0000 0.0000 0.0000 0.0000 0.00000.0000 0.0000 0.0000 0.0000 0.0000 0.0000Vendor 0.0000 0.0000 0.0000 0.0000
0.0000 0.0000 0.0000 0.0000 0.0000 0.00000.0000 0.0000 0.0000 0.0000 0.0000 0.0000Hauling 0.0000 0.0000 0.0000 0.0000
Total CO2 CH4 N2O CO2e
Category tons/yr MT/yr
PM10 Total
Fugitive PM2.5
Exhaust PM2.5
PM2.5 Total
Bio- CO2 NBio- CO2
Mitigated Construction Off-Site
ROG NOx CO SO2 Fugitive PM10
Exhaust PM10
0.0000 128.0527 128.0527 0.0172 0.0000 128.41332.1000e-003
2.1000e-003
2.1000e-003
2.1000e-003
Total 0.0158 0.0683 0.9718 1.4800e-003
0.0000 128.0527 128.0527 0.0172 0.0000 128.41332.1000e-003
2.1000e-003
2.1000e-003
2.1000e-003
Off-Road 0.0158 0.0683 0.9718 1.4800e-003
Total CO2 CH4 N2O CO2e
Category tons/yr MT/yr
PM10 Total
Fugitive PM2.5
Exhaust PM2.5
PM2.5 Total
Bio- CO2 NBio- CO2
Mitigated Construction On-Site
ROG NOx CO SO2 Fugitive PM10
Exhaust PM10
0.0000 331.9394 331.9394 0.0159 0.0000 332.27290.4147 3.2300e-003
0.4180 0.1101 2.9900e-003
0.1131Total 0.1049 0.1550 1.6146 5.0800e-003
0.0000 331.9394 331.9394 0.0159 0.0000 332.27290.4147 3.2300e-003
0.4180 0.1101 2.9900e-003
0.1131Worker 0.1049 0.1550 1.6146 5.0800e-003
0.0000 0.0000 0.0000 0.0000 0.0000 0.00000.0000 0.0000 0.0000 0.0000 0.0000 0.0000Vendor 0.0000 0.0000 0.0000 0.0000
0.0000 0.0000 0.0000 0.0000 0.0000 0.00000.0000 0.0000 0.0000 0.0000 0.0000 0.0000Hauling 0.0000 0.0000 0.0000 0.0000
Total CO2 CH4 N2O CO2e
Category tons/yr MT/yr
PM10 Total
Fugitive PM2.5
Exhaust PM2.5
PM2.5 Total
Bio- CO2 NBio- CO2
Unmitigated Construction Off-SiteROG NOx CO SO2 Fugitive
PM10Exhaust PM10

0.0000 8.0428 8.0428 7.6000e-004
0.0000 8.05881.2000e-004
1.2000e-004
1.2000e-004
1.2000e-004
Total 0.7851 4.0600e-003
0.0577 9.0000e-005
0.0000 8.0428 8.0428 7.6000e-004
0.0000 8.05881.2000e-004
1.2000e-004
1.2000e-004
1.2000e-004
Off-Road 9.4000e-004
4.0600e-003
0.0577 9.0000e-005
0.0000 0.0000 0.0000 0.0000 0.0000 0.00000.0000 0.0000 0.0000 0.0000Archit. Coating 0.7842
Total CO2 CH4 N2O CO2e
Category tons/yr MT/yr
PM10 Total
Fugitive PM2.5
Exhaust PM2.5
PM2.5 Total
Bio- CO2 NBio- CO2
Mitigated Construction On-Site
ROG NOx CO SO2 Fugitive PM10
Exhaust PM10
0.0000 29.9736 29.9736 1.4900e-003
0.0000 30.00500.0346 2.8000e-004
0.0348 9.1800e-003
2.6000e-004
9.4300e-003
Total 0.0102 0.0152 0.1577 4.2000e-004
0.0000 29.9736 29.9736 1.4900e-003
0.0000 30.00500.0346 2.8000e-004
0.0348 9.1800e-003
2.6000e-004
9.4300e-003
Worker 0.0102 0.0152 0.1577 4.2000e-004
0.0000 0.0000 0.0000 0.0000 0.0000 0.00000.0000 0.0000 0.0000 0.0000 0.0000 0.0000Vendor 0.0000 0.0000 0.0000 0.0000
0.0000 0.0000 0.0000 0.0000 0.0000 0.00000.0000 0.0000 0.0000 0.0000 0.0000 0.0000Hauling 0.0000 0.0000 0.0000 0.0000
Total CO2 CH4 N2O CO2e
Category tons/yr MT/yr
PM10 Total
Fugitive PM2.5
Exhaust PM2.5
PM2.5 Total
Bio- CO2 NBio- CO2
Unmitigated Construction Off-Site
ROG NOx CO SO2 Fugitive PM10
Exhaust PM10
0.0000 8.0428 8.0428 7.6000e-004
0.0000 8.05884.7400e-003
4.7400e-003
4.7400e-003
4.7400e-003
Total 0.7936 0.0632 0.0584 9.0000e-005
0.0000 8.0428 8.0428 7.6000e-004
0.0000 8.05884.7400e-003
4.7400e-003
4.7400e-003
4.7400e-003
Off-Road 9.4100e-003
0.0632 0.0584 9.0000e-005
0.0000 0.0000 0.0000 0.0000 0.0000 0.00000.0000 0.0000 0.0000 0.0000Archit. Coating 0.7842
Total CO2 CH4 N2O CO2e
Category tons/yr MT/yr
PM10 Total
Fugitive PM2.5
Exhaust PM2.5
PM2.5 Total
Bio- CO2 NBio- CO2
3.7 Architectural Coating - 2018Unmitigated Construction On-Site
ROG NOx CO SO2 Fugitive PM10
Exhaust PM10

0.0000 33.3200 33.3200 2.8100e-003
0.0000 33.37910.0168 0.0168 0.0168 0.0168Total 3.2836 0.2395 0.2403 3.9000e-004
0.0000 33.3200 33.3200 2.8100e-003
0.0000 33.37910.0168 0.0168 0.0168 0.0168Off-Road 0.0348 0.2395 0.2403 3.9000e-004
0.0000 0.0000 0.0000 0.0000 0.0000 0.00000.0000 0.0000 0.0000 0.0000Archit. Coating 3.2488
Total CO2 CH4 N2O CO2e
Category tons/yr MT/yr
PM10 Total
Fugitive PM2.5
Exhaust PM2.5
PM2.5 Total
Bio- CO2 NBio- CO2
3.7 Architectural Coating - 2019Unmitigated Construction On-Site
ROG NOx CO SO2 Fugitive PM10
Exhaust PM10
0.0000 29.9736 29.9736 1.4900e-003
0.0000 30.00500.0346 2.8000e-004
0.0348 9.1800e-003
2.6000e-004
9.4300e-003
Total 0.0102 0.0152 0.1577 4.2000e-004
0.0000 29.9736 29.9736 1.4900e-003
0.0000 30.00500.0346 2.8000e-004
0.0348 9.1800e-003
2.6000e-004
9.4300e-003
Worker 0.0102 0.0152 0.1577 4.2000e-004
0.0000 0.0000 0.0000 0.0000 0.0000 0.00000.0000 0.0000 0.0000 0.0000 0.0000 0.0000Vendor 0.0000 0.0000 0.0000 0.0000
0.0000 0.0000 0.0000 0.0000 0.0000 0.00000.0000 0.0000 0.0000 0.0000 0.0000 0.0000Hauling 0.0000 0.0000 0.0000 0.0000
Total CO2 CH4 N2O CO2e
Category tons/yr MT/yr
PM10 Total
Fugitive PM2.5
Exhaust PM2.5
PM2.5 Total
Bio- CO2 NBio- CO2
Mitigated Construction Off-Site
ROG NOx CO SO2 Fugitive PM10
Exhaust PM10
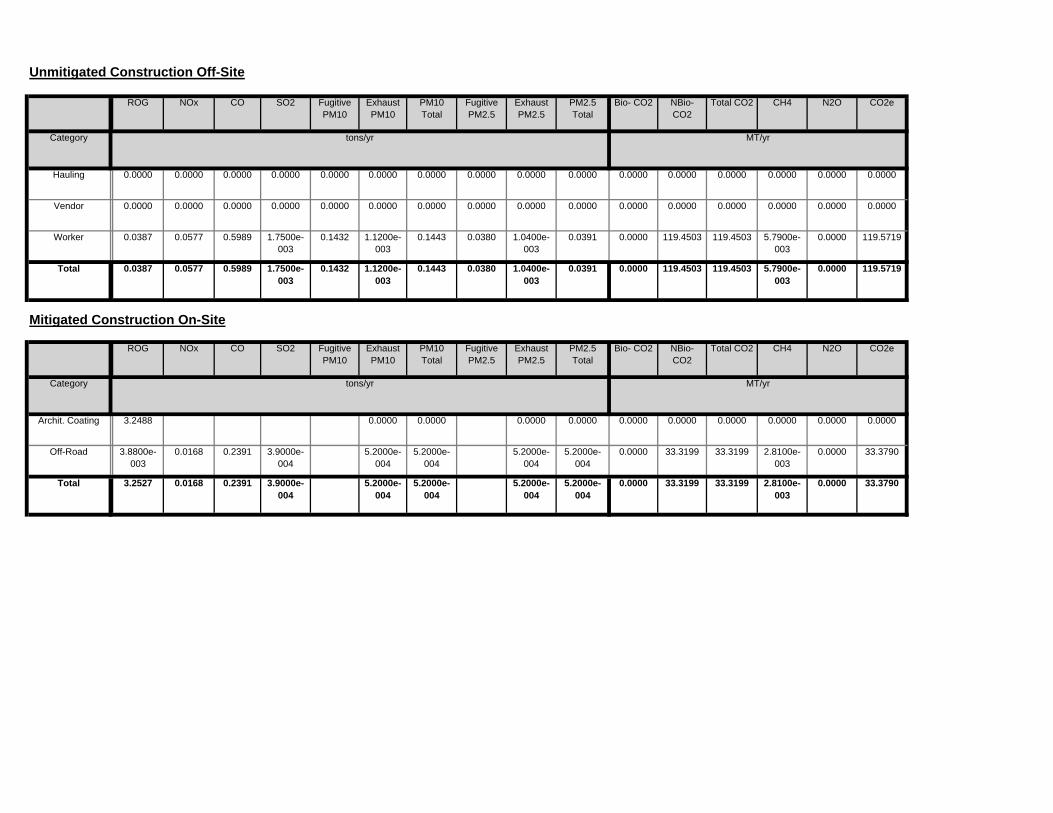
0.0000 33.3199 33.3199 2.8100e-003
0.0000 33.37905.2000e-004
5.2000e-004
5.2000e-004
5.2000e-004
Total 3.2527 0.0168 0.2391 3.9000e-004
0.0000 33.3199 33.3199 2.8100e-003
0.0000 33.37905.2000e-004
5.2000e-004
5.2000e-004
5.2000e-004
Off-Road 3.8800e-003
0.0168 0.2391 3.9000e-004
0.0000 0.0000 0.0000 0.0000 0.0000 0.00000.0000 0.0000 0.0000 0.0000Archit. Coating 3.2488
Total CO2 CH4 N2O CO2e
Category tons/yr MT/yr
PM10 Total
Fugitive PM2.5
Exhaust PM2.5
PM2.5 Total
Bio- CO2 NBio- CO2
Mitigated Construction On-Site
ROG NOx CO SO2 Fugitive PM10
Exhaust PM10
0.0000 119.4503 119.4503 5.7900e-003
0.0000 119.57190.1432 1.1200e-003
0.1443 0.0380 1.0400e-003
0.0391Total 0.0387 0.0577 0.5989 1.7500e-003
0.0000 119.4503 119.4503 5.7900e-003
0.0000 119.57190.1432 1.1200e-003
0.1443 0.0380 1.0400e-003
0.0391Worker 0.0387 0.0577 0.5989 1.7500e-003
0.0000 0.0000 0.0000 0.0000 0.0000 0.00000.0000 0.0000 0.0000 0.0000 0.0000 0.0000Vendor 0.0000 0.0000 0.0000 0.0000
0.0000 0.0000 0.0000 0.0000 0.0000 0.00000.0000 0.0000 0.0000 0.0000 0.0000 0.0000Hauling 0.0000 0.0000 0.0000 0.0000
Total CO2 CH4 N2O CO2e
Category tons/yr MT/yr
PM10 Total
Fugitive PM2.5
Exhaust PM2.5
PM2.5 Total
Bio- CO2 NBio- CO2
Unmitigated Construction Off-Site
ROG NOx CO SO2 Fugitive PM10
Exhaust PM10

0.0000 30.7351 30.7351 1.4700e-003
0.0000 30.76600.0384 3.0000e-004
0.0387 0.0102 2.8000e-004
0.0105Total 9.7100e-003
0.0144 0.1495 4.7000e-004
0.0000 30.7351 30.7351 1.4700e-003
0.0000 30.76600.0384 3.0000e-004
0.0387 0.0102 2.8000e-004
0.0105Worker 9.7100e-003
0.0144 0.1495 4.7000e-004
0.0000 0.0000 0.0000 0.0000 0.0000 0.00000.0000 0.0000 0.0000 0.0000 0.0000 0.0000Vendor 0.0000 0.0000 0.0000 0.0000
0.0000 0.0000 0.0000 0.0000 0.0000 0.00000.0000 0.0000 0.0000 0.0000 0.0000 0.0000Hauling 0.0000 0.0000 0.0000 0.0000
Total CO2 CH4 N2O CO2e
Category tons/yr MT/yr
PM10 Total
Fugitive PM2.5
Exhaust PM2.5
PM2.5 Total
Bio- CO2 NBio- CO2
Unmitigated Construction Off-SiteROG NOx CO SO2 Fugitive
PM10Exhaust PM10
0.0000 8.9364 8.9364 6.9000e-004
0.0000 8.95093.8800e-003
3.8800e-003
3.8800e-003
3.8800e-003
Total 0.8798 0.0589 0.0641 1.0000e-004
0.0000 8.9364 8.9364 6.9000e-004
0.0000 8.95093.8800e-003
3.8800e-003
3.8800e-003
3.8800e-003
Off-Road 8.4800e-003
0.0589 0.0641 1.0000e-004
0.0000 0.0000 0.0000 0.0000 0.0000 0.00000.0000 0.0000 0.0000 0.0000Archit. Coating 0.8713
Total CO2 CH4 N2O CO2e
Category tons/yr MT/yr
PM10 Total
Fugitive PM2.5
Exhaust PM2.5
PM2.5 Total
Bio- CO2 NBio- CO2
3.7 Architectural Coating - 2020Unmitigated Construction On-Site
ROG NOx CO SO2 Fugitive PM10
Exhaust PM10
0.0000 119.4503 119.4503 5.7900e-003
0.0000 119.57190.1432 1.1200e-003
0.1443 0.0380 1.0400e-003
0.0391Total 0.0387 0.0577 0.5989 1.7500e-003
0.0000 119.4503 119.4503 5.7900e-003
0.0000 119.57190.1432 1.1200e-003
0.1443 0.0380 1.0400e-003
0.0391Worker 0.0387 0.0577 0.5989 1.7500e-003
0.0000 0.0000 0.0000 0.0000 0.0000 0.00000.0000 0.0000 0.0000 0.0000 0.0000 0.0000Vendor 0.0000 0.0000 0.0000 0.0000
0.0000 0.0000 0.0000 0.0000 0.0000 0.00000.0000 0.0000 0.0000 0.0000 0.0000 0.0000Hauling 0.0000 0.0000 0.0000 0.0000
Total CO2 CH4 N2O CO2e
Category tons/yr MT/yr
PM10 Total
Fugitive PM2.5
Exhaust PM2.5
PM2.5 Total
Bio- CO2 NBio- CO2
Mitigated Construction Off-Site
ROG NOx CO SO2 Fugitive PM10
Exhaust PM10

0.0000 10.5207 10.5207 3.3300e-003
0.0000 10.59064.2500e-003
4.2500e-003
3.9100e-003
3.9100e-003
Total 7.4900e-003
0.0784 0.0754 1.2000e-004
0.0000 0.0000 0.0000 0.0000 0.0000 0.00000.0000 0.0000 0.0000 0.0000Paving 0.0000
0.0000 10.5207 10.5207 3.3300e-003
0.0000 10.59064.2500e-003
4.2500e-003
3.9100e-003
3.9100e-003
Off-Road 7.4900e-003
0.0784 0.0754 1.2000e-004
Total CO2 CH4 N2O CO2e
Category tons/yr MT/yr
PM10 Total
Fugitive PM2.5
Exhaust PM2.5
PM2.5 Total
Bio- CO2 NBio- CO2
3.8 Paving - 2019Unmitigated Construction On-Site
ROG NOx CO SO2 Fugitive PM10
Exhaust PM10
0.0000 30.7351 30.7351 1.4700e-003
0.0000 30.76600.0384 3.0000e-004
0.0387 0.0102 2.8000e-004
0.0105Total 9.7100e-003
0.0144 0.1495 4.7000e-004
0.0000 30.7351 30.7351 1.4700e-003
0.0000 30.76600.0384 3.0000e-004
0.0387 0.0102 2.8000e-004
0.0105Worker 9.7100e-003
0.0144 0.1495 4.7000e-004
0.0000 0.0000 0.0000 0.0000 0.0000 0.00000.0000 0.0000 0.0000 0.0000 0.0000 0.0000Vendor 0.0000 0.0000 0.0000 0.0000
0.0000 0.0000 0.0000 0.0000 0.0000 0.00000.0000 0.0000 0.0000 0.0000 0.0000 0.0000Hauling 0.0000 0.0000 0.0000 0.0000
Total CO2 CH4 N2O CO2e
Category tons/yr MT/yr
PM10 Total
Fugitive PM2.5
Exhaust PM2.5
PM2.5 Total
Bio- CO2 NBio- CO2
Mitigated Construction Off-Site
ROG NOx CO SO2 Fugitive PM10
Exhaust PM10
0.0000 8.9364 8.9364 6.9000e-004
0.0000 8.95091.4000e-004
1.4000e-004
1.4000e-004
1.4000e-004
Total 0.8724 4.5100e-003
0.0641 1.0000e-004
0.0000 8.9364 8.9364 6.9000e-004
0.0000 8.95091.4000e-004
1.4000e-004
1.4000e-004
1.4000e-004
Off-Road 1.0400e-003
4.5100e-003
0.0641 1.0000e-004
0.0000 0.0000 0.0000 0.0000 0.0000 0.00000.0000 0.0000 0.0000 0.0000Archit. Coating 0.8713
Total CO2 CH4 N2O CO2e
Category tons/yr MT/yr
PM10 Total
Fugitive PM2.5
Exhaust PM2.5
PM2.5 Total
Bio- CO2 NBio- CO2
Mitigated Construction On-Site
ROG NOx CO SO2 Fugitive PM10
Exhaust PM10

0.0000 0.9611 0.9611 5.0000e-005
0.0000 0.96211.1500e-003
1.0000e-005
1.1600e-003
3.1000e-004
1.0000e-005
3.1000e-004
Total 3.1000e-004
4.6000e-004
4.8200e-003
1.0000e-005
0.0000 0.9611 0.9611 5.0000e-005
0.0000 0.96211.1500e-003
1.0000e-005
1.1600e-003
3.1000e-004
1.0000e-005
3.1000e-004
Worker 3.1000e-004
4.6000e-004
4.8200e-003
1.0000e-005
0.0000 0.0000 0.0000 0.0000 0.0000 0.00000.0000 0.0000 0.0000 0.0000 0.0000 0.0000Vendor 0.0000 0.0000 0.0000 0.0000
0.0000 0.0000 0.0000 0.0000 0.0000 0.00000.0000 0.0000 0.0000 0.0000 0.0000 0.0000Hauling 0.0000 0.0000 0.0000 0.0000
Total CO2 CH4 N2O CO2e
Category tons/yr MT/yr
PM10 Total
Fugitive PM2.5
Exhaust PM2.5
PM2.5 Total
Bio- CO2 NBio- CO2
Mitigated Construction Off-Site
ROG NOx CO SO2 Fugitive PM10
Exhaust PM10
0.0000 10.5207 10.5207 3.3300e-003
0.0000 10.59061.9000e-004
1.9000e-004
1.9000e-004
1.9000e-004
Total 1.4400e-003
6.2400e-003
0.0889 1.2000e-004
0.0000 0.0000 0.0000 0.0000 0.0000 0.00000.0000 0.0000 0.0000 0.0000Paving 0.0000
0.0000 10.5207 10.5207 3.3300e-003
0.0000 10.59061.9000e-004
1.9000e-004
1.9000e-004
1.9000e-004
Off-Road 1.4400e-003
6.2400e-003
0.0889 1.2000e-004
Total CO2 CH4 N2O CO2e
Category tons/yr MT/yr
PM10 Total
Fugitive PM2.5
Exhaust PM2.5
PM2.5 Total
Bio- CO2 NBio- CO2
Mitigated Construction On-Site
ROG NOx CO SO2 Fugitive PM10
Exhaust PM10
0.0000 0.9611 0.9611 5.0000e-005
0.0000 0.96211.1500e-003
1.0000e-005
1.1600e-003
3.1000e-004
1.0000e-005
3.1000e-004
Total 3.1000e-004
4.6000e-004
4.8200e-003
1.0000e-005
0.0000 0.9611 0.9611 5.0000e-005
0.0000 0.96211.1500e-003
1.0000e-005
1.1600e-003
3.1000e-004
1.0000e-005
3.1000e-004
Worker 3.1000e-004
4.6000e-004
4.8200e-003
1.0000e-005
0.0000 0.0000 0.0000 0.0000 0.0000 0.00000.0000 0.0000 0.0000 0.0000 0.0000 0.0000Vendor 0.0000 0.0000 0.0000 0.0000
0.0000 0.0000 0.0000 0.0000 0.0000 0.00000.0000 0.0000 0.0000 0.0000 0.0000 0.0000Hauling 0.0000 0.0000 0.0000 0.0000
Total CO2 CH4 N2O CO2e
Category tons/yr MT/yr
PM10 Total
Fugitive PM2.5
Exhaust PM2.5
PM2.5 Total
Bio- CO2 NBio- CO2
Unmitigated Construction Off-Site
ROG NOx CO SO2 Fugitive PM10
Exhaust PM10

Off-road Equipment - See "Hazen AQ Construction Model Inputs"
1.3 User Entered Comments & Non-Default Data
Project Characteristics -
Land Use - See "Hazen AQ Construction Model Inputs"
Construction Phase - See "Hazen AQ Construction Model Inputs"
Off-road Equipment -
Off-road Equipment - See "Hazen AQ Construction Model Inputs"
CO2 Intensity (lb/MWhr)
1227.89 CH4 Intensity (lb/MWhr)
0.029 N2O Intensity (lb/MWhr)
0.006
31
Climate Zone 11 Operational Year 2023
Utility Company Los Angeles Department of Water & Power
1.2 Other Project Characteristics
Urbanization Urban Wind Speed (m/s) 2.2 Precipitation Freq (Days)
Strip Mall 25.00 1000sqft 0.57 25,000.00 0
Apartments High Rise 360.00 Dwelling Unit 5.81 418,000.00 587
Quality Restaurant 25.00 1000sqft 0.57 25,000.00 0
City Park 0.47 Acre 0.47 20,500.00 0
Parking Lot 5.00 1000sqft 0.11 5,000.00 0
Population
Enclosed Parking with Elevator 362.00 Space 3.26 144,800.00 0
1.1 Land Usage
Land Uses Size Metric Lot Acreage Floor Surface Area
CalEEMod Version: CalEEMod.2013.2.2 Page 1 of 1 Date: 4/19/2016 11:57 AM
LUXE Hotel - Phase 2 ConstructionSouth Coast Air Basin, Annual
1.0 Project Characteristics
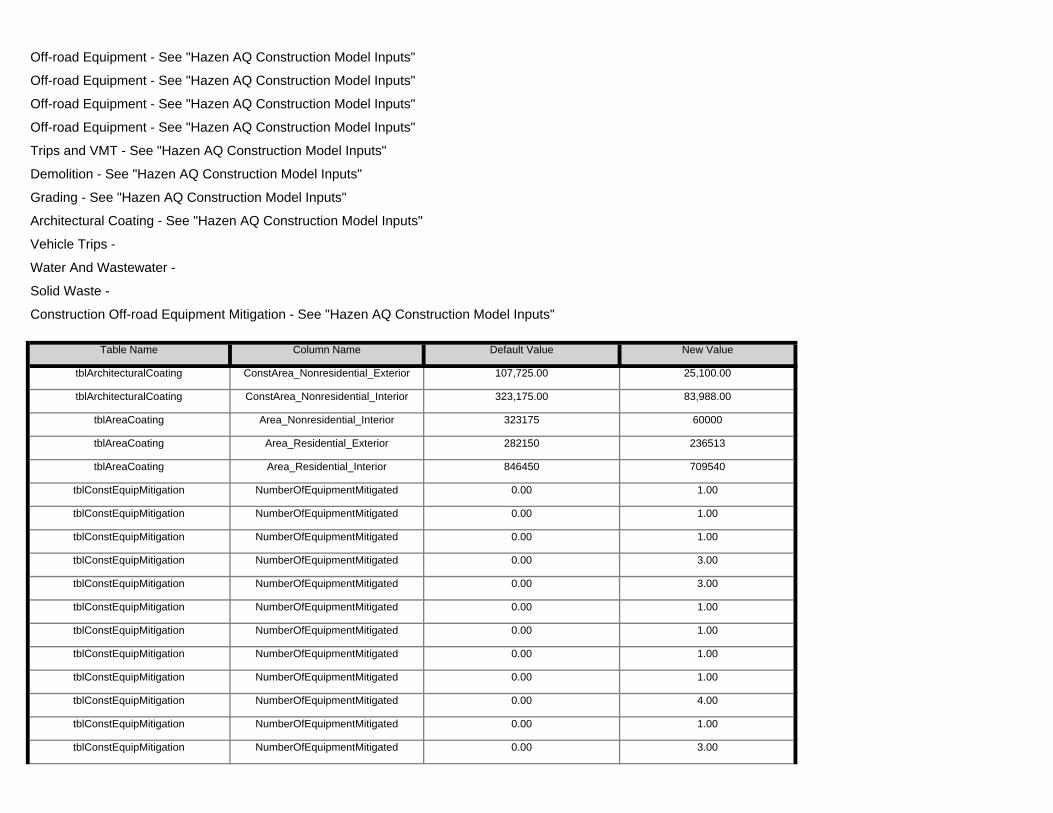
tblConstEquipMitigation NumberOfEquipmentMitigated 0.00 1.00
tblConstEquipMitigation NumberOfEquipmentMitigated 0.00 3.00
tblConstEquipMitigation NumberOfEquipmentMitigated 0.00 1.00
tblConstEquipMitigation NumberOfEquipmentMitigated 0.00 4.00
tblConstEquipMitigation NumberOfEquipmentMitigated 0.00 1.00
tblConstEquipMitigation NumberOfEquipmentMitigated 0.00 1.00
tblConstEquipMitigation NumberOfEquipmentMitigated 0.00 3.00
tblConstEquipMitigation NumberOfEquipmentMitigated 0.00 1.00
tblConstEquipMitigation NumberOfEquipmentMitigated 0.00 1.00
tblConstEquipMitigation NumberOfEquipmentMitigated 0.00 3.00
tblConstEquipMitigation NumberOfEquipmentMitigated 0.00 1.00
tblConstEquipMitigation NumberOfEquipmentMitigated 0.00 1.00
tblAreaCoating Area_Residential_Exterior 282150 236513
tblAreaCoating Area_Residential_Interior 846450 709540
tblArchitecturalCoating ConstArea_Nonresidential_Interior 323,175.00 83,988.00
tblAreaCoating Area_Nonresidential_Interior 323175 60000
Construction Off-road Equipment Mitigation - See "Hazen AQ Construction Model Inputs"
Table Name Column Name Default Value New Value
tblArchitecturalCoating ConstArea_Nonresidential_Exterior 107,725.00 25,100.00
Demolition - See "Hazen AQ Construction Model Inputs"
Grading - See "Hazen AQ Construction Model Inputs"
Architectural Coating - See "Hazen AQ Construction Model Inputs"
Vehicle Trips -
Water And Wastewater -
Solid Waste -
Off-road Equipment - See "Hazen AQ Construction Model Inputs"
Off-road Equipment - See "Hazen AQ Construction Model Inputs"
Off-road Equipment - See "Hazen AQ Construction Model Inputs"
Off-road Equipment - See "Hazen AQ Construction Model Inputs"
Trips and VMT - See "Hazen AQ Construction Model Inputs"

tblFireplaces NumberGas 306.00 246.50
tblFireplaces NumberNoFireplace 36.00 29.00
tblConstructionPhase PhaseStartDate 1/23/2021 1/25/2021
tblConstructionPhase PhaseStartDate 1/14/2023 11/9/2021
tblConstructionPhase PhaseEndDate 2/10/2023 12/6/2021
tblConstructionPhase PhaseStartDate 3/16/2023 8/9/2021
tblConstructionPhase NumDays 20.00 43.00
tblConstructionPhase PhaseEndDate 8/21/2024 1/13/2023
tblConstructionPhase NumDays 20.00 72.00
tblConstructionPhase NumDays 30.00 35.00
tblConstructionPhase NumDays 20.00 375.00
tblConstructionPhase NumDays 300.00 558.00
tblConstEquipMitigation Tier No Change Tier 4 Final
tblConstEquipMitigation Tier No Change Tier 4 Final
tblConstEquipMitigation Tier No Change Tier 4 Final
tblConstEquipMitigation Tier No Change Tier 4 Final
tblConstEquipMitigation Tier No Change Tier 4 Final
tblConstEquipMitigation Tier No Change Tier 4 Final
tblConstEquipMitigation Tier No Change Tier 4 Final
tblConstEquipMitigation Tier No Change Tier 4 Final
tblConstEquipMitigation Tier No Change Tier 4 Final
tblConstEquipMitigation Tier No Change Tier 4 Final
tblConstEquipMitigation Tier No Change Tier 4 Final
tblConstEquipMitigation Tier No Change Tier 4 Final
tblConstEquipMitigation Tier No Change Tier 4 Final
tblConstEquipMitigation Tier No Change Tier 4 Final
tblConstEquipMitigation Tier No Change Tier 4 Final
tblConstEquipMitigation Tier No Change Tier 4 Final
tblConstEquipMitigation NumberOfEquipmentMitigated 0.00 1.00
tblConstEquipMitigation NumberOfEquipmentMitigated 0.00 8.00

tblProjectCharacteristics OperationalYear 2014 2023
tblSolidWaste SolidWasteGenerationRate 165.60 133.40
tblOffRoadEquipment UsageHours 7.00 8.00
tblOffRoadEquipment UsageHours 7.00 8.00
tblOffRoadEquipment PhaseName Demolition
tblOffRoadEquipment PhaseName Foundation
tblOffRoadEquipment PhaseName Foundation
tblOffRoadEquipment PhaseName Building Construction
tblOffRoadEquipment OffRoadEquipmentUnitAmount 0.00 2.00
tblOffRoadEquipment PhaseName Grading
tblOffRoadEquipment OffRoadEquipmentUnitAmount 0.00 4.00
tblOffRoadEquipment OffRoadEquipmentUnitAmount 0.00 3.00
tblOffRoadEquipment OffRoadEquipmentUnitAmount 1.00 0.00
tblOffRoadEquipment OffRoadEquipmentUnitAmount 0.00 1.00
tblOffRoadEquipment OffRoadEquipmentUnitAmount 2.00 1.00
tblOffRoadEquipment OffRoadEquipmentUnitAmount 3.00 1.00
tblOffRoadEquipment OffRoadEquipmentUnitAmount 2.00 0.00
tblOffRoadEquipment OffRoadEquipmentUnitAmount 2.00 1.00
tblOffRoadEquipment OffRoadEquipmentUnitAmount 2.00 0.00
tblOffRoadEquipment OffRoadEquipmentUnitAmount 2.00 1.00
tblOffRoadEquipment OffRoadEquipmentUnitAmount 2.00 0.00
tblOffRoadEquipment OffRoadEquipmentUnitAmount 2.00 1.00
tblOffRoadEquipment OffRoadEquipmentUnitAmount 1.00 0.00
tblOffRoadEquipment OffRoadEquipmentUnitAmount 3.00 1.00
tblLandUse LandUseSquareFeet 360,000.00 418,000.00
tblLandUse Population 1,030.00 587.00
tblGrading MaterialExported 0.00 102,300.00
tblLandUse LandUseSquareFeet 20,473.20 20,500.00
tblFireplaces NumberWood 18.00 14.50
tblGrading AcresOfGrading 52.50 2.70
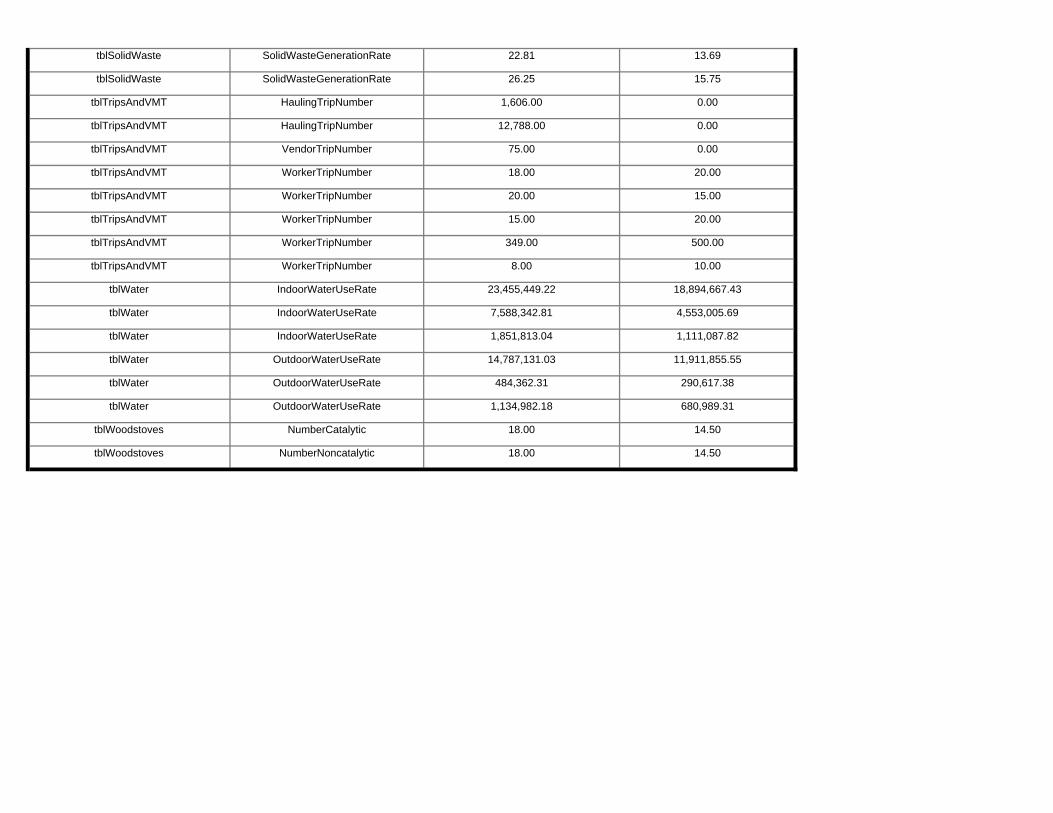
tblWoodstoves NumberCatalytic 18.00 14.50
tblWoodstoves NumberNoncatalytic 18.00 14.50
tblWater OutdoorWaterUseRate 484,362.31 290,617.38
tblWater OutdoorWaterUseRate 1,134,982.18 680,989.31
tblWater IndoorWaterUseRate 1,851,813.04 1,111,087.82
tblWater OutdoorWaterUseRate 14,787,131.03 11,911,855.55
tblWater IndoorWaterUseRate 23,455,449.22 18,894,667.43
tblWater IndoorWaterUseRate 7,588,342.81 4,553,005.69
tblTripsAndVMT WorkerTripNumber 349.00 500.00
tblTripsAndVMT WorkerTripNumber 8.00 10.00
tblTripsAndVMT WorkerTripNumber 20.00 15.00
tblTripsAndVMT WorkerTripNumber 15.00 20.00
tblTripsAndVMT VendorTripNumber 75.00 0.00
tblTripsAndVMT WorkerTripNumber 18.00 20.00
tblTripsAndVMT HaulingTripNumber 1,606.00 0.00
tblTripsAndVMT HaulingTripNumber 12,788.00 0.00
tblSolidWaste SolidWasteGenerationRate 22.81 13.69
tblSolidWaste SolidWasteGenerationRate 26.25 15.75

0.00 0.00 0.00 0.00 0.00 0.008.83 91.15 19.06 9.73 90.99 36.66
NBio-CO2 Total CO2 CH4 N20 CO2e
Percent Reduction
13.48 82.54 0.79 0.00
Exhaust PM10
PM10 Total
Fugitive PM2.5
Exhaust PM2.5
PM2.5 Total
Bio- CO2ROG NOx CO SO2 Fugitive PM10
0.0000 1,990.0255
1,990.0255 0.2040 0.0000 1,994.3086
1.8028 0.0248 1.8276 0.4824 0.0239 0.5062Total 2.7451 0.9460 10.9655 0.0285
0.0000 148.0230 148.0230 0.0116 0.0000 148.26590.1492 1.7500e-003
0.1510 0.0396 1.6600e-003
0.04132023 0.0969 0.0651 0.7545 2.2200e-003
0.0000 824.5490 824.5490 0.0626 0.0000 825.86400.8130 9.6300e-003
0.8226 0.2159 9.1700e-003
0.22512022 1.7805 0.3734 4.3189 0.0122
0.0000 761.2336 761.2336 0.0630 0.0000 762.55690.7152 8.9500e-003
0.7241 0.1899 8.5400e-003
0.19852021 0.8313 0.3594 4.1743 0.0111
0.0000 256.2199 256.2199 0.0668 0.0000 257.62180.1254 4.5000e-003
0.1299 0.0369 4.5000e-003
0.04142020 0.0365 0.1480 1.7178 2.9700e-003
Total CO2 CH4 N2O CO2e
Year tons/yr MT/yr
PM10 Total
Fugitive PM2.5
Exhaust PM2.5
PM2.5 Total
Bio- CO2 NBio- CO2
Mitigated Construction
ROG NOx CO SO2 Fugitive PM10
Exhaust PM10
0.0000 1,990.0263
1,990.0263 0.2040 0.0000 1,994.3094
1.9774 0.2806 2.2580 0.5344 0.2649 0.7993Total 3.1729 5.4182 11.0533 0.0285
0.0000 148.0230 148.0230 0.0116 0.0000 148.26590.1492 0.0116 0.1609 0.0396 0.0110 0.05062023 0.1137 0.2415 0.7399 2.2200e-003
0.0000 824.5492 824.5492 0.0626 0.0000 825.86420.8130 0.0750 0.8880 0.2159 0.0715 0.28742022 1.8910 1.4594 4.2504 0.0122
0.0000 761.2339 761.2339 0.0630 0.0000 762.55720.7152 0.0863 0.8015 0.1899 0.0819 0.27192021 0.9531 1.5798 4.0960 0.0111
0.0000 256.2202 256.2202 0.0668 0.0000 257.62210.3001 0.1076 0.4077 0.0889 0.1005 0.18942020 0.2151 2.1374 1.9670 2.9700e-003
NBio- CO2
Total CO2 CH4 N2O CO2e
Year tons/yr MT/yr
Exhaust PM10
PM10 Total
Fugitive PM2.5
Exhaust PM2.5
PM2.5 Total
Bio- CO2
2.0 Emissions Summary
2.1 Overall ConstructionUnmitigated Construction
ROG NOx CO SO2 Fugitive PM10
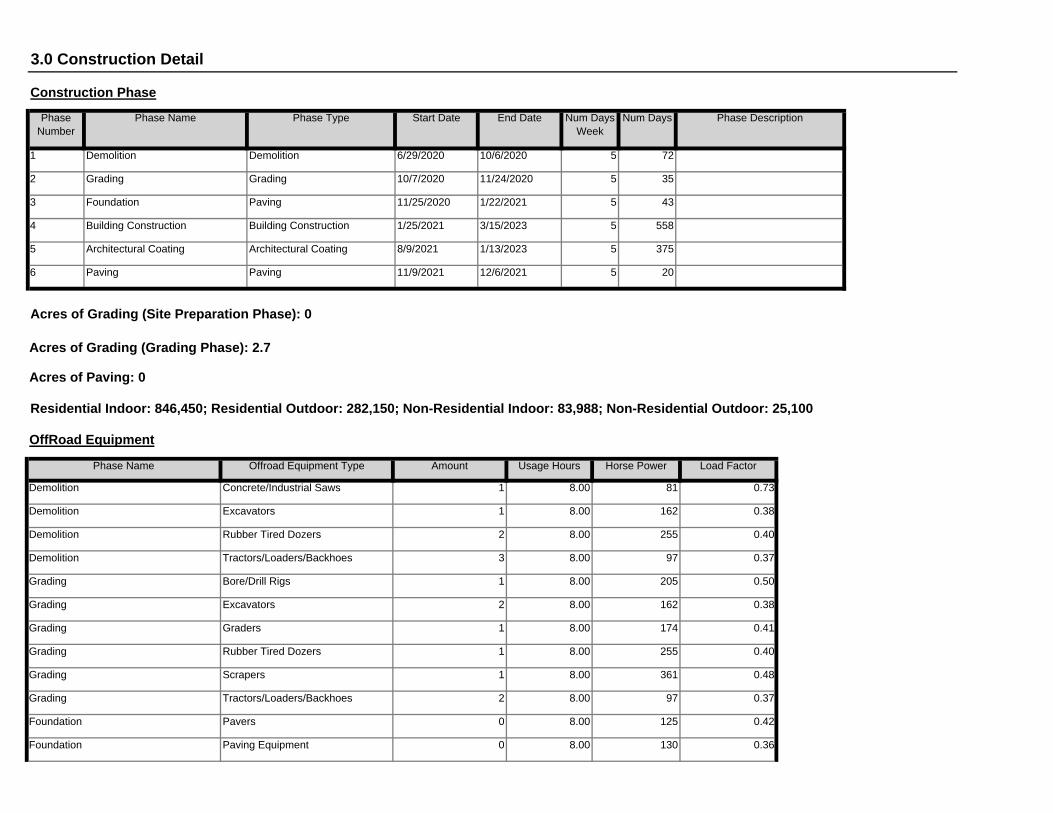
Foundation Paving Equipment 0 8.00 130 0.36
Foundation Pavers 0 8.00 125 0.42
Grading Tractors/Loaders/Backhoes 2 8.00 97 0.37
Grading Scrapers 1 8.00 361 0.48
Grading Rubber Tired Dozers 1 8.00 255 0.40
Grading Graders 1 8.00 174 0.41
Grading Excavators 2 8.00 162 0.38
Grading Bore/Drill Rigs 1 8.00 205 0.50
Demolition Tractors/Loaders/Backhoes 3 8.00 97 0.37
Demolition Rubber Tired Dozers 2 8.00 255 0.40
Demolition Excavators 1 8.00 162 0.38
Load Factor
Demolition Concrete/Industrial Saws 1 8.00 81 0.73
Acres of Grading (Site Preparation Phase): 0
Acres of Grading (Grading Phase): 2.7
Acres of Paving: 0
Residential Indoor: 846,450; Residential Outdoor: 282,150; Non-Residential Indoor: 83,988; Non-Residential Outdoor: 25,100
OffRoad Equipment
Phase Name Offroad Equipment Type Amount Usage Hours Horse Power
375
6 Paving Paving 11/9/2021 12/6/2021 5 20
5 Architectural Coating Architectural Coating 8/9/2021 1/13/2023 5
43
4 Building Construction Building Construction 1/25/2021 3/15/2023 5 558
3 Foundation Paving 11/25/2020 1/22/2021 5
72
2 Grading Grading 10/7/2020 11/24/2020 5 35
End Date Num Days Week
Num Days Phase Description
1 Demolition Demolition 6/29/2020 10/6/2020 5
3.0 Construction Detail
Construction Phase
Phase Number
Phase Name Phase Type Start Date

3.1 Mitigation Measures Construction
Use Cleaner Engines for Construction Equipment
Use Soil Stabilizer
Water Exposed Area
Reduce Vehicle Speed on Unpaved Roads
Clean Paved Roads
14.70 6.90 20.00 LD_Mix HDT_Mix HHDT
6.90 20.00 LD_Mix HDT_Mix HHDT
Paving 3 10.00 0.00 0.00
Architectural Coating 1 70.00 0.00 0.00 14.70
14.70 6.90 20.00 LD_Mix HDT_Mix HHDT
6.90 20.00 LD_Mix HDT_Mix HHDT
Building Construction 5 500.00 0.00 0.00
Foundation 6 20.00 0.00 0.00 14.70
14.70 6.90 20.00 LD_Mix HDT_Mix HHDT
6.90 20.00 LD_Mix HDT_Mix HHDT
Grading 8 15.00 0.00 0.00
Demolition 7 20.00 0.00 0.00 14.70
Worker Trip Length
Vendor Trip Length
Hauling Trip Length
Worker Vehicle Class
Vendor Vehicle Class
Hauling Vehicle Class
Trips and VMT
Phase Name Offroad Equipment Count
Worker Trip Number
Vendor Trip Number
Hauling Trip Number
Paving Rollers 1 8.00 80 0.38
Paving Paving Equipment 1 8.00 130 0.36
Paving Pavers 1 8.00 125 0.42
Architectural Coating Air Compressors 1 6.00 78 0.48
Building Construction Welders 0 8.00 46 0.45
Building Construction Tractors/Loaders/Backhoes 1 8.00 97 0.37
Building Construction Pumps 0 8.00 84 0.74
Building Construction Generator Sets 1 8.00 84 0.74
Building Construction Forklifts 3 8.00 89 0.20
Building Construction Cranes 0 8.00 226 0.29
Foundation Tractors/Loaders/Backhoes 2 8.00 97 0.37
Foundation Rollers 0 8.00 80 0.38
Foundation Pumps 4 8.00 84 0.74
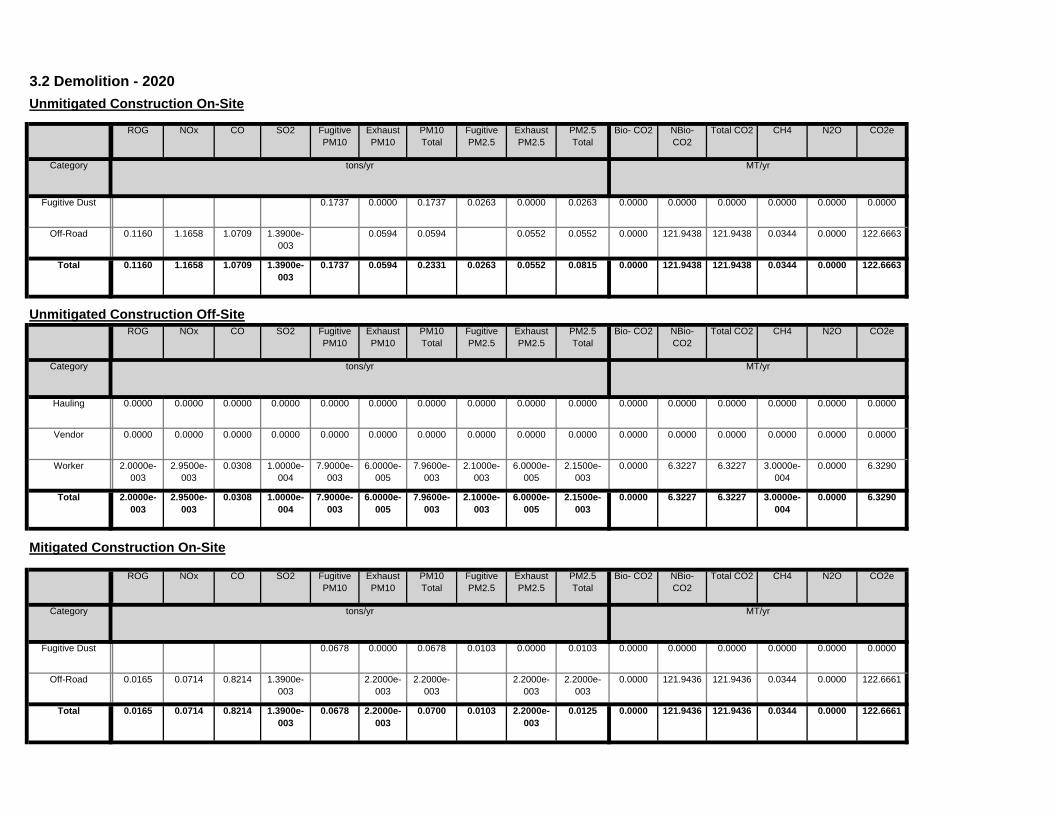
0.0000 121.9436 121.9436 0.0344 0.0000 122.66610.0678 2.2000e-003
0.0700 0.0103 2.2000e-003
0.0125Total 0.0165 0.0714 0.8214 1.3900e-003
0.0000 121.9436 121.9436 0.0344 0.0000 122.66612.2000e-003
2.2000e-003
2.2000e-003
2.2000e-003
Off-Road 0.0165 0.0714 0.8214 1.3900e-003
0.0000 0.0000 0.0000 0.0000 0.0000 0.00000.0678 0.0000 0.0678 0.0103 0.0000 0.0103Fugitive Dust
Total CO2 CH4 N2O CO2e
Category tons/yr MT/yr
PM10 Total
Fugitive PM2.5
Exhaust PM2.5
PM2.5 Total
Bio- CO2 NBio- CO2
Mitigated Construction On-Site
ROG NOx CO SO2 Fugitive PM10
Exhaust PM10
0.0000 6.3227 6.3227 3.0000e-004
0.0000 6.32907.9000e-003
6.0000e-005
7.9600e-003
2.1000e-003
6.0000e-005
2.1500e-003
Total 2.0000e-003
2.9500e-003
0.0308 1.0000e-004
0.0000 6.3227 6.3227 3.0000e-004
0.0000 6.32907.9000e-003
6.0000e-005
7.9600e-003
2.1000e-003
6.0000e-005
2.1500e-003
Worker 2.0000e-003
2.9500e-003
0.0308 1.0000e-004
0.0000 0.0000 0.0000 0.0000 0.0000 0.00000.0000 0.0000 0.0000 0.0000 0.0000 0.0000Vendor 0.0000 0.0000 0.0000 0.0000
0.0000 0.0000 0.0000 0.0000 0.0000 0.00000.0000 0.0000 0.0000 0.0000 0.0000 0.0000Hauling 0.0000 0.0000 0.0000 0.0000
Total CO2 CH4 N2O CO2e
Category tons/yr MT/yr
PM10 Total
Fugitive PM2.5
Exhaust PM2.5
PM2.5 Total
Bio- CO2 NBio- CO2
Unmitigated Construction Off-SiteROG NOx CO SO2 Fugitive
PM10Exhaust PM10
0.0000 121.9438 121.9438 0.0344 0.0000 122.66630.1737 0.0594 0.2331 0.0263 0.0552 0.0815Total 0.1160 1.1658 1.0709 1.3900e-003
0.0000 121.9438 121.9438 0.0344 0.0000 122.66630.0594 0.0594 0.0552 0.0552Off-Road 0.1160 1.1658 1.0709 1.3900e-003
0.0000 0.0000 0.0000 0.0000 0.0000 0.00000.1737 0.0000 0.1737 0.0263 0.0000 0.0263Fugitive Dust
Total CO2 CH4 N2O CO2e
Category tons/yr MT/yr
PM10 Total
Fugitive PM2.5
Exhaust PM2.5
PM2.5 Total
Bio- CO2 NBio- CO2
3.2 Demolition - 2020Unmitigated Construction On-Site
ROG NOx CO SO2 Fugitive PM10
Exhaust PM10

0.0000 2.3051 2.3051 1.1000e-004
0.0000 2.30752.8800e-003
2.0000e-005
2.9000e-003
7.6000e-004
2.0000e-005
7.9000e-004
Total 7.3000e-004
1.0800e-003
0.0112 4.0000e-005
0.0000 2.3051 2.3051 1.1000e-004
0.0000 2.30752.8800e-003
2.0000e-005
2.9000e-003
7.6000e-004
2.0000e-005
7.9000e-004
Worker 7.3000e-004
1.0800e-003
0.0112 4.0000e-005
0.0000 0.0000 0.0000 0.0000 0.0000 0.00000.0000 0.0000 0.0000 0.0000 0.0000 0.0000Vendor 0.0000 0.0000 0.0000 0.0000
0.0000 0.0000 0.0000 0.0000 0.0000 0.00000.0000 0.0000 0.0000 0.0000 0.0000 0.0000Hauling 0.0000 0.0000 0.0000 0.0000
Total CO2 CH4 N2O CO2e
Category tons/yr MT/yr
PM10 Total
Fugitive PM2.5
Exhaust PM2.5
PM2.5 Total
Bio- CO2 NBio- CO2
Unmitigated Construction Off-Site
ROG NOx CO SO2 Fugitive PM10
Exhaust PM10
0.0000 85.3895 85.3895 0.0276 0.0000 85.96940.1126 0.0333 0.1459 0.0590 0.0307 0.0896Total 0.0670 0.7191 0.5778 9.7000e-004
0.0000 85.3895 85.3895 0.0276 0.0000 85.96940.0333 0.0333 0.0307 0.0307Off-Road 0.0670 0.7191 0.5778 9.7000e-004
0.0000 0.0000 0.0000 0.0000 0.0000 0.00000.1126 0.0000 0.1126 0.0590 0.0000 0.0590Fugitive Dust
Total CO2 CH4 N2O CO2e
Category tons/yr MT/yr
PM10 Total
Fugitive PM2.5
Exhaust PM2.5
PM2.5 Total
Bio- CO2 NBio- CO2
3.3 Grading - 2020Unmitigated Construction On-Site
ROG NOx CO SO2 Fugitive PM10
Exhaust PM10
0.0000 6.3227 6.3227 3.0000e-004
0.0000 6.32907.9000e-003
6.0000e-005
7.9600e-003
2.1000e-003
6.0000e-005
2.1500e-003
Total 2.0000e-003
2.9500e-003
0.0308 1.0000e-004
0.0000 6.3227 6.3227 3.0000e-004
0.0000 6.32907.9000e-003
6.0000e-005
7.9600e-003
2.1000e-003
6.0000e-005
2.1500e-003
Worker 2.0000e-003
2.9500e-003
0.0308 1.0000e-004
0.0000 0.0000 0.0000 0.0000 0.0000 0.00000.0000 0.0000 0.0000 0.0000 0.0000 0.0000Vendor 0.0000 0.0000 0.0000 0.0000
0.0000 0.0000 0.0000 0.0000 0.0000 0.00000.0000 0.0000 0.0000 0.0000 0.0000 0.0000Hauling 0.0000 0.0000 0.0000 0.0000
Total CO2 CH4 N2O CO2e
Category tons/yr MT/yr
PM10 Total
Fugitive PM2.5
Exhaust PM2.5
PM2.5 Total
Bio- CO2 NBio- CO2
Mitigated Construction Off-Site
ROG NOx CO SO2 Fugitive PM10
Exhaust PM10
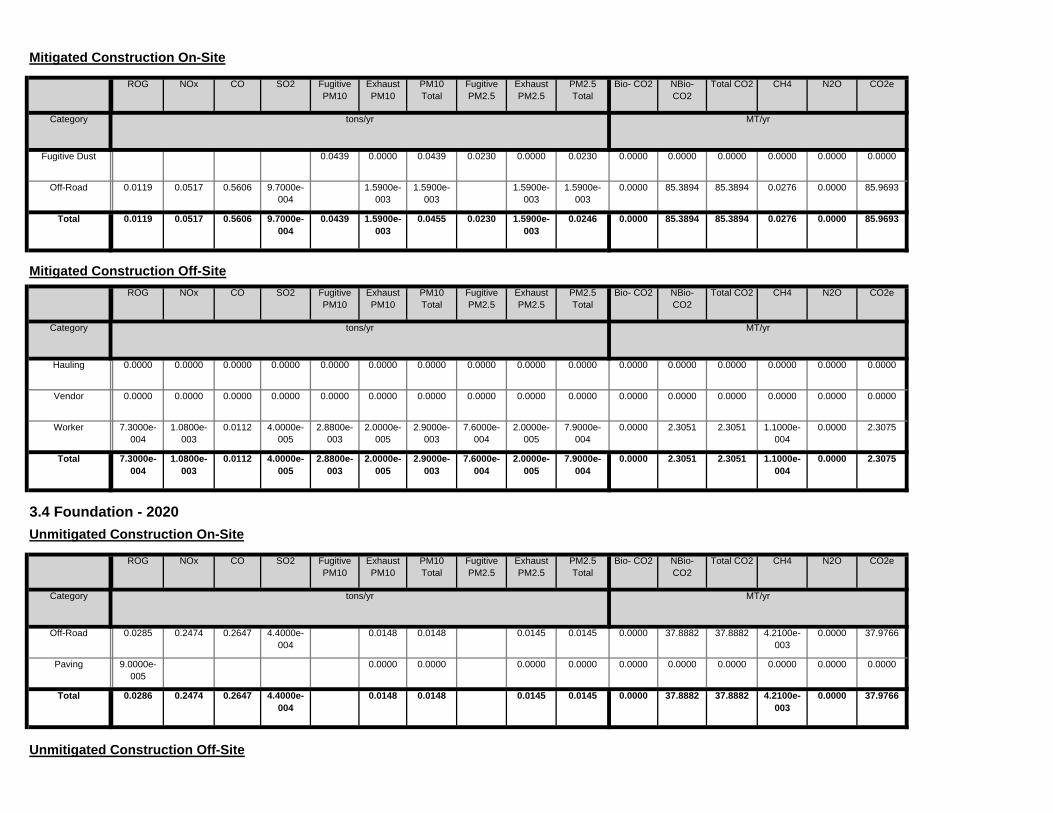
Unmitigated Construction Off-Site
0.0000 37.8882 37.8882 4.2100e-003
0.0000 37.97660.0148 0.0148 0.0145 0.0145Total 0.0286 0.2474 0.2647 4.4000e-004
0.0000 0.0000 0.0000 0.0000 0.0000 0.00000.0000 0.0000 0.0000 0.0000Paving 9.0000e-005
0.0000 37.8882 37.8882 4.2100e-003
0.0000 37.97660.0148 0.0148 0.0145 0.0145Off-Road 0.0285 0.2474 0.2647 4.4000e-004
Total CO2 CH4 N2O CO2e
Category tons/yr MT/yr
PM10 Total
Fugitive PM2.5
Exhaust PM2.5
PM2.5 Total
Bio- CO2 NBio- CO2
3.4 Foundation - 2020Unmitigated Construction On-Site
ROG NOx CO SO2 Fugitive PM10
Exhaust PM10
0.0000 2.3051 2.3051 1.1000e-004
0.0000 2.30752.8800e-003
2.0000e-005
2.9000e-003
7.6000e-004
2.0000e-005
7.9000e-004
Total 7.3000e-004
1.0800e-003
0.0112 4.0000e-005
0.0000 2.3051 2.3051 1.1000e-004
0.0000 2.30752.8800e-003
2.0000e-005
2.9000e-003
7.6000e-004
2.0000e-005
7.9000e-004
Worker 7.3000e-004
1.0800e-003
0.0112 4.0000e-005
0.0000 0.0000 0.0000 0.0000 0.0000 0.00000.0000 0.0000 0.0000 0.0000 0.0000 0.0000Vendor 0.0000 0.0000 0.0000 0.0000
0.0000 0.0000 0.0000 0.0000 0.0000 0.00000.0000 0.0000 0.0000 0.0000 0.0000 0.0000Hauling 0.0000 0.0000 0.0000 0.0000
Total CO2 CH4 N2O CO2e
Category tons/yr MT/yr
PM10 Total
Fugitive PM2.5
Exhaust PM2.5
PM2.5 Total
Bio- CO2 NBio- CO2
Mitigated Construction Off-SiteROG NOx CO SO2 Fugitive
PM10Exhaust PM10
0.0000 85.3894 85.3894 0.0276 0.0000 85.96930.0439 1.5900e-003
0.0455 0.0230 1.5900e-003
0.0246Total 0.0119 0.0517 0.5606 9.7000e-004
0.0000 85.3894 85.3894 0.0276 0.0000 85.96931.5900e-003
1.5900e-003
1.5900e-003
1.5900e-003
Off-Road 0.0119 0.0517 0.5606 9.7000e-004
0.0000 0.0000 0.0000 0.0000 0.0000 0.00000.0439 0.0000 0.0439 0.0230 0.0000 0.0230Fugitive Dust
Total CO2 CH4 N2O CO2e
Category tons/yr MT/yr
PM10 Total
Fugitive PM2.5
Exhaust PM2.5
PM2.5 Total
Bio- CO2 NBio- CO2
Mitigated Construction On-Site
ROG NOx CO SO2 Fugitive PM10
Exhaust PM10

0.0000 2.3710 2.3710 1.1000e-004
0.0000 2.37342.9600e-003
2.0000e-005
2.9900e-003
7.9000e-004
2.0000e-005
8.1000e-004
Total 7.5000e-004
1.1100e-003
0.0115 4.0000e-005
0.0000 2.3710 2.3710 1.1000e-004
0.0000 2.37342.9600e-003
2.0000e-005
2.9900e-003
7.9000e-004
2.0000e-005
8.1000e-004
Worker 7.5000e-004
1.1100e-003
0.0115 4.0000e-005
0.0000 0.0000 0.0000 0.0000 0.0000 0.00000.0000 0.0000 0.0000 0.0000 0.0000 0.0000Vendor 0.0000 0.0000 0.0000 0.0000
0.0000 0.0000 0.0000 0.0000 0.0000 0.00000.0000 0.0000 0.0000 0.0000 0.0000 0.0000Hauling 0.0000 0.0000 0.0000 0.0000
Total CO2 CH4 N2O CO2e
Category tons/yr MT/yr
PM10 Total
Fugitive PM2.5
Exhaust PM2.5
PM2.5 Total
Bio- CO2 NBio- CO2
Mitigated Construction Off-Site
ROG NOx CO SO2 Fugitive PM10
Exhaust PM10
0.0000 37.8882 37.8882 4.2100e-003
0.0000 37.97666.1000e-004
6.1000e-004
6.1000e-004
6.1000e-004
Total 4.6700e-003
0.0198 0.2823 4.4000e-004
0.0000 0.0000 0.0000 0.0000 0.0000 0.00000.0000 0.0000 0.0000 0.0000Paving 9.0000e-005
0.0000 37.8882 37.8882 4.2100e-003
0.0000 37.97666.1000e-004
6.1000e-004
6.1000e-004
6.1000e-004
Off-Road 4.5800e-003
0.0198 0.2823 4.4000e-004
Total CO2 CH4 N2O CO2e
Category tons/yr MT/yr
PM10 Total
Fugitive PM2.5
Exhaust PM2.5
PM2.5 Total
Bio- CO2 NBio- CO2
Mitigated Construction On-Site
ROG NOx CO SO2 Fugitive PM10
Exhaust PM10
0.0000 2.3710 2.3710 1.1000e-004
0.0000 2.37342.9600e-003
2.0000e-005
2.9900e-003
7.9000e-004
2.0000e-005
8.1000e-004
Total 7.5000e-004
1.1100e-003
0.0115 4.0000e-005
0.0000 2.3710 2.3710 1.1000e-004
0.0000 2.37342.9600e-003
2.0000e-005
2.9900e-003
7.9000e-004
2.0000e-005
8.1000e-004
Worker 7.5000e-004
1.1100e-003
0.0115 4.0000e-005
0.0000 0.0000 0.0000 0.0000 0.0000 0.00000.0000 0.0000 0.0000 0.0000 0.0000 0.0000Vendor 0.0000 0.0000 0.0000 0.0000
0.0000 0.0000 0.0000 0.0000 0.0000 0.00000.0000 0.0000 0.0000 0.0000 0.0000 0.0000Hauling 0.0000 0.0000 0.0000 0.0000
Total CO2 CH4 N2O CO2e
Category tons/yr MT/yr
PM10 Total
Fugitive PM2.5
Exhaust PM2.5
PM2.5 Total
Bio- CO2 NBio- CO2
ROG NOx CO SO2 Fugitive PM10
Exhaust PM10

0.0000 22.4542 22.4542 2.4000e-003
0.0000 22.50463.6000e-004
3.6000e-004
3.6000e-004
3.6000e-004
Total 2.7600e-003
0.0118 0.1673 2.6000e-004
0.0000 0.0000 0.0000 0.0000 0.0000 0.00000.0000 0.0000 0.0000 0.0000Paving 5.0000e-005
0.0000 22.4542 22.4542 2.4000e-003
0.0000 22.50463.6000e-004
3.6000e-004
3.6000e-004
3.6000e-004
Off-Road 2.7100e-003
0.0118 0.1673 2.6000e-004
Total CO2 CH4 N2O CO2e
Category tons/yr MT/yr
PM10 Total
Fugitive PM2.5
Exhaust PM2.5
PM2.5 Total
Bio- CO2 NBio- CO2
Mitigated Construction On-Site
ROG NOx CO SO2 Fugitive PM10
Exhaust PM10
0.0000 1.3833 1.3833 6.0000e-005
0.0000 1.38461.7600e-003
1.0000e-005
1.7700e-003
4.7000e-004
1.0000e-005
4.8000e-004
Total 4.2000e-004
6.1000e-004
6.4200e-003
2.0000e-005
0.0000 1.3833 1.3833 6.0000e-005
0.0000 1.38461.7600e-003
1.0000e-005
1.7700e-003
4.7000e-004
1.0000e-005
4.8000e-004
Worker 4.2000e-004
6.1000e-004
6.4200e-003
2.0000e-005
0.0000 0.0000 0.0000 0.0000 0.0000 0.00000.0000 0.0000 0.0000 0.0000 0.0000 0.0000Vendor 0.0000 0.0000 0.0000 0.0000
0.0000 0.0000 0.0000 0.0000 0.0000 0.00000.0000 0.0000 0.0000 0.0000 0.0000 0.0000Hauling 0.0000 0.0000 0.0000 0.0000
Total CO2 CH4 N2O CO2e
Category tons/yr MT/yr
PM10 Total
Fugitive PM2.5
Exhaust PM2.5
PM2.5 Total
Bio- CO2 NBio- CO2
Unmitigated Construction Off-SiteROG NOx CO SO2 Fugitive
PM10Exhaust PM10
0.0000 22.4542 22.4542 2.4000e-003
0.0000 22.50467.4700e-003
7.4700e-003
7.3300e-003
7.3300e-003
Total 0.0152 0.1331 0.1559 2.6000e-004
0.0000 0.0000 0.0000 0.0000 0.0000 0.00000.0000 0.0000 0.0000 0.0000Paving 5.0000e-005
0.0000 22.4542 22.4542 2.4000e-003
0.0000 22.50467.4700e-003
7.4700e-003
7.3300e-003
7.3300e-003
Off-Road 0.0152 0.1331 0.1559 2.6000e-004
Total CO2 CH4 N2O CO2e
Category tons/yr MT/yr
PM10 Total
Fugitive PM2.5
Exhaust PM2.5
PM2.5 Total
Bio- CO2 NBio- CO2
3.4 Foundation - 2021Unmitigated Construction On-Site
ROG NOx CO SO2 Fugitive PM10
Exhaust PM10

0.0000 529.5278 529.5278 0.0246 0.0000 530.04510.6720 5.2400e-003
0.6772 0.1785 4.8600e-003
0.1833Total 0.1608 0.2348 2.4577 8.2400e-003
0.0000 529.5278 529.5278 0.0246 0.0000 530.04510.6720 5.2400e-003
0.6772 0.1785 4.8600e-003
0.1833Worker 0.1608 0.2348 2.4577 8.2400e-003
0.0000 0.0000 0.0000 0.0000 0.0000 0.00000.0000 0.0000 0.0000 0.0000 0.0000 0.0000Vendor 0.0000 0.0000 0.0000 0.0000
0.0000 0.0000 0.0000 0.0000 0.0000 0.00000.0000 0.0000 0.0000 0.0000 0.0000 0.0000Hauling 0.0000 0.0000 0.0000 0.0000
Total CO2 CH4 N2O CO2e
Category tons/yr MT/yr
PM10 Total
Fugitive PM2.5
Exhaust PM2.5
PM2.5 Total
Bio- CO2 NBio- CO2
Unmitigated Construction Off-SiteROG NOx CO SO2 Fugitive
PM10Exhaust PM10
0.0000 152.0290 152.0290 0.0303 0.0000 152.66550.0650 0.0650 0.0614 0.0614Total 0.1143 1.0534 1.1574 1.7500e-003
0.0000 152.0290 152.0290 0.0303 0.0000 152.66550.0650 0.0650 0.0614 0.0614Off-Road 0.1143 1.0534 1.1574 1.7500e-003
Total CO2 CH4 N2O CO2e
Category tons/yr MT/yr
PM10 Total
Fugitive PM2.5
Exhaust PM2.5
PM2.5 Total
Bio- CO2 NBio- CO2
3.5 Building Construction - 2021Unmitigated Construction On-Site
ROG NOx CO SO2 Fugitive PM10
Exhaust PM10
0.0000 1.3833 1.3833 6.0000e-005
0.0000 1.38461.7600e-003
1.0000e-005
1.7700e-003
4.7000e-004
1.0000e-005
4.8000e-004
Total 4.2000e-004
6.1000e-004
6.4200e-003
2.0000e-005
0.0000 1.3833 1.3833 6.0000e-005
0.0000 1.38461.7600e-003
1.0000e-005
1.7700e-003
4.7000e-004
1.0000e-005
4.8000e-004
Worker 4.2000e-004
6.1000e-004
6.4200e-003
2.0000e-005
0.0000 0.0000 0.0000 0.0000 0.0000 0.00000.0000 0.0000 0.0000 0.0000 0.0000 0.0000Vendor 0.0000 0.0000 0.0000 0.0000
0.0000 0.0000 0.0000 0.0000 0.0000 0.00000.0000 0.0000 0.0000 0.0000 0.0000 0.0000Hauling 0.0000 0.0000 0.0000 0.0000
Total CO2 CH4 N2O CO2e
Category tons/yr MT/yr
PM10 Total
Fugitive PM2.5
Exhaust PM2.5
PM2.5 Total
Bio- CO2 NBio- CO2
Mitigated Construction Off-Site
ROG NOx CO SO2 Fugitive PM10
Exhaust PM10

0.0000 161.3769 161.3769 0.0319 0.0000 162.04720.0581 0.0581 0.0550 0.0550Total 0.1086 1.0099 1.2188 1.8600e-003
0.0000 161.3769 161.3769 0.0319 0.0000 162.04720.0581 0.0581 0.0550 0.0550Off-Road 0.1086 1.0099 1.2188 1.8600e-003
Total CO2 CH4 N2O CO2e
Category tons/yr MT/yr
PM10 Total
Fugitive PM2.5
Exhaust PM2.5
PM2.5 Total
Bio- CO2 NBio- CO2
3.5 Building Construction - 2022Unmitigated Construction On-Site
ROG NOx CO SO2 Fugitive PM10
Exhaust PM10
0.0000 529.5278 529.5278 0.0246 0.0000 530.04510.6720 5.2400e-003
0.6772 0.1785 4.8600e-003
0.1833Total 0.1608 0.2348 2.4577 8.2400e-003
0.0000 529.5278 529.5278 0.0246 0.0000 530.04510.6720 5.2400e-003
0.6772 0.1785 4.8600e-003
0.1833Worker 0.1608 0.2348 2.4577 8.2400e-003
0.0000 0.0000 0.0000 0.0000 0.0000 0.00000.0000 0.0000 0.0000 0.0000 0.0000 0.0000Vendor 0.0000 0.0000 0.0000 0.0000
0.0000 0.0000 0.0000 0.0000 0.0000 0.00000.0000 0.0000 0.0000 0.0000 0.0000 0.0000Hauling 0.0000 0.0000 0.0000 0.0000
Total CO2 CH4 N2O CO2e
Category tons/yr MT/yr
PM10 Total
Fugitive PM2.5
Exhaust PM2.5
PM2.5 Total
Bio- CO2 NBio- CO2
Mitigated Construction Off-Site
ROG NOx CO SO2 Fugitive PM10
Exhaust PM10
0.0000 152.0289 152.0289 0.0303 0.0000 152.66542.6200e-003
2.6200e-003
2.6200e-003
2.6200e-003
Total 0.0196 0.0851 1.2107 1.7500e-003
0.0000 152.0289 152.0289 0.0303 0.0000 152.66542.6200e-003
2.6200e-003
2.6200e-003
2.6200e-003
Off-Road 0.0196 0.0851 1.2107 1.7500e-003
Total CO2 CH4 N2O CO2e
Category tons/yr MT/yr
PM10 Total
Fugitive PM2.5
Exhaust PM2.5
PM2.5 Total
Bio- CO2 NBio- CO2
Mitigated Construction On-SiteROG NOx CO SO2 Fugitive
PM10Exhaust PM10

0.0000 552.6141 552.6141 0.0250 0.0000 553.13980.7131 5.5600e-003
0.7187 0.1894 5.1500e-003
0.1946Total 0.1615 0.2337 2.4525 8.7500e-003
0.0000 552.6141 552.6141 0.0250 0.0000 553.13980.7131 5.5600e-003
0.7187 0.1894 5.1500e-003
0.1946Worker 0.1615 0.2337 2.4525 8.7500e-003
0.0000 0.0000 0.0000 0.0000 0.0000 0.00000.0000 0.0000 0.0000 0.0000 0.0000 0.0000Vendor 0.0000 0.0000 0.0000 0.0000
0.0000 0.0000 0.0000 0.0000 0.0000 0.00000.0000 0.0000 0.0000 0.0000 0.0000 0.0000Hauling 0.0000 0.0000 0.0000 0.0000
Total CO2 CH4 N2O CO2e
Category tons/yr MT/yr
PM10 Total
Fugitive PM2.5
Exhaust PM2.5
PM2.5 Total
Bio- CO2 NBio- CO2
Mitigated Construction Off-Site
ROG NOx CO SO2 Fugitive PM10
Exhaust PM10
0.0000 161.3767 161.3767 0.0319 0.0000 162.04702.7800e-003
2.7800e-003
2.7800e-003
2.7800e-003
Total 0.0208 0.0903 1.2848 1.8600e-003
0.0000 161.3767 161.3767 0.0319 0.0000 162.04702.7800e-003
2.7800e-003
2.7800e-003
2.7800e-003
Off-Road 0.0208 0.0903 1.2848 1.8600e-003
Total CO2 CH4 N2O CO2e
Category tons/yr MT/yr
PM10 Total
Fugitive PM2.5
Exhaust PM2.5
PM2.5 Total
Bio- CO2 NBio- CO2
Mitigated Construction On-SiteROG NOx CO SO2 Fugitive
PM10Exhaust PM10
0.0000 552.6141 552.6141 0.0250 0.0000 553.13980.7131 5.5600e-003
0.7187 0.1894 5.1500e-003
0.1946Total 0.1615 0.2337 2.4525 8.7500e-003
0.0000 552.6141 552.6141 0.0250 0.0000 553.13980.7131 5.5600e-003
0.7187 0.1894 5.1500e-003
0.1946Worker 0.1615 0.2337 2.4525 8.7500e-003
0.0000 0.0000 0.0000 0.0000 0.0000 0.00000.0000 0.0000 0.0000 0.0000 0.0000 0.0000Vendor 0.0000 0.0000 0.0000 0.0000
0.0000 0.0000 0.0000 0.0000 0.0000 0.00000.0000 0.0000 0.0000 0.0000 0.0000 0.0000Hauling 0.0000 0.0000 0.0000 0.0000
Total CO2 CH4 N2O CO2e
Category tons/yr MT/yr
PM10 Total
Fugitive PM2.5
Exhaust PM2.5
PM2.5 Total
Bio- CO2 NBio- CO2
Unmitigated Construction Off-Site
ROG NOx CO SO2 Fugitive PM10
Exhaust PM10

Total CO2 CH4 N2O CO2ePM10 Total
Fugitive PM2.5
Exhaust PM2.5
PM2.5 Total
Bio- CO2 NBio- CO2
Mitigated Construction Off-Site
ROG NOx CO SO2 Fugitive PM10
Exhaust PM10
0.0000 32.9041 32.9041 6.4600e-003
0.0000 33.03975.7000e-004
5.7000e-004
5.7000e-004
5.7000e-004
Total 4.2500e-003
0.0184 0.2619 3.8000e-004
0.0000 32.9041 32.9041 6.4600e-003
0.0000 33.03975.7000e-004
5.7000e-004
5.7000e-004
5.7000e-004
Off-Road 4.2500e-003
0.0184 0.2619 3.8000e-004
Total CO2 CH4 N2O CO2e
Category tons/yr MT/yr
PM10 Total
Fugitive PM2.5
Exhaust PM2.5
PM2.5 Total
Bio- CO2 NBio- CO2
Mitigated Construction On-Site
ROG NOx CO SO2 Fugitive PM10
Exhaust PM10
0.0000 110.9125 110.9125 4.9000e-003
0.0000 111.01540.1454 1.1300e-003
0.1465 0.0386 1.0500e-003
0.0397Total 0.0312 0.0448 0.4710 1.7800e-003
0.0000 110.9125 110.9125 4.9000e-003
0.0000 111.01540.1454 1.1300e-003
0.1465 0.0386 1.0500e-003
0.0397Worker 0.0312 0.0448 0.4710 1.7800e-003
0.0000 0.0000 0.0000 0.0000 0.0000 0.00000.0000 0.0000 0.0000 0.0000 0.0000 0.0000Vendor 0.0000 0.0000 0.0000 0.0000
0.0000 0.0000 0.0000 0.0000 0.0000 0.00000.0000 0.0000 0.0000 0.0000 0.0000 0.0000Hauling 0.0000 0.0000 0.0000 0.0000
Total CO2 CH4 N2O CO2e
Category tons/yr MT/yr
PM10 Total
Fugitive PM2.5
Exhaust PM2.5
PM2.5 Total
Bio- CO2 NBio- CO2
Unmitigated Construction Off-Site
ROG NOx CO SO2 Fugitive PM10
Exhaust PM10
0.0000 32.9042 32.9042 6.4600e-003
0.0000 33.03980.0101 0.0101 9.5800e-003
9.5800e-003
Total 0.0203 0.1890 0.2474 3.8000e-004
0.0000 32.9042 32.9042 6.4600e-003
0.0000 33.03980.0101 0.0101 9.5800e-003
9.5800e-003
Off-Road 0.0203 0.1890 0.2474 3.8000e-004
Total CO2 CH4 N2O CO2e
Category tons/yr MT/yr
PM10 Total
Fugitive PM2.5
Exhaust PM2.5
PM2.5 Total
Bio- CO2 NBio- CO2
3.5 Building Construction - 2023Unmitigated Construction On-Site
ROG NOx CO SO2 Fugitive PM10
Exhaust PM10
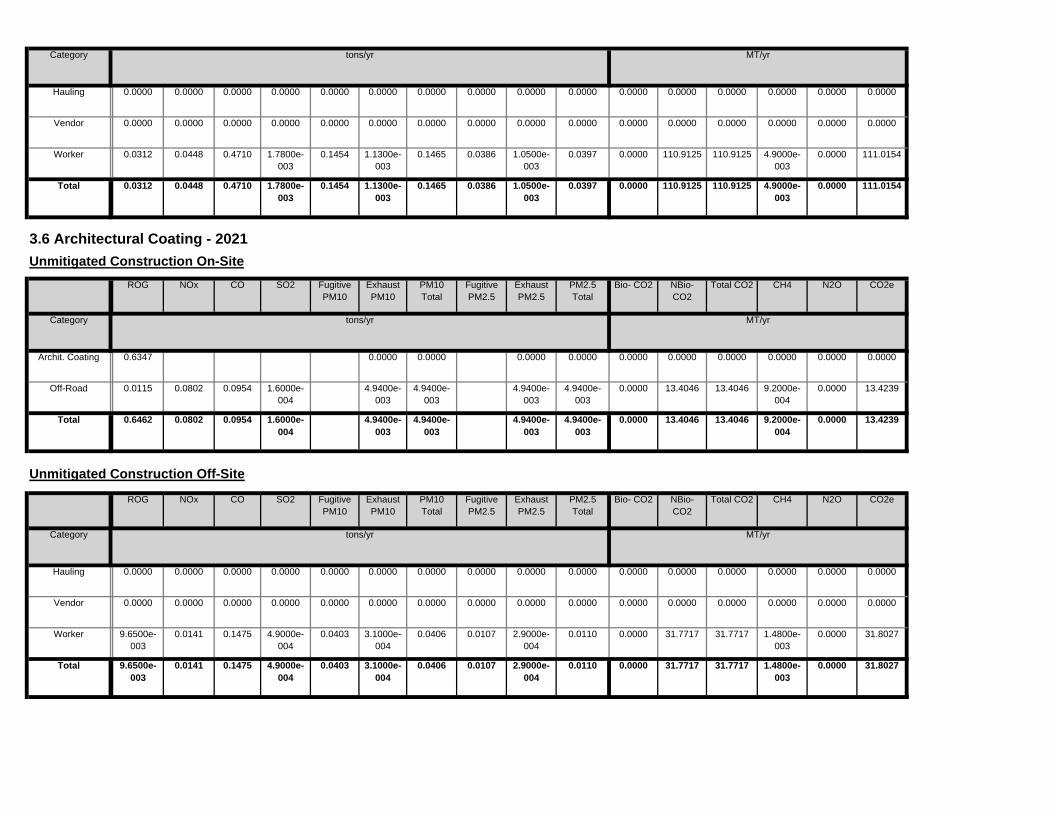
0.0000 31.7717 31.7717 1.4800e-003
0.0000 31.80270.0403 3.1000e-004
0.0406 0.0107 2.9000e-004
0.0110Total 9.6500e-003
0.0141 0.1475 4.9000e-004
0.0000 31.7717 31.7717 1.4800e-003
0.0000 31.80270.0403 3.1000e-004
0.0406 0.0107 2.9000e-004
0.0110Worker 9.6500e-003
0.0141 0.1475 4.9000e-004
0.0000 0.0000 0.0000 0.0000 0.0000 0.00000.0000 0.0000 0.0000 0.0000 0.0000 0.0000Vendor 0.0000 0.0000 0.0000 0.0000
0.0000 0.0000 0.0000 0.0000 0.0000 0.00000.0000 0.0000 0.0000 0.0000 0.0000 0.0000Hauling 0.0000 0.0000 0.0000 0.0000
Total CO2 CH4 N2O CO2e
Category tons/yr MT/yr
PM10 Total
Fugitive PM2.5
Exhaust PM2.5
PM2.5 Total
Bio- CO2 NBio- CO2
Unmitigated Construction Off-Site
ROG NOx CO SO2 Fugitive PM10
Exhaust PM10
0.0000 13.4046 13.4046 9.2000e-004
0.0000 13.42394.9400e-003
4.9400e-003
4.9400e-003
4.9400e-003
Total 0.6462 0.0802 0.0954 1.6000e-004
0.0000 13.4046 13.4046 9.2000e-004
0.0000 13.42394.9400e-003
4.9400e-003
4.9400e-003
4.9400e-003
Off-Road 0.0115 0.0802 0.0954 1.6000e-004
0.0000 0.0000 0.0000 0.0000 0.0000 0.00000.0000 0.0000 0.0000 0.0000Archit. Coating 0.6347
Total CO2 CH4 N2O CO2e
Category tons/yr MT/yr
PM10 Total
Fugitive PM2.5
Exhaust PM2.5
PM2.5 Total
Bio- CO2 NBio- CO2
3.6 Architectural Coating - 2021Unmitigated Construction On-Site
ROG NOx CO SO2 Fugitive PM10
Exhaust PM10
0.0000 110.9125 110.9125 4.9000e-003
0.0000 111.01540.1454 1.1300e-003
0.1465 0.0386 1.0500e-003
0.0397Total 0.0312 0.0448 0.4710 1.7800e-003
0.0000 110.9125 110.9125 4.9000e-003
0.0000 111.01540.1454 1.1300e-003
0.1465 0.0386 1.0500e-003
0.0397Worker 0.0312 0.0448 0.4710 1.7800e-003
0.0000 0.0000 0.0000 0.0000 0.0000 0.00000.0000 0.0000 0.0000 0.0000 0.0000 0.0000Vendor 0.0000 0.0000 0.0000 0.0000
0.0000 0.0000 0.0000 0.0000 0.0000 0.00000.0000 0.0000 0.0000 0.0000 0.0000 0.0000Hauling 0.0000 0.0000 0.0000 0.0000
Category tons/yr MT/yr
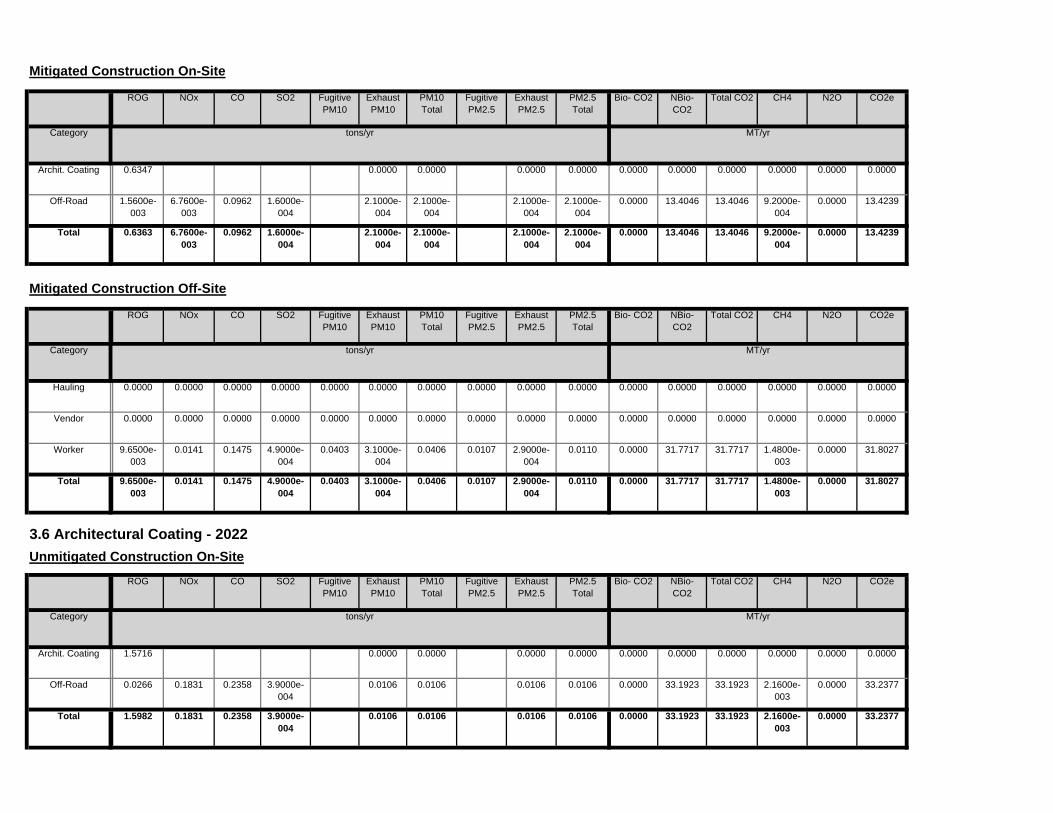
0.0000 33.1923 33.1923 2.1600e-003
0.0000 33.23770.0106 0.0106 0.0106 0.0106Total 1.5982 0.1831 0.2358 3.9000e-004
0.0000 33.1923 33.1923 2.1600e-003
0.0000 33.23770.0106 0.0106 0.0106 0.0106Off-Road 0.0266 0.1831 0.2358 3.9000e-004
0.0000 0.0000 0.0000 0.0000 0.0000 0.00000.0000 0.0000 0.0000 0.0000Archit. Coating 1.5716
Total CO2 CH4 N2O CO2e
Category tons/yr MT/yr
PM10 Total
Fugitive PM2.5
Exhaust PM2.5
PM2.5 Total
Bio- CO2 NBio- CO2
3.6 Architectural Coating - 2022Unmitigated Construction On-Site
ROG NOx CO SO2 Fugitive PM10
Exhaust PM10
0.0000 31.7717 31.7717 1.4800e-003
0.0000 31.80270.0403 3.1000e-004
0.0406 0.0107 2.9000e-004
0.0110Total 9.6500e-003
0.0141 0.1475 4.9000e-004
0.0000 31.7717 31.7717 1.4800e-003
0.0000 31.80270.0403 3.1000e-004
0.0406 0.0107 2.9000e-004
0.0110Worker 9.6500e-003
0.0141 0.1475 4.9000e-004
0.0000 0.0000 0.0000 0.0000 0.0000 0.00000.0000 0.0000 0.0000 0.0000 0.0000 0.0000Vendor 0.0000 0.0000 0.0000 0.0000
0.0000 0.0000 0.0000 0.0000 0.0000 0.00000.0000 0.0000 0.0000 0.0000 0.0000 0.0000Hauling 0.0000 0.0000 0.0000 0.0000
Total CO2 CH4 N2O CO2e
Category tons/yr MT/yr
PM10 Total
Fugitive PM2.5
Exhaust PM2.5
PM2.5 Total
Bio- CO2 NBio- CO2
Mitigated Construction Off-Site
ROG NOx CO SO2 Fugitive PM10
Exhaust PM10
0.0000 13.4046 13.4046 9.2000e-004
0.0000 13.42392.1000e-004
2.1000e-004
2.1000e-004
2.1000e-004
Total 0.6363 6.7600e-003
0.0962 1.6000e-004
0.0000 13.4046 13.4046 9.2000e-004
0.0000 13.42392.1000e-004
2.1000e-004
2.1000e-004
2.1000e-004
Off-Road 1.5600e-003
6.7600e-003
0.0962 1.6000e-004
0.0000 0.0000 0.0000 0.0000 0.0000 0.00000.0000 0.0000 0.0000 0.0000Archit. Coating 0.6347
Total CO2 CH4 N2O CO2e
Category tons/yr MT/yr
PM10 Total
Fugitive PM2.5
Exhaust PM2.5
PM2.5 Total
Bio- CO2 NBio- CO2
Mitigated Construction On-Site
ROG NOx CO SO2 Fugitive PM10
Exhaust PM10

0.0000 77.3660 77.3660 3.5000e-003
0.0000 77.43960.0998 7.8000e-004
0.1006 0.0265 7.2000e-004
0.0272Total 0.0226 0.0327 0.3434 1.2200e-003
0.0000 77.3660 77.3660 3.5000e-003
0.0000 77.43960.0998 7.8000e-004
0.1006 0.0265 7.2000e-004
0.0272Worker 0.0226 0.0327 0.3434 1.2200e-003
0.0000 0.0000 0.0000 0.0000 0.0000 0.00000.0000 0.0000 0.0000 0.0000 0.0000 0.0000Vendor 0.0000 0.0000 0.0000 0.0000
0.0000 0.0000 0.0000 0.0000 0.0000 0.00000.0000 0.0000 0.0000 0.0000 0.0000 0.0000Hauling 0.0000 0.0000 0.0000 0.0000
Total CO2 CH4 N2O CO2e
Category tons/yr MT/yr
PM10 Total
Fugitive PM2.5
Exhaust PM2.5
PM2.5 Total
Bio- CO2 NBio- CO2
Mitigated Construction Off-Site
ROG NOx CO SO2 Fugitive PM10
Exhaust PM10
0.0000 33.1923 33.1923 2.1600e-003
0.0000 33.23765.2000e-004
5.2000e-004
5.2000e-004
5.2000e-004
Total 1.5755 0.0167 0.2382 3.9000e-004
0.0000 33.1923 33.1923 2.1600e-003
0.0000 33.23765.2000e-004
5.2000e-004
5.2000e-004
5.2000e-004
Off-Road 3.8600e-003
0.0167 0.2382 3.9000e-004
0.0000 0.0000 0.0000 0.0000 0.0000 0.00000.0000 0.0000 0.0000 0.0000Archit. Coating 1.5716
Total CO2 CH4 N2O CO2e
Category tons/yr MT/yr
PM10 Total
Fugitive PM2.5
Exhaust PM2.5
PM2.5 Total
Bio- CO2 NBio- CO2
Mitigated Construction On-Site
ROG NOx CO SO2 Fugitive PM10
Exhaust PM10
0.0000 77.3660 77.3660 3.5000e-003
0.0000 77.43960.0998 7.8000e-004
0.1006 0.0265 7.2000e-004
0.0272Total 0.0226 0.0327 0.3434 1.2200e-003
0.0000 77.3660 77.3660 3.5000e-003
0.0000 77.43960.0998 7.8000e-004
0.1006 0.0265 7.2000e-004
0.0272Worker 0.0226 0.0327 0.3434 1.2200e-003
0.0000 0.0000 0.0000 0.0000 0.0000 0.00000.0000 0.0000 0.0000 0.0000 0.0000 0.0000Vendor 0.0000 0.0000 0.0000 0.0000
0.0000 0.0000 0.0000 0.0000 0.0000 0.00000.0000 0.0000 0.0000 0.0000 0.0000 0.0000Hauling 0.0000 0.0000 0.0000 0.0000
Total CO2 CH4 N2O CO2e
Category tons/yr MT/yr
PM10 Total
Fugitive PM2.5
Exhaust PM2.5
PM2.5 Total
Bio- CO2 NBio- CO2
Unmitigated Construction Off-Site
ROG NOx CO SO2 Fugitive PM10
Exhaust PM10

0.0000 1.2766 1.2766 8.0000e-005
0.0000 1.27822.0000e-005
2.0000e-005
2.0000e-005
2.0000e-005
Total 0.0606 6.4000e-004
9.1600e-003
1.0000e-005
0.0000 1.2766 1.2766 8.0000e-005
0.0000 1.27822.0000e-005
2.0000e-005
2.0000e-005
2.0000e-005
Off-Road 1.5000e-004
6.4000e-004
9.1600e-003
1.0000e-005
0.0000 0.0000 0.0000 0.0000 0.0000 0.00000.0000 0.0000 0.0000 0.0000Archit. Coating 0.0605
Total CO2 CH4 N2O CO2e
Category tons/yr MT/yr
PM10 Total
Fugitive PM2.5
Exhaust PM2.5
PM2.5 Total
Bio- CO2 NBio- CO2
Mitigated Construction On-SiteROG NOx CO SO2 Fugitive
PM10Exhaust PM10
0.0000 2.9298 2.9298 1.3000e-004
0.0000 2.93253.8400e-003
3.0000e-005
3.8700e-003
1.0200e-003
3.0000e-005
1.0500e-003
Total 8.2000e-004
1.1800e-003
0.0124 5.0000e-005
0.0000 2.9298 2.9298 1.3000e-004
0.0000 2.93253.8400e-003
3.0000e-005
3.8700e-003
1.0200e-003
3.0000e-005
1.0500e-003
Worker 8.2000e-004
1.1800e-003
0.0124 5.0000e-005
0.0000 0.0000 0.0000 0.0000 0.0000 0.00000.0000 0.0000 0.0000 0.0000 0.0000 0.0000Vendor 0.0000 0.0000 0.0000 0.0000
0.0000 0.0000 0.0000 0.0000 0.0000 0.00000.0000 0.0000 0.0000 0.0000 0.0000 0.0000Hauling 0.0000 0.0000 0.0000 0.0000
Total CO2 CH4 N2O CO2e
Category tons/yr MT/yr
PM10 Total
Fugitive PM2.5
Exhaust PM2.5
PM2.5 Total
Bio- CO2 NBio- CO2
Unmitigated Construction Off-Site
ROG NOx CO SO2 Fugitive PM10
Exhaust PM10
0.0000 1.2766 1.2766 8.0000e-005
0.0000 1.27823.5000e-004
3.5000e-004
3.5000e-004
3.5000e-004
Total 0.0614 6.5100e-003
9.0600e-003
1.0000e-005
0.0000 1.2766 1.2766 8.0000e-005
0.0000 1.27823.5000e-004
3.5000e-004
3.5000e-004
3.5000e-004
Off-Road 9.6000e-004
6.5100e-003
9.0600e-003
1.0000e-005
0.0000 0.0000 0.0000 0.0000 0.0000 0.00000.0000 0.0000 0.0000 0.0000Archit. Coating 0.0605
Total CO2 CH4 N2O CO2e
Category tons/yr MT/yr
PM10 Total
Fugitive PM2.5
Exhaust PM2.5
PM2.5 Total
Bio- CO2 NBio- CO2
3.6 Architectural Coating - 2023Unmitigated Construction On-Site
ROG NOx CO SO2 Fugitive PM10
Exhaust PM10

0.0000 0.8645 0.8645 4.0000e-005
0.0000 0.86541.1000e-003
1.0000e-005
1.1100e-003
2.9000e-004
1.0000e-005
3.0000e-004
Total 2.6000e-004
3.8000e-004
4.0100e-003
1.0000e-005
0.0000 0.8645 0.8645 4.0000e-005
0.0000 0.86541.1000e-003
1.0000e-005
1.1100e-003
2.9000e-004
1.0000e-005
3.0000e-004
Worker 2.6000e-004
3.8000e-004
4.0100e-003
1.0000e-005
0.0000 0.0000 0.0000 0.0000 0.0000 0.00000.0000 0.0000 0.0000 0.0000 0.0000 0.0000Vendor 0.0000 0.0000 0.0000 0.0000
0.0000 0.0000 0.0000 0.0000 0.0000 0.00000.0000 0.0000 0.0000 0.0000 0.0000 0.0000Hauling 0.0000 0.0000 0.0000 0.0000
Total CO2 CH4 N2O CO2e
Category tons/yr MT/yr
PM10 Total
Fugitive PM2.5
Exhaust PM2.5
PM2.5 Total
Bio- CO2 NBio- CO2
Unmitigated Construction Off-SiteROG NOx CO SO2 Fugitive
PM10Exhaust PM10
0.0000 9.7987 9.7987 3.1700e-003
0.0000 9.86533.3300e-003
3.3300e-003
3.0600e-003
3.0600e-003
Total 6.2900e-003
0.0633 0.0718 1.1000e-004
0.0000 0.0000 0.0000 0.0000 0.0000 0.00000.0000 0.0000 0.0000 0.0000Paving 1.4000e-004
0.0000 9.7987 9.7987 3.1700e-003
0.0000 9.86533.3300e-003
3.3300e-003
3.0600e-003
3.0600e-003
Off-Road 6.1500e-003
0.0633 0.0718 1.1000e-004
Total CO2 CH4 N2O CO2e
Category tons/yr MT/yr
PM10 Total
Fugitive PM2.5
Exhaust PM2.5
PM2.5 Total
Bio- CO2 NBio- CO2
3.7 Paving - 2021Unmitigated Construction On-Site
ROG NOx CO SO2 Fugitive PM10
Exhaust PM10
0.0000 2.9298 2.9298 1.3000e-004
0.0000 2.93253.8400e-003
3.0000e-005
3.8700e-003
1.0200e-003
3.0000e-005
1.0500e-003
Total 8.2000e-004
1.1800e-003
0.0124 5.0000e-005
0.0000 2.9298 2.9298 1.3000e-004
0.0000 2.93253.8400e-003
3.0000e-005
3.8700e-003
1.0200e-003
3.0000e-005
1.0500e-003
Worker 8.2000e-004
1.1800e-003
0.0124 5.0000e-005
0.0000 0.0000 0.0000 0.0000 0.0000 0.00000.0000 0.0000 0.0000 0.0000 0.0000 0.0000Vendor 0.0000 0.0000 0.0000 0.0000
0.0000 0.0000 0.0000 0.0000 0.0000 0.00000.0000 0.0000 0.0000 0.0000 0.0000 0.0000Hauling 0.0000 0.0000 0.0000 0.0000
Total CO2 CH4 N2O CO2e
Category tons/yr MT/yr
PM10 Total
Fugitive PM2.5
Exhaust PM2.5
PM2.5 Total
Bio- CO2 NBio- CO2
Mitigated Construction Off-Site
ROG NOx CO SO2 Fugitive PM10
Exhaust PM10
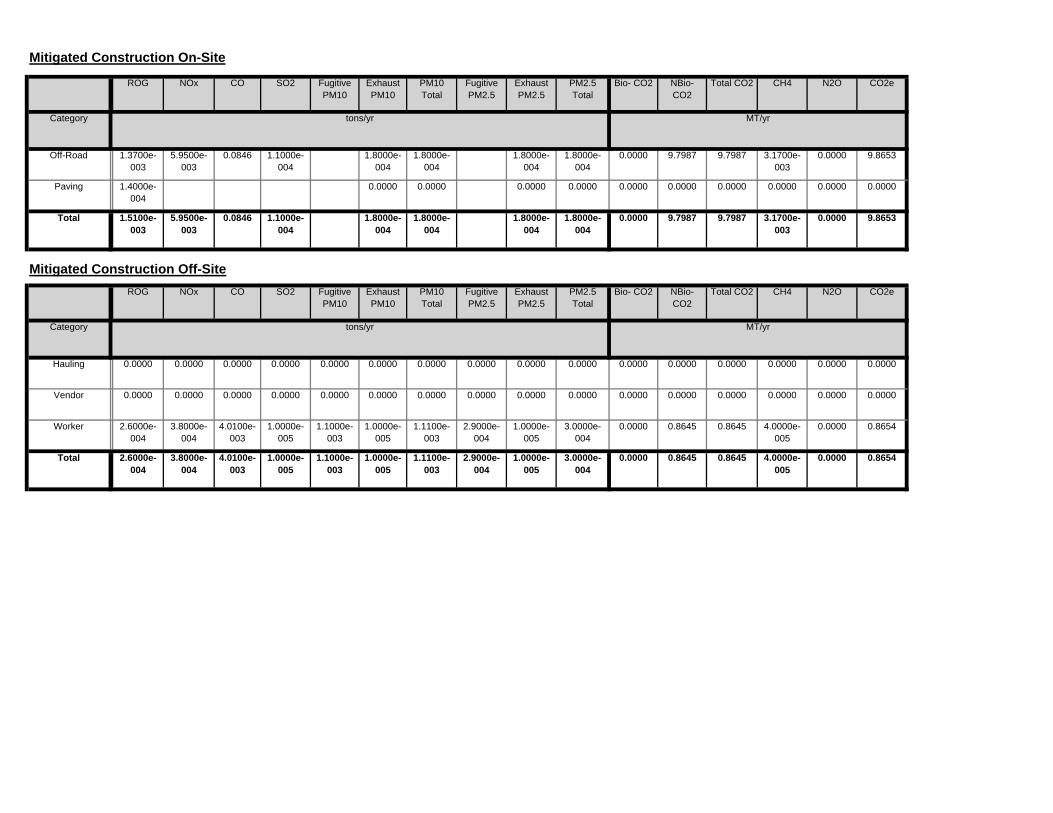
0.0000 0.8645 0.8645 4.0000e-005
0.0000 0.86541.1000e-003
1.0000e-005
1.1100e-003
2.9000e-004
1.0000e-005
3.0000e-004
Total 2.6000e-004
3.8000e-004
4.0100e-003
1.0000e-005
0.0000 0.8645 0.8645 4.0000e-005
0.0000 0.86541.1000e-003
1.0000e-005
1.1100e-003
2.9000e-004
1.0000e-005
3.0000e-004
Worker 2.6000e-004
3.8000e-004
4.0100e-003
1.0000e-005
0.0000 0.0000 0.0000 0.0000 0.0000 0.00000.0000 0.0000 0.0000 0.0000 0.0000 0.0000Vendor 0.0000 0.0000 0.0000 0.0000
0.0000 0.0000 0.0000 0.0000 0.0000 0.00000.0000 0.0000 0.0000 0.0000 0.0000 0.0000Hauling 0.0000 0.0000 0.0000 0.0000
Total CO2 CH4 N2O CO2e
Category tons/yr MT/yr
PM10 Total
Fugitive PM2.5
Exhaust PM2.5
PM2.5 Total
Bio- CO2 NBio- CO2
Mitigated Construction Off-SiteROG NOx CO SO2 Fugitive
PM10Exhaust PM10
0.0000 9.7987 9.7987 3.1700e-003
0.0000 9.86531.8000e-004
1.8000e-004
1.8000e-004
1.8000e-004
Total 1.5100e-003
5.9500e-003
0.0846 1.1000e-004
0.0000 0.0000 0.0000 0.0000 0.0000 0.00000.0000 0.0000 0.0000 0.0000Paving 1.4000e-004
0.0000 9.7987 9.7987 3.1700e-003
0.0000 9.86531.8000e-004
1.8000e-004
1.8000e-004
1.8000e-004
Off-Road 1.3700e-003
5.9500e-003
0.0846 1.1000e-004
Total CO2 CH4 N2O CO2e
Category tons/yr MT/yr
PM10 Total
Fugitive PM2.5
Exhaust PM2.5
PM2.5 Total
Bio- CO2 NBio- CO2
Mitigated Construction On-Site
ROG NOx CO SO2 Fugitive PM10
Exhaust PM10

AppendixA.2OperationalEmissions(CalEEMod)
EmissionsModelInputs
CalEEModOutput–Existing
CalEEModOutput–Project

1020 S. Figueroa Street Project EIRAir Quality and Greenhouse Gas Assessment
Trip Generation Rates
Land Use Units Res. Pop. Trips/dayTrip Rate (trips/unit) Trips/day
Trip Rate (trips/unit)
Existing Uses (2015)Hotel 178 rooms 112,748 sf 1,090 6.12 1,090 6.12Above‐Grade Parking Structure ‐ spaces ‐ sfSubterranean Parking Structure 86 spaces 34,400 sfSurface Parking Lot 198 spaces 79,200 sf
Interim Year (Phase 1 ends 2020)Residential + Amenities 290 DU 352,000 sf 473 1,054 3.63 949 3.27
Retail/Commercial 15.0 ksf 15,000 sf 564 37.60 314 20.93Restaurant 15.0 ksf 15,000 sf 1,678 111.87 934 62.27
Hotel 300 rooms 280,000 sf 1,838 6.13 1,654 5.51
Above‐Grade Parking Structure ‐ spaces ‐ sfSubterranean Parking Structure 437 spaces 174,800 sfOpen Space 29.3 ksf 0.67 acre
Full Buildout (Phase 1 + 2 ends 2023)Residential + Amenities 650 DU 770,000 sf 1060 2,139 3.29 1,925 2.96
Commercial 40.0 ksf 40,000 sf 1,503 37.58 836 20.90Restaurant 40.0 ksf 40,000 sf 4,476 111.90 2,490 62.25
Hotel 300 rooms 280,000 sf 1,838 6.13 1,654 5.51
Above‐Grade Parking Structure ‐ spaces ‐ sfSubterranean Parking Structure 799 spaces 319,600 sfOpen Space 49.8 ksf 1.14 acrePlaza Area 5.0 ksf 5,000 sf
Lot Area (acres)/Developed Area (sf) 2.70 acres 116,660 sfSources: Hazens Group, March 2016; PCR Services Corporation, March 2016 Source: Traffic Study, March 2016; PCR Services Corporation, March 2016
Notes:Reductions from transit were accounted for in trip rates.However, transit/walk‐in reductions were taken by CalEEMod using defaults.
Hotel
Quality Restaurant
Unenclosed Parking with ElevatorEnclosed Parking with Elevator
City ParkSurface Parking
Strip Mall
Enclosed Parking with ElevatorCity Park
High‐rise Apartment
Unenclosed Parking with Elevator
Strip MallQuality Restaurant
Hotel
Mitigated
CalEEMod Land Use Type
Hotel
High‐rise Apartment
Unmitigated
Surface Parking
Unenclosed Parking with ElevatorEnclosed Parking with Elevator

Vechicle Emission Factors -
Area Coating - See "Luxe Hotel Operational Inputs"
Energy Use -
Energy Mitigation -
1.3 User Entered Comments & Non-Default Data
Project Characteristics - LADWP, 2015 Power Integrated Resource Plan, Table C-1, (2015) C-12.
Land Use - See "LUXE Hotel Operational Inputs"
Vehicle Trips - See Traffic Study
Vechicle Emission Factors -
Vechicle Emission Factors -
CO2 Intensity (lb/MWhr)
1227.89 CH4 Intensity (lb/MWhr)
0.029 N2O Intensity (lb/MWhr)
0.006
31
Climate Zone 11 Operational Year 2015
Utility Company Los Angeles Department of Water & Power
1.2 Other Project Characteristics
Urbanization Urban Wind Speed (m/s) 2.2 Precipitation Freq (Days)
Hotel 178.00 Room 2.70 112,748.00 0
Parking Lot 198.00 Space 0.00 79,200.00 0
Population
Enclosed Parking with Elevator 86.00 Space 0.00 34,400.00 0
1.1 Land Usage
Land Uses Size Metric Lot Acreage Floor Surface Area
CalEEMod Version: CalEEMod.2013.2.2 Page 1 of 1 Date: 4/11/2016 3:24 PM
Luxe Hotel Existing OperationsSouth Coast Air Basin, Annual
1.0 Project Characteristics
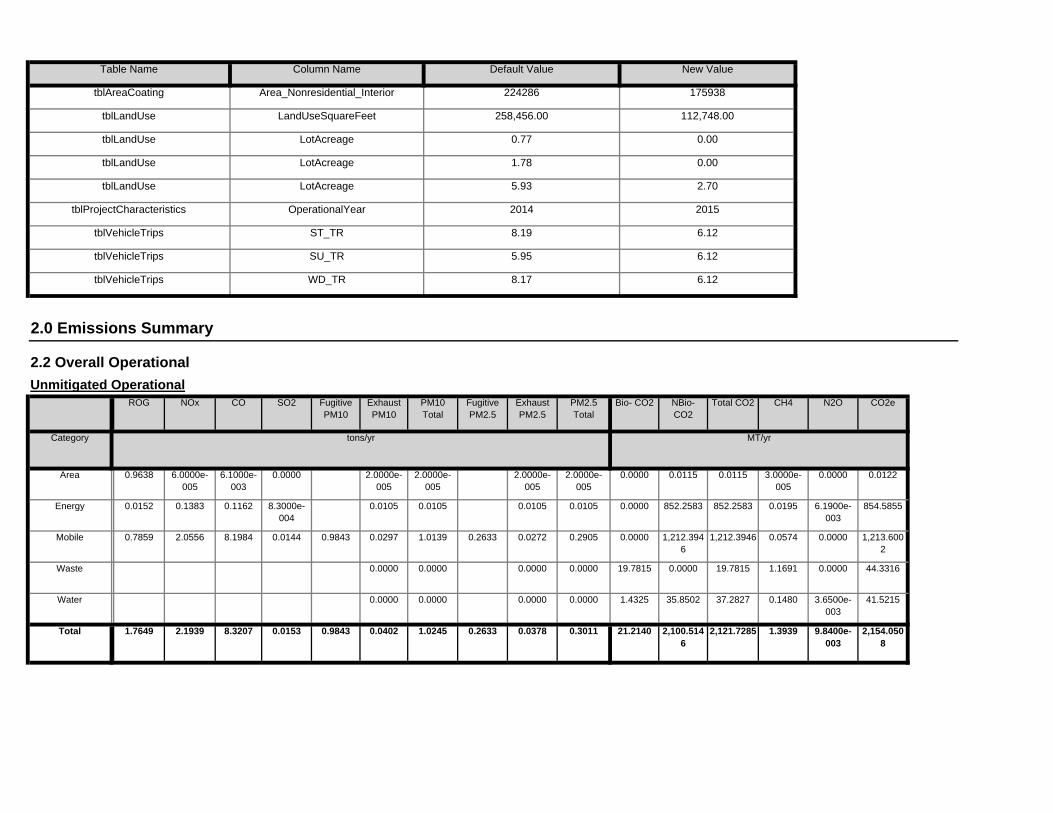
21.2140 2,100.5146
2,121.7285 1.3939 9.8400e-003
2,154.0508
0.9843 0.0402 1.0245 0.2633 0.0378 0.3011Total 1.7649 2.1939 8.3207 0.0153
1.4325 35.8502 37.2827 0.1480 3.6500e-003
41.52150.0000 0.0000 0.0000 0.0000Water
19.7815 0.0000 19.7815 1.1691 0.0000 44.33160.0000 0.0000 0.0000 0.0000Waste
0.0000 1,212.3946
1,212.3946 0.0574 0.0000 1,213.6002
0.9843 0.0297 1.0139 0.2633 0.0272 0.2905Mobile 0.7859 2.0556 8.1984 0.0144
0.0000 852.2583 852.2583 0.0195 6.1900e-003
854.58550.0105 0.0105 0.0105 0.0105Energy 0.0152 0.1383 0.1162 8.3000e-004
0.0000 0.0115 0.0115 3.0000e-005
0.0000 0.01222.0000e-005
2.0000e-005
2.0000e-005
2.0000e-005
Area 0.9638 6.0000e-005
6.1000e-003
0.0000
Total CO2 CH4 N2O CO2e
Category tons/yr MT/yr
PM10 Total
Fugitive PM2.5
Exhaust PM2.5
PM2.5 Total
Bio- CO2 NBio- CO2
2.2 Overall OperationalUnmitigated Operational
ROG NOx CO SO2 Fugitive PM10
Exhaust PM10
tblVehicleTrips WD_TR 8.17 6.12
2.0 Emissions Summary
tblVehicleTrips ST_TR 8.19 6.12
tblVehicleTrips SU_TR 5.95 6.12
tblLandUse LotAcreage 5.93 2.70
tblProjectCharacteristics OperationalYear 2014 2015
tblLandUse LotAcreage 0.77 0.00
tblLandUse LotAcreage 1.78 0.00
tblAreaCoating Area_Nonresidential_Interior 224286 175938
tblLandUse LandUseSquareFeet 258,456.00 112,748.00
Table Name Column Name Default Value New Value

0.0000 1,212.3946
1,212.3946 0.0574 0.0000 1,213.6002
0.9843 0.0297 1.0139 0.2633 0.0272 0.2905Unmitigated 0.7859 2.0556 8.1984 0.0144
0.0000 1,212.3946
1,212.3946 0.0574 0.0000 1,213.6002
0.9843 0.0297 1.0139 0.2633 0.0272 0.2905Mitigated 0.7859 2.0556 8.1984 0.0144
NBio- CO2
Total CO2 CH4 N2O CO2e
Category tons/yr MT/yr
Exhaust PM10
PM10 Total
Fugitive PM2.5
Exhaust PM2.5
PM2.5 Total
Bio- CO2
4.0 Operational Detail - Mobile
4.1 Mitigation Measures MobileROG NOx CO SO2 Fugitive
PM10
0.00 4.73 4.68 0.16 9.35 4.620.00 5.48 0.21 0.00 5.83 0.73
NBio-CO2 Total CO2 CH4 N20 CO2e
Percent Reduction
0.18 1.32 0.29 1.11
Exhaust PM10
PM10 Total
Fugitive PM2.5
Exhaust PM2.5
PM2.5 Total
Bio- CO2ROG NOx CO SO2 Fugitive PM10
21.2140 2,001.2298
2,022.4438 1.3917 8.9200e-003
2,054.4357
0.9843 0.0380 1.0223 0.2633 0.0356 0.2989Total 1.7617 2.1650 8.2963 0.0151
1.4325 35.8502 37.2827 0.1480 3.6400e-003
41.51920.0000 0.0000 0.0000 0.0000Water
19.7815 0.0000 19.7815 1.1691 0.0000 44.33160.0000 0.0000 0.0000 0.0000Waste
0.0000 1,212.3946
1,212.3946 0.0574 0.0000 1,213.6002
0.9843 0.0297 1.0139 0.2633 0.0272 0.2905Mobile 0.7859 2.0556 8.1984 0.0144
0.0000 752.9736 752.9736 0.0173 5.2800e-003
754.97268.3100e-003
8.3100e-003
8.3100e-003
8.3100e-003
Energy 0.0120 0.1093 0.0918 6.6000e-004
0.0000 0.0115 0.0115 3.0000e-005
0.0000 0.01222.0000e-005
2.0000e-005
2.0000e-005
2.0000e-005
Area 0.9638 6.0000e-005
6.1000e-003
0.0000
Total CO2 CH4 N2O CO2e
Category tons/yr MT/yr
PM10 Total
Fugitive PM2.5
Exhaust PM2.5
PM2.5 Total
Bio- CO2 NBio- CO2
Mitigated OperationalROG NOx CO SO2 Fugitive
PM10Exhaust PM10

4.4 Fleet MixHistorical Energy Use: N
5.1 Mitigation Measures Energy
Exceed Title 24
0.001923 0.002530 0.004314 0.000602 0.002075
5.0 Energy Detail
SBUS MH
0.516610 0.060517 0.179979 0.140587 0.041566 0.006616 0.015092 0.027587
LHD2 MHD HHD OBUS UBUS MCY
0.00 0.00 0 0 0
LDA LDT1 LDT2 MDV LHD1
61.60 19.00 58 38 4
Parking Lot 16.60 8.40 6.90 0.00
0.00 0.00 0 0 0
Hotel 16.60 8.40 6.90 19.40
H-S or C-C H-O or C-NW Primary Diverted Pass-by
Enclosed Parking with Elevator 16.60 8.40 6.90 0.00
4.3 Trip Type Information
Miles Trip % Trip Purpose %
Land Use H-W or C-W H-S or C-C H-O or C-NW H-W or C-W
Total 1,089.36 1,089.36 1,089.36 2,599,399 2,599,399Parking Lot 0.00 0.00 0.00
Hotel 1,089.36 1,089.36 1089.36 2,599,399 2,599,399
Annual VMT
Enclosed Parking with Elevator 0.00 0.00 0.00
4.2 Trip Summary Information
Average Daily Trip Rate Unmitigated MitigatedLand Use Weekday Saturday Sunday Annual VMT
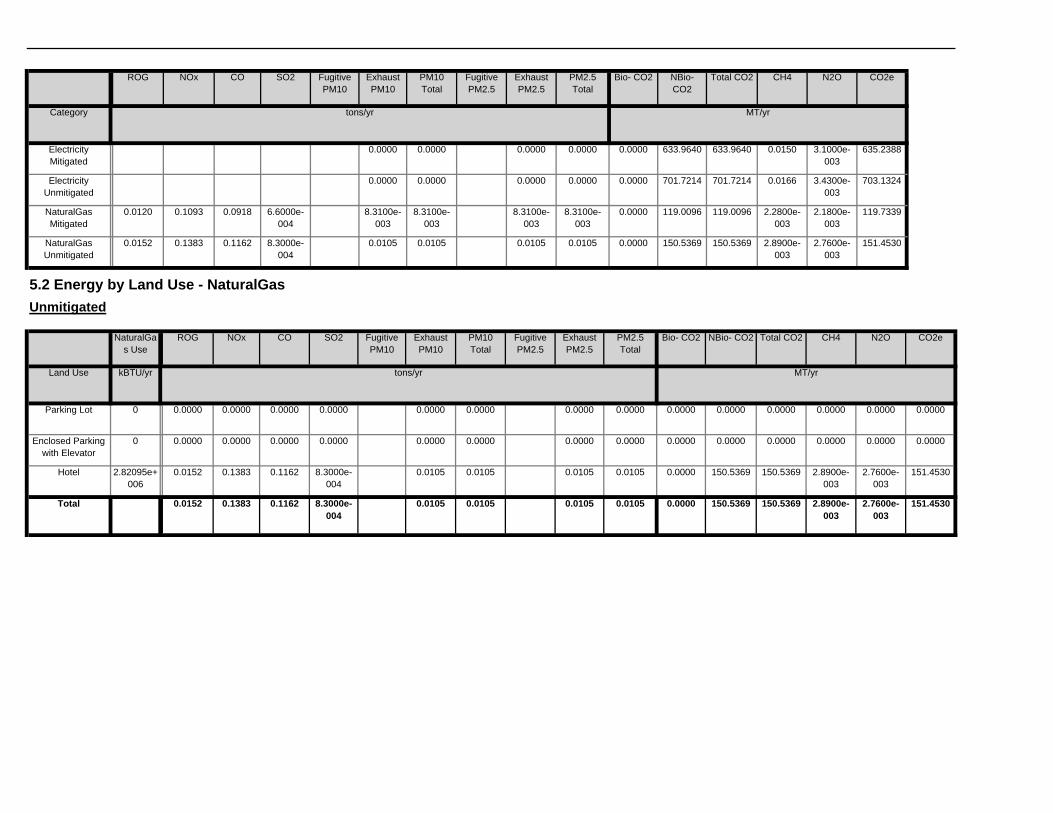
150.5369 2.8900e-003
2.7600e-003
151.45300.0105 0.0105 0.0105 0.0000 150.5369
151.4530
Total 0.0152 0.1383 0.1162 8.3000e-004
0.0105
0.0105 0.0000 150.5369 150.5369 2.8900e-003
2.7600e-003
8.3000e-004
0.0105 0.0105 0.0105
0.0000 0.0000 0.0000 0.0000
Hotel 2.82095e+006
0.0152 0.1383 0.1162
0.0000 0.0000 0.0000 0.0000 0.0000
0.0000
Enclosed Parking with Elevator
0 0.0000 0.0000 0.0000 0.0000 0.0000
0.0000 0.0000 0.0000 0.0000 0.0000 0.00000.0000 0.0000 0.0000 0.0000Parking Lot 0 0.0000 0.0000 0.0000
Total CO2 CH4 N2O CO2e
Land Use kBTU/yr tons/yr MT/yr
PM10 Total
Fugitive PM2.5
Exhaust PM2.5
PM2.5 Total
Bio- CO2 NBio- CO2
Unmitigated
NaturalGas Use
ROG NOx CO SO2 Fugitive PM10
Exhaust PM10
150.5369 150.5369 2.8900e-003
2.7600e-003
151.4530
5.2 Energy by Land Use - NaturalGas
0.0105 0.0105 0.0105 0.0105 0.0000
2.2800e-003
2.1800e-003
119.7339
NaturalGas Unmitigated
0.0152 0.1383 0.1162 8.3000e-004
8.3100e-003
8.3100e-003
0.0000 119.0096 119.0096
703.1324
NaturalGas Mitigated
0.0120 0.1093 0.0918 6.6000e-004
8.3100e-003
8.3100e-003
0.0000 0.0000 701.7214 701.7214 0.0166 3.4300e-003
0.0000 0.0000 0.0000
633.9640 633.9640 0.0150 3.1000e-003
635.2388
Electricity Unmitigated
0.0000 0.0000 0.0000 0.0000 0.0000
Category tons/yr MT/yr
Electricity Mitigated
Bio- CO2 NBio- CO2
Total CO2 CH4 N2O CO2eFugitive PM10
Exhaust PM10
PM10 Total
Fugitive PM2.5
Exhaust PM2.5
PM2.5 Total
ROG NOx CO SO2
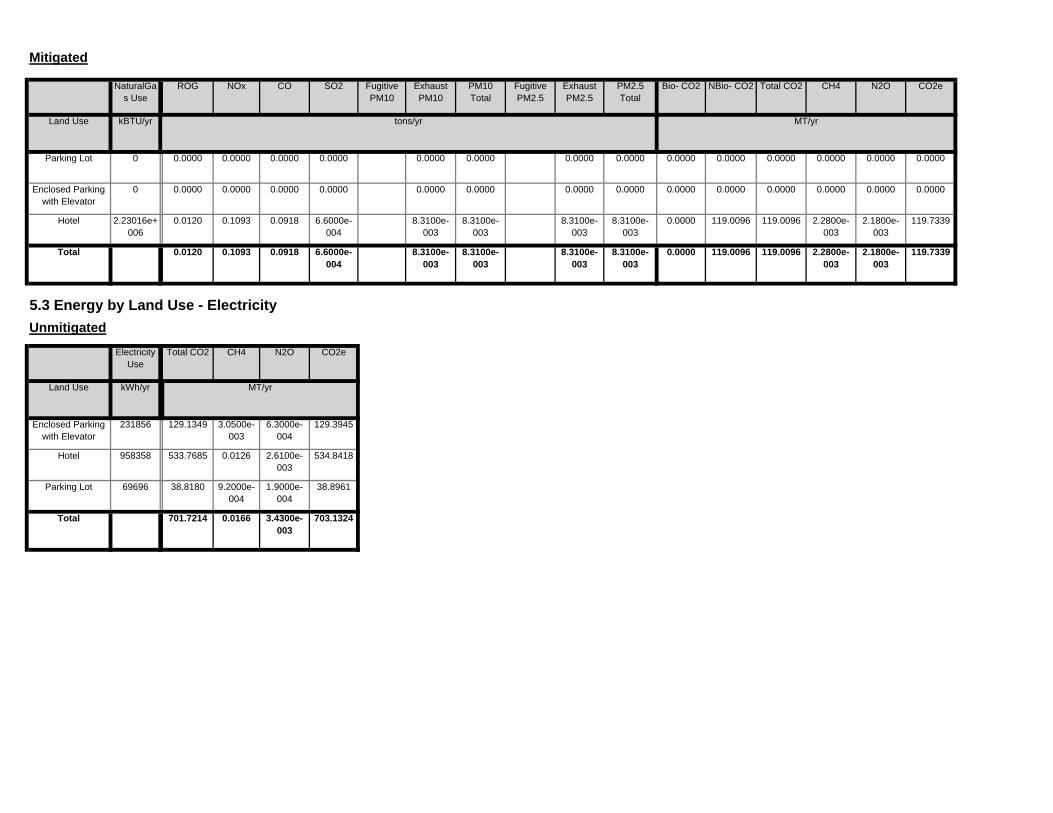
38.8961
Total 701.7214 0.0166 3.4300e-003
703.1324
Parking Lot 69696 38.8180 9.2000e-004
1.9000e-004
129.3945
Hotel 958358 533.7685 0.0126 2.6100e-003
534.8418
Land Use kWh/yr ton
MT/yr
Enclosed Parking with Elevator
231856 129.1349 3.0500e-003
6.3000e-004
Unmitigated
Electricity Use
Total CO2 CH4 N2O CO2e
119.0096 119.0096 2.2800e-003
2.1800e-003
119.7339
5.3 Energy by Land Use - Electricity
8.3100e-003
8.3100e-003
8.3100e-003
8.3100e-003
0.0000
2.1800e-003
119.7339
Total 0.0120 0.1093 0.0918 6.6000e-004
8.3100e-003
8.3100e-003
0.0000 119.0096 119.0096 2.2800e-003
0.0918 6.6000e-004
8.3100e-003
8.3100e-003
0.0000 0.0000 0.0000 0.0000 0.0000
Hotel 2.23016e+006
0.0120 0.1093
0.0000 0.0000 0.0000 0.0000 0.0000
0.0000 0.0000
Enclosed Parking with Elevator
0 0.0000 0.0000 0.0000 0.0000
0.0000 0.0000 0.0000 0.0000 0.0000 0.00000.0000 0.0000 0.0000 0.0000
CO2e
Land Use kBTU/yr tons/yr MT/yr
Parking Lot 0 0.0000 0.0000
PM2.5 Total
Bio- CO2 NBio- CO2 Total CO2 CH4 N2OSO2 Fugitive PM10
Exhaust PM10
PM10 Total
Fugitive PM2.5
Exhaust PM2.5
NaturalGas Use
ROG NOx CO
Mitigated

0.0000 0.0115 0.0115 3.0000e-005
0.0000 0.01222.0000e-005
2.0000e-005
2.0000e-005
2.0000e-005
Total 0.9638 6.0000e-005
6.1000e-003
0.0000
0.0000 0.0115 0.0115 3.0000e-005
0.0000 0.01222.0000e-005
2.0000e-005
2.0000e-005
2.0000e-005
Landscaping 6.0000e-004
6.0000e-005
6.1000e-003
0.0000
0.0000 0.0000 0.0000 0.0000 0.0000 0.00000.0000 0.0000 0.0000 0.0000Consumer Products
0.8179
0.0000 0.0000 0.0000 0.0000 0.0000 0.00000.0000 0.0000 0.0000 0.0000Architectural Coating
0.1453
Total CO2 CH4 N2O CO2e
SubCategory tons/yr MT/yr
PM10 Total
Fugitive PM2.5
Exhaust PM2.5
PM2.5 Total
Bio- CO2 NBio- CO2
6.2 Area by SubCategoryUnmitigated
ROG NOx CO SO2 Fugitive PM10
Exhaust PM10
0.0000 0.0115 0.0115 3.0000e-005
0.0000 0.01222.0000e-005
2.0000e-005
2.0000e-005
2.0000e-005
Unmitigated 0.9638 6.0000e-005
6.1000e-003
0.0000
0.0000 0.0115 0.0115 3.0000e-005
0.0000 0.01222.0000e-005
2.0000e-005
2.0000e-005
2.0000e-005
Mitigated 0.9638 6.0000e-005
6.1000e-003
0.0000
NBio- CO2
Total CO2 CH4 N2O CO2e
Category tons/yr MT/yr
Exhaust PM10
PM10 Total
Fugitive PM2.5
Exhaust PM2.5
PM2.5 Total
Bio- CO2
6.0 Area Detail
6.1 Mitigation Measures AreaROG NOx CO SO2 Fugitive
PM10
38.8961
Total 633.9640 0.0150 3.1000e-003
635.2388
Parking Lot 69696 38.8180 9.2000e-004
1.9000e-004
110.5805
Hotel 870415 484.7874 0.0115 2.3700e-003
485.7622
Land Use kWh/yr ton
MT/yr
Enclosed Parking with Elevator
198144 110.3586 2.6100e-003
5.4000e-004
Mitigated
Electricity Use
Total CO2 CH4 N2O CO2e

0.0000
Total 37.2827 0.1480 3.6500e-003
41.5215
Parking Lot 0 / 0 0.0000 0.0000 0.0000
0.0000
Hotel 4.51529 / 0.501698
37.2827 0.1480 3.6500e-003
41.5215
Land Use Mgal ton
MT/yr
Enclosed Parking with Elevator
0 / 0 0.0000 0.0000 0.0000
7.2 Water by Land UseUnmitigated
Indoor/Outdoor Use
Total CO2 CH4 N2O CO2e
Unmitigated 37.2827 0.1480 3.6500e-003
41.5215
Category ton
MT/yr
Mitigated 37.2827 0.1480 3.6400e-003
41.5192
7.0 Water Detail
7.1 Mitigation Measures WaterTotal CO2 CH4 N2O CO2e
0.0000 0.0115 0.0115 3.0000e-005
0.0000 0.01222.0000e-005
2.0000e-005
2.0000e-005
2.0000e-005
Total 0.9638 6.0000e-005
6.1000e-003
0.0000
0.0000 0.0115 0.0115 3.0000e-005
0.0000 0.01222.0000e-005
2.0000e-005
2.0000e-005
2.0000e-005
Landscaping 6.0000e-004
6.0000e-005
6.1000e-003
0.0000
0.0000 0.0000 0.0000 0.0000 0.0000 0.00000.0000 0.0000 0.0000 0.0000Consumer Products
0.8179
0.0000 0.0000 0.0000 0.0000 0.0000 0.00000.0000 0.0000 0.0000 0.0000Architectural Coating
0.1453
Total CO2 CH4 N2O CO2e
SubCategory tons/yr MT/yr
PM10 Total
Fugitive PM2.5
Exhaust PM2.5
PM2.5 Total
Bio- CO2 NBio- CO2
Mitigated
ROG NOx CO SO2 Fugitive PM10
Exhaust PM10

Unmitigated 19.7815 1.1691 0.0000 44.3316
ton
MT/yr
Mitigated 19.7815 1.1691 0.0000 44.3316
8.0 Waste Detail
8.1 Mitigation Measures WasteCategory/Year
Total CO2 CH4 N2O CO2e
0.0000
Total 37.2827 0.1480 3.6400e-003
41.5192
Parking Lot 0 / 0 0.0000 0.0000 0.0000
0.0000
Hotel 4.51529 / 0.501698
37.2827 0.1480 3.6400e-003
41.5192
Land Use Mgal ton
MT/yr
Enclosed Parking with Elevator
0 / 0 0.0000 0.0000 0.0000
MitigatedIndoor/Outdoor Use
Total CO2 CH4 N2O CO2e

Load Factor Fuel Type
10.0 Vegetation
9.0 Operational Offroad
Equipment Type Number Hours/Day Days/Year Horse Power
0.0000
Total 19.7815 1.1691 0.0000 44.3316
Parking Lot 0 0.0000 0.0000 0.0000
0.0000
Hotel 97.45 19.7815 1.1691 0.0000 44.3316
Land Use tons ton
MT/yr
Enclosed Parking with Elevator
0 0.0000 0.0000 0.0000
Mitigated
Waste Disposed
Total CO2 CH4 N2O CO2e
0.0000
Total 19.7815 1.1691 0.0000 44.3316
Parking Lot 0 0.0000 0.0000 0.0000
0.0000
Hotel 97.45 19.7815 1.1691 0.0000 44.3316
Land Use tons ton
MT/yr
Enclosed Parking with Elevator
0 0.0000 0.0000 0.0000
8.2 Waste by Land UseUnmitigated
Waste Disposed
Total CO2 CH4 N2O CO2e

Off-road Equipment -
1.3 User Entered Comments & Non-Default Data
Project Characteristics - LADWP, 2015 Power Integrated Resource Plan, Table C-1, (2015) C-12.
Land Use - See "LUXE Hotel Operational Inputs"
Construction Phase -
Off-road Equipment -
Off-road Equipment -
CO2 Intensity (lb/MWhr)
1163 CH4 Intensity (lb/MWhr)
0.029 N2O Intensity (lb/MWhr)
0.006
31
Climate Zone 11 Operational Year 2020
Utility Company Los Angeles Department of Water & Power
1.2 Other Project Characteristics
Urbanization Urban Wind Speed (m/s) 2.2 Precipitation Freq (Days)
Strip Mall 15.00 1000sqft 0.34 15,000.00 0
Apartments High Rise 290.00 Dwelling Unit 4.68 352,000.00 829
Quality Restaurant 15.00 1000sqft 0.34 15,000.00 0
Hotel 300.00 Room 10.00 280,000.00 0
City Park 0.47 Acre 0.47 20,473.20 0
Population
Enclosed Parking with Elevator 437.00 Space 3.93 174,800.00 0
1.1 Land Usage
Land Uses Size Metric Lot Acreage Floor Surface Area
CalEEMod Version: CalEEMod.2013.2.2 Page 1 of 1 Date: 4/14/2016 6:50 PM
LUXE Hotel - Interim Year (Phase 1)South Coast Air Basin, Annual
1.0 Project Characteristics

tblLandUse LandUseSquareFeet 290,000.00 352,000.00
tblProjectCharacteristics CO2IntensityFactor 1227.89 1163
tblFireplaces NumberWood 14.50 0.00
tblLandUse LandUseSquareFeet 435,600.00 280,000.00
tblFireplaces NumberGas 246.50 0.00
tblFireplaces NumberNoFireplace 29.00 0.00
tblFireplaces FireplaceHourDay 3.00 0.00
tblFireplaces FireplaceWoodMass 1,019.20 0.00
tblAreaCoating Area_Nonresidential_Interior 757910 453888
tblFireplaces FireplaceDayYear 25.00 0.00
Energy Use -
Waste Mitigation -
Table Name Column Name Default Value New Value
Water And Wastewater - See "LUXE Hotel Operational Inputs"
Solid Waste - See "LUXE Hotel Operational Inputs"
Construction Off-road Equipment Mitigation -
Area Mitigation -
Energy Mitigation -
Water Mitigation -
Demolition -
Grading -
Architectural Coating -
Vehicle Trips - See "LUXE Hotel Operational Inputs" and "Project Trip and VMT Reductions"
Woodstoves - No woodstoves nor fireplaces.
Area Coating - Parking lot square footage adjustment as in "AQ Construction Model Inputs"
Off-road Equipment -
Off-road Equipment -
Off-road Equipment -
Off-road Equipment -
Trips and VMT -

tblVehicleTrips ST_TR 42.04 29.07
tblVehicleTrips SU_TR 6.07 3.63
tblVehicleTrips ST_TR 8.19 6.13
tblVehicleTrips ST_TR 94.36 86.47
tblVehicleTrips ST_TR 7.16 3.63
tblVehicleTrips ST_TR 1.59 0.00
tblVehicleTrips HS_TL 5.90 4.03
tblVehicleTrips HW_TL 14.70 10.05
tblVehicleTrips CW_TL 16.60 11.35
tblVehicleTrips HO_TL 8.70 5.95
tblVehicleTrips CW_TL 16.60 11.35
tblVehicleTrips CW_TL 16.60 11.35
tblVehicleTrips CW_TL 16.60 0.00
tblVehicleTrips CW_TL 16.60 0.00
tblVehicleTrips CNW_TL 6.90 4.72
tblVehicleTrips CNW_TL 6.90 4.72
tblVehicleTrips CNW_TL 6.90 0.00
tblVehicleTrips CNW_TL 6.90 4.72
tblVehicleTrips CC_TL 8.40 5.74
tblVehicleTrips CNW_TL 6.90 0.00
tblVehicleTrips CC_TL 8.40 5.74
tblVehicleTrips CC_TL 8.40 5.74
tblVehicleTrips CC_TL 8.40 0.00
tblVehicleTrips CC_TL 8.40 0.00
tblSolidWaste SolidWasteGenerationRate 13.69 14.00
tblSolidWaste SolidWasteGenerationRate 15.75 14.00
tblSolidWaste SolidWasteGenerationRate 0.04 0.00
tblSolidWaste SolidWasteGenerationRate 164.25 234.00
tblProjectCharacteristics OperationalYear 2014 2020
tblSolidWaste SolidWasteGenerationRate 133.40 647.00

tblWoodstoves WoodstoveWoodMass 999.60 0.00
tblWoodstoves NumberNoncatalytic 14.50 0.00
tblWoodstoves WoodstoveDayYear 25.00 0.00
tblWater OutdoorWaterUseRate 680,989.31 105,850.00
tblWoodstoves NumberCatalytic 14.50 0.00
tblWater OutdoorWaterUseRate 845,559.00 1,733,346.67
tblWater OutdoorWaterUseRate 290,617.38 1,733,346.67
tblWater OutdoorWaterUseRate 559,996.23 522,896.67
tblWater OutdoorWaterUseRate 0.00 493,402.13
tblWater IndoorWaterUseRate 1,111,087.82 167,900.00
tblWater OutdoorWaterUseRate 11,911,855.55 4,577,447.97
tblWater IndoorWaterUseRate 7,610,031.00 12,454,374.27
tblWater IndoorWaterUseRate 4,553,005.69 2,749,446.45
tblWater IndoorWaterUseRate 0.00 829,422.31
tblWater IndoorWaterUseRate 0.00 782,637.87
tblVehicleTrips WD_TR 44.32 29.07
tblWater IndoorWaterUseRate 18,894,667.43 7,260,779.53
tblVehicleTrips WD_TR 8.17 6.13
tblVehicleTrips WD_TR 89.95 86.47
tblVehicleTrips WD_TR 6.59 3.63
tblVehicleTrips WD_TR 1.59 0.00
tblVehicleTrips SU_TR 72.16 86.47
tblVehicleTrips SU_TR 20.43 29.07
tblVehicleTrips SU_TR 1.59 0.00
tblVehicleTrips SU_TR 5.95 6.13

48.8995 6,116.3542
6,165.2537 3.2827 0.0344 6,244.8504
2.7657 0.1105 2.8762 0.7401 0.1060 0.8461Total 5.7680 4.4667 20.7458 0.0446
4.6150 123.3137 127.9287 0.4771 0.0118 141.61420.0000 0.0000 0.0000 0.0000Water
44.2845 0.0000 44.2845 2.6171 0.0000 99.24440.0000 0.0000 0.0000 0.0000Waste
0.0000 2,923.3698
2,923.3698 0.1102 0.0000 2,925.6830
2.7657 0.0582 2.8239 0.7401 0.0537 0.7938Mobile 1.9791 3.9654 17.3710 0.0417
0.0000 3,064.7665
3,064.7665 0.0735 0.0226 3,073.3034
0.0358 0.0358 0.0358 0.0358Energy 0.0518 0.4665 0.3643 2.8200e-003
0.0000 4.9043 4.9043 4.8100e-003
0.0000 5.00540.0165 0.0165 0.0165 0.0165Area 3.7371 0.0348 3.0105 1.6000e-004
Total CO2 CH4 N2O CO2e
Category tons/yr MT/yr
PM10 Total
Fugitive PM2.5
Exhaust PM2.5
PM2.5 Total
Bio- CO2 NBio- CO2
Mitigated OperationalROG NOx CO SO2 Fugitive
PM10Exhaust PM10
192.2105 6,716.6253
6,908.8358 11.9003 0.0470 7,173.3094
2.7657 0.1213 2.8870 0.7401 0.1168 0.8569Total 5.7836 4.6073 20.8537 0.0455
7.6917 220.2566 227.9483 0.7955 0.0198 250.78870.0000 0.0000 0.0000 0.0000Water
184.5188 0.0000 184.5188 10.9048 0.0000 413.51850.0000 0.0000 0.0000 0.0000Waste
0.0000 2,923.3698
2,923.3698 0.1102 0.0000 2,925.6830
2.7657 0.0582 2.8239 0.7401 0.0537 0.7938Mobile 1.9791 3.9654 17.3710 0.0417
0.0000 3,568.0947
3,568.0947 0.0851 0.0272 3,578.3138
0.0466 0.0466 0.0466 0.0466Energy 0.0674 0.6071 0.4722 3.6800e-003
0.0000 4.9043 4.9043 4.8100e-003
0.0000 5.00540.0165 0.0165 0.0165 0.0165Area 3.7371 0.0348 3.0105 1.6000e-004
Total CO2 CH4 N2O CO2e
Category tons/yr MT/yr
PM10 Total
Fugitive PM2.5
Exhaust PM2.5
PM2.5 Total
Bio- CO2 NBio- CO2
2.2 Overall OperationalUnmitigated Operational
ROG NOx CO SO2 Fugitive PM10
Exhaust PM10
2.0 Emissions Summary
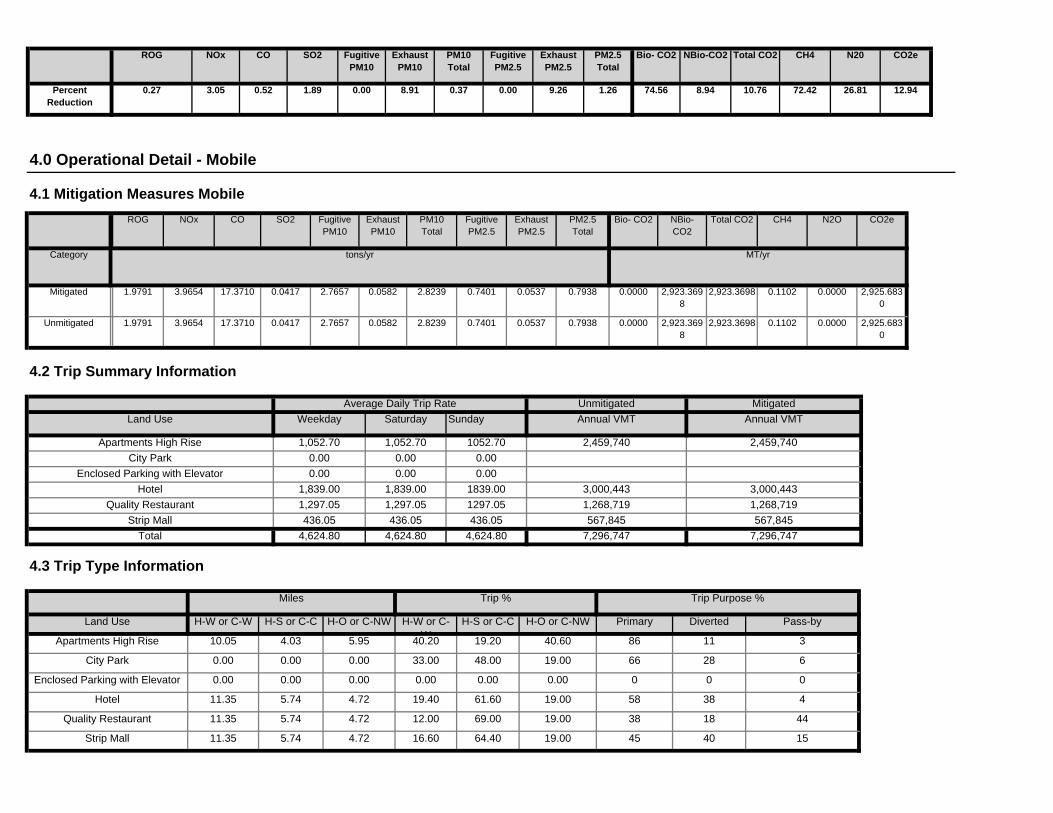
64.40 19.00 45 40 15
69.00 19.00 38 18 44
Strip Mall 11.35 5.74 4.72 16.60
61.60 19.00 58 38 4
Quality Restaurant 11.35 5.74 4.72 12.00
0.00 0.00 0 0 0
Hotel 11.35 5.74 4.72 19.40
48.00 19.00 66 28 6
Enclosed Parking with Elevator 0.00 0.00 0.00 0.00
19.20 40.60 86 11 3
City Park 0.00 0.00 0.00 33.00
H-S or C-C H-O or C-NW Primary Diverted Pass-by
Apartments High Rise 10.05 4.03 5.95 40.20
4.3 Trip Type Information
Miles Trip % Trip Purpose %
Land Use H-W or C-W H-S or C-C H-O or C-NW H-W or C-W
Total 4,624.80 4,624.80 4,624.80 7,296,747 7,296,747Strip Mall 436.05 436.05 436.05 567,845 567,845
Quality Restaurant 1,297.05 1,297.05 1297.05 1,268,719 1,268,719Hotel 1,839.00 1,839.00 1839.00 3,000,443 3,000,443
Enclosed Parking with Elevator 0.00 0.00 0.00City Park 0.00 0.00 0.00
Annual VMT
Apartments High Rise 1,052.70 1,052.70 1052.70 2,459,740 2,459,740
4.2 Trip Summary Information
Average Daily Trip Rate Unmitigated MitigatedLand Use Weekday Saturday Sunday Annual VMT
0.0000 2,923.3698
2,923.3698 0.1102 0.0000 2,925.6830
2.7657 0.0582 2.8239 0.7401 0.0537 0.7938Unmitigated 1.9791 3.9654 17.3710 0.0417
0.0000 2,923.3698
2,923.3698 0.1102 0.0000 2,925.6830
2.7657 0.0582 2.8239 0.7401 0.0537 0.7938Mitigated 1.9791 3.9654 17.3710 0.0417
NBio- CO2
Total CO2 CH4 N2O CO2e
Category tons/yr MT/yr
Exhaust PM10
PM10 Total
Fugitive PM2.5
Exhaust PM2.5
PM2.5 Total
Bio- CO2
4.0 Operational Detail - Mobile
4.1 Mitigation Measures MobileROG NOx CO SO2 Fugitive
PM10
74.56 8.94 10.76 72.42 26.81 12.940.00 8.91 0.37 0.00 9.26 1.26
NBio-CO2 Total CO2 CH4 N20 CO2e
Percent Reduction
0.27 3.05 0.52 1.89
Exhaust PM10
PM10 Total
Fugitive PM2.5
Exhaust PM2.5
PM2.5 Total
Bio- CO2ROG NOx CO SO2 Fugitive PM10

667.2606 667.2606 0.0128 0.0122 671.32150.0466 0.0466 0.0466 0.0466 0.0000
9.8200e-003
9.3900e-003
515.5163
NaturalGas Unmitigated
0.0674 0.6071 0.4722 3.6800e-003
0.0358 0.0358 0.0000 512.3979 512.3979
2,906.9924
NaturalGas Mitigated
0.0518 0.4665 0.3643 2.8200e-003
0.0358 0.0358
0.0000 0.0000 2,900.8340
2,900.8340 0.0723 0.01500.0000 0.0000 0.0000
2,552.3686
2,552.3686 0.0636 0.0132 2,557.7872
Electricity Unmitigated
0.0000 0.0000 0.0000 0.0000 0.0000
Category tons/yr MT/yr
Electricity Mitigated
Bio- CO2 NBio- CO2
Total CO2 CH4 N2O CO2eFugitive PM10
Exhaust PM10
PM10 Total
Fugitive PM2.5
Exhaust PM2.5
PM2.5 Total
4.4 Fleet MixHistorical Energy Use: N
5.1 Mitigation Measures Energy
Exceed Title 24
ROG NOx CO SO2
0.001943 0.002491 0.004392 0.000576 0.002140
5.0 Energy Detail
SBUS MH
0.510092 0.059583 0.181091 0.139410 0.042694 0.006692 0.016202 0.032692
LHD2 MHD HHD OBUS UBUS MCYLDA LDT1 LDT2 MDV LHD1
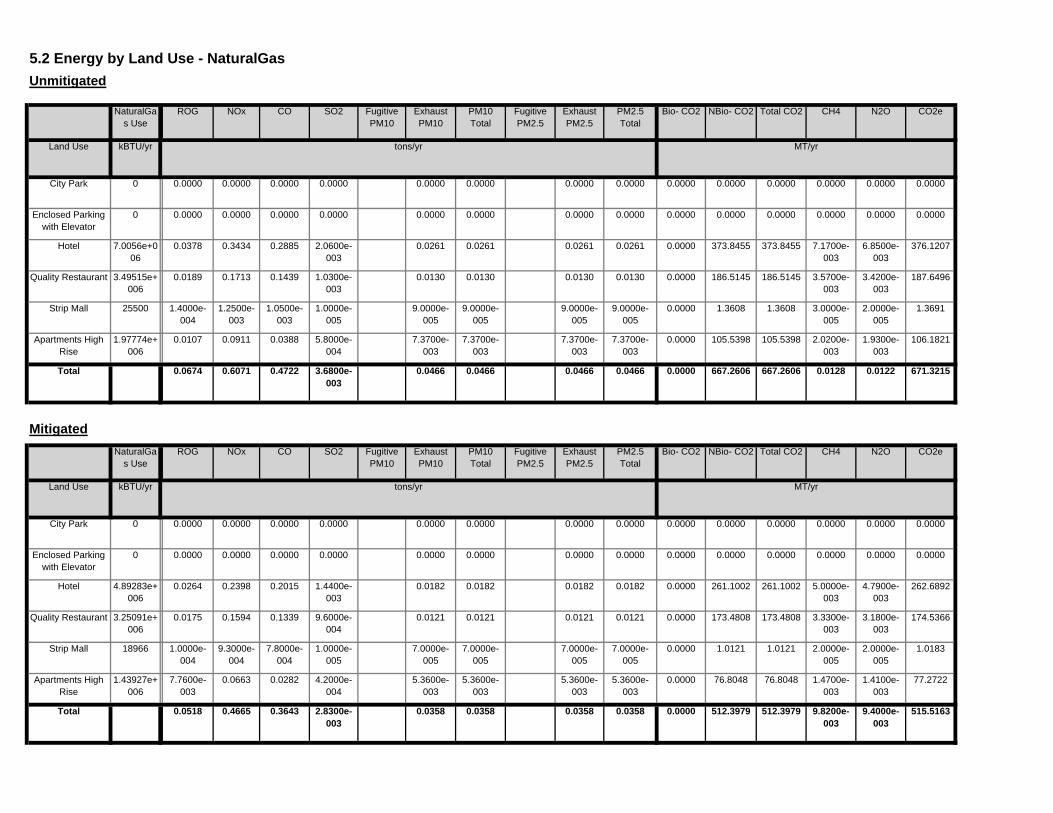
515.51630.0358 0.0000 512.3979 512.3979 9.8200e-003
9.4000e-003
2.8300e-003
0.0358 0.0358 0.0358
76.8048 1.4700e-003
1.4100e-003
77.2722
Total 0.0518 0.4665 0.3643
5.3600e-003
5.3600e-003
5.3600e-003
0.0000 76.8048
1.0183
Apartments High Rise
1.43927e+006
7.7600e-003
0.0663 0.0282 4.2000e-004
5.3600e-003
7.0000e-005
0.0000 1.0121 1.0121 2.0000e-005
2.0000e-005
1.0000e-005
7.0000e-005
7.0000e-005
7.0000e-005
173.4808 3.3300e-003
3.1800e-003
174.5366
Strip Mall 18966 1.0000e-004
9.3000e-004
7.8000e-004
0.0121 0.0121 0.0121 0.0000 173.4808
262.6892
Quality Restaurant 3.25091e+006
0.0175 0.1594 0.1339 9.6000e-004
0.0121
0.0182 0.0000 261.1002 261.1002 5.0000e-003
4.7900e-003
1.4400e-003
0.0182 0.0182 0.0182
0.0000 0.0000 0.0000 0.0000
Hotel 4.89283e+006
0.0264 0.2398 0.2015
0.0000 0.0000 0.0000 0.0000 0.0000
0.0000
Enclosed Parking with Elevator
0 0.0000 0.0000 0.0000 0.0000 0.0000
0.0000 0.0000 0.0000 0.0000 0.0000 0.00000.0000 0.0000 0.0000 0.0000
Land Use kBTU/yr tons/yr MT/yr
City Park 0 0.0000 0.0000 0.0000
Bio- CO2 NBio- CO2 Total CO2 CH4 N2O CO2eFugitive PM10
Exhaust PM10
PM10 Total
Fugitive PM2.5
Exhaust PM2.5
PM2.5 Total
671.3215
MitigatedNaturalGa
s UseROG NOx CO SO2
0.0466 0.0000 667.2606 667.2606 0.0128 0.01223.6800e-003
0.0466 0.0466 0.0466
105.5398 2.0200e-003
1.9300e-003
106.1821
Total 0.0674 0.6071 0.4722
7.3700e-003
7.3700e-003
7.3700e-003
0.0000 105.5398
1.3691
Apartments High Rise
1.97774e+006
0.0107 0.0911 0.0388 5.8000e-004
7.3700e-003
9.0000e-005
0.0000 1.3608 1.3608 3.0000e-005
2.0000e-005
1.0000e-005
9.0000e-005
9.0000e-005
9.0000e-005
186.5145 3.5700e-003
3.4200e-003
187.6496
Strip Mall 25500 1.4000e-004
1.2500e-003
1.0500e-003
0.0130 0.0130 0.0130 0.0000 186.5145
376.1207
Quality Restaurant 3.49515e+006
0.0189 0.1713 0.1439 1.0300e-003
0.0130
0.0261 0.0000 373.8455 373.8455 7.1700e-003
6.8500e-003
2.0600e-003
0.0261 0.0261 0.0261
0.0000 0.0000 0.0000 0.0000
Hotel 7.0056e+006
0.0378 0.3434 0.2885
0.0000 0.0000 0.0000 0.0000 0.0000
0.0000
Enclosed Parking with Elevator
0 0.0000 0.0000 0.0000 0.0000 0.0000
0.0000 0.0000 0.0000 0.0000 0.0000 0.00000.0000 0.0000 0.0000 0.0000City Park 0 0.0000 0.0000 0.0000
Total CO2 CH4 N2O CO2e
Land Use kBTU/yr tons/yr MT/yr
PM10 Total
Fugitive PM2.5
Exhaust PM2.5
PM2.5 Total
Bio- CO2 NBio- CO2
Unmitigated
NaturalGas Use
ROG NOx CO SO2 Fugitive PM10
Exhaust PM10
5.2 Energy by Land Use - NaturalGas

2,557.7872
Total 2,552.3686 0.0636 0.0132
343.6930
Strip Mall 201090 106.0806 2.6500e-003
5.5000e-004
106.3058
Quality Restaurant 650136 342.9649 8.5500e-003
1.7700e-003
492.4219
Hotel 2.0655e+006
1,089.6110 0.0272 5.6200e-003
1,091.9242
Enclosed Parking with Elevator
931474 491.3787 0.0123 2.5400e-003
523.4423
City Park 0 0.0000 0.0000 0.0000 0.0000
Land Use kWh/yr ton
MT/yr
Apartments High Rise
990153 522.3334 0.0130 2.6900e-003
2,906.9924
Mitigated
Electricity Use
Total CO2 CH4 N2O CO2e
Total 2,900.8340 0.0723 0.0150
371.9831
Strip Mall 227550 120.0390 2.9900e-003
6.2000e-004
120.2938
Quality Restaurant 703650 371.1950 9.2600e-003
1.9200e-003
622.8275
Hotel 2.38e+006 1,255.5165 0.0313 6.4800e-003
1,258.1819
Enclosed Parking with Elevator
1.17815e+006
621.5081 0.0155 3.2100e-003
533.7061
City Park 0 0.0000 0.0000 0.0000 0.0000
Land Use kWh/yr ton
MT/yr
Apartments High Rise
1.00957e+006
532.5755 0.0133 2.7500e-003
5.3 Energy by Land Use - ElectricityUnmitigated
Electricity Use
Total CO2 CH4 N2O CO2e

0.0000 4.9043 4.9043 4.8100e-003
0.0000 5.00540.0165 0.0165 0.0165 0.0165Total 3.7371 0.0348 3.0105 1.6000e-004
0.0000 4.9043 4.9043 4.8100e-003
0.0000 5.00540.0165 0.0165 0.0165 0.0165Landscaping 0.0923 0.0348 3.0105 1.6000e-004
0.0000 0.0000 0.0000 0.0000 0.0000 0.00000.0000 0.0000 0.0000 0.0000Hearth 0.0000 0.0000 0.0000 0.0000
0.0000 0.0000 0.0000 0.0000 0.0000 0.00000.0000 0.0000 0.0000 0.0000Consumer Products
3.0978
0.0000 0.0000 0.0000 0.0000 0.0000 0.00000.0000 0.0000 0.0000 0.0000Architectural Coating
0.5470
Total CO2 CH4 N2O CO2e
SubCategory tons/yr MT/yr
PM10 Total
Fugitive PM2.5
Exhaust PM2.5
PM2.5 Total
Bio- CO2 NBio- CO2
6.2 Area by SubCategoryUnmitigated
ROG NOx CO SO2 Fugitive PM10
Exhaust PM10
0.0000 4.9043 4.9043 4.8100e-003
0.0000 5.00540.0165 0.0165 0.0165 0.0165Unmitigated 3.7371 0.0348 3.0105 1.6000e-004
0.0000 4.9043 4.9043 4.8100e-003
0.0000 5.00540.0165 0.0165 0.0165 0.0165
CO2e
Category tons/yr MT/yr
Mitigated 3.7371 0.0348 3.0105 1.6000e-004
PM2.5 Total
Bio- CO2 NBio- CO2
Total CO2 CH4 N2OSO2 Fugitive PM10
Exhaust PM10
PM10 Total
Fugitive PM2.5
Exhaust PM2.5
6.0 Area Detail
6.1 Mitigation Measures Area
Use Low VOC Paint - Residential Interior
No Hearths InstalledROG NOx CO

Unmitigated 227.9483 0.7955 0.0198 250.7887
Category ton
MT/yr
Mitigated 127.9287 0.4771 0.0118 141.6142
7.0 Water Detail
7.1 Mitigation Measures Water
Apply Water Conservation Strategy
Total CO2 CH4 N2O CO2e
0.0000 4.9043 4.9043 4.8100e-003
0.0000 5.00540.0165 0.0165 0.0165 0.0165Total 3.7371 0.0348 3.0105 1.6000e-004
0.0000 4.9043 4.9043 4.8100e-003
0.0000 5.00540.0165 0.0165 0.0165 0.0165Landscaping 0.0923 0.0348 3.0105 1.6000e-004
0.0000 0.0000 0.0000 0.0000 0.0000 0.00000.0000 0.0000 0.0000 0.0000Hearth 0.0000 0.0000 0.0000 0.0000
0.0000 0.0000 0.0000 0.0000 0.0000 0.00000.0000 0.0000 0.0000 0.0000Consumer Products
3.0978
0.0000 0.0000 0.0000 0.0000 0.0000 0.00000.0000 0.0000 0.0000 0.0000Architectural Coating
0.5470
Total CO2 CH4 N2O CO2e
SubCategory tons/yr MT/yr
PM10 Total
Fugitive PM2.5
Exhaust PM2.5
PM2.5 Total
Bio- CO2 NBio- CO2
MitigatedROG NOx CO SO2 Fugitive
PM10Exhaust PM10
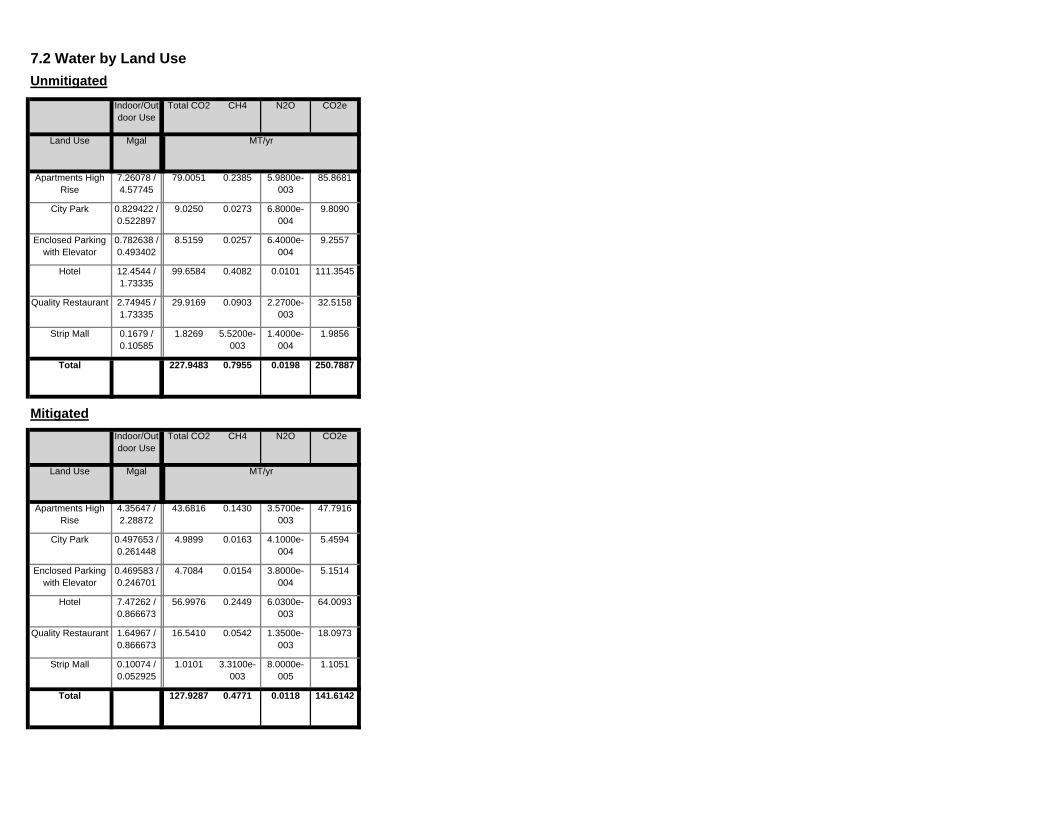
141.6142Total 127.9287 0.4771 0.0118
18.0973
Strip Mall 0.10074 / 0.052925
1.0101 3.3100e-003
8.0000e-005
1.1051
Quality Restaurant 1.64967 / 0.866673
16.5410 0.0542 1.3500e-003
5.1514
Hotel 7.47262 / 0.866673
56.9976 0.2449 6.0300e-003
64.0093
Enclosed Parking with Elevator
0.469583 / 0.246701
4.7084 0.0154 3.8000e-004
47.7916
City Park 0.497653 / 0.261448
4.9899 0.0163 4.1000e-004
5.4594
Land Use Mgal ton
MT/yr
Apartments High Rise
4.35647 / 2.28872
43.6816 0.1430 3.5700e-003
250.7887
MitigatedIndoor/Outdoor Use
Total CO2 CH4 N2O CO2e
Total 227.9483 0.7955 0.0198
32.5158
Strip Mall 0.1679 / 0.10585
1.8269 5.5200e-003
1.4000e-004
1.9856
Quality Restaurant 2.74945 / 1.73335
29.9169 0.0903 2.2700e-003
9.2557
Hotel 12.4544 / 1.73335
99.6584 0.4082 0.0101 111.3545
Enclosed Parking with Elevator
0.782638 / 0.493402
8.5159 0.0257 6.4000e-004
85.8681
City Park 0.829422 / 0.522897
9.0250 0.0273 6.8000e-004
9.8090
Land Use Mgal ton
MT/yr
Apartments High Rise
7.26078 / 4.57745
79.0051 0.2385 5.9800e-003
7.2 Water by Land UseUnmitigated
Indoor/Outdoor Use
Total CO2 CH4 N2O CO2e

413.5185Total 184.5188 10.9048 0.0000
6.3688
Strip Mall 14 2.8419 0.1680 0.0000 6.3688
Quality Restaurant 14 2.8419 0.1680 0.0000
0.0000
Hotel 234 47.4999 2.8072 0.0000 106.4503
Enclosed Parking with Elevator
0 0.0000 0.0000 0.0000
294.3305
City Park 0 0.0000 0.0000 0.0000 0.0000
Land Use tons ton
MT/yr
Apartments High Rise
647 131.3352 7.7617 0.0000
8.2 Waste by Land UseUnmitigated
Waste Disposed
Total CO2 CH4 N2O CO2e
Unmitigated 184.5188 10.9048 0.0000 413.5185
CO2e
ton
MT/yr
Mitigated 44.2845 2.6171 0.0000 99.2444
8.0 Waste Detail
8.1 Mitigation Measures Waste
Institute Recycling and Composting ServicesCategory/Year
Total CO2 CH4 N2O

99.2444Total 44.2845 2.6171 0.0000
1.5285
Strip Mall 3.36 0.6821 0.0403 0.0000 1.5285
Quality Restaurant 3.36 0.6821 0.0403 0.0000
0.0000
Hotel 56.16 11.4000 0.6737 0.0000 25.5481
Enclosed Parking with Elevator
0 0.0000 0.0000 0.0000
70.6393
City Park 0 0.0000 0.0000 0.0000 0.0000
Land Use tons ton
MT/yr
Apartments High Rise
155.28 31.5204 1.8628 0.0000
Mitigated
Waste Disposed
Total CO2 CH4 N2O CO2e
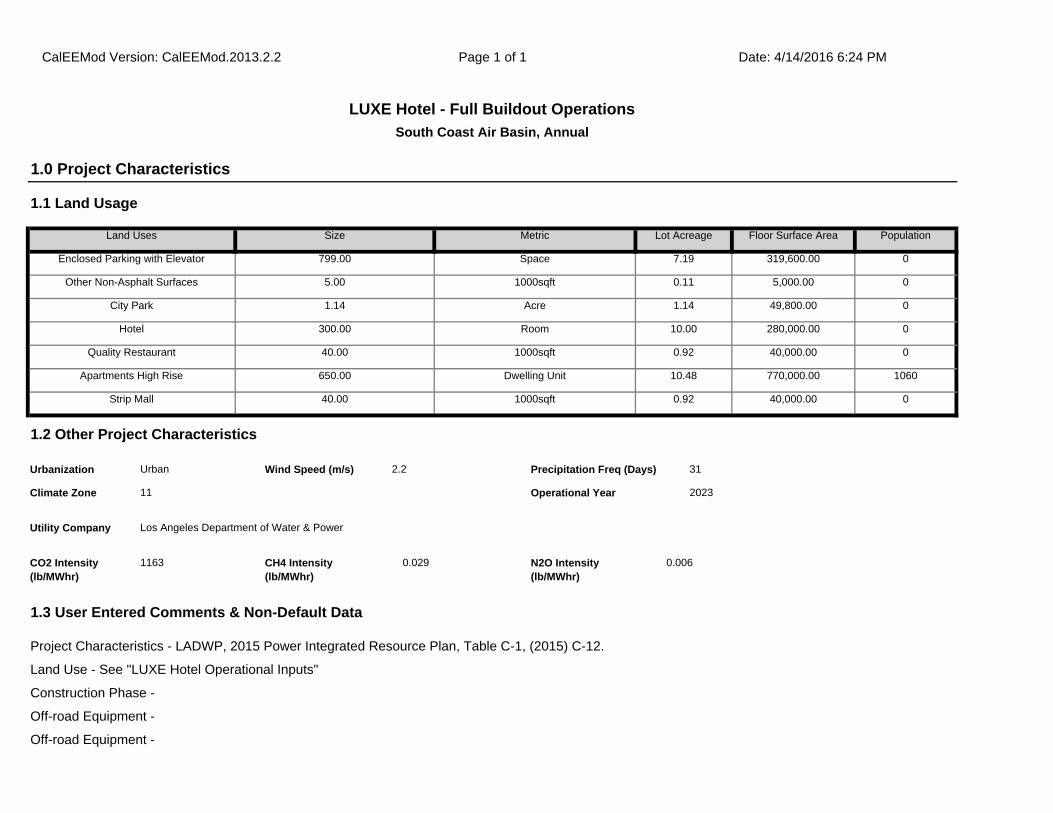
1.3 User Entered Comments & Non-Default Data
Project Characteristics - LADWP, 2015 Power Integrated Resource Plan, Table C-1, (2015) C-12.
Land Use - See "LUXE Hotel Operational Inputs"
Construction Phase -
Off-road Equipment -
Off-road Equipment -
CO2 Intensity (lb/MWhr)
1163 CH4 Intensity (lb/MWhr)
0.029 N2O Intensity (lb/MWhr)
0.006
31
Climate Zone 11 Operational Year 2023
Utility Company Los Angeles Department of Water & Power
1.2 Other Project Characteristics
Urbanization Urban Wind Speed (m/s) 2.2 Precipitation Freq (Days)
Strip Mall 40.00 1000sqft 0.92 40,000.00 0
Apartments High Rise 650.00 Dwelling Unit 10.48 770,000.00 1060
Quality Restaurant 40.00 1000sqft 0.92 40,000.00 0
Hotel 300.00 Room 10.00 280,000.00 0
City Park 1.14 Acre 1.14 49,800.00 0
Other Non-Asphalt Surfaces 5.00 1000sqft 0.11 5,000.00 0
Population
Enclosed Parking with Elevator 799.00 Space 7.19 319,600.00 0
1.1 Land Usage
Land Uses Size Metric Lot Acreage Floor Surface Area
CalEEMod Version: CalEEMod.2013.2.2 Page 1 of 1 Date: 4/14/2016 6:24 PM
LUXE Hotel - Full Buildout OperationsSouth Coast Air Basin, Annual
1.0 Project Characteristics

tblFireplaces FireplaceHourDay 3.00 0.00
tblFireplaces FireplaceWoodMass 1,019.20 0.00
tblAreaCoating Area_Nonresidential_Interior 1101600 345888
tblFireplaces FireplaceDayYear 25.00 0.00
tblArchitecturalCoating ConstArea_Residential_Exterior 519,750.00 438,750.00
tblArchitecturalCoating ConstArea_Residential_Interior 1,559,250.00 1,316,250.00
Area Mitigation -
Energy Mitigation -
Water Mitigation -
Waste Mitigation -
Vechicle Emission Factors -
Table Name Column Name Default Value New Value
Woodstoves - No woodstoves nor fireplaces.
Area Coating - Parking lot square footage adjustment as in "AQ Construction Model Inputs"
Energy Use -
Water And Wastewater - See "LUXE Hotel Operational Inputs"
Solid Waste - See "LUXE Hotel Operational Inputs"
Construction Off-road Equipment Mitigation -
Demolition -
Grading -
Architectural Coating -
Vehicle Trips - See "LUXE Hotel Operational Inputs" and "Project Trip and VMT Reductions"
Vechicle Emission Factors -
Vechicle Emission Factors -
Off-road Equipment -
Off-road Equipment -
Off-road Equipment -
Off-road Equipment -
Off-road Equipment -
Trips and VMT -

tblVehicleTrips CW_TL 16.60 11.35
tblVehicleTrips CW_TL 16.60 0.00
tblVehicleTrips CW_TL 16.60 0.00
tblVehicleTrips CW_TL 16.60 0.00
tblVehicleTrips CNW_TL 6.90 4.72
tblVehicleTrips CNW_TL 6.90 4.72
tblVehicleTrips CNW_TL 6.90 4.72
tblVehicleTrips CNW_TL 6.90 0.00
tblVehicleTrips CNW_TL 6.90 0.00
tblVehicleTrips CNW_TL 6.90 0.00
tblVehicleTrips CC_TL 8.40 5.74
tblVehicleTrips CC_TL 8.40 5.74
tblVehicleTrips CC_TL 8.40 5.74
tblVehicleTrips CC_TL 8.40 0.00
tblVehicleTrips CC_TL 8.40 0.00
tblVehicleTrips CC_TL 8.40 0.00
tblSolidWaste SolidWasteGenerationRate 36.50 37.00
tblSolidWaste SolidWasteGenerationRate 42.00 37.00
tblSolidWaste SolidWasteGenerationRate 0.10 0.00
tblSolidWaste SolidWasteGenerationRate 164.25 234.00
tblProjectCharacteristics OperationalYear 2014 2023
tblSolidWaste SolidWasteGenerationRate 299.00 1,450.00
tblLandUse Population 1,859.00 1,060.00
tblProjectCharacteristics CO2IntensityFactor 1227.89 1163
tblLandUse LandUseSquareFeet 435,600.00 280,000.00
tblLandUse LandUseSquareFeet 650,000.00 770,000.00
tblFireplaces NumberWood 32.50 0.00
tblLandUse LandUseSquareFeet 49,658.40 49,800.00
tblFireplaces NumberGas 552.50 0.00
tblFireplaces NumberNoFireplace 65.00 0.00

tblWater OutdoorWaterUseRate 0.00 805,956.01
tblWater OutdoorWaterUseRate 845,559.00 7,851,670.73
tblWater OutdoorWaterUseRate 26,698,986.59 10,262,792.60
tblWater OutdoorWaterUseRate 1,358,288.74 634,394.33
tblWater IndoorWaterUseRate 12,141,348.50 7,331,857.20
tblWater IndoorWaterUseRate 2,962,900.86 447,733.33
tblWater IndoorWaterUseRate 0.00 1,278,412.99
tblWater IndoorWaterUseRate 7,610,031.00 12,454,374.27
tblWater IndoorWaterUseRate 42,350,116.65 16,278,912.40
tblWater IndoorWaterUseRate 0.00 1,006,280.67
tblVehicleTrips WD_TR 89.95 86.48
tblVehicleTrips WD_TR 44.32 29.03
tblVehicleTrips WD_TR 1.59 0.00
tblVehicleTrips WD_TR 8.17 6.13
tblVehicleTrips SU_TR 20.43 29.03
tblVehicleTrips WD_TR 6.59 3.29
tblVehicleTrips SU_TR 5.95 6.13
tblVehicleTrips SU_TR 72.16 86.48
tblVehicleTrips SU_TR 6.07 3.29
tblVehicleTrips SU_TR 1.59 0.00
tblVehicleTrips ST_TR 94.36 86.48
tblVehicleTrips ST_TR 42.04 29.03
tblVehicleTrips ST_TR 1.59 0.00
tblVehicleTrips ST_TR 8.19 6.13
tblVehicleTrips HW_TL 14.70 10.05
tblVehicleTrips ST_TR 7.16 3.29
tblVehicleTrips HO_TL 8.70 5.95
tblVehicleTrips HS_TL 5.90 4.03
tblVehicleTrips CW_TL 16.60 11.35
tblVehicleTrips CW_TL 16.60 11.35

369.1668 12,563.6664
12,932.8332
22.8230 0.0776 13,436.1718
4.8820 0.2679 5.1499 1.3061 0.2553 1.5613Total 11.9901 12.2713 55.8222 0.0796
12.3087 409.8504 422.1591 1.2744 0.0320 458.83160.0000 0.0000 0.0000 0.0000Water
356.8581 0.0000 356.8581 21.0897 0.0000 799.74200.0000 0.0000 0.0000 0.0000Waste
0.0000 6,135.9085
6,135.9085 0.3049 0.0000 6,142.3111
4.8820 0.1531 5.0351 1.3061 0.1405 1.4466Mobile 5.5240 11.1860 48.3404 0.0731
0.0000 6,006.9286
6,006.9286 0.1434 0.0456 6,024.0854
0.0776 0.0776 0.0776 0.0776Energy 0.1123 1.0079 0.7620 6.1300e-003
0.0000 10.9790 10.9790 0.0106 0.0000 11.20180.0372 0.0372 0.0372 0.0372Area 6.3538 0.0774 6.7199 3.6000e-004
Total CO2 CH4 N2O CO2e
Category tons/yr MT/yr
PM10 Total
Fugitive PM2.5
Exhaust PM2.5
PM2.5 Total
Bio- CO2 NBio- CO2
2.2 Overall OperationalUnmitigated Operational
ROG NOx CO SO2 Fugitive PM10
Exhaust PM10
2.0 Emissions Summary
tblWoodstoves WoodstoveDayYear 25.00 0.00
tblWoodstoves WoodstoveWoodMass 999.60 0.00
tblWoodstoves NumberCatalytic 32.50 0.00
tblWoodstoves NumberNoncatalytic 32.50 0.00
tblWater OutdoorWaterUseRate 774,979.69 4,622,257.80
tblWater OutdoorWaterUseRate 1,815,971.49 282,266.67
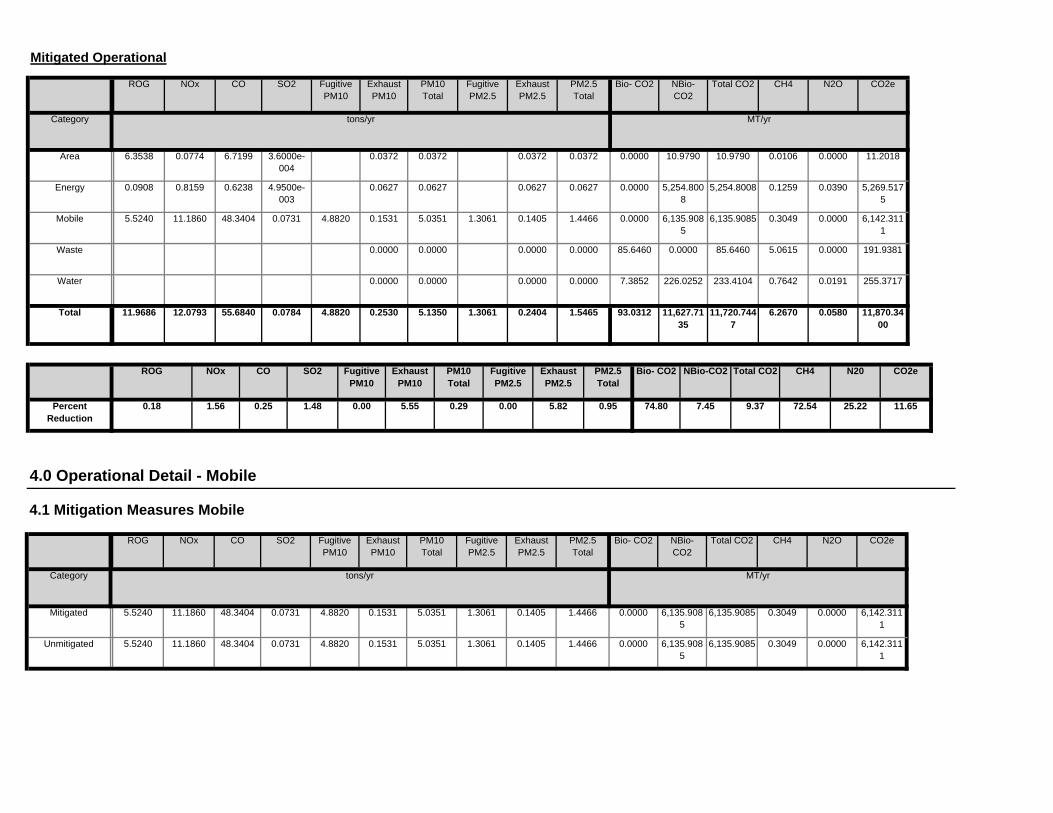
0.0000 6,135.9085
6,135.9085 0.3049 0.0000 6,142.3111
4.8820 0.1531 5.0351 1.3061 0.1405 1.4466Unmitigated 5.5240 11.1860 48.3404 0.0731
0.0000 6,135.9085
6,135.9085 0.3049 0.0000 6,142.3111
4.8820 0.1531 5.0351 1.3061 0.1405 1.4466Mitigated 5.5240 11.1860 48.3404 0.0731
NBio- CO2
Total CO2 CH4 N2O CO2e
Category tons/yr MT/yr
Exhaust PM10
PM10 Total
Fugitive PM2.5
Exhaust PM2.5
PM2.5 Total
Bio- CO2
4.0 Operational Detail - Mobile
4.1 Mitigation Measures Mobile
ROG NOx CO SO2 Fugitive PM10
74.80 7.45 9.37 72.54 25.22 11.650.00 5.55 0.29 0.00 5.82 0.95
NBio-CO2 Total CO2 CH4 N20 CO2e
Percent Reduction
0.18 1.56 0.25 1.48
Exhaust PM10
PM10 Total
Fugitive PM2.5
Exhaust PM2.5
PM2.5 Total
Bio- CO2ROG NOx CO SO2 Fugitive PM10
93.0312 11,627.7135
11,720.7447
6.2670 0.0580 11,870.3400
4.8820 0.2530 5.1350 1.3061 0.2404 1.5465Total 11.9686 12.0793 55.6840 0.0784
7.3852 226.0252 233.4104 0.7642 0.0191 255.37170.0000 0.0000 0.0000 0.0000Water
85.6460 0.0000 85.6460 5.0615 0.0000 191.93810.0000 0.0000 0.0000 0.0000Waste
0.0000 6,135.9085
6,135.9085 0.3049 0.0000 6,142.3111
4.8820 0.1531 5.0351 1.3061 0.1405 1.4466Mobile 5.5240 11.1860 48.3404 0.0731
0.0000 5,254.8008
5,254.8008 0.1259 0.0390 5,269.5175
0.0627 0.0627 0.0627 0.0627Energy 0.0908 0.8159 0.6238 4.9500e-003
0.0000 10.9790 10.9790 0.0106 0.0000 11.20180.0372 0.0372 0.0372 0.0372Area 6.3538 0.0774 6.7199 3.6000e-004
Total CO2 CH4 N2O CO2e
Category tons/yr MT/yr
PM10 Total
Fugitive PM2.5
Exhaust PM2.5
PM2.5 Total
Bio- CO2 NBio- CO2
Mitigated Operational
ROG NOx CO SO2 Fugitive PM10
Exhaust PM10
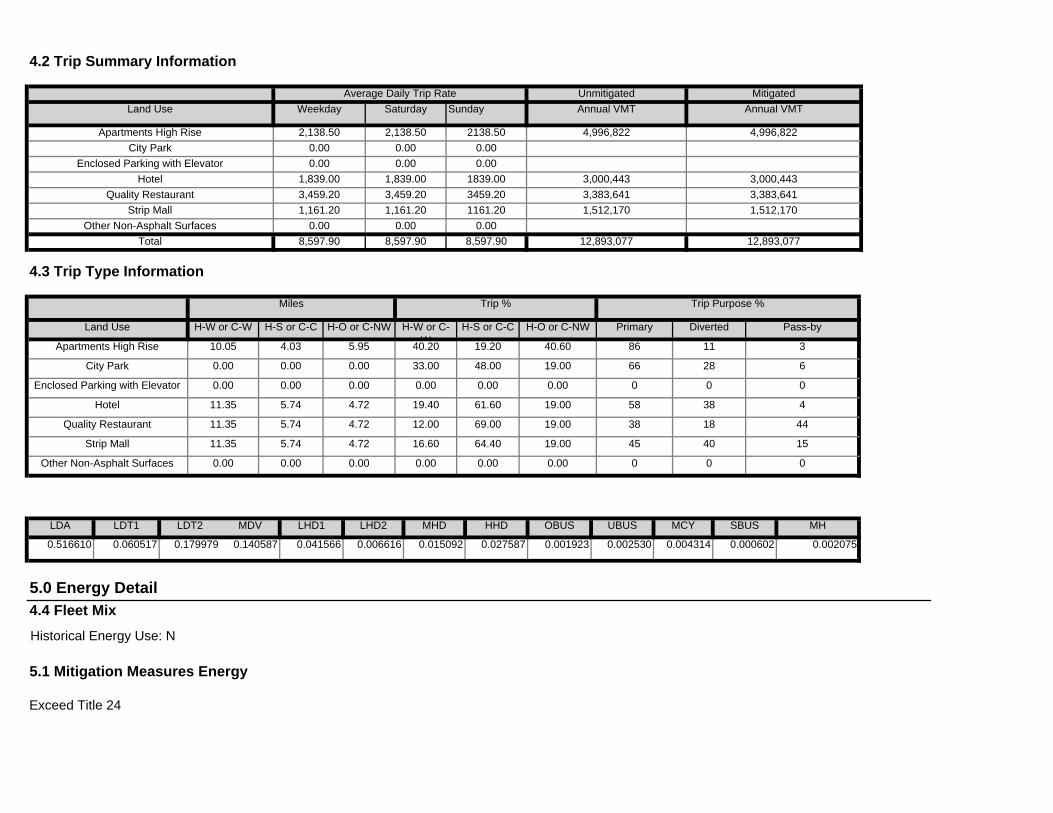
4.4 Fleet MixHistorical Energy Use: N
5.1 Mitigation Measures Energy
Exceed Title 24
0.001923 0.002530 0.004314 0.000602 0.002075
5.0 Energy Detail
SBUS MH
0.516610 0.060517 0.179979 0.140587 0.041566 0.006616 0.015092 0.027587
LHD2 MHD HHD OBUS UBUS MCY
0.00 0.00 0 0 0
LDA LDT1 LDT2 MDV LHD1
64.40 19.00 45 40 15
Other Non-Asphalt Surfaces 0.00 0.00 0.00 0.00
69.00 19.00 38 18 44
Strip Mall 11.35 5.74 4.72 16.60
61.60 19.00 58 38 4
Quality Restaurant 11.35 5.74 4.72 12.00
0.00 0.00 0 0 0
Hotel 11.35 5.74 4.72 19.40
48.00 19.00 66 28 6
Enclosed Parking with Elevator 0.00 0.00 0.00 0.00
19.20 40.60 86 11 3
City Park 0.00 0.00 0.00 33.00
H-S or C-C H-O or C-NW Primary Diverted Pass-by
Apartments High Rise 10.05 4.03 5.95 40.20
4.3 Trip Type Information
Miles Trip % Trip Purpose %
Land Use H-W or C-W H-S or C-C H-O or C-NW H-W or C-W
Total 8,597.90 8,597.90 8,597.90 12,893,077 12,893,077Other Non-Asphalt Surfaces 0.00 0.00 0.00
Strip Mall 1,161.20 1,161.20 1161.20 1,512,170 1,512,170Quality Restaurant 3,459.20 3,459.20 3459.20 3,383,641 3,383,641
Hotel 1,839.00 1,839.00 1839.00 3,000,443 3,000,443Enclosed Parking with Elevator 0.00 0.00 0.00
City Park 0.00 0.00 0.00
Annual VMT
Apartments High Rise 2,138.50 2,138.50 2138.50 4,996,822 4,996,822
4.2 Trip Summary Information
Average Daily Trip Rate Unmitigated MitigatedLand Use Weekday Saturday Sunday Annual VMT
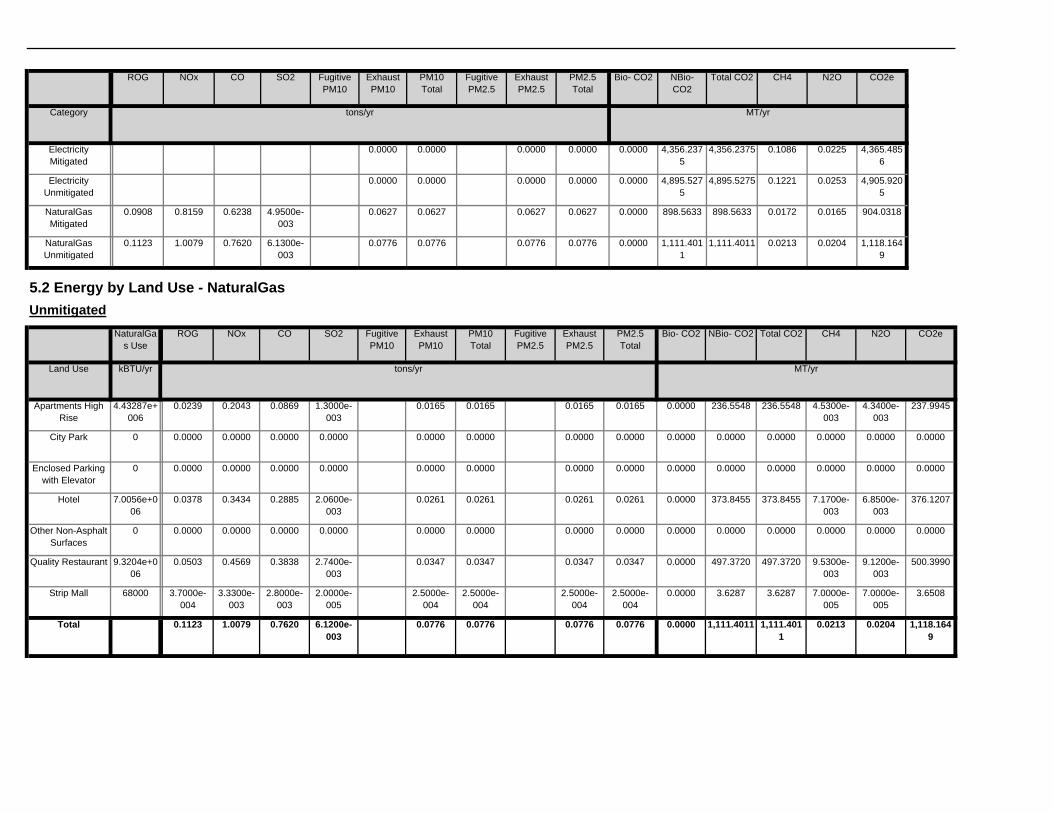
1,111.4011
0.0213 0.0204 1,118.1649
0.0776 0.0776 0.0776 0.0000 1,111.4011
3.6508
Total 0.1123 1.0079 0.7620 6.1200e-003
0.0776
2.5000e-004
0.0000 3.6287 3.6287 7.0000e-005
7.0000e-005
2.0000e-005
2.5000e-004
2.5000e-004
2.5000e-004
497.3720 9.5300e-003
9.1200e-003
500.3990
Strip Mall 68000 3.7000e-004
3.3300e-003
2.8000e-003
0.0347 0.0347 0.0347 0.0000 497.3720
0.0000
Quality Restaurant 9.3204e+006
0.0503 0.4569 0.3838 2.7400e-003
0.0347
0.0000 0.0000 0.0000 0.0000 0.0000 0.00000.0000 0.0000 0.0000 0.0000
373.8455 7.1700e-003
6.8500e-003
376.1207
Other Non-Asphalt Surfaces
0 0.0000 0.0000 0.0000
0.0261 0.0261 0.0261 0.0000 373.8455
0.0000
Hotel 7.0056e+006
0.0378 0.3434 0.2885 2.0600e-003
0.0261
0.0000 0.0000 0.0000 0.0000 0.0000 0.00000.0000 0.0000 0.0000 0.0000
0.0000 0.0000 0.0000 0.0000
Enclosed Parking with Elevator
0 0.0000 0.0000 0.0000
0.0000 0.0000 0.0000 0.0000 0.0000
237.9945
City Park 0 0.0000 0.0000 0.0000 0.0000 0.0000
0.0165 0.0000 236.5548 236.5548 4.5300e-003
4.3400e-003
1.3000e-003
0.0165 0.0165 0.0165Apartments High Rise
4.43287e+006
0.0239 0.2043 0.0869
Total CO2 CH4 N2O CO2e
Land Use kBTU/yr tons/yr MT/yr
PM10 Total
Fugitive PM2.5
Exhaust PM2.5
PM2.5 Total
Bio- CO2 NBio- CO2
UnmitigatedNaturalGa
s UseROG NOx CO SO2 Fugitive
PM10Exhaust PM10
1,111.4011
1,111.4011 0.0213 0.0204 1,118.1649
5.2 Energy by Land Use - NaturalGas
0.0776 0.0776 0.0776 0.0776 0.0000
0.0172 0.0165 904.0318
NaturalGas Unmitigated
0.1123 1.0079 0.7620 6.1300e-003
0.0627 0.0627 0.0000 898.5633 898.5633
4,905.9205
NaturalGas Mitigated
0.0908 0.8159 0.6238 4.9500e-003
0.0627 0.0627
0.0000 0.0000 4,895.5275
4,895.5275 0.1221 0.02530.0000 0.0000 0.0000
4,356.2375
4,356.2375 0.1086 0.0225 4,365.4856
Electricity Unmitigated
0.0000 0.0000 0.0000 0.0000 0.0000
Category tons/yr MT/yr
Electricity Mitigated
Bio- CO2 NBio- CO2
Total CO2 CH4 N2O CO2eFugitive PM10
Exhaust PM10
PM10 Total
Fugitive PM2.5
Exhaust PM2.5
PM2.5 Total
ROG NOx CO SO2

898.5633 898.5633 0.0172 0.0165 904.03180.0627 0.0627 0.0627 0.0627 0.0000
3.1600e-003
173.1964
Total 0.0908 0.8159 0.6238 4.9500e-003
0.0120 0.0120 0.0000 172.1487 172.1487 3.3000e-003
0.0633 9.5000e-004
0.0120 0.0120
2.6989 2.6989 5.0000e-005
5.0000e-005
2.7154
Apartments High Rise
3.22594e+006
0.0174 0.1487
1.9000e-004
1.9000e-004
1.9000e-004
1.9000e-004
0.0000
8.4800e-003
465.4310
Strip Mall 50576 2.7000e-004
2.4800e-003
2.0800e-003
1.0000e-005
0.0323 0.0323 0.0000 462.6156 462.6156 8.8700e-003
0.3570 2.5500e-003
0.0323 0.0323
0.0000 0.0000 0.0000 0.0000 0.0000
Quality Restaurant 8.66909e+006
0.0468 0.4250
0.0000 0.0000 0.0000 0.0000 0.0000
4.7900e-003
262.6892
Other Non-Asphalt Surfaces
0 0.0000 0.0000 0.0000 0.0000
0.0182 0.0182 0.0000 261.1002 261.1002 5.0000e-003
0.2015 1.4400e-003
0.0182 0.0182
0.0000 0.0000 0.0000 0.0000 0.0000
Hotel 4.89283e+006
0.0264 0.2398
0.0000 0.0000 0.0000 0.0000 0.0000
0.0000 0.0000
Enclosed Parking with Elevator
0 0.0000 0.0000 0.0000 0.0000
0.0000 0.0000 0.0000 0.0000 0.0000 0.00000.0000 0.0000 0.0000 0.0000
CO2e
Land Use kBTU/yr tons/yr MT/yr
City Park 0 0.0000 0.0000
PM2.5 Total
Bio- CO2 NBio- CO2 Total CO2 CH4 N2OSO2 Fugitive PM10
Exhaust PM10
PM10 Total
Fugitive PM2.5
Exhaust PM2.5
NaturalGas Use
ROG NOx CO
Mitigated

320.7835
Total 4,895.5275 0.1221 0.0253 4,905.9205
Strip Mall 606800 320.1040 7.9800e-003
1.6500e-003
0.0000
Quality Restaurant 1.8764e+006
989.8534 0.0247 5.1100e-003
991.9548
Other Non-Asphalt Surfaces
0 0.0000 0.0000 0.0000
1,138.7624
Hotel 2.38e+006 1,255.5165 0.0313 6.4800e-003
1,258.1819
Enclosed Parking with Elevator
2.1541e+006
1,136.3500 0.0283 5.8600e-003
1,196.2378
City Park 0 0.0000 0.0000 0.0000 0.0000
Land Use kWh/yr ton
MT/yr
Apartments High Rise
2.26283e+006
1,193.7036 0.0298 6.1600e-003
Unmitigated
Electricity Use
Total CO2 CH4 N2O CO2e
5.3 Energy by Land Use - Electricity

11.20180.0372 0.0000 10.9790 10.9790 0.0106 0.00003.6000e-004
0.0372 0.0372 0.0372
10.9790 10.9790 0.0106 0.0000 11.2018
Unmitigated 6.3538 0.0774 6.7199
0.0372 0.0372 0.0372 0.0372 0.0000
Category tons/yr MT/yr
Mitigated 6.3538 0.0774 6.7199 3.6000e-004
Bio- CO2 NBio- CO2
Total CO2 CH4 N2O CO2eFugitive PM10
Exhaust PM10
PM10 Total
Fugitive PM2.5
Exhaust PM2.5
PM2.5 Total
6.0 Area Detail
6.1 Mitigation Measures Area
Use Low VOC Paint - Residential Interior
No Hearths InstalledROG NOx CO SO2
283.4821
Total 4,356.2375 0.1086 0.0225 4,365.4856
Strip Mall 536240 282.8816 7.0500e-003
1.4600e-003
0.0000
Quality Restaurant 1.7337e+006
914.5731 0.0228 4.7200e-003
916.5147
Other Non-Asphalt Surfaces
0 0.0000 0.0000 0.0000
900.3319
Hotel 2.0655e+006
1,089.6110 0.0272 5.6200e-003
1,091.9242
Enclosed Parking with Elevator
1.70308e+006
898.4246 0.0224 4.6400e-003
1,173.2327
City Park 0 0.0000 0.0000 0.0000 0.0000
Land Use kWh/yr ton
MT/yr
Apartments High Rise
2.21931e+006
1,170.7472 0.0292 6.0400e-003
Mitigated
Electricity Use
Total CO2 CH4 N2O CO2e

0.0000 10.9790 10.9790 0.0106 0.0000 11.20180.0372 0.0372 0.0372 0.0372Total 6.3538 0.0774 6.7199 3.6000e-004
0.0000 10.9790 10.9790 0.0106 0.0000 11.20180.0372 0.0372 0.0372 0.0372Landscaping 0.2034 0.0774 6.7199 3.6000e-004
0.0000 0.0000 0.0000 0.0000 0.0000 0.00000.0000 0.0000 0.0000 0.0000Hearth 0.0000 0.0000 0.0000 0.0000
0.0000 0.0000 0.0000 0.0000 0.0000 0.00000.0000 0.0000 0.0000 0.0000Consumer Products
5.4362
0.0000 0.0000 0.0000 0.0000 0.0000 0.00000.0000 0.0000 0.0000 0.0000Architectural Coating
0.7143
Total CO2 CH4 N2O CO2e
SubCategory tons/yr MT/yr
PM10 Total
Fugitive PM2.5
Exhaust PM2.5
PM2.5 Total
Bio- CO2 NBio- CO2
MitigatedROG NOx CO SO2 Fugitive
PM10Exhaust PM10
0.0000 10.9790 10.9790 0.0106 0.0000 11.20180.0372 0.0372 0.0372 0.0372Total 6.3538 0.0774 6.7199 3.6000e-004
0.0000 10.9790 10.9790 0.0106 0.0000 11.20180.0372 0.0372 0.0372 0.0372Landscaping 0.2034 0.0774 6.7199 3.6000e-004
0.0000 0.0000 0.0000 0.0000 0.0000 0.00000.0000 0.0000 0.0000 0.0000Hearth 0.0000 0.0000 0.0000 0.0000
0.0000 0.0000 0.0000 0.0000 0.0000 0.00000.0000 0.0000 0.0000 0.0000Consumer Products
5.4362
0.0000 0.0000 0.0000 0.0000 0.0000 0.00000.0000 0.0000 0.0000 0.0000Architectural Coating
0.7143
NBio- CO2
Total CO2 CH4 N2O CO2e
SubCategory tons/yr MT/yr
Exhaust PM10
PM10 Total
Fugitive PM2.5
Exhaust PM2.5
PM2.5 Total
Bio- CO2
6.2 Area by SubCategoryUnmitigated
ROG NOx CO SO2 Fugitive PM10

5.2950
Total 422.1591 1.2744 0.0320 458.8316
Strip Mall 0.447733 / 0.282267
4.8718 0.0147 3.7000e-004
0.0000
Quality Restaurant 7.33186 / 4.62226
79.7785 0.2408 6.0400e-003
86.7087
Other Non-Asphalt Surfaces
0 / 0 0.0000 0.0000 0.0000
15.1189
Hotel 12.4544 / 7.85167
135.5169 0.4091 0.0103 147.2891
Enclosed Parking with Elevator
1.27841 / 0.805956
13.9105 0.0420 1.0500e-003
192.5192
City Park 1.00628 / 0.634394
10.9494 0.0331 8.3000e-004
11.9006
Land Use Mgal ton
MT/yr
Apartments High Rise
16.2789 / 10.2628
177.1320 0.5347 0.0134
7.2 Water by Land UseUnmitigated
Indoor/Outdoor Use
Total CO2 CH4 N2O CO2e
Unmitigated 422.1591 1.2744 0.0320 458.8316
Category ton
MT/yr
Mitigated 233.4104 0.7642 0.0191 255.3717
7.0 Water Detail
7.1 Mitigation Measures Water
Apply Water Conservation Strategy
Total CO2 CH4 N2O CO2e

Unmitigated 356.8581 21.0897 0.0000 799.7420
ton
MT/yr
Mitigated 85.6460 5.0615 0.0000 191.9381
8.0 Waste Detail
8.1 Mitigation Measures Waste
Institute Recycling and Composting ServicesCategory/Year
Total CO2 CH4 N2O CO2e
2.9471
Total 233.4104 0.7642 0.0191 255.3717
Strip Mall 0.26864 / 0.141133
2.6936 8.8200e-003
2.2000e-004
0.0000
Quality Restaurant 4.39911 / 2.31113
44.1093 0.1444 3.6100e-003
48.2594
Other Non-Asphalt Surfaces
0 / 0 0.0000 0.0000 0.0000
8.4147
Hotel 7.47262 / 3.92584
74.9269 0.2453 6.1200e-003
81.9766
Enclosed Parking with Elevator
0.767048 / 0.402978
7.6911 0.0252 6.3000e-004
107.1504
City Park 0.603768 / 0.317197
6.0539 0.0198 4.9000e-004
6.6235
Land Use Mgal ton
MT/yr
Apartments High Rise
9.76735 / 5.1314
97.9357 0.3206 8.0000e-003
MitigatedIndoor/Outdoor Use
Total CO2 CH4 N2O CO2e

16.8319
Total 356.8581 21.0897 0.0000 799.7420
Strip Mall 37 7.5107 0.4439 0.0000
0.0000
Quality Restaurant 37 7.5107 0.4439 0.0000 16.8319
Other Non-Asphalt Surfaces
0 0.0000 0.0000 0.0000
0.0000
Hotel 234 47.4999 2.8072 0.0000 106.4503
Enclosed Parking with Elevator
0 0.0000 0.0000 0.0000
659.6280
City Park 0 0.0000 0.0000 0.0000 0.0000
Land Use tons ton
MT/yr
Apartments High Rise
1450 294.3369 17.3948 0.0000
8.2 Waste by Land UseUnmitigated
Waste Disposed
Total CO2 CH4 N2O CO2e

4.0397
Total 85.6460 5.0615 0.0000 191.9381
Strip Mall 8.88 1.8026 0.1065 0.0000
0.0000
Quality Restaurant 8.88 1.8026 0.1065 0.0000 4.0397
Other Non-Asphalt Surfaces
0 0.0000 0.0000 0.0000
0.0000
Hotel 56.16 11.4000 0.6737 0.0000 25.5481
Enclosed Parking with Elevator
0 0.0000 0.0000 0.0000
158.3107
City Park 0 0.0000 0.0000 0.0000 0.0000
Land Use tons ton
MT/yr
Apartments High Rise
348 70.6409 4.1748 0.0000
Mitigated
Waste Disposed
Total CO2 CH4 N2O CO2e

AppendixA.3OperationalEmissions(EMFAC2014)
ExistingandProject(InterimandFullBuildout)TripandVMTReductions
ExistingandProject(InterimandFullBuildout)MobileSourceEmissions

1020 S. Figueroa Street ProjectDraft Environmental Impact ReportQuantifying Greenhouse Gas Mitigation Measures ‐ Transportation (Based on CAPCOA Guidance (August 2010))
Purpose:This section provides calculations for vehicle miles traveled (VMT) reductions from BAU characteristics based on guidance contained in the California Air Pollution Control Officers Association (CAPCOA),Quantifying Greenhouse Gas Mitigation Measures (August 2010).
Notes on Calculations:1. Percent VMT reduced is calculated individually for each measure based on the formulas for each measure.2. Certain individual measures or groups of measures have VMT reduction caps, as indicated in the calculations. 3. The location type determines the VMT reduction caps for LUT‐2 as well as the global transportation VMT reduction cap.4. The VMT reduction cap for the LUT/SDT/PDT/TST group of measures is 5% less than the global transportation cap.5. When summing the total VMT reductions from multiple measures, a double counting correction is applied as follows.
a. The total percent reductions from the different measures are NOT added together to avoid double counting. VMT reductions for each successive measure are applied only to the "remaining" VMT after the reductions from the previous measure have been taken out.
b. In order to calculate the "effective" VMT reduction percent due to multiple measures, the following formula is applied:Total Percent VMT Reduction % =
= 100% ‐ [(100% ‐ Measure 1 Reduction %) × (100% ‐ Measure 2 Reduction %) × (100% ‐ Measure 3 Reduction %) × … ]
Example:Measure 1 VMT Reduction = 5%Measure 2 VMT Reduction = 10%Measure 3 VMT Reduction = 7%Total Percent VMT Reduction % = 100% ‐ [(100% ‐ 5%) × (100% ‐ 10%) × (100% ‐ 7%)]
= 100% ‐ [(95%) × (90%) × (93%)] = 100% ‐ 79.5% = 20.5% (this is less than 5% + 10% + 7% = 22%, due to the double counting correction)
Note: Values in the above example are in percent format and 95% is equivalent to 0.95 in decimal format.Multiplying values that are less than 1 in decimal format results in a smaller number.

EXISTING SETTINGDraft Environmental Impact ReportQuantifying Greenhouse Gas Mitigation Measures ‐ Transportation (Based on CAPCOA Guidance (August 2010))
BUSINESS AS USUAL PROJECT
Location Type Global % VMT Reduction Cap Location Type Global % VMT Reduction CapUrban: 75% Suburban Center: 20%Less than 5 miles from central business district Typically 20 miles or more from central business districtJobs‐rich (jobs/housing ratio greater than 1.5) Balanced jobs‐housingTypical buildings are 6 stories or higher Typical buildings are 2 storiesGrid street pattern Grid street patternMinimal setbacks Setbacks 0 ‐ 20 feetParking constrained on‐ and off‐street Parking somewhat constrained on‐street; ample off‐streetParking prices high/highest in the region Parking prices low (if priced at all)High‐quality rail; bus service at 10 min or less in peak hours Bus service at 20 ‐ 30 min and/or commuter rail station
Compact Infill: 40% Suburban: 15%Typically 5 ‐ 15 miles from central business district Typically 20 miles or more from central business districtBalanced jobs‐housing (jobs/housing ratio from 0.9 to 1.2) Housing‐richTypical buildings are 2 ‐ 4 stories Typical buildings are 1 ‐ 2 storiesGrid street pattern Curvilinear street pattern (cul‐de‐sac based)Setbacks 0 ‐ 20 feet Parking between street and buildings; large lot residential Total Global Transportation VMT Reduction = 29.82% Cap: 75%Parking constrained Parking ample; largely surface lot‐based (Includes double counting correction.)Parking prices low/moderate No parking pricesRail w/in 2 miles; bus service at 15 min or less in peak hours Limited bus service at 30 minute headways or more Total LUT/SDT/PDT/TST VMT Reduction = 29.82% Cap: 70%
Land Use/Location Transportation Measures (65% Reduction Cap) Total LUT % VMT Reduction = 29.82% Cap: 65%
LUT‐1 Increase Density % VMT Reduction = A × B [not to exceed 30%] % VMT Reduction = 0.08% Cap: 30%
A (housing) = (Number of DU/acre ‐ 7.6 ) / 7.6 Number of DU/acre: ‐ A = 0%A (jobs) = (Number of Jobs/acre ‐ 20 ) / 20 Number of Jobs/acre: 43.7 A = 119%B = 0.07%
LUT‐2 Increase Location Efficiency % VMT Reduction Cap for all LUT measures Urban LUT % VMT Reduction Cap: 65%Compact Infill LUT % VMT Reduction Cap: 30%
Suburban Center LUT % VMT Reduction Cap: 10%
LUT‐3 Increase Diversity of Urban and % VMT Reduction = Land Use × B [not to exceed 30%] % VMT Reduction = 0.00% Cap: 30%Suburban Developments (Mixed Use) Land Use = % increase in land use index vs. single use
= (Land Use Index ‐ 0.15) / 0.15 Single family sqft: ‐ a1 = ‐
Land Use Index = ‐a / ln(6) Multi‐family sqft: ‐ a2 = ‐ a = ∑ ai × ln(ai) Commercial sqft: ‐ a3 = ‐ ai = building floor area / total square feet of area considered Industrial sqft: ‐ a4 = ‐ a1 = single family Institutional sqft: ‐ a5 = ‐ a2 = multi‐family Park sqft: ‐ a6 = ‐ a3 = commercial B = 0.09 Total sqft: ‐ a4 = industrial
(ACOUNTED FOR IN TRAFFIC STUDY) a5 = institutional (Note: If ai = 0, then set ai = 0.0000001)
a6 = park
LUT‐4 Increase Destination Accessibility % VMT Reduction = Center Distance × B [not to exceed 20%] % VMT Reduction = 18.33% Cap: 20%Center Distance = (12 ‐ Miles to downtown or job center) / 12B = 0.20 Miles to downtown or job center: 1.0
(Note: Only effective for 8 miles or less)
Urban: The urban project will be predominantly characterized by properties on which various uses, such as office, commercial, institutional, and residential, are combined in a single building or on a single site in an integrated development project with functional interrelationships and a coherent physical design.
Suburban: The suburban project will have at least three uses of the following on site and/or offsite within ¼‐mile: Residential Development, Retail Development, Park, Open Space, or Office.

LUT‐5 Increase Transit Accessibility % VMT Reduction = Transit × B [not to exceed 30%] % VMT Reduction = 0.00% Cap: 30%Transit = % project transit ‐ % typical ITE transit
(ACOUNTED FOR IN TRAFFIC STUDY) % project transit = ‐50x + 38 [where x = 0 ‐ 0.5 miles to transit] Miles to transit:‐4.4x + 15.2 [where x = 0.5 ‐ 3 miles to transit]
% typical ITE transit = 1.3% (Note: Only effective for 3 miles or less)B = 0.67
LUT‐6 Integrated Affordable and % VMT Reduction = 4% × % units BMR % VMT Reduction = 0.00%Below Market Rate Housing
% of units below market rate:
(Note: Only effective up to 30%)
LUT‐7 Orient Project Toward Non‐Auto Not quantified separately; Assumed to be included in LUT‐3Corridor (If included in LUT‐3, VMT reduction should be at least 0.5% per 1% inprovement in transit frequency and
0.5% per 10% increase in transit ridership)
LUT‐8 Locate Project near Bike Path/Bike Lanes Not quantified separately; Assumed to be included in LUT‐4(If included in LUT‐4, VMT reduction should be at least 0.625%)
LUT‐9 Improve Design of Development % VMT Reduction = Intersections × B % VMT Reduction = 14.00%Intersections = % increase vs. typical ITE suburban = (Intersections per square mile of project ‐ 36) / 36 Intersections per square mile: 78 B = 0.12
(Note: Only effective up to 100)
Neighborhood/Site Enhancement Measures (5% Reduction Cap without NEV; 15% Reduction Cap with NEV) Total SDT % VMT Reduction = 0.00% Cap: 5% without NEVCap: 15% With NEV
SDT‐1 Provide Pedestrian Network VMT reduction based on urban/rural context and % VMT Reduction = 0.00%Improvements pedestrian accomodations
Pedestrian network on‐site and connecting off‐site (urban/suburban): 2%Pedestrian network on‐site (urban/suburban): 1%
(Mark an "X" in one of the above)
SDT‐2 Provide Traffic Calming Measures Marked crosswalks, count‐down signal timers, % VMT Reduction = 0.00%curb extensions, speed tables, rasied crosswalks, % of streets with improvementsraised intersections, median islands, tight corner radii, 25% of streets with improvements: A A B C Droundabouts, on‐street parking, planter strips with trees, 50% of streets with improvements: B W 0.25% 0.25% 0.50% 0.50%chicanes/chokers, and others. 75% of streets with improvements: C X 0.25% 0.50% 0.50% 0.75%
100% of streets with improvements: D Y 0.50% 0.50% 0.75% 0.75%Z 0.50% 0.75% 0.75% 1.00%
25% of intersctions with improvements: W50% of intersctions with improvements: X75% of intersctions with improvements: Y
100% of intersctions with improvements: Z
(Mark an "X" in one of the above for each group)
% of intersections
with
improvem
ents
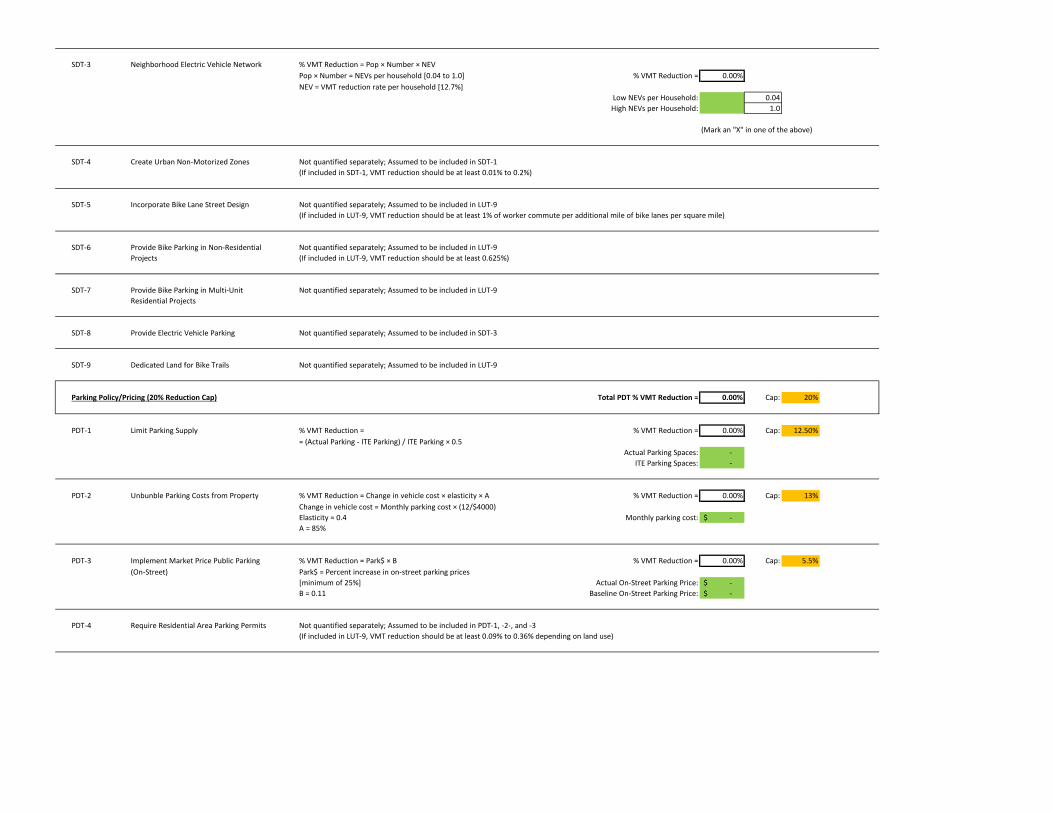
SDT‐3 Neighborhood Electric Vehicle Network % VMT Reduction = Pop × Number × NEVPop × Number = NEVs per household [0.04 to 1.0] % VMT Reduction = 0.00%NEV = VMT reduction rate per household [12.7%]
Low NEVs per Household: 0.04High NEVs per Household: 1.0
(Mark an "X" in one of the above)
SDT‐4 Create Urban Non‐Motorized Zones Not quantified separately; Assumed to be included in SDT‐1(If included in SDT‐1, VMT reduction should be at least 0.01% to 0.2%)
SDT‐5 Incorporate Bike Lane Street Design Not quantified separately; Assumed to be included in LUT‐9(If included in LUT‐9, VMT reduction should be at least 1% of worker commute per additional mile of bike lanes per square mile)
SDT‐6 Provide Bike Parking in Non‐Residential Not quantified separately; Assumed to be included in LUT‐9Projects (If included in LUT‐9, VMT reduction should be at least 0.625%)
SDT‐7 Provide Bike Parking in Multi‐Unit Not quantified separately; Assumed to be included in LUT‐9Residential Projects
SDT‐8 Provide Electric Vehicle Parking Not quantified separately; Assumed to be included in SDT‐3
SDT‐9 Dedicated Land for Bike Trails Not quantified separately; Assumed to be included in LUT‐9
Parking Policy/Pricing (20% Reduction Cap) Total PDT % VMT Reduction = 0.00% Cap: 20%
PDT‐1 Limit Parking Supply % VMT Reduction = % VMT Reduction = 0.00% Cap: 12.50%= (Actual Parking ‐ ITE Parking) / ITE Parking × 0.5
Actual Parking Spaces: ‐ ITE Parking Spaces: ‐
PDT‐2 Unbunble Parking Costs from Property % VMT Reduction = Change in vehicle cost × elasticity × A % VMT Reduction = 0.00% Cap: 13%Change in vehicle cost = Monthly parking cost × (12/$4000)Elasticity = 0.4 Monthly parking cost: ‐$ A = 85%
PDT‐3 Implement Market Price Public Parking % VMT Reduction = Park$ × B % VMT Reduction = 0.00% Cap: 5.5%(On‐Street) Park$ = Percent increase in on‐street parking prices
[minimum of 25%] Actual On‐Street Parking Price: ‐$ B = 0.11 Baseline On‐Street Parking Price: ‐$
PDT‐4 Require Residential Area Parking Permits Not quantified separately; Assumed to be included in PDT‐1, ‐2‐, and ‐3(If included in LUT‐9, VMT reduction should be at least 0.09% to 0.36% depending on land use)

Transit System Improvements (10% Reduction Cap) Total TST % VMT Reduction = 0.00% Cap: 10%
TST‐1 Provide a Bus Rapid Transit System % VMT Reduction = Riders × Mode × Lines × D % VMT Reduction = 0.00% Cap: 3.2%Riders = 28%Mode = 17% Urban Center Urban Center: 17%
4% Urban Urban: 4%1.30% Suburban Suburban: 1.30%
Lines = Percent of lines serving project converting to BRTD = 0.67 (Mark an "X" in one of the above)
Lines Converting to BRT: 0%Total Baseline Lines:
TST‐2 Implement Transit Access Improvements Not quantified separately; Assumed to be included in TST‐3 and ‐4
TST‐3 Expand Transit Network % VMT Reduction = Coverage × B × Mode × D % VMT Reduction = 0.00% Cap: 8.2%Coverage = % increase in transit network coverage
B = 0.65 Urban Center Urban Center: 17% 0.650.72 Urban Urban: 4% 0.721.01 Suburban Suburban: 1.30% 1.01
Mode = 17% Urban Center4% Urban (Mark an "X" in one of the above)
1.30% SuburbanD = 0.67 Coverage:
TST‐4 Increase Transit Service Frequency/Speed % VMT Reduction = Headway × B × C × Mode × E % VMT Reduction = 0.00% Cap: 2.5%Headway = % reduction in headways [15% ‐ 80%]
B = 0.32 Urban Urban Center: 17% 0.320.36 Suburban Urban: 4% 0.32
C = 50% < 50% lines improved Suburban: 1.30% 0.3685% >= 50% lines improved
Mode = 17% Urban Center (Mark an "X" in one of the above)4% Urban
1.30% Suburban Headway:E = 0.67 Percent of Lines Improved:
TST‐5 Provide Bike Parking Near Transit Not quantified separately; Assumed to be included in TST‐3 and ‐4
TST‐6 Provide Local Shuttles Not quantified separately; Assumed to be included in TST‐3 and ‐4
Commute Trip Reduction (25% Reduction Cap ‐ WORK VMT ONLY) Total TRT % Work VMT Reduction = 0.00% Cap: 25%% Work VMT of Total VMT: 2.5%
Total TRT % Overall VMT Reduction = 0.00% Cap: 15%
TRT‐1 Implement Voluntary Commute % Work VMT Reduction = A × B % Work VMT Reduction = 0.00% Cap: 6.2%Trip Reduction Program A = 6.2% Urban
5.4% Suburban Center Urban: 6.2%5.2% Suburban Suburban Center: 5.4%
B = % employees eligible Suburban: 5.2%
(Mark an "X" in one of the above)
% Employees Eligible:
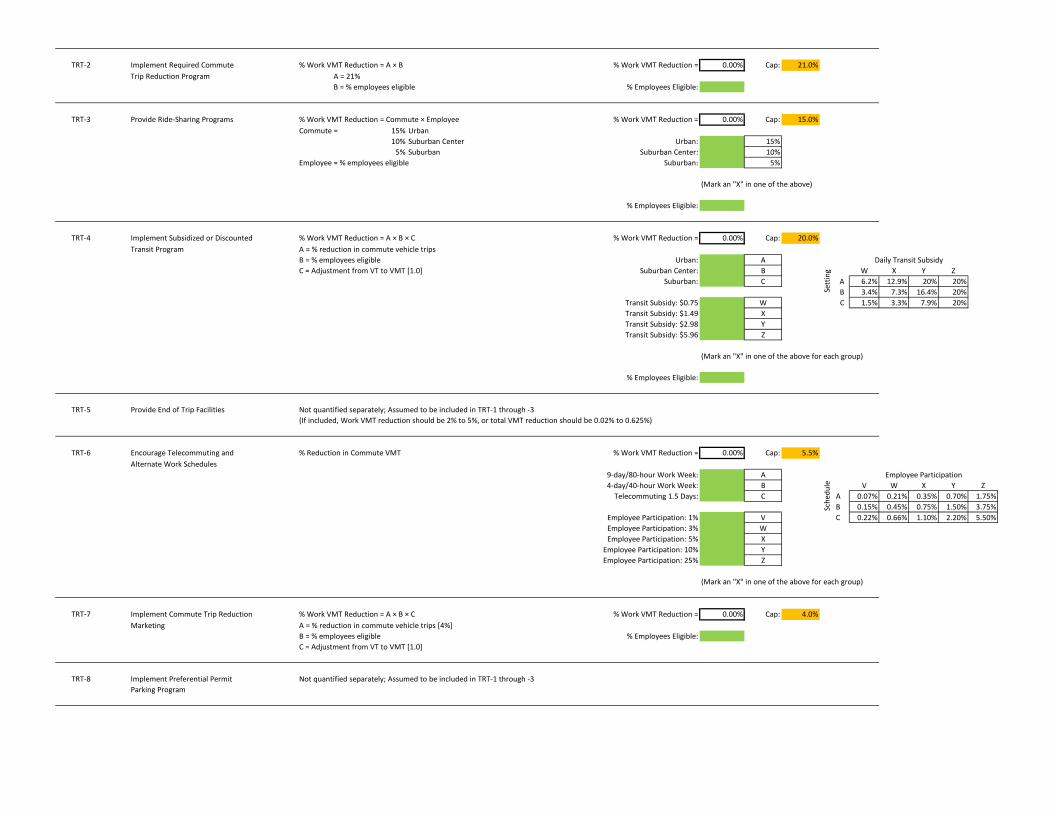
TRT‐2 Implement Required Commute % Work VMT Reduction = A × B % Work VMT Reduction = 0.00% Cap: 21.0%Trip Reduction Program A = 21%
B = % employees eligible % Employees Eligible:
TRT‐3 Provide Ride‐Sharing Programs % Work VMT Reduction = Commute × Employee % Work VMT Reduction = 0.00% Cap: 15.0%Commute = 15% Urban
10% Suburban Center Urban: 15%5% Suburban Suburban Center: 10%
Employee = % employees eligible Suburban: 5%
(Mark an "X" in one of the above)
% Employees Eligible:
TRT‐4 Implement Subsidized or Discounted % Work VMT Reduction = A × B × C % Work VMT Reduction = 0.00% Cap: 20.0%Transit Program A = % reduction in commute vehicle trips
B = % employees eligible Urban: AC = Adjustment from VT to VMT [1.0] Suburban Center: B W X Y Z
Suburban: C A 6.2% 12.9% 20% 20%B 3.4% 7.3% 16.4% 20%
Transit Subsidy: $0.75 W C 1.5% 3.3% 7.9% 20%Transit Subsidy: $1.49 XTransit Subsidy: $2.98 YTransit Subsidy: $5.96 Z
(Mark an "X" in one of the above for each group)
% Employees Eligible:
TRT‐5 Provide End of Trip Facilities Not quantified separately; Assumed to be included in TRT‐1 through ‐3(If included, Work VMT reduction should be 2% to 5%, or total VMT reduction should be 0.02% to 0.625%)
TRT‐6 Encourage Telecommuting and % Reduction in Commute VMT % Work VMT Reduction = 0.00% Cap: 5.5%Alternate Work Schedules
9‐day/80‐hour Work Week: A4‐day/40‐hour Work Week: B V W X Y ZTelecommuting 1.5 Days: C A 0.07% 0.21% 0.35% 0.70% 1.75%
B 0.15% 0.45% 0.75% 1.50% 3.75%Employee Participation: 1% V C 0.22% 0.66% 1.10% 2.20% 5.50%Employee Participation: 3% WEmployee Participation: 5% X
Employee Participation: 10% YEmployee Participation: 25% Z
(Mark an "X" in one of the above for each group)
TRT‐7 Implement Commute Trip Reduction % Work VMT Reduction = A × B × C % Work VMT Reduction = 0.00% Cap: 4.0%Marketing A = % reduction in commute vehicle trips [4%]
B = % employees eligible % Employees Eligible:C = Adjustment from VT to VMT [1.0]
TRT‐8 Implement Preferential Permit Not quantified separately; Assumed to be included in TRT‐1 through ‐3Parking Program
Sche
dule
Employee Participation
Setting
Daily Transit Subsidy

TRT‐9 Implement Car‐Sharing Program % Work VMT Reduction = A × B / C % Work VMT Reduction = 0.00% Cap: 0.74%A = % reduction in car‐share member annual VMT [37%]B = number of car share members per shared car [20] Urban: 1,000
C = 1,000 Urban Suburban: 2,000 2,000 Suburban
(Mark an "X" in one of the above)
TRT‐10 Implement a School Pool Program Not applicable.
TRT‐11 Provide Employer‐Sponsored % Work VMT Reduction = A × B × C % Work VMT Reduction = 0.00% Cap: 13.4%Vanpool/Shuttle A = % shift in vanpool mode share of commute trips
= 2% to 20% A: Shift in Vanpool Mode Share:B = % employees eligible B: Employees Eligible:C = 0.67
TRT‐12 Implement Bike Sharing Program Not quantified separately; Assumed to be included in LUT‐9 and SDT‐5(If included, total VMT reduction should be at least 0.03%)
TRT‐13 Implement School Bus Program Not applicable.
TRT‐14 Price Workplace Parking % Work VMT Reduction = A × B % Work VMT Reduction = 0.00% Cap: 19.7%A = % reduction in commute VMTB = % employees subject to priced parking Urban: A
Suburban Center: B W X Y ZSuburban: C A 6.9% 12.5% 16.8% 19.7%
B 1.8% 3.7% 5.4% 6.8%Daily Parking Charge: $1 W C 0.5% 1.2% 1.9% 2.8%Daily Parking Charge: $2 XDaily Parking Charge: $3 YDaily Parking Charge: $6 Z
(Mark an "X" in one of the above for each group)
% Employees Subject to Priced Parking:
TRT‐15 Implement Employee Parking % Work VMT Reduction = A × B % Work VMT Reduction = 0.00% Cap: 7.7%Cash‐Out
A = 7.7% Urban Urban: 7.7%4.5% Suburban Center Suburban Center: 4.5%3.0% Suburban Suburban: 3.0%
B = % employees eligible(Mark an "X" in one of the above)
% Employees Eligible:
Setting
Daily Parking Charge

INTERIM YEAR: 1020 S. Figueroa Street ProjectDraft Environmental Impact ReportQuantifying Greenhouse Gas Mitigation Measures ‐ Transportation (Based on CAPCOA Guidance (August 2010))
PROPOSED PROJECT
Location Type Global % VMT Reduction Cap Location Type Global % VMT Reduction CapUrban: 75% Suburban Center: 20%Less than 5 miles from central business district Typically 20 miles or more from central business districtJobs‐rich (jobs/housing ratio greater than 1.5) Balanced jobs‐housingTypical buildings are 6 stories or higher Typical buildings are 2 storiesGrid street pattern Grid street patternMinimal setbacks Setbacks 0 ‐ 20 feetParking constrained on‐ and off‐street Parking somewhat constrained on‐street; ample off‐streetParking prices high/highest in the region Parking prices low (if priced at all)High‐quality rail; bus service at 10 min or less in peak hours Bus service at 20 ‐ 30 min and/or commuter rail station
Compact Infill: 40% Suburban: 15%Typically 5 ‐ 15 miles from central business district Typically 20 miles or more from central business districtBalanced jobs‐housing (jobs/housing ratio from 0.9 to 1.2) Housing‐richTypical buildings are 2 ‐ 4 stories Typical buildings are 1 ‐ 2 storiesGrid street pattern Curvilinear street pattern (cul‐de‐sac based)Setbacks 0 ‐ 20 feet Parking between street and buildings; large lot residential Total Global Transportation VMT Reduction = 31.65% Cap: 75%Parking constrained Parking ample; largely surface lot‐based (Includes double counting correction.)Parking prices low/moderate No parking pricesRail w/in 2 miles; bus service at 15 min or less in peak hours Limited bus service at 30 minute headways or more Total LUT/SDT/PDT/TST VMT Reduction = 31.65% Cap: 70%
Land Use/Location Transportation Measures (65% Reduction Cap) Total LUT % VMT Reduction = 30.26% Cap: 65%
LUT‐1 Increase Density % VMT Reduction = A × B [not to exceed 30%] % VMT Reduction = 0.70% Cap: 30%
A (housing) = (Number of DU/acre ‐ 7.6 ) / 7.6 Number of DU/acre: 107.4 A = 500%A (jobs) = (Number of Jobs/acre ‐ 20 ) / 20 Number of Jobs/acre: 151.5 A = 500%B = 0.07%
LUT‐2 Increase Location Efficiency % VMT Reduction Cap for all LUT measures Urban LUT % VMT Reduction Cap: 65%Compact Infill LUT % VMT Reduction Cap: 30%
Suburban Center LUT % VMT Reduction Cap: 10%
LUT‐3 Increase Diversity of Urban and % VMT Reduction = Land Use × B [not to exceed 30%] % VMT Reduction = 0.00% Cap: 30%Suburban Developments (Mixed Use) Land Use = % increase in land use index vs. single use
= (Land Use Index ‐ 0.15) / 0.15 Single family sqft: ‐ a1 = ‐ Land Use Index = ‐a / ln(6) Multi‐family sqft: ‐ a2 = ‐ a = ∑ ai × ln(ai) Commercial sqft: ‐ a3 = ‐ ai = building floor area / total square feet of area considered Industrial sqft: ‐ a4 = ‐ a1 = single family Institutional sqft: ‐ a5 = ‐ a2 = multi‐family Park sqft: ‐ a6 = ‐ a3 = commercial B = 0.09 Total sqft: ‐ a4 = industrial
(ACOUNTED FOR IN TRAFFIC STUDY) a5 = institutional (Note: If ai = 0, then set ai = 0.0000001)a6 = park
LUT‐4 Increase Destination Accessibility % VMT Reduction = Center Distance × B [not to exceed 20%] % VMT Reduction = 18.33% Cap: 20%Center Distance = (12 ‐ Miles to downtown or job center) / 12B = 0.20 Miles to downtown or job center: 1.0
(Distance to Downtown's Financial District)(Note: Only effective for 8 miles or less)
Urban: The urban project will be predominantly characterized by properties on which various uses, such as office, commercial, institutional, and residential, are combined in a single building or on a single site in an integrated development project with functional interrelationships and a coherent physical design.
Suburban: The suburban project will have at least three uses of the following on site and/or offsite within ¼‐mile: Residential Development, Retail Development, Park, Open Space, or Office.

LUT‐5 Increase Transit Accessibility % VMT Reduction = Transit × B [not to exceed 30%] % VMT Reduction = 0.00% Cap: 30%Transit = % project transit ‐ % typical ITE transit
(ACOUNTED FOR IN TRAFFIC STUDY) % project transit = ‐50x + 38 [where x = 0 ‐ 0.5 miles to transit] Miles to transit:‐4.4x + 15.2 [where x = 0.5 ‐ 3 miles to transit]
% typical ITE transit = 1.3% (Note: Only effective for 3 miles or less)B = 0.67
LUT‐6 Integrated Affordable and % VMT Reduction = 4% × % units BMR % VMT Reduction = 0.00%Below Market Rate Housing
% of units below market rate:
(Note: Only effective up to 30%)
LUT‐7 Orient Project Toward Non‐Auto Not quantified separately; Assumed to be included in LUT‐3Corridor (If included in LUT‐3, VMT reduction should be at least 0.5% per 1% inprovement in transit frequency and
0.5% per 10% increase in transit ridership)
LUT‐8 Locate Project near Bike Path/Bike Lanes Not quantified separately; Assumed to be included in LUT‐4(If included in LUT‐4, VMT reduction should be at least 0.625%)
LUT‐9 Improve Design of Development % VMT Reduction = Intersections × B % VMT Reduction = 14.00%Intersections = % increase vs. typical ITE suburban = (Intersections per square mile of project ‐ 36) / 36 Intersections per square mile: 78 B = 0.12 (Estimated based on count of intersections within 1 mile radius of project site.)
(Note: Only effective up to 100)
Neighborhood/Site Enhancement Measures (5% Reduction Cap without NEV; 15% Reduction Cap with NEV) Total SDT % VMT Reduction = 2.00% Cap: 5% without NEVCap: 15% With NEV
SDT‐1 Provide Pedestrian Network VMT reduction based on urban/rural context and % VMT Reduction = 2.00%Improvements pedestrian accomodations
Pedestrian network on‐site and connecting off‐site (urban/suburban): X 2%Pedestrian network on‐site (urban/suburban): 1%
(Mark an "X" in one of the above)
SDT‐2 Provide Traffic Calming Measures Marked crosswalks, count‐down signal timers, % VMT Reduction = 0.00%curb extensions, speed tables, rasied crosswalks, % of streets with improvementsraised intersections, median islands, tight corner radii, 25% of streets with improvements: A A B C Droundabouts, on‐street parking, planter strips with trees, 50% of streets with improvements: B W 0.25% 0.25% 0.50% 0.50%chicanes/chokers, and others. 75% of streets with improvements: C X 0.25% 0.50% 0.50% 0.75%
100% of streets with improvements: D Y 0.50% 0.50% 0.75% 0.75%Z 0.50% 0.75% 0.75% 1.00%
25% of intersctions with improvements: W50% of intersctions with improvements: X75% of intersctions with improvements: Y100% of intersctions with improvements: Z
(Mark an "X" in one of the above for each group)
% of intersections
with
improvem
ents
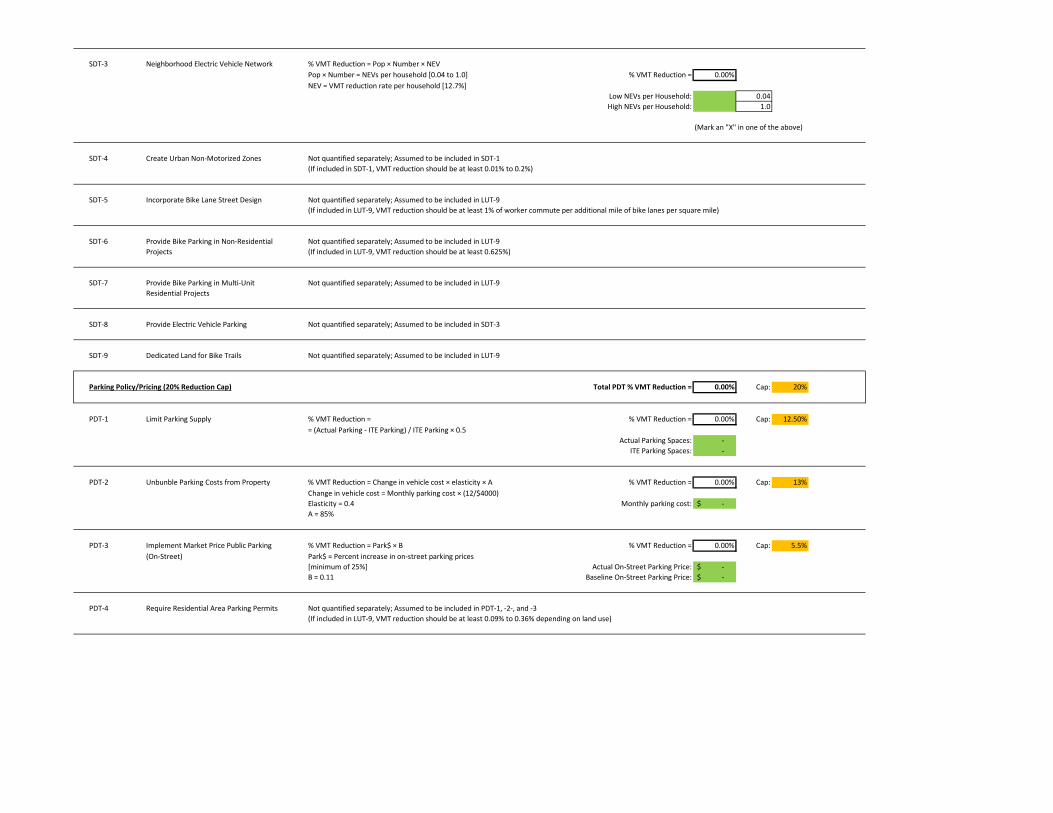
SDT‐3 Neighborhood Electric Vehicle Network % VMT Reduction = Pop × Number × NEVPop × Number = NEVs per household [0.04 to 1.0] % VMT Reduction = 0.00%NEV = VMT reduction rate per household [12.7%]
Low NEVs per Household: 0.04High NEVs per Household: 1.0
(Mark an "X" in one of the above)
SDT‐4 Create Urban Non‐Motorized Zones Not quantified separately; Assumed to be included in SDT‐1(If included in SDT‐1, VMT reduction should be at least 0.01% to 0.2%)
SDT‐5 Incorporate Bike Lane Street Design Not quantified separately; Assumed to be included in LUT‐9(If included in LUT‐9, VMT reduction should be at least 1% of worker commute per additional mile of bike lanes per square mile)
SDT‐6 Provide Bike Parking in Non‐Residential Not quantified separately; Assumed to be included in LUT‐9Projects (If included in LUT‐9, VMT reduction should be at least 0.625%)
SDT‐7 Provide Bike Parking in Multi‐Unit Not quantified separately; Assumed to be included in LUT‐9Residential Projects
SDT‐8 Provide Electric Vehicle Parking Not quantified separately; Assumed to be included in SDT‐3
SDT‐9 Dedicated Land for Bike Trails Not quantified separately; Assumed to be included in LUT‐9
Parking Policy/Pricing (20% Reduction Cap) Total PDT % VMT Reduction = 0.00% Cap: 20%
PDT‐1 Limit Parking Supply % VMT Reduction = % VMT Reduction = 0.00% Cap: 12.50%= (Actual Parking ‐ ITE Parking) / ITE Parking × 0.5
Actual Parking Spaces: ‐ ITE Parking Spaces: ‐
PDT‐2 Unbunble Parking Costs from Property % VMT Reduction = Change in vehicle cost × elasticity × A % VMT Reduction = 0.00% Cap: 13%Change in vehicle cost = Monthly parking cost × (12/$4000)Elasticity = 0.4 Monthly parking cost: ‐$ A = 85%
PDT‐3 Implement Market Price Public Parking % VMT Reduction = Park$ × B % VMT Reduction = 0.00% Cap: 5.5%(On‐Street) Park$ = Percent increase in on‐street parking prices
[minimum of 25%] Actual On‐Street Parking Price: ‐$ B = 0.11 Baseline On‐Street Parking Price: ‐$
PDT‐4 Require Residential Area Parking Permits Not quantified separately; Assumed to be included in PDT‐1, ‐2‐, and ‐3(If included in LUT‐9, VMT reduction should be at least 0.09% to 0.36% depending on land use)

Transit System Improvements (10% Reduction Cap) Total TST % VMT Reduction = 0.00% Cap: 10%
TST‐1 Provide a Bus Rapid Transit System % VMT Reduction = Riders × Mode × Lines × D % VMT Reduction = 0.00% Cap: 3.2%Riders = 28%Mode = 17% Urban Center Urban Center: 17%
4% Urban Urban: 4%1.30% Suburban Suburban: 1.30%
Lines = Percent of lines serving project converting to BRTD = 0.67 (Mark an "X" in one of the above)
Lines Converting to BRT: 0%Total Baseline Lines:
TST‐2 Implement Transit Access Improvements Not quantified separately; Assumed to be included in TST‐3 and ‐4
TST‐3 Expand Transit Network % VMT Reduction = Coverage × B × Mode × D % VMT Reduction = 0.00% Cap: 8.2%Coverage = % increase in transit network coverage
B = 0.65 Urban Center Urban Center: 17% 0.650.72 Urban Urban: 4% 0.721.01 Suburban Suburban: 1.30% 1.01
Mode = 17% Urban Center4% Urban (Mark an "X" in one of the above)
1.30% SuburbanD = 0.67 Coverage:
TST‐4 Increase Transit Service Frequency/Speed % VMT Reduction = Headway × B × C × Mode × E % VMT Reduction = 0.00% Cap: 2.5%Headway = % reduction in headways [15% ‐ 80%]
B = 0.32 Urban Urban Center: 17% 0.320.36 Suburban Urban: 4% 0.32
C = 50% < 50% lines improved Suburban: 1.30% 0.3685% >= 50% lines improved
Mode = 17% Urban Center (Mark an "X" in one of the above)4% Urban
1.30% Suburban Headway:E = 0.67 Percent of Lines Improved:
TST‐5 Provide Bike Parking Near Transit Not quantified separately; Assumed to be included in TST‐3 and ‐4
TST‐6 Provide Local Shuttles Not quantified separately; Assumed to be included in TST‐3 and ‐4
Commute Trip Reduction (25% Reduction Cap ‐ WORK VMT ONLY) Total TRT % Work VMT Reduction = 0.00% Cap: 25%% Work VMT of Total VMT: 2.5%
Total TRT % Overall VMT Reduction = 0.00% Cap: 15%
TRT‐1 Implement Voluntary Commute % Work VMT Reduction = A × B % Work VMT Reduction = 0.00% Cap: 6.2%Trip Reduction Program A = 6.2% Urban
5.4% Suburban Center Urban: 6.2%5.2% Suburban Suburban Center: 5.4%
B = % employees eligible Suburban: 5.2%
(Mark an "X" in one of the above)
% Employees Eligible:
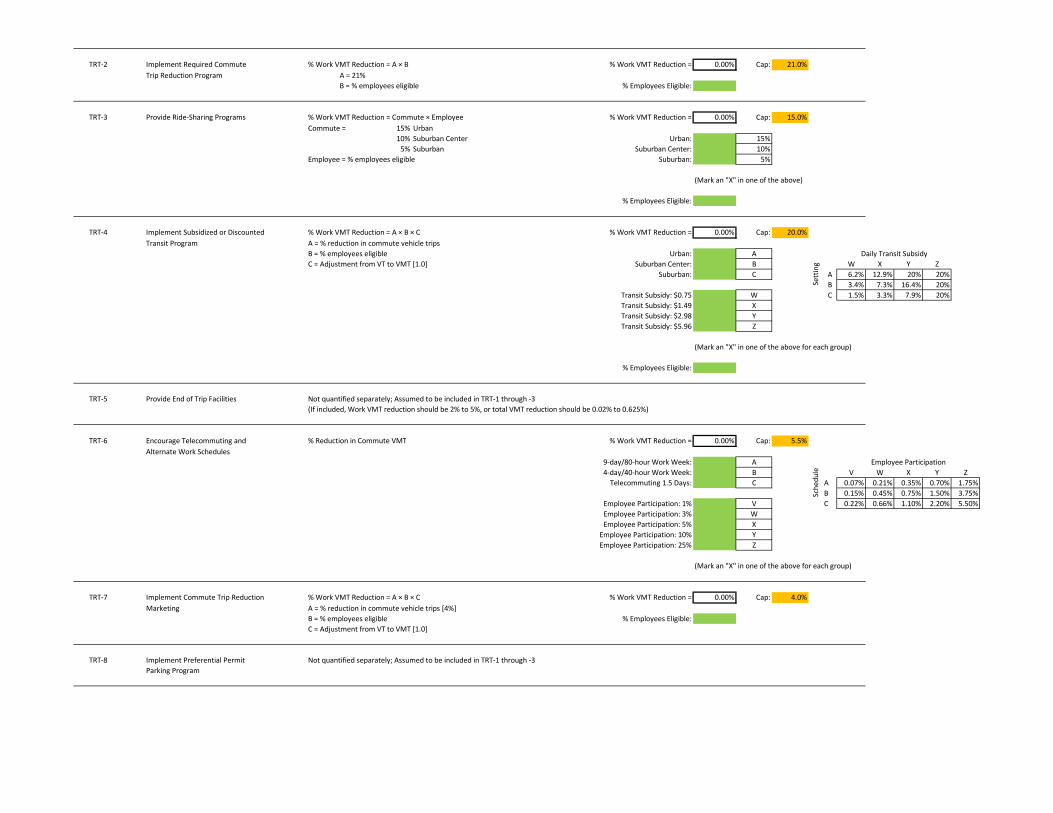
TRT‐2 Implement Required Commute % Work VMT Reduction = A × B % Work VMT Reduction = 0.00% Cap: 21.0%Trip Reduction Program A = 21%
B = % employees eligible % Employees Eligible:
TRT‐3 Provide Ride‐Sharing Programs % Work VMT Reduction = Commute × Employee % Work VMT Reduction = 0.00% Cap: 15.0%Commute = 15% Urban
10% Suburban Center Urban: 15%5% Suburban Suburban Center: 10%
Employee = % employees eligible Suburban: 5%
(Mark an "X" in one of the above)
% Employees Eligible:
TRT‐4 Implement Subsidized or Discounted % Work VMT Reduction = A × B × C % Work VMT Reduction = 0.00% Cap: 20.0%Transit Program A = % reduction in commute vehicle trips
B = % employees eligible Urban: AC = Adjustment from VT to VMT [1.0] Suburban Center: B W X Y Z
Suburban: C A 6.2% 12.9% 20% 20%B 3.4% 7.3% 16.4% 20%
Transit Subsidy: $0.75 W C 1.5% 3.3% 7.9% 20%Transit Subsidy: $1.49 XTransit Subsidy: $2.98 YTransit Subsidy: $5.96 Z
(Mark an "X" in one of the above for each group)
% Employees Eligible:
TRT‐5 Provide End of Trip Facilities Not quantified separately; Assumed to be included in TRT‐1 through ‐3(If included, Work VMT reduction should be 2% to 5%, or total VMT reduction should be 0.02% to 0.625%)
TRT‐6 Encourage Telecommuting and % Reduction in Commute VMT % Work VMT Reduction = 0.00% Cap: 5.5%Alternate Work Schedules
9‐day/80‐hour Work Week: A4‐day/40‐hour Work Week: B V W X Y ZTelecommuting 1.5 Days: C A 0.07% 0.21% 0.35% 0.70% 1.75%
B 0.15% 0.45% 0.75% 1.50% 3.75%Employee Participation: 1% V C 0.22% 0.66% 1.10% 2.20% 5.50%Employee Participation: 3% WEmployee Participation: 5% XEmployee Participation: 10% YEmployee Participation: 25% Z
(Mark an "X" in one of the above for each group)
TRT‐7 Implement Commute Trip Reduction % Work VMT Reduction = A × B × C % Work VMT Reduction = 0.00% Cap: 4.0%Marketing A = % reduction in commute vehicle trips [4%]
B = % employees eligible % Employees Eligible:C = Adjustment from VT to VMT [1.0]
TRT‐8 Implement Preferential Permit Not quantified separately; Assumed to be included in TRT‐1 through ‐3Parking Program
Setting
Daily Transit Subsidy
Sche
dule
Employee Participation

TRT‐9 Implement Car‐Sharing Program % Work VMT Reduction = A × B / C % Work VMT Reduction = 0.00% Cap: 0.74%A = % reduction in car‐share member annual VMT [37%]B = number of car share members per shared car [20] Urban: 1,000
C = 1,000 Urban Suburban: 2,000 2,000 Suburban
(Mark an "X" in one of the above)
TRT‐10 Implement a School Pool Program Not applicable.
TRT‐11 Provide Employer‐Sponsored % Work VMT Reduction = A × B × C % Work VMT Reduction = 0.00% Cap: 13.4%Vanpool/Shuttle A = % shift in vanpool mode share of commute trips
= 2% to 20% A: Shift in Vanpool Mode Share:B = % employees eligible B: Employees Eligible:C = 0.67
TRT‐12 Implement Bike Sharing Program Not quantified separately; Assumed to be included in LUT‐9 and SDT‐5(If included, total VMT reduction should be at least 0.03%)
TRT‐13 Implement School Bus Program Not applicable.
TRT‐14 Price Workplace Parking % Work VMT Reduction = A × B % Work VMT Reduction = 0.00% Cap: 19.7%A = % reduction in commute VMTB = % employees subject to priced parking Urban: A
Suburban Center: B W X Y ZSuburban: C A 6.9% 12.5% 16.8% 19.7%
B 1.8% 3.7% 5.4% 6.8%Daily Parking Charge: $1 W C 0.5% 1.2% 1.9% 2.8%Daily Parking Charge: $2 XDaily Parking Charge: $3 YDaily Parking Charge: $6 Z
(Mark an "X" in one of the above for each group)
% Employees Subject to Priced Parking:
TRT‐15 Implement Employee Parking % Work VMT Reduction = A × B % Work VMT Reduction = 0.00% Cap: 7.7%Cash‐Out
A = 7.7% Urban Urban: 7.7%4.5% Suburban Center Suburban Center: 4.5%3.0% Suburban Suburban: 3.0%
B = % employees eligible(Mark an "X" in one of the above)
% Employees Eligible:
Setting
Daily Parking Charge

FULL BUILDOUT: 1020 S. Figueroa Street ProjectDraft Environmental Impact ReportQuantifying Greenhouse Gas Mitigation Measures ‐ Transportation (Based on CAPCOA Guidance (August 2010))
BUSINESS AS USUAL PROJECT
Location Type Global % VMT Reduction Cap Location Type Global % VMT Reduction CapUrban: 75% Suburban Center: 20%Less than 5 miles from central business district Typically 20 miles or more from central business districtJobs‐rich (jobs/housing ratio greater than 1.5) Balanced jobs‐housingTypical buildings are 6 stories or higher Typical buildings are 2 storiesGrid street pattern Grid street patternMinimal setbacks Setbacks 0 ‐ 20 feetParking constrained on‐ and off‐street Parking somewhat constrained on‐street; ample off‐streetParking prices high/highest in the region Parking prices low (if priced at all)High‐quality rail; bus service at 10 min or less in peak hours Bus service at 20 ‐ 30 min and/or commuter rail station
Compact Infill: 40% Suburban: 15%Typically 5 ‐ 15 miles from central business district Typically 20 miles or more from central business districtBalanced jobs‐housing (jobs/housing ratio from 0.9 to 1.2) Housing‐richTypical buildings are 2 ‐ 4 stories Typical buildings are 1 ‐ 2 storiesGrid street pattern Curvilinear street pattern (cul‐de‐sac based)Setbacks 0 ‐ 20 feet Parking between street and buildings; large lot residential Total Global Transportation VMT Reduction = 31.65% Cap: 75%Parking constrained Parking ample; largely surface lot‐based (Includes double counting correction.)Parking prices low/moderate No parking pricesRail w/in 2 miles; bus service at 15 min or less in peak hours Limited bus service at 30 minute headways or more Total LUT/SDT/PDT/TST VMT Reduction = 31.65% Cap: 70%
Land Use/Location Transportation Measures (65% Reduction Cap) Total LUT % VMT Reduction = 30.26% Cap: 65%
LUT‐1 Increase Density % VMT Reduction = A × B [not to exceed 30%] % VMT Reduction = 0.70% Cap: 30%
A (housing) = (Number of DU/acre ‐ 7.6 ) / 7.6 Number of DU/acre: 240.7 A = 500%A (jobs) = (Number of Jobs/acre ‐ 20 ) / 20 Number of Jobs/acre: 205.9 A = 500%B = 0.07%
LUT‐2 Increase Location Efficiency % VMT Reduction Cap for all LUT measures Urban LUT % VMT Reduction Cap: 65%Compact Infill LUT % VMT Reduction Cap: 30%
Suburban Center LUT % VMT Reduction Cap: 10%
LUT‐3 Increase Diversity of Urban and % VMT Reduction = Land Use × B [not to exceed 30%] % VMT Reduction = 0.00% Cap: 30%Suburban Developments (Mixed Use) Land Use = % increase in land use index vs. single use
= (Land Use Index ‐ 0.15) / 0.15 Single family sqft: ‐ a1 = ‐
Land Use Index = ‐a / ln(6) Multi‐family sqft: ‐ a2 = ‐ a = ∑ ai × ln(ai) Commercial sqft: ‐ a3 = ‐ ai = building floor area / total square feet of area considered Industrial sqft: ‐ a4 = ‐ a1 = single family Institutional sqft: ‐ a5 = ‐ a2 = multi‐family Park sqft: ‐ a6 = ‐ a3 = commercial B = 0.09 Total sqft: ‐ a4 = industrial
(ACOUNTED FOR IN TRAFFIC STUDY) a5 = institutional (Note: If ai = 0, then set ai = 0.0000001)
a6 = park
LUT‐4 Increase Destination Accessibility % VMT Reduction = Center Distance × B [not to exceed 20%] % VMT Reduction = 18.33% Cap: 20%Center Distance = (12 ‐ Miles to downtown or job center) / 12B = 0.20 Miles to downtown or job center: 1.0
(Distance to Downtown's Financial District)(Note: Only effective for 8 miles or less)
Suburban: The suburban project will have at least three uses of the following on site and/or offsite within ¼‐mile: Residential Development, Retail Development, Park, Open Space, or Office.
Urban: The urban project will be predominantly characterized by properties on which various uses, such as office, commercial, institutional, and residential, are combined in a single building or on a single site in an integrated development project with functional interrelationships and a coherent physical design.

LUT‐5 Increase Transit Accessibility % VMT Reduction = Transit × B [not to exceed 30%] % VMT Reduction = 0.00% Cap: 30%Transit = % project transit ‐ % typical ITE transit
(ACOUNTED FOR IN TRAFFIC STUDY) % project transit = ‐50x + 38 [where x = 0 ‐ 0.5 miles to transit] Miles to transit:‐4.4x + 15.2 [where x = 0.5 ‐ 3 miles to transit]
% typical ITE transit = 1.3% (Note: Only effective for 3 miles or less)B = 0.67
LUT‐6 Integrated Affordable and % VMT Reduction = 4% × % units BMR % VMT Reduction = 0.00%Below Market Rate Housing
% of units below market rate:
(Note: Only effective up to 30%)
LUT‐7 Orient Project Toward Non‐Auto Not quantified separately; Assumed to be included in LUT‐3Corridor (If included in LUT‐3, VMT reduction should be at least 0.5% per 1% inprovement in transit frequency and
0.5% per 10% increase in transit ridership)
LUT‐8 Locate Project near Bike Path/Bike Lanes Not quantified separately; Assumed to be included in LUT‐4(If included in LUT‐4, VMT reduction should be at least 0.625%)
LUT‐9 Improve Design of Development % VMT Reduction = Intersections × B % VMT Reduction = 14.00%Intersections = % increase vs. typical ITE suburban = (Intersections per square mile of project ‐ 36) / 36 Intersections per square mile: 78 B = 0.12
(Note: Only effective up to 100)
Neighborhood/Site Enhancement Measures (5% Reduction Cap without NEV; 15% Reduction Cap with NEV) Total SDT % VMT Reduction = 2.00% Cap: 5% without NEVCap: 15% With NEV
SDT‐1 Provide Pedestrian Network VMT reduction based on urban/rural context and % VMT Reduction = 2.00%Improvements pedestrian accomodations
Pedestrian network on‐site and connecting off‐site (urban/suburban): X 2%Pedestrian network on‐site (urban/suburban): 1%
(Mark an "X" in one of the above)
SDT‐2 Provide Traffic Calming Measures Marked crosswalks, count‐down signal timers, % VMT Reduction = 0.00%curb extensions, speed tables, rasied crosswalks, % of streets with improvementsraised intersections, median islands, tight corner radii, 25% of streets with improvements: A A B C Droundabouts, on‐street parking, planter strips with trees, 50% of streets with improvements: B W 0.25% 0.25% 0.50% 0.50%chicanes/chokers, and others. 75% of streets with improvements: C X 0.25% 0.50% 0.50% 0.75%
100% of streets with improvements: D Y 0.50% 0.50% 0.75% 0.75%Z 0.50% 0.75% 0.75% 1.00%
25% of intersctions with improvements: W50% of intersctions with improvements: X75% of intersctions with improvements: Y
100% of intersctions with improvements: Z
(Mark an "X" in one of the above for each group)
with
improvem
ents
% of intersections

SDT‐3 Neighborhood Electric Vehicle Network % VMT Reduction = Pop × Number × NEVPop × Number = NEVs per household [0.04 to 1.0] % VMT Reduction = 0.00%NEV = VMT reduction rate per household [12.7%]
Low NEVs per Household: 0.04High NEVs per Household: 1.0
(Mark an "X" in one of the above)
SDT‐4 Create Urban Non‐Motorized Zones Not quantified separately; Assumed to be included in SDT‐1(If included in SDT‐1, VMT reduction should be at least 0.01% to 0.2%)
SDT‐5 Incorporate Bike Lane Street Design Not quantified separately; Assumed to be included in LUT‐9(If included in LUT‐9, VMT reduction should be at least 1% of worker commute per additional mile of bike lanes per square mile)
SDT‐6 Provide Bike Parking in Non‐Residential Not quantified separately; Assumed to be included in LUT‐9Projects (If included in LUT‐9, VMT reduction should be at least 0.625%)
SDT‐7 Provide Bike Parking in Multi‐Unit Not quantified separately; Assumed to be included in LUT‐9Residential Projects
SDT‐8 Provide Electric Vehicle Parking Not quantified separately; Assumed to be included in SDT‐3
SDT‐9 Dedicated Land for Bike Trails Not quantified separately; Assumed to be included in LUT‐9
Parking Policy/Pricing (20% Reduction Cap) Total PDT % VMT Reduction = 0.00% Cap: 20%
PDT‐1 Limit Parking Supply % VMT Reduction = % VMT Reduction = 0.00% Cap: 12.50%= (Actual Parking ‐ ITE Parking) / ITE Parking × 0.5
Actual Parking Spaces: ‐ ITE Parking Spaces: ‐
PDT‐2 Unbunble Parking Costs from Property % VMT Reduction = Change in vehicle cost × elasticity × A % VMT Reduction = 0.00% Cap: 13%Change in vehicle cost = Monthly parking cost × (12/$4000)Elasticity = 0.4 Monthly parking cost: ‐$ A = 85%
PDT‐3 Implement Market Price Public Parking % VMT Reduction = Park$ × B % VMT Reduction = 0.00% Cap: 5.5%(On‐Street) Park$ = Percent increase in on‐street parking prices
[minimum of 25%] Actual On‐Street Parking Price: ‐$ B = 0.11 Baseline On‐Street Parking Price: ‐$
PDT‐4 Require Residential Area Parking Permits Not quantified separately; Assumed to be included in PDT‐1, ‐2‐, and ‐3(If included in LUT‐9, VMT reduction should be at least 0.09% to 0.36% depending on land use)

Transit System Improvements (10% Reduction Cap) Total TST % VMT Reduction = 0.00% Cap: 10%
TST‐1 Provide a Bus Rapid Transit System % VMT Reduction = Riders × Mode × Lines × D % VMT Reduction = 0.00% Cap: 3.2%Riders = 28%Mode = 17% Urban Center Urban Center: 17%
4% Urban Urban: 4%1.30% Suburban Suburban: 1.30%
Lines = Percent of lines serving project converting to BRTD = 0.67 (Mark an "X" in one of the above)
Lines Converting to BRT: 0%Total Baseline Lines:
TST‐2 Implement Transit Access Improvements Not quantified separately; Assumed to be included in TST‐3 and ‐4
TST‐3 Expand Transit Network % VMT Reduction = Coverage × B × Mode × D % VMT Reduction = 0.00% Cap: 8.2%Coverage = % increase in transit network coverage
B = 0.65 Urban Center Urban Center: 17% 0.650.72 Urban Urban: 4% 0.721.01 Suburban Suburban: 1.30% 1.01
Mode = 17% Urban Center4% Urban (Mark an "X" in one of the above)
1.30% SuburbanD = 0.67 Coverage:
TST‐4 Increase Transit Service Frequency/Speed % VMT Reduction = Headway × B × C × Mode × E % VMT Reduction = 0.00% Cap: 2.5%Headway = % reduction in headways [15% ‐ 80%]
B = 0.32 Urban Urban Center: 17% 0.320.36 Suburban Urban: 4% 0.32
C = 50% < 50% lines improved Suburban: 1.30% 0.3685% >= 50% lines improved
Mode = 17% Urban Center (Mark an "X" in one of the above)4% Urban
1.30% Suburban Headway:E = 0.67 Percent of Lines Improved:
TST‐5 Provide Bike Parking Near Transit Not quantified separately; Assumed to be included in TST‐3 and ‐4
TST‐6 Provide Local Shuttles Not quantified separately; Assumed to be included in TST‐3 and ‐4
Commute Trip Reduction (25% Reduction Cap ‐ WORK VMT ONLY) Total TRT % Work VMT Reduction = 0.00% Cap: 25%% Work VMT of Total VMT: 2.5%
Total TRT % Overall VMT Reduction = 0.00% Cap: 15%
TRT‐1 Implement Voluntary Commute % Work VMT Reduction = A × B % Work VMT Reduction = 0.00% Cap: 6.2%Trip Reduction Program A = 6.2% Urban
5.4% Suburban Center Urban: 6.2%5.2% Suburban Suburban Center: 5.4%
B = % employees eligible Suburban: 5.2%
(Mark an "X" in one of the above)
% Employees Eligible:

TRT‐2 Implement Required Commute % Work VMT Reduction = A × B % Work VMT Reduction = 0.00% Cap: 21.0%Trip Reduction Program A = 21%
B = % employees eligible % Employees Eligible:
TRT‐3 Provide Ride‐Sharing Programs % Work VMT Reduction = Commute × Employee % Work VMT Reduction = 0.00% Cap: 15.0%Commute = 15% Urban
10% Suburban Center Urban: 15%5% Suburban Suburban Center: 10%
Employee = % employees eligible Suburban: 5%
(Mark an "X" in one of the above)
% Employees Eligible:
TRT‐4 Implement Subsidized or Discounted % Work VMT Reduction = A × B × C % Work VMT Reduction = 0.00% Cap: 20.0%Transit Program A = % reduction in commute vehicle trips
B = % employees eligible Urban: AC = Adjustment from VT to VMT [1.0] Suburban Center: B W X Y Z
Suburban: C A 6.2% 12.9% 20% 20%B 3.4% 7.3% 16.4% 20%
Transit Subsidy: $0.75 W C 1.5% 3.3% 7.9% 20%Transit Subsidy: $1.49 XTransit Subsidy: $2.98 YTransit Subsidy: $5.96 Z
(Mark an "X" in one of the above for each group)
% Employees Eligible:
TRT‐5 Provide End of Trip Facilities Not quantified separately; Assumed to be included in TRT‐1 through ‐3(If included, Work VMT reduction should be 2% to 5%, or total VMT reduction should be 0.02% to 0.625%)
TRT‐6 Encourage Telecommuting and % Reduction in Commute VMT % Work VMT Reduction = 0.00% Cap: 5.5%Alternate Work Schedules
9‐day/80‐hour Work Week: A4‐day/40‐hour Work Week: B V W X Y ZTelecommuting 1.5 Days: C A 0.07% 0.21% 0.35% 0.70% 1.75%
B 0.15% 0.45% 0.75% 1.50% 3.75%Employee Participation: 1% V C 0.22% 0.66% 1.10% 2.20% 5.50%Employee Participation: 3% WEmployee Participation: 5% X
Employee Participation: 10% YEmployee Participation: 25% Z
(Mark an "X" in one of the above for each group)
TRT‐7 Implement Commute Trip Reduction % Work VMT Reduction = A × B × C % Work VMT Reduction = 0.00% Cap: 4.0%Marketing A = % reduction in commute vehicle trips [4%]
B = % employees eligible % Employees Eligible:C = Adjustment from VT to VMT [1.0]
TRT‐8 Implement Preferential Permit Not quantified separately; Assumed to be included in TRT‐1 through ‐3Parking Program
Daily Transit Subsidy
Setting
Employee Participation
Sche
dule

TRT‐9 Implement Car‐Sharing Program % Work VMT Reduction = A × B / C % Work VMT Reduction = 0.00% Cap: 0.74%A = % reduction in car‐share member annual VMT [37%]B = number of car share members per shared car [20] Urban: 1,000
C = 1,000 Urban Suburban: 2,000 2,000 Suburban
(Mark an "X" in one of the above)
TRT‐10 Implement a School Pool Program Not applicable.
TRT‐11 Provide Employer‐Sponsored % Work VMT Reduction = A × B × C % Work VMT Reduction = 0.00% Cap: 13.4%Vanpool/Shuttle A = % shift in vanpool mode share of commute trips
= 2% to 20% A: Shift in Vanpool Mode Share:B = % employees eligible B: Employees Eligible:C = 0.67
TRT‐12 Implement Bike Sharing Program Not quantified separately; Assumed to be included in LUT‐9 and SDT‐5(If included, total VMT reduction should be at least 0.03%)
TRT‐13 Implement School Bus Program Not applicable.
TRT‐14 Price Workplace Parking % Work VMT Reduction = A × B % Work VMT Reduction = 0.00% Cap: 19.7%A = % reduction in commute VMTB = % employees subject to priced parking Urban: A
Suburban Center: B W X Y ZSuburban: C A 6.9% 12.5% 16.8% 19.7%
B 1.8% 3.7% 5.4% 6.8%Daily Parking Charge: $1 W C 0.5% 1.2% 1.9% 2.8%Daily Parking Charge: $2 XDaily Parking Charge: $3 YDaily Parking Charge: $6 Z
(Mark an "X" in one of the above for each group)
% Employees Subject to Priced Parking:
TRT‐15 Implement Employee Parking % Work VMT Reduction = A × B % Work VMT Reduction = 0.00% Cap: 7.7%Cash‐Out
A = 7.7% Urban Urban: 7.7%4.5% Suburban Center Suburban Center: 4.5%3.0% Suburban Suburban: 3.0%
B = % employees eligible(Mark an "X" in one of the above)
% Employees Eligible:
Setting
Daily Parking Charge

1020 S. Figueroa Street ProjectDraft Environmental Impact ReportDaily Vehicle Miles Traveled Adjustments
Existing and Project VMT
Land Use (CalEEMod Land U Daily Interim Year Project Trips
Project UsesResidential Units 4.54 Baseline trip rate per DU 4.11 Baseline trip rate per DU(High‐Rise Apartments) ‐20% Transit/Walk Adjustment (Traffic Study) ‐20% Transit/Walk Adjustment (Traffic Study)
3.63 Trip rate per Room less Transit/Walk Adj. 3.29 Trip rate per DU less Transit/Walk Adj.
‐31.7% VMT Reduction (CAPCOA) ‐31.7% VMT Reduction (CAPCOA)
14.70 H‐W Trip Length (Baseline) 14.70 H‐W Trip Length (Baseline)5.90 H‐S Trip Length (Baseline) 5.90 H‐S Trip Length (Baseline)8.70 H‐O Trip Length (Baseline) 8.70 H‐O Trip Length (Baseline)
10.05 H‐W Trip Length (Project) 10.05 H‐W Trip Length (Project)4.03 H‐S Trip Length (Project) 4.03 H‐S Trip Length (Project)5.95 H‐O Trip Length (Project) 5.95 H‐O Trip Length (Project)
Hotel 8.17 Baseline trip rate per Room 8.17 Baseline trip rate per Room 8.17 Baseline trip rate per Room(Hotel) ‐25% Transit/Walk Adjustment (Traffic Study) ‐25% Transit/Walk Adjustment (Traffic Study) ‐25% Transit/Walk Adjustment (Traffic Study)
6.13 Trip rate per Room less Transit/Walk Adj. 6.13 Trip rate per Room less Transit/Walk Adj. 6.13 Trip rate per Room less Transit/Walk Adj.
‐29.8% VMT Reduction (CAPCOA) ‐31.7% VMT Reduction (CAPCOA) ‐31.7% VMT Reduction (CAPCOA)
8.40 C‐C Trip Length (Baseline) 8.40 C‐C Trip Length (Baseline) 8.40 C‐C Trip Length (Baseline)16.60 C‐W Trip Length (Baseline) 16.60 C‐W Trip Length (Baseline) 16.60 C‐W Trip Length (Baseline)6.90 C‐NW Trip Length (Baseline) 6.90 C‐NW Trip Length (Baseline) 6.90 C‐NW Trip Length (Baseline)
5.89 C‐C Trip Length (Project) 5.74 H‐W Trip Length (Project) 5.74 C‐C Trip Length (Project)11.65 C‐W Trip Length (Project) 11.35 H‐S Trip Length (Project) 11.35 C‐W Trip Length (Project)4.84 C‐NW Trip Length (Project) 4.72 H‐O Trip Length (Project) 4.72 C‐NW Trip Length (Project)
Restaurant 127.13 Baseline trip rate per 1000 sf 127.15 Baseline trip rate per 1000 sf(Quality Restaurant) ‐20% Internal Capture Adjustment (Traffic Study) ‐20% Internal Capture Adjustment (Traffic Study)
‐15% Transit/Walk Adjustment (Traffic Study) ‐15% Transit/Walk Adjustment (Traffic Study)86.47 Baseline trip rate per 1000 sf less Adj. 86.48 Trip rate per 1000 sf less Adjustments
‐31.7% VMT Reduction (CAPCOA) ‐31.7% VMT Reduction (CAPCOA)
8.40 C‐C Trip Length (Baseline) 8.40 C‐C Trip Length (Baseline)16.60 C‐W Trip Length (Baseline) 16.60 C‐W Trip Length (Baseline)6.90 C‐NW Trip Length (Baseline) 6.90 C‐NW Trip Length (Baseline)
5.74 C‐C Trip Length (Project) 5.74 C‐C Trip Length (Project)11.35 C‐W Trip Length (Project) 11.35 C‐W Trip Length (Project)4.72 C‐NW Trip Length (Project) 4.72 C‐NW Trip Length (Project)
Retail 42.73 Baseline trip rate per 1000 sf 42.70 Baseline trip rate per 1000 sf(Strip Mall) ‐20% Internal Capture Adjustment (Traffic Study) ‐20% Internal Capture Adjustment (Traffic Study)
‐15% Transit/Walk Adjustment (Traffic Study) ‐15% Transit/Walk Adjustment (Traffic Study)29.07 Baseline trip rate per 1000 sf less Adj. 29.03 Trip rate per 1000 sf less Adjustments
‐31.7% VMT Reduction (CAPCOA) ‐31.7% VMT Reduction (CAPCOA)
8.40 C‐C Trip Length (Baseline) 8.40 C‐C Trip Length (Baseline)16.60 C‐W Trip Length (Baseline) 16.60 C‐W Trip Length (Baseline)6.90 C‐NW Trip Length (Baseline) 6.90 C‐NW Trip Length (Baseline)
5.74 C‐C Trip Length (Project) 5.74 C‐C Trip Length (Project)11.35 C‐W Trip Length (Project) 11.35 C‐W Trip Length (Project)4.72 C‐NW Trip Length (Project) 4.72 C‐NW Trip Length (Project)
Residential Common Areas Trips included in residential land use Trips included in residential land use Trips included in residential land useAbove‐Grade Parking Structure Land use does not generate its own trips Land use does not generate its own trips Land use does not generate its own tripsSubterranean Parking Structure Land use does not generate its own trips Land use does not generate its own trips Land use does not generate its own tripsOpen Space Land use does not generate its own trips Land use does not generate its own trips Land use does not generate its own trips
Daily Existing Trips
Source: PCR Service Corporation, (2016); Gibson Traffic Consulting, (2016).
Daily Full Buildout Project Trips

1020 S. Figueroa Street ProjectAir Quality and Greenhouse Gas AssessmentMobile Source Emissions
PM10 PM10 PM10 PM2_5 PM2_5 PM2_5Year Period ROG NOx CO SOx RD a Exh+BW+TW b Total RD a Exh+BW+TW b Total CO2
2015 Winter 9.60E‐08 7.26E‐08 7.81E‐07 1.52E‐09 3.31E‐07 1.90E‐08 3.50E‐07 8.11E‐08 8.20E‐09 8.93E‐082015 Summer 8.04E‐08 5.73E‐08 7.01E‐07 1.40E‐09 3.31E‐07 1.65E‐08 3.47E‐07 8.11E‐08 7.14E‐09 8.83E‐082015 Annual 1.54E‐04
2015 Max 9.60E‐08 7.26E‐08 7.81E‐07 1.52E‐09 3.31E‐07 1.90E‐08 3.50E‐07 8.11E‐08 8.20E‐09 8.93E‐08 1.54E‐042020 Winter 5.42E‐08 3.79E‐08 4.35E‐07 1.31E‐09 3.31E‐07 1.90E‐08 3.49E‐07 8.11E‐08 8.10E‐09 8.92E‐082020 Summer 5.26E‐08 3.44E‐08 4.57E‐07 1.39E‐09 3.31E‐07 1.90E‐08 3.49E‐07 8.11E‐08 8.10E‐09 8.92E‐082020 Annual 1.33E‐04
2020 Max 5.42E‐08 3.79E‐08 4.57E‐07 1.39E‐09 3.31E‐07 1.90E‐08 3.49E‐07 8.11E‐08 8.10E‐09 8.92E‐08 1.33E‐042023 Winter 4.39E‐08 2.73E‐08 3.40E‐07 1.17E‐09 3.31E‐07 1.88E‐08 3.49E‐07 8.11E‐08 8.00E‐09 8.91E‐082023 Summer 4.25E‐08 2.48E‐08 3.59E‐07 1.23E‐09 3.31E‐07 1.88E‐08 3.49E‐07 8.11E‐08 8.00E‐09 8.91E‐082023 Annual 1.18E‐04
2023 Max 4.39E‐08 2.73E‐08 3.59E‐07 1.23E‐09 3.31E‐07 1.88E‐08 3.49E‐07 8.11E‐08 8.00E‐09 8.91E‐08 1.18E‐04Notes:a. RD = Road Dustb. Exh = Exhaust; BW = Break Wear; TW = Tire WearSource: EMFAC2014
Daily Annual CO2PM10 PM10 PM10 PM2_5 PM2_5 PM2_5
Scenario VMT ROG NOx CO SOx RD a Exh+BW+TW b Total RD a Exh+BW+TW b Total Scenario VMT (MT/yr)Existing 9,624 1.8 1.4 15.0 0.03 6.4 0.4 6.7 1.6 0.2 1.7 Existing 2,599,399 362Interim Year 27,015 2.9 2.0 24.7 0.07 17.9 1.0 18.9 4.4 0.4 4.8 Interim Year 7,296,747 878Full Buildout 47,734 4.2 2.6 34.3 0.12 31.6 1.8 33.4 7.7 0.8 8.5 Full Buildout 12,893,077 1,381
Notes: Source: CalEEMod (VMT); ESA PCR, 2016a. RD = Road Dustb. Exh = Exhaust; BW = Break Wear; TW = Tire WearSource: CalEEMod (VMT); ESA PCR, 2016
Emission Factors (tons/mi)
Emissions (lbs/day)

6