Embed Size (px)
Citation preview

Appendix E
Health Risk Assessment for On-Road Diesel Trucks

Health Risk Assessment for On-Road Diesel Trucks
Principal Author
Pingkuan Di, Ph.D, P.E. Technical Analysis Section
Emission Assessment Branch Stationary Source Division
Contributing Author
Nicole Dolney
Regulatory Support Section Mobile Source Analysis Branch
Planning and Technical Support Division

This page is intentionally blank.
E - i
Health Risk Assessment for On-Road Diesel Trucks
Table of Contents Section Page I. INTRODUCTION............................................................................................. D-1
II. STUDY OVERVIEW........................................................................................ D-2
A. Study Area................................................................................................ D-2 B. On-Road Diesel Truck Diesel PM Emission Inventory.......................... D-3 C. Air Dispersion Modeling Methodology .................................................. D-6 D. Exposure Assessment Methodology ................................................... D-12
III. SUMMARY OF RESULTS ............................................................................ D-13
A. Potential Cancer Risk ............................................................................ D-13 B. Non-Cancer Health Impacts .................................................................. D-18 C. Uncertainty and Limitations.................................................................. D-21
IV. HEALTH RISK ASSESSMENT FOR AGRICULTURAL TRUCKS............... D-23
References................................................................................................................... D-26
E - ii
List of Tables Page
Table 1 Activity Matrix Example.......................................................................... D-4
Table 2 Emission Factor Matrix Example for On-Road Diesel Trucks ................ D-5
Table 3 Impacted Area and Affected Population by Risk Levels ...................... D-15
Table 4 Estimated Non-cancer Health Impacts in the Study Area Resulting from On-road Diesel Truck Diesel PM Emissions in 2003 ......................D-19
Table 5 Modeling Assumptions and Inputs for Agricultural Truck Health Risk Assessment ......................................................................................... D-23
Table 6 Distances from the Facility Boundary wherein the Risk is 10 in a Million for Different Agricultural Truck Volumes .............................................. D-25
List of Figures Page
Figure 1 Aerial Map of the Southern California Study Area for On-Road Diesel Truck Health Risk Assessment .............................................................. D-3
Figure 2 Estimated Future Year On-Road Diesel Truck Emissions within the Study Area ............................................................................................. D-6
Figure 3 Modeling Domain for the On-Road Diesel Truck Health Risk AssessmentD-7
Figure 4 Modeling Grid Receptor Network........................................................... D-8
Figure 5 Variations of Diesel Truck Emissions Based on Time of Day ................ D-9
Figure 6 Wind Rose Plot for Lynwood Station in 2002-2005.............................. D-11
Figure 7 Wind Class Frequency Distribution for Lynwood Station in 2002-2005 D-11
Figure 8 Estimated Cancer Risk Isopleths from On-Road Diesel Trucks within the Study Area ..................................................................................... D-14
Figure 9 Projected Cancer Risk Isopleths from On-Road Diesel Trucks for 2015 with the Proposed Regulation within the Study Area ........................... D-16
Figure 10 Projected Impacted Area (acres) by Risk Levels from On-Road Diesel Trucks within the Study Area ............................................................... D-17
Figure 11 Projected Affected Population by Risk Levels from On-Road Diesel Trucks within the Study Area ............................................................... D-17
Figure 12 Projected Average Cancer Risks from On-Road Diesel Trucks within the Study Area ..................................................................................... D-18
Figure 13 Risk Isopleths of 10 in a Million for Agricultural Truck Volumes of 40 and 80 trucks per Day.......................................................................... D-24
E - 1
I. INTRODUCTION Diesel engines emit a complex mixture of air pollutants, composed of gaseous and solid material. In 1998, following a 10-year scientific assessment process, ARB identified whole diesel exhaust as a toxic air contaminant based on its potential to cause cancer and other health problems, including respiratory illnesses, and increased risk of heart disease. The visible emissions in diesel exhaust are known as particulate matter or PM, which includes carbon particles or "soot.” The amount of diesel PM in diesel exhaust is used to evaluate the potential health risk from whole diesel exhaust. Subsequent to this action, research has shown that diesel PM also contributes to premature deaths (ARB, 2002). Health risks from diesel PM are highest in areas of concentrated emissions, such as near freeways, ports, railyards, or warehouse distribution centers. Diesel PM is a significant component of particulate matter in many cities. Diesel PM is composed of carbonaceous particles (soot) and particles that can form from nitrogen oxides (NOX) and oxides of sulfur (SOx) emitted by diesel engines. The health impacts of particulate matter (PM10 and PM 2.5) have been studied in epidemiological studies conducted in many different cities. These studies have found an increase of one to two percent in daily mortality associated with each 10 µg/m3 increase in PM10 exposure. The most vulnerable subpopulations are those with preexisting respiratory or cardiovascular disease, especially the elderly. In addition, increased hospital admissions and illnesses from respiratory disease have been associated with particulate matter exposure in adults and children. Numerous epidemiological studies have also found an association between exposures to diesel PM and an increased risk of lung cancer. Health risk assessments are a useful tool for comparing the potential health impacts of various sources of air pollution. In a risk assessment, the amount of diesel PM emitted from each source (e.g., truck or ship) is estimated. An air dispersion modeling computer program uses these emission estimates and local meteorological data (e. g. wind speed and direction) to estimate the annual average ground level concentrations of diesel PM in the communities around the facility. The increased risk of developing lung cancer from exposure to the model-estimated diesel PM concentrations can be estimated using the Office of Environmental Health Hazard Assessment’s (OEHHA) cancer potency factor for diesel PM. Non-cancer health impacts of diesel PM exposure can also be quantified if the expected concentrations of a pollutant are high enough and there is a sufficiently large exposed population. Non-cancer impacts include premature death, hospital admissions, respiratory illnesses/asthma, and lost school/work days.
E - 2
Risk assessments have various uncertainties in the methodology and risk assessments are therefore deliberately designed so that risks are not under predicted. Risk assessments are best understood as a tool for comparing risks from various sources, usually for purposes of prioritizing risk reduction, rather than as a literal prediction of the incidence of disease in the exposed population. To help understand the emissions impacts and the potential public health risk from exposures to on-road diesel truck PM emissions, ARB staff conducted a health risk assessment for a region in Southern California. The study is designed to enhance our understanding of on-road diesel truck diesel PM emissions impacts in an urban area and to evaluate how those impacts will change with implementation of the proposed emission control measure for on-road diesel trucks. We believe the results from this analysis provide a quantitative assessment of the impacts from on-road diesel trucks in the study area and are generally applicable to other urban areas in California, providing a qualitative estimate for those areas. We also conducted a simplified risk assessment for trucks used in agricultural operations. For this assessment we did not evaluate an exact location. Rather we conducted an assessment of a hypothetical operation typical of agricultural truck operation. Below, in sections II and III, we provide a description of the health risk assessment study and the results from the analysis for the region in Southern California. In section IV, we provide a discussion on the health risk assessment for agricultural trucks. II. STUDY OVERVIEW In the following sections, we provide a description of the key elements of the health risk assessment:
� identification of the study area; � development of the diesel PM emissions inventory for on-road diesel
trucks operating in the study area; � air dispersion modeling methodology to predict ambient diesel PM
concentrations; and � methodology to estimate potential cancer and non-cancer health impacts.
A. Study Area
The study area selected for analysis was located in the South Coast Air Basin. A 10 mile by 10 mile region was selected with the center at the City of Commerce. This study area was selected due to the large number of freeways and major arterials in the area which historically have had high volumes of on-road diesel truck traffic. This area contains a broad mix of land uses including industrial, light industrial, commercial and residential. An aerial photo of the study area is shown in Figure 1. Several communities or parts of communities are included in the
E - 3
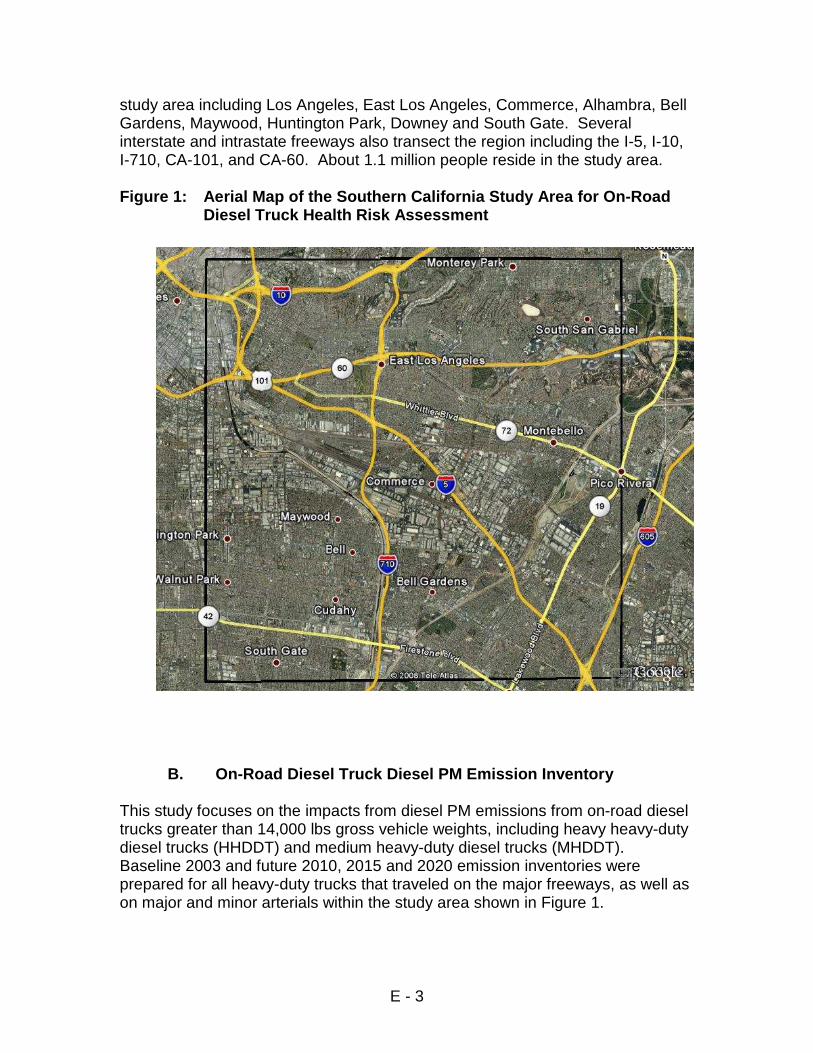
study area including Los Angeles, East Los Angeles, Commerce, Alhambra, Bell Gardens, Maywood, Huntington Park, Downey and South Gate. Several interstate and intrastate freeways also transect the region including the I-5, I-10, I-710, CA-101, and CA-60. About 1.1 million people reside in the study area. Figure 1: Aerial Map of the Southern California Study Area for On-Road
Diesel Truck Health Risk Assessment
B. On-Road Diesel Truck Diesel PM Emission Inventory
This study focuses on the impacts from diesel PM emissions from on-road diesel trucks greater than 14,000 lbs gross vehicle weights, including heavy heavy-duty diesel trucks (HHDDT) and medium heavy-duty diesel trucks (MHDDT). Baseline 2003 and future 2010, 2015 and 2020 emission inventories were prepared for all heavy-duty trucks that traveled on the major freeways, as well as on major and minor arterials within the study area shown in Figure 1.
E - 4
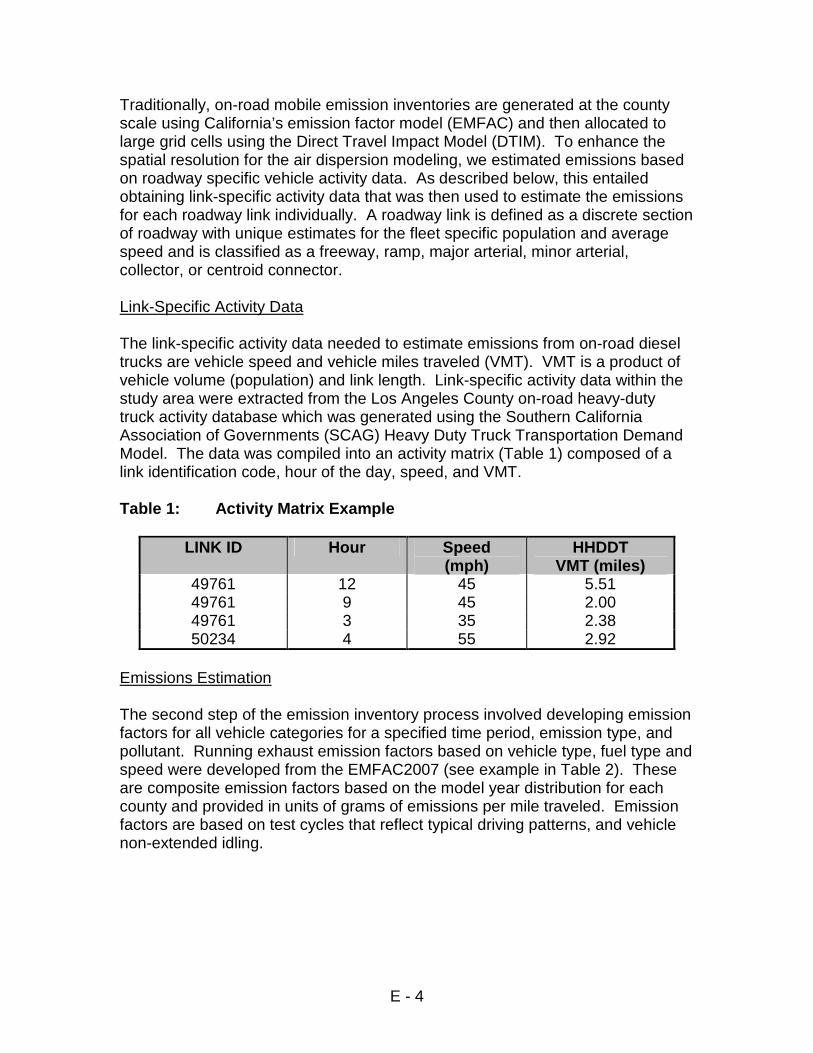
Traditionally, on-road mobile emission inventories are generated at the county scale using California’s emission factor model (EMFAC) and then allocated to large grid cells using the Direct Travel Impact Model (DTIM). To enhance the spatial resolution for the air dispersion modeling, we estimated emissions based on roadway specific vehicle activity data. As described below, this entailed obtaining link-specific activity data that was then used to estimate the emissions for each roadway link individually. A roadway link is defined as a discrete section of roadway with unique estimates for the fleet specific population and average speed and is classified as a freeway, ramp, major arterial, minor arterial, collector, or centroid connector. Link-Specific Activity Data The link-specific activity data needed to estimate emissions from on-road diesel trucks are vehicle speed and vehicle miles traveled (VMT). VMT is a product of vehicle volume (population) and link length. Link-specific activity data within the study area were extracted from the Los Angeles County on-road heavy-duty truck activity database which was generated using the Southern California Association of Governments (SCAG) Heavy Duty Truck Transportation Demand Model. The data was compiled into an activity matrix (Table 1) composed of a link identification code, hour of the day, speed, and VMT. Table 1: Activity Matrix Example
LINK ID Hour Speed (mph)
HHDDT VMT (miles)
49761 12 45 5.51 49761 9 45 2.00 49761 3 35 2.38 50234 4 55 2.92
Emissions Estimation The second step of the emission inventory process involved developing emission factors for all vehicle categories for a specified time period, emission type, and pollutant. Running exhaust emission factors based on vehicle type, fuel type and speed were developed from the EMFAC2007 (see example in Table 2). These are composite emission factors based on the model year distribution for each county and provided in units of grams of emissions per mile traveled. Emission factors are based on test cycles that reflect typical driving patterns, and vehicle non-extended idling.
E - 5
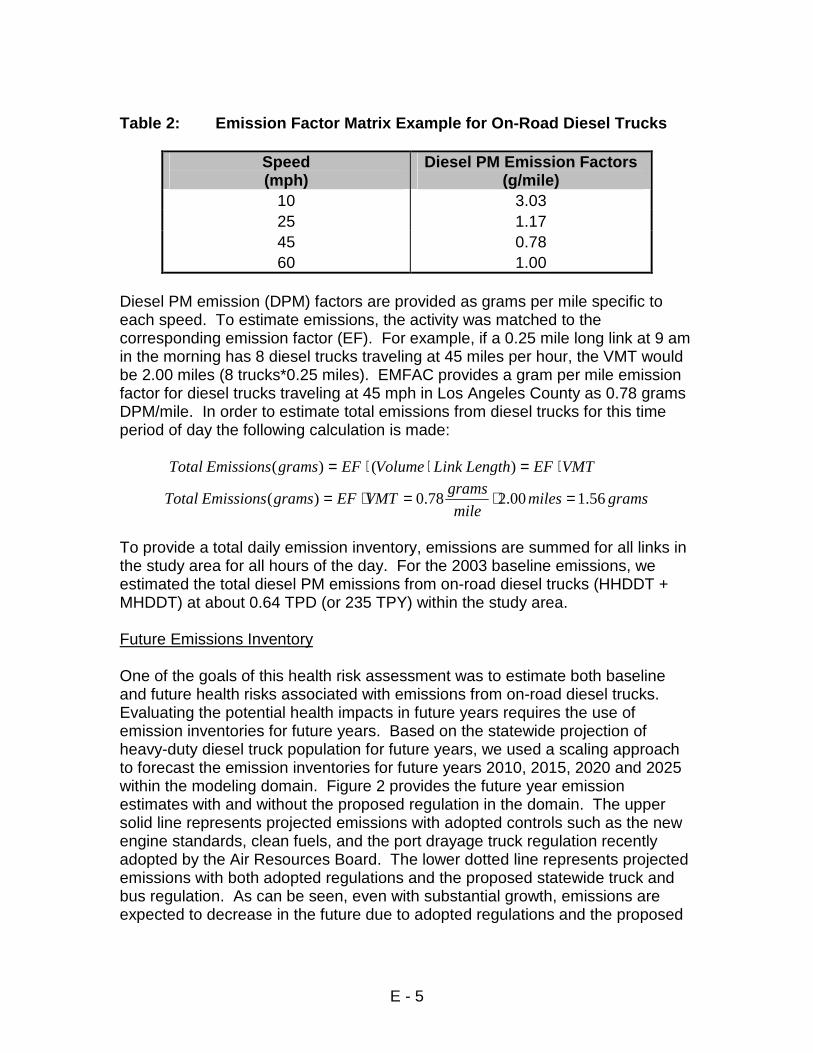
Table 2: Emission Factor Matrix Example for On-Road Diesel Trucks
Speed (mph)
Diesel PM Emission Factors (g/mile)
10 3.03 25 1.17 45 0.78 60 1.00
Diesel PM emission (DPM) factors are provided as grams per mile specific to each speed. To estimate emissions, the activity was matched to the corresponding emission factor (EF). For example, if a 0.25 mile long link at 9 am in the morning has 8 diesel trucks traveling at 45 miles per hour, the VMT would be 2.00 miles (8 trucks*0.25 miles). EMFAC provides a gram per mile emission factor for diesel trucks traveling at 45 mph in Los Angeles County as 0.78 grams DPM/mile. In order to estimate total emissions from diesel trucks for this time period of day the following calculation is made:
VMTEFLengthLinkVolumeEFgramsEmissionsTotal ⋅=⋅⋅= )()(
gramsmilesmile
gramsVMTEFgramsEmissionsTotal 56.100.278.0)( =⋅=⋅=
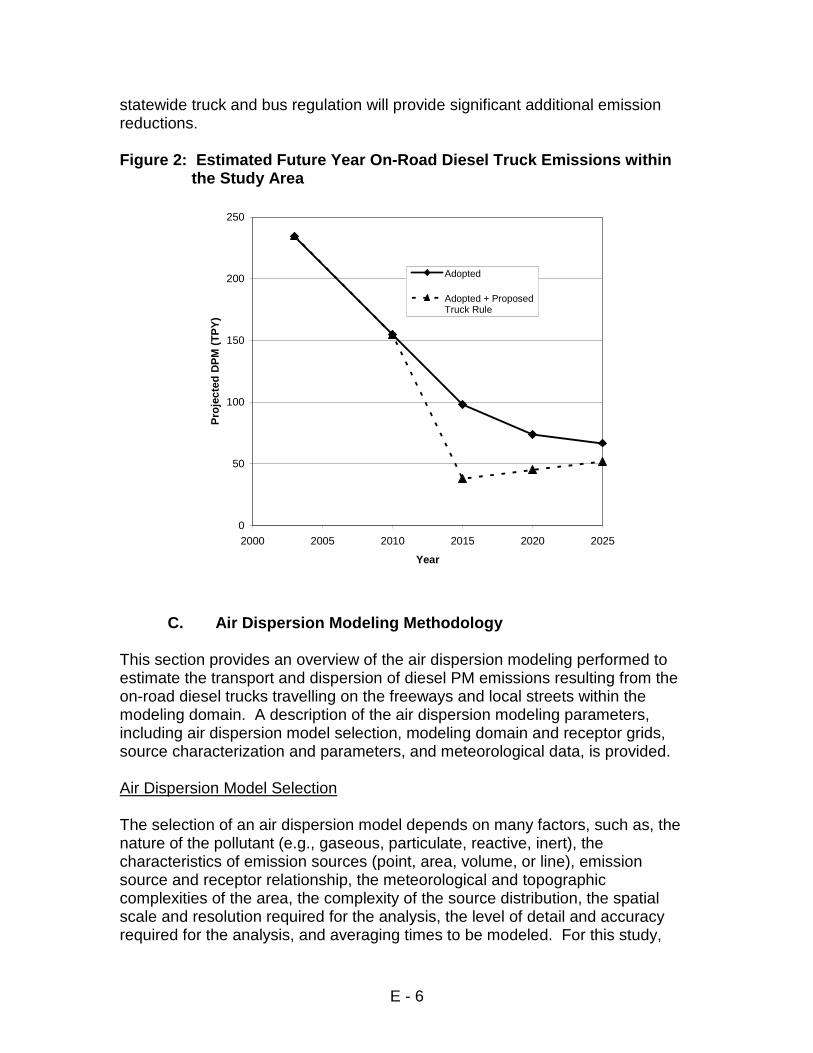
To provide a total daily emission inventory, emissions are summed for all links in the study area for all hours of the day. For the 2003 baseline emissions, we estimated the total diesel PM emissions from on-road diesel trucks (HHDDT + MHDDT) at about 0.64 TPD (or 235 TPY) within the study area. Future Emissions Inventory One of the goals of this health risk assessment was to estimate both baseline and future health risks associated with emissions from on-road diesel trucks. Evaluating the potential health impacts in future years requires the use of emission inventories for future years. Based on the statewide projection of heavy-duty diesel truck population for future years, we used a scaling approach to forecast the emission inventories for future years 2010, 2015, 2020 and 2025 within the modeling domain. Figure 2 provides the future year emission estimates with and without the proposed regulation in the domain. The upper solid line represents projected emissions with adopted controls such as the new engine standards, clean fuels, and the port drayage truck regulation recently adopted by the Air Resources Board. The lower dotted line represents projected emissions with both adopted regulations and the proposed statewide truck and bus regulation. As can be seen, even with substantial growth, emissions are expected to decrease in the future due to adopted regulations and the proposed
E - 6
statewide truck and bus regulation will provide significant additional emission reductions. Figure 2: Estimated Future Year On-Road Diesel Truck Emissions within
the Study Area
C. Air Dispersion Modeling Methodology This section provides an overview of the air dispersion modeling performed to estimate the transport and dispersion of diesel PM emissions resulting from the on-road diesel trucks travelling on the freeways and local streets within the modeling domain. A description of the air dispersion modeling parameters, including air dispersion model selection, modeling domain and receptor grids, source characterization and parameters, and meteorological data, is provided. Air Dispersion Model Selection The selection of an air dispersion model depends on many factors, such as, the nature of the pollutant (e.g., gaseous, particulate, reactive, inert), the characteristics of emission sources (point, area, volume, or line), emission source and receptor relationship, the meteorological and topographic complexities of the area, the complexity of the source distribution, the spatial scale and resolution required for the analysis, the level of detail and accuracy required for the analysis, and averaging times to be modeled. For this study,
0
50
100
150
200
250
2000 2005 2010 2015 2020 2025
Year
Pro
ject
ed D
PM
(T
PY
)
Adopted
Adopted + ProposedTruck Rule
E - 7
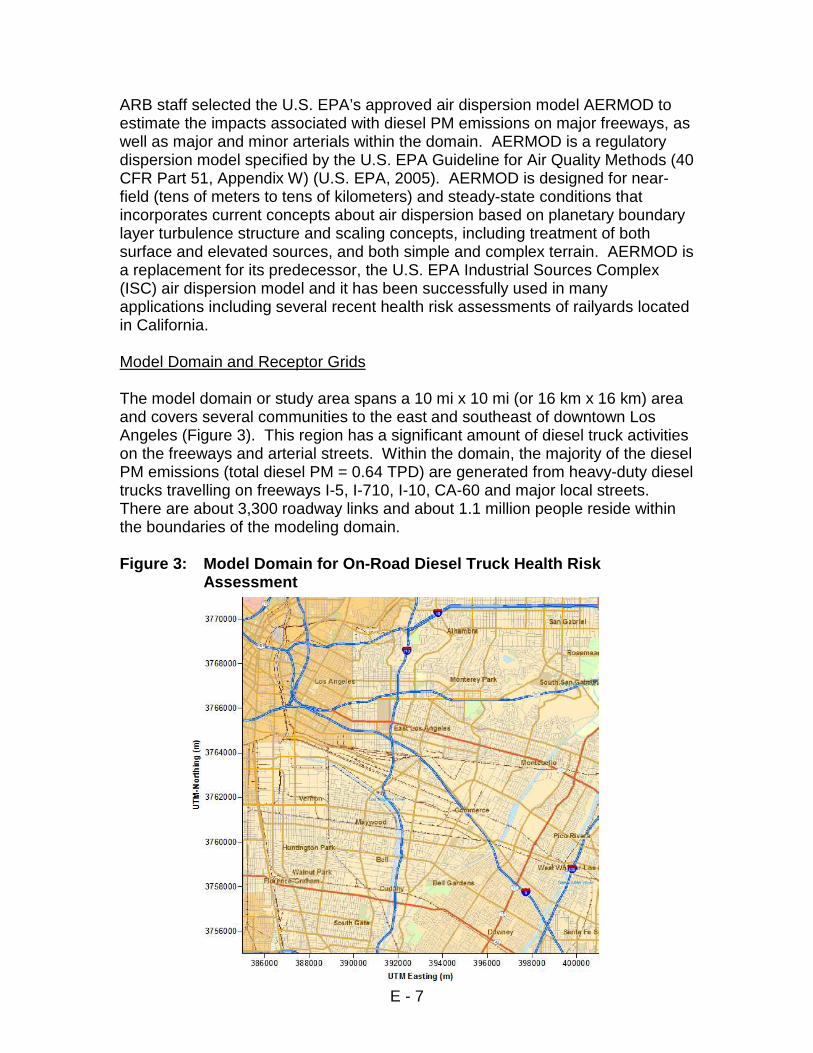
ARB staff selected the U.S. EPA’s approved air dispersion model AERMOD to estimate the impacts associated with diesel PM emissions on major freeways, as well as major and minor arterials within the domain. AERMOD is a regulatory dispersion model specified by the U.S. EPA Guideline for Air Quality Methods (40 CFR Part 51, Appendix W) (U.S. EPA, 2005). AERMOD is designed for near-field (tens of meters to tens of kilometers) and steady-state conditions that incorporates current concepts about air dispersion based on planetary boundary layer turbulence structure and scaling concepts, including treatment of both surface and elevated sources, and both simple and complex terrain. AERMOD is a replacement for its predecessor, the U.S. EPA Industrial Sources Complex (ISC) air dispersion model and it has been successfully used in many applications including several recent health risk assessments of railyards located in California. Model Domain and Receptor Grids The model domain or study area spans a 10 mi x 10 mi (or 16 km x 16 km) area and covers several communities to the east and southeast of downtown Los Angeles (Figure 3). This region has a significant amount of diesel truck activities on the freeways and arterial streets. Within the domain, the majority of the diesel PM emissions (total diesel PM = 0.64 TPD) are generated from heavy-duty diesel trucks travelling on freeways I-5, I-710, I-10, CA-60 and major local streets. There are about 3,300 roadway links and about 1.1 million people reside within the boundaries of the modeling domain. Figure 3: Model Domain for On-Road Diesel Truck Health Risk
Assessment
E - 8
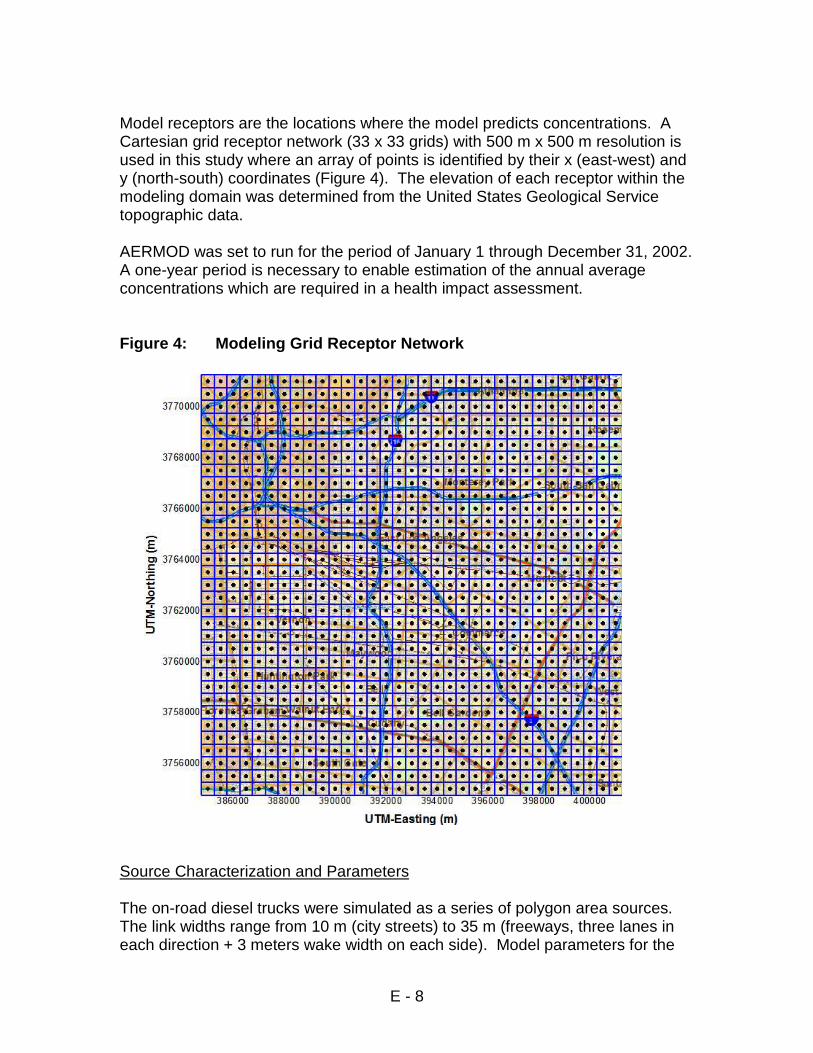
Model receptors are the locations where the model predicts concentrations. A Cartesian grid receptor network (33 x 33 grids) with 500 m x 500 m resolution is used in this study where an array of points is identified by their x (east-west) and y (north-south) coordinates (Figure 4). The elevation of each receptor within the modeling domain was determined from the United States Geological Service topographic data. AERMOD was set to run for the period of January 1 through December 31, 2002. A one-year period is necessary to enable estimation of the annual average concentrations which are required in a health impact assessment. Figure 4: Modeling Grid Receptor Network
Source Characterization and Parameters The on-road diesel trucks were simulated as a series of polygon area sources. The link widths range from 10 m (city streets) to 35 m (freeways, three lanes in each direction + 3 meters wake width on each side). Model parameters for the
E - 9
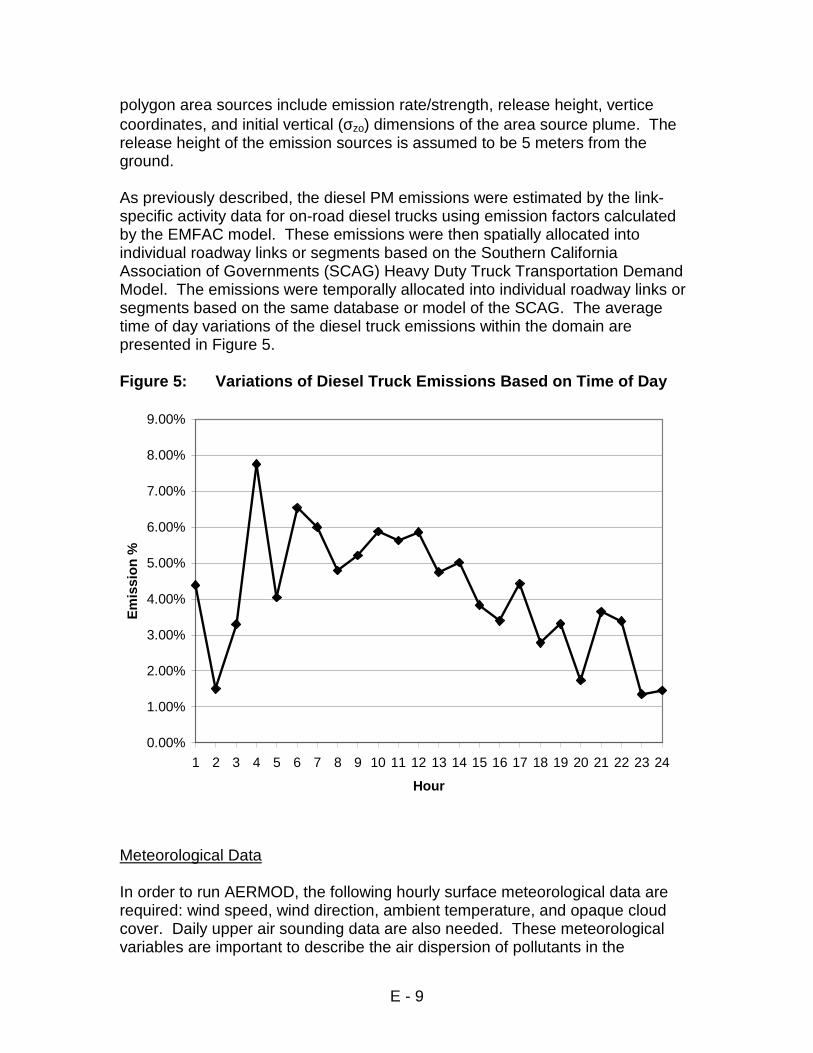
polygon area sources include emission rate/strength, release height, vertice coordinates, and initial vertical (σzo) dimensions of the area source plume. The release height of the emission sources is assumed to be 5 meters from the ground. As previously described, the diesel PM emissions were estimated by the link-specific activity data for on-road diesel trucks using emission factors calculated by the EMFAC model. These emissions were then spatially allocated into individual roadway links or segments based on the Southern California Association of Governments (SCAG) Heavy Duty Truck Transportation Demand Model. The emissions were temporally allocated into individual roadway links or segments based on the same database or model of the SCAG. The average time of day variations of the diesel truck emissions within the domain are presented in Figure 5. Figure 5: Variations of Diesel Truck Emissions Based on Time of Day
Meteorological Data In order to run AERMOD, the following hourly surface meteorological data are required: wind speed, wind direction, ambient temperature, and opaque cloud cover. Daily upper air sounding data are also needed. These meteorological variables are important to describe the air dispersion of pollutants in the
0.00%
1.00%
2.00%
3.00%
4.00%
5.00%
6.00%
7.00%
8.00%
9.00%
1 2 3 4 5 6 7 8 9 10 11 12 13 14 15 16 17 18 19 20 21 22 23 24
Hour
Em
issi
on
%
E - 10
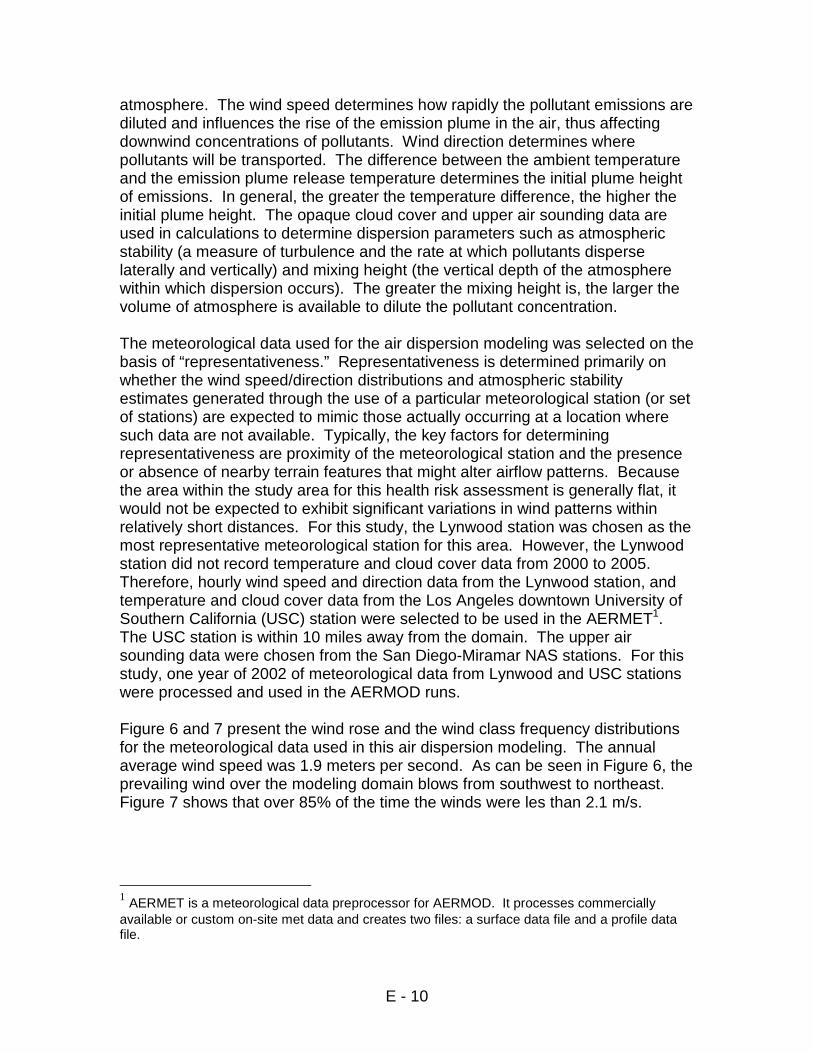
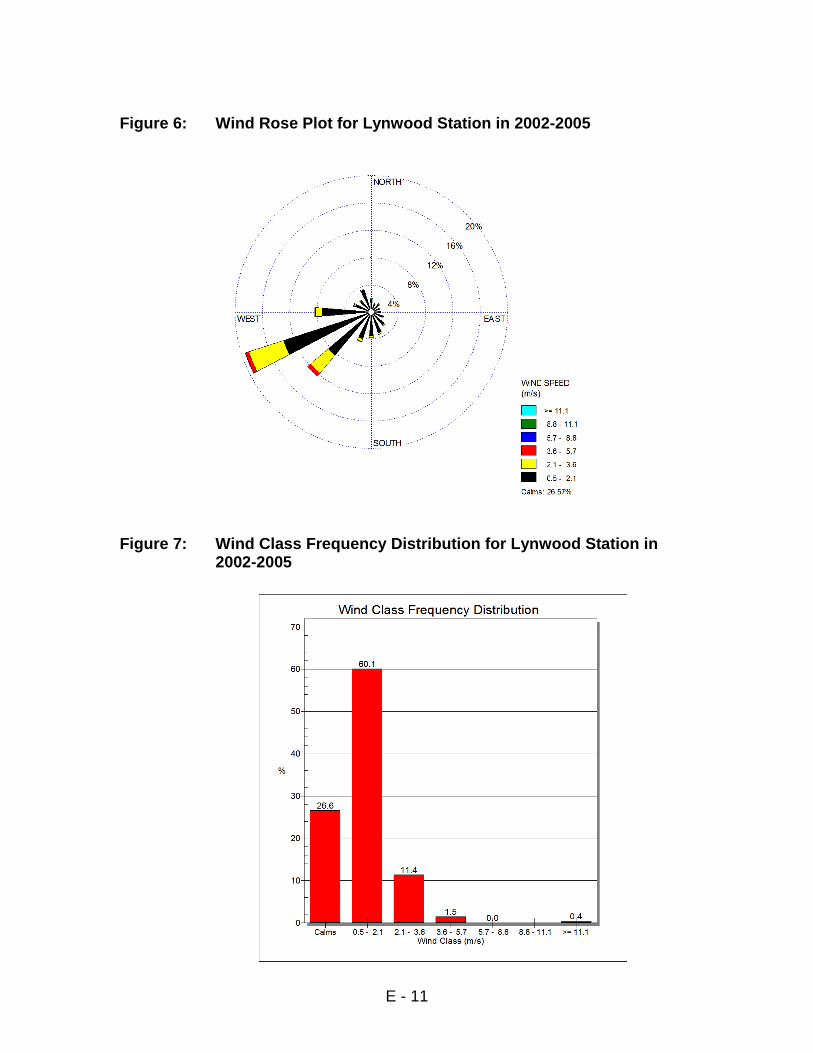
atmosphere. The wind speed determines how rapidly the pollutant emissions are diluted and influences the rise of the emission plume in the air, thus affecting downwind concentrations of pollutants. Wind direction determines where pollutants will be transported. The difference between the ambient temperature and the emission plume release temperature determines the initial plume height of emissions. In general, the greater the temperature difference, the higher the initial plume height. The opaque cloud cover and upper air sounding data are used in calculations to determine dispersion parameters such as atmospheric stability (a measure of turbulence and the rate at which pollutants disperse laterally and vertically) and mixing height (the vertical depth of the atmosphere within which dispersion occurs). The greater the mixing height is, the larger the volume of atmosphere is available to dilute the pollutant concentration. The meteorological data used for the air dispersion modeling was selected on the basis of “representativeness.” Representativeness is determined primarily on whether the wind speed/direction distributions and atmospheric stability estimates generated through the use of a particular meteorological station (or set of stations) are expected to mimic those actually occurring at a location where such data are not available. Typically, the key factors for determining representativeness are proximity of the meteorological station and the presence or absence of nearby terrain features that might alter airflow patterns. Because the area within the study area for this health risk assessment is generally flat, it would not be expected to exhibit significant variations in wind patterns within relatively short distances. For this study, the Lynwood station was chosen as the most representative meteorological station for this area. However, the Lynwood station did not record temperature and cloud cover data from 2000 to 2005. Therefore, hourly wind speed and direction data from the Lynwood station, and temperature and cloud cover data from the Los Angeles downtown University of Southern California (USC) station were selected to be used in the AERMET1. The USC station is within 10 miles away from the domain. The upper air sounding data were chosen from the San Diego-Miramar NAS stations. For this study, one year of 2002 of meteorological data from Lynwood and USC stations were processed and used in the AERMOD runs. Figure 6 and 7 present the wind rose and the wind class frequency distributions for the meteorological data used in this air dispersion modeling. The annual average wind speed was 1.9 meters per second. As can be seen in Figure 6, the prevailing wind over the modeling domain blows from southwest to northeast. Figure 7 shows that over 85% of the time the winds were les than 2.1 m/s.
1 AERMET is a meteorological data preprocessor for AERMOD. It processes commercially available or custom on-site met data and creates two files: a surface data file and a profile data file.
E - 11
Figure 6: Wind Rose Plot for Lynwood Station in 2002-2005
Figure 7: Wind Class Frequency Distribution for Lynwood Station in
2002-2005
E - 12
D. Exposure Assessment Methodology For this study, we estimated both the cancer and non-cancer health impacts from the exposures to diesel PM emissions from on-road diesel trucks in the study area. Below we provide brief descriptions of the risk assessment methodologies used. Potential Cancer Risks The potential cancer risks were estimated using standard risk assessment procedures based on the annual average concentration of diesel PM predicted by the model and a health risk factor (referred to as a cancer potency factor) that correlates cancer risk to the amount of diesel PM in the air. The methodology used to estimate the potential cancer risks is consistent with the Tier-1 analysis presented in OEHHA’s Air Toxics Hot Spots Program Guidance Manual for Preparation of Health Risk Assessments (OEHHA, 2003). A Tier-1 analysis assumes that an individual is exposed to an annual average concentration of a pollutant continuously for 70 years.2 The cancer potency factor was developed by the OEHHA and approved by the State’s Scientific Review Panel on Toxic Air Contaminants (SRP) as part of the process of identifying diesel PM emissions as a toxic air contaminant (TAC). The potential cancer risk is expressed as chances per a million people. The estimated diesel PM concentrations and cancer risk levels produced by a risk assessment are based on a number of assumptions. Many of the assumptions are designed to be health protective so that potential risks to individuals are not underestimated. Therefore, the actual cancer risk calculated is intentionally designed to avoid under-prediction. There are also many uncertainties in the health values used in the risk assessment. Some of the factors that affect the uncertainty are discussed later in Section III. Non-Cancer Health Impacts A substantial number of epidemiologic studies have found a strong association between exposure to ambient particulate matter (PM) and adverse health effects (CARB, 2002). As part of this study, ARB staff conducted an analysis of the potential non-cancer health impacts over the study domain associated with exposures to the model-predicted ambient levels of directly emitted diesel PM (primary diesel PM) from on-road diesel trucks operating within the study area. The non-cancer health effects evaluated include premature death, hospital admissions, asthma-related and other lower respiratory symptoms, work loss
2According to the OEHHA Guidelines, the relatively health-protective assumptions incorporated into the Tier-1 risk assessment make it unlikely that the risks are underestimated for the general population.
E - 13
days, and minor restricted activity days. The non-cancer health risks are expressed as the number of cases per year. ARB staff assessed the potential non-cancer health impacts associated with exposures to the model-predicted ambient levels of directly emitted diesel PM (primary diesel PM) over the entire modeling domain. The population in the domain was determined from U.S. Census Bureau year 2000 census data and then was projected to the year of 2003. Using the methodology peer-reviewed and published in the Staff Report: Public Hearing to Consider Amendments to the Ambient Air Quality Standards for Particulate Matter and Sulfates, (PM Staff Report) (CARB, 2002), we calculated the number of annual cases of premature death and other health effects associated with exposure to the PM concentration modeled over the entire study area. III. SUMMARY OF RESULTS
A. Potential Cancer Risk
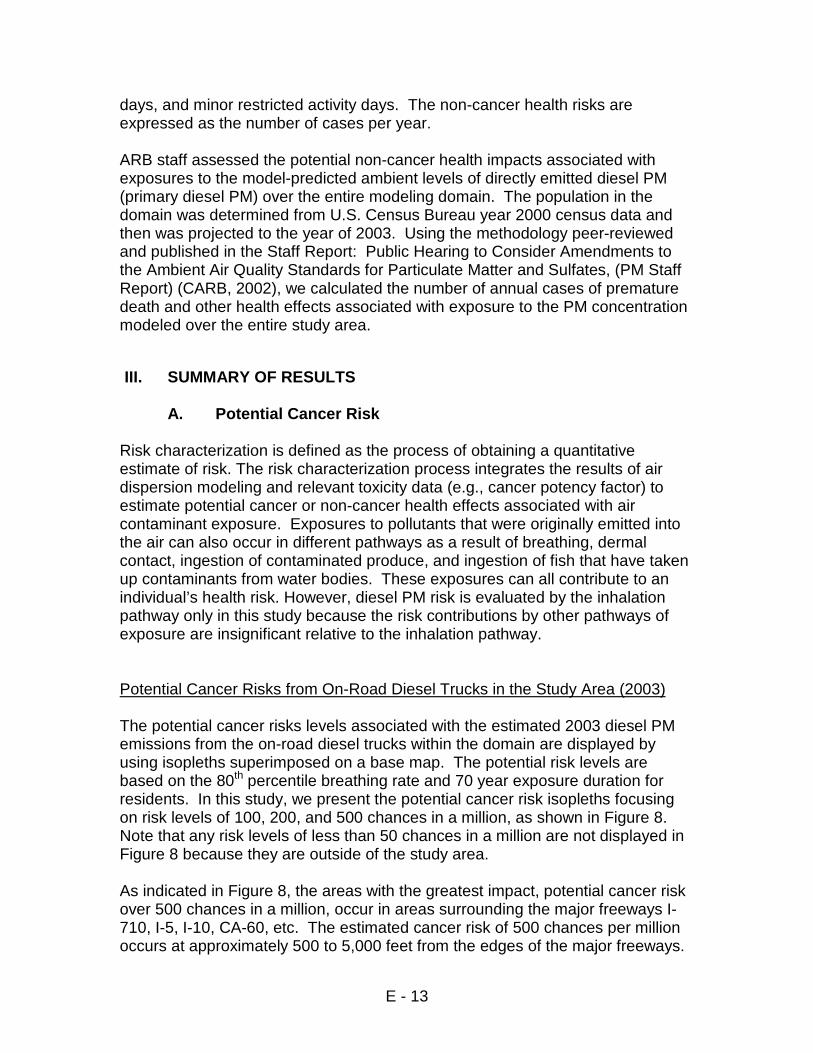
Risk characterization is defined as the process of obtaining a quantitative estimate of risk. The risk characterization process integrates the results of air dispersion modeling and relevant toxicity data (e.g., cancer potency factor) to estimate potential cancer or non-cancer health effects associated with air contaminant exposure. Exposures to pollutants that were originally emitted into the air can also occur in different pathways as a result of breathing, dermal contact, ingestion of contaminated produce, and ingestion of fish that have taken up contaminants from water bodies. These exposures can all contribute to an individual’s health risk. However, diesel PM risk is evaluated by the inhalation pathway only in this study because the risk contributions by other pathways of exposure are insignificant relative to the inhalation pathway. Potential Cancer Risks from On-Road Diesel Trucks in the Study Area (2003) The potential cancer risks levels associated with the estimated 2003 diesel PM emissions from the on-road diesel trucks within the domain are displayed by using isopleths superimposed on a base map. The potential risk levels are based on the 80th percentile breathing rate and 70 year exposure duration for residents. In this study, we present the potential cancer risk isopleths focusing on risk levels of 100, 200, and 500 chances in a million, as shown in Figure 8. Note that any risk levels of less than 50 chances in a million are not displayed in Figure 8 because they are outside of the study area. As indicated in Figure 8, the areas with the greatest impact, potential cancer risk over 500 chances in a million, occur in areas surrounding the major freeways I-710, I-5, I-10, CA-60, etc. The estimated cancer risk of 500 chances per million occurs at approximately 500 to 5,000 feet from the edges of the major freeways.
E - 14
Figure 8: Estimated Cancer Risk Isopleths from On-Road Diesel Trucks within the Study Area
(2003 On-Road Diesel Truck Diesel PM Emissions)
At about a quarter to several miles from the edges of the major freeways, the estimated cancer risks drop to about 200 chances in a million. The overall average potential cancer risk within the study area is about 375 chances in a million. Table 3 presents the exposed population and area of the various impacted zones of cancer risks associated with the on-road truck diesel PM emissions. Using the U.S. Census Bureau’s year 2000 census data, we estimated the population within the isopleth boundaries. The affected population numbers for the risk ranges of 100-200, 200-500, and over 500 chances in a million have been estimated to be about 260,000, 521,000, and 175,000. About 90 percent of 1.1 million people living in the study area are exposed to predicted risks of equal to or greater than 100 chances in a million.
E - 15
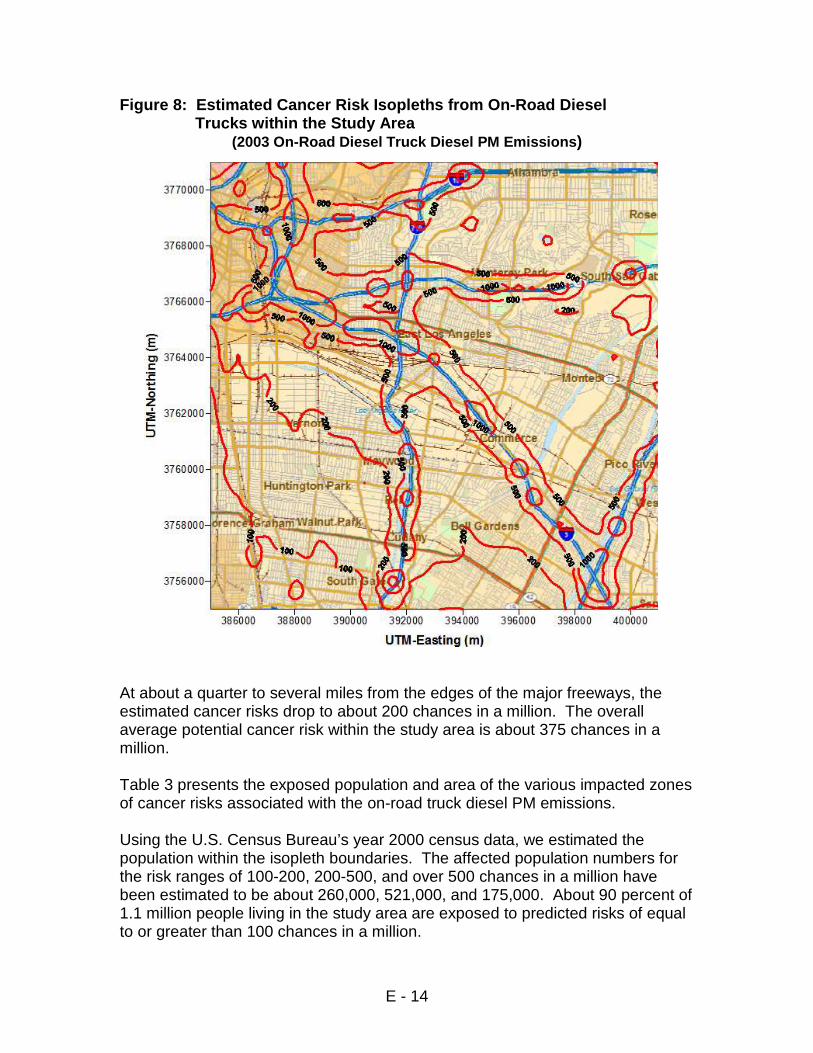
From the point view of impacted area, the area with predicted cancer risk levels in excess of 100 chances in a million is estimated to be about 63,000 acres, which is 93 percent of the total area within the study area. The area in which the risks are predicted to exceed 200 in a million is also very large, covering an area of about 51,000 acres (75 percent of the total area within the study area). The areas with an estimated potential cancer risk of over 500 chances in a million covers about 17 percent of the total area within the study area. The risk isopleths of 1,000 in a million occur in a narrow area along the major freeways, predominately at major freeway intersections. It should be noted that these risk levels represent the predicted risks only due to the on-road diesel trucks. Any potential cancer risk levels associated with all other sources are not included. For the South Coast Air Basin, the estimated regional potential risk level was estimated to be about 900-1,000 chances in a million from all diesel PM emissions in 2000 (SCAQMD MATES-II, 2000). Table 3: Impacted Area and Affected Population by Risk Levels
(2003 On-Road Diesel Truck Diesel PM Emissions)
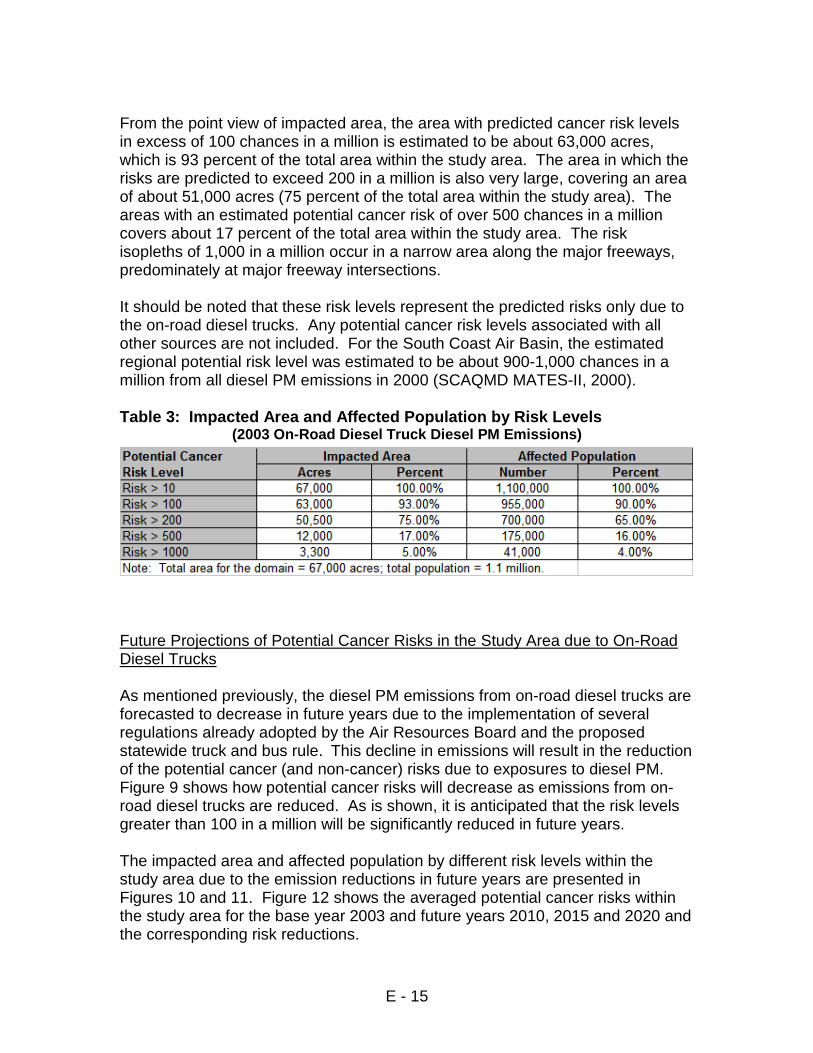
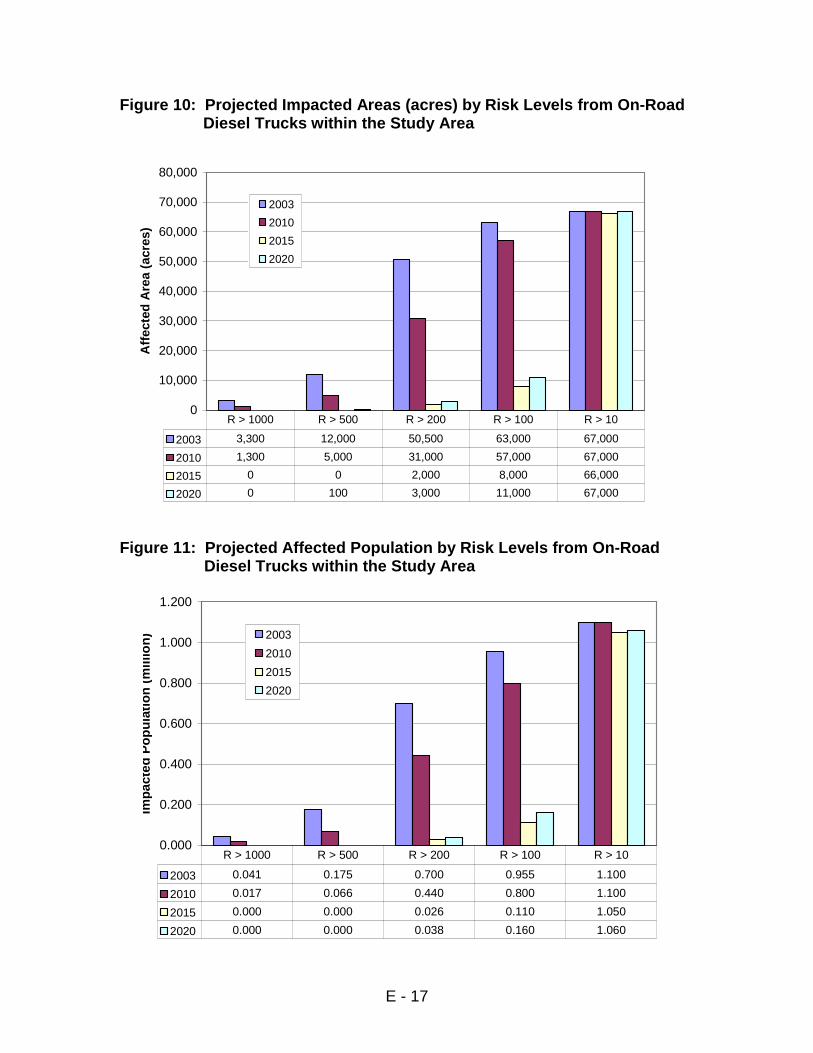
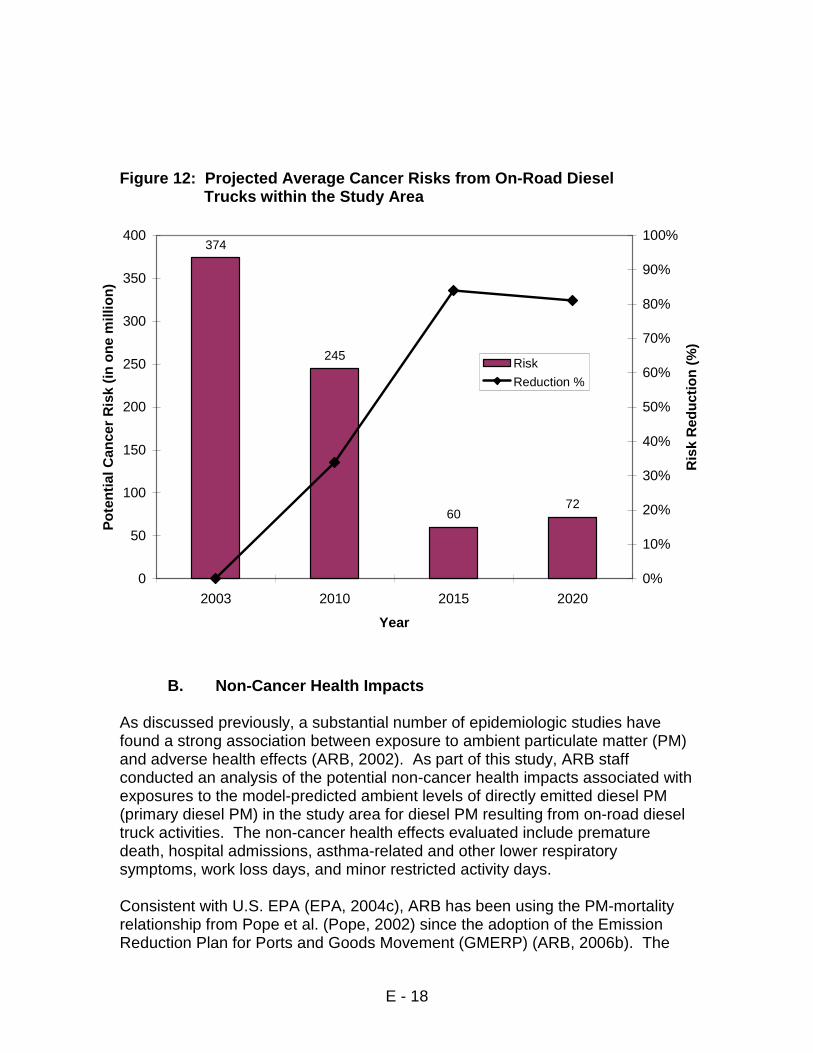
Future Projections of Potential Cancer Risks in the Study Area due to On-Road Diesel Trucks As mentioned previously, the diesel PM emissions from on-road diesel trucks are forecasted to decrease in future years due to the implementation of several regulations already adopted by the Air Resources Board and the proposed statewide truck and bus rule. This decline in emissions will result in the reduction of the potential cancer (and non-cancer) risks due to exposures to diesel PM. Figure 9 shows how potential cancer risks will decrease as emissions from on-road diesel trucks are reduced. As is shown, it is anticipated that the risk levels greater than 100 in a million will be significantly reduced in future years. The impacted area and affected population by different risk levels within the study area due to the emission reductions in future years are presented in Figures 10 and 11. Figure 12 shows the averaged potential cancer risks within the study area for the base year 2003 and future years 2010, 2015 and 2020 and the corresponding risk reductions.
E - 16
Figure 9: Projected Cancer Risk Isopleths from On-Road Diesel Trucks in 2015 with the Proposed Regulation within the Study Area
As shown in Figure 12, the predicted potential cancer risks will be reduced by about 82 percent in 2015 but then will begin to increase as growth surpasses the reductions required by regulatory programs. The predicted remaining cancer risk in the 2020 timeframe will be about 75 chances in a million within the study area. In future years after 2020, the averaged potential cancer risk will be greater than 75 chances in a million due to the growth.
E - 17
Figure 10: Projected Impacted Areas (acres) by Risk Levels from On-Road Diesel Trucks within the Study Area
Figure 11: Projected Affected Population by Risk Levels from On-Road Diesel Trucks within the Study Area
0.000
0.200
0.400
0.600
0.800
1.000
1.200
Imp
acte
d P
op
ula
tio
n (
mill
ion
) 2003
2010
2015
2020
2003 0.041 0.175 0.700 0.955 1.100
2010 0.017 0.066 0.440 0.800 1.100
2015 0.000 0.000 0.026 0.110 1.050
2020 0.000 0.000 0.038 0.160 1.060
R > 1000 R > 500 R > 200 R > 100 R > 10
0
10,000
20,000
30,000
40,000
50,000
60,000
70,000
80,000
Aff
ecte
d A
rea
(acr
es)
2003
2010
2015
2020
2003 3,300 12,000 50,500 63,000 67,000
2010 1,300 5,000 31,000 57,000 67,000
2015 0 0 2,000 8,000 66,000
2020 0 100 3,000 11,000 67,000
R > 1000 R > 500 R > 200 R > 100 R > 10
E - 18
Figure 12: Projected Average Cancer Risks from On-Road Diesel Trucks within the Study Area
B. Non-Cancer Health Impacts As discussed previously, a substantial number of epidemiologic studies have found a strong association between exposure to ambient particulate matter (PM) and adverse health effects (ARB, 2002). As part of this study, ARB staff conducted an analysis of the potential non-cancer health impacts associated with exposures to the model-predicted ambient levels of directly emitted diesel PM (primary diesel PM) in the study area for diesel PM resulting from on-road diesel truck activities. The non-cancer health effects evaluated include premature death, hospital admissions, asthma-related and other lower respiratory symptoms, work loss days, and minor restricted activity days. Consistent with U.S. EPA (EPA, 2004c), ARB has been using the PM-mortality relationship from Pope et al. (Pope, 2002) since the adoption of the Emission Reduction Plan for Ports and Goods Movement (GMERP) (ARB, 2006b). The
374
245
6072
0
50
100
150
200
250
300
350
400
2003 2010 2015 2020
Year
Po
ten
tial
Can
cer
Ris
k (i
n o
ne
mill
ion
)
0%
10%
20%
30%
40%
50%
60%
70%
80%
90%
100%
Ris
k R
edu
ctio
n (
%)
Risk
Reduction %
E - 19
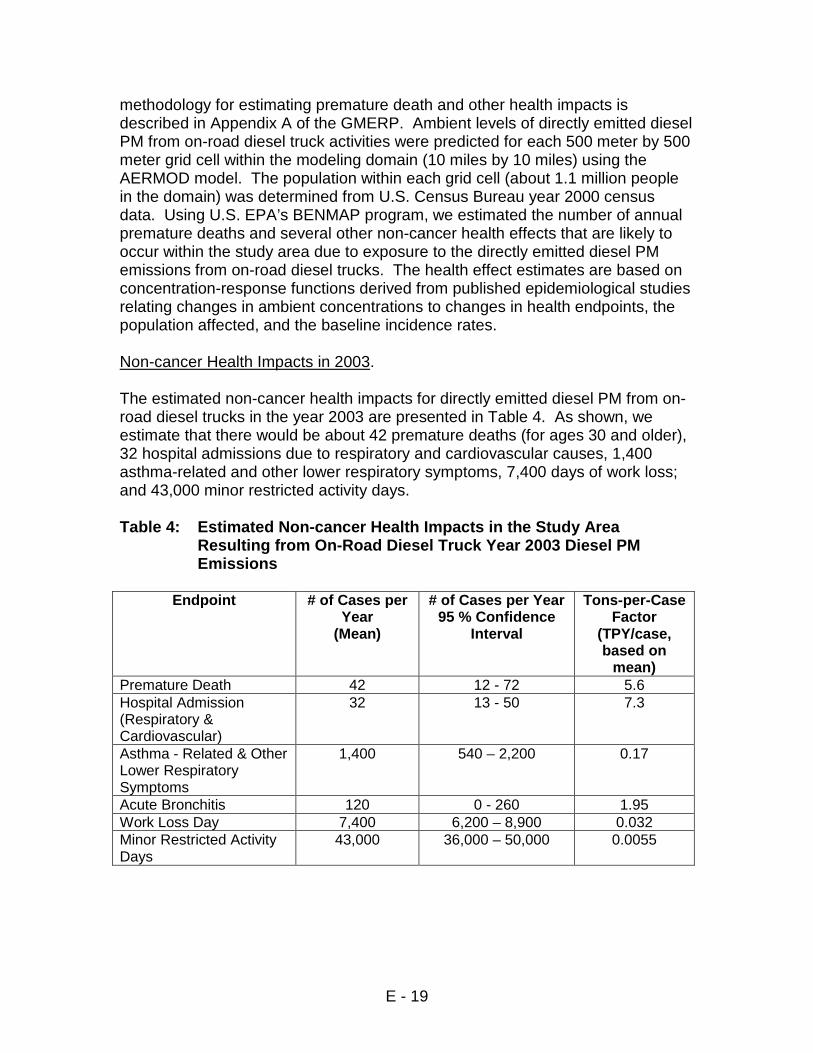
methodology for estimating premature death and other health impacts is described in Appendix A of the GMERP. Ambient levels of directly emitted diesel PM from on-road diesel truck activities were predicted for each 500 meter by 500 meter grid cell within the modeling domain (10 miles by 10 miles) using the AERMOD model. The population within each grid cell (about 1.1 million people in the domain) was determined from U.S. Census Bureau year 2000 census data. Using U.S. EPA’s BENMAP program, we estimated the number of annual premature deaths and several other non-cancer health effects that are likely to occur within the study area due to exposure to the directly emitted diesel PM emissions from on-road diesel trucks. The health effect estimates are based on concentration-response functions derived from published epidemiological studies relating changes in ambient concentrations to changes in health endpoints, the population affected, and the baseline incidence rates. Non-cancer Health Impacts in 2003. The estimated non-cancer health impacts for directly emitted diesel PM from on-road diesel trucks in the year 2003 are presented in Table 4. As shown, we estimate that there would be about 42 premature deaths (for ages 30 and older), 32 hospital admissions due to respiratory and cardiovascular causes, 1,400 asthma-related and other lower respiratory symptoms, 7,400 days of work loss; and 43,000 minor restricted activity days. Table 4: Estimated Non-cancer Health Impacts in the Study Area
Resulting from On-Road Diesel Truck Year 2003 Diesel PM Emissions
Endpoint # of Cases per
Year (Mean)
# of Cases per Year 95 % Confidence
Interval
Tons-per-Case Factor
(TPY/case, based on
mean) Premature Death 42 12 - 72 5.6 Hospital Admission (Respiratory & Cardiovascular)
32 13 - 50 7.3
Asthma - Related & Other Lower Respiratory Symptoms
1,400 540 – 2,200 0.17
Acute Bronchitis 120 0 - 260 1.95 Work Loss Day 7,400 6,200 – 8,900 0.032 Minor Restricted Activity Days
43,000 36,000 – 50,000 0.0055
E - 20
Non-cancer Health Impacts in Future Years ARB staff also conducted a quantitative analysis of six potential non-cancer health impacts associated with the change in exposures to the model-predicted ambient levels of directly emitted diesel PM. Below are the estimated non-cancer health impacts from direct diesel PM avoided due to the proposed regulation from year 2010 through 2020 within the study area. These benefits are due only to the reduction in emissions expected from implementation of the proposed statewide truck and bus regulation within the study area. Statewide, much greater benefits are expected to be realized.
• 78 premature deaths ( 20 to 130, 95% CI) • 60 hospital admissions –respiratory and cardiovascular (24 to 90, 95% CI) • 2,600 asthma attacks (1,000 to 4,000, 95% CI) • 220 acute bronchitis ( 0 to 48, 95% CI) • 14,700 work loss days (11,500 to 16,500, 95% CI) • 80,000 minor restricted activity days (70,000 to 93,000, 95% CI)
In May 2008 ARB released a draft methodology for estimating premature deaths associated with long-term exposures to fine airborne particulate matter in California that proposes increasing the relative risk factor from 6% to 10% increase in premature death per 10 µg/m3 increase in PM2.5 exposure (ARB, 2008). The premature deaths listed here were calculated using the 6% value. If the 10% value were used the estimates of premature deaths would increase by about 70%. Several assumptions were used in our estimation. They involve the selection and applicability of the concentration-response functions to California data, exposure estimation, subpopulation estimation, baseline incidence rates, and the threshold. These are briefly described below.
• Premature death calculations were based on the concentration-response function of Pope et al. (Pope, 2002). The ARB staff assumed that concentration-response function for premature mortality in the model domain is comparable to that in the Pope’s study. It is known that the composition of PM can vary by region, and not all constituents of PM have the same health effects. However, numerous studies have shown that the mortality effects of PM in California are comparable to those found in other locations in the United States, justifying our use of Pope et al’s results. Also, the U.S. EPA has been using Pope’s study for its regulatory impact analyses since 2000. For other health endpoints, the selection of the concentration-response functions was based on the most recent and relevant scientific literature. Details are in CARB’s PM Staff Report (CARB, 2002).
E - 21
• The ARB staff assumed the model-predicted exposure estimates could be applied to the entire population within each modeling grid. That is, the entire population within each modeling grid of 500 m x 500 m was assumed to be exposed uniformly to modeled concentration. This assumption is typical of this type of estimation.
• The ARB staff included only directly emitted PM and did not account for
secondary PM formed from NOx and SOx emissions.
• The ARB staff assumed the baseline incidence rates were uniform across each modeling grid and in many cases across each county. This assumption is consistent with methods used by the U.S. EPA for its regulatory impact assessment. The incidence rates match those used by U.S. EPA.
It should be noted again that the estimates in this study apply only to the limited study area (10 miles by 10 miles). The tons-per-case factors (TPY DPM per case) provided in Table 4 could be used to provide an estimate of the non-cancer health impacts for Los Angeles County, or the South Coast Air Basin. It is also possible to use this factor to estimate the non-cancer health impacts for other areas of the State; however, there may be greater uncertainty in the estimates.
C. Uncertainty and Limitations Health risk assessment is a complex procedure which requires the integration of many variables and assumptions. The estimated diesel PM concentrations and risk levels produced by a risk assessment are based on several assumptions, many of which are designed to be health protective so that potential risks to individual are not underestimated. As described previously, the health risk assessment consists of three components: (1) emission inventory, (2) air dispersion modeling, and (3) risk assessment. Each component has a certain degree of uncertainty associated with its estimation and prediction due to the assumptions made. Therefore, there are uncertainties and limitations with the results. Emission Inventory. We have made several assumptions in developing the emission inventory. While these assumptions are appropriate at the county level, they may be less appropriate for the particular areas modeled in this assessment. For example, the county specific default model year distribution within EMFAC was assumed to be applicable for all links within the domain modeled. In addition, the emission inventory developed for this study only included diesel PM emissions from running exhaust as it is the primary diesel source from on-road diesel trucks. Emissions from other modes such as idling and starts, were not included.
E - 22
Air Dispersion Modeling. There is no direct measurement technique for diesel PM. This analysis used air dispersion modeling to estimate the concentrations of diesel PM to which the public is exposed. While air dispersion models are based on the state-of-the-art formulations, there are uncertainties associated with the models. The AERMOD model used in this study is the U.S. EPA’s newly preferred air dispersion model. Evaluating the model is beyond the scope of this study. The model inputs may have some uncertainties. Among all modeling inputs, emission inventory or rate and meteorological conditions have the greatest affect on modeling results. The uncertainties of the emission inputs have been discussed above. Meteorological conditions can play a key role in predicted pollutant concentrations. For this modeling study, we used the wind speed and direction data from the Lynwood station, and temperature and cloud cover data from the Los Angeles downtown USC station. We assumed that this meteorological data was applicable over the entire study area (100 square miles). Risk Assessment. The toxicity of toxic air contaminants is often established by available epidemiological studies, or, where data from humans are not available, the use of data from animal studies. The diesel PM cancer potency factor is based on long-term study of railyard workers exposed to diesel exhaust at concentrations approximately ten times typical ambient exposures (OEHHA, 2003). This can introduce uncertainty in the potential risk estimated for the general public because there is a wide range of responses among all individuals, and there can be a wider range of responses in the general public than in the workers in an epidemiology study. Different epidemiological studies also suggest somewhat different levels of risk. When the Scientific Review Panel (SRP) identified diesel PM as a toxic air contaminant, they endorsed a range of inhalation cancer potency factors (1.3 x 10 –4 to 2.4 x 10 –3 (µg/m3) –1) and a risk factor of 3x10 -4 (µg/m3)-1, as a reasonable estimate of the unit risk. From the unit risk factor an inhalation cancer potency factor of 1.1 (mg/kg-day)-1 can be calculated, which was used in the study. This study adopts the standard Tier-1 approach recommended by the OEHHA for exposure and risk assessment. A Tier 1 approach is an end-point estimate methodology without the consideration of site-specific data distributions. It also assumes that an individual is exposed to an annual average concentration of a pollutant continuously for a specific time period. The OEHHA recommends the lifetime 70-year exposure duration with a 24-hour per day exposure be used for determining residential cancer risks. Lifetime 70-year exposure is a conservative estimate, but it is a historical benchmark for comparing facility impacts on receptors and for evaluating the effectiveness of air pollution control measures.
E - 23
IV. HEALTH RISK ASSESSMENT FOR AGRICULTURAL TRUCKS To screen the potential cancer risks associated with uncontrolled agricultural trucks used to transport agricultural commodities from the field to a processing facility, ARB staff developed general assumptions bracketing a range of possible operating scenarios and determined the potential cancer risks for a “generic” processing facility. The number of truck trips and the distance from the roadway or processing facility wherein the risk levels reached 10 in a million or greater were determined. This can be used to provide a “qualitative” assessment of the potential risk levels near a roadway used by agricultural trucks and the processing facility. Actual risk levels will vary due to site specific parameters, including the number of trucks and associated emission rates, operating schedules, site configuration, site meteorology, and distance to receptors. As such, this assessment should be viewed as a first screening of the potential health risks, but more work on an actual facility is needed to more fully understand the potential impact. Below we describe the key inputs for the assessment. The methodology used to determine the potential cancer risk is the same as that used for on-road trucks discussed in previously in this Appendix.
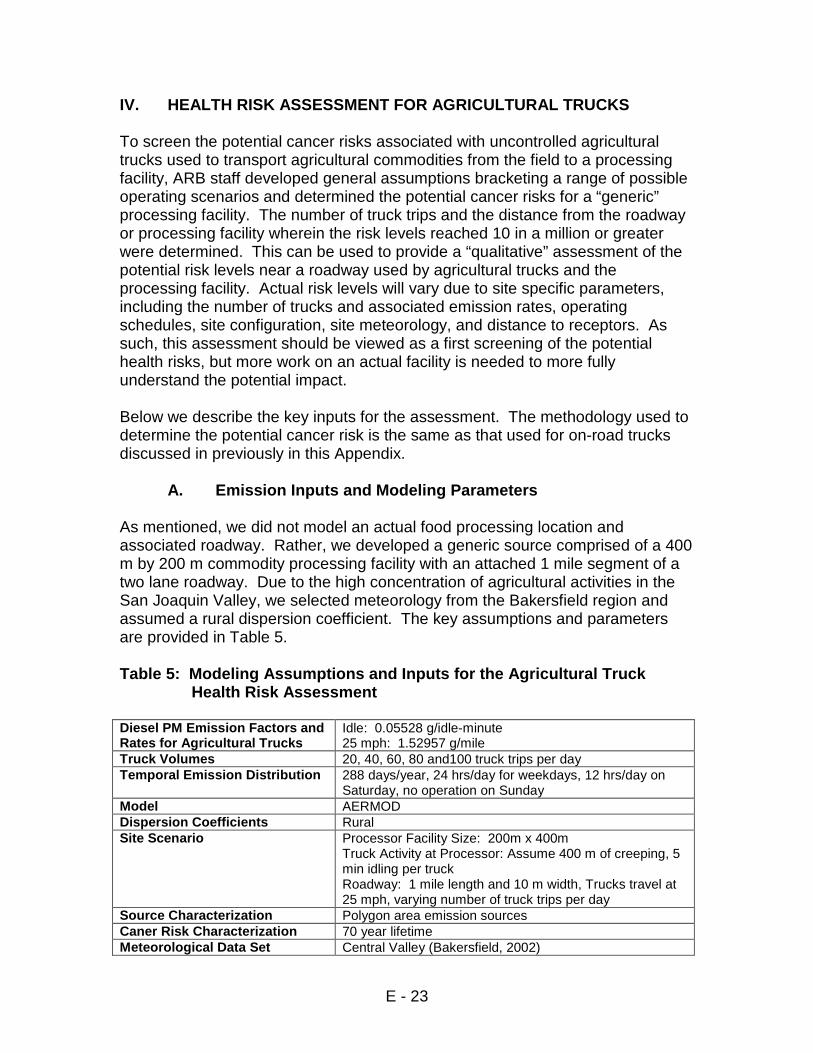
A. Emission Inputs and Modeling Parameters As mentioned, we did not model an actual food processing location and associated roadway. Rather, we developed a generic source comprised of a 400 m by 200 m commodity processing facility with an attached 1 mile segment of a two lane roadway. Due to the high concentration of agricultural activities in the San Joaquin Valley, we selected meteorology from the Bakersfield region and assumed a rural dispersion coefficient. The key assumptions and parameters are provided in Table 5. Table 5: Modeling Assumptions and Inputs for the Agricultural Truck
Health Risk Assessment Diesel PM Emission Factors and Rates for Agricultural Trucks
Idle: 0.05528 g/idle-minute 25 mph: 1.52957 g/mile
Truck Volumes 20, 40, 60, 80 and100 truck trips per day Temporal Emission Distribution 288 days/year, 24 hrs/day for weekdays, 12 hrs/day on
Saturday, no operation on Sunday Model AERMOD Dispersion Coefficients Rural Site Scenario Processor Facility Size: 200m x 400m
Truck Activity at Processor: Assume 400 m of creeping, 5 min idling per truck Roadway: 1 mile length and 10 m width, Trucks travel at 25 mph, varying number of truck trips per day
Source Characterization Polygon area emission sources Caner Risk Characterization 70 year lifetime Meteorological Data Set Central Valley (Bakersfield, 2002)
E - 24
B. Results
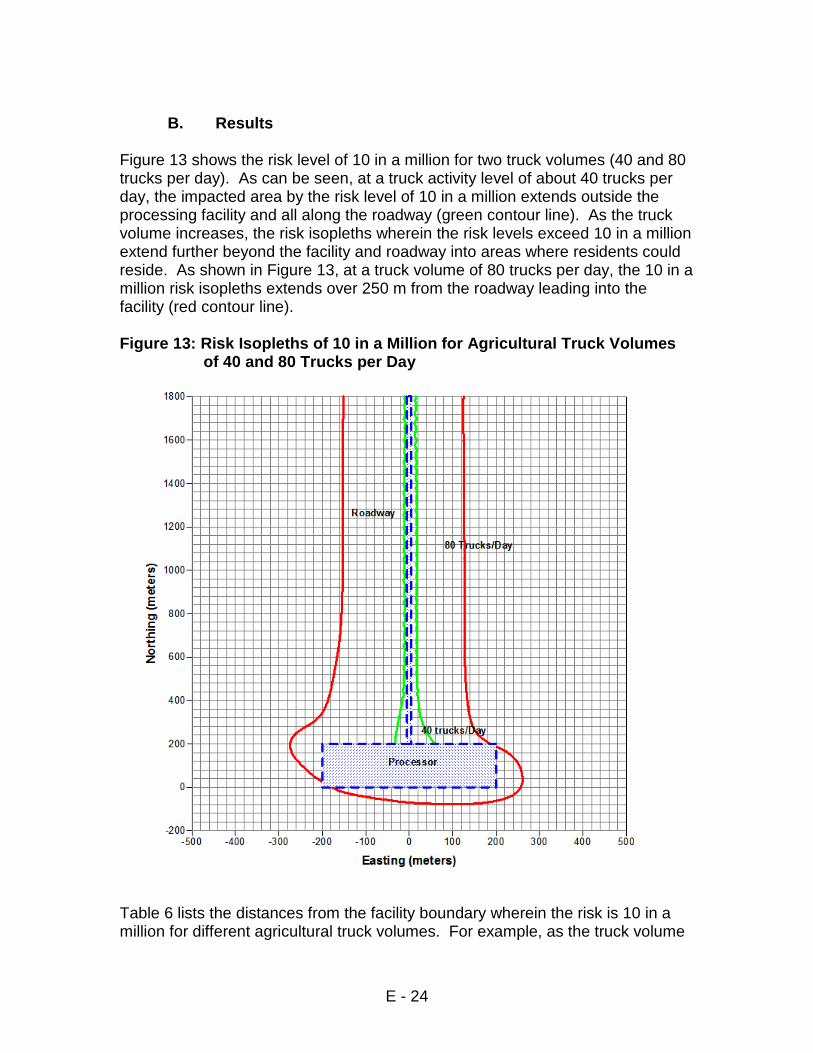
Figure 13 shows the risk level of 10 in a million for two truck volumes (40 and 80 trucks per day). As can be seen, at a truck activity level of about 40 trucks per day, the impacted area by the risk level of 10 in a million extends outside the processing facility and all along the roadway (green contour line). As the truck volume increases, the risk isopleths wherein the risk levels exceed 10 in a million extend further beyond the facility and roadway into areas where residents could reside. As shown in Figure 13, at a truck volume of 80 trucks per day, the 10 in a million risk isopleths extends over 250 m from the roadway leading into the facility (red contour line). Figure 13: Risk Isopleths of 10 in a Million for Agricultural Truck Volumes
of 40 and 80 Trucks per Day
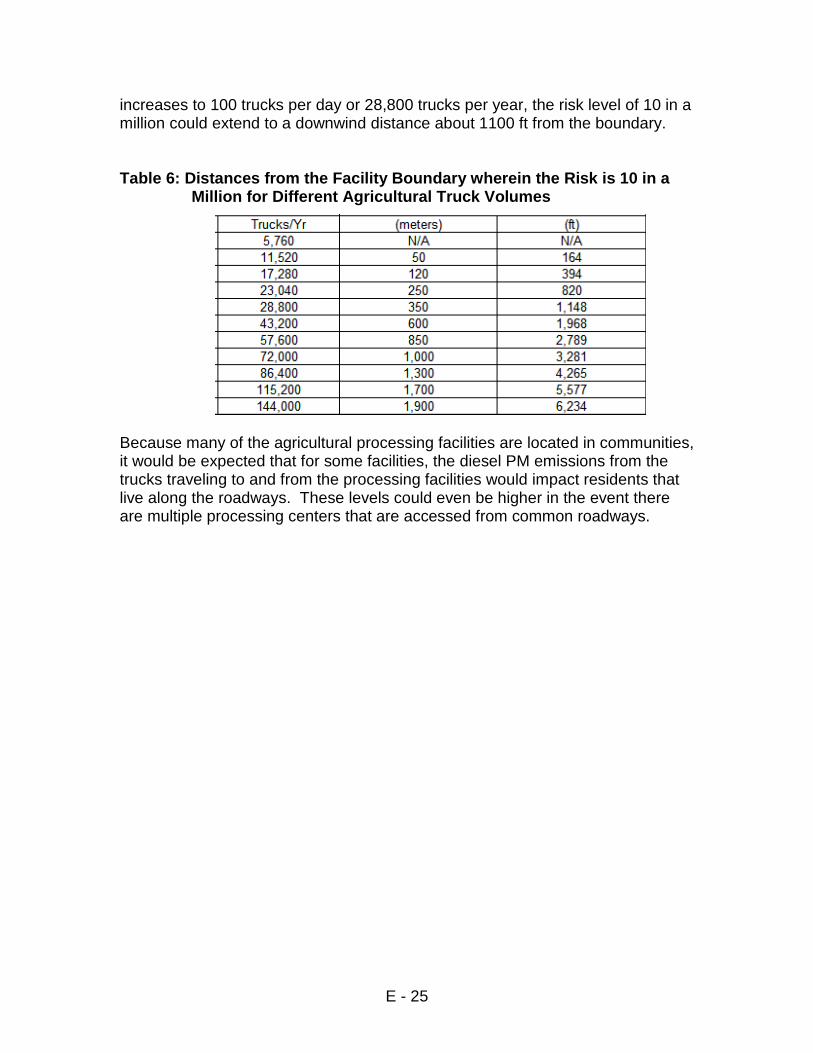
Table 6 lists the distances from the facility boundary wherein the risk is 10 in a million for different agricultural truck volumes. For example, as the truck volume
E - 25
increases to 100 trucks per day or 28,800 trucks per year, the risk level of 10 in a million could extend to a downwind distance about 1100 ft from the boundary. Table 6: Distances from the Facility Boundary wherein the Risk is 10 in a
Million for Different Agricultural Truck Volumes
Because many of the agricultural processing facilities are located in communities, it would be expected that for some facilities, the diesel PM emissions from the trucks traveling to and from the processing facilities would impact residents that live along the roadways. These levels could even be higher in the event there are multiple processing centers that are accessed from common roadways.
E - 26
REFERENCES ARB, 1998. For the "Proposed Identification of Diesel Exhaust as a Toxic Air Contaminant". April, 1998 ARB, 2000. Risk Reduction Plan to Reduce Particulate Matter Emissions from Diesel-Fueled Engines and Vehicles, Staff Report, October, 2000. (ARB, 2002). California Air Resources Board and Office of Environmental Health Hazard Assessment. Staff Report: Public Hearing to Consider Amendments to the Ambient Air Quality Standards for Particulate Matter and Sulfates, available at http://www.arb.ca.gov/research/aaqs/std-rs/pm-final/pm-final.htm. California Air Resources Board. 2002. ARB, 2004. ARB Recommended Interim Risk Management Policy for Inhalation-Based Residential Cancer Risk, March, 2004. http://www.arb.ca.gov/toxics/harp/rmpolicyfaq.htm ARB, 2006. Diesel Particulate Matter Exposure Assessment Study for the Ports of Los Angeles and Long Beach, Final Report. April, 2006. ARB, 2006b. Goods Movement Emissions Reduction Plan, Air Resources Board, April 2006. ARB, 2008. ARB Methodology for Estimating Premature Deaths Associated Long-term Exposures to Fine Airborne Particulate Matter in California. OEHHA, 2002. Air Toxics Hot Spot Program Risk Assessment Guidelines: Part II Technical Support Document for Describing Available Cancer Potency Factors. Office of Environmental Health Hazard Assessment. December, 2002. OEHHA, 2003. Air Toxics Hot Spots Program Risk Assessment Guidelines: The Air Toxics Hot Spots Program Guidance Manual for Preparation of Health Risk Assessments. Office of Environmental Health Hazard Assessment. August, 2003. (Pope, 2002). Pope, C.A., III et.al, Lung Cancer, Cardiopulmonary Mortality, and Long-Term Exposure to Fine Particulate Air Pollution, J. Am. Med. Assoc., 287, pp. 1132-1141. SCAQMD, 2000. Multiple Air Toxics Exposure Study in the South Coast Air Basin (MATES-II), Final Report, March, 2000. SCAG, 2007. SCAG Transportation Modeling, http://www.scag.ca.gov/modeling/ [Accessed January 2007].
E - 27
U.S. EPA, 2004a. User’s Guide for the AMS/EPA Regulatory Model – AERMOD. Report No. EPA-454/B-03-001. Office of Air Quality Planning and Standards. Emissions Monitoring and Analysis Division, Research Triangle Park, NC. September, 2004. U.S. EPA, 2004b. User’s Guide for the AERMOD Meteorological Preprocessor. Report No. EPA-454/B-03-002. Office of Air Quality Planning and Standards. Emissions Monitoring and Analysis Division, Research Triangle Park, NC. September, 2004. (USA EPA, 2004c). United States Environmental Protection Agency, May, 2004, Final Regulatory Impact Analysis: Control of Emissions from Nonroad Diesel Engines, EPA-420-R-04-007, Office of Transportation and Air quality, http://www.epa.gov/otaq/regs/nonroad/equip-hd/2004fr.htm#ria U.S. EPA, 2005. Federal Register, Part III, 40 CFR Part 51, Vol. 70, No. 216, November 9, 2005.

E - 28