Embed Size (px)
Citation preview

APPENDIX E
Hydrogeological Report DSO2 and DSO3 Sectors Schefferville (Québec) and Elross Lake (Newfoundland
and Labrador)
Unofficial Translation of Sections Dealing with DSO3


DIRECT-SHIPPING ORE PROJECT
Hydrogeological Report DSO2 and DSO3 Sectors
Schefferville (Québec) and Elross Lake (Newfoundland and
Labrador)
UNOFFICIAL TRANSLATION OF SECTIONS DEALING WITH DSO3
BY: Envir-Eau
March 2009
NEW MILLENNIUM CAPITAL CORP.

UNOFFICIAL TRANSLATION OF SECTIONS DEALING WITH DSO3
HYDROGEOLOGICAL REPORT DSO2 AND DSO3 SECTORS
SCHEFFERVILLE (QUEBEC) AND
ELROSS LAKE (NEWFOUNDLAND AND LABRADOR)
Report prepared for:
Groupe Hémisphères
By:
160, BOUL. DE L'HÔPITAL GATINEAU (QUÉBEC)
HB7103-00-00
March 2009


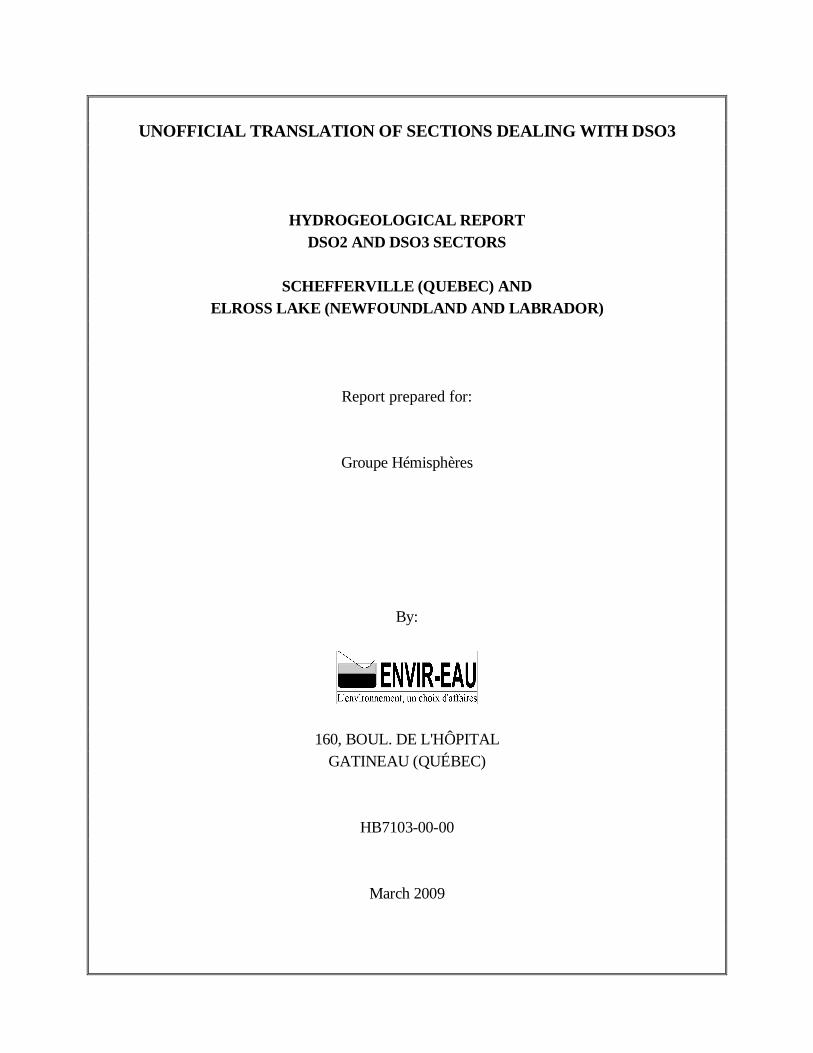
LOCATION OF DSO DEPOSITSSCHEFFERVILLELOCALISATION DES GISEMENTS DSOSCHEFFERVILLE
SOURCE:
GROUPE HÉMISPHÈRES, UPDATED HYDROLOGY, 2008GROUPE HÉMISPHÈRES, HYDROLOGIE MISE À JOUR, 2008
LEGEND/LÉGENDE
Timmins 3N
Ferriman 4
Timmins 4
Fleming 7N
Star Creek 2
Barney 2
Timmins 8
Timmins 7
Lac Star
Lac Big Star
Lac de l' Hématite
RLC-9RLC-8
RLC-7RLC-6
RLC-5RLC-25
RLC-24
RLC-22
RLC-20RLC-19
RLC-18RLC-17
RLC-16 RLC-15RLC-14
RLC-13
RLC-12RLC-11
RLC-3a
RLC-23
RLC-21
RLC-10
UTM Nad 83 Zone 19N
Sources: Government of Canada, NTDB, 1:50 000, 1979 Government of Newfoundland and Labrador and Governement of Quebec, Boundary used for claims New Millennium Capital Corp., Mining sites and roads Groupe Hémisphères, Hydrology update, 2008 Gouvernement du Canada, BNDT, 1/50 000, 1979 Gouvernement de Terre-Neuve-et-Labrador et Gouvernement du Québec, frontière utilisée pour les titres New Millennium Capital Corp., gisements et routes Groupe Hémisphères, mise-à-jour de l'hydrologie, 2008
Scale/Échelle:
Location of DSO2 and DSO3 DepositsLocalisation des gisements de DSO2 et DSO3
Figure 2
Ferriman 4
Star Creek 2
RLC-9RLC-8
RLC-7RLC-6
RLC-5
RLC-3 RLC-2
RLC-1RLC-27
RLC-26RLC-3a
RLc-27a
RLC-4
Lac Star
Lac Knob
Bean Lake
Slimy Lake
Lac DenaultLac Dauriat
Lac Big Star Lejeune Lake
EAST/EST
WEST/OUEST
0 1 2 3 40,5Kilometers/Kilomètres
QC
NL
QC NL
NL
QC
Legend/LégendeReconnaissance Station/Station de reconnaissanceProvincial Border/Frontière provincialeMain Access Road/Route d'accès principaleSecondary road/Chemin secondaireRailway/Chemin de fer
Deposit/GisementExisting mined-out Pit/Fosse existante épuiséeExisting Waste Dump/Halde de stériles existanteWaterbody/Plan d'eauWatercourse/Cours d'eau
Wetland/Milieu humide
QCNL
QC
º
ºTimmins 1
Silver Yard
Scheferville
1:40 000 FILE, VERSION, DATE, AUTHORFICHIER, VERSION, DATE, AUTEUR:GH-0022-00, 09-04-02, J.T.Groupe Hémisphères Inc.

3
1.2 NATURE OF THE STUDY The goal of the present hydrogeological study is to collect baseline data in order to answer questions that may be raised by Quebec, Newfoundland and Labrador or Fisheries and Oceans Canada, principally with regard to the following components: - the classification of the groundwater (class I, II or III); - the physical and chemical quality of the groundwater; - the identification of aquifers; - the vulnerability of the groundwater to pollution; - the direction of the flow of the groundwater; - the impact on the groundwater of dewatering the deposits by identifying:
measures to limit pumping for purposes of dewatering; the identification of the main contaminants likely to be found in the dewatering water and
its physical and chemical characteristics; the anticipated volume and average daily flow of the dewatering water; the method for managing the dewatering water; the components of the dewatering system; the site of discharge of the dewatering water.
4
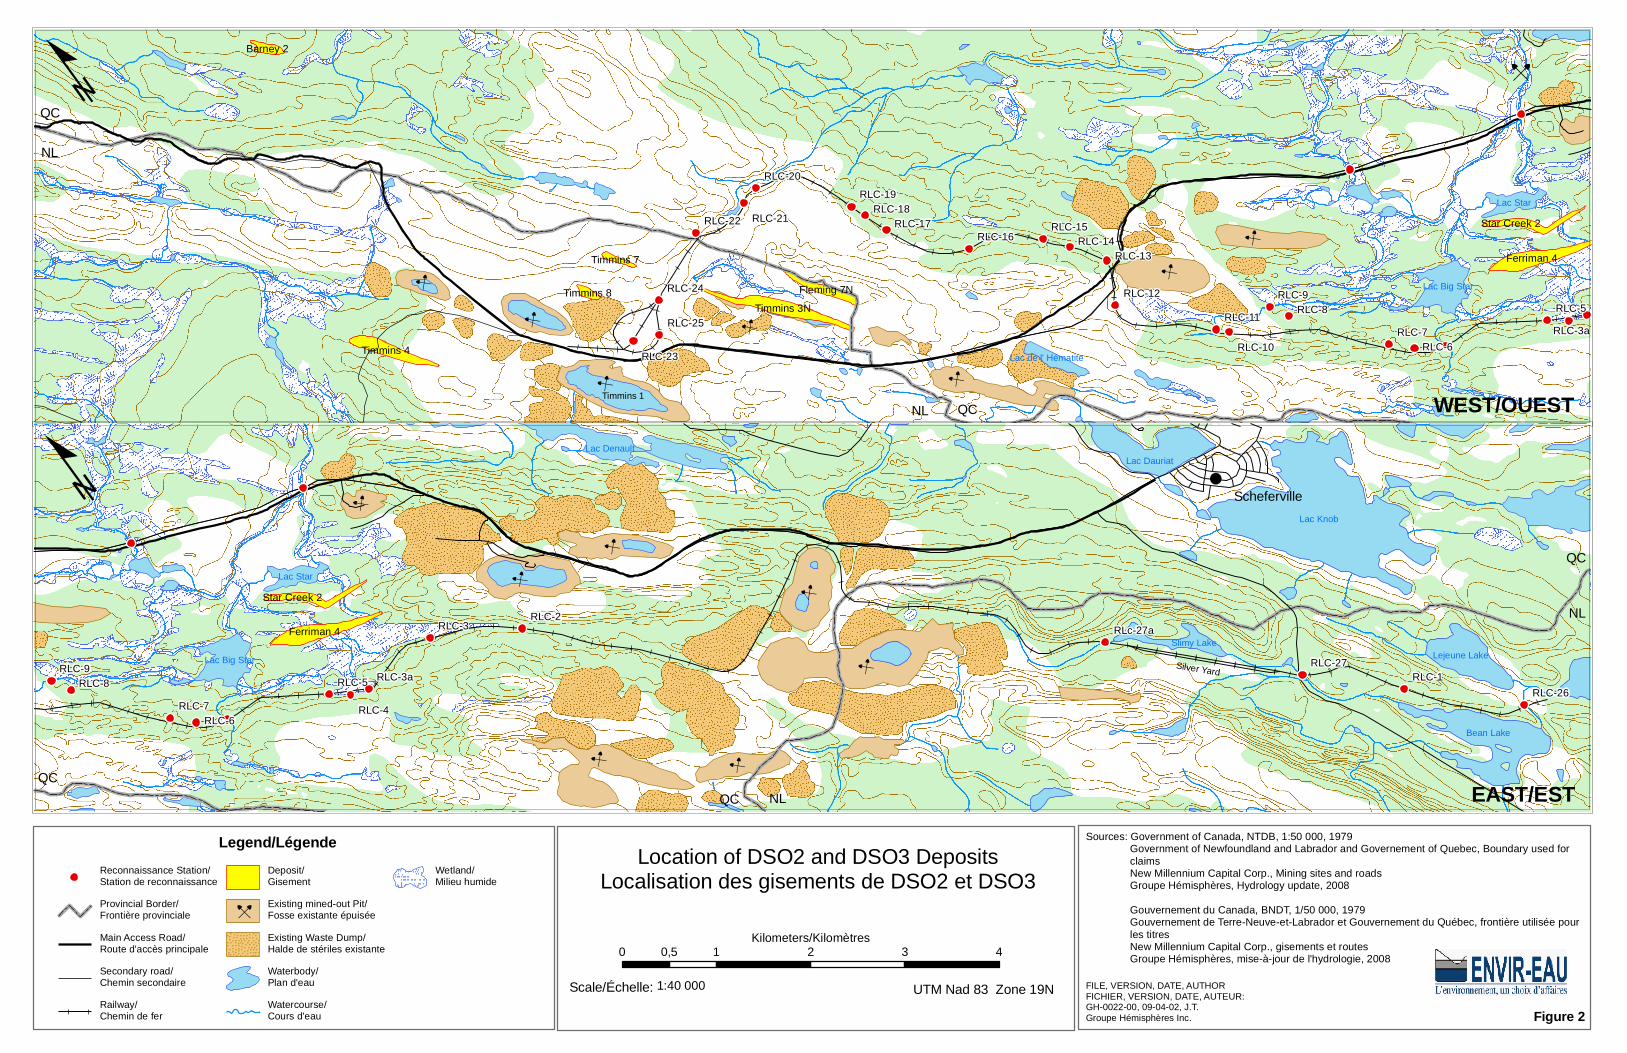
2. CHRONOLOGY AND GENERAL METHODOLOGY A first field visit was carried out from October 15 to 17, 2008 by Mr. Gilles Fortin, Project Manager for WEE. This visit produced an understanding of the geological and hydrogeological environment of the two sectors and permitted the identification of the elements that could have an impact on the environment during the mining of the deposits. More specifically, the site visits yielded an understanding of the topography of the sites, the position of the various geological formations, the presence of groundwater resurgence zones, the probable direction of groundwater flow and the most appropriate sites for the installation of piezometers, pumping wells, etc. The visit by the Project Manager also made it possible to select the location and configuration of a pumping test in DSO2.
5
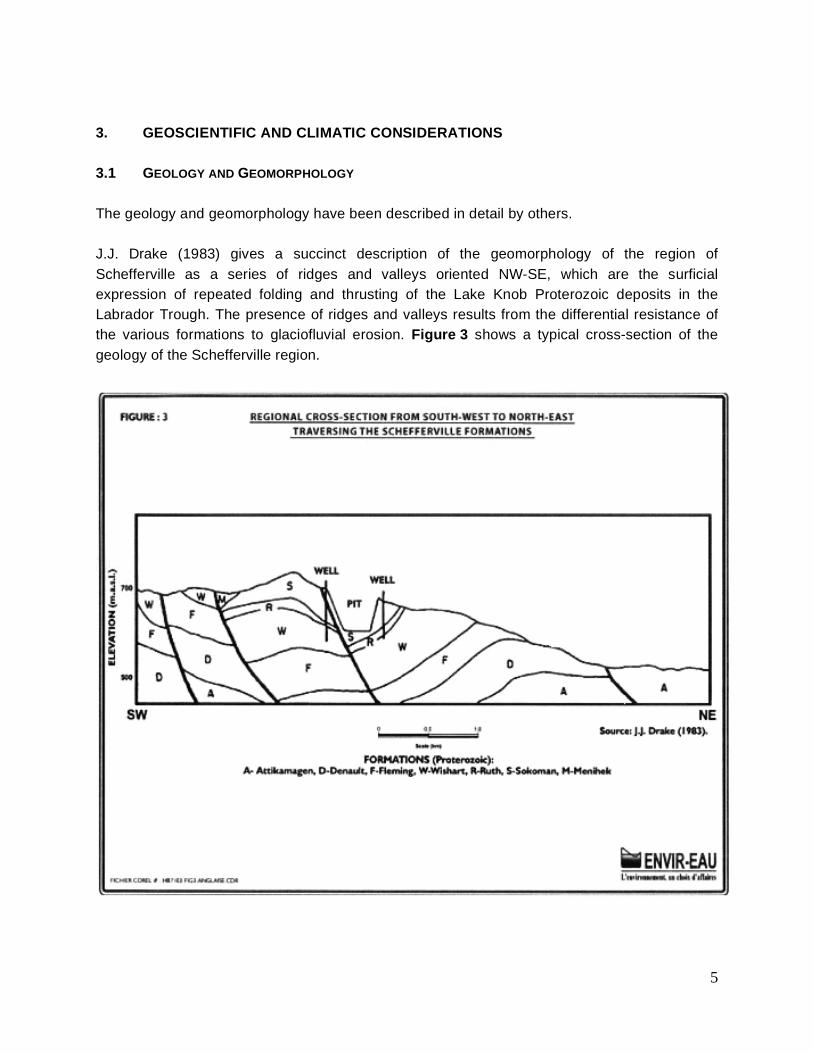
3. GEOSCIENTIFIC AND CLIMATIC CONSIDERATIONS 3.1 GEOLOGY AND GEOMORPHOLOGY The geology and geomorphology have been described in detail by others. J.J. Drake (1983) gives a succinct description of the geomorphology of the region of Schefferville as a series of ridges and valleys oriented NW-SE, which are the surficial expression of repeated folding and thrusting of the Lake Knob Proterozoic deposits in the Labrador Trough. The presence of ridges and valleys results from the differential resistance of the various formations to glaciofluvial erosion. Figure 3 shows a typical cross-section of the geology of the Schefferville region.

6
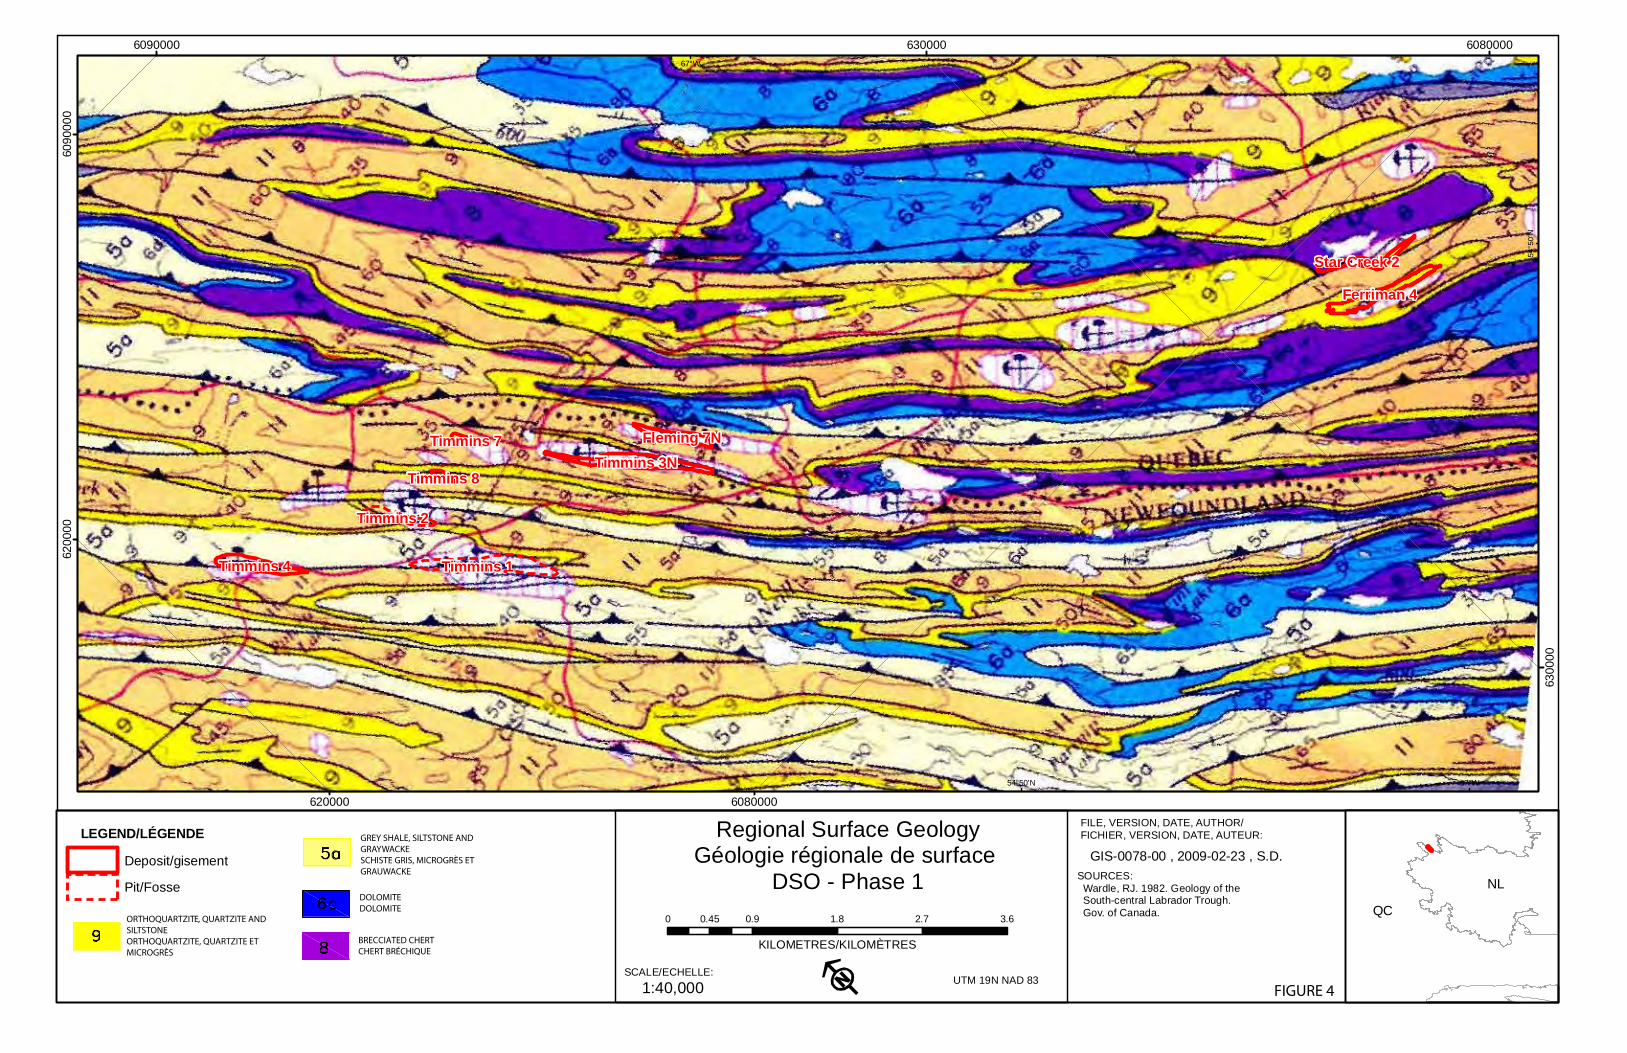
Figure 4 shows the regional geology according to R.J. Wardle (1982). All iron ore deposits are found in synclinal folds, either in the shale of the Ruth Formation or in the chert of the Sokoman Formation.
Timmins 3N
Ferriman 4
Timmins 4
Fleming 7N
Star Creek 2
Timmins 8
Timmins 7
Timmins 1
Timmins 2
67°W
67°W
54°5
0'N
54°50'N
6200
00
620000
630000
6300
00
6080000
6080000
609000060
9000
0
FILE, VERSION, DATE, AUTHOR/FICHIER, VERSION, DATE, AUTEUR:
SOURCES: Wardle, RJ. 1982. Geology of the South-central Labrador Trough. Gov. of Canada.
Regional Surface GeologyGéologie régionale de surface
DSO - Phase 10 0.9 1.8 2.7 3.60.45
KILOMETRES/KILOMÈTRES
LEGEND/LÉGENDE
Deposit/gisementPit/Fosse
UTM 19N NAD 83SCALE/ECHELLE:
QCNL
1:40,000
GIS-0078-00 , 2009-02-23 , S.D.
DOLOMITEDOLOMITE
GREY SHALE, SILTSTONE AND GRAYWACKESCHISTE GRIS, MICROGRÈS ET GRAUWACKE
ORTHOQUARTZITE, QUARTZITE ANDSILTSTONEORTHOQUARTZITE, QUARTZITE ET MICROGRÈS
BRECCIATED CHERTCHERT BRÉCHIQUE
FIGURE 4

8
Figure 5 shows the conformation of the deposits.
9
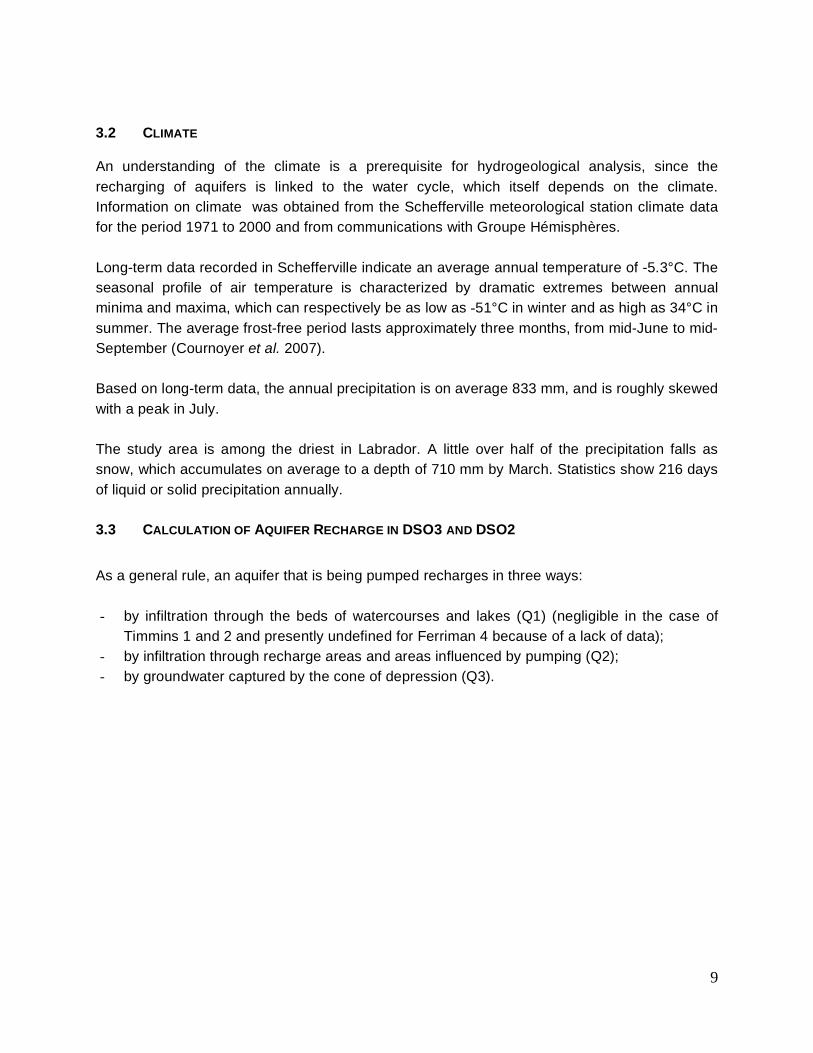
3.2 CLIMATE An understanding of the climate is a prerequisite for hydrogeological analysis, since the recharging of aquifers is linked to the water cycle, which itself depends on the climate. Information on climate was obtained from the Schefferville meteorological station climate data for the period 1971 to 2000 and from communications with Groupe Hémisphères. Long-term data recorded in Schefferville indicate an average annual temperature of -5.3°C. The seasonal profile of air temperature is characterized by dramatic extremes between annual minima and maxima, which can respectively be as low as -51°C in winter and as high as 34°C in summer. The average frost-free period lasts approximately three months, from mid-June to mid-September (Cournoyer et al. 2007). Based on long-term data, the annual precipitation is on average 833 mm, and is roughly skewed with a peak in July. The study area is among the driest in Labrador. A little over half of the precipitation falls as snow, which accumulates on average to a depth of 710 mm by March. Statistics show 216 days of liquid or solid precipitation annually. 3.3 CALCULATION OF AQUIFER RECHARGE IN DSO3 AND DSO2
As a general rule, an aquifer that is being pumped recharges in three ways: - by infiltration through the beds of watercourses and lakes (Q1) (negligible in the case of
Timmins 1 and 2 and presently undefined for Ferriman 4 because of a lack of data); - by infiltration through recharge areas and areas influenced by pumping (Q2); - by groundwater captured by the cone of depression (Q3).

10
Table 1 shows the results of the calculation of groundwater recharge for the Ferriman 4 deposit in DSO2 and in the former pit of Timmins 1 in DSO3. The Q2 and Q3 values were obtained respectively by applying the following formulae: Q2 = Recharge area x Infiltration from precipitation Q3 = KiA Where: K = Hydraulic conductivity of the aquifer (value obtained at Ferriman 4)
i = hydraulic gradient A = vertical recharge area
Table 1 : Recharge of Ferriman 4 (DSO2) and Timmins 1 (DSO3)
Direct recharge through infiltration Contribution of groundwater to recharge
Site
Recharge area (km2)
Infiltration (30%P) (mm/y)
Q2 (m3/d)
K (m/d)
i A (m2)
Q3 (m3/d)
Q2+Q3 (m3/d)
Ferriman 4 8.75 250 5,993 1.09 0.05 1,318m x 100m
7,183 13,176
Timmins 1 12.4 250 8,479 1.09 0.05 1,100m x 30m
1,799 10,278
P = precipitation
11
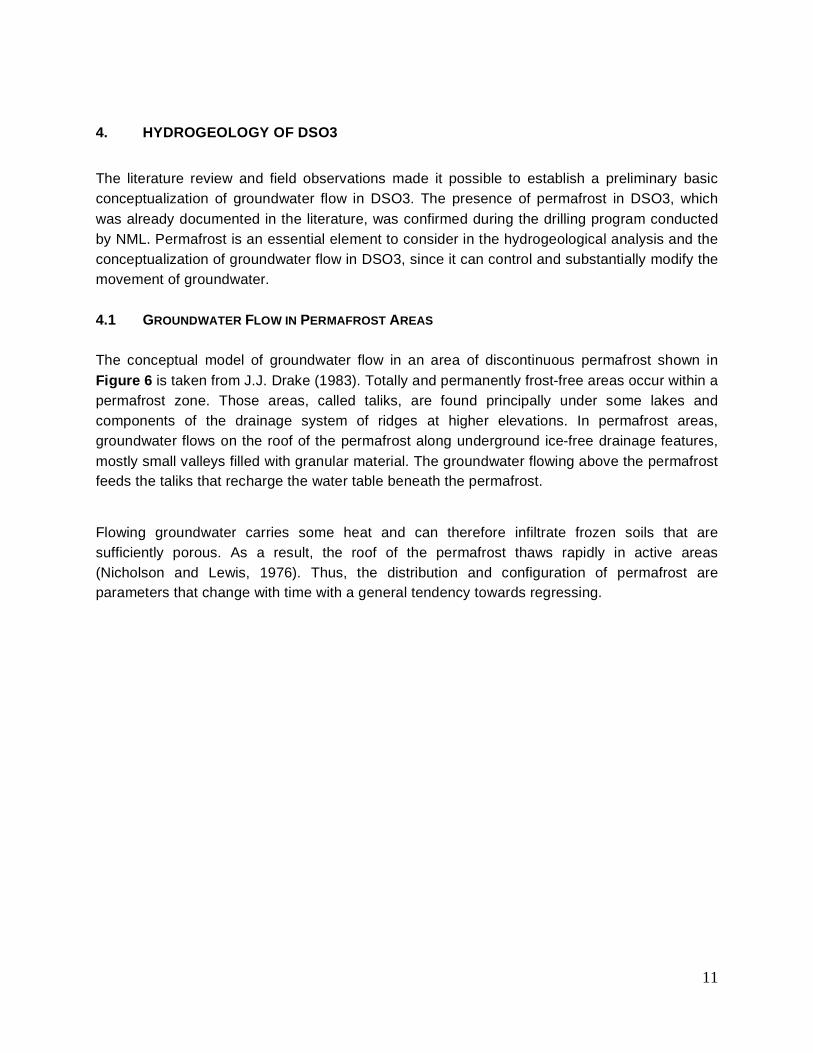
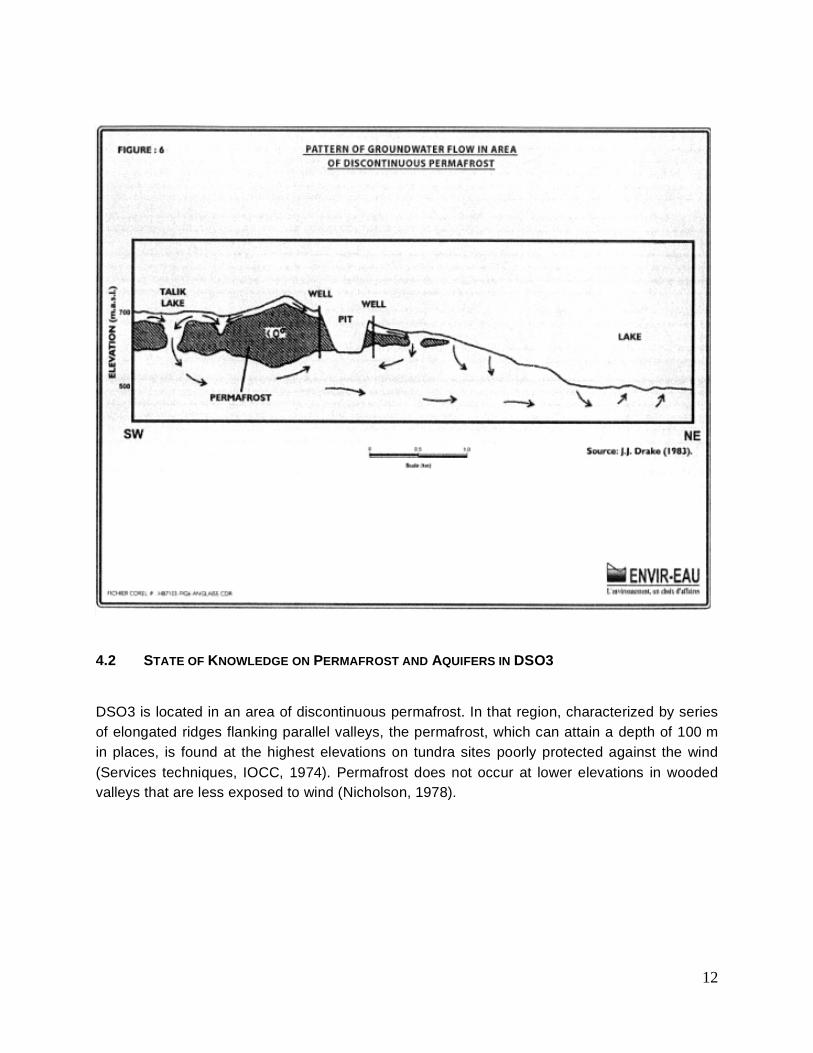
4. HYDROGEOLOGY OF DSO3 The literature review and field observations made it possible to establish a preliminary basic conceptualization of groundwater flow in DSO3. The presence of permafrost in DSO3, which was already documented in the literature, was confirmed during the drilling program conducted by NML. Permafrost is an essential element to consider in the hydrogeological analysis and the conceptualization of groundwater flow in DSO3, since it can control and substantially modify the movement of groundwater. 4.1 GROUNDWATER FLOW IN PERMAFROST AREAS The conceptual model of groundwater flow in an area of discontinuous permafrost shown in Figure 6 is taken from J.J. Drake (1983). Totally and permanently frost-free areas occur within a permafrost zone. Those areas, called taliks, are found principally under some lakes and components of the drainage system of ridges at higher elevations. In permafrost areas, groundwater flows on the roof of the permafrost along underground ice-free drainage features, mostly small valleys filled with granular material. The groundwater flowing above the permafrost feeds the taliks that recharge the water table beneath the permafrost. Flowing groundwater carries some heat and can therefore infiltrate frozen soils that are sufficiently porous. As a result, the roof of the permafrost thaws rapidly in active areas (Nicholson and Lewis, 1976). Thus, the distribution and configuration of permafrost are parameters that change with time with a general tendency towards regressing.
12
4.2 STATE OF KNOWLEDGE ON PERMAFROST AND AQUIFERS IN DSO3
DSO3 is located in an area of discontinuous permafrost. In that region, characterized by series of elongated ridges flanking parallel valleys, the permafrost, which can attain a depth of 100 m in places, is found at the highest elevations on tundra sites poorly protected against the wind (Services techniques, IOCC, 1974). Permafrost does not occur at lower elevations in wooded valleys that are less exposed to wind (Nicholson, 1978).
13
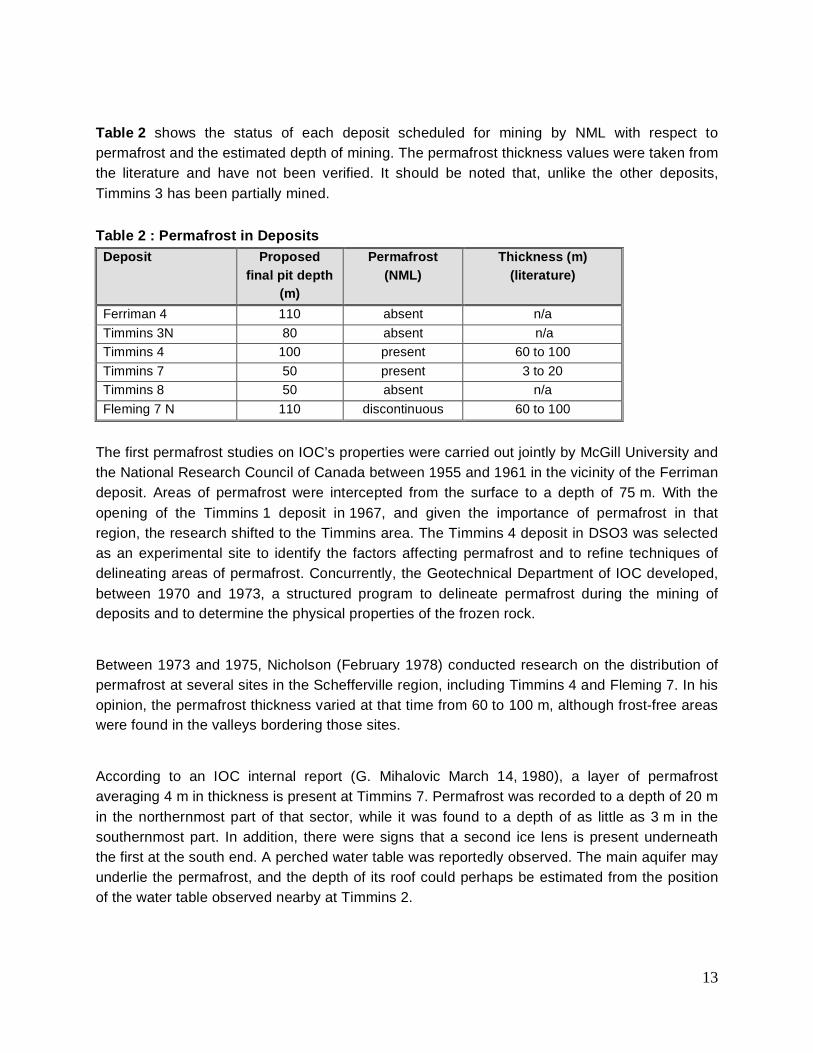
Table 2 shows the status of each deposit scheduled for mining by NML with respect to permafrost and the estimated depth of mining. The permafrost thickness values were taken from the literature and have not been verified. It should be noted that, unlike the other deposits, Timmins 3 has been partially mined. Table 2 : Permafrost in Deposits
Deposit Proposed final pit depth
(m)
Permafrost (NML)
Thickness (m) (literature)
Ferriman 4 110 absent n/a Timmins 3N 80 absent n/a Timmins 4 100 present 60 to 100 Timmins 7 50 present 3 to 20 Timmins 8 50 absent n/a Fleming 7 N 110 discontinuous 60 to 100
The first permafrost studies on IOC’s properties were carried out jointly by McGill University and the National Research Council of Canada between 1955 and 1961 in the vicinity of the Ferriman deposit. Areas of permafrost were intercepted from the surface to a depth of 75 m. With the opening of the Timmins 1 deposit in 1967, and given the importance of permafrost in that region, the research shifted to the Timmins area. The Timmins 4 deposit in DSO3 was selected as an experimental site to identify the factors affecting permafrost and to refine techniques of delineating areas of permafrost. Concurrently, the Geotechnical Department of IOC developed, between 1970 and 1973, a structured program to delineate permafrost during the mining of deposits and to determine the physical properties of the frozen rock. Between 1973 and 1975, Nicholson (February 1978) conducted research on the distribution of permafrost at several sites in the Schefferville region, including Timmins 4 and Fleming 7. In his opinion, the permafrost thickness varied at that time from 60 to 100 m, although frost-free areas were found in the valleys bordering those sites. According to an IOC internal report (G. Mihalovic March 14, 1980), a layer of permafrost averaging 4 m in thickness is present at Timmins 7. Permafrost was recorded to a depth of 20 m in the northernmost part of that sector, while it was found to a depth of as little as 3 m in the southernmost part. In addition, there were signs that a second ice lens is present underneath the first at the south end. A perched water table was reportedly observed. The main aquifer may underlie the permafrost, and the depth of its roof could perhaps be estimated from the position of the water table observed nearby at Timmins 2.
14
In another letter dated March 14, 1980, Mihalovic indicated that the Fleming 7 deposit is frozen starting at a depth of 2 m from the surface to more than 43 m. A perched water table was also observed. Mihalovic (April 8, 1980) noted that matching reports compiled over several years by the McGill Research Station and the IOC Technical Department demonstrated that the Timmins 4 deposit is frozen from the surface to a depth of more than 100 m. He also noted that it is difficult to establish the depth of the water table in a permafrost area. He was probably referring to the presence of perched water tables. 4.3 GROUNDWATER FLOW AT DSO3 The main aquifers in this sector are found mostly in the bedrock. The presence of discontinuous permafrost in that sector promotes the formation of local perched water tables. The landform maps indicate that the bedrock is exposed practically everywhere throughout the deposits (Groupe Hémisphères, Mars 2009), which is in keeping with the fact that several deposits were stripped down to the bedrock by the IOC with a view to eventually mining them. The soil that is still present in the sector is said to be composed almost entirely of moraine. According to the geologists of NML, the maximum thickness of natural overburden is in the Fleming 7 sector, where thicknesses of up to 5 m were found. The overburden in the DSO3 sector is not thick enough to contain important aquifers. The regional groundwater flow is illustrated in Figure 7. The DSO3 sector is entirely located in Labrador, a short distance from the Quebec border and, hence, from the drainage divide. The recharging of the aquifers will mostly occur on the higher ridges where the surface water divides. All of the deposits in DSO3 are located close to the principal recharge area, thus benefiting from a limited recharge area. The regional groundwater flow in that sector roughly follows the surface flow. Some of the water that infiltrates in the recharge area flows towards Labrador, namely towards the DSO3 sector. The groundwater will also be recharged through direct infiltration in the area downstream from the flow. The DSO3 sector was greatly disturbed by previous mining operations. Several abandoned pits and waste rock piles were observed. There is practically no vegetation in areas that were mined. According to Groupe Hémisphères (Décembre 2008), which compared old maps with recent field observations, the drainage network was somewhat reduced by the former mining operations. All those changes at the biophysical level have an impact on the recharging of the aquifer in the disturbed areas. It should be noted that permafrost areas have been identified at Fleming 7 and Timmins 4 and 7. Permafrost can significantly limit the infiltration of water into the soil and thus the
15
recharging of the aquifer in the permafrost area. The surface water would then tend to travel over the frozen soils or in the ice-free superficial layer of the recharge area and to infiltrate in unfrozen areas at lower elevations and in zones of taliks.

Timmins 3N
Ferriman 4
Timmins 4
Fleming 7N
Star Creek 2
Barney 2
Timmins 8
Timmins 7
Lac Star
Lac Big Star
Lac de l' Hématite
620
590650
560
680710
530
620
560
Regional Groundwater FlowHydrogeological Basin
Fleming and Timmins Area
Écoulement souterrain régionalBassin hydrogéologique
Fleming et secteur Timmins
NL/TNLQC/QC
QC/QCNL/TNL
¯
Timmins 1
SOURCES: Government of Canada, NTDB, 1:50 000, 1979 Government of Newfoundland and Labrador and Governement of Quebec, Boundary used for claims New Millennium Capital Corp., Mining sites and roads Groupe Hémisphères, Hydrology update, 2008 Hydrogeological Basin "Fleming", adapted from L. Nichols, 1966 Gouvernement du Canada, BNDT, 1/50 000, 1979 Gouvernement de Terre-Neuve-et-Labrador et Gouvernement du Québec, frontière utilisée pour les titres New Millennium Capital Corp., gisements et routes Groupe Hémisphères, mise-à-jour de l'hydrologie, 2008 Bassin hydrogéologique "Fleming", adapté de L. Nichols, 1966
Limit of Fleming Hydrogeological Basin/Limite du bassin hydrogéologique FlemingPiezometric Isocontour (m)/Isocontour piézométrique (m)Border/FrontièreRailway to be reconstructed/Voie ferrée à reconstruireMain Access Road/Route d'accès principaleRoad/routeDeposit/gisement
Watercourse/Cours d'eauWetland/Milieu humideWaterbody/Plan d'eauExisting mined-out Pit/Fosse existante épuiséeExisting Waste Dump/Halde de stériles existanteContour Interval/courbe de niveau
0 1 2 3
KILOMETERS/KILOMÈTRES
UTM NAD 83 Zone 19
Timmins 2
Figure 7Source and direction of Groundwater Flow/Sens d'écoulement de l'eau souterraine SCALE/ÉCHELLE:
1:40 000FILE, VERSION, DATE, AUTHOR/FICHIER, VERSION, DATE, AUTEUR:
GH-0010-02 , 2009-04-02, J.T.Groupe Hémisphères Inc.
17
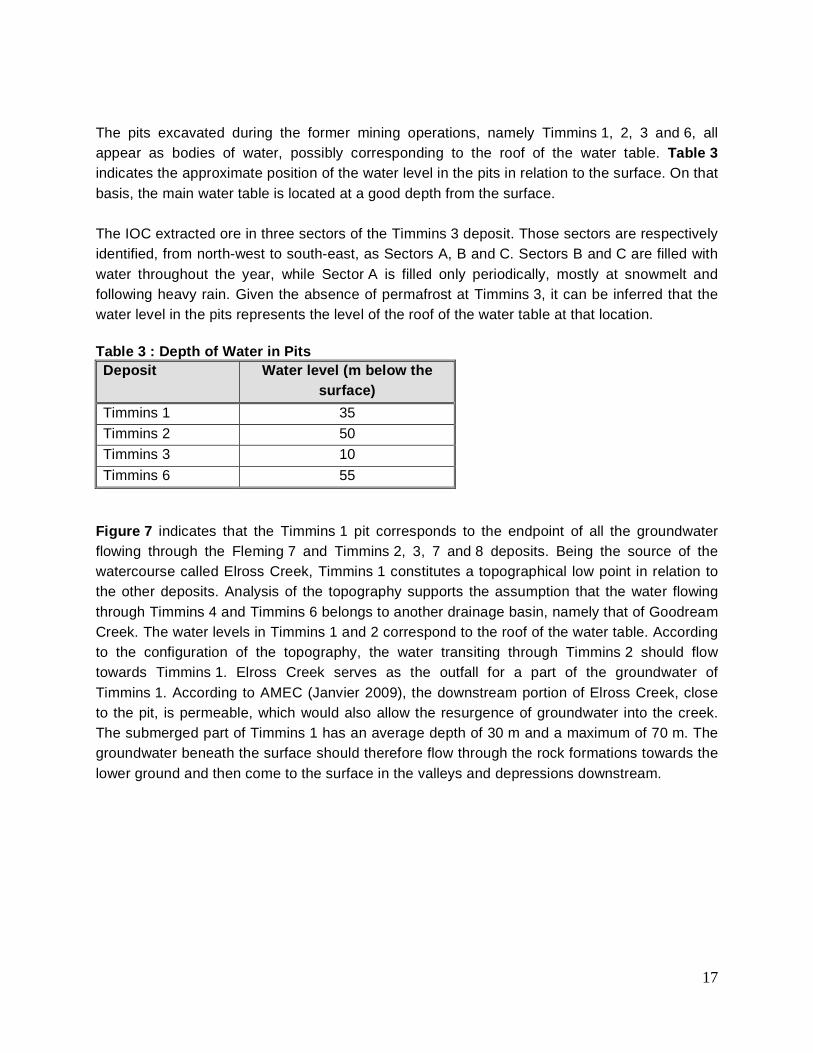
The pits excavated during the former mining operations, namely Timmins 1, 2, 3 and 6, all appear as bodies of water, possibly corresponding to the roof of the water table. Table 3 indicates the approximate position of the water level in the pits in relation to the surface. On that basis, the main water table is located at a good depth from the surface. The IOC extracted ore in three sectors of the Timmins 3 deposit. Those sectors are respectively identified, from north-west to south-east, as Sectors A, B and C. Sectors B and C are filled with water throughout the year, while Sector A is filled only periodically, mostly at snowmelt and following heavy rain. Given the absence of permafrost at Timmins 3, it can be inferred that the water level in the pits represents the level of the roof of the water table at that location. Table 3 : Depth of Water in Pits Deposit Water level (m below the
surface) Timmins 1 35 Timmins 2 50 Timmins 3 10 Timmins 6 55
Figure 7 indicates that the Timmins 1 pit corresponds to the endpoint of all the groundwater flowing through the Fleming 7 and Timmins 2, 3, 7 and 8 deposits. Being the source of the watercourse called Elross Creek, Timmins 1 constitutes a topographical low point in relation to the other deposits. Analysis of the topography supports the assumption that the water flowing through Timmins 4 and Timmins 6 belongs to another drainage basin, namely that of Goodream Creek. The water levels in Timmins 1 and 2 correspond to the roof of the water table. According to the configuration of the topography, the water transiting through Timmins 2 should flow towards Timmins 1. Elross Creek serves as the outfall for a part of the groundwater of Timmins 1. According to AMEC (Janvier 2009), the downstream portion of Elross Creek, close to the pit, is permeable, which would also allow the resurgence of groundwater into the creek. The submerged part of Timmins 1 has an average depth of 30 m and a maximum of 70 m. The groundwater beneath the surface should therefore flow through the rock formations towards the lower ground and then come to the surface in the valleys and depressions downstream.

18
Figure 9: Groundwater Flow Conceptual Model for the Ferriman 4 and Star Creek 2 Sector
Note : This is a slightly revised version of the figure that appeared in the French version.

19
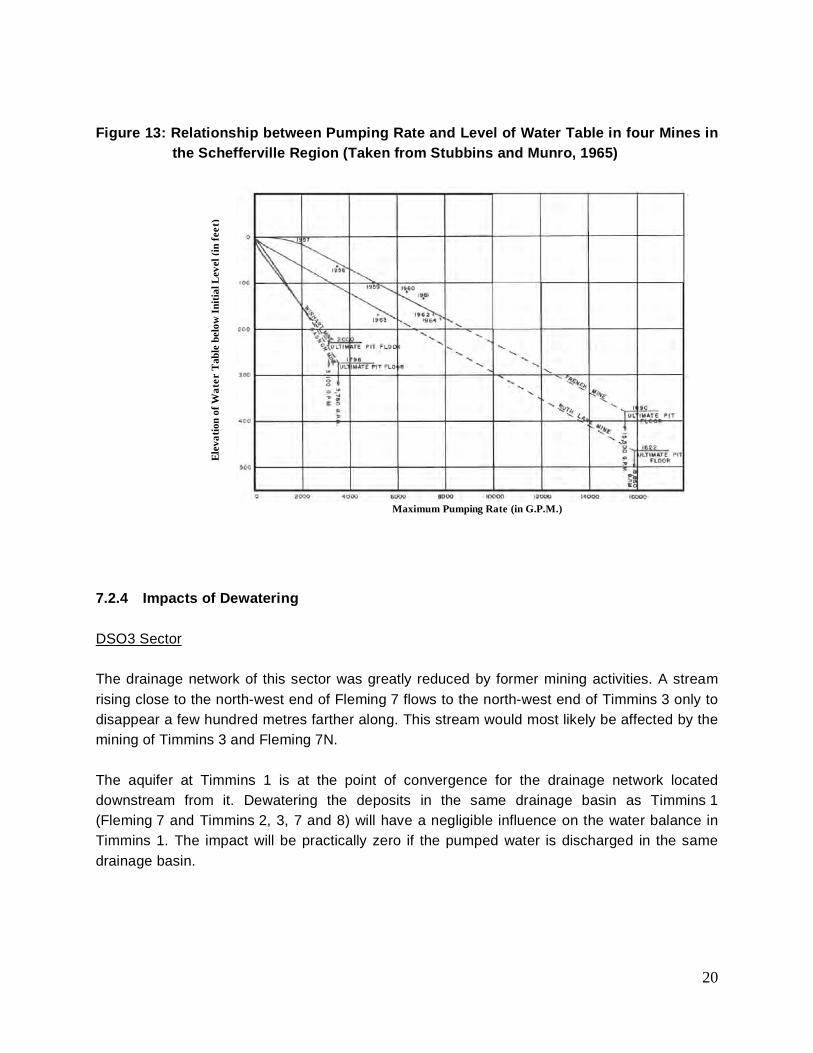
7. DEWATERING OF DEPOSITS The dewatering of a deposit in production involves extracting a volume of groundwater over a period commencing several months prior to the beginning of the mining operations and extending until the closing of the mine. A deposit is mined in successively deeper layers (lifts). Thus, dewatering is done progressively during mining operations so as to extract water only from that part of the aquifer above the floor of the layer that is intended to be mined. Once the desired level is reached, the pumping rate is adjusted and is maintained until all the layer in question has been mined. The next layer is then dewatered following the same principle, which means that the maximum pumping rate will be attained at the very end of the mining operations. As a general rule, once the desired drawdown is attained, the pumping rate required to maintain the desired level of the water table is between 33 and 50% of the initial pumping rate (Tomlinson, 1963). What is involved is pumping the volume of water coming from the aquifer recharge. 7.1 OVERVIEW OF EQUIVALENT DEWATERING ACTIVITIES IN THE SCHEFFERVILLE REGION Figure 13 illustrates the relationship between the drawdown and the required pumping rate for various direct shipping iron ore deposits that have been mined in the immediate vicinity of Schefferville. The graph shows that in order to achieve an equal drawdown, the French and Ruth Lake mines required a pumping effort three times greater than did the Gagnon and Wishart mines. The anticipated drawdown of the water table for the DSOP is not expected to exceed about 100 m. Based on historical data, the maximum pumping rate should be between 15 and 50 m3/min depending on the hydrogeological characteristics of the deposits. Field observations, the literature review on recharge areas and other relevant features suggest that the required pumping effort will be greater for DSO2 than for DSO3, where the recharge area and the storage structures of surface water are clearly smaller. The pumping test carried out at Ferriman 4 in the DSO2 sector indicates that the pumping rate required to draw down the water table by 100 m should be similar to that of about 50 m3/min applied at the French and Ruth Lake mines. The pumping rate for the deposits in the DSO3 sector should be similar to the 15 m3/min that was required at the Gagnon and Wishart mines.
20
Figure 13: Relationship between Pumping Rate and Level of Water Table in four Mines in the Schefferville Region (Taken from Stubbins and Munro, 1965)
7.2.4 Impacts of Dewatering DSO3 Sector The drainage network of this sector was greatly reduced by former mining activities. A stream rising close to the north-west end of Fleming 7 flows to the north-west end of Timmins 3 only to disappear a few hundred metres farther along. This stream would most likely be affected by the mining of Timmins 3 and Fleming 7N. The aquifer at Timmins 1 is at the point of convergence for the drainage network located downstream from it. Dewatering the deposits in the same drainage basin as Timmins 1 (Fleming 7 and Timmins 2, 3, 7 and 8) will have a negligible influence on the water balance in Timmins 1. The impact will be practically zero if the pumped water is discharged in the same drainage basin.
AKKAllncsjdc Maximum Pumping Rate (in G.P.M.)nccc
Maximum Pumping Rate (in G.P.M.)
Elev
atio
n of
Wat
er T
able
bel
ow In
itial
Lev
el (i
n fe
et)

21
8.0 MANAGEMENT OF GROUNDWATER DSO3 Sector The disposal of dewatering water will be planned so as not to transfer water from one hydrogeological basin to another. Based on that principle, the dewatering water from all of the deposits in DSO3, except for that from Timmins 4, which is located in another basin, will be pumped to the abandoned Timmins 2 pit along with the process water, other water that can no longer be recycled and the sump water from the floor of the operating mines. The dewatering water and the sump water from Timmins 4 will be disposed of in the abandoned Timmins 6 pit, which is located in the same hydrogeological basin. The foregoing strategy will allow the water pumped to rejoin the groundwater without significantly affecting the water balance in either of the basins.

22
9. DISPOSAL OF WASTE ROCK DSO3 Sector Hydrogeological considerations do not impose any restrictions on the disposal of waste rock. There is no resurgence of water that would exclude certain parts of the DSO3 sector as the site of waste rock piles. The hydrographic network in this sector is somewhat atrophied, with the result that the presence of waste rock piles cannot interfere with the recharge of aquifers by surface water.

23
10. CONCLUSIONS AND RECOMMENDATIONS DSO3 Sector The state of knowledge for this sector is limited to the literature review and the preliminary direct field observations. Additional work is needed to obtain complementary information on the hydrogeological parameters of the sector. A recommended first step would be to visit the sector and to make a list of the wells and drill holes that may remain from earlier activities. If dewatering wells have been preserved and are in good condition, they could perhaps be used for pumping tests. The DSO3 sector covers two drainage basins. As in the case of the DSO2 sector, the depth of the surface of the water table and the direction of flow of the groundwater should be confirmed by field measurements of the elevations of the level of the water in the observation wells and in abandoned pits that were excavated to below the level of the water table. Those measurements should be related by means of a survey to a common reference point. Since the abandoned Timmins 2 pit will be used to dispose of process water, it would also be important to know well the hydrogeological characteristics of the aquifer there and to establish the parameters of the movement of groundwater in this sector. We recommend undertaking the following activities in the 2009 field season in order to obtain the missing information:
• pumping tests to ascertain the hydrogeological characteristics of the aquifer in the rock;
• converting certain exploratory drill holes into observation wells; • surveying all the piezometers and the major water bodies in order to establish the
direction of the flow of the groundwater; • recording the water levels in the observation wells.
Signed Signed ___ __ __ __ __ __ __ __ __ __ __ __ __ __ __ __ __ __ __ __ __ __ __ __ __ _ ___ __ __ __ __ __ __ __ __ __ __ __ __ __ __ __ __ __ __ __ __ __ __ __ __ __ __ _
Abdel Mounem Benlahcen Ph.D. Gilles Fortin M. Sc. Hydrogeologist – Project Director Director, Environmental Engineering
24
11. LITERATURE CITED AMEC Earth & Environmental. January 2009. Fish and Fish Habitat Investigation for the Direct-Shipping Ore Project, New Millennium Capital Corp. Report No TF 8165902 Submitted to Groupe Hémisphères, 39 p. and 3 appendices Centre d'expertise en analyse environnementale du Québec (CEAQ), Guide d’échantillonnage à des fins d’analyses environnementales, 2008 www.ceaeq.gouv.qc.ca/documents/publications/guides_ech.htm Dimroth E, Rapport géologique no 193 de la région de la fosse du Labrador entre les latitudes 54o30’ et 56o30’, ministère des Richesses naturelles, Service de l’exploration géologique, 1978. Drake, J.J., Groundwater Chemistry in the Schefferville Quebec Iron Deposit, Catena, Vol 10, pp 149-158. Driscoll, D. G., Groundwater and Wells, Johnson Filtration System, 1989. Groupe Hémisphères. Mars 2009. Elross Lake Area Iron Ore Mine : Environmental Impact Statement for the Government of Newfounland and Labrador, Rapport préliminaire incluant en annexe les cartes des dépôts de surface de DSO2 et DSO3. Groupe Hémisphères. Décembre 2008. Reconnaissance de l’habitat du poisson le long de la voie ferrée et du chemin d’accès principal, projet DSO. Rapport technique soumis à New Millennium Capital Corp., 13 p. et 8 annexes Groupe Hémisphères. Octobre 2008. Cartographie des écosystèmes terrestres et des dépôts géologiques de surface: Projet DSO. Rapport technique préliminaire soumis à New Millennium Capital Corp. Groupe Hémisphère. Décembre 2008. Régime hydrique du lac Star du DSO2. Note de calcul interne livrée à Paul F. Wilkinson & Ass, 1 p. IOCC Technical Department, A Report on “Summary of the Permafrost Studies in the Schefferville Area”, May 1974. Kruseman G.P., Ridder N.A., Analysis and Evaluation of Pumping Test Data, 2000.

25
Mansikkaniemi, H., Measurement of Sediment Transport in the Schefferville Mining Area, Central Quebec-Labrador Peninsula. Kevo-Schefferville Subarctic Exchange Program 1978-1979. McGill Subarctic Research Station. MDDEP, Directions des politiques de l’eau, Guide de conception des installations de production d’eau potable, volume 1, 2007 MDDEP, Directions des politiques de l’eau, Directive 019 sur l’industrie minière, Envirodoq ENV/2005/0120, avril 2005. Mihalovic, G., Flemming #7 EXT: Permafrost and Water Table, Inter-Departmental Correspondence no 24-03-0001, March 14, 1980 Mihalovic, G., Timmins #7 : Permafrost and Water Table, Inter-Departmental Correspondence no 92-03-0002, March 14, 1980 Mihalovic, G., Timmins #4 Permafrost, Inter-Departmental Correspondence no 91-03-0012, April 8th, 1980 Nichols, L., Field Techniques for the Economic and Geotechnical Evaluation of Mining Property for Opencast Mine Design, Knob Lake, Quebec, Journal of Engineering Geology, Vol 1, 1968, pp. 169-180. Nichols, L., Hydrologic Balance of a Complex Drainage Area in New Quebec, Canada, M.Sc. Thesis, Syracuse University, Syracuse, N.Y., 1966 Rapports de forages d’exploration géologique, New Millennium Capital Corporation, 2008. Séguin, M.K., Permafrost Distribution on the Timmins #7 Deposit (Schefferville), Geotechnical Engineering Department of IOCC, July 1979. Stubbins, J. B. and P. Munro. 1965. Open Pit Mine Dewatering – Knob Lake. The Canadian Institute of Mining and Metallurgy Bulletin, 58:814-822. Tomlinson, Foundation Design and Construction. Pitman, 1963, pp 645-689 Wardle, R.J., Geology of the South-Central Labrador Trough, Gov. of Canada, 1982

APPENDIX G
Survey of Fish Habitat along the Railway Line and Main Access Road, DSO Project

DIRECT-SHIPPING ORE PROJECT
Survey of Fish Habitat along the Railway Line and Main
Access Road, DSO Project
Technical Report
BY: Groupe Hémisphères inc.
November 2008
NEW MILLENNIUM CAPITAL CORP.
SURVEY OF FISH HABITAT ALONG THE RAILWAY LINE AND MAIN ACCESS ROAD, DSO PROJECT TECHNICAL REPORT, VERSION 01, NOVEMBER 20, 2008
i
PROJECT TEAM New Millennium Capital Corporation
Roy Logan Logistics coordinator, Schefferville
Groupe Hémisphères
Simon Chartrand Applied ecology technician Daniel Néron Geographer, M.Sc., project leader Mathieu Charrette Biologist, M.Sc. Biol. Julie Tremblay Biologist, B.Sc. Biol., certificate in geomatics Marie-Ève Dion Biologist, M.Sc. Env. Ashini Goupil Enr. Michel Ashini-Goupil Civil-engineering technician
Recyclable and made of 55% recycled paper This report can be cited as follows: Groupe Hémisphères (2008) Survey of Fish Habitat along the Railway Line and Main Access Road. Technical Report
prepared for New Millennium Capital Corp. 12 p. and 8 appendices
SURVEY OF FISH HABITAT ALONG THE RAILWAY LINE AND MAIN ACCESS ROAD, DSO PROJECT TECHNICAL REPORT, VERSION 01, NOVEMBER 20, 2008
ii
TABLE OF CONTENTS PROJECT TEAM…………………………………………………………………………………………………………….. i LIST OF TABLES…………………………………………………………………………………………………………… iii LIST OF FIGURES………………………………………………………………………………………………………..... iv LIST OF APPENDICES…………………………………………………………………………………………………….. v LIST OF ABBREVIATIONS AND SYMBOLS …………………………………………………………………………… vi 1 INTRODUCTION………………………………………………………………………………………………….. 1 1.1 Background……………………………………………………………………………………………… 1 1.2 Mandate and Objectives………………………………………………………………… ………….. 1 2 METHODOLOGY……………………………………………………………………………………....…………. 2 2.1 Sampling of Streams……………………………………………………………………………………. 2 2.2 Survey Schedule ………………………………………………………………………………………... 2 2.3 Fish Habitat and Use Survey…………………………………………………….................………... 2 3 RESULTS………………………………………………………………………………………………………….. 3 3.1 General Description of the Study Area……………………………………………………………….. 3 3.2 Description of Sampling Stations……………………………………………………………………… 3 3.3 Summary of the Survey……………………………………………………………………………….. 10 4 CONCLUSION…………………………………………………………………………………………….……... 12 5 REFERENCES…………………………………………………………………………………………........….. 12 APPENDICES

SURVEY OF FISH HABITAT ALONG THE RAILWAY LINE AND MAIN ACCESS ROAD, DSO PROJECT TECHNICAL REPORT, VERSION 01, NOVEMBER 20, 2008
iii
LIST OF TABLES Table 1. Coordinates of the sampling stations: RLC and AR.................................................................................. 5 Table 2. Streams with potential fish habitat and types of obstacle found ............................................................. 11
SURVEY OF FISH HABITAT ALONG THE RAILWAY LINE AND MAIN ACCESS ROAD, DSO PROJECT TECHNICAL REPORT, VERSION 01, NOVEMBER 20, 2008
iv
LIST OF FIGURES
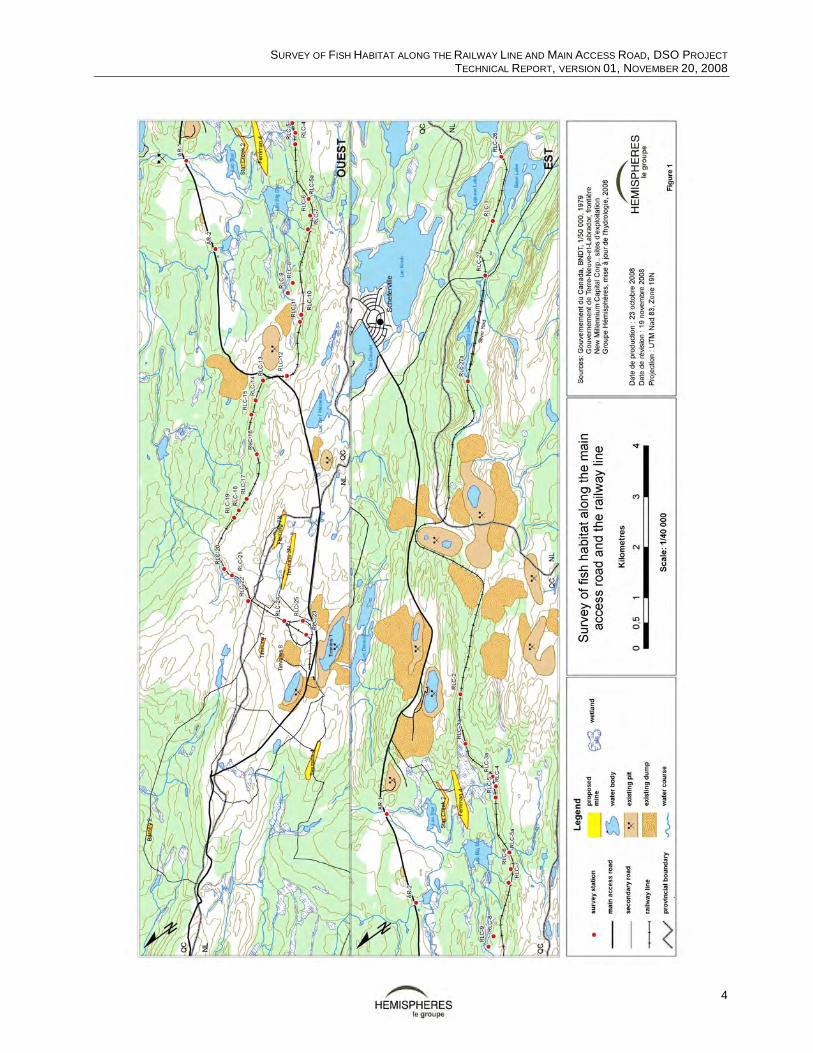
Figure 1. Survey of fish habitat along the main access road and the railway line............................................... 4
SURVEY OF FISH HABITAT ALONG THE RAILWAY LINE AND MAIN ACCESS ROAD, DSO PROJECT TECHNICAL REPORT, VERSION 01, NOVEMBER 20, 2008
v
LIST OF APPENDICES Appendix I Field Photographs Appendix II Field sheet used to characterize fish habitat Appendix III Types of streams and water quality Appendix IV Stream hydrology Appendix V Substrate composition Appendix VI Composition of plant cover Appendix VII June 2008 culvert study Appendix VIII Description of channel patterns used to characterize the streams
SURVEY OF FISH HABITAT ALONG THE RAILWAY LINE AND MAIN ROAD, DSO PROJECT TECHNICAL REPORT, VERSION 01, NOVEMBER 20, 2008
vi
LIST OF ABBREVIATIONS AND SYMBOLS AR Culvert along the main access road 0C Celsius µg/L Microgram per litre µmhos/cm Micromhos per centimetre IOC Iron Ore Company of Canada km Kilometre km2 Square kilometre L Litre THE NHWL Natural high water line m Metre m3/s Cubic metres per second m/s Metre per second NML New Millennium Capital Corp. NTU Standard unit of measure of turbidity pH Unit of measure of the acid or alkaline condition of a substance RLC Culvert along the railway line
N.B. This final technical report takes into account the changes made to Table 2 on 23 December, 2008.
REVISION AND PUBLICATION
Number Date Modification or detail of publication
00 2008-11-11 Preliminary technical report 01 2008-11-20 Final technical report

SURVEY OF FISH HABITAT ALONG THE RAILWAY LINE AND MAIN ACCESS ROAD, DSO PROJECT TECHNICAL REPORT, VERSION 01, NOVEMBER 20, 2008
1
1 INTRODUCTION
1.1 Background
The price of iron ore has considerably increased since 2002, making it profitable to develop the Millennium Iron Range, located in the Schefferville region. The Direct-Shipping Ore Project (DSOP) is one of three initiatives undertaken by New Millennium Capital Corp (NML). Its goal is the production of direct-shipping ore. The first phase involves the mining of two sectors (DSO 2 and DSO 3), located partly in Québec and partly in Labrador. The second phase will involve the mining of sector DSO 4, also located partly in Québec and partly in Labrador. The yearly tonnage for phase 2, however, has not been established to date. Two of these three sectors (DSO 2 and DSO 3) have been partially developed by the Iron Ore Company of Canada (IOC), which means that their biophysical environment was somewhat disturbed. For its part, the third sector, DSO 4, has remained more natural and kept its integrity. In both phases of the DSOP, the ore will be transported by train, which requires upgrading an abandoned section of the railway. 1.2 Mandate and Objectives
Physical modifications to the riparian habitat represent a source of pressure that contributes to the deterioration of the habitat of fish communities (Smokorowski and Pratt, 2007). Smokorowski and Pratt (2007) believe there is a direct link between the habitat and the abundance or biomass of fish. According to DFO (2008a), it is important to protect the habitat that provides fish with healthy waters, spawning and fry-rearing grounds, an adequate supply of food and unblocked migration paths. Given that brook trout (Salvelinus fontinalis) is very common in Labrador, according to DFO (2008b), its habitat must be characterized in this study. DFO (2008a) identifies "fish habitat" as "places that supply fish with their life cycle requirements for food, shelter, reproduction and movement." It is in this context that a characterization study of fish habitat in the streams that will be crossed by the NML project infrastructure was conducted in the sectors to be mined during phase 1 of the DSOP. The fish habitat survey was carried out along an abandoned railway line between Timmins 1 and Mile 353 of the existing railway linking Schefferville and Sept-Îles. Excluding the twinning of tracks in the vicinity of Lake Slimy, the survey ranged over 27.83 km. The fish habitat survey was also carried out over 21 km along the main access road linking Schefferville and the DSOP Timmins 1 area. It should be noted that the railway was used by IOC until 1982. Except for the rails and ties, most of the railroad infrastructure is already in place and in good condition. The methodology is similar to that used by AMEC in the fish habitat survey carried out in 2008 for the mine sites of the DSOP and its access roads (AMEC, 2008), as well as in the survey of stream crossings carried out in 2005 for the LabMag project (AMEC, 2005).
SURVEY OF FISH HABITAT ALONG THE RAILWAY LINE AND MAIN ACCESS ROAD, DSO PROJECT TECHNICAL REPORT, VERSION 01, NOVEMBER 20, 2008
2
2 METHODOLOGY
2.1 Sampling of Streams
Federal maps at a scale of 1/50 000 indicated over 30 possible stream crossings along the abandoned railway line. The goal was to find all culverts crossing this right-of-way and to proceed with their characterization. When a stream was found, a description of the fish habitat quality was carried out both downstream and upstream of each crossing point. The upstream and downstream sampling sites jointly constituted a sampling station. Streams were sampled as follows: a 12-channel GPS with an activated WAAS function was used to determine the locations of the sampling station and the sampling points; and the nature of the substrate and the hydrological conditions were noted (see the field sheet in Appendix II). All the streams shown on the map were visited. This report refers, however, to the visit to all culverts, whether or not a flowing stream was found.
2.2 Survey Schedule
The first part of the work took place on June 18, 2008, when Roy Logan carried out a survey of the condition of the culverts (Appendix VII). At that time, the various locations where culverts could be found along the existing track right-of-way were visited and numbered RLC-1 to RLC-27 (RLC; Railway Culvert). The second part of the work took place between July 17 and 20, 2008, when Daniel Néron conducted a survey of all the access roads. Two stream crossings were identified as AR1 and AR2 (AR; Access Road). The third part of the work took place between September 14 and 16, 2008, when Simon Chartrand and Michel Ashini-Goupil carried out the fish habitat survey. Roy Logan toured the study area with them. The letter (a) refers to streams that were not listed by Roy Logan at the time.
2.3 Fish Habitat and Use Survey
It is important to note that any discussion of fish in this report refers mainly to brook trout habitat because this species can be assumed to be the most abundant in the region, particularly at higher elevations. The fish habitat survey consisted in estimating the hydraulic radius of a stream by measuring its width and mean depth, flow velocity, substrate composition and quality, bank and shoreline vegetation (type, dominant species and cover), as well as its integrity. A Global Flow Probe FP101 water velocity meter (0.01m/s) was used randomly at three points along the hydraulic radius (1/3, 1/2 and 2/3) to assess the velocity of the stream at a given point. Distances were measured with a 30 m measuring tape, while a Suunto clinometer was used to assess the slope of the stream stretches. Appendix VIII describes the channel patterns used for this study, which were for the most part the same as those established by Malavoi (1989). In summary, streams are divided into seven channel patterns: pool, cascade, channel with uniform bed, waterfall, step-pool, rapids and pool riffles. Finally, some physical and chemical baseline data were recorded during this survey, namely water temperature (°C), dissolved oxygen (mg/l), conductivity (µS/cm), turbidity (NTU) and pH (unit). The meteorological conditions prevailing at the time of the survey were also noted, including air temperature and cloud cover.
SURVEY OF FISH HABITAT ALONG THE RAILWAY LINE AND MAIN ACCESS ROAD, DSO PROJECT TECHNICAL REPORT, VERSION 01, NOVEMBER 20, 2008
3
3 RESULTS
3.1 General Description of the Study Area
The study area is located north of the Town of Schefferville (Figure 1). It extends some 25 km on a north-west/south-east axis. It is located at the interfluve between the Howells River valley to the west and a lacustrine zone to the east. On this axis, it follows the watershed and consequently goes back and forth across the Québec/Labrador inter-provincial border. The elevation varies from 500 to 790 m, the northern part of the study area being generally more elevated. In its southern part, which corresponds to the DSO 2 sector, the study area is mainly characterized by open forest vegetation, such as spruce stands with mosses or lichens. Most summits are characterized by alpine vegetation (tundra). Some small lakes and wetlands, such as ponds and fens, are found in this part of the study area. Its northern part, which corresponds to the DSO 3 sector, is more elevated, less forested and much dryer. Both parts contain old mining sites with wide, deep and steep-sided trenches, waste rock piles, stripped zones and numerous secondary roads.
3.2 Description of Sampling Stations
This section presents the results and data interpretation obtained for each sampling station. Figure 1 shows the stations divided in two groups: RLC and AR. Appendix I contains photographs of each site. Appendix II lists the physical and chemical parameters of the streams. The types of streams and water quality data are shown in Appendix III, while Appendix IV presents data on stream hydrology. Appendix V shows the substrate composition for each station, while the composition of the plant cover is described in Appendix VI. The survey of stream crossings carried out by Roy Logan is reproduced in Appendix VII. Table 1 gives an overview of the sampling stations and their geographical coordinates, while Table 2 shows the stream crossings with potential fish habitat and indicates the types of obstacles.
SURVEY OF FISH HABITAT ALONG THE RAILWAY LINE AND MAIN ACCESS ROAD, DSO PROJECT TECHNICAL REPORT, VERSION 01, NOVEMBER 20, 2008
4
SURVEY OF FISH HABITAT ALONG THE RAILWAY LINE AND MAIN ACCESS ROAD, DSO PROJECT TECHNICAL REPORT, VERSION 01, NOVEMBER 20, 2008
5
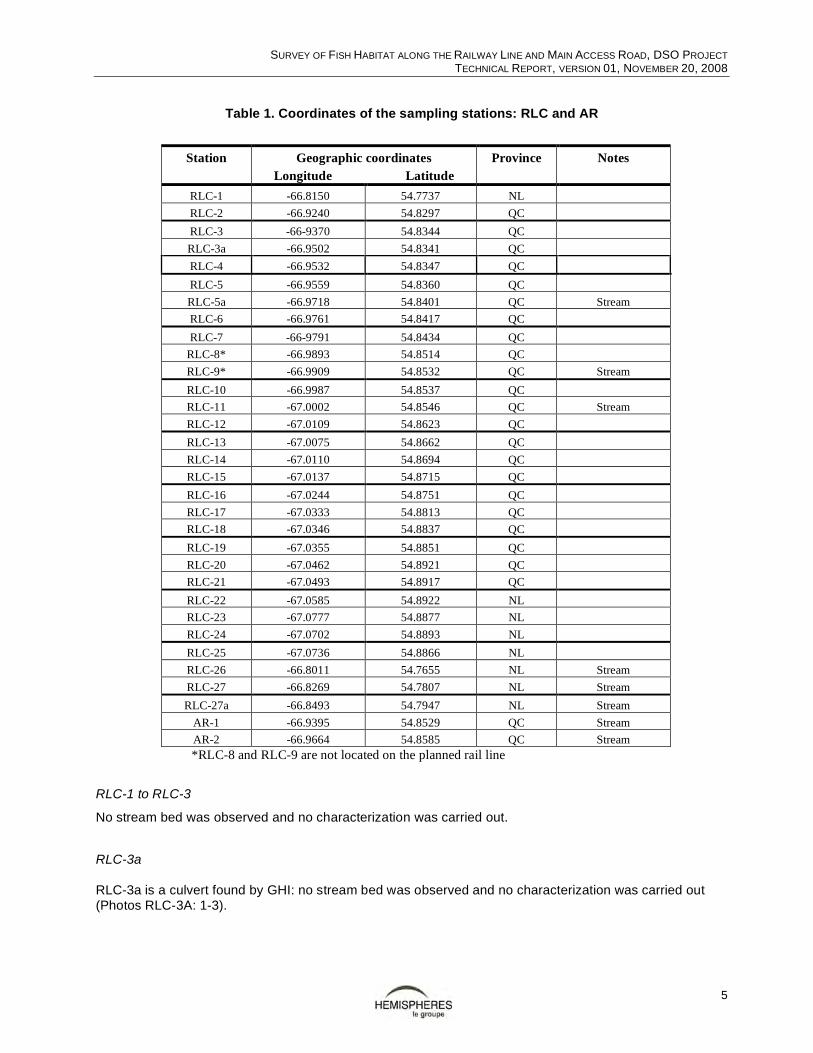
Table 1. Coordinates of the sampling stations: RLC and AR
Station Geographic coordinates
Longitude Latitude Province Notes
RLC-1 -66.8150 54.7737 NL RLC-2 -66.9240 54.8297 QC RLC-3 -66-9370 54.8344 QC RLC-3a -66.9502 54.8341 QC RLC-4 -66.9532 54.8347 QC RLC-5 -66.9559 54.8360 QC RLC-5a -66.9718 54.8401 QC Stream RLC-6 -66.9761 54.8417 QC RLC-7 -66-9791 54.8434 QC
RLC-8* -66.9893 54.8514 QC RLC-9* -66.9909 54.8532 QC Stream RLC-10 -66.9987 54.8537 QC RLC-11 -67.0002 54.8546 QC Stream RLC-12 -67.0109 54.8623 QC RLC-13 -67.0075 54.8662 QC RLC-14 -67.0110 54.8694 QC RLC-15 -67.0137 54.8715 QC RLC-16 -67.0244 54.8751 QC RLC-17 -67.0333 54.8813 QC RLC-18 -67.0346 54.8837 QC RLC-19 -67.0355 54.8851 QC RLC-20 -67.0462 54.8921 QC RLC-21 -67.0493 54.8917 QC RLC-22 -67.0585 54.8922 NL RLC-23 -67.0777 54.8877 NL RLC-24 -67.0702 54.8893 NL RLC-25 -67.0736 54.8866 NL RLC-26 -66.8011 54.7655 NL Stream RLC-27 -66.8269 54.7807 NL Stream RLC-27a -66.8493 54.7947 NL Stream
AR-1 -66.9395 54.8529 QC Stream AR-2 -66.9664 54.8585 QC Stream
*RLC-8 and RLC-9 are not located on the planned rail line
RLC-1 to RLC-3
No stream bed was observed and no characterization was carried out.
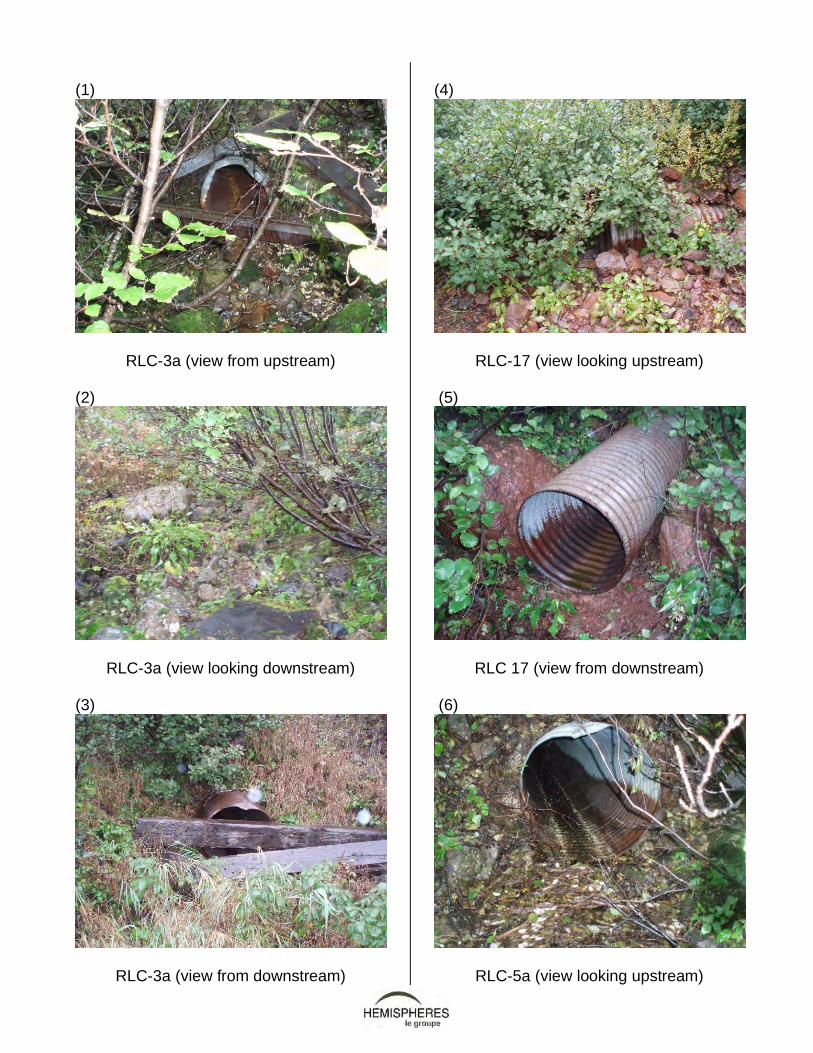
RLC-3a RLC-3a is a culvert found by GHI: no stream bed was observed and no characterization was carried out (Photos RLC-3A: 1-3).
SURVEY OF FISH HABITAT ALONG THE RAILWAY LINE AND MAIN ACCESS ROAD, DSO PROJECT TECHNICAL REPORT, VERSION 01, NOVEMBER 20, 2008
6
RLC-4, RLC-5 No stream bed was observed and no characterization was carried out. There might be some flow during snowmelt.
RLC-5a
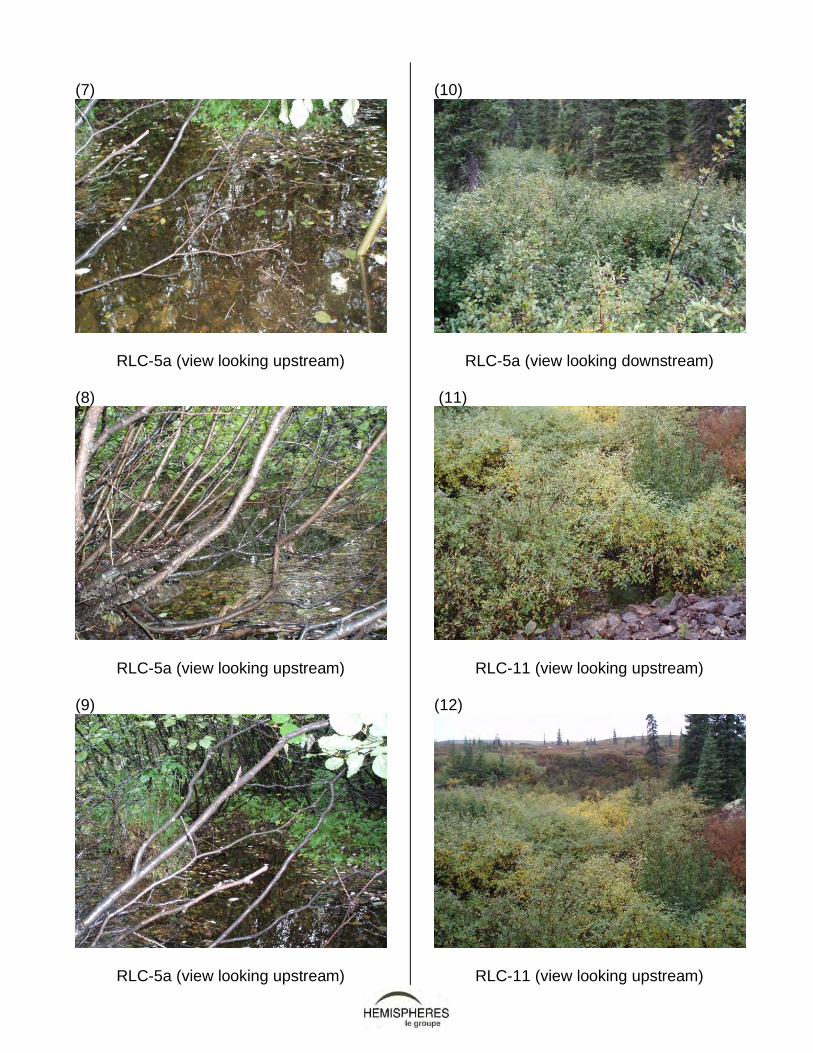
RLC-5a is a culvert found by GHI. The characterization of this station was carried out at two points, one in the upstream segment and the other in a segment of the channel with a uniform bed downstream from the culvert. RLC-5a has a flow of 0.02 m3/s, a mean velocity varying from 0.01 to 0.07 m/s, and a mean depth of 0.21 m. The wet width is 1.10 m upstream and 4.50 m downstream. However, the width at the NHWL is 10.15 m, and this line is located 0.80 m above the normal water level. The substrate is made up mainly of gravel and pebbles (55%) and organic matter (20%). Blocks (or coarse substrate) cover 15% of the stream bottom, and sand (or fine substrate) covers 10%. The slope of the segment varies from 1to 2%. The physical and chemical values of the stream are as follows: temperature of 10.4°C, pH of 6.7, conductivity of 5 µmhos/cm and turbidity of 0.83 NTU (Photos RLC-5a: 6-10). The study of the vegetation shows that this station is characterized by a plant cover of the shrubland and open forest type. The overhanging vegetation is dominated by the shrub layer; 43% of the riparian vegetation consists of the shrub layer, while 10 to 15% is made up of arboreous, herbaceous and moss layers. There is no aquatic vegetation. A great deal of organic matter has accumulated upstream and downstream from the culvert where an obstacle is causing this material to jam. A high-intensity disturbance is caused by the use of the railway bed as a roadway and by the culvert that restricts the flow of the stream. No fish were observed in this segment, but the data collected indicate that it is a probable fish habitat.
RLC-6 to RLC-10
No stream bed was observed and no characterization was carried out. There might be some flow during snowmelt. It should be noted that stations RLC-8 and RLC-9 are considered to be outside the scope of this study since they are located on a secondary branch of the railroad that will not be rebuilt.
RLC-11
The characterization of this station was carried out at two points, one upstream and one downstream from the culvert. A series of waterfalls and rapids was noted upstream, and a cascade is present downstream. The waterfall and the cascade constitute a natural obstacle that impedes fish movements. RLC-11 has a flow varying from 0.73 to 1.41 m3/s, a mean velocity varying from 0.37 to 0.53 m/s, and a mean depth varying from 0.33 to 0.38 m. The wet width varies from 1.00 to 1.60 m. The width at the NHWL, however, is 10 m upstream and 4.20 m downstream, with the height of the NHWL above the normal water level varying between 1.20 and 1.40 m. The substrate is composed mainly of gravel and pebbles (80%) and organic matter (10%). At this station, the slope of the segment is 5%. The physical and chemical values of the stream are as follows: temperature of 5.6°C, pH of 7.4, conductivity of 77 µmhos/cm and a turbidity indicating fairly clear water with 0.66 NTU (Photos RLC-11: 11-16). The study of the vegetation shows that this station is characterized by plant cover of the shrubland type and that there is no aquatic vegetation. The riparian vegetation is dominated by the moss layer (80%), whereas the overhanging vegetation is made up of a shrub layer. No fish were observed in this segment, but the data collected indicate that it is a probable fish habitat.
SURVEY OF FISH HABITAT ALONG THE RAILWAY LINE AND MAIN ACCESS ROAD, DSO PROJECT TECHNICAL REPORT, VERSION 01, NOVEMBER 20, 2008
7
RLC-12 to RLC-16
No stream bed was observed and no characterization was carried out. There might be some flow during snowmelt.
RLC-17
No stream bed or water is associated with this culvert. No characterization was carried out (Photos RLC-17: 11-16).
RLC-18 to RLC-25
No stream bed was observed and no characterization was carried out. There might be some flow during snowmelt. RLC-26
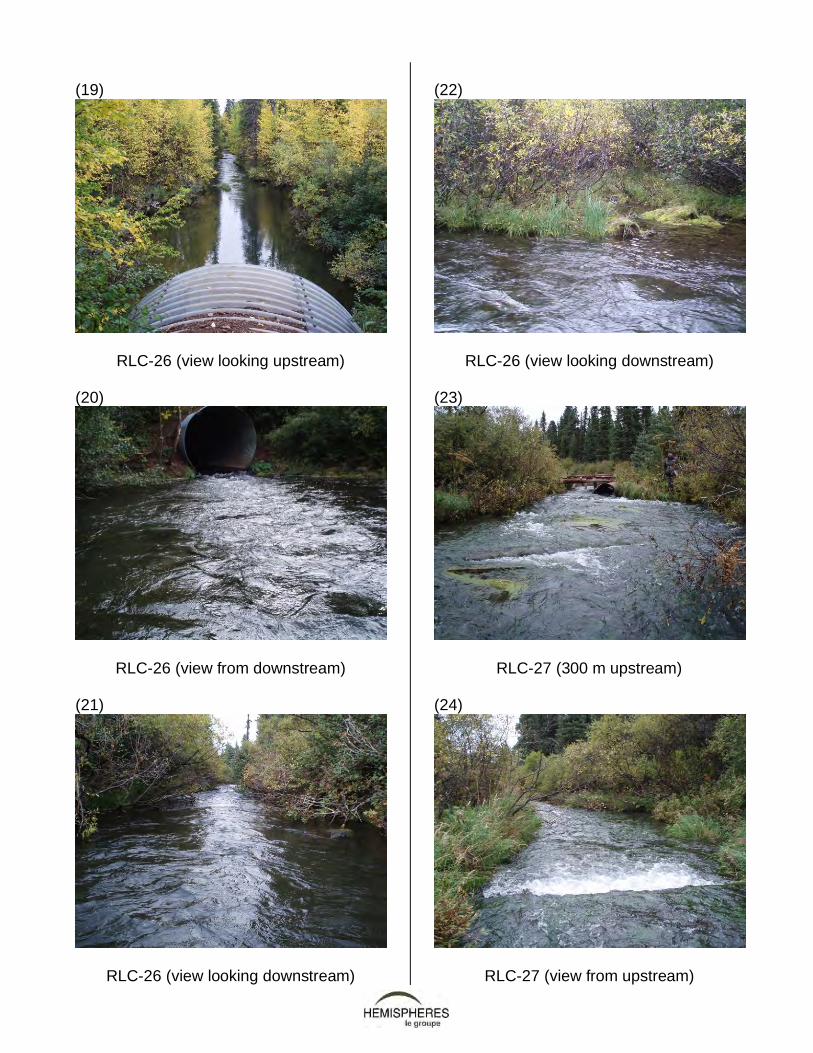
The characterization of this station was carried out at two points, i.e. in pool-riffle segments upstream and downstream from the culvert. Downstream from this station, the stream flows into Bean Lake, Lejeune Lake and Abel Lake. RLC-26 has a flow varying from 0.88 to 4.72 m3/s, a mean velocity varying from 0.30 to 0.54 m/s, and a mean depth varying from 0.35 to 0.42 m. The wet width varies from 6 to 7 m. The width at the NHWL, however, is 7 m upstream and 25 m downstream, with the height above the normal water level varying between 0.30 and 0.60 m. From 55 to 80% of the bottom is covered by a medium substrate (pebbles and gravel). A fine substrate (sand) covers between 5 and 20%, and a coarse substrate (blocks) between 10 and 15%. The slope of this segment varies from 1 to 2% at this station. The physical and chemical values of the stream are as follows: temperature of 9.6°C, pH of 7.4, conductivity of 152 µmhos/cm (Photos RLC-26: 17-22). The study of the vegetation shows that this station is characterized by a plant cover of the treeland type downstream and the closed forest type upstream. The riparian vegetation is composed for the most part of shrub and herbaceous strata, whereas the overhanging vegetation is dominated by the shrub layer. Submerged plants constitute 10 to 30% of the aquatic vegetation. Fish were observed in this segment (unconfirmed species). It is therefore a potential spawning ground for brook trout. Michel Ashini-Goupil, who is from Schefferville, knows it as a fishing ground. Consequently, this station should be considered a confirmed, important fish habitat.
RLC-27
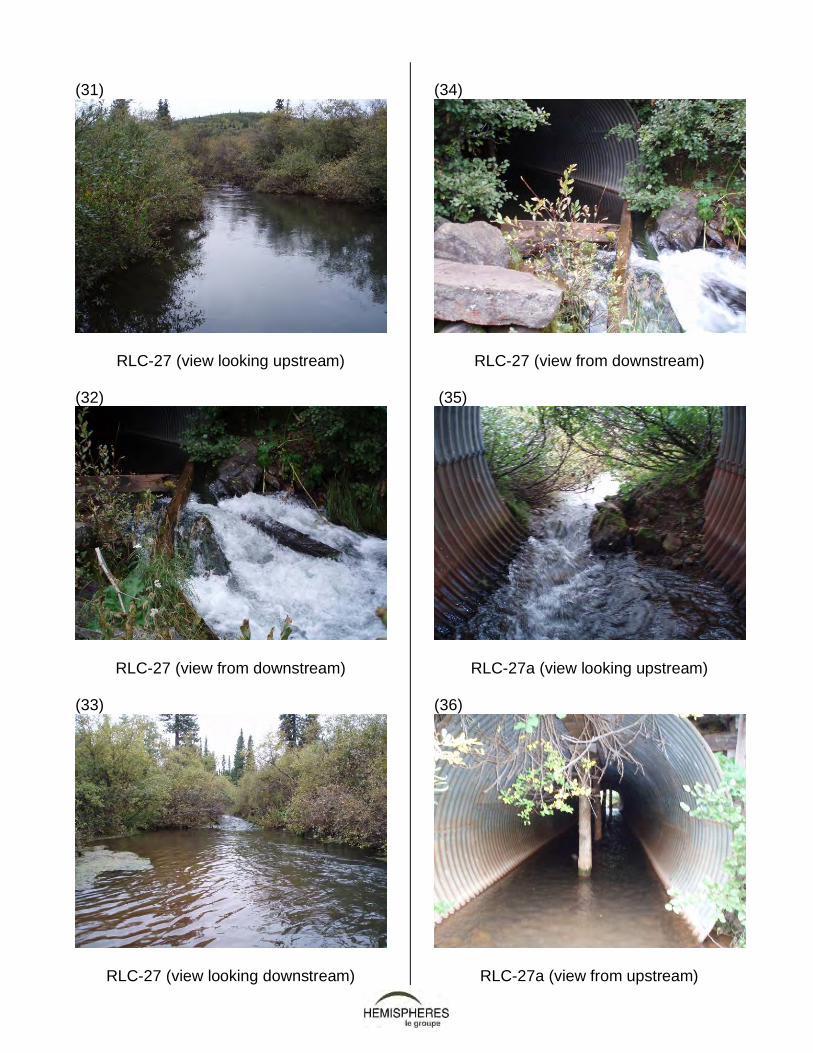
Three sampling points, two downstream and one upstream, were measured on this stream. The characterization of the upstream point was carried out in a section that included a cascade and a pool. The characterization of the downstream stations was carried out in two sections of rapids and in a cascade section. RLC-27 has a flow varying from 1.23 to 4.86 m3/s, a mean velocity varying from 0.15 to 1.05 m/s, and a mean depth varying from 0.26 to 0.42 m. The wet width varies from 3.60 to 7 m. The width at the NHWL, however, varies between 15 and 30 m, with the height of the NHWL above the normal water level varying between 0.5 and 0.8 m. From 20 to 75% of the bottom is covered by a medium substrate (pebbles and gravel). A fine substrate (sand) covers between 5 and 30%, and a coarse substrate (blocks) between 5 and 70%. The substrate is also made up of organic matter that covers between 5 and 10%. The slope of this segment varies from 1 to 2% at this station. The physical and chemical values of the stream are as follows: temperature of 8.3°C, pH of 8.1, conductivity of 144 µmhos/cm and turbidity of 3.60 NTU (Photos RLC-27:
SURVEY OF FISH HABITAT ALONG THE RAILWAY LINE AND MAIN ACCESS ROAD, DSO PROJECT TECHNICAL REPORT, VERSION 01, NOVEMBER 20, 2008
8
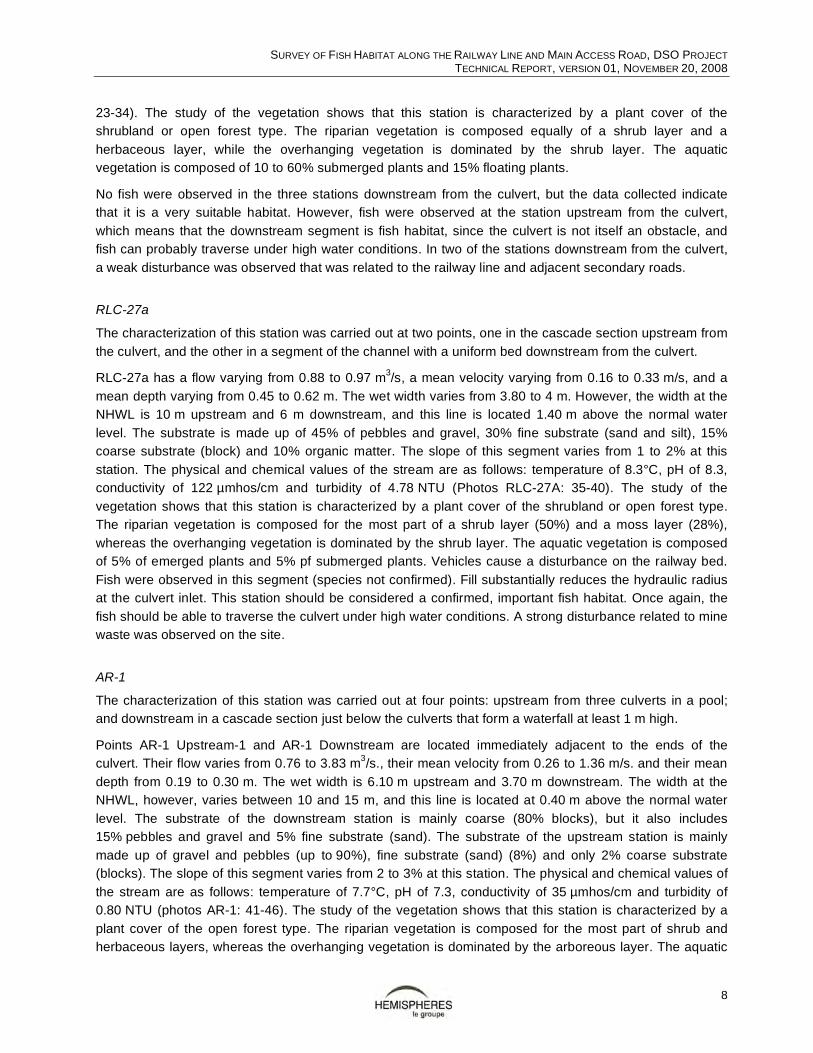
23-34). The study of the vegetation shows that this station is characterized by a plant cover of the shrubland or open forest type. The riparian vegetation is composed equally of a shrub layer and a herbaceous layer, while the overhanging vegetation is dominated by the shrub layer. The aquatic vegetation is composed of 10 to 60% submerged plants and 15% floating plants. No fish were observed in the three stations downstream from the culvert, but the data collected indicate that it is a very suitable habitat. However, fish were observed at the station upstream from the culvert, which means that the downstream segment is fish habitat, since the culvert is not itself an obstacle, and fish can probably traverse under high water conditions. In two of the stations downstream from the culvert, a weak disturbance was observed that was related to the railway line and adjacent secondary roads.
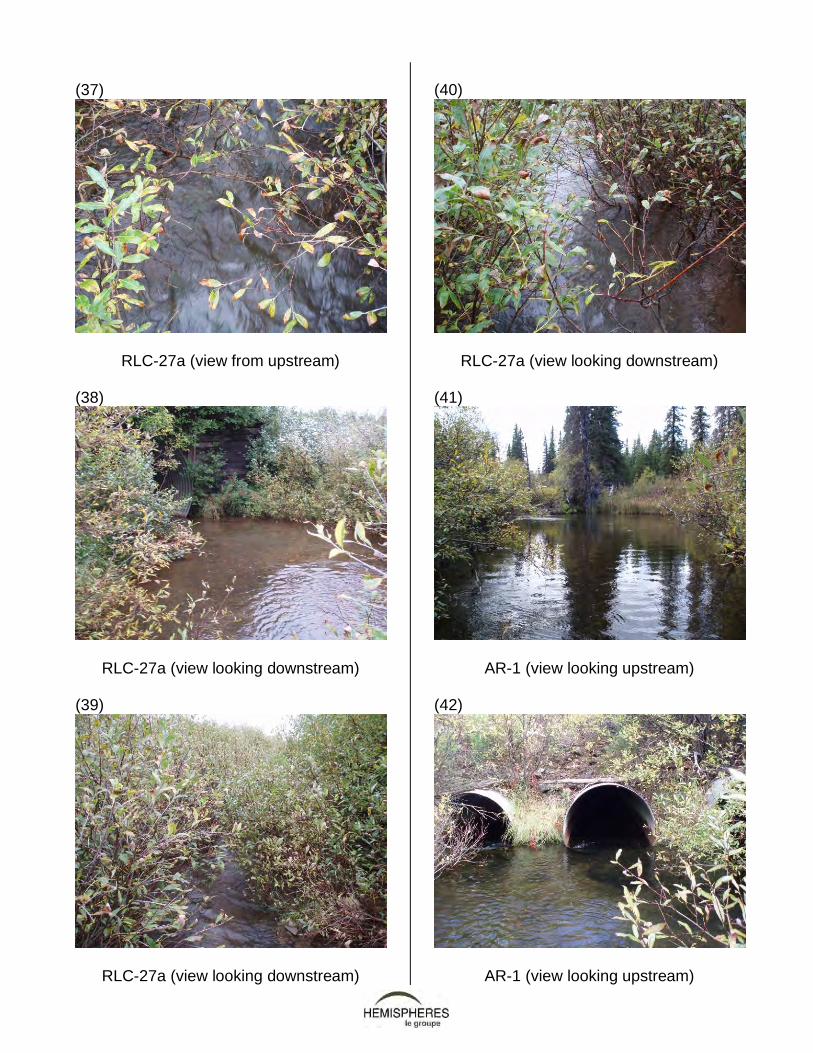
RLC-27a
The characterization of this station was carried out at two points, one in the cascade section upstream from the culvert, and the other in a segment of the channel with a uniform bed downstream from the culvert. RLC-27a has a flow varying from 0.88 to 0.97 m3/s, a mean velocity varying from 0.16 to 0.33 m/s, and a mean depth varying from 0.45 to 0.62 m. The wet width varies from 3.80 to 4 m. However, the width at the NHWL is 10 m upstream and 6 m downstream, and this line is located 1.40 m above the normal water level. The substrate is made up of 45% of pebbles and gravel, 30% fine substrate (sand and silt), 15% coarse substrate (block) and 10% organic matter. The slope of this segment varies from 1 to 2% at this station. The physical and chemical values of the stream are as follows: temperature of 8.3°C, pH of 8.3, conductivity of 122 µmhos/cm and turbidity of 4.78 NTU (Photos RLC-27A: 35-40). The study of the vegetation shows that this station is characterized by a plant cover of the shrubland or open forest type. The riparian vegetation is composed for the most part of a shrub layer (50%) and a moss layer (28%), whereas the overhanging vegetation is dominated by the shrub layer. The aquatic vegetation is composed of 5% of emerged plants and 5% pf submerged plants. Vehicles cause a disturbance on the railway bed. Fish were observed in this segment (species not confirmed). Fill substantially reduces the hydraulic radius at the culvert inlet. This station should be considered a confirmed, important fish habitat. Once again, the fish should be able to traverse the culvert under high water conditions. A strong disturbance related to mine waste was observed on the site.
AR-1
The characterization of this station was carried out at four points: upstream from three culverts in a pool; and downstream in a cascade section just below the culverts that form a waterfall at least 1 m high. Points AR-1 Upstream-1 and AR-1 Downstream are located immediately adjacent to the ends of the culvert. Their flow varies from 0.76 to 3.83 m3/s., their mean velocity from 0.26 to 1.36 m/s. and their mean depth from 0.19 to 0.30 m. The wet width is 6.10 m upstream and 3.70 m downstream. The width at the NHWL, however, varies between 10 and 15 m, and this line is located at 0.40 m above the normal water level. The substrate of the downstream station is mainly coarse (80% blocks), but it also includes 15% pebbles and gravel and 5% fine substrate (sand). The substrate of the upstream station is mainly made up of gravel and pebbles (up to 90%), fine substrate (sand) (8%) and only 2% coarse substrate (blocks). The slope of this segment varies from 2 to 3% at this station. The physical and chemical values of the stream are as follows: temperature of 7.7°C, pH of 7.3, conductivity of 35 µmhos/cm and turbidity of 0.80 NTU (photos AR-1: 41-46). The study of the vegetation shows that this station is characterized by a plant cover of the open forest type. The riparian vegetation is composed for the most part of shrub and herbaceous layers, whereas the overhanging vegetation is dominated by the arboreous layer. The aquatic
SURVEY OF FISH HABITAT ALONG THE RAILWAY LINE AND MAIN ACCESS ROAD, DSO PROJECT TECHNICAL REPORT, VERSION 01, NOVEMBER 20, 2008
9
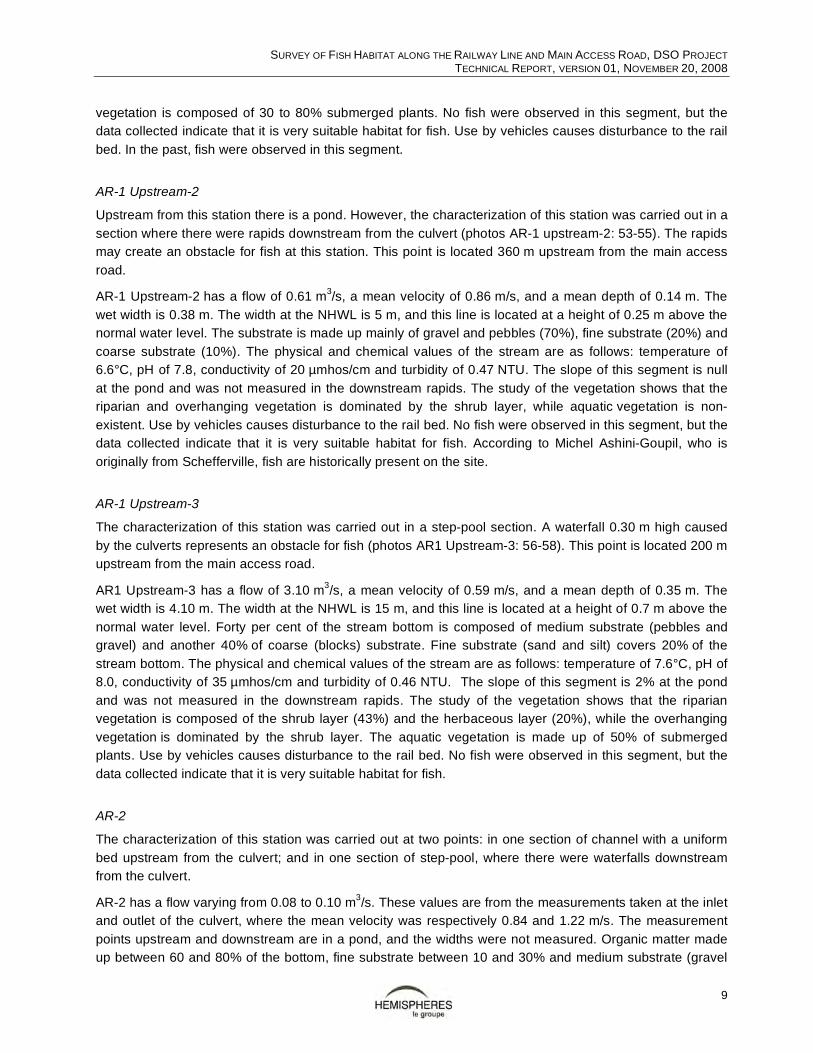
vegetation is composed of 30 to 80% submerged plants. No fish were observed in this segment, but the data collected indicate that it is very suitable habitat for fish. Use by vehicles causes disturbance to the rail bed. In the past, fish were observed in this segment.
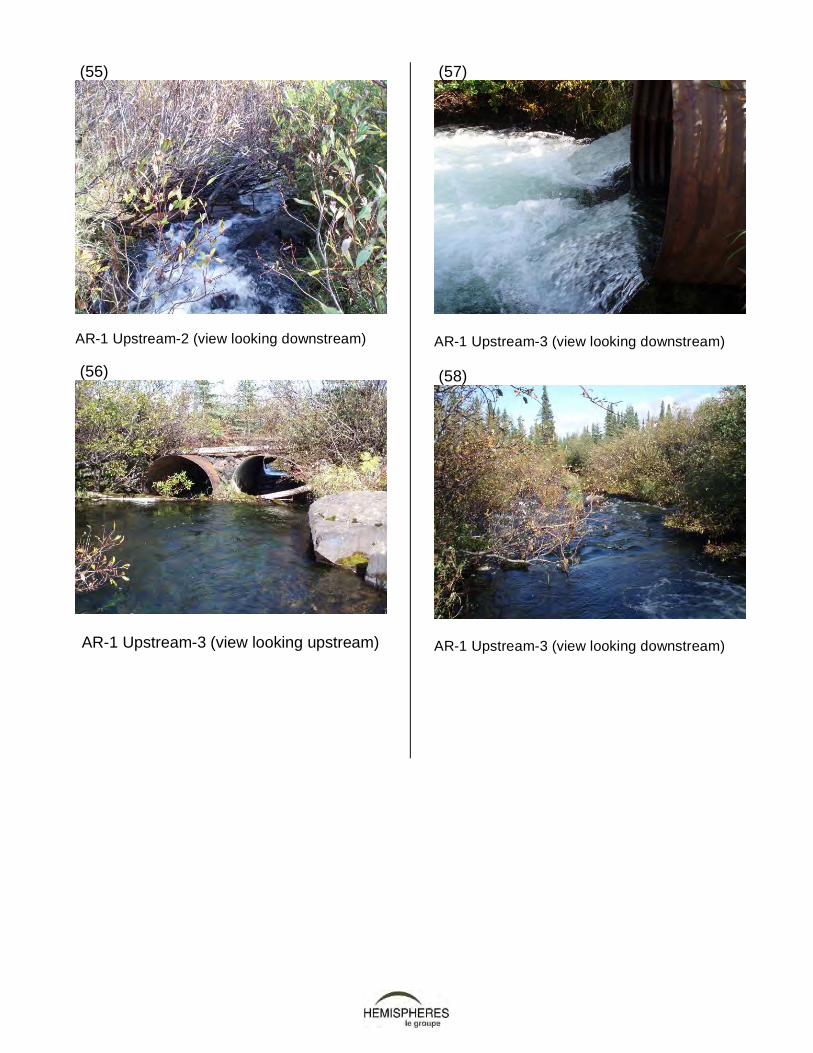
AR-1 Upstream-2
Upstream from this station there is a pond. However, the characterization of this station was carried out in a section where there were rapids downstream from the culvert (photos AR-1 upstream-2: 53-55). The rapids may create an obstacle for fish at this station. This point is located 360 m upstream from the main access road. AR-1 Upstream-2 has a flow of 0.61 m3/s, a mean velocity of 0.86 m/s, and a mean depth of 0.14 m. The wet width is 0.38 m. The width at the NHWL is 5 m, and this line is located at a height of 0.25 m above the normal water level. The substrate is made up mainly of gravel and pebbles (70%), fine substrate (20%) and coarse substrate (10%). The physical and chemical values of the stream are as follows: temperature of 6.6°C, pH of 7.8, conductivity of 20 µmhos/cm and turbidity of 0.47 NTU. The slope of this segment is null at the pond and was not measured in the downstream rapids. The study of the vegetation shows that the riparian and overhanging vegetation is dominated by the shrub layer, while aquatic vegetation is non-existent. Use by vehicles causes disturbance to the rail bed. No fish were observed in this segment, but the data collected indicate that it is very suitable habitat for fish. According to Michel Ashini-Goupil, who is originally from Schefferville, fish are historically present on the site.
AR-1 Upstream-3
The characterization of this station was carried out in a step-pool section. A waterfall 0.30 m high caused by the culverts represents an obstacle for fish (photos AR1 Upstream-3: 56-58). This point is located 200 m upstream from the main access road. AR1 Upstream-3 has a flow of 3.10 m3/s, a mean velocity of 0.59 m/s, and a mean depth of 0.35 m. The wet width is 4.10 m. The width at the NHWL is 15 m, and this line is located at a height of 0.7 m above the normal water level. Forty per cent of the stream bottom is composed of medium substrate (pebbles and gravel) and another 40% of coarse (blocks) substrate. Fine substrate (sand and silt) covers 20% of the stream bottom. The physical and chemical values of the stream are as follows: temperature of 7.6°C, pH of 8.0, conductivity of 35 µmhos/cm and turbidity of 0.46 NTU. The slope of this segment is 2% at the pond and was not measured in the downstream rapids. The study of the vegetation shows that the riparian vegetation is composed of the shrub layer (43%) and the herbaceous layer (20%), while the overhanging vegetation is dominated by the shrub layer. The aquatic vegetation is made up of 50% of submerged plants. Use by vehicles causes disturbance to the rail bed. No fish were observed in this segment, but the data collected indicate that it is very suitable habitat for fish.
AR-2
The characterization of this station was carried out at two points: in one section of channel with a uniform bed upstream from the culvert; and in one section of step-pool, where there were waterfalls downstream from the culvert. AR-2 has a flow varying from 0.08 to 0.10 m3/s. These values are from the measurements taken at the inlet and outlet of the culvert, where the mean velocity was respectively 0.84 and 1.22 m/s. The measurement points upstream and downstream are in a pond, and the widths were not measured. Organic matter made up between 60 and 80% of the bottom, fine substrate between 10 and 30% and medium substrate (gravel
SURVEY OF FISH HABITAT ALONG THE RAILWAY LINE AND MAIN ACCESS ROAD, DSO PROJECT TECHNICAL REPORT, VERSION 01, NOVEMBER 20, 2008
10
and pebbles) 10%. At this station, the slope of the segment is 2%. The physical and chemical values of the stream are as follows: temperature of 6.4°C, pH of 6.5, conductivity of 8 µmhos/cm and turbidity of 1.00 NTU (photos AR-2: 47-52). The study of the vegetation shows that this segment is characterized by a swamp and that submerged plants occupy an area varying from 10 to 30%. Fish were observed downstream from this segment; consequently, it should be considered a confirmed fish habitat.
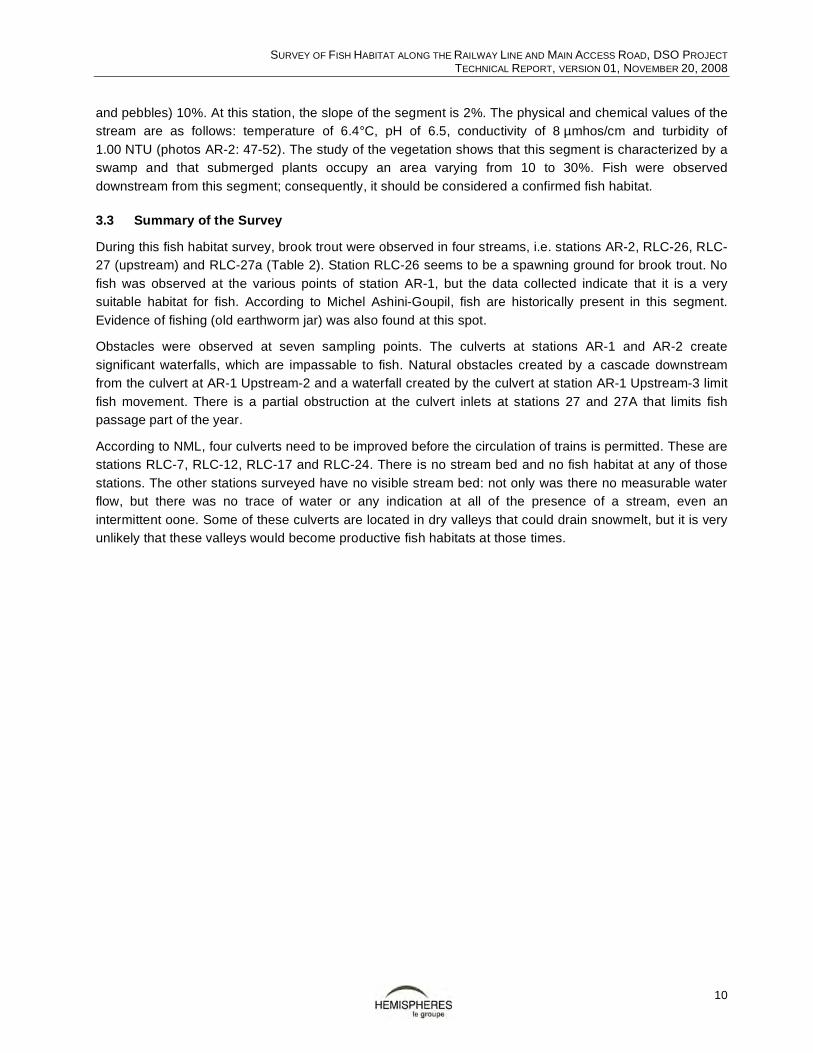
3.3 Summary of the Survey
During this fish habitat survey, brook trout were observed in four streams, i.e. stations AR-2, RLC-26, RLC-27 (upstream) and RLC-27a (Table 2). Station RLC-26 seems to be a spawning ground for brook trout. No fish was observed at the various points of station AR-1, but the data collected indicate that it is a very suitable habitat for fish. According to Michel Ashini-Goupil, fish are historically present in this segment. Evidence of fishing (old earthworm jar) was also found at this spot. Obstacles were observed at seven sampling points. The culverts at stations AR-1 and AR-2 create significant waterfalls, which are impassable to fish. Natural obstacles created by a cascade downstream from the culvert at AR-1 Upstream-2 and a waterfall created by the culvert at station AR-1 Upstream-3 limit fish movement. There is a partial obstruction at the culvert inlets at stations 27 and 27A that limits fish passage part of the year. According to NML, four culverts need to be improved before the circulation of trains is permitted. These are stations RLC-7, RLC-12, RLC-17 and RLC-24. There is no stream bed and no fish habitat at any of those stations. The other stations surveyed have no visible stream bed: not only was there no measurable water flow, but there was no trace of water or any indication at all of the presence of a stream, even an intermittent oone. Some of these culverts are located in dry valleys that could drain snowmelt, but it is very unlikely that these valleys would become productive fish habitats at those times.
SURVEY OF FISH HABITAT ALONG THE RAILWAY LINE AND MAIN ACCESS ROAD, DSO PROJECT TECHNICAL REPORT, VERSION 01, NOVEMBER 20, 2008
11
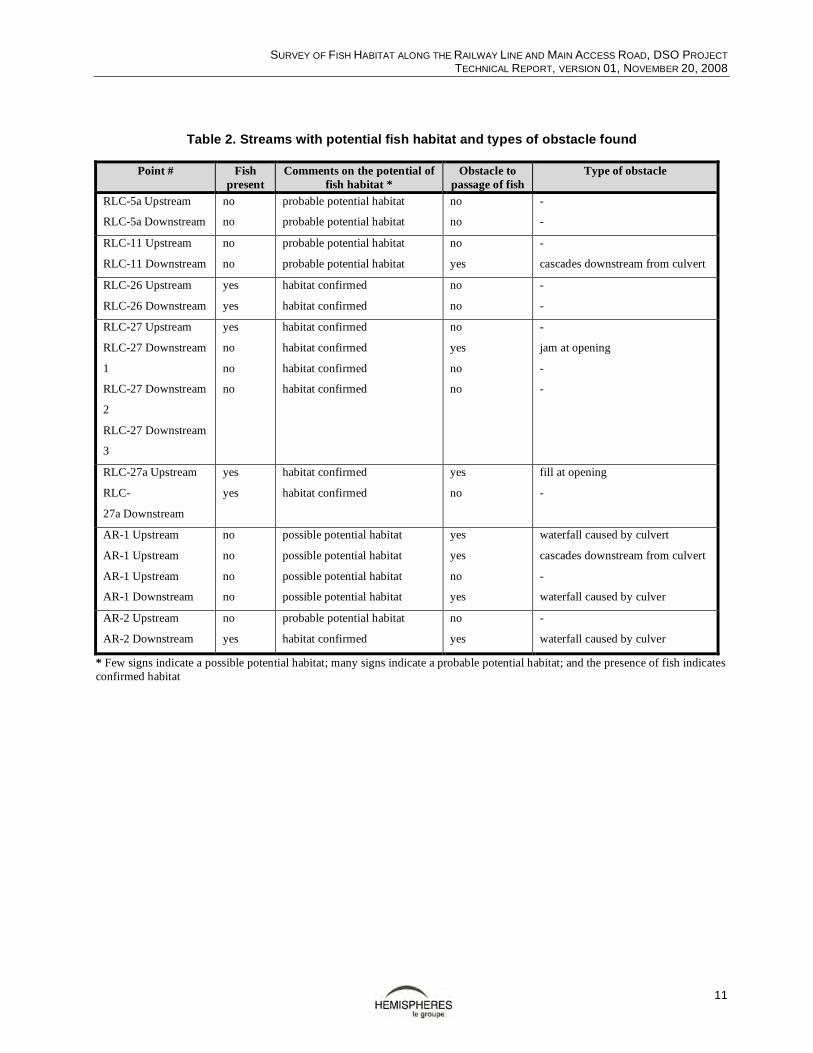
Table 2. Streams with potential fish habitat and types of obstacle found
Point # Fish
present Comments on the potential of
fish habitat * Obstacle to
passage of fish Type of obstacle
RLC-5a Upstream
RLC-5a Downstream no
no probable potential habitat
probable potential habitat no
no -
- RLC-11 Upstream
RLC-11 Downstream no
no probable potential habitat
probable potential habitat no
yes -
cascades downstream from culvert RLC-26 Upstream
RLC-26 Downstream yes
yes habitat confirmed
habitat confirmed no
no -
- RLC-27 Upstream
RLC-27 Downstream
1
RLC-27 Downstream
2
RLC-27 Downstream
3
yes
no
no
no
habitat confirmed
habitat confirmed
habitat confirmed
habitat confirmed
no
yes
no
no
-
jam at opening
-
-
RLC-27a Upstream
RLC-
27a Downstream
yes
yes habitat confirmed
habitat confirmed yes
no fill at opening
-
AR-1 Upstream
AR-1 Upstream
AR-1 Upstream
AR-1 Downstream
no
no
no
no
possible potential habitat
possible potential habitat
possible potential habitat
possible potential habitat
yes
yes
no
yes
waterfall caused by culvert
cascades downstream from culvert
-
waterfall caused by culver AR-2 Upstream
AR-2 Downstream
no
yes probable potential habitat
habitat confirmed
no
yes
-
waterfall caused by culver
* Few signs indicate a possible potential habitat; many signs indicate a probable potential habitat; and the presence of fish indicates confirmed habitat

SURVEY OF FISH HABITAT ALONG THE RAILWAY LINE AND MAIN ACCESS ROAD, DSO PROJECT TECHNICAL REPORT, VERSION 01, NOVEMBER 20, 2008
12
4 CONCLUSION
New Millennium Capital Corporation retained the professional services of Groupe Hémisphères to enhance knowledge of the fish habitat along the railway line and main access road. The primary goal was to characterize the fish habitat in streams crossed by the infrastructure forming part of the proposed mining project. The work consisted in a survey of fish habitat. With respect to the planned rail line, 29 culverts were covered during two ground surveys. Of these 29 culverts, five (5) contain streams that can be considered to be potential or confirmed fish habitat. Stations RLC-26 (NL), RLC-27 (NL) and RLC-27a (NL) are confirmed habitats, while stations RLC-5 (QC) and RLC-11 (QC) are probable or possible fish habitats. With respect to the main access road, the two (2) culverts are possible fish habitats, i.e. stations AR-1 (QC) and AR-2 downstream (QC). No fish habitat will be affected by the reconstruction of the railway. The reconstruction requires no new culverts nor the repair of any culverts in which a permanent or intermittent stream is present. The same is true for the use of the main access road, which is in excellent condition currently and will meet all future needs. There are obstacles created by the existing culverts at stations RLC-27 (NL), RLC-27a (NL), AR-1 (QC), AR-1 Upstream-3 (QC) and AR-2 (QC). These permanent obstacles to fish movements have existed for more than fifty years.
5 REFERENCES
Bibliography
AMEC Earth & Environmental (September 2008) Reconnaissance of Potentially Affected Fish Habitat – Direct Shipping Ore Project Phase I- Western Labrador and Eastern Quebec. Rapport TF8165901 submitted to Groupe Hémisphères, 10 pages and 4 appendices.
AMEC Earth & Environmental (December 2005) Potential Watercourse Crossings Desktop Data Review and Habitat Characterization. Report submitted to LabMag GP Inc., 9 pages and 2 appendices
Malavoi, J.R. (1989) Typologies des faciès d'écoulement ou unités morphodynamiques des cours d'eau à haute énergie. Bulletin français de la Pêche et de la Pisciculture, 15 : 189-210
Montgomery, D. and J. Buffington (1997) Channel-reach morphology in mountain drainage basins. GSA Bulletin, 09: 596–611
DFO (Fishing and Oceans Canada) (2008a) Why Protect Fish Habitat?. DFO Canada. Web site http://www.dfo-mpo.gc.ca/regions/central/habitat/index_e.htm, consulted on 2008-10-28
DFO (Fishing and Oceans Canada) (2008b) Finfish Species - Brook Trout. DFO Canada. Web site http://www.dfo-mpo.gc.ca/aquaculture/finfish/brook_trout_e.htm, consulted on 2008-10-28
Smokorowski, K. and T. Pratt (2007) Effect of a change in physical structure and cover on fish and cover on fish and fish habitat in freshwater ecosystems a review and meta-analysis. Environmental Reviews, 15: 15-41

SURVEY OF FISH HABITAT ALONG THE RAILWAY LINE AND MAIN ROAD, DSO PROJECT TECHNICAL REPORT, VERSION 01, NOVEMBER 20, 2008
APPENDICES


APPENDIX I
FIELD PHOTOGRAPHS

(1)
RLC-3a (view from upstream)
(2)
RLC-3a (view looking downstream)
(3)
RLC-3a (view from downstream)
(4)
RLC-17 (view looking upstream)
(5)
RLC 17 (view from downstream)
(6)
RLC-5a (view looking upstream)
(7)
RLC-5a (view looking upstream)
(8)
RLC-5a (view looking upstream)
(9)
RLC-5a (view looking upstream)
(10)
RLC-5a (view looking downstream)
(11)
RLC-11 (view looking upstream)
(12)
RLC-11 (view looking upstream)

(13)
RLC-11 (view from downstream)
(14)
RLC-11 (view looking downstream)
(15)
RLC-11 (view looking downstream)
(16)
RLC-11 (view looking downstream)
(17)
RLC-26 (view from upstream)
(18)
RLC-26 (view looking upstream)
(19)
RLC-26 (view looking upstream)
(20)
RLC-26 (view from downstream)
(21)
RLC-26 (view looking downstream)
(22)
RLC-26 (view looking downstream)
(23)
RLC-27 (300 m upstream)
(24)
RLC-27 (view from upstream)

(25)
RLC-27 (view looking upstream)
(26)
RLC-27 (view looking downstream)
(27)
RLC-27 (view looking downstream)
(28)
RLC-27 (view looking downstream)
(29)
RLC-27 (upstream)
(30)
RLC-27 (view from upstream)
(31)
RLC-27 (view looking upstream)
(32)
RLC-27 (view from downstream)
(33)
RLC-27 (view looking downstream)
(34)
RLC-27 (view from downstream)
(35)
RLC-27a (view looking upstream)
(36)
RLC-27a (view from upstream)
(37)
RLC-27a (view from upstream)
(38)
RLC-27a (view looking downstream)
(39)
RLC-27a (view looking downstream)
(40)
RLC-27a (view looking downstream)
(41)
AR-1 (view looking upstream)
(42)
AR-1 (view looking upstream)

(43)
AR-1 (view looking upstream)
(44)
AR-1 (view from downstream)
(45)
AR-1 (view from downstream)
(46)
AR-1 (view looking downstream)
(47)
AR-2 (view looking upstream)
(48)
AR-2 (upstream)

(49)
AR-2 (view looking upstream)
(50)
AR-2 (view looking downstream)
(51)
AR-2 (view from downstream)
(52)
AR-2 (view looking downstream)
(53)
AR-1 Upstream-2 (view looking upstream)
(54)
AR-1 Upstream-2 (view looking downstream)
(55)
AR-1 Upstream-2 (view looking downstream) (56)
AR-1 Upstream-3 (view looking upstream)
(57)
AR-1 Upstream-3 (view looking downstream) (58)
AR-1 Upstream-3 (view looking downstream)
APPENDIX II
FIELD SHEET USED TO CHARACTERIZE FISH HABITAT

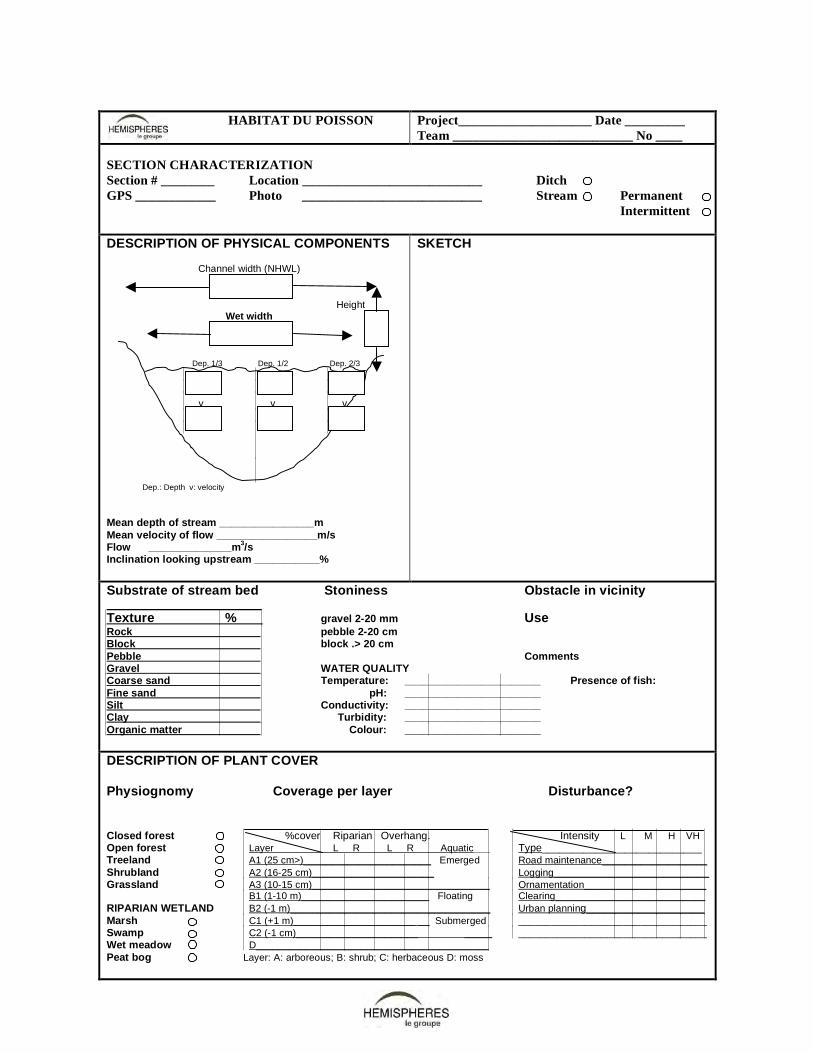
HABITAT DU POISSON Project____________________ Date _________ Team ___________________________ No ____
SECTION CHARACTERIZATION Section # ________ Location ___________________________ Ditch GPS ____________ Photo ___________________________ Stream Permanent Intermittent DESCRIPTION OF PHYSICAL COMPONENTS Channel width (NHWL) Height Wet width Dep. 1/3 Dep. 1/2 Dep. 2/3 v v v Dep.: Depth v: velocity Mean depth of stream ________________m Mean velocity of flow _________________m/s Flow ______________m3/s Inclination looking upstream ___________%
SKETCH
Substrate of stream bed Stoniness Obstacle in vicinity Texture % gravel 2-20 mm Use Rock pebble 2-20 cm Block block .> 20 cm Pebble Comments Gravel WATER QUALITY Coarse sand Temperature: _______________________ Presence of fish: Fine sand pH: _______________________ Silt Conductivity: _______________________ Clay Turbidity: _______________________ Organic matter Colour: _______________________ DESCRIPTION OF PLANT COVER Physiognomy Coverage per layer Disturbance? Closed forest %cover Riparian Overhang. Intensity L M H VH Open forest Layer L R L R Aquatic___ Type___________________________ Treeland A1 (25 cm>)_______________________ Emerged Road maintenance___________________ Shrubland A2 (16-25 cm)______________________ Logging____________________________ Grassland A3 (10-15 cm)________________________________ Ornamentation______________________ B1 (1-10 m)_______________________ Floating Clearing___________________________ RIPARIAN WETLAND B2 (-1 m)____________________________________ Urban planning____________________ Marsh C1 (+1 m)______________________ __ Submerged __________________________________ Swamp C2 (-1 cm)______________________ _____ __________________________________ Wet meadow D__________________________________________ Peat bog Layer: A: arboreous; B: shrub; C: herbaceous D: moss

APPENDIX III
TYPES OF STREAMS AND WATER QUALITY
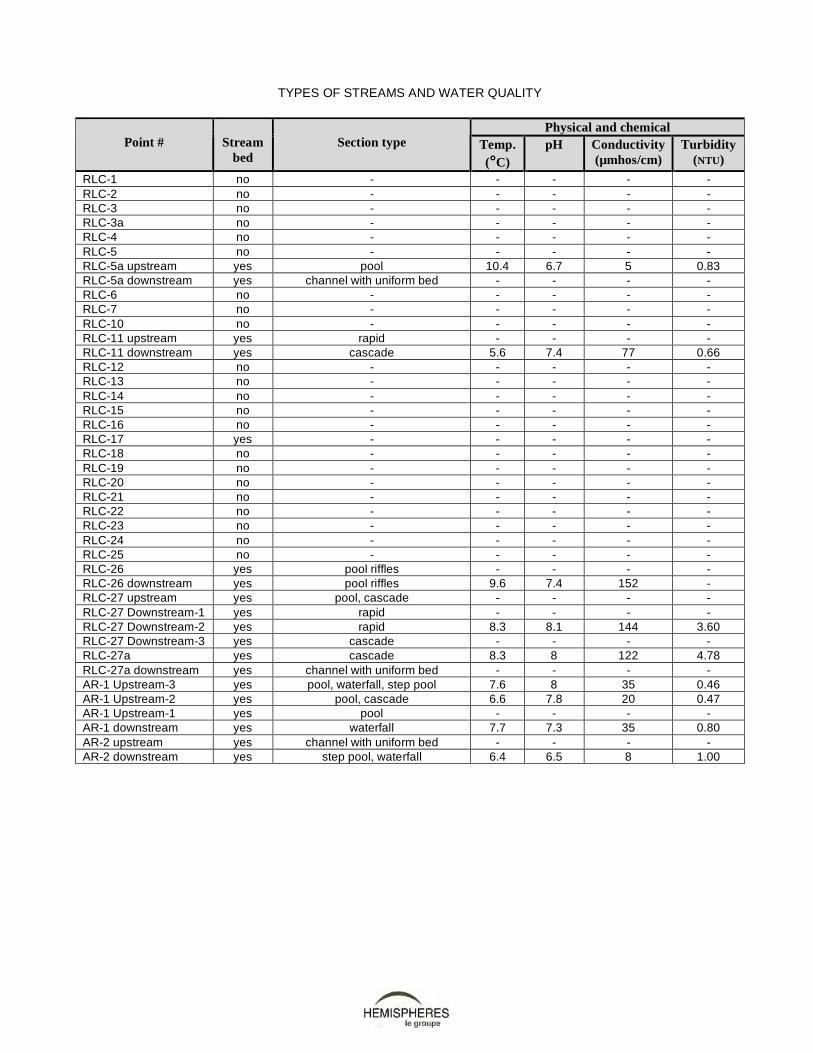
TYPES OF STREAMS AND WATER QUALITY
Physical and chemical
Point #
Stream bed
Section type Temp.
(°C) pH Conductivity
(µmhos/cm) Turbidity
(NTU) RLC-1 no - - - - - RLC-2 no - - - - - RLC-3 no - - - - - RLC-3a no - - - - - RLC-4 no - - - - - RLC-5 no - - - - - RLC-5a upstream yes pool 10.4 6.7 5 0.83 RLC-5a downstream yes channel with uniform bed - - - - RLC-6 no - - - - - RLC-7 no - - - - - RLC-10 no - - - - - RLC-11 upstream yes rapid - - - - RLC-11 downstream yes cascade 5.6 7.4 77 0.66 RLC-12 no - - - - - RLC-13 no - - - - - RLC-14 no - - - - - RLC-15 no - - - - - RLC-16 no - - - - - RLC-17 yes - - - - - RLC-18 no - - - - - RLC-19 no - - - - - RLC-20 no - - - - - RLC-21 no - - - - - RLC-22 no - - - - - RLC-23 no - - - - - RLC-24 no - - - - - RLC-25 no - - - - - RLC-26 yes pool riffles - - - - RLC-26 downstream yes pool riffles 9.6 7.4 152 - RLC-27 upstream yes pool, cascade - - - - RLC-27 Downstream-1 yes rapid - - - - RLC-27 Downstream-2 yes rapid 8.3 8.1 144 3.60 RLC-27 Downstream-3 yes cascade - - - - RLC-27a yes cascade 8.3 8 122 4.78 RLC-27a downstream yes channel with uniform bed - - - - AR-1 Upstream-3 yes pool, waterfall, step pool 7.6 8 35 0.46 AR-1 Upstream-2 yes pool, cascade 6.6 7.8 20 0.47 AR-1 Upstream-1 yes pool - - - - AR-1 downstream yes waterfall 7.7 7.3 35 0.80 AR-2 upstream yes channel with uniform bed - - - - AR-2 downstream yes step pool, waterfall 6.4 6.5 8 1.00
APPENDIX IV
STREAM HYDROLOGY

STREAM HYDROLOGY
Depth (m) Velocity (m/s) Point #
Channel width (m)
Wet width (m)
Height
(m)
1/3
1/2
2/3
1/3
1/2
2/3
RLC-1 - - - - - - - - - RLC-2 - - - - - - - - - RLC-3 - - - - - - - - - RLC-3a - - - - - - - - - RLC-4 - - - - - - - - - RLC-5 - - - - - - - - - RLC-5a upstream - 1.10 0.80 0.10 0.11 0.11 0.18 0.03 0.00 RLC-5a downstream 10.15 4.50 0.80 0.03 0.03 0.03 0.01 0.01 0.01 RLC-6 - - - - - - - - - RLC-7 - - - - - - - - - RLC-10 - - - - - - - - - RLC-11 upstream 10.00 1.60 1.40 0.13 0.03 0.04 0.59 0.13 0.40 RLC-11 downstream 4.20 1.00 1.20 0.09 0.06 0.08 0.88 0.68 0.02 RLC-12 - - - - - - - - - RLC-13 - - - - - - - - - RLC-14 - - - - - - - - - RLC-15 - - - - - - - - - RLC-16 - - - - - - - - - RLC-17 - - - - - - - - - RLC-18 - - - - - - - - - RLC-19 - - - - - - - - - RLC-20 - - - - - - - - - RLC-21 - - - - - - - - - RLC-22 - - - - - - - - - RLC-23 - - - - - - - - - RLC-24 - - - - - - - - - RLC-25 - - - - - - - - - RLC-26 7.00 6.00 0.30 0.75 0.90 0.95 0.34 0.40 0.15 RLC-26 downstream 25.00 7.00 0.60 0.36 0.55 0.30 0.54 0.55 0.54 RLC-27 upstream 15.00 7.00 0.70 0.14 0.24 0.07 0.95 1.00 1.20 RLC-27 Downstream-1 18.00 3.60 0.80 0.22 0.28 0.22 0.65 1.20 0.79 RLC-27 Downstream-2 30.00 5.70 0.50 0.35 0.36 0.35 0.28 0.76 0.50 RLC-27 Downstream-3 20.00 6.50 0.70 0.65 0.55 0.55 0.42 0.00 0.02 RLC-27a 10.00 4.00 1.40 0.30 0.88 0.41 0.14 0.21 0.12 RLC-27a downstream 6.00 3.80 1.40 0.19 0.27 0.21 0.13 0.67 0.18 AR-1 Upstream-3 15.00 4.10 0.70 0.42 0.43 0.40 0.61 0.57 0.58 AR-1 Upstream-2 5.00 0.38 0.25 0.21 0.18 0.18 0.49 0.99 1.09 AR-1 Upstream-1 10.00 6.10 0.40 0.50 0.45 0.47 0.18 0.32 0.27 AR-1 downstream 15.00 3.70 0.40 0.11 0.28 0.24 0.87 1.38 1.82 AR-2 upstream - - - - - - - - - AR-2 downstream - - 12.00 - - - - - -

APPENDIX V
SUBSTRATE COMPOSITION
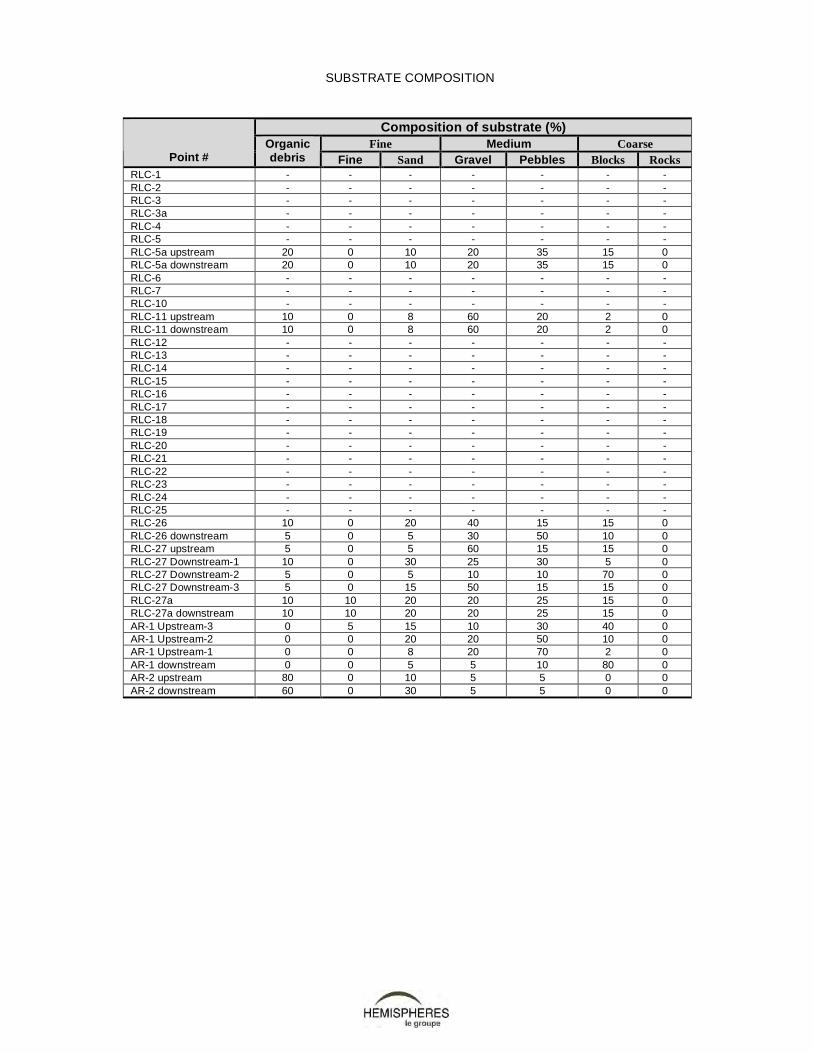
SUBSTRATE COMPOSITION
Composition of substrate (%) Fine Medium Coarse
Point # Organic debris Fine Sand Gravel Pebbles Blocks Rocks
RLC-1 - - - - - - - RLC-2 - - - - - - - RLC-3 - - - - - - - RLC-3a - - - - - - - RLC-4 - - - - - - - RLC-5 - - - - - - - RLC-5a upstream 20 0 10 20 35 15 0 RLC-5a downstream 20 0 10 20 35 15 0 RLC-6 - - - - - - - RLC-7 - - - - - - - RLC-10 - - - - - - - RLC-11 upstream 10 0 8 60 20 2 0 RLC-11 downstream 10 0 8 60 20 2 0 RLC-12 - - - - - - - RLC-13 - - - - - - - RLC-14 - - - - - - - RLC-15 - - - - - - - RLC-16 - - - - - - - RLC-17 - - - - - - - RLC-18 - - - - - - - RLC-19 - - - - - - - RLC-20 - - - - - - - RLC-21 - - - - - - - RLC-22 - - - - - - - RLC-23 - - - - - - - RLC-24 - - - - - - - RLC-25 - - - - - - - RLC-26 10 0 20 40 15 15 0 RLC-26 downstream 5 0 5 30 50 10 0 RLC-27 upstream 5 0 5 60 15 15 0 RLC-27 Downstream-1 10 0 30 25 30 5 0 RLC-27 Downstream-2 5 0 5 10 10 70 0 RLC-27 Downstream-3 5 0 15 50 15 15 0 RLC-27a 10 10 20 20 25 15 0 RLC-27a downstream 10 10 20 20 25 15 0 AR-1 Upstream-3 0 5 15 10 30 40 0 AR-1 Upstream-2 0 0 20 20 50 10 0 AR-1 Upstream-1 0 0 8 20 70 2 0 AR-1 downstream 0 0 5 5 10 80 0 AR-2 upstream 80 0 10 5 5 0 0 AR-2 downstream 60 0 30 5 5 0 0

APPENDIX VI
COMPOSITION OF PLANT COVER
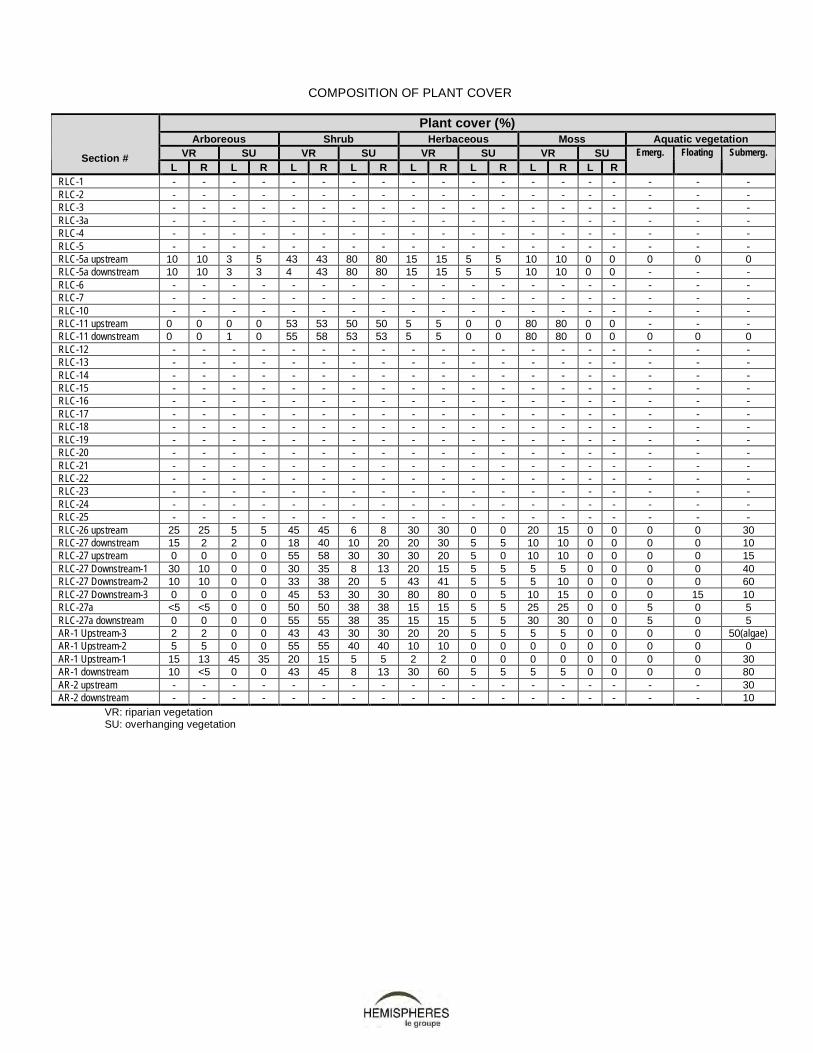
COMPOSITION OF PLANT COVER
Plant cover (%) Arboreous Shrub Herbaceous Moss Aquatic vegetation
VR SU VR SU VR SU VR SU
Section # L R L R L R L R L R L R L R L R
Emerg. Floating Submerg.
RLC-1 - - - - - - - - - - - - - - - - - - - RLC-2 - - - - - - - - - - - - - - - - - - - RLC-3 - - - - - - - - - - - - - - - - - - - RLC-3a - - - - - - - - - - - - - - - - - - - RLC-4 - - - - - - - - - - - - - - - - - - - RLC-5 - - - - - - - - - - - - - - - - - - - RLC-5a upstream 10 10 3 5 43 43 80 80 15 15 5 5 10 10 0 0 0 0 0 RLC-5a downstream 10 10 3 3 4 43 80 80 15 15 5 5 10 10 0 0 - - - RLC-6 - - - - - - - - - - - - - - - - - - - RLC-7 - - - - - - - - - - - - - - - - - - - RLC-10 - - - - - - - - - - - - - - - - - - - RLC-11 upstream 0 0 0 0 53 53 50 50 5 5 0 0 80 80 0 0 - - - RLC-11 downstream 0 0 1 0 55 58 53 53 5 5 0 0 80 80 0 0 0 0 0 RLC-12 - - - - - - - - - - - - - - - - - - - RLC-13 - - - - - - - - - - - - - - - - - - - RLC-14 - - - - - - - - - - - - - - - - - - - RLC-15 - - - - - - - - - - - - - - - - - - - RLC-16 - - - - - - - - - - - - - - - - - - - RLC-17 - - - - - - - - - - - - - - - - - - - RLC-18 - - - - - - - - - - - - - - - - - - - RLC-19 - - - - - - - - - - - - - - - - - - - RLC-20 - - - - - - - - - - - - - - - - - - - RLC-21 - - - - - - - - - - - - - - - - - - - RLC-22 - - - - - - - - - - - - - - - - - - - RLC-23 - - - - - - - - - - - - - - - - - - - RLC-24 - - - - - - - - - - - - - - - - - - - RLC-25 - - - - - - - - - - - - - - - - - - - RLC-26 upstream 25 25 5 5 45 45 6 8 30 30 0 0 20 15 0 0 0 0 30 RLC-27 downstream 15 2 2 0 18 40 10 20 20 30 5 5 10 10 0 0 0 0 10 RLC-27 upstream 0 0 0 0 55 58 30 30 30 20 5 0 10 10 0 0 0 0 15 RLC-27 Downstream-1 30 10 0 0 30 35 8 13 20 15 5 5 5 5 0 0 0 0 40 RLC-27 Downstream-2 10 10 0 0 33 38 20 5 43 41 5 5 5 10 0 0 0 0 60 RLC-27 Downstream-3 0 0 0 0 45 53 30 30 80 80 0 5 10 15 0 0 0 15 10 RLC-27a <5 <5 0 0 50 50 38 38 15 15 5 5 25 25 0 0 5 0 5 RLC-27a downstream 0 0 0 0 55 55 38 35 15 15 5 5 30 30 0 0 5 0 5 AR-1 Upstream-3 2 2 0 0 43 43 30 30 20 20 5 5 5 5 0 0 0 0 50(algae) AR-1 Upstream-2 5 5 0 0 55 55 40 40 10 10 0 0 0 0 0 0 0 0 0 AR-1 Upstream-1 15 13 45 35 20 15 5 5 2 2 0 0 0 0 0 0 0 0 30 AR-1 downstream 10 <5 0 0 43 45 8 13 30 60 5 5 5 5 0 0 0 0 80 AR-2 upstream - - - - - - - - - - - - - - - - - - 30 AR-2 downstream - - - - - - - - - - - - - - - - - - 10
VR: riparian vegetation SU: overhanging vegetation

APPENDIX VII
JUNE 2008 CULVERT STUDY

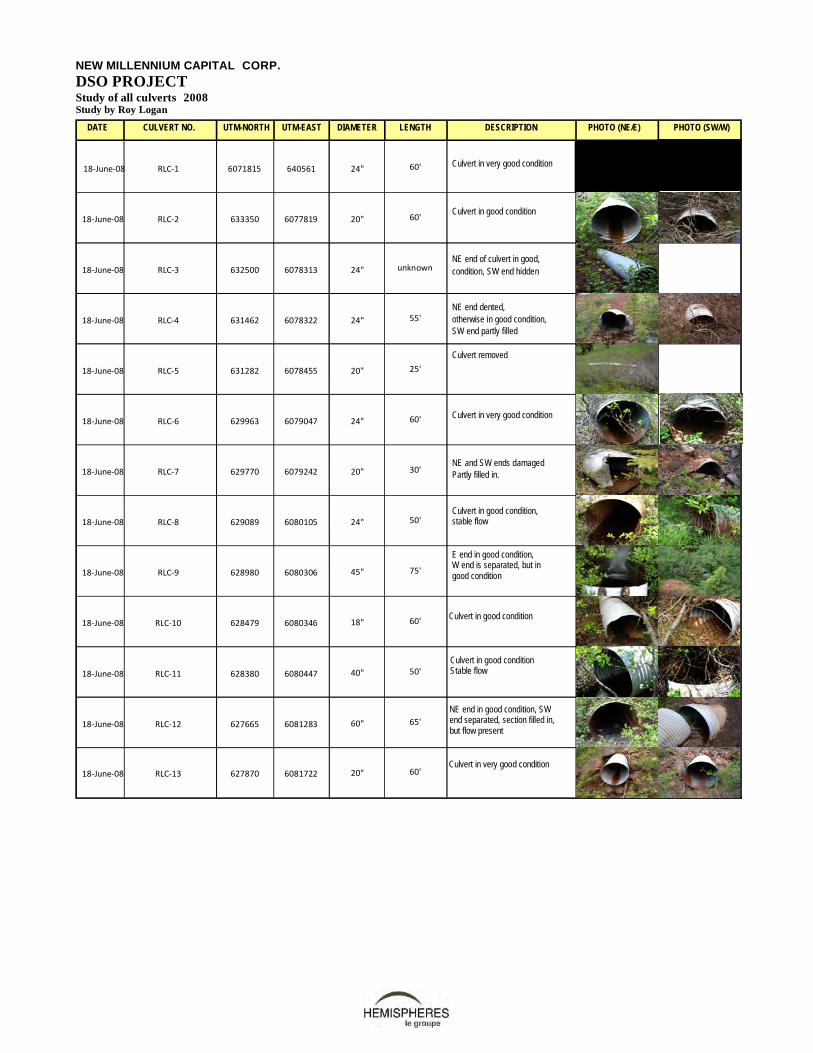
DATE CULVERT NO. UTM-NORTH UTM-EAST DIAMETER LENGTH DESCRIPTION PHOTO (NE/E) PHOTO (SW/W)
18‐June‐08 RLC‐1 6071815 640561 24" 60' Culvert in very good condition
18‐June‐08 RLC‐2 633350 6077819 20" 60' Culvert in good condition
18‐June‐08
RLC‐3 632500 6078313 24" unknown NE end of culvert in good, condition, SW end hidden
18‐June‐08
RLC‐4 631462 6078322 24" 55' NE end dented,
otherwise in good condition,
SW end partly filled
18‐June‐08
RLC‐5 631282 6078455 20" 25' Culvert removed
18‐June‐08
RLC‐6 629963 6079047 24" 60' Culvert in very good condition
18‐June‐08
RLC‐7 629770 6079242 20" 30' NE and SW ends damaged
Partly filled in. .
18‐June‐08
RLC‐8 629089 6080105 24" 50' Culvert in good condition, stable flow
18‐June‐08
RLC‐9 628980 6080306 45" 75' E end in good condition, W end is separated, but in good condition
18‐June‐08
RLC‐10 628479 6080346 18" 60' Culvert in good condition
18‐June‐08
RLC‐11 628380 6080447 40" 50' Culvert in good condition Stable flow
18‐June‐08
RLC‐12 627665 6081283 60" 65' NE end in good condition, SW end separated, section filled in, but flow present
18‐June‐08
RLC‐13 627870 6081722 20" 60' Culvert in very good condition
NEW MILLENNIUM CAPITAL CORP. DSO PROJECT Study of all culverts 2008 Study by Roy Logan MILLENNIUM CAPITAL CORP. DSO PROJECT Study of all culverts 2008 Study by Roy Logan

DATE CULVERT NO. UTM-NORTH UTM-EAST DIAMETER LENGTH DESCRIPTION PHOTO (NE/E) PHOTO (SW/W)
18‐June‐08
RLC‐14 627639 6082071 24" 55' E end dented, but culvert in good condition
18‐June‐08
RLC‐15 627460 6082304 24" 60' Culvert in very good condition
18‐June‐08
RLC‐16 626762 6082679 24" 65' Culvert in very good condition
18‐June‐08
RLC‐17 626170 6083359 24" 60' E end very dented, W end in good condition
18‐June‐08
RLC‐18 626076 6083615 24" 50' Culvert in good condition, erosion caused by water Culvert perhaps not adequate
18‐June‐08
RLC‐19 626016 6083777 24" 60' Culvert in very good condition
18‐June‐08
RLC‐20 625310 6084530 24" 40' E end in good condition, W end crushed and partly buried
18‐June‐08
RLC‐21 625114 6084481 24" 30' N end dented, S end is in good condition
18‐June‐08
RLC‐22 624517 6084520 20" 50' N end in good condition, S end in good condition, but a little filled
18‐June‐08
RLC‐23 623305 6083983 40" 40' Culvert in very good condition
18‐June‐08
RLC‐24 623778 6084174 40" 60' Culvert in poor condition at both ends
18‐June‐08
RLC‐25 623565 6083872 40" 60' N end dented, S end in good condition, but a little filled
19‐June‐08
RLC‐26 641472 6070913 10' 50' Culvert in good condition, stable flow
19‐June‐08
RLC‐27 639753 6072554 10' 60'
NEW MILLENNIUM CAPITAL CORP. DSO PROJECT Study of all culverts 2008 Study by Roy Logan
Culvert in good condition, stable flow

APPENDIX VIII
DESCRIPTION OF CHANNEL PATTERNS USED TO CHARACTERIZE THE STREAMS


DESCRIPTION OF CHANNEL PATTERNS USED TO CHARACTERIZE THE STREAMS
Channel patterns Description
Pool Long, deep zone of a stream frequently located downstream from an obstacle and corresponding to a widening of the stream.
Cascade Zone of a stream with a steep slope and very steep, irregular banks, in which boulders and rocks dominate. This type of obstacle is usually passable.
Channel with uniform bed
Zone of a stream with medium slope where the flow varies from slow to moderate, he water surface remains smooth. Particle size is average (gravel, pebbles).
Waterfall Zone of a stream where there is a sharp drop. This segment is usually characterized by large boulders or trees. This type of segment is frequently impassable for fish.
Step-pool
Zone of a stream characterized by pools (low-flow, deep zones) followed by a step created by an obstacle (rock or tree). Flow determined by major elements of bed roughness. Medium slope and flow speed varying from weak to medium.
Rapids Zone of a stream with a slope > 4%. The flow speed and turbulence are very strong. Particle size is coarse and water is shallow.
Pool riffles
Zone of a stream characterized a sequence of pools and riffles. The flow is usually moderate and the slope low to medium. Particle size is medium.
Source : Adapted from Montgomery and Buffington (1997) and Malavoi (1989)