Embed Size (px)
Citation preview
Riley Ridge Development EA Appendix F
Draft EA 2017
Appendix F
Emissions Inventory

Riley Ridge Development EA Appendix F
Draft EA 2017
This page intentionally left blank
Submitted to: Submitted by:Bureau of Land Management AECOM Pinedale, Wyoming Fort Collins, Colorado
May 2015
Environment
Riley Ridge Environmental Assessment Air Quality Emissions Inventory Development
F-1
Submitted to: Submitted by:Bureau of Land Management AECOM Pinedale, Wyoming Fort Collins, Colorado
May 2015
Environment
_________________________ Tom Damiana
Riley Ridge Environmental Assessment Air Quality Emissions Inventory Development
Prepared By:
_________________________________ Stephanie Carcieri
Reviewed By:
________
F-2
AECOM Environment i
Riley Ridge EA Air Quality Emissions Inventory Development May 2015
Contents
1.0 Introduction ....................................................................................................................................... 1
2.0 Riley Ridge Project Air Emissions Calculation Methodology .................................................... 2
2.1 Construction Emissions .......................................................................................................... 2 2.1.1 Construction and Surface Disturbance ................................................................... 3 2.1.2 Wind Erosion during Construction Activities ........................................................... 3 2.1.3 Construction Vehicles .............................................................................................. 3 2.1.4 Heavy Duty Construction Mobile Equipment Engines ............................................ 4
2.2 Drilling Emissions .................................................................................................................... 4 2.2.1 Rig Engines .............................................................................................................. 4 2.2.2 Rig Boilers ................................................................................................................ 4 2.2.3 Drilling and Completion Vehicle Traffic ................................................................... 4 2.2.4 Drilling and Completion Heavy Duty Mobile Engines ............................................. 5 2.2.5 Water Requirements ................................................................................................ 5
2.3 Production Emissions ............................................................................................................. 5 2.3.1 Production Vehicle Traffic ........................................................................................ 5 2.3.2 Produced Water ....................................................................................................... 5 2.3.3 Fugitive Emissions ................................................................................................... 6
3.0 References ......................................................................................................................................... 7
F-3
Environment ii
Riley Ridge EA Air Quality Emissions Inventory Development May 2015
AECOM
List of Appendices
Appendix A Emission Inventory Summaries
F-4
AECOM Environment 1
Riley Ridge EA Air Quality Emissions Inventory Development May 2015
1.0 Introduction
AECOM Technical Services, Inc. (AECOM) has prepared an air emissions inventory to support the Bureau of Land Management’s (BLM) Environmental Assessment (EA) of the proposed future development of the Riley Ridge oil field. The inventory was developed for the Proposed Action to be reasonable, but conservative. The basis of the emissions inventory is the Plan of Development for the Riley Ridge Unit Development Project and project-specific information provided by Denbury Resources, Inc. (Denbury). These project specific inputs were supplemented with published references and assumptions based on professional experience as necessary. Emissions were conservatively calculated for the most intensive project year based on the drilling schedule provided by Denbury. This was determined to be the last year of the project when there are both construction and well drilling activities and near maximum production since nearly the entire field will be developed. Specific calculation methodologies for each source category are documented in this report. Summaries of the emission inventory can be found in Appendix A.
F-5
AECOM Environment 2
Riley Ridge EA Air Quality Emissions Inventory Development May 2015
2.0 Riley Ridge Project Air Emissions Calculation Methodology
The Riley Ridge project-specific air emissions inventory has been developed for three activity categories: 1) construction equipment and fugitive dust, 2) drilling and completion activities, and 3) operation of fullyproducing wells with well workovers and maintenance vehicle traffic and well pad related equipment. Thefollowing sections provide a brief overview of the various air emission sources associated with theseactivities. Emissions for each activity were calculated on a source specific basis using regulatory agency-approved emissions factors, manufacturers’ data, mass balances, and/or other published emission factordocuments or process simulation software where appropriate. Supporting information such as operationschedules, equipment specifications, and physical and chemical properties of fuel and materials hasbeen provided by Denbury where available. Where site-specific information was not available, publishedreferences or assumptions based on professional experience were used.
The emissions inventory includes estimates for oxides of nitrogen (NOX), carbon monoxide (CO), sulfur dioxide (SO2), particulate matter with an aerodynamic diameter of 10 microns or less (PM10), particulate matter with an aerodynamic diameter of 2.5 microns or less (PM2.5), hydrogen sulfide (H2S), volatile organic compounds (VOCs), 6 hazardous air pollutants (HAPs) 1, and Greenhouse gases (GHGs). GHG emissions estimates have been developed based on emissions of carbon dioxide (CO2), methane (CH4), and nitrous oxide (N2O) and the global warming potential in CO2 equivalents.
The proposed project would be located in Sublette County, Wyoming within the concentrated development area (CDA). Presumptive best available control technology (BACT) is required for specific emission sources2 and all other sources with uncontrolled emissions in excess of 8 tons per year (tpy). These requirements have been assumed where required in the absence of specific details from plan of development or information provided by Denbury.
The emission calculations for the project were developed for all four wells part of the Proposed Action. Maximum annual emissions were found to occur in the year the last well is drilled for all pollutants. During that year, construction and drilling will still be occurring, and the field will be at near maximum production resulting in maximum emissions. A year later, production will be higher, but drilling will not be occurring. A year earlier, production emissions will be lower since not all the wells will be drilled and producing.
2.1 Construction Emissions
The proposed project includes drilling new wells on existing pads and new pads, construction associated access and primary roads, new pipeline gathering lines, and power lines. These activities would be conducted in conjunction with one another (i.e., pipelines and/or power lines may be installed as roadways are being built which would allow the same piece of equipment to support multiple construction activities), however, as a conservative estimate, emissions are based on each activity being performed sequentially; therefore, no economies of scale was assumed when it comes to emissions. Construction equipment includes heavy-duty vehicles (>10,000 pounds Gross Vehicle Weight [lbs GVW]), such as dozers and rollers, and light-duty vehicles (≤10,000 lbs GVW) typically used for transportation (i.e., ½-ton pickup trucks).
1 The 6 HAPs include BTEX (benzene, toluene, ethylbenzene, xylene), formaldehyde, and n-hexane. Of the 187 HAPs regulated under Section 112 of the Clean Air Act, these 6 HAPs are the primary hazardous compounds that are emitted in the oil and gas industry.
2 Requirements have been established for emissions from atmospheric storage tanks, dehydration units, gas-operated pneumatic units and natural gas-fired pumping unit engines.
F-6
AECOM Environment 3
Riley Ridge EA Air Quality Emissions Inventory Development May 2015
The primary pollutants of concern associated with construction emissions are PM10 and PM2.5 from surface disturbance, wind erosion, and vehicle traffic. Emissions of PM10 and PM2.5 as well as other criteria pollutants, such as NOX, CO, SO2, VOC, and HAPs result from the operation of all equipment. The following section outlines those construction activities and associated equipment that have been taken into account to estimate emissions for the proposed project. A portion of the project wells will be located on existing pads, making use of access roads and gathering pipelines already in place.
2.1.1 Construction and Surface Disturbance
The construction of well pads, associated roadways, pipelines and power lines has the potential to release PM10 and PM2.5 to the atmosphere from surface disturbance and excavation activities. PM10 and PM2.5 emissions related to excavation and surface disturbance are calculated using an emission factor of 0.11 ton PM10 per acre-month3 for general construction (Western Regional Air Partnership 2006). This factor includes an assumed control efficiency of 50 percent for watering on disturbed surface areas.
PM10 and PM2.5 emissions from these construction activities are based on the size of the surface disturbance, in acres, and construction duration (fraction of a 30-day month) for each activity type. Hourly emissions were determined by dividing the PM10 and PM2.5 emissions by the total number of construction hours (based on 10-hour work days).
2.1.2 Wind Erosion during Construction Activities
Emissions of PM10 and PM2.5 during construction also result from wind erosion of disturbed surfaces. These emissions are a function of the average amount of time per year with unobstructed wind speed greater than 12 miles per hour, disturbed surface area, precipitation and silt loading characteristics of the disturbed area. An annual emission factor for total suspended particulates (TSP) was derived using the Mojave Desert Air Quality Management District [MDAQMD] Emissions Inventory Guidance. Emissions factors for PM10 and PM2.5 assume a 50 percent and 20 percent distribution of particulate, respectively (MDAQMD 2000). The portion of the year with unobstructed wind speeds greater than 12 miles per hour has been determined based on five years of historical meteorological data from Gillette City, Wyoming. The resulting annual emissions in tons per year (tpy) are a product of the emission factor and the disturbed surface area. Again, 50 percent control efficiency has been applied for watering controls.
2.1.3 Construction Vehicles
Light and heavy-duty vehicles would travel on unpaved roads during construction and all other phases of operation. These vehicles would either be used for construction purposes or transportation of work crews, materials, and/or equipment. Emission factors for PM10 and PM2.5 from unpaved roadways have been developed for industrial sites4 (U.S. Environmental Protection Agency [USEPA] 2006). These factors are based on vehicle miles traveled (VMT) and take into account the control efficiency afforded by water treatment of roadways. Emissions are calculated on a per-well basis, assuming all wells will have the same pad size and linear construction (road, pipeline and power line) length. Therefore, this is conservative for wells which do not require new construction, and less conservative for wells requiring significant construction to connect to existing infrastructure.
Emission factors for tailpipe emissions from all mobile sources (including transportation vehicles) when operating are taken from AP-42 Volume II for light (USEPA 1995b) and heavy-duty diesel powered vehicle traffic at high altitudes (USEPA 1995a). These emission factors are based on a 2020 inventory year assuming a 2006 model year for the emission rates and calculated using total VMT. Total VMT was
3 Based on the Western Regional Air Partnership (WRAP) Fugitive Dust Handbook (Table 3-2, level 1) and the associated PM2.5/PM10 ratio (Chapter 3.3.1).
4 Section 13.2.2.2 of AP-42 (USEPA 2006, equations 1a, b).
F-7
AECOM Environment 4
Riley Ridge EA Air Quality Emissions Inventory Development May 2015
calculated as a sum of the roundtrips by each vehicle for each activity, multiplied by the distance traveled on unpaved roads. Emission rates for SO2 are calculated using a mass balance approach based on a fuel sulfur content of 15 parts per million by weight (ppmw) and an average mileage rating. Emission rates for GHGs are based on factors taken from Tables 4-3 and 4-5 of the API GHG Compendium and converted to g/VMT using Table 4-13 of the Compendium (API 2009).
2.1.4 Heavy Duty Construction Mobile Equipment Engines
The heavy-duty equipment (non-highway mobile equipment which is hauled in to be used during construction activities) releases the following criteria pollutants when operating: NOX, SO2, CO, PM10, PM2.5, and VOC; as well as HAPs and GHGs. Emission factors for the criteria pollutants are based on Tier 2 emission factors from Table 1 of the emissions standards for non-road diesel engines (40 Code of Federal Regulations [CFR] 89, §89.112). For SO2, the emission factor was calculated assuming a fuel content of 15 ppmw based on current federal sulfur standards in 40 CFR 89 for non-road engines. HAP emissions are calculated as a fraction of total VOC based on factors taken from the National Mobile Inventory Model (NMIM). GHG emissions are based on emission factors taken from Tables 4-3 and 4-5 of the API GHG Compendium (API 2009). Emissions are calculated for each type of equipment as the product of engine size, operational time5 (USEPA 2010), and the corresponding emission factor.
2.2 Drilling Emissions
Emissions from drilling activities would be similar to those from construction operations, but with the addition of drill rigs and their associated combustion sources. These activities are detailed below and include both heavy and light duty vehicle traffic, drilling operations and well completions and venting.
2.2.1 Rig Engines
Drill rig engine emission factors for NOX, CO, PM10, PM2.5, and VOC (as non-methane hydrocarbon) are based on Tier 2 engine standards from Table 1 of the non-road diesel engine standards (40 CFR 89). Emissions for SO2 were calculated assuming a fuel sulfur content of 15 ppmw per 40 CFR 89. HAP emission factors were taken from the NMIM. GHG emission factors were taken from Tables 4-3 and 4-5 of the API GHG Compendium (API 2009). Emissions from the drill rig engines for each well drilled were calculated based on rig size and drilling duration for each well6, multiplied by the number of wells per year (in this case, a maximum of one well per year) to determine annual emissions estimates.
2.2.2 Rig Boilers
All drill rigs would be equipped with a diesel-fired boiler to provide heat and steam during cold periods. Emission factors from AP-42, Chapter 1.3 for distillate oil-fired boilers (USEPA 2010a) were used to estimate emissions from rig boilers. An annual operating capacity of 1,080 hours per year was assumed for the boiler based on information provided by Denbury.
2.2.3 Drilling and Completion Vehicle Traffic
The same method used to calculate the emissions from construction vehicle traffic in Section 2.1.3 was used to calculate the emissions from vehicle traffic associated with drilling and completion activities.
5 Average utilization of 0.43 (for multiple engines) and 0.66 (for single engines), taken from Median Life, Annual Activity and Load Factor values for non-road engine emission modeling, table 9, 7-cycle average (EPA 7/2010b).
6 Information provided by Denbury states that the drill rigs consist of three 1,476 hp engines (4,428 hp total) and each well is drilled for 24-hours per day for 150 days.
F-8
AECOM Environment 5
Riley Ridge EA Air Quality Emissions Inventory Development May 2015
2.2.4 Drilling and Completion Heavy Duty Mobile Engines
The same method used to calculate the emissions from heavy duty construction equipment engines in Section 2.1.4 was used to calculate the emissions from any applicable drilling and completion construction equipment engines.
2.2.5 Water Requirements
As specified in the plan of development, a significant amount of water would be required for drilling and completion operations. It has been assumed all water required for these operations would be transported via pipeline both to and from central tank batteries and/or water production wells. Emissions from these activities including possible flashing have been deemed negligible7; water would be reused when possible and 98 percent control efficiency is consistent with Best Practices for such tanks. Pumps required to move the water were assumed to be electrically driven and would not result in additional direct emissions.
2.3 Production Emissions
Criteria pollutants, HAPs and GHGs are emitted during the operation and maintenance of production well sites. Maintenance activities include well workovers and interventions intended to repair or stimulate an existing well (production or injection) for the purpose of restoring, prolonging or enhancing the well production or service. These activities also include personnel visits (associated traffic) and truck hauling activities as outlined below. Production operations include storage of liquids (i.e., condensate, methanol and corrosion inhibitor) in tanks located at the well pads and the central facility.
The production rate from the proposed wells would be expected to decline very little throughout the life of each well. Data provided by Denbury indicate that new oil wells (wells entering their first year of production) would produce crude oil at a rate of 25 barrels per well-day (bbl/well-day) with no substantial decrease in production as the well ages. In order to retain conservative production and operation assumptions, the production rate for the life of each well was assumed to remain at 25 barrels per well-day rather than a declining factor. Well workovers to repair or stimulate the wells are expected to occur no sooner than five years after well production begins, and will take an estimated five days to complete with 12 hours/day of work time.
2.3.1 Production Vehicle Traffic
Production wells would require occasional maintenance visits (light or medium-duty vehicles) as well as site checks (light-duty vehicles). The same method used to calculate the PM10 and PM2.5 emissions from construction vehicle traffic in Section 2.1.3 was used to calculate the PM10 and PM2.5 emissions for production vehicle traffic. The vehicle tailpipe emissions use the same calculation methodology as described in Section 2.1.4.
2.3.2 Produced Water
It has been assumed any produced water from the source wells during normal production would be in the three phase production that is piped to the central facility for processing. As with the drilling water, emissions (primarily flashing) from produced water are assumed to be negligible and have not been included in the annual estimates.
7 Based on highest default emission factor of 0.262 lb VOC/bbl water from Colorado’s PS Memo 09-02, applied to all water required for the project, controlled emissions are under 5 tons VOC. The emission factor accounts for both flashing and standing losses.
F-9
AECOM Environment 6
Riley Ridge EA Air Quality Emissions Inventory Development May 2015
2.3.3 Fugitive Emissions
It was assumed that the wet gas analyses from Madison, Wyoming provided by Denbury would be representative of the constituents found in fugitive gas leaks at Riley Ridge. Fugitive emission leaks of VOC, H2S, CO2 and CH4 result from leaking from flanges and other connections. Total leakage of gas from stream components and per-well component counts have been estimated using the USEPA Protocol for Equipment Leak Estimates (USEPA 1995c).
2.3.4 Storage Tank Emissions
There is one small methanol storage tank planned to be located at each well site for injection into the well. Methanol will be delivered to the wellsites via pipeline from a centrally located tank. In addition, a corrosion inhibitor tank will be located centrally. Corrosion inhibitor will be piped to the well site an directly injected without intermediate storage. The corrosion inhibitor will be mixed with water and methanol, and is assumed to contain no VOCs. Therefore, for conservatism this storage tank was assumed to contain 100% methanol since the proportions of water, methanol and corrosion inhibitor are unknown. Emissions of VOCs from breathing and working losses were estimated using EPA’s TANKSs 4.0.9d program. Tanks dimensions and estimated annual throughputs were provided by Denbury, except for the corrosion inhibitor tank dimensions which were estimated based on the tank capacity.
F-10
AECOM Environment 7
Riley Ridge EA Air Quality Emissions Inventory Development May 2015
3.0 References
AECOM. 2013, Plan of Development, Riley Ridge Oil Field Unit Development Project. September 2013.
American Petroleum Institute (API). 2009. Compendium of Greenhouse Gas Emissions Methodologies for the Oil and Gas Industry. August 2009.
Mojave Desert Air Quality Management District (MDAQMD). 2000. Antelope Valley Air Pollution Control District, Emission Inventory Guidance, Mineral Handling and Processing Industries, April 10, 2000.
United States Environmental Protection Agency (USEPA). 2010a. Compilation of Air Pollutant Emission Factors: AP-42, Fifth Edition, Volume I: Stationary Point and Area Sources, Chapter 1.3 Fuel Oil Combustion. May 2010.
_____. 2010b. Median Life, Annual Activity, and Load Factor Values for Nonroad Engine Emissions Modeling, EPA-420-R-10-016/NR-005d. Office of Transportation and Air Quality, Assessment and Standards Division. July 2010.
_____. 2006. Compilation of Air Pollutant Emission Factors: AP-42, Fifth Edition, Volume I: Stationary Point and Area Sources, Chapter 13.2.2 Unpaved Roads. November 2006.
_____. 1998. Compilation of Air Pollutant Emission Factors: AP-42, Fifth Edition, Volume I: Stationary Point and Area Sources, Chapter 1.4 Natural Gas Combustion. July 1998.
_____. 1995a. Compilation of Air Pollutant Emission Factors: AP-42, Fifth Edition, Volume II: Mobile Sources, Heavy-Duty Diesel Vehicles. June 1995.
_____. 1995b. Compilation of Air Pollutant Emission Factors: AP-42, Fifth Edition, Volume II: Mobile Sources, Light-Duty Diesel Trucks. June 1995.
_____. 1995c. Protocol of Equipment Leak Emissions Estimates. EPA 453/R-95-017. Office of Air Quality Planning and Standards. Research Triangle Park, North Carolina. November 1995.
Western Regional Air Partnership. 2006. WRAP Fugitive Dust Handbook. Western Governors’ Association. September 2006.
F-11

This page intentionally left blank
F-12
AECOM Environment
Riley Ridge EA Air Quality Emissions Inventory Development May 2015
Appendix A
Emission Inventory Summaries
F-13

This page intentionally left blank
F-14
Plan of Development
F-15

This page intentionally left blank
F-16
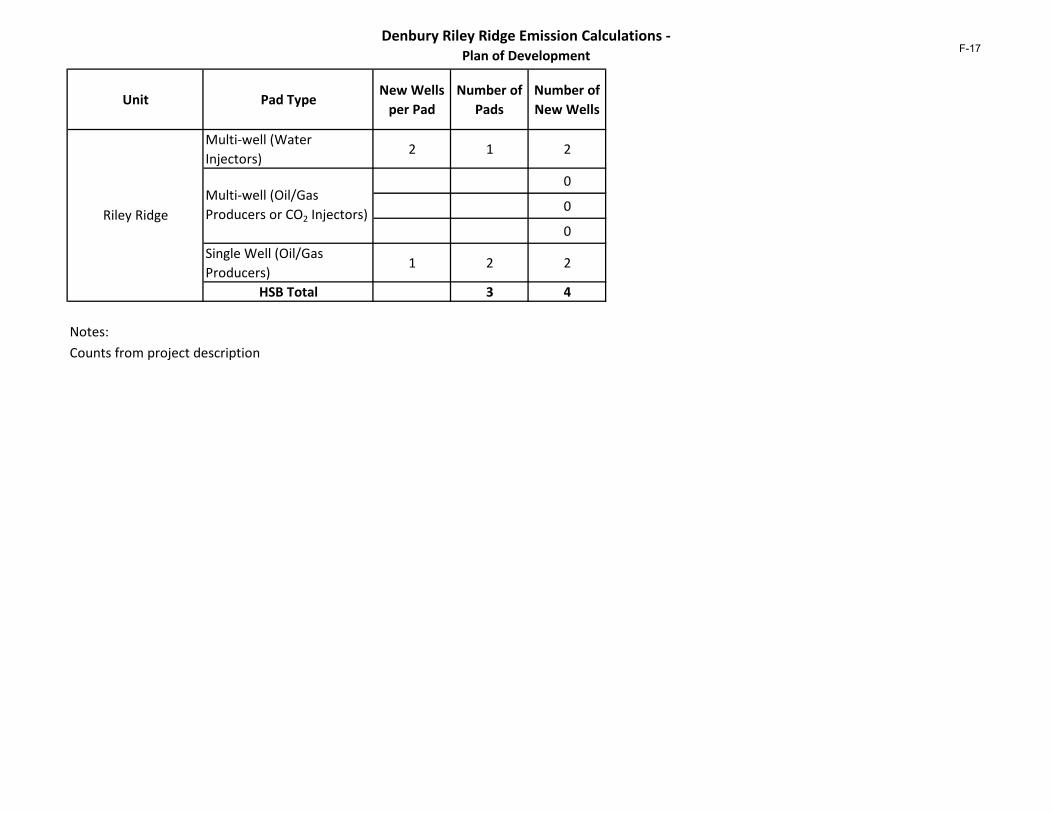
Denbury Riley Ridge Emission Calculations - Plan of Development
Unit Pad TypeNew Wells
per PadNumber of
PadsNumber of New Wells
Multi-well (Water Injectors)
2 1 2
0
0
0Single Well (Oil/Gas Producers)
1 2 2
HSB Total 3 4
Notes: Counts from project description
Multi-well (Oil/Gas Producers or CO2 Injectors)Riley Ridge
F-17

This page intentionally left blank
F-18

Reference
F-19

This page intentionally left blank
F-20
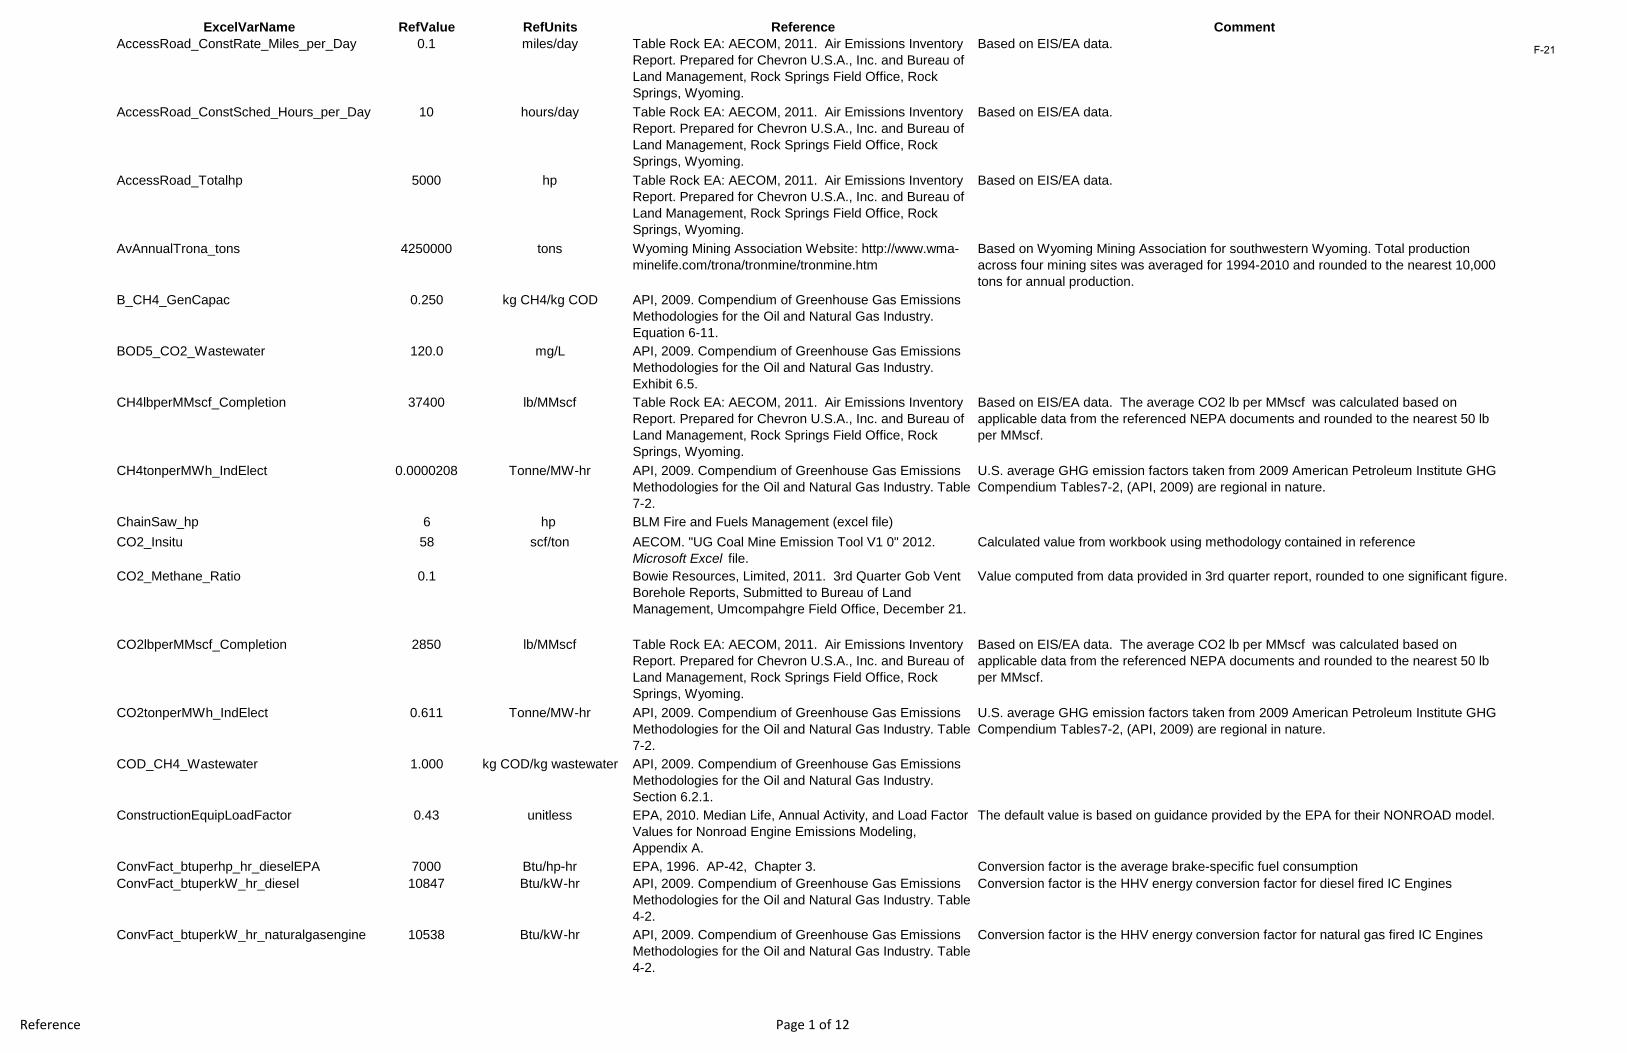
Reference Page 1 of 12
ExcelVarName RefValue RefUnits Reference CommentAccessRoad_ConstRate_Miles_per_Day 0.1 miles/day Table Rock EA: AECOM, 2011. Air Emissions Inventory
Report. Prepared for Chevron U.S.A., Inc. and Bureau of Land Management, Rock Springs Field Office, Rock Springs, Wyoming.
Based on EIS/EA data.
AccessRoad_ConstSched_Hours_per_Day 10 hours/day Table Rock EA: AECOM, 2011. Air Emissions Inventory Report. Prepared for Chevron U.S.A., Inc. and Bureau of Land Management, Rock Springs Field Office, Rock Springs, Wyoming.
Based on EIS/EA data.
AccessRoad_Totalhp 5000 hp Table Rock EA: AECOM, 2011. Air Emissions Inventory Report. Prepared for Chevron U.S.A., Inc. and Bureau of Land Management, Rock Springs Field Office, Rock Springs, Wyoming.
Based on EIS/EA data.
AvAnnualTrona_tons 4250000 tons Wyoming Mining Association Website: http://www.wma-minelife.com/trona/tronmine/tronmine.htm
Based on Wyoming Mining Association for southwestern Wyoming. Total production across four mining sites was averaged for 1994-2010 and rounded to the nearest 10,000 tons for annual production.
B_CH4_GenCapac 0.250 kg CH4/kg COD API, 2009. Compendium of Greenhouse Gas Emissions Methodologies for the Oil and Natural Gas Industry. Equation 6-11.
BOD5_CO2_Wastewater 120.0 mg/L API, 2009. Compendium of Greenhouse Gas Emissions Methodologies for the Oil and Natural Gas Industry. Exhibit 6.5.
CH4lbperMMscf_Completion 37400 lb/MMscf Table Rock EA: AECOM, 2011. Air Emissions Inventory Report. Prepared for Chevron U.S.A., Inc. and Bureau of Land Management, Rock Springs Field Office, Rock Springs, Wyoming.
Based on EIS/EA data. The average CO2 lb per MMscf was calculated based on applicable data from the referenced NEPA documents and rounded to the nearest 50 lb per MMscf.
CH4tonperMWh_IndElect 0.0000208 Tonne/MW-hr API, 2009. Compendium of Greenhouse Gas Emissions Methodologies for the Oil and Natural Gas Industry. Table 7-2.
U.S. average GHG emission factors taken from 2009 American Petroleum Institute GHG Compendium Tables7-2, (API, 2009) are regional in nature.
ChainSaw_hp 6 hp BLM Fire and Fuels Management (excel file)CO2_Insitu 58 scf/ton AECOM. "UG Coal Mine Emission Tool V1 0" 2012.
Microsoft Excel file.Calculated value from workbook using methodology contained in reference
CO2_Methane_Ratio 0.1 Bowie Resources, Limited, 2011. 3rd Quarter Gob Vent Borehole Reports, Submitted to Bureau of Land Management, Umcompahgre Field Office, December 21.
Value computed from data provided in 3rd quarter report, rounded to one significant figure.
CO2lbperMMscf_Completion 2850 lb/MMscf Table Rock EA: AECOM, 2011. Air Emissions Inventory Report. Prepared for Chevron U.S.A., Inc. and Bureau of Land Management, Rock Springs Field Office, Rock Springs, Wyoming.
Based on EIS/EA data. The average CO2 lb per MMscf was calculated based on applicable data from the referenced NEPA documents and rounded to the nearest 50 lb per MMscf.
CO2tonperMWh_IndElect 0.611 Tonne/MW-hr API, 2009. Compendium of Greenhouse Gas Emissions Methodologies for the Oil and Natural Gas Industry. Table 7-2.
U.S. average GHG emission factors taken from 2009 American Petroleum Institute GHG Compendium Tables7-2, (API, 2009) are regional in nature.
COD_CH4_Wastewater 1.000 kg COD/kg wastewater API, 2009. Compendium of Greenhouse Gas Emissions Methodologies for the Oil and Natural Gas Industry. Section 6.2.1.
ConstructionEquipLoadFactor 0.43 unitless EPA, 2010. Median Life, Annual Activity, and Load Factor Values for Nonroad Engine Emissions Modeling, Appendix A.
The default value is based on guidance provided by the EPA for their NONROAD model.
ConvFact_btuperhp_hr_dieselEPA 7000 Btu/hp-hr EPA, 1996. AP-42, Chapter 3. Conversion factor is the average brake-specific fuel consumptionConvFact_btuperkW_hr_diesel 10847 Btu/kW-hr API, 2009. Compendium of Greenhouse Gas Emissions
Methodologies for the Oil and Natural Gas Industry. Table 4-2.
Conversion factor is the HHV energy conversion factor for diesel fired IC Engines
ConvFact_btuperkW_hr_naturalgasengine 10538 Btu/kW-hr API, 2009. Compendium of Greenhouse Gas EmissionsMethodologies for the Oil and Natural Gas Industry. Table4-2.
Conversion factor is the HHV energy conversion factor for natural gas fired IC Engines
F-21
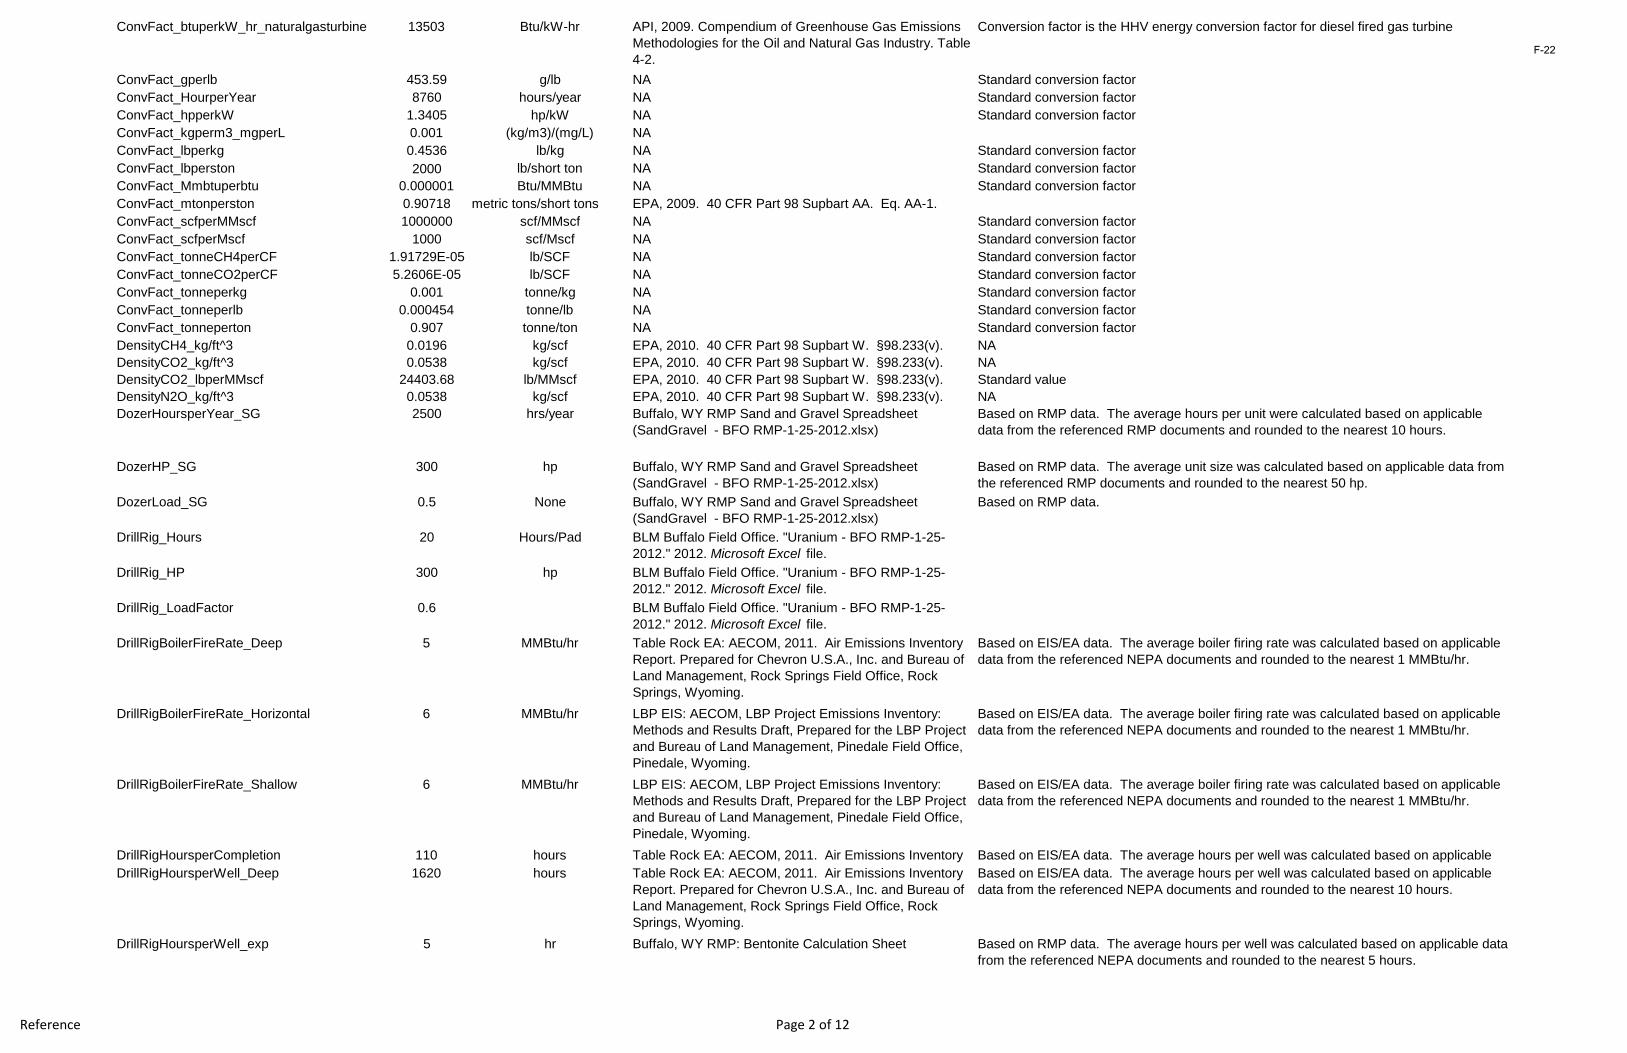
Reference Page 2 of 12
ConvFact_btuperkW_hr_naturalgasturbine 13503 Btu/kW-hr API, 2009. Compendium of Greenhouse Gas Emissions Methodologies for the Oil and Natural Gas Industry. Table 4-2.
Conversion factor is the HHV energy conversion factor for diesel fired gas turbine
ConvFact_gperlb 453.59 g/lb NA Standard conversion factorConvFact_HourperYear 8760 hours/year NA Standard conversion factorConvFact_hpperkW 1.3405 hp/kW NA Standard conversion factorConvFact_kgperm3_mgperL 0.001 (kg/m3)/(mg/L) NAConvFact_lbperkg 0.4536 lb/kg NA Standard conversion factorConvFact_lbperston 2000 lb/short ton NA Standard conversion factorConvFact_Mmbtuperbtu 0.000001 Btu/MMBtu NA Standard conversion factorConvFact_mtonperston 0.90718 metric tons/short tons EPA, 2009. 40 CFR Part 98 Supbart AA. Eq. AA-1.ConvFact_scfperMMscf 1000000 scf/MMscf NA Standard conversion factorConvFact_scfperMscf 1000 scf/Mscf NA Standard conversion factorConvFact_tonneCH4perCF 1.91729E-05 lb/SCF NA Standard conversion factorConvFact_tonneCO2perCF 5.2606E-05 lb/SCF NA Standard conversion factorConvFact_tonneperkg 0.001 tonne/kg NA Standard conversion factorConvFact_tonneperlb 0.000454 tonne/lb NA Standard conversion factorConvFact_tonneperton 0.907 tonne/ton NA Standard conversion factorDensityCH4_kg/ft^3 0.0196 kg/scf EPA, 2010. 40 CFR Part 98 Supbart W. §98.233(v). NADensityCO2_kg/ft^3 0.0538 kg/scf EPA, 2010. 40 CFR Part 98 Supbart W. §98.233(v). NADensityCO2_lbperMMscf 24403.68 lb/MMscf EPA, 2010. 40 CFR Part 98 Supbart W. §98.233(v). Standard valueDensityN2O_kg/ft^3 0.0538 kg/scf EPA, 2010. 40 CFR Part 98 Supbart W. §98.233(v). NADozerHoursperYear_SG 2500 hrs/year Buffalo, WY RMP Sand and Gravel Spreadsheet
(SandGravel - BFO RMP-1-25-2012.xlsx)Based on RMP data. The average hours per unit were calculated based on applicable data from the referenced RMP documents and rounded to the nearest 10 hours.
DozerHP_SG 300 hp Buffalo, WY RMP Sand and Gravel Spreadsheet (SandGravel - BFO RMP-1-25-2012.xlsx)
Based on RMP data. The average unit size was calculated based on applicable data from the referenced RMP documents and rounded to the nearest 50 hp.
DozerLoad_SG 0.5 None Buffalo, WY RMP Sand and Gravel Spreadsheet (SandGravel - BFO RMP-1-25-2012.xlsx)
Based on RMP data.
DrillRig_Hours 20 Hours/Pad BLM Buffalo Field Office. "Uranium - BFO RMP-1-25-2012." 2012. Microsoft Excel file.
DrillRig_HP 300 hp BLM Buffalo Field Office. "Uranium - BFO RMP-1-25-2012." 2012. Microsoft Excel file.
DrillRig_LoadFactor 0.6 BLM Buffalo Field Office. "Uranium - BFO RMP-1-25-2012." 2012. Microsoft Excel file.
DrillRigBoilerFireRate_Deep 5 MMBtu/hr Table Rock EA: AECOM, 2011. Air Emissions Inventory Report. Prepared for Chevron U.S.A., Inc. and Bureau of Land Management, Rock Springs Field Office, Rock Springs, Wyoming.
Based on EIS/EA data. The average boiler firing rate was calculated based on applicable data from the referenced NEPA documents and rounded to the nearest 1 MMBtu/hr.
DrillRigBoilerFireRate_Horizontal 6 MMBtu/hr LBP EIS: AECOM, LBP Project Emissions Inventory: Methods and Results Draft, Prepared for the LBP Project and Bureau of Land Management, Pinedale Field Office, Pinedale, Wyoming.
Based on EIS/EA data. The average boiler firing rate was calculated based on applicable data from the referenced NEPA documents and rounded to the nearest 1 MMBtu/hr.
DrillRigBoilerFireRate_Shallow 6 MMBtu/hr LBP EIS: AECOM, LBP Project Emissions Inventory: Methods and Results Draft, Prepared for the LBP Project and Bureau of Land Management, Pinedale Field Office, Pinedale, Wyoming.
Based on EIS/EA data. The average boiler firing rate was calculated based on applicable data from the referenced NEPA documents and rounded to the nearest 1 MMBtu/hr.
DrillRigHoursperCompletion 110 hours Table Rock EA: AECOM, 2011. Air Emissions Inventory
Based on EIS/EA data. The average hours per well was calculated based on applicable DrillRigHoursperWell_Deep 1620 hours Table Rock EA: AECOM, 2011. Air Emissions Inventory
Report. Prepared for Chevron U.S.A., Inc. and Bureau of Land Management, Rock Springs Field Office, Rock Springs, Wyoming.
Based on EIS/EA data. The average hours per well was calculated based on applicable data from the referenced NEPA documents and rounded to the nearest 10 hours.
DrillRigHoursperWell_exp 5 hr Buffalo, WY RMP: Bentonite Calculation Sheet Based on RMP data. The average hours per well was calculated based on applicable data from the referenced NEPA documents and rounded to the nearest 5 hours.
F-22
Reference Page 3 of 12
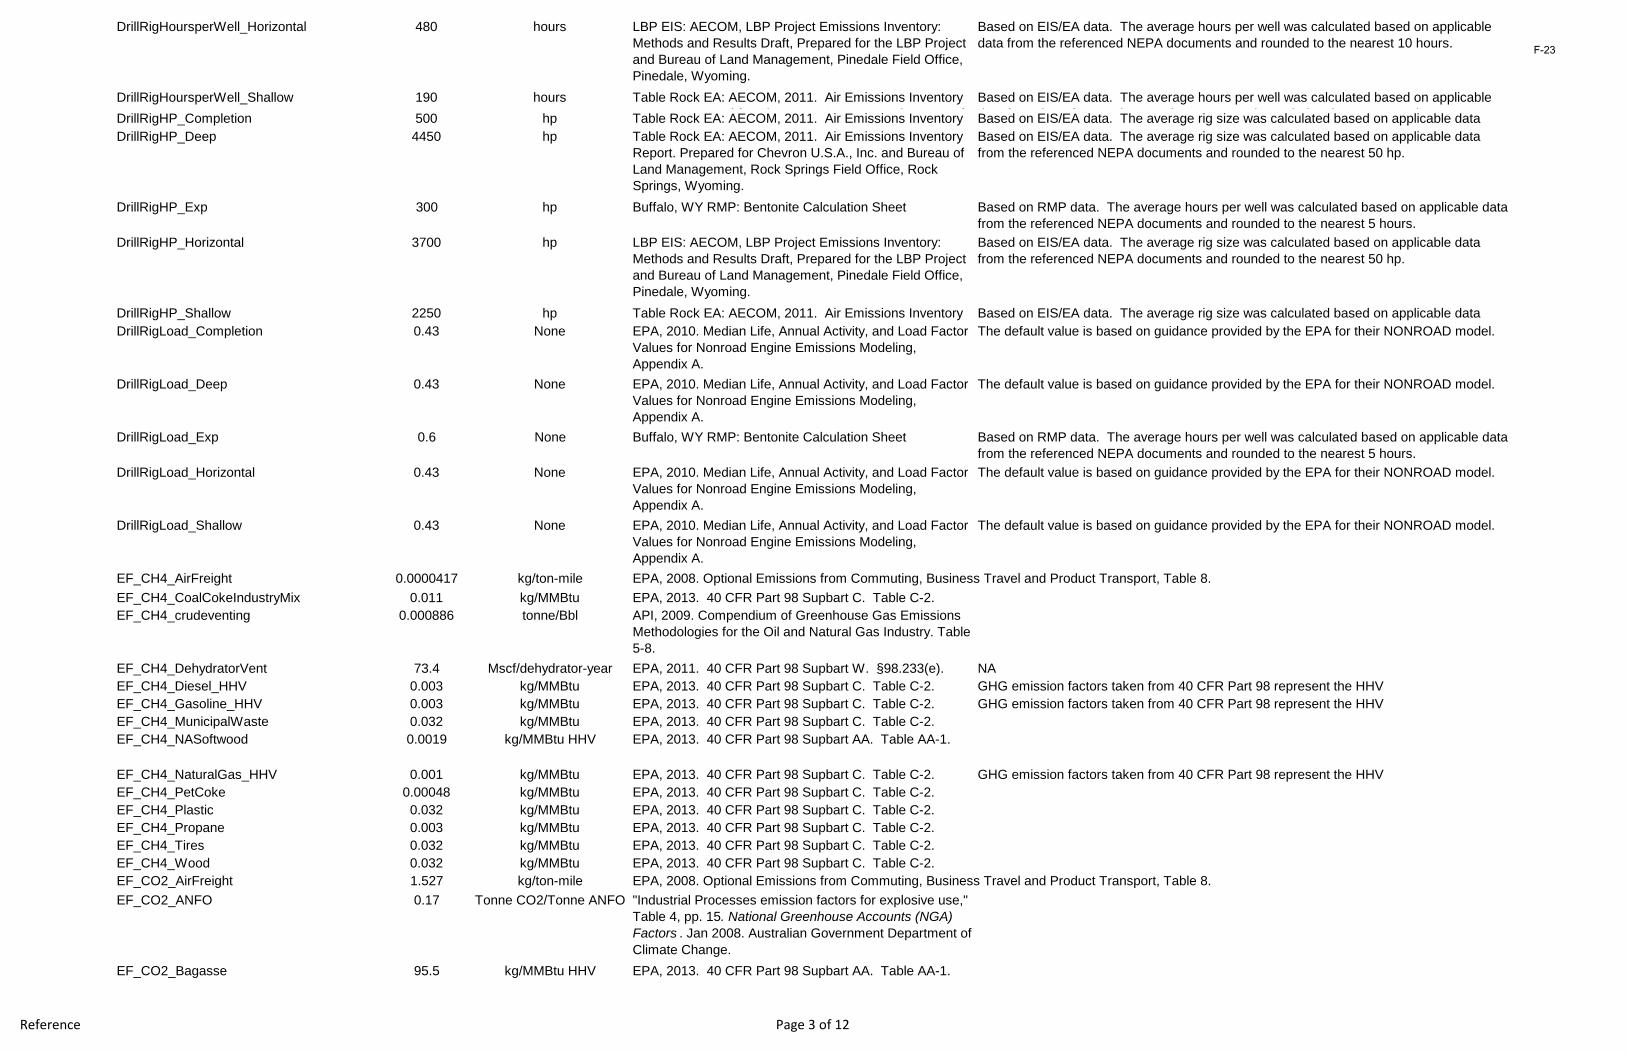
DrillRigHoursperWell_Horizontal 480 hours LBP EIS: AECOM, LBP Project Emissions Inventory: Methods and Results Draft, Prepared for the LBP Project and Bureau of Land Management, Pinedale Field Office, Pinedale, Wyoming.
Based on EIS/EA data. The average hours per well was calculated based on applicable data from the referenced NEPA documents and rounded to the nearest 10 hours.
DrillRigHoursperWell_Shallow 190 hours Table Rock EA: AECOM, 2011. Air Emissions Inventory R t P d f Ch U S A I d B f
Based on EIS/EA data. The average hours per well was calculated based on applicable d t f th f d NEPA d t d d d t th t 10 hDrillRigHP_Completion 500 hp Table Rock EA: AECOM, 2011. Air Emissions Inventory
Based on EIS/EA data. The average rig size was calculated based on applicable data
DrillRigHP_Deep 4450 hp Table Rock EA: AECOM, 2011. Air Emissions Inventory Report. Prepared for Chevron U.S.A., Inc. and Bureau of Land Management, Rock Springs Field Office, Rock Springs, Wyoming.
Based on EIS/EA data. The average rig size was calculated based on applicable data from the referenced NEPA documents and rounded to the nearest 50 hp.
DrillRigHP_Exp 300 hp Buffalo, WY RMP: Bentonite Calculation Sheet Based on RMP data. The average hours per well was calculated based on applicable data from the referenced NEPA documents and rounded to the nearest 5 hours.
DrillRigHP_Horizontal 3700 hp LBP EIS: AECOM, LBP Project Emissions Inventory: Methods and Results Draft, Prepared for the LBP Project and Bureau of Land Management, Pinedale Field Office, Pinedale, Wyoming.
Based on EIS/EA data. The average rig size was calculated based on applicable data from the referenced NEPA documents and rounded to the nearest 50 hp.
DrillRigHP_Shallow 2250 hp Table Rock EA: AECOM, 2011. Air Emissions Inventory
Based on EIS/EA data. The average rig size was calculated based on applicable data DrillRigLoad_Completion 0.43 None EPA, 2010. Median Life, Annual Activity, and Load Factor
Values for Nonroad Engine Emissions Modeling, Appendix A.
The default value is based on guidance provided by the EPA for their NONROAD model.
DrillRigLoad_Deep 0.43 None EPA, 2010. Median Life, Annual Activity, and Load Factor Values for Nonroad Engine Emissions Modeling, Appendix A.
The default value is based on guidance provided by the EPA for their NONROAD model.
DrillRigLoad_Exp 0.6 None Buffalo, WY RMP: Bentonite Calculation Sheet Based on RMP data. The average hours per well was calculated based on applicable data from the referenced NEPA documents and rounded to the nearest 5 hours.
DrillRigLoad_Horizontal 0.43 None EPA, 2010. Median Life, Annual Activity, and Load Factor Values for Nonroad Engine Emissions Modeling, Appendix A.
The default value is based on guidance provided by the EPA for their NONROAD model.
DrillRigLoad_Shallow 0.43 None EPA, 2010. Median Life, Annual Activity, and Load Factor Values for Nonroad Engine Emissions Modeling, Appendix A.
The default value is based on guidance provided by the EPA for their NONROAD model.
EF_CH4_AirFreight 0.0000417 kg/ton-mile EPA, 2008. Optional Emissions from Commuting, Business Travel and Product Transport, Table 8.EF_CH4_CoalCokeIndustryMix 0.011 kg/MMBtu EPA, 2013. 40 CFR Part 98 Supbart C. Table C-2.EF_CH4_crudeventing 0.000886 tonne/Bbl API, 2009. Compendium of Greenhouse Gas Emissions
Methodologies for the Oil and Natural Gas Industry. Table 5-8.
EF_CH4_DehydratorVent 73.4 Mscf/dehydrator-year EPA, 2011. 40 CFR Part 98 Supbart W. §98.233(e). NAEF_CH4_Diesel_HHV 0.003 kg/MMBtu EPA, 2013. 40 CFR Part 98 Supbart C. Table C-2. GHG emission factors taken from 40 CFR Part 98 represent the HHVEF_CH4_Gasoline_HHV 0.003 kg/MMBtu EPA, 2013. 40 CFR Part 98 Supbart C. Table C-2. GHG emission factors taken from 40 CFR Part 98 represent the HHVEF_CH4_MunicipalWaste 0.032 kg/MMBtu EPA, 2013. 40 CFR Part 98 Supbart C. Table C-2.EF_CH4_NASoftwood 0.0019 kg/MMBtu HHV EPA, 2013. 40 CFR Part 98 Supbart AA. Table AA-1.
EF_CH4_NaturalGas_HHV 0.001 kg/MMBtu EPA, 2013. 40 CFR Part 98 Supbart C. Table C-2. GHG emission factors taken from 40 CFR Part 98 represent the HHVEF_CH4_PetCoke 0.00048 kg/MMBtu EPA, 2013. 40 CFR Part 98 Supbart C. Table C-2.EF_CH4_Plastic 0.032 kg/MMBtu EPA, 2013. 40 CFR Part 98 Supbart C. Table C-2.EF_CH4_Propane 0.003 kg/MMBtu EPA, 2013. 40 CFR Part 98 Supbart C. Table C-2.EF_CH4_Tires 0.032 kg/MMBtu EPA, 2013. 40 CFR Part 98 Supbart C. Table C-2.EF_CH4_Wood 0.032 kg/MMBtu EPA, 2013. 40 CFR Part 98 Supbart C. Table C-2.EF_CO2_AirFreight 1.527 kg/ton-mile EPA, 2008. Optional Emissions from Commuting, Business Travel and Product Transport, Table 8.EF_CO2_ANFO 0.17 Tonne CO2/Tonne ANFO "Industrial Processes emission factors for explosive use,"
Table 4, pp. 15. National Greenhouse Accounts (NGA) Factors . Jan 2008. Australian Government Department of Climate Change.
EF_CO2_Bagasse 95.5 kg/MMBtu HHV EPA, 2013. 40 CFR Part 98 Supbart AA. Table AA-1.
F-23
Reference Page 4 of 12
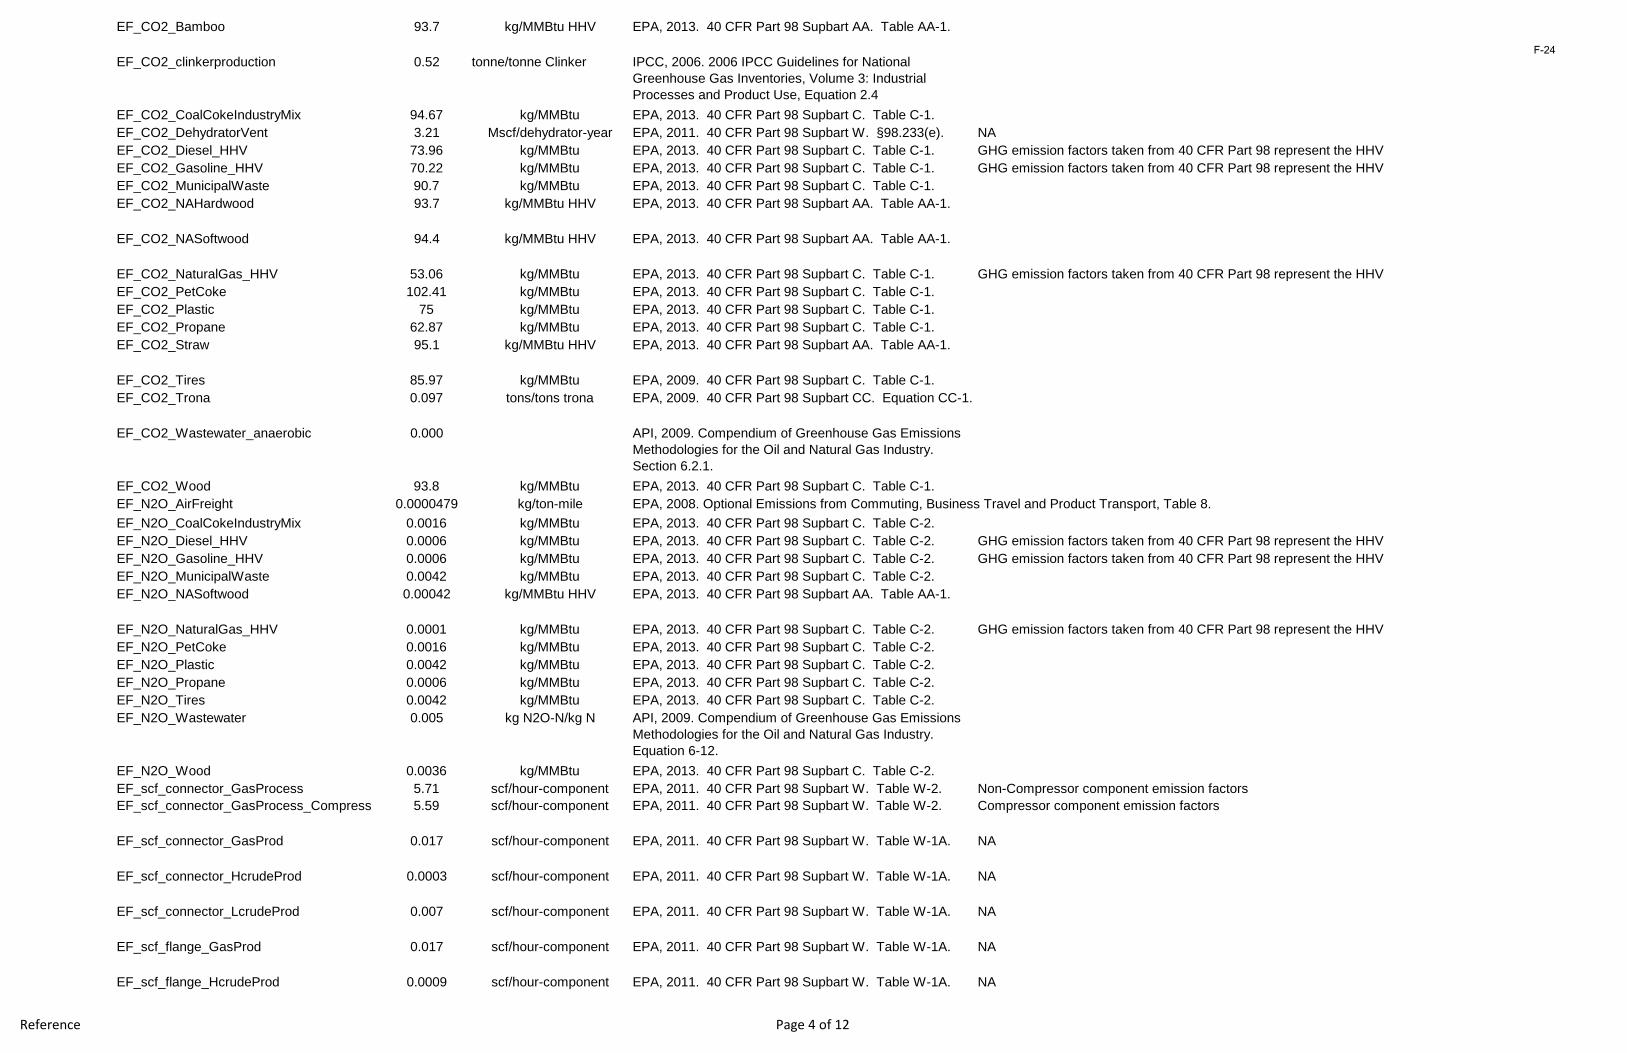
EF_CO2_Bamboo 93.7 kg/MMBtu HHV EPA, 2013. 40 CFR Part 98 Supbart AA. Table AA-1.
EF_CO2_clinkerproduction 0.52 tonne/tonne Clinker IPCC, 2006. 2006 IPCC Guidelines for National Greenhouse Gas Inventories, Volume 3: Industrial Processes and Product Use, Equation 2.4
EF_CO2_CoalCokeIndustryMix 94.67 kg/MMBtu EPA, 2013. 40 CFR Part 98 Supbart C. Table C-1.EF_CO2_DehydratorVent 3.21 Mscf/dehydrator-year EPA, 2011. 40 CFR Part 98 Supbart W. §98.233(e). NAEF_CO2_Diesel_HHV 73.96 kg/MMBtu EPA, 2013. 40 CFR Part 98 Supbart C. Table C-1. GHG emission factors taken from 40 CFR Part 98 represent the HHVEF_CO2_Gasoline_HHV 70.22 kg/MMBtu EPA, 2013. 40 CFR Part 98 Supbart C. Table C-1. GHG emission factors taken from 40 CFR Part 98 represent the HHVEF_CO2_MunicipalWaste 90.7 kg/MMBtu EPA, 2013. 40 CFR Part 98 Supbart C. Table C-1.EF_CO2_NAHardwood 93.7 kg/MMBtu HHV EPA, 2013. 40 CFR Part 98 Supbart AA. Table AA-1.
EF_CO2_NASoftwood 94.4 kg/MMBtu HHV EPA, 2013. 40 CFR Part 98 Supbart AA. Table AA-1.
EF_CO2_NaturalGas_HHV 53.06 kg/MMBtu EPA, 2013. 40 CFR Part 98 Supbart C. Table C-1. GHG emission factors taken from 40 CFR Part 98 represent the HHVEF_CO2_PetCoke 102.41 kg/MMBtu EPA, 2013. 40 CFR Part 98 Supbart C. Table C-1.EF_CO2_Plastic 75 kg/MMBtu EPA, 2013. 40 CFR Part 98 Supbart C. Table C-1.EF_CO2_Propane 62.87 kg/MMBtu EPA, 2013. 40 CFR Part 98 Supbart C. Table C-1.EF_CO2_Straw 95.1 kg/MMBtu HHV EPA, 2013. 40 CFR Part 98 Supbart AA. Table AA-1.
EF_CO2_Tires 85.97 kg/MMBtu EPA, 2009. 40 CFR Part 98 Supbart C. Table C-1.EF_CO2_Trona 0.097 tons/tons trona EPA, 2009. 40 CFR Part 98 Supbart CC. Equation CC-1.
EF_CO2_Wastewater_anaerobic 0.000 API, 2009. Compendium of Greenhouse Gas Emissions Methodologies for the Oil and Natural Gas Industry. Section 6.2.1.
EF_CO2_Wood 93.8 kg/MMBtu EPA, 2013. 40 CFR Part 98 Supbart C. Table C-1.EF_N2O_AirFreight 0.0000479 kg/ton-mile EPA, 2008. Optional Emissions from Commuting, Business Travel and Product Transport, Table 8.EF_N2O_CoalCokeIndustryMix 0.0016 kg/MMBtu EPA, 2013. 40 CFR Part 98 Supbart C. Table C-2.EF_N2O_Diesel_HHV 0.0006 kg/MMBtu EPA, 2013. 40 CFR Part 98 Supbart C. Table C-2. GHG emission factors taken from 40 CFR Part 98 represent the HHVEF_N2O_Gasoline_HHV 0.0006 kg/MMBtu EPA, 2013. 40 CFR Part 98 Supbart C. Table C-2. GHG emission factors taken from 40 CFR Part 98 represent the HHVEF_N2O_MunicipalWaste 0.0042 kg/MMBtu EPA, 2013. 40 CFR Part 98 Supbart C. Table C-2.EF_N2O_NASoftwood 0.00042 kg/MMBtu HHV EPA, 2013. 40 CFR Part 98 Supbart AA. Table AA-1.
EF_N2O_NaturalGas_HHV 0.0001 kg/MMBtu EPA, 2013. 40 CFR Part 98 Supbart C. Table C-2. GHG emission factors taken from 40 CFR Part 98 represent the HHVEF_N2O_PetCoke 0.0016 kg/MMBtu EPA, 2013. 40 CFR Part 98 Supbart C. Table C-2.EF_N2O_Plastic 0.0042 kg/MMBtu EPA, 2013. 40 CFR Part 98 Supbart C. Table C-2.EF_N2O_Propane 0.0006 kg/MMBtu EPA, 2013. 40 CFR Part 98 Supbart C. Table C-2.EF_N2O_Tires 0.0042 kg/MMBtu EPA, 2013. 40 CFR Part 98 Supbart C. Table C-2.EF_N2O_Wastewater 0.005 kg N2O-N/kg N API, 2009. Compendium of Greenhouse Gas Emissions
Methodologies for the Oil and Natural Gas Industry. Equation 6-12.
EF_N2O_Wood 0.0036 kg/MMBtu EPA, 2013. 40 CFR Part 98 Supbart C. Table C-2.EF_scf_connector_GasProcess 5.71 scf/hour-component EPA, 2011. 40 CFR Part 98 Supbart W. Table W-2. Non-Compressor component emission factorsEF_scf_connector_GasProcess_Compress 5.59 scf/hour-component EPA, 2011. 40 CFR Part 98 Supbart W. Table W-2. Compressor component emission factors
EF_scf_connector_GasProd 0.017 scf/hour-component EPA, 2011. 40 CFR Part 98 Supbart W. Table W-1A. NA
EF_scf_connector_HcrudeProd 0.0003 scf/hour-component EPA, 2011. 40 CFR Part 98 Supbart W. Table W-1A. NA
EF_scf_connector_LcrudeProd 0.007 scf/hour-component EPA, 2011. 40 CFR Part 98 Supbart W. Table W-1A. NA
EF_scf_flange_GasProd 0.017 scf/hour-component EPA, 2011. 40 CFR Part 98 Supbart W. Table W-1A. NA
EF_scf_flange_HcrudeProd 0.0009 scf/hour-component EPA, 2011. 40 CFR Part 98 Supbart W. Table W-1A. NA
F-24
Reference Page 5 of 12
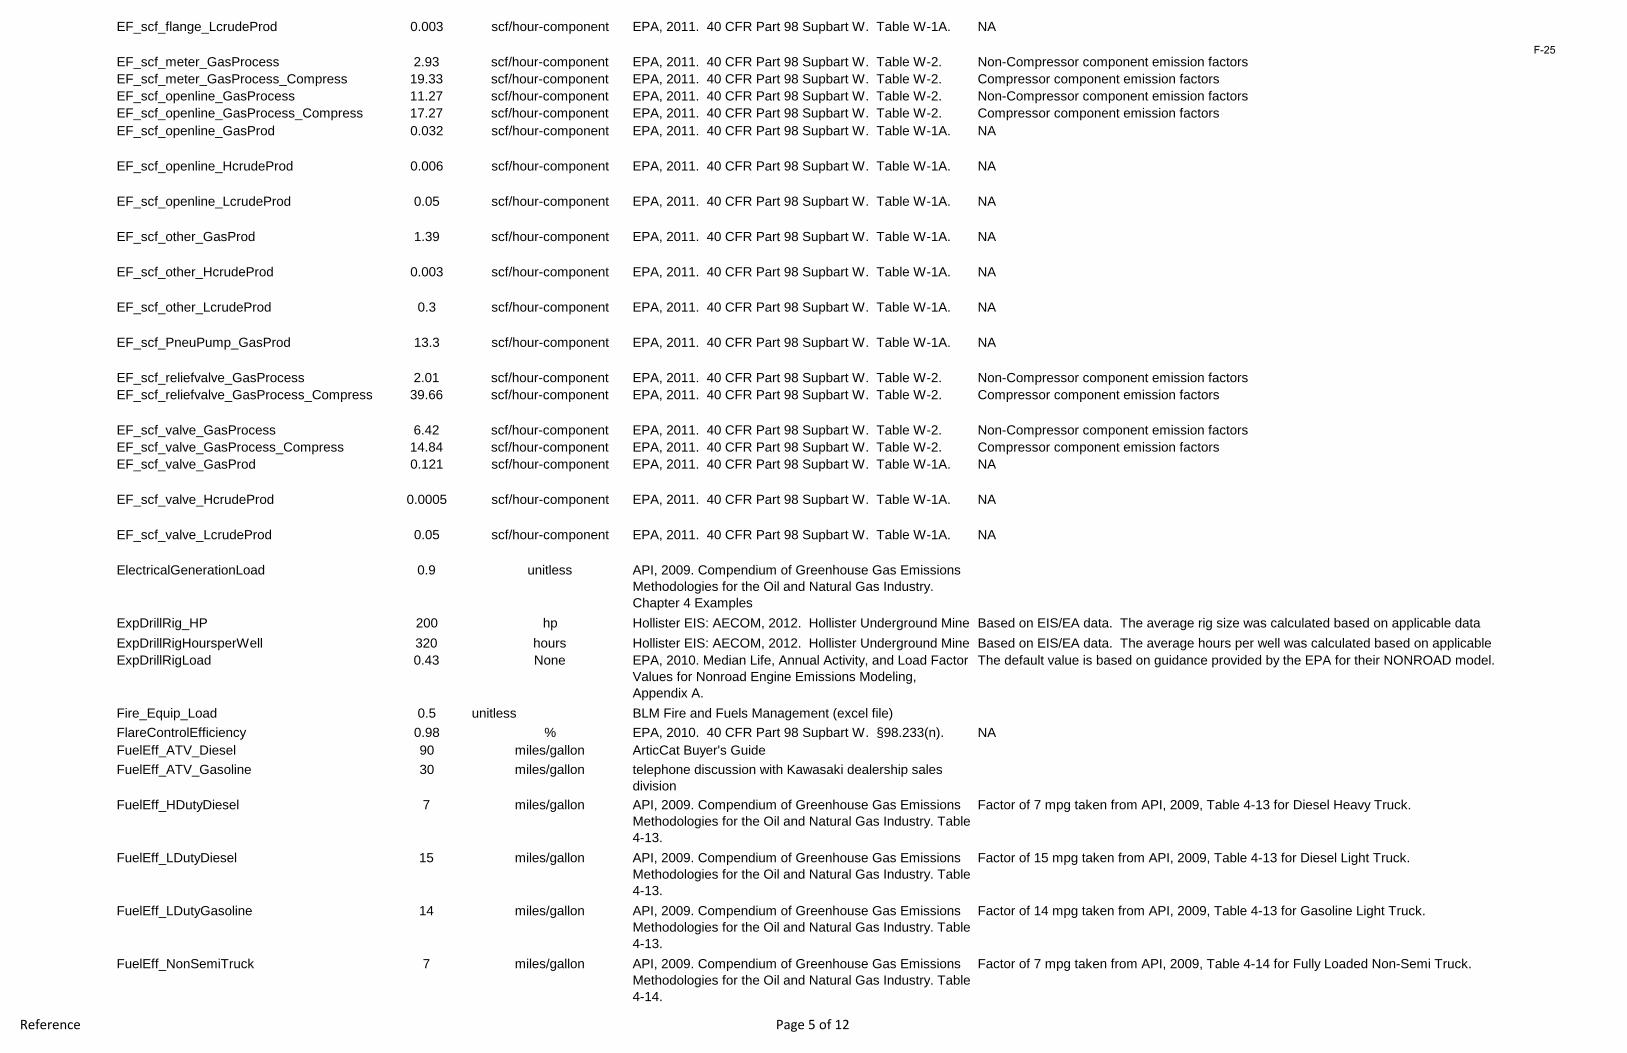
EF_scf_flange_LcrudeProd 0.003 scf/hour-component EPA, 2011. 40 CFR Part 98 Supbart W. Table W-1A. NA
EF_scf_meter_GasProcess 2.93 scf/hour-component EPA, 2011. 40 CFR Part 98 Supbart W. Table W-2. Non-Compressor component emission factorsEF_scf_meter_GasProcess_Compress 19.33 scf/hour-component EPA, 2011. 40 CFR Part 98 Supbart W. Table W-2. Compressor component emission factorsEF_scf_openline_GasProcess 11.27 scf/hour-component EPA, 2011. 40 CFR Part 98 Supbart W. Table W-2. Non-Compressor component emission factorsEF_scf_openline_GasProcess_Compress 17.27 scf/hour-component EPA, 2011. 40 CFR Part 98 Supbart W. Table W-2. Compressor component emission factorsEF_scf_openline_GasProd 0.032 scf/hour-component EPA, 2011. 40 CFR Part 98 Supbart W. Table W-1A. NA
EF_scf_openline_HcrudeProd 0.006 scf/hour-component EPA, 2011. 40 CFR Part 98 Supbart W. Table W-1A. NA
EF_scf_openline_LcrudeProd 0.05 scf/hour-component EPA, 2011. 40 CFR Part 98 Supbart W. Table W-1A. NA
EF_scf_other_GasProd 1.39 scf/hour-component EPA, 2011. 40 CFR Part 98 Supbart W. Table W-1A. NA
EF_scf_other_HcrudeProd 0.003 scf/hour-component EPA, 2011. 40 CFR Part 98 Supbart W. Table W-1A. NA
EF_scf_other_LcrudeProd 0.3 scf/hour-component EPA, 2011. 40 CFR Part 98 Supbart W. Table W-1A. NA
EF_scf_PneuPump_GasProd 13.3 scf/hour-component EPA, 2011. 40 CFR Part 98 Supbart W. Table W-1A. NA
EF_scf_reliefvalve_GasProcess 2.01 scf/hour-component EPA, 2011. 40 CFR Part 98 Supbart W. Table W-2. Non-Compressor component emission factorsEF_scf_reliefvalve_GasProcess_Compress 39.66 scf/hour-component EPA, 2011. 40 CFR Part 98 Supbart W. Table W-2. Compressor component emission factors
EF_scf_valve_GasProcess 6.42 scf/hour-component EPA, 2011. 40 CFR Part 98 Supbart W. Table W-2. Non-Compressor component emission factorsEF_scf_valve_GasProcess_Compress 14.84 scf/hour-component EPA, 2011. 40 CFR Part 98 Supbart W. Table W-2. Compressor component emission factorsEF_scf_valve_GasProd 0.121 scf/hour-component EPA, 2011. 40 CFR Part 98 Supbart W. Table W-1A. NA
EF_scf_valve_HcrudeProd 0.0005 scf/hour-component EPA, 2011. 40 CFR Part 98 Supbart W. Table W-1A. NA
EF_scf_valve_LcrudeProd 0.05 scf/hour-component EPA, 2011. 40 CFR Part 98 Supbart W. Table W-1A. NA
ElectricalGenerationLoad 0.9 unitless API, 2009. Compendium of Greenhouse Gas Emissions Methodologies for the Oil and Natural Gas Industry. Chapter 4 Examples
ExpDrillRig_HP 200 hp Hollister EIS: AECOM, 2012. Hollister Underground Mine
Based on EIS/EA data. The average rig size was calculated based on applicable data ExpDrillRigHoursperWell 320 hours Hollister EIS: AECOM, 2012. Hollister Underground Mine
Based on EIS/EA data. The average hours per well was calculated based on applicable
ExpDrillRigLoad 0.43 None EPA, 2010. Median Life, Annual Activity, and Load Factor Values for Nonroad Engine Emissions Modeling, Appendix A.
The default value is based on guidance provided by the EPA for their NONROAD model.
Fire_Equip_Load 0.5 unitless BLM Fire and Fuels Management (excel file)FlareControlEfficiency 0.98 % EPA, 2010. 40 CFR Part 98 Supbart W. §98.233(n). NAFuelEff_ATV_Diesel 90 miles/gallon ArticCat Buyer's GuideFuelEff_ATV_Gasoline 30 miles/gallon telephone discussion with Kawasaki dealership sales
divisionFuelEff_HDutyDiesel 7 miles/gallon API, 2009. Compendium of Greenhouse Gas Emissions
Methodologies for the Oil and Natural Gas Industry. Table 4-13.
Factor of 7 mpg taken from API, 2009, Table 4-13 for Diesel Heavy Truck.
FuelEff_LDutyDiesel 15 miles/gallon API, 2009. Compendium of Greenhouse Gas Emissions Methodologies for the Oil and Natural Gas Industry. Table 4-13.
Factor of 15 mpg taken from API, 2009, Table 4-13 for Diesel Light Truck.
FuelEff_LDutyGasoline 14 miles/gallon API, 2009. Compendium of Greenhouse Gas Emissions Methodologies for the Oil and Natural Gas Industry. Table 4-13.
Factor of 14 mpg taken from API, 2009, Table 4-13 for Gasoline Light Truck.
FuelEff_NonSemiTruck 7 miles/gallon API, 2009. Compendium of Greenhouse Gas Emissions Methodologies for the Oil and Natural Gas Industry. Table 4-14.
Factor of 7 mpg taken from API, 2009, Table 4-14 for Fully Loaded Non-Semi Truck.
F-25
Reference Page 6 of 12
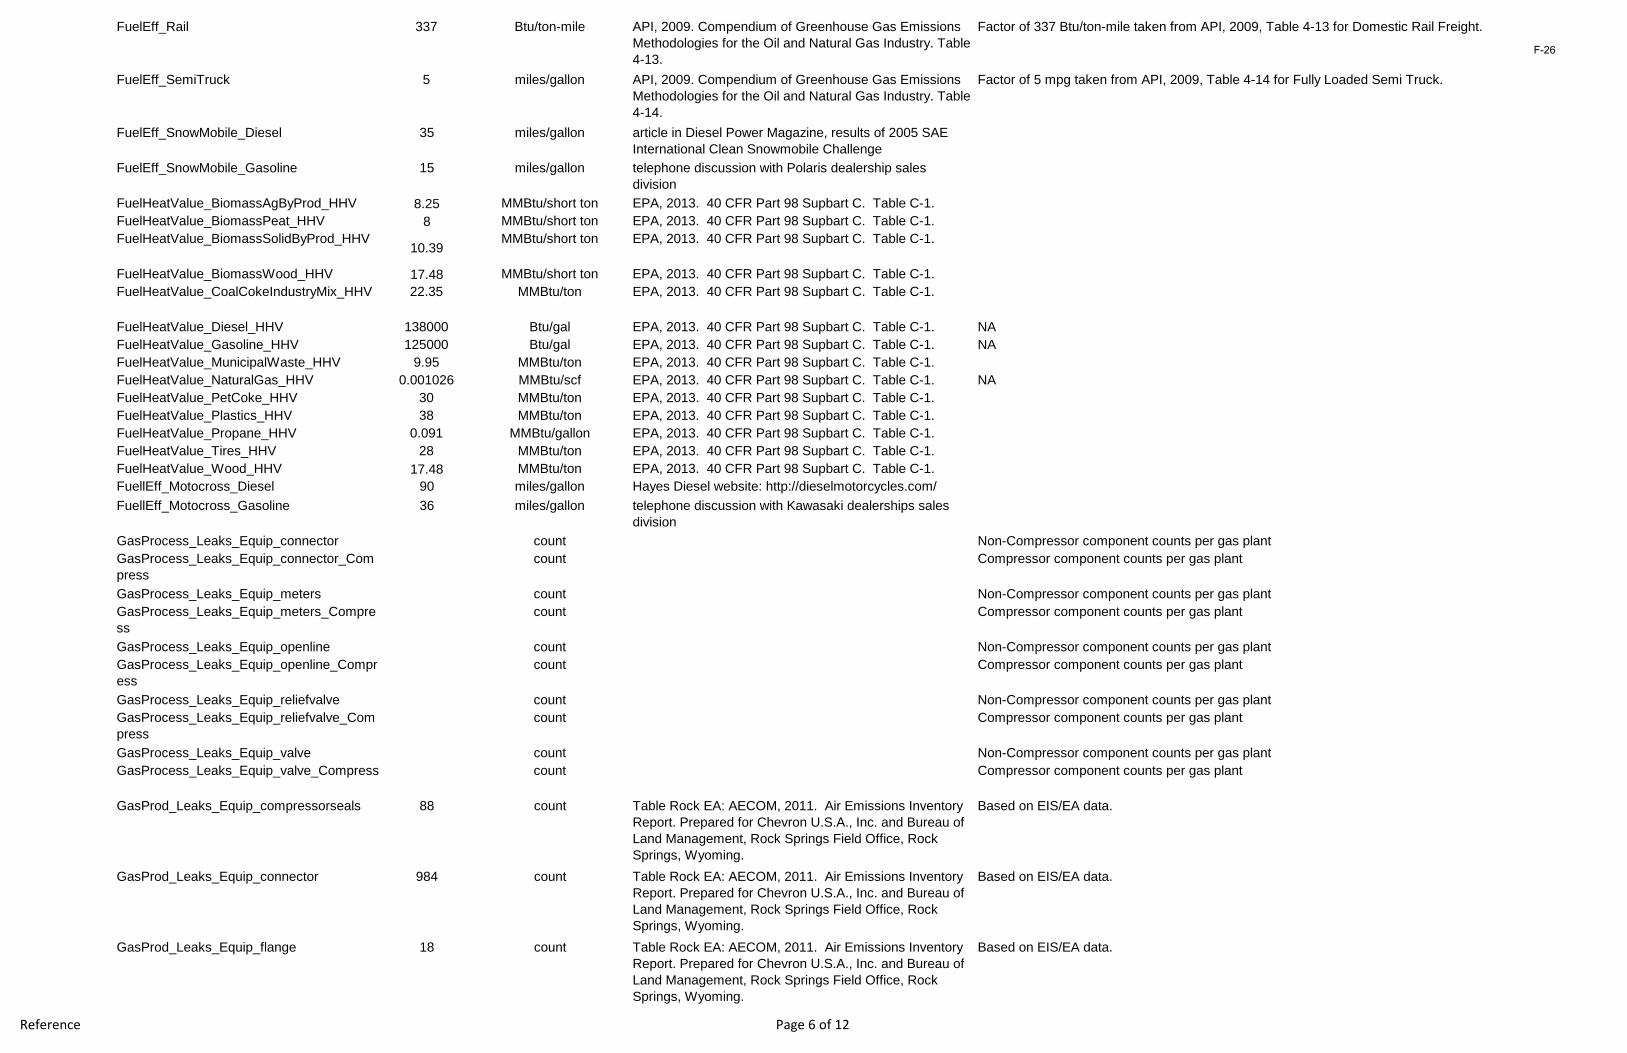
FuelEff_Rail 337 Btu/ton-mile API, 2009. Compendium of Greenhouse Gas Emissions Methodologies for the Oil and Natural Gas Industry. Table 4-13.
Factor of 337 Btu/ton-mile taken from API, 2009, Table 4-13 for Domestic Rail Freight.
FuelEff_SemiTruck 5 miles/gallon API, 2009. Compendium of Greenhouse Gas Emissions Methodologies for the Oil and Natural Gas Industry. Table 4-14.
Factor of 5 mpg taken from API, 2009, Table 4-14 for Fully Loaded Semi Truck.
FuelEff_SnowMobile_Diesel 35 miles/gallon article in Diesel Power Magazine, results of 2005 SAE International Clean Snowmobile Challenge
FuelEff_SnowMobile_Gasoline 15 miles/gallon telephone discussion with Polaris dealership sales division
FuelHeatValue_BiomassAgByProd_HHV 8.25 MMBtu/short ton EPA, 2013. 40 CFR Part 98 Supbart C. Table C-1.FuelHeatValue_BiomassPeat_HHV 8 MMBtu/short ton EPA, 2013. 40 CFR Part 98 Supbart C. Table C-1.FuelHeatValue_BiomassSolidByProd_HHV
10.39MMBtu/short ton EPA, 2013. 40 CFR Part 98 Supbart C. Table C-1.
FuelHeatValue_BiomassWood_HHV 17.48 MMBtu/short ton EPA, 2013. 40 CFR Part 98 Supbart C. Table C-1.FuelHeatValue_CoalCokeIndustryMix_HHV 22.35 MMBtu/ton EPA, 2013. 40 CFR Part 98 Supbart C. Table C-1.
FuelHeatValue_Diesel_HHV 138000 Btu/gal EPA, 2013. 40 CFR Part 98 Supbart C. Table C-1. NAFuelHeatValue_Gasoline_HHV 125000 Btu/gal EPA, 2013. 40 CFR Part 98 Supbart C. Table C-1. NAFuelHeatValue_MunicipalWaste_HHV 9.95 MMBtu/ton EPA, 2013. 40 CFR Part 98 Supbart C. Table C-1.FuelHeatValue_NaturalGas_HHV 0.001026 MMBtu/scf EPA, 2013. 40 CFR Part 98 Supbart C. Table C-1. NAFuelHeatValue_PetCoke_HHV 30 MMBtu/ton EPA, 2013. 40 CFR Part 98 Supbart C. Table C-1.FuelHeatValue_Plastics_HHV 38 MMBtu/ton EPA, 2013. 40 CFR Part 98 Supbart C. Table C-1.FuelHeatValue_Propane_HHV 0.091 MMBtu/gallon EPA, 2013. 40 CFR Part 98 Supbart C. Table C-1.FuelHeatValue_Tires_HHV 28 MMBtu/ton EPA, 2013. 40 CFR Part 98 Supbart C. Table C-1.FuelHeatValue_Wood_HHV 17.48 MMBtu/ton EPA, 2013. 40 CFR Part 98 Supbart C. Table C-1.FuellEff_Motocross_Diesel 90 miles/gallon Hayes Diesel website: http://dieselmotorcycles.com/FuellEff_Motocross_Gasoline 36 miles/gallon telephone discussion with Kawasaki dealerships sales
divisionGasProcess_Leaks_Equip_connector count Non-Compressor component counts per gas plantGasProcess_Leaks_Equip_connector_Compress
count Compressor component counts per gas plant
GasProcess_Leaks_Equip_meters count Non-Compressor component counts per gas plantGasProcess_Leaks_Equip_meters_Compress
count Compressor component counts per gas plant
GasProcess_Leaks_Equip_openline count Non-Compressor component counts per gas plantGasProcess_Leaks_Equip_openline_Compress
count Compressor component counts per gas plant
GasProcess_Leaks_Equip_reliefvalve count Non-Compressor component counts per gas plantGasProcess_Leaks_Equip_reliefvalve_Compress
count Compressor component counts per gas plant
GasProcess_Leaks_Equip_valve count Non-Compressor component counts per gas plantGasProcess_Leaks_Equip_valve_Compress count Compressor component counts per gas plant
GasProd_Leaks_Equip_compressorseals 88 count Table Rock EA: AECOM, 2011. Air Emissions Inventory Report. Prepared for Chevron U.S.A., Inc. and Bureau of Land Management, Rock Springs Field Office, Rock Springs, Wyoming.
Based on EIS/EA data.
GasProd_Leaks_Equip_connector 984 count Table Rock EA: AECOM, 2011. Air Emissions Inventory Report. Prepared for Chevron U.S.A., Inc. and Bureau of Land Management, Rock Springs Field Office, Rock Springs, Wyoming.
Based on EIS/EA data.
GasProd_Leaks_Equip_flange 18 count Table Rock EA: AECOM, 2011. Air Emissions Inventory Report. Prepared for Chevron U.S.A., Inc. and Bureau of Land Management, Rock Springs Field Office, Rock Springs, Wyoming.
Based on EIS/EA data.
F-26
Reference Page 7 of 12
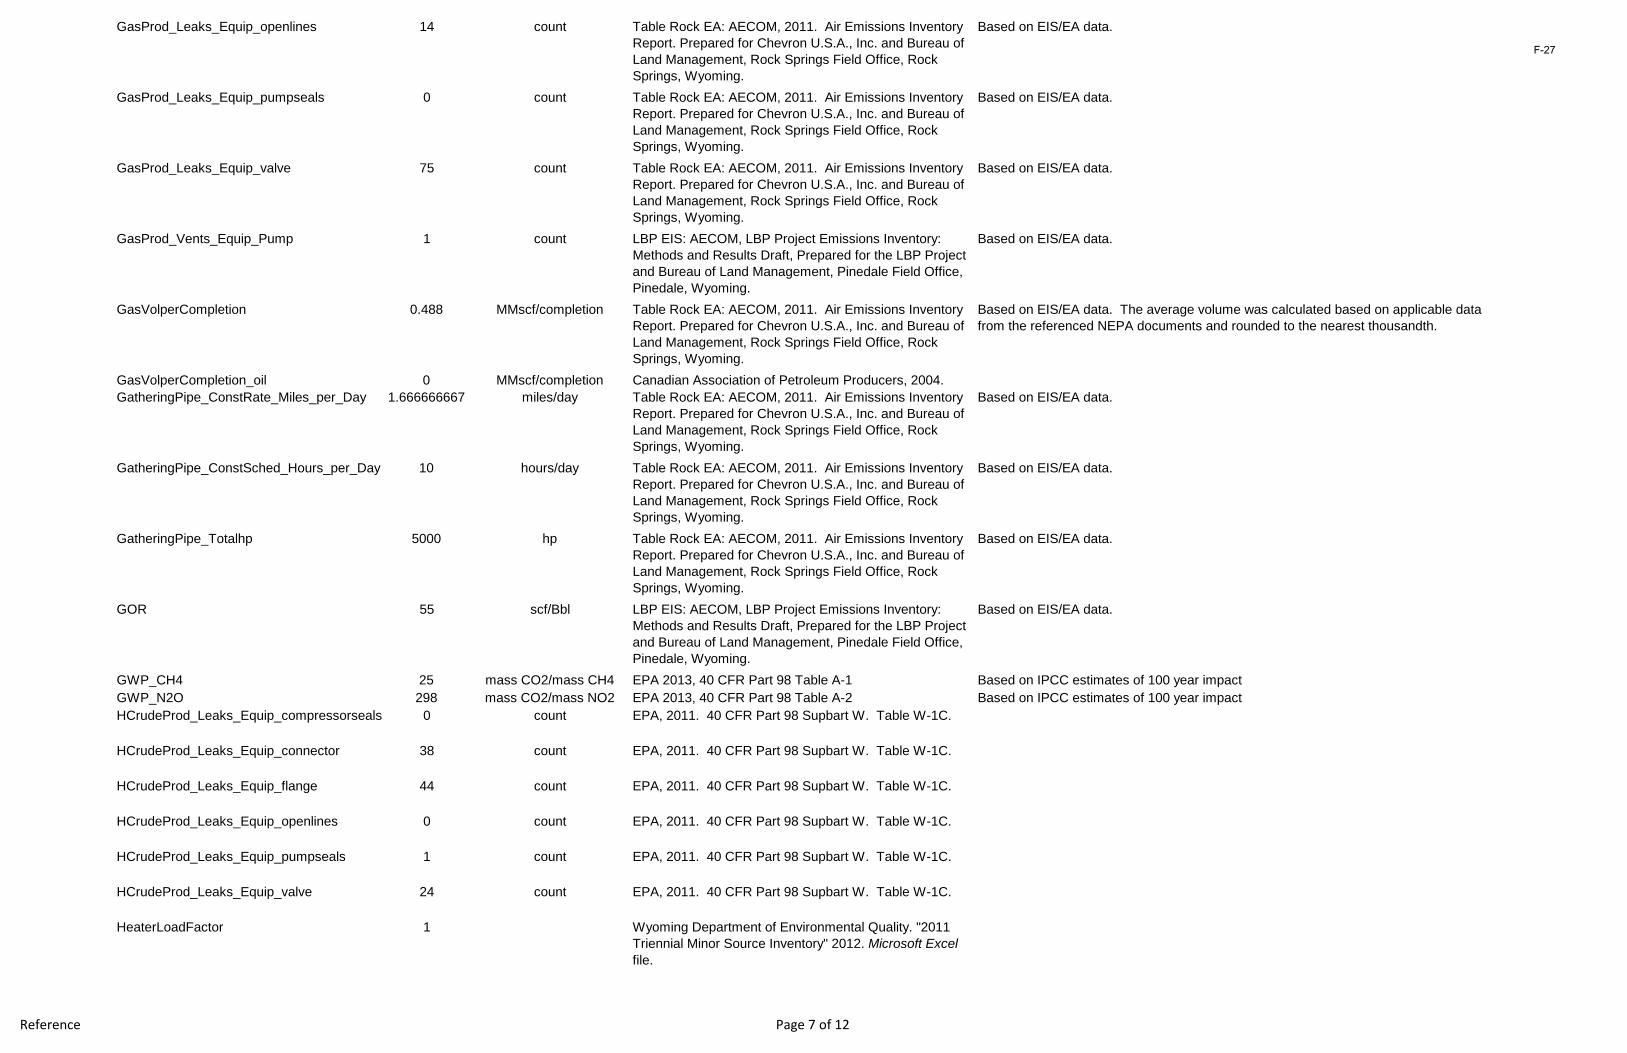
GasProd_Leaks_Equip_openlines 14 count Table Rock EA: AECOM, 2011. Air Emissions Inventory Report. Prepared for Chevron U.S.A., Inc. and Bureau of Land Management, Rock Springs Field Office, Rock Springs, Wyoming.
Based on EIS/EA data.
GasProd_Leaks_Equip_pumpseals 0 count Table Rock EA: AECOM, 2011. Air Emissions Inventory Report. Prepared for Chevron U.S.A., Inc. and Bureau of Land Management, Rock Springs Field Office, Rock Springs, Wyoming.
Based on EIS/EA data.
GasProd_Leaks_Equip_valve 75 count Table Rock EA: AECOM, 2011. Air Emissions Inventory Report. Prepared for Chevron U.S.A., Inc. and Bureau of Land Management, Rock Springs Field Office, Rock Springs, Wyoming.
Based on EIS/EA data.
GasProd_Vents_Equip_Pump 1 count LBP EIS: AECOM, LBP Project Emissions Inventory: Methods and Results Draft, Prepared for the LBP Project and Bureau of Land Management, Pinedale Field Office, Pinedale, Wyoming.
Based on EIS/EA data.
GasVolperCompletion 0.488 MMscf/completion Table Rock EA: AECOM, 2011. Air Emissions Inventory Report. Prepared for Chevron U.S.A., Inc. and Bureau of Land Management, Rock Springs Field Office, Rock Springs, Wyoming.
Based on EIS/EA data. The average volume was calculated based on applicable data from the referenced NEPA documents and rounded to the nearest thousandth.
GasVolperCompletion_oil 0 MMscf/completion Canadian Association of Petroleum Producers, 2004.GatheringPipe_ConstRate_Miles_per_Day 1.666666667 miles/day Table Rock EA: AECOM, 2011. Air Emissions Inventory
Report. Prepared for Chevron U.S.A., Inc. and Bureau of Land Management, Rock Springs Field Office, Rock Springs, Wyoming.
Based on EIS/EA data.
GatheringPipe_ConstSched_Hours_per_Day 10 hours/day Table Rock EA: AECOM, 2011. Air Emissions Inventory Report. Prepared for Chevron U.S.A., Inc. and Bureau of Land Management, Rock Springs Field Office, Rock Springs, Wyoming.
Based on EIS/EA data.
GatheringPipe_Totalhp 5000 hp Table Rock EA: AECOM, 2011. Air Emissions Inventory Report. Prepared for Chevron U.S.A., Inc. and Bureau of Land Management, Rock Springs Field Office, Rock Springs, Wyoming.
Based on EIS/EA data.
GOR 55 scf/Bbl LBP EIS: AECOM, LBP Project Emissions Inventory: Methods and Results Draft, Prepared for the LBP Project and Bureau of Land Management, Pinedale Field Office, Pinedale, Wyoming.
Based on EIS/EA data.
GWP_CH4 25 mass CO2/mass CH4 EPA 2013, 40 CFR Part 98 Table A-1 Based on IPCC estimates of 100 year impactGWP_N2O 298 mass CO2/mass NO2 EPA 2013, 40 CFR Part 98 Table A-2 Based on IPCC estimates of 100 year impactHCrudeProd_Leaks_Equip_compressorseals 0 count EPA, 2011. 40 CFR Part 98 Supbart W. Table W-1C.
HCrudeProd_Leaks_Equip_connector 38 count EPA, 2011. 40 CFR Part 98 Supbart W. Table W-1C.
HCrudeProd_Leaks_Equip_flange 44 count EPA, 2011. 40 CFR Part 98 Supbart W. Table W-1C.
HCrudeProd_Leaks_Equip_openlines 0 count EPA, 2011. 40 CFR Part 98 Supbart W. Table W-1C.
HCrudeProd_Leaks_Equip_pumpseals 1 count EPA, 2011. 40 CFR Part 98 Supbart W. Table W-1C.
HCrudeProd_Leaks_Equip_valve 24 count EPA, 2011. 40 CFR Part 98 Supbart W. Table W-1C.
HeaterLoadFactor 1 Wyoming Department of Environmental Quality. "2011 Triennial Minor Source Inventory" 2012. Microsoft Excel file.
F-27
Reference Page 8 of 12
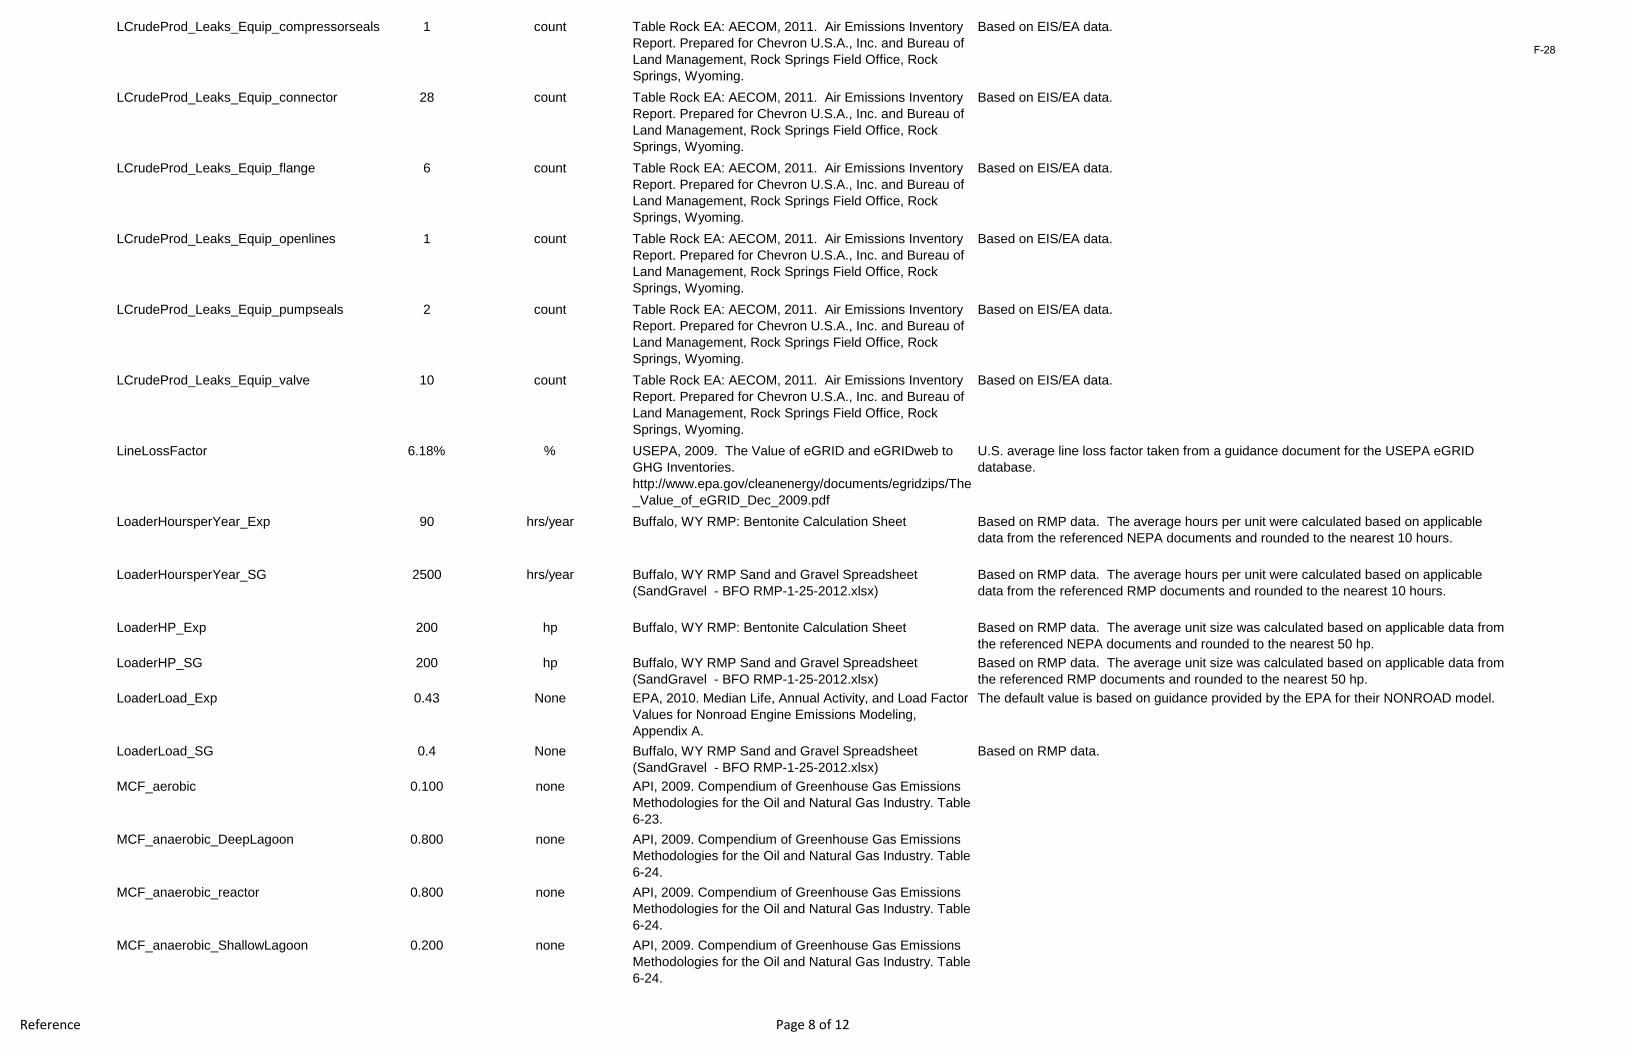
LCrudeProd_Leaks_Equip_compressorseals 1 count Table Rock EA: AECOM, 2011. Air Emissions Inventory Report. Prepared for Chevron U.S.A., Inc. and Bureau of Land Management, Rock Springs Field Office, Rock Springs, Wyoming.
Based on EIS/EA data.
LCrudeProd_Leaks_Equip_connector 28 count Table Rock EA: AECOM, 2011. Air Emissions Inventory Report. Prepared for Chevron U.S.A., Inc. and Bureau of Land Management, Rock Springs Field Office, Rock Springs, Wyoming.
Based on EIS/EA data.
LCrudeProd_Leaks_Equip_flange 6 count Table Rock EA: AECOM, 2011. Air Emissions Inventory Report. Prepared for Chevron U.S.A., Inc. and Bureau of Land Management, Rock Springs Field Office, Rock Springs, Wyoming.
Based on EIS/EA data.
LCrudeProd_Leaks_Equip_openlines 1 count Table Rock EA: AECOM, 2011. Air Emissions Inventory Report. Prepared for Chevron U.S.A., Inc. and Bureau of Land Management, Rock Springs Field Office, Rock Springs, Wyoming.
Based on EIS/EA data.
LCrudeProd_Leaks_Equip_pumpseals 2 count Table Rock EA: AECOM, 2011. Air Emissions Inventory Report. Prepared for Chevron U.S.A., Inc. and Bureau of Land Management, Rock Springs Field Office, Rock Springs, Wyoming.
Based on EIS/EA data.
LCrudeProd_Leaks_Equip_valve 10 count Table Rock EA: AECOM, 2011. Air Emissions Inventory Report. Prepared for Chevron U.S.A., Inc. and Bureau of Land Management, Rock Springs Field Office, Rock Springs, Wyoming.
Based on EIS/EA data.
LineLossFactor 6.18% % USEPA, 2009. The Value of eGRID and eGRIDweb to GHG Inventories. http://www.epa.gov/cleanenergy/documents/egridzips/The_Value_of_eGRID_Dec_2009.pdf
U.S. average line loss factor taken from a guidance document for the USEPA eGRID database.
LoaderHoursperYear_Exp 90 hrs/year Buffalo, WY RMP: Bentonite Calculation Sheet Based on RMP data. The average hours per unit were calculated based on applicable data from the referenced NEPA documents and rounded to the nearest 10 hours.
LoaderHoursperYear_SG 2500 hrs/year Buffalo, WY RMP Sand and Gravel Spreadsheet (SandGravel - BFO RMP-1-25-2012.xlsx)
Based on RMP data. The average hours per unit were calculated based on applicable data from the referenced RMP documents and rounded to the nearest 10 hours.
LoaderHP_Exp 200 hp Buffalo, WY RMP: Bentonite Calculation Sheet Based on RMP data. The average unit size was calculated based on applicable data from the referenced NEPA documents and rounded to the nearest 50 hp.
LoaderHP_SG 200 hp Buffalo, WY RMP Sand and Gravel Spreadsheet (SandGravel - BFO RMP-1-25-2012.xlsx)
Based on RMP data. The average unit size was calculated based on applicable data from the referenced RMP documents and rounded to the nearest 50 hp.
LoaderLoad_Exp 0.43 None EPA, 2010. Median Life, Annual Activity, and Load Factor Values for Nonroad Engine Emissions Modeling, Appendix A.
The default value is based on guidance provided by the EPA for their NONROAD model.
LoaderLoad_SG 0.4 None Buffalo, WY RMP Sand and Gravel Spreadsheet (SandGravel - BFO RMP-1-25-2012.xlsx)
Based on RMP data.
MCF_aerobic 0.100 none API, 2009. Compendium of Greenhouse Gas Emissions Methodologies for the Oil and Natural Gas Industry. Table 6-23.
MCF_anaerobic_DeepLagoon 0.800 none API, 2009. Compendium of Greenhouse Gas Emissions Methodologies for the Oil and Natural Gas Industry. Table 6-24.
MCF_anaerobic_reactor 0.800 none API, 2009. Compendium of Greenhouse Gas Emissions Methodologies for the Oil and Natural Gas Industry. Table 6-24.
MCF_anaerobic_ShallowLagoon 0.200 none API, 2009. Compendium of Greenhouse Gas Emissions Methodologies for the Oil and Natural Gas Industry. Table 6-24.
F-28
Reference Page 9 of 12
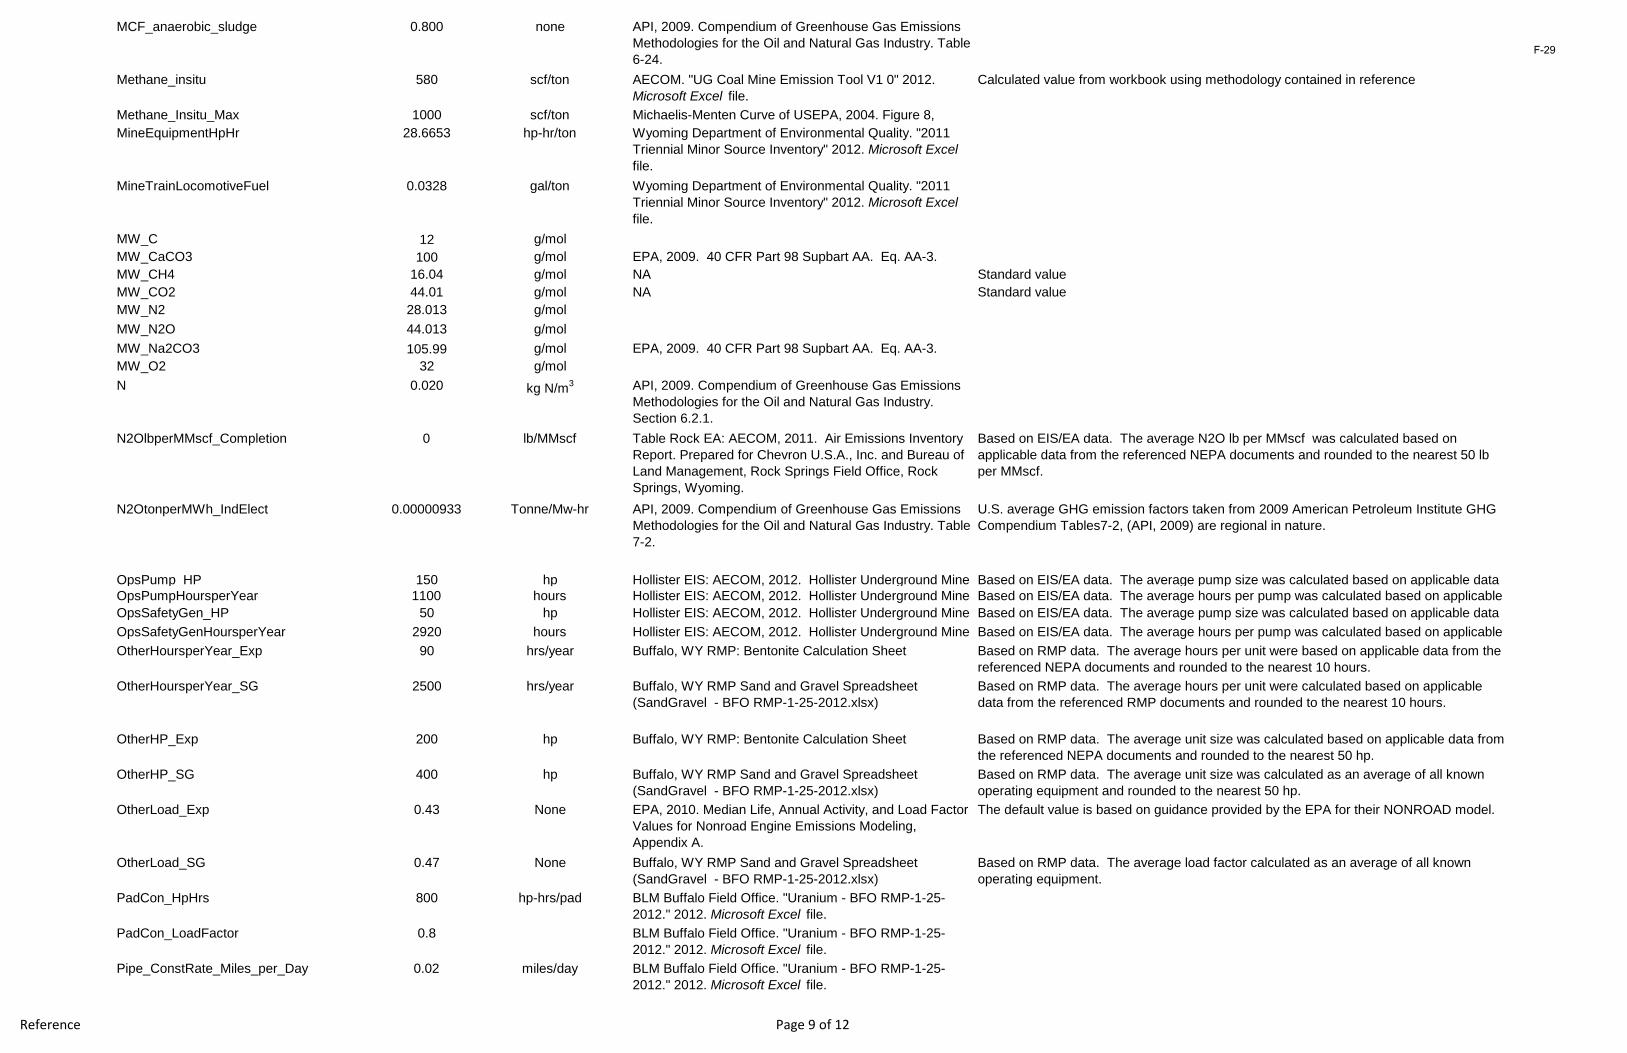
MCF_anaerobic_sludge 0.800 none API, 2009. Compendium of Greenhouse Gas Emissions Methodologies for the Oil and Natural Gas Industry. Table 6-24.
Methane_insitu 580 scf/ton AECOM. "UG Coal Mine Emission Tool V1 0" 2012. Microsoft Excel file.
Calculated value from workbook using methodology contained in reference
Methane_Insitu_Max 1000 scf/ton Michaelis-Menten Curve of USEPA, 2004. Figure 8, MineEquipmentHpHr 28.6653 hp-hr/ton Wyoming Department of Environmental Quality. "2011
Triennial Minor Source Inventory" 2012. Microsoft Excel file.
MineTrainLocomotiveFuel 0.0328 gal/ton Wyoming Department of Environmental Quality. "2011 Triennial Minor Source Inventory" 2012. Microsoft Excel file.
MW_C 12 g/molMW_CaCO3 100 g/mol EPA, 2009. 40 CFR Part 98 Supbart AA. Eq. AA-3.MW_CH4 16.04 g/mol NA Standard valueMW_CO2 44.01 g/mol NA Standard valueMW_N2 28.013 g/molMW_N2O 44.013 g/molMW_Na2CO3 105.99 g/mol EPA, 2009. 40 CFR Part 98 Supbart AA. Eq. AA-3.MW_O2 32 g/molN 0.020 kg N/m3 API, 2009. Compendium of Greenhouse Gas Emissions
Methodologies for the Oil and Natural Gas Industry. Section 6.2.1.
N2OlbperMMscf_Completion 0 lb/MMscf Table Rock EA: AECOM, 2011. Air Emissions Inventory Report. Prepared for Chevron U.S.A., Inc. and Bureau of Land Management, Rock Springs Field Office, Rock Springs, Wyoming.
Based on EIS/EA data. The average N2O lb per MMscf was calculated based on applicable data from the referenced NEPA documents and rounded to the nearest 50 lb per MMscf.
N2OtonperMWh_IndElect 0.00000933 Tonne/Mw-hr API, 2009. Compendium of Greenhouse Gas Emissions Methodologies for the Oil and Natural Gas Industry. Table 7-2.
U.S. average GHG emission factors taken from 2009 American Petroleum Institute GHG Compendium Tables7-2, (API, 2009) are regional in nature.
OpsPump_HP 150 hp Hollister EIS: AECOM, 2012. Hollister Underground Mine Based on EIS/EA data. The average pump size was calculated based on applicable data OpsPumpHoursperYear 1100 hours Hollister EIS: AECOM, 2012. Hollister Underground Mine
Based on EIS/EA data. The average hours per pump was calculated based on applicable
OpsSafetyGen_HP 50 hp Hollister EIS: AECOM, 2012. Hollister Underground Mine
Based on EIS/EA data. The average pump size was calculated based on applicable data OpsSafetyGenHoursperYear 2920 hours Hollister EIS: AECOM, 2012. Hollister Underground Mine
Based on EIS/EA data. The average hours per pump was calculated based on applicable
OtherHoursperYear_Exp 90 hrs/year Buffalo, WY RMP: Bentonite Calculation Sheet Based on RMP data. The average hours per unit were based on applicable data from the referenced NEPA documents and rounded to the nearest 10 hours.
OtherHoursperYear_SG 2500 hrs/year Buffalo, WY RMP Sand and Gravel Spreadsheet (SandGravel - BFO RMP-1-25-2012.xlsx)
Based on RMP data. The average hours per unit were calculated based on applicable data from the referenced RMP documents and rounded to the nearest 10 hours.
OtherHP_Exp 200 hp Buffalo, WY RMP: Bentonite Calculation Sheet Based on RMP data. The average unit size was calculated based on applicable data from the referenced NEPA documents and rounded to the nearest 50 hp.
OtherHP_SG 400 hp Buffalo, WY RMP Sand and Gravel Spreadsheet (SandGravel - BFO RMP-1-25-2012.xlsx)
Based on RMP data. The average unit size was calculated as an average of all known operating equipment and rounded to the nearest 50 hp.
OtherLoad_Exp 0.43 None EPA, 2010. Median Life, Annual Activity, and Load Factor Values for Nonroad Engine Emissions Modeling, Appendix A.
The default value is based on guidance provided by the EPA for their NONROAD model.
OtherLoad_SG 0.47 None Buffalo, WY RMP Sand and Gravel Spreadsheet (SandGravel - BFO RMP-1-25-2012.xlsx)
Based on RMP data. The average load factor calculated as an average of all known operating equipment.
PadCon_HpHrs 800 hp-hrs/pad BLM Buffalo Field Office. "Uranium - BFO RMP-1-25-2012." 2012. Microsoft Excel file.
PadCon_LoadFactor 0.8 BLM Buffalo Field Office. "Uranium - BFO RMP-1-25-2012." 2012. Microsoft Excel file.
Pipe_ConstRate_Miles_per_Day 0.02 miles/day BLM Buffalo Field Office. "Uranium - BFO RMP-1-25-2012." 2012. Microsoft Excel file.
F-29
Reference Page 10 of 12
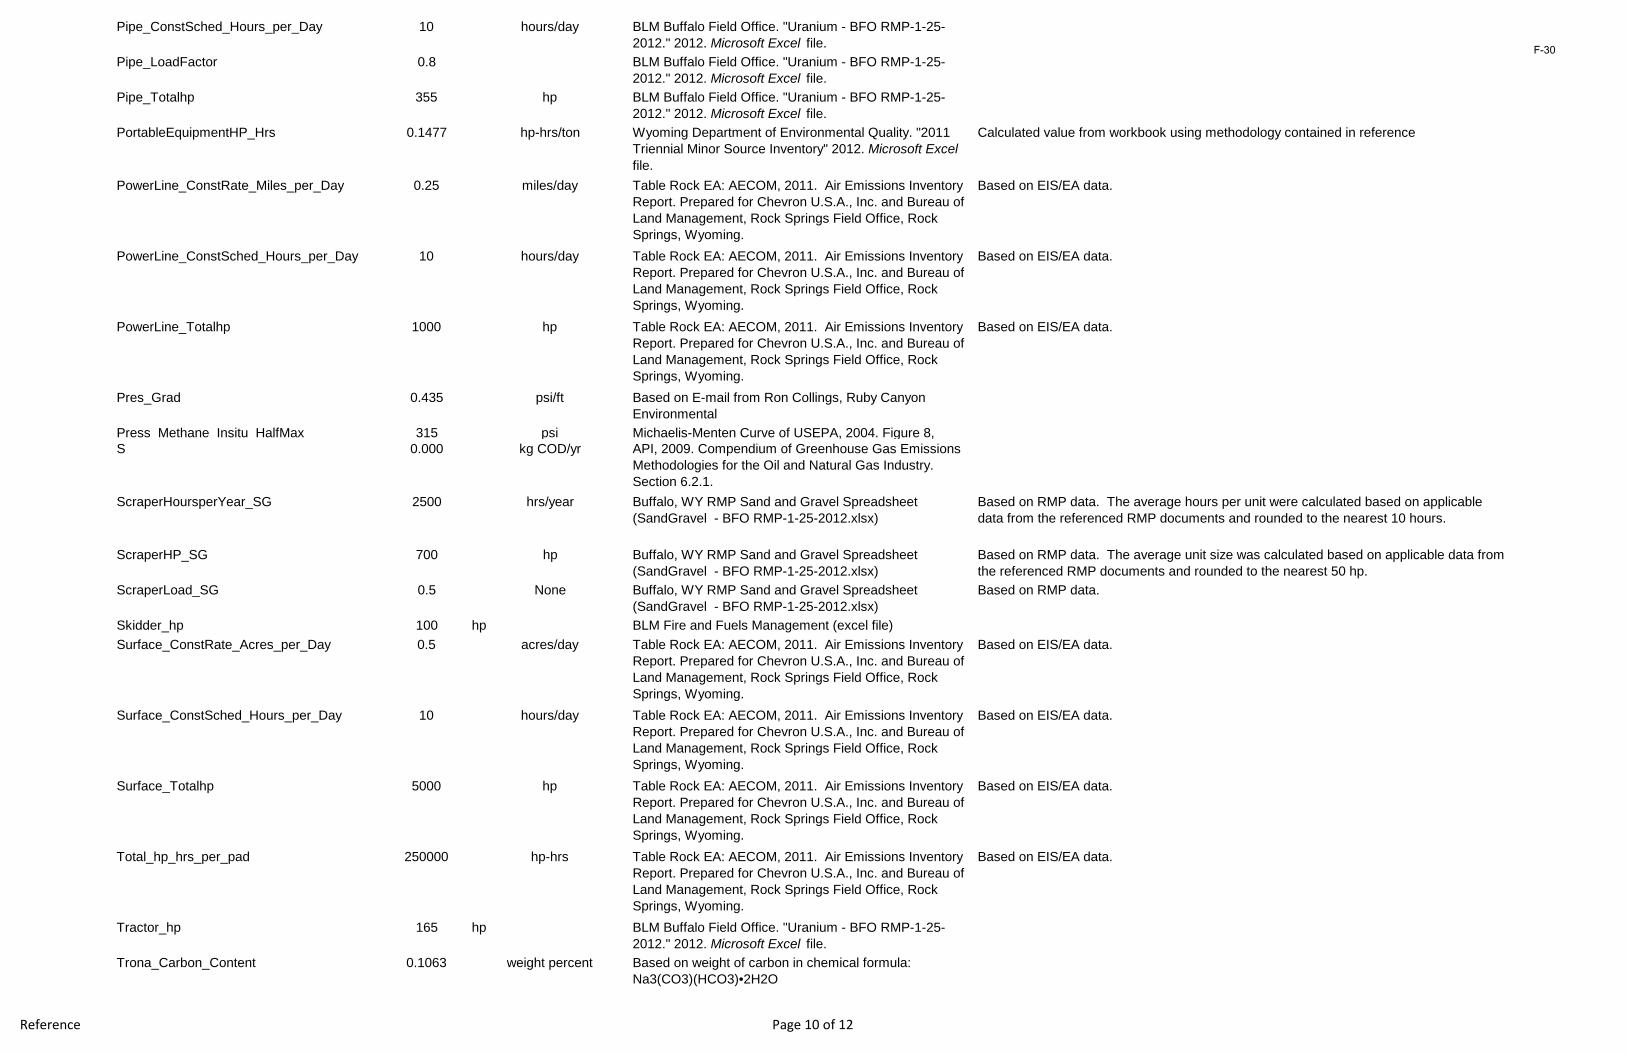
Pipe_ConstSched_Hours_per_Day 10 hours/day BLM Buffalo Field Office. "Uranium - BFO RMP-1-25-2012." 2012. Microsoft Excel file.
Pipe_LoadFactor 0.8 BLM Buffalo Field Office. "Uranium - BFO RMP-1-25-2012." 2012. Microsoft Excel file.
Pipe_Totalhp 355 hp BLM Buffalo Field Office. "Uranium - BFO RMP-1-25-2012." 2012. Microsoft Excel file.
PortableEquipmentHP_Hrs 0.1477 hp-hrs/ton Wyoming Department of Environmental Quality. "2011 Triennial Minor Source Inventory" 2012. Microsoft Excel file.
Calculated value from workbook using methodology contained in reference
PowerLine_ConstRate_Miles_per_Day 0.25 miles/day Table Rock EA: AECOM, 2011. Air Emissions Inventory Report. Prepared for Chevron U.S.A., Inc. and Bureau of Land Management, Rock Springs Field Office, Rock Springs, Wyoming.
Based on EIS/EA data.
PowerLine_ConstSched_Hours_per_Day 10 hours/day Table Rock EA: AECOM, 2011. Air Emissions Inventory Report. Prepared for Chevron U.S.A., Inc. and Bureau of Land Management, Rock Springs Field Office, Rock Springs, Wyoming.
Based on EIS/EA data.
PowerLine_Totalhp 1000 hp Table Rock EA: AECOM, 2011. Air Emissions Inventory Report. Prepared for Chevron U.S.A., Inc. and Bureau of Land Management, Rock Springs Field Office, Rock Springs, Wyoming.
Based on EIS/EA data.
Pres_Grad 0.435 psi/ft Based on E-mail from Ron Collings, Ruby Canyon Environmental
Press_Methane_Insitu_HalfMax 315 psi Michaelis-Menten Curve of USEPA, 2004. Figure 8, S 0.000 kg COD/yr API, 2009. Compendium of Greenhouse Gas Emissions
Methodologies for the Oil and Natural Gas Industry. Section 6.2.1.
ScraperHoursperYear_SG 2500 hrs/year Buffalo, WY RMP Sand and Gravel Spreadsheet (SandGravel - BFO RMP-1-25-2012.xlsx)
Based on RMP data. The average hours per unit were calculated based on applicable data from the referenced RMP documents and rounded to the nearest 10 hours.
ScraperHP_SG 700 hp Buffalo, WY RMP Sand and Gravel Spreadsheet (SandGravel - BFO RMP-1-25-2012.xlsx)
Based on RMP data. The average unit size was calculated based on applicable data from the referenced RMP documents and rounded to the nearest 50 hp.
ScraperLoad_SG 0.5 None Buffalo, WY RMP Sand and Gravel Spreadsheet (SandGravel - BFO RMP-1-25-2012.xlsx)
Based on RMP data.
Skidder_hp 100 hp BLM Fire and Fuels Management (excel file)Surface_ConstRate_Acres_per_Day 0.5 acres/day Table Rock EA: AECOM, 2011. Air Emissions Inventory
Report. Prepared for Chevron U.S.A., Inc. and Bureau of Land Management, Rock Springs Field Office, Rock Springs, Wyoming.
Based on EIS/EA data.
Surface_ConstSched_Hours_per_Day 10 hours/day Table Rock EA: AECOM, 2011. Air Emissions Inventory Report. Prepared for Chevron U.S.A., Inc. and Bureau of Land Management, Rock Springs Field Office, Rock Springs, Wyoming.
Based on EIS/EA data.
Surface_Totalhp 5000 hp Table Rock EA: AECOM, 2011. Air Emissions Inventory Report. Prepared for Chevron U.S.A., Inc. and Bureau of Land Management, Rock Springs Field Office, Rock Springs, Wyoming.
Based on EIS/EA data.
Total_hp_hrs_per_pad 250000 hp-hrs Table Rock EA: AECOM, 2011. Air Emissions Inventory Report. Prepared for Chevron U.S.A., Inc. and Bureau of Land Management, Rock Springs Field Office, Rock Springs, Wyoming.
Based on EIS/EA data.
Tractor_hp 165 hp BLM Buffalo Field Office. "Uranium - BFO RMP-1-25-2012." 2012. Microsoft Excel file.
Trona_Carbon_Content 0.1063 weight percent Based on weight of carbon in chemical formula: Na3(CO3)(HCO3)•2H2O
F-30
Reference Page 11 of 12
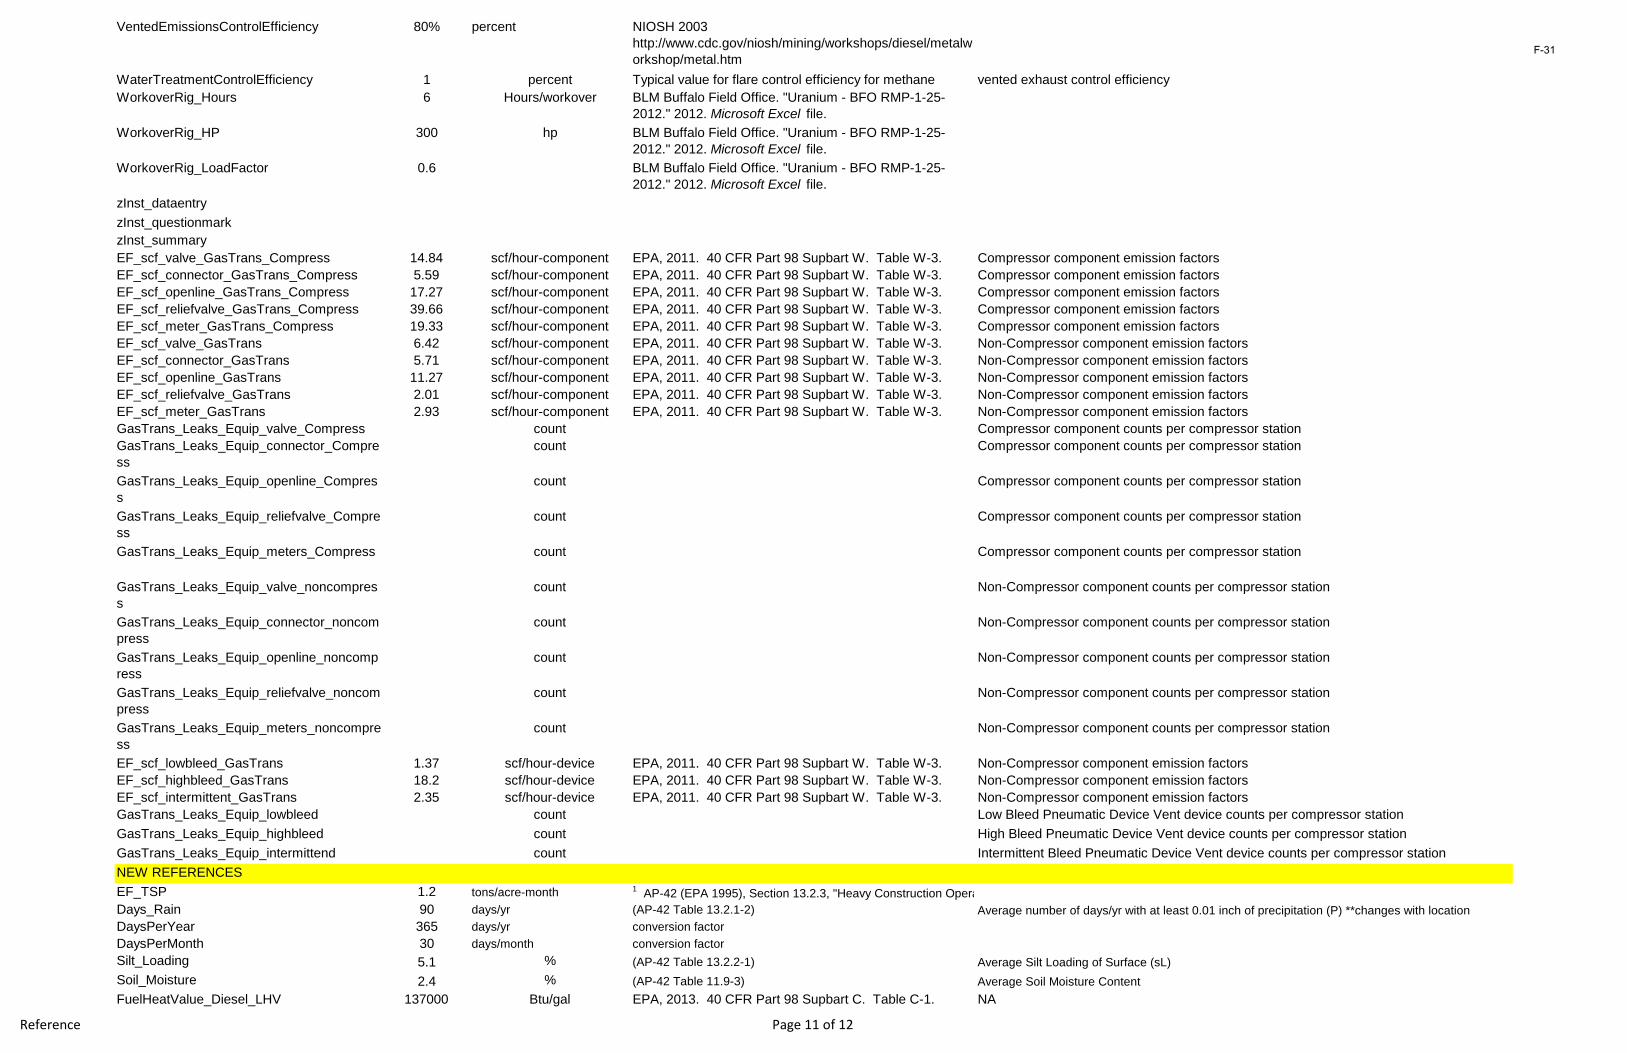
VentedEmissionsControlEfficiency 80% percent NIOSH 2003 http://www.cdc.gov/niosh/mining/workshops/diesel/metalworkshop/metal.htm
WaterTreatmentControlEfficiency 1 percent Typical value for flare control efficiency for methane vented exhaust control efficiencyWorkoverRig_Hours 6 Hours/workover BLM Buffalo Field Office. "Uranium - BFO RMP-1-25-
2012." 2012. Microsoft Excel file.WorkoverRig_HP 300 hp BLM Buffalo Field Office. "Uranium - BFO RMP-1-25-
2012." 2012. Microsoft Excel file.WorkoverRig_LoadFactor 0.6 BLM Buffalo Field Office. "Uranium - BFO RMP-1-25-
2012." 2012. Microsoft Excel file.zInst_dataentryzInst_questionmarkzInst_summaryEF_scf_valve_GasTrans_Compress 14.84 scf/hour-component EPA, 2011. 40 CFR Part 98 Supbart W. Table W-3. Compressor component emission factorsEF_scf_connector_GasTrans_Compress 5.59 scf/hour-component EPA, 2011. 40 CFR Part 98 Supbart W. Table W-3. Compressor component emission factorsEF_scf_openline_GasTrans_Compress 17.27 scf/hour-component EPA, 2011. 40 CFR Part 98 Supbart W. Table W-3. Compressor component emission factorsEF_scf_reliefvalve_GasTrans_Compress 39.66 scf/hour-component EPA, 2011. 40 CFR Part 98 Supbart W. Table W-3. Compressor component emission factorsEF_scf_meter_GasTrans_Compress 19.33 scf/hour-component EPA, 2011. 40 CFR Part 98 Supbart W. Table W-3. Compressor component emission factorsEF_scf_valve_GasTrans 6.42 scf/hour-component EPA, 2011. 40 CFR Part 98 Supbart W. Table W-3. Non-Compressor component emission factorsEF_scf_connector_GasTrans 5.71 scf/hour-component EPA, 2011. 40 CFR Part 98 Supbart W. Table W-3. Non-Compressor component emission factorsEF_scf_openline_GasTrans 11.27 scf/hour-component EPA, 2011. 40 CFR Part 98 Supbart W. Table W-3. Non-Compressor component emission factorsEF_scf_reliefvalve_GasTrans 2.01 scf/hour-component EPA, 2011. 40 CFR Part 98 Supbart W. Table W-3. Non-Compressor component emission factorsEF_scf_meter_GasTrans 2.93 scf/hour-component EPA, 2011. 40 CFR Part 98 Supbart W. Table W-3. Non-Compressor component emission factorsGasTrans_Leaks_Equip_valve_Compress count Compressor component counts per compressor stationGasTrans_Leaks_Equip_connector_Compress
count Compressor component counts per compressor station
GasTrans_Leaks_Equip_openline_Compress
count Compressor component counts per compressor station
GasTrans_Leaks_Equip_reliefvalve_Compress
count Compressor component counts per compressor station
GasTrans_Leaks_Equip_meters_Compress count Compressor component counts per compressor station
GasTrans_Leaks_Equip_valve_noncompress
count Non-Compressor component counts per compressor station
GasTrans_Leaks_Equip_connector_noncompress
count Non-Compressor component counts per compressor station
GasTrans_Leaks_Equip_openline_noncompress
count Non-Compressor component counts per compressor station
GasTrans_Leaks_Equip_reliefvalve_noncompress
count Non-Compressor component counts per compressor station
GasTrans_Leaks_Equip_meters_noncompress
count Non-Compressor component counts per compressor station
EF_scf_lowbleed_GasTrans 1.37 scf/hour-device EPA, 2011. 40 CFR Part 98 Supbart W. Table W-3. Non-Compressor component emission factorsEF_scf_highbleed_GasTrans 18.2 scf/hour-device EPA, 2011. 40 CFR Part 98 Supbart W. Table W-3. Non-Compressor component emission factorsEF_scf_intermittent_GasTrans 2.35 scf/hour-device EPA, 2011. 40 CFR Part 98 Supbart W. Table W-3. Non-Compressor component emission factorsGasTrans_Leaks_Equip_lowbleed count Low Bleed Pneumatic Device Vent device counts per compressor stationGasTrans_Leaks_Equip_highbleed count High Bleed Pneumatic Device Vent device counts per compressor stationGasTrans_Leaks_Equip_intermittend count Intermittent Bleed Pneumatic Device Vent device counts per compressor stationNEW REFERENCESEF_TSP 1.2 tons/acre-month 1 AP-42 (EPA 1995), Section 13.2.3, "Heavy Construction Opera Days_Rain 90 days/yr (AP-42 Table 13.2.1-2) Average number of days/yr with at least 0.01 inch of precipitation (P) **changes with locationDaysPerYear 365 days/yr conversion factorDaysPerMonth 30 days/month conversion factorSilt_Loading 5.1 % (AP-42 Table 13.2.2-1) Average Silt Loading of Surface (sL)Soil_Moisture 2.4 % (AP-42 Table 11.9-3) Average Soil Moisture ContentFuelHeatValue_Diesel_LHV 137000 Btu/gal EPA, 2013. 40 CFR Part 98 Supbart C. Table C-1. NA
F-31
Reference Page 12 of 12
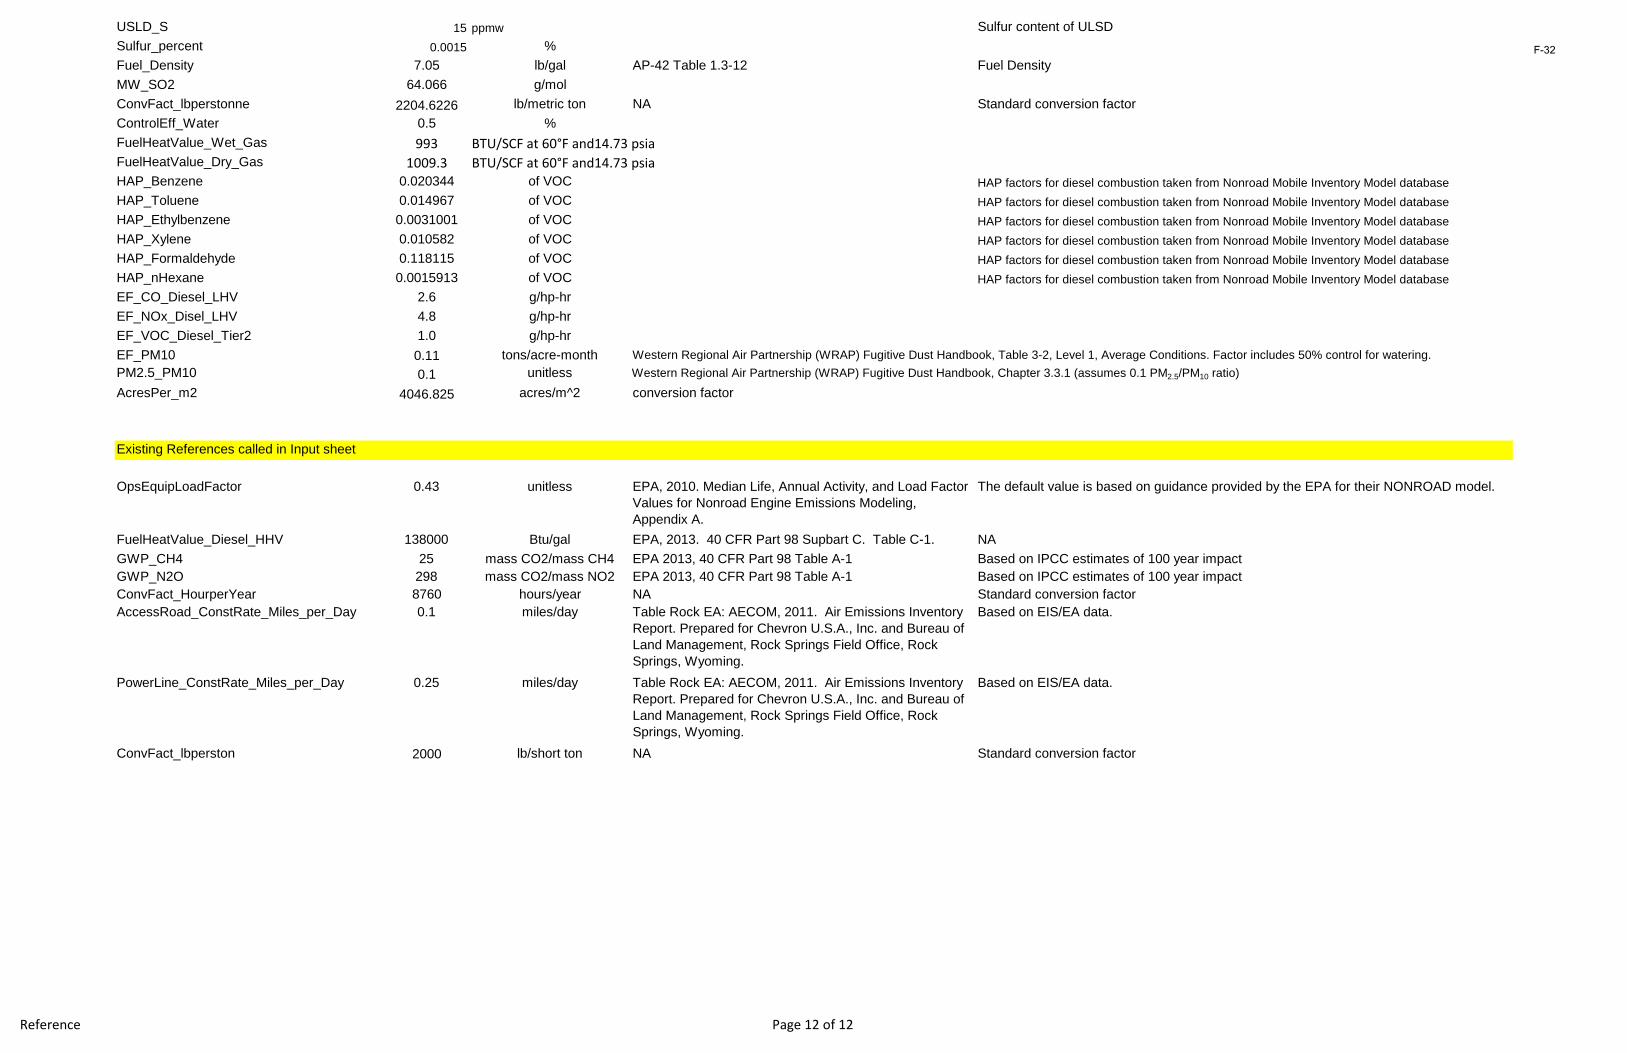
USLD_S 15 ppmw Sulfur content of ULSDSulfur_percent 0.0015 %Fuel_Density 7.05 lb/gal AP-42 Table 1.3-12 Fuel DensityMW_SO2 64.066 g/molConvFact_lbperstonne 2204.6226 lb/metric ton NA Standard conversion factorControlEff_Water 0.5 %FuelHeatValue_Wet_Gas 993 BTU/SCF at 60°F and14.73 psiaFuelHeatValue_Dry_Gas 1009.3 BTU/SCF at 60°F and14.73 psiaHAP_Benzene 0.020344 of VOC HAP factors for diesel combustion taken from Nonroad Mobile Inventory Model databaseHAP_Toluene 0.014967 of VOC HAP factors for diesel combustion taken from Nonroad Mobile Inventory Model databaseHAP_Ethylbenzene 0.0031001 of VOC HAP factors for diesel combustion taken from Nonroad Mobile Inventory Model databaseHAP_Xylene 0.010582 of VOC HAP factors for diesel combustion taken from Nonroad Mobile Inventory Model databaseHAP_Formaldehyde 0.118115 of VOC HAP factors for diesel combustion taken from Nonroad Mobile Inventory Model databaseHAP_nHexane 0.0015913 of VOC HAP factors for diesel combustion taken from Nonroad Mobile Inventory Model databaseEF_CO_Diesel_LHV 2.6 g/hp-hrEF_NOx_Disel_LHV 4.8 g/hp-hrEF_VOC_Diesel_Tier2 1.0 g/hp-hrEF_PM10 0.11 tons/acre-monthPM2.5_PM10 0.1 unitlessAcresPer_m2 4046.825 acres/m^2 conversion factor
Existing References called in Input sheet
OpsEquipLoadFactor 0.43 unitless EPA, 2010. Median Life, Annual Activity, and Load Factor Values for Nonroad Engine Emissions Modeling, Appendix A.
The default value is based on guidance provided by the EPA for their NONROAD model.
FuelHeatValue_Diesel_HHV 138000 Btu/gal EPA, 2013. 40 CFR Part 98 Supbart C. Table C-1. NAGWP_CH4 25 mass CO2/mass CH4 EPA 2013, 40 CFR Part 98 Table A-1 Based on IPCC estimates of 100 year impactGWP_N2O 298 mass CO2/mass NO2 EPA 2013, 40 CFR Part 98 Table A-1 Based on IPCC estimates of 100 year impactConvFact_HourperYear 8760 hours/year NA Standard conversion factorAccessRoad_ConstRate_Miles_per_Day 0.1 miles/day Table Rock EA: AECOM, 2011. Air Emissions Inventory
Report. Prepared for Chevron U.S.A., Inc. and Bureau of Land Management, Rock Springs Field Office, Rock Springs, Wyoming.
Based on EIS/EA data.
PowerLine_ConstRate_Miles_per_Day 0.25 miles/day Table Rock EA: AECOM, 2011. Air Emissions Inventory Report. Prepared for Chevron U.S.A., Inc. and Bureau of Land Management, Rock Springs Field Office, Rock Springs, Wyoming.
Based on EIS/EA data.
ConvFact_lbperston 2000 lb/short ton NA Standard conversion factor
Western Regional Air Partnership (WRAP) Fugitive Dust Handbook, Table 3-2, Level 1, Average Conditions. Factor includes 50% control for watering.Western Regional Air Partnership (WRAP) Fugitive Dust Handbook, Chapter 3.3.1 (assumes 0.1 PM2.5/PM10 ratio)
F-32

Input Summary
F-33

This page intentionally left blank
F-34
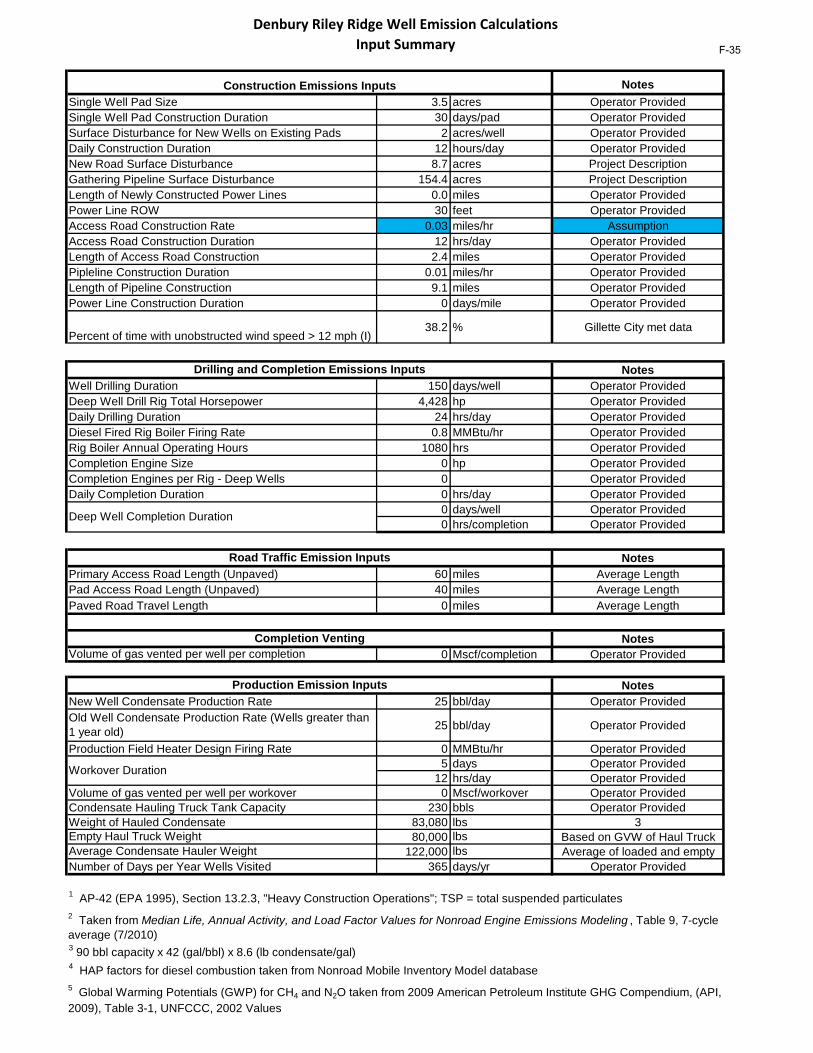
Denbury Riley Ridge Well Emission Calculations Input Summary
NotesSingle Well Pad Size 3.5 acres Operator ProvidedSingle Well Pad Construction Duration 30 days/pad Operator ProvidedSurface Disturbance for New Wells on Existing Pads 2 acres/well Operator ProvidedDaily Construction Duration 12 hours/day Operator ProvidedNew Road Surface Disturbance 8.7 acres Project DescriptionGathering Pipeline Surface Disturbance 154.4 acres Project DescriptionLength of Newly Constructed Power Lines 0.0 miles Operator ProvidedPower Line ROW 30 feet Operator ProvidedAccess Road Construction Rate 0.03 miles/hr AssumptionAccess Road Construction Duration 12 hrs/day Operator ProvidedLength of Access Road Construction 2.4 miles Operator ProvidedPipleline Construction Duration 0.01 miles/hr Operator ProvidedLength of Pipeline Construction 9.1 miles Operator ProvidedPower Line Construction Duration 0 days/mile Operator Provided
38.2 % Gillette City met data
NotesWell Drilling Duration 150 days/well Operator ProvidedDeep Well Drill Rig Total Horsepower 4,428 hp Operator ProvidedDaily Drilling Duration 24 hrs/day Operator ProvidedDiesel Fired Rig Boiler Firing Rate 0.8 MMBtu/hr Operator ProvidedRig Boiler Annual Operating Hours 1080 hrs Operator ProvidedCompletion Engine Size 0 hp Operator ProvidedCompletion Engines per Rig - Deep Wells 0 Operator ProvidedDaily Completion Duration 0 hrs/day Operator Provided
0 days/well Operator Provided0 hrs/completion Operator Provided
NotesPrimary Access Road Length (Unpaved) 60 miles Average LengthPad Access Road Length (Unpaved) 40 miles Average LengthPaved Road Travel Length 0 miles Average Length
Notes0 Mscf/completion Operator Provided
NotesNew Well Condensate Production Rate 25 bbl/day Operator Provided
25 bbl/day Operator Provided
Production Field Heater Design Firing Rate 0 MMBtu/hr Operator Provided5 days Operator Provided
12 hrs/day Operator ProvidedVolume of gas vented per well per workover 0 Mscf/workover Operator ProvidedCondensate Hauling Truck Tank Capacity 230 bbls Operator ProvidedWeight of Hauled Condensate 83,080 lbs 3
80,000 Based on GVW of Haul Truck122,000 Average of loaded and empty
Number of Days per Year Wells Visited 365 days/yr Operator Provided
1 AP-42 (EPA 1995), Section 13.2.3, "Heavy Construction Operations"; TSP = total suspended particulates
3 90 bbl capacity x 42 (gal/bbl) x 8.6 (lb condensate/gal)4 HAP factors for diesel combustion taken from Nonroad Mobile Inventory Model database
Average Condensate Hauler Weight lbs
5 Global Warming Potentials (GWP) for CH4 and N2O taken from 2009 American Petroleum Institute GHG Compendium, (API, 2009), Table 3-1, UNFCCC, 2002 Values
2 Taken from Median Life, Annual Activity, and Load Factor Values for Nonroad Engine Emissions Modeling , Table 9, 7-cycle average (7/2010)
Construction Emissions Inputs
Drilling and Completion Emissions Inputs
Percent of time with unobstructed wind speed > 12 mph (I)
Empty Haul Truck Weight lbs
Production Emission Inputs
Workover Duration
Deep Well Completion Duration
Road Traffic Emission Inputs
Completion VentingVolume of gas vented per well per completion
Old Well Condensate Production Rate (Wells greater than 1 year old)
F-35

This page intentionally left blank
F-36
Wet Gas Analysis
F-37

This page intentionally left blank
F-38
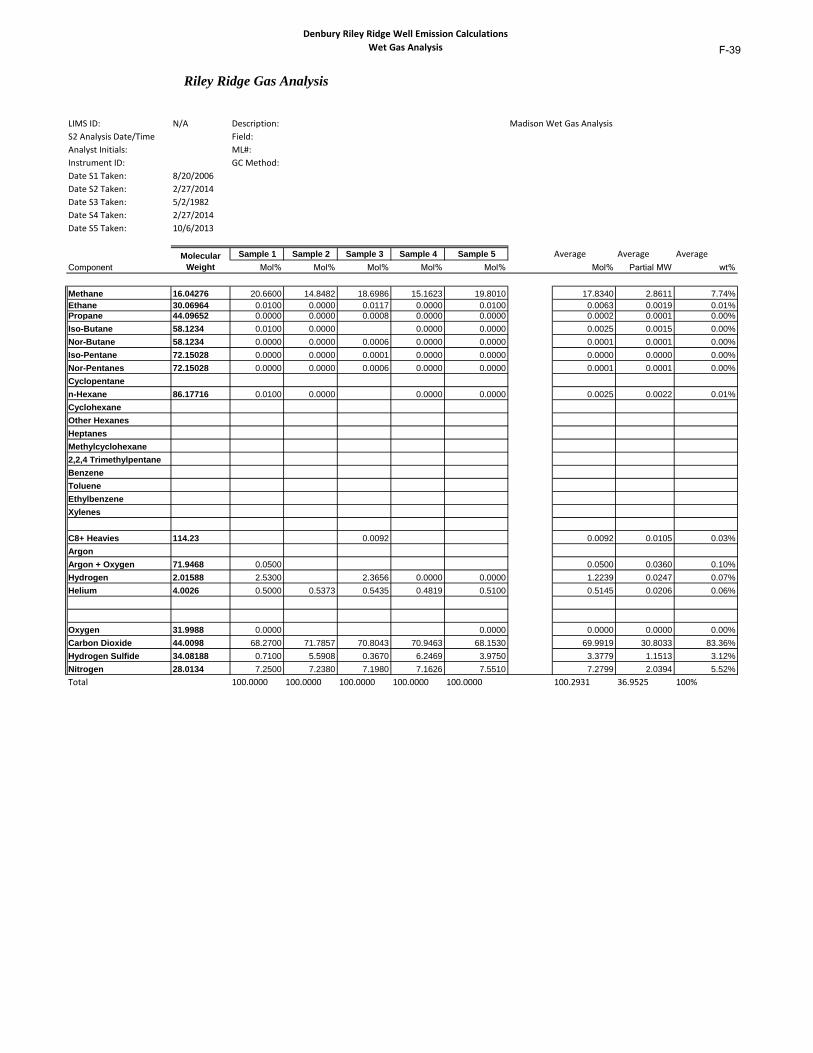
Denbury Riley Ridge Well Emission Calculations Wet Gas Analysis
Riley Ridge Gas Analysis
LIMS ID: N/A Description: Madison Wet Gas AnalysisS2 Analysis Date/Time Field:Analyst Initials: ML#:Instrument ID: GC Method:Date S1 Taken: 8/20/2006Date S2 Taken: 2/27/2014Date S3 Taken: 5/2/1982Date S4 Taken: 2/27/2014Date S5 Taken: 10/6/2013
Sample 1 Sample 2 Sample 3 Sample 4 Sample 5 Average Average AverageComponent Mol% Mol% Mol% Mol% Mol% Mol% Partial MW wt%
Methane 16.04276 20.6600 14.8482 18.6986 15.1623 19.8010 17.8340 2.8611 7.74%Ethane 30.06964 0.0100 0.0000 0.0117 0.0000 0.0100 0.0063 0.0019 0.01%Propane 44.09652 0.0000 0.0000 0.0008 0.0000 0.0000 0.0002 0.0001 0.00%Iso-Butane 58.1234 0.0100 0.0000 0.0000 0.0000 0.0025 0.0015 0.00%Nor-Butane 58.1234 0.0000 0.0000 0.0006 0.0000 0.0000 0.0001 0.0001 0.00%Iso-Pentane 72.15028 0.0000 0.0000 0.0001 0.0000 0.0000 0.0000 0.0000 0.00%Nor-Pentanes 72.15028 0.0000 0.0000 0.0006 0.0000 0.0000 0.0001 0.0001 0.00%Cyclopentanen-Hexane 86.17716 0.0100 0.0000 0.0000 0.0000 0.0025 0.0022 0.01%CyclohexaneOther Hexanes Heptanes Methylcyclohexane2,2,4 TrimethylpentaneBenzeneTolueneEthylbenzeneXylenes
C8+ Heavies 114.23 0.0092 0.0092 0.0105 0.03%ArgonArgon + Oxygen 71.9468 0.0500 0.0500 0.0360 0.10%Hydrogen 2.01588 2.5300 2.3656 0.0000 0.0000 1.2239 0.0247 0.07%Helium 4.0026 0.5000 0.5373 0.5435 0.4819 0.5100 0.5145 0.0206 0.06%
Oxygen 31.9988 0.0000 0.0000 0.0000 0.0000 0.00%Carbon Dioxide 44.0098 68.2700 71.7857 70.8043 70.9463 68.1530 69.9919 30.8033 83.36%Hydrogen Sulfide 34.08188 0.7100 5.5908 0.3670 6.2469 3.9750 3.3779 1.1513 3.12%Nitrogen 28.0134 7.2500 7.2380 7.1980 7.1626 7.5510 7.2799 2.0394 5.52%Total 100.0000 100.0000 100.0000 100.0000 100.0000 100.2931 36.9525 100%
Molecular Weight
F-39

This page intentionally left blank
F-40
Construction PM Emissions
F-41

This page intentionally left blank
F-42
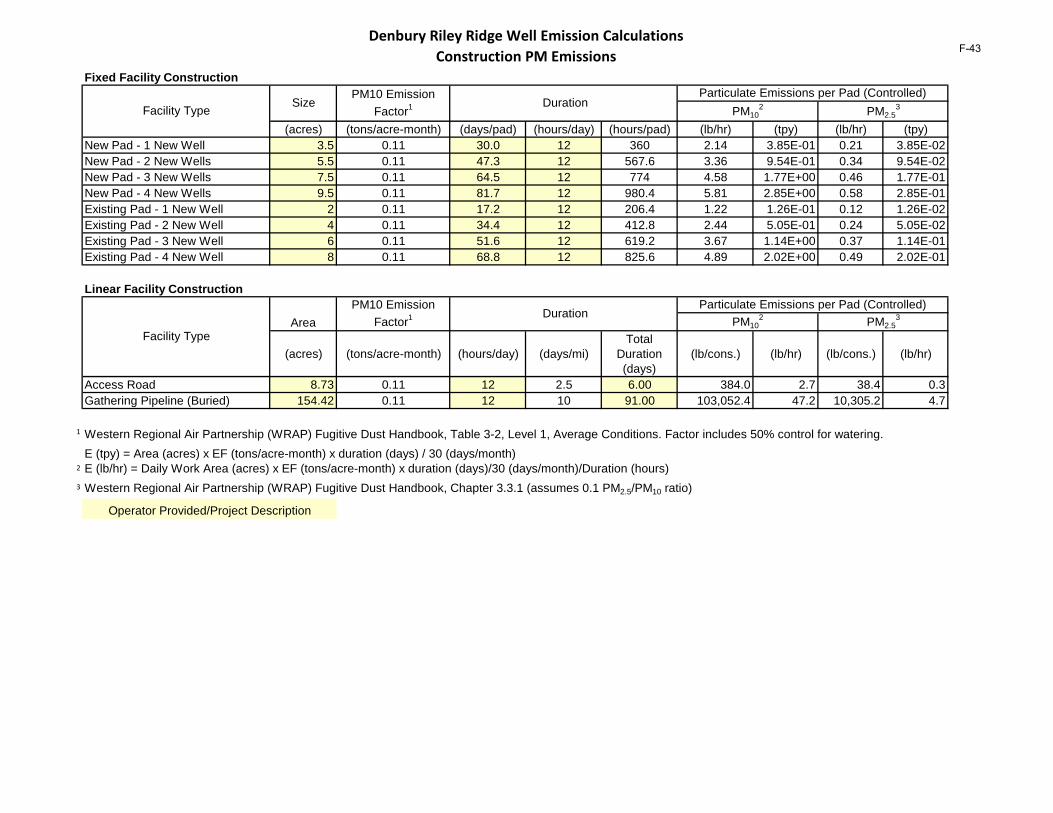
Denbury Riley Ridge Well Emission Calculations Construction PM Emissions
Fixed Facility Construction
(acres) (tons/acre-month) (days/pad) (hours/day) (hours/pad) (lb/hr) (tpy) (lb/hr) (tpy)New Pad - 1 New Well 3.5 0.11 30.0 12 360 2.14 3.85E-01 0.21 3.85E-02New Pad - 2 New Wells 5.5 0.11 47.3 12 567.6 3.36 9.54E-01 0.34 9.54E-02New Pad - 3 New Wells 7.5 0.11 64.5 12 774 4.58 1.77E+00 0.46 1.77E-01New Pad - 4 New Wells 9.5 0.11 81.7 12 980.4 5.81 2.85E+00 0.58 2.85E-01Existing Pad - 1 New Well 2 0.11 17.2 12 206.4 1.22 1.26E-01 0.12 1.26E-02Existing Pad - 2 New Well 4 0.11 34.4 12 412.8 2.44 5.05E-01 0.24 5.05E-02Existing Pad - 3 New Well 6 0.11 51.6 12 619.2 3.67 1.14E+00 0.37 1.14E-01Existing Pad - 4 New Well 8 0.11 68.8 12 825.6 4.89 2.02E+00 0.49 2.02E-01
Linear Facility Construction
(acres) (tons/acre-month) (hours/day) (days/mi)Total
Duration (days)
(lb/cons.) (lb/hr) (lb/cons.) (lb/hr)
Access Road 8.73 0.11 12 2.5 6.00 384.0 2.7 38.4 0.3Gathering Pipeline (Buried) 154.42 0.11 12 10 91.00 103,052.4 47.2 10,305.2 4.7
1 Western Regional Air Partnership (WRAP) Fugitive Dust Handbook, Table 3-2, Level 1, Average Conditions. Factor includes 50% control for watering.
2
3
PM102 PM2.5
3
Operator Provided/Project Description
E (tpy) = Area (acres) x EF (tons/acre-month) x duration (days) / 30 (days/month)E (lb/hr) = Daily Work Area (acres) x EF (tons/acre-month) x duration (days)/30 (days/month)/Duration (hours)Western Regional Air Partnership (WRAP) Fugitive Dust Handbook, Chapter 3.3.1 (assumes 0.1 PM2.5/PM10 ratio)
PM102 PM2.5
3 DurationParticulate Emissions per Pad (Controlled)
Facility TypeArea
PM10 Emission Factor1
Facility TypeSize
PM10 Emission Factor1
DurationParticulate Emissions per Pad (Controlled)
F-43

This page intentionally left blank
F-44

Construction Wind Erosion
F-45

This page intentionally left blank
F-46
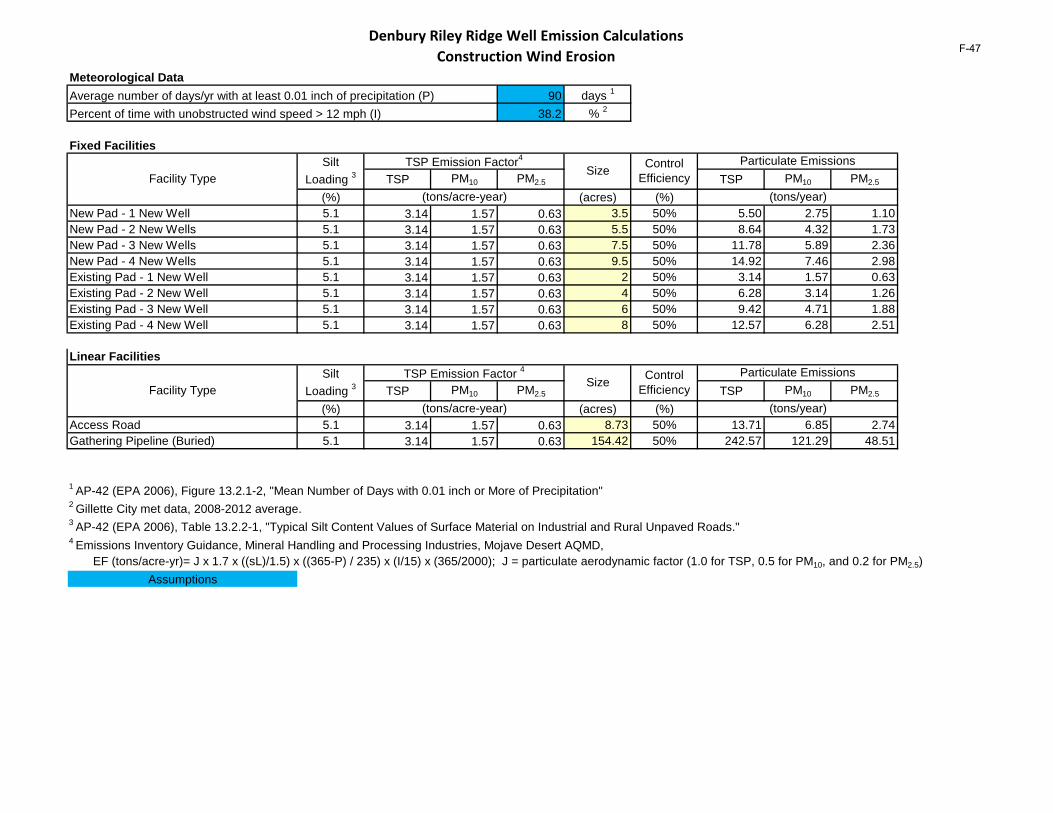
Denbury Riley Ridge Well Emission Calculations Construction Wind Erosion
Meteorological DataAverage number of days/yr with at least 0.01 inch of precipitation (P) 90 days 1
Percent of time with unobstructed wind speed > 12 mph (I) 38.2 % 2
TSP PM10 PM2.5 TSP PM10 PM2.5
(%) (acres) (%)New Pad - 1 New Well 5.1 3.14 1.57 0.63 3.5 50% 5.50 2.75 1.10New Pad - 2 New Wells 5.1 3.14 1.57 0.63 5.5 50% 8.64 4.32 1.73New Pad - 3 New Wells 5.1 3.14 1.57 0.63 7.5 50% 11.78 5.89 2.36New Pad - 4 New Wells 5.1 3.14 1.57 0.63 9.5 50% 14.92 7.46 2.98Existing Pad - 1 New Well 5.1 3.14 1.57 0.63 2 50% 3.14 1.57 0.63Existing Pad - 2 New Well 5.1 3.14 1.57 0.63 4 50% 6.28 3.14 1.26Existing Pad - 3 New Well 5.1 3.14 1.57 0.63 6 50% 9.42 4.71 1.88Existing Pad - 4 New Well 5.1 3.14 1.57 0.63 8 50% 12.57 6.28 2.51
TSP PM10 PM2.5 TSP PM10 PM2.5
(%) (acres) (%)Access Road 5.1 3.14 1.57 0.63 8.73 50% 13.71 6.85 2.74Gathering Pipeline (Buried) 5.1 3.14 1.57 0.63 154.42 50% 242.57 121.29 48.51
1 AP-42 (EPA 2006), Figure 13.2.1-2, "Mean Number of Days with 0.01 inch or More of Precipitation"2 Gillette City met data, 2008-2012 average.3 AP-42 (EPA 2006), Table 13.2.2-1, "Typical Silt Content Values of Surface Material on Industrial and Rural Unpaved Roads."4 Emissions Inventory Guidance, Mineral Handling and Processing Industries, Mojave Desert AQMD, EF (tons/acre-yr)= J x 1.7 x ((sL)/1.5) x ((365-P) / 235) x (I/15) x (365/2000); J = particulate aerodynamic factor (1.0 for TSP, 0.5 for PM10, and 0.2 for PM2.5)
Assumptions
Linear Facilities
Facility TypeSilt
Loading 3TSP Emission Factor 4
SizeParticulate Emissions
(tons/acre-year) (tons/year)
Control Efficiency
Fixed Facilities
Facility TypeSilt
Loading 3TSP Emission Factor4
SizeParticulate Emissions
(tons/acre-year) (tons/year)
Control Efficiency
F-47

This page intentionally left blank
F-48

Construction Road Traffic-New
F-49

This page intentionally left blank
F-50

Denbury Riley Ridge Well Emission Calculations Construction Road Traffic-New
Primary Access Road 60 Water 50%
Pad Access Road 40
Primary Access Road 0
Activity Construction Traffic PM Emissions - New Wells
Vehicle Type Road Type
Dust Control Method
Average Vehicle Weight
Vehicle Quantity
Average Vehicle Speed
Silt Content1
Moisture Content2
Precipitation > 0.01 inches3
Round Trips (RTs)
Vehicle Miles Traveled
(VMT)
PM10 Emission Factor
(controlled)5,6
PM2.5
Emission Factor
(controlled)5,6
PM10
Emissions (controlled)
PM2.5
Emissions (controlled)
(lb) (#) (mph) (%) (%) (days/yr) (RT/pad) (VMT/pad) (lb/VMT) (lb/VMT) (lb/pad) (lb/pad)Primary 0.17 0.017 206.12 20.47Pad 0.56 0.06 676.08 67.61Primary 0.17 0.017 2,576.45 255.88Pad 0.84 0.08 12,588.23 1,258.82
Primary 0.17 0.017 2,061.16 204.70
Pad 0.44 0.04 5,335.56 533.56
Total Unpaved Road Traffic Emissions (lb/pad) 16,046.87 1,602.78
1 AP-42 (EPA 2006), Table 13.2.2-1, "Typical Silt Content Values of Surface Material on Industrial and Rural Unpaved Roads."2 AP-42 (EPA 2004), Table 11.9-3, "Typical Values for Correction Factors Applicable to the Predictive Emission Factor Equations."3 AP-42 (EPA 2006), Figure 13.2.1-2, "Mean number of days with 0.01 inch or more of precipitation in the United States."4 Control efficiency of 50% assumed for watering.5 AP-42 Chapter 13.2.2.2, Emissions Calculation And Correction Parameters, Equation (1a) for Primary Road6 AP-42 Chapter 13.2.2.2, Emissions Calculation And Correction Parameters, Equation (1b) for Pad Road
Operator ProvidedAssumptions
5.1 2.4 90 60 12000.00Light Weight Support Vehicles or Medium Weight Utility Vehicles
Water 19,500 2 20
RT Distance on Unpaved Roads (VMT/RT)
Emission Control Efficiency4 (%)
Rubber Tire Belly-Dump Gravel Trunk
Rubber Tire Low Boy Mobilization Tractor Trailer
Water
Water 33,000 2
5
RT Distance on Paved Roads (VMT/RT)
80,000
20 5.1 6
30 15000.0020
1200.00
5.1 2.4 90
902.4
F-51
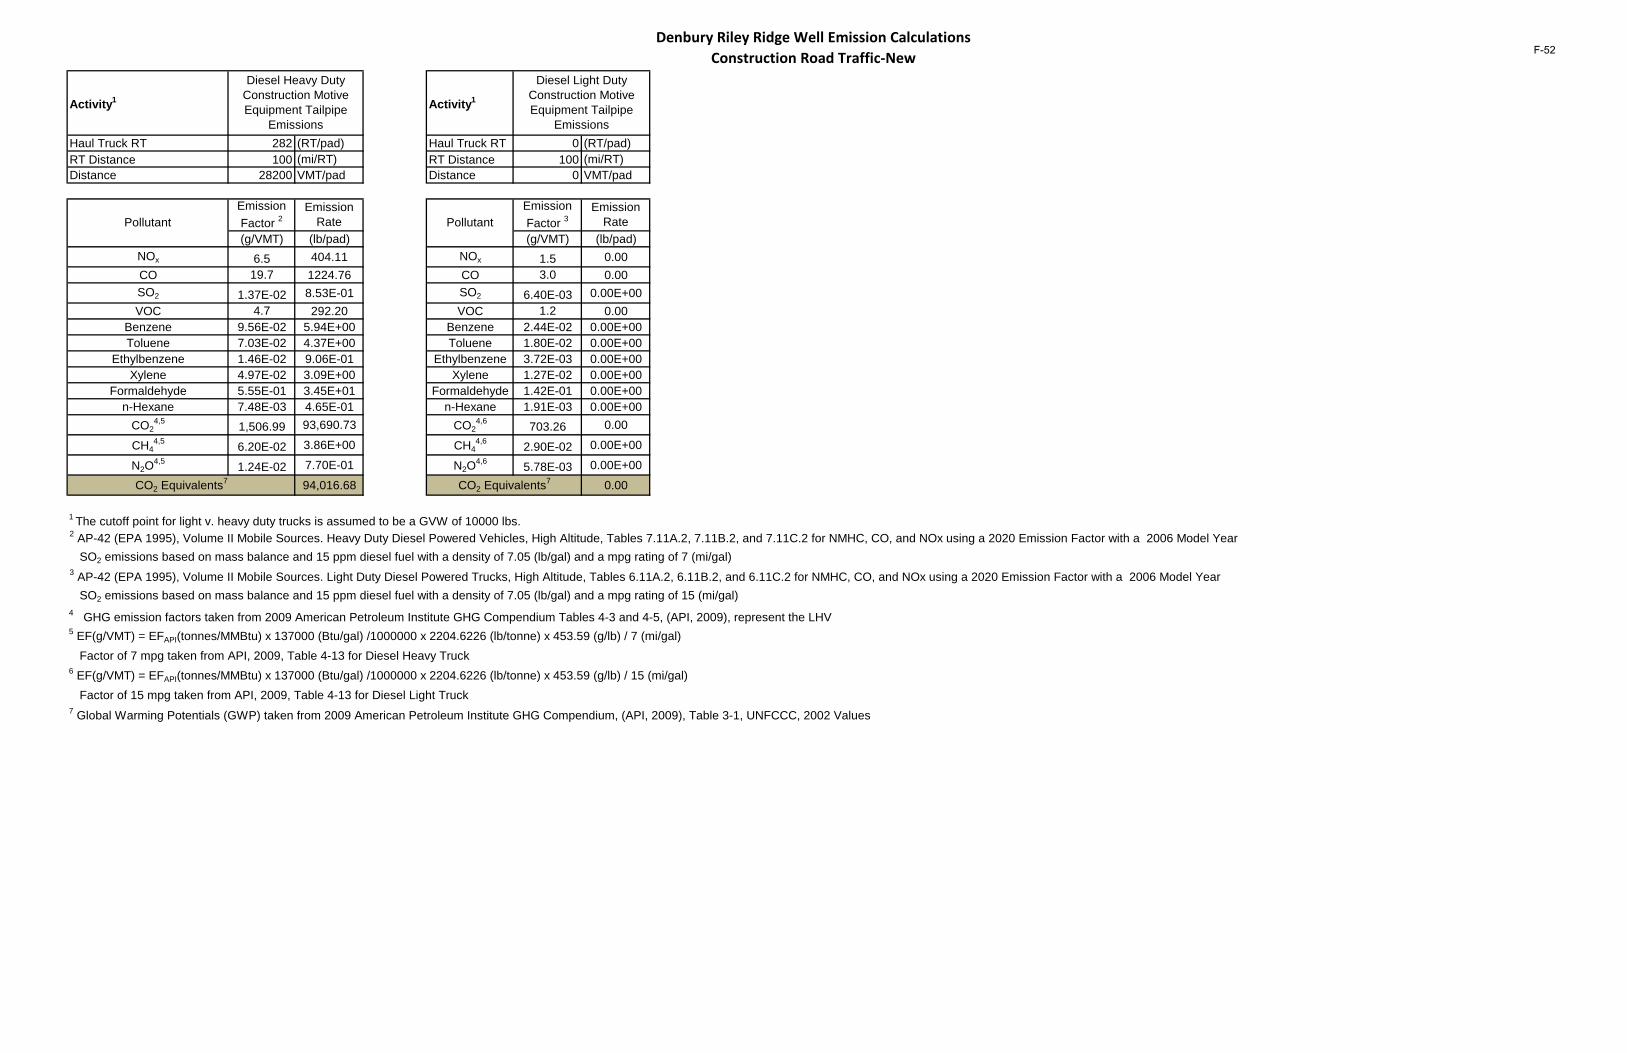
Denbury Riley Ridge Well Emission Calculations Construction Road Traffic-New
Activity1 Activity1
Haul Truck RT 282 (RT/pad) Haul Truck RT 0 (RT/pad)RT Distance 100 (mi/RT) RT Distance 100 (mi/RT)Distance 28200 VMT/pad Distance 0 VMT/pad
(g/VMT) (lb/pad) (g/VMT) (lb/pad)NOx 6.5 404.11 NOx 1.5 0.00CO 19.7 1224.76 CO 3.0 0.00SO2 1.37E-02 8.53E-01 SO2 6.40E-03 0.00E+00VOC 4.7 292.20 VOC 1.2 0.00
Benzene 9.56E-02 5.94E+00 Benzene 2.44E-02 0.00E+00Toluene 7.03E-02 4.37E+00 Toluene 1.80E-02 0.00E+00
Ethylbenzene 1.46E-02 9.06E-01 Ethylbenzene 3.72E-03 0.00E+00Xylene 4.97E-02 3.09E+00 Xylene 1.27E-02 0.00E+00
Formaldehyde 5.55E-01 3.45E+01 Formaldehyde 1.42E-01 0.00E+00n-Hexane 7.48E-03 4.65E-01 n-Hexane 1.91E-03 0.00E+00
CO24,5 1,506.99 93,690.73 CO2
4,6 703.26 0.00
CH44,5 6.20E-02 3.86E+00 CH4
4,6 2.90E-02 0.00E+00
N2O4,5 1.24E-02 7.70E-01 N2O
4,6 5.78E-03 0.00E+00
94,016.68 0.00
1 The cutoff point for light v. heavy duty trucks is assumed to be a GVW of 10000 lbs.2 AP-42 (EPA 1995), Volume II Mobile Sources. Heavy Duty Diesel Powered Vehicles, High Altitude, Tables 7.11A.2, 7.11B.2, and 7.11C.2 for NMHC, CO, and NOx using a 2020 Emission Factor with a 2006 Model Year SO2 emissions based on mass balance and 15 ppm diesel fuel with a density of 7.05 (lb/gal) and a mpg rating of 7 (mi/gal)3 AP-42 (EPA 1995), Volume II Mobile Sources. Light Duty Diesel Powered Trucks, High Altitude, Tables 6.11A.2, 6.11B.2, and 6.11C.2 for NMHC, CO, and NOx using a 2020 Emission Factor with a 2006 Model Year SO2 emissions based on mass balance and 15 ppm diesel fuel with a density of 7.05 (lb/gal) and a mpg rating of 15 (mi/gal)4 GHG emission factors taken from 2009 American Petroleum Institute GHG Compendium Tables 4-3 and 4-5, (API, 2009), represent the LHV5 EF(g/VMT) = EFAPI(tonnes/MMBtu) x 137000 (Btu/gal) /1000000 x 2204.6226 (lb/tonne) x 453.59 (g/lb) / 7 (mi/gal) Factor of 7 mpg taken from API, 2009, Table 4-13 for Diesel Heavy Truck6 EF(g/VMT) = EFAPI(tonnes/MMBtu) x 137000 (Btu/gal) /1000000 x 2204.6226 (lb/tonne) x 453.59 (g/lb) / 15 (mi/gal) Factor of 15 mpg taken from API, 2009, Table 4-13 for Diesel Light Truck7 Global Warming Potentials (GWP) taken from 2009 American Petroleum Institute GHG Compendium, (API, 2009), Table 3-1, UNFCCC, 2002 Values
Diesel Light Duty Construction Motive Equipment Tailpipe
Emissions
PollutantEmission Factor 3
Emission Rate
CO2 Equivalents7
Diesel Heavy Duty Construction Motive Equipment Tailpipe
Emissions
PollutantEmission Factor 2
Emission Rate
CO2 Equivalents7
F-52
Construction Road Traffic-Ex
F-53

This page intentionally left blank
F-54
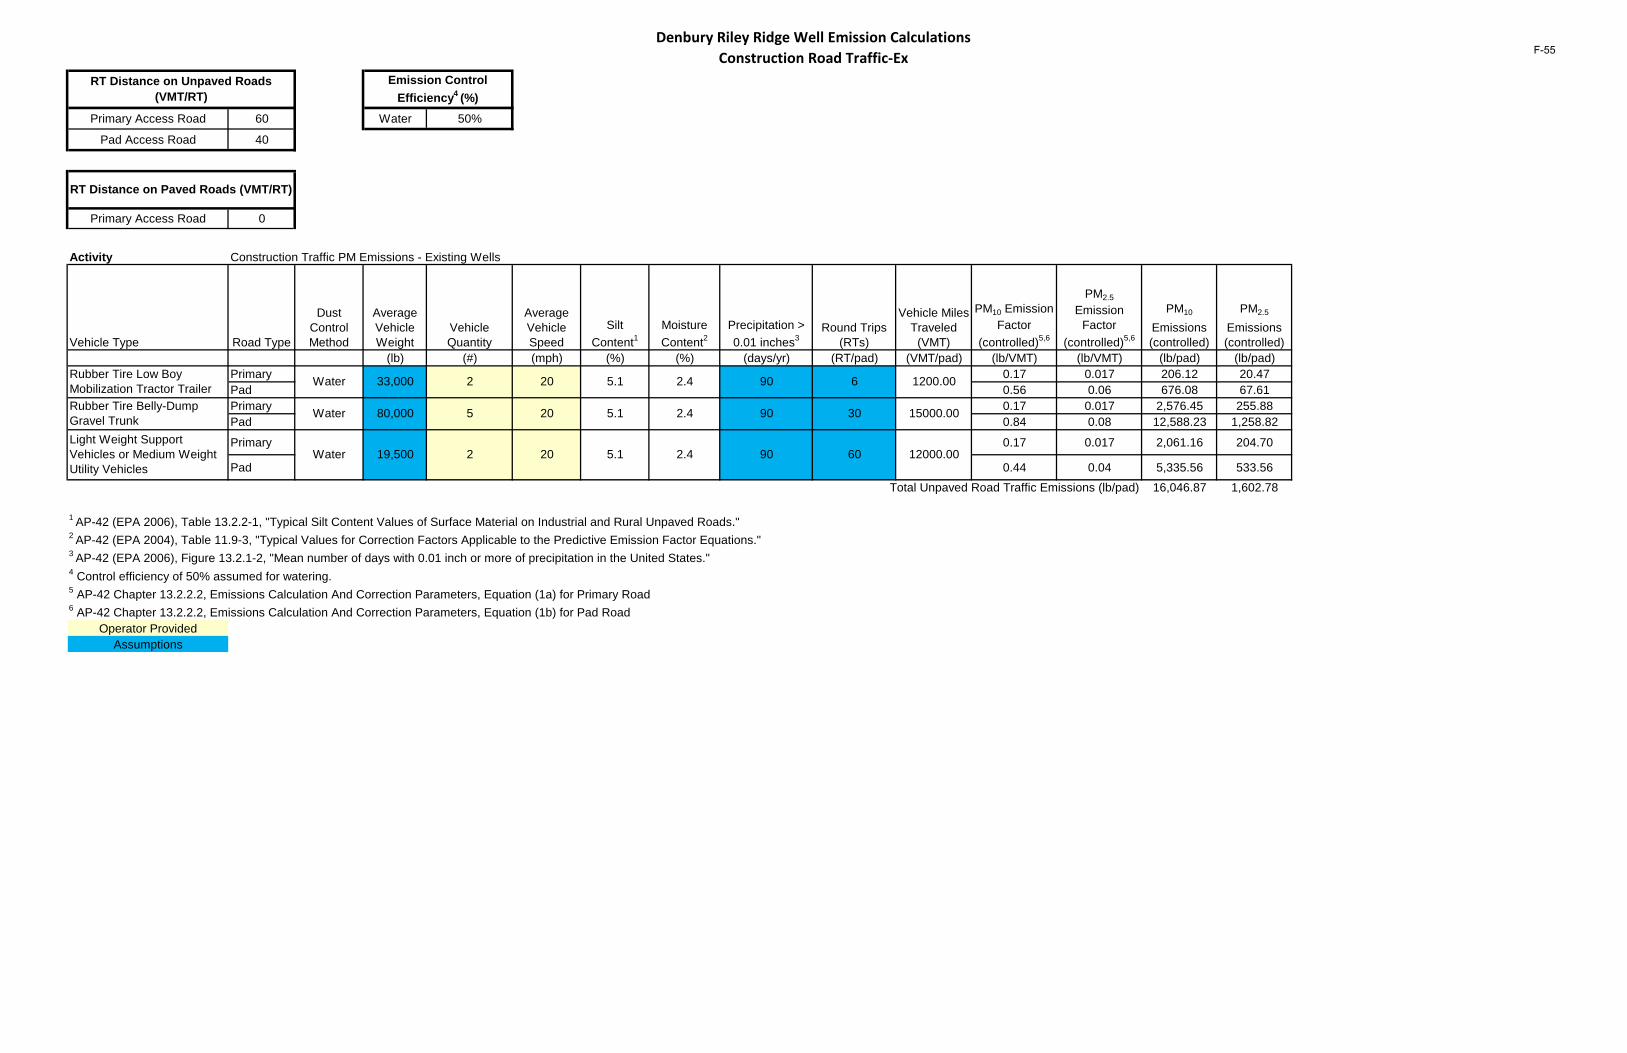
Denbury Riley Ridge Well Emission Calculations Construction Road Traffic-Ex
Primary Access Road 60 Water 50%
Pad Access Road 40
Primary Access Road 0
Activity Construction Traffic PM Emissions - Existing Wells
Vehicle Type Road Type
Dust Control Method
Average Vehicle Weight
Vehicle Quantity
Average Vehicle Speed
Silt Content1
Moisture Content2
Precipitation > 0.01 inches3
Round Trips (RTs)
Vehicle Miles Traveled
(VMT)
PM10 Emission Factor
(controlled)5,6
PM2.5
Emission Factor
(controlled)5,6
PM10
Emissions (controlled)
PM2.5
Emissions (controlled)
(lb) (#) (mph) (%) (%) (days/yr) (RT/pad) (VMT/pad) (lb/VMT) (lb/VMT) (lb/pad) (lb/pad)Primary 0.17 0.017 206.12 20.47Pad 0.56 0.06 676.08 67.61Primary 0.17 0.017 2,576.45 255.88Pad 0.84 0.08 12,588.23 1,258.82
Primary 0.17 0.017 2,061.16 204.70
Pad 0.44 0.04 5,335.56 533.56
Total Unpaved Road Traffic Emissions (lb/pad) 16,046.87 1,602.78
1 AP-42 (EPA 2006), Table 13.2.2-1, "Typical Silt Content Values of Surface Material on Industrial and Rural Unpaved Roads."2 AP-42 (EPA 2004), Table 11.9-3, "Typical Values for Correction Factors Applicable to the Predictive Emission Factor Equations."3 AP-42 (EPA 2006), Figure 13.2.1-2, "Mean number of days with 0.01 inch or more of precipitation in the United States."4 Control efficiency of 50% assumed for watering.5 AP-42 Chapter 13.2.2.2, Emissions Calculation And Correction Parameters, Equation (1a) for Primary Road6 AP-42 Chapter 13.2.2.2, Emissions Calculation And Correction Parameters, Equation (1b) for Pad Road
Operator ProvidedAssumptions
2.4 90 60 12000.00
2.4 90 30 15000.00
Light Weight Support Vehicles or Medium Weight Utility Vehicles
Water 19,500 2 20 5.1
Rubber Tire Belly-Dump Gravel Trunk Water 80,000 5 20 5.1
1200.00
RT Distance on Unpaved Roads (VMT/RT)
Emission Control Efficiency4 (%)
RT Distance on Paved Roads (VMT/RT)
Rubber Tire Low Boy Mobilization Tractor Trailer Water 33,000 2 20 5.1 2.4 90 6
F-55

Denbury Riley Ridge Well Emission Calculations Construction Road Traffic-Ex
Activity1 Activity1
Haul Truck RT 282 (RT/pad) Haul Truck RT 0 (RT/pad)RT Distance 100 (mi/RT) RT Distance 100 (mi/RT)Distance 28200 VMT/pad Distance 0 VMT/pad
(g/VMT) (lb/pad) (g/VMT) (lb/pad)NOx 6.5 404.11 NOx 1.5 0.00CO 19.7 1224.76 CO 3.0 0.00SO2 1.37E-02 8.53E-01 SO2 6.40E-03 0.00E+00VOC 4.7 292.20 VOC 1.2 0.00
Benzene 9.56E-02 5.94E+00 Benzene 2.44E-02 0.00E+00Toluene 7.03E-02 4.37E+00 Toluene 1.80E-02 0.00E+00
Ethylbenzene 1.46E-02 9.06E-01 Ethylbenzene 3.72E-03 0.00E+00Xylene 4.97E-02 3.09E+00 Xylene 1.27E-02 0.00E+00
Formaldehyde 5.55E-01 3.45E+01 Formaldehyde 1.42E-01 0.00E+00n-Hexane 7.48E-03 4.65E-01 n-Hexane 1.91E-03 0.00E+00
CO24,5 1,506.99 93,690.73 CO2
4,6 703.26 0.00
CH44,5 6.20E-02 3.86E+00 CH4
4,6 2.90E-02 0.00E+00
N2O4,5 1.24E-02 7.70E-01 N2O
4,6 5.78E-03 0.00E+00
94,016.68 0.00
1 The cutoff point for light v. heavy duty trucks is assumed to be a GVW of 10000 lbs.2 AP-42 (EPA 1995), Volume II Mobile Sources. Heavy Duty Diesel Powered Vehicles, High Altitude, Tables 7.11A.2, 7.11B.2, and 7.11C.2 for NMHC, CO, and NOx using a 2020 Emission Factor with a 2006 Model Year SO2 emissions based on mass balance and 15 ppm diesel fuel with a density of 7.05 (lb/gal) and a mpg rating of 7 (mi/gal)3 AP-42 (EPA 1995), Volume II Mobile Sources. Light Duty Diesel Powered Trucks, High Altitude, Tables 6.11A.2, 6.11B.2, and 6.11C.2 for NMHC, CO, and NOx using a 2020 Emission Factor with a 2006 Model Year SO2 emissions based on mass balance and 15 ppm diesel fuel with a density of 7.05 (lb/gal) and a mpg rating of 15 (mi/gal)4 GHG emission factors taken from 2009 American Petroleum Institute GHG Compendium Tables 4-3 and 4-5, (API, 2009), represent the LHV5 EF(g/VMT) = EFAPI(tonnes/MMBtu) x 137000 (Btu/gal) /1000000 x 2204.6226 (lb/tonne) x 453.59 (g/lb) / 7 (mi/gal) Factor of 7 mpg taken from API, 2009, Table 4-13 for Diesel Heavy Truck6 EF(g/VMT) = EFAPI(tonnes/MMBtu) x 137000 (Btu/gal) /1000000 x 2204.6226 (lb/tonne) x 453.59 (g/lb) / 15 (mi/gal) Factor of 15 mpg taken from API, 2009, Table 4-13 for Diesel Light Truck7 Global Warming Potentials (GWP) taken from 2009 American Petroleum Institute GHG Compendium, (API, 2009), Table 3-1, UNFCCC, 2002 Values
CO2 Equivalents7 CO2 Equivalents7
PollutantEmission Factor 2
Emission Rate Pollutant
Emission Factor 3
Emission Rate
Diesel Heavy Duty Construction Motive Equipment Tailpipe
Emissions
Diesel Light Duty Construction Motive Equipment Tailpipe
Emissions
F-56

Pipeline Construction Road Traffic
F-57

This page intentionally left blank
F-58
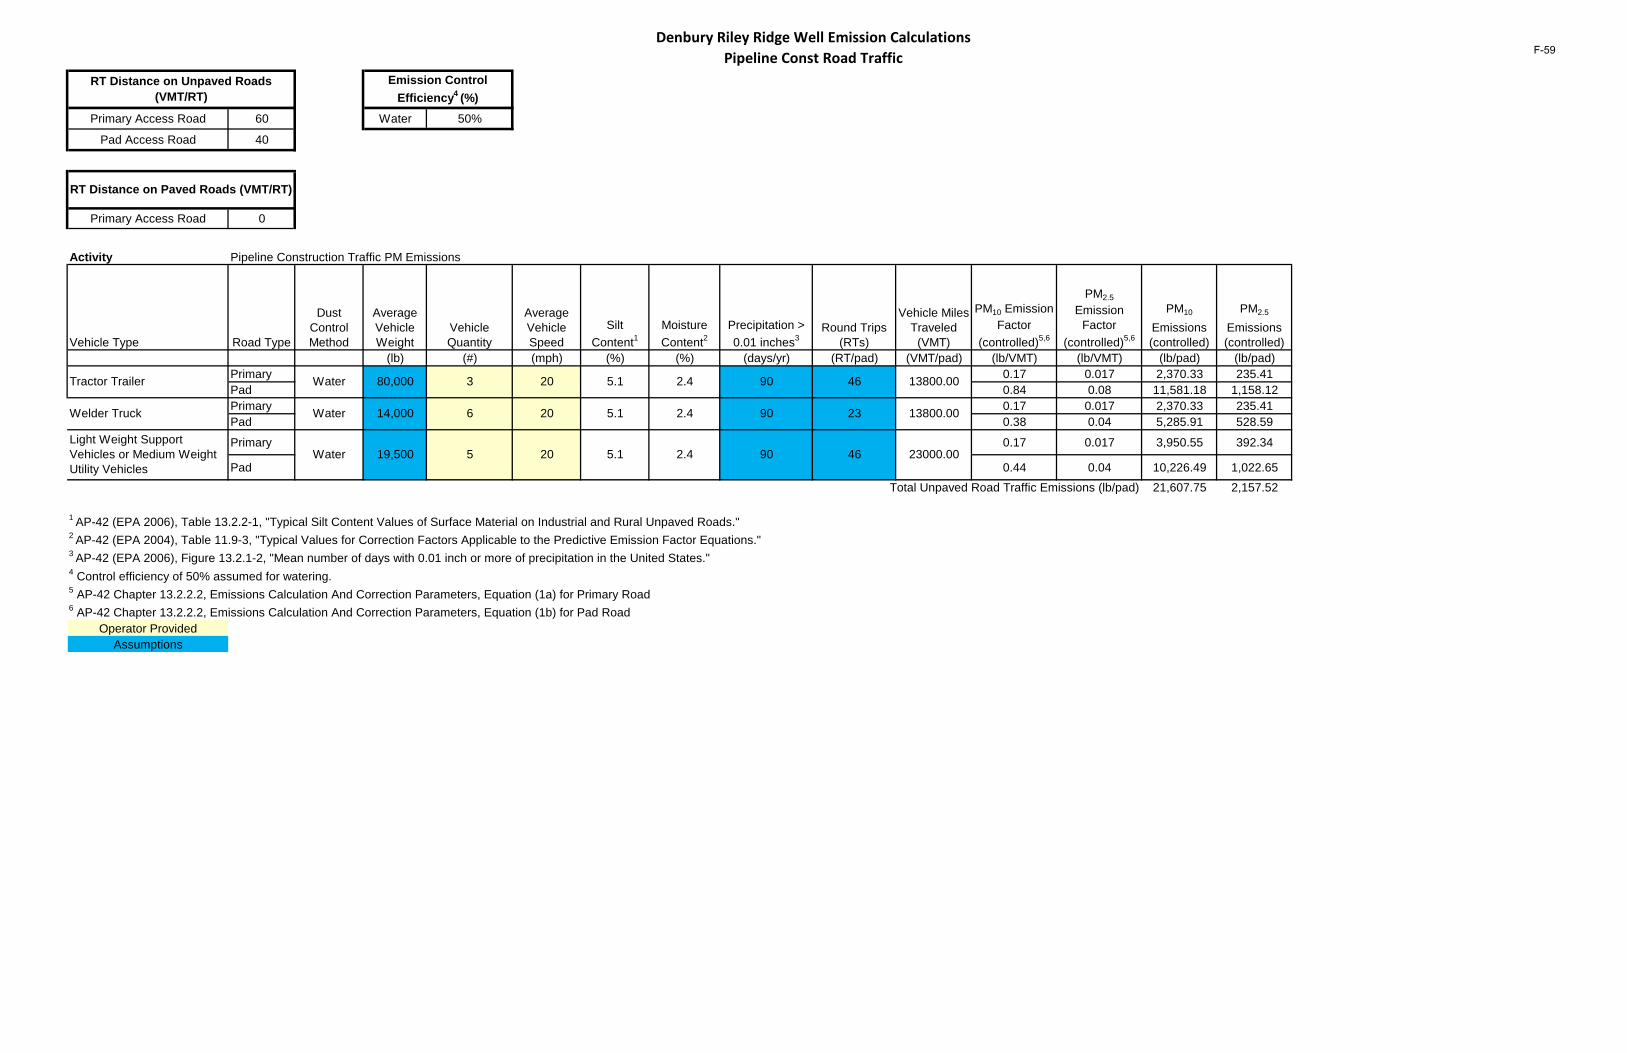
Denbury Riley Ridge Well Emission Calculations Pipeline Const Road Traffic
Primary Access Road 60 Water 50%
Pad Access Road 40
Primary Access Road 0
Activity Pipeline Construction Traffic PM Emissions
Vehicle Type Road Type
Dust Control Method
Average Vehicle Weight
Vehicle Quantity
Average Vehicle Speed
Silt Content1
Moisture Content2
Precipitation > 0.01 inches3
Round Trips (RTs)
Vehicle Miles Traveled
(VMT)
PM10 Emission Factor
(controlled)5,6
PM2.5
Emission Factor
(controlled)5,6
PM10
Emissions (controlled)
PM2.5
Emissions (controlled)
(lb) (#) (mph) (%) (%) (days/yr) (RT/pad) (VMT/pad) (lb/VMT) (lb/VMT) (lb/pad) (lb/pad)Primary 0.17 0.017 2,370.33 235.41Pad 0.84 0.08 11,581.18 1,158.12Primary 0.17 0.017 2,370.33 235.41Pad 0.38 0.04 5,285.91 528.59
Primary 0.17 0.017 3,950.55 392.34
Pad 0.44 0.04 10,226.49 1,022.65
Total Unpaved Road Traffic Emissions (lb/pad) 21,607.75 2,157.52
1 AP-42 (EPA 2006), Table 13.2.2-1, "Typical Silt Content Values of Surface Material on Industrial and Rural Unpaved Roads."2 AP-42 (EPA 2004), Table 11.9-3, "Typical Values for Correction Factors Applicable to the Predictive Emission Factor Equations."3 AP-42 (EPA 2006), Figure 13.2.1-2, "Mean number of days with 0.01 inch or more of precipitation in the United States."4 Control efficiency of 50% assumed for watering.5 AP-42 Chapter 13.2.2.2, Emissions Calculation And Correction Parameters, Equation (1a) for Primary Road6 AP-42 Chapter 13.2.2.2, Emissions Calculation And Correction Parameters, Equation (1b) for Pad Road
Operator ProvidedAssumptions
2.4 90 46 23000.00
2.4 90 23 13800.00
Light Weight Support Vehicles or Medium Weight Utility Vehicles
Water 19,500 5 20 5.1
Welder Truck Water 14,000 6 20 5.1
13800.00
RT Distance on Unpaved Roads (VMT/RT)
Emission Control Efficiency4 (%)
RT Distance on Paved Roads (VMT/RT)
Tractor Trailer Water 80,000 3 20 5.1 2.4 90 46
F-59
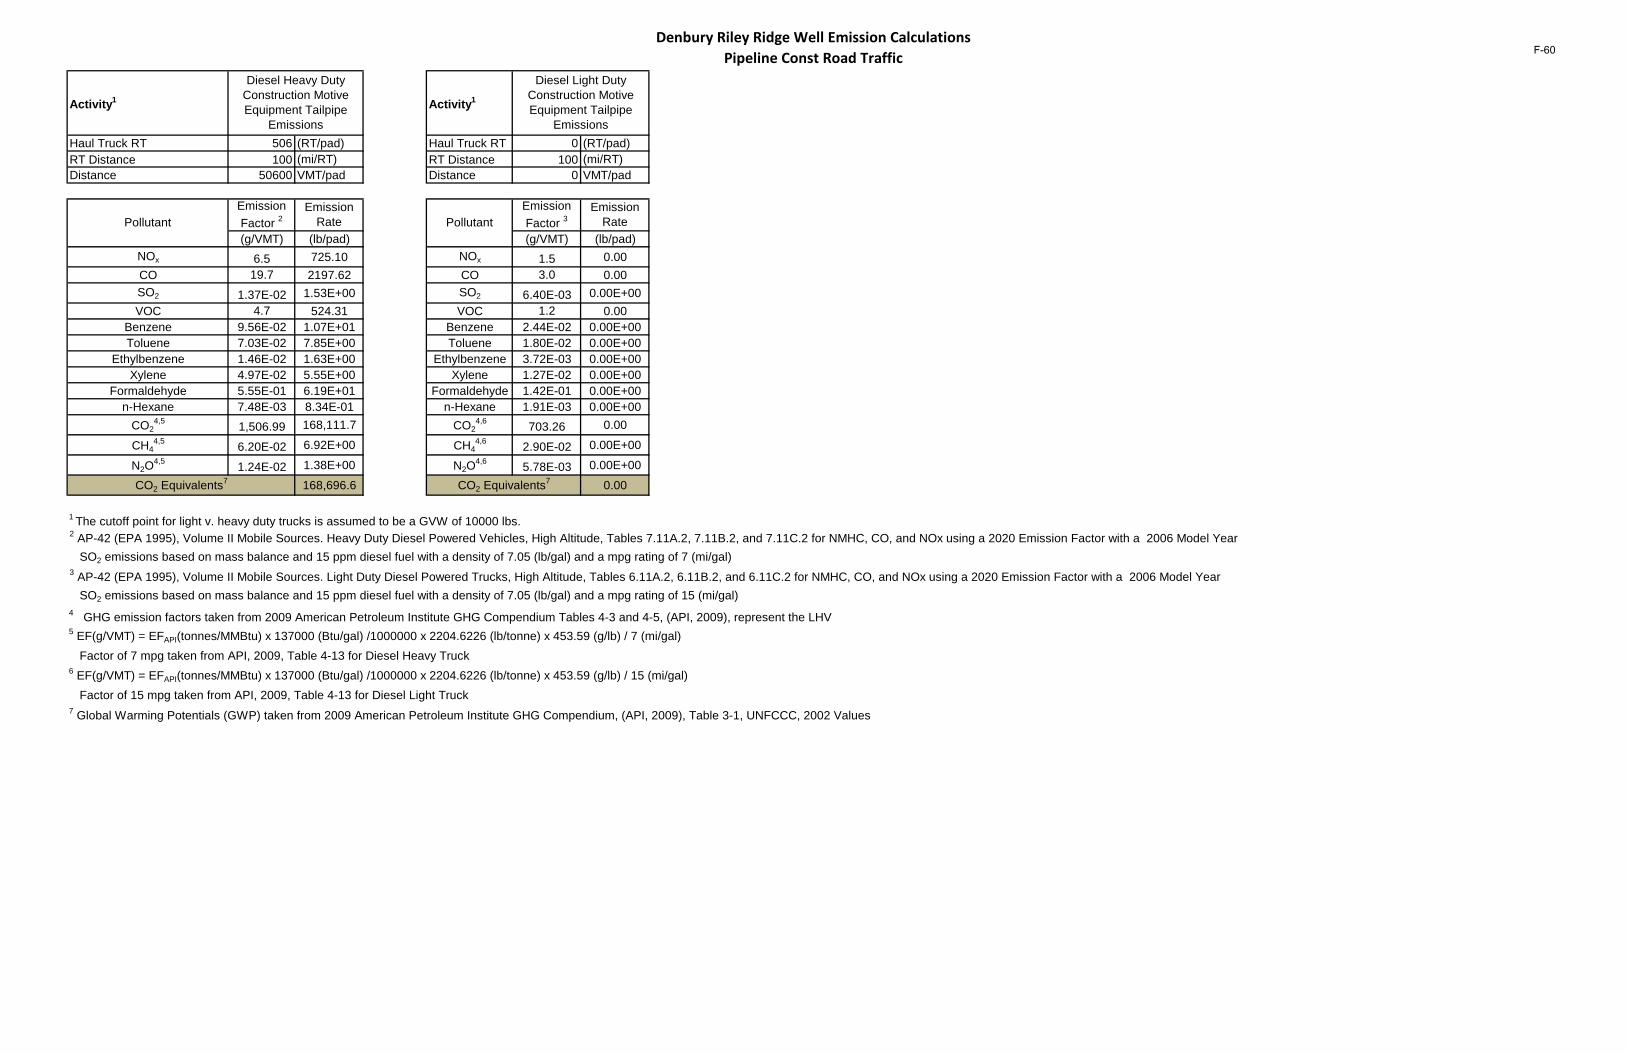
Denbury Riley Ridge Well Emission Calculations Pipeline Const Road Traffic
Activity1 Activity1
Haul Truck RT 506 (RT/pad) Haul Truck RT 0 (RT/pad)RT Distance 100 (mi/RT) RT Distance 100 (mi/RT)Distance 50600 VMT/pad Distance 0 VMT/pad
(g/VMT) (lb/pad) (g/VMT) (lb/pad)NOx 6.5 725.10 NOx 1.5 0.00CO 19.7 2197.62 CO 3.0 0.00SO2 1.37E-02 1.53E+00 SO2 6.40E-03 0.00E+00VOC 4.7 524.31 VOC 1.2 0.00
Benzene 9.56E-02 1.07E+01 Benzene 2.44E-02 0.00E+00Toluene 7.03E-02 7.85E+00 Toluene 1.80E-02 0.00E+00
Ethylbenzene 1.46E-02 1.63E+00 Ethylbenzene 3.72E-03 0.00E+00Xylene 4.97E-02 5.55E+00 Xylene 1.27E-02 0.00E+00
Formaldehyde 5.55E-01 6.19E+01 Formaldehyde 1.42E-01 0.00E+00n-Hexane 7.48E-03 8.34E-01 n-Hexane 1.91E-03 0.00E+00
CO24,5 1,506.99 168,111.7 CO2
4,6 703.26 0.00
CH44,5 6.20E-02 6.92E+00 CH4
4,6 2.90E-02 0.00E+00
N2O4,5 1.24E-02 1.38E+00 N2O
4,6 5.78E-03 0.00E+00
168,696.6 0.00
1 The cutoff point for light v. heavy duty trucks is assumed to be a GVW of 10000 lbs.2 AP-42 (EPA 1995), Volume II Mobile Sources. Heavy Duty Diesel Powered Vehicles, High Altitude, Tables 7.11A.2, 7.11B.2, and 7.11C.2 for NMHC, CO, and NOx using a 2020 Emission Factor with a 2006 Model Year SO2 emissions based on mass balance and 15 ppm diesel fuel with a density of 7.05 (lb/gal) and a mpg rating of 7 (mi/gal)3 AP-42 (EPA 1995), Volume II Mobile Sources. Light Duty Diesel Powered Trucks, High Altitude, Tables 6.11A.2, 6.11B.2, and 6.11C.2 for NMHC, CO, and NOx using a 2020 Emission Factor with a 2006 Model Year SO2 emissions based on mass balance and 15 ppm diesel fuel with a density of 7.05 (lb/gal) and a mpg rating of 15 (mi/gal)4 GHG emission factors taken from 2009 American Petroleum Institute GHG Compendium Tables 4-3 and 4-5, (API, 2009), represent the LHV5 EF(g/VMT) = EFAPI(tonnes/MMBtu) x 137000 (Btu/gal) /1000000 x 2204.6226 (lb/tonne) x 453.59 (g/lb) / 7 (mi/gal) Factor of 7 mpg taken from API, 2009, Table 4-13 for Diesel Heavy Truck6 EF(g/VMT) = EFAPI(tonnes/MMBtu) x 137000 (Btu/gal) /1000000 x 2204.6226 (lb/tonne) x 453.59 (g/lb) / 15 (mi/gal) Factor of 15 mpg taken from API, 2009, Table 4-13 for Diesel Light Truck7 Global Warming Potentials (GWP) taken from 2009 American Petroleum Institute GHG Compendium, (API, 2009), Table 3-1, UNFCCC, 2002 Values
CO2 Equivalents7 CO2 Equivalents7
PollutantEmission Factor 2
Emission Rate Pollutant
Emission Factor 3
Emission Rate
Diesel Heavy Duty Construction Motive Equipment Tailpipe
Emissions
Diesel Light Duty Construction Motive Equipment Tailpipe
Emissions
F-60
Construction Mobile Equipment
F-61

This page intentionally left blank
F-62
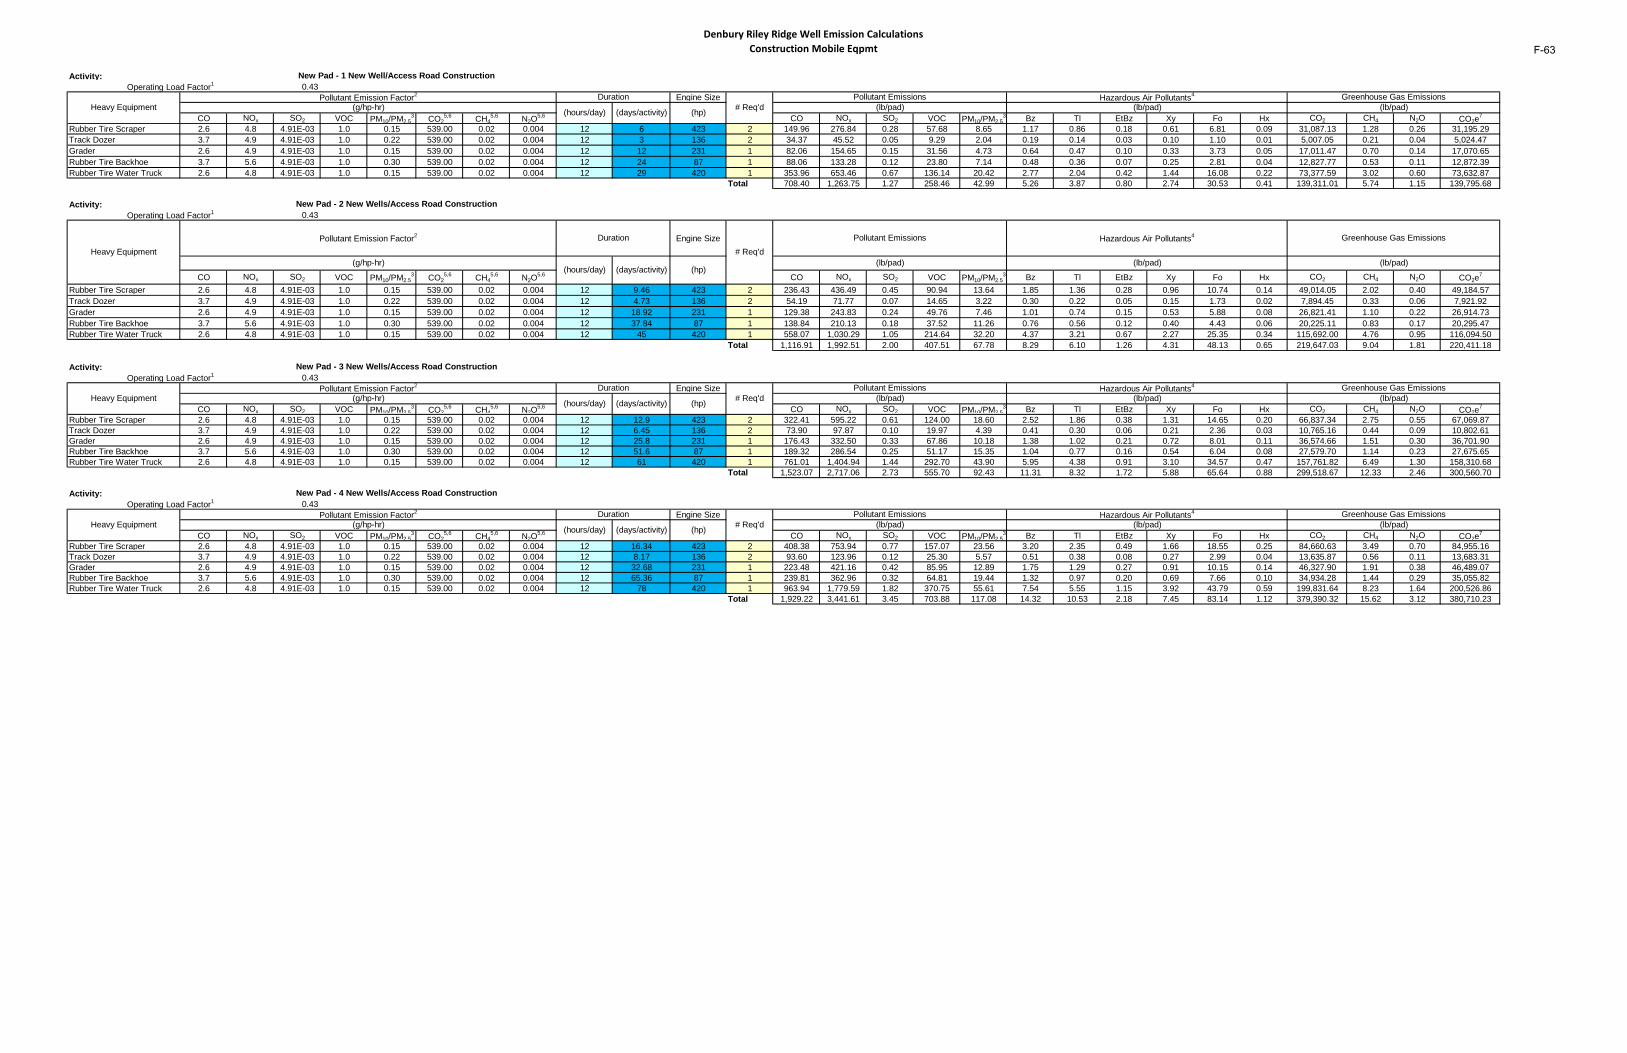
Denbury Riley Ridge Well Emission Calculations Construction Mobile Eqpmt
Activity:0.43
Engine Size
CO NOx SO2 VOC PM10/PM2.53 CO2
5,6 CH45,6 N2O
5,6 CO NOx SO2 VOC PM10/PM2.53 Bz Tl EtBz Xy Fo Hx CO2 CH4 N2O CO2e
7
Rubber Tire Scraper 2.6 4.8 4.91E-03 1.0 0.15 539.00 0.02 0.004 12 6 423 2 149.96 276.84 0.28 57.68 8.65 1.17 0.86 0.18 0.61 6.81 0.09 31,087.13 1.28 0.26 31,195.29Track Dozer 3.7 4.9 4.91E-03 1.0 0.22 539.00 0.02 0.004 12 3 136 2 34.37 45.52 0.05 9.29 2.04 0.19 0.14 0.03 0.10 1.10 0.01 5,007.05 0.21 0.04 5,024.47Grader 2.6 4.9 4.91E-03 1.0 0.15 539.00 0.02 0.004 12 12 231 1 82.06 154.65 0.15 31.56 4.73 0.64 0.47 0.10 0.33 3.73 0.05 17,011.47 0.70 0.14 17,070.65Rubber Tire Backhoe 3.7 5.6 4.91E-03 1.0 0.30 539.00 0.02 0.004 12 24 87 1 88.06 133.28 0.12 23.80 7.14 0.48 0.36 0.07 0.25 2.81 0.04 12,827.77 0.53 0.11 12,872.39Rubber Tire Water Truck 2.6 4.8 4.91E-03 1.0 0.15 539.00 0.02 0.004 12 29 420 1 353.96 653.46 0.67 136.14 20.42 2.77 2.04 0.42 1.44 16.08 0.22 73,377.59 3.02 0.60 73,632.87
Total 708.40 1,263.75 1.27 258.46 42.99 5.26 3.87 0.80 2.74 30.53 0.41 139,311.01 5.74 1.15 139,795.68
Activity:0.43
Engine Size
CO NOx SO2 VOC PM10/PM2.53 CO2
5,6 CH45,6 N2O
5,6 CO NOx SO2 VOC PM10/PM2.53 Bz Tl EtBz Xy Fo Hx CO2 CH4 N2O CO2e
7
Rubber Tire Scraper 2.6 4.8 4.91E-03 1.0 0.15 539.00 0.02 0.004 12 9.46 423 2 236.43 436.49 0.45 90.94 13.64 1.85 1.36 0.28 0.96 10.74 0.14 49,014.05 2.02 0.40 49,184.57Track Dozer 3.7 4.9 4.91E-03 1.0 0.22 539.00 0.02 0.004 12 4.73 136 2 54.19 71.77 0.07 14.65 3.22 0.30 0.22 0.05 0.15 1.73 0.02 7,894.45 0.33 0.06 7,921.92Grader 2.6 4.9 4.91E-03 1.0 0.15 539.00 0.02 0.004 12 18.92 231 1 129.38 243.83 0.24 49.76 7.46 1.01 0.74 0.15 0.53 5.88 0.08 26,821.41 1.10 0.22 26,914.73Rubber Tire Backhoe 3.7 5.6 4.91E-03 1.0 0.30 539.00 0.02 0.004 12 37.84 87 1 138.84 210.13 0.18 37.52 11.26 0.76 0.56 0.12 0.40 4.43 0.06 20,225.11 0.83 0.17 20,295.47Rubber Tire Water Truck 2.6 4.8 4.91E-03 1.0 0.15 539.00 0.02 0.004 12 45 420 1 558.07 1,030.29 1.05 214.64 32.20 4.37 3.21 0.67 2.27 25.35 0.34 115,692.00 4.76 0.95 116,094.50
Total 1,116.91 1,992.51 2.00 407.51 67.78 8.29 6.10 1.26 4.31 48.13 0.65 219,647.03 9.04 1.81 220,411.18
Activity:0.43
Engine Size
CO NOx SO2 VOC PM10/PM2.53 CO2
5,6 CH45,6 N2O
5,6 CO NOx SO2 VOC PM10/PM2.53 Bz Tl EtBz Xy Fo Hx CO2 CH4 N2O CO2e
7
Rubber Tire Scraper 2.6 4.8 4.91E-03 1.0 0.15 539.00 0.02 0.004 12 12.9 423 2 322.41 595.22 0.61 124.00 18.60 2.52 1.86 0.38 1.31 14.65 0.20 66,837.34 2.75 0.55 67,069.87Track Dozer 3.7 4.9 4.91E-03 1.0 0.22 539.00 0.02 0.004 12 6.45 136 2 73.90 97.87 0.10 19.97 4.39 0.41 0.30 0.06 0.21 2.36 0.03 10,765.16 0.44 0.09 10,802.61Grader 2.6 4.9 4.91E-03 1.0 0.15 539.00 0.02 0.004 12 25.8 231 1 176.43 332.50 0.33 67.86 10.18 1.38 1.02 0.21 0.72 8.01 0.11 36,574.66 1.51 0.30 36,701.90Rubber Tire Backhoe 3.7 5.6 4.91E-03 1.0 0.30 539.00 0.02 0.004 12 51.6 87 1 189.32 286.54 0.25 51.17 15.35 1.04 0.77 0.16 0.54 6.04 0.08 27,579.70 1.14 0.23 27,675.65Rubber Tire Water Truck 2.6 4.8 4.91E-03 1.0 0.15 539.00 0.02 0.004 12 61 420 1 761.01 1,404.94 1.44 292.70 43.90 5.95 4.38 0.91 3.10 34.57 0.47 157,761.82 6.49 1.30 158,310.68
Total 1,523.07 2,717.06 2.73 555.70 92.43 11.31 8.32 1.72 5.88 65.64 0.88 299,518.67 12.33 2.46 300,560.70
Activity:0.43
Engine Size
CO NOx SO2 VOC PM10/PM2.53 CO2
5,6 CH45,6 N2O
5,6 CO NOx SO2 VOC PM10/PM2.53 Bz Tl EtBz Xy Fo Hx CO2 CH4 N2O CO2e
7
Rubber Tire Scraper 2.6 4.8 4.91E-03 1.0 0.15 539.00 0.02 0.004 12 16.34 423 2 408.38 753.94 0.77 157.07 23.56 3.20 2.35 0.49 1.66 18.55 0.25 84,660.63 3.49 0.70 84,955.16Track Dozer 3.7 4.9 4.91E-03 1.0 0.22 539.00 0.02 0.004 12 8.17 136 2 93.60 123.96 0.12 25.30 5.57 0.51 0.38 0.08 0.27 2.99 0.04 13,635.87 0.56 0.11 13,683.31Grader 2.6 4.9 4.91E-03 1.0 0.15 539.00 0.02 0.004 12 32.68 231 1 223.48 421.16 0.42 85.95 12.89 1.75 1.29 0.27 0.91 10.15 0.14 46,327.90 1.91 0.38 46,489.07Rubber Tire Backhoe 3.7 5.6 4.91E-03 1.0 0.30 539.00 0.02 0.004 12 65.36 87 1 239.81 362.96 0.32 64.81 19.44 1.32 0.97 0.20 0.69 7.66 0.10 34,934.28 1.44 0.29 35,055.82Rubber Tire Water Truck 2.6 4.8 4.91E-03 1.0 0.15 539.00 0.02 0.004 12 78 420 1 963.94 1,779.59 1.82 370.75 55.61 7.54 5.55 1.15 3.92 43.79 0.59 199,831.64 8.23 1.64 200,526.86
Total 1,929.22 3,441.61 3.45 703.88 117.08 14.32 10.53 2.18 7.45 83.14 1.12 379,390.32 15.62 3.12 380,710.23
New Pad - 2 New Wells/Access Road ConstructionOperating Load Factor1
Heavy EquipmentPollutant Emission Factor2 Duration
# Req'dPollutant Emissions
Greenhouse Gas Emissions(lb/pad) (lb/pad)
New Pad - 1 New Well/Access Road ConstructionOperating Load Factor1
(hours/day)
Duration
(days/activity)(g/hp-hr)Heavy EquipmentPollutant Emission Factor2
# Req'dPollutant Emissions
(hp) (lb/pad)Hazardous Air Pollutants4
New Pad - 3 New Wells/Access Road ConstructionOperating Load Factor1
Heavy EquipmentPollutant Emission Factor2 Duration
Hazardous Air Pollutants4 Greenhouse Gas Emissions
(g/hp-hr)(hours/day) (days/activity) (hp)
(lb/pad) (lb/pad) (lb/pad)
New Pad - 4 New Wells/Access Road ConstructionOperating Load Factor1
Heavy EquipmentPollutant Emission Factor2 Duration
# Req'dPollutant Emissions Hazardous Air Pollutants4 Greenhouse Gas Emissions
(g/hp-hr) (hours/day) (days/activity) (hp) (lb/pad) (lb/pad) (lb/pad)
# Req'dPollutant Emissions Hazardous Air Pollutants4 Greenhouse Gas Emissions
(g/hp-hr) (hours/day) (days/activity) (hp) (lb/pad) (lb/pad) (lb/pad)
F-63
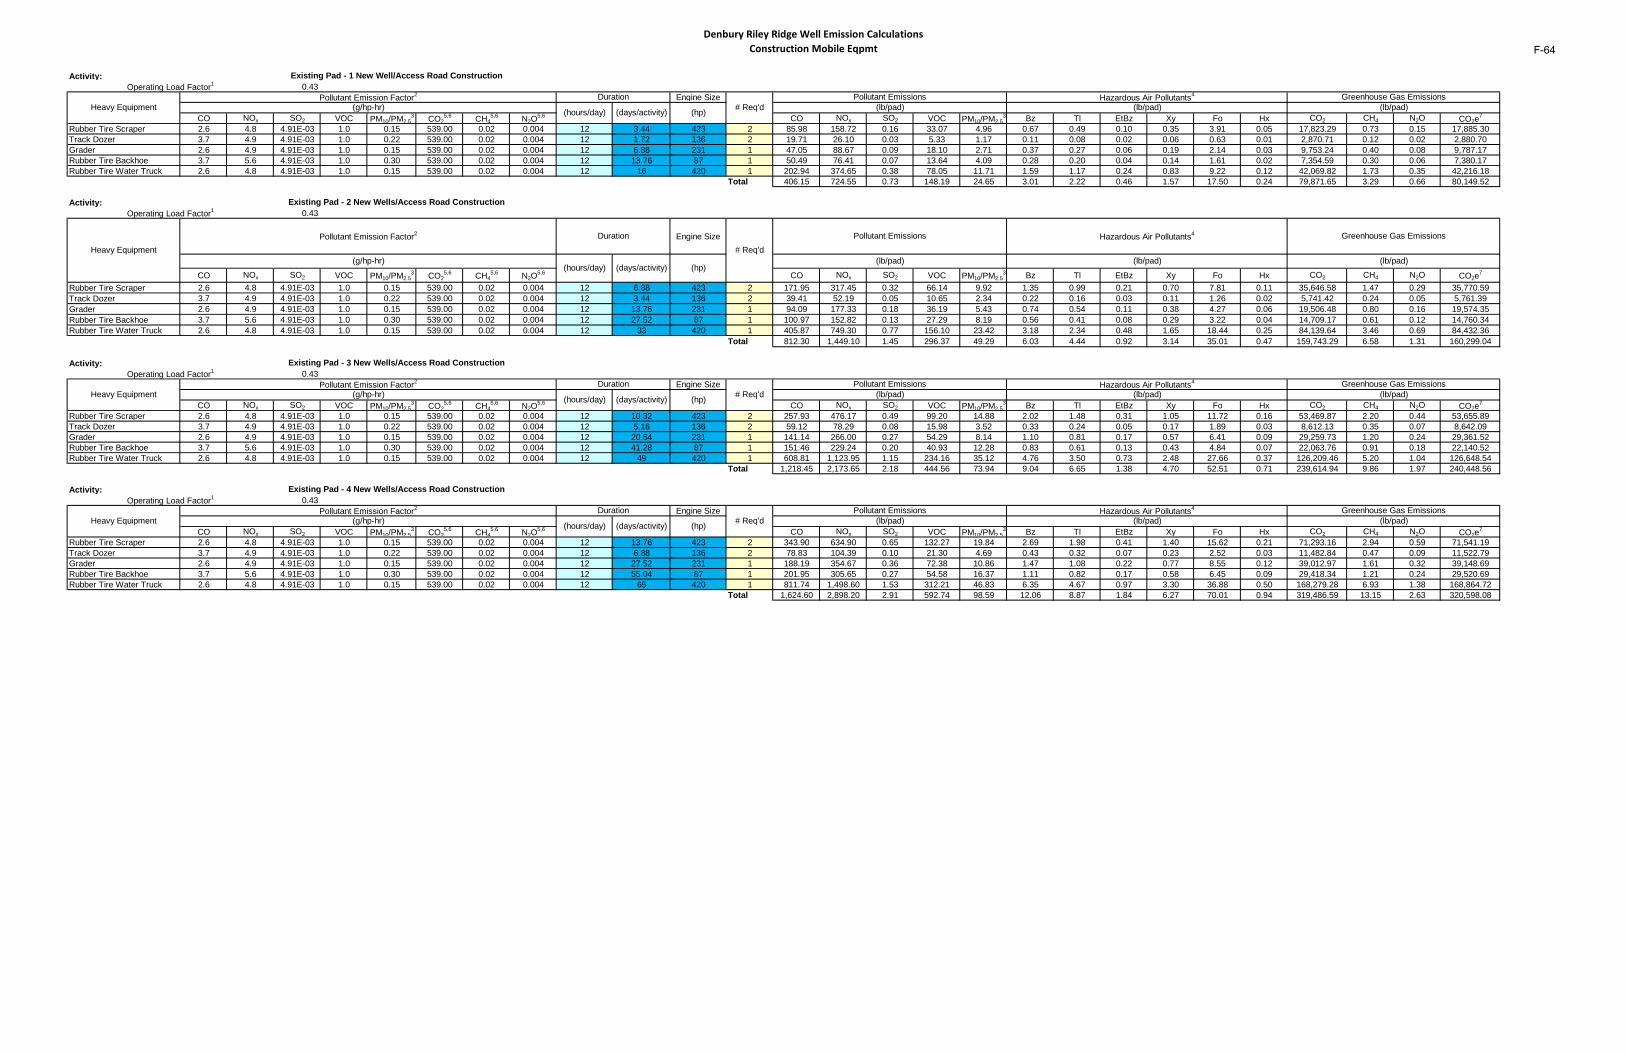
Denbury Riley Ridge Well Emission Calculations Construction Mobile Eqpmt
Activity:0.43
Engine Size
CO NOx SO2 VOC PM10/PM2.53 CO2
5,6 CH45,6 N2O
5,6 CO NOx SO2 VOC PM10/PM2.53 Bz Tl EtBz Xy Fo Hx CO2 CH4 N2O CO2e
7
Rubber Tire Scraper 2.6 4.8 4.91E-03 1.0 0.15 539.00 0.02 0.004 12 3.44 423 2 85.98 158.72 0.16 33.07 4.96 0.67 0.49 0.10 0.35 3.91 0.05 17,823.29 0.73 0.15 17,885.30Track Dozer 3.7 4.9 4.91E-03 1.0 0.22 539.00 0.02 0.004 12 1.72 136 2 19.71 26.10 0.03 5.33 1.17 0.11 0.08 0.02 0.06 0.63 0.01 2,870.71 0.12 0.02 2,880.70Grader 2.6 4.9 4.91E-03 1.0 0.15 539.00 0.02 0.004 12 6.88 231 1 47.05 88.67 0.09 18.10 2.71 0.37 0.27 0.06 0.19 2.14 0.03 9,753.24 0.40 0.08 9,787.17Rubber Tire Backhoe 3.7 5.6 4.91E-03 1.0 0.30 539.00 0.02 0.004 12 13.76 87 1 50.49 76.41 0.07 13.64 4.09 0.28 0.20 0.04 0.14 1.61 0.02 7,354.59 0.30 0.06 7,380.17Rubber Tire Water Truck 2.6 4.8 4.91E-03 1.0 0.15 539.00 0.02 0.004 12 16 420 1 202.94 374.65 0.38 78.05 11.71 1.59 1.17 0.24 0.83 9.22 0.12 42,069.82 1.73 0.35 42,216.18
Total 406.15 724.55 0.73 148.19 24.65 3.01 2.22 0.46 1.57 17.50 0.24 79,871.65 3.29 0.66 80,149.52
Activity:0.43
Engine Size
CO NOx SO2 VOC PM10/PM2.53 CO2
5,6 CH45,6 N2O
5,6 CO NOx SO2 VOC PM10/PM2.53 Bz Tl EtBz Xy Fo Hx CO2 CH4 N2O CO2e
7
Rubber Tire Scraper 2.6 4.8 4.91E-03 1.0 0.15 539.00 0.02 0.004 12 6.88 423 2 171.95 317.45 0.32 66.14 9.92 1.35 0.99 0.21 0.70 7.81 0.11 35,646.58 1.47 0.29 35,770.59Track Dozer 3.7 4.9 4.91E-03 1.0 0.22 539.00 0.02 0.004 12 3.44 136 2 39.41 52.19 0.05 10.65 2.34 0.22 0.16 0.03 0.11 1.26 0.02 5,741.42 0.24 0.05 5,761.39Grader 2.6 4.9 4.91E-03 1.0 0.15 539.00 0.02 0.004 12 13.76 231 1 94.09 177.33 0.18 36.19 5.43 0.74 0.54 0.11 0.38 4.27 0.06 19,506.48 0.80 0.16 19,574.35Rubber Tire Backhoe 3.7 5.6 4.91E-03 1.0 0.30 539.00 0.02 0.004 12 27.52 87 1 100.97 152.82 0.13 27.29 8.19 0.56 0.41 0.08 0.29 3.22 0.04 14,709.17 0.61 0.12 14,760.34Rubber Tire Water Truck 2.6 4.8 4.91E-03 1.0 0.15 539.00 0.02 0.004 12 33 420 1 405.87 749.30 0.77 156.10 23.42 3.18 2.34 0.48 1.65 18.44 0.25 84,139.64 3.46 0.69 84,432.36
Total 812.30 1,449.10 1.45 296.37 49.29 6.03 4.44 0.92 3.14 35.01 0.47 159,743.29 6.58 1.31 160,299.04
Activity:0.43
Engine Size
CO NOx SO2 VOC PM10/PM2.53 CO2
5,6 CH45,6 N2O
5,6 CO NOx SO2 VOC PM10/PM2.53 Bz Tl EtBz Xy Fo Hx CO2 CH4 N2O CO2e
7
Rubber Tire Scraper 2.6 4.8 4.91E-03 1.0 0.15 539.00 0.02 0.004 12 10.32 423 2 257.93 476.17 0.49 99.20 14.88 2.02 1.48 0.31 1.05 11.72 0.16 53,469.87 2.20 0.44 53,655.89Track Dozer 3.7 4.9 4.91E-03 1.0 0.22 539.00 0.02 0.004 12 5.16 136 2 59.12 78.29 0.08 15.98 3.52 0.33 0.24 0.05 0.17 1.89 0.03 8,612.13 0.35 0.07 8,642.09Grader 2.6 4.9 4.91E-03 1.0 0.15 539.00 0.02 0.004 12 20.64 231 1 141.14 266.00 0.27 54.29 8.14 1.10 0.81 0.17 0.57 6.41 0.09 29,259.73 1.20 0.24 29,361.52Rubber Tire Backhoe 3.7 5.6 4.91E-03 1.0 0.30 539.00 0.02 0.004 12 41.28 87 1 151.46 229.24 0.20 40.93 12.28 0.83 0.61 0.13 0.43 4.84 0.07 22,063.76 0.91 0.18 22,140.52Rubber Tire Water Truck 2.6 4.8 4.91E-03 1.0 0.15 539.00 0.02 0.004 12 49 420 1 608.81 1,123.95 1.15 234.16 35.12 4.76 3.50 0.73 2.48 27.66 0.37 126,209.46 5.20 1.04 126,648.54
Total 1,218.45 2,173.65 2.18 444.56 73.94 9.04 6.65 1.38 4.70 52.51 0.71 239,614.94 9.86 1.97 240,448.56
Activity:0.43
Engine Size
CO NOx SO2 VOC PM10/PM2.53 CO2
5,6 CH45,6 N2O
5,6 CO NOx SO2 VOC PM10/PM2.53 Bz Tl EtBz Xy Fo Hx CO2 CH4 N2O CO2e
7
Rubber Tire Scraper 2.6 4.8 4.91E-03 1.0 0.15 539.00 0.02 0.004 12 13.76 423 2 343.90 634.90 0.65 132.27 19.84 2.69 1.98 0.41 1.40 15.62 0.21 71,293.16 2.94 0.59 71,541.19Track Dozer 3.7 4.9 4.91E-03 1.0 0.22 539.00 0.02 0.004 12 6.88 136 2 78.83 104.39 0.10 21.30 4.69 0.43 0.32 0.07 0.23 2.52 0.03 11,482.84 0.47 0.09 11,522.79Grader 2.6 4.9 4.91E-03 1.0 0.15 539.00 0.02 0.004 12 27.52 231 1 188.19 354.67 0.36 72.38 10.86 1.47 1.08 0.22 0.77 8.55 0.12 39,012.97 1.61 0.32 39,148.69Rubber Tire Backhoe 3.7 5.6 4.91E-03 1.0 0.30 539.00 0.02 0.004 12 55.04 87 1 201.95 305.65 0.27 54.58 16.37 1.11 0.82 0.17 0.58 6.45 0.09 29,418.34 1.21 0.24 29,520.69Rubber Tire Water Truck 2.6 4.8 4.91E-03 1.0 0.15 539.00 0.02 0.004 12 65 420 1 811.74 1,498.60 1.53 312.21 46.83 6.35 4.67 0.97 3.30 36.88 0.50 168,279.28 6.93 1.38 168,864.72
Total 1,624.60 2,898.20 2.91 592.74 98.59 12.06 8.87 1.84 6.27 70.01 0.94 319,486.59 13.15 2.63 320,598.08
Existing Pad - 1 New Well/Access Road ConstructionOperating Load Factor1
Heavy EquipmentPollutant Emission Factor2 Duration
Existing Pad - 2 New Wells/Access Road ConstructionOperating Load Factor1
Heavy EquipmentPollutant Emission Factor2 Duration
# Req'dPollutant Emissions Hazardous Air Pollutants4 Greenhouse Gas Emissions
(g/hp-hr) (hours/day) (days/activity) (hp) (lb/pad) (lb/pad) (lb/pad)
Pollutant Emissions Hazardous Air Pollutants4 Greenhouse Gas Emissions
(g/hp-hr)(hours/day) (days/activity) (hp)
(lb/pad) (lb/pad) (lb/pad)
(hours/day) (days/activity) (hp)
Existing Pad - 3 New Wells/Access Road ConstructionOperating Load Factor1
Heavy EquipmentPollutant Emission Factor2 Duration
# Req'd
(lb/pad) (lb/pad) (lb/pad)
Existing Pad - 4 New Wells/Access Road ConstructionOperating Load Factor1
Heavy EquipmentPollutant Emission Factor2 Duration
# Req'dPollutant Emissions Hazardous Air Pollutants4 Greenhouse Gas Emissions
(g/hp-hr)
(g/hp-hr)
(hours/day) (days/activity) (hp) (lb/pad) (lb/pad) (lb/pad)
# Req'dPollutant Emissions Hazardous Air Pollutants4 Greenhouse Gas Emissions
F-64
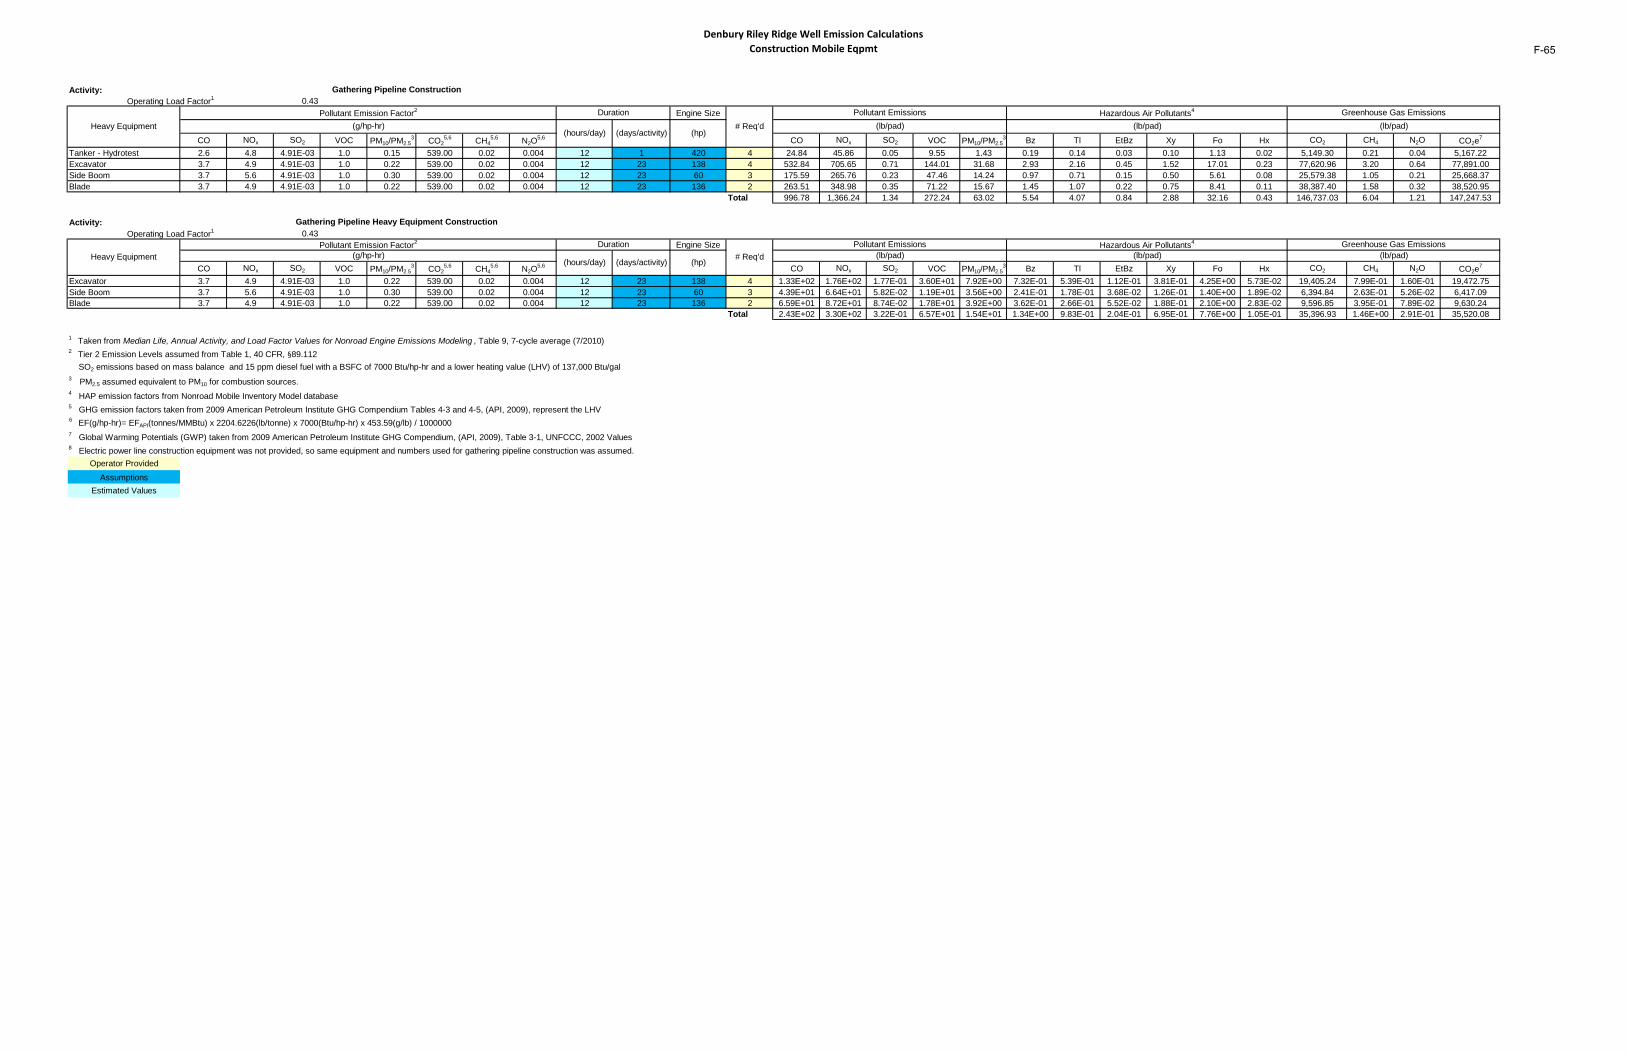
Denbury Riley Ridge Well Emission Calculations Construction Mobile Eqpmt
Activity:0.43
Engine Size
CO NOx SO2 VOC PM10/PM2.53 CO2
5,6 CH45,6 N2O
5,6 CO NOx SO2 VOC PM10/PM2.53 Bz Tl EtBz Xy Fo Hx CO2 CH4 N2O CO2e
7
Tanker - Hydrotest 2.6 4.8 4.91E-03 1.0 0.15 539.00 0.02 0.004 12 1 420 4 24.84 45.86 0.05 9.55 1.43 0.19 0.14 0.03 0.10 1.13 0.02 5,149.30 0.21 0.04 5,167.22Excavator 3.7 4.9 4.91E-03 1.0 0.22 539.00 0.02 0.004 12 23 138 4 532.84 705.65 0.71 144.01 31.68 2.93 2.16 0.45 1.52 17.01 0.23 77,620.96 3.20 0.64 77,891.00Side Boom 3.7 5.6 4.91E-03 1.0 0.30 539.00 0.02 0.004 12 23 60 3 175.59 265.76 0.23 47.46 14.24 0.97 0.71 0.15 0.50 5.61 0.08 25,579.38 1.05 0.21 25,668.37Blade 3.7 4.9 4.91E-03 1.0 0.22 539.00 0.02 0.004 12 23 136 2 263.51 348.98 0.35 71.22 15.67 1.45 1.07 0.22 0.75 8.41 0.11 38,387.40 1.58 0.32 38,520.95
Total 996.78 1,366.24 1.34 272.24 63.02 5.54 4.07 0.84 2.88 32.16 0.43 146,737.03 6.04 1.21 147,247.53
Activity:0.43
Engine Size
CO NOx SO2 VOC PM10/PM2.53 CO2
5,6 CH45,6 N2O
5,6 CO NOx SO2 VOC PM10/PM2.53 Bz Tl EtBz Xy Fo Hx CO2 CH4 N2O CO2e
7
Excavator 3.7 4.9 4.91E-03 1.0 0.22 539.00 0.02 0.004 12 23 138 4 1.33E+02 1.76E+02 1.77E-01 3.60E+01 7.92E+00 7.32E-01 5.39E-01 1.12E-01 3.81E-01 4.25E+00 5.73E-02 19,405.24 7.99E-01 1.60E-01 19,472.75Side Boom 3.7 5.6 4.91E-03 1.0 0.30 539.00 0.02 0.004 12 23 60 3 4.39E+01 6.64E+01 5.82E-02 1.19E+01 3.56E+00 2.41E-01 1.78E-01 3.68E-02 1.26E-01 1.40E+00 1.89E-02 6,394.84 2.63E-01 5.26E-02 6,417.09Blade 3.7 4.9 4.91E-03 1.0 0.22 539.00 0.02 0.004 12 23 136 2 6.59E+01 8.72E+01 8.74E-02 1.78E+01 3.92E+00 3.62E-01 2.66E-01 5.52E-02 1.88E-01 2.10E+00 2.83E-02 9,596.85 3.95E-01 7.89E-02 9,630.24
Total 2.43E+02 3.30E+02 3.22E-01 6.57E+01 1.54E+01 1.34E+00 9.83E-01 2.04E-01 6.95E-01 7.76E+00 1.05E-01 35,396.93 1.46E+00 2.91E-01 35,520.08
1 Taken from Median Life, Annual Activity, and Load Factor Values for Nonroad Engine Emissions Modeling , Table 9, 7-cycle average (7/2010)2 Tier 2 Emission Levels assumed from Table 1, 40 CFR, §89.112 SO2 emissions based on mass balance and 15 ppm diesel fuel with a BSFC of 7000 Btu/hp-hr and a lower heating value (LHV) of 137,000 Btu/gal3 PM2.5 assumed equivalent to PM10 for combustion sources.4 HAP emission factors from Nonroad Mobile Inventory Model database5 GHG emission factors taken from 2009 American Petroleum Institute GHG Compendium Tables 4-3 and 4-5, (API, 2009), represent the LHV6 EF(g/hp-hr)= EFAPI(tonnes/MMBtu) x 2204.6226(lb/tonne) x 7000(Btu/hp-hr) x 453.59(g/lb) / 10000007 Global Warming Potentials (GWP) taken from 2009 American Petroleum Institute GHG Compendium, (API, 2009), Table 3-1, UNFCCC, 2002 Values8 Electric power line construction equipment was not provided, so same equipment and numbers used for gathering pipeline construction was assumed.
Operator ProvidedAssumptions
Estimated Values
Heavy EquipmentPollutant Emission Factor2 Duration
# Req'dPollutant Emissions Hazardous Air Pollutants4 Greenhouse Gas Emissions
(g/hp-hr)(hours/day) (days/activity) (hp)
(lb/pad) (lb/pad) (lb/pad)
Gathering Pipeline Heavy Equipment ConstructionOperating Load Factor1
Heavy EquipmentPollutant Emission Factor2 Duration
# Req'dPollutant Emissions Hazardous Air Pollutants4
Gathering Pipeline ConstructionOperating Load Factor1
Greenhouse Gas Emissions(g/hp-hr)
(hours/day) (days/activity) (hp)(lb/pad) (lb/pad) (lb/pad)
F-65

This page intentionally left blank
F-66
Construction Emissions Summary
F-67

This page intentionally left blank
F-68
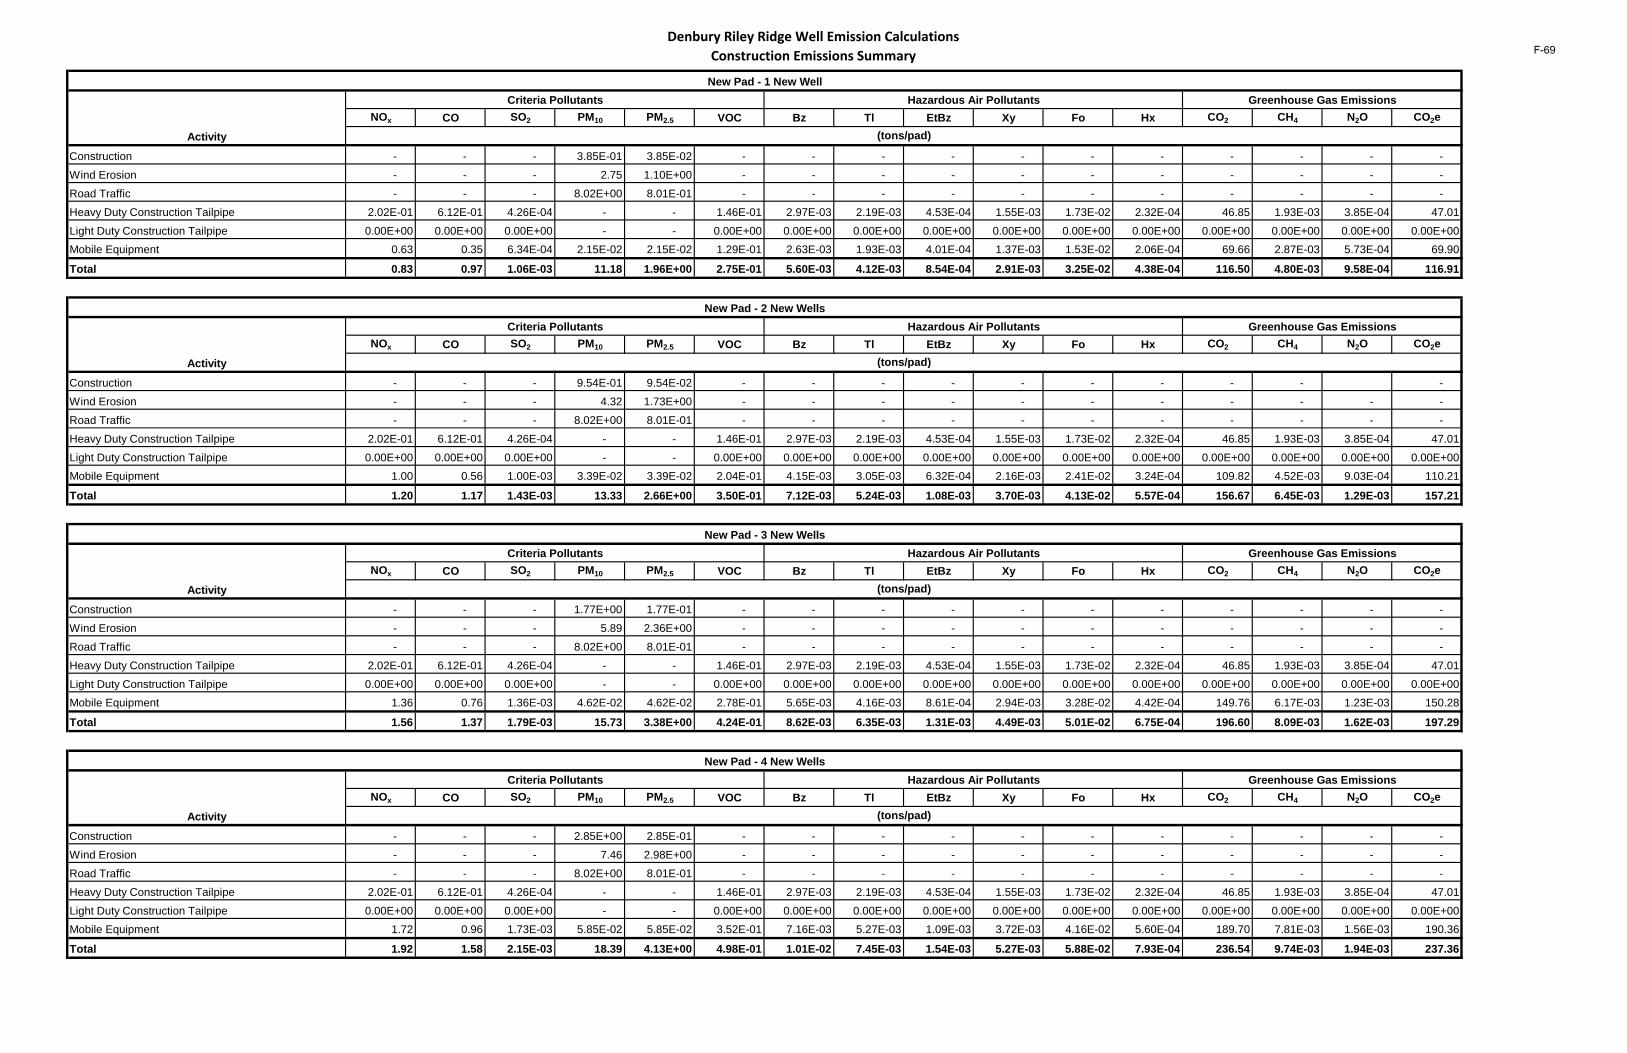
Denbury Riley Ridge Well Emission Calculations Construction Emissions Summary
NOx CO SO2 PM10 PM2.5 VOC Bz Tl EtBz Xy Fo Hx CO2 CH4 N2O CO2e
Construction - - - 3.85E-01 3.85E-02 - - - - - - - - - - -
Wind Erosion - - - 2.75 1.10E+00 - - - - - - - - - - -
Road Traffic - - - 8.02E+00 8.01E-01 - - - - - - - - - - -
Heavy Duty Construction Tailpipe 2.02E-01 6.12E-01 4.26E-04 - - 1.46E-01 2.97E-03 2.19E-03 4.53E-04 1.55E-03 1.73E-02 2.32E-04 46.85 1.93E-03 3.85E-04 47.01
Light Duty Construction Tailpipe 0.00E+00 0.00E+00 0.00E+00 - - 0.00E+00 0.00E+00 0.00E+00 0.00E+00 0.00E+00 0.00E+00 0.00E+00 0.00E+00 0.00E+00 0.00E+00 0.00E+00Mobile Equipment 0.63 0.35 6.34E-04 2.15E-02 2.15E-02 1.29E-01 2.63E-03 1.93E-03 4.01E-04 1.37E-03 1.53E-02 2.06E-04 69.66 2.87E-03 5.73E-04 69.90
Total 0.83 0.97 1.06E-03 11.18 1.96E+00 2.75E-01 5.60E-03 4.12E-03 8.54E-04 2.91E-03 3.25E-02 4.38E-04 116.50 4.80E-03 9.58E-04 116.91
NOx CO SO2 PM10 PM2.5 VOC Bz Tl EtBz Xy Fo Hx CO2 CH4 N2O CO2e
Construction - - - 9.54E-01 9.54E-02 - - - - - - - - - -
Wind Erosion - - - 4.32 1.73E+00 - - - - - - - - - - -
Road Traffic - - - 8.02E+00 8.01E-01 - - - - - - - - - - -
Heavy Duty Construction Tailpipe 2.02E-01 6.12E-01 4.26E-04 - - 1.46E-01 2.97E-03 2.19E-03 4.53E-04 1.55E-03 1.73E-02 2.32E-04 46.85 1.93E-03 3.85E-04 47.01
Light Duty Construction Tailpipe 0.00E+00 0.00E+00 0.00E+00 - - 0.00E+00 0.00E+00 0.00E+00 0.00E+00 0.00E+00 0.00E+00 0.00E+00 0.00E+00 0.00E+00 0.00E+00 0.00E+00Mobile Equipment 1.00 0.56 1.00E-03 3.39E-02 3.39E-02 2.04E-01 4.15E-03 3.05E-03 6.32E-04 2.16E-03 2.41E-02 3.24E-04 109.82 4.52E-03 9.03E-04 110.21
Total 1.20 1.17 1.43E-03 13.33 2.66E+00 3.50E-01 7.12E-03 5.24E-03 1.08E-03 3.70E-03 4.13E-02 5.57E-04 156.67 6.45E-03 1.29E-03 157.21
NOx CO SO2 PM10 PM2.5 VOC Bz Tl EtBz Xy Fo Hx CO2 CH4 N2O CO2e
Construction - - - 1.77E+00 1.77E-01 - - - - - - - - - - -
Wind Erosion - - - 5.89 2.36E+00 - - - - - - - - - - -
Road Traffic - - - 8.02E+00 8.01E-01 - - - - - - - - - - -
Heavy Duty Construction Tailpipe 2.02E-01 6.12E-01 4.26E-04 - - 1.46E-01 2.97E-03 2.19E-03 4.53E-04 1.55E-03 1.73E-02 2.32E-04 46.85 1.93E-03 3.85E-04 47.01
Light Duty Construction Tailpipe 0.00E+00 0.00E+00 0.00E+00 - - 0.00E+00 0.00E+00 0.00E+00 0.00E+00 0.00E+00 0.00E+00 0.00E+00 0.00E+00 0.00E+00 0.00E+00 0.00E+00Mobile Equipment 1.36 0.76 1.36E-03 4.62E-02 4.62E-02 2.78E-01 5.65E-03 4.16E-03 8.61E-04 2.94E-03 3.28E-02 4.42E-04 149.76 6.17E-03 1.23E-03 150.28
Total 1.56 1.37 1.79E-03 15.73 3.38E+00 4.24E-01 8.62E-03 6.35E-03 1.31E-03 4.49E-03 5.01E-02 6.75E-04 196.60 8.09E-03 1.62E-03 197.29
NOx CO SO2 PM10 PM2.5 VOC Bz Tl EtBz Xy Fo Hx CO2 CH4 N2O CO2e
Construction - - - 2.85E+00 2.85E-01 - - - - - - - - - - -
Wind Erosion - - - 7.46 2.98E+00 - - - - - - - - - - -
Road Traffic - - - 8.02E+00 8.01E-01 - - - - - - - - - - -
Heavy Duty Construction Tailpipe 2.02E-01 6.12E-01 4.26E-04 - - 1.46E-01 2.97E-03 2.19E-03 4.53E-04 1.55E-03 1.73E-02 2.32E-04 46.85 1.93E-03 3.85E-04 47.01
Light Duty Construction Tailpipe 0.00E+00 0.00E+00 0.00E+00 - - 0.00E+00 0.00E+00 0.00E+00 0.00E+00 0.00E+00 0.00E+00 0.00E+00 0.00E+00 0.00E+00 0.00E+00 0.00E+00Mobile Equipment 1.72 0.96 1.73E-03 5.85E-02 5.85E-02 3.52E-01 7.16E-03 5.27E-03 1.09E-03 3.72E-03 4.16E-02 5.60E-04 189.70 7.81E-03 1.56E-03 190.36
Total 1.92 1.58 2.15E-03 18.39 4.13E+00 4.98E-01 1.01E-02 7.45E-03 1.54E-03 5.27E-03 5.88E-02 7.93E-04 236.54 9.74E-03 1.94E-03 237.36
Criteria Pollutants Hazardous Air Pollutants Greenhouse Gas Emissions
(tons/pad)
New Pad - 3 New Wells
Activity
New Pad - 1 New Well
(tons/pad)Activity
Criteria Pollutants Hazardous Air Pollutants Greenhouse Gas Emissions
New Pad - 2 New Wells
Activity
Criteria Pollutants Hazardous Air Pollutants Greenhouse Gas Emissions
(tons/pad)
New Pad - 4 New Wells
Activity
Criteria Pollutants Hazardous Air Pollutants Greenhouse Gas Emissions
(tons/pad)
F-69

Denbury Riley Ridge Well Emission Calculations Construction Emissions Summary
NOx CO SO2 PM10 PM2.5 VOC Bz Tl EtBz Xy Fo Hx CO2 CH4 N2O CO2e
Construction - - - 1.26E-01 1.26E-02 - - - - - - - - - - -
Wind Erosion - - - 1.57 6.28E-01 - - - - - - - - - - -
Road Traffic - - - 8.02E+00 8.01E-01 - - - - - - - - - - -
Heavy Duty Construction Tailpipe 2.02E-01 6.12E-01 4.26E-04 - - 1.46E-01 2.97E-03 2.19E-03 4.53E-04 1.55E-03 1.73E-02 2.32E-04 46.85 1.93E-03 3.85E-04 47.01
Light Duty Construction Tailpipe 0.00E+00 0.00E+00 0.00E+00 - - 0.00E+00 0.00E+00 0.00E+00 0.00E+00 0.00E+00 0.00E+00 0.00E+00 0.00E+00 0.00E+00 0.00E+00 0.00E+00Mobile Equipment 0.36 0.20 3.64E-04 1.23E-02 1.23E-02 7.41E-02 1.51E-03 1.11E-03 2.30E-04 7.84E-04 8.75E-03 1.18E-04 39.94 1.64E-03 3.28E-04 40.07
Total 0.56 0.82 7.90E-04 9.73 1.45E+00 2.20E-01 4.48E-03 3.30E-03 6.83E-04 2.33E-03 2.60E-02 3.50E-04 86.78 3.57E-03 7.13E-04 87.08
NOx CO SO2 PM10 PM2.5 VOC Bz Tl EtBz Xy Fo Hx CO2 CH4 N2O CO2e
Construction - - - 5.05E-01 5.05E-02 - - - - - - - - - - -
Wind Erosion - - - 3.14 1.26E+00 - - - - - - - - - - -
Road Traffic - - - 8.02E+00 8.01E-01 - - - - - - - - - - -
Heavy Duty Construction Tailpipe 2.02E-01 6.12E-01 4.26E-04 - - 1.46E-01 2.97E-03 2.19E-03 4.53E-04 1.55E-03 1.73E-02 2.32E-04 46.85 1.93E-03 3.85E-04 47.01
Light Duty Construction Tailpipe 0.00E+00 0.00E+00 0.00E+00 - - 0.00E+00 0.00E+00 0.00E+00 0.00E+00 0.00E+00 0.00E+00 0.00E+00 0.00E+00 0.00E+00 0.00E+00 0.00E+00Mobile Equipment 0.72 0.41 7.27E-04 2.46E-02 2.46E-02 1.48E-01 3.01E-03 2.22E-03 4.59E-04 1.57E-03 1.75E-02 2.36E-04 79.87 3.29E-03 6.57E-04 80.15
Total 0.93 1.02 1.15E-03 11.69 2.13E+00 2.94E-01 5.99E-03 4.40E-03 9.12E-04 3.11E-03 3.48E-02 4.68E-04 126.72 5.22E-03 1.04E-03 127.16
NOx CO SO2 PM10 PM2.5 VOC Bz Tl EtBz Xy Fo Hx CO2 CH4 N2O CO2e
Construction - - - 1.14E+00 1.14E-01 - - - - - - - - - - -
Wind Erosion - - - 4.71 1.88E+00 - - - - - - - - - - -
Road Traffic - - - 8.02E+00 8.01E-01 - - - - - - - - - - -
Heavy Duty Construction Tailpipe 2.02E-01 6.12E-01 4.26E-04 - - 1.46E-01 2.97E-03 2.19E-03 4.53E-04 1.55E-03 1.73E-02 2.32E-04 46.85 1.93E-03 3.85E-04 47.01
Light Duty Construction Tailpipe 0.00E+00 0.00E+00 0.00E+00 - - 0.00E+00 0.00E+00 0.00E+00 0.00E+00 0.00E+00 0.00E+00 0.00E+00 0.00E+00 0.00E+00 0.00E+00 0.00E+00Mobile Equipment 1.09 0.61 1.09E-03 3.70E-02 3.70E-02 2.22E-01 4.52E-03 3.33E-03 6.89E-04 2.35E-03 2.63E-02 3.54E-04 119.81 4.93E-03 9.85E-04 120.22
Total 1.29 1.22 1.52E-03 13.91 2.84E+00 3.68E-01 7.49E-03 5.51E-03 1.14E-03 3.90E-03 4.35E-02 5.86E-04 166.65 6.86E-03 1.37E-03 167.23
NOx CO SO2 PM10 PM2.5 VOC Bz Tl EtBz Xy Fo Hx CO2 CH4 N2O CO2e
Construction - - - 2.02E+00 2.02E-01 - - - - - - - - - - -
Wind Erosion - - - 6.28 2.51E+00 - - - - - - - - - - -
Road Traffic - - - 8.02E+00 8.01E-01 - - - - - - - - - - -
Heavy Duty Construction Tailpipe 2.02E-01 6.12E-01 4.26E-04 - - 1.46E-01 2.97E-03 2.19E-03 4.53E-04 1.55E-03 1.73E-02 2.32E-04 46.85 1.93E-03 3.85E-04 47.01
Light Duty Construction Tailpipe 0.00E+00 0.00E+00 0.00E+00 - - 0.00E+00 0.00E+00 0.00E+00 0.00E+00 0.00E+00 0.00E+00 0.00E+00 0.00E+00 0.00E+00 0.00E+00 0.00E+00Mobile Equipment 1.45 0.81 1.45E-03 4.93E-02 4.93E-02 2.96E-01 6.03E-03 4.44E-03 9.19E-04 3.14E-03 3.50E-02 4.72E-04 159.74 6.58E-03 1.31E-03 160.30
Total 1.65 1.42 1.88E-03 16.37 3.57E+00 4.42E-01 9.00E-03 6.62E-03 1.37E-03 4.68E-03 5.23E-02 7.04E-04 206.59 8.51E-03 1.70E-03 207.31
Existing Pad - 1 New Well
Activity
Criteria Pollutants Hazardous Air Pollutants Greenhouse Gas Emissions
(tons/pad)
Existing Pad - 2 New Wells
Activity
Criteria Pollutants Hazardous Air Pollutants Greenhouse Gas Emissions
(tons/pad)
Existing Pad - 3 New Wells
Activity
Criteria Pollutants Hazardous Air Pollutants Greenhouse Gas Emissions
(tons/pad)
Existing Pad - 4 New Wells
Activity
Criteria Pollutants Hazardous Air Pollutants Greenhouse Gas Emissions
(tons/pad)
F-70
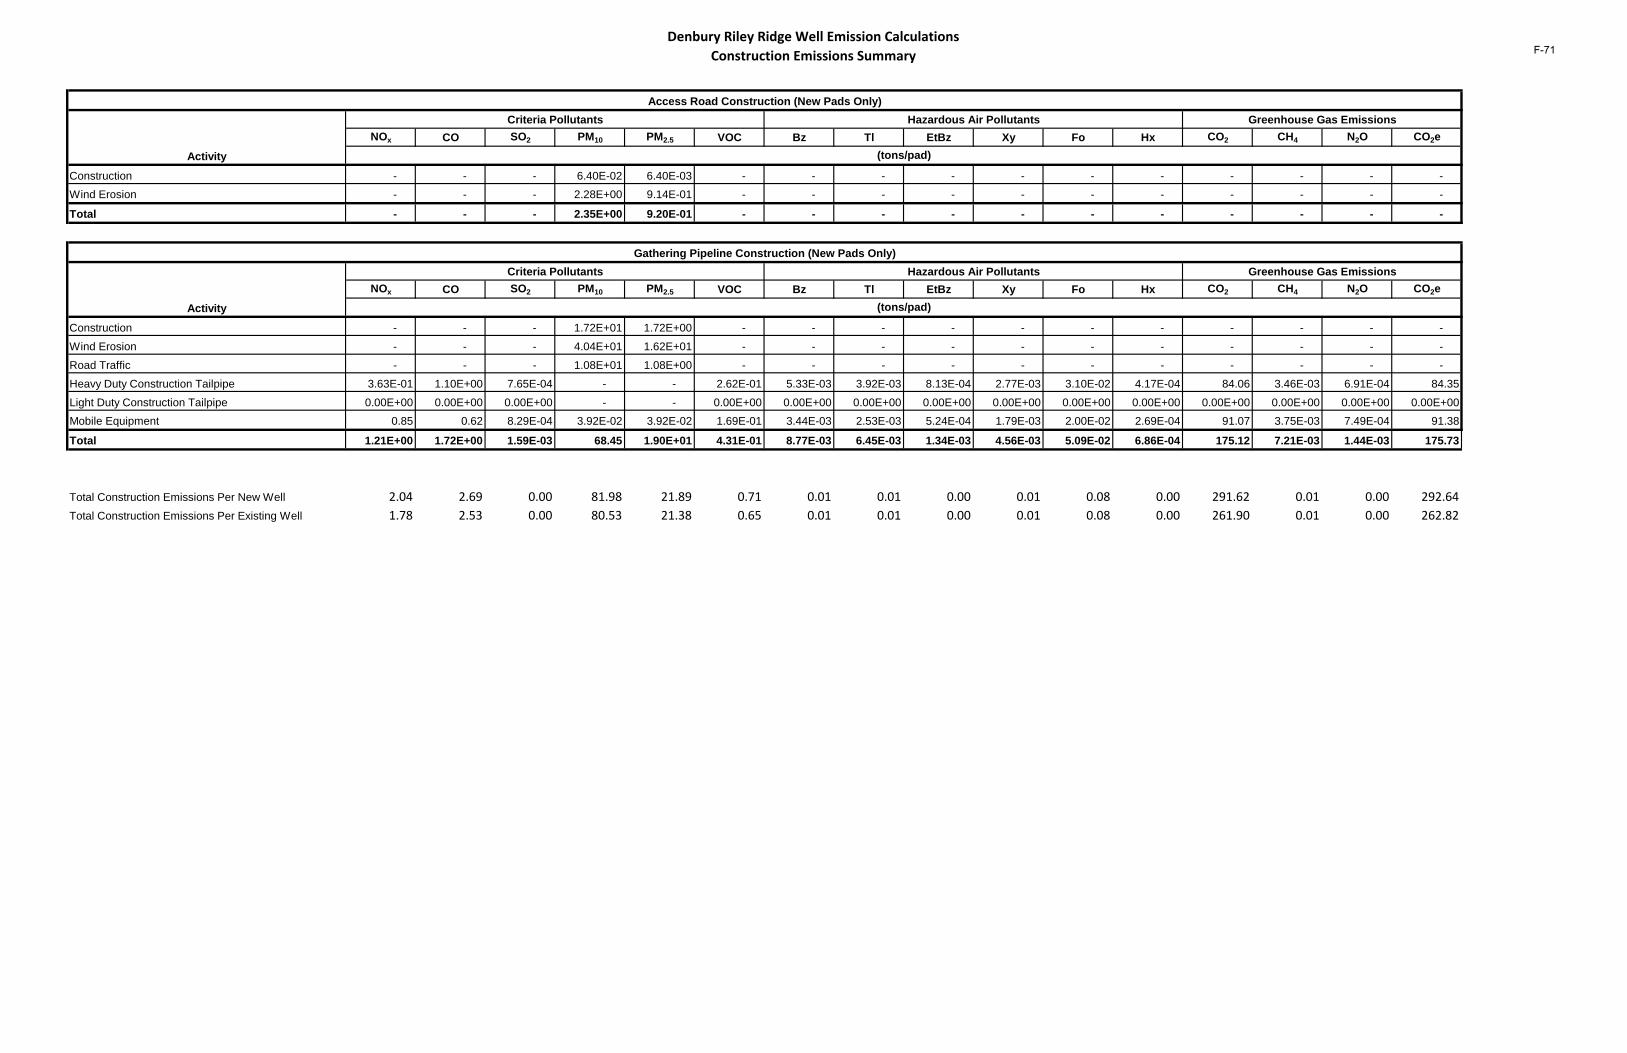
Denbury Riley Ridge Well Emission Calculations Construction Emissions Summary
NOx CO SO2 PM10 PM2.5 VOC Bz Tl EtBz Xy Fo Hx CO2 CH4 N2O CO2e
Construction - - - 6.40E-02 6.40E-03 - - - - - - - - - - - Wind Erosion - - - 2.28E+00 9.14E-01 - - - - - - - - - - -
Total - - - 2.35E+00 9.20E-01 - - - - - - - - - - -
NOx CO SO2 PM10 PM2.5 VOC Bz Tl EtBz Xy Fo Hx CO2 CH4 N2O CO2e
Construction - - - 1.72E+01 1.72E+00 - - - - - - - - - - -
Wind Erosion - - - 4.04E+01 1.62E+01 - - - - - - - - - - -
Road Traffic - - - 1.08E+01 1.08E+00 - - - - - - - - - - -
Heavy Duty Construction Tailpipe 3.63E-01 1.10E+00 7.65E-04 - - 2.62E-01 5.33E-03 3.92E-03 8.13E-04 2.77E-03 3.10E-02 4.17E-04 84.06 3.46E-03 6.91E-04 84.35
Light Duty Construction Tailpipe 0.00E+00 0.00E+00 0.00E+00 - - 0.00E+00 0.00E+00 0.00E+00 0.00E+00 0.00E+00 0.00E+00 0.00E+00 0.00E+00 0.00E+00 0.00E+00 0.00E+00Mobile Equipment 0.85 0.62 8.29E-04 3.92E-02 3.92E-02 1.69E-01 3.44E-03 2.53E-03 5.24E-04 1.79E-03 2.00E-02 2.69E-04 91.07 3.75E-03 7.49E-04 91.38
Total 1.21E+00 1.72E+00 1.59E-03 68.45 1.90E+01 4.31E-01 8.77E-03 6.45E-03 1.34E-03 4.56E-03 5.09E-02 6.86E-04 175.12 7.21E-03 1.44E-03 175.73
Total Construction Emissions Per New Well 2.04 2.69 0.00 81.98 21.89 0.71 0.01 0.01 0.00 0.01 0.08 0.00 291.62 0.01 0.00 292.64Total Construction Emissions Per Existing Well 1.78 2.53 0.00 80.53 21.38 0.65 0.01 0.01 0.00 0.01 0.08 0.00 261.90 0.01 0.00 262.82
Gathering Pipeline Construction (New Pads Only)Hazardous Air Pollutants Greenhouse Gas EmissionsCriteria Pollutants
Activity
Criteria Pollutants
Activity (tons/pad)
Access Road Construction (New Pads Only)Hazardous Air Pollutants Greenhouse Gas Emissions
(tons/pad)
F-71

This page intentionally left blank
F-72

Drill Rig
F-73

This page intentionally left blank
F-74
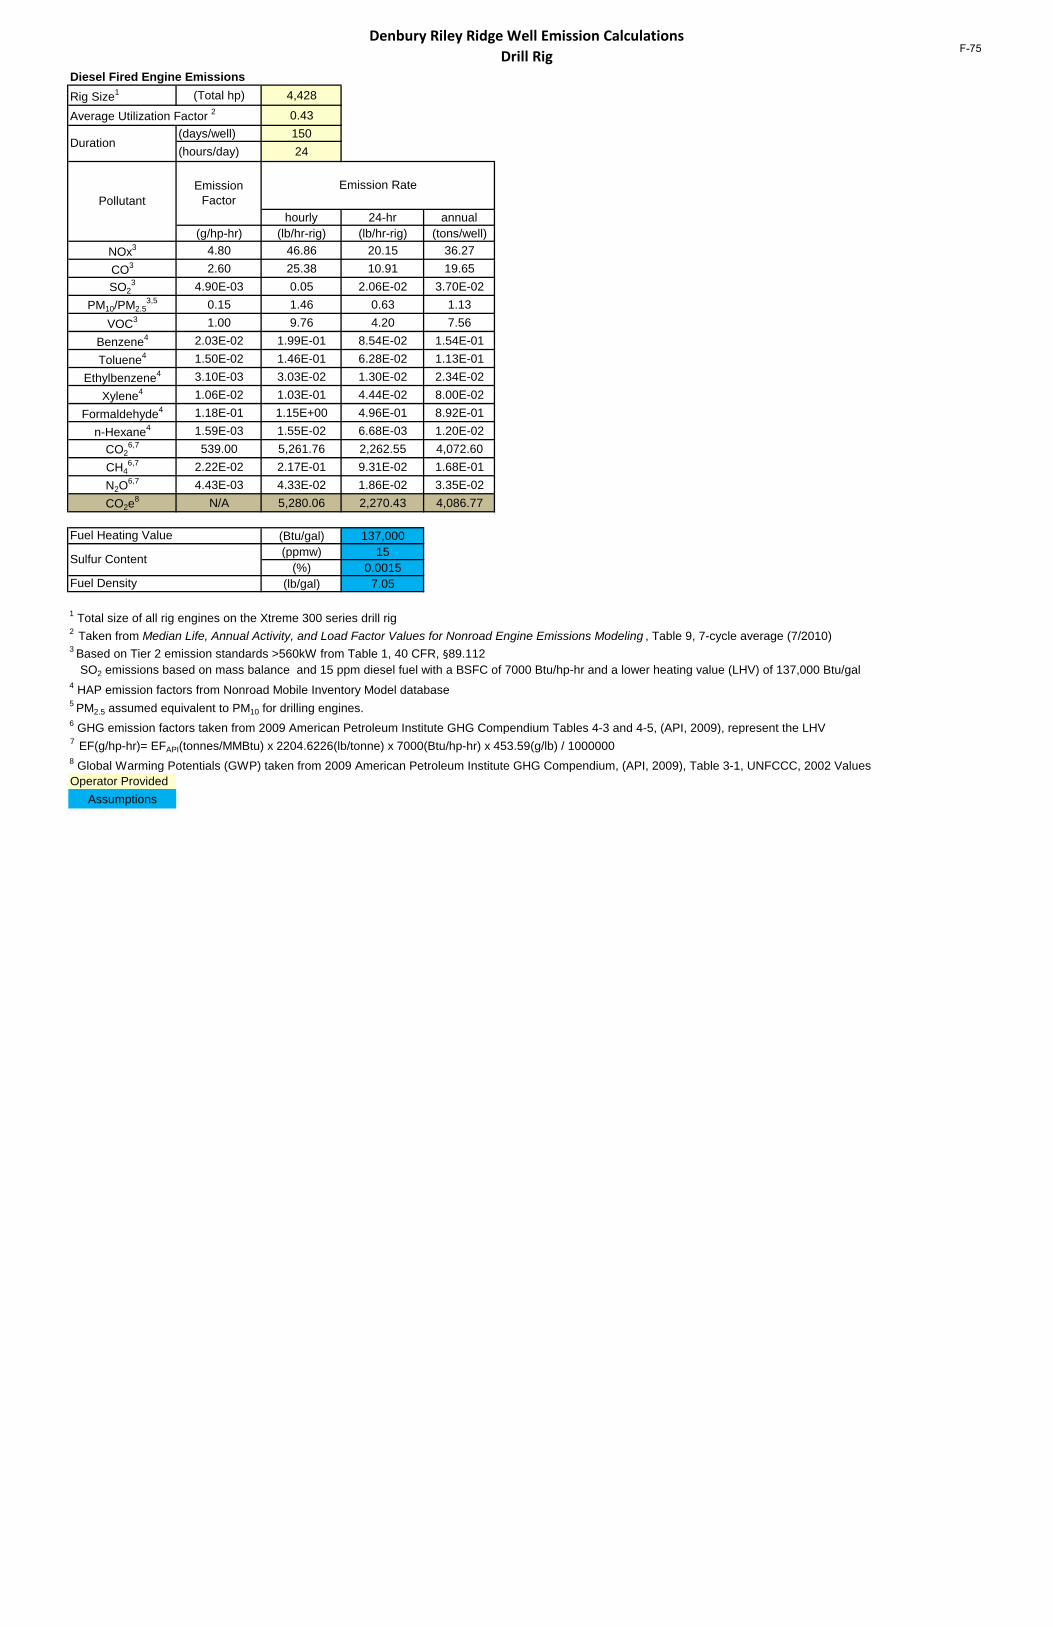
Denbury Riley Ridge Well Emission Calculations Drill Rig
Rig Size1 (Total hp) 4,428
0.43(days/well) 150(hours/day) 24
hourly 24-hr annual(g/hp-hr) (lb/hr-rig) (lb/hr-rig) (tons/well)
NOx3 4.80 46.86 20.15 36.27CO3 2.60 25.38 10.91 19.65SO2
3 4.90E-03 0.05 2.06E-02 3.70E-02PM10/PM2.5
3,5 0.15 1.46 0.63 1.13VOC3 1.00 9.76 4.20 7.56
Benzene4 2.03E-02 1.99E-01 8.54E-02 1.54E-01Toluene4 1.50E-02 1.46E-01 6.28E-02 1.13E-01
Ethylbenzene4 3.10E-03 3.03E-02 1.30E-02 2.34E-02Xylene4 1.06E-02 1.03E-01 4.44E-02 8.00E-02
Formaldehyde4 1.18E-01 1.15E+00 4.96E-01 8.92E-01n-Hexane4 1.59E-03 1.55E-02 6.68E-03 1.20E-02
CO26,7 539.00 5,261.76 2,262.55 4,072.60
CH46,7 2.22E-02 2.17E-01 9.31E-02 1.68E-01
N2O6,7 4.43E-03 4.33E-02 1.86E-02 3.35E-02
CO2e8 N/A 5,280.06 2,270.43 4,086.77
(Btu/gal) 137,000(ppmw) 15
(%) 0.0015(lb/gal) 7.05
1 Total size of all rig engines on the Xtreme 300 series drill rig2 Taken from Median Life, Annual Activity, and Load Factor Values for Nonroad Engine Emissions Modeling , Table 9, 7-cycle average (7/2010)3 Based on Tier 2 emission standards >560kW from Table 1, 40 CFR, §89.112 SO2 emissions based on mass balance and 15 ppm diesel fuel with a BSFC of 7000 Btu/hp-hr and a lower heating value (LHV) of 137,000 Btu/gal4 HAP emission factors from Nonroad Mobile Inventory Model database5 PM2.5 assumed equivalent to PM10 for drilling engines.6 GHG emission factors taken from 2009 American Petroleum Institute GHG Compendium Tables 4-3 and 4-5, (API, 2009), represent the LHV7 EF(g/hp-hr)= EFAPI(tonnes/MMBtu) x 2204.6226(lb/tonne) x 7000(Btu/hp-hr) x 453.59(g/lb) / 10000008 Global Warming Potentials (GWP) taken from 2009 American Petroleum Institute GHG Compendium, (API, 2009), Table 3-1, UNFCCC, 2002 ValuesOperator Provided
Assumptions
Duration
Diesel Fired Engine Emissions
Average Utilization Factor 2
Emission Factor
Fuel Density
Sulfur Content
Pollutant
Fuel Heating Value
Emission Rate
F-75

This page intentionally left blank
F-76

Drill Rig Boiler
F-77

This page intentionally left blank
F-78
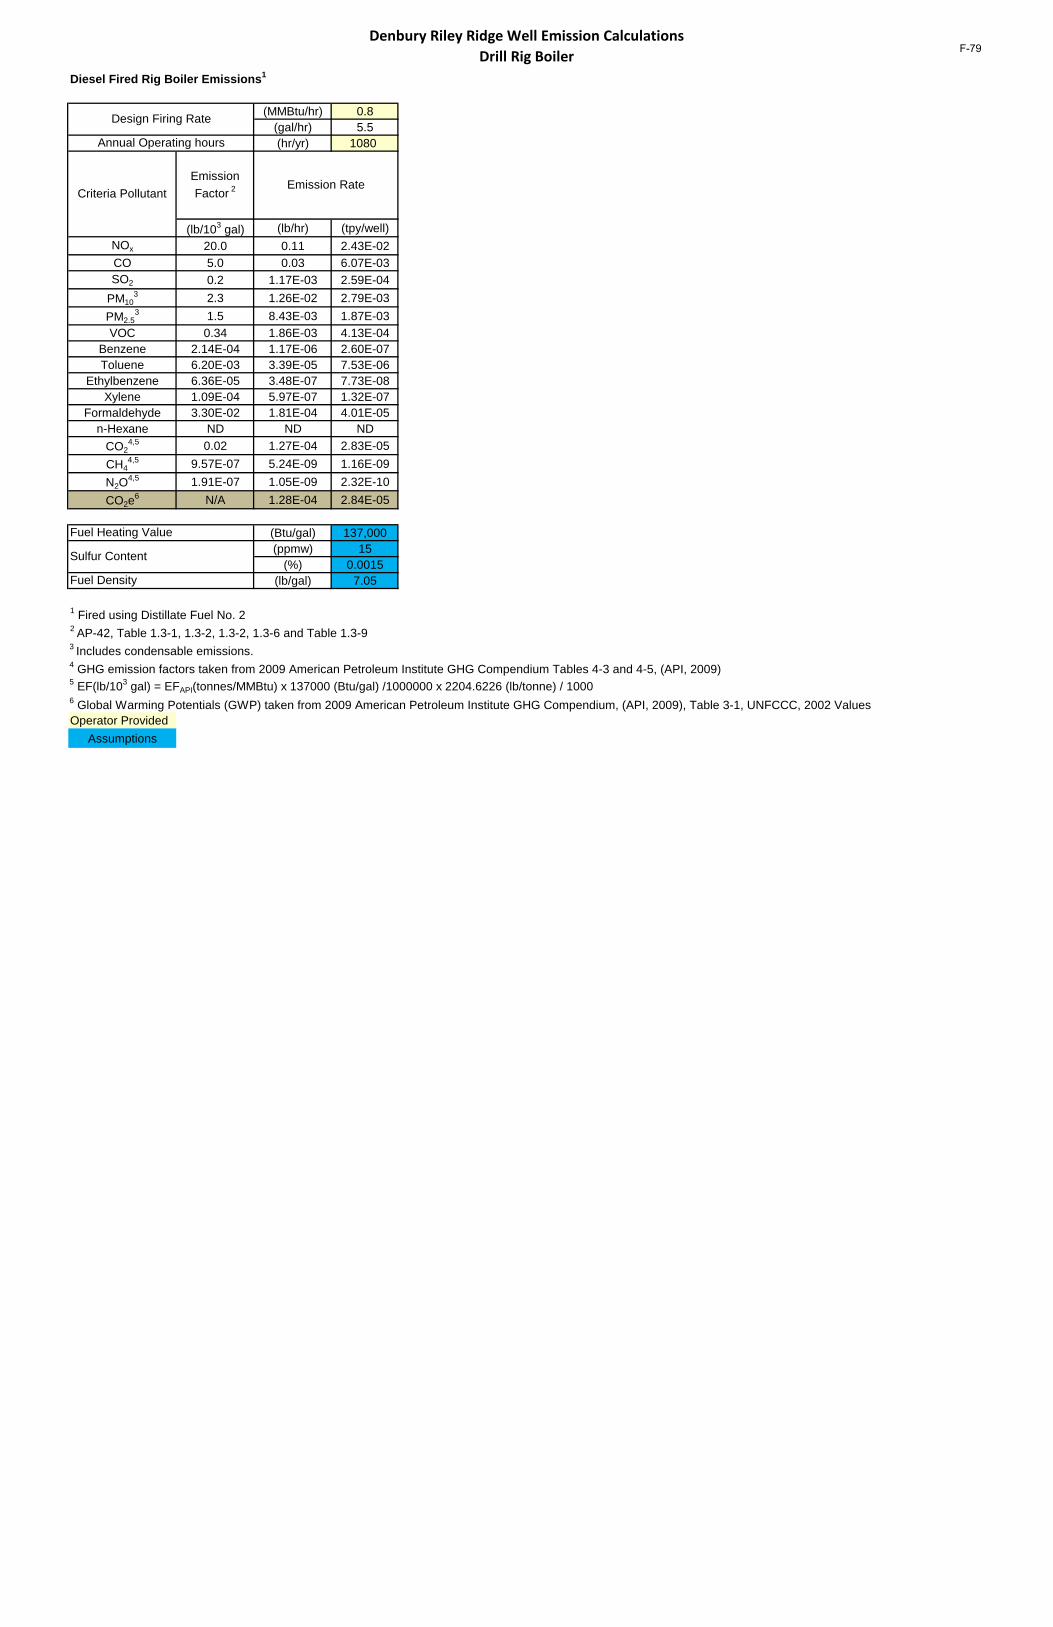
Denbury Riley Ridge Well Emission Calculations Drill Rig Boiler
(MMBtu/hr) 0.8(gal/hr) 5.5(hr/yr) 1080
(lb/103 gal) (lb/hr) (tpy/well)NOx 20.0 0.11 2.43E-02CO 5.0 0.03 6.07E-03SO2 0.2 1.17E-03 2.59E-04
PM103 2.3 1.26E-02 2.79E-03
PM2.53 1.5 8.43E-03 1.87E-03
VOC 0.34 1.86E-03 4.13E-04Benzene 2.14E-04 1.17E-06 2.60E-07Toluene 6.20E-03 3.39E-05 7.53E-06
Ethylbenzene 6.36E-05 3.48E-07 7.73E-08Xylene 1.09E-04 5.97E-07 1.32E-07
Formaldehyde 3.30E-02 1.81E-04 4.01E-05n-Hexane ND ND ND
CO24,5 0.02 1.27E-04 2.83E-05
CH44,5 9.57E-07 5.24E-09 1.16E-09
N2O4,5 1.91E-07 1.05E-09 2.32E-10
CO2e6 N/A 1.28E-04 2.84E-05
(Btu/gal) 137,000(ppmw) 15
(%) 0.0015(lb/gal) 7.05
1 Fired using Distillate Fuel No. 22 AP-42, Table 1.3-1, 1.3-2, 1.3-2, 1.3-6 and Table 1.3-93 Includes condensable emissions.4 GHG emission factors taken from 2009 American Petroleum Institute GHG Compendium Tables 4-3 and 4-5, (API, 2009)5 EF(lb/103 gal) = EFAPI(tonnes/MMBtu) x 137000 (Btu/gal) /1000000 x 2204.6226 (lb/tonne) / 10006 Global Warming Potentials (GWP) taken from 2009 American Petroleum Institute GHG Compendium, (API, 2009), Table 3-1, UNFCCC, 2002 ValuesOperator Provided
Assumptions
Fuel Heating Value
Sulfur Content
Fuel Density
Emission Rate
Diesel Fired Rig Boiler Emissions1
Design Firing Rate
Annual Operating hours
Criteria PollutantEmission Factor 2
F-79

This page intentionally left blank
F-80
Drilling Road Traffic
F-81

This page intentionally left blank
F-82
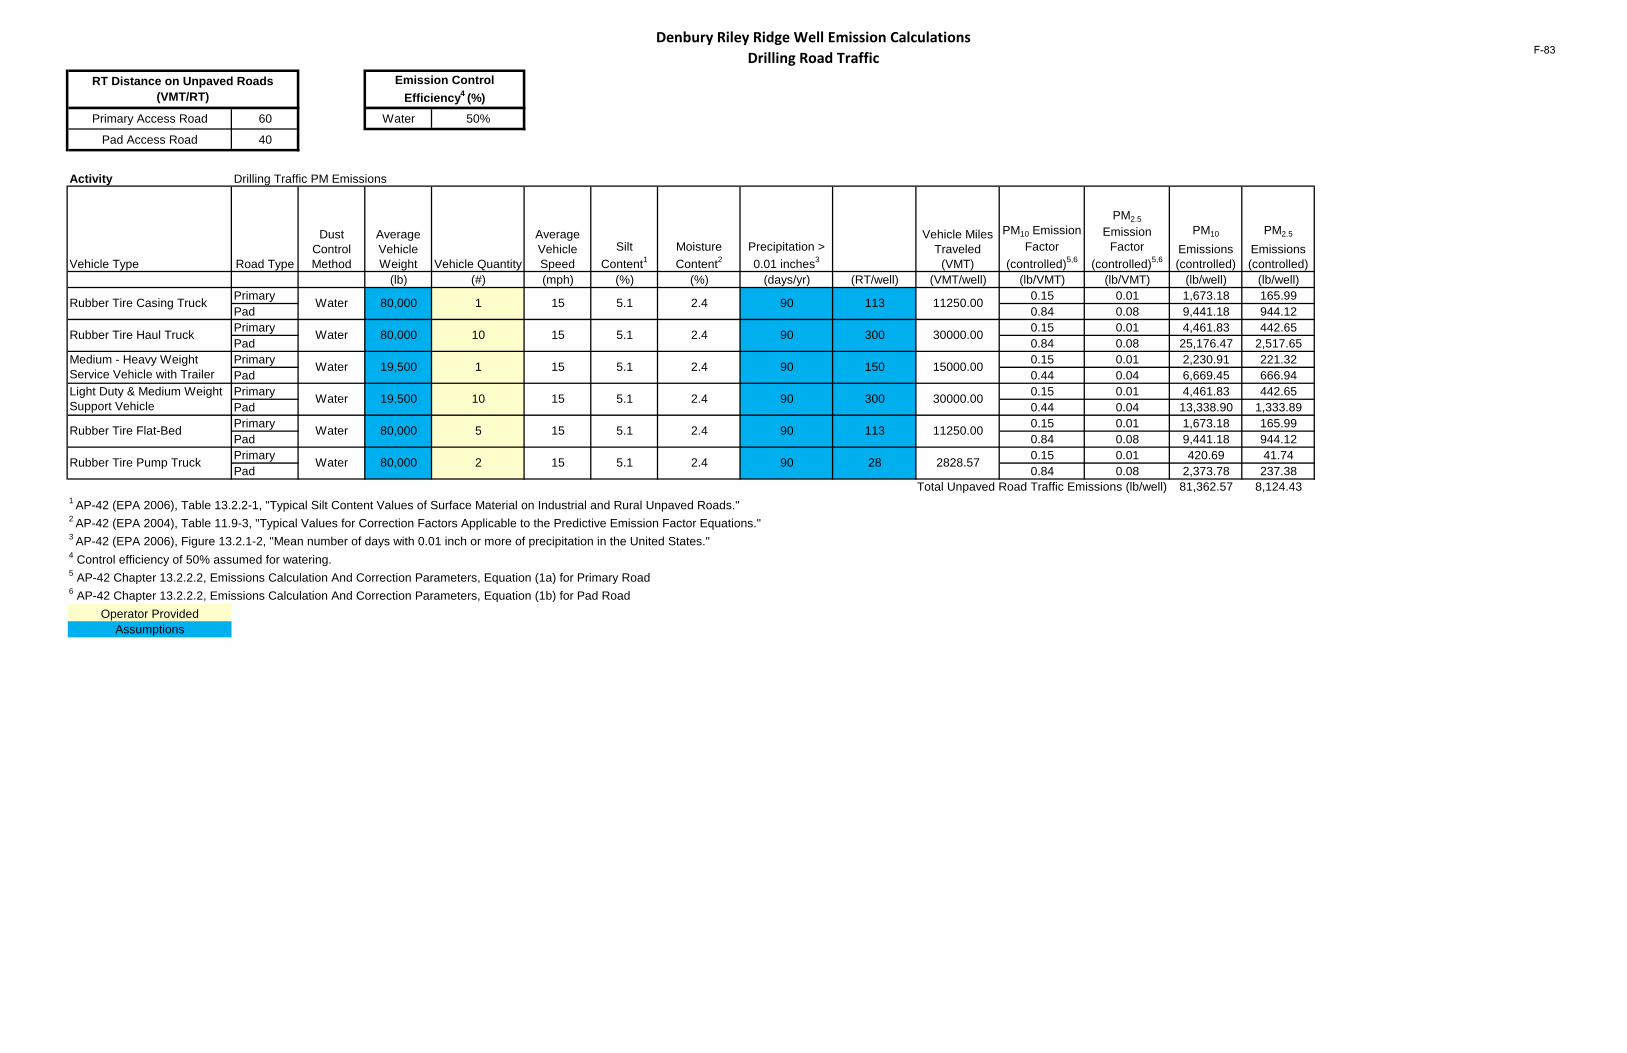
Denbury Riley Ridge Well Emission Calculations Drilling Road Traffic
Primary Access Road 60 Water 50%
Pad Access Road 40
Activity Drilling Traffic PM Emissions
Vehicle Type Road Type
Dust Control Method
Average Vehicle Weight Vehicle Quantity
Average Vehicle Speed
Silt Content1
Moisture Content2
Precipitation > 0.01 inches3
Vehicle Miles Traveled
(VMT)
PM10 Emission Factor
(controlled)5,6
PM2.5
Emission Factor
(controlled)5,6
PM10
Emissions (controlled)
PM2.5
Emissions (controlled)
(lb) (#) (mph) (%) (%) (days/yr) (RT/well) (VMT/well) (lb/VMT) (lb/VMT) (lb/well) (lb/well)Primary 0.15 0.01 1,673.18 165.99Pad 0.84 0.08 9,441.18 944.12Primary 0.15 0.01 4,461.83 442.65Pad 0.84 0.08 25,176.47 2,517.65Primary 0.15 0.01 2,230.91 221.32Pad 0.44 0.04 6,669.45 666.94Primary 0.15 0.01 4,461.83 442.65Pad 0.44 0.04 13,338.90 1,333.89Primary 0.15 0.01 1,673.18 165.99Pad 0.84 0.08 9,441.18 944.12Primary 0.15 0.01 420.69 41.74Pad 0.84 0.08 2,373.78 237.38
Total Unpaved Road Traffic Emissions (lb/well) 81,362.57 8,124.431 AP-42 (EPA 2006), Table 13.2.2-1, "Typical Silt Content Values of Surface Material on Industrial and Rural Unpaved Roads."2 AP-42 (EPA 2004), Table 11.9-3, "Typical Values for Correction Factors Applicable to the Predictive Emission Factor Equations."3 AP-42 (EPA 2006), Figure 13.2.1-2, "Mean number of days with 0.01 inch or more of precipitation in the United States."4 Control efficiency of 50% assumed for watering.5 AP-42 Chapter 13.2.2.2, Emissions Calculation And Correction Parameters, Equation (1a) for Primary Road6 AP-42 Chapter 13.2.2.2, Emissions Calculation And Correction Parameters, Equation (1b) for Pad Road
Operator ProvidedAssumptions
15 5.1 2.4 90 150
11250.00
2828.57
113
28
300 30000.00
113 11250.00
300 30000.00
15000.00
90
90
5.1
5.1
2.4
2.4
5.1 2.4 90
5.1 2.4 90
5.1 2.4 90
1
2
15
15
Emission Control Efficiency4 (%)
19,500 10 15
80,000 5 15
80,000 10 15
19,500 1
RT Distance on Unpaved Roads (VMT/RT)
Rubber Tire Casing Truck
Rubber Tire Pump Truck
Water 80,000
Water 80,000
Light Duty & Medium Weight Support Vehicle Water
Rubber Tire Flat-Bed Water
Rubber Tire Haul Truck Water
Medium - Heavy Weight Service Vehicle with Trailer Water
F-83
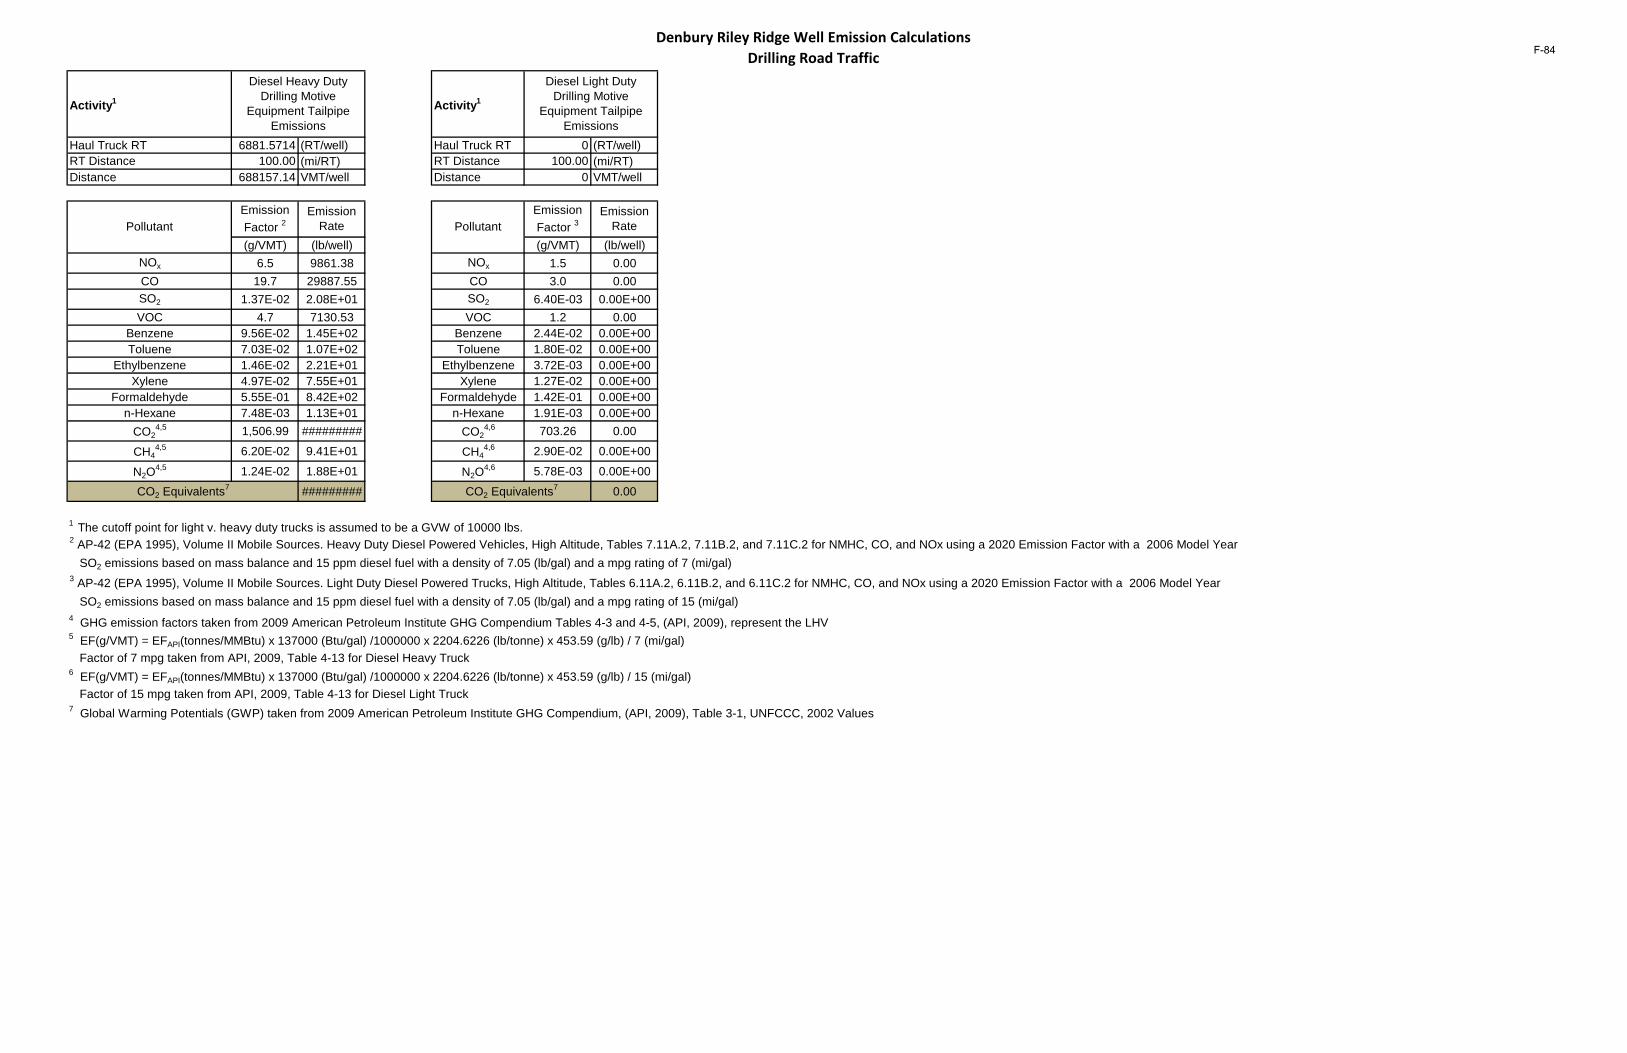
Denbury Riley Ridge Well Emission Calculations Drilling Road Traffic
Activity1 Activity1
Haul Truck RT 6881.5714 (RT/well) Haul Truck RT 0 (RT/well)RT Distance 100.00 (mi/RT) RT Distance 100.00 (mi/RT)Distance 688157.14 VMT/well Distance 0 VMT/well
(g/VMT) (lb/well) (g/VMT) (lb/well)NOx 6.5 9861.38 NOx 1.5 0.00CO 19.7 29887.55 CO 3.0 0.00SO2 1.37E-02 2.08E+01 SO2 6.40E-03 0.00E+00VOC 4.7 7130.53 VOC 1.2 0.00
Benzene 9.56E-02 1.45E+02 Benzene 2.44E-02 0.00E+00Toluene 7.03E-02 1.07E+02 Toluene 1.80E-02 0.00E+00
Ethylbenzene 1.46E-02 2.21E+01 Ethylbenzene 3.72E-03 0.00E+00Xylene 4.97E-02 7.55E+01 Xylene 1.27E-02 0.00E+00
Formaldehyde 5.55E-01 8.42E+02 Formaldehyde 1.42E-01 0.00E+00n-Hexane 7.48E-03 1.13E+01 n-Hexane 1.91E-03 0.00E+00
CO24,5 1,506.99 ######### CO2
4,6 703.26 0.00
CH44,5 6.20E-02 9.41E+01 CH4
4,6 2.90E-02 0.00E+00
N2O4,5 1.24E-02 1.88E+01 N2O
4,6 5.78E-03 0.00E+00
######### 0.00
1 The cutoff point for light v. heavy duty trucks is assumed to be a GVW of 10000 lbs.2 AP-42 (EPA 1995), Volume II Mobile Sources. Heavy Duty Diesel Powered Vehicles, High Altitude, Tables 7.11A.2, 7.11B.2, and 7.11C.2 for NMHC, CO, and NOx using a 2020 Emission Factor with a 2006 Model Year SO2 emissions based on mass balance and 15 ppm diesel fuel with a density of 7.05 (lb/gal) and a mpg rating of 7 (mi/gal)3 AP-42 (EPA 1995), Volume II Mobile Sources. Light Duty Diesel Powered Trucks, High Altitude, Tables 6.11A.2, 6.11B.2, and 6.11C.2 for NMHC, CO, and NOx using a 2020 Emission Factor with a 2006 Model Year SO2 emissions based on mass balance and 15 ppm diesel fuel with a density of 7.05 (lb/gal) and a mpg rating of 15 (mi/gal)4 GHG emission factors taken from 2009 American Petroleum Institute GHG Compendium Tables 4-3 and 4-5, (API, 2009), represent the LHV5 EF(g/VMT) = EFAPI(tonnes/MMBtu) x 137000 (Btu/gal) /1000000 x 2204.6226 (lb/tonne) x 453.59 (g/lb) / 7 (mi/gal) Factor of 7 mpg taken from API, 2009, Table 4-13 for Diesel Heavy Truck6 EF(g/VMT) = EFAPI(tonnes/MMBtu) x 137000 (Btu/gal) /1000000 x 2204.6226 (lb/tonne) x 453.59 (g/lb) / 15 (mi/gal) Factor of 15 mpg taken from API, 2009, Table 4-13 for Diesel Light Truck7 Global Warming Potentials (GWP) taken from 2009 American Petroleum Institute GHG Compendium, (API, 2009), Table 3-1, UNFCCC, 2002 Values
Emission Factor 3
Emission Rate
CO2 Equivalents7
Diesel Heavy Duty Drilling Motive
Equipment Tailpipe Emissions
Diesel Light Duty Drilling Motive
Equipment Tailpipe Emissions
CO2 Equivalents7
PollutantEmission Factor 2
Emission Rate Pollutant
F-84
Drilling Mobile Equipment
F-85

This page intentionally left blank
F-86
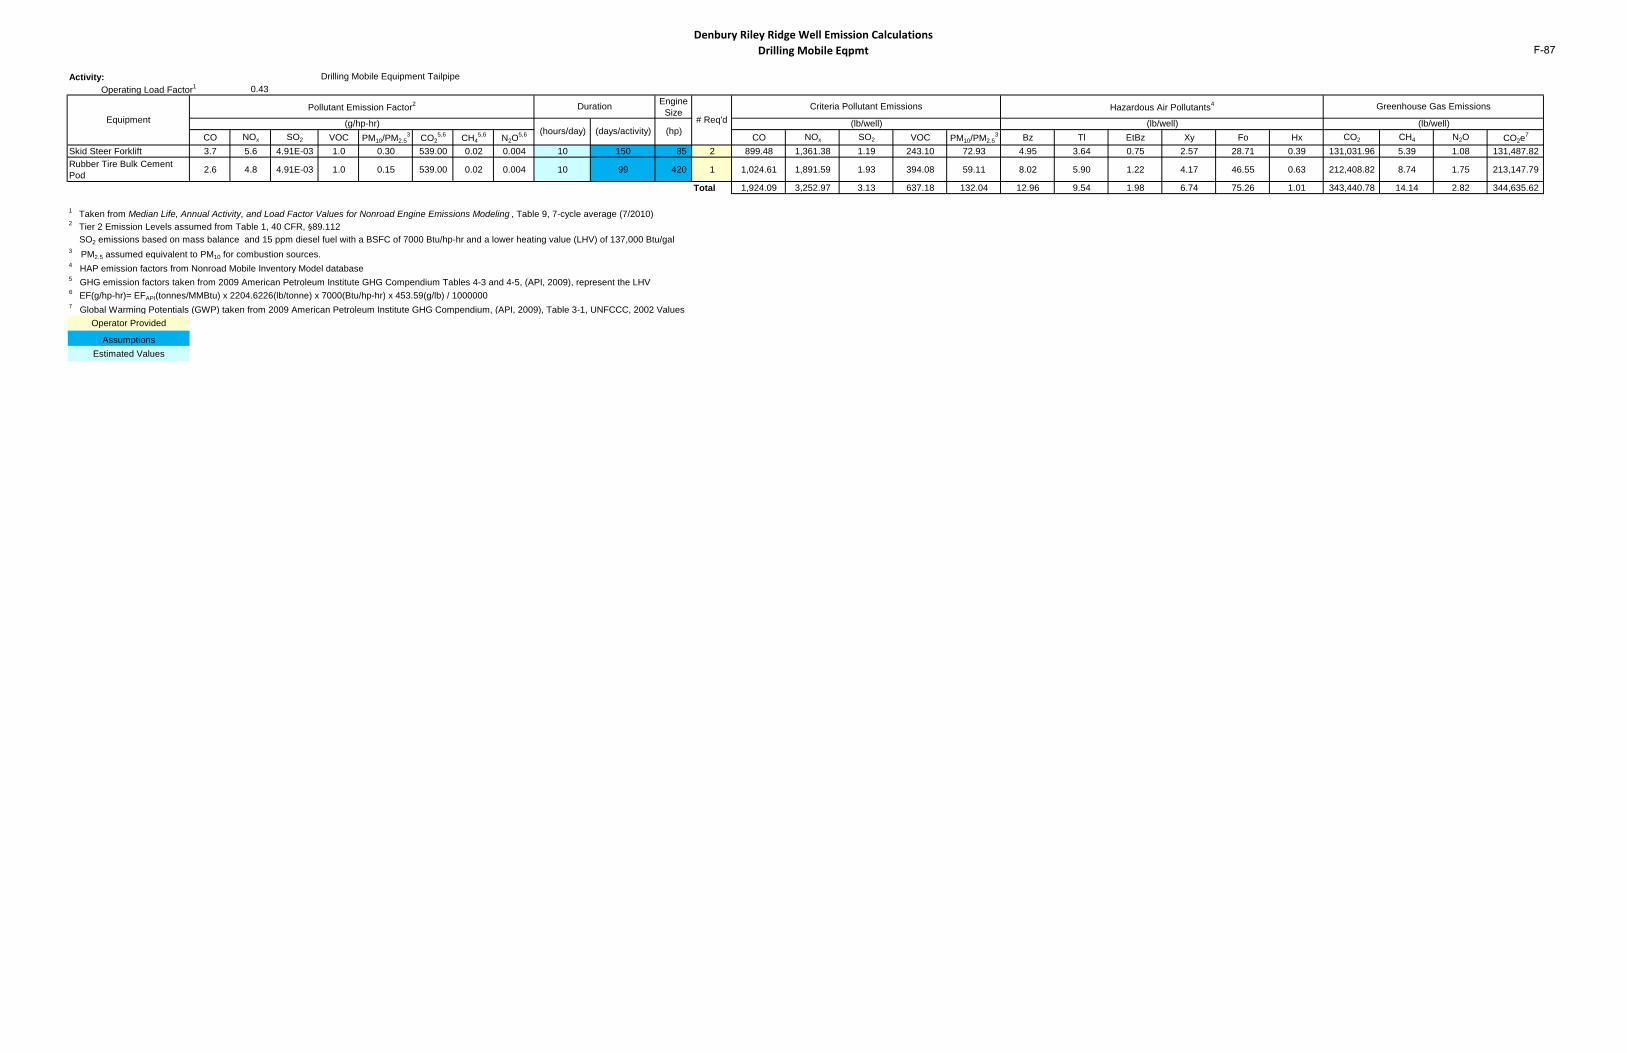
Denbury Riley Ridge Well Emission Calculations Drilling Mobile Eqpmt
Activity:0.43
Engine Size
CO NOx SO2 VOC PM10/PM2.53 CO2
5,6 CH45,6 N2O
5,6 CO NOx SO2 VOC PM10/PM2.53 Bz Tl EtBz Xy Fo Hx CO2 CH4 N2O CO2e
7
Skid Steer Forklift 3.7 5.6 4.91E-03 1.0 0.30 539.00 0.02 0.004 10 150 85 2 899.48 1,361.38 1.19 243.10 72.93 4.95 3.64 0.75 2.57 28.71 0.39 131,031.96 5.39 1.08 131,487.82Rubber Tire Bulk Cement Pod 2.6 4.8 4.91E-03 1.0 0.15 539.00 0.02 0.004 10 99 420 1 1,024.61 1,891.59 1.93 394.08 59.11 8.02 5.90 1.22 4.17 46.55 0.63 212,408.82 8.74 1.75 213,147.79
Total 1,924.09 3,252.97 3.13 637.18 132.04 12.96 9.54 1.98 6.74 75.26 1.01 343,440.78 14.14 2.82 344,635.62
1 Taken from Median Life, Annual Activity, and Load Factor Values for Nonroad Engine Emissions Modeling , Table 9, 7-cycle average (7/2010)
SO2 emissions based on mass balance and 15 ppm diesel fuel with a BSFC of 7000 Btu/hp-hr and a lower heating value (LHV) of 137,000 Btu/gal3 PM2.5 assumed equivalent to PM10 for combustion sources.4 HAP emission factors from Nonroad Mobile Inventory Model database5 GHG emission factors taken from 2009 American Petroleum Institute GHG Compendium Tables 4-3 and 4-5, (API, 2009), represent the LHV6 EF(g/hp-hr)= EFAPI(tonnes/MMBtu) x 2204.6226(lb/tonne) x 7000(Btu/hp-hr) x 453.59(g/lb) / 10000007 Global Warming Potentials (GWP) taken from 2009 American Petroleum Institute GHG Compendium, (API, 2009), Table 3-1, UNFCCC, 2002 Values
Operator Provided
AssumptionsEstimated Values
# Req'dHazardous Air Pollutants4 Greenhouse Gas Emissions
(g/hp-hr)(hours/day) (hp)
(lb/well) (lb/well) (lb/well)
Duration
(days/activity)
Criteria Pollutant Emissions
2 Tier 2 Emission Levels assumed from Table 1, 40 CFR, §89.112
Drilling Mobile Equipment TailpipeOperating Load Factor1
EquipmentPollutant Emission Factor2
F-87

This page intentionally left blank
F-88

Rig Move Road Traffic
F-89

This page intentionally left blank
F-90
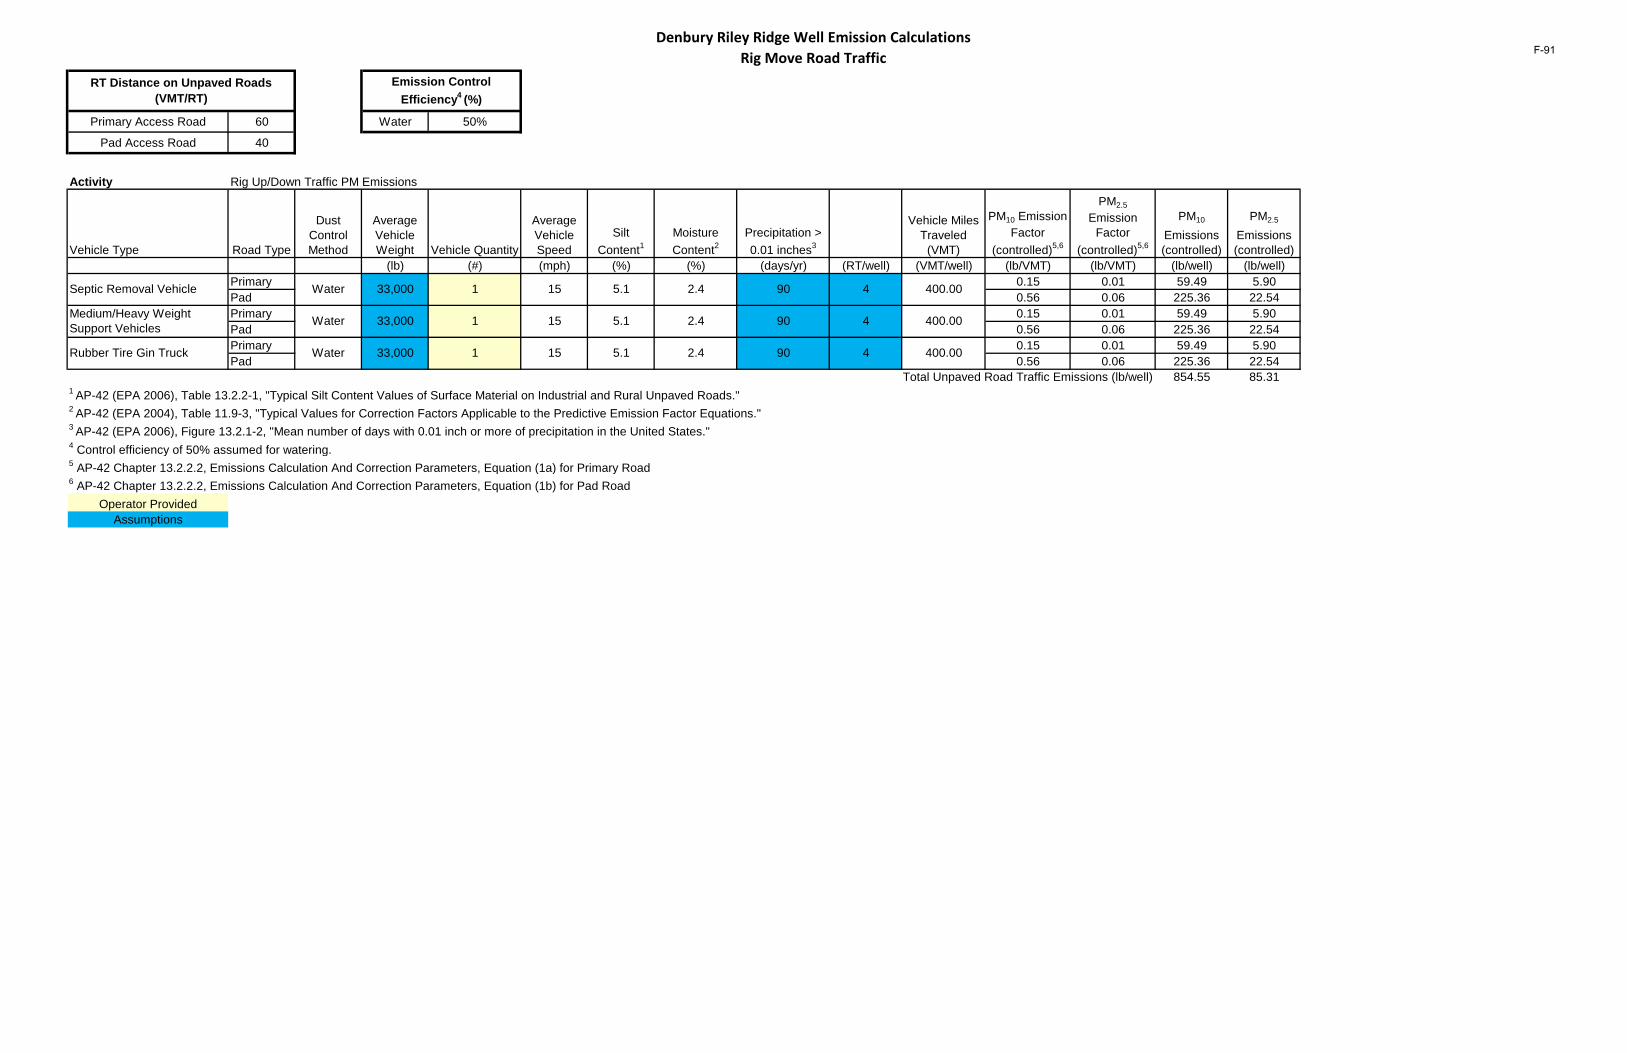
Denbury Riley Ridge Well Emission Calculations Rig Move Road Traffic
Primary Access Road 60 Water 50%
Pad Access Road 40
Activity Rig Up/Down Traffic PM Emissions
Vehicle Type Road Type
Dust Control Method
Average Vehicle Weight Vehicle Quantity
Average Vehicle Speed
Silt Content1
Moisture Content2
Precipitation > 0.01 inches3
Vehicle Miles Traveled
(VMT)
PM10 Emission Factor
(controlled)5,6
PM2.5
Emission Factor
(controlled)5,6
PM10
Emissions (controlled)
PM2.5
Emissions (controlled)
(lb) (#) (mph) (%) (%) (days/yr) (RT/well) (VMT/well) (lb/VMT) (lb/VMT) (lb/well) (lb/well)Primary 0.15 0.01 59.49 5.90Pad 0.56 0.06 225.36 22.54Primary 0.15 0.01 59.49 5.90Pad 0.56 0.06 225.36 22.54Primary 0.15 0.01 59.49 5.90Pad 0.56 0.06 225.36 22.54
Total Unpaved Road Traffic Emissions (lb/well) 854.55 85.311 AP-42 (EPA 2006), Table 13.2.2-1, "Typical Silt Content Values of Surface Material on Industrial and Rural Unpaved Roads."2 AP-42 (EPA 2004), Table 11.9-3, "Typical Values for Correction Factors Applicable to the Predictive Emission Factor Equations."3 AP-42 (EPA 2006), Figure 13.2.1-2, "Mean number of days with 0.01 inch or more of precipitation in the United States."4 Control efficiency of 50% assumed for watering.5 AP-42 Chapter 13.2.2.2, Emissions Calculation And Correction Parameters, Equation (1a) for Primary Road6 AP-42 Chapter 13.2.2.2, Emissions Calculation And Correction Parameters, Equation (1b) for Pad Road
Operator ProvidedAssumptions
4 400.00
15
33,000 1
400.00
400.00
4
4
RT Distance on Unpaved Roads (VMT/RT)
Emission Control Efficiency4 (%)
Septic Removal Vehicle
Rubber Tire Gin Truck
Water 33,000 1
Water 33,000 1
Medium/Heavy Weight Support Vehicles Water
15 2.4 90
2.4 90
15 5.1 2.4 90
5.1
5.1
F-91
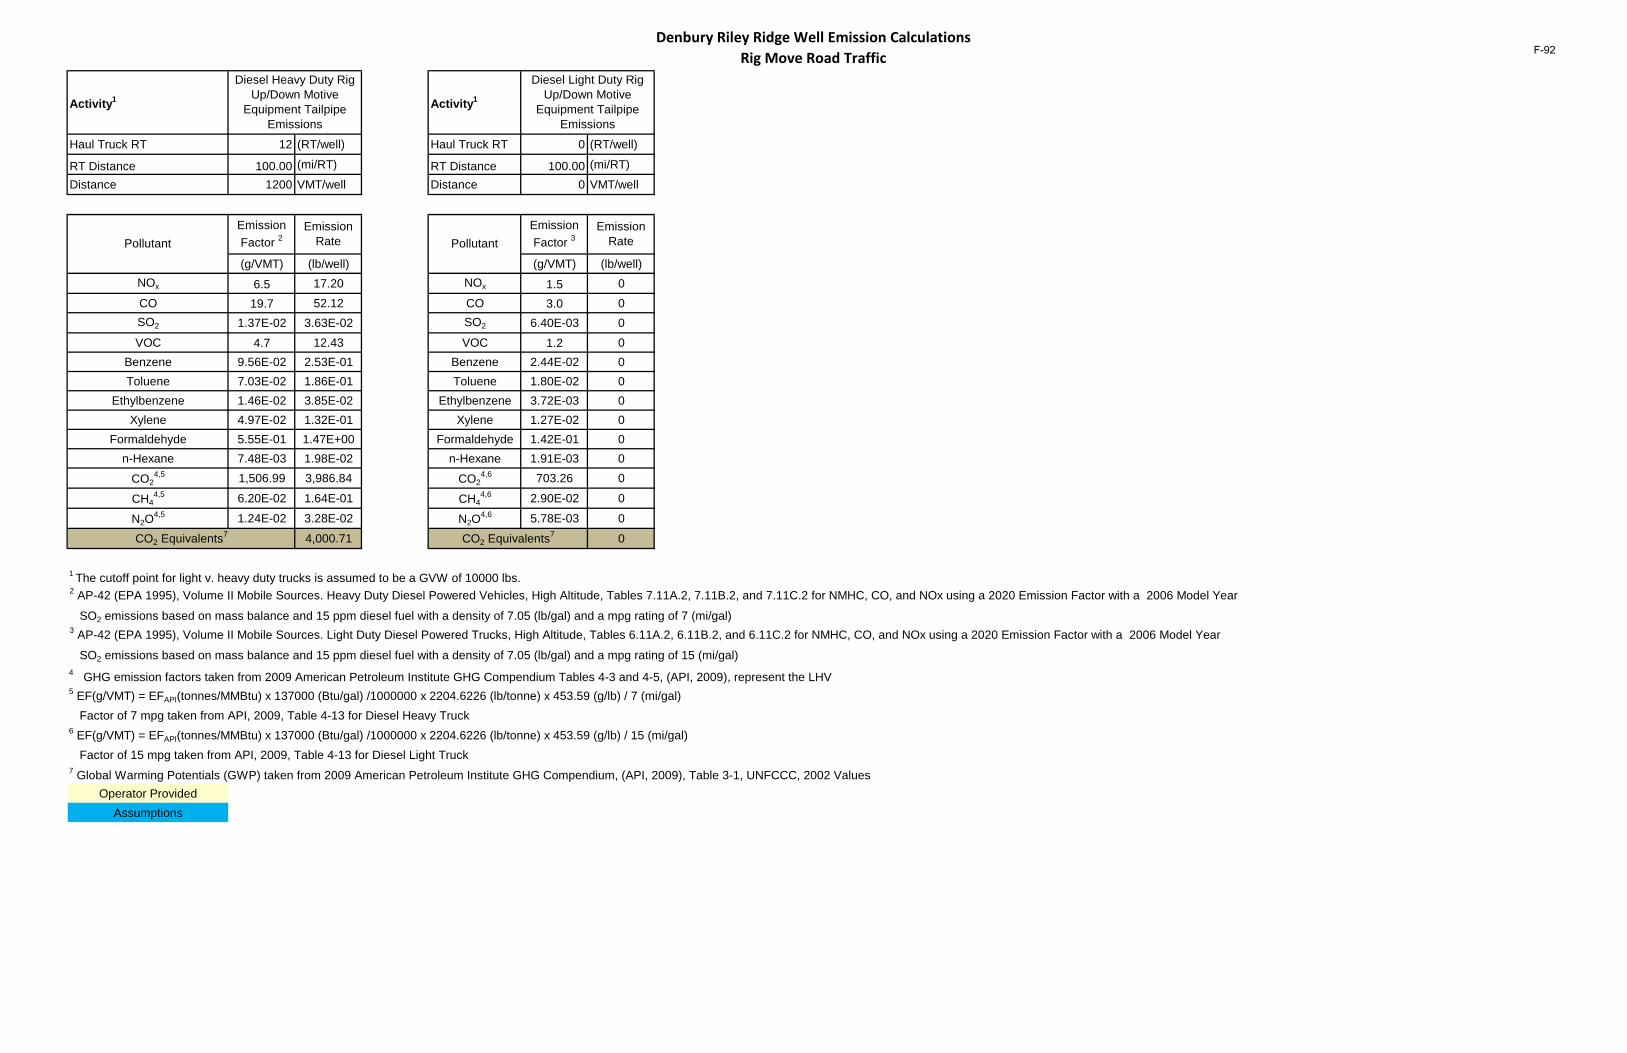
Denbury Riley Ridge Well Emission Calculations Rig Move Road Traffic
Activity1 Activity1
Haul Truck RT 12 (RT/well) Haul Truck RT 0 (RT/well)
RT Distance 100.00 (mi/RT) RT Distance 100.00 (mi/RT)
Distance 1200 VMT/well Distance 0 VMT/well
(g/VMT) (lb/well) (g/VMT) (lb/well)NOx 6.5 17.20 NOx 1.5 0CO 19.7 52.12 CO 3.0 0SO2 1.37E-02 3.63E-02 SO2 6.40E-03 0VOC 4.7 12.43 VOC 1.2 0
Benzene 9.56E-02 2.53E-01 Benzene 2.44E-02 0Toluene 7.03E-02 1.86E-01 Toluene 1.80E-02 0
Ethylbenzene 1.46E-02 3.85E-02 Ethylbenzene 3.72E-03 0Xylene 4.97E-02 1.32E-01 Xylene 1.27E-02 0
Formaldehyde 5.55E-01 1.47E+00 Formaldehyde 1.42E-01 0n-Hexane 7.48E-03 1.98E-02 n-Hexane 1.91E-03 0
CO24,5 1,506.99 3,986.84 CO2
4,6 703.26 0
CH44,5 6.20E-02 1.64E-01 CH4
4,6 2.90E-02 0
N2O4,5 1.24E-02 3.28E-02 N2O
4,6 5.78E-03 0
4,000.71 0
1 The cutoff point for light v. heavy duty trucks is assumed to be a GVW of 10000 lbs.2 AP-42 (EPA 1995), Volume II Mobile Sources. Heavy Duty Diesel Powered Vehicles, High Altitude, Tables 7.11A.2, 7.11B.2, and 7.11C.2 for NMHC, CO, and NOx using a 2020 Emission Factor with a 2006 Model Year
SO2 emissions based on mass balance and 15 ppm diesel fuel with a density of 7.05 (lb/gal) and a mpg rating of 7 (mi/gal)3 AP-42 (EPA 1995), Volume II Mobile Sources. Light Duty Diesel Powered Trucks, High Altitude, Tables 6.11A.2, 6.11B.2, and 6.11C.2 for NMHC, CO, and NOx using a 2020 Emission Factor with a 2006 Model Year
SO2 emissions based on mass balance and 15 ppm diesel fuel with a density of 7.05 (lb/gal) and a mpg rating of 15 (mi/gal)4 GHG emission factors taken from 2009 American Petroleum Institute GHG Compendium Tables 4-3 and 4-5, (API, 2009), represent the LHV5 EF(g/VMT) = EFAPI(tonnes/MMBtu) x 137000 (Btu/gal) /1000000 x 2204.6226 (lb/tonne) x 453.59 (g/lb) / 7 (mi/gal) Factor of 7 mpg taken from API, 2009, Table 4-13 for Diesel Heavy Truck6 EF(g/VMT) = EFAPI(tonnes/MMBtu) x 137000 (Btu/gal) /1000000 x 2204.6226 (lb/tonne) x 453.59 (g/lb) / 15 (mi/gal) Factor of 15 mpg taken from API, 2009, Table 4-13 for Diesel Light Truck7 Global Warming Potentials (GWP) taken from 2009 American Petroleum Institute GHG Compendium, (API, 2009), Table 3-1, UNFCCC, 2002 Values
Operator ProvidedAssumptions
Diesel Light Duty Rig Up/Down Motive
Equipment Tailpipe Emissions
PollutantEmission Factor 3
Emission Rate
CO2 Equivalents7
Diesel Heavy Duty Rig Up/Down Motive
Equipment Tailpipe Emissions
PollutantEmission Factor 2
Emission Rate
CO2 Equivalents7
F-92

Rig Move Mobile Equipment
F-93

This page intentionally left blank
F-94
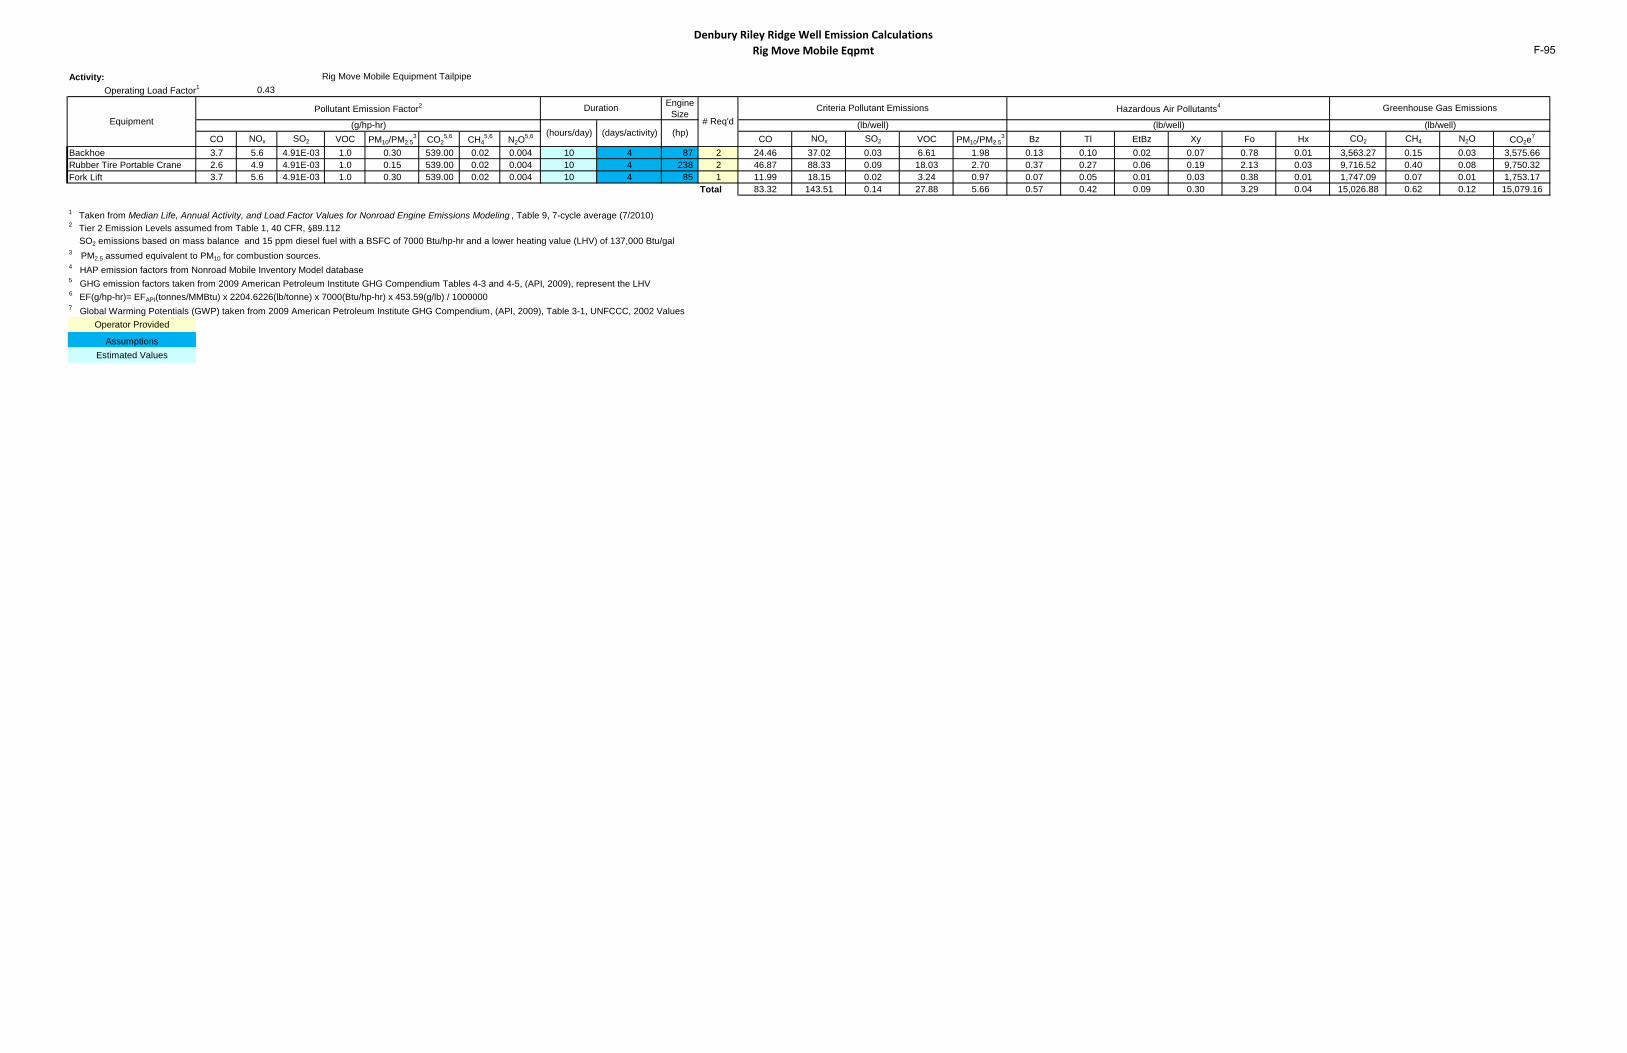
Denbury Riley Ridge Well Emission Calculations Rig Move Mobile Eqpmt
Activity:0.43
Engine Size
CO NOx SO2 VOC PM10/PM2.53 CO2
5,6 CH45,6 N2O
5,6 CO NOx SO2 VOC PM10/PM2.53 Bz Tl EtBz Xy Fo Hx CO2 CH4 N2O CO2e
7
Backhoe 3.7 5.6 4.91E-03 1.0 0.30 539.00 0.02 0.004 10 4 87 2 24.46 37.02 0.03 6.61 1.98 0.13 0.10 0.02 0.07 0.78 0.01 3,563.27 0.15 0.03 3,575.66Rubber Tire Portable Crane 2.6 4.9 4.91E-03 1.0 0.15 539.00 0.02 0.004 10 4 238 2 46.87 88.33 0.09 18.03 2.70 0.37 0.27 0.06 0.19 2.13 0.03 9,716.52 0.40 0.08 9,750.32Fork Lift 3.7 5.6 4.91E-03 1.0 0.30 539.00 0.02 0.004 10 4 85 1 11.99 18.15 0.02 3.24 0.97 0.07 0.05 0.01 0.03 0.38 0.01 1,747.09 0.07 0.01 1,753.17
Total 83.32 143.51 0.14 27.88 5.66 0.57 0.42 0.09 0.30 3.29 0.04 15,026.88 0.62 0.12 15,079.16
1 Taken from Median Life, Annual Activity, and Load Factor Values for Nonroad Engine Emissions Modeling , Table 9, 7-cycle average (7/2010)
SO2 emissions based on mass balance and 15 ppm diesel fuel with a BSFC of 7000 Btu/hp-hr and a lower heating value (LHV) of 137,000 Btu/gal3 PM2.5 assumed equivalent to PM10 for combustion sources.4 HAP emission factors from Nonroad Mobile Inventory Model database5 GHG emission factors taken from 2009 American Petroleum Institute GHG Compendium Tables 4-3 and 4-5, (API, 2009), represent the LHV6 EF(g/hp-hr)= EFAPI(tonnes/MMBtu) x 2204.6226(lb/tonne) x 7000(Btu/hp-hr) x 453.59(g/lb) / 10000007 Global Warming Potentials (GWP) taken from 2009 American Petroleum Institute GHG Compendium, (API, 2009), Table 3-1, UNFCCC, 2002 Values
Operator Provided
AssumptionsEstimated Values
2 Tier 2 Emission Levels assumed from Table 1, 40 CFR, §89.112
Criteria Pollutant Emissions Hazardous Air Pollutants4 Greenhouse Gas Emissions
(g/hp-hr)(hours/day) (days/activity) (hp)
(lb/well) (lb/well) (lb/well)# Req'd
Rig Move Mobile Equipment TailpipeOperating Load Factor1
EquipmentPollutant Emission Factor2 Duration
F-95

This page intentionally left blank
F-96
Drilling Emissions Summary
F-97

This page intentionally left blank
F-98
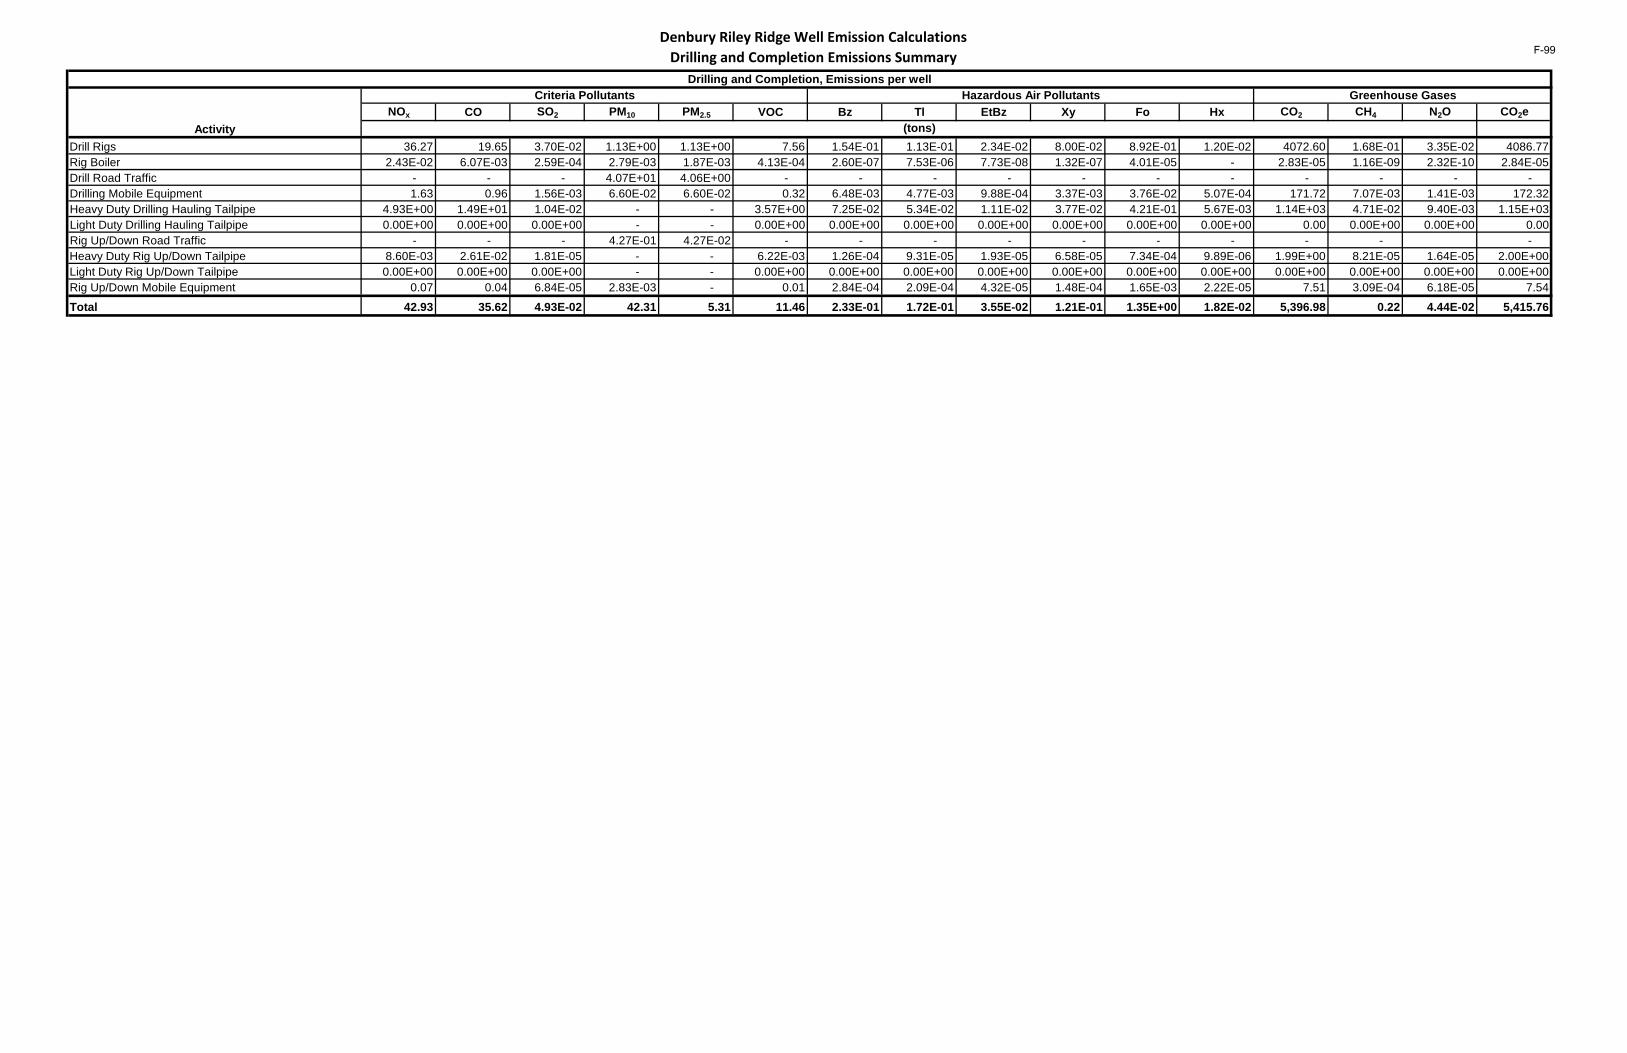
Denbury Riley Ridge Well Emission Calculations Drilling and Completion Emissions Summary
NOx CO SO2 PM10 PM2.5 VOC Bz Tl EtBz Xy Fo Hx CO2 CH4 N2O CO2e
Drill Rigs 36.27 19.65 3.70E-02 1.13E+00 1.13E+00 7.56 1.54E-01 1.13E-01 2.34E-02 8.00E-02 8.92E-01 1.20E-02 4072.60 1.68E-01 3.35E-02 4086.77Rig Boiler 2.43E-02 6.07E-03 2.59E-04 2.79E-03 1.87E-03 4.13E-04 2.60E-07 7.53E-06 7.73E-08 1.32E-07 4.01E-05 - 2.83E-05 1.16E-09 2.32E-10 2.84E-05Drill Road Traffic - - - 4.07E+01 4.06E+00 - - - - - - - - - - - Drilling Mobile Equipment 1.63 0.96 1.56E-03 6.60E-02 6.60E-02 0.32 6.48E-03 4.77E-03 9.88E-04 3.37E-03 3.76E-02 5.07E-04 171.72 7.07E-03 1.41E-03 172.32Heavy Duty Drilling Hauling Tailpipe 4.93E+00 1.49E+01 1.04E-02 - - 3.57E+00 7.25E-02 5.34E-02 1.11E-02 3.77E-02 4.21E-01 5.67E-03 1.14E+03 4.71E-02 9.40E-03 1.15E+03Light Duty Drilling Hauling Tailpipe 0.00E+00 0.00E+00 0.00E+00 - - 0.00E+00 0.00E+00 0.00E+00 0.00E+00 0.00E+00 0.00E+00 0.00E+00 0.00 0.00E+00 0.00E+00 0.00Rig Up/Down Road Traffic - - - 4.27E-01 4.27E-02 - - - - - - - - - - Heavy Duty Rig Up/Down Tailpipe 8.60E-03 2.61E-02 1.81E-05 - - 6.22E-03 1.26E-04 9.31E-05 1.93E-05 6.58E-05 7.34E-04 9.89E-06 1.99E+00 8.21E-05 1.64E-05 2.00E+00Light Duty Rig Up/Down Tailpipe 0.00E+00 0.00E+00 0.00E+00 - - 0.00E+00 0.00E+00 0.00E+00 0.00E+00 0.00E+00 0.00E+00 0.00E+00 0.00E+00 0.00E+00 0.00E+00 0.00E+00Rig Up/Down Mobile Equipment 0.07 0.04 6.84E-05 2.83E-03 - 0.01 2.84E-04 2.09E-04 4.32E-05 1.48E-04 1.65E-03 2.22E-05 7.51 3.09E-04 6.18E-05 7.54
Total 42.93 35.62 4.93E-02 42.31 5.31 11.46 2.33E-01 1.72E-01 3.55E-02 1.21E-01 1.35E+00 1.82E-02 5,396.98 0.22 4.44E-02 5,415.76
Drilling and Completion, Emissions per well
(tons)
Greenhouse Gases
Activity
Criteria Pollutants Hazardous Air Pollutants
F-99

This page intentionally left blank
F-100

Production Traffic
F-101

This page intentionally left blank
F-102
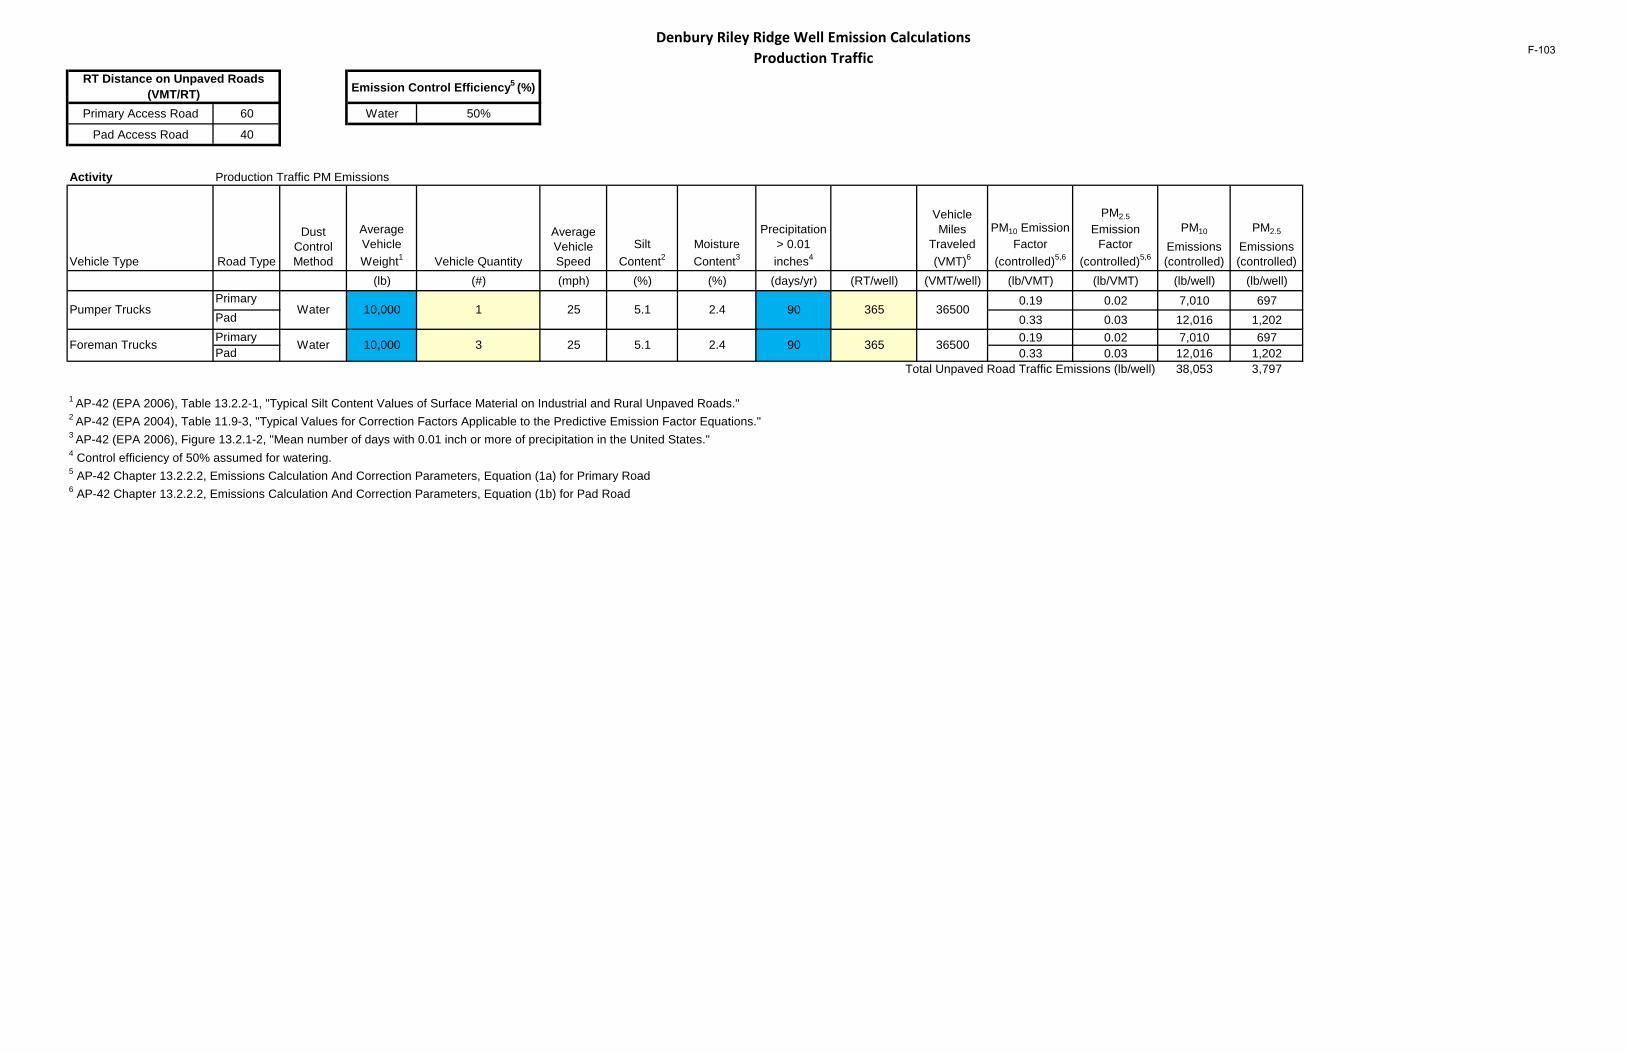
Denbury Riley Ridge Well Emission Calculations Production Traffic
Primary Access Road 60 Water 50%
Pad Access Road 40
Activity Production Traffic PM Emissions
Vehicle Type Road Type
Dust Control Method
Average Vehicle Weight1 Vehicle Quantity
Average Vehicle Speed
Silt Content2
Moisture Content3
Precipitation > 0.01 inches4
Vehicle Miles
Traveled (VMT)6
PM10 Emission Factor
(controlled)5,6
PM2.5
Emission Factor
(controlled)5,6
PM10
Emissions (controlled)
PM2.5
Emissions (controlled)
(lb) (#) (mph) (%) (%) (days/yr) (RT/well) (VMT/well) (lb/VMT) (lb/VMT) (lb/well) (lb/well)Primary 0.19 0.02 7,010 697Pad 0.33 0.03 12,016 1,202Primary 0.19 0.02 7,010 697Pad 0.33 0.03 12,016 1,202
Total Unpaved Road Traffic Emissions (lb/well) 38,053 3,797
1 AP-42 (EPA 2006), Table 13.2.2-1, "Typical Silt Content Values of Surface Material on Industrial and Rural Unpaved Roads."2 AP-42 (EPA 2004), Table 11.9-3, "Typical Values for Correction Factors Applicable to the Predictive Emission Factor Equations."3 AP-42 (EPA 2006), Figure 13.2.1-2, "Mean number of days with 0.01 inch or more of precipitation in the United States."4 Control efficiency of 50% assumed for watering.5 AP-42 Chapter 13.2.2.2, Emissions Calculation And Correction Parameters, Equation (1a) for Primary Road6 AP-42 Chapter 13.2.2.2, Emissions Calculation And Correction Parameters, Equation (1b) for Pad Road
RT Distance on Unpaved Roads (VMT/RT) Emission Control Efficiency5 (%)
Pumper Trucks Water 10,000 1 25 5.1
Foreman Trucks Water 10,000 3 25
2.4 90 365
36500
36500
5.1 2.4 90 365
F-103
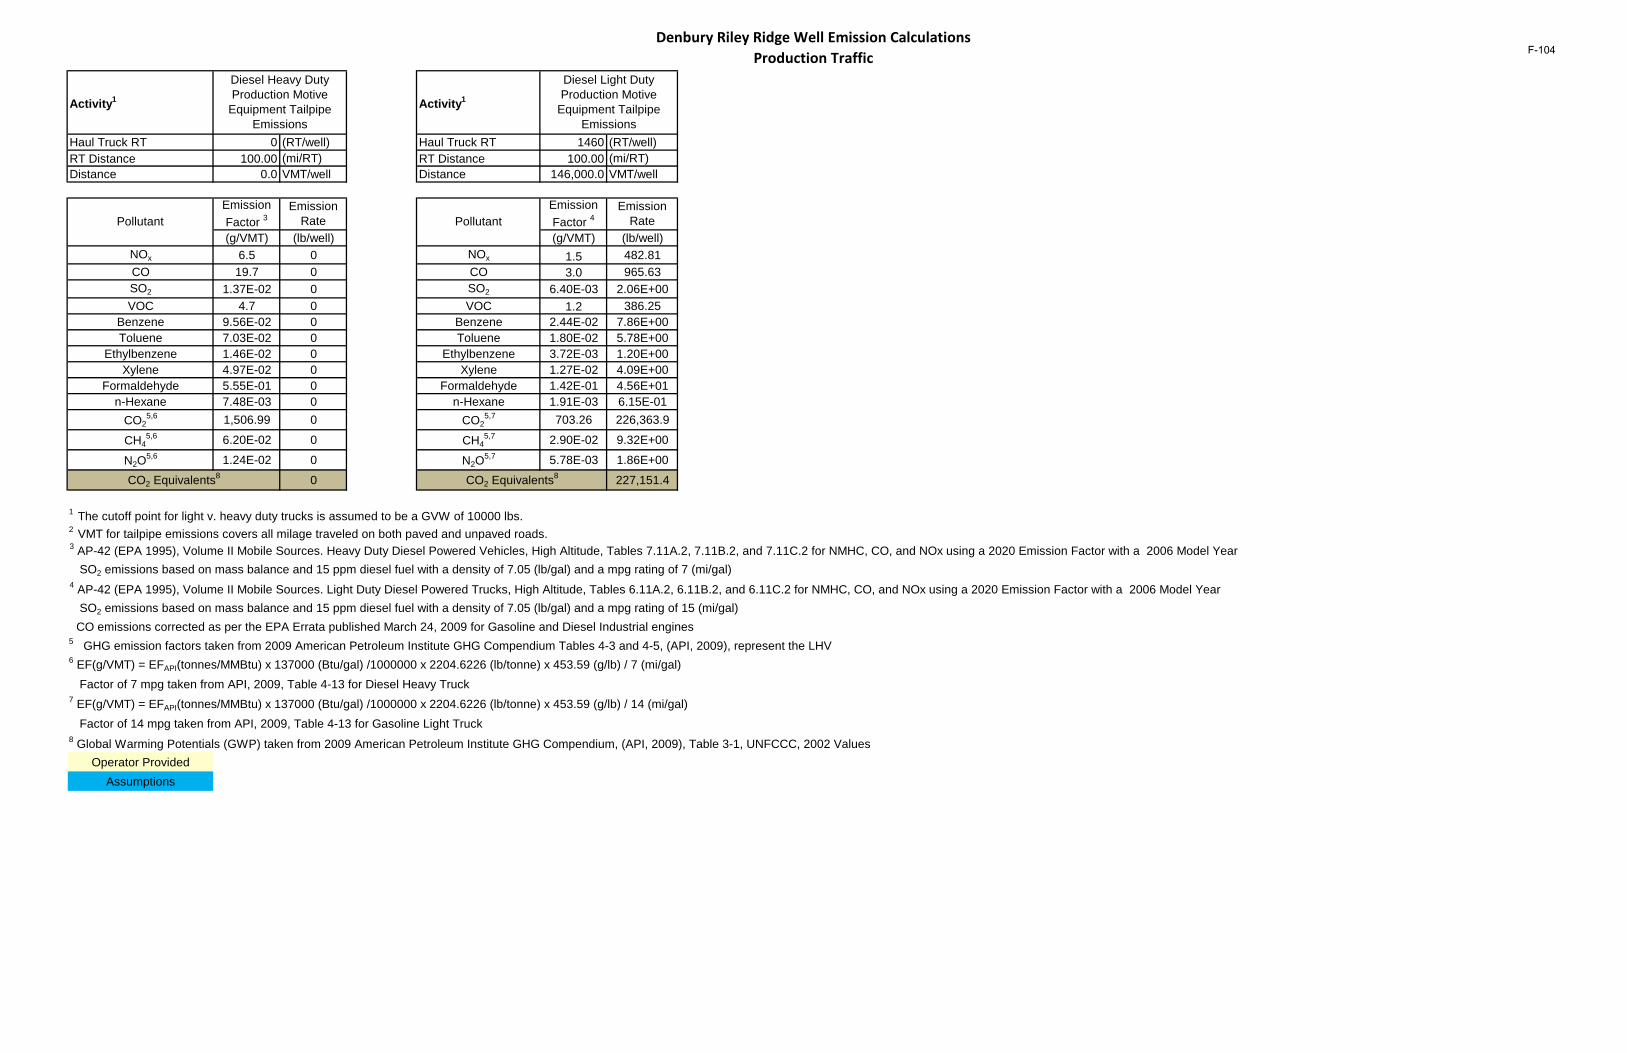
Denbury Riley Ridge Well Emission Calculations Production Traffic
Activity1 Activity1
Haul Truck RT 0 (RT/well) Haul Truck RT 1460 (RT/well)RT Distance 100.00 (mi/RT) RT Distance 100.00 (mi/RT)Distance 0.0 VMT/well Distance 146,000.0 VMT/well
(g/VMT) (lb/well) (g/VMT) (lb/well)NOx 6.5 0 NOx 1.5 482.81CO 19.7 0 CO 3.0 965.63SO2 1.37E-02 0 SO2 6.40E-03 2.06E+00VOC 4.7 0 VOC 1.2 386.25
Benzene 9.56E-02 0 Benzene 2.44E-02 7.86E+00Toluene 7.03E-02 0 Toluene 1.80E-02 5.78E+00
Ethylbenzene 1.46E-02 0 Ethylbenzene 3.72E-03 1.20E+00Xylene 4.97E-02 0 Xylene 1.27E-02 4.09E+00
Formaldehyde 5.55E-01 0 Formaldehyde 1.42E-01 4.56E+01n-Hexane 7.48E-03 0 n-Hexane 1.91E-03 6.15E-01
CO25,6 1,506.99 0 CO2
5,7 703.26 226,363.9
CH45,6 6.20E-02 0 CH4
5,7 2.90E-02 9.32E+00
N2O5,6 1.24E-02 0 N2O
5,7 5.78E-03 1.86E+00
0 227,151.4
1 The cutoff point for light v. heavy duty trucks is assumed to be a GVW of 10000 lbs.2 VMT for tailpipe emissions covers all milage traveled on both paved and unpaved roads.3 AP-42 (EPA 1995), Volume II Mobile Sources. Heavy Duty Diesel Powered Vehicles, High Altitude, Tables 7.11A.2, 7.11B.2, and 7.11C.2 for NMHC, CO, and NOx using a 2020 Emission Factor with a 2006 Model Year SO2 emissions based on mass balance and 15 ppm diesel fuel with a density of 7.05 (lb/gal) and a mpg rating of 7 (mi/gal)4 AP-42 (EPA 1995), Volume II Mobile Sources. Light Duty Diesel Powered Trucks, High Altitude, Tables 6.11A.2, 6.11B.2, and 6.11C.2 for NMHC, CO, and NOx using a 2020 Emission Factor with a 2006 Model Year SO2 emissions based on mass balance and 15 ppm diesel fuel with a density of 7.05 (lb/gal) and a mpg rating of 15 (mi/gal) CO emissions corrected as per the EPA Errata published March 24, 2009 for Gasoline and Diesel Industrial engines5 GHG emission factors taken from 2009 American Petroleum Institute GHG Compendium Tables 4-3 and 4-5, (API, 2009), represent the LHV6 EF(g/VMT) = EFAPI(tonnes/MMBtu) x 137000 (Btu/gal) /1000000 x 2204.6226 (lb/tonne) x 453.59 (g/lb) / 7 (mi/gal) Factor of 7 mpg taken from API, 2009, Table 4-13 for Diesel Heavy Truck7 EF(g/VMT) = EFAPI(tonnes/MMBtu) x 137000 (Btu/gal) /1000000 x 2204.6226 (lb/tonne) x 453.59 (g/lb) / 14 (mi/gal) Factor of 14 mpg taken from API, 2009, Table 4-13 for Gasoline Light Truck8 Global Warming Potentials (GWP) taken from 2009 American Petroleum Institute GHG Compendium, (API, 2009), Table 3-1, UNFCCC, 2002 Values
Operator ProvidedAssumptions
Diesel Heavy Duty Production Motive
Equipment Tailpipe Emissions
Diesel Light Duty Production Motive
Equipment Tailpipe Emissions
CO2 Equivalents8 CO2 Equivalents8
PollutantEmission Factor 3
Emission Rate Pollutant
Emission Factor 4
Emission Rate
F-104

Workovers
F-105

This page intentionally left blank
F-106
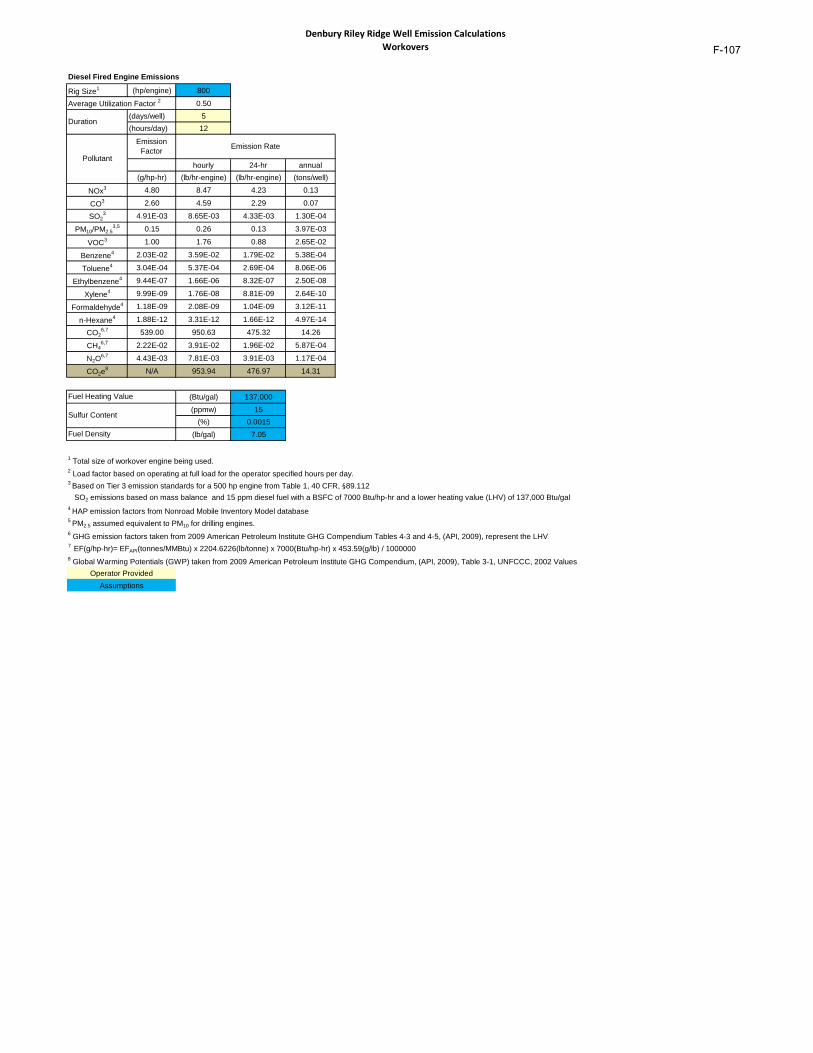
Denbury Riley Ridge Well Emission Calculations Workovers
Rig Size1 (hp/engine) 800
0.50(days/well) 5(hours/day) 12
hourly 24-hr annual(g/hp-hr) (lb/hr-engine) (lb/hr-engine) (tons/well)
NOx3 4.80 8.47 4.23 0.13
CO3 2.60 4.59 2.29 0.07
SO23 4.91E-03 8.65E-03 4.33E-03 1.30E-04
PM10/PM2.53,5 0.15 0.26 0.13 3.97E-03
VOC3 1.00 1.76 0.88 2.65E-02
Benzene4 2.03E-02 3.59E-02 1.79E-02 5.38E-04
Toluene4 3.04E-04 5.37E-04 2.69E-04 8.06E-06
Ethylbenzene4 9.44E-07 1.66E-06 8.32E-07 2.50E-08
Xylene4 9.99E-09 1.76E-08 8.81E-09 2.64E-10
Formaldehyde4 1.18E-09 2.08E-09 1.04E-09 3.12E-11
n-Hexane4 1.88E-12 3.31E-12 1.66E-12 4.97E-14
CO26,7 539.00 950.63 475.32 14.26
CH46,7 2.22E-02 3.91E-02 1.96E-02 5.87E-04
N2O6,7 4.43E-03 7.81E-03 3.91E-03 1.17E-04
CO2e8 N/A 953.94 476.97 14.31
(Btu/gal) 137,000(ppmw) 15
(%) 0.0015(lb/gal) 7.05
1 Total size of workover engine being used.2 Load factor based on operating at full load for the operator specified hours per day.3 Based on Tier 3 emission standards for a 500 hp engine from Table 1, 40 CFR, §89.112 SO2 emissions based on mass balance and 15 ppm diesel fuel with a BSFC of 7000 Btu/hp-hr and a lower heating value (LHV) of 137,000 Btu/gal4 HAP emission factors from Nonroad Mobile Inventory Model database5 PM2.5 assumed equivalent to PM10 for drilling engines.6 GHG emission factors taken from 2009 American Petroleum Institute GHG Compendium Tables 4-3 and 4-5, (API, 2009), represent the LHV7 EF(g/hp-hr)= EFAPI(tonnes/MMBtu) x 2204.6226(lb/tonne) x 7000(Btu/hp-hr) x 453.59(g/lb) / 10000008 Global Warming Potentials (GWP) taken from 2009 American Petroleum Institute GHG Compendium, (API, 2009), Table 3-1, UNFCCC, 2002 Values
Diesel Fired Engine Emissions
Average Utilization Factor 2
Duration
Pollutant
Emission Factor Emission Rate
Fuel Heating Value
Sulfur Content
Fuel Density
Operator ProvidedAssumptions
F-107

This page intentionally left blank
F-108

Workover Traffic
F-109

This page intentionally left blank
F-110
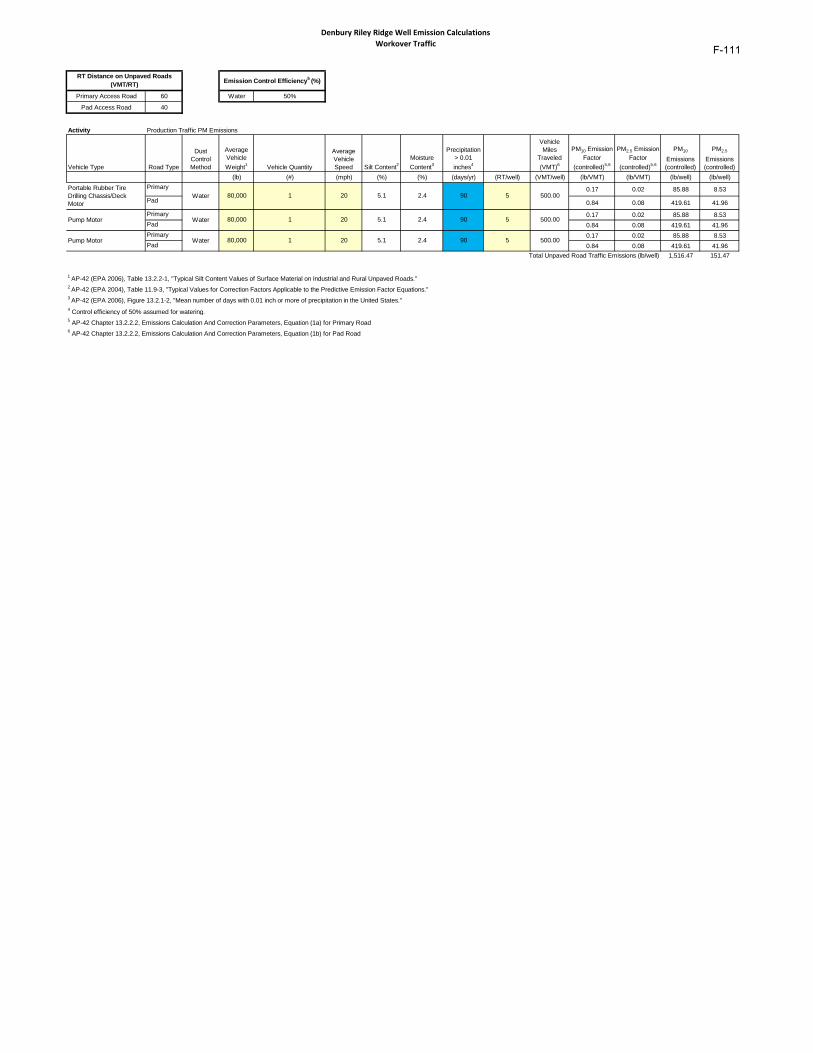
Denbury Riley Ridge Well Emission Calculations Workover Traffic
Primary Access Road 60 Water 50%
Pad Access Road 40
Activity Production Traffic PM Emissions
Vehicle Type Road Type
Dust Control Method
Average Vehicle Weight1 Vehicle Quantity
Average Vehicle Speed Silt Content2
Moisture Content3
Precipitation > 0.01 inches4
Vehicle Miles
Traveled (VMT)6
PM10 Emission Factor
(controlled)5,6
PM2.5 Emission Factor
(controlled)5,6
PM10
Emissions (controlled)
PM2.5
Emissions (controlled)
(lb) (#) (mph) (%) (%) (days/yr) (RT/well) (VMT/well) (lb/VMT) (lb/VMT) (lb/well) (lb/well)Primary 0.17 0.02 85.88 8.53
Pad 0.84 0.08 419.61 41.96
Primary 0.17 0.02 85.88 8.53Pad 0.84 0.08 419.61 41.96Primary 0.17 0.02 85.88 8.53Pad 0.84 0.08 419.61 41.96
Total Unpaved Road Traffic Emissions (lb/well) 1,516.47 151.47
1 AP-42 (EPA 2006), Table 13.2.2-1, "Typical Silt Content Values of Surface Material on Industrial and Rural Unpaved Roads."2 AP-42 (EPA 2004), Table 11.9-3, "Typical Values for Correction Factors Applicable to the Predictive Emission Factor Equations."3 AP-42 (EPA 2006), Figure 13.2.1-2, "Mean number of days with 0.01 inch or more of precipitation in the United States."4 Control efficiency of 50% assumed for watering.5 AP-42 Chapter 13.2.2.2, Emissions Calculation And Correction Parameters, Equation (1a) for Primary Road6 AP-42 Chapter 13.2.2.2, Emissions Calculation And Correction Parameters, Equation (1b) for Pad Road
5.1 2.4 90 5 500.00Pump Motor Water 80,000 1 20
500.00
RT Distance on Unpaved Roads (VMT/RT) Emission Control Efficiency5 (%)
Portable Rubber Tire Drilling Chassis/Deck Motor
Water 80,000 1 20 5.1 2.4 90 5
Pump Motor Water 80,000 1 20 5.1 2.4 90 5 500.00
F-111
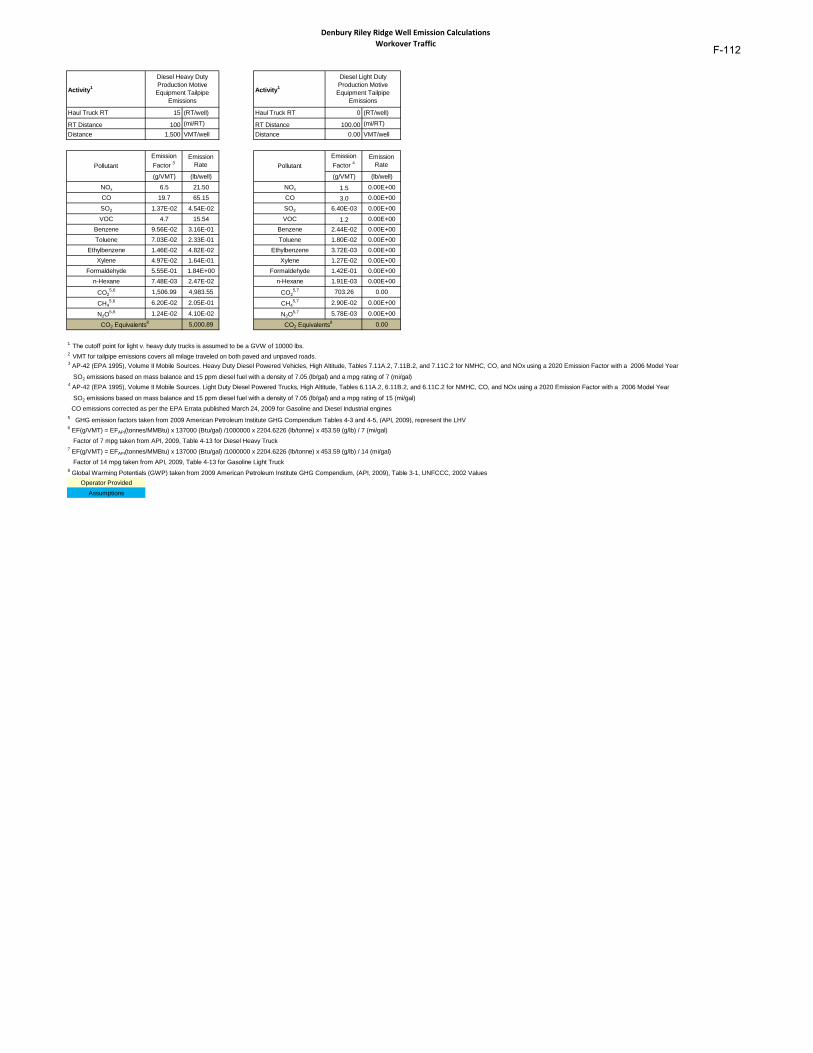
Denbury Riley Ridge Well Emission Calculations Workover Traffic
Activity1 Activity1
Haul Truck RT 15 (RT/well) Haul Truck RT 0 (RT/well)
RT Distance 100 (mi/RT) RT Distance 100.00 (mi/RT)
Distance 1,500 VMT/well Distance 0.00 VMT/well
(g/VMT) (lb/well) (g/VMT) (lb/well)
NOx 6.5 21.50 NOx 1.5 0.00E+00CO 19.7 65.15 CO 3.0 0.00E+00
SO2 1.37E-02 4.54E-02 SO2 6.40E-03 0.00E+00VOC 4.7 15.54 VOC 1.2 0.00E+00
Benzene 9.56E-02 3.16E-01 Benzene 2.44E-02 0.00E+00Toluene 7.03E-02 2.33E-01 Toluene 1.80E-02 0.00E+00
Ethylbenzene 1.46E-02 4.82E-02 Ethylbenzene 3.72E-03 0.00E+00Xylene 4.97E-02 1.64E-01 Xylene 1.27E-02 0.00E+00
Formaldehyde 5.55E-01 1.84E+00 Formaldehyde 1.42E-01 0.00E+00n-Hexane 7.48E-03 2.47E-02 n-Hexane 1.91E-03 0.00E+00
CO25,6 1,506.99 4,983.55 CO2
5,7 703.26 0.00
CH45,6 6.20E-02 2.05E-01 CH4
5,7 2.90E-02 0.00E+00
N2O5,6 1.24E-02 4.10E-02 N2O
5,7 5.78E-03 0.00E+00
5,000.89 0.00
1 The cutoff point for light v. heavy duty trucks is assumed to be a GVW of 10000 lbs.2 VMT for tailpipe emissions covers all milage traveled on both paved and unpaved roads.3 AP-42 (EPA 1995), Volume II Mobile Sources. Heavy Duty Diesel Powered Vehicles, High Altitude, Tables 7.11A.2, 7.11B.2, and 7.11C.2 for NMHC, CO, and NOx using a 2020 Emission Factor with a 2006 Model Year
SO2 emissions based on mass balance and 15 ppm diesel fuel with a density of 7.05 (lb/gal) and a mpg rating of 7 (mi/gal)4 AP-42 (EPA 1995), Volume II Mobile Sources. Light Duty Diesel Powered Trucks, High Altitude, Tables 6.11A.2, 6.11B.2, and 6.11C.2 for NMHC, CO, and NOx using a 2020 Emission Factor with a 2006 Model Year
SO2 emissions based on mass balance and 15 ppm diesel fuel with a density of 7.05 (lb/gal) and a mpg rating of 15 (mi/gal) CO emissions corrected as per the EPA Errata published March 24, 2009 for Gasoline and Diesel Industrial engines5 GHG emission factors taken from 2009 American Petroleum Institute GHG Compendium Tables 4-3 and 4-5, (API, 2009), represent the LHV6 EF(g/VMT) = EFAPI(tonnes/MMBtu) x 137000 (Btu/gal) /1000000 x 2204.6226 (lb/tonne) x 453.59 (g/lb) / 7 (mi/gal) Factor of 7 mpg taken from API, 2009, Table 4-13 for Diesel Heavy Truck7 EF(g/VMT) = EFAPI(tonnes/MMBtu) x 137000 (Btu/gal) /1000000 x 2204.6226 (lb/tonne) x 453.59 (g/lb) / 14 (mi/gal) Factor of 14 mpg taken from API, 2009, Table 4-13 for Gasoline Light Truck8 Global Warming Potentials (GWP) taken from 2009 American Petroleum Institute GHG Compendium, (API, 2009), Table 3-1, UNFCCC, 2002 Values
Operator ProvidedAssumptions
Diesel Heavy Duty Production Motive Equipment Tailpipe
Emissions
Diesel Light Duty Production Motive Equipment Tailpipe
Emissions
Emission Rate
CO2 Equivalents8 CO2 Equivalents8
PollutantEmission Factor 3
Emission Rate Pollutant
Emission Factor 4
F-112

Storage Tanks
F-113

This page intentionally left blank
F-114
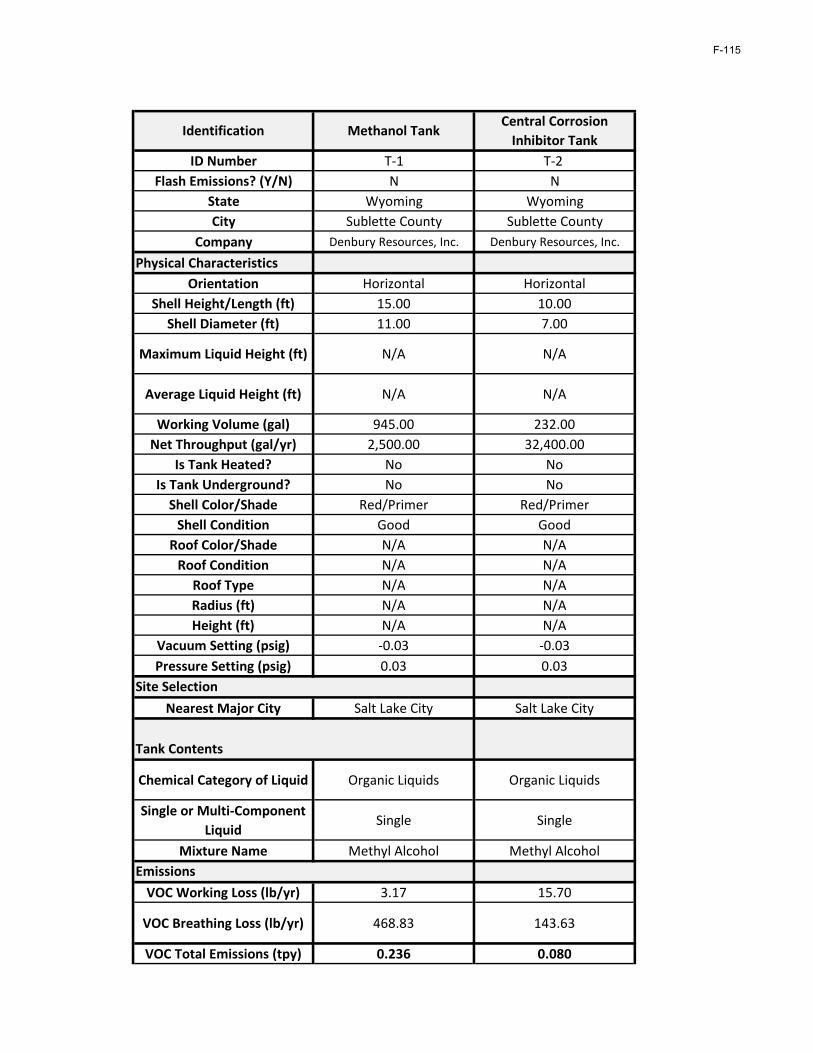
ID Number T-1 T-2 Flash Emissions? (Y/N) N N
State Wyoming WyomingCity Sublette County Sublette County
Company Denbury Resources, Inc. Denbury Resources, Inc.
Physical CharacteristicsOrientation Horizontal Horizontal
Shell Height/Length (ft) 15.00 10.00Shell Diameter (ft) 11.00 7.00
Maximum Liquid Height (ft) N/A N/A
Average Liquid Height (ft) N/A N/A
Working Volume (gal) 945.00 232.00Net Throughput (gal/yr) 2,500.00 32,400.00
Is Tank Heated? No NoIs Tank Underground? No No
Shell Color/Shade Red/Primer Red/PrimerShell Condition Good Good
Roof Color/Shade N/A N/ARoof Condition N/A N/A
Roof Type N/A N/ARadius (ft) N/A N/AHeight (ft) N/A N/A
Vacuum Setting (psig) -0.03 -0.03Pressure Setting (psig) 0.03 0.03
Site SelectionNearest Major City Salt Lake City Salt Lake City
Tank Contents
Chemical Category of Liquid Organic Liquids Organic Liquids
Single or Multi-Component Liquid
Single Single
Mixture Name Methyl Alcohol Methyl AlcoholEmissions
VOC Working Loss (lb/yr) 3.17 15.70
VOC Breathing Loss (lb/yr) 468.83 143.63
VOC Total Emissions (tpy) 0.236 0.080
Identification Methanol TankCentral Corrosion
Inhibitor Tank
F-115

This page intentionally left blank
F-116
Production Well Fugitive Emissions
F-117

This page intentionally left blank
F-118
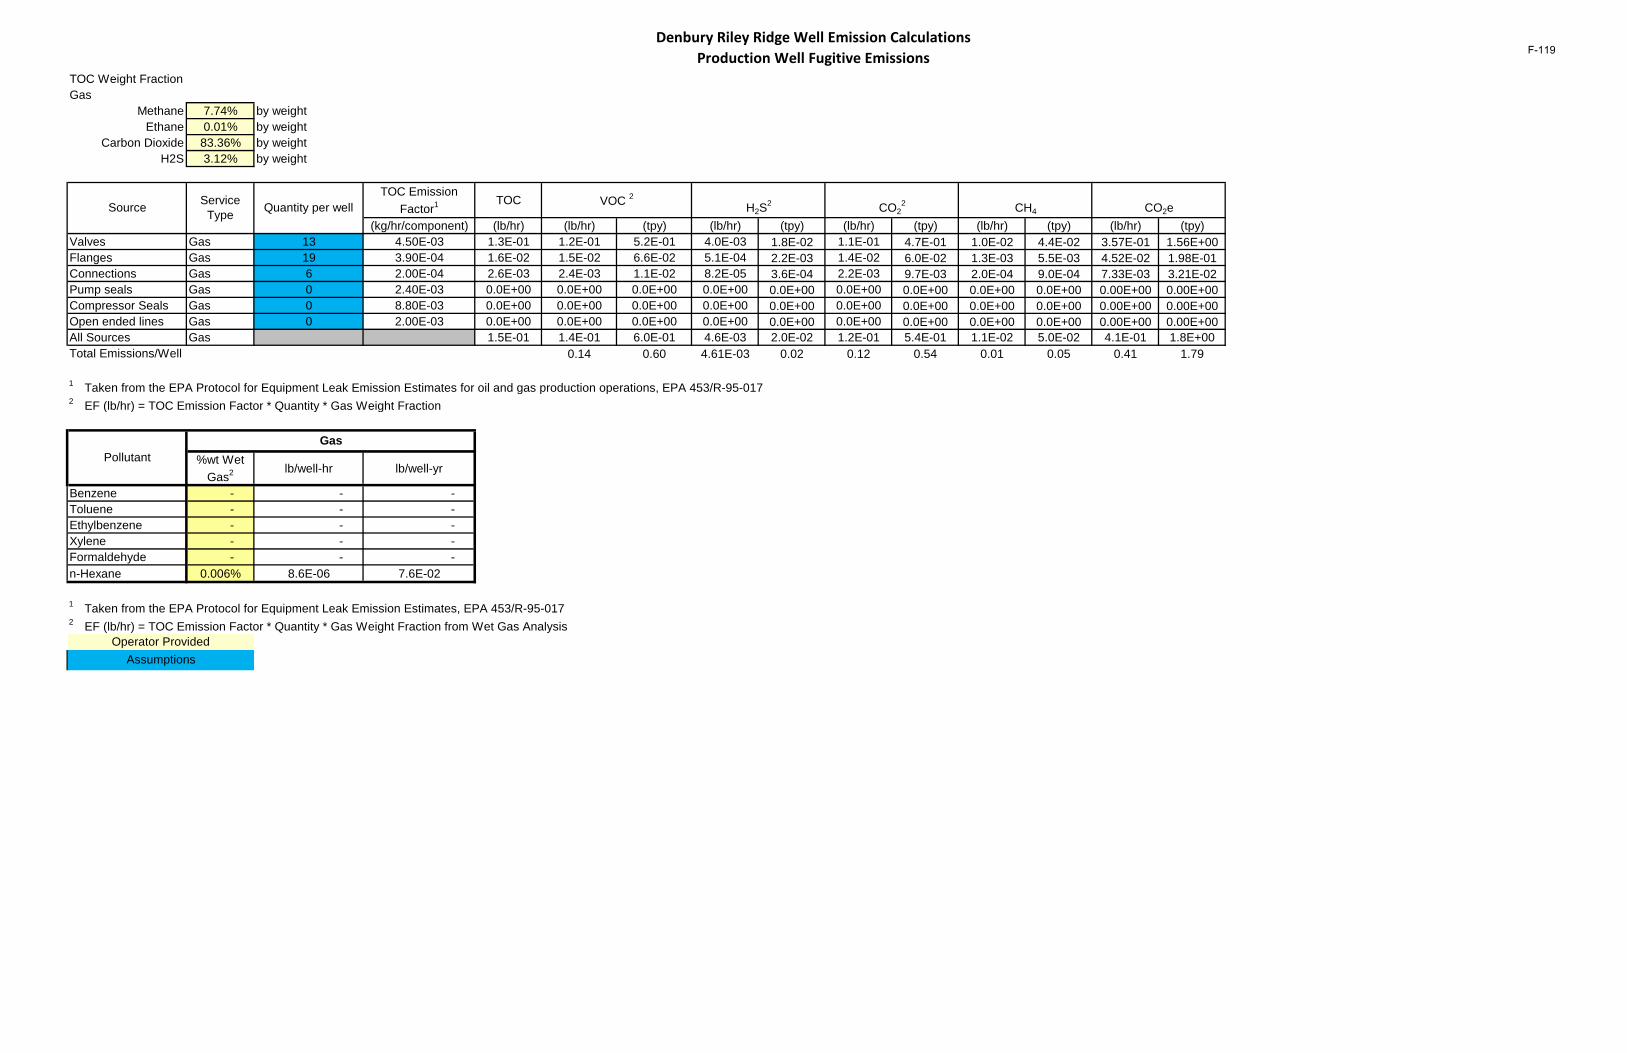
Denbury Riley Ridge Well Emission Calculations Production Well Fugitive Emissions
TOC Weight FractionGas
Methane 7.74% by weightEthane 0.01% by weight
Carbon Dioxide 83.36% by weightH2S 3.12% by weight
TOC Emission Factor1 TOC
(kg/hr/component) (lb/hr) (lb/hr) (tpy) (lb/hr) (tpy) (lb/hr) (tpy) (lb/hr) (tpy) (lb/hr) (tpy)Valves Gas 13 4.50E-03 1.3E-01 1.2E-01 5.2E-01 4.0E-03 1.8E-02 1.1E-01 4.7E-01 1.0E-02 4.4E-02 3.57E-01 1.56E+00Flanges Gas 19 3.90E-04 1.6E-02 1.5E-02 6.6E-02 5.1E-04 2.2E-03 1.4E-02 6.0E-02 1.3E-03 5.5E-03 4.52E-02 1.98E-01Connections Gas 6 2.00E-04 2.6E-03 2.4E-03 1.1E-02 8.2E-05 3.6E-04 2.2E-03 9.7E-03 2.0E-04 9.0E-04 7.33E-03 3.21E-02Pump seals Gas 0 2.40E-03 0.0E+00 0.0E+00 0.0E+00 0.0E+00 0.0E+00 0.0E+00 0.0E+00 0.0E+00 0.0E+00 0.00E+00 0.00E+00Compressor Seals Gas 0 8.80E-03 0.0E+00 0.0E+00 0.0E+00 0.0E+00 0.0E+00 0.0E+00 0.0E+00 0.0E+00 0.0E+00 0.00E+00 0.00E+00Open ended lines Gas 0 2.00E-03 0.0E+00 0.0E+00 0.0E+00 0.0E+00 0.0E+00 0.0E+00 0.0E+00 0.0E+00 0.0E+00 0.00E+00 0.00E+00All Sources Gas 1.5E-01 1.4E-01 6.0E-01 4.6E-03 2.0E-02 1.2E-01 5.4E-01 1.1E-02 5.0E-02 4.1E-01 1.8E+00Total Emissions/Well 0.14 0.60 4.61E-03 0.02 0.12 0.54 0.01 0.05 0.41 1.79
1 Taken from the EPA Protocol for Equipment Leak Emission Estimates for oil and gas production operations, EPA 453/R-95-0172 EF (lb/hr) = TOC Emission Factor * Quantity * Gas Weight Fraction
%wt Wet Gas2 lb/well-hr lb/well-yr
Benzene - - - Toluene - - - Ethylbenzene - - - Xylene - - - Formaldehyde - - - n-Hexane 0.006% 8.6E-06 7.6E-02
1 Taken from the EPA Protocol for Equipment Leak Emission Estimates, EPA 453/R-95-0172 EF (lb/hr) = TOC Emission Factor * Quantity * Gas Weight Fraction from Wet Gas Analysis
CO2eCO22 CH4
Service Type
Operator Provided
H2S2
Assumptions
VOC 2
GasPollutant
Source Quantity per well
F-119

This page intentionally left blank
F-120
Production Emissions Summary
F-121

This page intentionally left blank
F-122
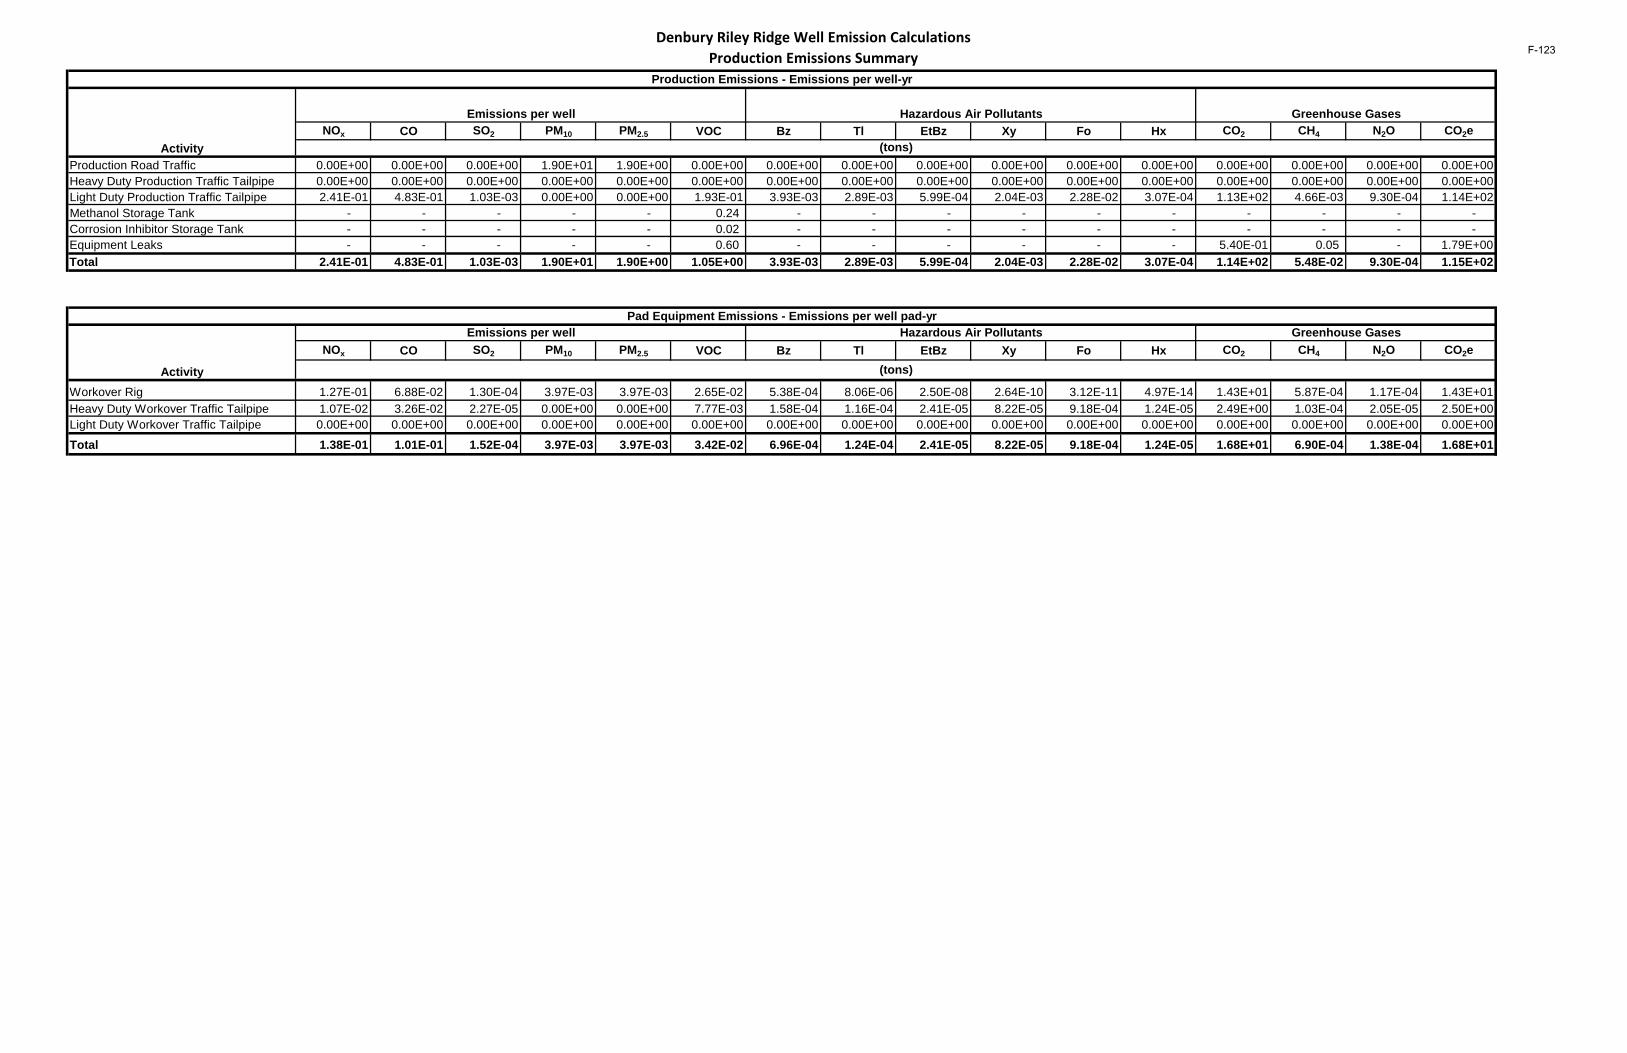
Denbury Riley Ridge Well Emission Calculations Production Emissions Summary
NOx CO SO2 PM10 PM2.5 VOC Bz Tl EtBz Xy Fo Hx CO2 CH4 N2O CO2e
Production Road Traffic 0.00E+00 0.00E+00 0.00E+00 1.90E+01 1.90E+00 0.00E+00 0.00E+00 0.00E+00 0.00E+00 0.00E+00 0.00E+00 0.00E+00 0.00E+00 0.00E+00 0.00E+00 0.00E+00Heavy Duty Production Traffic Tailpipe 0.00E+00 0.00E+00 0.00E+00 0.00E+00 0.00E+00 0.00E+00 0.00E+00 0.00E+00 0.00E+00 0.00E+00 0.00E+00 0.00E+00 0.00E+00 0.00E+00 0.00E+00 0.00E+00Light Duty Production Traffic Tailpipe 2.41E-01 4.83E-01 1.03E-03 0.00E+00 0.00E+00 1.93E-01 3.93E-03 2.89E-03 5.99E-04 2.04E-03 2.28E-02 3.07E-04 1.13E+02 4.66E-03 9.30E-04 1.14E+02Methanol Storage Tank - - - - - 0.24 - - - - - - - - - - Corrosion Inhibitor Storage Tank - - - - - 0.02 - - - - - - - - - - Equipment Leaks - - - - - 0.60 - - - - - - 5.40E-01 0.05 - 1.79E+00Total 2.41E-01 4.83E-01 1.03E-03 1.90E+01 1.90E+00 1.05E+00 3.93E-03 2.89E-03 5.99E-04 2.04E-03 2.28E-02 3.07E-04 1.14E+02 5.48E-02 9.30E-04 1.15E+02
NOx CO SO2 PM10 PM2.5 VOC Bz Tl EtBz Xy Fo Hx CO2 CH4 N2O CO2e
Workover Rig 1.27E-01 6.88E-02 1.30E-04 3.97E-03 3.97E-03 2.65E-02 5.38E-04 8.06E-06 2.50E-08 2.64E-10 3.12E-11 4.97E-14 1.43E+01 5.87E-04 1.17E-04 1.43E+01Heavy Duty Workover Traffic Tailpipe 1.07E-02 3.26E-02 2.27E-05 0.00E+00 0.00E+00 7.77E-03 1.58E-04 1.16E-04 2.41E-05 8.22E-05 9.18E-04 1.24E-05 2.49E+00 1.03E-04 2.05E-05 2.50E+00Light Duty Workover Traffic Tailpipe 0.00E+00 0.00E+00 0.00E+00 0.00E+00 0.00E+00 0.00E+00 0.00E+00 0.00E+00 0.00E+00 0.00E+00 0.00E+00 0.00E+00 0.00E+00 0.00E+00 0.00E+00 0.00E+00
Total 1.38E-01 1.01E-01 1.52E-04 3.97E-03 3.97E-03 3.42E-02 6.96E-04 1.24E-04 2.41E-05 8.22E-05 9.18E-04 1.24E-05 1.68E+01 6.90E-04 1.38E-04 1.68E+01
Pad Equipment Emissions - Emissions per well pad-yr
Activity
Emissions per well Hazardous Air Pollutants Greenhouse Gases
(tons)
Production Emissions - Emissions per well-yr
Greenhouse Gases
Activity
Emissions per well Hazardous Air Pollutants
(tons)
F-123

This page intentionally left blank
F-124
Summary – Proposed Action
F-125

This page intentionally left blank
F-126
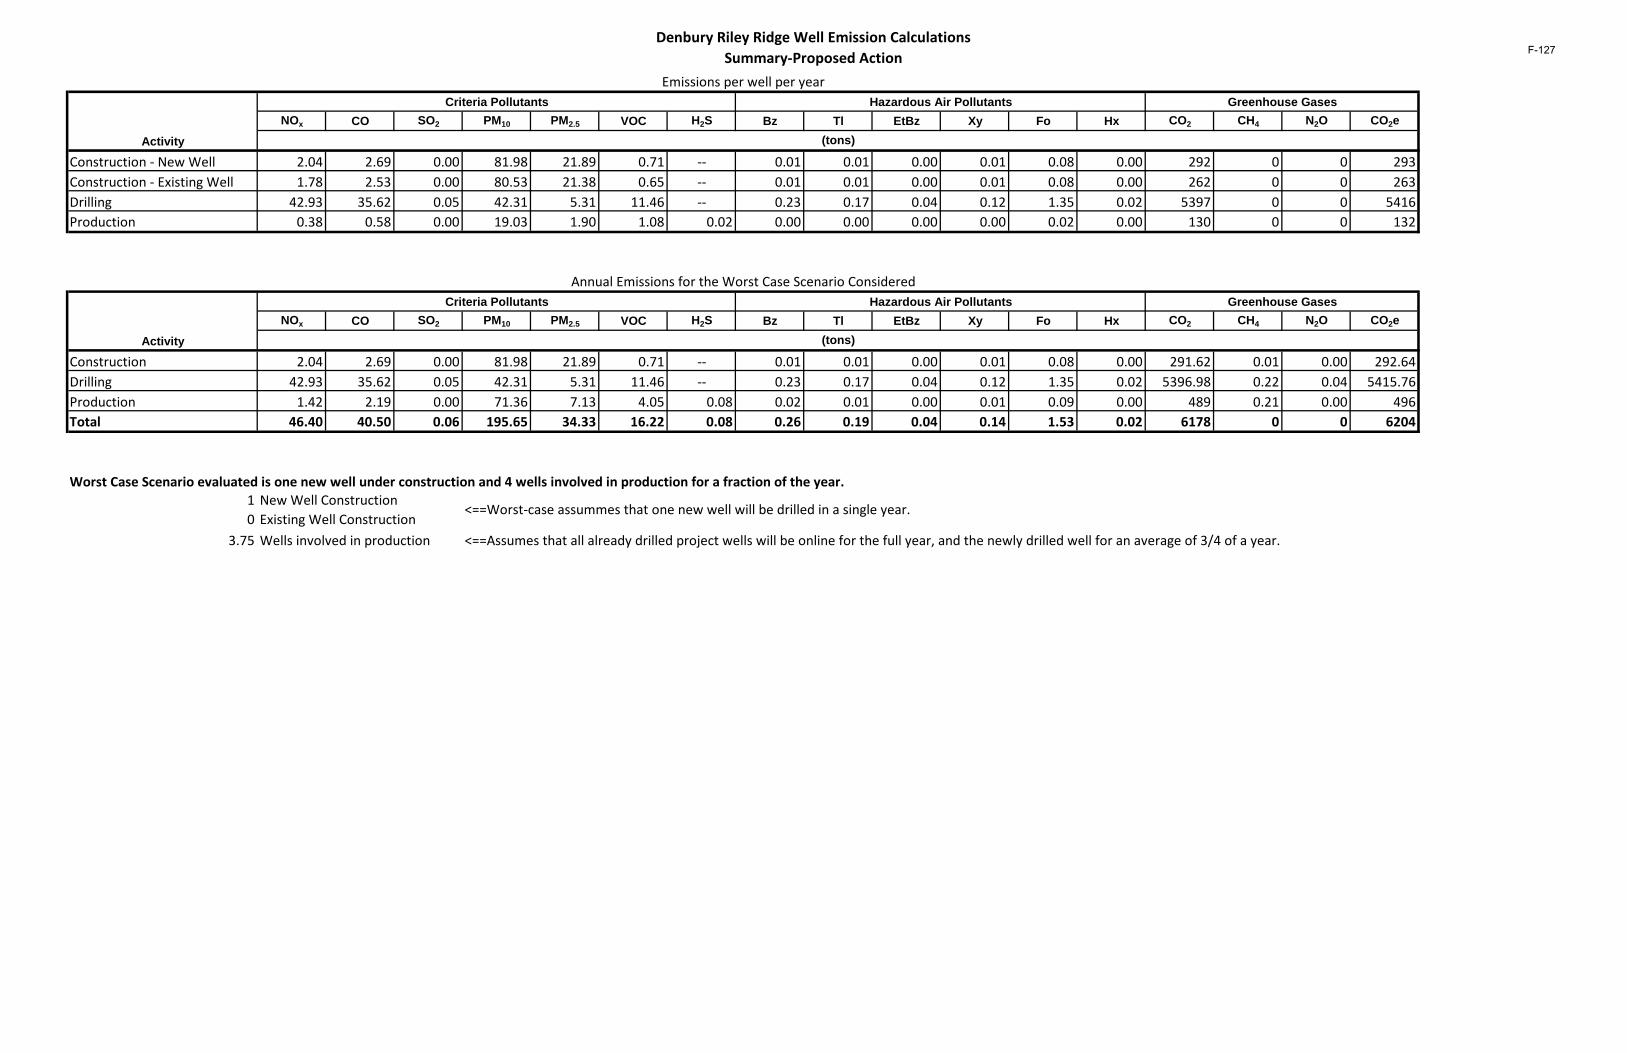
Denbury Riley Ridge Well Emission Calculations Summary-Proposed Action
NOx CO SO2 PM10 PM2.5 VOC H2S Bz Tl EtBz Xy Fo Hx CO2 CH4 N2O CO2e
Construction - New Well 2.04 2.69 0.00 81.98 21.89 0.71 -- 0.01 0.01 0.00 0.01 0.08 0.00 292 0 0 293Construction - Existing Well 1.78 2.53 0.00 80.53 21.38 0.65 -- 0.01 0.01 0.00 0.01 0.08 0.00 262 0 0 263Drilling 42.93 35.62 0.05 42.31 5.31 11.46 -- 0.23 0.17 0.04 0.12 1.35 0.02 5397 0 0 5416Production 0.38 0.58 0.00 19.03 1.90 1.08 0.02 0.00 0.00 0.00 0.00 0.02 0.00 130 0 0 132
NOx CO SO2 PM10 PM2.5 VOC H2S Bz Tl EtBz Xy Fo Hx CO2 CH4 N2O CO2e
Construction 2.04 2.69 0.00 81.98 21.89 0.71 -- 0.01 0.01 0.00 0.01 0.08 0.00 291.62 0.01 0.00 292.64Drilling 42.93 35.62 0.05 42.31 5.31 11.46 -- 0.23 0.17 0.04 0.12 1.35 0.02 5396.98 0.22 0.04 5415.76Production 1.42 2.19 0.00 71.36 7.13 4.05 0.08 0.02 0.01 0.00 0.01 0.09 0.00 489 0.21 0.00 496Total 46.40 40.50 0.06 195.65 34.33 16.22 0.08 0.26 0.19 0.04 0.14 1.53 0.02 6178 0 0 6204
Worst Case Scenario evaluated is one new well under construction and 4 wells involved in production for a fraction of the year.1 New Well Construction0 Existing Well Construction
3.75 Wells involved in production <==Assumes that all already drilled project wells will be online for the full year, and the newly drilled well for an average of 3/4 of a year.
<==Worst-case assummes that one new well will be drilled in a single year.
Annual Emissions for the Worst Case Scenario Considered
Activity
Hazardous Air Pollutants Greenhouse Gases
(tons)
Criteria Pollutants
Emissions per well per year
Activity
Hazardous Air Pollutants Greenhouse Gases
(tons)
Criteria Pollutants
F-127

This page intentionally left blank
F-128
Summary – Cumulative Impacts
F-129

This page intentionally left blank
F-130
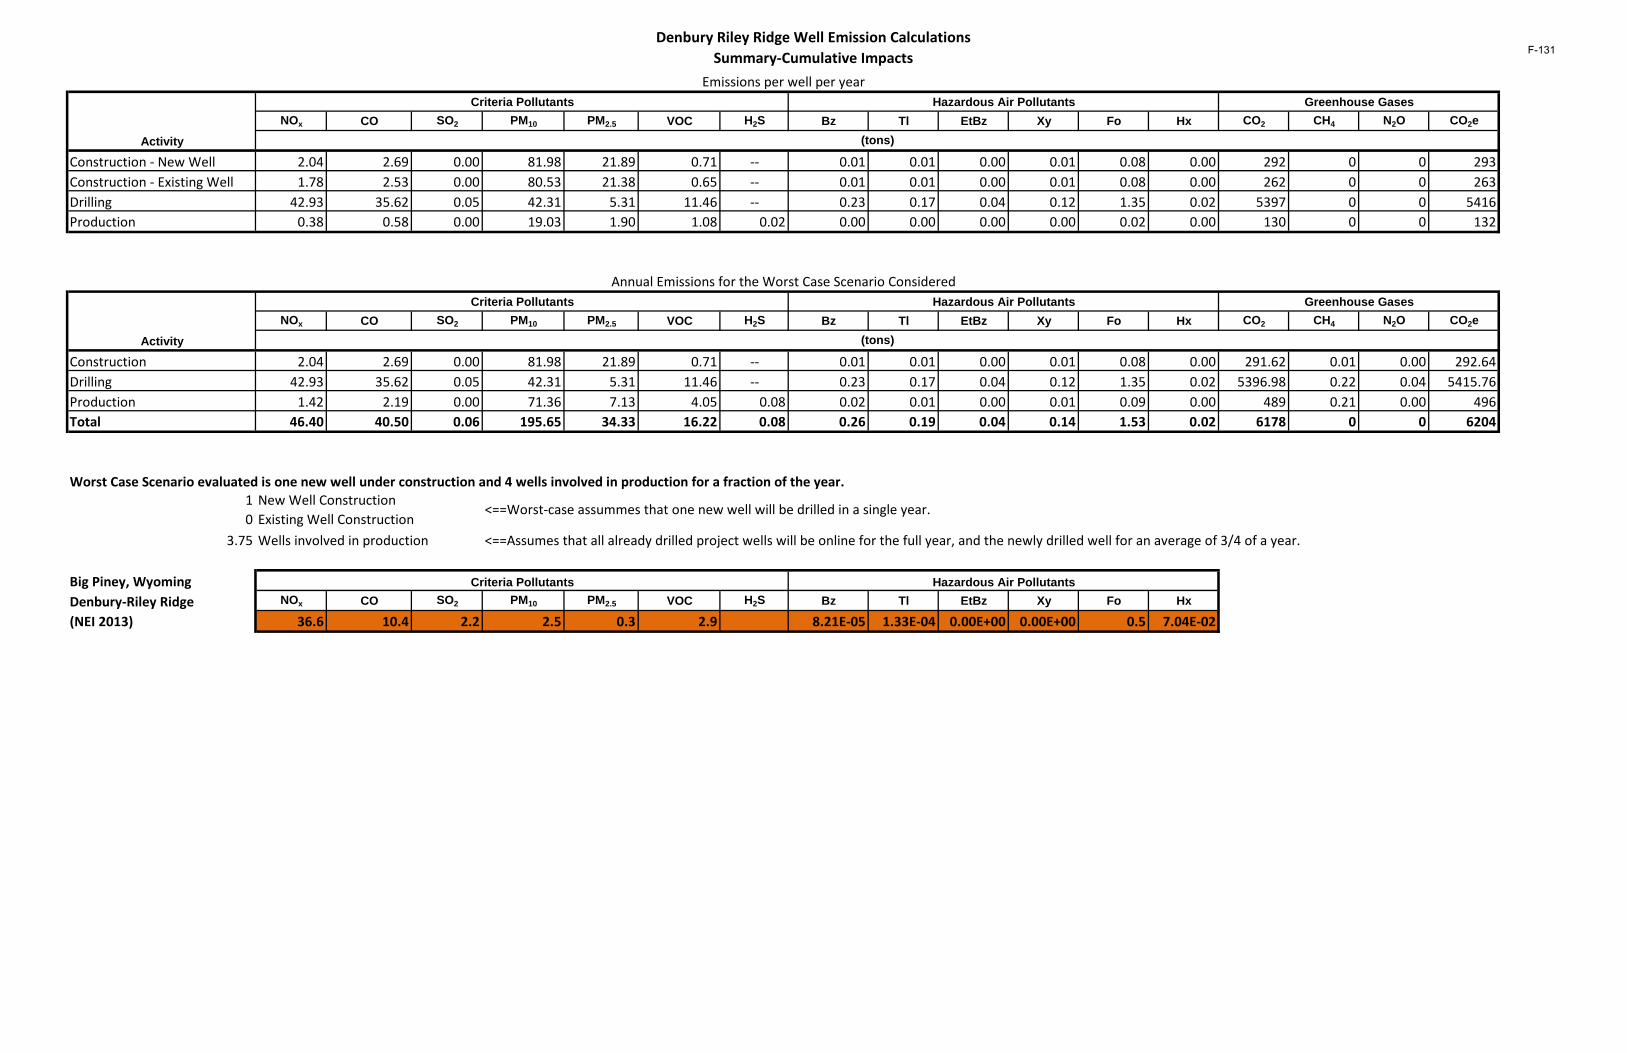
Denbury Riley Ridge Well Emission Calculations Summary-Cumulative Impacts
NOx CO SO2 PM10 PM2.5 VOC H2S Bz Tl EtBz Xy Fo Hx CO2 CH4 N2O CO2e
Construction - New Well 2.04 2.69 0.00 81.98 21.89 0.71 -- 0.01 0.01 0.00 0.01 0.08 0.00 292 0 0 293Construction - Existing Well 1.78 2.53 0.00 80.53 21.38 0.65 -- 0.01 0.01 0.00 0.01 0.08 0.00 262 0 0 263Drilling 42.93 35.62 0.05 42.31 5.31 11.46 -- 0.23 0.17 0.04 0.12 1.35 0.02 5397 0 0 5416Production 0.38 0.58 0.00 19.03 1.90 1.08 0.02 0.00 0.00 0.00 0.00 0.02 0.00 130 0 0 132
NOx CO SO2 PM10 PM2.5 VOC H2S Bz Tl EtBz Xy Fo Hx CO2 CH4 N2O CO2e
Construction 2.04 2.69 0.00 81.98 21.89 0.71 -- 0.01 0.01 0.00 0.01 0.08 0.00 291.62 0.01 0.00 292.64Drilling 42.93 35.62 0.05 42.31 5.31 11.46 -- 0.23 0.17 0.04 0.12 1.35 0.02 5396.98 0.22 0.04 5415.76Production 1.42 2.19 0.00 71.36 7.13 4.05 0.08 0.02 0.01 0.00 0.01 0.09 0.00 489 0.21 0.00 496Total 46.40 40.50 0.06 195.65 34.33 16.22 0.08 0.26 0.19 0.04 0.14 1.53 0.02 6178 0 0 6204
Worst Case Scenario evaluated is one new well under construction and 4 wells involved in production for a fraction of the year.1 New Well Construction0 Existing Well Construction
3.75 Wells involved in production <==Assumes that all already drilled project wells will be online for the full year, and the newly drilled well for an average of 3/4 of a year.
Big Piney, WyomingDenbury-Riley Ridge NOx CO SO2 PM10 PM2.5 VOC H2S Bz Tl EtBz Xy Fo Hx
(NEI 2013) 36.6 10.4 2.2 2.5 0.3 2.9 8.21E-05 1.33E-04 0.00E+00 0.00E+00 0.5 7.04E-02
Hazardous Air Pollutants
Annual Emissions for the Worst Case Scenario Considered
Activity
Hazardous Air Pollutants Greenhouse Gases
(tons)
<==Worst-case assummes that one new well will be drilled in a single year.
Criteria Pollutants
Criteria Pollutants
Emissions per well per year
Activity
Hazardous Air Pollutants Greenhouse Gases
(tons)
Criteria Pollutants
F-131

This page intentionally left blank
F-132