Embed Size (px)
Citation preview
Portway Extensions Concept Development Study Final Report
APPENDIX F – PRELIMINARY CONSTRUCTION COST ESTIMATES
Portway Extensions Concept Development Study Final Report
In advance of an economic impact analysis to be conducted as part of the next stage of the Portway Extensions program, preliminary construction cost estimates were prepared for the roadway infrastructure improvement con-cepts presented in Section X of this report. The cost estimates follow the NJDOT preliminary estimation procedures. Following is a summary table of the infrastructure improvement costs (exclusive of any required right-of-way acquisition or extensive environmental remediation that may be required). Also presented are the computation sheets detailing the construction items, estimated quantities and unit costs for each recommended alternative con-cept.
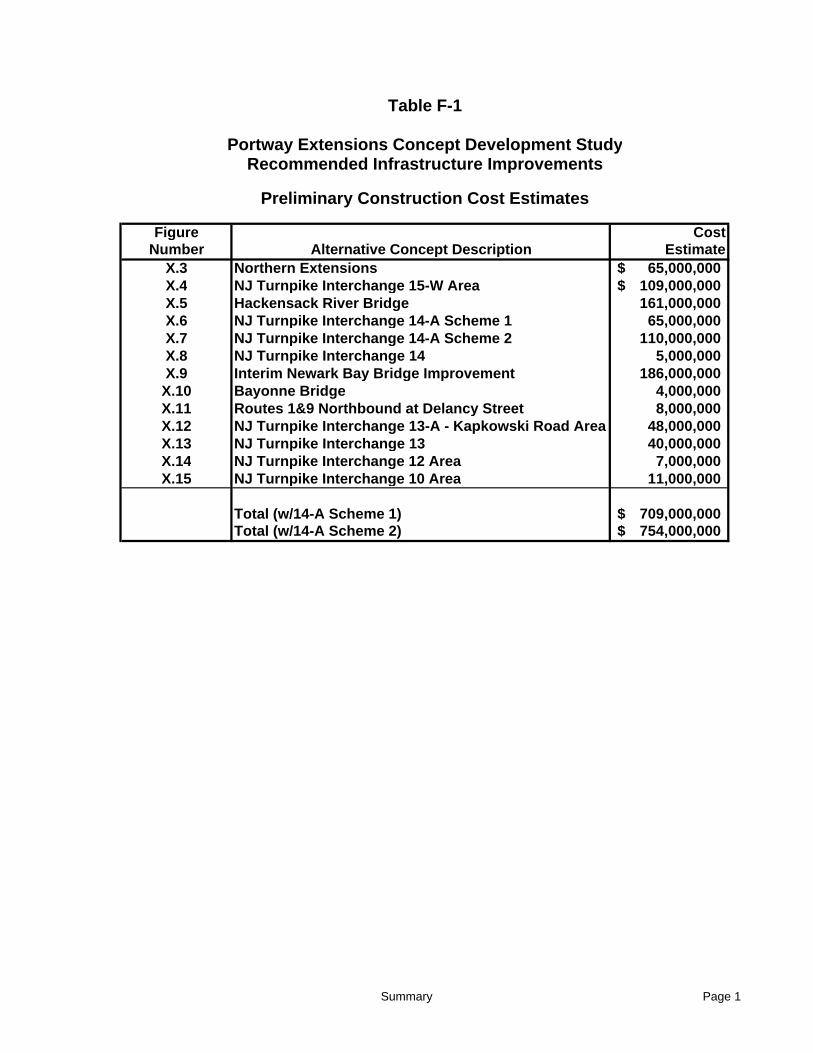
Figure CostNumber Alternative Concept Description Estimate
X.3 Northern Extensions 65,000,000$ X.4 NJ Turnpike Interchange 15-W Area 109,000,000$ X.5 Hackensack River Bridge 161,000,000 X.6 NJ Turnpike Interchange 14-A Scheme 1 65,000,000 X.7 NJ Turnpike Interchange 14-A Scheme 2 110,000,000 X.8 NJ Turnpike Interchange 14 5,000,000 X.9 Interim Newark Bay Bridge Improvement 186,000,000
X.10 Bayonne Bridge 4,000,000 X.11 Routes 1&9 Northbound at Delancy Street 8,000,000 X.12 NJ Turnpike Interchange 13-A - Kapkowski Road Area 48,000,000 X.13 NJ Turnpike Interchange 13 40,000,000 X.14 NJ Turnpike Interchange 12 Area 7,000,000 X.15 NJ Turnpike Interchange 10 Area 11,000,000
Total (w/14-A Scheme 1) 709,000,000$ Total (w/14-A Scheme 2) 754,000,000$
Portway Extensions Concept Development StudyRecommended Infrastructure Improvements
Table F-1
Preliminary Construction Cost Estimates
Summary Page 1
Class 1 - New Construction
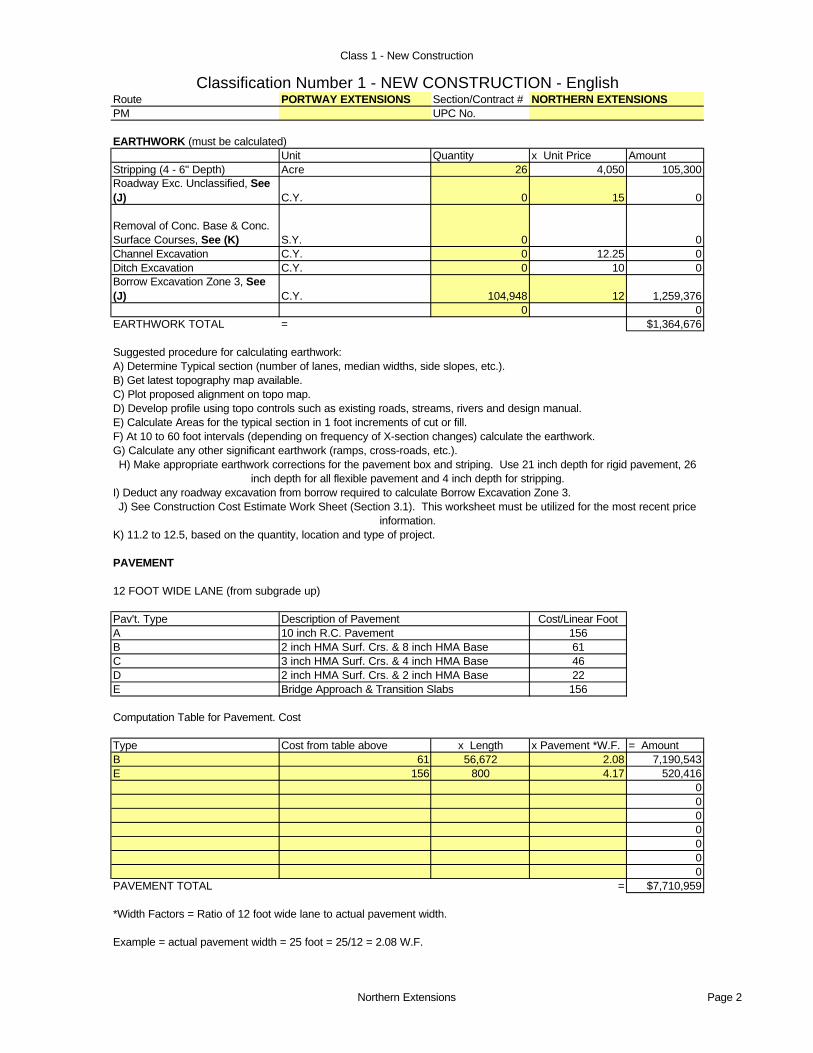
Classification Number 1 - NEW CONSTRUCTION - EnglishRoute PORTWAY EXTENSIONS Section/Contract # NORTHERN EXTENSIONSPM UPC No.
EARTHWORK (must be calculated)Unit Quantity x Unit Price Amount
Stripping (4 - 6" Depth) Acre 26 4,050 105,300Roadway Exc. Unclassified, See (J) C.Y. 0 15 0
Removal of Conc. Base & Conc. Surface Courses, See (K) S.Y. 0 0Channel Excavation C.Y. 0 12.25 0Ditch Excavation C.Y. 0 10 0Borrow Excavation Zone 3, See (J) C.Y. 104,948 12 1,259,376
0 0EARTHWORK TOTAL = $1,364,676
Suggested procedure for calculating earthwork:A) Determine Typical section (number of lanes, median widths, side slopes, etc.).B) Get latest topography map available.C) Plot proposed alignment on topo map.D) Develop profile using topo controls such as existing roads, streams, rivers and design manual.E) Calculate Areas for the typical section in 1 foot increments of cut or fill.F) At 10 to 60 foot intervals (depending on frequency of X-section changes) calculate the earthwork.G) Calculate any other significant earthwork (ramps, cross-roads, etc.).H) Make appropriate earthwork corrections for the pavement box and striping. Use 21 inch depth for rigid pavement, 26
inch depth for all flexible pavement and 4 inch depth for stripping.I) Deduct any roadway excavation from borrow required to calculate Borrow Excavation Zone 3.J) See Construction Cost Estimate Work Sheet (Section 3.1). This worksheet must be utilized for the most recent price
information.K) 11.2 to 12.5, based on the quantity, location and type of project.
PAVEMENT
12 FOOT WIDE LANE (from subgrade up)
Pav't. Type Cost/Linear FootA 156B 61C 46D 22E 156
Computation Table for Pavement. Cost
Type Cost from table above x Length x Pavement *W.F. = AmountB 61 56,672 2.08 7,190,543E 156 800 4.17 520,416
0000000
PAVEMENT TOTAL = $7,710,959
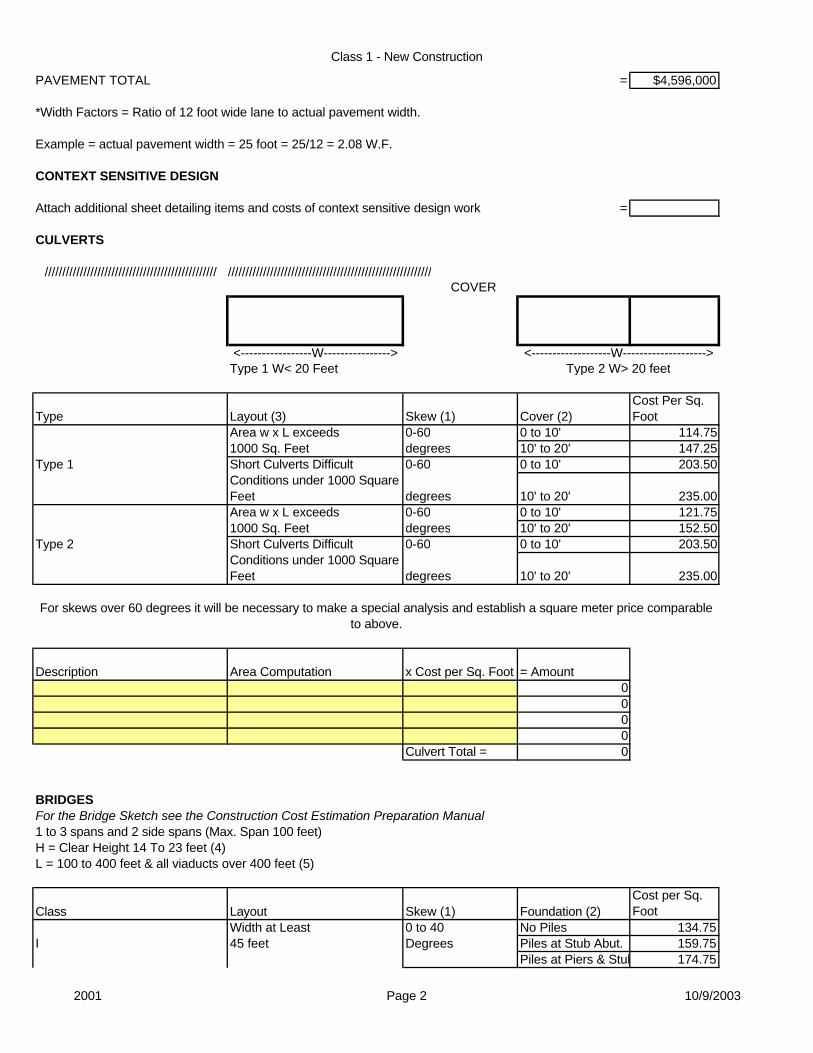
*Width Factors = Ratio of 12 foot wide lane to actual pavement width.
Example = actual pavement width = 25 foot = 25/12 = 2.08 W.F.
2 inch HMA Surf. Crs. & 2 inch HMA BaseBridge Approach & Transition Slabs
3 inch HMA Surf. Crs. & 4 inch HMA Base
Description of Pavement10 inch R.C. Pavement2 inch HMA Surf. Crs. & 8 inch HMA Base
Northern Extensions Page 2

Class 1 - New Construction
CONTEXT SENSITIVE DESIGN
Attach additional sheet detailing items and costs of context sensitive design work =
CULVERTS
///////////////////////////////////////////////////////////////////////////////////////////////////////////////////COVER
<-----------------W----------------> <-------------------W-------------------->Type 1 W< 20 Feet Type 2 W> 20 feet
Type Layout (3) Skew (1) Cover (2)Cost Per Sq. Foot
Area w x L exceeds 0-60 0 to 10' 114.751000 Sq. Feet degrees 10' to 20' 147.25
Type 1 Short Culverts Difficult 0-60 0 to 10' 203.50Conditions under 1000 Square Feet degrees 10' to 20' 235.00Area w x L exceeds 0-60 0 to 10' 121.751000 Sq. Feet degrees 10' to 20' 152.50
Type 2 Short Culverts Difficult 0-60 0 to 10' 203.50Conditions under 1000 Square Feet degrees 10' to 20' 235.00
For skews over 60 degrees it will be necessary to make a special analysis and establish a square meter price comparable to above.
Description Area Computation x Cost per Sq. Foot = Amount0000
Culvert Total = 0
BRIDGESFor the Bridge Sketch see the Construction Cost Estimation Preparation Manual1 to 3 spans and 2 side spans (Max. Span 100 feet)H = Clear Height 14 To 23 feet (4)L = 100 to 400 feet & all viaducts over 400 feet (5)
Class Layout Skew (1) Foundation (2)Cost per Sq. Foot
Width at Least 0 to 40 No Piles 134.75I 45 feet Degrees Piles at Stub Abut. 159.75
Piles at Piers & Stub Abut. 174.7540 to 60 No Piles 145.00Degrees Piles at Stub Abut. 168.25
Piles at Piers & Stub Abut. 181.25
Northern Extensions Page 3
Class 1 - New Construction
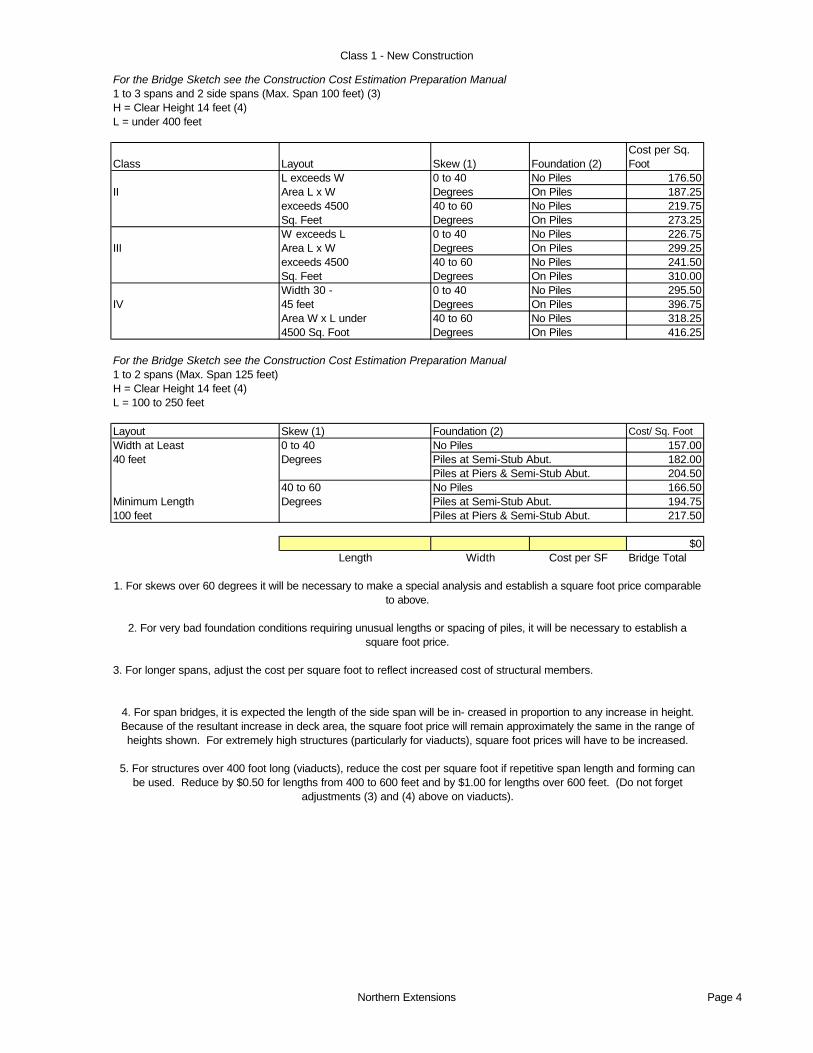
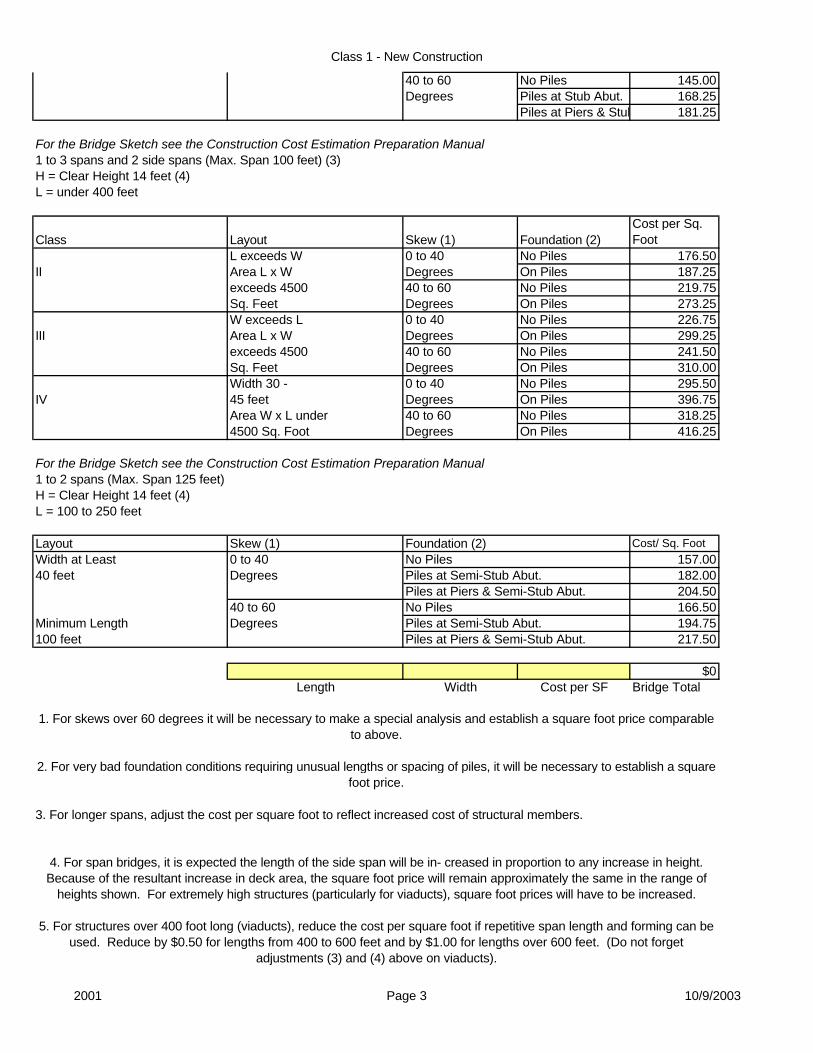
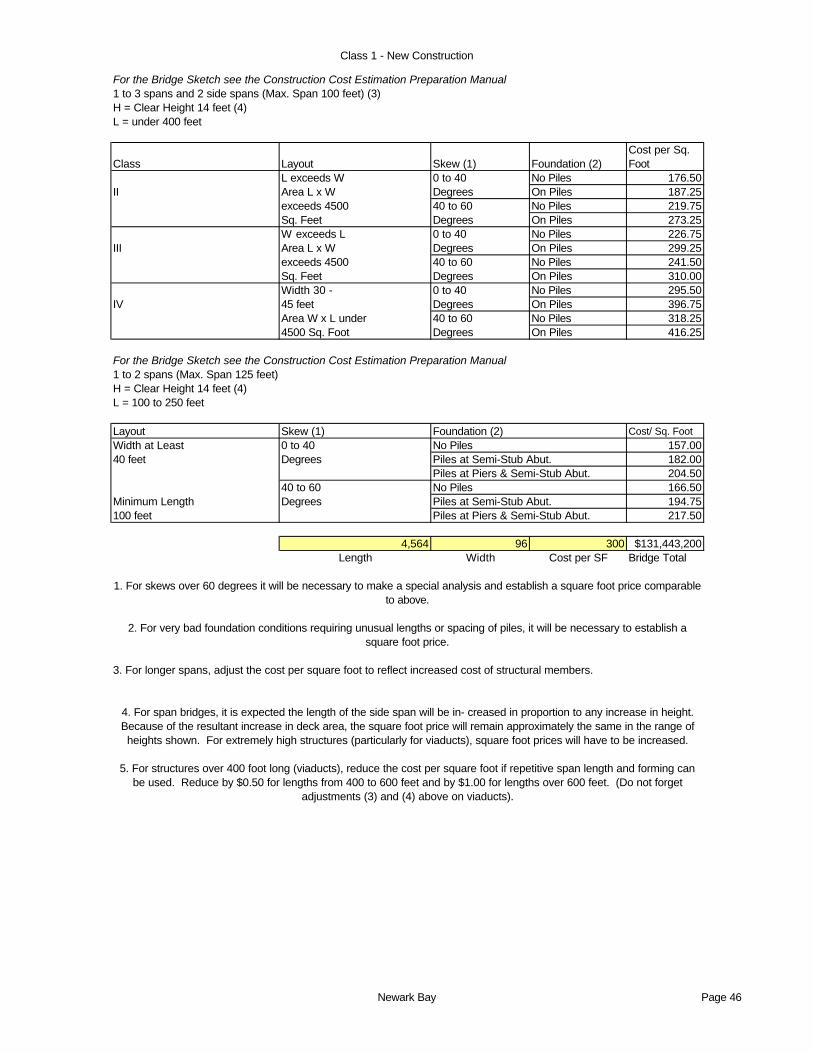
For the Bridge Sketch see the Construction Cost Estimation Preparation Manual1 to 3 spans and 2 side spans (Max. Span 100 feet) (3)H = Clear Height 14 feet (4)L = under 400 feet
Class Layout Skew (1) Foundation (2)Cost per Sq. Foot
L exceeds W 0 to 40 No Piles 176.50II Area L x W Degrees On Piles 187.25
exceeds 4500 40 to 60 No Piles 219.75Sq. Feet Degrees On Piles 273.25W exceeds L 0 to 40 No Piles 226.75
III Area L x W Degrees On Piles 299.25exceeds 4500 40 to 60 No Piles 241.50Sq. Feet Degrees On Piles 310.00Width 30 - 0 to 40 No Piles 295.50
IV 45 feet Degrees On Piles 396.75Area W x L under 40 to 60 No Piles 318.254500 Sq. Foot Degrees On Piles 416.25
For the Bridge Sketch see the Construction Cost Estimation Preparation Manual1 to 2 spans (Max. Span 125 feet)H = Clear Height 14 feet (4)L = 100 to 250 feet
Layout Skew (1) Cost/ Sq. FootWidth at Least 0 to 40 157.0040 feet Degrees 182.00
204.5040 to 60 166.50
Minimum Length Degrees 194.75100 feet 217.50
$0Length Width Cost per SF Bridge Total
1. For skews over 60 degrees it will be necessary to make a special analysis and establish a square foot price comparable to above.
2. For very bad foundation conditions requiring unusual lengths or spacing of piles, it will be necessary to establish a square foot price.
3. For longer spans, adjust the cost per square foot to reflect increased cost of structural members.
4. For span bridges, it is expected the length of the side span will be in- creased in proportion to any increase in height. Because of the resultant increase in deck area, the square foot price will remain approximately the same in the range of heights shown. For extremely high structures (particularly for viaducts), square foot prices will have to be increased.
5. For structures over 400 foot long (viaducts), reduce the cost per square foot if repetitive span length and forming can be used. Reduce by $0.50 for lengths from 400 to 600 feet and by $1.00 for lengths over 600 feet. (Do not forget
adjustments (3) and (4) above on viaducts).
Foundation (2)No PilesPiles at Semi-Stub Abut.Piles at Piers & Semi-Stub Abut.No PilesPiles at Semi-Stub Abut.Piles at Piers & Semi-Stub Abut.
Northern Extensions Page 4
Class 1 - New Construction
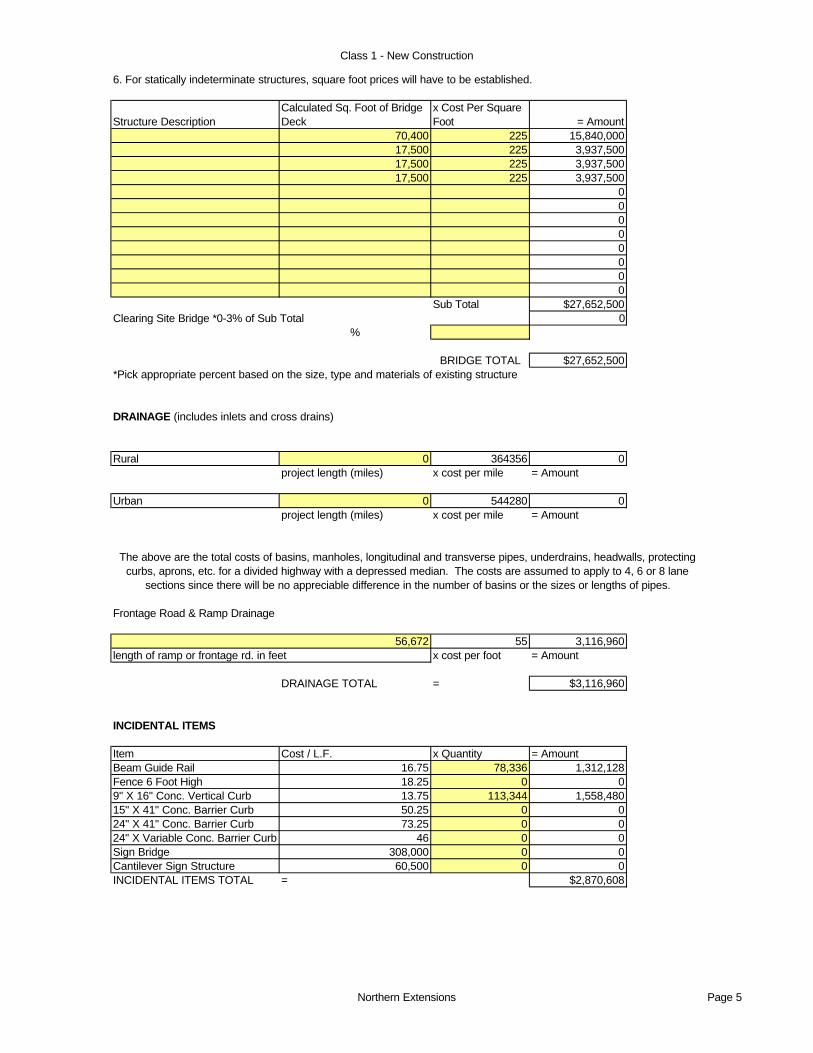
6. For statically indeterminate structures, square foot prices will have to be established.
Structure DescriptionCalculated Sq. Foot of Bridge Deck
x Cost Per Square Foot = Amount
70,400 225 15,840,00017,500 225 3,937,50017,500 225 3,937,50017,500 225 3,937,500
00000000
Sub Total $27,652,500Clearing Site Bridge *0-3% of Sub Total 0
%
BRIDGE TOTAL $27,652,500*Pick appropriate percent based on the size, type and materials of existing structure
DRAINAGE (includes inlets and cross drains)
Rural 0 364356 0project length (miles) x cost per mile = Amount
Urban 0 544280 0project length (miles) x cost per mile = Amount
The above are the total costs of basins, manholes, longitudinal and transverse pipes, underdrains, headwalls, protecting curbs, aprons, etc. for a divided highway with a depressed median. The costs are assumed to apply to 4, 6 or 8 lane
sections since there will be no appreciable difference in the number of basins or the sizes or lengths of pipes.
Frontage Road & Ramp Drainage
55 3,116,960x cost per foot = Amount
DRAINAGE TOTAL = $3,116,960
INCIDENTAL ITEMS
Item Cost / L.F. x Quantity = AmountBeam Guide Rail 16.75 78,336 1,312,128Fence 6 Foot High 18.25 0 09" X 16" Conc. Vertical Curb 13.75 113,344 1,558,48015" X 41" Conc. Barrier Curb 50.25 0 024" X 41" Conc. Barrier Curb 73.25 0 024" X Variable Conc. Barrier Curb 46 0 0Sign Bridge 308,000 0 0Cantilever Sign Structure 60,500 0 0INCIDENTAL ITEMS TOTAL = $2,870,608
56,672length of ramp or frontage rd. in feet
Northern Extensions Page 5

Class 1 - New Construction
LANDSCAPE
Quantity x Unit Prices = AmountTopsoil and Seeding (Mainline) Length of Project in miles 0 112,815 0Planting (Mainline) Length of Project in miles 0 64,500 0Topsoil, Seeding, Planting (Finger Ramp Number of Finger Ramps 0 12,500 0Topsoil, Seeding, Planting (Loop Ramp) Number of Loop Ramps 0 20,000 0Topsoil, Seeding (Access Road) Length of Access Road in Feet 56,672 7.9 447,709LANDSCAPE TOTAL = $447,709
NOISE ABATEMENT
Unit Quantity x Cost = AmountNoise Wall L.F. 0 305 0
000
NOISE ABATEMENT TOTAL = 0
GENERAL ITEMS
Item Project Length (miles) x Cost/Mile = AmountField Office 10.7 44,260 473,582Materials Field Laboratory 10.7 28,970 309,979Erosion Control during Construction 10.7 64,375 688,813GENERAL ITEMS TOTAL = $1,472,374
SUMMARY
Route PORTWAY EXTENSIONS Section/Contract #NORTHERN EXTENSIONS
PM 0 UPC No. 0
Work TypeTotals from other pages
Earthwork 1,364,676Pavement 7,710,959Context Sensitive Design 0Culverts 0Bridges 27,652,500Drainage 3,116,960Incidental Items 2,870,608Landscape 447,709Noise Abatement 0General Items 1,472,374
PROJECT SUBTOTAL $44,635,786
Northern Extensions Page 6

Class 1 - New Construction
Other Items Proj. Subtotal Range Choice AmountLighting, Traffic Stripes, Signs and Delineators
3% of Proj. Subtotal 1,339,074
Maintenance of Traffic1.5% of Proj. Subtotal 669,537
Training1% of Proj. Subtotal 446,358
Mobilization 4,463,579
Project Cost < 5.0 (Mil.)9% of Proj. Subtotal 0
Project Cost 5.0 & above10% of Proj. Subtotal 4463579
Progress Schedule Project Cost(Mil.) $ 58,000Less than 2.0 0 02.0 to 5.0 6,000 05.0 to 10.0 8,000 010.0 to 20.0 15,000 020.0 to 30.0 30,000 030.0 to 40.0 40,000 040.0 & above 58,000 58000
Clearing Site Project Cost (Mil.) $ 490,000Less than 1.0 15,000 01.0 to 2.0 30,000 02.0 to 5.0 45,000 05.0 to 10.0 115,000 010.0 to 20.0 220,000 020.0 to 30.0 240,000 030.0 to 40.0 250,000 040.0 & above 490,000 490000
Construction Layout Project Cost(Mil.) $ 890,000Less than 1.0 7,000 01.0 to 2.0 20,000 02.0 to 5.0 42,000 05.0 to 10.0 87,000 010.0 to 20.0 160,000 020.0 to 30.0 220,000 030.0 to 40.0 490,000 040.0 & above 890,000 890000
PROJECT TOTAL $52,992,332
Northern Extensions Page 7
Class 1 - New Construction
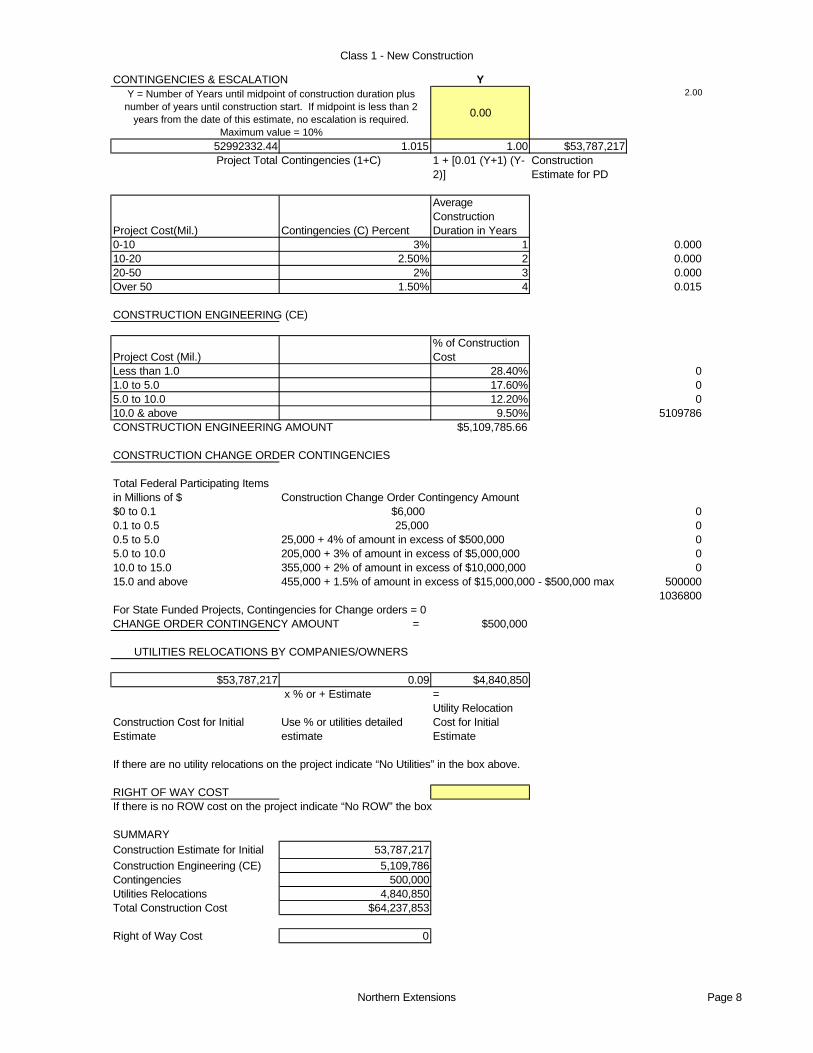
CONTINGENCIES & ESCALATION YY = Number of Years until midpoint of construction duration plus
number of years until construction start. If midpoint is less than 2 years from the date of this estimate, no escalation is required.
Maximum value = 10%
0.00
2.00
52992332.44 1.015 1.00 $53,787,217Project Total Contingencies (1+C) 1 + [0.01 (Y+1) (Y-
2)]Construction Estimate for PD
Project Cost(Mil.) Contingencies (C) Percent
Average Construction Duration in Years
0-10 3% 1 0.00010-20 2.50% 2 0.00020-50 2% 3 0.000Over 50 1.50% 4 0.015
CONSTRUCTION ENGINEERING (CE)
Project Cost (Mil.)% of Construction Cost
Less than 1.0 28.40% 01.0 to 5.0 17.60% 05.0 to 10.0 12.20% 010.0 & above 9.50% 5109786CONSTRUCTION ENGINEERING AMOUNT $5,109,785.66
CONSTRUCTION CHANGE ORDER CONTINGENCIES
Total Federal Participating Items in Millions of $ Construction Change Order Contingency Amount$0 to 0.1 $6,000 00.1 to 0.5 25,000 00.5 to 5.0 25,000 + 4% of amount in excess of $500,000 05.0 to 10.0 205,000 + 3% of amount in excess of $5,000,000 010.0 to 15.0 355,000 + 2% of amount in excess of $10,000,000 015.0 and above 455,000 + 1.5% of amount in excess of $15,000,000 - $500,000 max 500000
1036800For State Funded Projects, Contingencies for Change orders = 0CHANGE ORDER CONTINGENCY AMOUNT = $500,000
UTILITIES RELOCATIONS BY COMPANIES/OWNERS
$53,787,217 0.09 $4,840,850 x % or + Estimate =
Construction Cost for Initial Estimate
Use % or utilities detailed estimate
Utility Relocation Cost for Initial Estimate
If there are no utility relocations on the project indicate “No Utilities” in the box above.
RIGHT OF WAY COSTIf there is no ROW cost on the project indicate “No ROW” the box
SUMMARYConstruction Estimate for Initial 53,787,217Construction Engineering (CE) 5,109,786Contingencies 500,000Utilities Relocations 4,840,850Total Construction Cost $64,237,853
Right of Way Cost 0
Northern Extensions Page 8
Class 1 - New Construction
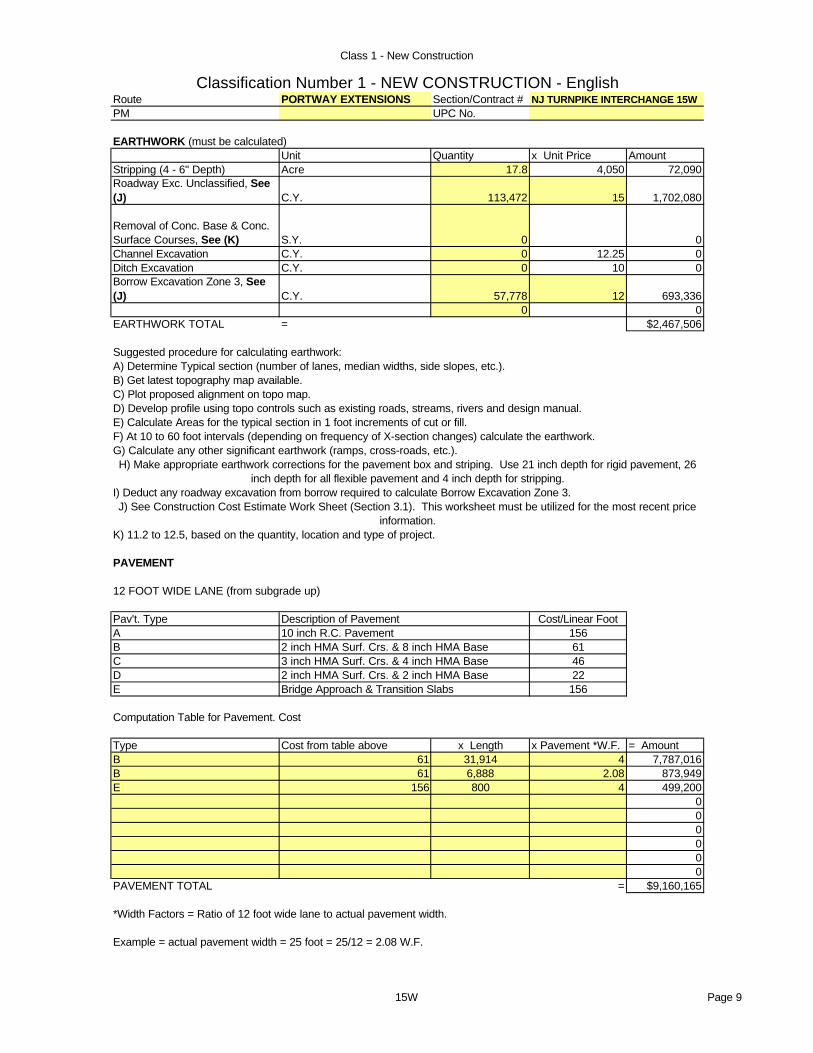
Classification Number 1 - NEW CONSTRUCTION - EnglishRoute PORTWAY EXTENSIONS Section/Contract # NJ TURNPIKE INTERCHANGE 15WPM UPC No.
EARTHWORK (must be calculated)Unit Quantity x Unit Price Amount
Stripping (4 - 6" Depth) Acre 17.8 4,050 72,090Roadway Exc. Unclassified, See (J) C.Y. 113,472 15 1,702,080
Removal of Conc. Base & Conc. Surface Courses, See (K) S.Y. 0 0Channel Excavation C.Y. 0 12.25 0Ditch Excavation C.Y. 0 10 0Borrow Excavation Zone 3, See (J) C.Y. 57,778 12 693,336
0 0EARTHWORK TOTAL = $2,467,506
Suggested procedure for calculating earthwork:A) Determine Typical section (number of lanes, median widths, side slopes, etc.).B) Get latest topography map available.C) Plot proposed alignment on topo map.D) Develop profile using topo controls such as existing roads, streams, rivers and design manual.E) Calculate Areas for the typical section in 1 foot increments of cut or fill.F) At 10 to 60 foot intervals (depending on frequency of X-section changes) calculate the earthwork.G) Calculate any other significant earthwork (ramps, cross-roads, etc.).H) Make appropriate earthwork corrections for the pavement box and striping. Use 21 inch depth for rigid pavement, 26
inch depth for all flexible pavement and 4 inch depth for stripping.I) Deduct any roadway excavation from borrow required to calculate Borrow Excavation Zone 3.J) See Construction Cost Estimate Work Sheet (Section 3.1). This worksheet must be utilized for the most recent price
information.K) 11.2 to 12.5, based on the quantity, location and type of project.
PAVEMENT
12 FOOT WIDE LANE (from subgrade up)
Pav't. Type Cost/Linear FootA 156B 61C 46D 22E 156
Computation Table for Pavement. Cost
Type Cost from table above x Length x Pavement *W.F. = AmountB 61 31,914 4 7,787,016B 61 6,888 2.08 873,949E 156 800 4 499,200
000000
PAVEMENT TOTAL = $9,160,165
*Width Factors = Ratio of 12 foot wide lane to actual pavement width.
Example = actual pavement width = 25 foot = 25/12 = 2.08 W.F.
Description of Pavement10 inch R.C. Pavement2 inch HMA Surf. Crs. & 8 inch HMA Base3 inch HMA Surf. Crs. & 4 inch HMA Base2 inch HMA Surf. Crs. & 2 inch HMA BaseBridge Approach & Transition Slabs
15W Page 9

Class 1 - New Construction
CONTEXT SENSITIVE DESIGN
Attach additional sheet detailing items and costs of context sensitive design work =
CULVERTS
///////////////////////////////////////////////////////////////////////////////////////////////////////////////////COVER
<-----------------W----------------> <-------------------W-------------------->Type 1 W< 20 Feet Type 2 W> 20 feet
Type Layout (3) Skew (1) Cover (2)Cost Per Sq. Foot
Area w x L exceeds 0-60 0 to 10' 114.751000 Sq. Feet degrees 10' to 20' 147.25
Type 1 Short Culverts Difficult 0-60 0 to 10' 203.50Conditions under 1000 Square Feet degrees 10' to 20' 235.00Area w x L exceeds 0-60 0 to 10' 121.751000 Sq. Feet degrees 10' to 20' 152.50
Type 2 Short Culverts Difficult 0-60 0 to 10' 203.50Conditions under 1000 Square Feet degrees 10' to 20' 235.00
For skews over 60 degrees it will be necessary to make a special analysis and establish a square meter price comparable to above.
Description Area Computation x Cost per Sq. Foot = Amount0000
Culvert Total = 0
BRIDGESFor the Bridge Sketch see the Construction Cost Estimation Preparation Manual1 to 3 spans and 2 side spans (Max. Span 100 feet)H = Clear Height 14 To 23 feet (4)L = 100 to 400 feet & all viaducts over 400 feet (5)
Class Layout Skew (1) Foundation (2)Cost per Sq. Foot
Width at Least 0 to 40 No Piles 134.75I 45 feet Degrees Piles at Stub Abut. 159.75
Piles at Piers & Stub Abut. 174.7540 to 60 No Piles 145.00Degrees Piles at Stub Abut. 168.25
Piles at Piers & Stub Abut. 181.25
15W Page 10

Class 1 - New Construction
For the Bridge Sketch see the Construction Cost Estimation Preparation Manual1 to 3 spans and 2 side spans (Max. Span 100 feet) (3)H = Clear Height 14 feet (4)L = under 400 feet
Class Layout Skew (1) Foundation (2)Cost per Sq. Foot
L exceeds W 0 to 40 No Piles 176.50II Area L x W Degrees On Piles 187.25
exceeds 4500 40 to 60 No Piles 219.75Sq. Feet Degrees On Piles 273.25W exceeds L 0 to 40 No Piles 226.75
III Area L x W Degrees On Piles 299.25exceeds 4500 40 to 60 No Piles 241.50Sq. Feet Degrees On Piles 310.00Width 30 - 0 to 40 No Piles 295.50
IV 45 feet Degrees On Piles 396.75Area W x L under 40 to 60 No Piles 318.254500 Sq. Foot Degrees On Piles 416.25
For the Bridge Sketch see the Construction Cost Estimation Preparation Manual1 to 2 spans (Max. Span 125 feet)H = Clear Height 14 feet (4)L = 100 to 250 feet
Layout Skew (1) Cost/ Sq. FootWidth at Least 0 to 40 157.0040 feet Degrees 182.00
204.5040 to 60 166.50
Minimum Length Degrees 194.75100 feet 217.50
$0Length Width Cost per SF Bridge Total
1. For skews over 60 degrees it will be necessary to make a special analysis and establish a square foot price comparable to above.
2. For very bad foundation conditions requiring unusual lengths or spacing of piles, it will be necessary to establish a square foot price.
3. For longer spans, adjust the cost per square foot to reflect increased cost of structural members.
4. For span bridges, it is expected the length of the side span will be in- creased in proportion to any increase in height. Because of the resultant increase in deck area, the square foot price will remain approximately the same in the range of heights shown. For extremely high structures (particularly for viaducts), square foot prices will have to be increased.
5. For structures over 400 foot long (viaducts), reduce the cost per square foot if repetitive span length and forming can be used. Reduce by $0.50 for lengths from 400 to 600 feet and by $1.00 for lengths over 600 feet. (Do not forget
adjustments (3) and (4) above on viaducts).
Foundation (2)No Piles
Piles at Piers & Semi-Stub Abut.
Piles at Semi-Stub Abut.Piles at Piers & Semi-Stub Abut.No PilesPiles at Semi-Stub Abut.
15W Page 11
Class 1 - New Construction
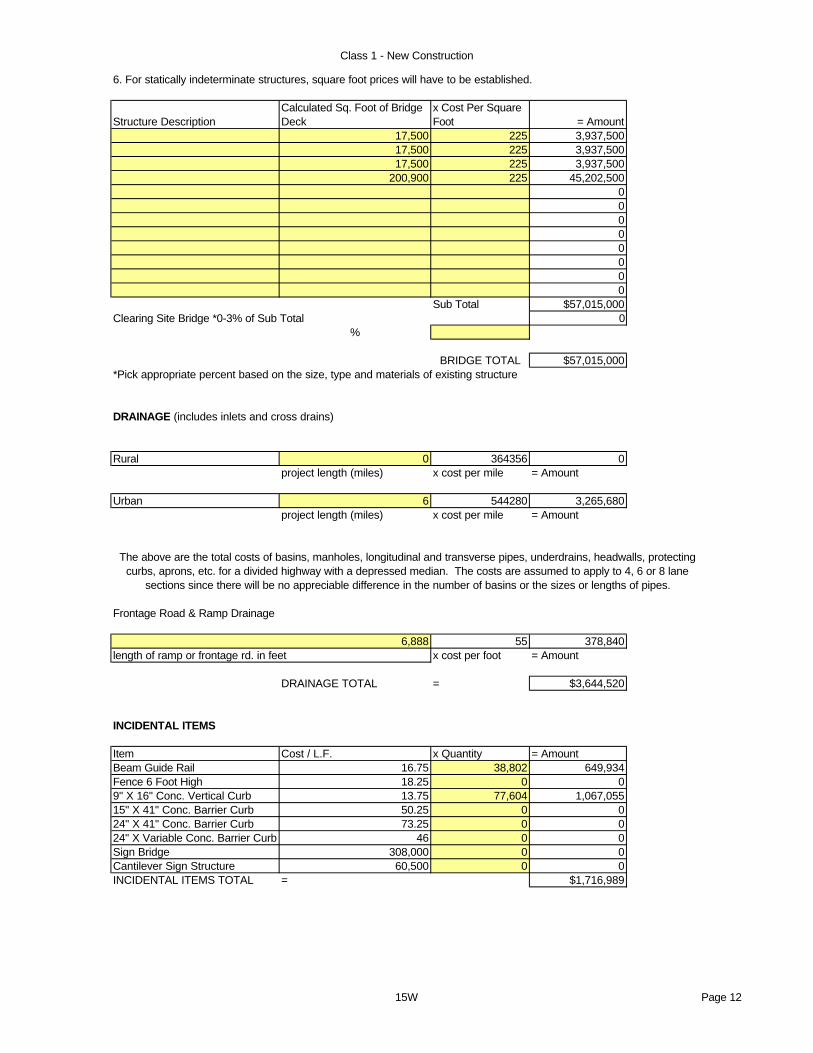
6. For statically indeterminate structures, square foot prices will have to be established.
Structure DescriptionCalculated Sq. Foot of Bridge Deck
x Cost Per Square Foot = Amount
17,500 225 3,937,50017,500 225 3,937,50017,500 225 3,937,500
200,900 225 45,202,50000000000
Sub Total $57,015,000Clearing Site Bridge *0-3% of Sub Total 0
%
BRIDGE TOTAL $57,015,000*Pick appropriate percent based on the size, type and materials of existing structure
DRAINAGE (includes inlets and cross drains)
Rural 0 364356 0project length (miles) x cost per mile = Amount
Urban 6 544280 3,265,680project length (miles) x cost per mile = Amount
The above are the total costs of basins, manholes, longitudinal and transverse pipes, underdrains, headwalls, protecting curbs, aprons, etc. for a divided highway with a depressed median. The costs are assumed to apply to 4, 6 or 8 lane
sections since there will be no appreciable difference in the number of basins or the sizes or lengths of pipes.
Frontage Road & Ramp Drainage
55 378,840x cost per foot = Amount
DRAINAGE TOTAL = $3,644,520
INCIDENTAL ITEMS
Item Cost / L.F. x Quantity = AmountBeam Guide Rail 16.75 38,802 649,934Fence 6 Foot High 18.25 0 09" X 16" Conc. Vertical Curb 13.75 77,604 1,067,05515" X 41" Conc. Barrier Curb 50.25 0 024" X 41" Conc. Barrier Curb 73.25 0 024" X Variable Conc. Barrier Curb 46 0 0Sign Bridge 308,000 0 0Cantilever Sign Structure 60,500 0 0INCIDENTAL ITEMS TOTAL = $1,716,989
6,888length of ramp or frontage rd. in feet
15W Page 12
Class 1 - New Construction
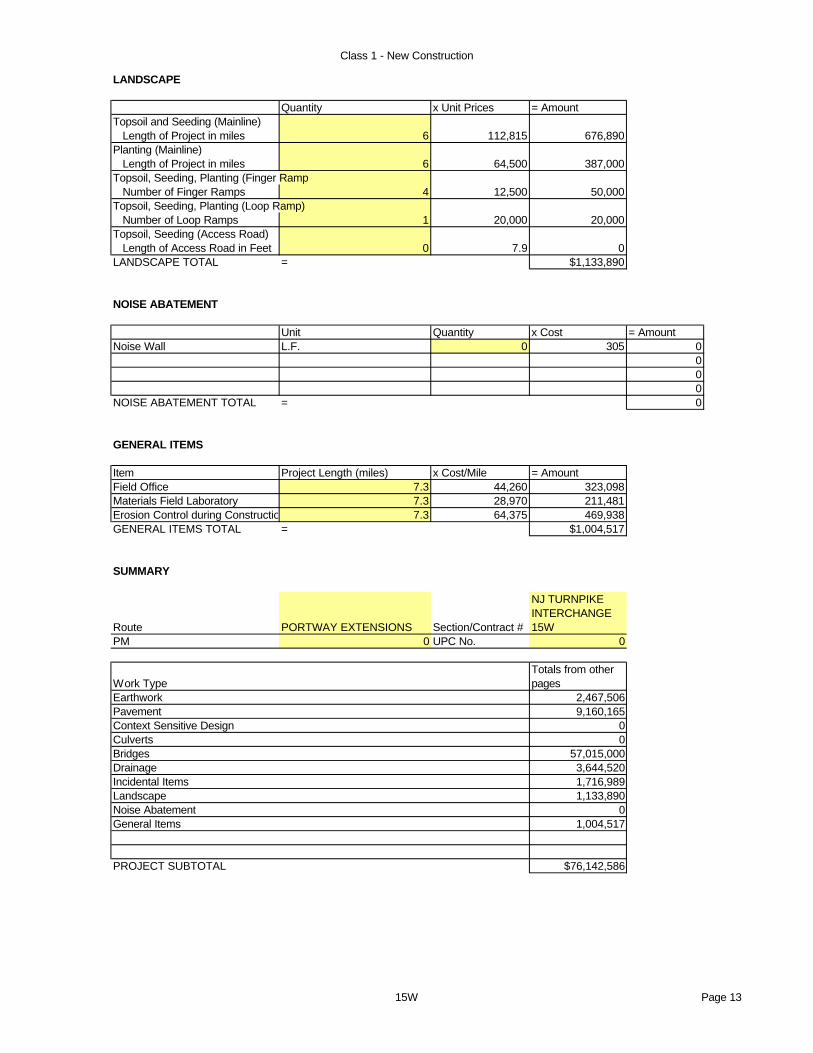
LANDSCAPE
Quantity x Unit Prices = AmountTopsoil and Seeding (Mainline) Length of Project in miles 6 112,815 676,890Planting (Mainline) Length of Project in miles 6 64,500 387,000Topsoil, Seeding, Planting (Finger Ramp Number of Finger Ramps 4 12,500 50,000Topsoil, Seeding, Planting (Loop Ramp) Number of Loop Ramps 1 20,000 20,000Topsoil, Seeding (Access Road) Length of Access Road in Feet 0 7.9 0LANDSCAPE TOTAL = $1,133,890
NOISE ABATEMENT
Unit Quantity x Cost = AmountNoise Wall L.F. 0 305 0
000
NOISE ABATEMENT TOTAL = 0
GENERAL ITEMS
Item Project Length (miles) x Cost/Mile = AmountField Office 7.3 44,260 323,098Materials Field Laboratory 7.3 28,970 211,481Erosion Control during Construction 7.3 64,375 469,938GENERAL ITEMS TOTAL = $1,004,517
SUMMARY
Route PORTWAY EXTENSIONS Section/Contract #
NJ TURNPIKE INTERCHANGE 15W
PM 0 UPC No. 0
Work TypeTotals from other pages
Earthwork 2,467,506Pavement 9,160,165Context Sensitive Design 0Culverts 0Bridges 57,015,000Drainage 3,644,520Incidental Items 1,716,989Landscape 1,133,890Noise Abatement 0General Items 1,004,517
PROJECT SUBTOTAL $76,142,586
15W Page 13

Class 1 - New Construction
Other Items Proj. Subtotal Range Choice AmountLighting, Traffic Stripes, Signs and Delineators
3% of Proj. Subtotal 2,284,278
Maintenance of Traffic1.5% of Proj. Subtotal 1,142,139
Training1% of Proj. Subtotal 761,426
Mobilization 7,614,259
Project Cost < 5.0 (Mil.)9% of Proj. Subtotal 0
Project Cost 5.0 & above10% of Proj. Subtotal 7614259
Progress Schedule Project Cost(Mil.) $ 58,000Less than 2.0 0 02.0 to 5.0 6,000 05.0 to 10.0 8,000 010.0 to 20.0 15,000 020.0 to 30.0 30,000 030.0 to 40.0 40,000 040.0 & above 58,000 58000
Clearing Site Project Cost (Mil.) $ 490,000Less than 1.0 15,000 01.0 to 2.0 30,000 02.0 to 5.0 45,000 05.0 to 10.0 115,000 010.0 to 20.0 220,000 020.0 to 30.0 240,000 030.0 to 40.0 250,000 040.0 & above 490,000 490000
Construction Layout Project Cost(Mil.) $ 890,000Less than 1.0 7,000 01.0 to 2.0 20,000 02.0 to 5.0 42,000 05.0 to 10.0 87,000 010.0 to 20.0 160,000 020.0 to 30.0 220,000 030.0 to 40.0 490,000 040.0 & above 890,000 890000
PROJECT TOTAL $89,382,687
15W Page 14

Class 1 - New Construction
CONTINGENCIES & ESCALATION YY = Number of Years until midpoint of construction duration plus
number of years until construction start. If midpoint is less than 2 years from the date of this estimate, no escalation is required.
Maximum value = 10%
0.00
2.00
89382687.34 1.015 1.00 $90,723,428Project Total Contingencies (1+C) 1 + [0.01 (Y+1) (Y-
2)]Construction Estimate for PD
Project Cost(Mil.) Contingencies (C) Percent
Average Construction Duration in Years
0-10 3% 1 0.00010-20 2.50% 2 0.00020-50 2% 3 0.000Over 50 1.50% 4 0.015
CONSTRUCTION ENGINEERING (CE)
Project Cost (Mil.)% of Construction Cost
Less than 1.0 28.40% 01.0 to 5.0 17.60% 05.0 to 10.0 12.20% 010.0 & above 9.50% 8618726CONSTRUCTION ENGINEERING AMOUNT $8,618,725.63
CONSTRUCTION CHANGE ORDER CONTINGENCIES
Total Federal Participating Items in Millions of $ Construction Change Order Contingency Amount$0 to 0.1 $6,000 00.1 to 0.5 25,000 00.5 to 5.0 25,000 + 4% of amount in excess of $500,000 05.0 to 10.0 205,000 + 3% of amount in excess of $5,000,000 010.0 to 15.0 355,000 + 2% of amount in excess of $10,000,000 015.0 and above 455,000 + 1.5% of amount in excess of $15,000,000 - $500,000 max 500000
1590900For State Funded Projects, Contingencies for Change orders = 0CHANGE ORDER CONTINGENCY AMOUNT = $500,000
UTILITIES RELOCATIONS BY COMPANIES/OWNERS
$90,723,428 0.09 $8,165,108 x % or + Estimate =
Construction Cost for Initial Estimate
Use % or utilities detailed estimate
Utility Relocation Cost for Initial Estimate
If there are no utility relocations on the project indicate “No Utilities” in the box above.
RIGHT OF WAY COSTIf there is no ROW cost on the project indicate “No ROW” the box
SUMMARYConstruction Estimate for Initial 90,723,428Construction Engineering (CE) 8,618,726Contingencies 500,000Utilities Relocations 8,165,108Total Construction Cost $108,007,262
Right of Way Cost 0
15W Page 15

Class 1 - New Construction
Classification Number 1 - NEW CONSTRUCTION - EnglishRoute PORTWAY EXTENSIONS Section/Contract # HACKENSACK RIVER BRIDGEPM UPC No.
EARTHWORK (must be calculated)Unit Quantity x Unit Price Amount
Stripping (4 - 6" Depth) Acre 0 4,050 0Roadway Exc. Unclassified, See (J) C.Y. 0 0
Removal of Conc. Base & Conc. Surface Courses, See (K) S.Y. 0 0Channel Excavation C.Y. 0 12.25 0Ditch Excavation C.Y. 0 10 0Borrow Excavation Zone 3, See (J) C.Y. 0 0
0 0EARTHWORK TOTAL = 0
Suggested procedure for calculating earthwork:A) Determine Typical section (number of lanes, median widths, side slopes, etc.).B) Get latest topography map available.C) Plot proposed alignment on topo map.D) Develop profile using topo controls such as existing roads, streams, rivers and design manual.E) Calculate Areas for the typical section in 1 foot increments of cut or fill.F) At 10 to 60 foot intervals (depending on frequency of X-section changes) calculate the earthwork.G) Calculate any other significant earthwork (ramps, cross-roads, etc.).H) Make appropriate earthwork corrections for the pavement box and striping. Use 21 inch depth for rigid pavement, 26
inch depth for all flexible pavement and 4 inch depth for stripping.I) Deduct any roadway excavation from borrow required to calculate Borrow Excavation Zone 3.J) See Construction Cost Estimate Work Sheet (Section 3.1). This worksheet must be utilized for the most recent price
information.K) 11.2 to 12.5, based on the quantity, location and type of project.
PAVEMENT
12 FOOT WIDE LANE (from subgrade up)
Pav't. Type Cost/Linear FootA 156B 61C 46D 22E 156
Computation Table for Pavement. Cost
Type Cost from table above x Length x Pavement *W.F. = AmountE 156 200 6 187,200
00000000
PAVEMENT TOTAL = $187,200
*Width Factors = Ratio of 12 foot wide lane to actual pavement width.
Example = actual pavement width = 25 foot = 25/12 = 2.08 W.F.
Description of Pavement10 inch R.C. Pavement2 inch HMA Surf. Crs. & 8 inch HMA Base3 inch HMA Surf. Crs. & 4 inch HMA Base2 inch HMA Surf. Crs. & 2 inch HMA BaseBridge Approach & Transition Slabs
Hackensack River Page 16

Class 1 - New Construction
CONTEXT SENSITIVE DESIGN
Attach additional sheet detailing items and costs of context sensitive design work =
CULVERTS
///////////////////////////////////////////////////////////////////////////////////////////////////////////////////COVER
<-----------------W----------------> <-------------------W-------------------->Type 1 W< 20 Feet Type 2 W> 20 feet
Type Layout (3) Skew (1) Cover (2)Cost Per Sq. Foot
Area w x L exceeds 0-60 0 to 10' 114.751000 Sq. Feet degrees 10' to 20' 147.25
Type 1 Short Culverts Difficult 0-60 0 to 10' 203.50Conditions under 1000 Square Feet degrees 10' to 20' 235.00Area w x L exceeds 0-60 0 to 10' 121.751000 Sq. Feet degrees 10' to 20' 152.50
Type 2 Short Culverts Difficult 0-60 0 to 10' 203.50Conditions under 1000 Square Feet degrees 10' to 20' 235.00
For skews over 60 degrees it will be necessary to make a special analysis and establish a square meter price comparable to above.
Description Area Computation x Cost per Sq. Foot = Amount0000
Culvert Total = 0
BRIDGESFor the Bridge Sketch see the Construction Cost Estimation Preparation Manual1 to 3 spans and 2 side spans (Max. Span 100 feet)H = Clear Height 14 To 23 feet (4)L = 100 to 400 feet & all viaducts over 400 feet (5)
Class Layout Skew (1) Foundation (2)Cost per Sq. Foot
Width at Least 0 to 40 No Piles 134.75I 45 feet Degrees Piles at Stub Abut. 159.75
Piles at Piers & Stub Abut. 174.7540 to 60 No Piles 145.00Degrees Piles at Stub Abut. 168.25
Piles at Piers & Stub Abut. 181.25
Hackensack River Page 17

Class 1 - New Construction
For the Bridge Sketch see the Construction Cost Estimation Preparation Manual1 to 3 spans and 2 side spans (Max. Span 100 feet) (3)H = Clear Height 14 feet (4)L = under 400 feet
Class Layout Skew (1) Foundation (2)Cost per Sq. Foot
L exceeds W 0 to 40 No Piles 176.50II Area L x W Degrees On Piles 187.25
exceeds 4500 40 to 60 No Piles 219.75Sq. Feet Degrees On Piles 273.25W exceeds L 0 to 40 No Piles 226.75
III Area L x W Degrees On Piles 299.25exceeds 4500 40 to 60 No Piles 241.50Sq. Feet Degrees On Piles 310.00Width 30 - 0 to 40 No Piles 295.50
IV 45 feet Degrees On Piles 396.75Area W x L under 40 to 60 No Piles 318.254500 Sq. Foot Degrees On Piles 416.25
For the Bridge Sketch see the Construction Cost Estimation Preparation Manual1 to 2 spans (Max. Span 125 feet)H = Clear Height 14 feet (4)L = 100 to 250 feet
Layout Skew (1) Cost/ Sq. FootWidth at Least 0 to 40 157.0040 feet Degrees 182.00
204.5040 to 60 166.50
Minimum Length Degrees 194.75100 feet 217.50
5,263 72 300 $113,680,800Length Width Cost per SF Bridge Total
1. For skews over 60 degrees it will be necessary to make a special analysis and establish a square foot price comparable to above.
2. For very bad foundation conditions requiring unusual lengths or spacing of piles, it will be necessary to establish a square foot price.
3. For longer spans, adjust the cost per square foot to reflect increased cost of structural members.
4. For span bridges, it is expected the length of the side span will be in- creased in proportion to any increase in height. Because of the resultant increase in deck area, the square foot price will remain approximately the same in the range of heights shown. For extremely high structures (particularly for viaducts), square foot prices will have to be increased.
5. For structures over 400 foot long (viaducts), reduce the cost per square foot if repetitive span length and forming can be used. Reduce by $0.50 for lengths from 400 to 600 feet and by $1.00 for lengths over 600 feet. (Do not forget
adjustments (3) and (4) above on viaducts).
Foundation (2)No Piles
Piles at Piers & Semi-Stub Abut.
Piles at Semi-Stub Abut.Piles at Piers & Semi-Stub Abut.No PilesPiles at Semi-Stub Abut.
Hackensack River Page 18

Class 1 - New Construction
6. For statically indeterminate structures, square foot prices will have to be established.
Structure DescriptionCalculated Sq. Foot of Bridge Deck
x Cost Per Square Foot = Amount
000000000000
Sub Total 0Clearing Site Bridge *0-3% of Sub Total 0
%
BRIDGE TOTAL 0*Pick appropriate percent based on the size, type and materials of existing structure
DRAINAGE (includes inlets and cross drains)
Rural 0 364356 0project length (miles) x cost per mile = Amount
Urban 0 544280 0project length (miles) x cost per mile = Amount
The above are the total costs of basins, manholes, longitudinal and transverse pipes, underdrains, headwalls, protecting curbs, aprons, etc. for a divided highway with a depressed median. The costs are assumed to apply to 4, 6 or 8 lane
sections since there will be no appreciable difference in the number of basins or the sizes or lengths of pipes.
Frontage Road & Ramp Drainage
55 0x cost per foot = Amount
DRAINAGE TOTAL = 0
INCIDENTAL ITEMS
Item Cost / L.F. x Quantity = AmountBeam Guide Rail 16.75 0 0Fence 6 Foot High 18.25 0 09" X 16" Conc. Vertical Curb 13.75 0 015" X 41" Conc. Barrier Curb 50.25 0 024" X 41" Conc. Barrier Curb 73.25 0 024" X Variable Conc. Barrier Curb 46 0 0Sign Bridge 308,000 0 0Cantilever Sign Structure 60,500 0 0INCIDENTAL ITEMS TOTAL = 0
0length of ramp or frontage rd. in feet
Hackensack River Page 19

Class 1 - New Construction
LANDSCAPE
Quantity x Unit Prices = AmountTopsoil and Seeding (Mainline) Length of Project in miles 0 112,815 0Planting (Mainline) Length of Project in miles 0 64,500 0Topsoil, Seeding, Planting (Finger Ramp Number of Finger Ramps 0 12,500 0Topsoil, Seeding, Planting (Loop Ramp) Number of Loop Ramps 0 20,000 0Topsoil, Seeding (Access Road) Length of Access Road in Feet 0 7.9 0LANDSCAPE TOTAL = 0
NOISE ABATEMENT
Unit Quantity x Cost = AmountNoise Wall L.F. 0 305 0
000
NOISE ABATEMENT TOTAL = 0
GENERAL ITEMS
Item Project Length (miles) x Cost/Mile = AmountField Office 1 44,260 44260Materials Field Laboratory 1 28,970 28970Erosion Control during Construction 1 64,375 64375GENERAL ITEMS TOTAL = $137,605
SUMMARY
Route PORTWAY EXTENSIONS Section/Contract #HACKENSACK RIVER BRIDGE
PM 0 UPC No. 0
Work TypeTotals from other pages
Earthwork 0Pavement 187,200Context Sensitive Design 0Culverts 0Bridges 113,680,800Drainage 0Incidental Items 0Landscape 0Noise Abatement 0General Items 137,605
PROJECT SUBTOTAL $114,005,605
Hackensack River Page 20

Class 1 - New Construction
Other Items Proj. Subtotal Range Choice AmountLighting, Traffic Stripes, Signs and Delineators
3% of Proj. Subtotal 3,420,168
Maintenance of Traffic1.5% of Proj. Subtotal 1,710,084
Training1% of Proj. Subtotal 1,140,056
Mobilization 11,400,561
Project Cost < 5.0 (Mil.)9% of Proj. Subtotal 0
Project Cost 5.0 & above10% of Proj. Subtotal 11400561
Progress Schedule Project Cost(Mil.) $ 58,000Less than 2.0 0 02.0 to 5.0 6,000 05.0 to 10.0 8,000 010.0 to 20.0 15,000 020.0 to 30.0 30,000 030.0 to 40.0 40,000 040.0 & above 58,000 58000
Clearing Site Project Cost (Mil.) $ 490,000Less than 1.0 15,000 01.0 to 2.0 30,000 02.0 to 5.0 45,000 05.0 to 10.0 115,000 010.0 to 20.0 220,000 020.0 to 30.0 240,000 030.0 to 40.0 250,000 040.0 & above 490,000 490000
Construction Layout Project Cost(Mil.) $ 890,000Less than 1.0 7,000 01.0 to 2.0 20,000 02.0 to 5.0 42,000 05.0 to 10.0 87,000 010.0 to 20.0 160,000 020.0 to 30.0 220,000 030.0 to 40.0 490,000 040.0 & above 890,000 890000
PROJECT TOTAL $133,114,474
Hackensack River Page 21

Class 1 - New Construction
CONTINGENCIES & ESCALATION YY = Number of Years until midpoint of construction duration plus
number of years until construction start. If midpoint is less than 2 years from the date of this estimate, no escalation is required.
Maximum value = 10%
0.00
2.00
133114473.8 1.015 1.00 $135,111,191Project Total Contingencies (1+C) 1 + [0.01 (Y+1) (Y-
2)]Construction Estimate for PD
Project Cost(Mil.) Contingencies (C) Percent
Average Construction Duration in Years
0-10 3% 1 0.00010-20 2.50% 2 0.00020-50 2% 3 0.000Over 50 1.50% 4 0.015
CONSTRUCTION ENGINEERING (CE)
Project Cost (Mil.)% of Construction Cost
Less than 1.0 28.40% 01.0 to 5.0 17.60% 05.0 to 10.0 12.20% 010.0 & above 9.50% 12835563CONSTRUCTION ENGINEERING AMOUNT $12,835,563.13
CONSTRUCTION CHANGE ORDER CONTINGENCIES
Total Federal Participating Items in Millions of $ Construction Change Order Contingency Amount$0 to 0.1 $6,000 00.1 to 0.5 25,000 00.5 to 5.0 25,000 + 4% of amount in excess of $500,000 05.0 to 10.0 205,000 + 3% of amount in excess of $5,000,000 010.0 to 15.0 355,000 + 2% of amount in excess of $10,000,000 015.0 and above 455,000 + 1.5% of amount in excess of $15,000,000 - $500,000 max 500000
2256700For State Funded Projects, Contingencies for Change orders = 0CHANGE ORDER CONTINGENCY AMOUNT = $500,000
UTILITIES RELOCATIONS BY COMPANIES/OWNERS
$135,111,191 0.09 $12,160,007 x % or + Estimate =
Construction Cost for Initial Estimate
Use % or utilities detailed estimate
Utility Relocation Cost for Initial Estimate
If there are no utility relocations on the project indicate “No Utilities” in the box above.
RIGHT OF WAY COSTIf there is no ROW cost on the project indicate “No ROW” the box
SUMMARYConstruction Estimate for Initial 135,111,191Construction Engineering (CE) 12,835,563Contingencies 500,000Utilities Relocations 12,160,007Total Construction Cost $160,606,761
Right of Way Cost 0
Hackensack River Page 22

Class 1 - New Construction
Classification Number 1 - NEW CONSTRUCTION - EnglishRoute PORTWAY EXTENSIONS Section/Contract # NJTP INT 14A - SCHEME 1PM UPC No.
EARTHWORK (must be calculated)Unit Quantity x Unit Price Amount
Stripping (4 - 6" Depth) Acre 22.9 4,050 92,745Roadway Exc. Unclassified, See (J) C.Y. 110,672 15 1,660,080Removal of Conc. Base & Conc. Surface Courses, See (K) S.Y. 0 0Channel Excavation C.Y. 0 12.25 0Ditch Excavation C.Y. 0 10 0Borrow Excavation Zone 3, See (J) C.Y. 90,130 12 1,081,560
0 0EARTHWORK TOTAL = $2,834,385
Suggested procedure for calculating earthwork:A) Determine Typical section (number of lanes, median widths, side slopes, etc.).B) Get latest topography map available.C) Plot proposed alignment on topo map.D) Develop profile using topo controls such as existing roads, streams, rivers and design manual.E) Calculate Areas for the typical section in 1 foot increments of cut or fill.F) At 10 to 60 foot intervals (depending on frequency of X-section changes) calculate the earthwork.G) Calculate any other significant earthwork (ramps, cross-roads, etc.).
H) Make appropriate earthwork corrections for the pavement box and striping. Use 21 inch depth for rigid pavement, 26 inch depth for all flexible pavement and 4 inch depth for stripping.
I) Deduct any roadway excavation from borrow required to calculate Borrow Excavation Zone 3.J) See Construction Cost Estimate Work Sheet (Section 3.1). This worksheet must be utilized for the most recent price
information.K) 11.2 to 12.5, based on the quantity, location and type of project.
PAVEMENT
12 FOOT WIDE LANE (from subgrade up)
Pav't. Type Cost/Linear FootA 156B 61C 46D 22E 156
Computation Table for Pavement. Cost
Type Cost from table above x Length x Pavement *W.F. = AmountB 60 900 20.83 1,125,000B 60 620 6.25 232,500B 60 7,010 4.17 1,752,500B 60 11,888 2.08 1,486,000
00000
2 inch HMA Surf. Crs. & 2 inch HMA BaseBridge Approach & Transition Slabs
3 inch HMA Surf. Crs. & 4 inch HMA Base
Description of Pavement10 inch R.C. Pavement2 inch HMA Surf. Crs. & 8 inch HMA Base
2001 Page 1 10/9/2003
Class 1 - New Construction
PAVEMENT TOTAL = $4,596,000
*Width Factors = Ratio of 12 foot wide lane to actual pavement width.
Example = actual pavement width = 25 foot = 25/12 = 2.08 W.F.
CONTEXT SENSITIVE DESIGN
Attach additional sheet detailing items and costs of context sensitive design work =
CULVERTS
///////////////////////////////////////////////////////////////////////////////////////////////////////////////////COVER
<-----------------W----------------> <-------------------W-------------------->Type 1 W< 20 Feet Type 2 W> 20 feet
Type Layout (3) Skew (1) Cover (2)Cost Per Sq. Foot
Area w x L exceeds 0-60 0 to 10' 114.751000 Sq. Feet degrees 10' to 20' 147.25
Type 1 Short Culverts Difficult 0-60 0 to 10' 203.50Conditions under 1000 Square Feet degrees 10' to 20' 235.00Area w x L exceeds 0-60 0 to 10' 121.751000 Sq. Feet degrees 10' to 20' 152.50
Type 2 Short Culverts Difficult 0-60 0 to 10' 203.50Conditions under 1000 Square Feet degrees 10' to 20' 235.00
For skews over 60 degrees it will be necessary to make a special analysis and establish a square meter price comparable to above.
Description Area Computation x Cost per Sq. Foot = Amount0000
Culvert Total = 0
BRIDGESFor the Bridge Sketch see the Construction Cost Estimation Preparation Manual1 to 3 spans and 2 side spans (Max. Span 100 feet)H = Clear Height 14 To 23 feet (4)L = 100 to 400 feet & all viaducts over 400 feet (5)
Class Layout Skew (1) Foundation (2)Cost per Sq. Foot
Width at Least 0 to 40 No Piles 134.75I 45 feet Degrees Piles at Stub Abut. 159.75
Piles at Piers & Stub Abut. 174.75
2001 Page 2 10/9/2003
Class 1 - New Construction
40 to 60 No Piles 145.00Degrees Piles at Stub Abut. 168.25
Piles at Piers & Stub Abut. 181.25
For the Bridge Sketch see the Construction Cost Estimation Preparation Manual1 to 3 spans and 2 side spans (Max. Span 100 feet) (3)H = Clear Height 14 feet (4)L = under 400 feet
Class Layout Skew (1) Foundation (2)Cost per Sq. Foot
L exceeds W 0 to 40 No Piles 176.50II Area L x W Degrees On Piles 187.25
exceeds 4500 40 to 60 No Piles 219.75Sq. Feet Degrees On Piles 273.25W exceeds L 0 to 40 No Piles 226.75
III Area L x W Degrees On Piles 299.25exceeds 4500 40 to 60 No Piles 241.50Sq. Feet Degrees On Piles 310.00Width 30 - 0 to 40 No Piles 295.50
IV 45 feet Degrees On Piles 396.75Area W x L under 40 to 60 No Piles 318.254500 Sq. Foot Degrees On Piles 416.25
For the Bridge Sketch see the Construction Cost Estimation Preparation Manual1 to 2 spans (Max. Span 125 feet)H = Clear Height 14 feet (4)L = 100 to 250 feet
Layout Skew (1) Cost/ Sq. FootWidth at Least 0 to 40 157.0040 feet Degrees 182.00
204.5040 to 60 166.50
Minimum Length Degrees 194.75100 feet 217.50
$0Length Width Cost per SF Bridge Total
1. For skews over 60 degrees it will be necessary to make a special analysis and establish a square foot price comparable to above.
2. For very bad foundation conditions requiring unusual lengths or spacing of piles, it will be necessary to establish a square foot price.
3. For longer spans, adjust the cost per square foot to reflect increased cost of structural members.
4. For span bridges, it is expected the length of the side span will be in- creased in proportion to any increase in height. Because of the resultant increase in deck area, the square foot price will remain approximately the same in the range of
heights shown. For extremely high structures (particularly for viaducts), square foot prices will have to be increased.
5. For structures over 400 foot long (viaducts), reduce the cost per square foot if repetitive span length and forming can be used. Reduce by $0.50 for lengths from 400 to 600 feet and by $1.00 for lengths over 600 feet. (Do not forget
adjustments (3) and (4) above on viaducts).
Foundation (2)No PilesPiles at Semi-Stub Abut.Piles at Piers & Semi-Stub Abut.No PilesPiles at Semi-Stub Abut.Piles at Piers & Semi-Stub Abut.
2001 Page 3 10/9/2003

Class 1 - New Construction
6. For statically indeterminate structures, square foot prices will have to be established.
Structure DescriptionCalculated Sq. Foot of Bridge Deck
x Cost Per Square Foot = Amount
26,000 225 5,850,00000000000000
Sub Total $5,850,000Clearing Site Bridge *0-3% of Sub Total 0
%
BRIDGE TOTAL $5,850,000*Pick appropriate percent based on the size, type and materials of existing structure
DRAINAGE (includes inlets and cross drains)
Rural 0 364356 0project length (miles) x cost per mile = Amount
Urban 1.6 544280 870,848project length (miles) x cost per mile = Amount
The above are the total costs of basins, manholes, longitudinal and transverse pipes, underdrains, headwalls, protecting curbs, aprons, etc. for a divided highway with a depressed median. The costs are assumed to apply to 4, 6 or 8 lane
sections since there will be no appreciable difference in the number of basins or the sizes or lengths of pipes.
Frontage Road & Ramp Drainage
55 678,590x cost per foot = Amount
DRAINAGE TOTAL = $1,549,438
INCIDENTAL ITEMS
Item Cost / L.F. x Quantity = AmountBeam Guide Rail 16.75 2500 41,875Fence 6 Foot High 18.25 09" X 16" Conc. Vertical Curb 13.75 22,970 315,83815" X 41" Conc. Barrier Curb 50.25 024" X 41" Conc. Barrier Curb 73.25 4410 323,03324" X Variable Conc. Barrier Curb 46 0
12,338length of ramp or frontage rd. in feet
2001 Page 4 10/9/2003
Class 1 - New Construction
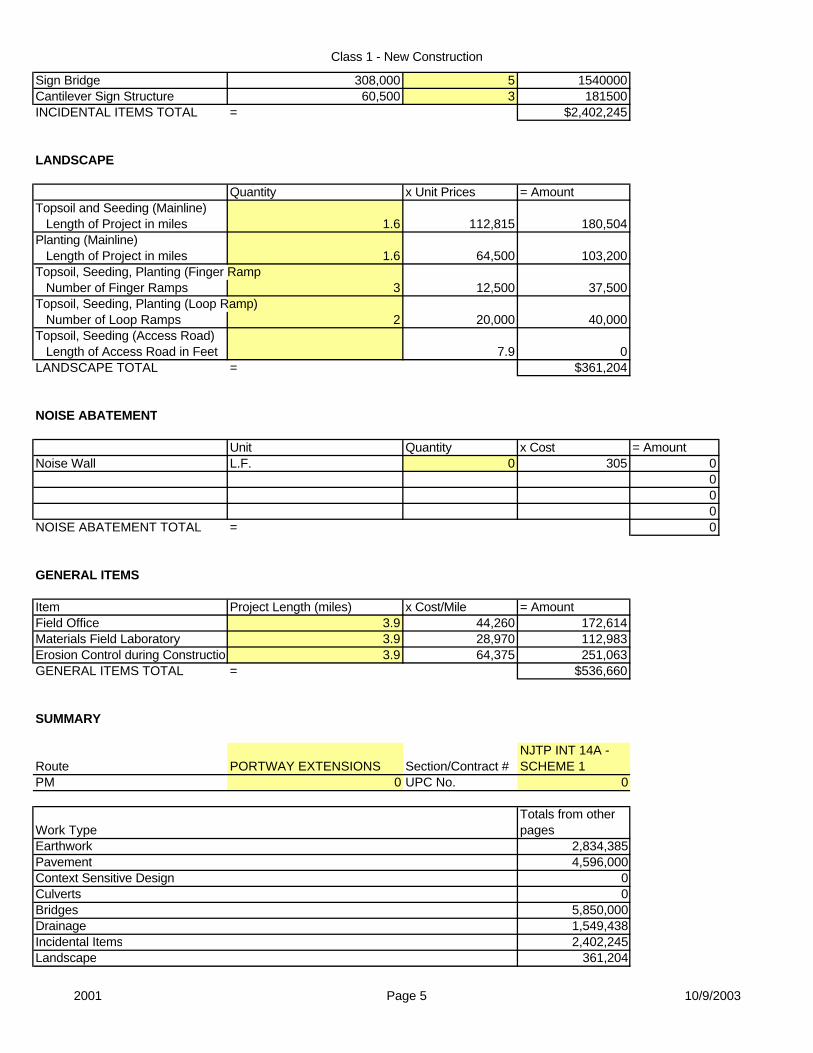
Sign Bridge 308,000 5 1540000Cantilever Sign Structure 60,500 3 181500INCIDENTAL ITEMS TOTAL = $2,402,245
LANDSCAPE
Quantity x Unit Prices = AmountTopsoil and Seeding (Mainline) Length of Project in miles 1.6 112,815 180,504Planting (Mainline) Length of Project in miles 1.6 64,500 103,200Topsoil, Seeding, Planting (Finger Ramp Number of Finger Ramps 3 12,500 37,500Topsoil, Seeding, Planting (Loop Ramp) Number of Loop Ramps 2 20,000 40,000Topsoil, Seeding (Access Road) Length of Access Road in Feet 7.9 0LANDSCAPE TOTAL = $361,204
NOISE ABATEMENT
Unit Quantity x Cost = AmountNoise Wall L.F. 0 305 0
000
NOISE ABATEMENT TOTAL = 0
GENERAL ITEMS
Item Project Length (miles) x Cost/Mile = AmountField Office 3.9 44,260 172,614Materials Field Laboratory 3.9 28,970 112,983Erosion Control during Construction 3.9 64,375 251,063GENERAL ITEMS TOTAL = $536,660
SUMMARY
Route PORTWAY EXTENSIONS Section/Contract #NJTP INT 14A - SCHEME 1
PM 0 UPC No. 0
Work TypeTotals from other pages
Earthwork 2,834,385Pavement 4,596,000Context Sensitive Design 0Culverts 0Bridges 5,850,000Drainage 1,549,438Incidental Items 2,402,245Landscape 361,204
2001 Page 5 10/9/2003
Class 1 - New Construction
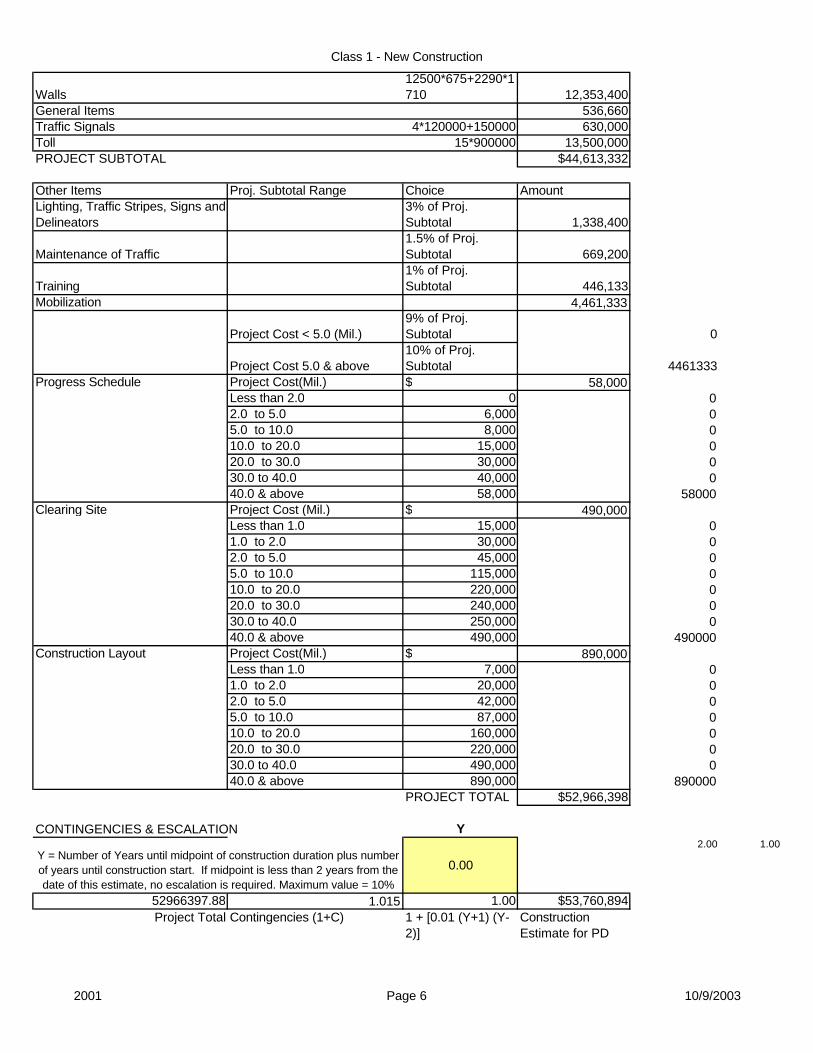
Walls12500*675+2290*1710 12,353,400
General Items 536,660Traffic Signals 4*120000+150000 630,000Toll 15*900000 13,500,000PROJECT SUBTOTAL $44,613,332
Other Items Proj. Subtotal Range Choice AmountLighting, Traffic Stripes, Signs and Delineators
3% of Proj. Subtotal 1,338,400
Maintenance of Traffic1.5% of Proj. Subtotal 669,200
Training1% of Proj. Subtotal 446,133
Mobilization 4,461,333
Project Cost < 5.0 (Mil.)9% of Proj. Subtotal 0
Project Cost 5.0 & above10% of Proj. Subtotal 4461333
Progress Schedule Project Cost(Mil.) $ 58,000Less than 2.0 0 02.0 to 5.0 6,000 05.0 to 10.0 8,000 010.0 to 20.0 15,000 020.0 to 30.0 30,000 030.0 to 40.0 40,000 040.0 & above 58,000 58000
Clearing Site Project Cost (Mil.) $ 490,000Less than 1.0 15,000 01.0 to 2.0 30,000 02.0 to 5.0 45,000 05.0 to 10.0 115,000 010.0 to 20.0 220,000 020.0 to 30.0 240,000 030.0 to 40.0 250,000 040.0 & above 490,000 490000
Construction Layout Project Cost(Mil.) $ 890,000Less than 1.0 7,000 01.0 to 2.0 20,000 02.0 to 5.0 42,000 05.0 to 10.0 87,000 010.0 to 20.0 160,000 020.0 to 30.0 220,000 030.0 to 40.0 490,000 040.0 & above 890,000 890000
PROJECT TOTAL $52,966,398
CONTINGENCIES & ESCALATION Y
Y = Number of Years until midpoint of construction duration plus number of years until construction start. If midpoint is less than 2 years from the date of this estimate, no escalation is required. Maximum value = 10%
0.00
2.00 1.00
52966397.88 1.015 1.00 $53,760,894Project Total Contingencies (1+C) 1 + [0.01 (Y+1) (Y-
2)]Construction Estimate for PD
2001 Page 6 10/9/2003
Class 1 - New Construction
Project Cost(Mil.) Contingencies (C) Percent
Average Construction Duration in Years
0-10 3% 1 0.00010-20 2.50% 2 0.00020-50 2% 3 0.000Over 50 1.50% 4 0.015
CONSTRUCTION ENGINEERING (CE)
Project Cost (Mil.)% of Construction Cost
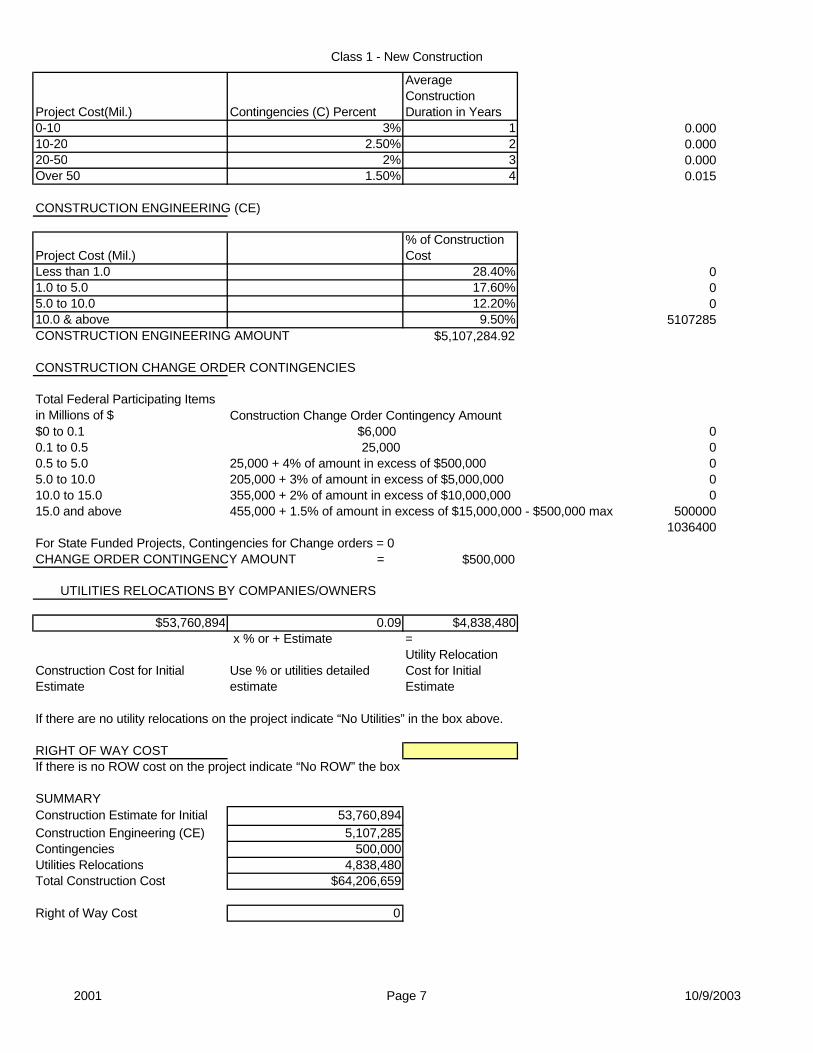
Less than 1.0 28.40% 01.0 to 5.0 17.60% 05.0 to 10.0 12.20% 010.0 & above 9.50% 5107285CONSTRUCTION ENGINEERING AMOUNT $5,107,284.92
CONSTRUCTION CHANGE ORDER CONTINGENCIES
Total Federal Participating Items in Millions of $ Construction Change Order Contingency Amount$0 to 0.1 $6,000 00.1 to 0.5 25,000 00.5 to 5.0 25,000 + 4% of amount in excess of $500,000 05.0 to 10.0 205,000 + 3% of amount in excess of $5,000,000 010.0 to 15.0 355,000 + 2% of amount in excess of $10,000,000 015.0 and above 455,000 + 1.5% of amount in excess of $15,000,000 - $500,000 max 500000
1036400For State Funded Projects, Contingencies for Change orders = 0CHANGE ORDER CONTINGENCY AMOUNT = $500,000
UTILITIES RELOCATIONS BY COMPANIES/OWNERS
$53,760,894 0.09 $4,838,480 x % or + Estimate =
Construction Cost for Initial Estimate
Use % or utilities detailed estimate
Utility Relocation Cost for Initial Estimate
If there are no utility relocations on the project indicate “No Utilities” in the box above.
RIGHT OF WAY COSTIf there is no ROW cost on the project indicate “No ROW” the box
SUMMARYConstruction Estimate for Initial 53,760,894Construction Engineering (CE) 5,107,285Contingencies 500,000Utilities Relocations 4,838,480Total Construction Cost $64,206,659
Right of Way Cost 0
2001 Page 7 10/9/2003
Class 1 - New Construction
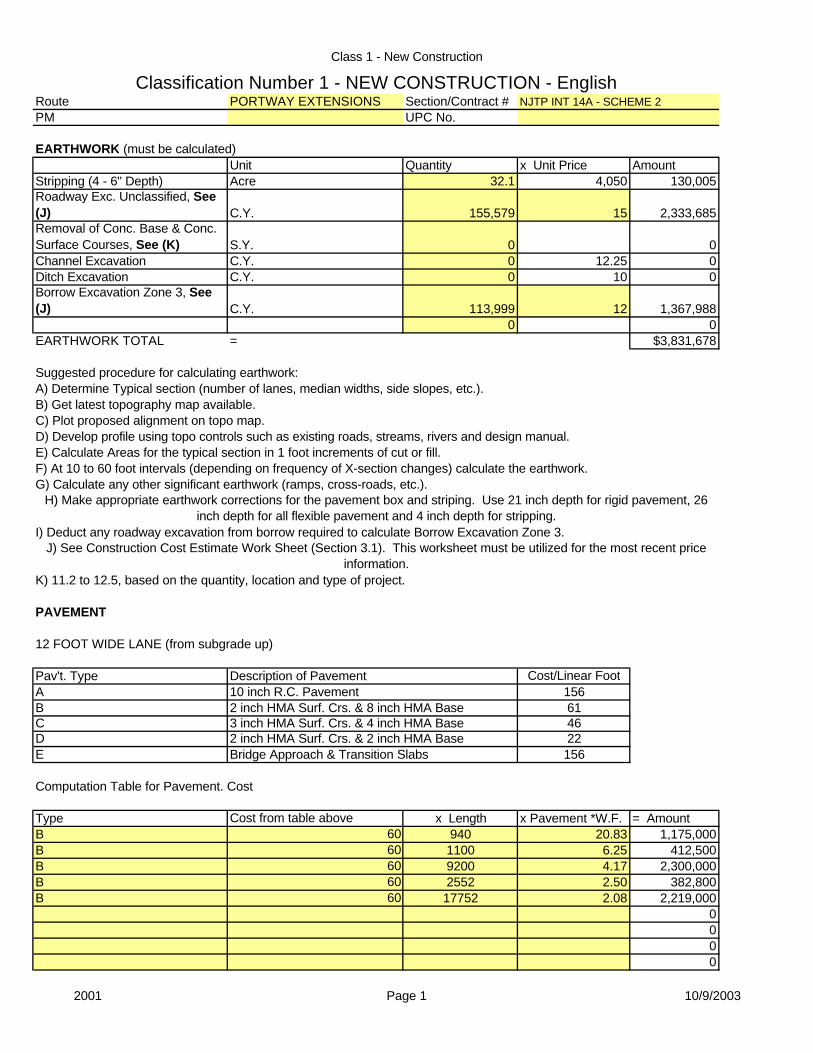
Classification Number 1 - NEW CONSTRUCTION - EnglishRoute PORTWAY EXTENSIONS Section/Contract # NJTP INT 14A - SCHEME 2PM UPC No.
EARTHWORK (must be calculated)Unit Quantity x Unit Price Amount
Stripping (4 - 6" Depth) Acre 32.1 4,050 130,005Roadway Exc. Unclassified, See (J) C.Y. 155,579 15 2,333,685Removal of Conc. Base & Conc. Surface Courses, See (K) S.Y. 0 0Channel Excavation C.Y. 0 12.25 0Ditch Excavation C.Y. 0 10 0Borrow Excavation Zone 3, See (J) C.Y. 113,999 12 1,367,988
0 0EARTHWORK TOTAL = $3,831,678
Suggested procedure for calculating earthwork:A) Determine Typical section (number of lanes, median widths, side slopes, etc.).B) Get latest topography map available.C) Plot proposed alignment on topo map.D) Develop profile using topo controls such as existing roads, streams, rivers and design manual.E) Calculate Areas for the typical section in 1 foot increments of cut or fill.F) At 10 to 60 foot intervals (depending on frequency of X-section changes) calculate the earthwork.G) Calculate any other significant earthwork (ramps, cross-roads, etc.).
H) Make appropriate earthwork corrections for the pavement box and striping. Use 21 inch depth for rigid pavement, 26 inch depth for all flexible pavement and 4 inch depth for stripping.
I) Deduct any roadway excavation from borrow required to calculate Borrow Excavation Zone 3.J) See Construction Cost Estimate Work Sheet (Section 3.1). This worksheet must be utilized for the most recent price
information.K) 11.2 to 12.5, based on the quantity, location and type of project.
PAVEMENT
12 FOOT WIDE LANE (from subgrade up)
Pav't. Type Cost/Linear FootA 156B 61C 46D 22E 156
Computation Table for Pavement. Cost
Type Cost from table above x Length x Pavement *W.F. = AmountB 60 940 20.83 1,175,000B 60 1100 6.25 412,500B 60 9200 4.17 2,300,000B 60 2552 2.50 382,800B 60 17752 2.08 2,219,000
0000
2 inch HMA Surf. Crs. & 2 inch HMA BaseBridge Approach & Transition Slabs
3 inch HMA Surf. Crs. & 4 inch HMA Base
Description of Pavement10 inch R.C. Pavement2 inch HMA Surf. Crs. & 8 inch HMA Base
2001 Page 1 10/9/2003
Class 1 - New Construction
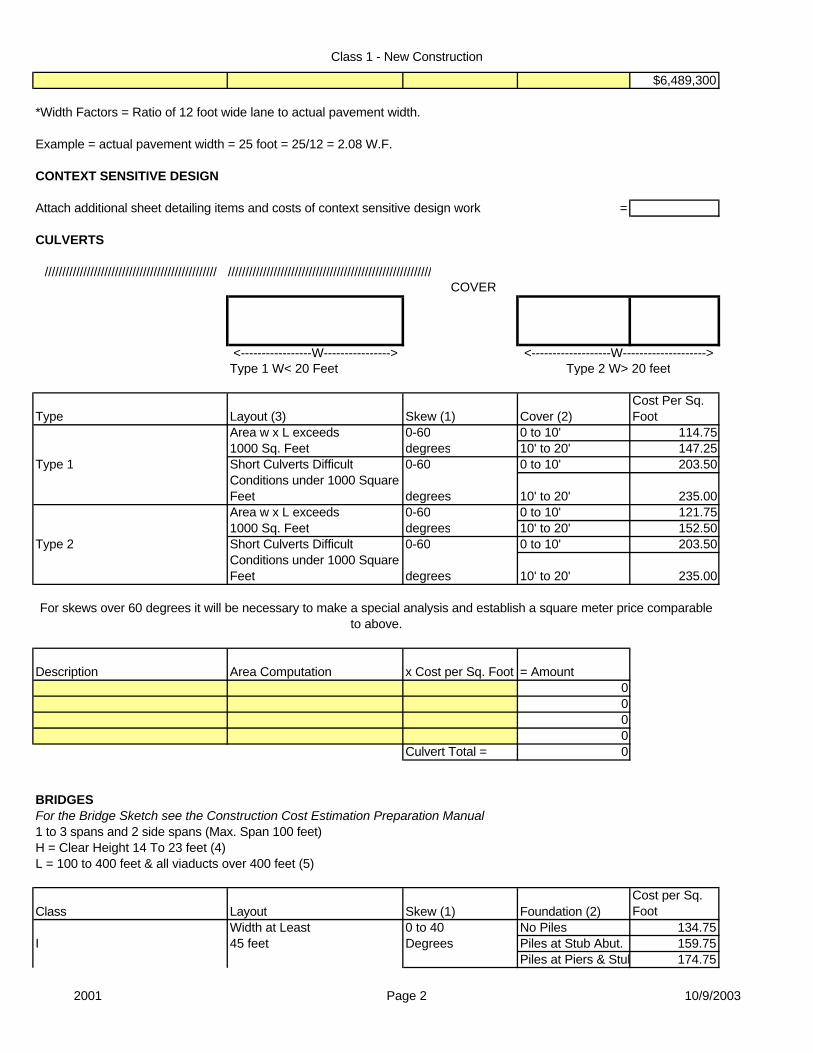
$6,489,300
*Width Factors = Ratio of 12 foot wide lane to actual pavement width.
Example = actual pavement width = 25 foot = 25/12 = 2.08 W.F.
CONTEXT SENSITIVE DESIGN
Attach additional sheet detailing items and costs of context sensitive design work =
CULVERTS
///////////////////////////////////////////////////////////////////////////////////////////////////////////////////COVER
<-----------------W----------------> <-------------------W-------------------->Type 1 W< 20 Feet Type 2 W> 20 feet
Type Layout (3) Skew (1) Cover (2)Cost Per Sq. Foot
Area w x L exceeds 0-60 0 to 10' 114.751000 Sq. Feet degrees 10' to 20' 147.25
Type 1 Short Culverts Difficult 0-60 0 to 10' 203.50Conditions under 1000 Square Feet degrees 10' to 20' 235.00Area w x L exceeds 0-60 0 to 10' 121.751000 Sq. Feet degrees 10' to 20' 152.50
Type 2 Short Culverts Difficult 0-60 0 to 10' 203.50Conditions under 1000 Square Feet degrees 10' to 20' 235.00
For skews over 60 degrees it will be necessary to make a special analysis and establish a square meter price comparable to above.
Description Area Computation x Cost per Sq. Foot = Amount0000
Culvert Total = 0
BRIDGESFor the Bridge Sketch see the Construction Cost Estimation Preparation Manual1 to 3 spans and 2 side spans (Max. Span 100 feet)H = Clear Height 14 To 23 feet (4)L = 100 to 400 feet & all viaducts over 400 feet (5)
Class Layout Skew (1) Foundation (2)Cost per Sq. Foot
Width at Least 0 to 40 No Piles 134.75I 45 feet Degrees Piles at Stub Abut. 159.75
Piles at Piers & Stub Abut. 174.75
2001 Page 2 10/9/2003

Class 1 - New Construction
40 to 60 No Piles 145.00Degrees Piles at Stub Abut. 168.25
Piles at Piers & Stub Abut. 181.25
For the Bridge Sketch see the Construction Cost Estimation Preparation Manual1 to 3 spans and 2 side spans (Max. Span 100 feet) (3)H = Clear Height 14 feet (4)L = under 400 feet
Class Layout Skew (1) Foundation (2)Cost per Sq. Foot
L exceeds W 0 to 40 No Piles 176.50II Area L x W Degrees On Piles 187.25
exceeds 4500 40 to 60 No Piles 219.75Sq. Feet Degrees On Piles 273.25W exceeds L 0 to 40 No Piles 226.75
III Area L x W Degrees On Piles 299.25exceeds 4500 40 to 60 No Piles 241.50Sq. Feet Degrees On Piles 310.00Width 30 - 0 to 40 No Piles 295.50
IV 45 feet Degrees On Piles 396.75Area W x L under 40 to 60 No Piles 318.254500 Sq. Foot Degrees On Piles 416.25
For the Bridge Sketch see the Construction Cost Estimation Preparation Manual1 to 2 spans (Max. Span 125 feet)H = Clear Height 14 feet (4)L = 100 to 250 feet
Layout Skew (1) Cost/ Sq. FootWidth at Least 0 to 40 157.0040 feet Degrees 182.00
204.5040 to 60 166.50
Minimum Length Degrees 194.75100 feet 217.50
$0Length Width Cost per SF Bridge Total
1. For skews over 60 degrees it will be necessary to make a special analysis and establish a square foot price comparable to above.
2. For very bad foundation conditions requiring unusual lengths or spacing of piles, it will be necessary to establish a square foot price.
3. For longer spans, adjust the cost per square foot to reflect increased cost of structural members.
4. For span bridges, it is expected the length of the side span will be in- creased in proportion to any increase in height. Because of the resultant increase in deck area, the square foot price will remain approximately the same in the range of
heights shown. For extremely high structures (particularly for viaducts), square foot prices will have to be increased.
5. For structures over 400 foot long (viaducts), reduce the cost per square foot if repetitive span length and forming can be used. Reduce by $0.50 for lengths from 400 to 600 feet and by $1.00 for lengths over 600 feet. (Do not forget
adjustments (3) and (4) above on viaducts).
Foundation (2)No PilesPiles at Semi-Stub Abut.Piles at Piers & Semi-Stub Abut.No PilesPiles at Semi-Stub Abut.Piles at Piers & Semi-Stub Abut.
2001 Page 3 10/9/2003

Class 1 - New Construction
6. For statically indeterminate structures, square foot prices will have to be established.
Structure DescriptionCalculated Sq. Foot of Bridge Deck
x Cost Per Square Foot = Amount
140,000 225 31,500,00000000000000
Sub Total $31,500,000Clearing Site Bridge *0-3% of Sub Total 0
%
BRIDGE TOTAL $31,500,000*Pick appropriate percent based on the size, type and materials of existing structure
DRAINAGE (includes inlets and cross drains)
Rural 0 364356 0project length (miles) x cost per mile = Amount
Urban 2.7 544280 1,469,556project length (miles) x cost per mile = Amount
The above are the total costs of basins, manholes, longitudinal and transverse pipes, underdrains, headwalls, protecting curbs, aprons, etc. for a divided highway with a depressed median. The costs are assumed to apply to 4, 6 or 8 lane
sections since there will be no appreciable difference in the number of basins or the sizes or lengths of pipes.
Frontage Road & Ramp Drainage
55 814,000x cost per foot = Amount
DRAINAGE TOTAL = $2,283,556
INCIDENTAL ITEMS
Item Cost / L.F. x Quantity = AmountBeam Guide Rail 16.75 2200 36,850Fence 6 Foot High 18.25 09" X 16" Conc. Vertical Curb 13.75 37,164 511,00515" X 41" Conc. Barrier Curb 50.25 024" X 41" Conc. Barrier Curb 73.25 2750 201,43824" X Variable Conc. Barrier Curb 46 0
14,800length of ramp or frontage rd. in feet
2001 Page 4 10/9/2003

Class 1 - New Construction
Sign Bridge 308,000 11 3388000Cantilever Sign Structure 60,500 0INCIDENTAL ITEMS TOTAL = $4,137,293
LANDSCAPE
Quantity x Unit Prices = AmountTopsoil and Seeding (Mainline) Length of Project in miles 2.7 112,815 304,601Planting (Mainline) Length of Project in miles 2.7 64,500 174,150Topsoil, Seeding, Planting (Finger Ramp Number of Finger Ramps 6 12,500 75,000Topsoil, Seeding, Planting (Loop Ramp) Number of Loop Ramps 20,000 0Topsoil, Seeding (Access Road) Length of Access Road in Feet 7.9 0LANDSCAPE TOTAL = $553,751
NOISE ABATEMENT
Unit Quantity x Cost = AmountNoise Wall L.F. 0 305 0
000
NOISE ABATEMENT TOTAL = 0
GENERAL ITEMS
Item Project Length (miles) x Cost/Mile = AmountField Office 5.4 44,260 239,004Materials Field Laboratory 5.4 28,970 156,438Erosion Control during Construction 5.4 64,375 347,625GENERAL ITEMS TOTAL = $743,067
SUMMARY
Route PORTWAY EXTENSIONS Section/Contract #NJTP INT 14A - SCHEME 2
PM 0 UPC No. 0
Work TypeTotals from other pages
Earthwork 3,831,678Pavement 6,489,300Context Sensitive Design 0Culverts 0Bridges 31,500,000Drainage 2,283,556Incidental Items 4,137,293Landscape 553,751
2001 Page 5 10/9/2003

Class 1 - New Construction
Walls10700*675+3560*1710 13,310,100
General Items 743,067Traffic Signals 3*120000+150000 510,000Toll 15*900000 13500000PROJECT SUBTOTAL $76,858,744
Other Items Proj. Subtotal Range Choice AmountLighting, Traffic Stripes, Signs and Delineators
3% of Proj. Subtotal 2,305,762
Maintenance of Traffic1.5% of Proj. Subtotal 1,152,881
Training1% of Proj. Subtotal 768,587
Mobilization 7,685,874
Project Cost < 5.0 (Mil.)9% of Proj. Subtotal 0
Project Cost 5.0 & above10% of Proj. Subtotal 7685874
Progress Schedule Project Cost(Mil.) $ 58,000Less than 2.0 0 02.0 to 5.0 6,000 05.0 to 10.0 8,000 010.0 to 20.0 15,000 020.0 to 30.0 30,000 030.0 to 40.0 40,000 040.0 & above 58,000 58000
Clearing Site Project Cost (Mil.) $ 490,000Less than 1.0 15,000 01.0 to 2.0 30,000 02.0 to 5.0 45,000 05.0 to 10.0 115,000 010.0 to 20.0 220,000 020.0 to 30.0 240,000 030.0 to 40.0 250,000 040.0 & above 490,000 490000
Construction Layout Project Cost(Mil.) $ 890,000Less than 1.0 7,000 01.0 to 2.0 20,000 02.0 to 5.0 42,000 05.0 to 10.0 87,000 010.0 to 20.0 160,000 020.0 to 30.0 220,000 030.0 to 40.0 490,000 040.0 & above 890,000 890000
PROJECT TOTAL $90,209,849
CONTINGENCIES & ESCALATION Y
Y = Number of Years until midpoint of construction duration plus number of years until construction start. If midpoint is less than 2 years from the date of this estimate, no escalation is required. Maximum value = 10%
0.00
2.00 1.00
90209849.32 1.015 1.00 $91,562,997Project Total Contingencies (1+C) 1 + [0.01 (Y+1) (Y-
2)]Construction Estimate for PD
2001 Page 6 10/9/2003

Class 1 - New Construction
Project Cost(Mil.) Contingencies (C) Percent
Average Construction Duration in Years
0-10 3% 1 0.00010-20 2.50% 2 0.00020-50 2% 3 0.000Over 50 1.50% 4 0.015
CONSTRUCTION ENGINEERING (CE)
Project Cost (Mil.)% of Construction Cost
Less than 1.0 28.40% 01.0 to 5.0 17.60% 05.0 to 10.0 12.20% 010.0 & above 9.50% 8698485CONSTRUCTION ENGINEERING AMOUNT $8,698,484.72
CONSTRUCTION CHANGE ORDER CONTINGENCIES
Total Federal Participating Items in Millions of $ Construction Change Order Contingency Amount$0 to 0.1 $6,000 00.1 to 0.5 25,000 00.5 to 5.0 25,000 + 4% of amount in excess of $500,000 05.0 to 10.0 205,000 + 3% of amount in excess of $5,000,000 010.0 to 15.0 355,000 + 2% of amount in excess of $10,000,000 015.0 and above 455,000 + 1.5% of amount in excess of $15,000,000 - $500,000 max 500000
1603400For State Funded Projects, Contingencies for Change orders = 0CHANGE ORDER CONTINGENCY AMOUNT = $500,000
UTILITIES RELOCATIONS BY COMPANIES/OWNERS
$91,562,997 0.09 $8,240,670 x % or + Estimate =
Construction Cost for Initial Estimate
Use % or utilities detailed estimate
Utility Relocation Cost for Initial Estimate
If there are no utility relocations on the project indicate “No Utilities” in the box above.
RIGHT OF WAY COSTIf there is no ROW cost on the project indicate “No ROW” the box
SUMMARYConstruction Estimate for Initial 91,562,997Construction Engineering (CE) 8,698,485Contingencies 500,000Utilities Relocations 8,240,670Total Construction Cost $109,002,152
Right of Way Cost 0
2001 Page 7 10/9/2003

Class 1 - New Construction
Classification Number 1 - NEW CONSTRUCTION - EnglishRoute PORTWAY EXTENSIONS Section/Contract # NJ TURNPIKE INTERCHANGE 14PM UPC No.
EARTHWORK (must be calculated)Unit Quantity x Unit Price Amount
Stripping (4 - 6" Depth) Acre 3.5 4,050 14,175Roadway Exc. Unclassified, See (J) C.Y. 0 15 0
Removal of Conc. Base & Conc. Surface Courses, See (K) S.Y. 0 0Channel Excavation C.Y. 0 12.25 0Ditch Excavation C.Y. 0 10 0Borrow Excavation Zone 3, See (J) C.Y. 57,037 12 684,444
0 0EARTHWORK TOTAL = $698,619
Suggested procedure for calculating earthwork:A) Determine Typical section (number of lanes, median widths, side slopes, etc.).B) Get latest topography map available.C) Plot proposed alignment on topo map.D) Develop profile using topo controls such as existing roads, streams, rivers and design manual.E) Calculate Areas for the typical section in 1 foot increments of cut or fill.F) At 10 to 60 foot intervals (depending on frequency of X-section changes) calculate the earthwork.G) Calculate any other significant earthwork (ramps, cross-roads, etc.).H) Make appropriate earthwork corrections for the pavement box and striping. Use 21 inch depth for rigid pavement, 26
inch depth for all flexible pavement and 4 inch depth for stripping.I) Deduct any roadway excavation from borrow required to calculate Borrow Excavation Zone 3.J) See Construction Cost Estimate Work Sheet (Section 3.1). This worksheet must be utilized for the most recent price
information.K) 11.2 to 12.5, based on the quantity, location and type of project.
PAVEMENT
12 FOOT WIDE LANE (from subgrade up)
Pav't. Type Cost/Linear FootA 156B 61C 46D 22E 156
Computation Table for Pavement. Cost
Type Cost from table above x Length x Pavement *W.F. = AmountB 61 7,700 2.08 976,976
00000000
PAVEMENT TOTAL = $976,976
*Width Factors = Ratio of 12 foot wide lane to actual pavement width.
Example = actual pavement width = 25 foot = 25/12 = 2.08 W.F.
Description of Pavement10 inch R.C. Pavement2 inch HMA Surf. Crs. & 8 inch HMA Base3 inch HMA Surf. Crs. & 4 inch HMA Base2 inch HMA Surf. Crs. & 2 inch HMA BaseBridge Approach & Transition Slabs
14 Page 37

Class 1 - New Construction
CONTEXT SENSITIVE DESIGN
Attach additional sheet detailing items and costs of context sensitive design work =
CULVERTS
///////////////////////////////////////////////////////////////////////////////////////////////////////////////////COVER
<-----------------W----------------> <-------------------W-------------------->Type 1 W< 20 Feet Type 2 W> 20 feet
Type Layout (3) Skew (1) Cover (2)Cost Per Sq. Foot
Area w x L exceeds 0-60 0 to 10' 114.751000 Sq. Feet degrees 10' to 20' 147.25
Type 1 Short Culverts Difficult 0-60 0 to 10' 203.50Conditions under 1000 Square Feet degrees 10' to 20' 235.00Area w x L exceeds 0-60 0 to 10' 121.751000 Sq. Feet degrees 10' to 20' 152.50
Type 2 Short Culverts Difficult 0-60 0 to 10' 203.50Conditions under 1000 Square Feet degrees 10' to 20' 235.00
For skews over 60 degrees it will be necessary to make a special analysis and establish a square meter price comparable to above.
Description Area Computation x Cost per Sq. Foot = Amount0000
Culvert Total = 0
BRIDGESFor the Bridge Sketch see the Construction Cost Estimation Preparation Manual1 to 3 spans and 2 side spans (Max. Span 100 feet)H = Clear Height 14 To 23 feet (4)L = 100 to 400 feet & all viaducts over 400 feet (5)
Class Layout Skew (1) Foundation (2)Cost per Sq. Foot
Width at Least 0 to 40 No Piles 134.75I 45 feet Degrees Piles at Stub Abut. 159.75
Piles at Piers & Stub Abut. 174.7540 to 60 No Piles 145.00Degrees Piles at Stub Abut. 168.25
Piles at Piers & Stub Abut. 181.25
14 Page 38

Class 1 - New Construction
For the Bridge Sketch see the Construction Cost Estimation Preparation Manual1 to 3 spans and 2 side spans (Max. Span 100 feet) (3)H = Clear Height 14 feet (4)L = under 400 feet
Class Layout Skew (1) Foundation (2)Cost per Sq. Foot
L exceeds W 0 to 40 No Piles 176.50II Area L x W Degrees On Piles 187.25
exceeds 4500 40 to 60 No Piles 219.75Sq. Feet Degrees On Piles 273.25W exceeds L 0 to 40 No Piles 226.75
III Area L x W Degrees On Piles 299.25exceeds 4500 40 to 60 No Piles 241.50Sq. Feet Degrees On Piles 310.00Width 30 - 0 to 40 No Piles 295.50
IV 45 feet Degrees On Piles 396.75Area W x L under 40 to 60 No Piles 318.254500 Sq. Foot Degrees On Piles 416.25
For the Bridge Sketch see the Construction Cost Estimation Preparation Manual1 to 2 spans (Max. Span 125 feet)H = Clear Height 14 feet (4)L = 100 to 250 feet
Layout Skew (1) Cost/ Sq. FootWidth at Least 0 to 40 157.0040 feet Degrees 182.00
204.5040 to 60 166.50
Minimum Length Degrees 194.75100 feet 217.50
$0Length Width Cost per SF Bridge Total
1. For skews over 60 degrees it will be necessary to make a special analysis and establish a square foot price comparable to above.
2. For very bad foundation conditions requiring unusual lengths or spacing of piles, it will be necessary to establish a square foot price.
3. For longer spans, adjust the cost per square foot to reflect increased cost of structural members.
4. For span bridges, it is expected the length of the side span will be in- creased in proportion to any increase in height. Because of the resultant increase in deck area, the square foot price will remain approximately the same in the range of heights shown. For extremely high structures (particularly for viaducts), square foot prices will have to be increased.
5. For structures over 400 foot long (viaducts), reduce the cost per square foot if repetitive span length and forming can be used. Reduce by $0.50 for lengths from 400 to 600 feet and by $1.00 for lengths over 600 feet. (Do not forget
adjustments (3) and (4) above on viaducts).
Foundation (2)No Piles
Piles at Piers & Semi-Stub Abut.
Piles at Semi-Stub Abut.Piles at Piers & Semi-Stub Abut.No PilesPiles at Semi-Stub Abut.
14 Page 39
Class 1 - New Construction
6. For statically indeterminate structures, square foot prices will have to be established.
Structure DescriptionCalculated Sq. Foot of Bridge Deck
x Cost Per Square Foot = Amount
000000000000
Sub Total $0Clearing Site Bridge *0-3% of Sub Total 0
%
BRIDGE TOTAL $0*Pick appropriate percent based on the size, type and materials of existing structure
DRAINAGE (includes inlets and cross drains)
Rural 0 364356 0project length (miles) x cost per mile = Amount
Urban 0 544280 0project length (miles) x cost per mile = Amount
The above are the total costs of basins, manholes, longitudinal and transverse pipes, underdrains, headwalls, protecting curbs, aprons, etc. for a divided highway with a depressed median. The costs are assumed to apply to 4, 6 or 8 lane
sections since there will be no appreciable difference in the number of basins or the sizes or lengths of pipes.
Frontage Road & Ramp Drainage
55 423,500x cost per foot = Amount
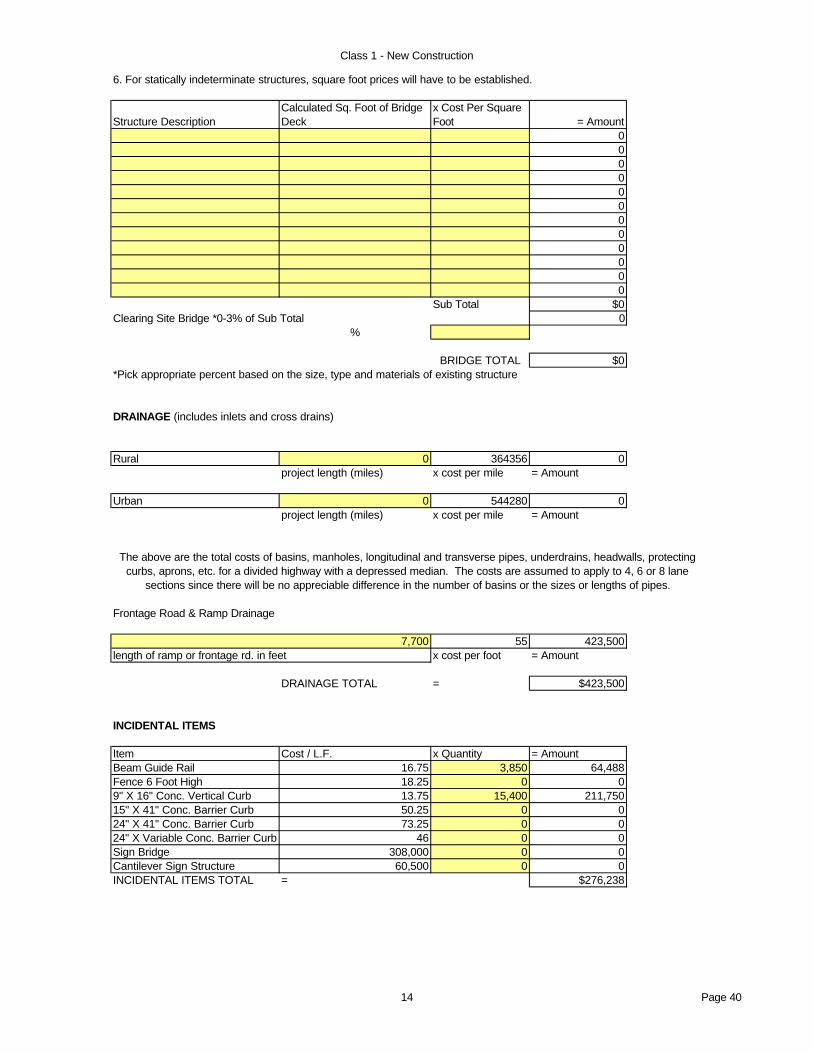
DRAINAGE TOTAL = $423,500
INCIDENTAL ITEMS
Item Cost / L.F. x Quantity = AmountBeam Guide Rail 16.75 3,850 64,488Fence 6 Foot High 18.25 0 09" X 16" Conc. Vertical Curb 13.75 15,400 211,75015" X 41" Conc. Barrier Curb 50.25 0 024" X 41" Conc. Barrier Curb 73.25 0 024" X Variable Conc. Barrier Curb 46 0 0Sign Bridge 308,000 0 0Cantilever Sign Structure 60,500 0 0INCIDENTAL ITEMS TOTAL = $276,238
7,700length of ramp or frontage rd. in feet
14 Page 40

Class 1 - New Construction
LANDSCAPE
Quantity x Unit Prices = AmountTopsoil and Seeding (Mainline) Length of Project in miles 0 112,815 0Planting (Mainline) Length of Project in miles 0 64,500 0Topsoil, Seeding, Planting (Finger Ramp Number of Finger Ramps 0 12,500 0Topsoil, Seeding, Planting (Loop Ramp) Number of Loop Ramps 5 20,000 100,000Topsoil, Seeding (Access Road) Length of Access Road in Feet 0 7.9 0LANDSCAPE TOTAL = $100,000
NOISE ABATEMENT
Unit Quantity x Cost = AmountNoise Wall L.F. 0 305 0
000
NOISE ABATEMENT TOTAL = 0
GENERAL ITEMS
Item Project Length (miles) x Cost/Mile = AmountField Office 1.46 44,260 64,620Materials Field Laboratory 1.46 28,970 42,296Erosion Control during Construction 1.46 64,375 93,988GENERAL ITEMS TOTAL = $200,903
SUMMARY
Route PORTWAY EXTENSIONS Section/Contract #
NJ TURNPIKE INTERCHANGE 14
PM 0 UPC No. 0
Work TypeTotals from other pages
Earthwork 698,619Pavement 976,976Context Sensitive Design 0Culverts 0Bridges 0Drainage 423,500Incidental Items 276,238Landscape 100,000Noise Abatement 0General Items 200,903
PROJECT SUBTOTAL $2,676,236
14 Page 41

Class 1 - New Construction
Other Items Proj. Subtotal Range Choice AmountLighting, Traffic Stripes, Signs and Delineators
3% of Proj. Subtotal 80,287
Maintenance of Traffic1.5% of Proj. Subtotal 40,144
Training1% of Proj. Subtotal 26,762
Mobilization 240,861
Project Cost < 5.0 (Mil.)9% of Proj. Subtotal 240861
Project Cost 5.0 & above10% of Proj. Subtotal 0
Progress Schedule Project Cost(Mil.) $ 6,000Less than 2.0 0 02.0 to 5.0 6,000 60005.0 to 10.0 8,000 010.0 to 20.0 15,000 020.0 to 30.0 30,000 030.0 to 40.0 40,000 040.0 & above 58,000 0
Clearing Site Project Cost (Mil.) $ 45,000Less than 1.0 15,000 01.0 to 2.0 30,000 02.0 to 5.0 45,000 450005.0 to 10.0 115,000 010.0 to 20.0 220,000 020.0 to 30.0 240,000 030.0 to 40.0 250,000 040.0 & above 490,000 0
Construction Layout Project Cost(Mil.) $ 42,000Less than 1.0 7,000 01.0 to 2.0 20,000 02.0 to 5.0 42,000 420005.0 to 10.0 87,000 010.0 to 20.0 160,000 020.0 to 30.0 220,000 030.0 to 40.0 490,000 040.0 & above 890,000 0
PROJECT TOTAL $3,157,290
14 Page 42

Class 1 - New Construction
CONTINGENCIES & ESCALATION YY = Number of Years until midpoint of construction duration plus
number of years until construction start. If midpoint is less than 2 years from the date of this estimate, no escalation is required.
Maximum value = 10%
0.00
2.00
3157289.991 1.030 1.00 $3,252,009Project Total Contingencies (1+C) 1 + [0.01 (Y+1) (Y-
2)]Construction Estimate for PD
Project Cost(Mil.) Contingencies (C) Percent
Average Construction Duration in Years
0-10 3% 1 0.03010-20 2.50% 2 0.00020-50 2% 3 0.000Over 50 1.50% 4 0.000
CONSTRUCTION ENGINEERING (CE)
Project Cost (Mil.)% of Construction Cost
Less than 1.0 28.40% 01.0 to 5.0 17.60% 5723545.0 to 10.0 12.20% 010.0 & above 9.50% 0CONSTRUCTION ENGINEERING AMOUNT $572,353.53
CONSTRUCTION CHANGE ORDER CONTINGENCIES
Total Federal Participating Items in Millions of $ Construction Change Order Contingency Amount$0 to 0.1 $6,000 00.1 to 0.5 25,000 00.5 to 5.0 25,000 + 4% of amount in excess of $500,000 1351005.0 to 10.0 205,000 + 3% of amount in excess of $5,000,000 010.0 to 15.0 355,000 + 2% of amount in excess of $10,000,000 015.0 and above 455,000 + 1.5% of amount in excess of $15,000,000 - $500,000 max 0
0For State Funded Projects, Contingencies for Change orders = 0CHANGE ORDER CONTINGENCY AMOUNT = $135,100
UTILITIES RELOCATIONS BY COMPANIES/OWNERS
$3,252,009 0.09 $292,681 x % or + Estimate =
Construction Cost for Initial Estimate
Use % or utilities detailed estimate
Utility Relocation Cost for Initial Estimate
If there are no utility relocations on the project indicate “No Utilities” in the box above.
RIGHT OF WAY COSTIf there is no ROW cost on the project indicate “No ROW” the box
SUMMARYConstruction Estimate for Initial 3,252,009Construction Engineering (CE) 572,354Contingencies 135,100Utilities Relocations 292,681Total Construction Cost $4,252,143
Right of Way Cost 0
14 Page 43
Class 1 - New Construction
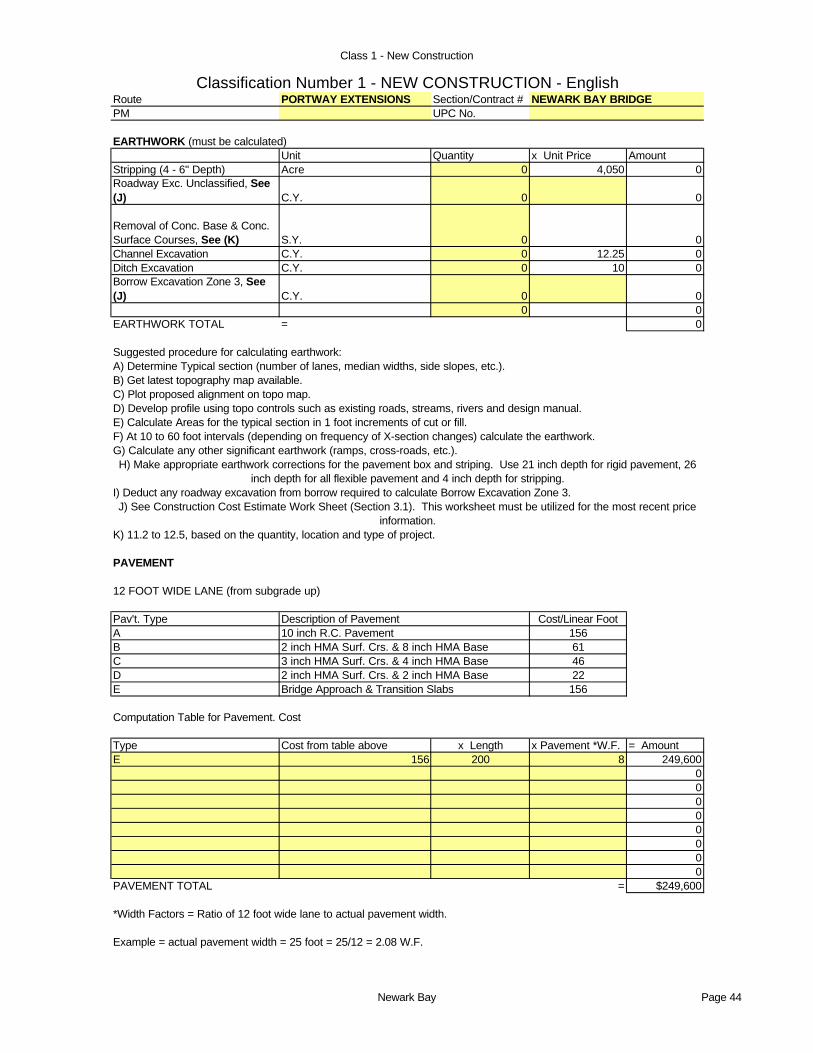
Classification Number 1 - NEW CONSTRUCTION - EnglishRoute PORTWAY EXTENSIONS Section/Contract # NEWARK BAY BRIDGEPM UPC No.
EARTHWORK (must be calculated)Unit Quantity x Unit Price Amount
Stripping (4 - 6" Depth) Acre 0 4,050 0Roadway Exc. Unclassified, See (J) C.Y. 0 0
Removal of Conc. Base & Conc. Surface Courses, See (K) S.Y. 0 0Channel Excavation C.Y. 0 12.25 0Ditch Excavation C.Y. 0 10 0Borrow Excavation Zone 3, See (J) C.Y. 0 0
0 0EARTHWORK TOTAL = 0
Suggested procedure for calculating earthwork:A) Determine Typical section (number of lanes, median widths, side slopes, etc.).B) Get latest topography map available.C) Plot proposed alignment on topo map.D) Develop profile using topo controls such as existing roads, streams, rivers and design manual.E) Calculate Areas for the typical section in 1 foot increments of cut or fill.F) At 10 to 60 foot intervals (depending on frequency of X-section changes) calculate the earthwork.G) Calculate any other significant earthwork (ramps, cross-roads, etc.).H) Make appropriate earthwork corrections for the pavement box and striping. Use 21 inch depth for rigid pavement, 26
inch depth for all flexible pavement and 4 inch depth for stripping.I) Deduct any roadway excavation from borrow required to calculate Borrow Excavation Zone 3.J) See Construction Cost Estimate Work Sheet (Section 3.1). This worksheet must be utilized for the most recent price
information.K) 11.2 to 12.5, based on the quantity, location and type of project.
PAVEMENT
12 FOOT WIDE LANE (from subgrade up)
Pav't. Type Cost/Linear FootA 156B 61C 46D 22E 156
Computation Table for Pavement. Cost
Type Cost from table above x Length x Pavement *W.F. = AmountE 156 200 8 249,600
00000000
PAVEMENT TOTAL = $249,600
*Width Factors = Ratio of 12 foot wide lane to actual pavement width.
Example = actual pavement width = 25 foot = 25/12 = 2.08 W.F.
Description of Pavement10 inch R.C. Pavement2 inch HMA Surf. Crs. & 8 inch HMA Base3 inch HMA Surf. Crs. & 4 inch HMA Base2 inch HMA Surf. Crs. & 2 inch HMA BaseBridge Approach & Transition Slabs
Newark Bay Page 44

Class 1 - New Construction
CONTEXT SENSITIVE DESIGN
Attach additional sheet detailing items and costs of context sensitive design work =
CULVERTS
///////////////////////////////////////////////////////////////////////////////////////////////////////////////////COVER
<-----------------W----------------> <-------------------W-------------------->Type 1 W< 20 Feet Type 2 W> 20 feet
Type Layout (3) Skew (1) Cover (2)Cost Per Sq. Foot
Area w x L exceeds 0-60 0 to 10' 114.751000 Sq. Feet degrees 10' to 20' 147.25
Type 1 Short Culverts Difficult 0-60 0 to 10' 203.50Conditions under 1000 Square Feet degrees 10' to 20' 235.00Area w x L exceeds 0-60 0 to 10' 121.751000 Sq. Feet degrees 10' to 20' 152.50
Type 2 Short Culverts Difficult 0-60 0 to 10' 203.50Conditions under 1000 Square Feet degrees 10' to 20' 235.00
For skews over 60 degrees it will be necessary to make a special analysis and establish a square meter price comparable to above.
Description Area Computation x Cost per Sq. Foot = Amount0000
Culvert Total = 0
BRIDGESFor the Bridge Sketch see the Construction Cost Estimation Preparation Manual1 to 3 spans and 2 side spans (Max. Span 100 feet)H = Clear Height 14 To 23 feet (4)L = 100 to 400 feet & all viaducts over 400 feet (5)
Class Layout Skew (1) Foundation (2)Cost per Sq. Foot
Width at Least 0 to 40 No Piles 134.75I 45 feet Degrees Piles at Stub Abut. 159.75
Piles at Piers & Stub Abut. 174.7540 to 60 No Piles 145.00Degrees Piles at Stub Abut. 168.25
Piles at Piers & Stub Abut. 181.25
Newark Bay Page 45
Class 1 - New Construction
For the Bridge Sketch see the Construction Cost Estimation Preparation Manual1 to 3 spans and 2 side spans (Max. Span 100 feet) (3)H = Clear Height 14 feet (4)L = under 400 feet
Class Layout Skew (1) Foundation (2)Cost per Sq. Foot
L exceeds W 0 to 40 No Piles 176.50II Area L x W Degrees On Piles 187.25
exceeds 4500 40 to 60 No Piles 219.75Sq. Feet Degrees On Piles 273.25W exceeds L 0 to 40 No Piles 226.75
III Area L x W Degrees On Piles 299.25exceeds 4500 40 to 60 No Piles 241.50Sq. Feet Degrees On Piles 310.00Width 30 - 0 to 40 No Piles 295.50
IV 45 feet Degrees On Piles 396.75Area W x L under 40 to 60 No Piles 318.254500 Sq. Foot Degrees On Piles 416.25
For the Bridge Sketch see the Construction Cost Estimation Preparation Manual1 to 2 spans (Max. Span 125 feet)H = Clear Height 14 feet (4)L = 100 to 250 feet
Layout Skew (1) Cost/ Sq. FootWidth at Least 0 to 40 157.0040 feet Degrees 182.00
204.5040 to 60 166.50
Minimum Length Degrees 194.75100 feet 217.50
4,564 96 300 $131,443,200Length Width Cost per SF Bridge Total
1. For skews over 60 degrees it will be necessary to make a special analysis and establish a square foot price comparable to above.
2. For very bad foundation conditions requiring unusual lengths or spacing of piles, it will be necessary to establish a square foot price.
3. For longer spans, adjust the cost per square foot to reflect increased cost of structural members.
4. For span bridges, it is expected the length of the side span will be in- creased in proportion to any increase in height. Because of the resultant increase in deck area, the square foot price will remain approximately the same in the range of heights shown. For extremely high structures (particularly for viaducts), square foot prices will have to be increased.
5. For structures over 400 foot long (viaducts), reduce the cost per square foot if repetitive span length and forming can be used. Reduce by $0.50 for lengths from 400 to 600 feet and by $1.00 for lengths over 600 feet. (Do not forget
adjustments (3) and (4) above on viaducts).
Foundation (2)No Piles
Piles at Piers & Semi-Stub Abut.
Piles at Semi-Stub Abut.Piles at Piers & Semi-Stub Abut.No PilesPiles at Semi-Stub Abut.
Newark Bay Page 46

Class 1 - New Construction
6. For statically indeterminate structures, square foot prices will have to be established.
Structure DescriptionCalculated Sq. Foot of Bridge Deck
x Cost Per Square Foot = Amount
000000000000
Sub Total 0Clearing Site Bridge *0-3% of Sub Total 0
%
BRIDGE TOTAL 0*Pick appropriate percent based on the size, type and materials of existing structure
DRAINAGE (includes inlets and cross drains)
Rural 0 364356 0project length (miles) x cost per mile = Amount
Urban 0 544280 0project length (miles) x cost per mile = Amount
The above are the total costs of basins, manholes, longitudinal and transverse pipes, underdrains, headwalls, protecting curbs, aprons, etc. for a divided highway with a depressed median. The costs are assumed to apply to 4, 6 or 8 lane
sections since there will be no appreciable difference in the number of basins or the sizes or lengths of pipes.
Frontage Road & Ramp Drainage
55 0x cost per foot = Amount
DRAINAGE TOTAL = 0
INCIDENTAL ITEMS
Item Cost / L.F. x Quantity = AmountBeam Guide Rail 16.75 0 0Fence 6 Foot High 18.25 0 09" X 16" Conc. Vertical Curb 13.75 0 015" X 41" Conc. Barrier Curb 50.25 0 024" X 41" Conc. Barrier Curb 73.25 0 024" X Variable Conc. Barrier Curb 46 0 0Sign Bridge 308,000 0 0Cantilever Sign Structure 60,500 0 0INCIDENTAL ITEMS TOTAL = 0
0length of ramp or frontage rd. in feet
Newark Bay Page 47
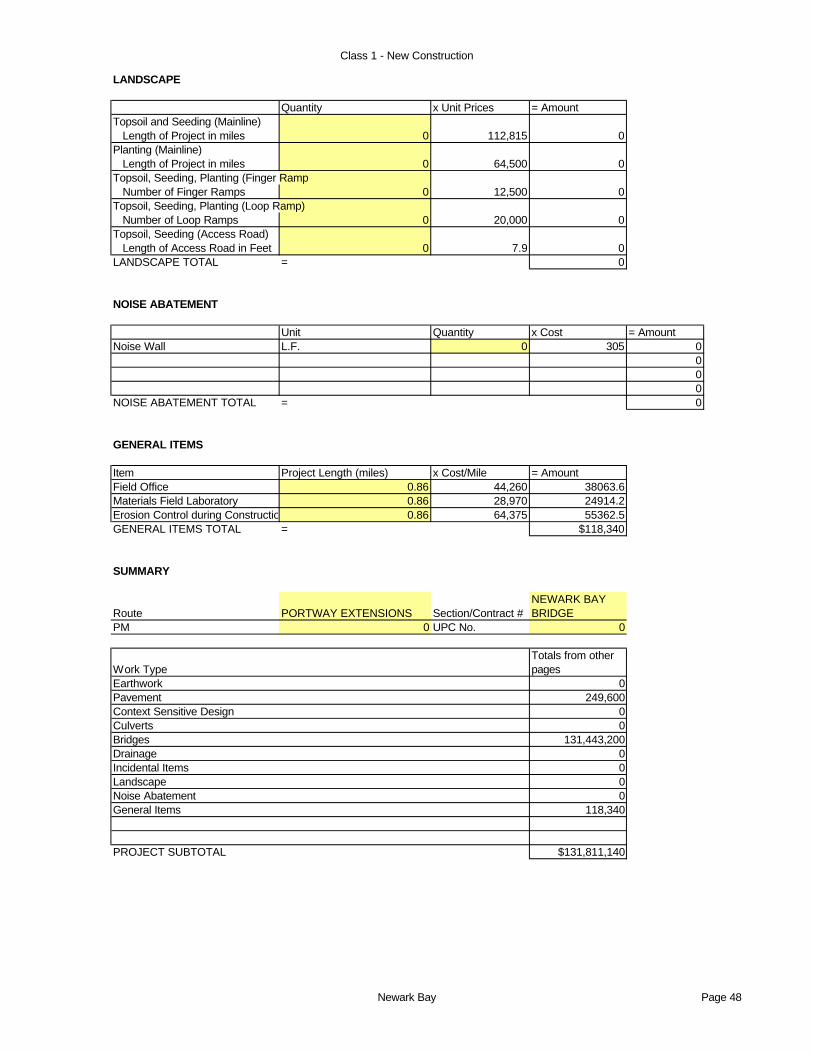
Class 1 - New Construction
LANDSCAPE
Quantity x Unit Prices = AmountTopsoil and Seeding (Mainline) Length of Project in miles 0 112,815 0Planting (Mainline) Length of Project in miles 0 64,500 0Topsoil, Seeding, Planting (Finger Ramp Number of Finger Ramps 0 12,500 0Topsoil, Seeding, Planting (Loop Ramp) Number of Loop Ramps 0 20,000 0Topsoil, Seeding (Access Road) Length of Access Road in Feet 0 7.9 0LANDSCAPE TOTAL = 0
NOISE ABATEMENT
Unit Quantity x Cost = AmountNoise Wall L.F. 0 305 0
000
NOISE ABATEMENT TOTAL = 0
GENERAL ITEMS
Item Project Length (miles) x Cost/Mile = AmountField Office 0.86 44,260 38063.6Materials Field Laboratory 0.86 28,970 24914.2Erosion Control during Construction 0.86 64,375 55362.5GENERAL ITEMS TOTAL = $118,340
SUMMARY
Route PORTWAY EXTENSIONS Section/Contract #NEWARK BAY BRIDGE
PM 0 UPC No. 0
Work TypeTotals from other pages
Earthwork 0Pavement 249,600Context Sensitive Design 0Culverts 0Bridges 131,443,200Drainage 0Incidental Items 0Landscape 0Noise Abatement 0General Items 118,340
PROJECT SUBTOTAL $131,811,140
Newark Bay Page 48
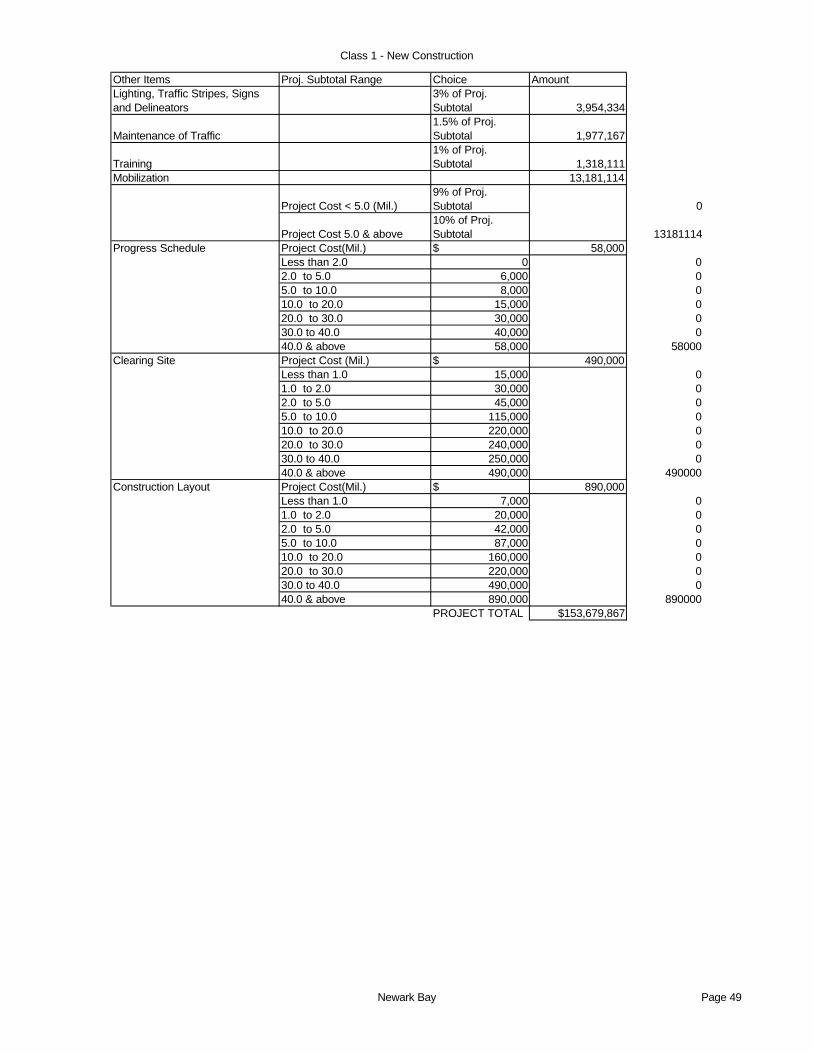
Class 1 - New Construction
Other Items Proj. Subtotal Range Choice AmountLighting, Traffic Stripes, Signs and Delineators
3% of Proj. Subtotal 3,954,334
Maintenance of Traffic1.5% of Proj. Subtotal 1,977,167
Training1% of Proj. Subtotal 1,318,111
Mobilization 13,181,114
Project Cost < 5.0 (Mil.)9% of Proj. Subtotal 0
Project Cost 5.0 & above10% of Proj. Subtotal 13181114
Progress Schedule Project Cost(Mil.) $ 58,000Less than 2.0 0 02.0 to 5.0 6,000 05.0 to 10.0 8,000 010.0 to 20.0 15,000 020.0 to 30.0 30,000 030.0 to 40.0 40,000 040.0 & above 58,000 58000
Clearing Site Project Cost (Mil.) $ 490,000Less than 1.0 15,000 01.0 to 2.0 30,000 02.0 to 5.0 45,000 05.0 to 10.0 115,000 010.0 to 20.0 220,000 020.0 to 30.0 240,000 030.0 to 40.0 250,000 040.0 & above 490,000 490000
Construction Layout Project Cost(Mil.) $ 890,000Less than 1.0 7,000 01.0 to 2.0 20,000 02.0 to 5.0 42,000 05.0 to 10.0 87,000 010.0 to 20.0 160,000 020.0 to 30.0 220,000 030.0 to 40.0 490,000 040.0 & above 890,000 890000
PROJECT TOTAL $153,679,867
Newark Bay Page 49
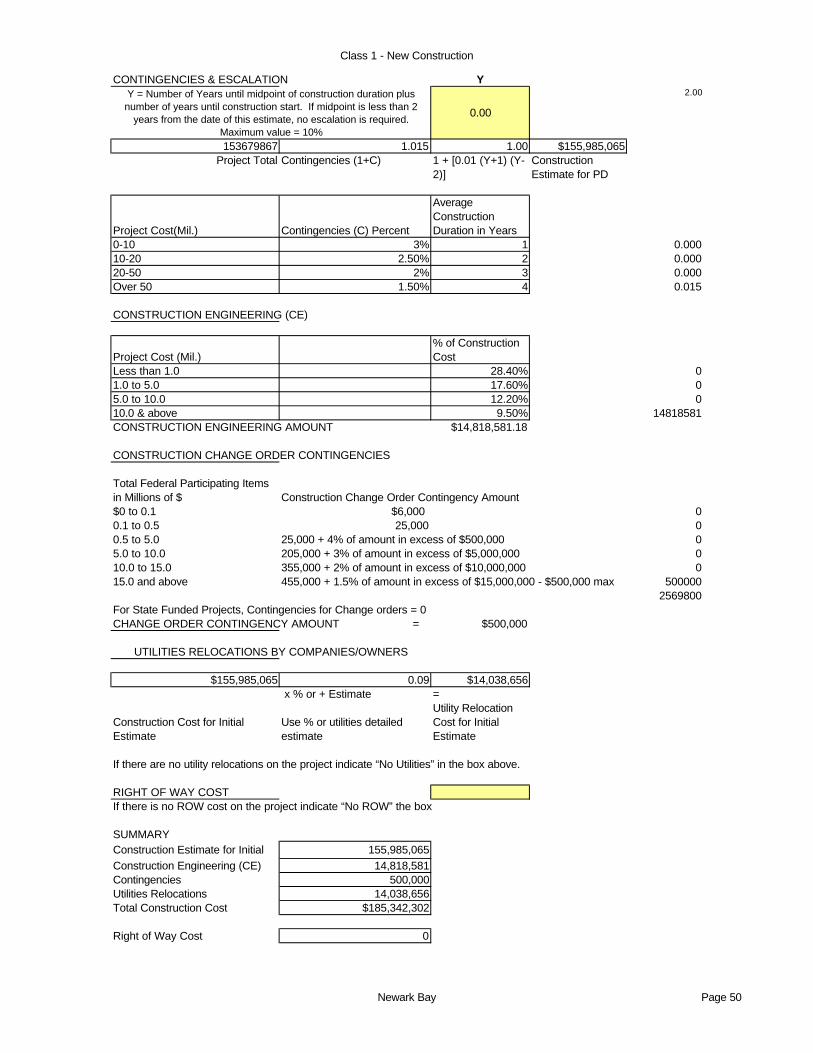
Class 1 - New Construction
CONTINGENCIES & ESCALATION YY = Number of Years until midpoint of construction duration plus
number of years until construction start. If midpoint is less than 2 years from the date of this estimate, no escalation is required.
Maximum value = 10%
0.00
2.00
153679867 1.015 1.00 $155,985,065Project Total Contingencies (1+C) 1 + [0.01 (Y+1) (Y-
2)]Construction Estimate for PD
Project Cost(Mil.) Contingencies (C) Percent
Average Construction Duration in Years
0-10 3% 1 0.00010-20 2.50% 2 0.00020-50 2% 3 0.000Over 50 1.50% 4 0.015
CONSTRUCTION ENGINEERING (CE)
Project Cost (Mil.)% of Construction Cost
Less than 1.0 28.40% 01.0 to 5.0 17.60% 05.0 to 10.0 12.20% 010.0 & above 9.50% 14818581CONSTRUCTION ENGINEERING AMOUNT $14,818,581.18
CONSTRUCTION CHANGE ORDER CONTINGENCIES
Total Federal Participating Items in Millions of $ Construction Change Order Contingency Amount$0 to 0.1 $6,000 00.1 to 0.5 25,000 00.5 to 5.0 25,000 + 4% of amount in excess of $500,000 05.0 to 10.0 205,000 + 3% of amount in excess of $5,000,000 010.0 to 15.0 355,000 + 2% of amount in excess of $10,000,000 015.0 and above 455,000 + 1.5% of amount in excess of $15,000,000 - $500,000 max 500000
2569800For State Funded Projects, Contingencies for Change orders = 0CHANGE ORDER CONTINGENCY AMOUNT = $500,000
UTILITIES RELOCATIONS BY COMPANIES/OWNERS
$155,985,065 0.09 $14,038,656 x % or + Estimate =
Construction Cost for Initial Estimate
Use % or utilities detailed estimate
Utility Relocation Cost for Initial Estimate
If there are no utility relocations on the project indicate “No Utilities” in the box above.
RIGHT OF WAY COSTIf there is no ROW cost on the project indicate “No ROW” the box
SUMMARYConstruction Estimate for Initial 155,985,065Construction Engineering (CE) 14,818,581Contingencies 500,000Utilities Relocations 14,038,656Total Construction Cost $185,342,302
Right of Way Cost 0
Newark Bay Page 50

Class 1 - New Construction
Classification Number 1 - NEW CONSTRUCTION - EnglishRoute PORTWAY EXTENSIONS Section/Contract # BAYONNE BRIDGEPM UPC No.
EARTHWORK (must be calculated)Unit Quantity x Unit Price Amount
Stripping (4 - 6" Depth) Acre 0 4,050 0Roadway Exc. Unclassified, See (J) C.Y. 0 0
Removal of Conc. Base & Conc. Surface Courses, See (K) S.Y. 0 0Channel Excavation C.Y. 0 12.25 0Ditch Excavation C.Y. 0 10 0Borrow Excavation Zone 3, See (J) C.Y. 0 0
0 0EARTHWORK TOTAL = 0
Suggested procedure for calculating earthwork:A) Determine Typical section (number of lanes, median widths, side slopes, etc.).B) Get latest topography map available.C) Plot proposed alignment on topo map.D) Develop profile using topo controls such as existing roads, streams, rivers and design manual.E) Calculate Areas for the typical section in 1 foot increments of cut or fill.F) At 10 to 60 foot intervals (depending on frequency of X-section changes) calculate the earthwork.G) Calculate any other significant earthwork (ramps, cross-roads, etc.).H) Make appropriate earthwork corrections for the pavement box and striping. Use 21 inch depth for rigid pavement, 26
inch depth for all flexible pavement and 4 inch depth for stripping.I) Deduct any roadway excavation from borrow required to calculate Borrow Excavation Zone 3.J) See Construction Cost Estimate Work Sheet (Section 3.1). This worksheet must be utilized for the most recent price
information.K) 11.2 to 12.5, based on the quantity, location and type of project.
PAVEMENT
12 FOOT WIDE LANE (from subgrade up)
Pav't. Type Cost/Linear FootA 156B 61C 46D 22E 156
Computation Table for Pavement. Cost
Type Cost from table above x Length x Pavement *W.F. = AmountE 156 200 8 249,600
00000000
PAVEMENT TOTAL = $249,600
*Width Factors = Ratio of 12 foot wide lane to actual pavement width.
Example = actual pavement width = 25 foot = 25/12 = 2.08 W.F.
Description of Pavement10 inch R.C. Pavement2 inch HMA Surf. Crs. & 8 inch HMA Base3 inch HMA Surf. Crs. & 4 inch HMA Base2 inch HMA Surf. Crs. & 2 inch HMA BaseBridge Approach & Transition Slabs
Bayonne Bridge Page 51
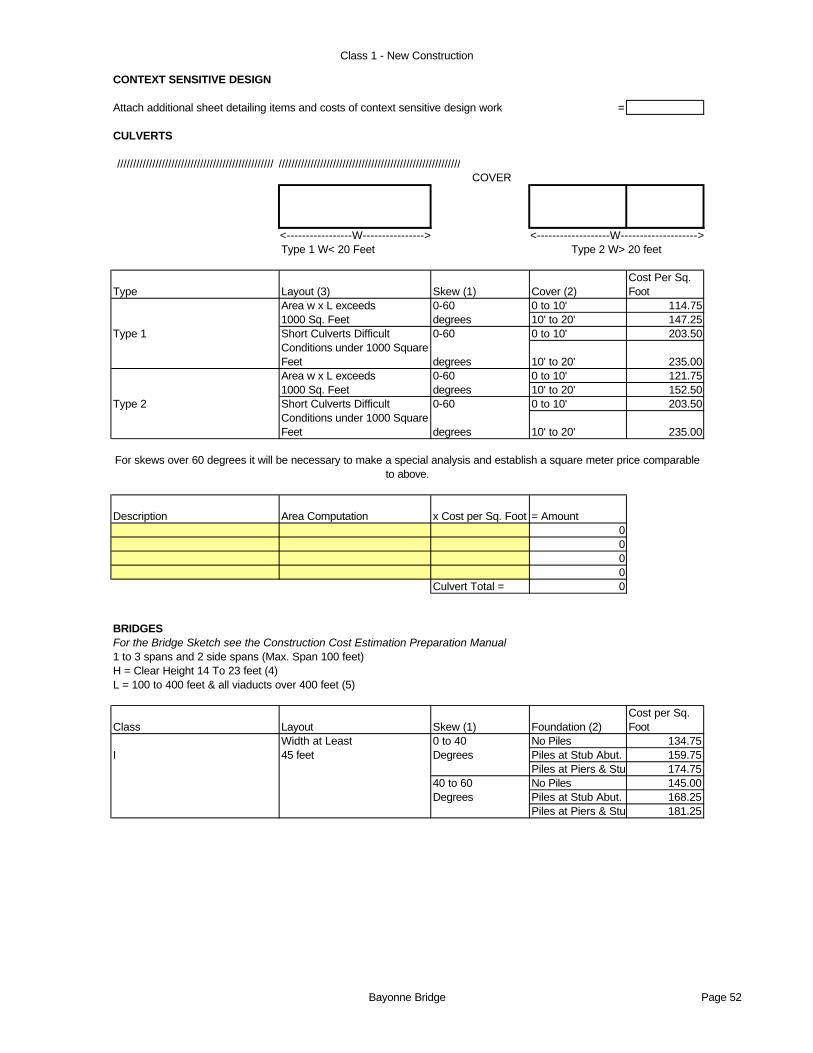
Class 1 - New Construction
CONTEXT SENSITIVE DESIGN
Attach additional sheet detailing items and costs of context sensitive design work =
CULVERTS
///////////////////////////////////////////////////////////////////////////////////////////////////////////////////COVER
<-----------------W----------------> <-------------------W-------------------->Type 1 W< 20 Feet Type 2 W> 20 feet
Type Layout (3) Skew (1) Cover (2)Cost Per Sq. Foot
Area w x L exceeds 0-60 0 to 10' 114.751000 Sq. Feet degrees 10' to 20' 147.25
Type 1 Short Culverts Difficult 0-60 0 to 10' 203.50Conditions under 1000 Square Feet degrees 10' to 20' 235.00Area w x L exceeds 0-60 0 to 10' 121.751000 Sq. Feet degrees 10' to 20' 152.50
Type 2 Short Culverts Difficult 0-60 0 to 10' 203.50Conditions under 1000 Square Feet degrees 10' to 20' 235.00
For skews over 60 degrees it will be necessary to make a special analysis and establish a square meter price comparable to above.
Description Area Computation x Cost per Sq. Foot = Amount0000
Culvert Total = 0
BRIDGESFor the Bridge Sketch see the Construction Cost Estimation Preparation Manual1 to 3 spans and 2 side spans (Max. Span 100 feet)H = Clear Height 14 To 23 feet (4)L = 100 to 400 feet & all viaducts over 400 feet (5)
Class Layout Skew (1) Foundation (2)Cost per Sq. Foot
Width at Least 0 to 40 No Piles 134.75I 45 feet Degrees Piles at Stub Abut. 159.75
Piles at Piers & Stub Abut. 174.7540 to 60 No Piles 145.00Degrees Piles at Stub Abut. 168.25
Piles at Piers & Stub Abut. 181.25
Bayonne Bridge Page 52

Class 1 - New Construction
For the Bridge Sketch see the Construction Cost Estimation Preparation Manual1 to 3 spans and 2 side spans (Max. Span 100 feet) (3)H = Clear Height 14 feet (4)L = under 400 feet
Class Layout Skew (1) Foundation (2)Cost per Sq. Foot
L exceeds W 0 to 40 No Piles 176.50II Area L x W Degrees On Piles 187.25
exceeds 4500 40 to 60 No Piles 219.75Sq. Feet Degrees On Piles 273.25W exceeds L 0 to 40 No Piles 226.75
III Area L x W Degrees On Piles 299.25exceeds 4500 40 to 60 No Piles 241.50Sq. Feet Degrees On Piles 310.00Width 30 - 0 to 40 No Piles 295.50
IV 45 feet Degrees On Piles 396.75Area W x L under 40 to 60 No Piles 318.254500 Sq. Foot Degrees On Piles 416.25
For the Bridge Sketch see the Construction Cost Estimation Preparation Manual1 to 2 spans (Max. Span 125 feet)H = Clear Height 14 feet (4)L = 100 to 250 feet
Layout Skew (1) Cost/ Sq. FootWidth at Least 0 to 40 157.0040 feet Degrees 182.00
204.5040 to 60 166.50
Minimum Length Degrees 194.75100 feet 217.50
4,818 96 300 $138,758,400Length Width Cost per SF Bridge Total
1. For skews over 60 degrees it will be necessary to make a special analysis and establish a square foot price comparable to above.
2. For very bad foundation conditions requiring unusual lengths or spacing of piles, it will be necessary to establish a square foot price.
3. For longer spans, adjust the cost per square foot to reflect increased cost of structural members.
4. For span bridges, it is expected the length of the side span will be in- creased in proportion to any increase in height. Because of the resultant increase in deck area, the square foot price will remain approximately the same in the range of heights shown. For extremely high structures (particularly for viaducts), square foot prices will have to be increased.
5. For structures over 400 foot long (viaducts), reduce the cost per square foot if repetitive span length and forming can be used. Reduce by $0.50 for lengths from 400 to 600 feet and by $1.00 for lengths over 600 feet. (Do not forget
adjustments (3) and (4) above on viaducts).
Foundation (2)No Piles
Piles at Piers & Semi-Stub Abut.
Piles at Semi-Stub Abut.Piles at Piers & Semi-Stub Abut.No PilesPiles at Semi-Stub Abut.
Bayonne Bridge Page 53
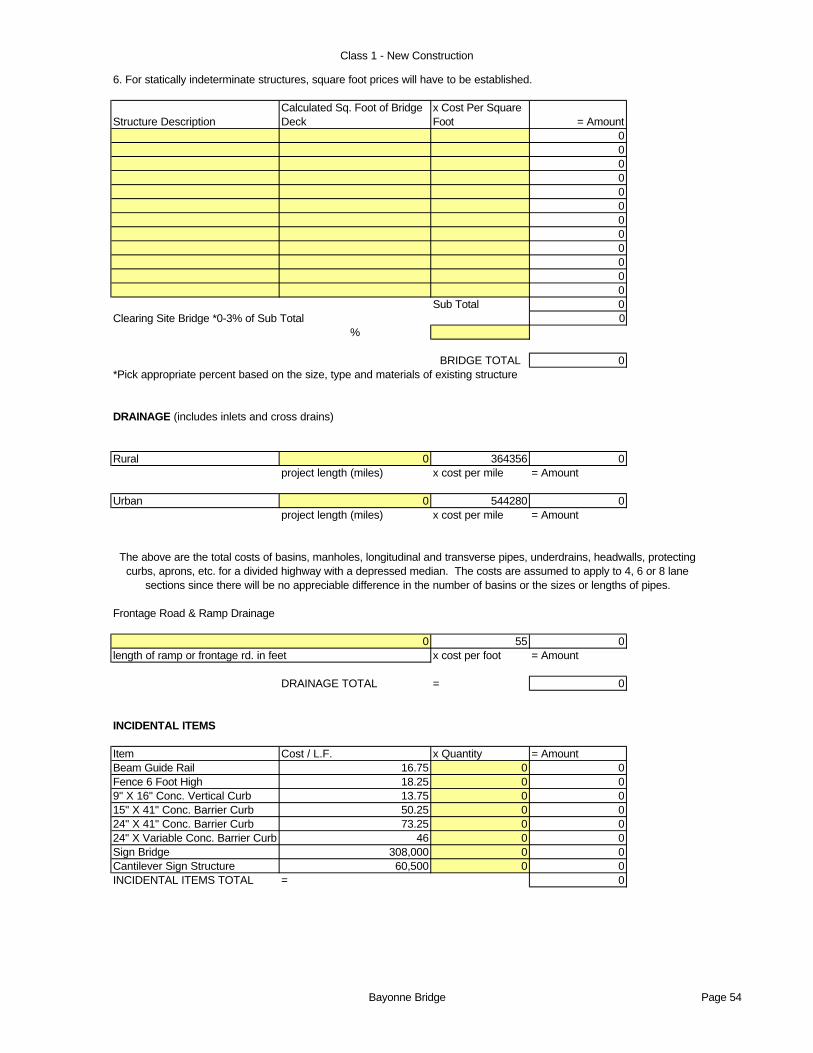
Class 1 - New Construction
6. For statically indeterminate structures, square foot prices will have to be established.
Structure DescriptionCalculated Sq. Foot of Bridge Deck
x Cost Per Square Foot = Amount
000000000000
Sub Total 0Clearing Site Bridge *0-3% of Sub Total 0
%
BRIDGE TOTAL 0*Pick appropriate percent based on the size, type and materials of existing structure
DRAINAGE (includes inlets and cross drains)
Rural 0 364356 0project length (miles) x cost per mile = Amount
Urban 0 544280 0project length (miles) x cost per mile = Amount
The above are the total costs of basins, manholes, longitudinal and transverse pipes, underdrains, headwalls, protecting curbs, aprons, etc. for a divided highway with a depressed median. The costs are assumed to apply to 4, 6 or 8 lane
sections since there will be no appreciable difference in the number of basins or the sizes or lengths of pipes.
Frontage Road & Ramp Drainage
55 0x cost per foot = Amount
DRAINAGE TOTAL = 0
INCIDENTAL ITEMS
Item Cost / L.F. x Quantity = AmountBeam Guide Rail 16.75 0 0Fence 6 Foot High 18.25 0 09" X 16" Conc. Vertical Curb 13.75 0 015" X 41" Conc. Barrier Curb 50.25 0 024" X 41" Conc. Barrier Curb 73.25 0 024" X Variable Conc. Barrier Curb 46 0 0Sign Bridge 308,000 0 0Cantilever Sign Structure 60,500 0 0INCIDENTAL ITEMS TOTAL = 0
0length of ramp or frontage rd. in feet
Bayonne Bridge Page 54

Class 1 - New Construction
LANDSCAPE
Quantity x Unit Prices = AmountTopsoil and Seeding (Mainline) Length of Project in miles 0 112,815 0Planting (Mainline) Length of Project in miles 0 64,500 0Topsoil, Seeding, Planting (Finger Ramp Number of Finger Ramps 0 12,500 0Topsoil, Seeding, Planting (Loop Ramp) Number of Loop Ramps 0 20,000 0Topsoil, Seeding (Access Road) Length of Access Road in Feet 0 7.9 0LANDSCAPE TOTAL = 0
NOISE ABATEMENT
Unit Quantity x Cost = AmountNoise Wall L.F. 0 305 0
000
NOISE ABATEMENT TOTAL = 0
GENERAL ITEMS
Item Project Length (miles) x Cost/Mile = AmountField Office 0.91 44,260 40276.6Materials Field Laboratory 0.91 28,970 26362.7Erosion Control during Construction 0.91 64,375 58581.25GENERAL ITEMS TOTAL = $125,221
SUMMARY
Route PORTWAY EXTENSIONS Section/Contract #BAYONNE BRIDGE
PM 0 UPC No. 0
Work TypeTotals from other pages
Earthwork 0Pavement 249,600Context Sensitive Design 0Culverts 0Bridges 138,758,400Drainage 0Incidental Items 0Landscape 0Noise Abatement 0General Items 125,221
PROJECT SUBTOTAL $139,133,221
Bayonne Bridge Page 55
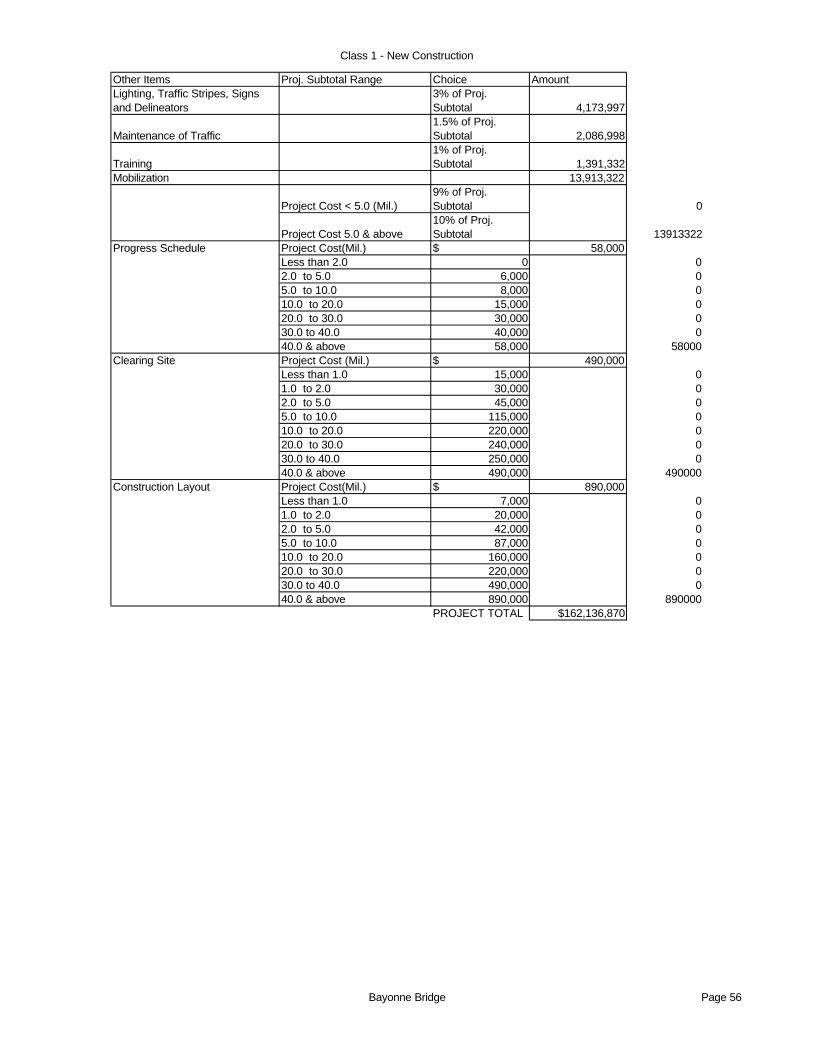
Class 1 - New Construction
Other Items Proj. Subtotal Range Choice AmountLighting, Traffic Stripes, Signs and Delineators
3% of Proj. Subtotal 4,173,997
Maintenance of Traffic1.5% of Proj. Subtotal 2,086,998
Training1% of Proj. Subtotal 1,391,332
Mobilization 13,913,322
Project Cost < 5.0 (Mil.)9% of Proj. Subtotal 0
Project Cost 5.0 & above10% of Proj. Subtotal 13913322
Progress Schedule Project Cost(Mil.) $ 58,000Less than 2.0 0 02.0 to 5.0 6,000 05.0 to 10.0 8,000 010.0 to 20.0 15,000 020.0 to 30.0 30,000 030.0 to 40.0 40,000 040.0 & above 58,000 58000
Clearing Site Project Cost (Mil.) $ 490,000Less than 1.0 15,000 01.0 to 2.0 30,000 02.0 to 5.0 45,000 05.0 to 10.0 115,000 010.0 to 20.0 220,000 020.0 to 30.0 240,000 030.0 to 40.0 250,000 040.0 & above 490,000 490000
Construction Layout Project Cost(Mil.) $ 890,000Less than 1.0 7,000 01.0 to 2.0 20,000 02.0 to 5.0 42,000 05.0 to 10.0 87,000 010.0 to 20.0 160,000 020.0 to 30.0 220,000 030.0 to 40.0 490,000 040.0 & above 890,000 890000
PROJECT TOTAL $162,136,870
Bayonne Bridge Page 56

Class 1 - New Construction
CONTINGENCIES & ESCALATION YY = Number of Years until midpoint of construction duration plus
number of years until construction start. If midpoint is less than 2 years from the date of this estimate, no escalation is required.
Maximum value = 10%
0.00
2.00
162136869.7 1.015 1.00 $164,568,923Project Total Contingencies (1+C) 1 + [0.01 (Y+1) (Y-
2)]Construction Estimate for PD
Project Cost(Mil.) Contingencies (C) Percent
Average Construction Duration in Years
0-10 3% 1 0.00010-20 2.50% 2 0.00020-50 2% 3 0.000Over 50 1.50% 4 0.015
CONSTRUCTION ENGINEERING (CE)
Project Cost (Mil.)% of Construction Cost
Less than 1.0 28.40% 01.0 to 5.0 17.60% 05.0 to 10.0 12.20% 010.0 & above 9.50% 15634048CONSTRUCTION ENGINEERING AMOUNT $15,634,047.66
CONSTRUCTION CHANGE ORDER CONTINGENCIES
Total Federal Participating Items in Millions of $ Construction Change Order Contingency Amount$0 to 0.1 $6,000 00.1 to 0.5 25,000 00.5 to 5.0 25,000 + 4% of amount in excess of $500,000 05.0 to 10.0 205,000 + 3% of amount in excess of $5,000,000 010.0 to 15.0 355,000 + 2% of amount in excess of $10,000,000 015.0 and above 455,000 + 1.5% of amount in excess of $15,000,000 - $500,000 max 500000
2698500For State Funded Projects, Contingencies for Change orders = 0CHANGE ORDER CONTINGENCY AMOUNT = $500,000
UTILITIES RELOCATIONS BY COMPANIES/OWNERS
$164,568,923 0.09 $14,811,203 x % or + Estimate =
Construction Cost for Initial Estimate
Use % or utilities detailed estimate
Utility Relocation Cost for Initial Estimate
If there are no utility relocations on the project indicate “No Utilities” in the box above.
RIGHT OF WAY COSTIf there is no ROW cost on the project indicate “No ROW” the box
SUMMARYConstruction Estimate for Initial 164,568,923Construction Engineering (CE) 15,634,048Contingencies 500,000Utilities Relocations 14,811,203Total Construction Cost $195,514,173
Right of Way Cost 0
Bayonne Bridge Page 57
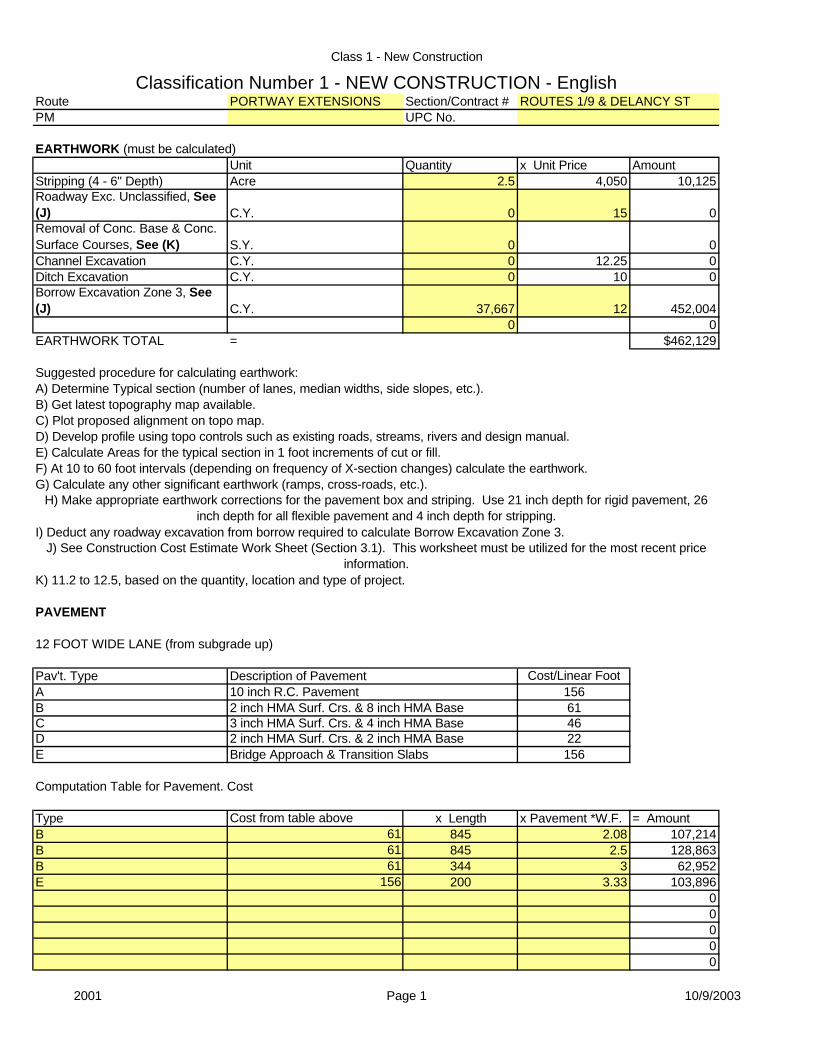
Class 1 - New Construction
Classification Number 1 - NEW CONSTRUCTION - EnglishRoute PORTWAY EXTENSIONS Section/Contract # ROUTES 1/9 & DELANCY STPM UPC No.
EARTHWORK (must be calculated)Unit Quantity x Unit Price Amount
Stripping (4 - 6" Depth) Acre 2.5 4,050 10,125Roadway Exc. Unclassified, See (J) C.Y. 0 15 0Removal of Conc. Base & Conc. Surface Courses, See (K) S.Y. 0 0Channel Excavation C.Y. 0 12.25 0Ditch Excavation C.Y. 0 10 0Borrow Excavation Zone 3, See (J) C.Y. 37,667 12 452,004
0 0EARTHWORK TOTAL = $462,129
Suggested procedure for calculating earthwork:A) Determine Typical section (number of lanes, median widths, side slopes, etc.).B) Get latest topography map available.C) Plot proposed alignment on topo map.D) Develop profile using topo controls such as existing roads, streams, rivers and design manual.E) Calculate Areas for the typical section in 1 foot increments of cut or fill.F) At 10 to 60 foot intervals (depending on frequency of X-section changes) calculate the earthwork.G) Calculate any other significant earthwork (ramps, cross-roads, etc.).
H) Make appropriate earthwork corrections for the pavement box and striping. Use 21 inch depth for rigid pavement, 26 inch depth for all flexible pavement and 4 inch depth for stripping.
I) Deduct any roadway excavation from borrow required to calculate Borrow Excavation Zone 3.J) See Construction Cost Estimate Work Sheet (Section 3.1). This worksheet must be utilized for the most recent price
information.K) 11.2 to 12.5, based on the quantity, location and type of project.
PAVEMENT
12 FOOT WIDE LANE (from subgrade up)
Pav't. Type Cost/Linear FootA 156B 61C 46D 22E 156
Computation Table for Pavement. Cost
Type Cost from table above x Length x Pavement *W.F. = AmountB 61 845 2.08 107,214B 61 845 2.5 128,863B 61 344 3 62,952E 156 200 3.33 103,896
00000
2 inch HMA Surf. Crs. & 2 inch HMA BaseBridge Approach & Transition Slabs
3 inch HMA Surf. Crs. & 4 inch HMA Base
Description of Pavement10 inch R.C. Pavement2 inch HMA Surf. Crs. & 8 inch HMA Base
2001 Page 1 10/9/2003

Class 1 - New Construction
PAVEMENT TOTAL = $402,924
*Width Factors = Ratio of 12 foot wide lane to actual pavement width.
Example = actual pavement width = 25 foot = 25/12 = 2.08 W.F.
CONTEXT SENSITIVE DESIGN
Attach additional sheet detailing items and costs of context sensitive design work =
CULVERTS
///////////////////////////////////////////////////////////////////////////////////////////////////////////////////COVER
<-----------------W----------------> <-------------------W-------------------->Type 1 W< 20 Feet Type 2 W> 20 feet
Type Layout (3) Skew (1) Cover (2)Cost Per Sq. Foot
Area w x L exceeds 0-60 0 to 10' 114.751000 Sq. Feet degrees 10' to 20' 147.25
Type 1 Short Culverts Difficult 0-60 0 to 10' 203.50Conditions under 1000 Square Feet degrees 10' to 20' 235.00Area w x L exceeds 0-60 0 to 10' 121.751000 Sq. Feet degrees 10' to 20' 152.50
Type 2 Short Culverts Difficult 0-60 0 to 10' 203.50Conditions under 1000 Square Feet degrees 10' to 20' 235.00
For skews over 60 degrees it will be necessary to make a special analysis and establish a square meter price comparable to above.
Description Area Computation x Cost per Sq. Foot = Amount0000
Culvert Total = 0
BRIDGESFor the Bridge Sketch see the Construction Cost Estimation Preparation Manual1 to 3 spans and 2 side spans (Max. Span 100 feet)H = Clear Height 14 To 23 feet (4)L = 100 to 400 feet & all viaducts over 400 feet (5)
Class Layout Skew (1) Foundation (2)Cost per Sq. Foot
Width at Least 0 to 40 No Piles 134.75I 45 feet Degrees Piles at Stub Abut. 159.75
Piles at Piers & Stub Abut. 174.75
2001 Page 2 10/9/2003
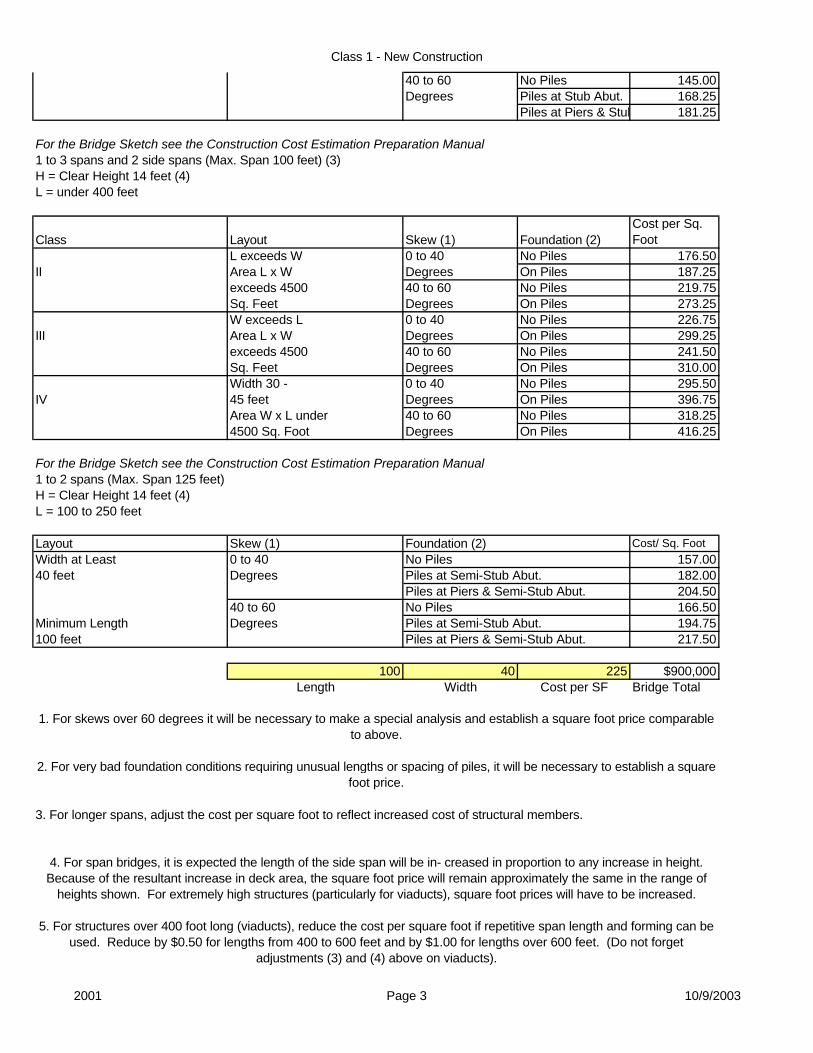
Class 1 - New Construction
40 to 60 No Piles 145.00Degrees Piles at Stub Abut. 168.25
Piles at Piers & Stub Abut. 181.25
For the Bridge Sketch see the Construction Cost Estimation Preparation Manual1 to 3 spans and 2 side spans (Max. Span 100 feet) (3)H = Clear Height 14 feet (4)L = under 400 feet
Class Layout Skew (1) Foundation (2)Cost per Sq. Foot
L exceeds W 0 to 40 No Piles 176.50II Area L x W Degrees On Piles 187.25
exceeds 4500 40 to 60 No Piles 219.75Sq. Feet Degrees On Piles 273.25W exceeds L 0 to 40 No Piles 226.75
III Area L x W Degrees On Piles 299.25exceeds 4500 40 to 60 No Piles 241.50Sq. Feet Degrees On Piles 310.00Width 30 - 0 to 40 No Piles 295.50
IV 45 feet Degrees On Piles 396.75Area W x L under 40 to 60 No Piles 318.254500 Sq. Foot Degrees On Piles 416.25
For the Bridge Sketch see the Construction Cost Estimation Preparation Manual1 to 2 spans (Max. Span 125 feet)H = Clear Height 14 feet (4)L = 100 to 250 feet
Layout Skew (1) Cost/ Sq. FootWidth at Least 0 to 40 157.0040 feet Degrees 182.00
204.5040 to 60 166.50
Minimum Length Degrees 194.75100 feet 217.50
100 40 225 $900,000Length Width Cost per SF Bridge Total
1. For skews over 60 degrees it will be necessary to make a special analysis and establish a square foot price comparable to above.
2. For very bad foundation conditions requiring unusual lengths or spacing of piles, it will be necessary to establish a square foot price.
3. For longer spans, adjust the cost per square foot to reflect increased cost of structural members.
4. For span bridges, it is expected the length of the side span will be in- creased in proportion to any increase in height. Because of the resultant increase in deck area, the square foot price will remain approximately the same in the range of
heights shown. For extremely high structures (particularly for viaducts), square foot prices will have to be increased.
5. For structures over 400 foot long (viaducts), reduce the cost per square foot if repetitive span length and forming can be used. Reduce by $0.50 for lengths from 400 to 600 feet and by $1.00 for lengths over 600 feet. (Do not forget
adjustments (3) and (4) above on viaducts).
Foundation (2)No PilesPiles at Semi-Stub Abut.Piles at Piers & Semi-Stub Abut.No PilesPiles at Semi-Stub Abut.Piles at Piers & Semi-Stub Abut.
2001 Page 3 10/9/2003
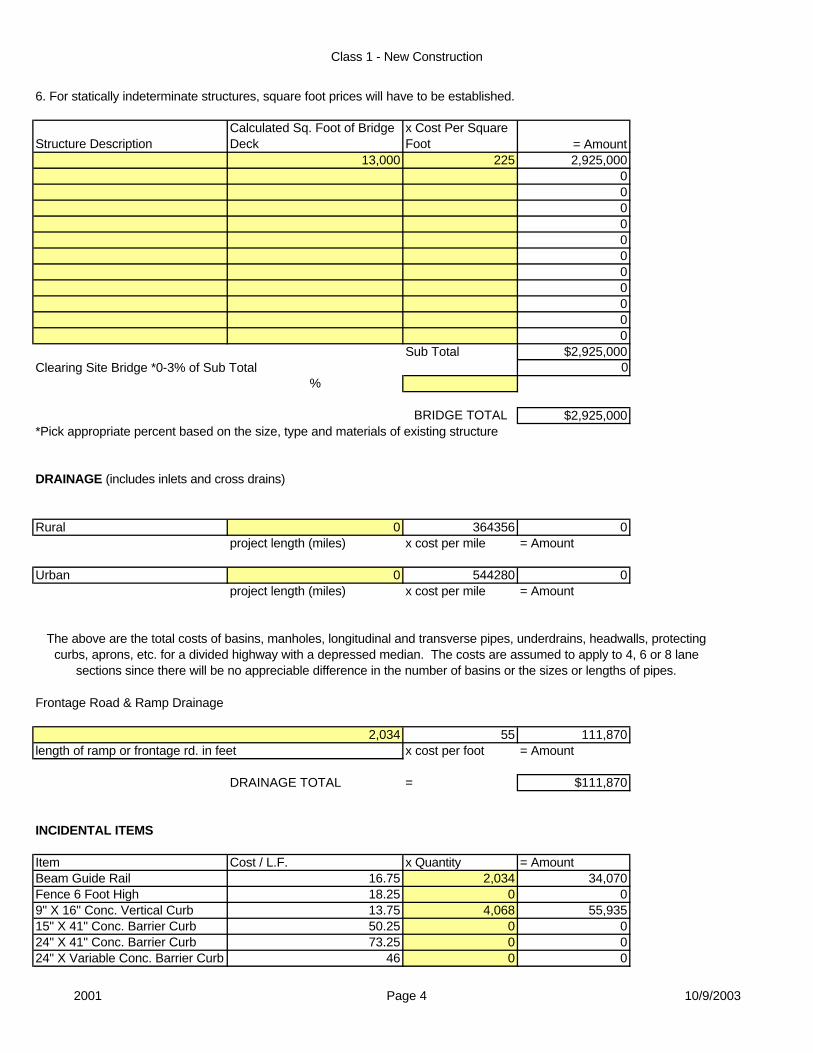
Class 1 - New Construction
6. For statically indeterminate structures, square foot prices will have to be established.
Structure DescriptionCalculated Sq. Foot of Bridge Deck
x Cost Per Square Foot = Amount
13,000 225 2,925,00000000000000
Sub Total $2,925,000Clearing Site Bridge *0-3% of Sub Total 0
%
BRIDGE TOTAL $2,925,000*Pick appropriate percent based on the size, type and materials of existing structure
DRAINAGE (includes inlets and cross drains)
Rural 0 364356 0project length (miles) x cost per mile = Amount
Urban 0 544280 0project length (miles) x cost per mile = Amount
The above are the total costs of basins, manholes, longitudinal and transverse pipes, underdrains, headwalls, protecting curbs, aprons, etc. for a divided highway with a depressed median. The costs are assumed to apply to 4, 6 or 8 lane
sections since there will be no appreciable difference in the number of basins or the sizes or lengths of pipes.
Frontage Road & Ramp Drainage
55 111,870x cost per foot = Amount
DRAINAGE TOTAL = $111,870
INCIDENTAL ITEMS
Item Cost / L.F. x Quantity = AmountBeam Guide Rail 16.75 2,034 34,070Fence 6 Foot High 18.25 0 09" X 16" Conc. Vertical Curb 13.75 4,068 55,93515" X 41" Conc. Barrier Curb 50.25 0 024" X 41" Conc. Barrier Curb 73.25 0 024" X Variable Conc. Barrier Curb 46 0 0
2,034length of ramp or frontage rd. in feet
2001 Page 4 10/9/2003
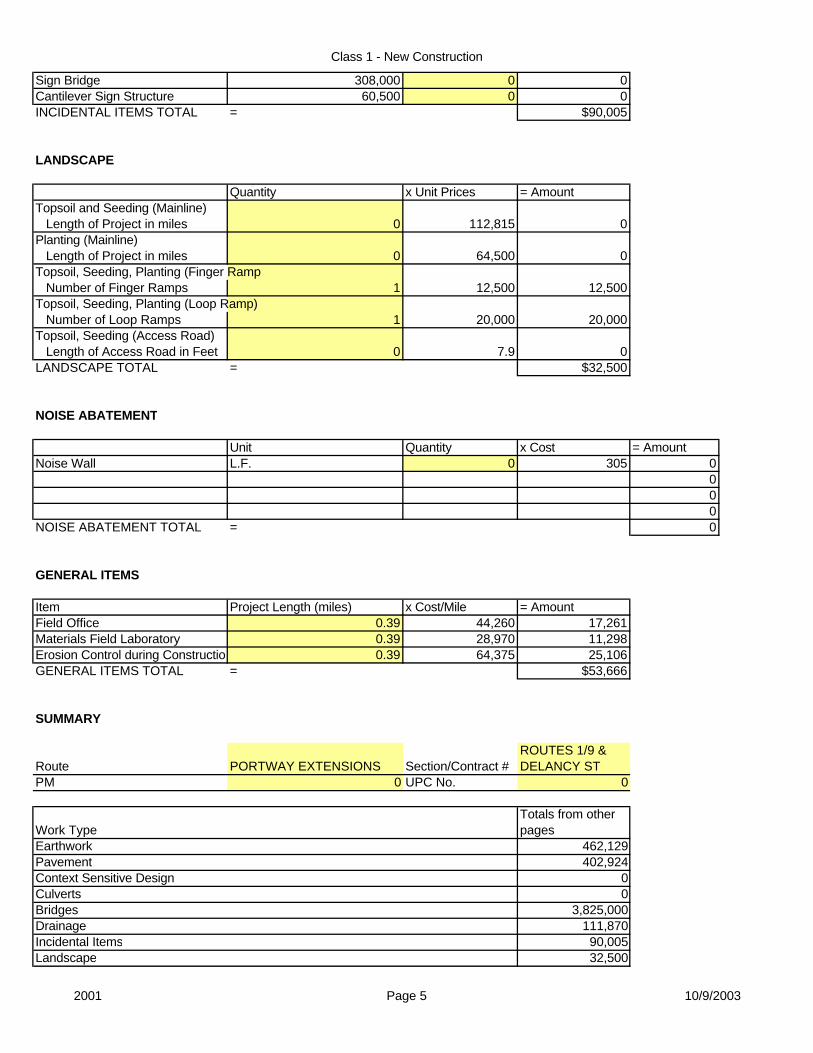
Class 1 - New Construction
Sign Bridge 308,000 0 0Cantilever Sign Structure 60,500 0 0INCIDENTAL ITEMS TOTAL = $90,005
LANDSCAPE
Quantity x Unit Prices = AmountTopsoil and Seeding (Mainline) Length of Project in miles 0 112,815 0Planting (Mainline) Length of Project in miles 0 64,500 0Topsoil, Seeding, Planting (Finger Ramp Number of Finger Ramps 1 12,500 12,500Topsoil, Seeding, Planting (Loop Ramp) Number of Loop Ramps 1 20,000 20,000Topsoil, Seeding (Access Road) Length of Access Road in Feet 0 7.9 0LANDSCAPE TOTAL = $32,500
NOISE ABATEMENT
Unit Quantity x Cost = AmountNoise Wall L.F. 0 305 0
000
NOISE ABATEMENT TOTAL = 0
GENERAL ITEMS
Item Project Length (miles) x Cost/Mile = AmountField Office 0.39 44,260 17,261Materials Field Laboratory 0.39 28,970 11,298Erosion Control during Construction 0.39 64,375 25,106GENERAL ITEMS TOTAL = $53,666
SUMMARY
Route PORTWAY EXTENSIONS Section/Contract #ROUTES 1/9 & DELANCY ST
PM 0 UPC No. 0
Work TypeTotals from other pages
Earthwork 462,129Pavement 402,924Context Sensitive Design 0Culverts 0Bridges 3,825,000Drainage 111,870Incidental Items 90,005Landscape 32,500
2001 Page 5 10/9/2003
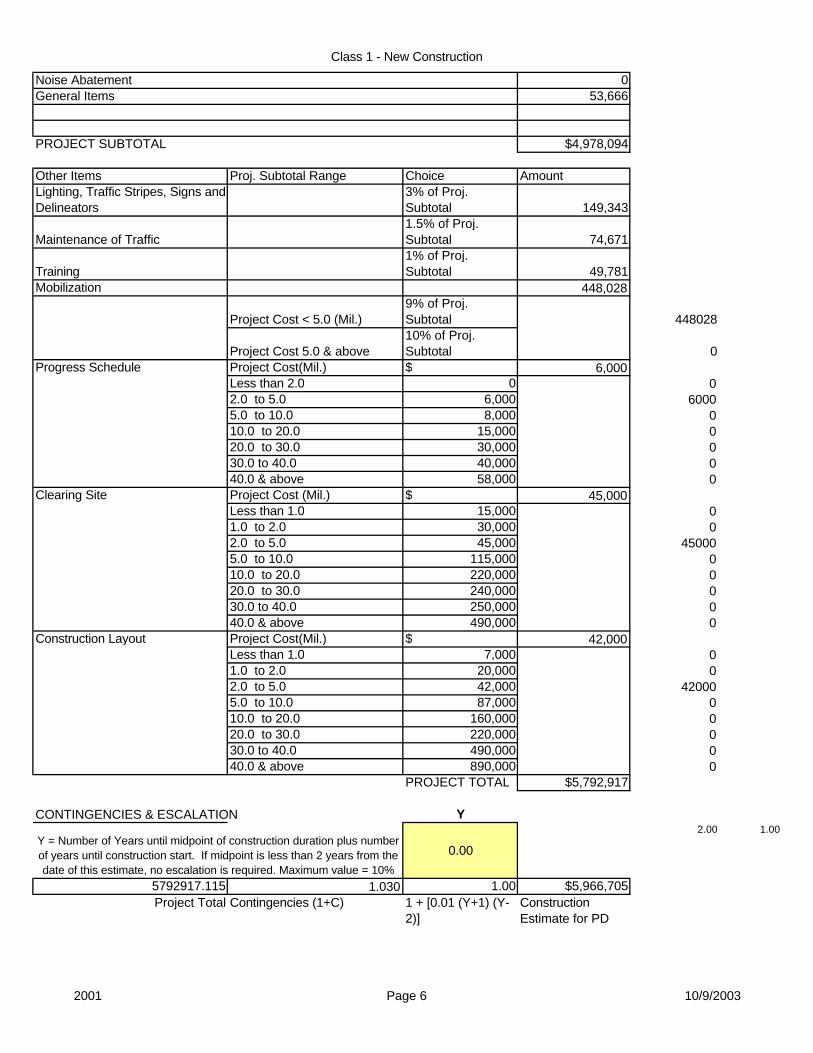
Class 1 - New Construction
Noise Abatement 0General Items 53,666
PROJECT SUBTOTAL $4,978,094
Other Items Proj. Subtotal Range Choice AmountLighting, Traffic Stripes, Signs and Delineators
3% of Proj. Subtotal 149,343
Maintenance of Traffic1.5% of Proj. Subtotal 74,671
Training1% of Proj. Subtotal 49,781
Mobilization 448,028
Project Cost < 5.0 (Mil.)9% of Proj. Subtotal 448028
Project Cost 5.0 & above10% of Proj. Subtotal 0
Progress Schedule Project Cost(Mil.) $ 6,000Less than 2.0 0 02.0 to 5.0 6,000 60005.0 to 10.0 8,000 010.0 to 20.0 15,000 020.0 to 30.0 30,000 030.0 to 40.0 40,000 040.0 & above 58,000 0
Clearing Site Project Cost (Mil.) $ 45,000Less than 1.0 15,000 01.0 to 2.0 30,000 02.0 to 5.0 45,000 450005.0 to 10.0 115,000 010.0 to 20.0 220,000 020.0 to 30.0 240,000 030.0 to 40.0 250,000 040.0 & above 490,000 0
Construction Layout Project Cost(Mil.) $ 42,000Less than 1.0 7,000 01.0 to 2.0 20,000 02.0 to 5.0 42,000 420005.0 to 10.0 87,000 010.0 to 20.0 160,000 020.0 to 30.0 220,000 030.0 to 40.0 490,000 040.0 & above 890,000 0
PROJECT TOTAL $5,792,917
CONTINGENCIES & ESCALATION Y
Y = Number of Years until midpoint of construction duration plus number of years until construction start. If midpoint is less than 2 years from the date of this estimate, no escalation is required. Maximum value = 10%
0.00
2.00 1.00
5792917.115 1.030 1.00 $5,966,705Project Total Contingencies (1+C) 1 + [0.01 (Y+1) (Y-
2)]Construction Estimate for PD
2001 Page 6 10/9/2003
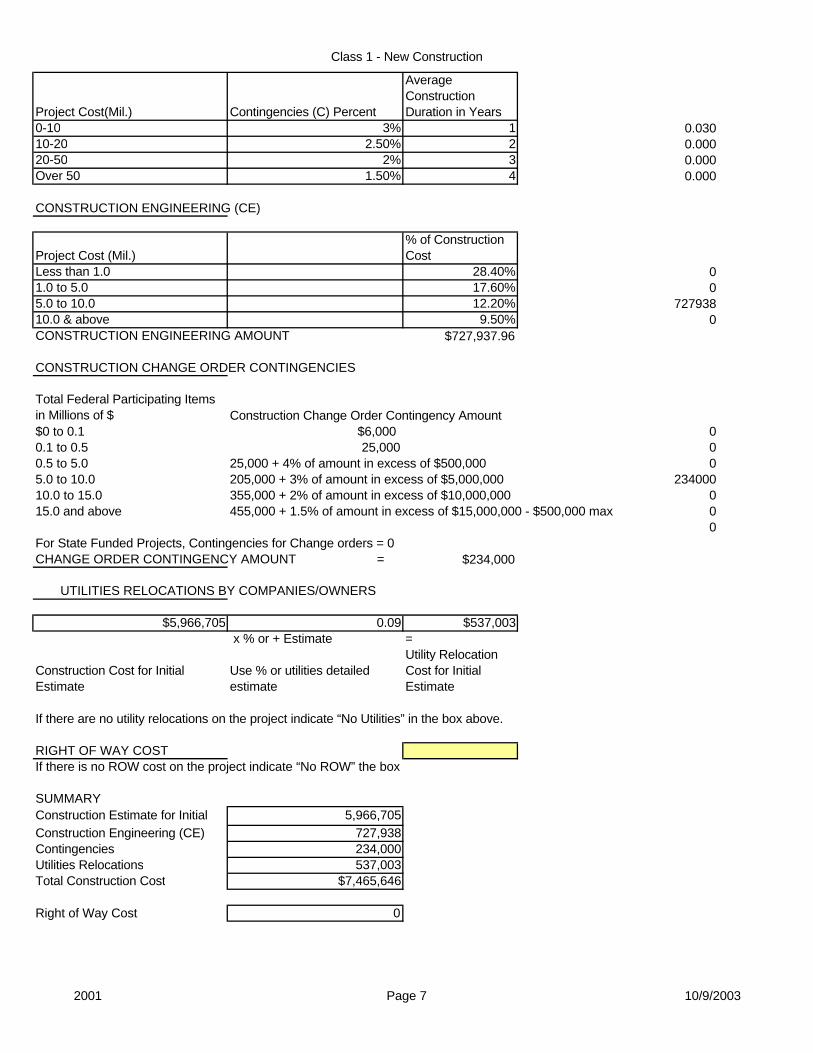
Class 1 - New Construction
Project Cost(Mil.) Contingencies (C) Percent
Average Construction Duration in Years
0-10 3% 1 0.03010-20 2.50% 2 0.00020-50 2% 3 0.000Over 50 1.50% 4 0.000
CONSTRUCTION ENGINEERING (CE)
Project Cost (Mil.)% of Construction Cost
Less than 1.0 28.40% 01.0 to 5.0 17.60% 05.0 to 10.0 12.20% 72793810.0 & above 9.50% 0CONSTRUCTION ENGINEERING AMOUNT $727,937.96
CONSTRUCTION CHANGE ORDER CONTINGENCIES
Total Federal Participating Items in Millions of $ Construction Change Order Contingency Amount$0 to 0.1 $6,000 00.1 to 0.5 25,000 00.5 to 5.0 25,000 + 4% of amount in excess of $500,000 05.0 to 10.0 205,000 + 3% of amount in excess of $5,000,000 23400010.0 to 15.0 355,000 + 2% of amount in excess of $10,000,000 015.0 and above 455,000 + 1.5% of amount in excess of $15,000,000 - $500,000 max 0
0For State Funded Projects, Contingencies for Change orders = 0CHANGE ORDER CONTINGENCY AMOUNT = $234,000
UTILITIES RELOCATIONS BY COMPANIES/OWNERS
$5,966,705 0.09 $537,003 x % or + Estimate =
Construction Cost for Initial Estimate
Use % or utilities detailed estimate
Utility Relocation Cost for Initial Estimate
If there are no utility relocations on the project indicate “No Utilities” in the box above.
RIGHT OF WAY COSTIf there is no ROW cost on the project indicate “No ROW” the box
SUMMARYConstruction Estimate for Initial 5,966,705Construction Engineering (CE) 727,938Contingencies 234,000Utilities Relocations 537,003Total Construction Cost $7,465,646
Right of Way Cost 0
2001 Page 7 10/9/2003

Class 1 - New Construction
Classification Number 1 - NEW CONSTRUCTION - EnglishRoute PORTWAY EXTENSIONS Section/Contract # NJ TURNPIKE INTERCHANGE 13APM UPC No.
EARTHWORK (must be calculated)Unit Quantity x Unit Price Amount
Stripping (4 - 6" Depth) Acre 15 4,050 60,750Roadway Exc. Unclassified, See (J) C.Y. 0 15 0
Removal of Conc. Base & Conc. Surface Courses, See (K) S.Y. 0 0Channel Excavation C.Y. 0 12.25 0Ditch Excavation C.Y. 0 10 0Borrow Excavation Zone 3, See (J) C.Y. 97,437 12 1,169,244
0 0EARTHWORK TOTAL = $1,229,994
Suggested procedure for calculating earthwork:A) Determine Typical section (number of lanes, median widths, side slopes, etc.).B) Get latest topography map available.C) Plot proposed alignment on topo map.D) Develop profile using topo controls such as existing roads, streams, rivers and design manual.E) Calculate Areas for the typical section in 1 foot increments of cut or fill.F) At 10 to 60 foot intervals (depending on frequency of X-section changes) calculate the earthwork.G) Calculate any other significant earthwork (ramps, cross-roads, etc.).H) Make appropriate earthwork corrections for the pavement box and striping. Use 21 inch depth for rigid pavement, 26
inch depth for all flexible pavement and 4 inch depth for stripping.I) Deduct any roadway excavation from borrow required to calculate Borrow Excavation Zone 3.J) See Construction Cost Estimate Work Sheet (Section 3.1). This worksheet must be utilized for the most recent price
information.K) 11.2 to 12.5, based on the quantity, location and type of project.
PAVEMENT
12 FOOT WIDE LANE (from subgrade up)
Pav't. Type Cost/Linear FootA 156B 61C 46D 22E 156
Computation Table for Pavement. Cost
Type Cost from table above x Length x Pavement *W.F. = AmountB 61 13,154 2.08 1,668,980E 156 1,600 2.08 519,168
0000000
PAVEMENT TOTAL = $2,188,148
*Width Factors = Ratio of 12 foot wide lane to actual pavement width.
Example = actual pavement width = 25 foot = 25/12 = 2.08 W.F.
Description of Pavement10 inch R.C. Pavement2 inch HMA Surf. Crs. & 8 inch HMA Base3 inch HMA Surf. Crs. & 4 inch HMA Base2 inch HMA Surf. Crs. & 2 inch HMA BaseBridge Approach & Transition Slabs
13A Page 65
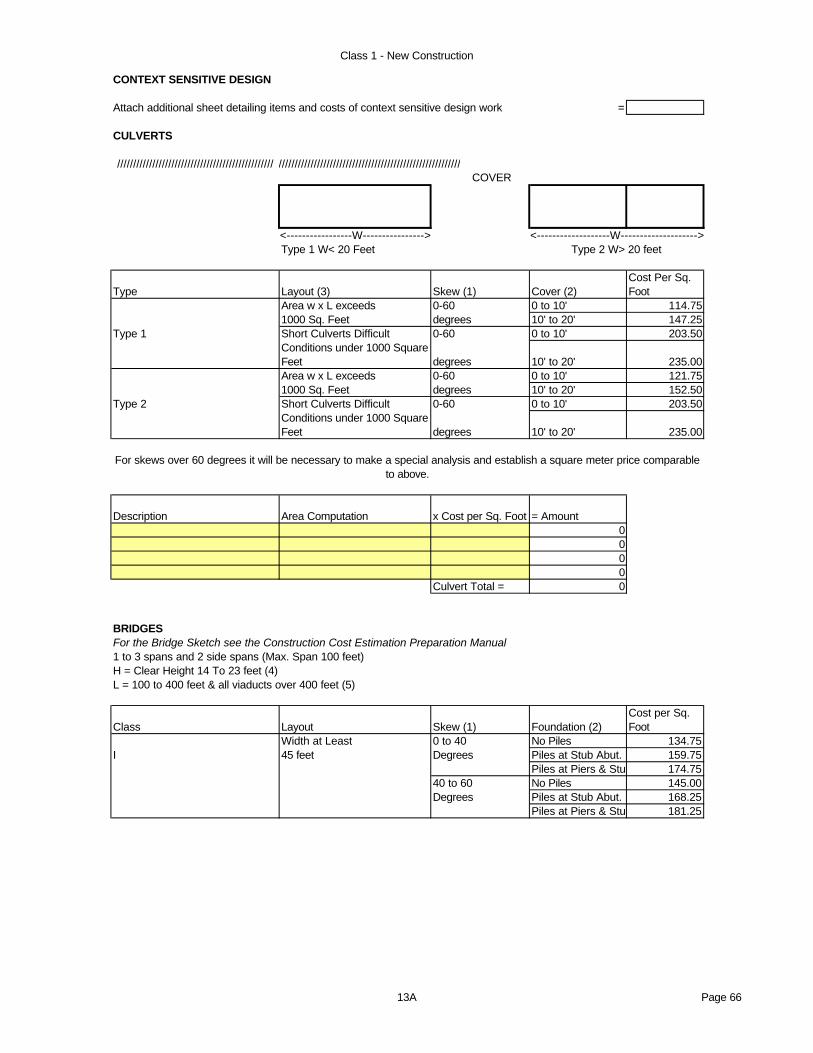
Class 1 - New Construction
CONTEXT SENSITIVE DESIGN
Attach additional sheet detailing items and costs of context sensitive design work =
CULVERTS
///////////////////////////////////////////////////////////////////////////////////////////////////////////////////COVER
<-----------------W----------------> <-------------------W-------------------->Type 1 W< 20 Feet Type 2 W> 20 feet
Type Layout (3) Skew (1) Cover (2)Cost Per Sq. Foot
Area w x L exceeds 0-60 0 to 10' 114.751000 Sq. Feet degrees 10' to 20' 147.25
Type 1 Short Culverts Difficult 0-60 0 to 10' 203.50Conditions under 1000 Square Feet degrees 10' to 20' 235.00Area w x L exceeds 0-60 0 to 10' 121.751000 Sq. Feet degrees 10' to 20' 152.50
Type 2 Short Culverts Difficult 0-60 0 to 10' 203.50Conditions under 1000 Square Feet degrees 10' to 20' 235.00
For skews over 60 degrees it will be necessary to make a special analysis and establish a square meter price comparable to above.
Description Area Computation x Cost per Sq. Foot = Amount0000
Culvert Total = 0
BRIDGESFor the Bridge Sketch see the Construction Cost Estimation Preparation Manual1 to 3 spans and 2 side spans (Max. Span 100 feet)H = Clear Height 14 To 23 feet (4)L = 100 to 400 feet & all viaducts over 400 feet (5)
Class Layout Skew (1) Foundation (2)Cost per Sq. Foot
Width at Least 0 to 40 No Piles 134.75I 45 feet Degrees Piles at Stub Abut. 159.75
Piles at Piers & Stub Abut. 174.7540 to 60 No Piles 145.00Degrees Piles at Stub Abut. 168.25
Piles at Piers & Stub Abut. 181.25
13A Page 66
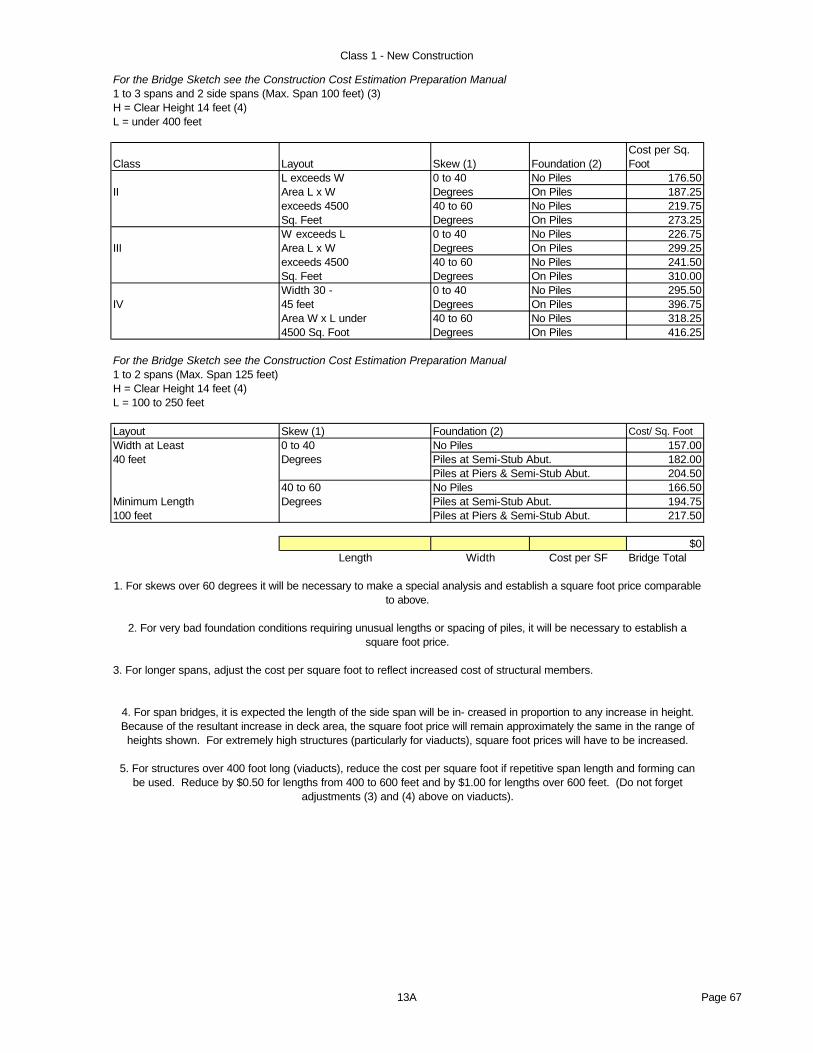
Class 1 - New Construction
For the Bridge Sketch see the Construction Cost Estimation Preparation Manual1 to 3 spans and 2 side spans (Max. Span 100 feet) (3)H = Clear Height 14 feet (4)L = under 400 feet
Class Layout Skew (1) Foundation (2)Cost per Sq. Foot
L exceeds W 0 to 40 No Piles 176.50II Area L x W Degrees On Piles 187.25
exceeds 4500 40 to 60 No Piles 219.75Sq. Feet Degrees On Piles 273.25W exceeds L 0 to 40 No Piles 226.75
III Area L x W Degrees On Piles 299.25exceeds 4500 40 to 60 No Piles 241.50Sq. Feet Degrees On Piles 310.00Width 30 - 0 to 40 No Piles 295.50
IV 45 feet Degrees On Piles 396.75Area W x L under 40 to 60 No Piles 318.254500 Sq. Foot Degrees On Piles 416.25
For the Bridge Sketch see the Construction Cost Estimation Preparation Manual1 to 2 spans (Max. Span 125 feet)H = Clear Height 14 feet (4)L = 100 to 250 feet
Layout Skew (1) Cost/ Sq. FootWidth at Least 0 to 40 157.0040 feet Degrees 182.00
204.5040 to 60 166.50
Minimum Length Degrees 194.75100 feet 217.50
$0Length Width Cost per SF Bridge Total
1. For skews over 60 degrees it will be necessary to make a special analysis and establish a square foot price comparable to above.
2. For very bad foundation conditions requiring unusual lengths or spacing of piles, it will be necessary to establish a square foot price.
3. For longer spans, adjust the cost per square foot to reflect increased cost of structural members.
4. For span bridges, it is expected the length of the side span will be in- creased in proportion to any increase in height. Because of the resultant increase in deck area, the square foot price will remain approximately the same in the range of heights shown. For extremely high structures (particularly for viaducts), square foot prices will have to be increased.
5. For structures over 400 foot long (viaducts), reduce the cost per square foot if repetitive span length and forming can be used. Reduce by $0.50 for lengths from 400 to 600 feet and by $1.00 for lengths over 600 feet. (Do not forget
adjustments (3) and (4) above on viaducts).
Foundation (2)No Piles
Piles at Piers & Semi-Stub Abut.
Piles at Semi-Stub Abut.Piles at Piers & Semi-Stub Abut.No PilesPiles at Semi-Stub Abut.
13A Page 67
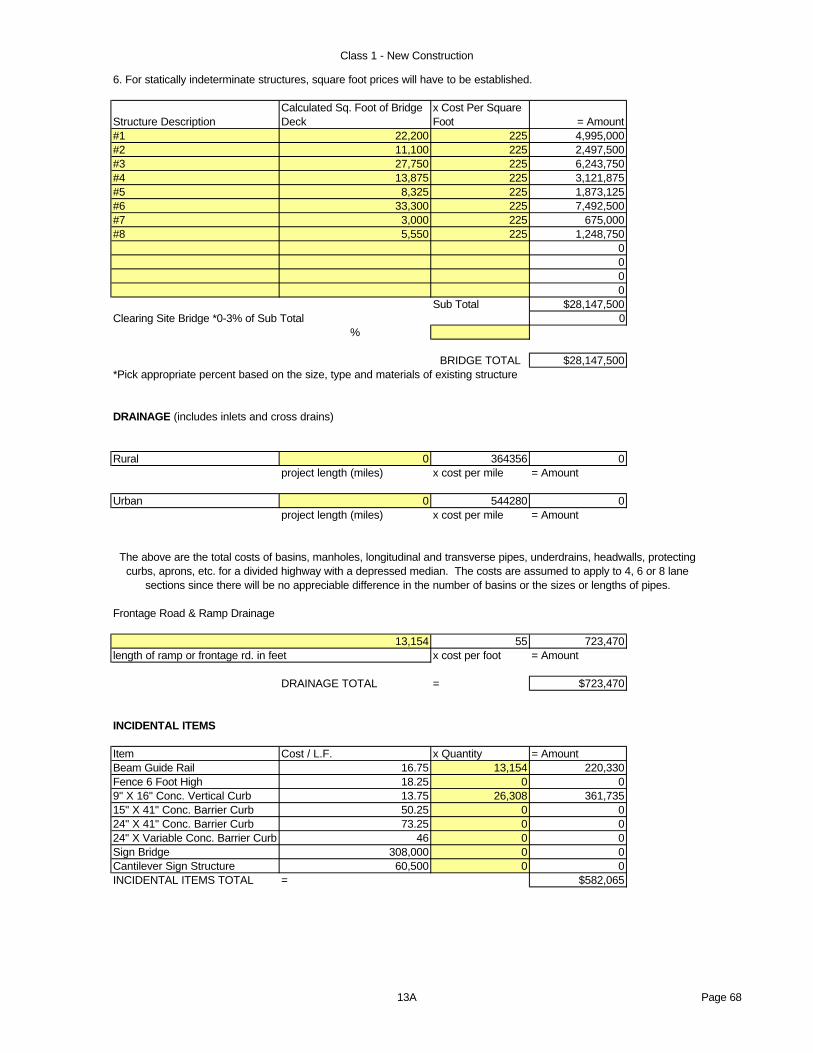
Class 1 - New Construction
6. For statically indeterminate structures, square foot prices will have to be established.
Structure DescriptionCalculated Sq. Foot of Bridge Deck
x Cost Per Square Foot = Amount
#1 22,200 225 4,995,000#2 11,100 225 2,497,500#3 27,750 225 6,243,750#4 13,875 225 3,121,875#5 8,325 225 1,873,125#6 33,300 225 7,492,500#7 3,000 225 675,000#8 5,550 225 1,248,750
0000
Sub Total $28,147,500Clearing Site Bridge *0-3% of Sub Total 0
%
BRIDGE TOTAL $28,147,500*Pick appropriate percent based on the size, type and materials of existing structure
DRAINAGE (includes inlets and cross drains)
Rural 0 364356 0project length (miles) x cost per mile = Amount
Urban 0 544280 0project length (miles) x cost per mile = Amount
The above are the total costs of basins, manholes, longitudinal and transverse pipes, underdrains, headwalls, protecting curbs, aprons, etc. for a divided highway with a depressed median. The costs are assumed to apply to 4, 6 or 8 lane
sections since there will be no appreciable difference in the number of basins or the sizes or lengths of pipes.
Frontage Road & Ramp Drainage
55 723,470x cost per foot = Amount
DRAINAGE TOTAL = $723,470
INCIDENTAL ITEMS
Item Cost / L.F. x Quantity = AmountBeam Guide Rail 16.75 13,154 220,330Fence 6 Foot High 18.25 0 09" X 16" Conc. Vertical Curb 13.75 26,308 361,73515" X 41" Conc. Barrier Curb 50.25 0 024" X 41" Conc. Barrier Curb 73.25 0 024" X Variable Conc. Barrier Curb 46 0 0Sign Bridge 308,000 0 0Cantilever Sign Structure 60,500 0 0INCIDENTAL ITEMS TOTAL = $582,065
13,154length of ramp or frontage rd. in feet
13A Page 68
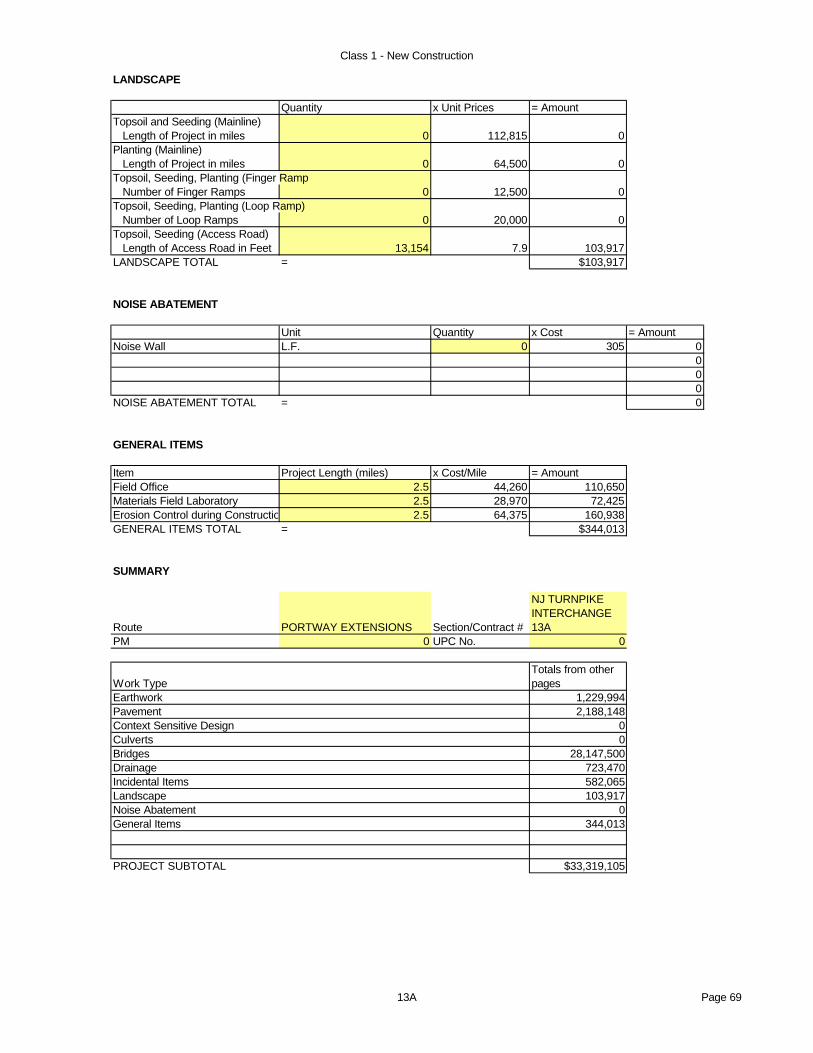
Class 1 - New Construction
LANDSCAPE
Quantity x Unit Prices = AmountTopsoil and Seeding (Mainline) Length of Project in miles 0 112,815 0Planting (Mainline) Length of Project in miles 0 64,500 0Topsoil, Seeding, Planting (Finger Ramp Number of Finger Ramps 0 12,500 0Topsoil, Seeding, Planting (Loop Ramp) Number of Loop Ramps 0 20,000 0Topsoil, Seeding (Access Road) Length of Access Road in Feet 13,154 7.9 103,917LANDSCAPE TOTAL = $103,917
NOISE ABATEMENT
Unit Quantity x Cost = AmountNoise Wall L.F. 0 305 0
000
NOISE ABATEMENT TOTAL = 0
GENERAL ITEMS
Item Project Length (miles) x Cost/Mile = AmountField Office 2.5 44,260 110,650Materials Field Laboratory 2.5 28,970 72,425Erosion Control during Construction 2.5 64,375 160,938GENERAL ITEMS TOTAL = $344,013
SUMMARY
Route PORTWAY EXTENSIONS Section/Contract #
NJ TURNPIKE INTERCHANGE 13A
PM 0 UPC No. 0
Work TypeTotals from other pages
Earthwork 1,229,994Pavement 2,188,148Context Sensitive Design 0Culverts 0Bridges 28,147,500Drainage 723,470Incidental Items 582,065Landscape 103,917Noise Abatement 0General Items 344,013
PROJECT SUBTOTAL $33,319,105
13A Page 69

Class 1 - New Construction
Other Items Proj. Subtotal Range Choice AmountLighting, Traffic Stripes, Signs and Delineators
3% of Proj. Subtotal 999,573
Maintenance of Traffic1.5% of Proj. Subtotal 499,787
Training1% of Proj. Subtotal 333,191
Mobilization 3,331,911
Project Cost < 5.0 (Mil.)9% of Proj. Subtotal 0
Project Cost 5.0 & above10% of Proj. Subtotal 3331911
Progress Schedule Project Cost(Mil.) $ 40,000Less than 2.0 0 02.0 to 5.0 6,000 05.0 to 10.0 8,000 010.0 to 20.0 15,000 020.0 to 30.0 30,000 030.0 to 40.0 40,000 4000040.0 & above 58,000 0
Clearing Site Project Cost (Mil.) $ 250,000Less than 1.0 15,000 01.0 to 2.0 30,000 02.0 to 5.0 45,000 05.0 to 10.0 115,000 010.0 to 20.0 220,000 020.0 to 30.0 240,000 030.0 to 40.0 250,000 25000040.0 & above 490,000 0
Construction Layout Project Cost(Mil.) $ 490,000Less than 1.0 7,000 01.0 to 2.0 20,000 02.0 to 5.0 42,000 05.0 to 10.0 87,000 010.0 to 20.0 160,000 020.0 to 30.0 220,000 030.0 to 40.0 490,000 49000040.0 & above 890,000 0
PROJECT TOTAL $39,263,566
13A Page 70

Class 1 - New Construction
CONTINGENCIES & ESCALATION YY = Number of Years until midpoint of construction duration plus
number of years until construction start. If midpoint is less than 2 years from the date of this estimate, no escalation is required.
Maximum value = 10%
0.00
2.00
39263566.41 1.000 1.00 $39,263,566Project Total Contingencies (1+C) 1 + [0.01 (Y+1) (Y-
2)]Construction Estimate for PD
Project Cost(Mil.) Contingencies (C) Percent
Average Construction Duration in Years
0-10 3% 1 0.00010-20 2.50% 2 0.00020-50 2% 3 0.000Over 50 1.50% 4 0.000
CONSTRUCTION ENGINEERING (CE)
Project Cost (Mil.)% of Construction Cost
Less than 1.0 28.40% 01.0 to 5.0 17.60% 05.0 to 10.0 12.20% 010.0 & above 9.50% 3730039CONSTRUCTION ENGINEERING AMOUNT $3,730,038.81
CONSTRUCTION CHANGE ORDER CONTINGENCIES
Total Federal Participating Items in Millions of $ Construction Change Order Contingency Amount$0 to 0.1 $6,000 00.1 to 0.5 25,000 00.5 to 5.0 25,000 + 4% of amount in excess of $500,000 05.0 to 10.0 205,000 + 3% of amount in excess of $5,000,000 010.0 to 15.0 355,000 + 2% of amount in excess of $10,000,000 015.0 and above 455,000 + 1.5% of amount in excess of $15,000,000 - $500,000 max 500000
819000For State Funded Projects, Contingencies for Change orders = 0CHANGE ORDER CONTINGENCY AMOUNT = $500,000
UTILITIES RELOCATIONS BY COMPANIES/OWNERS
$39,263,566 0.09 $3,533,721 x % or + Estimate =
Construction Cost for Initial Estimate
Use % or utilities detailed estimate
Utility Relocation Cost for Initial Estimate
If there are no utility relocations on the project indicate “No Utilities” in the box above.
RIGHT OF WAY COSTIf there is no ROW cost on the project indicate “No ROW” the box
SUMMARYConstruction Estimate for Initial 39,263,566Construction Engineering (CE) 3,730,039Contingencies 500,000Utilities Relocations 3,533,721Total Construction Cost $47,027,326
Right of Way Cost 0
13A Page 71

Class 1 - New Construction
Classification Number 1 - NEW CONSTRUCTION - EnglishRoute PORTWAY EXTENSIONS Section/Contract # NJ TURNPIKE INTERCHANGE 13PM UPC No.
EARTHWORK (must be calculated)Unit Quantity x Unit Price Amount
Stripping (4 - 6" Depth) Acre 3.8 4,050 15,390Roadway Exc. Unclassified, See (J) C.Y. 0 15 0
Removal of Conc. Base & Conc. Surface Courses, See (K) S.Y. 0 0Channel Excavation C.Y. 0 12.25 0Ditch Excavation C.Y. 0 10 0Borrow Excavation Zone 3, See (J) C.Y. 27,496 12 329,952
0 0EARTHWORK TOTAL = $345,342
Suggested procedure for calculating earthwork:A) Determine Typical section (number of lanes, median widths, side slopes, etc.).B) Get latest topography map available.C) Plot proposed alignment on topo map.D) Develop profile using topo controls such as existing roads, streams, rivers and design manual.E) Calculate Areas for the typical section in 1 foot increments of cut or fill.F) At 10 to 60 foot intervals (depending on frequency of X-section changes) calculate the earthwork.G) Calculate any other significant earthwork (ramps, cross-roads, etc.).H) Make appropriate earthwork corrections for the pavement box and striping. Use 21 inch depth for rigid pavement, 26
inch depth for all flexible pavement and 4 inch depth for stripping.I) Deduct any roadway excavation from borrow required to calculate Borrow Excavation Zone 3.J) See Construction Cost Estimate Work Sheet (Section 3.1). This worksheet must be utilized for the most recent price
information.K) 11.2 to 12.5, based on the quantity, location and type of project.
PAVEMENT
12 FOOT WIDE LANE (from subgrade up)
Pav't. Type Cost/Linear FootA 156B 61C 46D 22E 156
Computation Table for Pavement. Cost
Type Cost from table above x Length x Pavement *W.F. = AmountB 61 3,700 2.08 469,456E 156 900 2.08 292,032
0000000
PAVEMENT TOTAL = $761,488
*Width Factors = Ratio of 12 foot wide lane to actual pavement width.
Example = actual pavement width = 25 foot = 25/12 = 2.08 W.F.
Description of Pavement10 inch R.C. Pavement2 inch HMA Surf. Crs. & 8 inch HMA Base3 inch HMA Surf. Crs. & 4 inch HMA Base2 inch HMA Surf. Crs. & 2 inch HMA BaseBridge Approach & Transition Slabs
13 Page 72

Class 1 - New Construction
CONTEXT SENSITIVE DESIGN
Attach additional sheet detailing items and costs of context sensitive design work =
CULVERTS
///////////////////////////////////////////////////////////////////////////////////////////////////////////////////COVER
<-----------------W----------------> <-------------------W-------------------->Type 1 W< 20 Feet Type 2 W> 20 feet
Type Layout (3) Skew (1) Cover (2)Cost Per Sq. Foot
Area w x L exceeds 0-60 0 to 10' 114.751000 Sq. Feet degrees 10' to 20' 147.25
Type 1 Short Culverts Difficult 0-60 0 to 10' 203.50Conditions under 1000 Square Feet degrees 10' to 20' 235.00Area w x L exceeds 0-60 0 to 10' 121.751000 Sq. Feet degrees 10' to 20' 152.50
Type 2 Short Culverts Difficult 0-60 0 to 10' 203.50Conditions under 1000 Square Feet degrees 10' to 20' 235.00
For skews over 60 degrees it will be necessary to make a special analysis and establish a square meter price comparable to above.
Description Area Computation x Cost per Sq. Foot = Amount0000
Culvert Total = 0
BRIDGESFor the Bridge Sketch see the Construction Cost Estimation Preparation Manual1 to 3 spans and 2 side spans (Max. Span 100 feet)H = Clear Height 14 To 23 feet (4)L = 100 to 400 feet & all viaducts over 400 feet (5)
Class Layout Skew (1) Foundation (2)Cost per Sq. Foot
Width at Least 0 to 40 No Piles 134.75I 45 feet Degrees Piles at Stub Abut. 159.75
Piles at Piers & Stub Abut. 174.7540 to 60 No Piles 145.00Degrees Piles at Stub Abut. 168.25
Piles at Piers & Stub Abut. 181.25
13 Page 73

Class 1 - New Construction
For the Bridge Sketch see the Construction Cost Estimation Preparation Manual1 to 3 spans and 2 side spans (Max. Span 100 feet) (3)H = Clear Height 14 feet (4)L = under 400 feet
Class Layout Skew (1) Foundation (2)Cost per Sq. Foot
L exceeds W 0 to 40 No Piles 176.50II Area L x W Degrees On Piles 187.25
exceeds 4500 40 to 60 No Piles 219.75Sq. Feet Degrees On Piles 273.25W exceeds L 0 to 40 No Piles 226.75
III Area L x W Degrees On Piles 299.25exceeds 4500 40 to 60 No Piles 241.50Sq. Feet Degrees On Piles 310.00Width 30 - 0 to 40 No Piles 295.50
IV 45 feet Degrees On Piles 396.75Area W x L under 40 to 60 No Piles 318.254500 Sq. Foot Degrees On Piles 416.25
For the Bridge Sketch see the Construction Cost Estimation Preparation Manual1 to 2 spans (Max. Span 125 feet)H = Clear Height 14 feet (4)L = 100 to 250 feet
Layout Skew (1) Cost/ Sq. FootWidth at Least 0 to 40 157.0040 feet Degrees 182.00
204.5040 to 60 166.50
Minimum Length Degrees 194.75100 feet 217.50
$0Length Width Cost per SF Bridge Total
1. For skews over 60 degrees it will be necessary to make a special analysis and establish a square foot price comparable to above.
2. For very bad foundation conditions requiring unusual lengths or spacing of piles, it will be necessary to establish a square foot price.
3. For longer spans, adjust the cost per square foot to reflect increased cost of structural members.
4. For span bridges, it is expected the length of the side span will be in- creased in proportion to any increase in height. Because of the resultant increase in deck area, the square foot price will remain approximately the same in the range of heights shown. For extremely high structures (particularly for viaducts), square foot prices will have to be increased.
5. For structures over 400 foot long (viaducts), reduce the cost per square foot if repetitive span length and forming can be used. Reduce by $0.50 for lengths from 400 to 600 feet and by $1.00 for lengths over 600 feet. (Do not forget
adjustments (3) and (4) above on viaducts).
Foundation (2)No Piles
Piles at Piers & Semi-Stub Abut.
Piles at Semi-Stub Abut.Piles at Piers & Semi-Stub Abut.No PilesPiles at Semi-Stub Abut.
13 Page 74

Class 1 - New Construction
6. For statically indeterminate structures, square foot prices will have to be established.
Structure DescriptionCalculated Sq. Foot of Bridge Deck
x Cost Per Square Foot = Amount
7,500 225 1,687,50015,000 225 3,375,00060,000 225 13,500,00035,000 225 7,875,000
00000000
Sub Total $26,437,500Clearing Site Bridge *0-3% of Sub Total 0
%
BRIDGE TOTAL $26,437,500*Pick appropriate percent based on the size, type and materials of existing structure
DRAINAGE (includes inlets and cross drains)
Rural 0 364356 0project length (miles) x cost per mile = Amount
Urban 0 544280 0project length (miles) x cost per mile = Amount
The above are the total costs of basins, manholes, longitudinal and transverse pipes, underdrains, headwalls, protecting curbs, aprons, etc. for a divided highway with a depressed median. The costs are assumed to apply to 4, 6 or 8 lane
sections since there will be no appreciable difference in the number of basins or the sizes or lengths of pipes.
Frontage Road & Ramp Drainage
55 204,160x cost per foot = Amount
DRAINAGE TOTAL = $204,160
INCIDENTAL ITEMS
Item Cost / L.F. x Quantity = AmountBeam Guide Rail 16.75 1,856 31,088Fence 6 Foot High 18.25 0 09" X 16" Conc. Vertical Curb 13.75 7,424 102,08015" X 41" Conc. Barrier Curb 50.25 0 024" X 41" Conc. Barrier Curb 73.25 0 024" X Variable Conc. Barrier Curb 46 0 0Sign Bridge 308,000 0 0Cantilever Sign Structure 60,500 0 0INCIDENTAL ITEMS TOTAL = $133,168
3,712length of ramp or frontage rd. in feet
13 Page 75
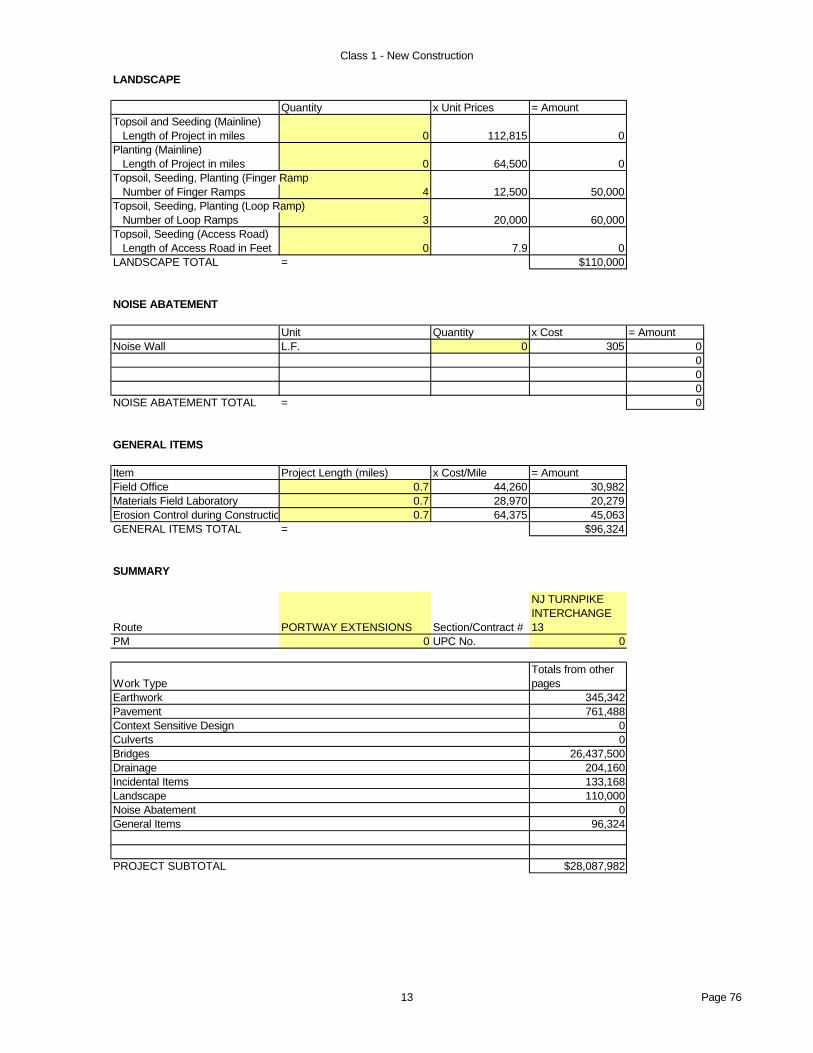
Class 1 - New Construction
LANDSCAPE
Quantity x Unit Prices = AmountTopsoil and Seeding (Mainline) Length of Project in miles 0 112,815 0Planting (Mainline) Length of Project in miles 0 64,500 0Topsoil, Seeding, Planting (Finger Ramp Number of Finger Ramps 4 12,500 50,000Topsoil, Seeding, Planting (Loop Ramp) Number of Loop Ramps 3 20,000 60,000Topsoil, Seeding (Access Road) Length of Access Road in Feet 0 7.9 0LANDSCAPE TOTAL = $110,000
NOISE ABATEMENT
Unit Quantity x Cost = AmountNoise Wall L.F. 0 305 0
000
NOISE ABATEMENT TOTAL = 0
GENERAL ITEMS
Item Project Length (miles) x Cost/Mile = AmountField Office 0.7 44,260 30,982Materials Field Laboratory 0.7 28,970 20,279Erosion Control during Construction 0.7 64,375 45,063GENERAL ITEMS TOTAL = $96,324
SUMMARY
Route PORTWAY EXTENSIONS Section/Contract #
NJ TURNPIKE INTERCHANGE 13
PM 0 UPC No. 0
Work TypeTotals from other pages
Earthwork 345,342Pavement 761,488Context Sensitive Design 0Culverts 0Bridges 26,437,500Drainage 204,160Incidental Items 133,168Landscape 110,000Noise Abatement 0General Items 96,324
PROJECT SUBTOTAL $28,087,982
13 Page 76

Class 1 - New Construction
Other Items Proj. Subtotal Range Choice AmountLighting, Traffic Stripes, Signs and Delineators
3% of Proj. Subtotal 842,639
Maintenance of Traffic1.5% of Proj. Subtotal 421,320
Training1% of Proj. Subtotal 280,880
Mobilization 2,808,798
Project Cost < 5.0 (Mil.)9% of Proj. Subtotal 0
Project Cost 5.0 & above10% of Proj. Subtotal 2808798
Progress Schedule Project Cost(Mil.) $ 30,000Less than 2.0 0 02.0 to 5.0 6,000 05.0 to 10.0 8,000 010.0 to 20.0 15,000 020.0 to 30.0 30,000 3000030.0 to 40.0 40,000 040.0 & above 58,000 0
Clearing Site Project Cost (Mil.) $ 240,000Less than 1.0 15,000 01.0 to 2.0 30,000 02.0 to 5.0 45,000 05.0 to 10.0 115,000 010.0 to 20.0 220,000 020.0 to 30.0 240,000 24000030.0 to 40.0 250,000 040.0 & above 490,000 0
Construction Layout Project Cost(Mil.) $ 220,000Less than 1.0 7,000 01.0 to 2.0 20,000 02.0 to 5.0 42,000 05.0 to 10.0 87,000 010.0 to 20.0 160,000 020.0 to 30.0 220,000 22000030.0 to 40.0 490,000 040.0 & above 890,000 0
PROJECT TOTAL $32,931,619
13 Page 77

Class 1 - New Construction
CONTINGENCIES & ESCALATION YY = Number of Years until midpoint of construction duration plus
number of years until construction start. If midpoint is less than 2 years from the date of this estimate, no escalation is required.
Maximum value = 10%
0.00
2.00
32931618.63 1.000 1.00 $32,931,619Project Total Contingencies (1+C) 1 + [0.01 (Y+1) (Y-
2)]Construction Estimate for PD
Project Cost(Mil.) Contingencies (C) Percent
Average Construction Duration in Years
0-10 3% 1 0.00010-20 2.50% 2 0.00020-50 2% 3 0.000Over 50 1.50% 4 0.000
CONSTRUCTION ENGINEERING (CE)
Project Cost (Mil.)% of Construction Cost
Less than 1.0 28.40% 01.0 to 5.0 17.60% 05.0 to 10.0 12.20% 010.0 & above 9.50% 3128504CONSTRUCTION ENGINEERING AMOUNT $3,128,503.77
CONSTRUCTION CHANGE ORDER CONTINGENCIES
Total Federal Participating Items in Millions of $ Construction Change Order Contingency Amount$0 to 0.1 $6,000 00.1 to 0.5 25,000 00.5 to 5.0 25,000 + 4% of amount in excess of $500,000 05.0 to 10.0 205,000 + 3% of amount in excess of $5,000,000 010.0 to 15.0 355,000 + 2% of amount in excess of $10,000,000 015.0 and above 455,000 + 1.5% of amount in excess of $15,000,000 - $500,000 max 500000
724000For State Funded Projects, Contingencies for Change orders = 0CHANGE ORDER CONTINGENCY AMOUNT = $500,000
UTILITIES RELOCATIONS BY COMPANIES/OWNERS
$32,931,619 0.09 $2,963,846 x % or + Estimate =
Construction Cost for Initial Estimate
Use % or utilities detailed estimate
Utility Relocation Cost for Initial Estimate
If there are no utility relocations on the project indicate “No Utilities” in the box above.
RIGHT OF WAY COSTIf there is no ROW cost on the project indicate “No ROW” the box
SUMMARYConstruction Estimate for Initial 32,931,619Construction Engineering (CE) 3,128,504Contingencies 500,000Utilities Relocations 2,963,846Total Construction Cost $39,523,968
Right of Way Cost 0
13 Page 78
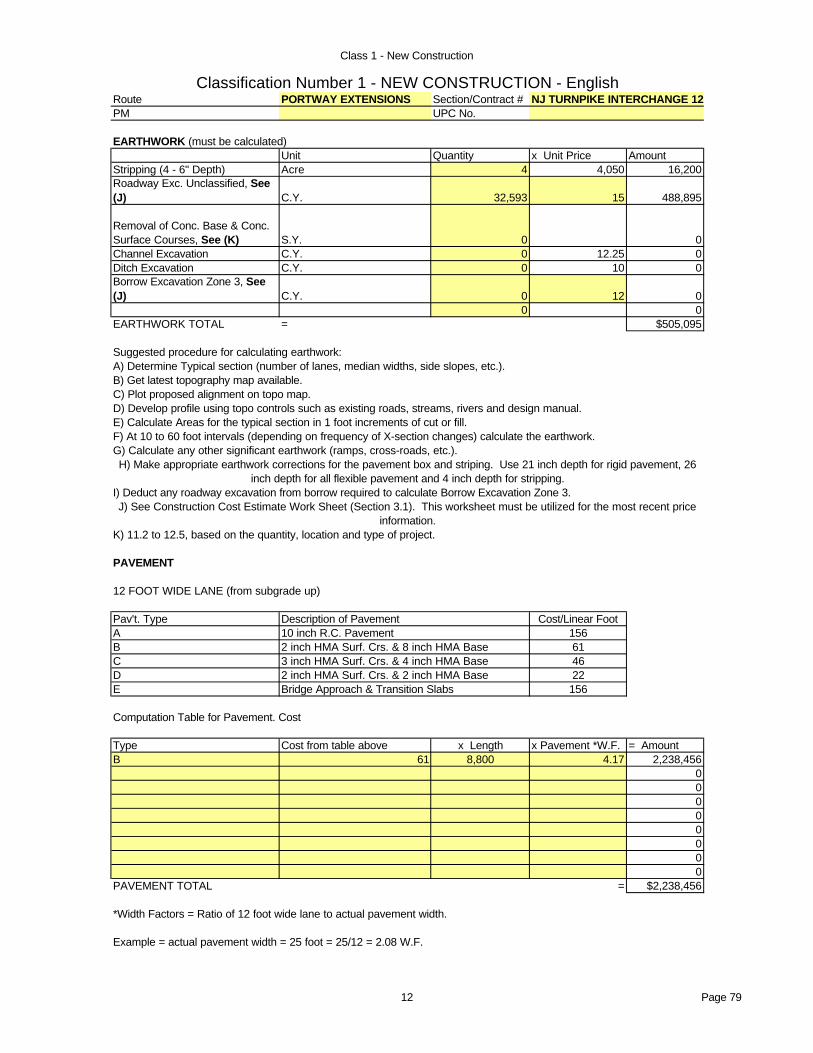
Class 1 - New Construction
Classification Number 1 - NEW CONSTRUCTION - EnglishRoute PORTWAY EXTENSIONS Section/Contract # NJ TURNPIKE INTERCHANGE 12PM UPC No.
EARTHWORK (must be calculated)Unit Quantity x Unit Price Amount
Stripping (4 - 6" Depth) Acre 4 4,050 16,200Roadway Exc. Unclassified, See (J) C.Y. 32,593 15 488,895
Removal of Conc. Base & Conc. Surface Courses, See (K) S.Y. 0 0Channel Excavation C.Y. 0 12.25 0Ditch Excavation C.Y. 0 10 0Borrow Excavation Zone 3, See (J) C.Y. 0 12 0
0 0EARTHWORK TOTAL = $505,095
Suggested procedure for calculating earthwork:A) Determine Typical section (number of lanes, median widths, side slopes, etc.).B) Get latest topography map available.C) Plot proposed alignment on topo map.D) Develop profile using topo controls such as existing roads, streams, rivers and design manual.E) Calculate Areas for the typical section in 1 foot increments of cut or fill.F) At 10 to 60 foot intervals (depending on frequency of X-section changes) calculate the earthwork.G) Calculate any other significant earthwork (ramps, cross-roads, etc.).H) Make appropriate earthwork corrections for the pavement box and striping. Use 21 inch depth for rigid pavement, 26
inch depth for all flexible pavement and 4 inch depth for stripping.I) Deduct any roadway excavation from borrow required to calculate Borrow Excavation Zone 3.J) See Construction Cost Estimate Work Sheet (Section 3.1). This worksheet must be utilized for the most recent price
information.K) 11.2 to 12.5, based on the quantity, location and type of project.
PAVEMENT
12 FOOT WIDE LANE (from subgrade up)
Pav't. Type Cost/Linear FootA 156B 61C 46D 22E 156
Computation Table for Pavement. Cost
Type Cost from table above x Length x Pavement *W.F. = AmountB 61 8,800 4.17 2,238,456
00000000
PAVEMENT TOTAL = $2,238,456
*Width Factors = Ratio of 12 foot wide lane to actual pavement width.
Example = actual pavement width = 25 foot = 25/12 = 2.08 W.F.
Description of Pavement10 inch R.C. Pavement2 inch HMA Surf. Crs. & 8 inch HMA Base3 inch HMA Surf. Crs. & 4 inch HMA Base2 inch HMA Surf. Crs. & 2 inch HMA BaseBridge Approach & Transition Slabs
12 Page 79

Class 1 - New Construction
CONTEXT SENSITIVE DESIGN
Attach additional sheet detailing items and costs of context sensitive design work =
CULVERTS
///////////////////////////////////////////////////////////////////////////////////////////////////////////////////COVER
<-----------------W----------------> <-------------------W-------------------->Type 1 W< 20 Feet Type 2 W> 20 feet
Type Layout (3) Skew (1) Cover (2)Cost Per Sq. Foot
Area w x L exceeds 0-60 0 to 10' 114.751000 Sq. Feet degrees 10' to 20' 147.25
Type 1 Short Culverts Difficult 0-60 0 to 10' 203.50Conditions under 1000 Square Feet degrees 10' to 20' 235.00Area w x L exceeds 0-60 0 to 10' 121.751000 Sq. Feet degrees 10' to 20' 152.50
Type 2 Short Culverts Difficult 0-60 0 to 10' 203.50Conditions under 1000 Square Feet degrees 10' to 20' 235.00
For skews over 60 degrees it will be necessary to make a special analysis and establish a square meter price comparable to above.
Description Area Computation x Cost per Sq. Foot = Amount0000
Culvert Total = 0
BRIDGESFor the Bridge Sketch see the Construction Cost Estimation Preparation Manual1 to 3 spans and 2 side spans (Max. Span 100 feet)H = Clear Height 14 To 23 feet (4)L = 100 to 400 feet & all viaducts over 400 feet (5)
Class Layout Skew (1) Foundation (2)Cost per Sq. Foot
Width at Least 0 to 40 No Piles 134.75I 45 feet Degrees Piles at Stub Abut. 159.75
Piles at Piers & Stub Abut. 174.7540 to 60 No Piles 145.00Degrees Piles at Stub Abut. 168.25
Piles at Piers & Stub Abut. 181.25
12 Page 80

Class 1 - New Construction
For the Bridge Sketch see the Construction Cost Estimation Preparation Manual1 to 3 spans and 2 side spans (Max. Span 100 feet) (3)H = Clear Height 14 feet (4)L = under 400 feet
Class Layout Skew (1) Foundation (2)Cost per Sq. Foot
L exceeds W 0 to 40 No Piles 176.50II Area L x W Degrees On Piles 187.25
exceeds 4500 40 to 60 No Piles 219.75Sq. Feet Degrees On Piles 273.25W exceeds L 0 to 40 No Piles 226.75
III Area L x W Degrees On Piles 299.25exceeds 4500 40 to 60 No Piles 241.50Sq. Feet Degrees On Piles 310.00Width 30 - 0 to 40 No Piles 295.50
IV 45 feet Degrees On Piles 396.75Area W x L under 40 to 60 No Piles 318.254500 Sq. Foot Degrees On Piles 416.25
For the Bridge Sketch see the Construction Cost Estimation Preparation Manual1 to 2 spans (Max. Span 125 feet)H = Clear Height 14 feet (4)L = 100 to 250 feet
Layout Skew (1) Cost/ Sq. FootWidth at Least 0 to 40 157.0040 feet Degrees 182.00
204.5040 to 60 166.50
Minimum Length Degrees 194.75100 feet 217.50
$0Length Width Cost per SF Bridge Total
1. For skews over 60 degrees it will be necessary to make a special analysis and establish a square foot price comparable to above.
2. For very bad foundation conditions requiring unusual lengths or spacing of piles, it will be necessary to establish a square foot price.
3. For longer spans, adjust the cost per square foot to reflect increased cost of structural members.
4. For span bridges, it is expected the length of the side span will be in- creased in proportion to any increase in height. Because of the resultant increase in deck area, the square foot price will remain approximately the same in the range of heights shown. For extremely high structures (particularly for viaducts), square foot prices will have to be increased.
5. For structures over 400 foot long (viaducts), reduce the cost per square foot if repetitive span length and forming can be used. Reduce by $0.50 for lengths from 400 to 600 feet and by $1.00 for lengths over 600 feet. (Do not forget
adjustments (3) and (4) above on viaducts).
Foundation (2)No Piles
Piles at Piers & Semi-Stub Abut.
Piles at Semi-Stub Abut.Piles at Piers & Semi-Stub Abut.No PilesPiles at Semi-Stub Abut.
12 Page 81

Class 1 - New Construction
6. For statically indeterminate structures, square foot prices will have to be established.
Structure DescriptionCalculated Sq. Foot of Bridge Deck
x Cost Per Square Foot = Amount
000000000000
Sub Total $0Clearing Site Bridge *0-3% of Sub Total 0
%
BRIDGE TOTAL $0*Pick appropriate percent based on the size, type and materials of existing structure
DRAINAGE (includes inlets and cross drains)
Rural 0 364356 0project length (miles) x cost per mile = Amount
Urban 1.7 544280 925,276project length (miles) x cost per mile = Amount
The above are the total costs of basins, manholes, longitudinal and transverse pipes, underdrains, headwalls, protecting curbs, aprons, etc. for a divided highway with a depressed median. The costs are assumed to apply to 4, 6 or 8 lane
sections since there will be no appreciable difference in the number of basins or the sizes or lengths of pipes.
Frontage Road & Ramp Drainage
55 0x cost per foot = Amount
DRAINAGE TOTAL = $925,276
INCIDENTAL ITEMS
Item Cost / L.F. x Quantity = AmountBeam Guide Rail 16.75 0 0Fence 6 Foot High 18.25 0 09" X 16" Conc. Vertical Curb 13.75 17,600 242,00015" X 41" Conc. Barrier Curb 50.25 0 024" X 41" Conc. Barrier Curb 73.25 0 024" X Variable Conc. Barrier Curb 46 0 0Sign Bridge 308,000 0 0Cantilever Sign Structure 60,500 0 0INCIDENTAL ITEMS TOTAL = $242,000
0length of ramp or frontage rd. in feet
12 Page 82

Class 1 - New Construction
LANDSCAPE
Quantity x Unit Prices = AmountTopsoil and Seeding (Mainline) Length of Project in miles 1.7 112,815 191,786Planting (Mainline) Length of Project in miles 1.7 64,500 109,650Topsoil, Seeding, Planting (Finger Ramp Number of Finger Ramps 0 12,500 0Topsoil, Seeding, Planting (Loop Ramp) Number of Loop Ramps 0 20,000 0Topsoil, Seeding (Access Road) Length of Access Road in Feet 0 7.9 0LANDSCAPE TOTAL = $301,436
NOISE ABATEMENT
Unit Quantity x Cost = AmountNoise Wall L.F. 0 305 0
000
NOISE ABATEMENT TOTAL = 0
GENERAL ITEMS
Item Project Length (miles) x Cost/Mile = AmountField Office 1.7 44,260 75,242Materials Field Laboratory 1.7 28,970 49,249Erosion Control during Construction 1.7 64,375 109,438GENERAL ITEMS TOTAL = $233,929
SUMMARY
Route PORTWAY EXTENSIONS Section/Contract #
NJ TURNPIKE INTERCHANGE 12
PM 0 UPC No. 0
Work TypeTotals from other pages
Earthwork 505,095Pavement 2,238,456Context Sensitive Design 0Culverts 0Bridges 0Drainage 925,276Incidental Items 242,000Landscape 301,436Noise Abatement 0General Items 233,929
PROJECT SUBTOTAL $4,446,191
12 Page 83

Class 1 - New Construction
Other Items Proj. Subtotal Range Choice AmountLighting, Traffic Stripes, Signs and Delineators
3% of Proj. Subtotal 133,386
Maintenance of Traffic1.5% of Proj. Subtotal 66,693
Training1% of Proj. Subtotal 44,462
Mobilization 400,157
Project Cost < 5.0 (Mil.)9% of Proj. Subtotal 400157
Project Cost 5.0 & above10% of Proj. Subtotal 0
Progress Schedule Project Cost(Mil.) $ 6,000Less than 2.0 0 02.0 to 5.0 6,000 60005.0 to 10.0 8,000 010.0 to 20.0 15,000 020.0 to 30.0 30,000 030.0 to 40.0 40,000 040.0 & above 58,000 0
Clearing Site Project Cost (Mil.) $ 45,000Less than 1.0 15,000 01.0 to 2.0 30,000 02.0 to 5.0 45,000 450005.0 to 10.0 115,000 010.0 to 20.0 220,000 020.0 to 30.0 240,000 030.0 to 40.0 250,000 040.0 & above 490,000 0
Construction Layout Project Cost(Mil.) $ 42,000Less than 1.0 7,000 01.0 to 2.0 20,000 02.0 to 5.0 42,000 420005.0 to 10.0 87,000 010.0 to 20.0 160,000 020.0 to 30.0 220,000 030.0 to 40.0 490,000 040.0 & above 890,000 0
PROJECT TOTAL $5,183,889
12 Page 84
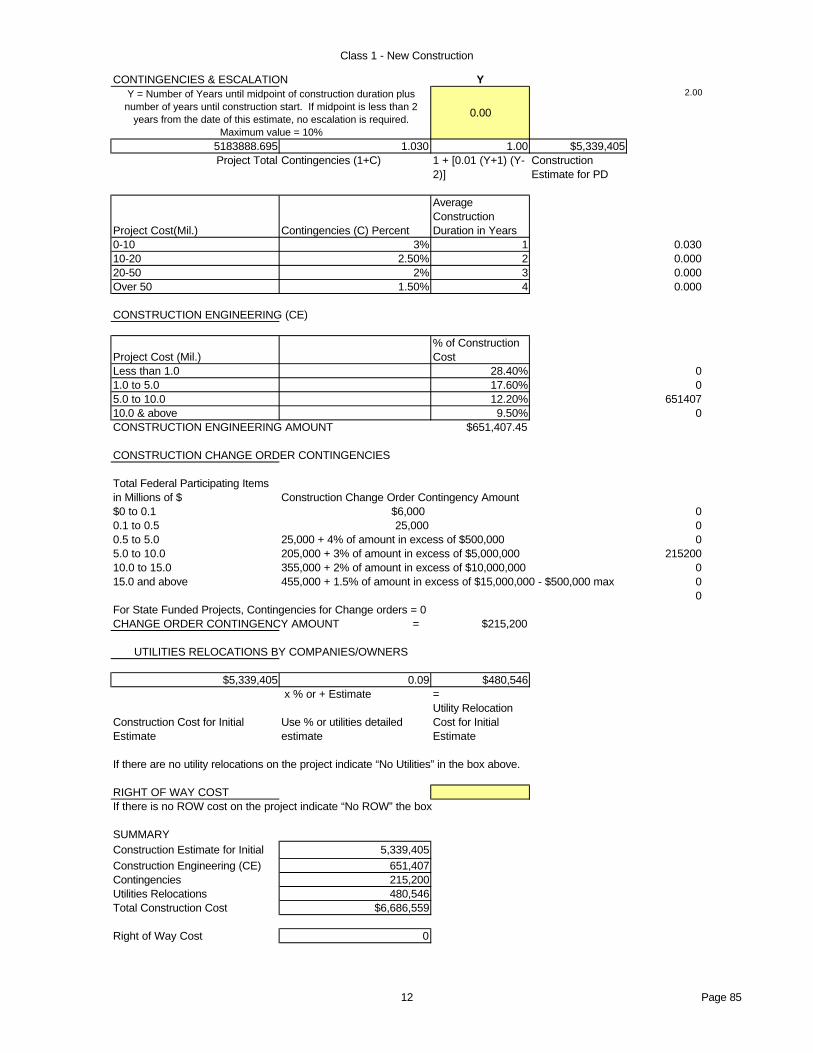
Class 1 - New Construction
CONTINGENCIES & ESCALATION YY = Number of Years until midpoint of construction duration plus
number of years until construction start. If midpoint is less than 2 years from the date of this estimate, no escalation is required.
Maximum value = 10%
0.00
2.00
5183888.695 1.030 1.00 $5,339,405Project Total Contingencies (1+C) 1 + [0.01 (Y+1) (Y-
2)]Construction Estimate for PD
Project Cost(Mil.) Contingencies (C) Percent
Average Construction Duration in Years
0-10 3% 1 0.03010-20 2.50% 2 0.00020-50 2% 3 0.000Over 50 1.50% 4 0.000
CONSTRUCTION ENGINEERING (CE)
Project Cost (Mil.)% of Construction Cost
Less than 1.0 28.40% 01.0 to 5.0 17.60% 05.0 to 10.0 12.20% 65140710.0 & above 9.50% 0CONSTRUCTION ENGINEERING AMOUNT $651,407.45
CONSTRUCTION CHANGE ORDER CONTINGENCIES
Total Federal Participating Items in Millions of $ Construction Change Order Contingency Amount$0 to 0.1 $6,000 00.1 to 0.5 25,000 00.5 to 5.0 25,000 + 4% of amount in excess of $500,000 05.0 to 10.0 205,000 + 3% of amount in excess of $5,000,000 21520010.0 to 15.0 355,000 + 2% of amount in excess of $10,000,000 015.0 and above 455,000 + 1.5% of amount in excess of $15,000,000 - $500,000 max 0
0For State Funded Projects, Contingencies for Change orders = 0CHANGE ORDER CONTINGENCY AMOUNT = $215,200
UTILITIES RELOCATIONS BY COMPANIES/OWNERS
$5,339,405 0.09 $480,546 x % or + Estimate =
Construction Cost for Initial Estimate
Use % or utilities detailed estimate
Utility Relocation Cost for Initial Estimate
If there are no utility relocations on the project indicate “No Utilities” in the box above.
RIGHT OF WAY COSTIf there is no ROW cost on the project indicate “No ROW” the box
SUMMARYConstruction Estimate for Initial 5,339,405Construction Engineering (CE) 651,407Contingencies 215,200Utilities Relocations 480,546Total Construction Cost $6,686,559
Right of Way Cost 0
12 Page 85

Class 1 - New Construction
Classification Number 1 - NEW CONSTRUCTION - EnglishRoute PORTWAY EXTENSIONS Section/Contract # NJ TURNPIKE INTERCHANGE 10PM UPC No.
EARTHWORK (must be calculated)Unit Quantity x Unit Price Amount
Stripping (4 - 6" Depth) Acre 5.8 4,050 23,490Roadway Exc. Unclassified, See (J) C.Y. 0 15 0
Removal of Conc. Base & Conc. Surface Courses, See (K) S.Y. 0 0Channel Excavation C.Y. 0 12.25 0Ditch Excavation C.Y. 0 10 0Borrow Excavation Zone 3, See (J) C.Y. 93,541 12 1,122,492
0 0EARTHWORK TOTAL = $1,145,982
Suggested procedure for calculating earthwork:A) Determine Typical section (number of lanes, median widths, side slopes, etc.).B) Get latest topography map available.C) Plot proposed alignment on topo map.D) Develop profile using topo controls such as existing roads, streams, rivers and design manual.E) Calculate Areas for the typical section in 1 foot increments of cut or fill.F) At 10 to 60 foot intervals (depending on frequency of X-section changes) calculate the earthwork.G) Calculate any other significant earthwork (ramps, cross-roads, etc.).H) Make appropriate earthwork corrections for the pavement box and striping. Use 21 inch depth for rigid pavement, 26
inch depth for all flexible pavement and 4 inch depth for stripping.I) Deduct any roadway excavation from borrow required to calculate Borrow Excavation Zone 3.J) See Construction Cost Estimate Work Sheet (Section 3.1). This worksheet must be utilized for the most recent price
information.K) 11.2 to 12.5, based on the quantity, location and type of project.
PAVEMENT
12 FOOT WIDE LANE (from subgrade up)
Pav't. Type Cost/Linear FootA 156B 61C 46D 22E 156
Computation Table for Pavement. Cost
Type Cost from table above x Length x Pavement *W.F. = AmountB 61 12,628 2.08 1,602,241E 156 200 2.08 64,896
0000000
PAVEMENT TOTAL = $1,667,137
*Width Factors = Ratio of 12 foot wide lane to actual pavement width.
Example = actual pavement width = 25 foot = 25/12 = 2.08 W.F.
Description of Pavement10 inch R.C. Pavement2 inch HMA Surf. Crs. & 8 inch HMA Base3 inch HMA Surf. Crs. & 4 inch HMA Base2 inch HMA Surf. Crs. & 2 inch HMA BaseBridge Approach & Transition Slabs
10 Page 86

Class 1 - New Construction
CONTEXT SENSITIVE DESIGN
Attach additional sheet detailing items and costs of context sensitive design work =
CULVERTS
///////////////////////////////////////////////////////////////////////////////////////////////////////////////////COVER
<-----------------W----------------> <-------------------W-------------------->Type 1 W< 20 Feet Type 2 W> 20 feet
Type Layout (3) Skew (1) Cover (2)Cost Per Sq. Foot
Area w x L exceeds 0-60 0 to 10' 114.751000 Sq. Feet degrees 10' to 20' 147.25
Type 1 Short Culverts Difficult 0-60 0 to 10' 203.50Conditions under 1000 Square Feet degrees 10' to 20' 235.00Area w x L exceeds 0-60 0 to 10' 121.751000 Sq. Feet degrees 10' to 20' 152.50
Type 2 Short Culverts Difficult 0-60 0 to 10' 203.50Conditions under 1000 Square Feet degrees 10' to 20' 235.00
For skews over 60 degrees it will be necessary to make a special analysis and establish a square meter price comparable to above.
Description Area Computation x Cost per Sq. Foot = Amount0000
Culvert Total = 0
BRIDGESFor the Bridge Sketch see the Construction Cost Estimation Preparation Manual1 to 3 spans and 2 side spans (Max. Span 100 feet)H = Clear Height 14 To 23 feet (4)L = 100 to 400 feet & all viaducts over 400 feet (5)
Class Layout Skew (1) Foundation (2)Cost per Sq. Foot
Width at Least 0 to 40 No Piles 134.75I 45 feet Degrees Piles at Stub Abut. 159.75
Piles at Piers & Stub Abut. 174.7540 to 60 No Piles 145.00Degrees Piles at Stub Abut. 168.25
Piles at Piers & Stub Abut. 181.25
10 Page 87
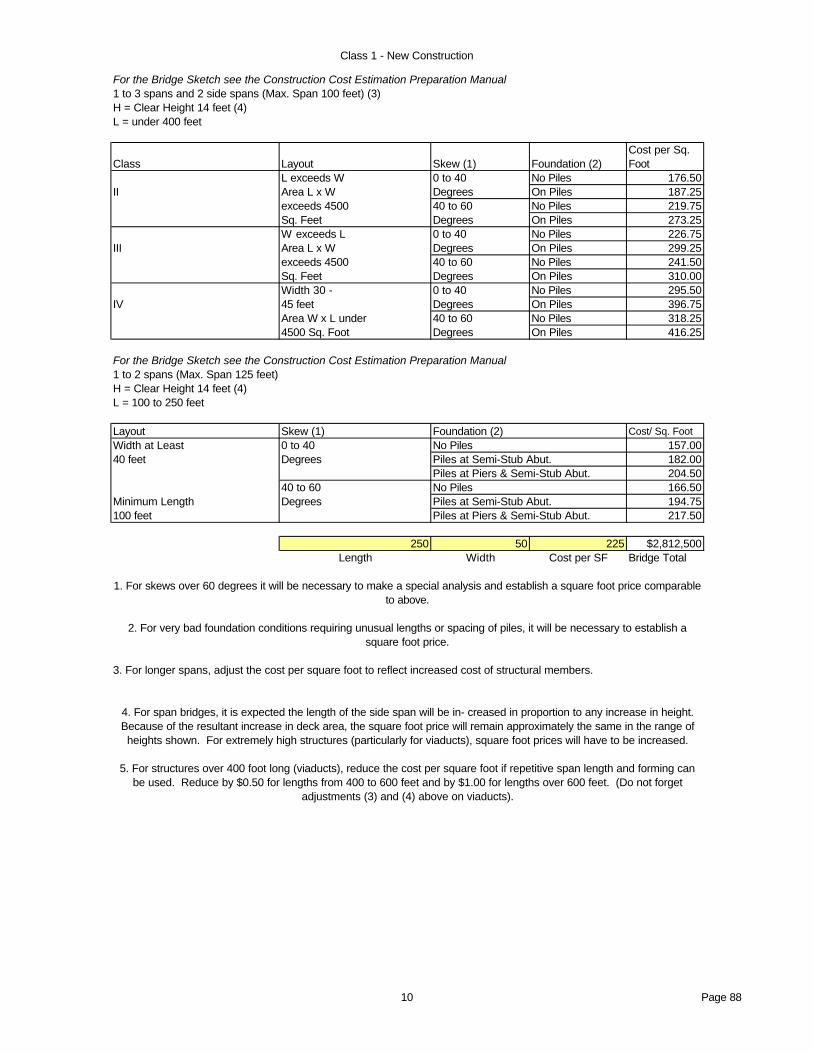
Class 1 - New Construction
For the Bridge Sketch see the Construction Cost Estimation Preparation Manual1 to 3 spans and 2 side spans (Max. Span 100 feet) (3)H = Clear Height 14 feet (4)L = under 400 feet
Class Layout Skew (1) Foundation (2)Cost per Sq. Foot
L exceeds W 0 to 40 No Piles 176.50II Area L x W Degrees On Piles 187.25
exceeds 4500 40 to 60 No Piles 219.75Sq. Feet Degrees On Piles 273.25W exceeds L 0 to 40 No Piles 226.75
III Area L x W Degrees On Piles 299.25exceeds 4500 40 to 60 No Piles 241.50Sq. Feet Degrees On Piles 310.00Width 30 - 0 to 40 No Piles 295.50
IV 45 feet Degrees On Piles 396.75Area W x L under 40 to 60 No Piles 318.254500 Sq. Foot Degrees On Piles 416.25
For the Bridge Sketch see the Construction Cost Estimation Preparation Manual1 to 2 spans (Max. Span 125 feet)H = Clear Height 14 feet (4)L = 100 to 250 feet
Layout Skew (1) Cost/ Sq. FootWidth at Least 0 to 40 157.0040 feet Degrees 182.00
204.5040 to 60 166.50
Minimum Length Degrees 194.75100 feet 217.50
250 50 225 $2,812,500Length Width Cost per SF Bridge Total
1. For skews over 60 degrees it will be necessary to make a special analysis and establish a square foot price comparable to above.
2. For very bad foundation conditions requiring unusual lengths or spacing of piles, it will be necessary to establish a square foot price.
3. For longer spans, adjust the cost per square foot to reflect increased cost of structural members.
4. For span bridges, it is expected the length of the side span will be in- creased in proportion to any increase in height. Because of the resultant increase in deck area, the square foot price will remain approximately the same in the range of heights shown. For extremely high structures (particularly for viaducts), square foot prices will have to be increased.
5. For structures over 400 foot long (viaducts), reduce the cost per square foot if repetitive span length and forming can be used. Reduce by $0.50 for lengths from 400 to 600 feet and by $1.00 for lengths over 600 feet. (Do not forget
adjustments (3) and (4) above on viaducts).
Foundation (2)No Piles
Piles at Piers & Semi-Stub Abut.
Piles at Semi-Stub Abut.Piles at Piers & Semi-Stub Abut.No PilesPiles at Semi-Stub Abut.
10 Page 88

Class 1 - New Construction
6. For statically indeterminate structures, square foot prices will have to be established.
Structure DescriptionCalculated Sq. Foot of Bridge Deck
x Cost Per Square Foot = Amount
000000000000
Sub Total $0Clearing Site Bridge *0-3% of Sub Total 0
%
BRIDGE TOTAL $0*Pick appropriate percent based on the size, type and materials of existing structure
DRAINAGE (includes inlets and cross drains)
Rural 0 364356 0project length (miles) x cost per mile = Amount
Urban 0 544280 0project length (miles) x cost per mile = Amount
The above are the total costs of basins, manholes, longitudinal and transverse pipes, underdrains, headwalls, protecting curbs, aprons, etc. for a divided highway with a depressed median. The costs are assumed to apply to 4, 6 or 8 lane
sections since there will be no appreciable difference in the number of basins or the sizes or lengths of pipes.
Frontage Road & Ramp Drainage
55 694,540x cost per foot = Amount
DRAINAGE TOTAL = $694,540
INCIDENTAL ITEMS
Item Cost / L.F. x Quantity = AmountBeam Guide Rail 16.75 6,314 105,760Fence 6 Foot High 18.25 0 09" X 16" Conc. Vertical Curb 13.75 25,256 347,27015" X 41" Conc. Barrier Curb 50.25 0 024" X 41" Conc. Barrier Curb 73.25 0 024" X Variable Conc. Barrier Curb 46 0 0Sign Bridge 308,000 0 0Cantilever Sign Structure 60,500 0 0INCIDENTAL ITEMS TOTAL = $453,030
12,628length of ramp or frontage rd. in feet
10 Page 89

Class 1 - New Construction
LANDSCAPE
Quantity x Unit Prices = AmountTopsoil and Seeding (Mainline) Length of Project in miles 0 112,815 0Planting (Mainline) Length of Project in miles 0 64,500 0Topsoil, Seeding, Planting (Finger Ramp Number of Finger Ramps 2 12,500 25,000Topsoil, Seeding, Planting (Loop Ramp) Number of Loop Ramps 1 20,000 20,000Topsoil, Seeding (Access Road) Length of Access Road in Feet 0 7.9 0LANDSCAPE TOTAL = $45,000
NOISE ABATEMENT
Unit Quantity x Cost = AmountNoise Wall L.F. 0 305 0
000
NOISE ABATEMENT TOTAL = 0
GENERAL ITEMS
Item Project Length (miles) x Cost/Mile = AmountField Office 2.4 44,260 106,224Materials Field Laboratory 2.4 28,970 69,528Erosion Control during Construction 2.4 64,375 154,500GENERAL ITEMS TOTAL = $330,252
SUMMARY
Route PORTWAY EXTENSIONS Section/Contract #
NJ TURNPIKE INTERCHANGE 10
PM 0 UPC No. 0
Work TypeTotals from other pages
Earthwork 1,145,982Pavement 1,667,137Context Sensitive Design 0Culverts 0Bridges 2,812,500Drainage 694,540Incidental Items 453,030Landscape 45,000Noise Abatement 0General Items 330,252
PROJECT SUBTOTAL $7,148,440
10 Page 90

Class 1 - New Construction
Other Items Proj. Subtotal Range Choice AmountLighting, Traffic Stripes, Signs and Delineators
3% of Proj. Subtotal 214,453
Maintenance of Traffic1.5% of Proj. Subtotal 107,227
Training1% of Proj. Subtotal 71,484
Mobilization 714,844
Project Cost < 5.0 (Mil.)9% of Proj. Subtotal 0
Project Cost 5.0 & above10% of Proj. Subtotal 714844
Progress Schedule Project Cost(Mil.) $ 8,000Less than 2.0 0 02.0 to 5.0 6,000 05.0 to 10.0 8,000 800010.0 to 20.0 15,000 020.0 to 30.0 30,000 030.0 to 40.0 40,000 040.0 & above 58,000 0
Clearing Site Project Cost (Mil.) $ 115,000Less than 1.0 15,000 01.0 to 2.0 30,000 02.0 to 5.0 45,000 05.0 to 10.0 115,000 11500010.0 to 20.0 220,000 020.0 to 30.0 240,000 030.0 to 40.0 250,000 040.0 & above 490,000 0
Construction Layout Project Cost(Mil.) $ 87,000Less than 1.0 7,000 01.0 to 2.0 20,000 02.0 to 5.0 42,000 05.0 to 10.0 87,000 8700010.0 to 20.0 160,000 020.0 to 30.0 220,000 030.0 to 40.0 490,000 040.0 & above 890,000 0
PROJECT TOTAL $8,466,448
10 Page 91
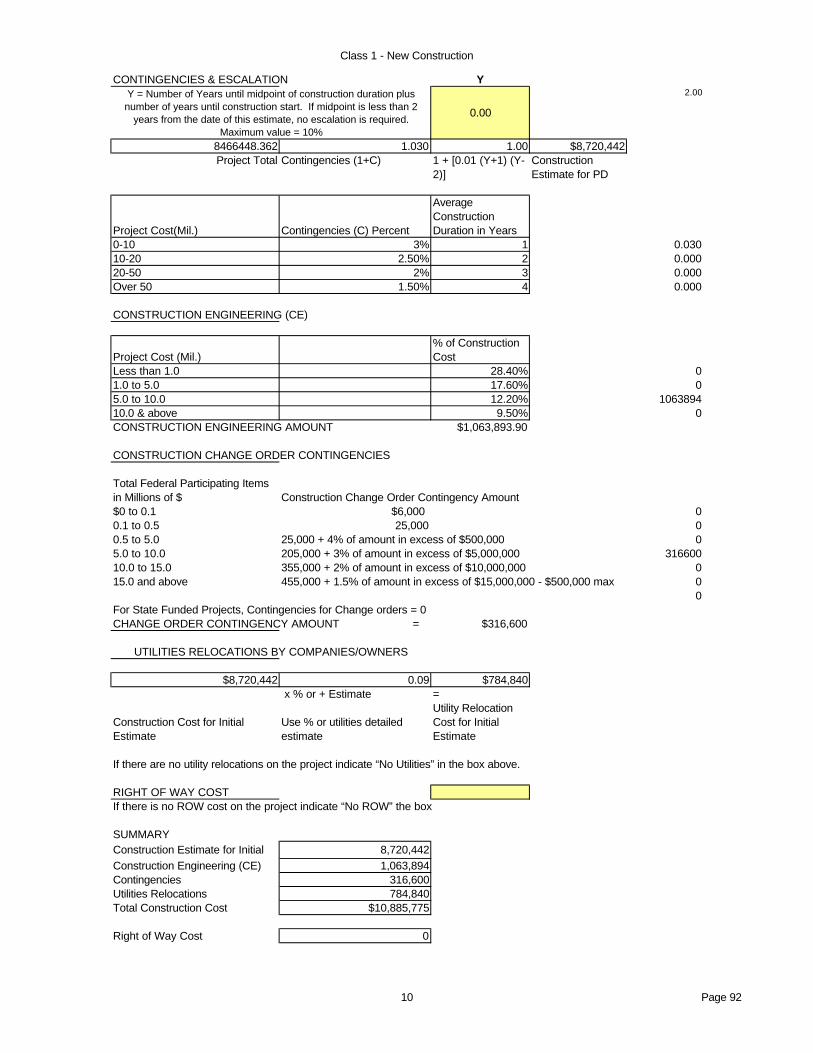
Class 1 - New Construction
CONTINGENCIES & ESCALATION YY = Number of Years until midpoint of construction duration plus
number of years until construction start. If midpoint is less than 2 years from the date of this estimate, no escalation is required.
Maximum value = 10%
0.00
2.00
8466448.362 1.030 1.00 $8,720,442Project Total Contingencies (1+C) 1 + [0.01 (Y+1) (Y-
2)]Construction Estimate for PD
Project Cost(Mil.) Contingencies (C) Percent
Average Construction Duration in Years
0-10 3% 1 0.03010-20 2.50% 2 0.00020-50 2% 3 0.000Over 50 1.50% 4 0.000
CONSTRUCTION ENGINEERING (CE)
Project Cost (Mil.)% of Construction Cost
Less than 1.0 28.40% 01.0 to 5.0 17.60% 05.0 to 10.0 12.20% 106389410.0 & above 9.50% 0CONSTRUCTION ENGINEERING AMOUNT $1,063,893.90
CONSTRUCTION CHANGE ORDER CONTINGENCIES
Total Federal Participating Items in Millions of $ Construction Change Order Contingency Amount$0 to 0.1 $6,000 00.1 to 0.5 25,000 00.5 to 5.0 25,000 + 4% of amount in excess of $500,000 05.0 to 10.0 205,000 + 3% of amount in excess of $5,000,000 31660010.0 to 15.0 355,000 + 2% of amount in excess of $10,000,000 015.0 and above 455,000 + 1.5% of amount in excess of $15,000,000 - $500,000 max 0
0For State Funded Projects, Contingencies for Change orders = 0CHANGE ORDER CONTINGENCY AMOUNT = $316,600
UTILITIES RELOCATIONS BY COMPANIES/OWNERS
$8,720,442 0.09 $784,840 x % or + Estimate =
Construction Cost for Initial Estimate
Use % or utilities detailed estimate
Utility Relocation Cost for Initial Estimate
If there are no utility relocations on the project indicate “No Utilities” in the box above.
RIGHT OF WAY COSTIf there is no ROW cost on the project indicate “No ROW” the box
SUMMARYConstruction Estimate for Initial 8,720,442Construction Engineering (CE) 1,063,894Contingencies 316,600Utilities Relocations 784,840Total Construction Cost $10,885,775
Right of Way Cost 0
10 Page 92
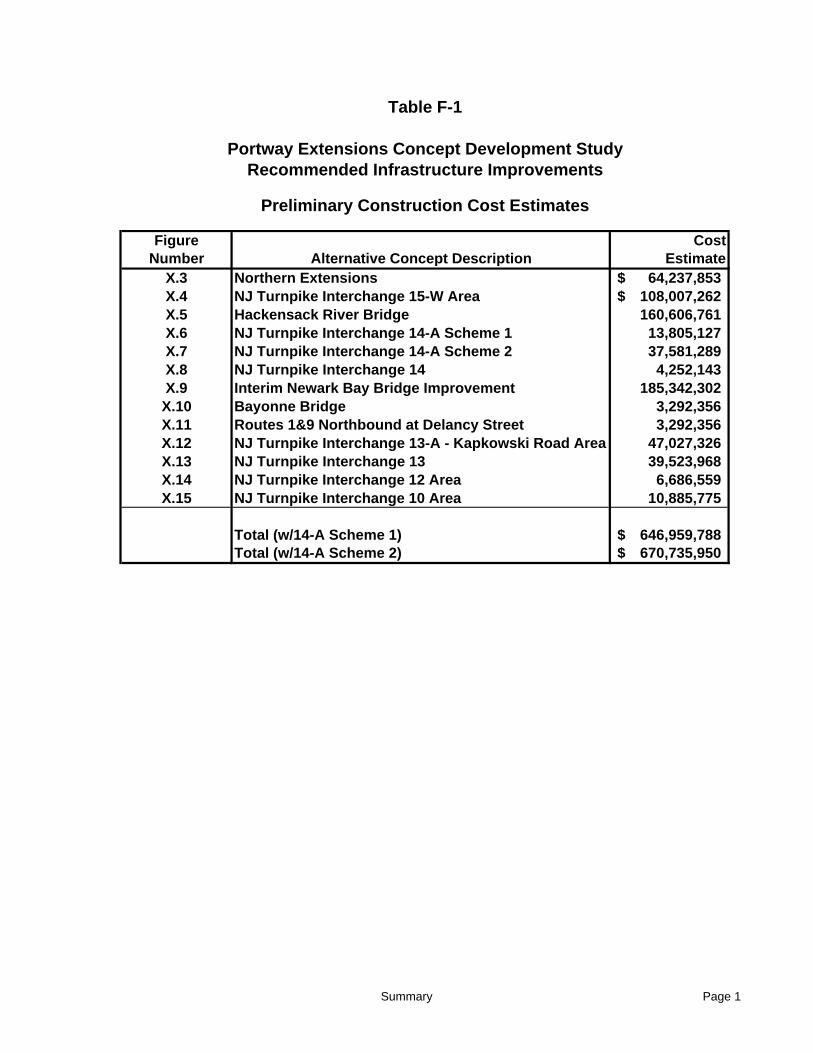
Figure CostNumber Alternative Concept Description Estimate
X.3 Northern Extensions 64,237,853$ X.4 NJ Turnpike Interchange 15-W Area 108,007,262$ X.5 Hackensack River Bridge 160,606,761 X.6 NJ Turnpike Interchange 14-A Scheme 1 13,805,127 X.7 NJ Turnpike Interchange 14-A Scheme 2 37,581,289 X.8 NJ Turnpike Interchange 14 4,252,143 X.9 Interim Newark Bay Bridge Improvement 185,342,302 X.10 Bayonne Bridge 3,292,356 X.11 Routes 1&9 Northbound at Delancy Street 3,292,356 X.12 NJ Turnpike Interchange 13-A - Kapkowski Road Area 47,027,326 X.13 NJ Turnpike Interchange 13 39,523,968 X.14 NJ Turnpike Interchange 12 Area 6,686,559 X.15 NJ Turnpike Interchange 10 Area 10,885,775
Total (w/14-A Scheme 1) 646,959,788$ Total (w/14-A Scheme 2) 670,735,950$
Portway Extensions Concept Development StudyRecommended Infrastructure Improvements
Table F-1
Preliminary Construction Cost Estimates
Summary Page 1