Embed Size (px)
Citation preview
Appendix FW-1-R: Reference System, Feb 21-27, 2014 Singer, Delp et al. (LBNL)
ARB-11-311: Reducing In-Home Exposure to Air Pollution Final Report 1
Appendix FW-1-R. Results for Reference System, February 21-27, 2014.
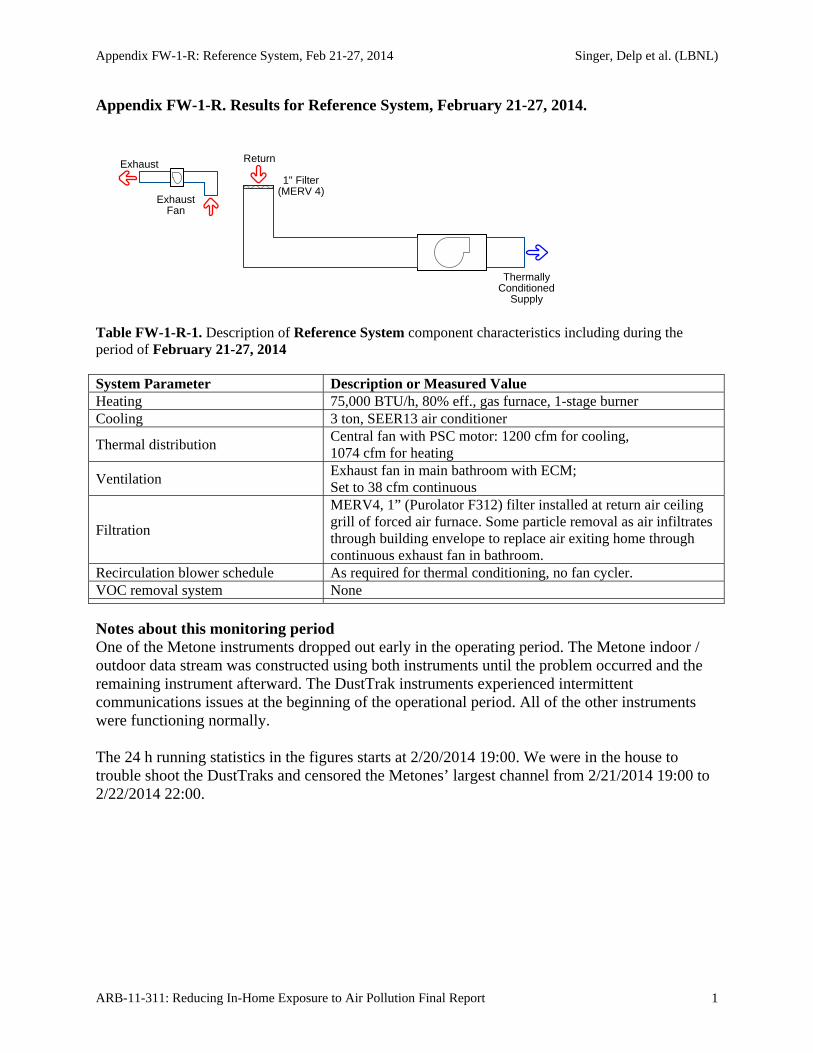
Table FW-1-R-1. Description of Reference System component characteristics including during the period of February 21-27, 2014 System Parameter Description or Measured Value Heating 75,000 BTU/h, 80% eff., gas furnace, 1-stage burner Cooling 3 ton, SEER13 air conditioner
Thermal distribution Central fan with PSC motor: 1200 cfm for cooling, 1074 cfm for heating
Ventilation Exhaust fan in main bathroom with ECM; Set to 38 cfm continuous
Filtration
MERV4, 1” (Purolator F312) filter installed at return air ceiling grill of forced air furnace. Some particle removal as air infiltrates through building envelope to replace air exiting home through continuous exhaust fan in bathroom.
Recirculation blower schedule As required for thermal conditioning, no fan cycler. VOC removal system None
Notes about this monitoring period One of the Metone instruments dropped out early in the operating period. The Metone indoor / outdoor data stream was constructed using both instruments until the problem occurred and the remaining instrument afterward. The DustTrak instruments experienced intermittent communications issues at the beginning of the operational period. All of the other instruments were functioning normally. The 24 h running statistics in the figures starts at 2/20/2014 19:00. We were in the house to trouble shoot the DustTraks and censored the Metones’ largest channel from 2/21/2014 19:00 to 2/22/2014 22:00.
Exhaust
ThermallyConditioned
Supply
ExhaustFan
1" Filter(MERV 4)
Return
Appendix FW-1-R: Reference System, Feb 21-27, 2014 Singer, Delp et al. (LBNL)
ARB-11-311: Reducing In-Home Exposure to Air Pollution Final Report 2
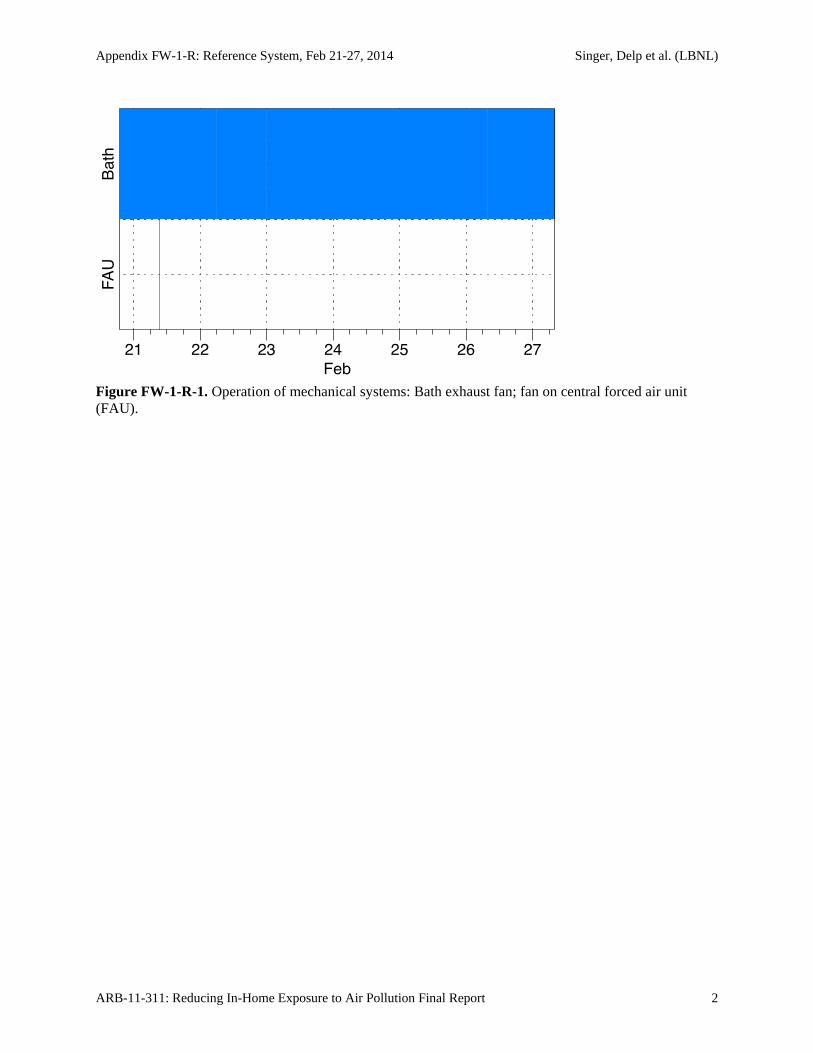
Figure FW-1-R-1. Operation of mechanical systems: Bath exhaust fan; fan on central forced air unit (FAU).
Appendix FW-1-R: Reference System, Feb 21-27, 2014 Singer, Delp et al. (LBNL)
ARB-11-311: Reducing In-Home Exposure to Air Pollution Final Report 3
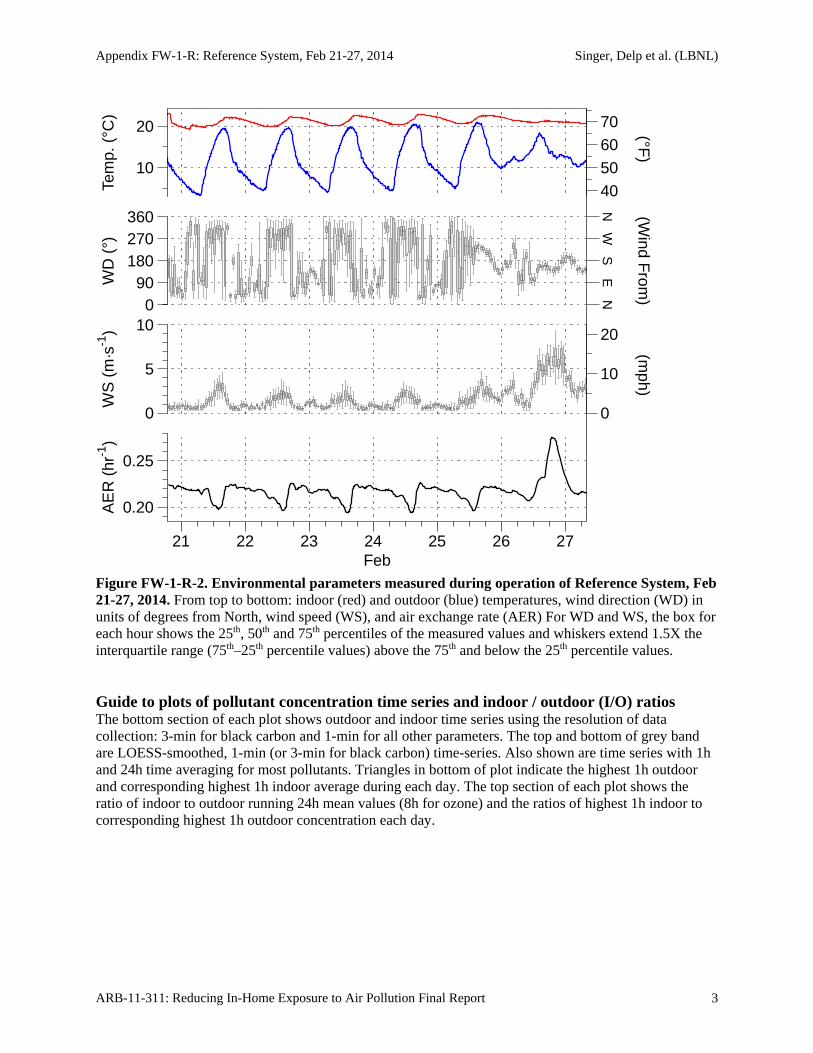
Figure FW-1-R-2. Environmental parameters measured during operation of Reference System, Feb 21-27, 2014. From top to bottom: indoor (red) and outdoor (blue) temperatures, wind direction (WD) in units of degrees from North, wind speed (WS), and air exchange rate (AER) For WD and WS, the box for each hour shows the 25th, 50th and 75th percentiles of the measured values and whiskers extend 1.5X the interquartile range (75th–25th percentile values) above the 75th and below the 25th percentile values. Guide to plots of pollutant concentration time series and indoor / outdoor (I/O) ratios The bottom section of each plot shows outdoor and indoor time series using the resolution of data collection: 3-min for black carbon and 1-min for all other parameters. The top and bottom of grey band are LOESS-smoothed, 1-min (or 3-min for black carbon) time-series. Also shown are time series with 1h and 24h time averaging for most pollutants. Triangles in bottom of plot indicate the highest 1h outdoor and corresponding highest 1h indoor average during each day. The top section of each plot shows the ratio of indoor to outdoor running 24h mean values (8h for ozone) and the ratios of highest 1h indoor to corresponding highest 1h outdoor concentration each day.
0
10
20
40506070
NE
SW
N
(mph)
(Wind F
rom)
(°F)
AE
R (
hr-1
)
0.20
0.25
WS
(m
·s-1
)
0
5
10
WD
(°)
090
180270360
Tem
p. (
°C)
10
20
21 22 23 24 25 26 27Feb
Appendix FW-1-R: Reference System, Feb 21-27, 2014 Singer, Delp et al. (LBNL)
ARB-11-311: Reducing In-Home Exposure to Air Pollution Final Report 4
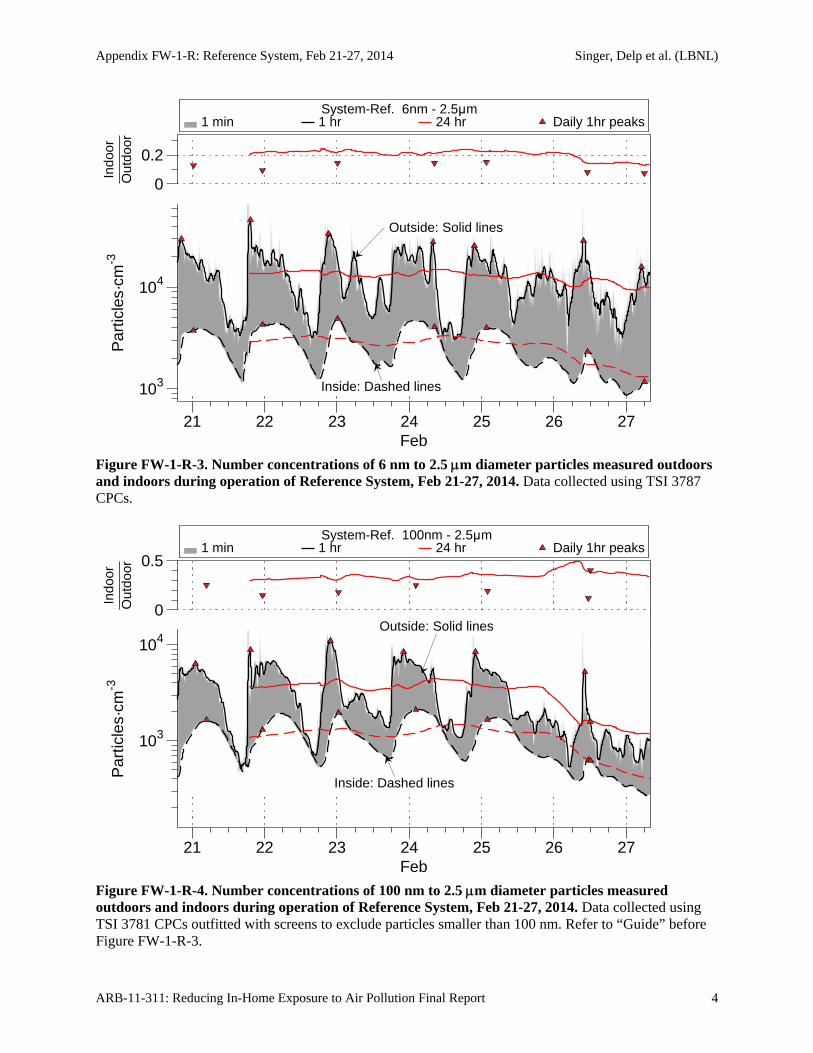
Figure FW-1-R-3. Number concentrations of 6 nm to 2.5 m diameter particles measured outdoors and indoors during operation of Reference System, Feb 21-27, 2014. Data collected using TSI 3787 CPCs.
Figure FW-1-R-4. Number concentrations of 100 nm to 2.5 m diameter particles measured outdoors and indoors during operation of Reference System, Feb 21-27, 2014. Data collected using TSI 3781 CPCs outfitted with screens to exclude particles smaller than 100 nm. Refer to “Guide” before Figure FW-1-R-3.
1 min 1 hr 24 hr Daily 1hr peaks System-Ref. 6nm - 2.5μm
Outside: Solid lines
Inside: Dashed lines
Par
ticle
s·cm
-3
103
104
Indo
orO
utdo
or
0
0.2
21 22 23 24 25 26 27Feb
1 min 1 hr 24 hr Daily 1hr peaks System-Ref. 100nm - 2.5μm
Outside: Solid lines
Inside: Dashed lines
Par
ticle
s·cm
-3
103
104
Indo
orO
utdo
or
0
0.5
21 22 23 24 25 26 27Feb
Appendix FW-1-R: Reference System, Feb 21-27, 2014 Singer, Delp et al. (LBNL)
ARB-11-311: Reducing In-Home Exposure to Air Pollution Final Report 5
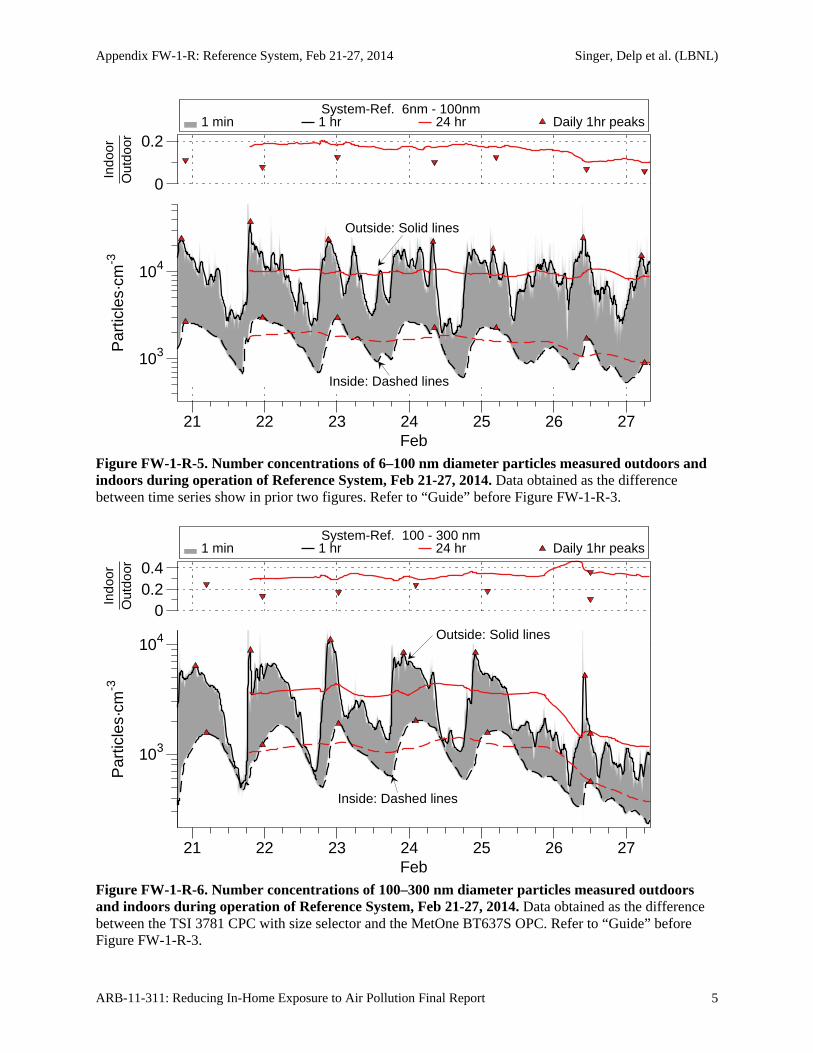
Figure FW-1-R-5. Number concentrations of 6–100 nm diameter particles measured outdoors and indoors during operation of Reference System, Feb 21-27, 2014. Data obtained as the difference between time series show in prior two figures. Refer to “Guide” before Figure FW-1-R-3.
Figure FW-1-R-6. Number concentrations of 100–300 nm diameter particles measured outdoors and indoors during operation of Reference System, Feb 21-27, 2014. Data obtained as the difference between the TSI 3781 CPC with size selector and the MetOne BT637S OPC. Refer to “Guide” before Figure FW-1-R-3.
1 min 1 hr 24 hr Daily 1hr peaks System-Ref. 6nm - 100nm
Outside: Solid lines
Inside: Dashed lines
Par
ticle
s·cm
-3
103
104
Indo
orO
utdo
or
0
0.2
21 22 23 24 25 26 27Feb
1 min 1 hr 24 hr Daily 1hr peaks System-Ref. 100 - 300 nm
Outside: Solid lines
Inside: Dashed lines
103
104
Par
ticle
s·cm
-3In
door
Out
door
00.20.4
21 22 23 24 25 26 27Feb
Appendix FW-1-R: Reference System, Feb 21-27, 2014 Singer, Delp et al. (LBNL)
ARB-11-311: Reducing In-Home Exposure to Air Pollution Final Report 6
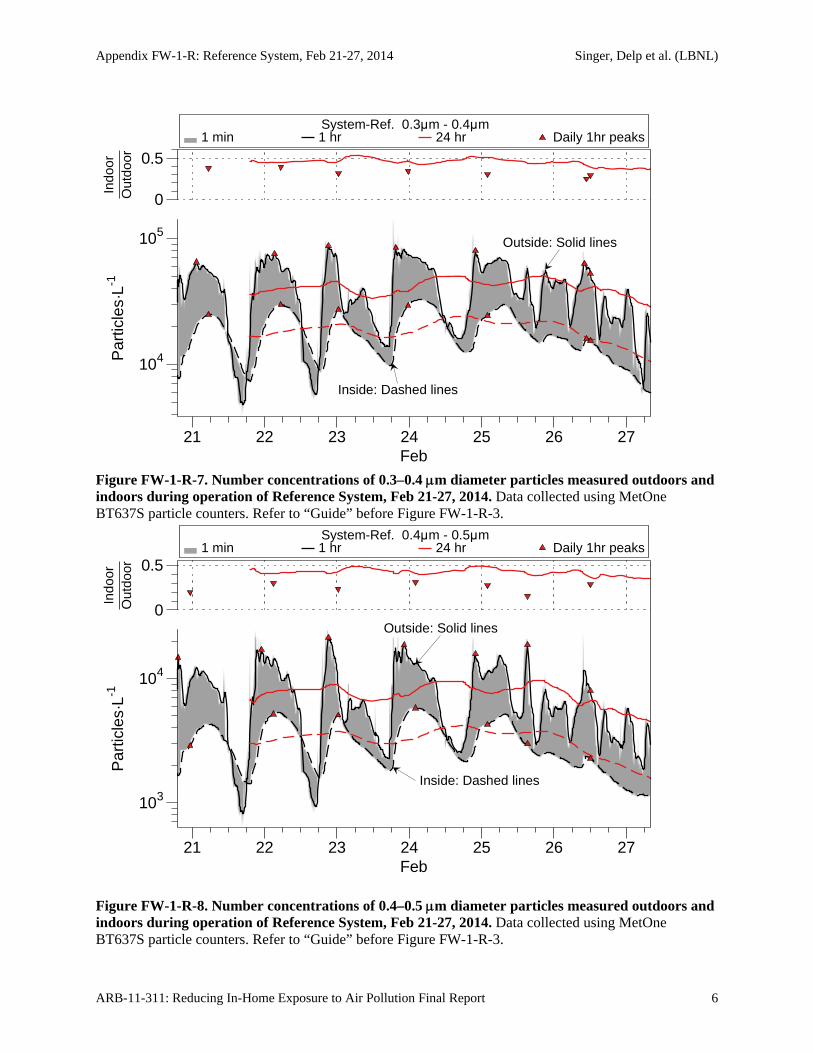
Figure FW-1-R-7. Number concentrations of 0.3–0.4 m diameter particles measured outdoors and indoors during operation of Reference System, Feb 21-27, 2014. Data collected using MetOne BT637S particle counters. Refer to “Guide” before Figure FW-1-R-3.
Figure FW-1-R-8. Number concentrations of 0.4–0.5 m diameter particles measured outdoors and indoors during operation of Reference System, Feb 21-27, 2014. Data collected using MetOne BT637S particle counters. Refer to “Guide” before Figure FW-1-R-3.
1 min 1 hr 24 hr Daily 1hr peaks System-Ref. 0.3μm - 0.4μm
Outside: Solid lines
Inside: Dashed lines
Par
ticle
s·L-1
104
105
Indo
orO
utdo
or
0
0.5
21 22 23 24 25 26 27Feb
1 min 1 hr 24 hr Daily 1hr peaks System-Ref. 0.4μm - 0.5μm
Outside: Solid lines
Inside: Dashed lines
Par
ticle
s·L-1
103
104
Indo
orO
utdo
or
0
0.5
21 22 23 24 25 26 27Feb
Appendix FW-1-R: Reference System, Feb 21-27, 2014 Singer, Delp et al. (LBNL)
ARB-11-311: Reducing In-Home Exposure to Air Pollution Final Report 7
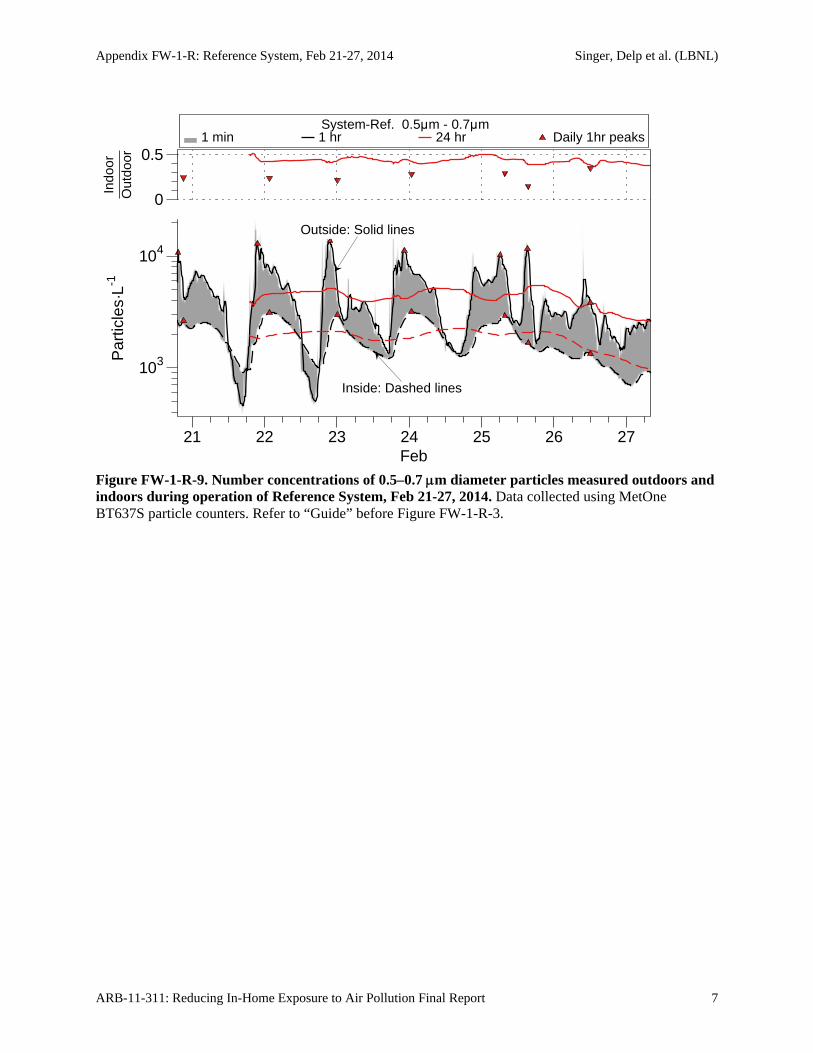
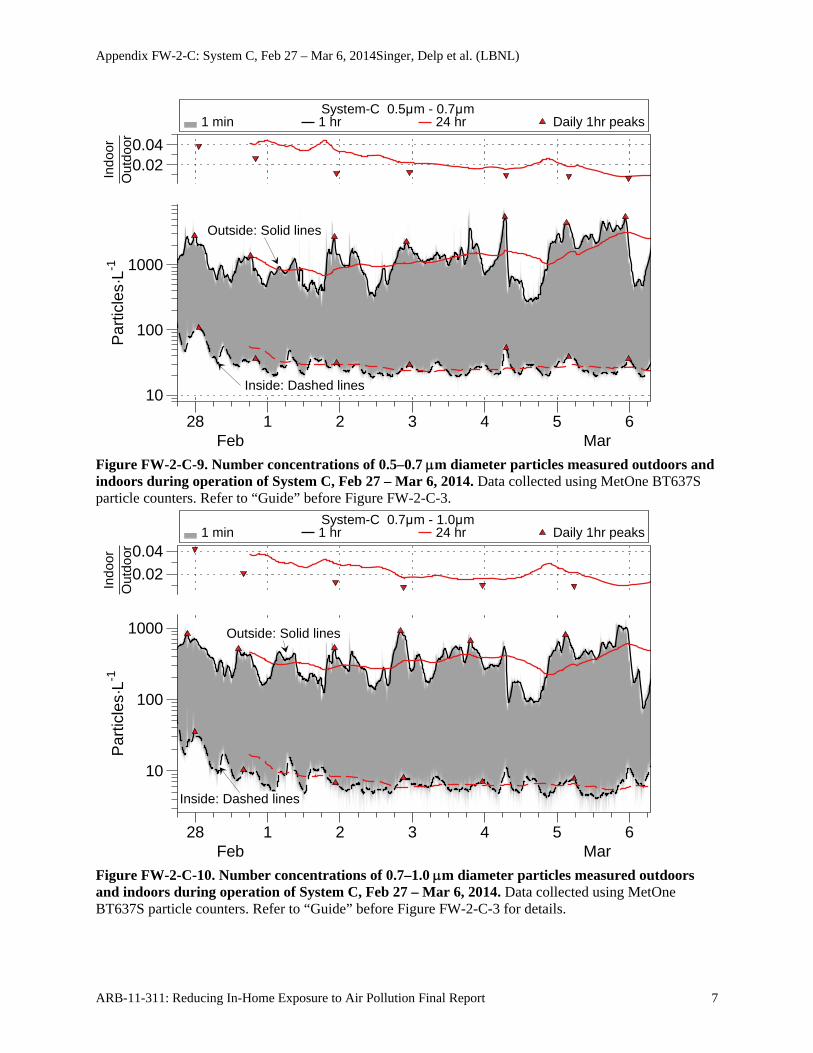
Figure FW-1-R-9. Number concentrations of 0.5–0.7 m diameter particles measured outdoors and indoors during operation of Reference System, Feb 21-27, 2014. Data collected using MetOne BT637S particle counters. Refer to “Guide” before Figure FW-1-R-3.
1 min 1 hr 24 hr Daily 1hr peaks System-Ref. 0.5μm - 0.7μm
Outside: Solid lines
Inside: Dashed lines
Par
ticle
s·L-1
103
104
Indo
orO
utdo
or
0
0.5
21 22 23 24 25 26 27Feb
Appendix FW-1-R: Reference System, Feb 21-27, 2014 Singer, Delp et al. (LBNL)
ARB-11-311: Reducing In-Home Exposure to Air Pollution Final Report 8
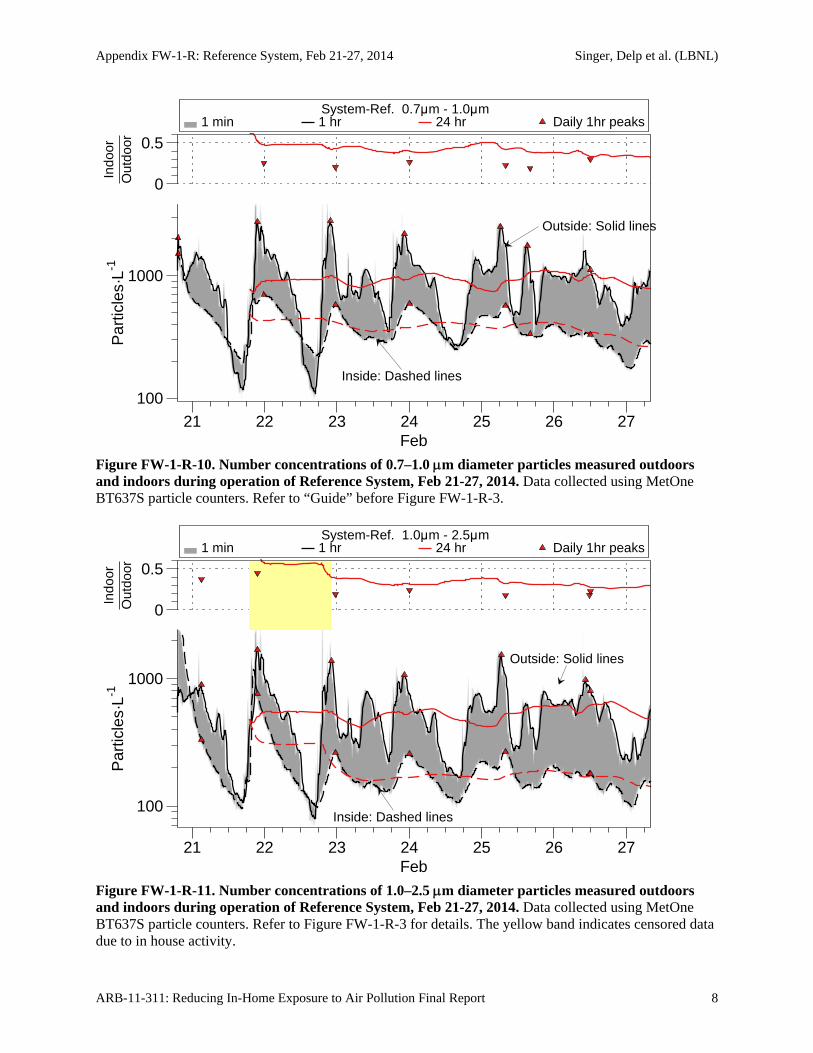
Figure FW-1-R-10. Number concentrations of 0.7–1.0 m diameter particles measured outdoors and indoors during operation of Reference System, Feb 21-27, 2014. Data collected using MetOne BT637S particle counters. Refer to “Guide” before Figure FW-1-R-3.
Figure FW-1-R-11. Number concentrations of 1.0–2.5 m diameter particles measured outdoors and indoors during operation of Reference System, Feb 21-27, 2014. Data collected using MetOne BT637S particle counters. Refer to Figure FW-1-R-3 for details. The yellow band indicates censored data due to in house activity.
1 min 1 hr 24 hr Daily 1hr peaks System-Ref. 0.7μm - 1.0μm
Outside: Solid lines
Inside: Dashed lines
Par
ticle
s·L-1
100
1000
Indo
orO
utdo
or
0
0.5
21 22 23 24 25 26 27Feb
1 min 1 hr 24 hr Daily 1hr peaks System-Ref. 1.0μm - 2.5μm
Outside: Solid lines
Inside: Dashed lines
Par
ticle
s·L-1
100
1000
Indo
orO
utdo
or
0
0.5
21 22 23 24 25 26 27Feb
Appendix FW-1-R: Reference System, Feb 21-27, 2014 Singer, Delp et al. (LBNL)
ARB-11-311: Reducing In-Home Exposure to Air Pollution Final Report 9
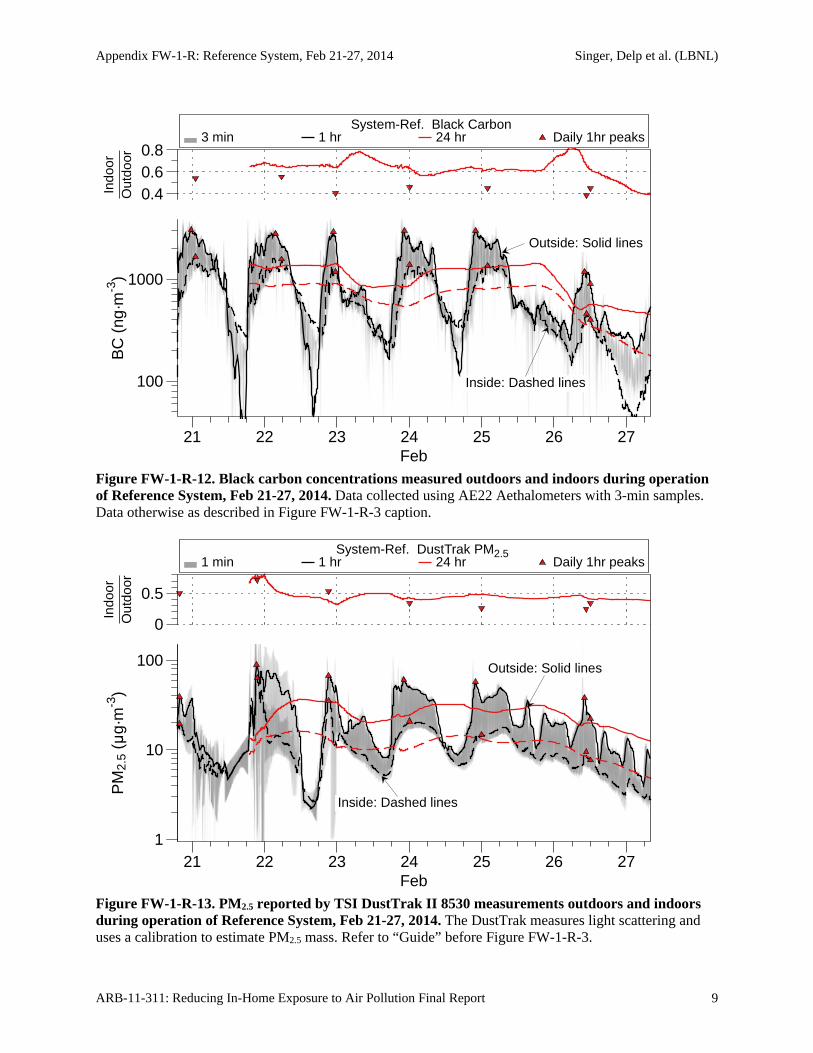
Figure FW-1-R-12. Black carbon concentrations measured outdoors and indoors during operation of Reference System, Feb 21-27, 2014. Data collected using AE22 Aethalometers with 3-min samples. Data otherwise as described in Figure FW-1-R-3 caption.
Figure FW-1-R-13. PM2.5 reported by TSI DustTrak II 8530 measurements outdoors and indoors during operation of Reference System, Feb 21-27, 2014. The DustTrak measures light scattering and uses a calibration to estimate PM2.5 mass. Refer to “Guide” before Figure FW-1-R-3.
3 min 1 hr 24 hr Daily 1hr peaks System-Ref. Black Carbon
Outside: Solid lines
Inside: Dashed lines
BC
(ng
·m-3
)
100
1000
Indo
orO
utdo
or
0.40.60.8
21 22 23 24 25 26 27Feb
1 min 1 hr 24 hr Daily 1hr peaks System-Ref. DustTrak PM2.5
1
10
100 Outside: Solid lines
Inside: Dashed lines
PM
2.5
(μg·
m-3
)In
door
Out
door
0
0.5
21 22 23 24 25 26 27Feb
Appendix FW-1-R: Reference System, Feb 21-27, 2014 Singer, Delp et al. (LBNL)
ARB-11-311: Reducing In-Home Exposure to Air Pollution Final Report 10
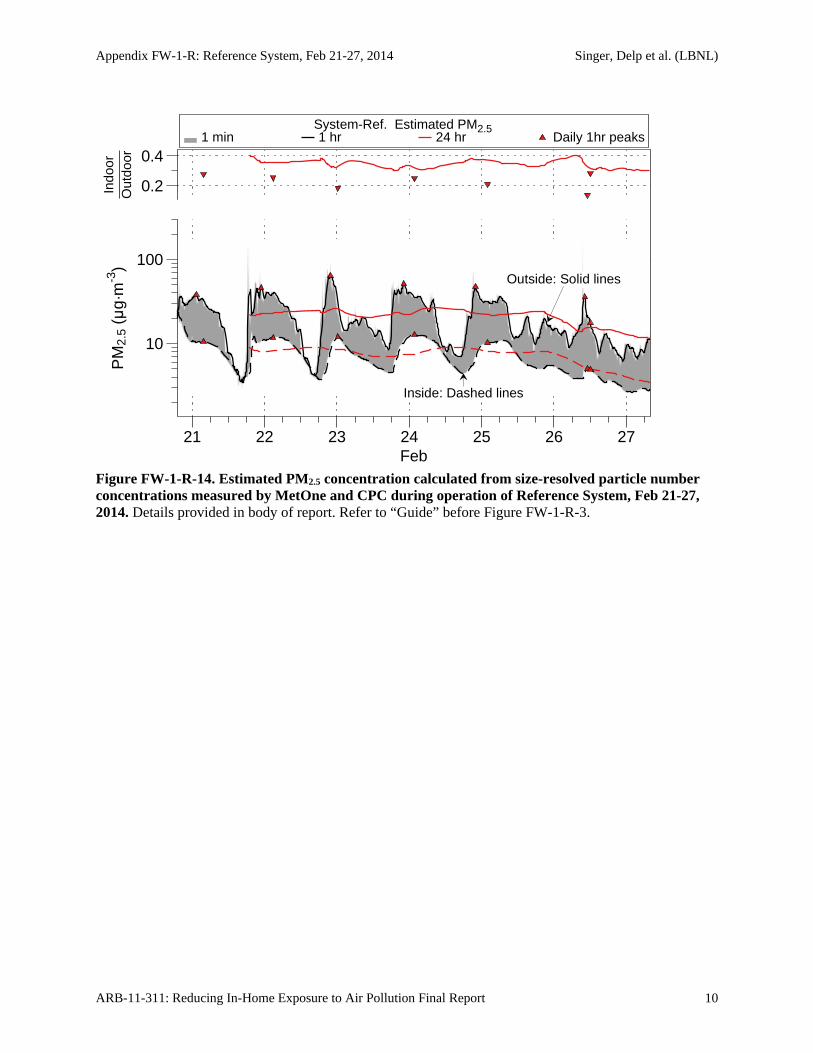
Figure FW-1-R-14. Estimated PM2.5 concentration calculated from size-resolved particle number concentrations measured by MetOne and CPC during operation of Reference System, Feb 21-27, 2014. Details provided in body of report. Refer to “Guide” before Figure FW-1-R-3.
1 min 1 hr 24 hr Daily 1hr peaks System-Ref. Estimated PM2.5
Outside: Solid lines
Inside: Dashed lines
PM
2.5
(μg·
m-3
)
10
100
Indo
orO
utdo
or
0.2
0.4
21 22 23 24 25 26 27Feb
Appendix FW-1-R: Reference System, Feb 21-27, 2014 Singer, Delp et al. (LBNL)
ARB-11-311: Reducing In-Home Exposure to Air Pollution Final Report 11
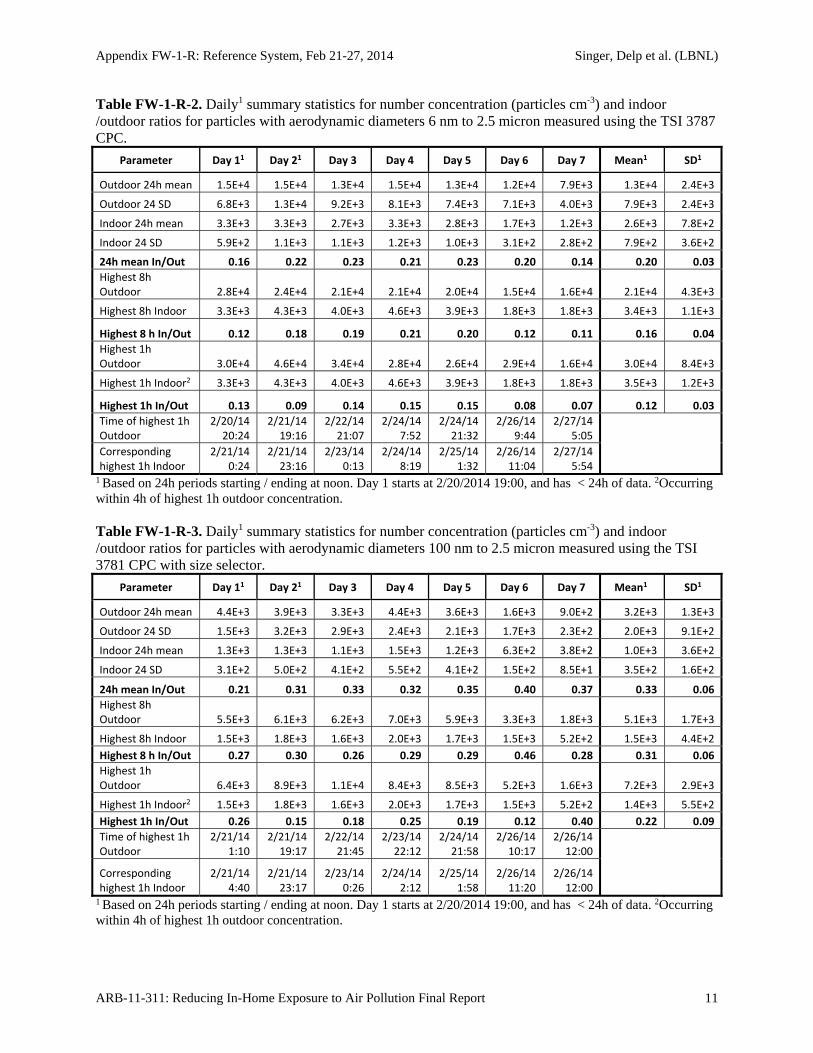
Table FW-1-R-2. Daily1 summary statistics for number concentration (particles cm-3) and indoor /outdoor ratios for particles with aerodynamic diameters 6 nm to 2.5 micron measured using the TSI 3787 CPC.
Parameter Day 11 Day 21 Day 3 Day 4 Day 5 Day 6 Day 7 Mean1 SD1
Outdoor 24h mean 1.5E+4 1.5E+4 1.3E+4 1.5E+4 1.3E+4 1.2E+4 7.9E+3 1.3E+4 2.4E+3
Outdoor 24 SD 6.8E+3 1.3E+4 9.2E+3 8.1E+3 7.4E+3 7.1E+3 4.0E+3 7.9E+3 2.4E+3
Indoor 24h mean 3.3E+3 3.3E+3 2.7E+3 3.3E+3 2.8E+3 1.7E+3 1.2E+3 2.6E+3 7.8E+2
Indoor 24 SD 5.9E+2 1.1E+3 1.1E+3 1.2E+3 1.0E+3 3.1E+2 2.8E+2 7.9E+2 3.6E+2
24h mean In/Out 0.16 0.22 0.23 0.21 0.23 0.20 0.14 0.20 0.03
Highest 8h Outdoor 2.8E+4 2.4E+4 2.1E+4 2.1E+4 2.0E+4 1.5E+4 1.6E+4 2.1E+4 4.3E+3
Highest 8h Indoor 3.3E+3 4.3E+3 4.0E+3 4.6E+3 3.9E+3 1.8E+3 1.8E+3 3.4E+3 1.1E+3
Highest 8 h In/Out 0.12 0.18 0.19 0.21 0.20 0.12 0.11 0.16 0.04
Highest 1h Outdoor 3.0E+4 4.6E+4 3.4E+4 2.8E+4 2.6E+4 2.9E+4 1.6E+4 3.0E+4 8.4E+3
Highest 1h Indoor2 3.3E+3 4.3E+3 4.0E+3 4.6E+3 3.9E+3 1.8E+3 1.8E+3 3.5E+3 1.2E+3
Highest 1h In/Out 0.13 0.09 0.14 0.15 0.15 0.08 0.07 0.12 0.03
Time of highest 1h Outdoor
2/20/14 20:24
2/21/14 19:16
2/22/14 21:07
2/24/14 7:52
2/24/14 21:32
2/26/14 9:44
2/27/14 5:05
Corresponding highest 1h Indoor
2/21/14 0:24
2/21/14 23:16
2/23/14 0:13
2/24/14 8:19
2/25/14 1:32
2/26/14 11:04
2/27/14 5:54
1 Based on 24h periods starting / ending at noon. Day 1 starts at 2/20/2014 19:00, and has < 24h of data. 2Occurring within 4h of highest 1h outdoor concentration. Table FW-1-R-3. Daily1 summary statistics for number concentration (particles cm-3) and indoor /outdoor ratios for particles with aerodynamic diameters 100 nm to 2.5 micron measured using the TSI 3781 CPC with size selector.
Parameter Day 11 Day 21 Day 3 Day 4 Day 5 Day 6 Day 7 Mean1 SD1
Outdoor 24h mean 4.4E+3 3.9E+3 3.3E+3 4.4E+3 3.6E+3 1.6E+3 9.0E+2 3.2E+3 1.3E+3
Outdoor 24 SD 1.5E+3 3.2E+3 2.9E+3 2.4E+3 2.1E+3 1.7E+3 2.3E+2 2.0E+3 9.1E+2
Indoor 24h mean 1.3E+3 1.3E+3 1.1E+3 1.5E+3 1.2E+3 6.3E+2 3.8E+2 1.0E+3 3.6E+2
Indoor 24 SD 3.1E+2 5.0E+2 4.1E+2 5.5E+2 4.1E+2 1.5E+2 8.5E+1 3.5E+2 1.6E+2
24h mean In/Out 0.21 0.31 0.33 0.32 0.35 0.40 0.37 0.33 0.06
Highest 8h Outdoor 5.5E+3 6.1E+3 6.2E+3 7.0E+3 5.9E+3 3.3E+3 1.8E+3 5.1E+3 1.7E+3
Highest 8h Indoor 1.5E+3 1.8E+3 1.6E+3 2.0E+3 1.7E+3 1.5E+3 5.2E+2 1.5E+3 4.4E+2
Highest 8 h In/Out 0.27 0.30 0.26 0.29 0.29 0.46 0.28 0.31 0.06
Highest 1h Outdoor 6.4E+3 8.9E+3 1.1E+4 8.4E+3 8.5E+3 5.2E+3 1.6E+3 7.2E+3 2.9E+3
Highest 1h Indoor2 1.5E+3 1.8E+3 1.6E+3 2.0E+3 1.7E+3 1.5E+3 5.2E+2 1.4E+3 5.5E+2
Highest 1h In/Out 0.26 0.15 0.18 0.25 0.19 0.12 0.40 0.22 0.09
Time of highest 1h Outdoor
2/21/14 1:10
2/21/14 19:17
2/22/14 21:45
2/23/14 22:12
2/24/14 21:58
2/26/14 10:17
2/26/14 12:00
Corresponding highest 1h Indoor
2/21/14 4:40
2/21/14 23:17
2/23/14 0:26
2/24/14 2:12
2/25/14 1:58
2/26/14 11:20
2/26/14 12:00
1 Based on 24h periods starting / ending at noon. Day 1 starts at 2/20/2014 19:00, and has < 24h of data. 2Occurring within 4h of highest 1h outdoor concentration.
Appendix FW-1-R: Reference System, Feb 21-27, 2014 Singer, Delp et al. (LBNL)
ARB-11-311: Reducing In-Home Exposure to Air Pollution Final Report 12
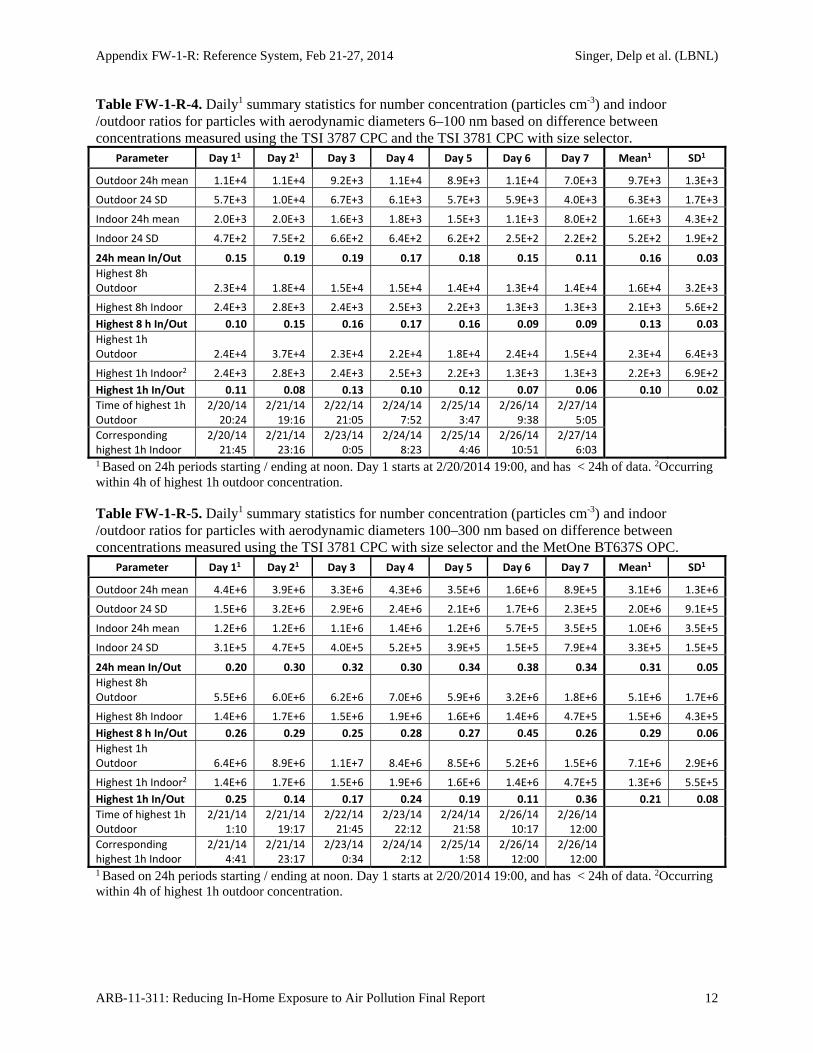
Table FW-1-R-4. Daily1 summary statistics for number concentration (particles cm-3) and indoor /outdoor ratios for particles with aerodynamic diameters 6–100 nm based on difference between concentrations measured using the TSI 3787 CPC and the TSI 3781 CPC with size selector.
Parameter Day 11 Day 21 Day 3 Day 4 Day 5 Day 6 Day 7 Mean1 SD1
Outdoor 24h mean 1.1E+4 1.1E+4 9.2E+3 1.1E+4 8.9E+3 1.1E+4 7.0E+3 9.7E+3 1.3E+3
Outdoor 24 SD 5.7E+3 1.0E+4 6.7E+3 6.1E+3 5.7E+3 5.9E+3 4.0E+3 6.3E+3 1.7E+3
Indoor 24h mean 2.0E+3 2.0E+3 1.6E+3 1.8E+3 1.5E+3 1.1E+3 8.0E+2 1.6E+3 4.3E+2
Indoor 24 SD 4.7E+2 7.5E+2 6.6E+2 6.4E+2 6.2E+2 2.5E+2 2.2E+2 5.2E+2 1.9E+2
24h mean In/Out 0.15 0.19 0.19 0.17 0.18 0.15 0.11 0.16 0.03
Highest 8h Outdoor 2.3E+4 1.8E+4 1.5E+4 1.5E+4 1.4E+4 1.3E+4 1.4E+4 1.6E+4 3.2E+3
Highest 8h Indoor 2.4E+3 2.8E+3 2.4E+3 2.5E+3 2.2E+3 1.3E+3 1.3E+3 2.1E+3 5.6E+2
Highest 8 h In/Out 0.10 0.15 0.16 0.17 0.16 0.09 0.09 0.13 0.03
Highest 1h Outdoor 2.4E+4 3.7E+4 2.3E+4 2.2E+4 1.8E+4 2.4E+4 1.5E+4 2.3E+4 6.4E+3
Highest 1h Indoor2 2.4E+3 2.8E+3 2.4E+3 2.5E+3 2.2E+3 1.3E+3 1.3E+3 2.2E+3 6.9E+2
Highest 1h In/Out 0.11 0.08 0.13 0.10 0.12 0.07 0.06 0.10 0.02
Time of highest 1h Outdoor
2/20/14 20:24
2/21/14 19:16
2/22/14 21:05
2/24/14 7:52
2/25/14 3:47
2/26/14 9:38
2/27/14 5:05
Corresponding highest 1h Indoor
2/20/14 21:45
2/21/14 23:16
2/23/14 0:05
2/24/14 8:23
2/25/14 4:46
2/26/14 10:51
2/27/14 6:03
1 Based on 24h periods starting / ending at noon. Day 1 starts at 2/20/2014 19:00, and has < 24h of data. 2Occurring within 4h of highest 1h outdoor concentration. Table FW-1-R-5. Daily1 summary statistics for number concentration (particles cm-3) and indoor /outdoor ratios for particles with aerodynamic diameters 100–300 nm based on difference between concentrations measured using the TSI 3781 CPC with size selector and the MetOne BT637S OPC.
Parameter Day 11 Day 21 Day 3 Day 4 Day 5 Day 6 Day 7 Mean1 SD1
Outdoor 24h mean 4.4E+6 3.9E+6 3.3E+6 4.3E+6 3.5E+6 1.6E+6 8.9E+5 3.1E+6 1.3E+6
Outdoor 24 SD 1.5E+6 3.2E+6 2.9E+6 2.4E+6 2.1E+6 1.7E+6 2.3E+5 2.0E+6 9.1E+5
Indoor 24h mean 1.2E+6 1.2E+6 1.1E+6 1.4E+6 1.2E+6 5.7E+5 3.5E+5 1.0E+6 3.5E+5
Indoor 24 SD 3.1E+5 4.7E+5 4.0E+5 5.2E+5 3.9E+5 1.5E+5 7.9E+4 3.3E+5 1.5E+5
24h mean In/Out 0.20 0.30 0.32 0.30 0.34 0.38 0.34 0.31 0.05
Highest 8h Outdoor 5.5E+6 6.0E+6 6.2E+6 7.0E+6 5.9E+6 3.2E+6 1.8E+6 5.1E+6 1.7E+6
Highest 8h Indoor 1.4E+6 1.7E+6 1.5E+6 1.9E+6 1.6E+6 1.4E+6 4.7E+5 1.5E+6 4.3E+5
Highest 8 h In/Out 0.26 0.29 0.25 0.28 0.27 0.45 0.26 0.29 0.06
Highest 1h Outdoor 6.4E+6 8.9E+6 1.1E+7 8.4E+6 8.5E+6 5.2E+6 1.5E+6 7.1E+6 2.9E+6
Highest 1h Indoor2 1.4E+6 1.7E+6 1.5E+6 1.9E+6 1.6E+6 1.4E+6 4.7E+5 1.3E+6 5.5E+5
Highest 1h In/Out 0.25 0.14 0.17 0.24 0.19 0.11 0.36 0.21 0.08
Time of highest 1h Outdoor
2/21/14 1:10
2/21/14 19:17
2/22/14 21:45
2/23/14 22:12
2/24/14 21:58
2/26/14 10:17
2/26/14 12:00
Corresponding highest 1h Indoor
2/21/14 4:41
2/21/14 23:17
2/23/14 0:34
2/24/14 2:12
2/25/14 1:58
2/26/14 12:00
2/26/14 12:00
1 Based on 24h periods starting / ending at noon. Day 1 starts at 2/20/2014 19:00, and has < 24h of data. 2Occurring within 4h of highest 1h outdoor concentration.

Appendix FW-1-R: Reference System, Feb 21-27, 2014 Singer, Delp et al. (LBNL)
ARB-11-311: Reducing In-Home Exposure to Air Pollution Final Report 13
Table FW-1-R-6. Daily1 summary statistics for number concentration (particles L-1) and indoor /outdoor ratios for particles with aerodynamic diameters 0.3–0.4 microns measured with the MetOne BT637S OPC.
Parameter Day 11 Day 21 Day 3 Day 4 Day 5 Day 6 Day 7 Mean1 SD1
Outdoor 24h mean 4.7E+4 4.1E+4 3.3E+4 5.0E+4 4.5E+4 4.1E+4 2.3E+4 4.0E+4 8.5E+3
Outdoor 24 SD 1.3E+4 2.5E+4 2.3E+4 2.5E+4 2.1E+4 1.3E+4 1.0E+4 1.9E+4 6.0E+3
Indoor 24h mean 1.9E+4 1.9E+4 1.7E+4 2.3E+4 2.1E+4 1.6E+4 9.7E+3 1.8E+4 4.0E+3
Indoor 24 SD 5.1E+3 8.0E+3 5.2E+3 8.5E+3 6.0E+3 1.8E+3 2.6E+3 5.3E+3 2.3E+3
24h mean In/Out 0.31 0.45 0.49 0.45 0.49 0.44 0.38 0.43 0.06
Highest 8h Outdoor 5.7E+4 6.6E+4 5.6E+4 7.5E+4 6.5E+4 5.5E+4 4.6E+4 6.0E+4 8.8E+3
Highest 8h Indoor 2.4E+4 2.8E+4 2.3E+4 3.2E+4 2.8E+4 2.7E+4 1.4E+4 2.5E+4 5.2E+3
Highest 8 h In/Out 0.41 0.42 0.41 0.42 0.43 0.49 0.31 0.41 0.05
Highest 1h Outdoor 6.5E+4 7.5E+4 8.7E+4 8.5E+4 8.0E+4 6.3E+4 5.3E+4 7.2E+4 1.2E+4
Highest 1h Indoor2 2.4E+4 2.8E+4 2.3E+4 3.2E+4 2.8E+4 2.7E+4 1.4E+4 2.4E+4 5.5E+3
Highest 1h In/Out 0.38 0.40 0.31 0.35 0.30 0.25 0.29 0.33 0.05
Time of highest 1h Outdoor
2/21/14 1:23
2/22/14 3:21
2/22/14 21:06
2/23/14 19:34
2/24/14 21:57
2/26/14 10:03
2/26/14 12:00
Corresponding highest 1h Indoor
2/21/14 5:23
2/22/14 5:23
2/23/14 0:29
2/23/14 23:34
2/25/14 1:57
2/26/14 10:42
2/26/14 12:00
1 Based on 24h periods starting / ending at noon. Day 1 starts at 2/20/2014 19:00, and has < 24h of data. 2Occurring within 4h of highest 1h outdoor concentration. Table FW-1-R-7. Daily1 summary statistics for number concentration (particles L-1) and indoor /outdoor ratios for particles with aerodynamic diameters 0.4–0.5 microns measured with the MetOne BT637S OPC.
Parameter Day 11 Day 21 Day 3 Day 4 Day 5 Day 6 Day 7 Mean1 SD1
Outdoor 24h mean 8.8E+3 8.2E+3 6.6E+3 9.4E+3 8.3E+3 6.6E+3 3.6E+3 7.4E+3 1.8E+3
Outdoor 24 SD 2.6E+3 5.5E+3 5.4E+3 5.6E+3 4.5E+3 3.8E+3 1.3E+3 4.1E+3 1.5E+3
Indoor 24h mean 3.5E+3 3.5E+3 3.0E+3 4.0E+3 3.6E+3 2.4E+3 1.5E+3 3.1E+3 8.1E+2
Indoor 24 SD 7.1E+2 1.4E+3 9.9E+2 1.5E+3 1.0E+3 3.5E+2 3.3E+2 9.0E+2 4.2E+2
24h mean In/Out 0.31 0.42 0.45 0.42 0.46 0.41 0.37 0.41 0.05
Highest 8h Outdoor 1.5E+4 1.4E+4 1.2E+4 1.5E+4 1.2E+4 1.0E+4 7.2E+3 1.2E+4 2.7E+3
Highest 8h Indoor 2.5E+3 5.0E+3 4.2E+3 5.6E+3 4.8E+3 4.6E+3 2.1E+3 4.1E+3 1.2E+3
Highest 8 h In/Out 0.17 0.35 0.36 0.37 0.39 0.46 0.29 0.34 0.08
Highest 1h Outdoor 1.5E+4 1.7E+4 2.1E+4 1.9E+4 1.6E+4 1.9E+4 8.0E+3 1.6E+4 4.0E+3
Highest 1h Indoor2 2.5E+3 5.0E+3 4.2E+3 5.6E+3 4.8E+3 4.6E+3 2.1E+3 4.0E+3 1.2E+3
Highest 1h In/Out 0.20 0.30 0.24 0.31 0.27 0.16 0.29 0.25 0.05
Time of highest 1h Outdoor
2/20/14 19:16
2/21/14 22:52
2/22/14 21:08
2/23/14 22:15
2/24/14 21:57
2/25/14 15:12
2/26/14 12:00
Corresponding highest 1h Indoor
2/20/14 23:16
2/22/14 2:52
2/23/14 0:22
2/24/14 2:02
2/25/14 1:57
2/25/14 15:12
2/26/14 12:00
1 Based on 24h periods starting / ending at noon. Day 1 starts at 2/20/2014 19:00, and has < 24h of data. 2Occurring within 4h of highest 1h outdoor concentration.

Appendix FW-1-R: Reference System, Feb 21-27, 2014 Singer, Delp et al. (LBNL)
ARB-11-311: Reducing In-Home Exposure to Air Pollution Final Report 14
Table FW-1-R-8. Daily1 summary statistics for number concentration (particles L-1) and indoor /outdoor ratios for particles with aerodynamic diameters 0.5–0.7 microns measured with the MetOne BT637S OPC.
Parameter Day 11 Day 21 Day 3 Day 4 Day 5 Day 6 Day 7 Mean1 SD1
Outdoor 24h mean 5.1E+3 4.8E+3 3.9E+3 5.1E+3 4.6E+3 3.7E+3 2.2E+3 4.2E+3 9.5E+2
Outdoor 24 SD 1.7E+3 3.6E+3 3.4E+3 3.0E+3 2.7E+3 2.5E+3 5.0E+2 2.5E+3 1.0E+3
Indoor 24h mean 2.3E+3 2.1E+3 1.8E+3 2.2E+3 2.0E+3 1.4E+3 9.1E+2 1.8E+3 4.5E+2
Indoor 24 SD 2.9E+2 7.8E+2 5.7E+2 7.0E+2 5.6E+2 1.6E+2 1.6E+2 4.6E+2 2.4E+2
24h mean In/Out 0.40 0.45 0.45 0.42 0.47 0.41 0.40 0.43 0.02
Highest 8h Outdoor 1.1E+4 8.7E+3 7.0E+3 8.3E+3 7.1E+3 5.7E+3 3.8E+3 7.4E+3 2.1E+3
Highest 8h Indoor 2.5E+3 3.0E+3 2.4E+3 3.0E+3 2.6E+3 2.5E+3 1.3E+3 2.5E+3 5.4E+2
Highest 8 h In/Out 0.23 0.34 0.35 0.36 0.37 0.45 0.33 0.35 0.06
Highest 1h Outdoor 1.1E+4 1.3E+4 1.4E+4 1.1E+4 1.0E+4 1.2E+4 3.8E+3 1.1E+4 3.0E+3
Highest 1h Indoor2 2.5E+3 3.0E+3 2.4E+3 3.0E+3 2.6E+3 2.5E+3 1.3E+3 2.5E+3 6.8E+2
Highest 1h In/Out 0.24 0.24 0.22 0.28 0.29 0.14 0.35 0.25 0.06
Time of highest 1h Outdoor
2/20/14 19:16
2/21/14 21:35
2/22/14 21:43
2/23/14 22:18
2/25/14 6:07
2/25/14 15:12
2/26/14 12:00
Corresponding highest 1h Indoor
2/20/14 21:02
2/22/14 1:35
2/23/14 0:03
2/24/14 0:48
2/25/14 7:44
2/25/14 15:24
2/26/14 12:00
1 Based on 24h periods starting / ending at noon. Day 1 starts at 2/20/2014 19:00, and has < 24h of data. 2Occurring within 4h of highest 1h outdoor concentration. Table FW-1-R-9. Daily1 summary statistics for number concentration (particles L-1) and indoor /outdoor ratios for particles with aerodynamic diameters 0.7–1.0 microns measured with the MetOne BT637S OPC.
Parameter Day 11 Day 21 Day 3 Day 4 Day 5 Day 6 Day 7 Mean1 SD1
Outdoor 24h mean 1.0E+3 9.3E+2 8.6E+2 9.7E+2 9.2E+2 1.0E+3 7.0E+2 9.2E+2 1.0E+2
Outdoor 24 SD 3.8E+2 7.4E+2 7.0E+2 5.1E+2 6.0E+2 4.3E+2 2.0E+2 5.1E+2 1.8E+2
Indoor 24h mean 5.9E+2 4.4E+2 3.5E+2 4.1E+2 4.0E+2 3.4E+2 2.5E+2 4.0E+2 9.9E+1
Indoor 24 SD 2.7E+2 1.7E+2 1.0E+2 1.1E+2 1.0E+2 2.8E+1 4.2E+1 1.2E+2 7.6E+1
24h mean In/Out 0.68 0.53 0.45 0.39 0.46 0.39 0.34 0.46 0.11
Highest 8h Outdoor 2.0E+3 1.8E+3 1.4E+3 1.5E+3 1.5E+3 1.2E+3 1.1E+3 1.5E+3 2.8E+2
Highest 8h Indoor 1.5E+3 6.4E+2 4.8E+2 5.4E+2 5.0E+2 4.8E+2 3.3E+2 6.4E+2 3.6E+2
Highest 8 h In/Out 0.75 0.36 0.34 0.35 0.34 0.39 0.29 0.40 0.14
Highest 1h Outdoor 2.0E+3 2.7E+3 2.8E+3 2.2E+3 2.5E+3 1.8E+3 1.1E+3 2.2E+3 5.5E+2
Highest 1h Indoor2 1.5E+3 6.4E+2 4.8E+2 5.4E+2 5.0E+2 4.8E+2 3.3E+2 6.6E+2 3.7E+2
Highest 1h In/Out 0.75 0.25 0.21 0.27 0.23 0.19 0.30 0.31 0.18
Time of highest 1h Outdoor
2/20/14 19:17
2/21/14 21:35
2/22/14 21:45
2/23/14 22:20
2/25/14 6:09
2/25/14 15:12
2/26/14 12:00
Corresponding highest 1h Indoor
2/20/14 19:17
2/21/14 23:48
2/22/14 23:28
2/24/14 0:08
2/25/14 8:02
2/25/14 16:02
2/26/14 12:00
1 Based on 24h periods starting / ending at noon. Day 1 starts at 2/20/2014 19:00, and has < 24h of data. 2Occurring within 4h of highest 1h outdoor concentration.
Appendix FW-1-R: Reference System, Feb 21-27, 2014 Singer, Delp et al. (LBNL)
ARB-11-311: Reducing In-Home Exposure to Air Pollution Final Report 15
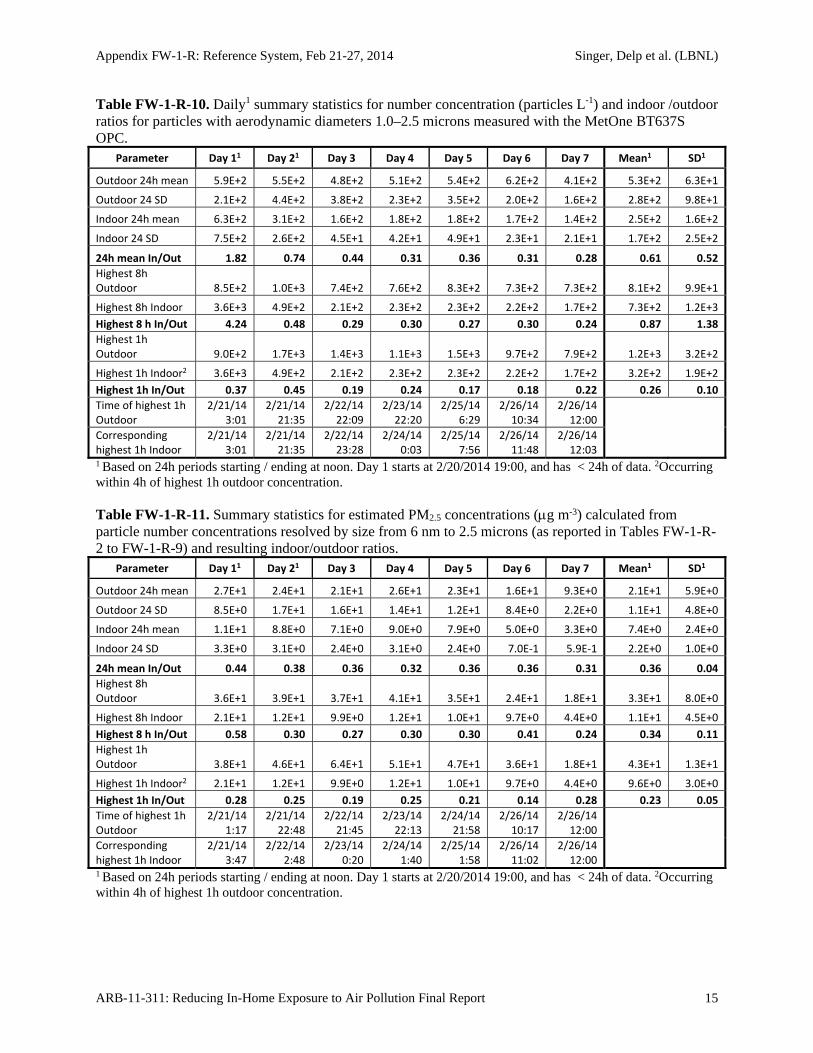
Table FW-1-R-10. Daily1 summary statistics for number concentration (particles L-1) and indoor /outdoor ratios for particles with aerodynamic diameters 1.0–2.5 microns measured with the MetOne BT637S OPC.
Parameter Day 11 Day 21 Day 3 Day 4 Day 5 Day 6 Day 7 Mean1 SD1
Outdoor 24h mean 5.9E+2 5.5E+2 4.8E+2 5.1E+2 5.4E+2 6.2E+2 4.1E+2 5.3E+2 6.3E+1
Outdoor 24 SD 2.1E+2 4.4E+2 3.8E+2 2.3E+2 3.5E+2 2.0E+2 1.6E+2 2.8E+2 9.8E+1
Indoor 24h mean 6.3E+2 3.1E+2 1.6E+2 1.8E+2 1.8E+2 1.7E+2 1.4E+2 2.5E+2 1.6E+2
Indoor 24 SD 7.5E+2 2.6E+2 4.5E+1 4.2E+1 4.9E+1 2.3E+1 2.1E+1 1.7E+2 2.5E+2
24h mean In/Out 1.82 0.74 0.44 0.31 0.36 0.31 0.28 0.61 0.52
Highest 8h Outdoor 8.5E+2 1.0E+3 7.4E+2 7.6E+2 8.3E+2 7.3E+2 7.3E+2 8.1E+2 9.9E+1
Highest 8h Indoor 3.6E+3 4.9E+2 2.1E+2 2.3E+2 2.3E+2 2.2E+2 1.7E+2 7.3E+2 1.2E+3
Highest 8 h In/Out 4.24 0.48 0.29 0.30 0.27 0.30 0.24 0.87 1.38
Highest 1h Outdoor 9.0E+2 1.7E+3 1.4E+3 1.1E+3 1.5E+3 9.7E+2 7.9E+2 1.2E+3 3.2E+2
Highest 1h Indoor2 3.6E+3 4.9E+2 2.1E+2 2.3E+2 2.3E+2 2.2E+2 1.7E+2 3.2E+2 1.9E+2
Highest 1h In/Out 0.37 0.45 0.19 0.24 0.17 0.18 0.22 0.26 0.10
Time of highest 1h Outdoor
2/21/14 3:01
2/21/14 21:35
2/22/14 22:09
2/23/14 22:20
2/25/14 6:29
2/26/14 10:34
2/26/14 12:00
Corresponding highest 1h Indoor
2/21/14 3:01
2/21/14 21:35
2/22/14 23:28
2/24/14 0:03
2/25/14 7:56
2/26/14 11:48
2/26/14 12:03
1 Based on 24h periods starting / ending at noon. Day 1 starts at 2/20/2014 19:00, and has < 24h of data. 2Occurring within 4h of highest 1h outdoor concentration. Table FW-1-R-11. Summary statistics for estimated PM2.5 concentrations (g m-3) calculated from particle number concentrations resolved by size from 6 nm to 2.5 microns (as reported in Tables FW-1-R-2 to FW-1-R-9) and resulting indoor/outdoor ratios.
Parameter Day 11 Day 21 Day 3 Day 4 Day 5 Day 6 Day 7 Mean1 SD1
Outdoor 24h mean 2.7E+1 2.4E+1 2.1E+1 2.6E+1 2.3E+1 1.6E+1 9.3E+0 2.1E+1 5.9E+0
Outdoor 24 SD 8.5E+0 1.7E+1 1.6E+1 1.4E+1 1.2E+1 8.4E+0 2.2E+0 1.1E+1 4.8E+0
Indoor 24h mean 1.1E+1 8.8E+0 7.1E+0 9.0E+0 7.9E+0 5.0E+0 3.3E+0 7.4E+0 2.4E+0
Indoor 24 SD 3.3E+0 3.1E+0 2.4E+0 3.1E+0 2.4E+0 7.0E‐1 5.9E‐1 2.2E+0 1.0E+0
24h mean In/Out 0.44 0.38 0.36 0.32 0.36 0.36 0.31 0.36 0.04
Highest 8h Outdoor 3.6E+1 3.9E+1 3.7E+1 4.1E+1 3.5E+1 2.4E+1 1.8E+1 3.3E+1 8.0E+0
Highest 8h Indoor 2.1E+1 1.2E+1 9.9E+0 1.2E+1 1.0E+1 9.7E+0 4.4E+0 1.1E+1 4.5E+0
Highest 8 h In/Out 0.58 0.30 0.27 0.30 0.30 0.41 0.24 0.34 0.11
Highest 1h Outdoor 3.8E+1 4.6E+1 6.4E+1 5.1E+1 4.7E+1 3.6E+1 1.8E+1 4.3E+1 1.3E+1
Highest 1h Indoor2 2.1E+1 1.2E+1 9.9E+0 1.2E+1 1.0E+1 9.7E+0 4.4E+0 9.6E+0 3.0E+0
Highest 1h In/Out 0.28 0.25 0.19 0.25 0.21 0.14 0.28 0.23 0.05
Time of highest 1h Outdoor
2/21/14 1:17
2/21/14 22:48
2/22/14 21:45
2/23/14 22:13
2/24/14 21:58
2/26/14 10:17
2/26/14 12:00
Corresponding highest 1h Indoor
2/21/14 3:47
2/22/14 2:48
2/23/14 0:20
2/24/14 1:40
2/25/14 1:58
2/26/14 11:02
2/26/14 12:00
1 Based on 24h periods starting / ending at noon. Day 1 starts at 2/20/2014 19:00, and has < 24h of data. 2Occurring within 4h of highest 1h outdoor concentration.
Appendix FW-1-R: Reference System, Feb 21-27, 2014 Singer, Delp et al. (LBNL)
ARB-11-311: Reducing In-Home Exposure to Air Pollution Final Report 16
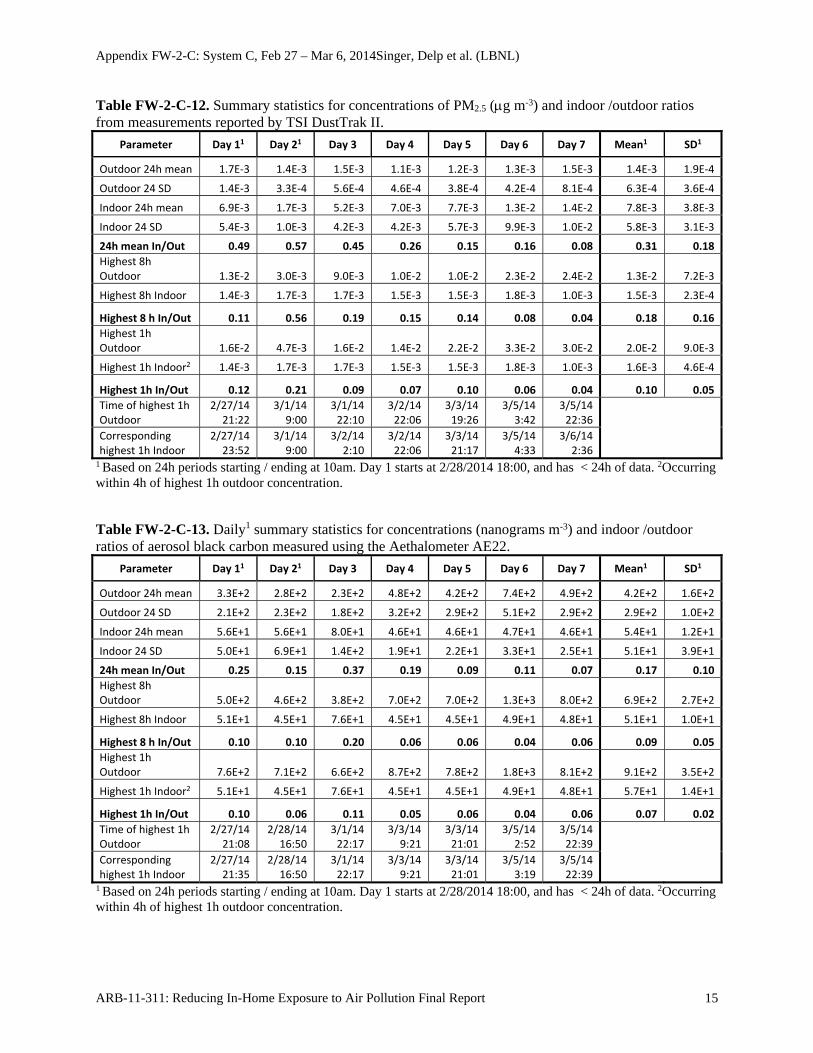
Table FW-1-R-12. Summary statistics for concentrations of PM2.5 (g m-3) and indoor /outdoor ratios from measurements reported by TSI DustTrak II.
Parameter Day 11 Day 21 Day 3 Day 4 Day 5 Day 6 Day 7 Mean1 SD1
Outdoor 24h mean 1.5E‐2 3.6E‐2 2.0E‐2 3.2E‐2 2.8E‐2 2.0E‐2 9.7E‐3 2.3E‐2 8.8E‐3
Outdoor 24 SD 1.3E‐2 4.3E‐2 1.9E‐2 2.0E‐2 1.7E‐2 1.2E‐2 4.3E‐3 1.8E‐2 1.1E‐2
Indoor 24h mean 9.0E‐3 1.6E‐2 1.0E‐2 1.4E‐2 1.2E‐2 8.2E‐3 4.2E‐3 1.1E‐2 3.6E‐3
Indoor 24 SD 6.6E‐3 2.8E‐2 1.1E‐2 9.3E‐3 7.5E‐3 4.4E‐3 2.2E‐3 9.8E‐3 7.9E‐3
24h mean In/Out 0.54 0.61 0.42 0.44 0.46 0.43 0.40 0.47 0.07
Highest 8h Outdoor 3.9E‐2 6.7E‐2 3.6E‐2 5.0E‐2 4.2E‐2 3.4E‐2 2.2E‐2 4.1E‐2 1.3E‐2
Highest 8h Indoor 1.9E‐2 2.5E‐2 1.7E‐2 2.0E‐2 1.6E‐2 1.5E‐2 7.2E‐3 1.7E‐2 5.0E‐3
Highest 8 h In/Out 0.50 0.37 0.48 0.39 0.39 0.45 0.33 0.42 0.06
Highest 1h Outdoor 3.9E‐2 8.8E‐2 6.7E‐2 6.1E‐2 5.7E‐2 3.8E‐2 2.2E‐2 5.3E‐2 2.0E‐2
Highest 1h Indoor2 1.9E‐2 2.5E‐2 1.7E‐2 2.0E‐2 1.6E‐2 1.5E‐2 7.2E‐3 2.4E‐2 1.8E‐2
Highest 1h In/Out 0.50 0.72 0.53 0.34 0.26 0.25 0.34 0.42 0.16
Time of highest 1h Outdoor
2/20/14 19:49
2/21/14 21:19
2/22/14 21:08
2/23/14 22:13
2/24/14 21:58
2/26/14 10:06
2/26/14 12:00
Corresponding highest 1h Indoor
2/20/14 19:51
2/21/14 21:31
2/22/14 21:19
2/24/14 0:09
2/25/14 0:02
2/26/14 10:39
2/26/14 12:00
1 Based on 24h periods starting / ending at noon. Day 1 starts at 2/20/2014 19:00, and has < 24h of data. 2Occurring within 4h of highest 1h outdoor concentration. Table FW-1-R-13. Daily1 summary statistics for concentrations (nanograms m-3) and indoor /outdoor ratios of aerosol black carbon measured using the Aethalometer AE22.
Parameter Day 11 Day 21 Day 3 Day 4 Day 5 Day 6 Day 7 Mean1 SD1
Outdoor 24h mean 1.9E+3 1.4E+3 8.6E+2 1.4E+3 1.5E+3 6.1E+2 3.2E+2 1.1E+3 5.1E+2
Outdoor 24 SD 9.4E+2 1.1E+3 8.9E+2 1.0E+3 1.1E+3 3.7E+2 1.3E+2 7.9E+2 3.5E+2
Indoor 24h mean 1.0E+3 8.4E+2 5.9E+2 6.3E+2 7.0E+2 3.1E+2 1.5E+2 6.1E+2 2.8E+2
Indoor 24 SD 5.4E+2 4.8E+2 3.6E+2 3.7E+2 3.4E+2 1.3E+2 1.1E+2 3.3E+2 1.5E+2
24h mean In/Out 0.55 0.61 0.64 0.50 0.48 0.57 0.43 0.54 0.07
Highest 8h Outdoor 2.6E+3 2.5E+3 1.7E+3 2.5E+3 2.6E+3 1.4E+3 8.9E+2 2.0E+3 6.4E+2
Highest 8h Indoor 1.2E+3 1.2E+3 7.9E+2 1.0E+3 1.0E+3 8.9E+2 3.0E+2 9.2E+2 2.9E+2
Highest 8 h In/Out 0.48 0.47 0.46 0.41 0.40 0.63 0.33 0.45 0.09
Highest 1h Outdoor 3.2E+3 3.1E+3 3.1E+3 3.4E+3 3.3E+3 1.5E+3 9.4E+2 2.6E+3 9.1E+2
Highest 1h Indoor2 1.2E+3 1.2E+3 7.9E+2 1.0E+3 1.0E+3 8.9E+2 3.0E+2 9.8E+2 4.1E+2
Highest 1h In/Out 0.44 0.48 0.35 0.32 0.33 0.24 0.39 0.36 0.07
Time of highest 1h Outdoor
2/20/14 23:40
2/22/14 3:06
2/22/14 22:20
2/23/14 22:16
2/24/14 22:07
2/26/14 9:55
2/26/14 12:00
Corresponding highest 1h Indoor
2/21/14 2:47
2/22/14 5:39
2/23/14 0:01
2/24/14 1:34
2/25/14 2:01
2/26/14 12:02
2/26/14 12:02
1 Based on 24h periods starting / ending at noon. Day 1 starts at 2/20/2014 19:00, and has < 24h of data. 2Occurring within 4h of highest 1h outdoor concentration.
Appendix FW-2-C: System C, Feb 27 – Mar 6, 2014Singer, Delp et al. (LBNL)
ARB-11-311: Reducing In-Home Exposure to Air Pollution Final Report 1
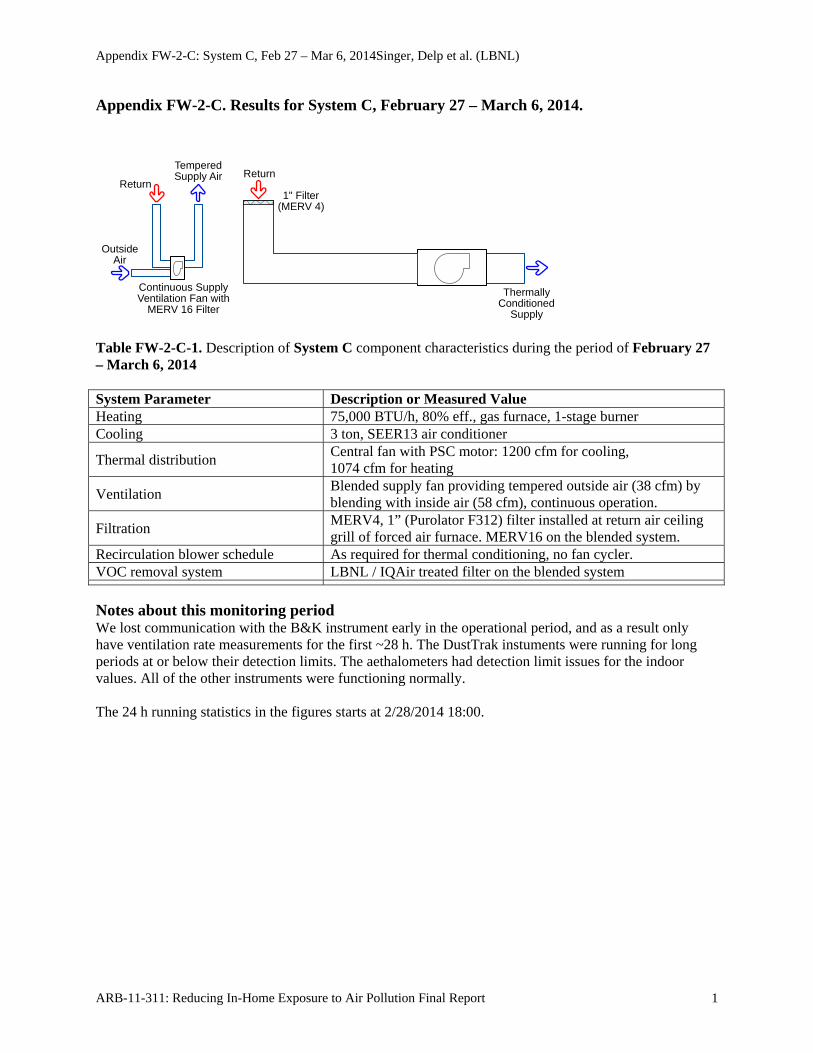
Appendix FW-2-C. Results for System C, February 27 – March 6, 2014.
Table FW-2-C-1. Description of System C component characteristics during the period of February 27 – March 6, 2014 System Parameter Description or Measured Value Heating 75,000 BTU/h, 80% eff., gas furnace, 1-stage burner Cooling 3 ton, SEER13 air conditioner
Thermal distribution Central fan with PSC motor: 1200 cfm for cooling, 1074 cfm for heating
Ventilation Blended supply fan providing tempered outside air (38 cfm) by blending with inside air (58 cfm), continuous operation.
Filtration MERV4, 1” (Purolator F312) filter installed at return air ceiling grill of forced air furnace. MERV16 on the blended system.
Recirculation blower schedule As required for thermal conditioning, no fan cycler. VOC removal system LBNL / IQAir treated filter on the blended system
Notes about this monitoring period We lost communication with the B&K instrument early in the operational period, and as a result only have ventilation rate measurements for the first ~28 h. The DustTrak instuments were running for long periods at or below their detection limits. The aethalometers had detection limit issues for the indoor values. All of the other instruments were functioning normally. The 24 h running statistics in the figures starts at 2/28/2014 18:00.
ThermallyConditioned
Supply
Continuous SupplyVentilation Fan with
MERV 16 Filter
1" Filter(MERV 4)
ReturnReturn
OutsideAir
TemperedSupply Air
Appendix FW-2-C: System C, Feb 27 – Mar 6, 2014Singer, Delp et al. (LBNL)
ARB-11-311: Reducing In-Home Exposure to Air Pollution Final Report 2
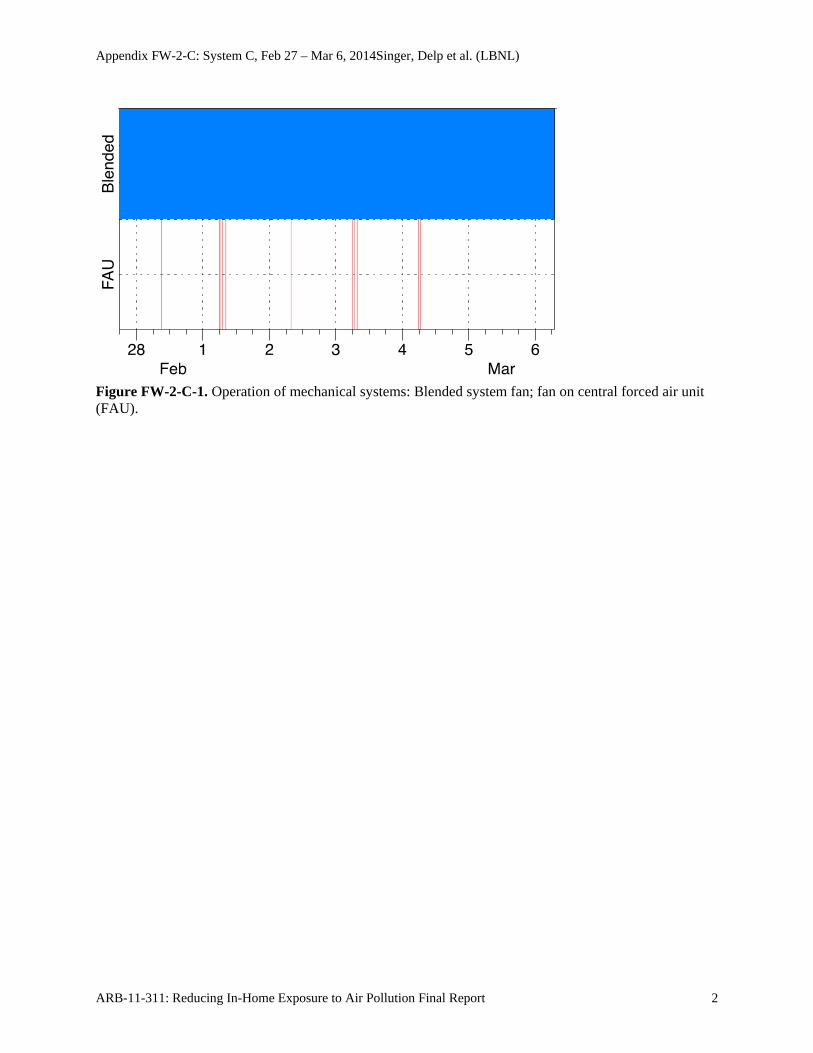
Figure FW-2-C-1. Operation of mechanical systems: Blended system fan; fan on central forced air unit (FAU).
Appendix FW-2-C: System C, Feb 27 – Mar 6, 2014Singer, Delp et al. (LBNL)
ARB-11-311: Reducing In-Home Exposure to Air Pollution Final Report 3
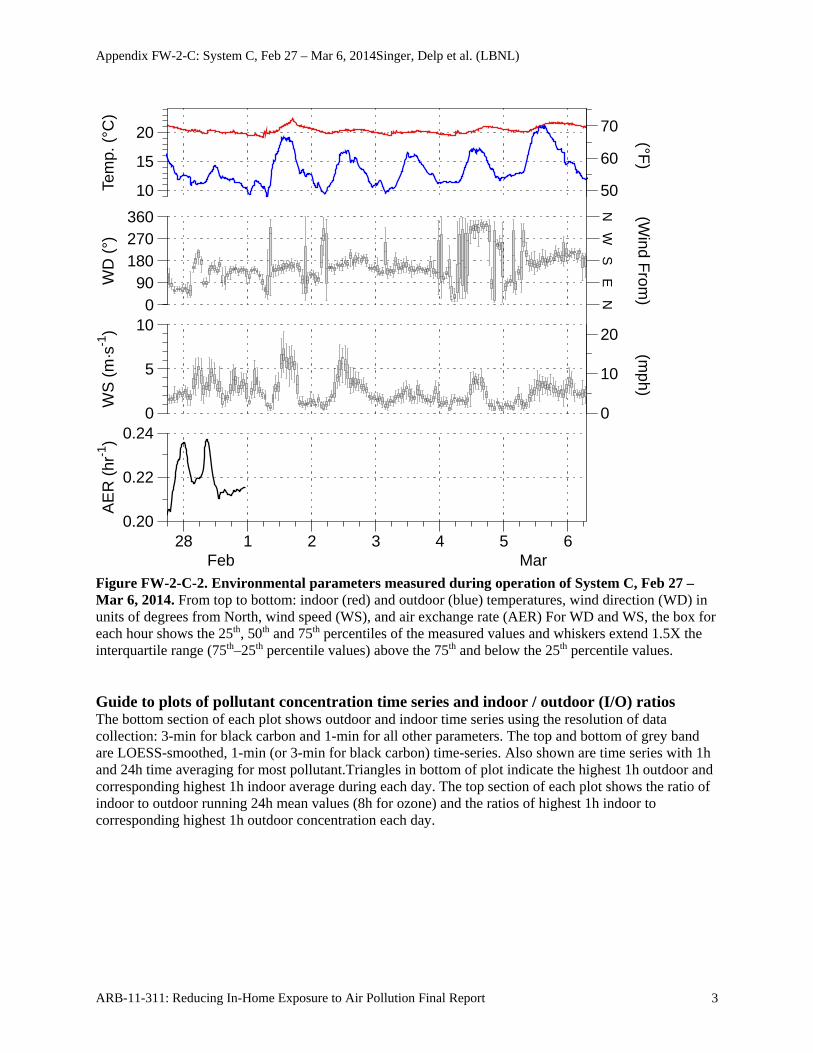
Figure FW-2-C-2. Environmental parameters measured during operation of System C, Feb 27 – Mar 6, 2014. From top to bottom: indoor (red) and outdoor (blue) temperatures, wind direction (WD) in units of degrees from North, wind speed (WS), and air exchange rate (AER) For WD and WS, the box for each hour shows the 25th, 50th and 75th percentiles of the measured values and whiskers extend 1.5X the interquartile range (75th–25th percentile values) above the 75th and below the 25th percentile values. Guide to plots of pollutant concentration time series and indoor / outdoor (I/O) ratios The bottom section of each plot shows outdoor and indoor time series using the resolution of data collection: 3-min for black carbon and 1-min for all other parameters. The top and bottom of grey band are LOESS-smoothed, 1-min (or 3-min for black carbon) time-series. Also shown are time series with 1h and 24h time averaging for most pollutant.Triangles in bottom of plot indicate the highest 1h outdoor and corresponding highest 1h indoor average during each day. The top section of each plot shows the ratio of indoor to outdoor running 24h mean values (8h for ozone) and the ratios of highest 1h indoor to corresponding highest 1h outdoor concentration each day.
0
10
20
50
60
70
NE
SW
N
(mph)
(Wind F
rom)
(°F)
AE
R (
hr-1
)
0.20
0.22
0.24
WS
(m
·s-1
)
0
5
10
WD
(°)
090
180270360
Tem
p. (
°C)
10
15
20
28 1 2 3 4 5 6Feb Mar
Appendix FW-2-C: System C, Feb 27 – Mar 6, 2014Singer, Delp et al. (LBNL)
ARB-11-311: Reducing In-Home Exposure to Air Pollution Final Report 4
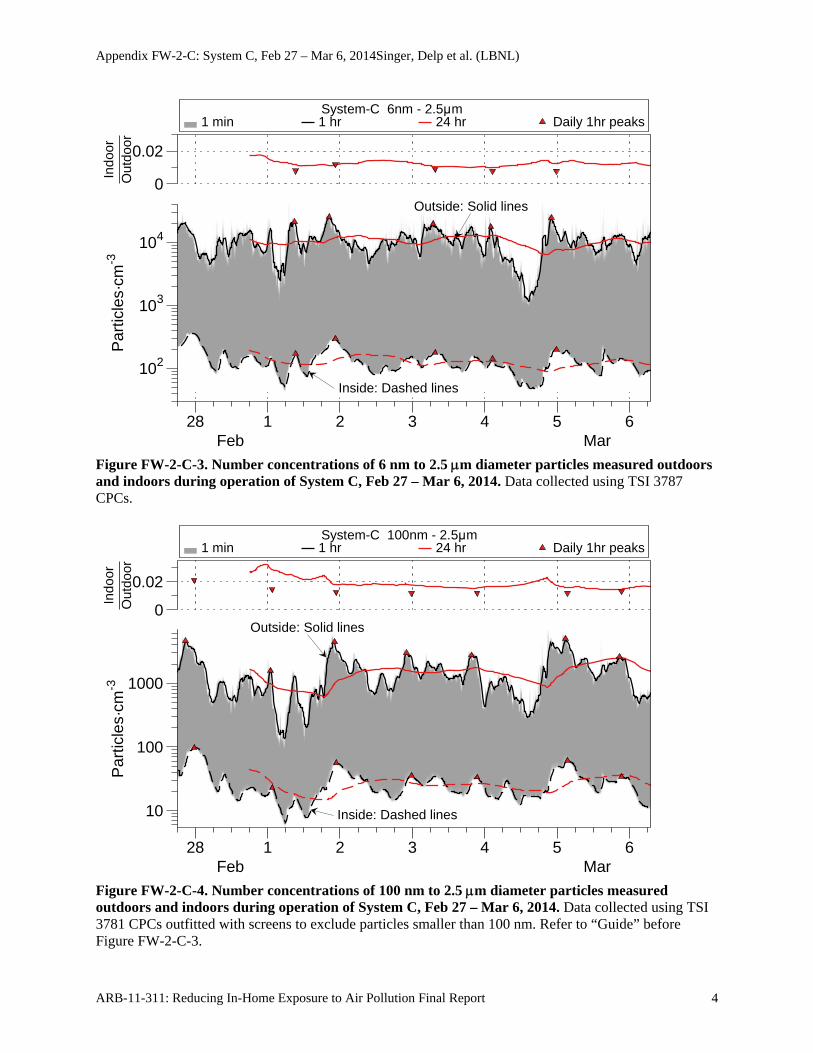
Figure FW-2-C-3. Number concentrations of 6 nm to 2.5 m diameter particles measured outdoors and indoors during operation of System C, Feb 27 – Mar 6, 2014. Data collected using TSI 3787 CPCs.
Figure FW-2-C-4. Number concentrations of 100 nm to 2.5 m diameter particles measured outdoors and indoors during operation of System C, Feb 27 – Mar 6, 2014. Data collected using TSI 3781 CPCs outfitted with screens to exclude particles smaller than 100 nm. Refer to “Guide” before Figure FW-2-C-3.
1 min 1 hr 24 hr Daily 1hr peaks System-C 6nm - 2.5μm
Outside: Solid lines
Inside: Dashed lines
Par
ticle
s·cm
-3
102
103
104
Indo
orO
utdo
or
0
0.02
28 1 2 3 4 5 6Feb Mar
1 min 1 hr 24 hr Daily 1hr peaks System-C 100nm - 2.5μm
Outside: Solid lines
Inside: Dashed lines
Par
ticle
s·cm
-3
10
100
1000
Indo
orO
utdo
or
0
0.02
28 1 2 3 4 5 6Feb Mar
Appendix FW-2-C: System C, Feb 27 – Mar 6, 2014Singer, Delp et al. (LBNL)
ARB-11-311: Reducing In-Home Exposure to Air Pollution Final Report 5
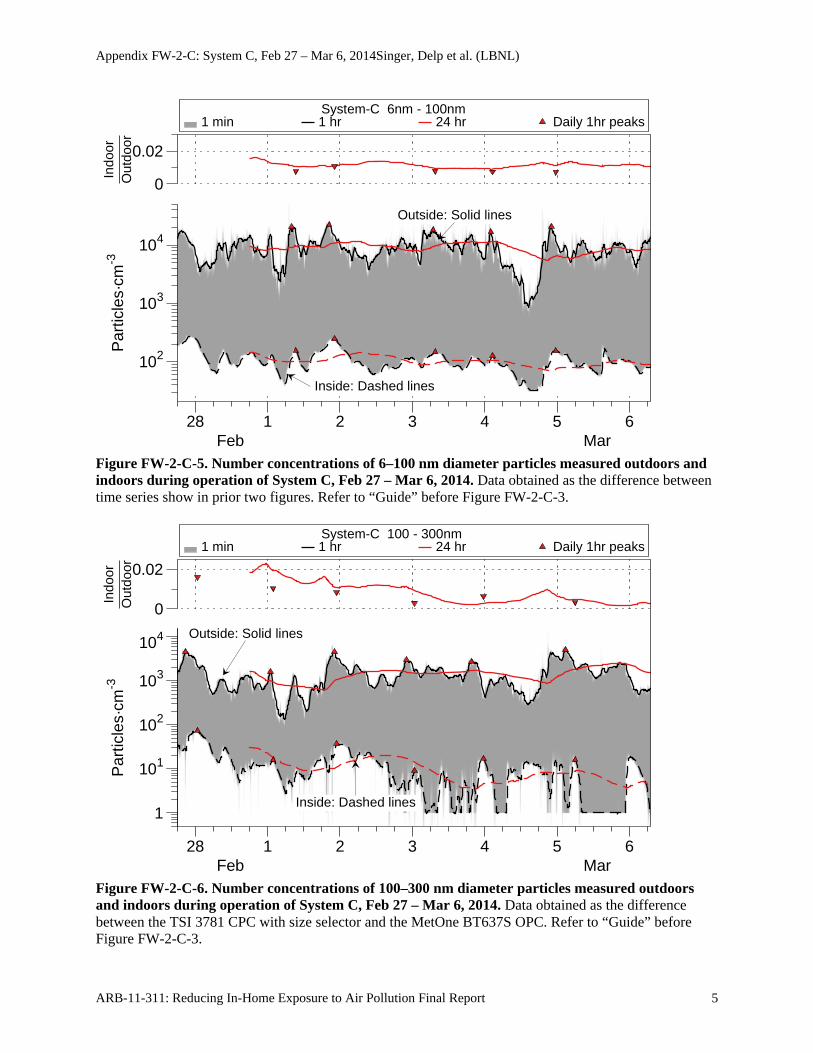
Figure FW-2-C-5. Number concentrations of 6–100 nm diameter particles measured outdoors and indoors during operation of System C, Feb 27 – Mar 6, 2014. Data obtained as the difference between time series show in prior two figures. Refer to “Guide” before Figure FW-2-C-3.
Figure FW-2-C-6. Number concentrations of 100–300 nm diameter particles measured outdoors and indoors during operation of System C, Feb 27 – Mar 6, 2014. Data obtained as the difference between the TSI 3781 CPC with size selector and the MetOne BT637S OPC. Refer to “Guide” before Figure FW-2-C-3.
1 min 1 hr 24 hr Daily 1hr peaks System-C 6nm - 100nm
Outside: Solid lines
Inside: Dashed lines
Par
ticle
s·cm
-3
102
103
104
Indo
orO
utdo
or
0
0.02
28 1 2 3 4 5 6Feb Mar
1 min 1 hr 24 hr Daily 1hr peaks System-C 100 - 300nm
Outside: Solid lines
Inside: Dashed lines1
101
102
103
104
Par
ticle
s·cm
-3In
door
Out
door
0
0.02
28 1 2 3 4 5 6Feb Mar
Appendix FW-2-C: System C, Feb 27 – Mar 6, 2014Singer, Delp et al. (LBNL)
ARB-11-311: Reducing In-Home Exposure to Air Pollution Final Report 6
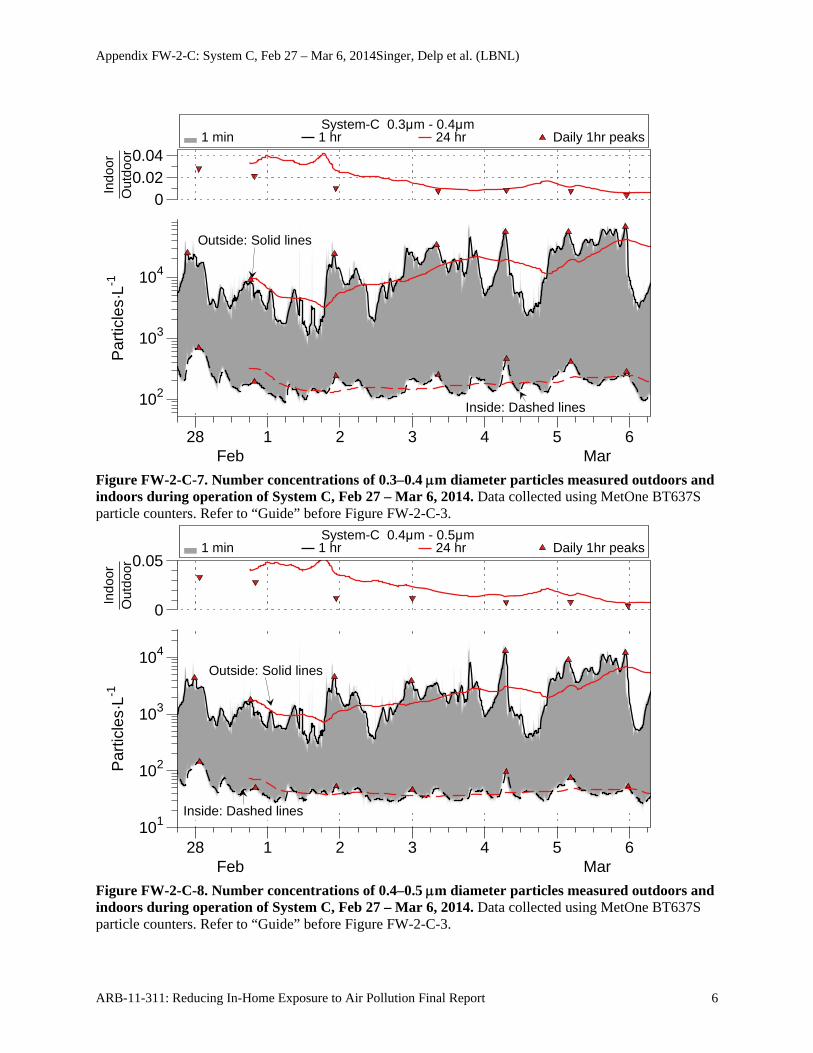
Figure FW-2-C-7. Number concentrations of 0.3–0.4 m diameter particles measured outdoors and indoors during operation of System C, Feb 27 – Mar 6, 2014. Data collected using MetOne BT637S particle counters. Refer to “Guide” before Figure FW-2-C-3.
Figure FW-2-C-8. Number concentrations of 0.4–0.5 m diameter particles measured outdoors and indoors during operation of System C, Feb 27 – Mar 6, 2014. Data collected using MetOne BT637S particle counters. Refer to “Guide” before Figure FW-2-C-3.
1 min 1 hr 24 hr Daily 1hr peaks System-C 0.3μm - 0.4μm
Outside: Solid lines
Inside: Dashed lines
Par
ticle
s·L-1
102
103
104
Indo
orO
utdo
or
00.020.04
28 1 2 3 4 5 6Feb Mar
1 min 1 hr 24 hr Daily 1hr peaks System-C 0.4μm - 0.5μm
Outside: Solid lines
Inside: Dashed lines
Par
ticle
s·L-1
101
102
103
104
Indo
orO
utdo
or
0
0.05
28 1 2 3 4 5 6Feb Mar
Appendix FW-2-C: System C, Feb 27 – Mar 6, 2014Singer, Delp et al. (LBNL)
ARB-11-311: Reducing In-Home Exposure to Air Pollution Final Report 7
Figure FW-2-C-9. Number concentrations of 0.5–0.7 m diameter particles measured outdoors and indoors during operation of System C, Feb 27 – Mar 6, 2014. Data collected using MetOne BT637S particle counters. Refer to “Guide” before Figure FW-2-C-3.
Figure FW-2-C-10. Number concentrations of 0.7–1.0 m diameter particles measured outdoors and indoors during operation of System C, Feb 27 – Mar 6, 2014. Data collected using MetOne BT637S particle counters. Refer to “Guide” before Figure FW-2-C-3 for details.
1 min 1 hr 24 hr Daily 1hr peaks System-C 0.5μm - 0.7μm
Outside: Solid lines
Inside: Dashed lines
Par
ticle
s·L-1
10
100
1000
Indo
orO
utdo
or
0.020.04
28 1 2 3 4 5 6Feb Mar
1 min 1 hr 24 hr Daily 1hr peaks System-C 0.7μm - 1.0μm
Outside: Solid lines
Inside: Dashed lines
Par
ticle
s·L-1
10
100
1000
Indo
orO
utdo
or
0.020.04
28 1 2 3 4 5 6Feb Mar
Appendix FW-2-C: System C, Feb 27 – Mar 6, 2014Singer, Delp et al. (LBNL)
ARB-11-311: Reducing In-Home Exposure to Air Pollution Final Report 8
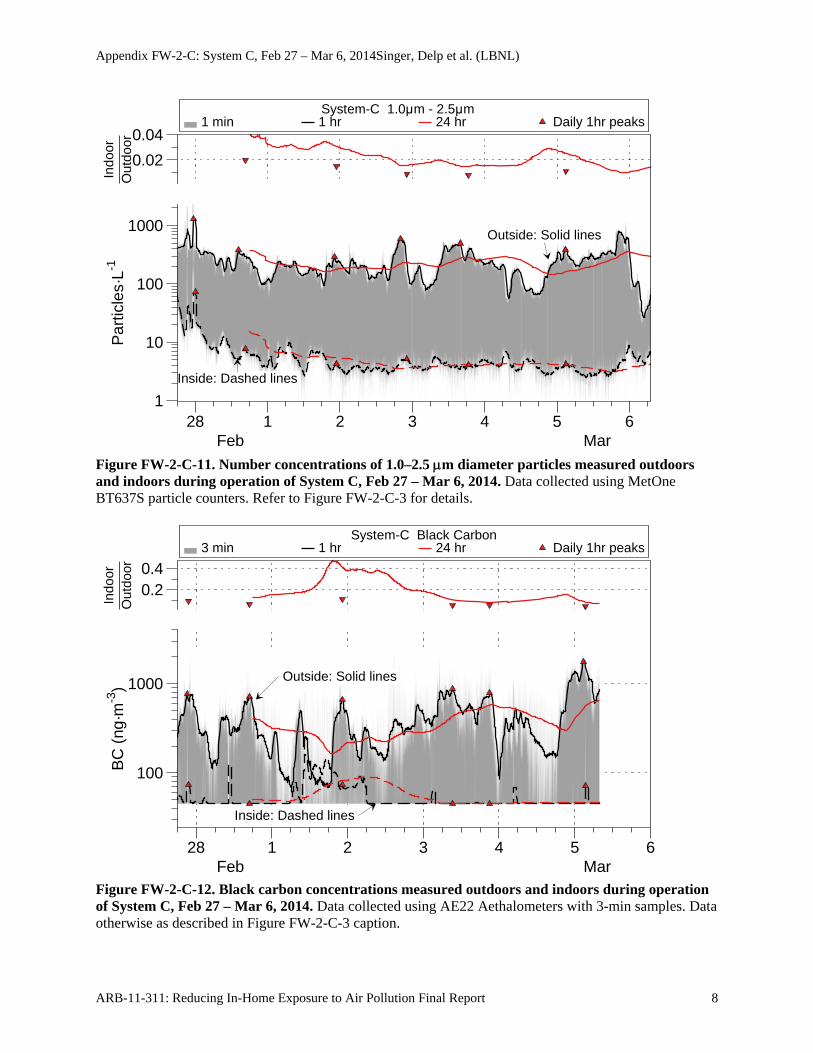
Figure FW-2-C-11. Number concentrations of 1.0–2.5 m diameter particles measured outdoors and indoors during operation of System C, Feb 27 – Mar 6, 2014. Data collected using MetOne BT637S particle counters. Refer to Figure FW-2-C-3 for details.
Figure FW-2-C-12. Black carbon concentrations measured outdoors and indoors during operation of System C, Feb 27 – Mar 6, 2014. Data collected using AE22 Aethalometers with 3-min samples. Data otherwise as described in Figure FW-2-C-3 caption.
1 min 1 hr 24 hr Daily 1hr peaks System-C 1.0μm - 2.5μm
Outside: Solid lines
Inside: Dashed lines
Par
ticle
s·L-1
1
10
100
1000
Indo
orO
utdo
or
0.02
0.04
28 1 2 3 4 5 6Feb Mar
3 min 1 hr 24 hr Daily 1hr peaks System-C Black Carbon
Outside: Solid lines
Inside: Dashed lines
BC
(ng
·m-3
)
100
1000
Indo
orO
utdo
or
0.20.4
28 1 2 3 4 5 6Feb Mar
Appendix FW-2-C: System C, Feb 27 – Mar 6, 2014Singer, Delp et al. (LBNL)
ARB-11-311: Reducing In-Home Exposure to Air Pollution Final Report 9
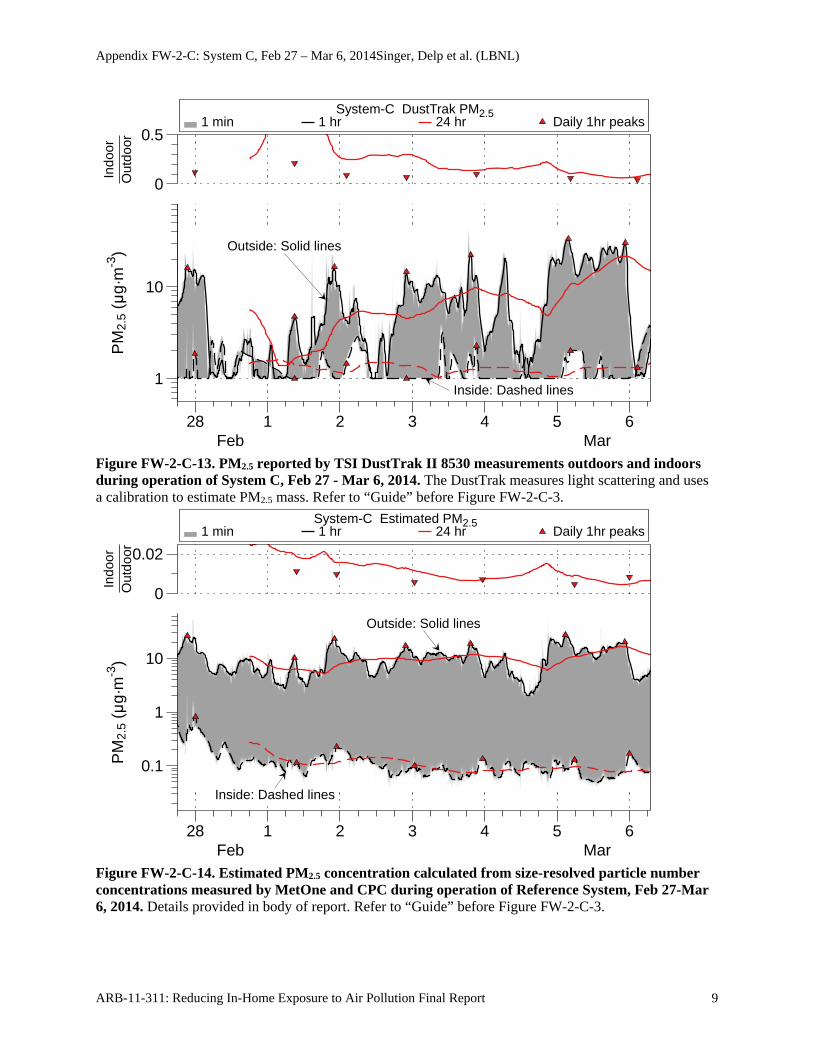
Figure FW-2-C-13. PM2.5 reported by TSI DustTrak II 8530 measurements outdoors and indoors during operation of System C, Feb 27 - Mar 6, 2014. The DustTrak measures light scattering and uses a calibration to estimate PM2.5 mass. Refer to “Guide” before Figure FW-2-C-3.
Figure FW-2-C-14. Estimated PM2.5 concentration calculated from size-resolved particle number concentrations measured by MetOne and CPC during operation of Reference System, Feb 27-Mar 6, 2014. Details provided in body of report. Refer to “Guide” before Figure FW-2-C-3.
1 min 1 hr 24 hr Daily 1hr peaks System-C DustTrak PM2.5
1
10
Outside: Solid lines
Inside: Dashed lines
PM
2.5
(μg·
m-3
)In
door
Out
door
0
0.5
28 1 2 3 4 5 6Feb Mar
1 min 1 hr 24 hr Daily 1hr peaks System-C Estimated PM2.5
Outside: Solid lines
Inside: Dashed lines
PM
2.5
(μg·
m-3
)
0.1
1
10
Indo
orO
utdo
or
0
0.02
28 1 2 3 4 5 6Feb Mar
Appendix FW-2-C: System C, Feb 27 – Mar 6, 2014Singer, Delp et al. (LBNL)
ARB-11-311: Reducing In-Home Exposure to Air Pollution Final Report 10
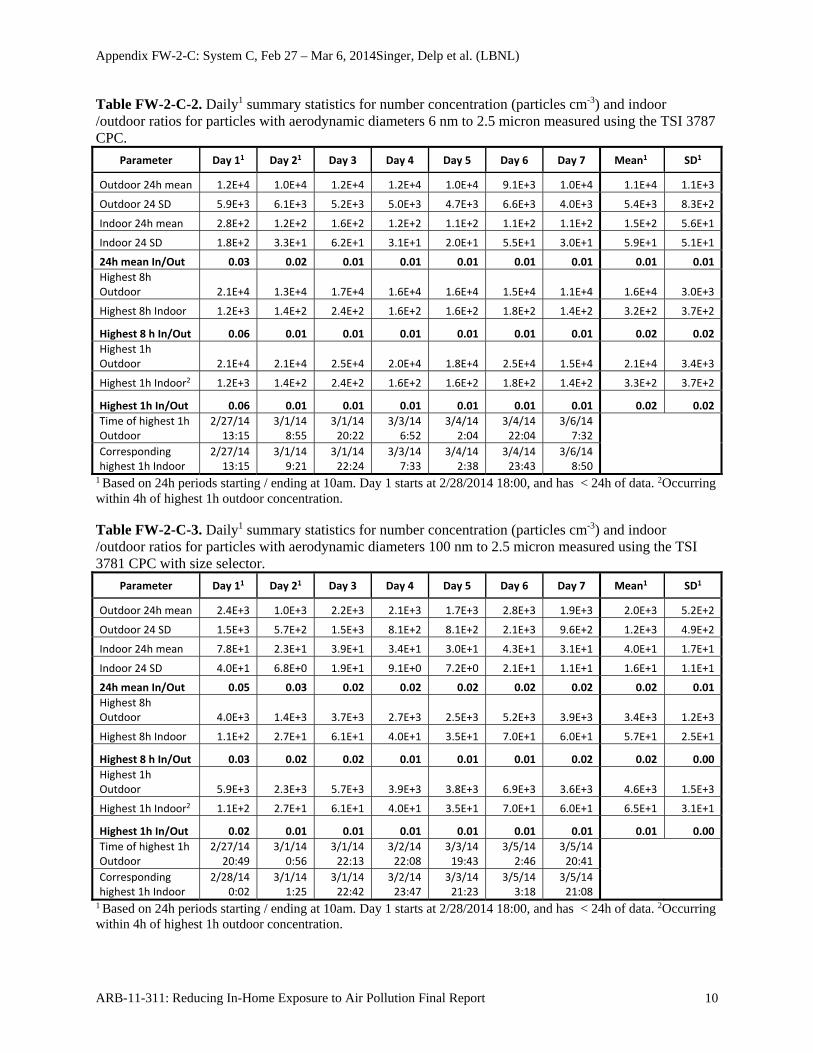
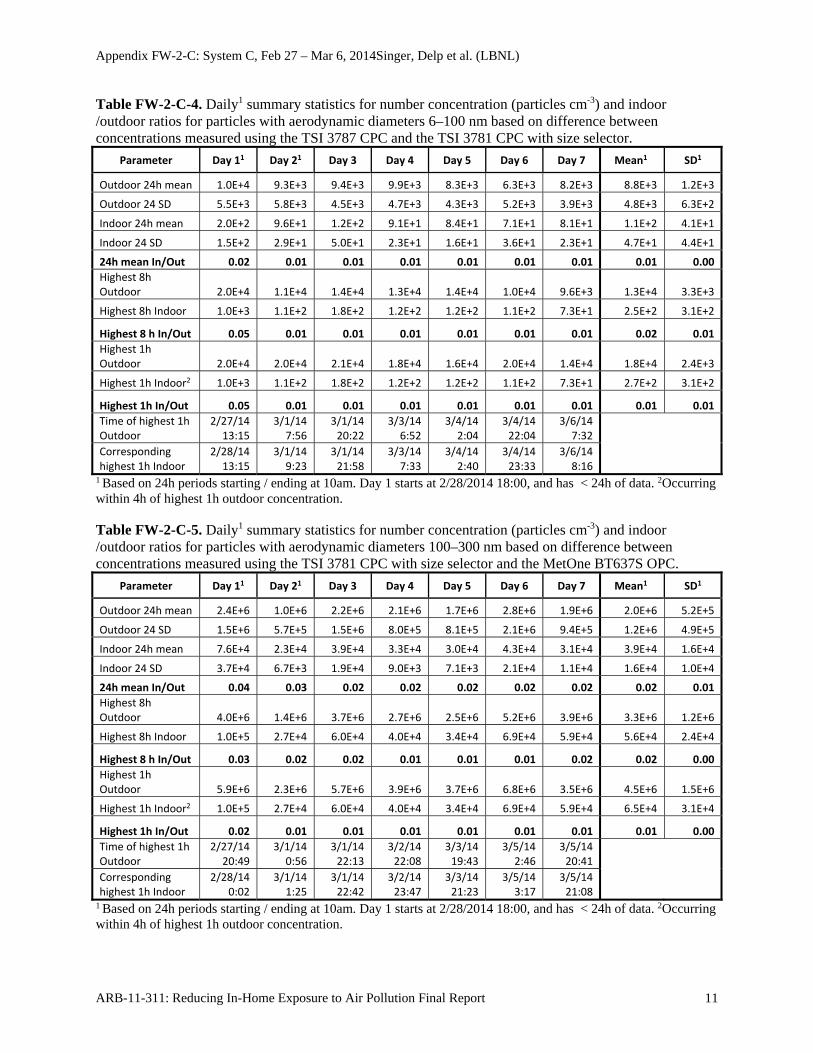
Table FW-2-C-2. Daily1 summary statistics for number concentration (particles cm-3) and indoor /outdoor ratios for particles with aerodynamic diameters 6 nm to 2.5 micron measured using the TSI 3787 CPC.
Parameter Day 11 Day 21 Day 3 Day 4 Day 5 Day 6 Day 7 Mean1 SD1
Outdoor 24h mean 1.2E+4 1.0E+4 1.2E+4 1.2E+4 1.0E+4 9.1E+3 1.0E+4 1.1E+4 1.1E+3
Outdoor 24 SD 5.9E+3 6.1E+3 5.2E+3 5.0E+3 4.7E+3 6.6E+3 4.0E+3 5.4E+3 8.3E+2
Indoor 24h mean 2.8E+2 1.2E+2 1.6E+2 1.2E+2 1.1E+2 1.1E+2 1.1E+2 1.5E+2 5.6E+1
Indoor 24 SD 1.8E+2 3.3E+1 6.2E+1 3.1E+1 2.0E+1 5.5E+1 3.0E+1 5.9E+1 5.1E+1
24h mean In/Out 0.03 0.02 0.01 0.01 0.01 0.01 0.01 0.01 0.01
Highest 8h Outdoor 2.1E+4 1.3E+4 1.7E+4 1.6E+4 1.6E+4 1.5E+4 1.1E+4 1.6E+4 3.0E+3
Highest 8h Indoor 1.2E+3 1.4E+2 2.4E+2 1.6E+2 1.6E+2 1.8E+2 1.4E+2 3.2E+2 3.7E+2
Highest 8 h In/Out 0.06 0.01 0.01 0.01 0.01 0.01 0.01 0.02 0.02
Highest 1h Outdoor 2.1E+4 2.1E+4 2.5E+4 2.0E+4 1.8E+4 2.5E+4 1.5E+4 2.1E+4 3.4E+3
Highest 1h Indoor2 1.2E+3 1.4E+2 2.4E+2 1.6E+2 1.6E+2 1.8E+2 1.4E+2 3.3E+2 3.7E+2
Highest 1h In/Out 0.06 0.01 0.01 0.01 0.01 0.01 0.01 0.02 0.02
Time of highest 1h Outdoor
2/27/14 13:15
3/1/14 8:55
3/1/14 20:22
3/3/14 6:52
3/4/14 2:04
3/4/14 22:04
3/6/14 7:32
Corresponding highest 1h Indoor
2/27/14 13:15
3/1/14 9:21
3/1/14 22:24
3/3/14 7:33
3/4/14 2:38
3/4/14 23:43
3/6/14 8:50
1 Based on 24h periods starting / ending at 10am. Day 1 starts at 2/28/2014 18:00, and has < 24h of data. 2Occurring within 4h of highest 1h outdoor concentration. Table FW-2-C-3. Daily1 summary statistics for number concentration (particles cm-3) and indoor /outdoor ratios for particles with aerodynamic diameters 100 nm to 2.5 micron measured using the TSI 3781 CPC with size selector.
Parameter Day 11 Day 21 Day 3 Day 4 Day 5 Day 6 Day 7 Mean1 SD1
Outdoor 24h mean 2.4E+3 1.0E+3 2.2E+3 2.1E+3 1.7E+3 2.8E+3 1.9E+3 2.0E+3 5.2E+2
Outdoor 24 SD 1.5E+3 5.7E+2 1.5E+3 8.1E+2 8.1E+2 2.1E+3 9.6E+2 1.2E+3 4.9E+2
Indoor 24h mean 7.8E+1 2.3E+1 3.9E+1 3.4E+1 3.0E+1 4.3E+1 3.1E+1 4.0E+1 1.7E+1
Indoor 24 SD 4.0E+1 6.8E+0 1.9E+1 9.1E+0 7.2E+0 2.1E+1 1.1E+1 1.6E+1 1.1E+1
24h mean In/Out 0.05 0.03 0.02 0.02 0.02 0.02 0.02 0.02 0.01
Highest 8h Outdoor 4.0E+3 1.4E+3 3.7E+3 2.7E+3 2.5E+3 5.2E+3 3.9E+3 3.4E+3 1.2E+3
Highest 8h Indoor 1.1E+2 2.7E+1 6.1E+1 4.0E+1 3.5E+1 7.0E+1 6.0E+1 5.7E+1 2.5E+1
Highest 8 h In/Out 0.03 0.02 0.02 0.01 0.01 0.01 0.02 0.02 0.00
Highest 1h Outdoor 5.9E+3 2.3E+3 5.7E+3 3.9E+3 3.8E+3 6.9E+3 3.6E+3 4.6E+3 1.5E+3
Highest 1h Indoor2 1.1E+2 2.7E+1 6.1E+1 4.0E+1 3.5E+1 7.0E+1 6.0E+1 6.5E+1 3.1E+1
Highest 1h In/Out 0.02 0.01 0.01 0.01 0.01 0.01 0.01 0.01 0.00
Time of highest 1h Outdoor
2/27/14 20:49
3/1/14 0:56
3/1/14 22:13
3/2/14 22:08
3/3/14 19:43
3/5/14 2:46
3/5/14 20:41
Corresponding highest 1h Indoor
2/28/14 0:02
3/1/14 1:25
3/1/14 22:42
3/2/14 23:47
3/3/14 21:23
3/5/14 3:18
3/5/14 21:08
1 Based on 24h periods starting / ending at 10am. Day 1 starts at 2/28/2014 18:00, and has < 24h of data. 2Occurring within 4h of highest 1h outdoor concentration.
Appendix FW-2-C: System C, Feb 27 – Mar 6, 2014Singer, Delp et al. (LBNL)
ARB-11-311: Reducing In-Home Exposure to Air Pollution Final Report 11
Table FW-2-C-4. Daily1 summary statistics for number concentration (particles cm-3) and indoor /outdoor ratios for particles with aerodynamic diameters 6–100 nm based on difference between concentrations measured using the TSI 3787 CPC and the TSI 3781 CPC with size selector.
Parameter Day 11 Day 21 Day 3 Day 4 Day 5 Day 6 Day 7 Mean1 SD1
Outdoor 24h mean 1.0E+4 9.3E+3 9.4E+3 9.9E+3 8.3E+3 6.3E+3 8.2E+3 8.8E+3 1.2E+3
Outdoor 24 SD 5.5E+3 5.8E+3 4.5E+3 4.7E+3 4.3E+3 5.2E+3 3.9E+3 4.8E+3 6.3E+2
Indoor 24h mean 2.0E+2 9.6E+1 1.2E+2 9.1E+1 8.4E+1 7.1E+1 8.1E+1 1.1E+2 4.1E+1
Indoor 24 SD 1.5E+2 2.9E+1 5.0E+1 2.3E+1 1.6E+1 3.6E+1 2.3E+1 4.7E+1 4.4E+1
24h mean In/Out 0.02 0.01 0.01 0.01 0.01 0.01 0.01 0.01 0.00
Highest 8h Outdoor 2.0E+4 1.1E+4 1.4E+4 1.3E+4 1.4E+4 1.0E+4 9.6E+3 1.3E+4 3.3E+3
Highest 8h Indoor 1.0E+3 1.1E+2 1.8E+2 1.2E+2 1.2E+2 1.1E+2 7.3E+1 2.5E+2 3.1E+2
Highest 8 h In/Out 0.05 0.01 0.01 0.01 0.01 0.01 0.01 0.02 0.01
Highest 1h Outdoor 2.0E+4 2.0E+4 2.1E+4 1.8E+4 1.6E+4 2.0E+4 1.4E+4 1.8E+4 2.4E+3
Highest 1h Indoor2 1.0E+3 1.1E+2 1.8E+2 1.2E+2 1.2E+2 1.1E+2 7.3E+1 2.7E+2 3.1E+2
Highest 1h In/Out 0.05 0.01 0.01 0.01 0.01 0.01 0.01 0.01 0.01
Time of highest 1h Outdoor
2/27/14 13:15
3/1/14 7:56
3/1/14 20:22
3/3/14 6:52
3/4/14 2:04
3/4/14 22:04
3/6/14 7:32
Corresponding highest 1h Indoor
2/28/14 13:15
3/1/14 9:23
3/1/14 21:58
3/3/14 7:33
3/4/14 2:40
3/4/14 23:33
3/6/14 8:16
1 Based on 24h periods starting / ending at 10am. Day 1 starts at 2/28/2014 18:00, and has < 24h of data. 2Occurring within 4h of highest 1h outdoor concentration. Table FW-2-C-5. Daily1 summary statistics for number concentration (particles cm-3) and indoor /outdoor ratios for particles with aerodynamic diameters 100–300 nm based on difference between concentrations measured using the TSI 3781 CPC with size selector and the MetOne BT637S OPC.
Parameter Day 11 Day 21 Day 3 Day 4 Day 5 Day 6 Day 7 Mean1 SD1
Outdoor 24h mean 2.4E+6 1.0E+6 2.2E+6 2.1E+6 1.7E+6 2.8E+6 1.9E+6 2.0E+6 5.2E+5
Outdoor 24 SD 1.5E+6 5.7E+5 1.5E+6 8.0E+5 8.1E+5 2.1E+6 9.4E+5 1.2E+6 4.9E+5
Indoor 24h mean 7.6E+4 2.3E+4 3.9E+4 3.3E+4 3.0E+4 4.3E+4 3.1E+4 3.9E+4 1.6E+4
Indoor 24 SD 3.7E+4 6.7E+3 1.9E+4 9.0E+3 7.1E+3 2.1E+4 1.1E+4 1.6E+4 1.0E+4
24h mean In/Out 0.04 0.03 0.02 0.02 0.02 0.02 0.02 0.02 0.01
Highest 8h Outdoor 4.0E+6 1.4E+6 3.7E+6 2.7E+6 2.5E+6 5.2E+6 3.9E+6 3.3E+6 1.2E+6
Highest 8h Indoor 1.0E+5 2.7E+4 6.0E+4 4.0E+4 3.4E+4 6.9E+4 5.9E+4 5.6E+4 2.4E+4
Highest 8 h In/Out 0.03 0.02 0.02 0.01 0.01 0.01 0.02 0.02 0.00
Highest 1h Outdoor 5.9E+6 2.3E+6 5.7E+6 3.9E+6 3.7E+6 6.8E+6 3.5E+6 4.5E+6 1.5E+6
Highest 1h Indoor2 1.0E+5 2.7E+4 6.0E+4 4.0E+4 3.4E+4 6.9E+4 5.9E+4 6.5E+4 3.1E+4
Highest 1h In/Out 0.02 0.01 0.01 0.01 0.01 0.01 0.01 0.01 0.00
Time of highest 1h Outdoor
2/27/14 20:49
3/1/14 0:56
3/1/14 22:13
3/2/14 22:08
3/3/14 19:43
3/5/14 2:46
3/5/14 20:41
Corresponding highest 1h Indoor
2/28/14 0:02
3/1/14 1:25
3/1/14 22:42
3/2/14 23:47
3/3/14 21:23
3/5/14 3:17
3/5/14 21:08
1 Based on 24h periods starting / ending at 10am. Day 1 starts at 2/28/2014 18:00, and has < 24h of data. 2Occurring within 4h of highest 1h outdoor concentration.
Appendix FW-2-C: System C, Feb 27 – Mar 6, 2014Singer, Delp et al. (LBNL)
ARB-11-311: Reducing In-Home Exposure to Air Pollution Final Report 12
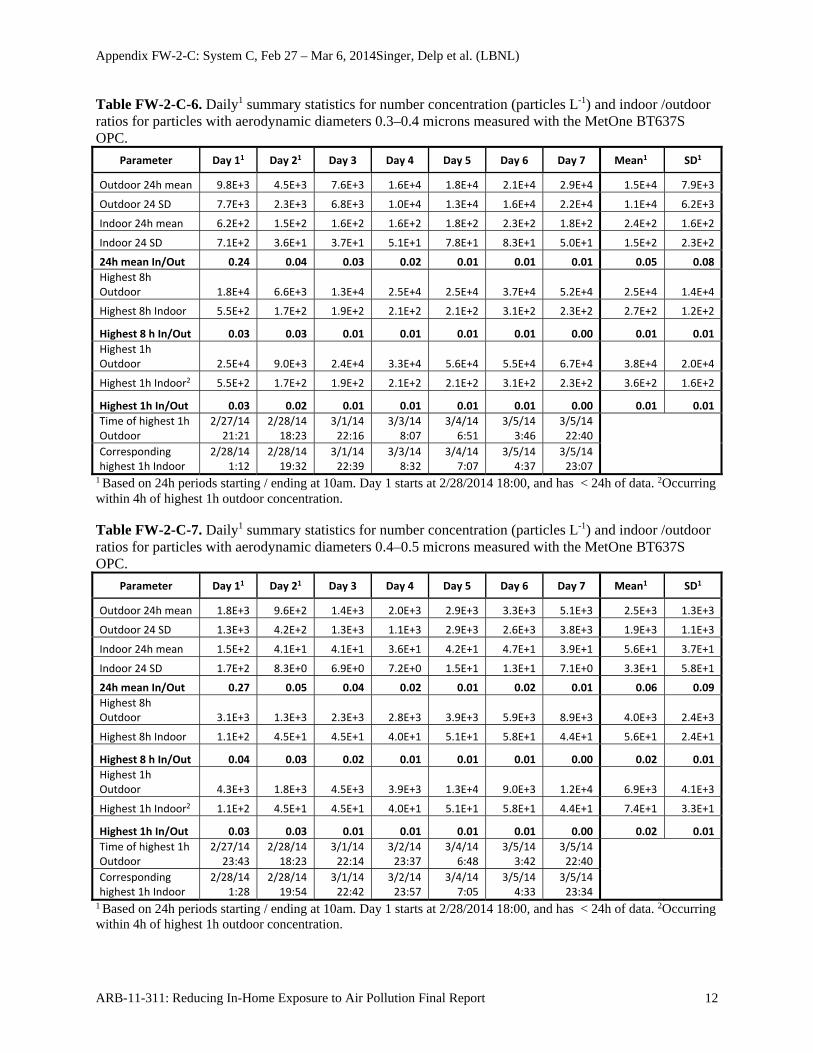
Table FW-2-C-6. Daily1 summary statistics for number concentration (particles L-1) and indoor /outdoor ratios for particles with aerodynamic diameters 0.3–0.4 microns measured with the MetOne BT637S OPC.
Parameter Day 11 Day 21 Day 3 Day 4 Day 5 Day 6 Day 7 Mean1 SD1
Outdoor 24h mean 9.8E+3 4.5E+3 7.6E+3 1.6E+4 1.8E+4 2.1E+4 2.9E+4 1.5E+4 7.9E+3
Outdoor 24 SD 7.7E+3 2.3E+3 6.8E+3 1.0E+4 1.3E+4 1.6E+4 2.2E+4 1.1E+4 6.2E+3
Indoor 24h mean 6.2E+2 1.5E+2 1.6E+2 1.6E+2 1.8E+2 2.3E+2 1.8E+2 2.4E+2 1.6E+2
Indoor 24 SD 7.1E+2 3.6E+1 3.7E+1 5.1E+1 7.8E+1 8.3E+1 5.0E+1 1.5E+2 2.3E+2
24h mean In/Out 0.24 0.04 0.03 0.02 0.01 0.01 0.01 0.05 0.08
Highest 8h Outdoor 1.8E+4 6.6E+3 1.3E+4 2.5E+4 2.5E+4 3.7E+4 5.2E+4 2.5E+4 1.4E+4
Highest 8h Indoor 5.5E+2 1.7E+2 1.9E+2 2.1E+2 2.1E+2 3.1E+2 2.3E+2 2.7E+2 1.2E+2
Highest 8 h In/Out 0.03 0.03 0.01 0.01 0.01 0.01 0.00 0.01 0.01
Highest 1h Outdoor 2.5E+4 9.0E+3 2.4E+4 3.3E+4 5.6E+4 5.5E+4 6.7E+4 3.8E+4 2.0E+4
Highest 1h Indoor2 5.5E+2 1.7E+2 1.9E+2 2.1E+2 2.1E+2 3.1E+2 2.3E+2 3.6E+2 1.6E+2
Highest 1h In/Out 0.03 0.02 0.01 0.01 0.01 0.01 0.00 0.01 0.01
Time of highest 1h Outdoor
2/27/14 21:21
2/28/14 18:23
3/1/14 22:16
3/3/14 8:07
3/4/14 6:51
3/5/14 3:46
3/5/14 22:40
Corresponding highest 1h Indoor
2/28/14 1:12
2/28/14 19:32
3/1/14 22:39
3/3/14 8:32
3/4/14 7:07
3/5/14 4:37
3/5/14 23:07
1 Based on 24h periods starting / ending at 10am. Day 1 starts at 2/28/2014 18:00, and has < 24h of data. 2Occurring within 4h of highest 1h outdoor concentration. Table FW-2-C-7. Daily1 summary statistics for number concentration (particles L-1) and indoor /outdoor ratios for particles with aerodynamic diameters 0.4–0.5 microns measured with the MetOne BT637S OPC.
Parameter Day 11 Day 21 Day 3 Day 4 Day 5 Day 6 Day 7 Mean1 SD1
Outdoor 24h mean 1.8E+3 9.6E+2 1.4E+3 2.0E+3 2.9E+3 3.3E+3 5.1E+3 2.5E+3 1.3E+3
Outdoor 24 SD 1.3E+3 4.2E+2 1.3E+3 1.1E+3 2.9E+3 2.6E+3 3.8E+3 1.9E+3 1.1E+3
Indoor 24h mean 1.5E+2 4.1E+1 4.1E+1 3.6E+1 4.2E+1 4.7E+1 3.9E+1 5.6E+1 3.7E+1
Indoor 24 SD 1.7E+2 8.3E+0 6.9E+0 7.2E+0 1.5E+1 1.3E+1 7.1E+0 3.3E+1 5.8E+1
24h mean In/Out 0.27 0.05 0.04 0.02 0.01 0.02 0.01 0.06 0.09
Highest 8h Outdoor 3.1E+3 1.3E+3 2.3E+3 2.8E+3 3.9E+3 5.9E+3 8.9E+3 4.0E+3 2.4E+3
Highest 8h Indoor 1.1E+2 4.5E+1 4.5E+1 4.0E+1 5.1E+1 5.8E+1 4.4E+1 5.6E+1 2.4E+1
Highest 8 h In/Out 0.04 0.03 0.02 0.01 0.01 0.01 0.00 0.02 0.01
Highest 1h Outdoor 4.3E+3 1.8E+3 4.5E+3 3.9E+3 1.3E+4 9.0E+3 1.2E+4 6.9E+3 4.1E+3
Highest 1h Indoor2 1.1E+2 4.5E+1 4.5E+1 4.0E+1 5.1E+1 5.8E+1 4.4E+1 7.4E+1 3.3E+1
Highest 1h In/Out 0.03 0.03 0.01 0.01 0.01 0.01 0.00 0.02 0.01
Time of highest 1h Outdoor
2/27/14 23:43
2/28/14 18:23
3/1/14 22:14
3/2/14 23:37
3/4/14 6:48
3/5/14 3:42
3/5/14 22:40
Corresponding highest 1h Indoor
2/28/14 1:28
2/28/14 19:54
3/1/14 22:42
3/2/14 23:57
3/4/14 7:05
3/5/14 4:33
3/5/14 23:34
1 Based on 24h periods starting / ending at 10am. Day 1 starts at 2/28/2014 18:00, and has < 24h of data. 2Occurring within 4h of highest 1h outdoor concentration.
Appendix FW-2-C: System C, Feb 27 – Mar 6, 2014Singer, Delp et al. (LBNL)
ARB-11-311: Reducing In-Home Exposure to Air Pollution Final Report 13
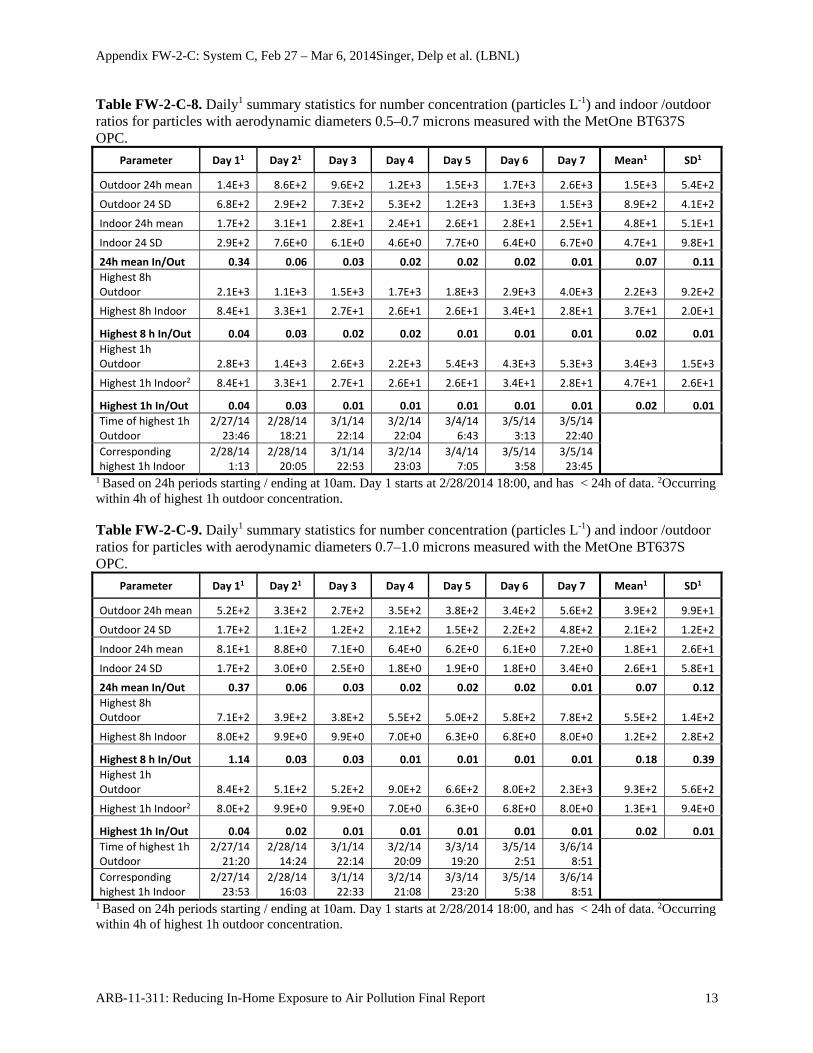
Table FW-2-C-8. Daily1 summary statistics for number concentration (particles L-1) and indoor /outdoor ratios for particles with aerodynamic diameters 0.5–0.7 microns measured with the MetOne BT637S OPC.
Parameter Day 11 Day 21 Day 3 Day 4 Day 5 Day 6 Day 7 Mean1 SD1
Outdoor 24h mean 1.4E+3 8.6E+2 9.6E+2 1.2E+3 1.5E+3 1.7E+3 2.6E+3 1.5E+3 5.4E+2
Outdoor 24 SD 6.8E+2 2.9E+2 7.3E+2 5.3E+2 1.2E+3 1.3E+3 1.5E+3 8.9E+2 4.1E+2
Indoor 24h mean 1.7E+2 3.1E+1 2.8E+1 2.4E+1 2.6E+1 2.8E+1 2.5E+1 4.8E+1 5.1E+1
Indoor 24 SD 2.9E+2 7.6E+0 6.1E+0 4.6E+0 7.7E+0 6.4E+0 6.7E+0 4.7E+1 9.8E+1
24h mean In/Out 0.34 0.06 0.03 0.02 0.02 0.02 0.01 0.07 0.11
Highest 8h Outdoor 2.1E+3 1.1E+3 1.5E+3 1.7E+3 1.8E+3 2.9E+3 4.0E+3 2.2E+3 9.2E+2
Highest 8h Indoor 8.4E+1 3.3E+1 2.7E+1 2.6E+1 2.6E+1 3.4E+1 2.8E+1 3.7E+1 2.0E+1
Highest 8 h In/Out 0.04 0.03 0.02 0.02 0.01 0.01 0.01 0.02 0.01
Highest 1h Outdoor 2.8E+3 1.4E+3 2.6E+3 2.2E+3 5.4E+3 4.3E+3 5.3E+3 3.4E+3 1.5E+3
Highest 1h Indoor2 8.4E+1 3.3E+1 2.7E+1 2.6E+1 2.6E+1 3.4E+1 2.8E+1 4.7E+1 2.6E+1
Highest 1h In/Out 0.04 0.03 0.01 0.01 0.01 0.01 0.01 0.02 0.01
Time of highest 1h Outdoor
2/27/14 23:46
2/28/14 18:21
3/1/14 22:14
3/2/14 22:04
3/4/14 6:43
3/5/14 3:13
3/5/14 22:40
Corresponding highest 1h Indoor
2/28/14 1:13
2/28/14 20:05
3/1/14 22:53
3/2/14 23:03
3/4/14 7:05
3/5/14 3:58
3/5/14 23:45
1 Based on 24h periods starting / ending at 10am. Day 1 starts at 2/28/2014 18:00, and has < 24h of data. 2Occurring within 4h of highest 1h outdoor concentration. Table FW-2-C-9. Daily1 summary statistics for number concentration (particles L-1) and indoor /outdoor ratios for particles with aerodynamic diameters 0.7–1.0 microns measured with the MetOne BT637S OPC.
Parameter Day 11 Day 21 Day 3 Day 4 Day 5 Day 6 Day 7 Mean1 SD1
Outdoor 24h mean 5.2E+2 3.3E+2 2.7E+2 3.5E+2 3.8E+2 3.4E+2 5.6E+2 3.9E+2 9.9E+1
Outdoor 24 SD 1.7E+2 1.1E+2 1.2E+2 2.1E+2 1.5E+2 2.2E+2 4.8E+2 2.1E+2 1.2E+2
Indoor 24h mean 8.1E+1 8.8E+0 7.1E+0 6.4E+0 6.2E+0 6.1E+0 7.2E+0 1.8E+1 2.6E+1
Indoor 24 SD 1.7E+2 3.0E+0 2.5E+0 1.8E+0 1.9E+0 1.8E+0 3.4E+0 2.6E+1 5.8E+1
24h mean In/Out 0.37 0.06 0.03 0.02 0.02 0.02 0.01 0.07 0.12
Highest 8h Outdoor 7.1E+2 3.9E+2 3.8E+2 5.5E+2 5.0E+2 5.8E+2 7.8E+2 5.5E+2 1.4E+2
Highest 8h Indoor 8.0E+2 9.9E+0 9.9E+0 7.0E+0 6.3E+0 6.8E+0 8.0E+0 1.2E+2 2.8E+2
Highest 8 h In/Out 1.14 0.03 0.03 0.01 0.01 0.01 0.01 0.18 0.39
Highest 1h Outdoor 8.4E+2 5.1E+2 5.2E+2 9.0E+2 6.6E+2 8.0E+2 2.3E+3 9.3E+2 5.6E+2
Highest 1h Indoor2 8.0E+2 9.9E+0 9.9E+0 7.0E+0 6.3E+0 6.8E+0 8.0E+0 1.3E+1 9.4E+0
Highest 1h In/Out 0.04 0.02 0.01 0.01 0.01 0.01 0.01 0.02 0.01
Time of highest 1h Outdoor
2/27/14 21:20
2/28/14 14:24
3/1/14 22:14
3/2/14 20:09
3/3/14 19:20
3/5/14 2:51
3/6/14 8:51
Corresponding highest 1h Indoor
2/27/14 23:53
2/28/14 16:03
3/1/14 22:33
3/2/14 21:08
3/3/14 23:20
3/5/14 5:38
3/6/14 8:51
1 Based on 24h periods starting / ending at 10am. Day 1 starts at 2/28/2014 18:00, and has < 24h of data. 2Occurring within 4h of highest 1h outdoor concentration.
Appendix FW-2-C: System C, Feb 27 – Mar 6, 2014Singer, Delp et al. (LBNL)
ARB-11-311: Reducing In-Home Exposure to Air Pollution Final Report 14
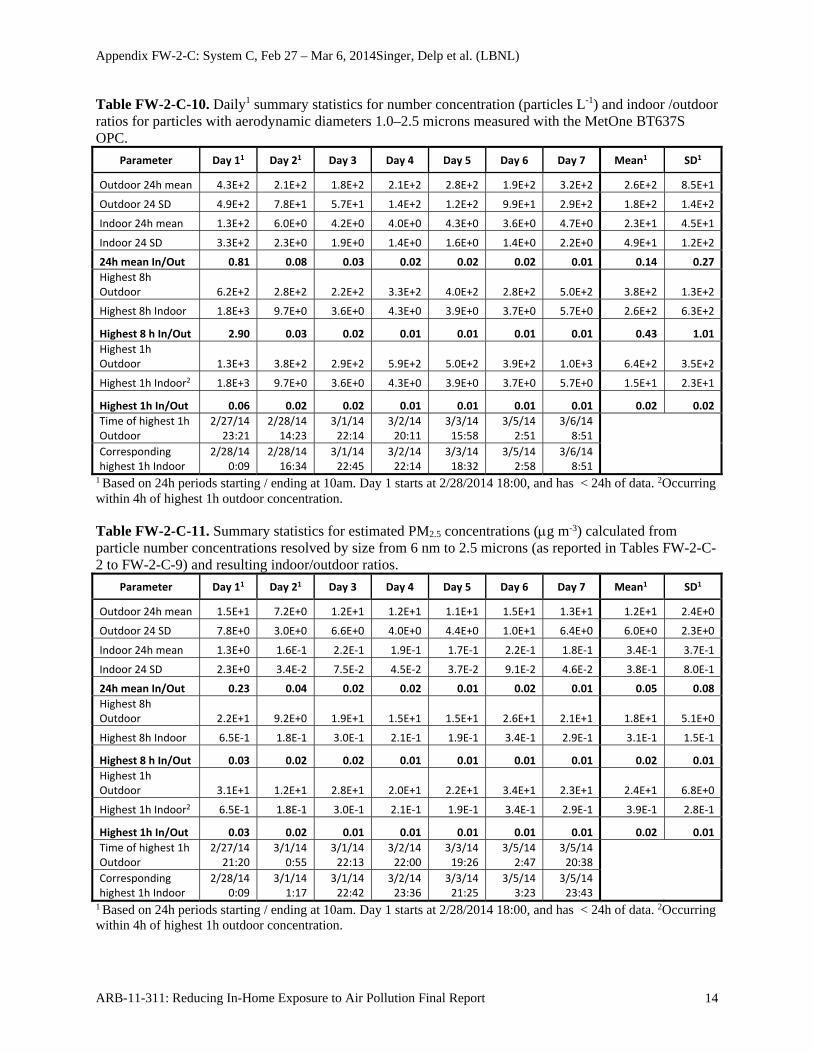
Table FW-2-C-10. Daily1 summary statistics for number concentration (particles L-1) and indoor /outdoor ratios for particles with aerodynamic diameters 1.0–2.5 microns measured with the MetOne BT637S OPC.
Parameter Day 11 Day 21 Day 3 Day 4 Day 5 Day 6 Day 7 Mean1 SD1
Outdoor 24h mean 4.3E+2 2.1E+2 1.8E+2 2.1E+2 2.8E+2 1.9E+2 3.2E+2 2.6E+2 8.5E+1
Outdoor 24 SD 4.9E+2 7.8E+1 5.7E+1 1.4E+2 1.2E+2 9.9E+1 2.9E+2 1.8E+2 1.4E+2
Indoor 24h mean 1.3E+2 6.0E+0 4.2E+0 4.0E+0 4.3E+0 3.6E+0 4.7E+0 2.3E+1 4.5E+1
Indoor 24 SD 3.3E+2 2.3E+0 1.9E+0 1.4E+0 1.6E+0 1.4E+0 2.2E+0 4.9E+1 1.2E+2
24h mean In/Out 0.81 0.08 0.03 0.02 0.02 0.02 0.01 0.14 0.27
Highest 8h Outdoor 6.2E+2 2.8E+2 2.2E+2 3.3E+2 4.0E+2 2.8E+2 5.0E+2 3.8E+2 1.3E+2
Highest 8h Indoor 1.8E+3 9.7E+0 3.6E+0 4.3E+0 3.9E+0 3.7E+0 5.7E+0 2.6E+2 6.3E+2
Highest 8 h In/Out 2.90 0.03 0.02 0.01 0.01 0.01 0.01 0.43 1.01
Highest 1h Outdoor 1.3E+3 3.8E+2 2.9E+2 5.9E+2 5.0E+2 3.9E+2 1.0E+3 6.4E+2 3.5E+2
Highest 1h Indoor2 1.8E+3 9.7E+0 3.6E+0 4.3E+0 3.9E+0 3.7E+0 5.7E+0 1.5E+1 2.3E+1
Highest 1h In/Out 0.06 0.02 0.02 0.01 0.01 0.01 0.01 0.02 0.02
Time of highest 1h Outdoor
2/27/14 23:21
2/28/14 14:23
3/1/14 22:14
3/2/14 20:11
3/3/14 15:58
3/5/14 2:51
3/6/14 8:51
Corresponding highest 1h Indoor
2/28/14 0:09
2/28/14 16:34
3/1/14 22:45
3/2/14 22:14
3/3/14 18:32
3/5/14 2:58
3/6/14 8:51
1 Based on 24h periods starting / ending at 10am. Day 1 starts at 2/28/2014 18:00, and has < 24h of data. 2Occurring within 4h of highest 1h outdoor concentration. Table FW-2-C-11. Summary statistics for estimated PM2.5 concentrations (g m-3) calculated from particle number concentrations resolved by size from 6 nm to 2.5 microns (as reported in Tables FW-2-C-2 to FW-2-C-9) and resulting indoor/outdoor ratios.
Parameter Day 11 Day 21 Day 3 Day 4 Day 5 Day 6 Day 7 Mean1 SD1
Outdoor 24h mean 1.5E+1 7.2E+0 1.2E+1 1.2E+1 1.1E+1 1.5E+1 1.3E+1 1.2E+1 2.4E+0
Outdoor 24 SD 7.8E+0 3.0E+0 6.6E+0 4.0E+0 4.4E+0 1.0E+1 6.4E+0 6.0E+0 2.3E+0
Indoor 24h mean 1.3E+0 1.6E‐1 2.2E‐1 1.9E‐1 1.7E‐1 2.2E‐1 1.8E‐1 3.4E‐1 3.7E‐1
Indoor 24 SD 2.3E+0 3.4E‐2 7.5E‐2 4.5E‐2 3.7E‐2 9.1E‐2 4.6E‐2 3.8E‐1 8.0E‐1
24h mean In/Out 0.23 0.04 0.02 0.02 0.01 0.02 0.01 0.05 0.08
Highest 8h Outdoor 2.2E+1 9.2E+0 1.9E+1 1.5E+1 1.5E+1 2.6E+1 2.1E+1 1.8E+1 5.1E+0
Highest 8h Indoor 6.5E‐1 1.8E‐1 3.0E‐1 2.1E‐1 1.9E‐1 3.4E‐1 2.9E‐1 3.1E‐1 1.5E‐1
Highest 8 h In/Out 0.03 0.02 0.02 0.01 0.01 0.01 0.01 0.02 0.01
Highest 1h Outdoor 3.1E+1 1.2E+1 2.8E+1 2.0E+1 2.2E+1 3.4E+1 2.3E+1 2.4E+1 6.8E+0
Highest 1h Indoor2 6.5E‐1 1.8E‐1 3.0E‐1 2.1E‐1 1.9E‐1 3.4E‐1 2.9E‐1 3.9E‐1 2.8E‐1
Highest 1h In/Out 0.03 0.02 0.01 0.01 0.01 0.01 0.01 0.02 0.01
Time of highest 1h Outdoor
2/27/14 21:20
3/1/14 0:55
3/1/14 22:13
3/2/14 22:00
3/3/14 19:26
3/5/14 2:47
3/5/14 20:38
Corresponding highest 1h Indoor
2/28/14 0:09
3/1/14 1:17
3/1/14 22:42
3/2/14 23:36
3/3/14 21:25
3/5/14 3:23
3/5/14 23:43
1 Based on 24h periods starting / ending at 10am. Day 1 starts at 2/28/2014 18:00, and has < 24h of data. 2Occurring within 4h of highest 1h outdoor concentration.
Appendix FW-2-C: System C, Feb 27 – Mar 6, 2014Singer, Delp et al. (LBNL)
ARB-11-311: Reducing In-Home Exposure to Air Pollution Final Report 15
Table FW-2-C-12. Summary statistics for concentrations of PM2.5 (g m-3) and indoor /outdoor ratios from measurements reported by TSI DustTrak II.
Parameter Day 11 Day 21 Day 3 Day 4 Day 5 Day 6 Day 7 Mean1 SD1
Outdoor 24h mean 1.7E‐3 1.4E‐3 1.5E‐3 1.1E‐3 1.2E‐3 1.3E‐3 1.5E‐3 1.4E‐3 1.9E‐4
Outdoor 24 SD 1.4E‐3 3.3E‐4 5.6E‐4 4.6E‐4 3.8E‐4 4.2E‐4 8.1E‐4 6.3E‐4 3.6E‐4
Indoor 24h mean 6.9E‐3 1.7E‐3 5.2E‐3 7.0E‐3 7.7E‐3 1.3E‐2 1.4E‐2 7.8E‐3 3.8E‐3
Indoor 24 SD 5.4E‐3 1.0E‐3 4.2E‐3 4.2E‐3 5.7E‐3 9.9E‐3 1.0E‐2 5.8E‐3 3.1E‐3
24h mean In/Out 0.49 0.57 0.45 0.26 0.15 0.16 0.08 0.31 0.18
Highest 8h Outdoor 1.3E‐2 3.0E‐3 9.0E‐3 1.0E‐2 1.0E‐2 2.3E‐2 2.4E‐2 1.3E‐2 7.2E‐3
Highest 8h Indoor 1.4E‐3 1.7E‐3 1.7E‐3 1.5E‐3 1.5E‐3 1.8E‐3 1.0E‐3 1.5E‐3 2.3E‐4
Highest 8 h In/Out 0.11 0.56 0.19 0.15 0.14 0.08 0.04 0.18 0.16
Highest 1h Outdoor 1.6E‐2 4.7E‐3 1.6E‐2 1.4E‐2 2.2E‐2 3.3E‐2 3.0E‐2 2.0E‐2 9.0E‐3
Highest 1h Indoor2 1.4E‐3 1.7E‐3 1.7E‐3 1.5E‐3 1.5E‐3 1.8E‐3 1.0E‐3 1.6E‐3 4.6E‐4
Highest 1h In/Out 0.12 0.21 0.09 0.07 0.10 0.06 0.04 0.10 0.05
Time of highest 1h Outdoor
2/27/14 21:22
3/1/14 9:00
3/1/14 22:10
3/2/14 22:06
3/3/14 19:26
3/5/14 3:42
3/5/14 22:36
Corresponding highest 1h Indoor
2/27/14 23:52
3/1/14 9:00
3/2/14 2:10
3/2/14 22:06
3/3/14 21:17
3/5/14 4:33
3/6/14 2:36
1 Based on 24h periods starting / ending at 10am. Day 1 starts at 2/28/2014 18:00, and has < 24h of data. 2Occurring within 4h of highest 1h outdoor concentration. Table FW-2-C-13. Daily1 summary statistics for concentrations (nanograms m-3) and indoor /outdoor ratios of aerosol black carbon measured using the Aethalometer AE22.
Parameter Day 11 Day 21 Day 3 Day 4 Day 5 Day 6 Day 7 Mean1 SD1
Outdoor 24h mean 3.3E+2 2.8E+2 2.3E+2 4.8E+2 4.2E+2 7.4E+2 4.9E+2 4.2E+2 1.6E+2
Outdoor 24 SD 2.1E+2 2.3E+2 1.8E+2 3.2E+2 2.9E+2 5.1E+2 2.9E+2 2.9E+2 1.0E+2
Indoor 24h mean 5.6E+1 5.6E+1 8.0E+1 4.6E+1 4.6E+1 4.7E+1 4.6E+1 5.4E+1 1.2E+1
Indoor 24 SD 5.0E+1 6.9E+1 1.4E+2 1.9E+1 2.2E+1 3.3E+1 2.5E+1 5.1E+1 3.9E+1
24h mean In/Out 0.25 0.15 0.37 0.19 0.09 0.11 0.07 0.17 0.10
Highest 8h Outdoor 5.0E+2 4.6E+2 3.8E+2 7.0E+2 7.0E+2 1.3E+3 8.0E+2 6.9E+2 2.7E+2
Highest 8h Indoor 5.1E+1 4.5E+1 7.6E+1 4.5E+1 4.5E+1 4.9E+1 4.8E+1 5.1E+1 1.0E+1
Highest 8 h In/Out 0.10 0.10 0.20 0.06 0.06 0.04 0.06 0.09 0.05
Highest 1h Outdoor 7.6E+2 7.1E+2 6.6E+2 8.7E+2 7.8E+2 1.8E+3 8.1E+2 9.1E+2 3.5E+2
Highest 1h Indoor2 5.1E+1 4.5E+1 7.6E+1 4.5E+1 4.5E+1 4.9E+1 4.8E+1 5.7E+1 1.4E+1
Highest 1h In/Out 0.10 0.06 0.11 0.05 0.06 0.04 0.06 0.07 0.02
Time of highest 1h Outdoor
2/27/14 21:08
2/28/14 16:50
3/1/14 22:17
3/3/14 9:21
3/3/14 21:01
3/5/14 2:52
3/5/14 22:39
Corresponding highest 1h Indoor
2/27/14 21:35
2/28/14 16:50
3/1/14 22:17
3/3/14 9:21
3/3/14 21:01
3/5/14 3:19
3/5/14 22:39
1 Based on 24h periods starting / ending at 10am. Day 1 starts at 2/28/2014 18:00, and has < 24h of data. 2Occurring within 4h of highest 1h outdoor concentration.
Appendix FW-3-E: System E, Oct 29 – Nov 4, 2014Singer, Delp et al. (LBNL)
ARB-11-311: Reducing In-Home Exposure to Air Pollution Final Report 1
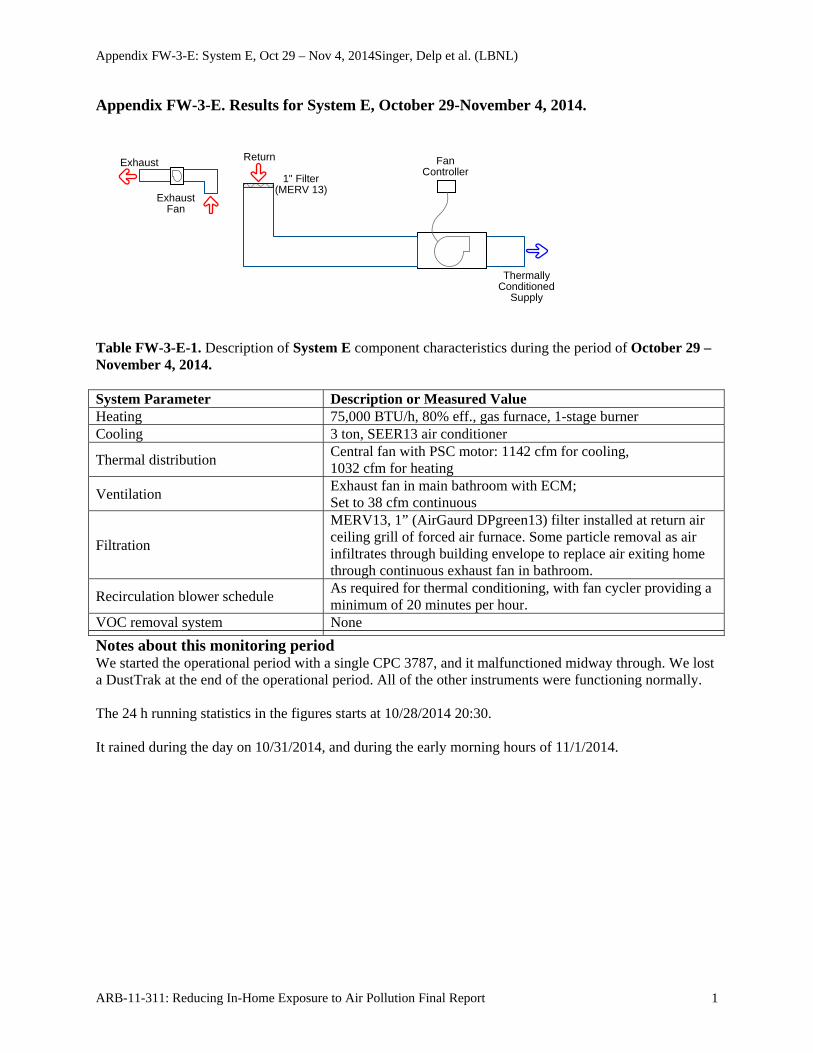
Appendix FW-3-E. Results for System E, October 29-November 4, 2014.
Table FW-3-E-1. Description of System E component characteristics during the period of October 29 – November 4, 2014. System Parameter Description or Measured Value Heating 75,000 BTU/h, 80% eff., gas furnace, 1-stage burner Cooling 3 ton, SEER13 air conditioner
Thermal distribution Central fan with PSC motor: 1142 cfm for cooling, 1032 cfm for heating
Ventilation Exhaust fan in main bathroom with ECM; Set to 38 cfm continuous
Filtration
MERV13, 1” (AirGaurd DPgreen13) filter installed at return air ceiling grill of forced air furnace. Some particle removal as air infiltrates through building envelope to replace air exiting home through continuous exhaust fan in bathroom.
Recirculation blower schedule As required for thermal conditioning, with fan cycler providing a minimum of 20 minutes per hour.
VOC removal system None
Notes about this monitoring period We started the operational period with a single CPC 3787, and it malfunctioned midway through. We lost a DustTrak at the end of the operational period. All of the other instruments were functioning normally. The 24 h running statistics in the figures starts at 10/28/2014 20:30. It rained during the day on 10/31/2014, and during the early morning hours of 11/1/2014.
Exhaust
ThermallyConditioned
Supply
FanController
ExhaustFan
1" Filter(MERV 13)
Return
Appendix FW-3-E: System E, Oct 29 – Nov 4, 2014Singer, Delp et al. (LBNL)
ARB-11-311: Reducing In-Home Exposure to Air Pollution Final Report 2
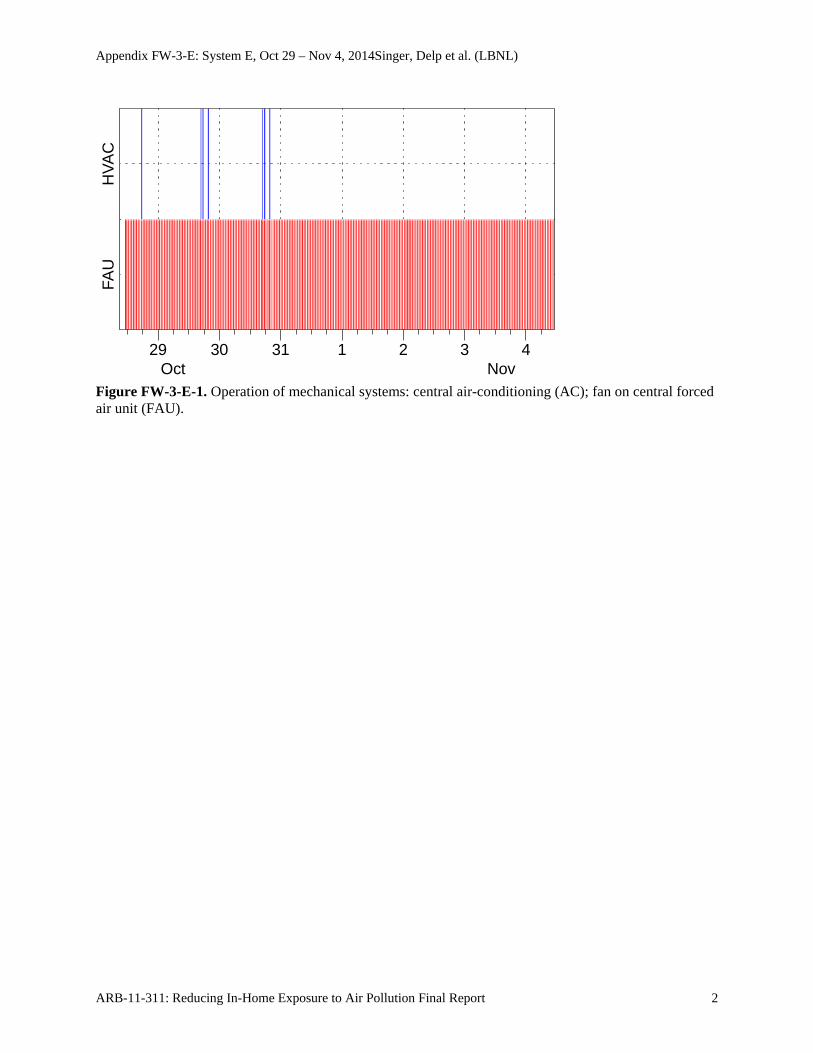
Figure FW-3-E-1. Operation of mechanical systems: central air-conditioning (AC); fan on central forced air unit (FAU).
FAU
HV
AC
29 30 31 1 2 3 4Oct Nov
Appendix FW-3-E: System E, Oct 29 – Nov 4, 2014Singer, Delp et al. (LBNL)
ARB-11-311: Reducing In-Home Exposure to Air Pollution Final Report 3
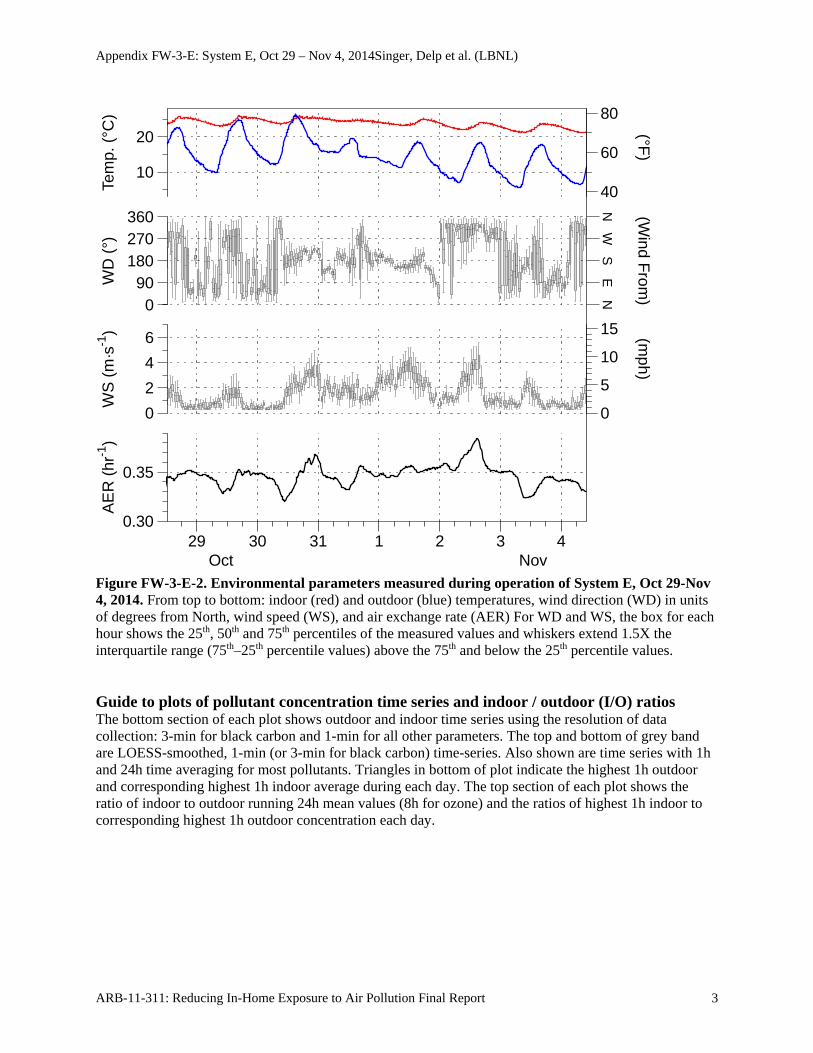
Figure FW-3-E-2. Environmental parameters measured during operation of System E, Oct 29-Nov 4, 2014. From top to bottom: indoor (red) and outdoor (blue) temperatures, wind direction (WD) in units of degrees from North, wind speed (WS), and air exchange rate (AER) For WD and WS, the box for each hour shows the 25th, 50th and 75th percentiles of the measured values and whiskers extend 1.5X the interquartile range (75th–25th percentile values) above the 75th and below the 25th percentile values. Guide to plots of pollutant concentration time series and indoor / outdoor (I/O) ratios The bottom section of each plot shows outdoor and indoor time series using the resolution of data collection: 3-min for black carbon and 1-min for all other parameters. The top and bottom of grey band are LOESS-smoothed, 1-min (or 3-min for black carbon) time-series. Also shown are time series with 1h and 24h time averaging for most pollutants. Triangles in bottom of plot indicate the highest 1h outdoor and corresponding highest 1h indoor average during each day. The top section of each plot shows the ratio of indoor to outdoor running 24h mean values (8h for ozone) and the ratios of highest 1h indoor to corresponding highest 1h outdoor concentration each day.
0
5
10
15
40
60
80
NE
SW
N
(mph)
(Wind F
rom)
(°F)
AE
R (
hr-1
)
0.30
0.35
WS
(m
·s-1
)
0
2
4
6
WD
(°)
090
180270360
Tem
p. (
°C)
10
20
29 30 31 1 2 3 4Oct Nov
Appendix FW-3-E: System E, Oct 29 – Nov 4, 2014Singer, Delp et al. (LBNL)
ARB-11-311: Reducing In-Home Exposure to Air Pollution Final Report 4
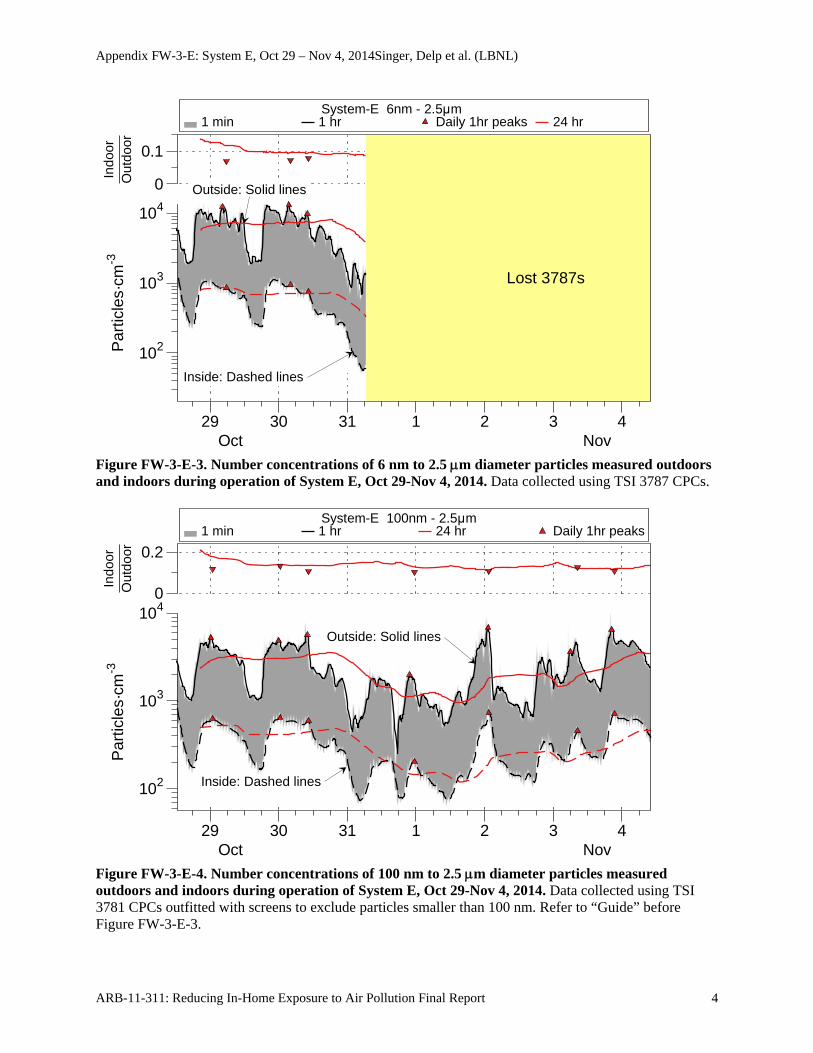
Figure FW-3-E-3. Number concentrations of 6 nm to 2.5 m diameter particles measured outdoors and indoors during operation of System E, Oct 29-Nov 4, 2014. Data collected using TSI 3787 CPCs.
Figure FW-3-E-4. Number concentrations of 100 nm to 2.5 m diameter particles measured outdoors and indoors during operation of System E, Oct 29-Nov 4, 2014. Data collected using TSI 3781 CPCs outfitted with screens to exclude particles smaller than 100 nm. Refer to “Guide” before Figure FW-3-E-3.
1 min 1 hr Daily 1hr peaks 24 hr System-E 6nm - 2.5μm
Outside: Solid lines
Inside: Dashed lines
Lost 3787s
Par
ticle
s·cm
-3
102
103
104
Indo
orO
utdo
or
0
0.1
29 30 31 1 2 3 4Oct Nov
1 min 1 hr 24 hr Daily 1hr peaks System-E 100nm - 2.5μm
Outside: Solid lines
Inside: Dashed lines
Par
ticle
s·cm
-3
102
103
104
Indo
orO
utdo
or
0
0.2
29 30 31 1 2 3 4Oct Nov
Appendix FW-3-E: System E, Oct 29 – Nov 4, 2014Singer, Delp et al. (LBNL)
ARB-11-311: Reducing In-Home Exposure to Air Pollution Final Report 5
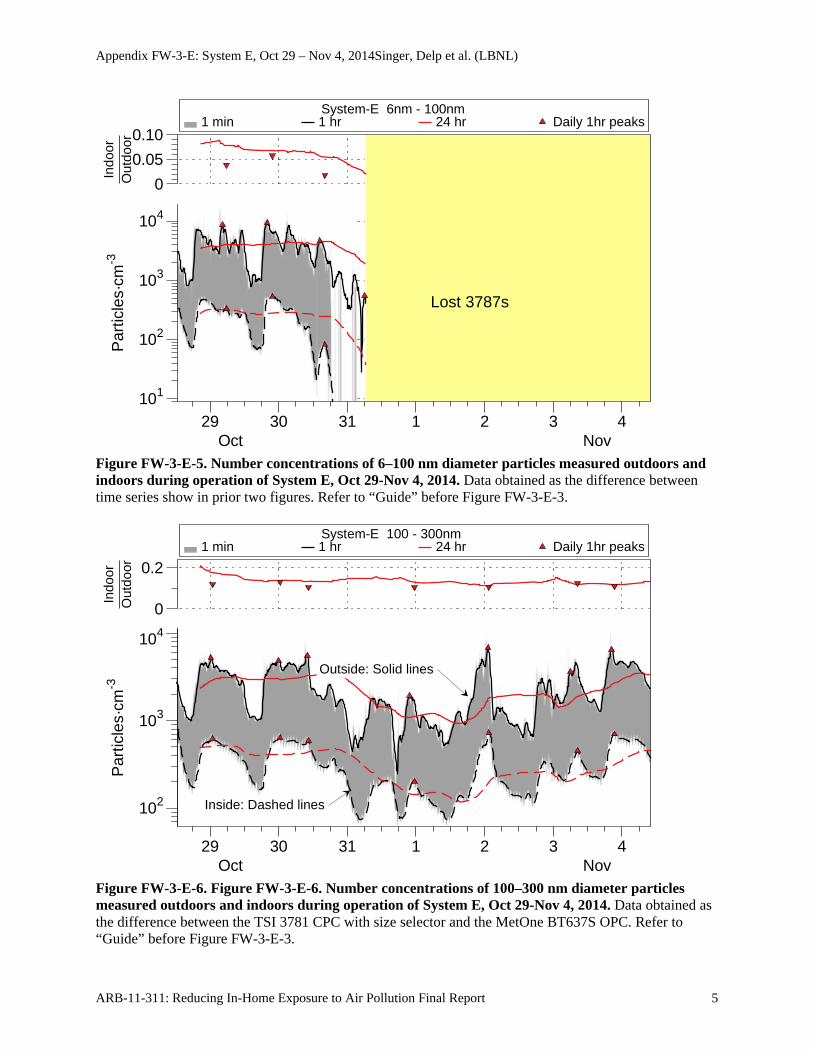
Figure FW-3-E-5. Number concentrations of 6–100 nm diameter particles measured outdoors and indoors during operation of System E, Oct 29-Nov 4, 2014. Data obtained as the difference between time series show in prior two figures. Refer to “Guide” before Figure FW-3-E-3.
Figure FW-3-E-6. Figure FW-3-E-6. Number concentrations of 100–300 nm diameter particles measured outdoors and indoors during operation of System E, Oct 29-Nov 4, 2014. Data obtained as the difference between the TSI 3781 CPC with size selector and the MetOne BT637S OPC. Refer to “Guide” before Figure FW-3-E-3.
1 min 1 hr 24 hr Daily 1hr peaks System-E 6nm - 100nm
Lost 3787s
Par
ticle
s·cm
-3
101
102
103
104
Indo
orO
utdo
or
0
0.05
0.10
29 30 31 1 2 3 4Oct Nov
1 min 1 hr 24 hr Daily 1hr peaks System-E 100 - 300nm
Outside: Solid lines
Inside: Dashed lines102
103
104
Par
ticle
s·cm
-3In
door
Out
door
0
0.2
29 30 31 1 2 3 4Oct Nov
Appendix FW-3-E: System E, Oct 29 – Nov 4, 2014Singer, Delp et al. (LBNL)
ARB-11-311: Reducing In-Home Exposure to Air Pollution Final Report 6
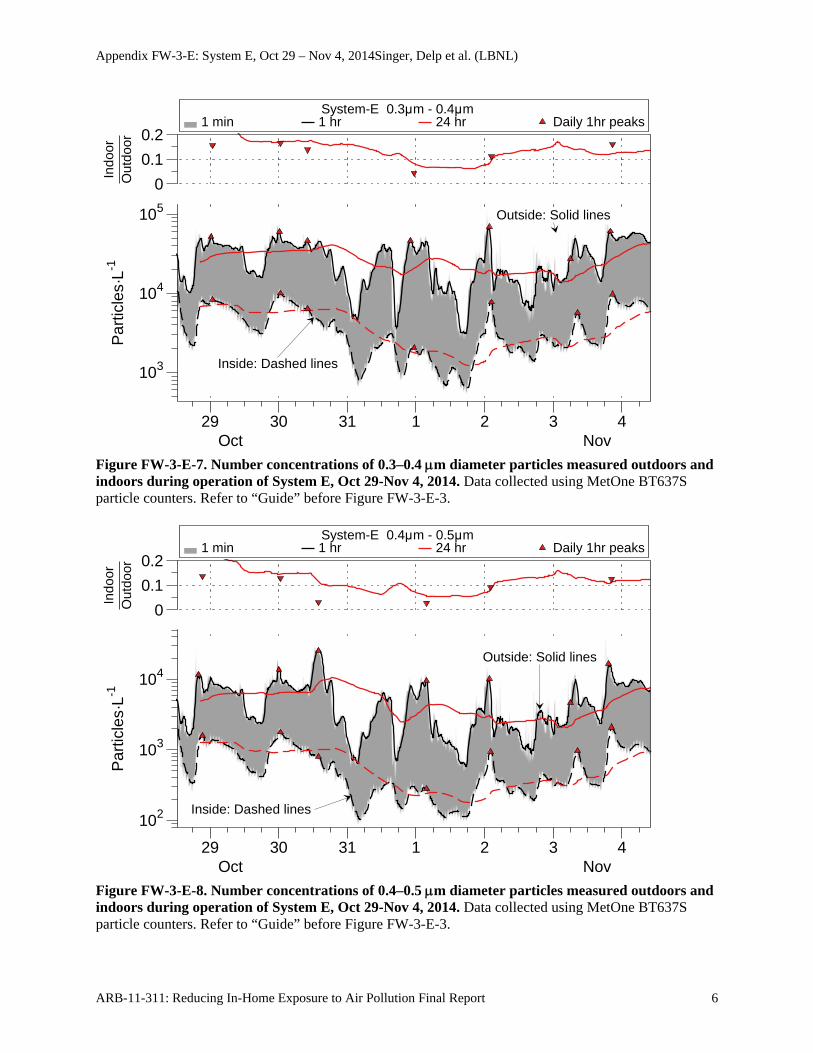
Figure FW-3-E-7. Number concentrations of 0.3–0.4 m diameter particles measured outdoors and indoors during operation of System E, Oct 29-Nov 4, 2014. Data collected using MetOne BT637S particle counters. Refer to “Guide” before Figure FW-3-E-3.
Figure FW-3-E-8. Number concentrations of 0.4–0.5 m diameter particles measured outdoors and indoors during operation of System E, Oct 29-Nov 4, 2014. Data collected using MetOne BT637S particle counters. Refer to “Guide” before Figure FW-3-E-3.
1 min 1 hr 24 hr Daily 1hr peaks System-E 0.3μm - 0.4μm
Outside: Solid lines
Inside: Dashed lines
Par
ticle
s·L-1
103
104
105
Indo
orO
utdo
or
0
0.1
0.2
29 30 31 1 2 3 4Oct Nov
1 min 1 hr 24 hr Daily 1hr peaks System-E 0.4μm - 0.5μm
Outside: Solid lines
Inside: Dashed lines
Par
ticle
s·L-1
102
103
104
Indo
orO
utdo
or
0
0.1
0.2
29 30 31 1 2 3 4Oct Nov
Appendix FW-3-E: System E, Oct 29 – Nov 4, 2014Singer, Delp et al. (LBNL)
ARB-11-311: Reducing In-Home Exposure to Air Pollution Final Report 7
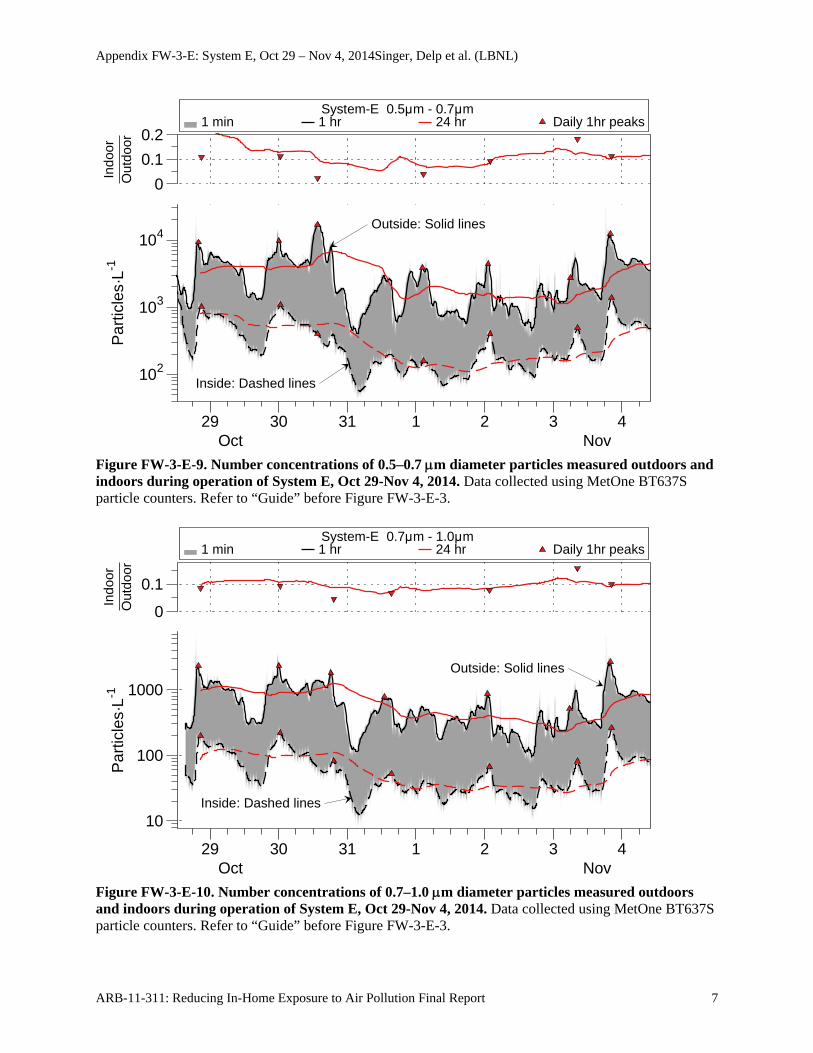
Figure FW-3-E-9. Number concentrations of 0.5–0.7 m diameter particles measured outdoors and indoors during operation of System E, Oct 29-Nov 4, 2014. Data collected using MetOne BT637S particle counters. Refer to “Guide” before Figure FW-3-E-3.
Figure FW-3-E-10. Number concentrations of 0.7–1.0 m diameter particles measured outdoors and indoors during operation of System E, Oct 29-Nov 4, 2014. Data collected using MetOne BT637S particle counters. Refer to “Guide” before Figure FW-3-E-3.
1 min 1 hr 24 hr Daily 1hr peaks System-E 0.5μm - 0.7μm
Outside: Solid lines
Inside: Dashed lines
Par
ticle
s·L-1
102
103
104
Indo
orO
utdo
or
0
0.1
0.2
29 30 31 1 2 3 4Oct Nov
1 min 1 hr 24 hr Daily 1hr peaks System-E 0.7μm - 1.0μm
Outside: Solid lines
Inside: Dashed lines
Par
ticle
s·L-1
10
100
1000
Indo
orO
utdo
or
0
0.1
29 30 31 1 2 3 4Oct Nov
Appendix FW-3-E: System E, Oct 29 – Nov 4, 2014Singer, Delp et al. (LBNL)
ARB-11-311: Reducing In-Home Exposure to Air Pollution Final Report 8
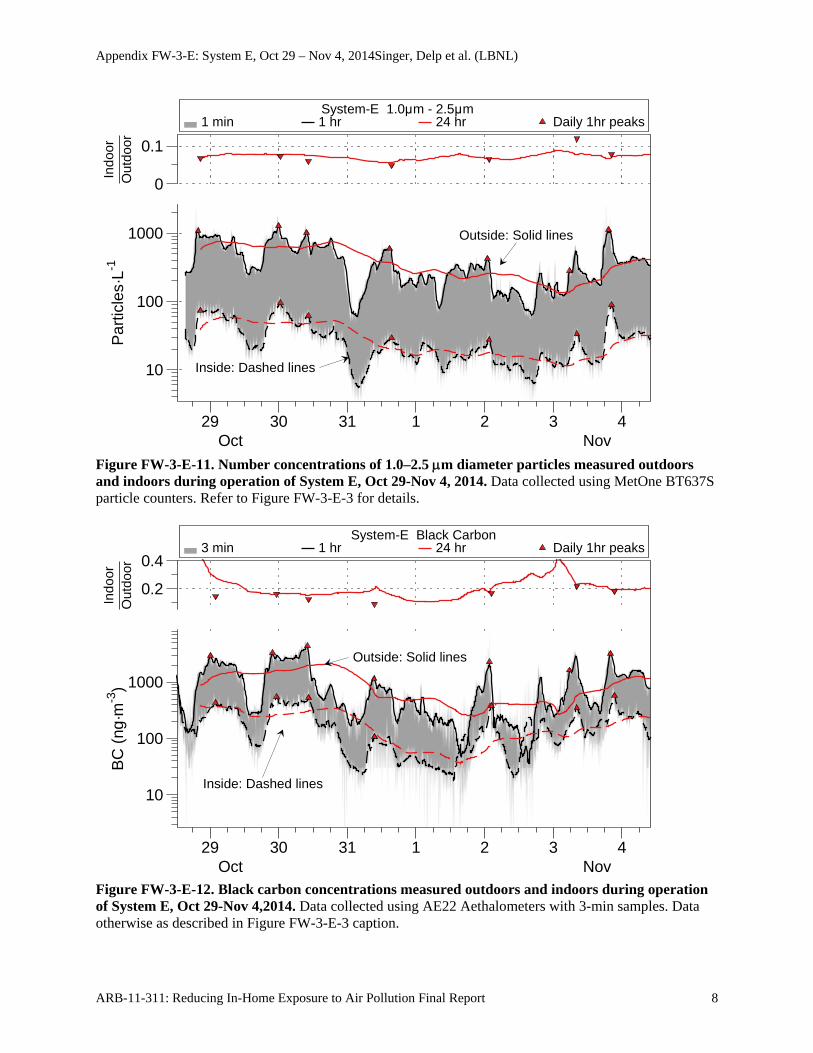
Figure FW-3-E-11. Number concentrations of 1.0–2.5 m diameter particles measured outdoors and indoors during operation of System E, Oct 29-Nov 4, 2014. Data collected using MetOne BT637S particle counters. Refer to Figure FW-3-E-3 for details.
Figure FW-3-E-12. Black carbon concentrations measured outdoors and indoors during operation of System E, Oct 29-Nov 4,2014. Data collected using AE22 Aethalometers with 3-min samples. Data otherwise as described in Figure FW-3-E-3 caption.
1 min 1 hr 24 hr Daily 1hr peaks System-E 1.0μm - 2.5μm
Outside: Solid lines
Inside: Dashed lines
Par
ticle
s·L-1
10
100
1000
Indo
orO
utdo
or
0
0.1
29 30 31 1 2 3 4Oct Nov
3 min 1 hr 24 hr Daily 1hr peaks System-E Black Carbon
Outside: Solid lines
Inside: Dashed lines
BC
(ng
·m-3
)
10
100
1000
Indo
orO
utdo
or
0.2
0.4
29 30 31 1 2 3 4Oct Nov
Appendix FW-3-E: System E, Oct 29 – Nov 4, 2014Singer, Delp et al. (LBNL)
ARB-11-311: Reducing In-Home Exposure to Air Pollution Final Report 9
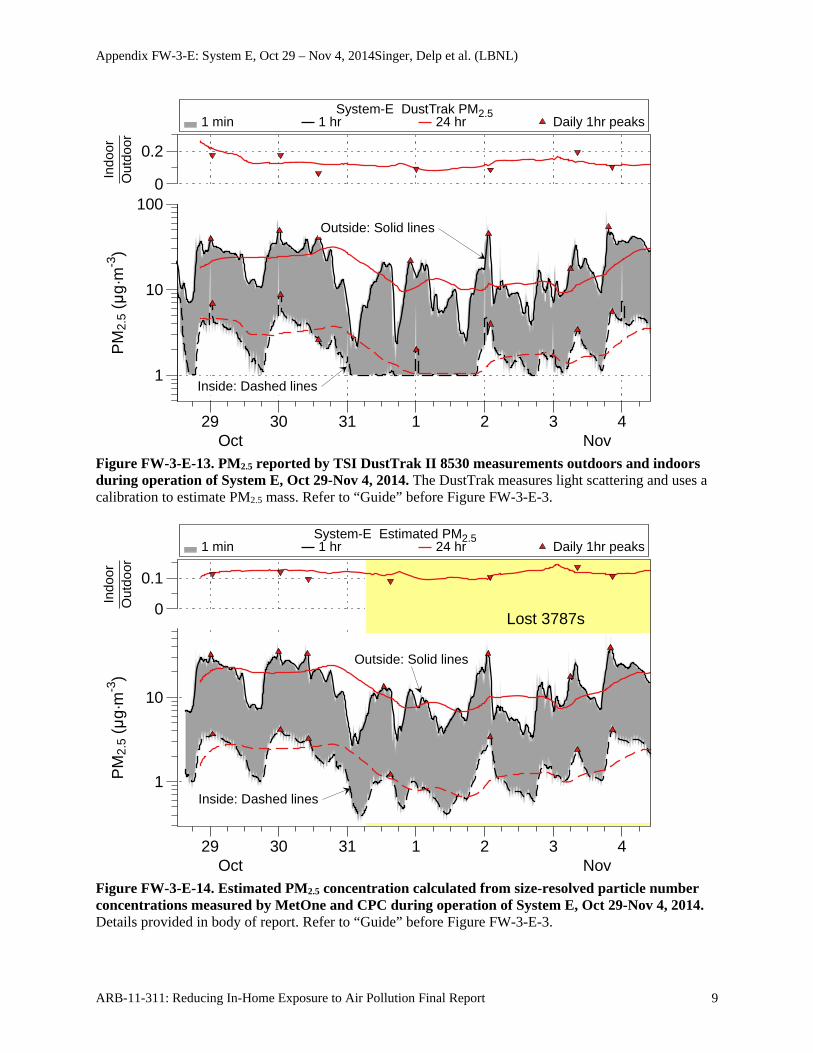
Figure FW-3-E-13. PM2.5 reported by TSI DustTrak II 8530 measurements outdoors and indoors during operation of System E, Oct 29-Nov 4, 2014. The DustTrak measures light scattering and uses a calibration to estimate PM2.5 mass. Refer to “Guide” before Figure FW-3-E-3.
Figure FW-3-E-14. Estimated PM2.5 concentration calculated from size-resolved particle number concentrations measured by MetOne and CPC during operation of System E, Oct 29-Nov 4, 2014. Details provided in body of report. Refer to “Guide” before Figure FW-3-E-3.
1 min 1 hr 24 hr Daily 1hr peaks System-E DustTrak PM2.5
1
10
100Outside: Solid lines
Inside: Dashed lines
PM
2.5
(μg·
m-3
)In
door
Out
door
0
0.2
29 30 31 1 2 3 4Oct Nov
1 min 1 hr 24 hr Daily 1hr peaks System-E Estimated PM2.5
Outside: Solid lines
Inside: Dashed lines
Lost 3787s
PM
2.5
(μg·
m-3
)
1
10
Indo
orO
utdo
or
0
0.1
29 30 31 1 2 3 4Oct Nov
Appendix FW-3-E: System E, Oct 29 – Nov 4, 2014Singer, Delp et al. (LBNL)
ARB-11-311: Reducing In-Home Exposure to Air Pollution Final Report 10
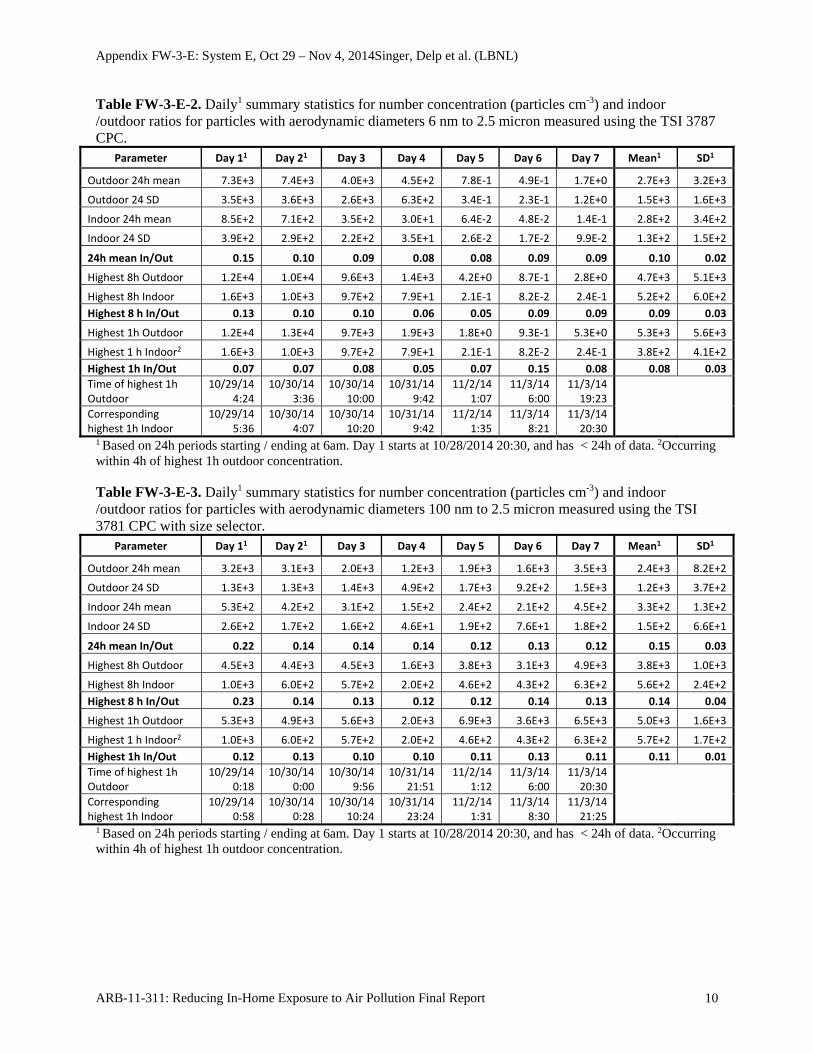
Table FW-3-E-2. Daily1 summary statistics for number concentration (particles cm-3) and indoor /outdoor ratios for particles with aerodynamic diameters 6 nm to 2.5 micron measured using the TSI 3787 CPC.
Parameter Day 11 Day 21 Day 3 Day 4 Day 5 Day 6 Day 7 Mean1 SD1
Outdoor 24h mean 7.3E+3 7.4E+3 4.0E+3 4.5E+2 7.8E‐1 4.9E‐1 1.7E+0 2.7E+3 3.2E+3
Outdoor 24 SD 3.5E+3 3.6E+3 2.6E+3 6.3E+2 3.4E‐1 2.3E‐1 1.2E+0 1.5E+3 1.6E+3
Indoor 24h mean 8.5E+2 7.1E+2 3.5E+2 3.0E+1 6.4E‐2 4.8E‐2 1.4E‐1 2.8E+2 3.4E+2
Indoor 24 SD 3.9E+2 2.9E+2 2.2E+2 3.5E+1 2.6E‐2 1.7E‐2 9.9E‐2 1.3E+2 1.5E+2
24h mean In/Out 0.15 0.10 0.09 0.08 0.08 0.09 0.09 0.10 0.02
Highest 8h Outdoor 1.2E+4 1.0E+4 9.6E+3 1.4E+3 4.2E+0 8.7E‐1 2.8E+0 4.7E+3 5.1E+3
Highest 8h Indoor 1.6E+3 1.0E+3 9.7E+2 7.9E+1 2.1E‐1 8.2E‐2 2.4E‐1 5.2E+2 6.0E+2
Highest 8 h In/Out 0.13 0.10 0.10 0.06 0.05 0.09 0.09 0.09 0.03
Highest 1h Outdoor 1.2E+4 1.3E+4 9.7E+3 1.9E+3 1.8E+0 9.3E‐1 5.3E+0 5.3E+3 5.6E+3
Highest 1 h Indoor2 1.6E+3 1.0E+3 9.7E+2 7.9E+1 2.1E‐1 8.2E‐2 2.4E‐1 3.8E+2 4.1E+2
Highest 1h In/Out 0.07 0.07 0.08 0.05 0.07 0.15 0.08 0.08 0.03
Time of highest 1h Outdoor
10/29/14 4:24
10/30/14 3:36
10/30/14 10:00
10/31/14 9:42
11/2/14 1:07
11/3/14 6:00
11/3/14 19:23
Corresponding highest 1h Indoor
10/29/14 5:36
10/30/14 4:07
10/30/14 10:20
10/31/14 9:42
11/2/14 1:35
11/3/14 8:21
11/3/14 20:30
1 Based on 24h periods starting / ending at 6am. Day 1 starts at 10/28/2014 20:30, and has < 24h of data. 2Occurring within 4h of highest 1h outdoor concentration. Table FW-3-E-3. Daily1 summary statistics for number concentration (particles cm-3) and indoor /outdoor ratios for particles with aerodynamic diameters 100 nm to 2.5 micron measured using the TSI 3781 CPC with size selector.
Parameter Day 11 Day 21 Day 3 Day 4 Day 5 Day 6 Day 7 Mean1 SD1
Outdoor 24h mean 3.2E+3 3.1E+3 2.0E+3 1.2E+3 1.9E+3 1.6E+3 3.5E+3 2.4E+3 8.2E+2
Outdoor 24 SD 1.3E+3 1.3E+3 1.4E+3 4.9E+2 1.7E+3 9.2E+2 1.5E+3 1.2E+3 3.7E+2
Indoor 24h mean 5.3E+2 4.2E+2 3.1E+2 1.5E+2 2.4E+2 2.1E+2 4.5E+2 3.3E+2 1.3E+2
Indoor 24 SD 2.6E+2 1.7E+2 1.6E+2 4.6E+1 1.9E+2 7.6E+1 1.8E+2 1.5E+2 6.6E+1
24h mean In/Out 0.22 0.14 0.14 0.14 0.12 0.13 0.12 0.15 0.03
Highest 8h Outdoor 4.5E+3 4.4E+3 4.5E+3 1.6E+3 3.8E+3 3.1E+3 4.9E+3 3.8E+3 1.0E+3
Highest 8h Indoor 1.0E+3 6.0E+2 5.7E+2 2.0E+2 4.6E+2 4.3E+2 6.3E+2 5.6E+2 2.4E+2
Highest 8 h In/Out 0.23 0.14 0.13 0.12 0.12 0.14 0.13 0.14 0.04
Highest 1h Outdoor 5.3E+3 4.9E+3 5.6E+3 2.0E+3 6.9E+3 3.6E+3 6.5E+3 5.0E+3 1.6E+3
Highest 1 h Indoor2 1.0E+3 6.0E+2 5.7E+2 2.0E+2 4.6E+2 4.3E+2 6.3E+2 5.7E+2 1.7E+2
Highest 1h In/Out 0.12 0.13 0.10 0.10 0.11 0.13 0.11 0.11 0.01
Time of highest 1h Outdoor
10/29/14 0:18
10/30/14 0:00
10/30/14 9:56
10/31/14 21:51
11/2/14 1:12
11/3/14 6:00
11/3/14 20:30
Corresponding highest 1h Indoor
10/29/14 0:58
10/30/14 0:28
10/30/14 10:24
10/31/14 23:24
11/2/14 1:31
11/3/14 8:30
11/3/14 21:25
1 Based on 24h periods starting / ending at 6am. Day 1 starts at 10/28/2014 20:30, and has < 24h of data. 2Occurring within 4h of highest 1h outdoor concentration.
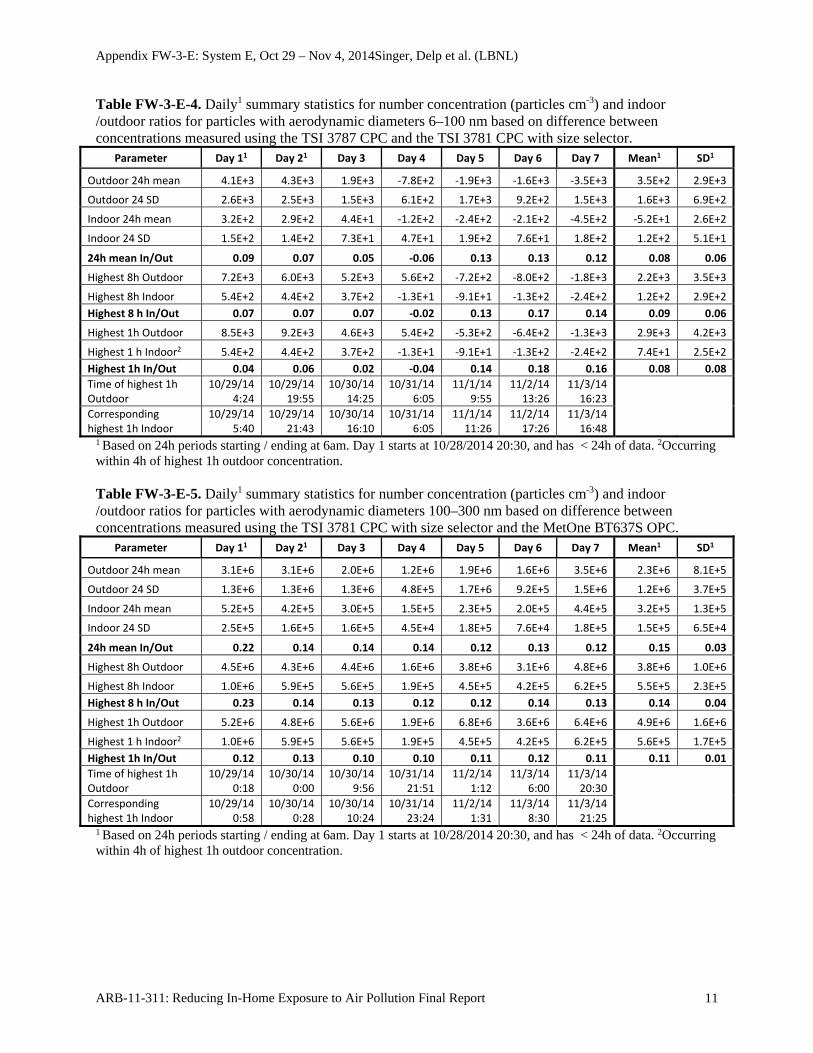
Appendix FW-3-E: System E, Oct 29 – Nov 4, 2014Singer, Delp et al. (LBNL)
ARB-11-311: Reducing In-Home Exposure to Air Pollution Final Report 11
Table FW-3-E-4. Daily1 summary statistics for number concentration (particles cm-3) and indoor /outdoor ratios for particles with aerodynamic diameters 6–100 nm based on difference between concentrations measured using the TSI 3787 CPC and the TSI 3781 CPC with size selector.
Parameter Day 11 Day 21 Day 3 Day 4 Day 5 Day 6 Day 7 Mean1 SD1
Outdoor 24h mean 4.1E+3 4.3E+3 1.9E+3 ‐7.8E+2 ‐1.9E+3 ‐1.6E+3 ‐3.5E+3 3.5E+2 2.9E+3
Outdoor 24 SD 2.6E+3 2.5E+3 1.5E+3 6.1E+2 1.7E+3 9.2E+2 1.5E+3 1.6E+3 6.9E+2
Indoor 24h mean 3.2E+2 2.9E+2 4.4E+1 ‐1.2E+2 ‐2.4E+2 ‐2.1E+2 ‐4.5E+2 ‐5.2E+1 2.6E+2
Indoor 24 SD 1.5E+2 1.4E+2 7.3E+1 4.7E+1 1.9E+2 7.6E+1 1.8E+2 1.2E+2 5.1E+1
24h mean In/Out 0.09 0.07 0.05 ‐0.06 0.13 0.13 0.12 0.08 0.06
Highest 8h Outdoor 7.2E+3 6.0E+3 5.2E+3 5.6E+2 ‐7.2E+2 ‐8.0E+2 ‐1.8E+3 2.2E+3 3.5E+3
Highest 8h Indoor 5.4E+2 4.4E+2 3.7E+2 ‐1.3E+1 ‐9.1E+1 ‐1.3E+2 ‐2.4E+2 1.2E+2 2.9E+2
Highest 8 h In/Out 0.07 0.07 0.07 ‐0.02 0.13 0.17 0.14 0.09 0.06
Highest 1h Outdoor 8.5E+3 9.2E+3 4.6E+3 5.4E+2 ‐5.3E+2 ‐6.4E+2 ‐1.3E+3 2.9E+3 4.2E+3
Highest 1 h Indoor2 5.4E+2 4.4E+2 3.7E+2 ‐1.3E+1 ‐9.1E+1 ‐1.3E+2 ‐2.4E+2 7.4E+1 2.5E+2
Highest 1h In/Out 0.04 0.06 0.02 ‐0.04 0.14 0.18 0.16 0.08 0.08
Time of highest 1h Outdoor
10/29/14 4:24
10/29/14 19:55
10/30/14 14:25
10/31/14 6:05
11/1/14 9:55
11/2/14 13:26
11/3/14 16:23
Corresponding highest 1h Indoor
10/29/14 5:40
10/29/14 21:43
10/30/14 16:10
10/31/14 6:05
11/1/14 11:26
11/2/14 17:26
11/3/14 16:48
1 Based on 24h periods starting / ending at 6am. Day 1 starts at 10/28/2014 20:30, and has < 24h of data. 2Occurring within 4h of highest 1h outdoor concentration. Table FW-3-E-5. Daily1 summary statistics for number concentration (particles cm-3) and indoor /outdoor ratios for particles with aerodynamic diameters 100–300 nm based on difference between concentrations measured using the TSI 3781 CPC with size selector and the MetOne BT637S OPC.
Parameter Day 11 Day 21 Day 3 Day 4 Day 5 Day 6 Day 7 Mean1 SD1
Outdoor 24h mean 3.1E+6 3.1E+6 2.0E+6 1.2E+6 1.9E+6 1.6E+6 3.5E+6 2.3E+6 8.1E+5
Outdoor 24 SD 1.3E+6 1.3E+6 1.3E+6 4.8E+5 1.7E+6 9.2E+5 1.5E+6 1.2E+6 3.7E+5
Indoor 24h mean 5.2E+5 4.2E+5 3.0E+5 1.5E+5 2.3E+5 2.0E+5 4.4E+5 3.2E+5 1.3E+5
Indoor 24 SD 2.5E+5 1.6E+5 1.6E+5 4.5E+4 1.8E+5 7.6E+4 1.8E+5 1.5E+5 6.5E+4
24h mean In/Out 0.22 0.14 0.14 0.14 0.12 0.13 0.12 0.15 0.03
Highest 8h Outdoor 4.5E+6 4.3E+6 4.4E+6 1.6E+6 3.8E+6 3.1E+6 4.8E+6 3.8E+6 1.0E+6
Highest 8h Indoor 1.0E+6 5.9E+5 5.6E+5 1.9E+5 4.5E+5 4.2E+5 6.2E+5 5.5E+5 2.3E+5
Highest 8 h In/Out 0.23 0.14 0.13 0.12 0.12 0.14 0.13 0.14 0.04
Highest 1h Outdoor 5.2E+6 4.8E+6 5.6E+6 1.9E+6 6.8E+6 3.6E+6 6.4E+6 4.9E+6 1.6E+6
Highest 1 h Indoor2 1.0E+6 5.9E+5 5.6E+5 1.9E+5 4.5E+5 4.2E+5 6.2E+5 5.6E+5 1.7E+5
Highest 1h In/Out 0.12 0.13 0.10 0.10 0.11 0.12 0.11 0.11 0.01
Time of highest 1h Outdoor
10/29/14 0:18
10/30/14 0:00
10/30/14 9:56
10/31/14 21:51
11/2/14 1:12
11/3/14 6:00
11/3/14 20:30
Corresponding highest 1h Indoor
10/29/14 0:58
10/30/14 0:28
10/30/14 10:24
10/31/14 23:24
11/2/14 1:31
11/3/14 8:30
11/3/14 21:25
1 Based on 24h periods starting / ending at 6am. Day 1 starts at 10/28/2014 20:30, and has < 24h of data. 2Occurring within 4h of highest 1h outdoor concentration.
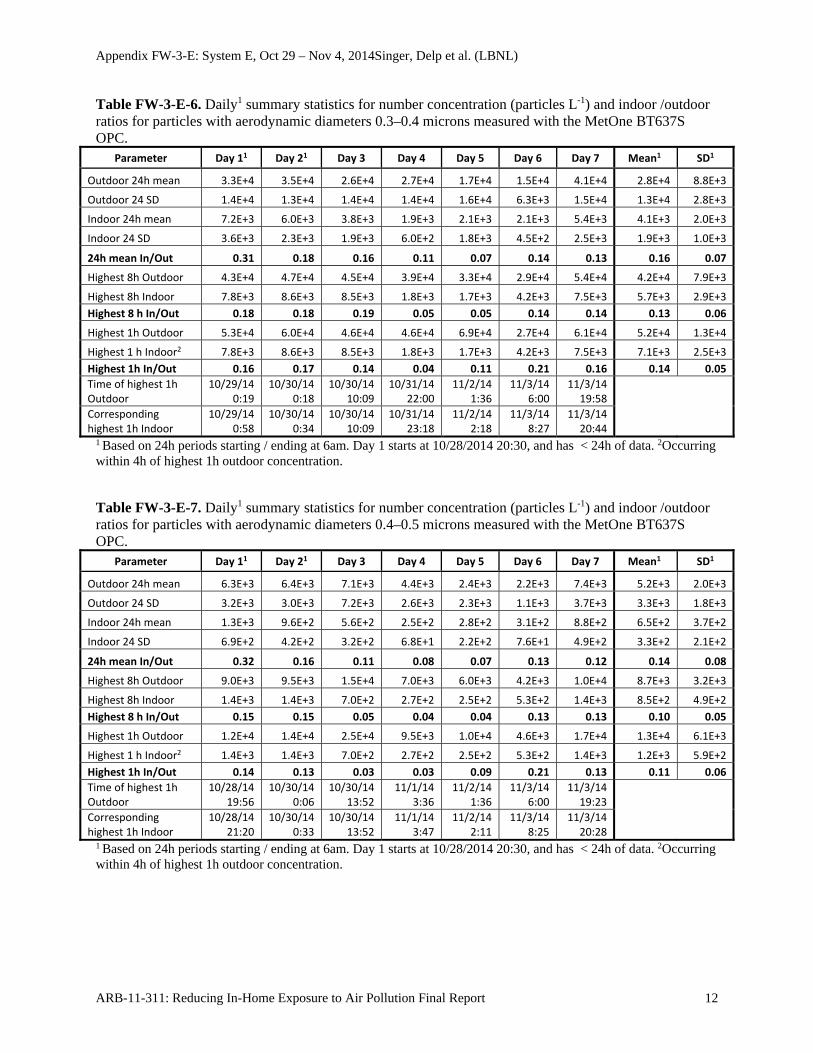
Appendix FW-3-E: System E, Oct 29 – Nov 4, 2014Singer, Delp et al. (LBNL)
ARB-11-311: Reducing In-Home Exposure to Air Pollution Final Report 12
Table FW-3-E-6. Daily1 summary statistics for number concentration (particles L-1) and indoor /outdoor ratios for particles with aerodynamic diameters 0.3–0.4 microns measured with the MetOne BT637S OPC.
Parameter Day 11 Day 21 Day 3 Day 4 Day 5 Day 6 Day 7 Mean1 SD1
Outdoor 24h mean 3.3E+4 3.5E+4 2.6E+4 2.7E+4 1.7E+4 1.5E+4 4.1E+4 2.8E+4 8.8E+3
Outdoor 24 SD 1.4E+4 1.3E+4 1.4E+4 1.4E+4 1.6E+4 6.3E+3 1.5E+4 1.3E+4 2.8E+3
Indoor 24h mean 7.2E+3 6.0E+3 3.8E+3 1.9E+3 2.1E+3 2.1E+3 5.4E+3 4.1E+3 2.0E+3
Indoor 24 SD 3.6E+3 2.3E+3 1.9E+3 6.0E+2 1.8E+3 4.5E+2 2.5E+3 1.9E+3 1.0E+3
24h mean In/Out 0.31 0.18 0.16 0.11 0.07 0.14 0.13 0.16 0.07
Highest 8h Outdoor 4.3E+4 4.7E+4 4.5E+4 3.9E+4 3.3E+4 2.9E+4 5.4E+4 4.2E+4 7.9E+3
Highest 8h Indoor 7.8E+3 8.6E+3 8.5E+3 1.8E+3 1.7E+3 4.2E+3 7.5E+3 5.7E+3 2.9E+3
Highest 8 h In/Out 0.18 0.18 0.19 0.05 0.05 0.14 0.14 0.13 0.06
Highest 1h Outdoor 5.3E+4 6.0E+4 4.6E+4 4.6E+4 6.9E+4 2.7E+4 6.1E+4 5.2E+4 1.3E+4
Highest 1 h Indoor2 7.8E+3 8.6E+3 8.5E+3 1.8E+3 1.7E+3 4.2E+3 7.5E+3 7.1E+3 2.5E+3
Highest 1h In/Out 0.16 0.17 0.14 0.04 0.11 0.21 0.16 0.14 0.05
Time of highest 1h Outdoor
10/29/14 0:19
10/30/14 0:18
10/30/14 10:09
10/31/14 22:00
11/2/14 1:36
11/3/14 6:00
11/3/14 19:58
Corresponding highest 1h Indoor
10/29/14 0:58
10/30/14 0:34
10/30/14 10:09
10/31/14 23:18
11/2/14 2:18
11/3/14 8:27
11/3/14 20:44
1 Based on 24h periods starting / ending at 6am. Day 1 starts at 10/28/2014 20:30, and has < 24h of data. 2Occurring within 4h of highest 1h outdoor concentration. Table FW-3-E-7. Daily1 summary statistics for number concentration (particles L-1) and indoor /outdoor ratios for particles with aerodynamic diameters 0.4–0.5 microns measured with the MetOne BT637S OPC.
Parameter Day 11 Day 21 Day 3 Day 4 Day 5 Day 6 Day 7 Mean1 SD1
Outdoor 24h mean 6.3E+3 6.4E+3 7.1E+3 4.4E+3 2.4E+3 2.2E+3 7.4E+3 5.2E+3 2.0E+3
Outdoor 24 SD 3.2E+3 3.0E+3 7.2E+3 2.6E+3 2.3E+3 1.1E+3 3.7E+3 3.3E+3 1.8E+3
Indoor 24h mean 1.3E+3 9.6E+2 5.6E+2 2.5E+2 2.8E+2 3.1E+2 8.8E+2 6.5E+2 3.7E+2
Indoor 24 SD 6.9E+2 4.2E+2 3.2E+2 6.8E+1 2.2E+2 7.6E+1 4.9E+2 3.3E+2 2.1E+2
24h mean In/Out 0.32 0.16 0.11 0.08 0.07 0.13 0.12 0.14 0.08
Highest 8h Outdoor 9.0E+3 9.5E+3 1.5E+4 7.0E+3 6.0E+3 4.2E+3 1.0E+4 8.7E+3 3.2E+3
Highest 8h Indoor 1.4E+3 1.4E+3 7.0E+2 2.7E+2 2.5E+2 5.3E+2 1.4E+3 8.5E+2 4.9E+2
Highest 8 h In/Out 0.15 0.15 0.05 0.04 0.04 0.13 0.13 0.10 0.05
Highest 1h Outdoor 1.2E+4 1.4E+4 2.5E+4 9.5E+3 1.0E+4 4.6E+3 1.7E+4 1.3E+4 6.1E+3
Highest 1 h Indoor2 1.4E+3 1.4E+3 7.0E+2 2.7E+2 2.5E+2 5.3E+2 1.4E+3 1.2E+3 5.9E+2
Highest 1h In/Out 0.14 0.13 0.03 0.03 0.09 0.21 0.13 0.11 0.06
Time of highest 1h Outdoor
10/28/14 19:56
10/30/14 0:06
10/30/14 13:52
11/1/14 3:36
11/2/14 1:36
11/3/14 6:00
11/3/14 19:23
Corresponding highest 1h Indoor
10/28/14 21:20
10/30/14 0:33
10/30/14 13:52
11/1/14 3:47
11/2/14 2:11
11/3/14 8:25
11/3/14 20:28
1 Based on 24h periods starting / ending at 6am. Day 1 starts at 10/28/2014 20:30, and has < 24h of data. 2Occurring within 4h of highest 1h outdoor concentration.
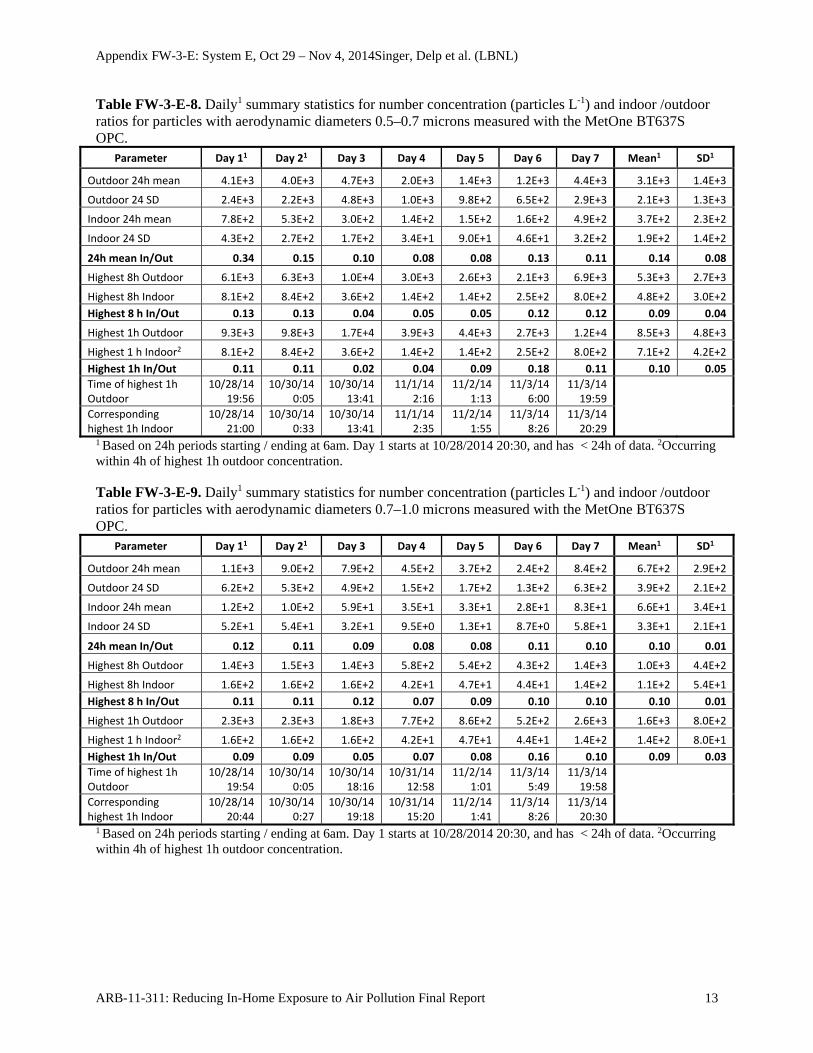
Appendix FW-3-E: System E, Oct 29 – Nov 4, 2014Singer, Delp et al. (LBNL)
ARB-11-311: Reducing In-Home Exposure to Air Pollution Final Report 13
Table FW-3-E-8. Daily1 summary statistics for number concentration (particles L-1) and indoor /outdoor ratios for particles with aerodynamic diameters 0.5–0.7 microns measured with the MetOne BT637S OPC.
Parameter Day 11 Day 21 Day 3 Day 4 Day 5 Day 6 Day 7 Mean1 SD1
Outdoor 24h mean 4.1E+3 4.0E+3 4.7E+3 2.0E+3 1.4E+3 1.2E+3 4.4E+3 3.1E+3 1.4E+3
Outdoor 24 SD 2.4E+3 2.2E+3 4.8E+3 1.0E+3 9.8E+2 6.5E+2 2.9E+3 2.1E+3 1.3E+3
Indoor 24h mean 7.8E+2 5.3E+2 3.0E+2 1.4E+2 1.5E+2 1.6E+2 4.9E+2 3.7E+2 2.3E+2
Indoor 24 SD 4.3E+2 2.7E+2 1.7E+2 3.4E+1 9.0E+1 4.6E+1 3.2E+2 1.9E+2 1.4E+2
24h mean In/Out 0.34 0.15 0.10 0.08 0.08 0.13 0.11 0.14 0.08
Highest 8h Outdoor 6.1E+3 6.3E+3 1.0E+4 3.0E+3 2.6E+3 2.1E+3 6.9E+3 5.3E+3 2.7E+3
Highest 8h Indoor 8.1E+2 8.4E+2 3.6E+2 1.4E+2 1.4E+2 2.5E+2 8.0E+2 4.8E+2 3.0E+2
Highest 8 h In/Out 0.13 0.13 0.04 0.05 0.05 0.12 0.12 0.09 0.04
Highest 1h Outdoor 9.3E+3 9.8E+3 1.7E+4 3.9E+3 4.4E+3 2.7E+3 1.2E+4 8.5E+3 4.8E+3
Highest 1 h Indoor2 8.1E+2 8.4E+2 3.6E+2 1.4E+2 1.4E+2 2.5E+2 8.0E+2 7.1E+2 4.2E+2
Highest 1h In/Out 0.11 0.11 0.02 0.04 0.09 0.18 0.11 0.10 0.05
Time of highest 1h Outdoor
10/28/14 19:56
10/30/14 0:05
10/30/14 13:41
11/1/14 2:16
11/2/14 1:13
11/3/14 6:00
11/3/14 19:59
Corresponding highest 1h Indoor
10/28/14 21:00
10/30/14 0:33
10/30/14 13:41
11/1/14 2:35
11/2/14 1:55
11/3/14 8:26
11/3/14 20:29
1 Based on 24h periods starting / ending at 6am. Day 1 starts at 10/28/2014 20:30, and has < 24h of data. 2Occurring within 4h of highest 1h outdoor concentration. Table FW-3-E-9. Daily1 summary statistics for number concentration (particles L-1) and indoor /outdoor ratios for particles with aerodynamic diameters 0.7–1.0 microns measured with the MetOne BT637S OPC.
Parameter Day 11 Day 21 Day 3 Day 4 Day 5 Day 6 Day 7 Mean1 SD1
Outdoor 24h mean 1.1E+3 9.0E+2 7.9E+2 4.5E+2 3.7E+2 2.4E+2 8.4E+2 6.7E+2 2.9E+2
Outdoor 24 SD 6.2E+2 5.3E+2 4.9E+2 1.5E+2 1.7E+2 1.3E+2 6.3E+2 3.9E+2 2.1E+2
Indoor 24h mean 1.2E+2 1.0E+2 5.9E+1 3.5E+1 3.3E+1 2.8E+1 8.3E+1 6.6E+1 3.4E+1
Indoor 24 SD 5.2E+1 5.4E+1 3.2E+1 9.5E+0 1.3E+1 8.7E+0 5.8E+1 3.3E+1 2.1E+1
24h mean In/Out 0.12 0.11 0.09 0.08 0.08 0.11 0.10 0.10 0.01
Highest 8h Outdoor 1.4E+3 1.5E+3 1.4E+3 5.8E+2 5.4E+2 4.3E+2 1.4E+3 1.0E+3 4.4E+2
Highest 8h Indoor 1.6E+2 1.6E+2 1.6E+2 4.2E+1 4.7E+1 4.4E+1 1.4E+2 1.1E+2 5.4E+1
Highest 8 h In/Out 0.11 0.11 0.12 0.07 0.09 0.10 0.10 0.10 0.01
Highest 1h Outdoor 2.3E+3 2.3E+3 1.8E+3 7.7E+2 8.6E+2 5.2E+2 2.6E+3 1.6E+3 8.0E+2
Highest 1 h Indoor2 1.6E+2 1.6E+2 1.6E+2 4.2E+1 4.7E+1 4.4E+1 1.4E+2 1.4E+2 8.0E+1
Highest 1h In/Out 0.09 0.09 0.05 0.07 0.08 0.16 0.10 0.09 0.03
Time of highest 1h Outdoor
10/28/14 19:54
10/30/14 0:05
10/30/14 18:16
10/31/14 12:58
11/2/14 1:01
11/3/14 5:49
11/3/14 19:58
Corresponding highest 1h Indoor
10/28/14 20:44
10/30/14 0:27
10/30/14 19:18
10/31/14 15:20
11/2/14 1:41
11/3/14 8:26
11/3/14 20:30
1 Based on 24h periods starting / ending at 6am. Day 1 starts at 10/28/2014 20:30, and has < 24h of data. 2Occurring within 4h of highest 1h outdoor concentration.
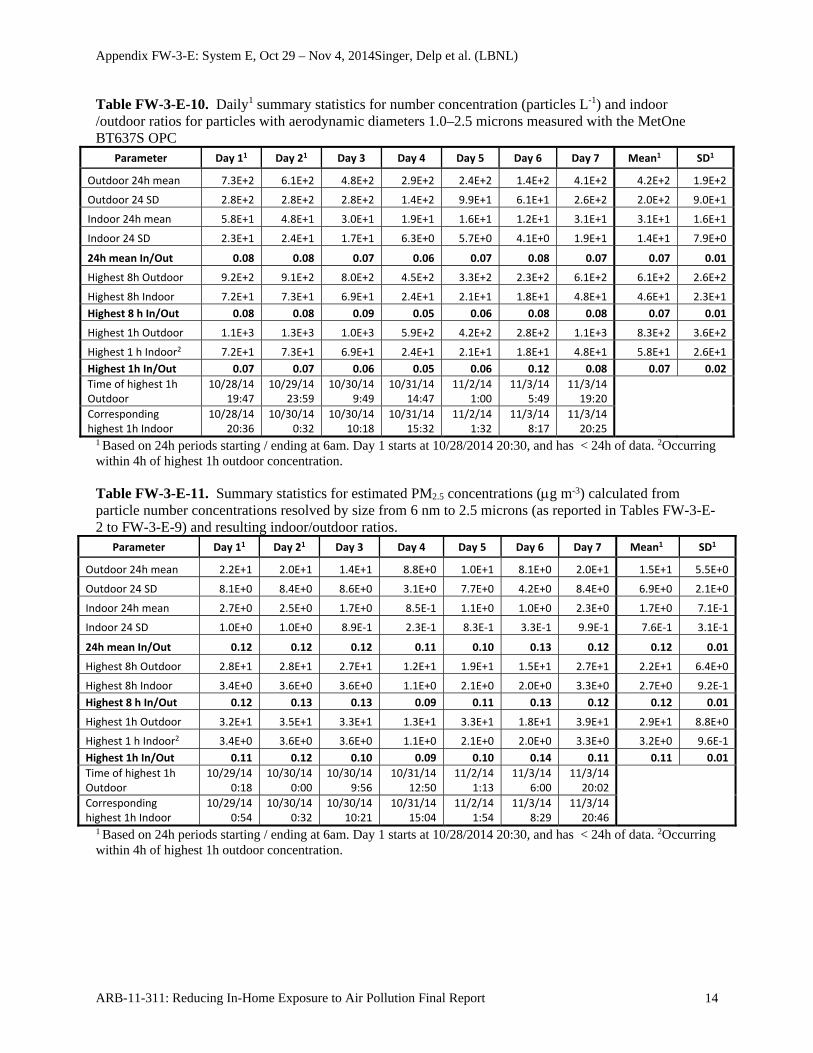
Appendix FW-3-E: System E, Oct 29 – Nov 4, 2014Singer, Delp et al. (LBNL)
ARB-11-311: Reducing In-Home Exposure to Air Pollution Final Report 14
Table FW-3-E-10. Daily1 summary statistics for number concentration (particles L-1) and indoor /outdoor ratios for particles with aerodynamic diameters 1.0–2.5 microns measured with the MetOne BT637S OPC
Parameter Day 11 Day 21 Day 3 Day 4 Day 5 Day 6 Day 7 Mean1 SD1
Outdoor 24h mean 7.3E+2 6.1E+2 4.8E+2 2.9E+2 2.4E+2 1.4E+2 4.1E+2 4.2E+2 1.9E+2
Outdoor 24 SD 2.8E+2 2.8E+2 2.8E+2 1.4E+2 9.9E+1 6.1E+1 2.6E+2 2.0E+2 9.0E+1
Indoor 24h mean 5.8E+1 4.8E+1 3.0E+1 1.9E+1 1.6E+1 1.2E+1 3.1E+1 3.1E+1 1.6E+1
Indoor 24 SD 2.3E+1 2.4E+1 1.7E+1 6.3E+0 5.7E+0 4.1E+0 1.9E+1 1.4E+1 7.9E+0
24h mean In/Out 0.08 0.08 0.07 0.06 0.07 0.08 0.07 0.07 0.01
Highest 8h Outdoor 9.2E+2 9.1E+2 8.0E+2 4.5E+2 3.3E+2 2.3E+2 6.1E+2 6.1E+2 2.6E+2
Highest 8h Indoor 7.2E+1 7.3E+1 6.9E+1 2.4E+1 2.1E+1 1.8E+1 4.8E+1 4.6E+1 2.3E+1
Highest 8 h In/Out 0.08 0.08 0.09 0.05 0.06 0.08 0.08 0.07 0.01
Highest 1h Outdoor 1.1E+3 1.3E+3 1.0E+3 5.9E+2 4.2E+2 2.8E+2 1.1E+3 8.3E+2 3.6E+2
Highest 1 h Indoor2 7.2E+1 7.3E+1 6.9E+1 2.4E+1 2.1E+1 1.8E+1 4.8E+1 5.8E+1 2.6E+1
Highest 1h In/Out 0.07 0.07 0.06 0.05 0.06 0.12 0.08 0.07 0.02
Time of highest 1h Outdoor
10/28/14 19:47
10/29/14 23:59
10/30/14 9:49
10/31/14 14:47
11/2/14 1:00
11/3/14 5:49
11/3/14 19:20
Corresponding highest 1h Indoor
10/28/14 20:36
10/30/14 0:32
10/30/14 10:18
10/31/14 15:32
11/2/14 1:32
11/3/14 8:17
11/3/14 20:25
1 Based on 24h periods starting / ending at 6am. Day 1 starts at 10/28/2014 20:30, and has < 24h of data. 2Occurring within 4h of highest 1h outdoor concentration. Table FW-3-E-11. Summary statistics for estimated PM2.5 concentrations (g m-3) calculated from particle number concentrations resolved by size from 6 nm to 2.5 microns (as reported in Tables FW-3-E-2 to FW-3-E-9) and resulting indoor/outdoor ratios.
Parameter Day 11 Day 21 Day 3 Day 4 Day 5 Day 6 Day 7 Mean1 SD1
Outdoor 24h mean 2.2E+1 2.0E+1 1.4E+1 8.8E+0 1.0E+1 8.1E+0 2.0E+1 1.5E+1 5.5E+0
Outdoor 24 SD 8.1E+0 8.4E+0 8.6E+0 3.1E+0 7.7E+0 4.2E+0 8.4E+0 6.9E+0 2.1E+0
Indoor 24h mean 2.7E+0 2.5E+0 1.7E+0 8.5E‐1 1.1E+0 1.0E+0 2.3E+0 1.7E+0 7.1E‐1
Indoor 24 SD 1.0E+0 1.0E+0 8.9E‐1 2.3E‐1 8.3E‐1 3.3E‐1 9.9E‐1 7.6E‐1 3.1E‐1
24h mean In/Out 0.12 0.12 0.12 0.11 0.10 0.13 0.12 0.12 0.01
Highest 8h Outdoor 2.8E+1 2.8E+1 2.7E+1 1.2E+1 1.9E+1 1.5E+1 2.7E+1 2.2E+1 6.4E+0
Highest 8h Indoor 3.4E+0 3.6E+0 3.6E+0 1.1E+0 2.1E+0 2.0E+0 3.3E+0 2.7E+0 9.2E‐1
Highest 8 h In/Out 0.12 0.13 0.13 0.09 0.11 0.13 0.12 0.12 0.01
Highest 1h Outdoor 3.2E+1 3.5E+1 3.3E+1 1.3E+1 3.3E+1 1.8E+1 3.9E+1 2.9E+1 8.8E+0
Highest 1 h Indoor2 3.4E+0 3.6E+0 3.6E+0 1.1E+0 2.1E+0 2.0E+0 3.3E+0 3.2E+0 9.6E‐1
Highest 1h In/Out 0.11 0.12 0.10 0.09 0.10 0.14 0.11 0.11 0.01
Time of highest 1h Outdoor
10/29/14 0:18
10/30/14 0:00
10/30/14 9:56
10/31/14 12:50
11/2/14 1:13
11/3/14 6:00
11/3/14 20:02
Corresponding highest 1h Indoor
10/29/14 0:54
10/30/14 0:32
10/30/14 10:21
10/31/14 15:04
11/2/14 1:54
11/3/14 8:29
11/3/14 20:46
1 Based on 24h periods starting / ending at 6am. Day 1 starts at 10/28/2014 20:30, and has < 24h of data. 2Occurring within 4h of highest 1h outdoor concentration.
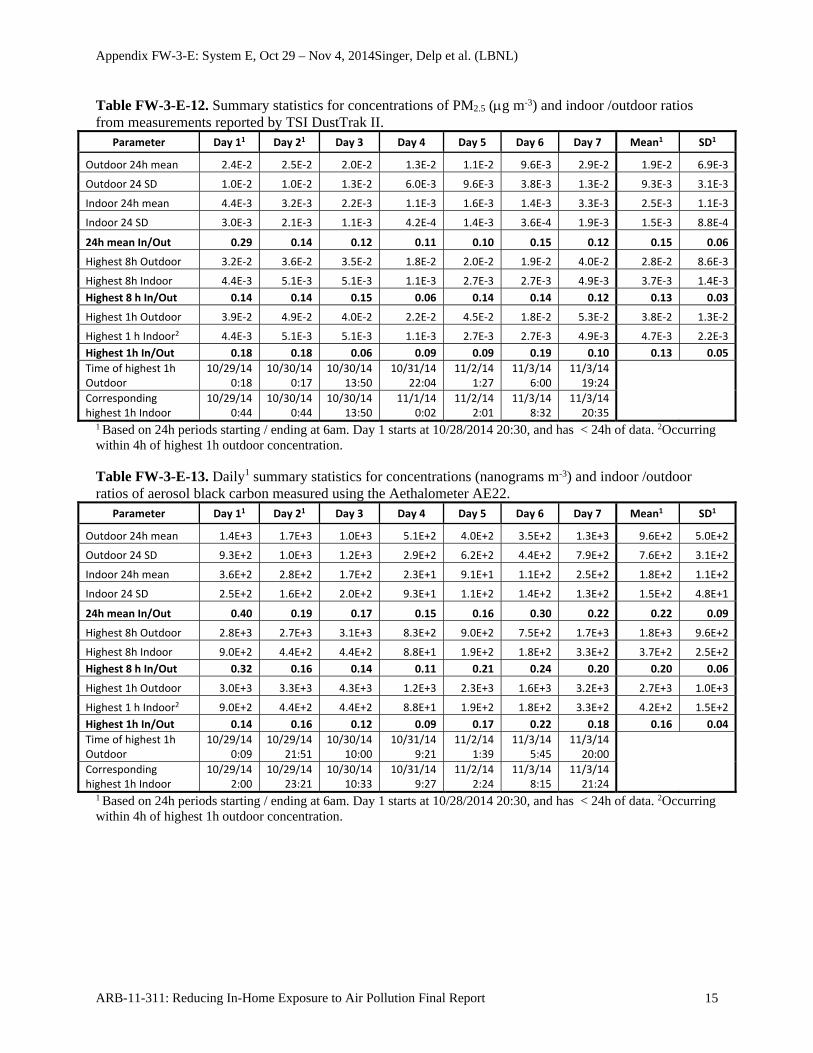
Appendix FW-3-E: System E, Oct 29 – Nov 4, 2014Singer, Delp et al. (LBNL)
ARB-11-311: Reducing In-Home Exposure to Air Pollution Final Report 15
Table FW-3-E-12. Summary statistics for concentrations of PM2.5 (g m-3) and indoor /outdoor ratios from measurements reported by TSI DustTrak II.
Parameter Day 11 Day 21 Day 3 Day 4 Day 5 Day 6 Day 7 Mean1 SD1
Outdoor 24h mean 2.4E‐2 2.5E‐2 2.0E‐2 1.3E‐2 1.1E‐2 9.6E‐3 2.9E‐2 1.9E‐2 6.9E‐3
Outdoor 24 SD 1.0E‐2 1.0E‐2 1.3E‐2 6.0E‐3 9.6E‐3 3.8E‐3 1.3E‐2 9.3E‐3 3.1E‐3
Indoor 24h mean 4.4E‐3 3.2E‐3 2.2E‐3 1.1E‐3 1.6E‐3 1.4E‐3 3.3E‐3 2.5E‐3 1.1E‐3
Indoor 24 SD 3.0E‐3 2.1E‐3 1.1E‐3 4.2E‐4 1.4E‐3 3.6E‐4 1.9E‐3 1.5E‐3 8.8E‐4
24h mean In/Out 0.29 0.14 0.12 0.11 0.10 0.15 0.12 0.15 0.06
Highest 8h Outdoor 3.2E‐2 3.6E‐2 3.5E‐2 1.8E‐2 2.0E‐2 1.9E‐2 4.0E‐2 2.8E‐2 8.6E‐3
Highest 8h Indoor 4.4E‐3 5.1E‐3 5.1E‐3 1.1E‐3 2.7E‐3 2.7E‐3 4.9E‐3 3.7E‐3 1.4E‐3
Highest 8 h In/Out 0.14 0.14 0.15 0.06 0.14 0.14 0.12 0.13 0.03
Highest 1h Outdoor 3.9E‐2 4.9E‐2 4.0E‐2 2.2E‐2 4.5E‐2 1.8E‐2 5.3E‐2 3.8E‐2 1.3E‐2
Highest 1 h Indoor2 4.4E‐3 5.1E‐3 5.1E‐3 1.1E‐3 2.7E‐3 2.7E‐3 4.9E‐3 4.7E‐3 2.2E‐3
Highest 1h In/Out 0.18 0.18 0.06 0.09 0.09 0.19 0.10 0.13 0.05
Time of highest 1h Outdoor
10/29/14 0:18
10/30/14 0:17
10/30/14 13:50
10/31/14 22:04
11/2/14 1:27
11/3/14 6:00
11/3/14 19:24
Corresponding highest 1h Indoor
10/29/14 0:44
10/30/14 0:44
10/30/14 13:50
11/1/14 0:02
11/2/14 2:01
11/3/14 8:32
11/3/14 20:35
1 Based on 24h periods starting / ending at 6am. Day 1 starts at 10/28/2014 20:30, and has < 24h of data. 2Occurring within 4h of highest 1h outdoor concentration. Table FW-3-E-13. Daily1 summary statistics for concentrations (nanograms m-3) and indoor /outdoor ratios of aerosol black carbon measured using the Aethalometer AE22.
Parameter Day 11 Day 21 Day 3 Day 4 Day 5 Day 6 Day 7 Mean1 SD1
Outdoor 24h mean 1.4E+3 1.7E+3 1.0E+3 5.1E+2 4.0E+2 3.5E+2 1.3E+3 9.6E+2 5.0E+2
Outdoor 24 SD 9.3E+2 1.0E+3 1.2E+3 2.9E+2 6.2E+2 4.4E+2 7.9E+2 7.6E+2 3.1E+2
Indoor 24h mean 3.6E+2 2.8E+2 1.7E+2 2.3E+1 9.1E+1 1.1E+2 2.5E+2 1.8E+2 1.1E+2
Indoor 24 SD 2.5E+2 1.6E+2 2.0E+2 9.3E+1 1.1E+2 1.4E+2 1.3E+2 1.5E+2 4.8E+1
24h mean In/Out 0.40 0.19 0.17 0.15 0.16 0.30 0.22 0.22 0.09
Highest 8h Outdoor 2.8E+3 2.7E+3 3.1E+3 8.3E+2 9.0E+2 7.5E+2 1.7E+3 1.8E+3 9.6E+2
Highest 8h Indoor 9.0E+2 4.4E+2 4.4E+2 8.8E+1 1.9E+2 1.8E+2 3.3E+2 3.7E+2 2.5E+2
Highest 8 h In/Out 0.32 0.16 0.14 0.11 0.21 0.24 0.20 0.20 0.06
Highest 1h Outdoor 3.0E+3 3.3E+3 4.3E+3 1.2E+3 2.3E+3 1.6E+3 3.2E+3 2.7E+3 1.0E+3
Highest 1 h Indoor2 9.0E+2 4.4E+2 4.4E+2 8.8E+1 1.9E+2 1.8E+2 3.3E+2 4.2E+2 1.5E+2
Highest 1h In/Out 0.14 0.16 0.12 0.09 0.17 0.22 0.18 0.16 0.04
Time of highest 1h Outdoor
10/29/14 0:09
10/29/14 21:51
10/30/14 10:00
10/31/14 9:21
11/2/14 1:39
11/3/14 5:45
11/3/14 20:00
Corresponding highest 1h Indoor
10/29/14 2:00
10/29/14 23:21
10/30/14 10:33
10/31/14 9:27
11/2/14 2:24
11/3/14 8:15
11/3/14 21:24
1 Based on 24h periods starting / ending at 6am. Day 1 starts at 10/28/2014 20:30, and has < 24h of data. 2Occurring within 4h of highest 1h outdoor concentration.
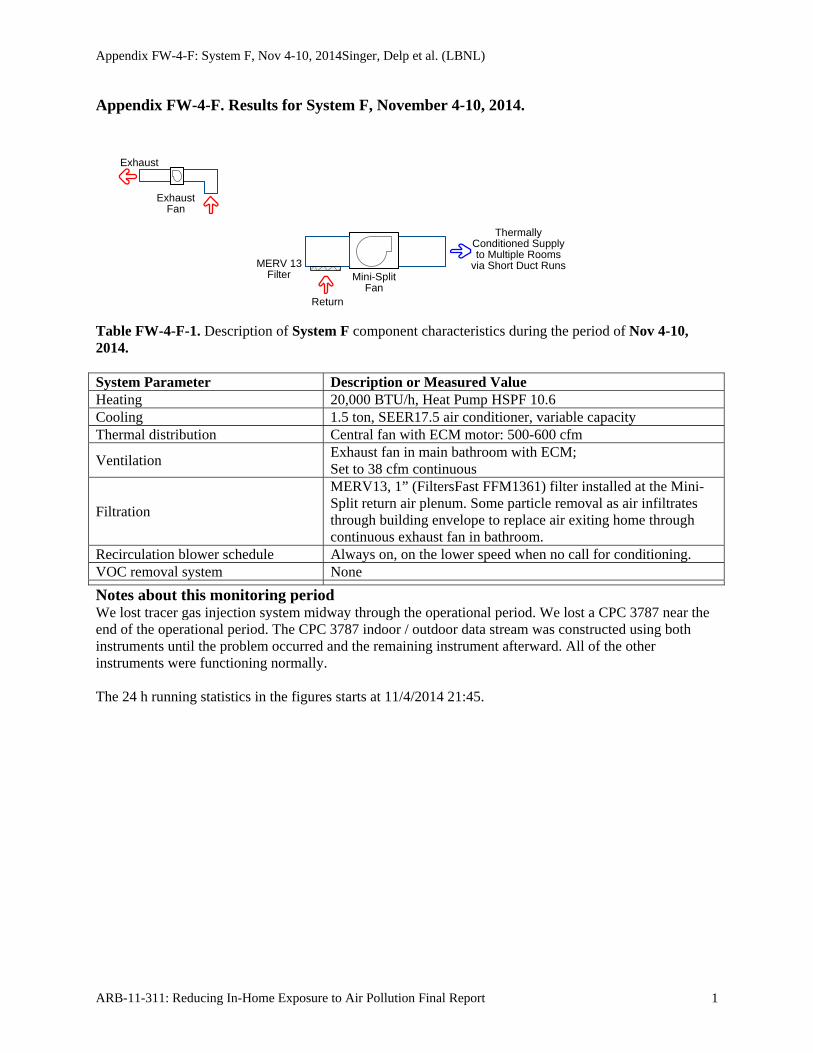
Appendix FW-4-F: System F, Nov 4-10, 2014Singer, Delp et al. (LBNL)
ARB-11-311: Reducing In-Home Exposure to Air Pollution Final Report 1
Appendix FW-4-F. Results for System F, November 4-10, 2014.
Table FW-4-F-1. Description of System F component characteristics during the period of Nov 4-10, 2014. System Parameter Description or Measured Value Heating 20,000 BTU/h, Heat Pump HSPF 10.6 Cooling 1.5 ton, SEER17.5 air conditioner, variable capacity Thermal distribution Central fan with ECM motor: 500-600 cfm
Ventilation Exhaust fan in main bathroom with ECM; Set to 38 cfm continuous
Filtration
MERV13, 1” (FiltersFast FFM1361) filter installed at the Mini-Split return air plenum. Some particle removal as air infiltrates through building envelope to replace air exiting home through continuous exhaust fan in bathroom.
Recirculation blower schedule Always on, on the lower speed when no call for conditioning. VOC removal system None
Notes about this monitoring period We lost tracer gas injection system midway through the operational period. We lost a CPC 3787 near the end of the operational period. The CPC 3787 indoor / outdoor data stream was constructed using both instruments until the problem occurred and the remaining instrument afterward. All of the other instruments were functioning normally. The 24 h running statistics in the figures starts at 11/4/2014 21:45.
Exhaust
ThermallyConditioned Supplyto Multiple Rooms
via Short Duct Runs
ExhaustFan
MERV 13Filter Mini-Split
FanReturn
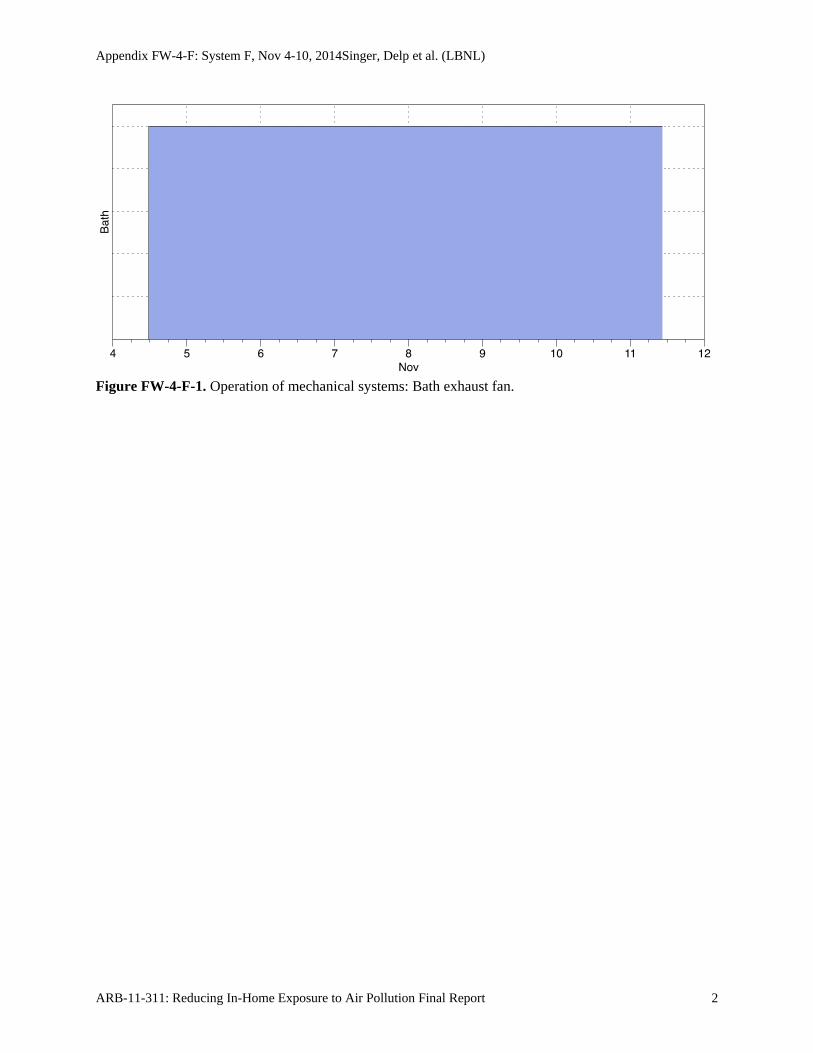
Appendix FW-4-F: System F, Nov 4-10, 2014Singer, Delp et al. (LBNL)
ARB-11-311: Reducing In-Home Exposure to Air Pollution Final Report 2
Figure FW-4-F-1. Operation of mechanical systems: Bath exhaust fan.
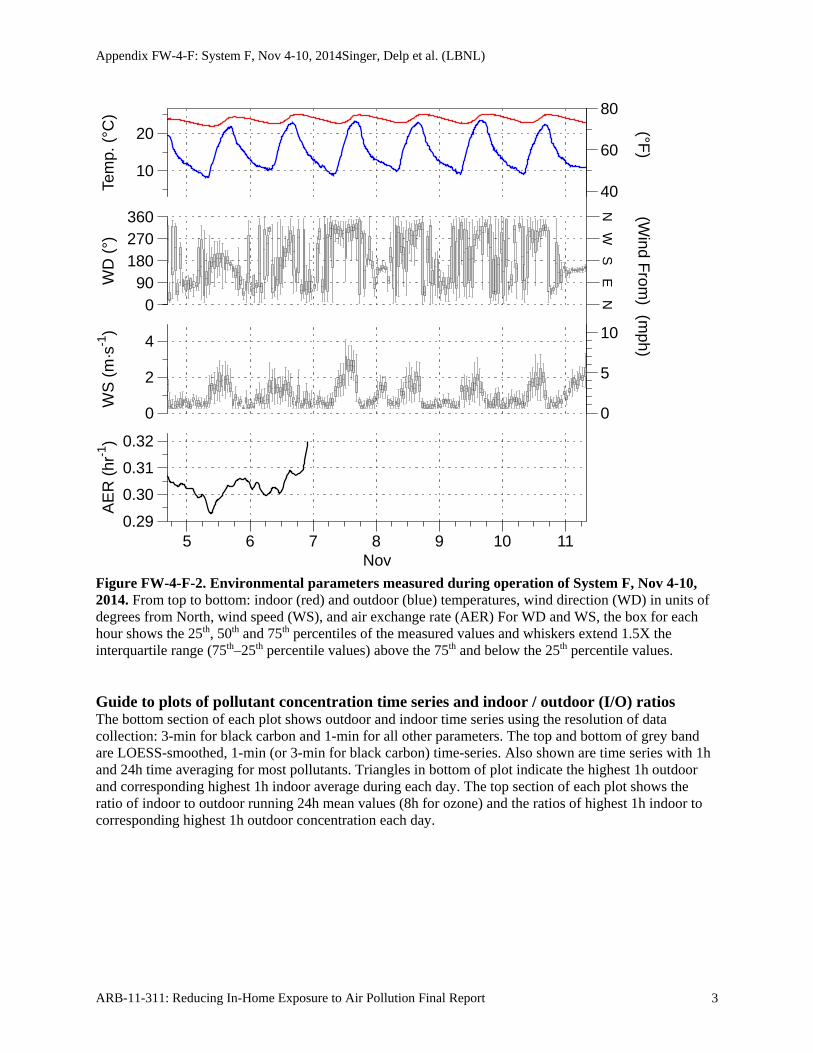
Appendix FW-4-F: System F, Nov 4-10, 2014Singer, Delp et al. (LBNL)
ARB-11-311: Reducing In-Home Exposure to Air Pollution Final Report 3
Figure FW-4-F-2. Environmental parameters measured during operation of System F, Nov 4-10, 2014. From top to bottom: indoor (red) and outdoor (blue) temperatures, wind direction (WD) in units of degrees from North, wind speed (WS), and air exchange rate (AER) For WD and WS, the box for each hour shows the 25th, 50th and 75th percentiles of the measured values and whiskers extend 1.5X the interquartile range (75th–25th percentile values) above the 75th and below the 25th percentile values. Guide to plots of pollutant concentration time series and indoor / outdoor (I/O) ratios The bottom section of each plot shows outdoor and indoor time series using the resolution of data collection: 3-min for black carbon and 1-min for all other parameters. The top and bottom of grey band are LOESS-smoothed, 1-min (or 3-min for black carbon) time-series. Also shown are time series with 1h and 24h time averaging for most pollutants. Triangles in bottom of plot indicate the highest 1h outdoor and corresponding highest 1h indoor average during each day. The top section of each plot shows the ratio of indoor to outdoor running 24h mean values (8h for ozone) and the ratios of highest 1h indoor to corresponding highest 1h outdoor concentration each day.
0
5
10
40
60
80
NE
SW
N
(mph)
(Wind F
rom)
(°F)
AE
R (
hr-1
)
0.29
0.30
0.31
0.32
WS
(m
·s-1
)
0
2
4
WD
(°)
090
180270360
Tem
p. (
°C)
10
20
5 6 7 8 9 10 11Nov
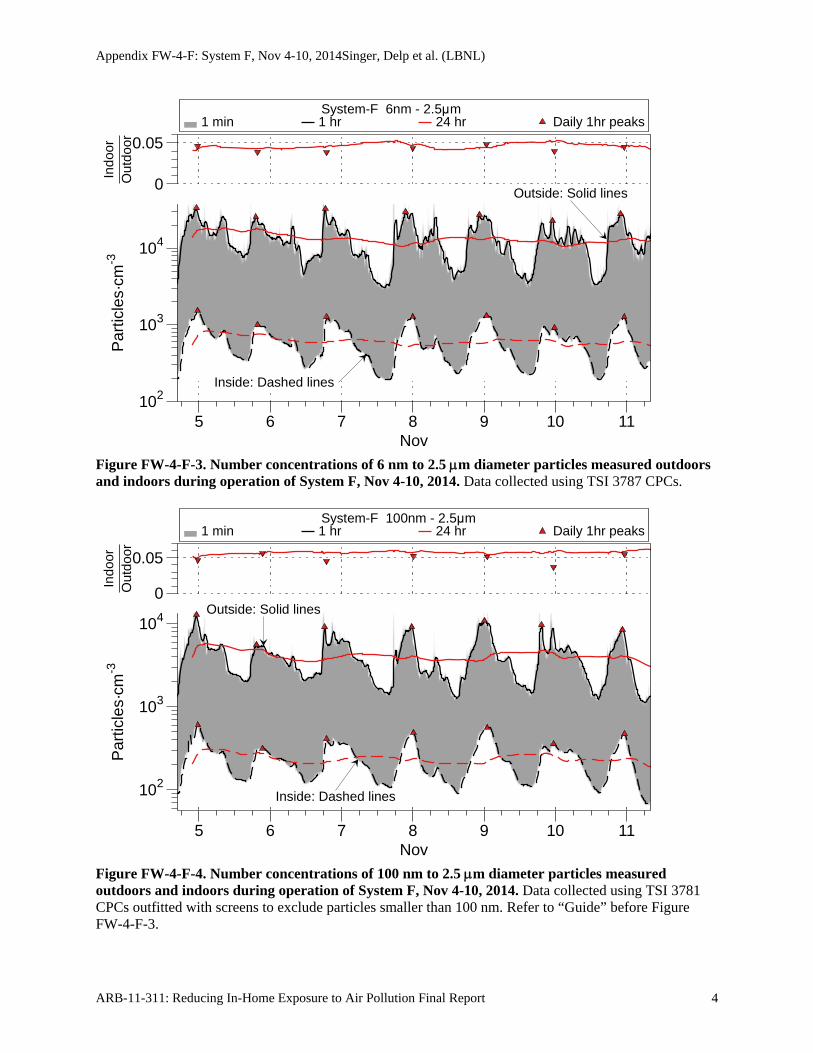
Appendix FW-4-F: System F, Nov 4-10, 2014Singer, Delp et al. (LBNL)
ARB-11-311: Reducing In-Home Exposure to Air Pollution Final Report 4
Figure FW-4-F-3. Number concentrations of 6 nm to 2.5 m diameter particles measured outdoors and indoors during operation of System F, Nov 4-10, 2014. Data collected using TSI 3787 CPCs.
Figure FW-4-F-4. Number concentrations of 100 nm to 2.5 m diameter particles measured outdoors and indoors during operation of System F, Nov 4-10, 2014. Data collected using TSI 3781 CPCs outfitted with screens to exclude particles smaller than 100 nm. Refer to “Guide” before Figure FW-4-F-3.
1 min 1 hr 24 hr Daily 1hr peaks System-F 6nm - 2.5μm
Outside: Solid lines
Inside: Dashed lines
Par
ticle
s·cm
-3
102
103
104
Indo
orO
utdo
or
0
0.05
5 6 7 8 9 10 11Nov
1 min 1 hr 24 hr Daily 1hr peaks System-F 100nm - 2.5μm
Outside: Solid lines
Inside: Dashed lines
Par
ticle
s·cm
-3
102
103
104
Indo
orO
utdo
or
0
0.05
5 6 7 8 9 10 11Nov
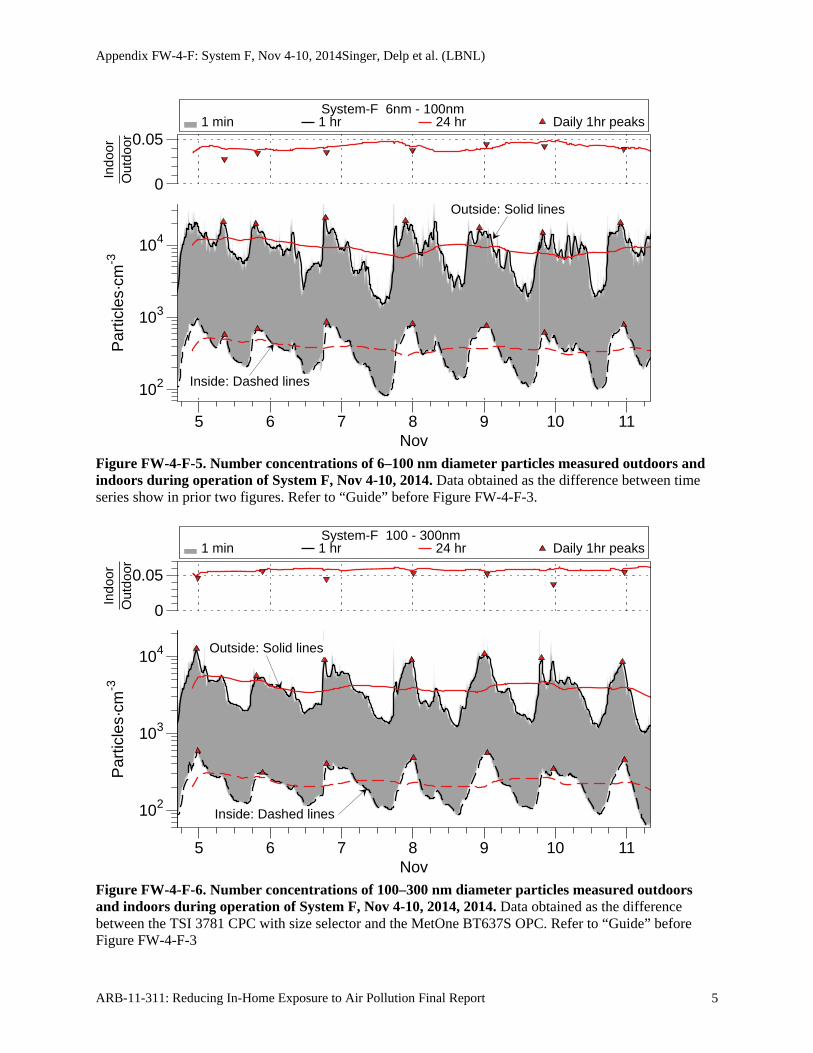
Appendix FW-4-F: System F, Nov 4-10, 2014Singer, Delp et al. (LBNL)
ARB-11-311: Reducing In-Home Exposure to Air Pollution Final Report 5
Figure FW-4-F-5. Number concentrations of 6–100 nm diameter particles measured outdoors and indoors during operation of System F, Nov 4-10, 2014. Data obtained as the difference between time series show in prior two figures. Refer to “Guide” before Figure FW-4-F-3.
Figure FW-4-F-6. Number concentrations of 100–300 nm diameter particles measured outdoors and indoors during operation of System F, Nov 4-10, 2014, 2014. Data obtained as the difference between the TSI 3781 CPC with size selector and the MetOne BT637S OPC. Refer to “Guide” before Figure FW-4-F-3
1 min 1 hr 24 hr Daily 1hr peaks System-F 6nm - 100nm
Outside: Solid lines
Inside: Dashed lines
Par
ticle
s·cm
-3
102
103
104
Indo
orO
utdo
or
0
0.05
5 6 7 8 9 10 11Nov
1 min 1 hr 24 hr Daily 1hr peaks System-F 100 - 300nm
Outside: Solid lines
Inside: Dashed lines102
103
104
Par
ticle
s·cm
-3In
door
Out
door
0
0.05
5 6 7 8 9 10 11Nov
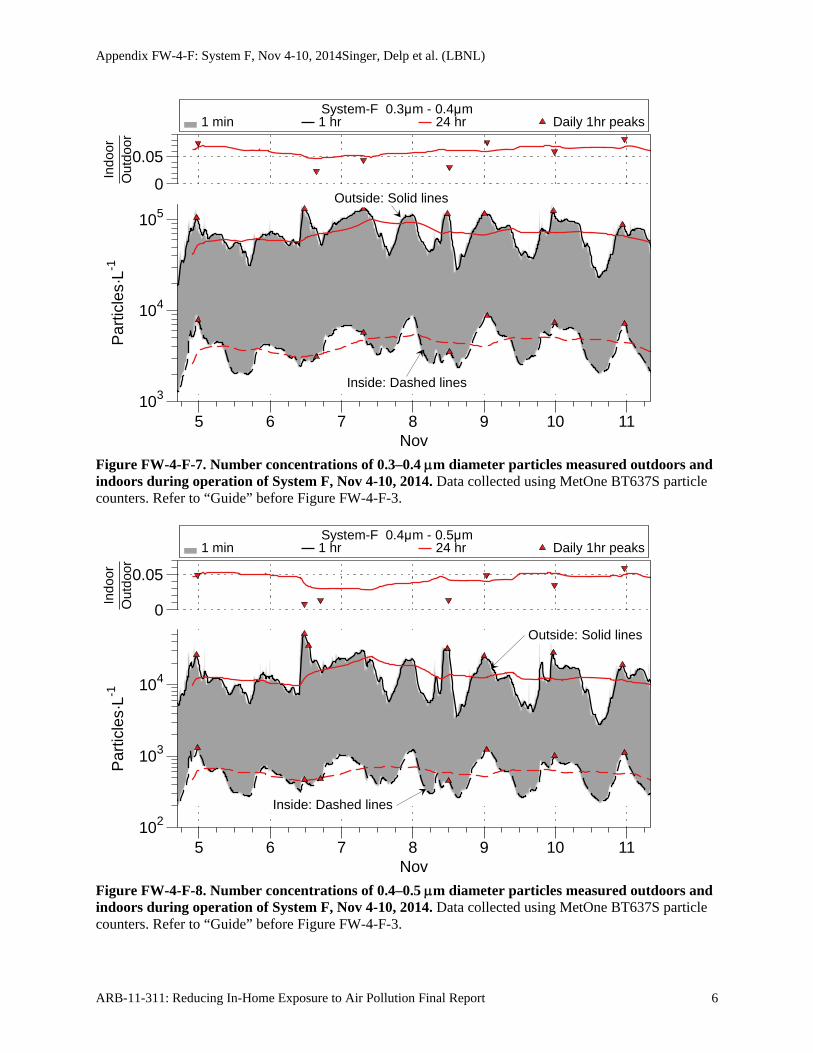
Appendix FW-4-F: System F, Nov 4-10, 2014Singer, Delp et al. (LBNL)
ARB-11-311: Reducing In-Home Exposure to Air Pollution Final Report 6
Figure FW-4-F-7. Number concentrations of 0.3–0.4 m diameter particles measured outdoors and indoors during operation of System F, Nov 4-10, 2014. Data collected using MetOne BT637S particle counters. Refer to “Guide” before Figure FW-4-F-3.
Figure FW-4-F-8. Number concentrations of 0.4–0.5 m diameter particles measured outdoors and indoors during operation of System F, Nov 4-10, 2014. Data collected using MetOne BT637S particle counters. Refer to “Guide” before Figure FW-4-F-3.
1 min 1 hr 24 hr Daily 1hr peaks System-F 0.3μm - 0.4μm
Outside: Solid lines
Inside: Dashed lines
Par
ticle
s·L-1
103
104
105
Indo
orO
utdo
or
0
0.05
5 6 7 8 9 10 11Nov
1 min 1 hr 24 hr Daily 1hr peaks System-F 0.4μm - 0.5μm
Outside: Solid lines
Inside: Dashed lines
Par
ticle
s·L-1
102
103
104
Indo
orO
utdo
or
0
0.05
5 6 7 8 9 10 11Nov
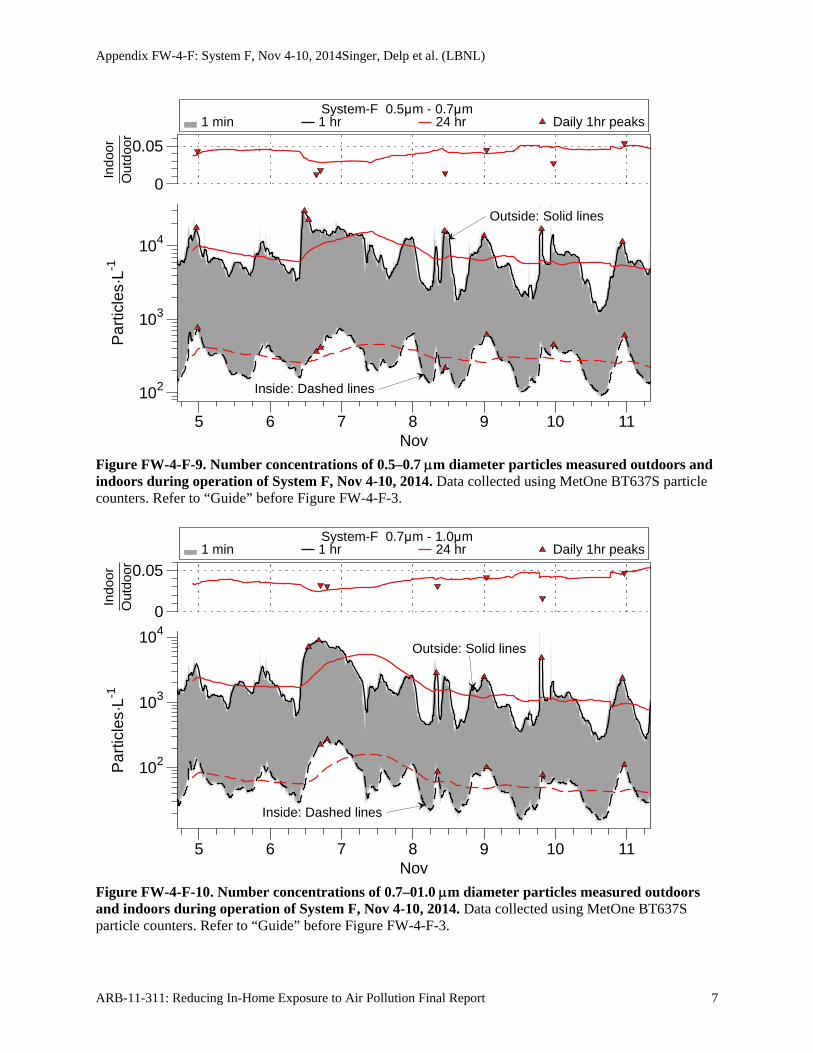
Appendix FW-4-F: System F, Nov 4-10, 2014Singer, Delp et al. (LBNL)
ARB-11-311: Reducing In-Home Exposure to Air Pollution Final Report 7
Figure FW-4-F-9. Number concentrations of 0.5–0.7 m diameter particles measured outdoors and indoors during operation of System F, Nov 4-10, 2014. Data collected using MetOne BT637S particle counters. Refer to “Guide” before Figure FW-4-F-3.
Figure FW-4-F-10. Number concentrations of 0.7–01.0 m diameter particles measured outdoors and indoors during operation of System F, Nov 4-10, 2014. Data collected using MetOne BT637S particle counters. Refer to “Guide” before Figure FW-4-F-3.
1 min 1 hr 24 hr Daily 1hr peaks System-F 0.5μm - 0.7μm
Outside: Solid lines
Inside: Dashed lines
Par
ticle
s·L-1
102
103
104
Indo
orO
utdo
or
0
0.05
5 6 7 8 9 10 11Nov
1 min 1 hr 24 hr Daily 1hr peaks System-F 0.7μm - 1.0μm
Outside: Solid lines
Inside: Dashed lines
Par
ticle
s·L-1
102
103
104
Indo
orO
utdo
or
0
0.05
5 6 7 8 9 10 11Nov
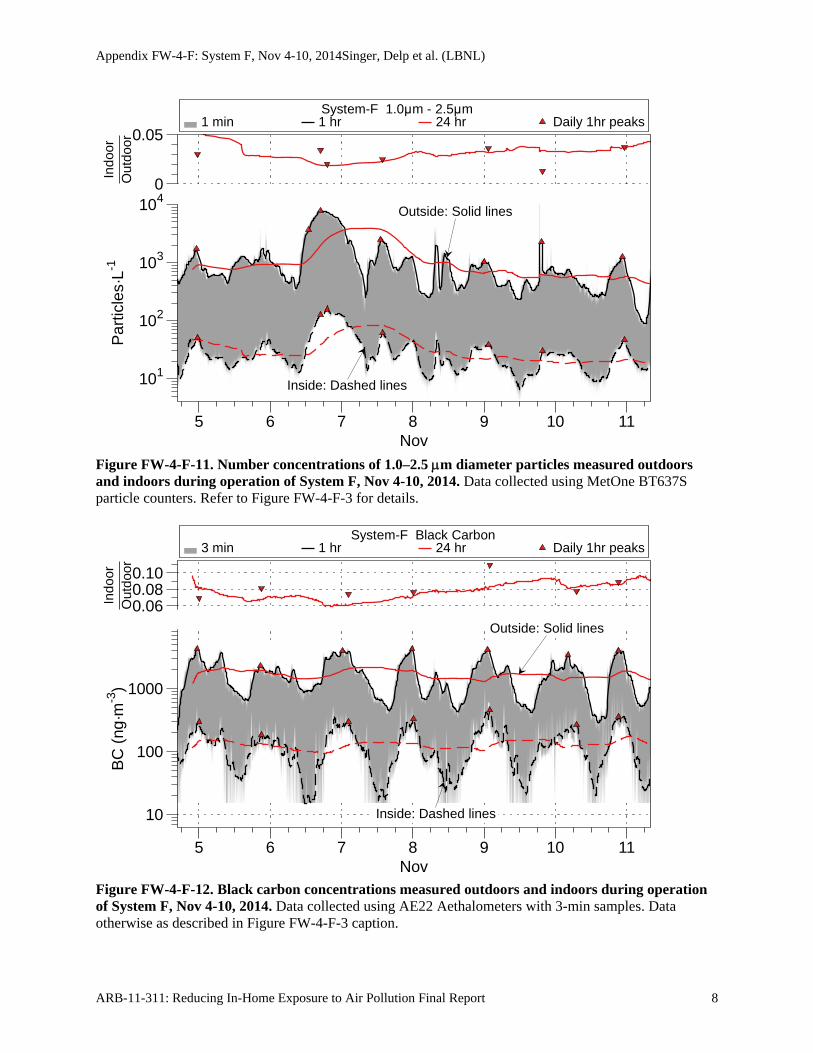
Appendix FW-4-F: System F, Nov 4-10, 2014Singer, Delp et al. (LBNL)
ARB-11-311: Reducing In-Home Exposure to Air Pollution Final Report 8
Figure FW-4-F-11. Number concentrations of 1.0–2.5 m diameter particles measured outdoors and indoors during operation of System F, Nov 4-10, 2014. Data collected using MetOne BT637S particle counters. Refer to Figure FW-4-F-3 for details.
Figure FW-4-F-12. Black carbon concentrations measured outdoors and indoors during operation of System F, Nov 4-10, 2014. Data collected using AE22 Aethalometers with 3-min samples. Data otherwise as described in Figure FW-4-F-3 caption.
1 min 1 hr 24 hr Daily 1hr peaks System-F 1.0μm - 2.5μm
Outside: Solid lines
Inside: Dashed lines
Par
ticle
s·L-1
101
102
103
104
Indo
orO
utdo
or
0
0.05
5 6 7 8 9 10 11Nov
3 min 1 hr 24 hr Daily 1hr peaks System-F Black Carbon
Outside: Solid lines
Inside: Dashed lines
BC
(ng
·m-3
)
10
100
1000
Indo
orO
utdo
or
0.060.080.10
5 6 7 8 9 10 11Nov
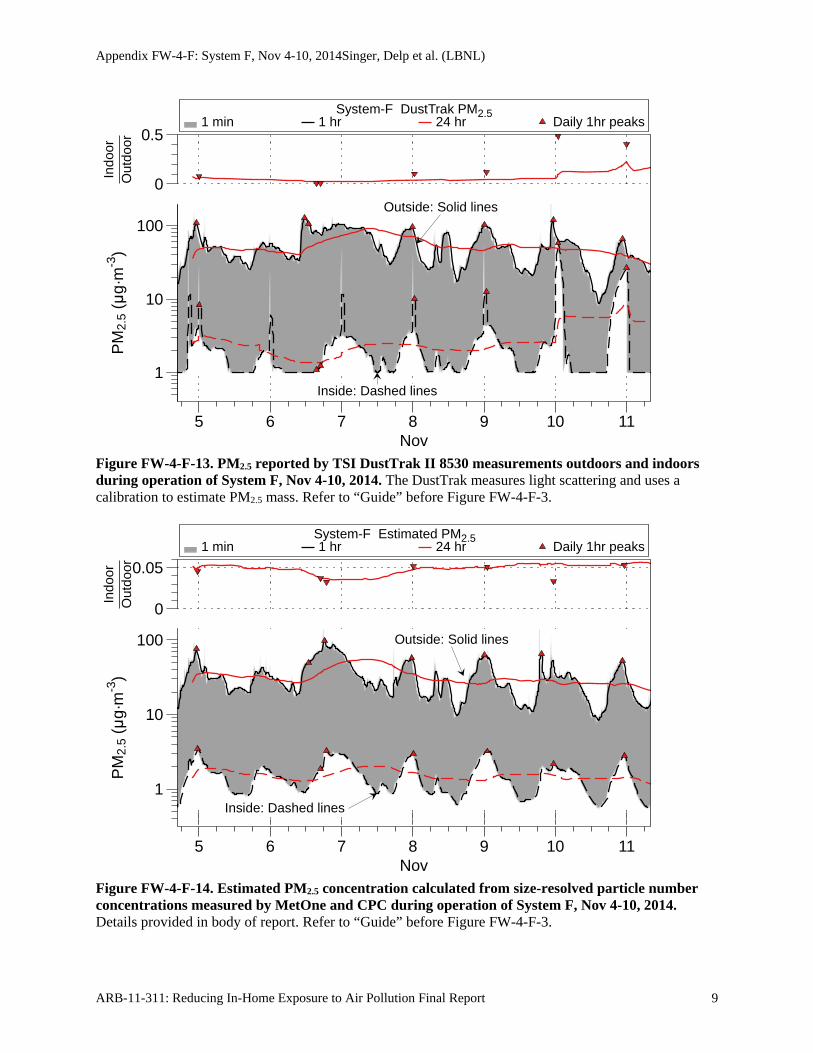
Appendix FW-4-F: System F, Nov 4-10, 2014Singer, Delp et al. (LBNL)
ARB-11-311: Reducing In-Home Exposure to Air Pollution Final Report 9
Figure FW-4-F-13. PM2.5 reported by TSI DustTrak II 8530 measurements outdoors and indoors during operation of System F, Nov 4-10, 2014. The DustTrak measures light scattering and uses a calibration to estimate PM2.5 mass. Refer to “Guide” before Figure FW-4-F-3.
Figure FW-4-F-14. Estimated PM2.5 concentration calculated from size-resolved particle number concentrations measured by MetOne and CPC during operation of System F, Nov 4-10, 2014. Details provided in body of report. Refer to “Guide” before Figure FW-4-F-3.
1 min 1 hr 24 hr Daily 1hr peaks System-F DustTrak PM2.5
1
10
100Outside: Solid lines
Inside: Dashed lines
PM
2.5
(μg·
m-3
)In
door
Out
door
0
0.5
5 6 7 8 9 10 11Nov
1 min 1 hr 24 hr Daily 1hr peaks System-F Estimated PM2.5
Outside: Solid lines
Inside: Dashed lines
PM
2.5
(μg·
m-3
)
1
10
100
Indo
orO
utdo
or
0
0.05
5 6 7 8 9 10 11Nov
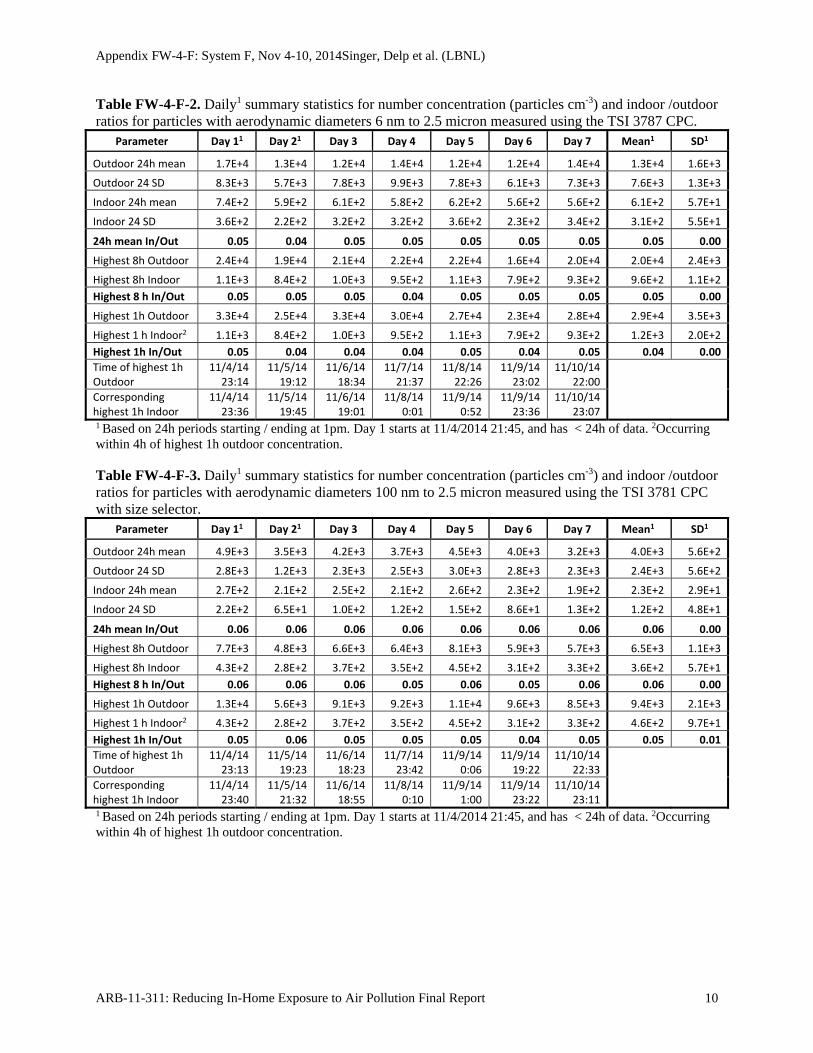
Appendix FW-4-F: System F, Nov 4-10, 2014Singer, Delp et al. (LBNL)
ARB-11-311: Reducing In-Home Exposure to Air Pollution Final Report 10
Table FW-4-F-2. Daily1 summary statistics for number concentration (particles cm-3) and indoor /outdoor ratios for particles with aerodynamic diameters 6 nm to 2.5 micron measured using the TSI 3787 CPC.
Parameter Day 11 Day 21 Day 3 Day 4 Day 5 Day 6 Day 7 Mean1 SD1
Outdoor 24h mean 1.7E+4 1.3E+4 1.2E+4 1.4E+4 1.2E+4 1.2E+4 1.4E+4 1.3E+4 1.6E+3
Outdoor 24 SD 8.3E+3 5.7E+3 7.8E+3 9.9E+3 7.8E+3 6.1E+3 7.3E+3 7.6E+3 1.3E+3
Indoor 24h mean 7.4E+2 5.9E+2 6.1E+2 5.8E+2 6.2E+2 5.6E+2 5.6E+2 6.1E+2 5.7E+1
Indoor 24 SD 3.6E+2 2.2E+2 3.2E+2 3.2E+2 3.6E+2 2.3E+2 3.4E+2 3.1E+2 5.5E+1
24h mean In/Out 0.05 0.04 0.05 0.05 0.05 0.05 0.05 0.05 0.00
Highest 8h Outdoor 2.4E+4 1.9E+4 2.1E+4 2.2E+4 2.2E+4 1.6E+4 2.0E+4 2.0E+4 2.4E+3
Highest 8h Indoor 1.1E+3 8.4E+2 1.0E+3 9.5E+2 1.1E+3 7.9E+2 9.3E+2 9.6E+2 1.1E+2
Highest 8 h In/Out 0.05 0.05 0.05 0.04 0.05 0.05 0.05 0.05 0.00
Highest 1h Outdoor 3.3E+4 2.5E+4 3.3E+4 3.0E+4 2.7E+4 2.3E+4 2.8E+4 2.9E+4 3.5E+3
Highest 1 h Indoor2 1.1E+3 8.4E+2 1.0E+3 9.5E+2 1.1E+3 7.9E+2 9.3E+2 1.2E+3 2.0E+2
Highest 1h In/Out 0.05 0.04 0.04 0.04 0.05 0.04 0.05 0.04 0.00
Time of highest 1h Outdoor
11/4/14 23:14
11/5/14 19:12
11/6/14 18:34
11/7/14 21:37
11/8/14 22:26
11/9/14 23:02
11/10/14 22:00
Corresponding highest 1h Indoor
11/4/14 23:36
11/5/14 19:45
11/6/14 19:01
11/8/14 0:01
11/9/14 0:52
11/9/14 23:36
11/10/14 23:07
1 Based on 24h periods starting / ending at 1pm. Day 1 starts at 11/4/2014 21:45, and has < 24h of data. 2Occurring within 4h of highest 1h outdoor concentration. Table FW-4-F-3. Daily1 summary statistics for number concentration (particles cm-3) and indoor /outdoor ratios for particles with aerodynamic diameters 100 nm to 2.5 micron measured using the TSI 3781 CPC with size selector.
Parameter Day 11 Day 21 Day 3 Day 4 Day 5 Day 6 Day 7 Mean1 SD1
Outdoor 24h mean 4.9E+3 3.5E+3 4.2E+3 3.7E+3 4.5E+3 4.0E+3 3.2E+3 4.0E+3 5.6E+2
Outdoor 24 SD 2.8E+3 1.2E+3 2.3E+3 2.5E+3 3.0E+3 2.8E+3 2.3E+3 2.4E+3 5.6E+2
Indoor 24h mean 2.7E+2 2.1E+2 2.5E+2 2.1E+2 2.6E+2 2.3E+2 1.9E+2 2.3E+2 2.9E+1
Indoor 24 SD 2.2E+2 6.5E+1 1.0E+2 1.2E+2 1.5E+2 8.6E+1 1.3E+2 1.2E+2 4.8E+1
24h mean In/Out 0.06 0.06 0.06 0.06 0.06 0.06 0.06 0.06 0.00
Highest 8h Outdoor 7.7E+3 4.8E+3 6.6E+3 6.4E+3 8.1E+3 5.9E+3 5.7E+3 6.5E+3 1.1E+3
Highest 8h Indoor 4.3E+2 2.8E+2 3.7E+2 3.5E+2 4.5E+2 3.1E+2 3.3E+2 3.6E+2 5.7E+1
Highest 8 h In/Out 0.06 0.06 0.06 0.05 0.06 0.05 0.06 0.06 0.00
Highest 1h Outdoor 1.3E+4 5.6E+3 9.1E+3 9.2E+3 1.1E+4 9.6E+3 8.5E+3 9.4E+3 2.1E+3
Highest 1 h Indoor2 4.3E+2 2.8E+2 3.7E+2 3.5E+2 4.5E+2 3.1E+2 3.3E+2 4.6E+2 9.7E+1
Highest 1h In/Out 0.05 0.06 0.05 0.05 0.05 0.04 0.05 0.05 0.01
Time of highest 1h Outdoor
11/4/14 23:13
11/5/14 19:23
11/6/14 18:23
11/7/14 23:42
11/9/14 0:06
11/9/14 19:22
11/10/14 22:33
Corresponding highest 1h Indoor
11/4/14 23:40
11/5/14 21:32
11/6/14 18:55
11/8/14 0:10
11/9/14 1:00
11/9/14 23:22
11/10/14 23:11
1 Based on 24h periods starting / ending at 1pm. Day 1 starts at 11/4/2014 21:45, and has < 24h of data. 2Occurring within 4h of highest 1h outdoor concentration.
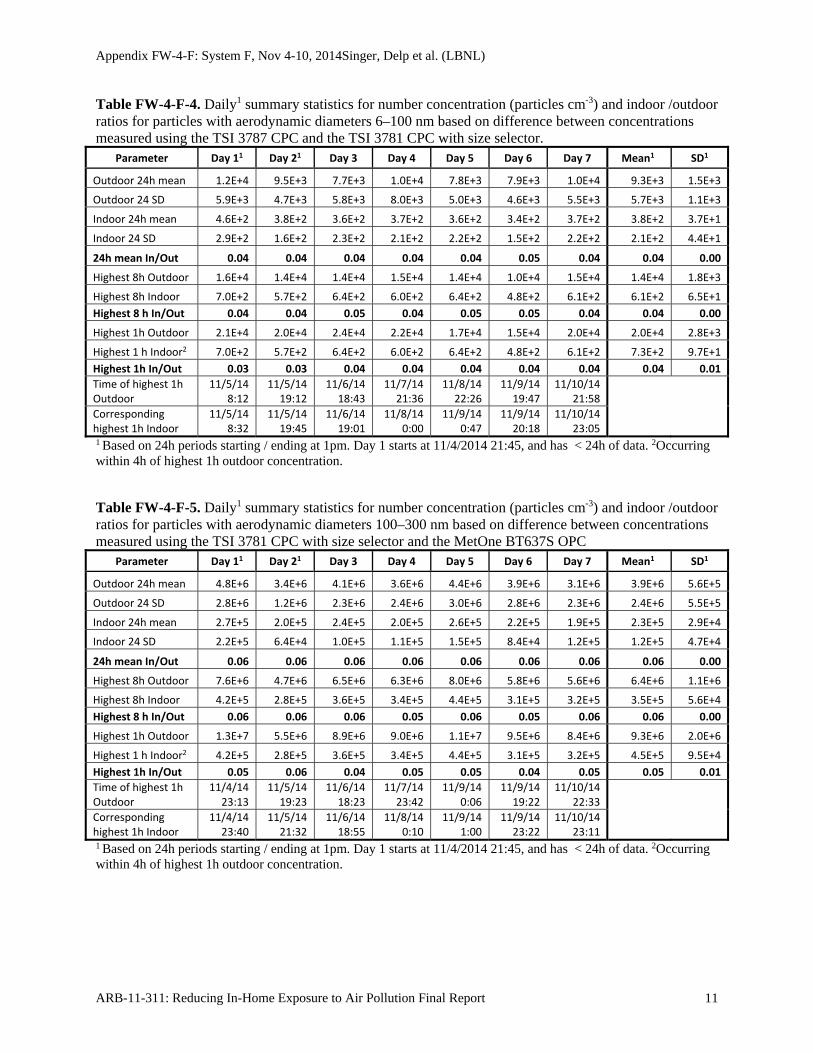
Appendix FW-4-F: System F, Nov 4-10, 2014Singer, Delp et al. (LBNL)
ARB-11-311: Reducing In-Home Exposure to Air Pollution Final Report 11
Table FW-4-F-4. Daily1 summary statistics for number concentration (particles cm-3) and indoor /outdoor ratios for particles with aerodynamic diameters 6–100 nm based on difference between concentrations measured using the TSI 3787 CPC and the TSI 3781 CPC with size selector.
Parameter Day 11 Day 21 Day 3 Day 4 Day 5 Day 6 Day 7 Mean1 SD1
Outdoor 24h mean 1.2E+4 9.5E+3 7.7E+3 1.0E+4 7.8E+3 7.9E+3 1.0E+4 9.3E+3 1.5E+3
Outdoor 24 SD 5.9E+3 4.7E+3 5.8E+3 8.0E+3 5.0E+3 4.6E+3 5.5E+3 5.7E+3 1.1E+3
Indoor 24h mean 4.6E+2 3.8E+2 3.6E+2 3.7E+2 3.6E+2 3.4E+2 3.7E+2 3.8E+2 3.7E+1
Indoor 24 SD 2.9E+2 1.6E+2 2.3E+2 2.1E+2 2.2E+2 1.5E+2 2.2E+2 2.1E+2 4.4E+1
24h mean In/Out 0.04 0.04 0.04 0.04 0.04 0.05 0.04 0.04 0.00
Highest 8h Outdoor 1.6E+4 1.4E+4 1.4E+4 1.5E+4 1.4E+4 1.0E+4 1.5E+4 1.4E+4 1.8E+3
Highest 8h Indoor 7.0E+2 5.7E+2 6.4E+2 6.0E+2 6.4E+2 4.8E+2 6.1E+2 6.1E+2 6.5E+1
Highest 8 h In/Out 0.04 0.04 0.05 0.04 0.05 0.05 0.04 0.04 0.00
Highest 1h Outdoor 2.1E+4 2.0E+4 2.4E+4 2.2E+4 1.7E+4 1.5E+4 2.0E+4 2.0E+4 2.8E+3
Highest 1 h Indoor2 7.0E+2 5.7E+2 6.4E+2 6.0E+2 6.4E+2 4.8E+2 6.1E+2 7.3E+2 9.7E+1
Highest 1h In/Out 0.03 0.03 0.04 0.04 0.04 0.04 0.04 0.04 0.01
Time of highest 1h Outdoor
11/5/14 8:12
11/5/14 19:12
11/6/14 18:43
11/7/14 21:36
11/8/14 22:26
11/9/14 19:47
11/10/14 21:58
Corresponding highest 1h Indoor
11/5/14 8:32
11/5/14 19:45
11/6/14 19:01
11/8/14 0:00
11/9/14 0:47
11/9/14 20:18
11/10/14 23:05
1 Based on 24h periods starting / ending at 1pm. Day 1 starts at 11/4/2014 21:45, and has < 24h of data. 2Occurring within 4h of highest 1h outdoor concentration. Table FW-4-F-5. Daily1 summary statistics for number concentration (particles cm-3) and indoor /outdoor ratios for particles with aerodynamic diameters 100–300 nm based on difference between concentrations measured using the TSI 3781 CPC with size selector and the MetOne BT637S OPC
Parameter Day 11 Day 21 Day 3 Day 4 Day 5 Day 6 Day 7 Mean1 SD1
Outdoor 24h mean 4.8E+6 3.4E+6 4.1E+6 3.6E+6 4.4E+6 3.9E+6 3.1E+6 3.9E+6 5.6E+5
Outdoor 24 SD 2.8E+6 1.2E+6 2.3E+6 2.4E+6 3.0E+6 2.8E+6 2.3E+6 2.4E+6 5.5E+5
Indoor 24h mean 2.7E+5 2.0E+5 2.4E+5 2.0E+5 2.6E+5 2.2E+5 1.9E+5 2.3E+5 2.9E+4
Indoor 24 SD 2.2E+5 6.4E+4 1.0E+5 1.1E+5 1.5E+5 8.4E+4 1.2E+5 1.2E+5 4.7E+4
24h mean In/Out 0.06 0.06 0.06 0.06 0.06 0.06 0.06 0.06 0.00
Highest 8h Outdoor 7.6E+6 4.7E+6 6.5E+6 6.3E+6 8.0E+6 5.8E+6 5.6E+6 6.4E+6 1.1E+6
Highest 8h Indoor 4.2E+5 2.8E+5 3.6E+5 3.4E+5 4.4E+5 3.1E+5 3.2E+5 3.5E+5 5.6E+4
Highest 8 h In/Out 0.06 0.06 0.06 0.05 0.06 0.05 0.06 0.06 0.00
Highest 1h Outdoor 1.3E+7 5.5E+6 8.9E+6 9.0E+6 1.1E+7 9.5E+6 8.4E+6 9.3E+6 2.0E+6
Highest 1 h Indoor2 4.2E+5 2.8E+5 3.6E+5 3.4E+5 4.4E+5 3.1E+5 3.2E+5 4.5E+5 9.5E+4
Highest 1h In/Out 0.05 0.06 0.04 0.05 0.05 0.04 0.05 0.05 0.01
Time of highest 1h Outdoor
11/4/14 23:13
11/5/14 19:23
11/6/14 18:23
11/7/14 23:42
11/9/14 0:06
11/9/14 19:22
11/10/14 22:33
Corresponding highest 1h Indoor
11/4/14 23:40
11/5/14 21:32
11/6/14 18:55
11/8/14 0:10
11/9/14 1:00
11/9/14 23:22
11/10/14 23:11
1 Based on 24h periods starting / ending at 1pm. Day 1 starts at 11/4/2014 21:45, and has < 24h of data. 2Occurring within 4h of highest 1h outdoor concentration.

Appendix FW-4-F: System F, Nov 4-10, 2014Singer, Delp et al. (LBNL)
ARB-11-311: Reducing In-Home Exposure to Air Pollution Final Report 12
Table FW-4-F-6. Daily1 summary statistics for number concentration (particles L-1) and indoor /outdoor ratios for particles with aerodynamic diameters 0.3–0.4 microns measured with the MetOne BT637S OPC.
Parameter Day 11 Day 21 Day 3 Day 4 Day 5 Day 6 Day 7 Mean1 SD1
Outdoor 24h mean 5.9E+4 6.5E+4 9.5E+4 7.3E+4 7.2E+4 7.2E+4 5.8E+4 7.1E+4 1.2E+4
Outdoor 24 SD 2.2E+4 2.4E+4 2.3E+4 2.6E+4 2.7E+4 2.7E+4 2.3E+4 2.5E+4 1.9E+3
Indoor 24h mean 3.7E+3 3.2E+3 5.0E+3 4.5E+3 4.9E+3 4.8E+3 3.5E+3 4.2E+3 7.0E+2
Indoor 24 SD 2.7E+3 7.6E+2 1.4E+3 1.9E+3 2.0E+3 1.6E+3 1.5E+3 1.7E+3 5.5E+2
24h mean In/Out 0.07 0.06 0.05 0.06 0.06 0.07 0.07 0.06 0.01
Highest 8h Outdoor 7.8E+4 8.0E+4 1.2E+5 1.1E+5 1.0E+5 1.0E+5 7.8E+4 9.5E+4 1.6E+4
Highest 8h Indoor 5.4E+3 2.9E+3 5.7E+3 4.5E+3 7.4E+3 6.5E+3 4.9E+3 5.3E+3 1.3E+3
Highest 8 h In/Out 0.07 0.04 0.05 0.04 0.07 0.06 0.06 0.06 0.01
Highest 1h Outdoor 1.1E+5 1.3E+5 1.3E+5 1.2E+5 1.2E+5 1.2E+5 8.8E+4 1.2E+5 1.4E+4
Highest 1 h Indoor2 5.4E+3 2.9E+3 5.7E+3 4.5E+3 7.4E+3 6.5E+3 4.9E+3 6.2E+3 2.0E+3
Highest 1h In/Out 0.07 0.02 0.04 0.03 0.08 0.06 0.08 0.06 0.02
Time of highest 1h Outdoor
11/4/14 23:15
11/6/14 11:27
11/7/14 7:19
11/8/14 11:38
11/9/14 0:05
11/9/14 23:17
11/10/14 22:42
Corresponding highest 1h Indoor
11/4/14 23:41
11/6/14 15:27
11/7/14 7:19
11/8/14 12:16
11/9/14 0:58
11/9/14 23:45
11/10/14 23:16
1 Based on 24h periods starting / ending at 1pm. Day 1 starts at 11/4/2014 21:45, and has < 24h of data. 2Occurring within 4h of highest 1h outdoor concentration. Table FW-4-F-7. Daily1 summary statistics for number concentration (particles L-1) and indoor /outdoor ratios for particles with aerodynamic diameters 0.4–0.5 microns measured with the MetOne BT637S OPC.
Parameter Day 11 Day 21 Day 3 Day 4 Day 5 Day 6 Day 7 Mean1 SD1
Outdoor 24h mean 1.2E+4 1.4E+4 2.1E+4 1.4E+4 1.2E+4 1.3E+4 1.1E+4 1.4E+4 3.3E+3
Outdoor 24 SD 5.3E+3 1.1E+4 4.9E+3 8.2E+3 6.1E+3 7.7E+3 5.4E+3 7.0E+3 2.2E+3
Indoor 24h mean 6.0E+2 4.6E+2 7.0E+2 5.8E+2 6.2E+2 6.0E+2 4.8E+2 5.8E+2 7.6E+1
Indoor 24 SD 6.2E+2 1.3E+2 2.3E+2 2.8E+2 3.1E+2 2.3E+2 2.6E+2 3.0E+2 1.4E+2
24h mean In/Out 0.05 0.05 0.03 0.04 0.04 0.05 0.05 0.04 0.01
Highest 8h Outdoor 1.7E+4 2.1E+4 2.8E+4 2.1E+4 1.9E+4 1.9E+4 1.5E+4 2.0E+4 3.9E+3
Highest 8h Indoor 9.2E+2 4.2E+2 6.4E+2 5.6E+2 1.0E+3 8.3E+2 7.0E+2 7.2E+2 1.9E+2
Highest 8 h In/Out 0.06 0.02 0.02 0.03 0.05 0.04 0.05 0.04 0.01
Highest 1h Outdoor 2.6E+4 5.1E+4 3.6E+4 3.2E+4 2.5E+4 2.8E+4 1.9E+4 3.1E+4 9.6E+3
Highest 1 h Indoor2 9.2E+2 4.2E+2 6.4E+2 5.6E+2 1.0E+3 8.3E+2 7.0E+2 8.6E+2 3.6E+2
Highest 1h In/Out 0.05 0.01 0.01 0.01 0.05 0.04 0.06 0.03 0.02
Time of highest 1h Outdoor
11/4/14 23:12
11/6/14 11:27
11/6/14 13:00
11/8/14 11:38
11/8/14 23:58
11/9/14 23:18
11/10/14 22:41
Corresponding highest 1h Indoor
11/4/14 23:33
11/6/14 11:27
11/6/14 16:55
11/8/14 12:05
11/9/14 0:54
11/9/14 23:41
11/10/14 23:11
1 Based on 24h periods starting / ending at 1pm. Day 1 starts at 11/4/2014 21:45, and has < 24h of data. 2Occurring within 4h of highest 1h outdoor concentration.
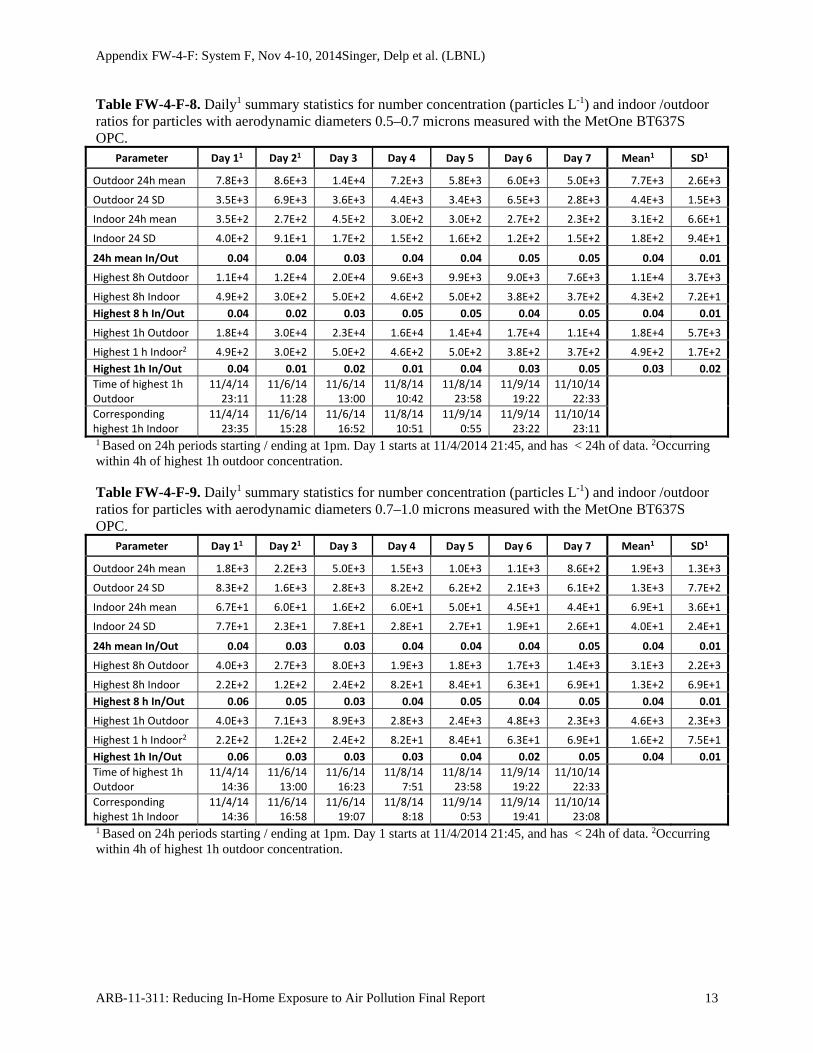
Appendix FW-4-F: System F, Nov 4-10, 2014Singer, Delp et al. (LBNL)
ARB-11-311: Reducing In-Home Exposure to Air Pollution Final Report 13
Table FW-4-F-8. Daily1 summary statistics for number concentration (particles L-1) and indoor /outdoor ratios for particles with aerodynamic diameters 0.5–0.7 microns measured with the MetOne BT637S OPC.
Parameter Day 11 Day 21 Day 3 Day 4 Day 5 Day 6 Day 7 Mean1 SD1
Outdoor 24h mean 7.8E+3 8.6E+3 1.4E+4 7.2E+3 5.8E+3 6.0E+3 5.0E+3 7.7E+3 2.6E+3
Outdoor 24 SD 3.5E+3 6.9E+3 3.6E+3 4.4E+3 3.4E+3 6.5E+3 2.8E+3 4.4E+3 1.5E+3
Indoor 24h mean 3.5E+2 2.7E+2 4.5E+2 3.0E+2 3.0E+2 2.7E+2 2.3E+2 3.1E+2 6.6E+1
Indoor 24 SD 4.0E+2 9.1E+1 1.7E+2 1.5E+2 1.6E+2 1.2E+2 1.5E+2 1.8E+2 9.4E+1
24h mean In/Out 0.04 0.04 0.03 0.04 0.04 0.05 0.05 0.04 0.01
Highest 8h Outdoor 1.1E+4 1.2E+4 2.0E+4 9.6E+3 9.9E+3 9.0E+3 7.6E+3 1.1E+4 3.7E+3
Highest 8h Indoor 4.9E+2 3.0E+2 5.0E+2 4.6E+2 5.0E+2 3.8E+2 3.7E+2 4.3E+2 7.2E+1
Highest 8 h In/Out 0.04 0.02 0.03 0.05 0.05 0.04 0.05 0.04 0.01
Highest 1h Outdoor 1.8E+4 3.0E+4 2.3E+4 1.6E+4 1.4E+4 1.7E+4 1.1E+4 1.8E+4 5.7E+3
Highest 1 h Indoor2 4.9E+2 3.0E+2 5.0E+2 4.6E+2 5.0E+2 3.8E+2 3.7E+2 4.9E+2 1.7E+2
Highest 1h In/Out 0.04 0.01 0.02 0.01 0.04 0.03 0.05 0.03 0.02
Time of highest 1h Outdoor
11/4/14 23:11
11/6/14 11:28
11/6/14 13:00
11/8/14 10:42
11/8/14 23:58
11/9/14 19:22
11/10/14 22:33
Corresponding highest 1h Indoor
11/4/14 23:35
11/6/14 15:28
11/6/14 16:52
11/8/14 10:51
11/9/14 0:55
11/9/14 23:22
11/10/14 23:11
1 Based on 24h periods starting / ending at 1pm. Day 1 starts at 11/4/2014 21:45, and has < 24h of data. 2Occurring within 4h of highest 1h outdoor concentration. Table FW-4-F-9. Daily1 summary statistics for number concentration (particles L-1) and indoor /outdoor ratios for particles with aerodynamic diameters 0.7–1.0 microns measured with the MetOne BT637S OPC.
Parameter Day 11 Day 21 Day 3 Day 4 Day 5 Day 6 Day 7 Mean1 SD1
Outdoor 24h mean 1.8E+3 2.2E+3 5.0E+3 1.5E+3 1.0E+3 1.1E+3 8.6E+2 1.9E+3 1.3E+3
Outdoor 24 SD 8.3E+2 1.6E+3 2.8E+3 8.2E+2 6.2E+2 2.1E+3 6.1E+2 1.3E+3 7.7E+2
Indoor 24h mean 6.7E+1 6.0E+1 1.6E+2 6.0E+1 5.0E+1 4.5E+1 4.4E+1 6.9E+1 3.6E+1
Indoor 24 SD 7.7E+1 2.3E+1 7.8E+1 2.8E+1 2.7E+1 1.9E+1 2.6E+1 4.0E+1 2.4E+1
24h mean In/Out 0.04 0.03 0.03 0.04 0.04 0.04 0.05 0.04 0.01
Highest 8h Outdoor 4.0E+3 2.7E+3 8.0E+3 1.9E+3 1.8E+3 1.7E+3 1.4E+3 3.1E+3 2.2E+3
Highest 8h Indoor 2.2E+2 1.2E+2 2.4E+2 8.2E+1 8.4E+1 6.3E+1 6.9E+1 1.3E+2 6.9E+1
Highest 8 h In/Out 0.06 0.05 0.03 0.04 0.05 0.04 0.05 0.04 0.01
Highest 1h Outdoor 4.0E+3 7.1E+3 8.9E+3 2.8E+3 2.4E+3 4.8E+3 2.3E+3 4.6E+3 2.3E+3
Highest 1 h Indoor2 2.2E+2 1.2E+2 2.4E+2 8.2E+1 8.4E+1 6.3E+1 6.9E+1 1.6E+2 7.5E+1
Highest 1h In/Out 0.06 0.03 0.03 0.03 0.04 0.02 0.05 0.04 0.01
Time of highest 1h Outdoor
11/4/14 14:36
11/6/14 13:00
11/6/14 16:23
11/8/14 7:51
11/8/14 23:58
11/9/14 19:22
11/10/14 22:33
Corresponding highest 1h Indoor
11/4/14 14:36
11/6/14 16:58
11/6/14 19:07
11/8/14 8:18
11/9/14 0:53
11/9/14 19:41
11/10/14 23:08
1 Based on 24h periods starting / ending at 1pm. Day 1 starts at 11/4/2014 21:45, and has < 24h of data. 2Occurring within 4h of highest 1h outdoor concentration.
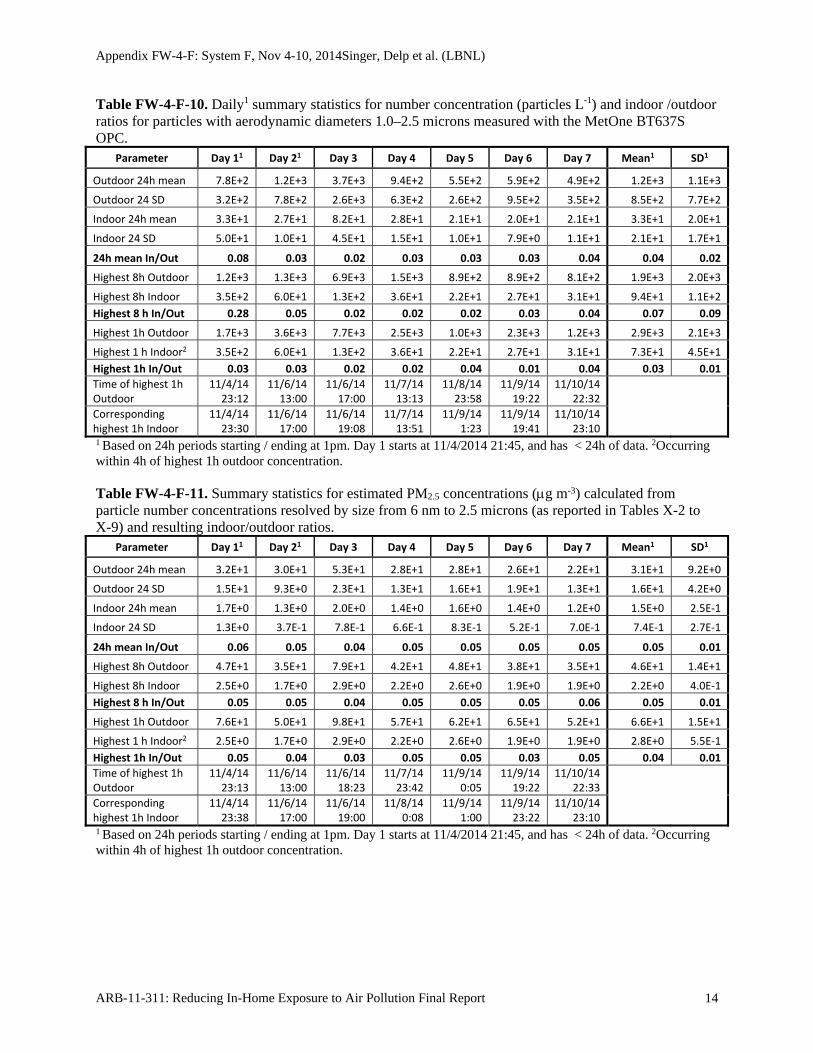
Appendix FW-4-F: System F, Nov 4-10, 2014Singer, Delp et al. (LBNL)
ARB-11-311: Reducing In-Home Exposure to Air Pollution Final Report 14
Table FW-4-F-10. Daily1 summary statistics for number concentration (particles L-1) and indoor /outdoor ratios for particles with aerodynamic diameters 1.0–2.5 microns measured with the MetOne BT637S OPC.
Parameter Day 11 Day 21 Day 3 Day 4 Day 5 Day 6 Day 7 Mean1 SD1
Outdoor 24h mean 7.8E+2 1.2E+3 3.7E+3 9.4E+2 5.5E+2 5.9E+2 4.9E+2 1.2E+3 1.1E+3
Outdoor 24 SD 3.2E+2 7.8E+2 2.6E+3 6.3E+2 2.6E+2 9.5E+2 3.5E+2 8.5E+2 7.7E+2
Indoor 24h mean 3.3E+1 2.7E+1 8.2E+1 2.8E+1 2.1E+1 2.0E+1 2.1E+1 3.3E+1 2.0E+1
Indoor 24 SD 5.0E+1 1.0E+1 4.5E+1 1.5E+1 1.0E+1 7.9E+0 1.1E+1 2.1E+1 1.7E+1
24h mean In/Out 0.08 0.03 0.02 0.03 0.03 0.03 0.04 0.04 0.02
Highest 8h Outdoor 1.2E+3 1.3E+3 6.9E+3 1.5E+3 8.9E+2 8.9E+2 8.1E+2 1.9E+3 2.0E+3
Highest 8h Indoor 3.5E+2 6.0E+1 1.3E+2 3.6E+1 2.2E+1 2.7E+1 3.1E+1 9.4E+1 1.1E+2
Highest 8 h In/Out 0.28 0.05 0.02 0.02 0.02 0.03 0.04 0.07 0.09
Highest 1h Outdoor 1.7E+3 3.6E+3 7.7E+3 2.5E+3 1.0E+3 2.3E+3 1.2E+3 2.9E+3 2.1E+3
Highest 1 h Indoor2 3.5E+2 6.0E+1 1.3E+2 3.6E+1 2.2E+1 2.7E+1 3.1E+1 7.3E+1 4.5E+1
Highest 1h In/Out 0.03 0.03 0.02 0.02 0.04 0.01 0.04 0.03 0.01
Time of highest 1h Outdoor
11/4/14 23:12
11/6/14 13:00
11/6/14 17:00
11/7/14 13:13
11/8/14 23:58
11/9/14 19:22
11/10/14 22:32
Corresponding highest 1h Indoor
11/4/14 23:30
11/6/14 17:00
11/6/14 19:08
11/7/14 13:51
11/9/14 1:23
11/9/14 19:41
11/10/14 23:10
1 Based on 24h periods starting / ending at 1pm. Day 1 starts at 11/4/2014 21:45, and has < 24h of data. 2Occurring within 4h of highest 1h outdoor concentration. Table FW-4-F-11. Summary statistics for estimated PM2.5 concentrations (g m-3) calculated from particle number concentrations resolved by size from 6 nm to 2.5 microns (as reported in Tables X-2 to X-9) and resulting indoor/outdoor ratios.
Parameter Day 11 Day 21 Day 3 Day 4 Day 5 Day 6 Day 7 Mean1 SD1
Outdoor 24h mean 3.2E+1 3.0E+1 5.3E+1 2.8E+1 2.8E+1 2.6E+1 2.2E+1 3.1E+1 9.2E+0
Outdoor 24 SD 1.5E+1 9.3E+0 2.3E+1 1.3E+1 1.6E+1 1.9E+1 1.3E+1 1.6E+1 4.2E+0
Indoor 24h mean 1.7E+0 1.3E+0 2.0E+0 1.4E+0 1.6E+0 1.4E+0 1.2E+0 1.5E+0 2.5E‐1
Indoor 24 SD 1.3E+0 3.7E‐1 7.8E‐1 6.6E‐1 8.3E‐1 5.2E‐1 7.0E‐1 7.4E‐1 2.7E‐1
24h mean In/Out 0.06 0.05 0.04 0.05 0.05 0.05 0.05 0.05 0.01
Highest 8h Outdoor 4.7E+1 3.5E+1 7.9E+1 4.2E+1 4.8E+1 3.8E+1 3.5E+1 4.6E+1 1.4E+1
Highest 8h Indoor 2.5E+0 1.7E+0 2.9E+0 2.2E+0 2.6E+0 1.9E+0 1.9E+0 2.2E+0 4.0E‐1
Highest 8 h In/Out 0.05 0.05 0.04 0.05 0.05 0.05 0.06 0.05 0.01
Highest 1h Outdoor 7.6E+1 5.0E+1 9.8E+1 5.7E+1 6.2E+1 6.5E+1 5.2E+1 6.6E+1 1.5E+1
Highest 1 h Indoor2 2.5E+0 1.7E+0 2.9E+0 2.2E+0 2.6E+0 1.9E+0 1.9E+0 2.8E+0 5.5E‐1
Highest 1h In/Out 0.05 0.04 0.03 0.05 0.05 0.03 0.05 0.04 0.01
Time of highest 1h Outdoor
11/4/14 23:13
11/6/14 13:00
11/6/14 18:23
11/7/14 23:42
11/9/14 0:05
11/9/14 19:22
11/10/14 22:33
Corresponding highest 1h Indoor
11/4/14 23:38
11/6/14 17:00
11/6/14 19:00
11/8/14 0:08
11/9/14 1:00
11/9/14 23:22
11/10/14 23:10
1 Based on 24h periods starting / ending at 1pm. Day 1 starts at 11/4/2014 21:45, and has < 24h of data. 2Occurring within 4h of highest 1h outdoor concentration.
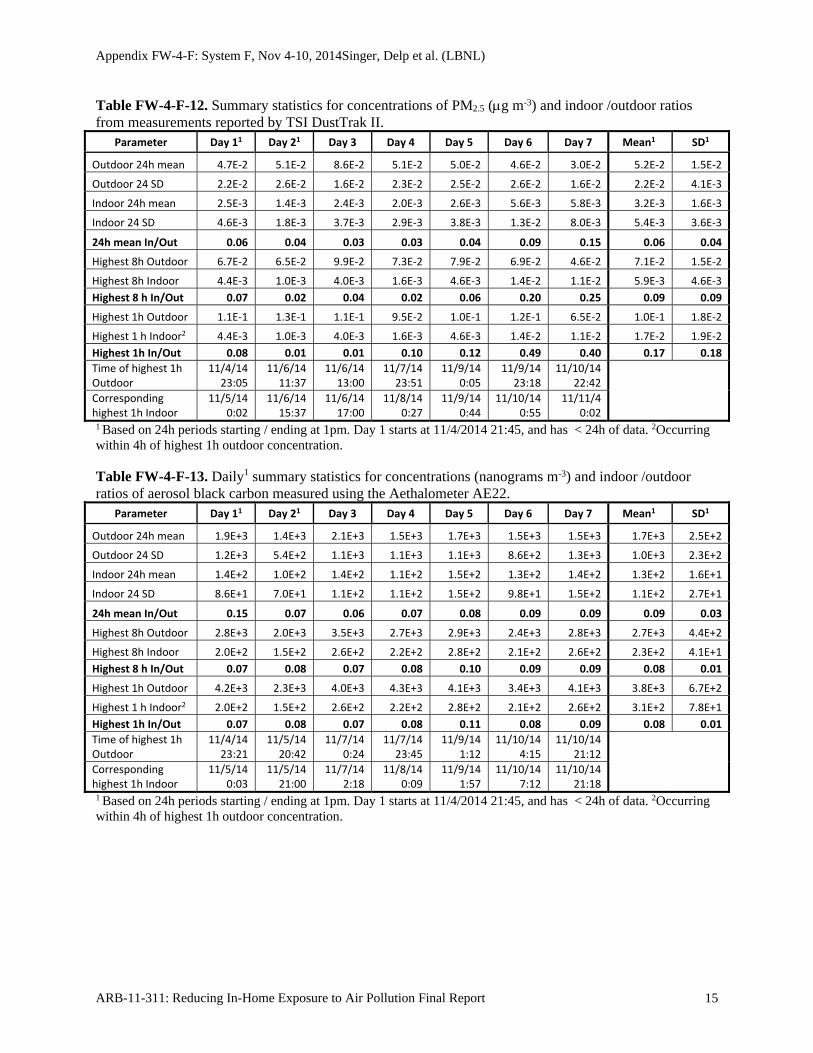
Appendix FW-4-F: System F, Nov 4-10, 2014Singer, Delp et al. (LBNL)
ARB-11-311: Reducing In-Home Exposure to Air Pollution Final Report 15
Table FW-4-F-12. Summary statistics for concentrations of PM2.5 (g m-3) and indoor /outdoor ratios from measurements reported by TSI DustTrak II.
Parameter Day 11 Day 21 Day 3 Day 4 Day 5 Day 6 Day 7 Mean1 SD1
Outdoor 24h mean 4.7E‐2 5.1E‐2 8.6E‐2 5.1E‐2 5.0E‐2 4.6E‐2 3.0E‐2 5.2E‐2 1.5E‐2
Outdoor 24 SD 2.2E‐2 2.6E‐2 1.6E‐2 2.3E‐2 2.5E‐2 2.6E‐2 1.6E‐2 2.2E‐2 4.1E‐3
Indoor 24h mean 2.5E‐3 1.4E‐3 2.4E‐3 2.0E‐3 2.6E‐3 5.6E‐3 5.8E‐3 3.2E‐3 1.6E‐3
Indoor 24 SD 4.6E‐3 1.8E‐3 3.7E‐3 2.9E‐3 3.8E‐3 1.3E‐2 8.0E‐3 5.4E‐3 3.6E‐3
24h mean In/Out 0.06 0.04 0.03 0.03 0.04 0.09 0.15 0.06 0.04
Highest 8h Outdoor 6.7E‐2 6.5E‐2 9.9E‐2 7.3E‐2 7.9E‐2 6.9E‐2 4.6E‐2 7.1E‐2 1.5E‐2
Highest 8h Indoor 4.4E‐3 1.0E‐3 4.0E‐3 1.6E‐3 4.6E‐3 1.4E‐2 1.1E‐2 5.9E‐3 4.6E‐3
Highest 8 h In/Out 0.07 0.02 0.04 0.02 0.06 0.20 0.25 0.09 0.09
Highest 1h Outdoor 1.1E‐1 1.3E‐1 1.1E‐1 9.5E‐2 1.0E‐1 1.2E‐1 6.5E‐2 1.0E‐1 1.8E‐2
Highest 1 h Indoor2 4.4E‐3 1.0E‐3 4.0E‐3 1.6E‐3 4.6E‐3 1.4E‐2 1.1E‐2 1.7E‐2 1.9E‐2
Highest 1h In/Out 0.08 0.01 0.01 0.10 0.12 0.49 0.40 0.17 0.18
Time of highest 1h Outdoor
11/4/14 23:05
11/6/14 11:37
11/6/14 13:00
11/7/14 23:51
11/9/14 0:05
11/9/14 23:18
11/10/14 22:42
Corresponding highest 1h Indoor
11/5/14 0:02
11/6/14 15:37
11/6/14 17:00
11/8/14 0:27
11/9/14 0:44
11/10/14 0:55
11/11/4 0:02
1 Based on 24h periods starting / ending at 1pm. Day 1 starts at 11/4/2014 21:45, and has < 24h of data. 2Occurring within 4h of highest 1h outdoor concentration. Table FW-4-F-13. Daily1 summary statistics for concentrations (nanograms m-3) and indoor /outdoor ratios of aerosol black carbon measured using the Aethalometer AE22.
Parameter Day 11 Day 21 Day 3 Day 4 Day 5 Day 6 Day 7 Mean1 SD1
Outdoor 24h mean 1.9E+3 1.4E+3 2.1E+3 1.5E+3 1.7E+3 1.5E+3 1.5E+3 1.7E+3 2.5E+2
Outdoor 24 SD 1.2E+3 5.4E+2 1.1E+3 1.1E+3 1.1E+3 8.6E+2 1.3E+3 1.0E+3 2.3E+2
Indoor 24h mean 1.4E+2 1.0E+2 1.4E+2 1.1E+2 1.5E+2 1.3E+2 1.4E+2 1.3E+2 1.6E+1
Indoor 24 SD 8.6E+1 7.0E+1 1.1E+2 1.1E+2 1.5E+2 9.8E+1 1.5E+2 1.1E+2 2.7E+1
24h mean In/Out 0.15 0.07 0.06 0.07 0.08 0.09 0.09 0.09 0.03
Highest 8h Outdoor 2.8E+3 2.0E+3 3.5E+3 2.7E+3 2.9E+3 2.4E+3 2.8E+3 2.7E+3 4.4E+2
Highest 8h Indoor 2.0E+2 1.5E+2 2.6E+2 2.2E+2 2.8E+2 2.1E+2 2.6E+2 2.3E+2 4.1E+1
Highest 8 h In/Out 0.07 0.08 0.07 0.08 0.10 0.09 0.09 0.08 0.01
Highest 1h Outdoor 4.2E+3 2.3E+3 4.0E+3 4.3E+3 4.1E+3 3.4E+3 4.1E+3 3.8E+3 6.7E+2
Highest 1 h Indoor2 2.0E+2 1.5E+2 2.6E+2 2.2E+2 2.8E+2 2.1E+2 2.6E+2 3.1E+2 7.8E+1
Highest 1h In/Out 0.07 0.08 0.07 0.08 0.11 0.08 0.09 0.08 0.01
Time of highest 1h Outdoor
11/4/14 23:21
11/5/14 20:42
11/7/14 0:24
11/7/14 23:45
11/9/14 1:12
11/10/14 4:15
11/10/14 21:12
Corresponding highest 1h Indoor
11/5/14 0:03
11/5/14 21:00
11/7/14 2:18
11/8/14 0:09
11/9/14 1:57
11/10/14 7:12
11/10/14 21:18
1 Based on 24h periods starting / ending at 1pm. Day 1 starts at 11/4/2014 21:45, and has < 24h of data. 2Occurring within 4h of highest 1h outdoor concentration.
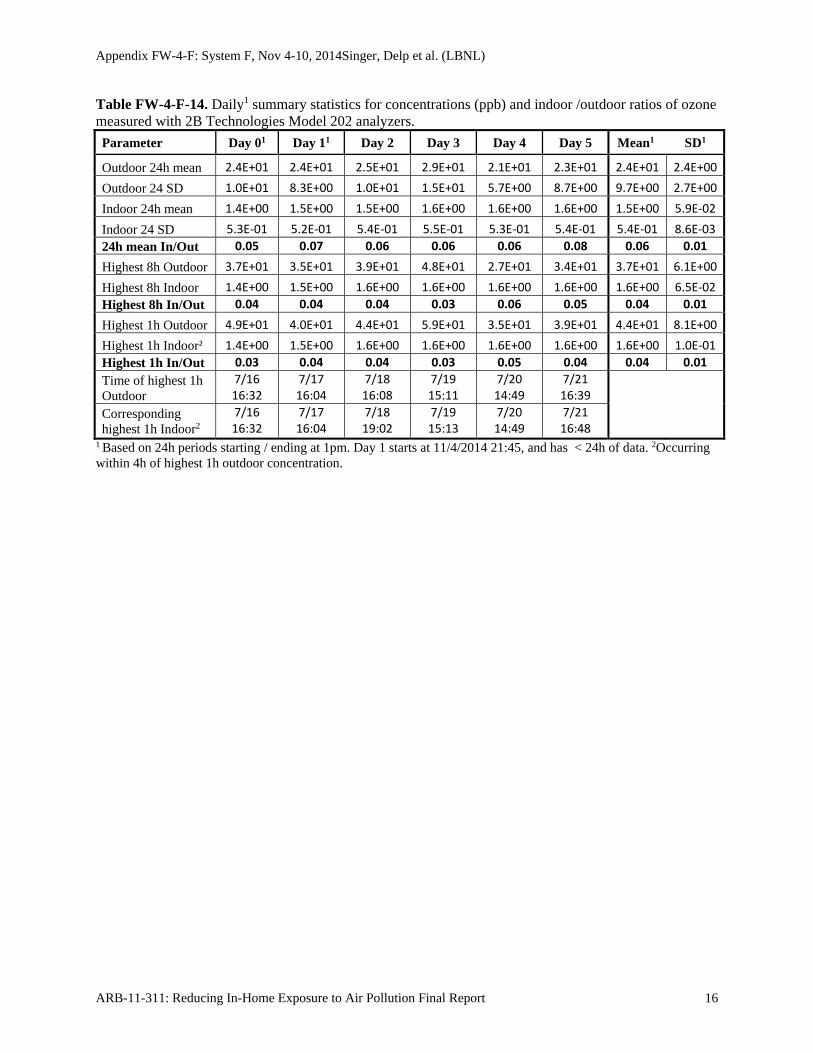
Appendix FW-4-F: System F, Nov 4-10, 2014Singer, Delp et al. (LBNL)
ARB-11-311: Reducing In-Home Exposure to Air Pollution Final Report 16
Table FW-4-F-14. Daily1 summary statistics for concentrations (ppb) and indoor /outdoor ratios of ozone measured with 2B Technologies Model 202 analyzers.
Parameter Day 01 Day 11 Day 2 Day 3 Day 4 Day 5 Mean1 SD1
Outdoor 24h mean 2.4E+01 2.4E+01 2.5E+01 2.9E+01 2.1E+01 2.3E+01 2.4E+01 2.4E+00
Outdoor 24 SD 1.0E+01 8.3E+00 1.0E+01 1.5E+01 5.7E+00 8.7E+00 9.7E+00 2.7E+00
Indoor 24h mean 1.4E+00 1.5E+00 1.5E+00 1.6E+00 1.6E+00 1.6E+00 1.5E+00 5.9E‐02
Indoor 24 SD 5.3E‐01 5.2E‐01 5.4E‐01 5.5E‐01 5.3E‐01 5.4E‐01 5.4E‐01 8.6E‐03
24h mean In/Out 0.05 0.07 0.06 0.06 0.06 0.08 0.06 0.01
Highest 8h Outdoor 3.7E+01 3.5E+01 3.9E+01 4.8E+01 2.7E+01 3.4E+01 3.7E+01 6.1E+00
Highest 8h Indoor 1.4E+00 1.5E+00 1.6E+00 1.6E+00 1.6E+00 1.6E+00 1.6E+00 6.5E‐02
Highest 8h In/Out 0.04 0.04 0.04 0.03 0.06 0.05 0.04 0.01
Highest 1h Outdoor 4.9E+01 4.0E+01 4.4E+01 5.9E+01 3.5E+01 3.9E+01 4.4E+01 8.1E+00
Highest 1h Indoor2 1.4E+00 1.5E+00 1.6E+00 1.6E+00 1.6E+00 1.6E+00 1.6E+00 1.0E‐01
Highest 1h In/Out 0.03 0.04 0.04 0.03 0.05 0.04 0.04 0.01
Time of highest 1h Outdoor
7/16 16:32
7/17 16:04
7/18 16:08
7/19 15:11
7/20 14:49
7/21 16:39
Corresponding highest 1h Indoor2
7/16 16:32
7/17 16:04
7/18 19:02
7/19 15:13
7/20 14:49
7/21 16:48
1 Based on 24h periods starting / ending at 1pm. Day 1 starts at 11/4/2014 21:45, and has < 24h of data. 2Occurring within 4h of highest 1h outdoor concentration.
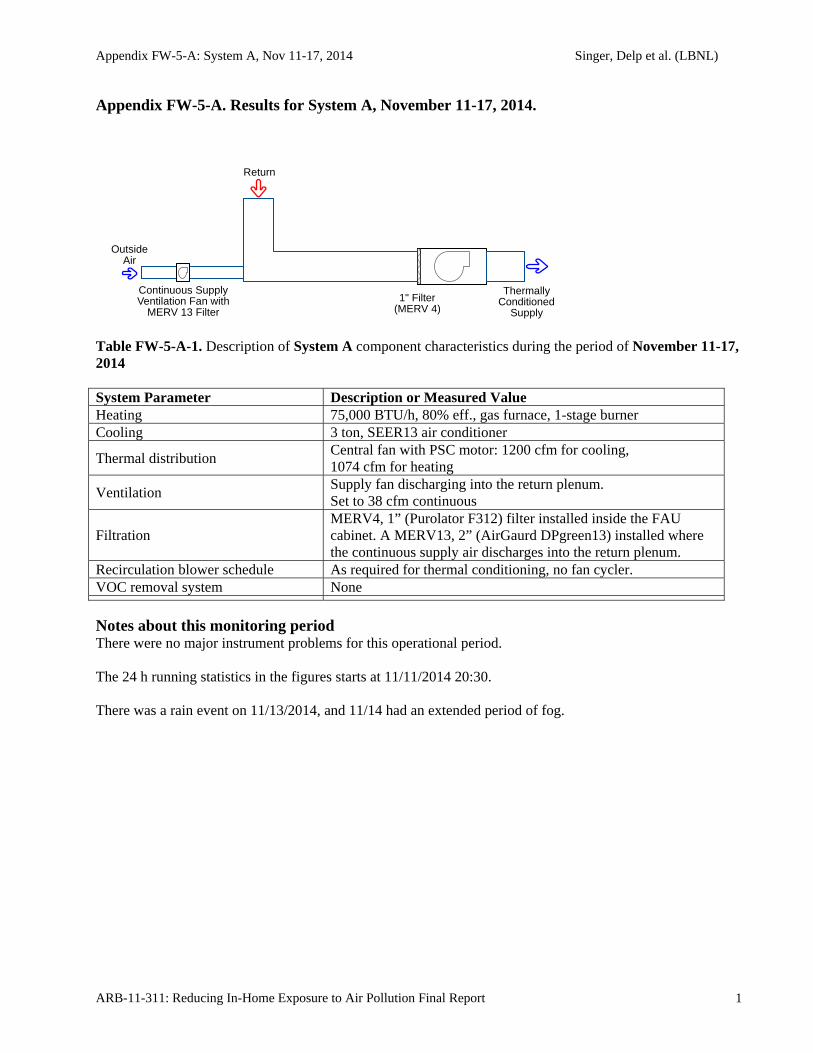
Appendix FW-5-A: System A, Nov 11-17, 2014 Singer, Delp et al. (LBNL)
ARB-11-311: Reducing In-Home Exposure to Air Pollution Final Report 1
Appendix FW-5-A. Results for System A, November 11-17, 2014.
Table FW-5-A-1. Description of System A component characteristics during the period of November 11-17, 2014 System Parameter Description or Measured Value Heating 75,000 BTU/h, 80% eff., gas furnace, 1-stage burner Cooling 3 ton, SEER13 air conditioner
Thermal distribution Central fan with PSC motor: 1200 cfm for cooling, 1074 cfm for heating
Ventilation Supply fan discharging into the return plenum. Set to 38 cfm continuous
Filtration MERV4, 1” (Purolator F312) filter installed inside the FAU cabinet. A MERV13, 2” (AirGaurd DPgreen13) installed where the continuous supply air discharges into the return plenum.
Recirculation blower schedule As required for thermal conditioning, no fan cycler. VOC removal system None
Notes about this monitoring period There were no major instrument problems for this operational period. The 24 h running statistics in the figures starts at 11/11/2014 20:30. There was a rain event on 11/13/2014, and 11/14 had an extended period of fog.
OutsideAir
ThermallyConditioned
Supply
Continuous SupplyVentilation Fan with
MERV 13 Filter1" Filter
(MERV 4)
Return
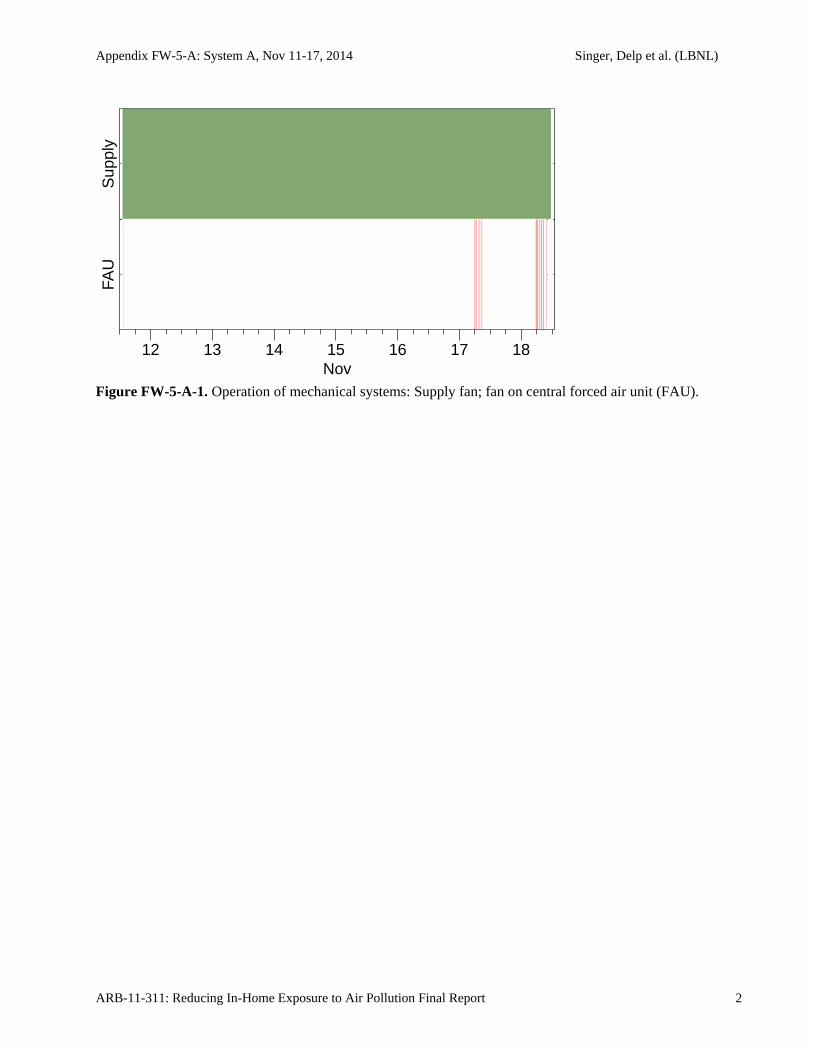
Appendix FW-5-A: System A, Nov 11-17, 2014 Singer, Delp et al. (LBNL)
ARB-11-311: Reducing In-Home Exposure to Air Pollution Final Report 2
Figure FW-5-A-1. Operation of mechanical systems: Supply fan; fan on central forced air unit (FAU).
FAU
Sup
ply
12 13 14 15 16 17 18Nov
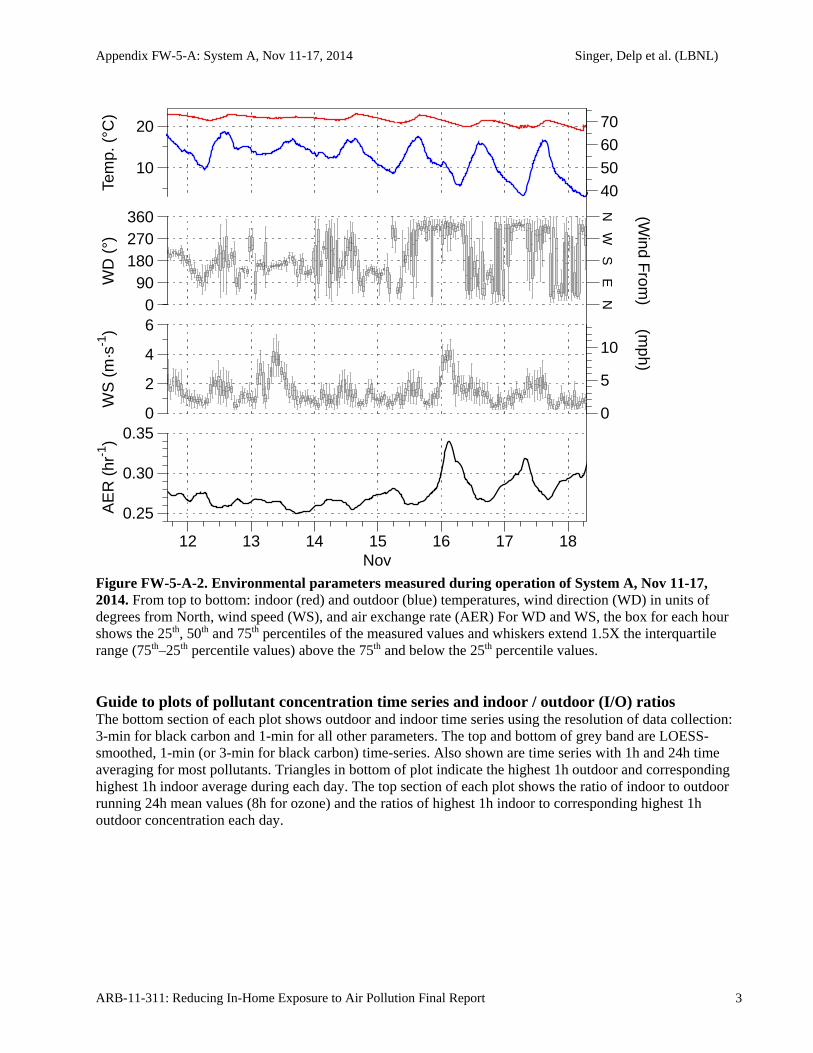
Appendix FW-5-A: System A, Nov 11-17, 2014 Singer, Delp et al. (LBNL)
ARB-11-311: Reducing In-Home Exposure to Air Pollution Final Report 3
Figure FW-5-A-2. Environmental parameters measured during operation of System A, Nov 11-17, 2014. From top to bottom: indoor (red) and outdoor (blue) temperatures, wind direction (WD) in units of degrees from North, wind speed (WS), and air exchange rate (AER) For WD and WS, the box for each hour shows the 25th, 50th and 75th percentiles of the measured values and whiskers extend 1.5X the interquartile range (75th–25th percentile values) above the 75th and below the 25th percentile values. Guide to plots of pollutant concentration time series and indoor / outdoor (I/O) ratios The bottom section of each plot shows outdoor and indoor time series using the resolution of data collection: 3-min for black carbon and 1-min for all other parameters. The top and bottom of grey band are LOESS-smoothed, 1-min (or 3-min for black carbon) time-series. Also shown are time series with 1h and 24h time averaging for most pollutants. Triangles in bottom of plot indicate the highest 1h outdoor and corresponding highest 1h indoor average during each day. The top section of each plot shows the ratio of indoor to outdoor running 24h mean values (8h for ozone) and the ratios of highest 1h indoor to corresponding highest 1h outdoor concentration each day.
0
5
10
40506070
NE
SW
N
(mph)
(Wind F
rom)
AE
R (
hr-1
)
0.25
0.30
0.35
WS
(m
·s-1
)
0
2
4
6
WD
(°)
090
180270360
Tem
p. (
°C)
10
20
12 13 14 15 16 17 18Nov
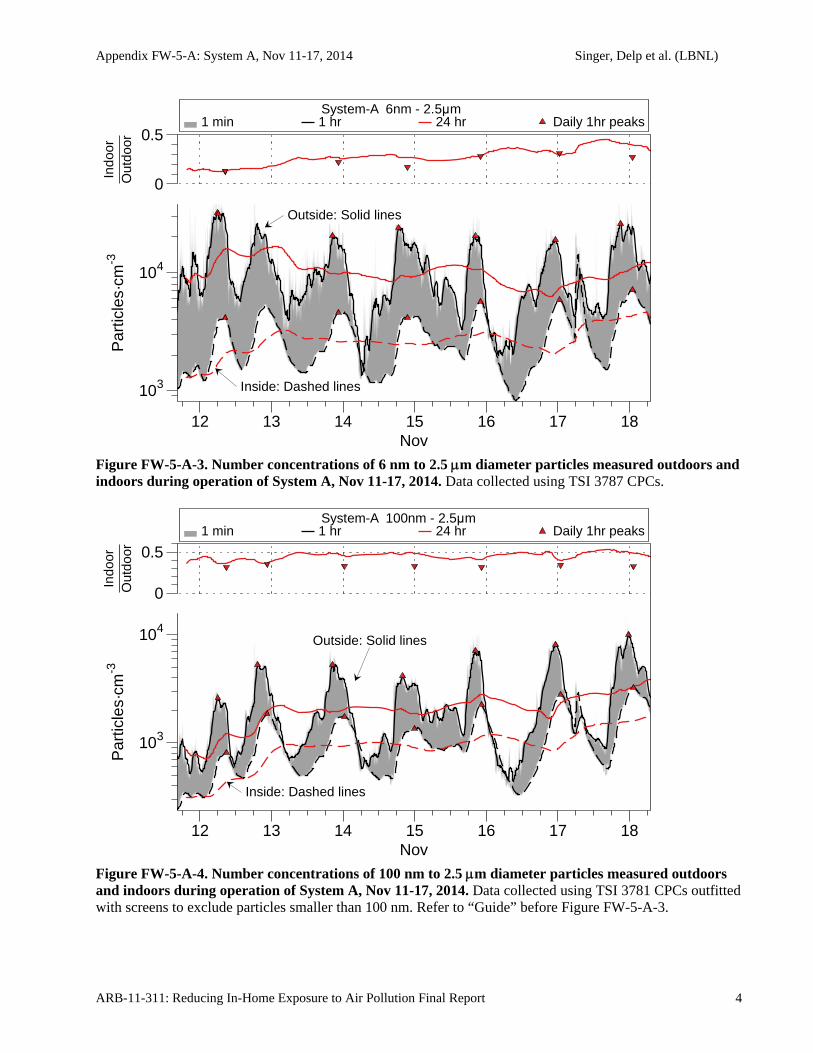
Appendix FW-5-A: System A, Nov 11-17, 2014 Singer, Delp et al. (LBNL)
ARB-11-311: Reducing In-Home Exposure to Air Pollution Final Report 4
Figure FW-5-A-3. Number concentrations of 6 nm to 2.5 m diameter particles measured outdoors and indoors during operation of System A, Nov 11-17, 2014. Data collected using TSI 3787 CPCs.
Figure FW-5-A-4. Number concentrations of 100 nm to 2.5 m diameter particles measured outdoors and indoors during operation of System A, Nov 11-17, 2014. Data collected using TSI 3781 CPCs outfitted with screens to exclude particles smaller than 100 nm. Refer to “Guide” before Figure FW-5-A-3.
1 min 1 hr 24 hr Daily 1hr peaks System-A 6nm - 2.5μm
Outside: Solid lines
Inside: Dashed lines
Par
ticle
s·cm
-3
103
104
Indo
orO
utdo
or
0
0.5
12 13 14 15 16 17 18Nov
1 min 1 hr 24 hr Daily 1hr peaks System-A 100nm - 2.5μm
Outside: Solid lines
Inside: Dashed lines
Par
ticle
s·cm
-3
103
104
Indo
orO
utdo
or
0
0.5
12 13 14 15 16 17 18Nov
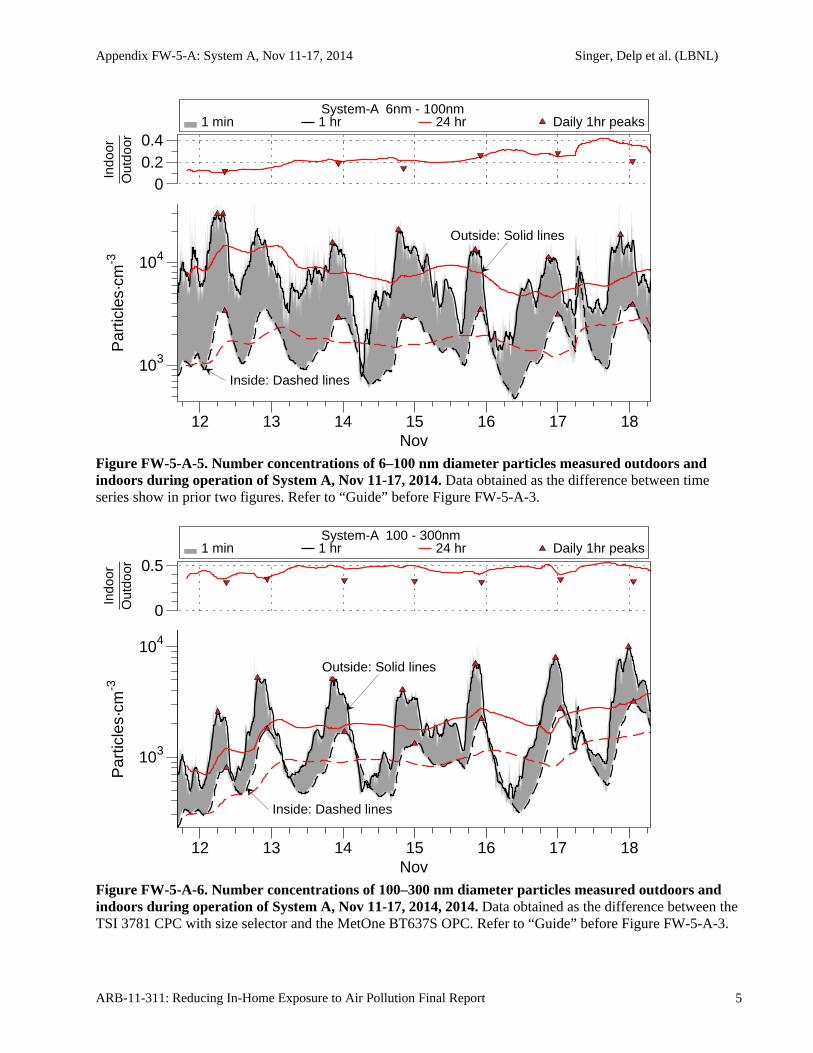
Appendix FW-5-A: System A, Nov 11-17, 2014 Singer, Delp et al. (LBNL)
ARB-11-311: Reducing In-Home Exposure to Air Pollution Final Report 5
Figure FW-5-A-5. Number concentrations of 6–100 nm diameter particles measured outdoors and indoors during operation of System A, Nov 11-17, 2014. Data obtained as the difference between time series show in prior two figures. Refer to “Guide” before Figure FW-5-A-3.
Figure FW-5-A-6. Number concentrations of 100–300 nm diameter particles measured outdoors and indoors during operation of System A, Nov 11-17, 2014, 2014. Data obtained as the difference between the TSI 3781 CPC with size selector and the MetOne BT637S OPC. Refer to “Guide” before Figure FW-5-A-3.
1 min 1 hr 24 hr Daily 1hr peaks System-A 6nm - 100nm
Outside: Solid lines
Inside: Dashed lines
Par
ticle
s·cm
-3
103
104
Indo
orO
utdo
or
00.20.4
12 13 14 15 16 17 18Nov
1 min 1 hr 24 hr Daily 1hr peaks System-A 100 - 300nm
Outside: Solid lines
Inside: Dashed lines
103
104
Par
ticle
s·cm
-3In
door
Out
door
0
0.5
12 13 14 15 16 17 18Nov
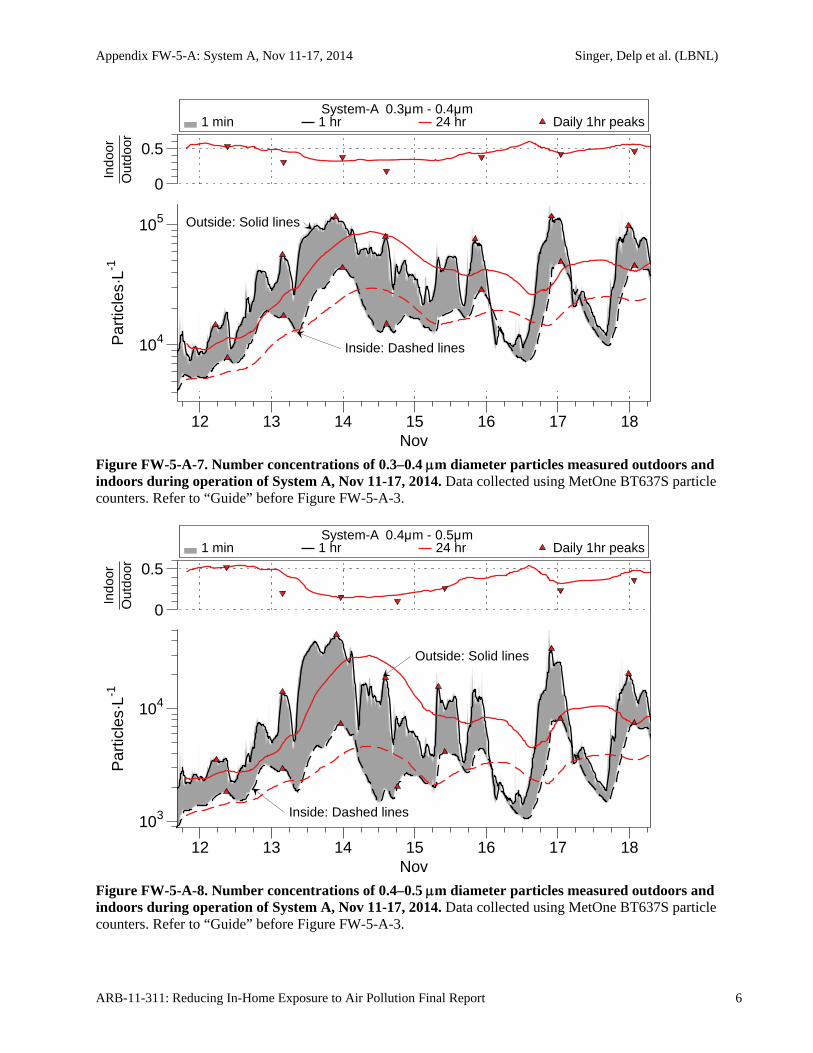
Appendix FW-5-A: System A, Nov 11-17, 2014 Singer, Delp et al. (LBNL)
ARB-11-311: Reducing In-Home Exposure to Air Pollution Final Report 6
Figure FW-5-A-7. Number concentrations of 0.3–0.4 m diameter particles measured outdoors and indoors during operation of System A, Nov 11-17, 2014. Data collected using MetOne BT637S particle counters. Refer to “Guide” before Figure FW-5-A-3.
Figure FW-5-A-8. Number concentrations of 0.4–0.5 m diameter particles measured outdoors and indoors during operation of System A, Nov 11-17, 2014. Data collected using MetOne BT637S particle counters. Refer to “Guide” before Figure FW-5-A-3.
1 min 1 hr 24 hr Daily 1hr peaks System-A 0.3μm - 0.4μm
Outside: Solid lines
Inside: Dashed linesPar
ticle
s·L-1
104
105
Indo
orO
utdo
or
0
0.5
12 13 14 15 16 17 18Nov
1 min 1 hr 24 hr Daily 1hr peaks System-A 0.4μm - 0.5μm
Outside: Solid lines
Inside: Dashed lines
Par
ticle
s·L-1
103
104
Indo
orO
utdo
or
0
0.5
12 13 14 15 16 17 18Nov
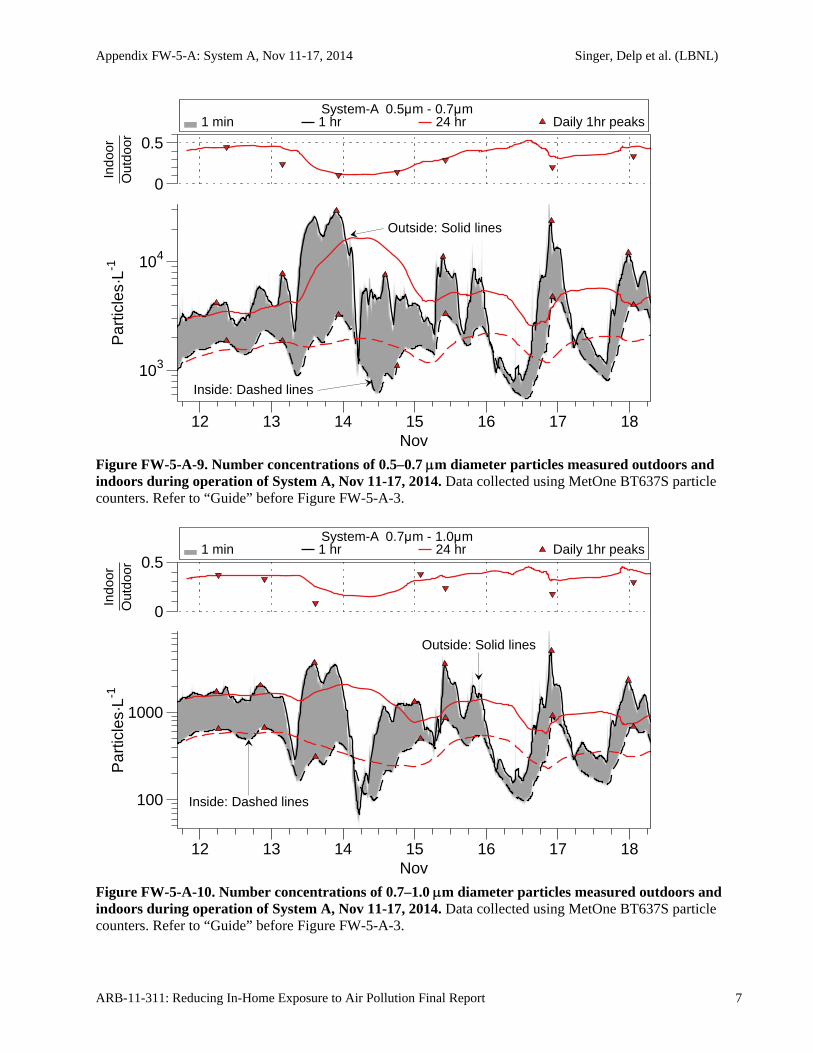
Appendix FW-5-A: System A, Nov 11-17, 2014 Singer, Delp et al. (LBNL)
ARB-11-311: Reducing In-Home Exposure to Air Pollution Final Report 7
Figure FW-5-A-9. Number concentrations of 0.5–0.7 m diameter particles measured outdoors and indoors during operation of System A, Nov 11-17, 2014. Data collected using MetOne BT637S particle counters. Refer to “Guide” before Figure FW-5-A-3.
Figure FW-5-A-10. Number concentrations of 0.7–1.0 m diameter particles measured outdoors and indoors during operation of System A, Nov 11-17, 2014. Data collected using MetOne BT637S particle counters. Refer to “Guide” before Figure FW-5-A-3.
1 min 1 hr 24 hr Daily 1hr peaks System-A 0.5μm - 0.7μm
Outside: Solid lines
Inside: Dashed lines
Par
ticle
s·L-1
103
104
Indo
orO
utdo
or
0
0.5
12 13 14 15 16 17 18Nov
1 min 1 hr 24 hr Daily 1hr peaks System-A 0.7μm - 1.0μm
Outside: Solid lines
Inside: Dashed lines
Par
ticle
s·L-1
100
1000
Indo
orO
utdo
or
0
0.5
12 13 14 15 16 17 18Nov
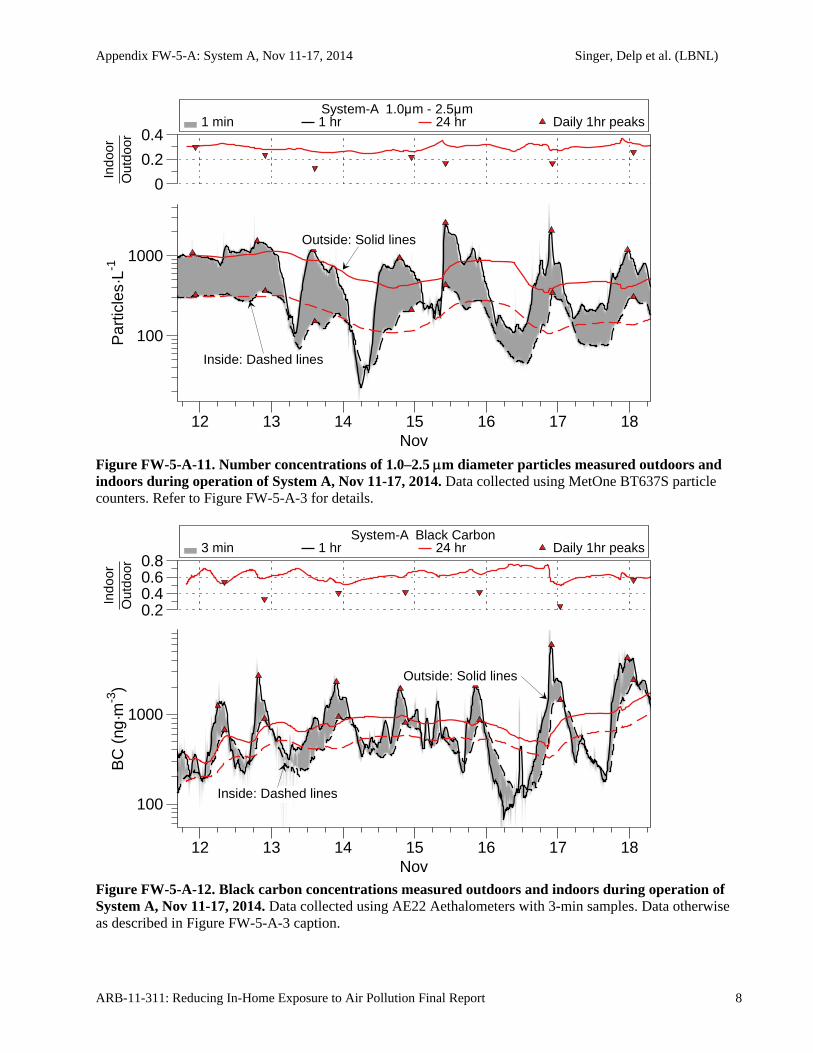
Appendix FW-5-A: System A, Nov 11-17, 2014 Singer, Delp et al. (LBNL)
ARB-11-311: Reducing In-Home Exposure to Air Pollution Final Report 8
Figure FW-5-A-11. Number concentrations of 1.0–2.5 m diameter particles measured outdoors and indoors during operation of System A, Nov 11-17, 2014. Data collected using MetOne BT637S particle counters. Refer to Figure FW-5-A-3 for details.
Figure FW-5-A-12. Black carbon concentrations measured outdoors and indoors during operation of System A, Nov 11-17, 2014. Data collected using AE22 Aethalometers with 3-min samples. Data otherwise as described in Figure FW-5-A-3 caption.
1 min 1 hr 24 hr Daily 1hr peaks System-A 1.0μm - 2.5μm
Outside: Solid lines
Inside: Dashed lines
Par
ticle
s·L-1
100
1000
Indo
orO
utdo
or
0
0.2
0.4
12 13 14 15 16 17 18Nov
3 min 1 hr 24 hr Daily 1hr peaks System-A Black Carbon
Outside: Solid lines
Inside: Dashed lines
BC
(ng
·m-3
)
100
1000
Indo
orO
utdo
or
0.20.40.60.8
12 13 14 15 16 17 18Nov
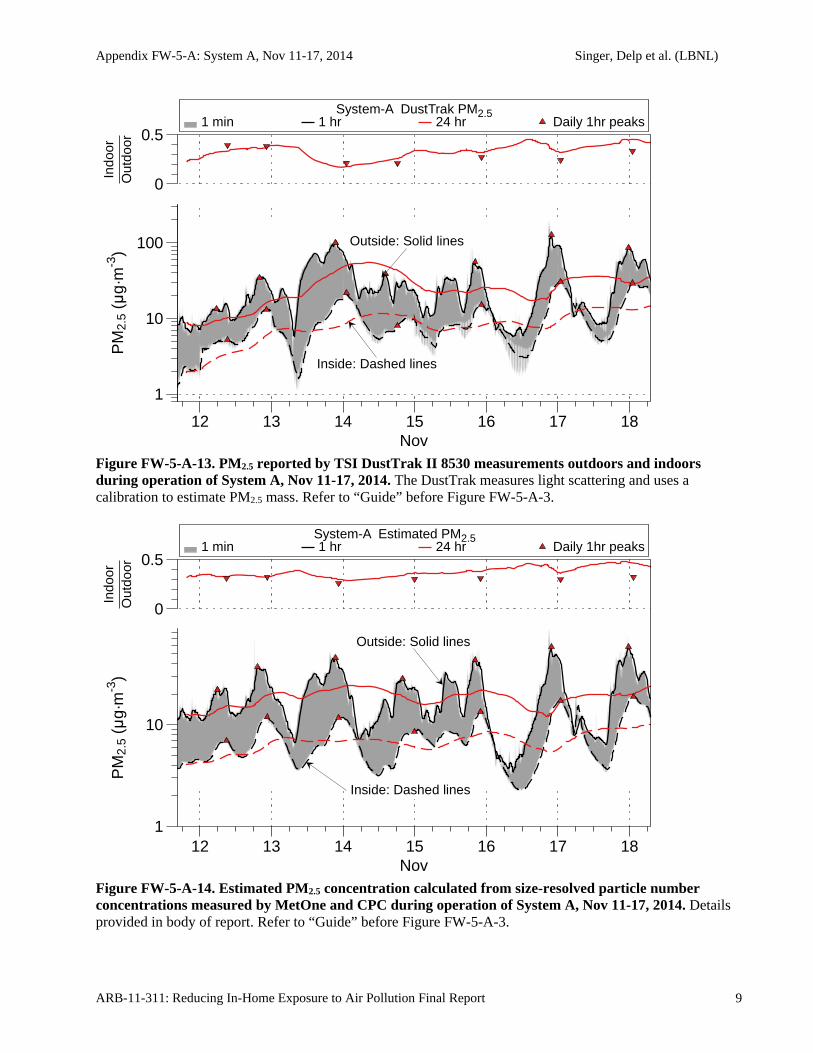
Appendix FW-5-A: System A, Nov 11-17, 2014 Singer, Delp et al. (LBNL)
ARB-11-311: Reducing In-Home Exposure to Air Pollution Final Report 9
Figure FW-5-A-13. PM2.5 reported by TSI DustTrak II 8530 measurements outdoors and indoors during operation of System A, Nov 11-17, 2014. The DustTrak measures light scattering and uses a calibration to estimate PM2.5 mass. Refer to “Guide” before Figure FW-5-A-3.
Figure FW-5-A-14. Estimated PM2.5 concentration calculated from size-resolved particle number concentrations measured by MetOne and CPC during operation of System A, Nov 11-17, 2014. Details provided in body of report. Refer to “Guide” before Figure FW-5-A-3.
1 min 1 hr 24 hr Daily 1hr peaks System-A DustTrak PM2.5
1
10
100 Outside: Solid lines
Inside: Dashed lines
PM
2.5
(μg·
m-3
)In
door
Out
door
0
0.5
12 13 14 15 16 17 18Nov
1 min 1 hr 24 hr Daily 1hr peaks System-A Estimated PM2.5
Outside: Solid lines
Inside: Dashed lines
PM
2.5
(μg·
m-3
)
1
10
Indo
orO
utdo
or
0
0.5
12 13 14 15 16 17 18Nov
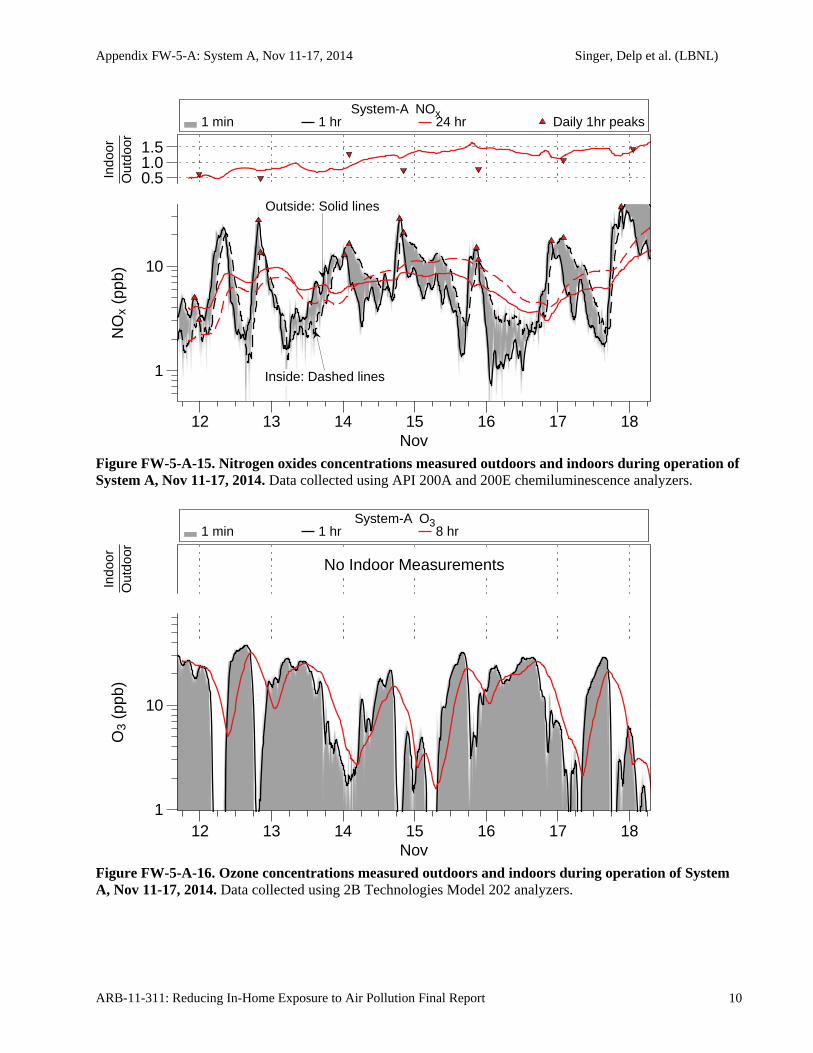
Appendix FW-5-A: System A, Nov 11-17, 2014 Singer, Delp et al. (LBNL)
ARB-11-311: Reducing In-Home Exposure to Air Pollution Final Report 10
Figure FW-5-A-15. Nitrogen oxides concentrations measured outdoors and indoors during operation of System A, Nov 11-17, 2014. Data collected using API 200A and 200E chemiluminescence analyzers.
Figure FW-5-A-16. Ozone concentrations measured outdoors and indoors during operation of System A, Nov 11-17, 2014. Data collected using 2B Technologies Model 202 analyzers.
1 min 1 hr 24 hr Daily 1hr peaks System-A NOx
Outside: Solid lines
Inside: Dashed lines
NO
x (p
pb)
1
10
Indo
orO
utdo
or
0.51.01.5
12 13 14 15 16 17 18Nov
1 min 1 hr 8 hr System-A O3
No Indoor Measurements
O3
(ppb
)
1
10
Indo
orO
utdo
or
12 13 14 15 16 17 18Nov

Appendix FW-5-A: System A, Nov 11-17, 2014 Singer, Delp et al. (LBNL)
ARB-11-311: Reducing In-Home Exposure to Air Pollution Final Report 11
Table FW-5-A-2. Daily1 summary statistics for number concentration (particles cm-3) and indoor /outdoor ratios for particles with aerodynamic diameters 6 nm to 2.5 micron measured using the TSI 3787 CPC.
Parameter Day 11 Day 21 Day 3 Day 4 Day 5 Day 6 Day 7 Mean1 SD1
Outdoor 24h mean 1.4E+4 1.3E+4 9.6E+3 1.1E+4 7.8E+3 8.3E+3 1.2E+4 1.1E+4 2.2E+3
Outdoor 24 SD 9.1E+3 8.6E+3 5.4E+3 6.7E+3 5.8E+3 5.0E+3 7.6E+3 6.9E+3 1.5E+3
Indoor 24h mean 1.7E+3 3.2E+3 2.6E+3 2.5E+3 2.8E+3 2.8E+3 4.5E+3 2.9E+3 7.8E+2
Indoor 24 SD 7.2E+2 1.2E+3 1.1E+3 1.2E+3 1.2E+3 2.4E+3 2.7E+3 1.5E+3 6.8E+2
24h mean In/Out 0.14 0.16 0.26 0.27 0.28 0.33 0.41 0.27 0.09
Highest 8h Outdoor 1.6E+4 2.4E+4 1.5E+4 1.9E+4 1.3E+4 1.4E+4 2.1E+4 1.8E+4 3.5E+3
Highest 8h Indoor 3.2E+3 3.3E+3 4.1E+3 4.0E+3 4.2E+3 4.7E+3 6.1E+3 4.2E+3 9.1E+2
Highest 8 h In/Out 0.19 0.14 0.26 0.22 0.31 0.33 0.29 0.25 0.06
Highest 1h Outdoor 3.2E+4 3.2E+4 2.1E+4 2.4E+4 2.0E+4 1.9E+4 2.6E+4 2.5E+4 5.0E+3
Highest 1 h Indoor2 3.2E+3 3.3E+3 4.1E+3 4.0E+3 4.2E+3 4.7E+3 6.1E+3 5.1E+3 1.1E+3
Highest 1h In/Out 0.13 0.13 0.22 0.17 0.28 0.31 0.27 0.22 0.07
Time of highest 1h Outdoor
11/12/14 5:47
11/12/14 6:02
11/13/14 20:23
11/14/14 18:34
11/15/14 20:14
11/16/14 23:08
11/17/14 21:02
Corresponding highest 1h Indoor
11/12/14 8:23
11/12/14 8:23
11/13/14 22:21
11/14/14 21:30
11/15/14 22:01
11/17/14 0:30
11/18/14 1:02
1 Based on 24h periods starting / ending at 6am. Day 1 starts at 11/11/2014 20:30, and has < 24h of data. 2Occurring within 4h of highest 1h outdoor concentration.
Table FW-5-A-3. Daily1 summary statistics for number concentration (particles cm-3) and indoor /outdoor ratios for particles with aerodynamic diameters 100 nm to 2.5 micron measured using the TSI 3781 CPC with size selector.
Parameter Day 11 Day 21 Day 3 Day 4 Day 5 Day 6 Day 7 Mean1 SD1
Outdoor 24h mean 1.0E+3 2.1E+3 2.1E+3 1.9E+3 2.4E+3 2.6E+3 3.8E+3 2.3E+3 7.8E+2
Outdoor 24 SD 6.2E+2 1.4E+3 1.4E+3 1.2E+3 1.9E+3 2.4E+3 2.8E+3 1.7E+3 6.9E+2
Indoor 24h mean 3.6E+2 9.6E+2 9.9E+2 8.5E+2 1.1E+3 1.2E+3 1.7E+3 1.0E+3 3.8E+2
Indoor 24 SD 1.0E+2 4.3E+2 4.5E+2 3.4E+2 4.7E+2 8.8E+2 9.3E+2 5.1E+2 2.7E+2
24h mean In/Out 0.39 0.40 0.47 0.47 0.43 0.46 0.50 0.45 0.04
Highest 8h Outdoor 1.2E+3 3.7E+3 3.9E+3 3.5E+3 4.3E+3 5.5E+3 7.1E+3 4.2E+3 1.7E+3
Highest 8h Indoor 6.2E+2 1.5E+3 1.6E+3 1.3E+3 1.7E+3 2.3E+3 2.8E+3 1.7E+3 6.5E+2
Highest 8 h In/Out 0.52 0.41 0.40 0.36 0.39 0.41 0.39 0.41 0.05
Highest 1h Outdoor 2.6E+3 5.3E+3 5.2E+3 4.1E+3 7.1E+3 8.1E+3 1.0E+4 6.1E+3 2.3E+3
Highest 1 h Indoor2 6.2E+2 1.5E+3 1.6E+3 1.3E+3 1.7E+3 2.3E+3 2.8E+3 2.0E+3 7.7E+2
Highest 1h In/Out 0.31 0.35 0.33 0.33 0.32 0.34 0.32 0.33 0.01
Time of highest 1h Outdoor
11/12/14 6:00
11/12/14 19:23
11/13/14 20:24
11/14/14 20:00
11/15/14 20:15
11/16/14 23:16
11/17/14 23:42
Corresponding highest 1h Indoor
11/12/14 8:46
11/12/14 22:30
11/14/14 0:20
11/15/14 0:00
11/15/14 22:24
11/17/14 0:54
11/18/14 1:14
1 Based on 24h periods starting / ending at 6am. Day 1 starts at 11/11/2014 20:30, and has < 24h of data. 2Occurring within 4h of highest 1h outdoor concentration.

Appendix FW-5-A: System A, Nov 11-17, 2014 Singer, Delp et al. (LBNL)
ARB-11-311: Reducing In-Home Exposure to Air Pollution Final Report 12
Table FW-5-A-4. Daily1 summary statistics for number concentration (particles cm-3) and indoor /outdoor ratios for particles with aerodynamic diameters 6–100 nm based on difference between concentrations measured using the TSI 3787 CPC and the TSI 3781 CPC with size selector.
Parameter Day 11 Day 21 Day 3 Day 4 Day 5 Day 6 Day 7 Mean1 SD1
Outdoor 24h mean 1.3E+4 1.1E+4 7.5E+3 8.7E+3 5.3E+3 5.6E+3 8.4E+3 8.5E+3 2.5E+3
Outdoor 24 SD 8.6E+3 7.7E+3 4.3E+3 5.6E+3 3.9E+3 3.0E+3 5.3E+3 5.5E+3 1.9E+3
Indoor 24h mean 1.3E+3 2.2E+3 1.6E+3 1.7E+3 1.7E+3 1.6E+3 2.8E+3 1.8E+3 4.4E+2
Indoor 24 SD 6.2E+2 8.5E+2 6.8E+2 9.1E+2 7.5E+2 1.8E+3 2.0E+3 1.1E+3 5.3E+2
24h mean In/Out 0.12 0.14 0.21 0.22 0.24 0.28 0.38 0.23 0.08
Highest 8h Outdoor 1.5E+4 2.2E+4 1.2E+4 1.5E+4 1.0E+4 8.9E+3 1.5E+4 1.4E+4 4.0E+3
Highest 8h Indoor 2.6E+3 2.6E+3 2.5E+3 2.8E+3 2.4E+3 2.5E+3 3.4E+3 2.7E+3 3.2E+2
Highest 8 h In/Out 0.17 0.12 0.22 0.19 0.23 0.28 0.24 0.21 0.05
Highest 1h Outdoor 2.9E+4 2.9E+4 1.5E+4 2.1E+4 1.3E+4 1.1E+4 1.9E+4 2.0E+4 6.8E+3
Highest 1 h Indoor2 2.6E+3 2.6E+3 2.5E+3 2.8E+3 2.4E+3 2.5E+3 3.4E+3 3.3E+3 3.2E+2
Highest 1h In/Out 0.11 0.11 0.19 0.14 0.26 0.28 0.21 0.19 0.06
Time of highest 1h Outdoor
11/12/14 5:47
11/12/14 7:46
11/13/14 20:22
11/14/14 18:32
11/15/14 20:11
11/16/14 20:52
11/17/14 21:03
Corresponding highest 1h Indoor
11/12/14 8:21
11/12/14 8:21
11/13/14 22:21
11/14/14 20:15
11/15/14 22:01
11/16/14 23:58
11/18/14 1:00
1 Based on 24h periods starting / ending at 6am. Day 1 starts at 11/11/2014 20:30, and has < 24h of data. 2Occurring within 4h of highest 1h outdoor concentration.
Table FW-5-A-5. Daily1 summary statistics for number concentration (particles cm-3) and indoor /outdoor ratios for particles with aerodynamic diameters 100–300 nm based on difference between concentrations measured using the TSI 3781 CPC with size selector and the MetOne BT637S OPC.
Parameter Day 11 Day 21 Day 3 Day 4 Day 5 Day 6 Day 7 Mean1 SD1
Outdoor 24h mean 9.9E+5 2.0E+6 2.0E+6 1.9E+6 2.4E+6 2.6E+6 3.7E+6 2.2E+6 7.7E+5
Outdoor 24 SD 6.1E+5 1.4E+6 1.4E+6 1.2E+6 1.9E+6 2.3E+6 2.8E+6 1.7E+6 6.8E+5
Indoor 24h mean 3.5E+5 9.5E+5 9.5E+5 8.3E+5 1.1E+6 1.2E+6 1.7E+6 1.0E+6 3.8E+5
Indoor 24 SD 1.0E+5 4.3E+5 4.4E+5 3.4E+5 4.6E+5 8.6E+5 9.1E+5 5.1E+5 2.7E+5
24h mean In/Out 0.39 0.39 0.48 0.48 0.43 0.46 0.50 0.45 0.04
Highest 8h Outdoor 1.2E+6 3.6E+6 3.7E+6 3.4E+6 4.3E+6 5.4E+6 7.0E+6 4.1E+6 1.7E+6
Highest 8h Indoor 6.0E+5 1.5E+6 1.5E+6 1.2E+6 1.7E+6 2.2E+6 2.8E+6 1.6E+6 6.4E+5
Highest 8 h In/Out 0.52 0.41 0.41 0.36 0.39 0.41 0.39 0.41 0.05
Highest 1h Outdoor 2.6E+6 5.2E+6 5.1E+6 4.1E+6 7.0E+6 8.0E+6 9.9E+6 6.0E+6 2.3E+6
Highest 1 h Indoor2 6.0E+5 1.5E+6 1.5E+6 1.2E+6 1.7E+6 2.2E+6 2.8E+6 2.0E+6 7.5E+5
Highest 1h In/Out 0.31 0.35 0.33 0.33 0.31 0.34 0.32 0.33 0.01
Time of highest 1h Outdoor
11/12/14 6:00
11/12/14 19:23
11/13/14 20:24
11/14/14 20:00
11/15/14 20:15
11/16/14 23:16
11/17/14 23:42
Corresponding highest 1h Indoor
11/12/14 8:46
11/12/14 22:30
11/14/14 0:20
11/15/14 0:00
11/15/14 22:24
11/17/14 0:54
11/18/14 1:14
1 Based on 24h periods starting / ending at 6am. Day 1 starts at 11/11/2014 20:30, and has < 24h of data. 2Occurring within 4h of highest 1h outdoor concentration.
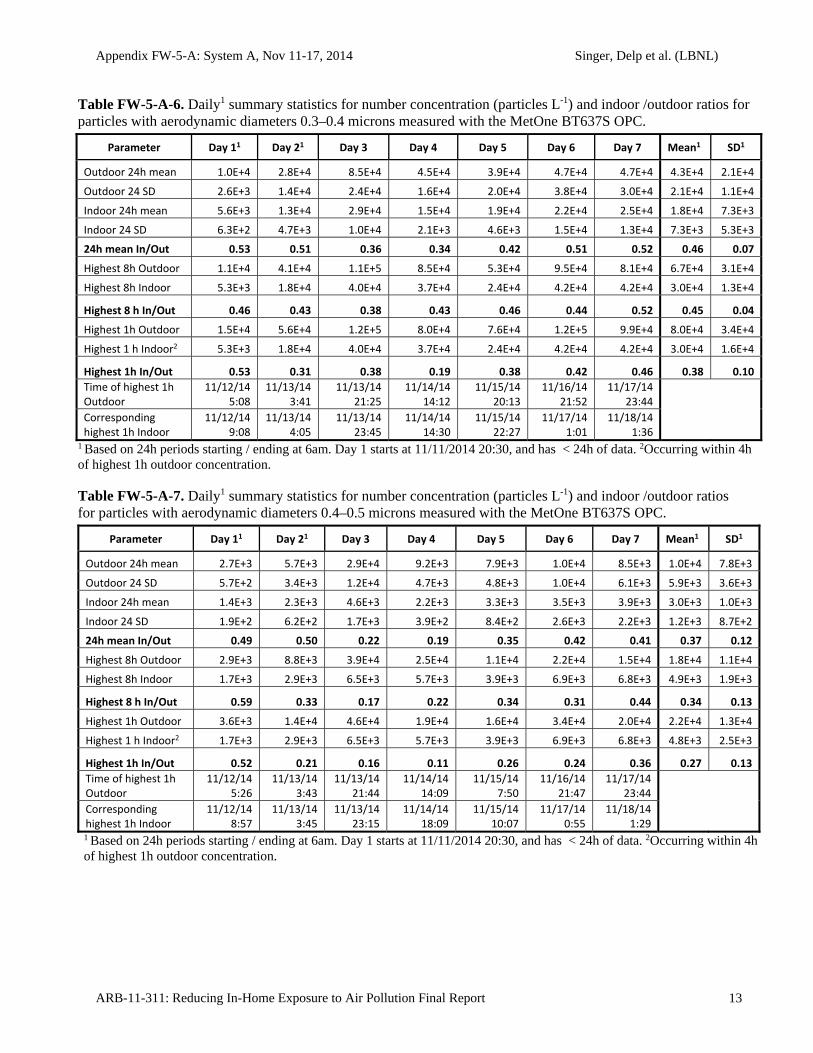
Appendix FW-5-A: System A, Nov 11-17, 2014 Singer, Delp et al. (LBNL)
ARB-11-311: Reducing In-Home Exposure to Air Pollution Final Report 13
Table FW-5-A-6. Daily1 summary statistics for number concentration (particles L-1) and indoor /outdoor ratios for particles with aerodynamic diameters 0.3–0.4 microns measured with the MetOne BT637S OPC.
Parameter Day 11 Day 21 Day 3 Day 4 Day 5 Day 6 Day 7 Mean1 SD1
Outdoor 24h mean 1.0E+4 2.8E+4 8.5E+4 4.5E+4 3.9E+4 4.7E+4 4.7E+4 4.3E+4 2.1E+4
Outdoor 24 SD 2.6E+3 1.4E+4 2.4E+4 1.6E+4 2.0E+4 3.8E+4 3.0E+4 2.1E+4 1.1E+4
Indoor 24h mean 5.6E+3 1.3E+4 2.9E+4 1.5E+4 1.9E+4 2.2E+4 2.5E+4 1.8E+4 7.3E+3
Indoor 24 SD 6.3E+2 4.7E+3 1.0E+4 2.1E+3 4.6E+3 1.5E+4 1.3E+4 7.3E+3 5.3E+3
24h mean In/Out 0.53 0.51 0.36 0.34 0.42 0.51 0.52 0.46 0.07
Highest 8h Outdoor 1.1E+4 4.1E+4 1.1E+5 8.5E+4 5.3E+4 9.5E+4 8.1E+4 6.7E+4 3.1E+4
Highest 8h Indoor 5.3E+3 1.8E+4 4.0E+4 3.7E+4 2.4E+4 4.2E+4 4.2E+4 3.0E+4 1.3E+4
Highest 8 h In/Out 0.46 0.43 0.38 0.43 0.46 0.44 0.52 0.45 0.04
Highest 1h Outdoor 1.5E+4 5.6E+4 1.2E+5 8.0E+4 7.6E+4 1.2E+5 9.9E+4 8.0E+4 3.4E+4
Highest 1 h Indoor2 5.3E+3 1.8E+4 4.0E+4 3.7E+4 2.4E+4 4.2E+4 4.2E+4 3.0E+4 1.6E+4
Highest 1h In/Out 0.53 0.31 0.38 0.19 0.38 0.42 0.46 0.38 0.10
Time of highest 1h Outdoor
11/12/14 5:08
11/13/14 3:41
11/13/14 21:25
11/14/14 14:12
11/15/14 20:13
11/16/14 21:52
11/17/14 23:44
Corresponding highest 1h Indoor
11/12/14 9:08
11/13/14 4:05
11/13/14 23:45
11/14/14 14:30
11/15/14 22:27
11/17/14 1:01
11/18/14 1:36
1 Based on 24h periods starting / ending at 6am. Day 1 starts at 11/11/2014 20:30, and has < 24h of data. 2Occurring within 4h of highest 1h outdoor concentration.
Table FW-5-A-7. Daily1 summary statistics for number concentration (particles L-1) and indoor /outdoor ratios for particles with aerodynamic diameters 0.4–0.5 microns measured with the MetOne BT637S OPC.
Parameter Day 11 Day 21 Day 3 Day 4 Day 5 Day 6 Day 7 Mean1 SD1
Outdoor 24h mean 2.7E+3 5.7E+3 2.9E+4 9.2E+3 7.9E+3 1.0E+4 8.5E+3 1.0E+4 7.8E+3
Outdoor 24 SD 5.7E+2 3.4E+3 1.2E+4 4.7E+3 4.8E+3 1.0E+4 6.1E+3 5.9E+3 3.6E+3
Indoor 24h mean 1.4E+3 2.3E+3 4.6E+3 2.2E+3 3.3E+3 3.5E+3 3.9E+3 3.0E+3 1.0E+3
Indoor 24 SD 1.9E+2 6.2E+2 1.7E+3 3.9E+2 8.4E+2 2.6E+3 2.2E+3 1.2E+3 8.7E+2
24h mean In/Out 0.49 0.50 0.22 0.19 0.35 0.42 0.41 0.37 0.12
Highest 8h Outdoor 2.9E+3 8.8E+3 3.9E+4 2.5E+4 1.1E+4 2.2E+4 1.5E+4 1.8E+4 1.1E+4
Highest 8h Indoor 1.7E+3 2.9E+3 6.5E+3 5.7E+3 3.9E+3 6.9E+3 6.8E+3 4.9E+3 1.9E+3
Highest 8 h In/Out 0.59 0.33 0.17 0.22 0.34 0.31 0.44 0.34 0.13
Highest 1h Outdoor 3.6E+3 1.4E+4 4.6E+4 1.9E+4 1.6E+4 3.4E+4 2.0E+4 2.2E+4 1.3E+4
Highest 1 h Indoor2 1.7E+3 2.9E+3 6.5E+3 5.7E+3 3.9E+3 6.9E+3 6.8E+3 4.8E+3 2.5E+3
Highest 1h In/Out 0.52 0.21 0.16 0.11 0.26 0.24 0.36 0.27 0.13
Time of highest 1h Outdoor
11/12/14 5:26
11/13/14 3:43
11/13/14 21:44
11/14/14 14:09
11/15/14 7:50
11/16/14 21:47
11/17/14 23:44
Corresponding highest 1h Indoor
11/12/14 8:57
11/13/14 3:45
11/13/14 23:15
11/14/14 18:09
11/15/14 10:07
11/17/14 0:55
11/18/14 1:29
1 Based on 24h periods starting / ending at 6am. Day 1 starts at 11/11/2014 20:30, and has < 24h of data. 2Occurring within 4h of highest 1h outdoor concentration.

Appendix FW-5-A: System A, Nov 11-17, 2014 Singer, Delp et al. (LBNL)
ARB-11-311: Reducing In-Home Exposure to Air Pollution Final Report 14
Table FW-5-A-8. Daily1 summary statistics for number concentration (particles L-1) and indoor /outdoor ratios for particles with aerodynamic diameters 0.5–0.7 microns measured with the MetOne BT637S OPC.
Parameter Day 11 Day 21 Day 3 Day 4 Day 5 Day 6 Day 7 Mean1 SD1
Outdoor 24h mean 3.4E+3 4.3E+3 1.6E+4 4.4E+3 4.9E+3 5.4E+3 4.7E+3 6.2E+3 4.1E+3
Outdoor 24 SD 4.6E+2 1.4E+3 8.9E+3 1.3E+3 3.2E+3 6.1E+3 3.4E+3 3.5E+3 2.8E+3
Indoor 24h mean 1.5E+3 1.8E+3 2.0E+3 1.2E+3 2.1E+3 1.9E+3 2.0E+3 1.8E+3 3.0E+2
Indoor 24 SD 2.0E+2 2.9E+2 7.2E+2 3.8E+2 6.9E+2 1.4E+3 1.2E+3 7.0E+2 4.3E+2
24h mean In/Out 0.42 0.45 0.21 0.18 0.37 0.42 0.39 0.35 0.10
Highest 8h Outdoor 3.6E+3 5.3E+3 2.4E+4 1.2E+4 7.8E+3 1.2E+4 8.6E+3 1.0E+4 6.1E+3
Highest 8h Indoor 1.8E+3 2.0E+3 2.8E+3 2.3E+3 2.8E+3 3.7E+3 3.7E+3 2.7E+3 7.0E+2
Highest 8 h In/Out 0.49 0.37 0.12 0.19 0.36 0.30 0.42 0.32 0.12
Highest 1h Outdoor 4.2E+3 7.8E+3 3.0E+4 7.6E+3 1.1E+4 2.4E+4 1.2E+4 1.4E+4 8.7E+3
Highest 1 h Indoor2 1.8E+3 2.0E+3 2.8E+3 2.3E+3 2.8E+3 3.7E+3 3.7E+3 2.9E+3 1.2E+3
Highest 1h In/Out 0.45 0.24 0.11 0.14 0.29 0.20 0.33 0.25 0.11
Time of highest 1h Outdoor
11/12/14 5:27
11/13/14 3:40
11/13/14 21:44
11/14/14 14:03
11/15/14 9:29
11/16/14 21:47
11/17/14 23:35
Corresponding highest 1h Indoor
11/12/14 9:02
11/13/14 3:40
11/13/14 22:28
11/14/14 18:03
11/15/14 10:13
11/16/14 22:06
11/18/14 1:20
1 Based on 24h periods starting / ending at 6am. Day 1 starts at 11/11/2014 20:30, and has < 24h of data. 2Occurring within 4h of highest 1h outdoor concentration.
Table FW-5-A-9. Daily1 summary statistics for number concentration (particles L-1) and indoor /outdoor ratios for particles with aerodynamic diameters 0.7–1.0 microns measured with the MetOne BT637S OPC.
Parameter Day 11 Day 21 Day 3 Day 4 Day 5 Day 6 Day 7 Mean1 SD1
Outdoor 24h mean 1.6E+3 1.5E+3 1.9E+3 8.7E+2 1.2E+3 9.6E+2 9.0E+2 1.3E+3 3.6E+2
Outdoor 24 SD 1.2E+2 3.3E+2 1.3E+3 3.8E+2 8.9E+2 1.2E+3 6.2E+2 6.9E+2 4.1E+2
Indoor 24h mean 5.7E+2 5.6E+2 2.8E+2 2.9E+2 4.9E+2 3.3E+2 3.5E+2 4.1E+2 1.2E+2
Indoor 24 SD 6.1E+1 8.4E+1 8.9E+1 1.4E+2 1.9E+2 2.5E+2 2.0E+2 1.5E+2 6.6E+1
24h mean In/Out 0.35 0.36 0.24 0.23 0.38 0.38 0.38 0.33 0.06
Highest 8h Outdoor 1.6E+3 1.8E+3 3.0E+3 1.3E+3 2.0E+3 2.1E+3 1.6E+3 1.9E+3 5.0E+2
Highest 8h Indoor 6.3E+2 6.2E+2 3.8E+2 4.5E+2 6.7E+2 6.4E+2 6.2E+2 5.7E+2 1.0E+2
Highest 8 h In/Out 0.39 0.35 0.13 0.36 0.34 0.30 0.38 0.32 0.08
Highest 1h Outdoor 1.7E+3 2.0E+3 3.7E+3 1.3E+3 3.6E+3 5.1E+3 2.3E+3 2.8E+3 1.2E+3
Highest 1 h Indoor2 6.3E+2 6.2E+2 3.8E+2 4.5E+2 6.7E+2 6.4E+2 6.2E+2 6.5E+2 1.9E+2
Highest 1h In/Out 0.37 0.33 0.08 0.38 0.24 0.18 0.29 0.27 0.10
Time of highest 1h Outdoor
11/12/14 5:32
11/12/14 20:12
11/13/14 14:21
11/14/14 23:55
11/15/14 10:07
11/16/14 21:47
11/17/14 23:31
Corresponding highest 1h Indoor
11/12/14 6:06
11/12/14 21:36
11/13/14 14:42
11/15/14 2:00
11/15/14 10:15
11/16/14 22:05
11/18/14 1:21
1 Based on 24h periods starting / ending at 6am. Day 1 starts at 11/11/2014 20:30, and has < 24h of data. 2Occurring within 4h of highest 1h outdoor concentration.
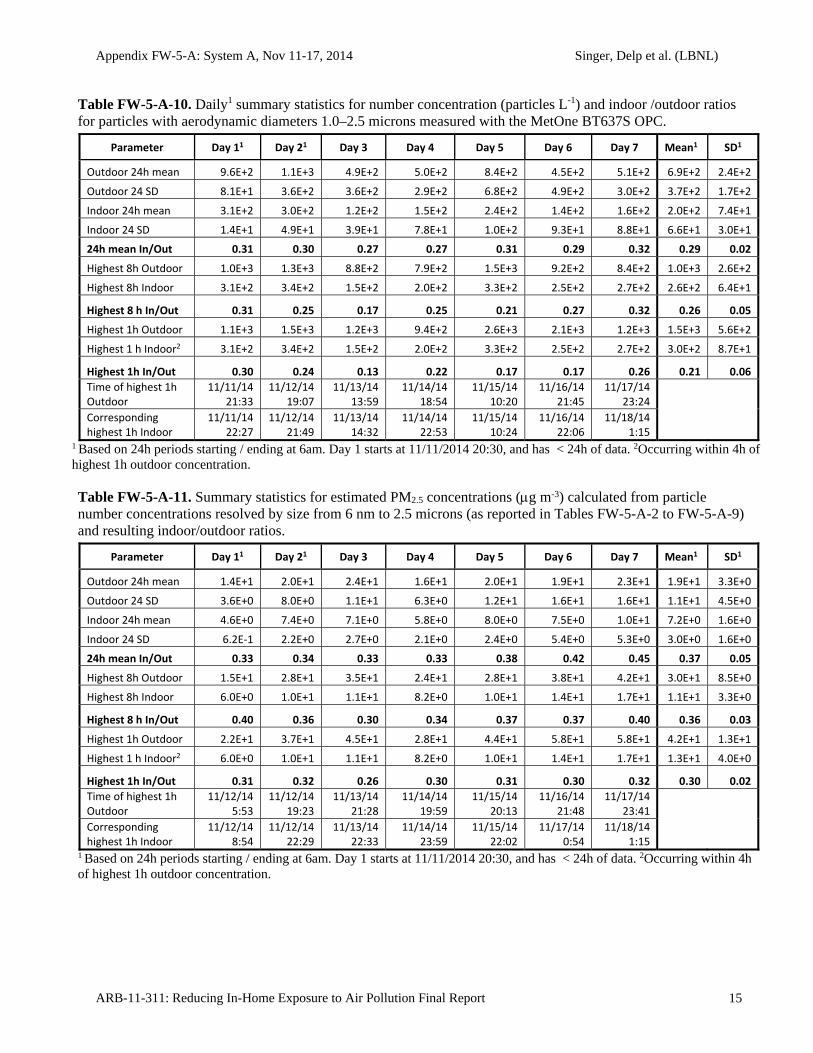
Appendix FW-5-A: System A, Nov 11-17, 2014 Singer, Delp et al. (LBNL)
ARB-11-311: Reducing In-Home Exposure to Air Pollution Final Report 15
Table FW-5-A-10. Daily1 summary statistics for number concentration (particles L-1) and indoor /outdoor ratios for particles with aerodynamic diameters 1.0–2.5 microns measured with the MetOne BT637S OPC.
Parameter Day 11 Day 21 Day 3 Day 4 Day 5 Day 6 Day 7 Mean1 SD1
Outdoor 24h mean 9.6E+2 1.1E+3 4.9E+2 5.0E+2 8.4E+2 4.5E+2 5.1E+2 6.9E+2 2.4E+2
Outdoor 24 SD 8.1E+1 3.6E+2 3.6E+2 2.9E+2 6.8E+2 4.9E+2 3.0E+2 3.7E+2 1.7E+2
Indoor 24h mean 3.1E+2 3.0E+2 1.2E+2 1.5E+2 2.4E+2 1.4E+2 1.6E+2 2.0E+2 7.4E+1
Indoor 24 SD 1.4E+1 4.9E+1 3.9E+1 7.8E+1 1.0E+2 9.3E+1 8.8E+1 6.6E+1 3.0E+1
24h mean In/Out 0.31 0.30 0.27 0.27 0.31 0.29 0.32 0.29 0.02
Highest 8h Outdoor 1.0E+3 1.3E+3 8.8E+2 7.9E+2 1.5E+3 9.2E+2 8.4E+2 1.0E+3 2.6E+2
Highest 8h Indoor 3.1E+2 3.4E+2 1.5E+2 2.0E+2 3.3E+2 2.5E+2 2.7E+2 2.6E+2 6.4E+1
Highest 8 h In/Out 0.31 0.25 0.17 0.25 0.21 0.27 0.32 0.26 0.05
Highest 1h Outdoor 1.1E+3 1.5E+3 1.2E+3 9.4E+2 2.6E+3 2.1E+3 1.2E+3 1.5E+3 5.6E+2
Highest 1 h Indoor2 3.1E+2 3.4E+2 1.5E+2 2.0E+2 3.3E+2 2.5E+2 2.7E+2 3.0E+2 8.7E+1
Highest 1h In/Out 0.30 0.24 0.13 0.22 0.17 0.17 0.26 0.21 0.06
Time of highest 1h Outdoor
11/11/14 21:33
11/12/14 19:07
11/13/14 13:59
11/14/14 18:54
11/15/14 10:20
11/16/14 21:45
11/17/14 23:24
Corresponding highest 1h Indoor
11/11/14 22:27
11/12/14 21:49
11/13/14 14:32
11/14/14 22:53
11/15/14 10:24
11/16/14 22:06
11/18/14 1:15
1 Based on 24h periods starting / ending at 6am. Day 1 starts at 11/11/2014 20:30, and has < 24h of data. 2Occurring within 4h of highest 1h outdoor concentration.
Table FW-5-A-11. Summary statistics for estimated PM2.5 concentrations (g m-3) calculated from particle number concentrations resolved by size from 6 nm to 2.5 microns (as reported in Tables FW-5-A-2 to FW-5-A-9) and resulting indoor/outdoor ratios.
Parameter Day 11 Day 21 Day 3 Day 4 Day 5 Day 6 Day 7 Mean1 SD1
Outdoor 24h mean 1.4E+1 2.0E+1 2.4E+1 1.6E+1 2.0E+1 1.9E+1 2.3E+1 1.9E+1 3.3E+0
Outdoor 24 SD 3.6E+0 8.0E+0 1.1E+1 6.3E+0 1.2E+1 1.6E+1 1.6E+1 1.1E+1 4.5E+0
Indoor 24h mean 4.6E+0 7.4E+0 7.1E+0 5.8E+0 8.0E+0 7.5E+0 1.0E+1 7.2E+0 1.6E+0
Indoor 24 SD 6.2E‐1 2.2E+0 2.7E+0 2.1E+0 2.4E+0 5.4E+0 5.3E+0 3.0E+0 1.6E+0
24h mean In/Out 0.33 0.34 0.33 0.33 0.38 0.42 0.45 0.37 0.05
Highest 8h Outdoor 1.5E+1 2.8E+1 3.5E+1 2.4E+1 2.8E+1 3.8E+1 4.2E+1 3.0E+1 8.5E+0
Highest 8h Indoor 6.0E+0 1.0E+1 1.1E+1 8.2E+0 1.0E+1 1.4E+1 1.7E+1 1.1E+1 3.3E+0
Highest 8 h In/Out 0.40 0.36 0.30 0.34 0.37 0.37 0.40 0.36 0.03
Highest 1h Outdoor 2.2E+1 3.7E+1 4.5E+1 2.8E+1 4.4E+1 5.8E+1 5.8E+1 4.2E+1 1.3E+1
Highest 1 h Indoor2 6.0E+0 1.0E+1 1.1E+1 8.2E+0 1.0E+1 1.4E+1 1.7E+1 1.3E+1 4.0E+0
Highest 1h In/Out 0.31 0.32 0.26 0.30 0.31 0.30 0.32 0.30 0.02
Time of highest 1h Outdoor
11/12/14 5:53
11/12/14 19:23
11/13/14 21:28
11/14/14 19:59
11/15/14 20:13
11/16/14 21:48
11/17/14 23:41
Corresponding highest 1h Indoor
11/12/14 8:54
11/12/14 22:29
11/13/14 22:33
11/14/14 23:59
11/15/14 22:02
11/17/14 0:54
11/18/14 1:15
1 Based on 24h periods starting / ending at 6am. Day 1 starts at 11/11/2014 20:30, and has < 24h of data. 2Occurring within 4h of highest 1h outdoor concentration.
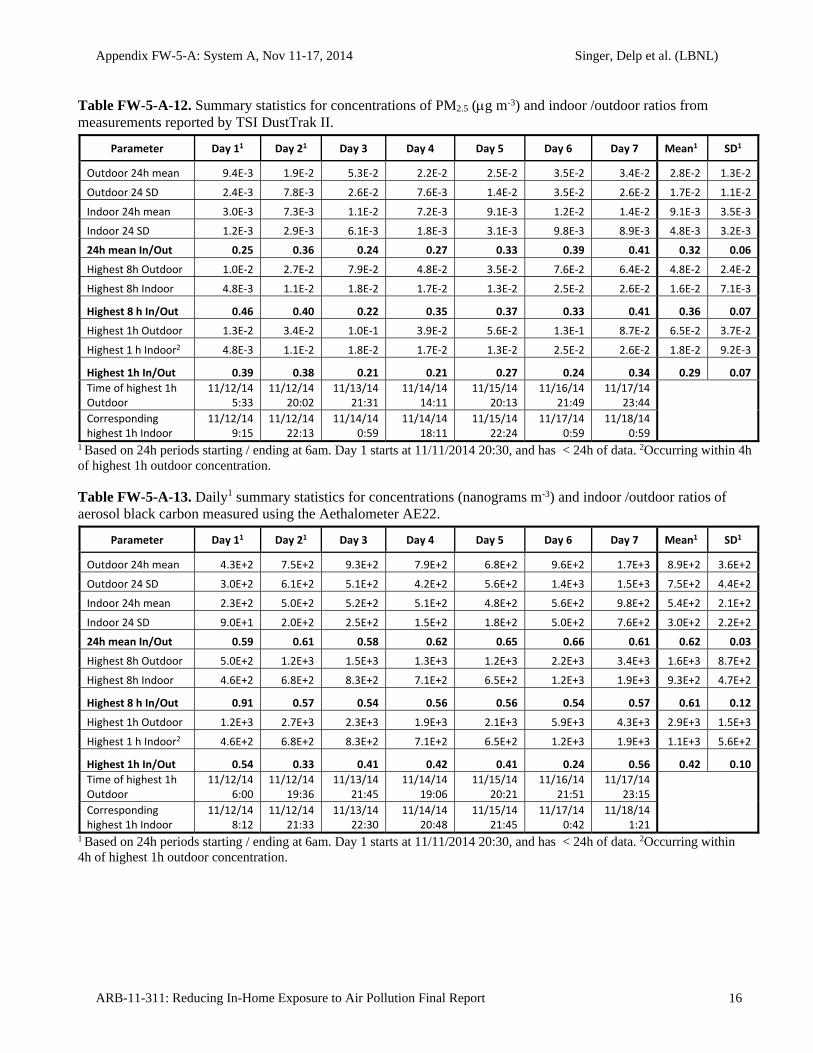
Appendix FW-5-A: System A, Nov 11-17, 2014 Singer, Delp et al. (LBNL)
ARB-11-311: Reducing In-Home Exposure to Air Pollution Final Report 16
Table FW-5-A-12. Summary statistics for concentrations of PM2.5 (g m-3) and indoor /outdoor ratios from measurements reported by TSI DustTrak II.
Parameter Day 11 Day 21 Day 3 Day 4 Day 5 Day 6 Day 7 Mean1 SD1
Outdoor 24h mean 9.4E‐3 1.9E‐2 5.3E‐2 2.2E‐2 2.5E‐2 3.5E‐2 3.4E‐2 2.8E‐2 1.3E‐2
Outdoor 24 SD 2.4E‐3 7.8E‐3 2.6E‐2 7.6E‐3 1.4E‐2 3.5E‐2 2.6E‐2 1.7E‐2 1.1E‐2
Indoor 24h mean 3.0E‐3 7.3E‐3 1.1E‐2 7.2E‐3 9.1E‐3 1.2E‐2 1.4E‐2 9.1E‐3 3.5E‐3
Indoor 24 SD 1.2E‐3 2.9E‐3 6.1E‐3 1.8E‐3 3.1E‐3 9.8E‐3 8.9E‐3 4.8E‐3 3.2E‐3
24h mean In/Out 0.25 0.36 0.24 0.27 0.33 0.39 0.41 0.32 0.06
Highest 8h Outdoor 1.0E‐2 2.7E‐2 7.9E‐2 4.8E‐2 3.5E‐2 7.6E‐2 6.4E‐2 4.8E‐2 2.4E‐2
Highest 8h Indoor 4.8E‐3 1.1E‐2 1.8E‐2 1.7E‐2 1.3E‐2 2.5E‐2 2.6E‐2 1.6E‐2 7.1E‐3
Highest 8 h In/Out 0.46 0.40 0.22 0.35 0.37 0.33 0.41 0.36 0.07
Highest 1h Outdoor 1.3E‐2 3.4E‐2 1.0E‐1 3.9E‐2 5.6E‐2 1.3E‐1 8.7E‐2 6.5E‐2 3.7E‐2
Highest 1 h Indoor2 4.8E‐3 1.1E‐2 1.8E‐2 1.7E‐2 1.3E‐2 2.5E‐2 2.6E‐2 1.8E‐2 9.2E‐3
Highest 1h In/Out 0.39 0.38 0.21 0.21 0.27 0.24 0.34 0.29 0.07
Time of highest 1h Outdoor
11/12/14 5:33
11/12/14 20:02
11/13/14 21:31
11/14/14 14:11
11/15/14 20:13
11/16/14 21:49
11/17/14 23:44
Corresponding highest 1h Indoor
11/12/14 9:15
11/12/14 22:13
11/14/14 0:59
11/14/14 18:11
11/15/14 22:24
11/17/14 0:59
11/18/14 0:59
1 Based on 24h periods starting / ending at 6am. Day 1 starts at 11/11/2014 20:30, and has < 24h of data. 2Occurring within 4h of highest 1h outdoor concentration.
Table FW-5-A-13. Daily1 summary statistics for concentrations (nanograms m-3) and indoor /outdoor ratios of aerosol black carbon measured using the Aethalometer AE22.
Parameter Day 11 Day 21 Day 3 Day 4 Day 5 Day 6 Day 7 Mean1 SD1
Outdoor 24h mean 4.3E+2 7.5E+2 9.3E+2 7.9E+2 6.8E+2 9.6E+2 1.7E+3 8.9E+2 3.6E+2
Outdoor 24 SD 3.0E+2 6.1E+2 5.1E+2 4.2E+2 5.6E+2 1.4E+3 1.5E+3 7.5E+2 4.4E+2
Indoor 24h mean 2.3E+2 5.0E+2 5.2E+2 5.1E+2 4.8E+2 5.6E+2 9.8E+2 5.4E+2 2.1E+2
Indoor 24 SD 9.0E+1 2.0E+2 2.5E+2 1.5E+2 1.8E+2 5.0E+2 7.6E+2 3.0E+2 2.2E+2
24h mean In/Out 0.59 0.61 0.58 0.62 0.65 0.66 0.61 0.62 0.03
Highest 8h Outdoor 5.0E+2 1.2E+3 1.5E+3 1.3E+3 1.2E+3 2.2E+3 3.4E+3 1.6E+3 8.7E+2
Highest 8h Indoor 4.6E+2 6.8E+2 8.3E+2 7.1E+2 6.5E+2 1.2E+3 1.9E+3 9.3E+2 4.7E+2
Highest 8 h In/Out 0.91 0.57 0.54 0.56 0.56 0.54 0.57 0.61 0.12
Highest 1h Outdoor 1.2E+3 2.7E+3 2.3E+3 1.9E+3 2.1E+3 5.9E+3 4.3E+3 2.9E+3 1.5E+3
Highest 1 h Indoor2 4.6E+2 6.8E+2 8.3E+2 7.1E+2 6.5E+2 1.2E+3 1.9E+3 1.1E+3 5.6E+2
Highest 1h In/Out 0.54 0.33 0.41 0.42 0.41 0.24 0.56 0.42 0.10
Time of highest 1h Outdoor
11/12/14 6:00
11/12/14 19:36
11/13/14 21:45
11/14/14 19:06
11/15/14 20:21
11/16/14 21:51
11/17/14 23:15
Corresponding highest 1h Indoor
11/12/14 8:12
11/12/14 21:33
11/13/14 22:30
11/14/14 20:48
11/15/14 21:45
11/17/14 0:42
11/18/14 1:21
1 Based on 24h periods starting / ending at 6am. Day 1 starts at 11/11/2014 20:30, and has < 24h of data. 2Occurring within 4h of highest 1h outdoor concentration.
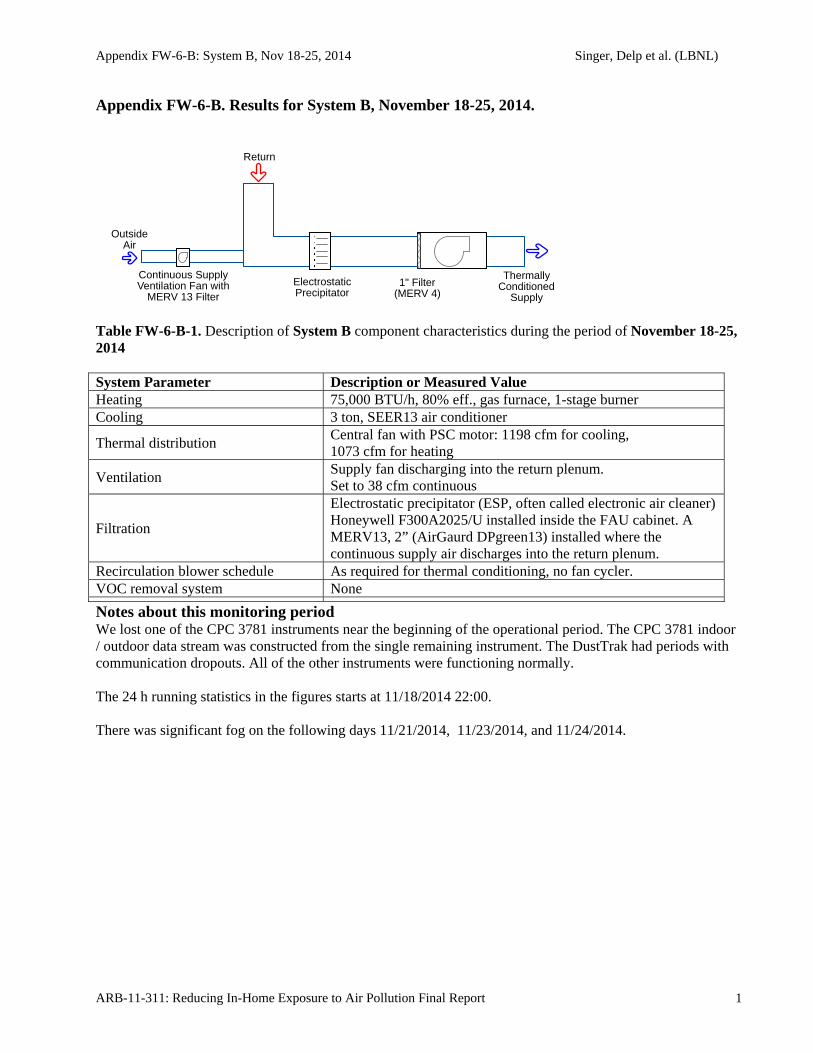
Appendix FW-6-B: System B, Nov 18-25, 2014 Singer, Delp et al. (LBNL)
ARB-11-311: Reducing In-Home Exposure to Air Pollution Final Report 1
Appendix FW-6-B. Results for System B, November 18-25, 2014.
Table FW-6-B-1. Description of System B component characteristics during the period of November 18-25, 2014 System Parameter Description or Measured Value Heating 75,000 BTU/h, 80% eff., gas furnace, 1-stage burner Cooling 3 ton, SEER13 air conditioner
Thermal distribution Central fan with PSC motor: 1198 cfm for cooling, 1073 cfm for heating
Ventilation Supply fan discharging into the return plenum. Set to 38 cfm continuous
Filtration
Electrostatic precipitator (ESP, often called electronic air cleaner) Honeywell F300A2025/U installed inside the FAU cabinet. A MERV13, 2” (AirGaurd DPgreen13) installed where the continuous supply air discharges into the return plenum.
Recirculation blower schedule As required for thermal conditioning, no fan cycler. VOC removal system None
Notes about this monitoring period We lost one of the CPC 3781 instruments near the beginning of the operational period. The CPC 3781 indoor / outdoor data stream was constructed from the single remaining instrument. The DustTrak had periods with communication dropouts. All of the other instruments were functioning normally. The 24 h running statistics in the figures starts at 11/18/2014 22:00. There was significant fog on the following days 11/21/2014, 11/23/2014, and 11/24/2014.
OutsideAir
ThermallyConditioned
Supply
Continuous SupplyVentilation Fan with
MERV 13 Filter
ElectrostaticPrecipitator
1" Filter(MERV 4)
Return
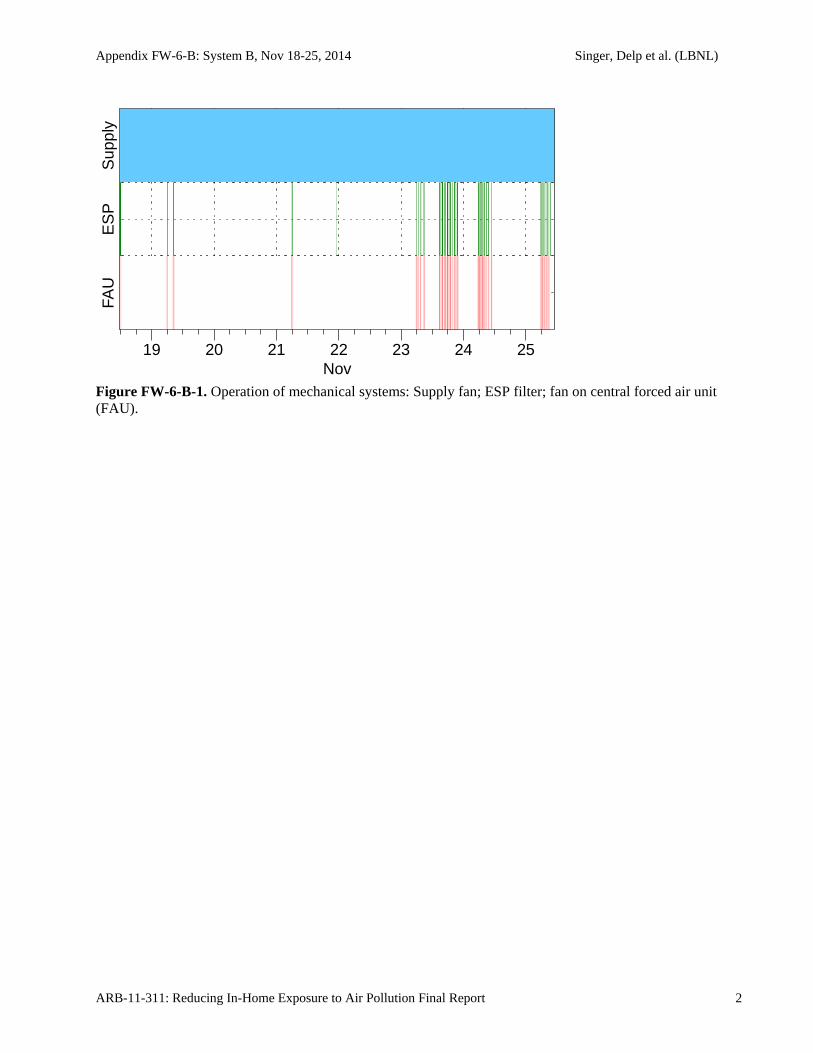
Appendix FW-6-B: System B, Nov 18-25, 2014 Singer, Delp et al. (LBNL)
ARB-11-311: Reducing In-Home Exposure to Air Pollution Final Report 2
Figure FW-6-B-1. Operation of mechanical systems: Supply fan; ESP filter; fan on central forced air unit (FAU).
FAU
ES
PS
uppl
y
19 20 21 22 23 24 25Nov
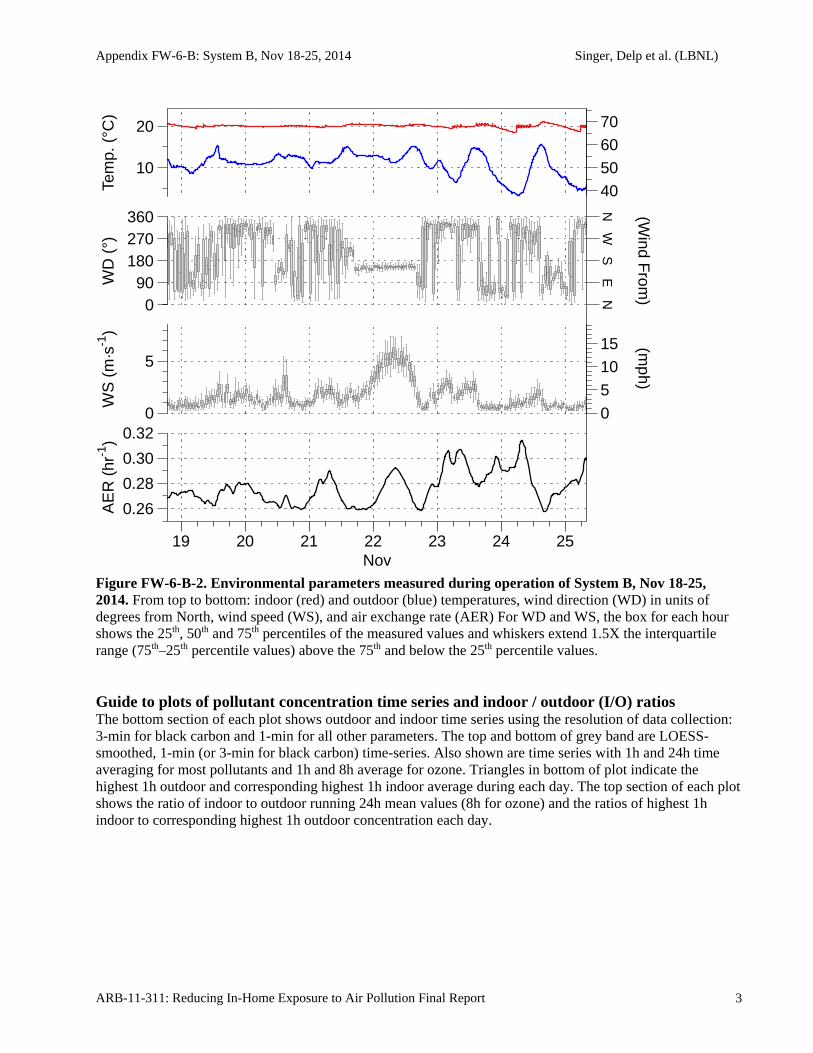
Appendix FW-6-B: System B, Nov 18-25, 2014 Singer, Delp et al. (LBNL)
ARB-11-311: Reducing In-Home Exposure to Air Pollution Final Report 3
Figure FW-6-B-2. Environmental parameters measured during operation of System B, Nov 18-25, 2014. From top to bottom: indoor (red) and outdoor (blue) temperatures, wind direction (WD) in units of degrees from North, wind speed (WS), and air exchange rate (AER) For WD and WS, the box for each hour shows the 25th, 50th and 75th percentiles of the measured values and whiskers extend 1.5X the interquartile range (75th–25th percentile values) above the 75th and below the 25th percentile values. Guide to plots of pollutant concentration time series and indoor / outdoor (I/O) ratios The bottom section of each plot shows outdoor and indoor time series using the resolution of data collection: 3-min for black carbon and 1-min for all other parameters. The top and bottom of grey band are LOESS-smoothed, 1-min (or 3-min for black carbon) time-series. Also shown are time series with 1h and 24h time averaging for most pollutants and 1h and 8h average for ozone. Triangles in bottom of plot indicate the highest 1h outdoor and corresponding highest 1h indoor average during each day. The top section of each plot shows the ratio of indoor to outdoor running 24h mean values (8h for ozone) and the ratios of highest 1h indoor to corresponding highest 1h outdoor concentration each day.
0
5
1015
40506070
NE
SW
N
(mph)
(Wind F
rom)
AE
R (
hr-1
)
0.26
0.28
0.30
0.32
WS
(m
·s-1
)
0
5
WD
(°)
090
180270360
Tem
p. (
°C)
10
20
19 20 21 22 23 24 25Nov
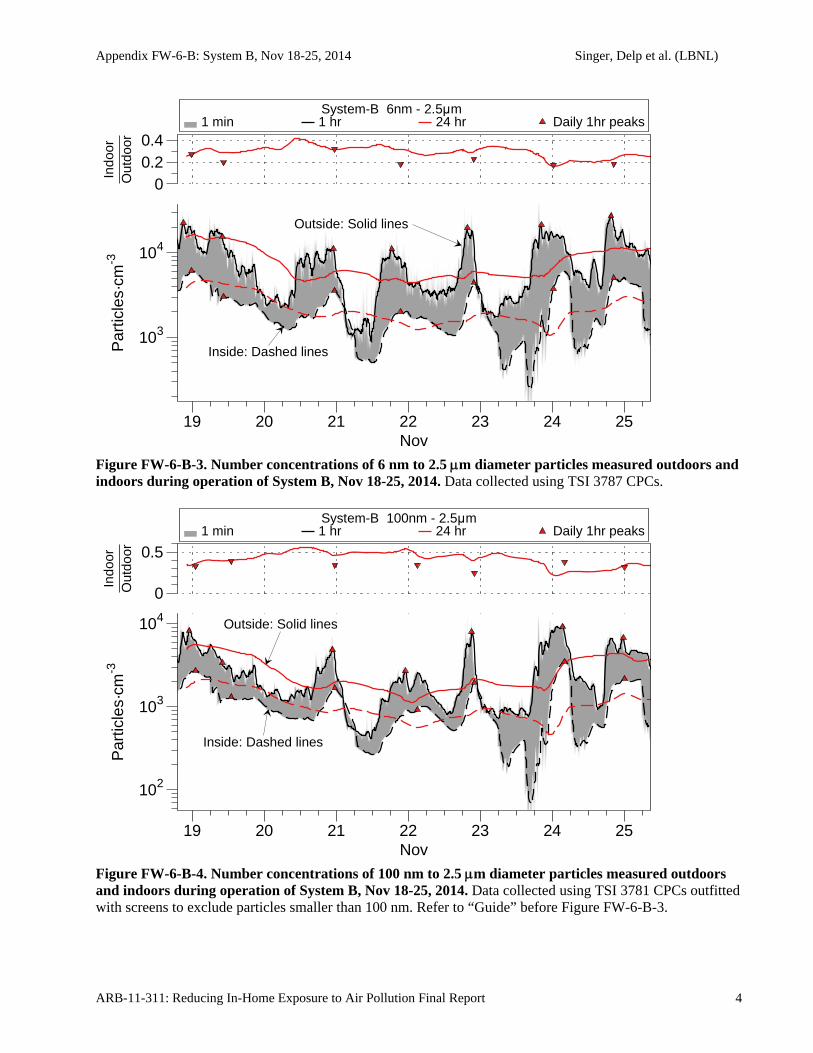
Appendix FW-6-B: System B, Nov 18-25, 2014 Singer, Delp et al. (LBNL)
ARB-11-311: Reducing In-Home Exposure to Air Pollution Final Report 4
Figure FW-6-B-3. Number concentrations of 6 nm to 2.5 m diameter particles measured outdoors and indoors during operation of System B, Nov 18-25, 2014. Data collected using TSI 3787 CPCs.
Figure FW-6-B-4. Number concentrations of 100 nm to 2.5 m diameter particles measured outdoors and indoors during operation of System B, Nov 18-25, 2014. Data collected using TSI 3781 CPCs outfitted with screens to exclude particles smaller than 100 nm. Refer to “Guide” before Figure FW-6-B-3.
1 min 1 hr 24 hr Daily 1hr peaks System-B 6nm - 2.5μm
Outside: Solid lines
Inside: Dashed linesPar
ticle
s·cm
-3
103
104
Indo
orO
utdo
or
00.20.4
19 20 21 22 23 24 25Nov
1 min 1 hr 24 hr Daily 1hr peaks System-B 100nm - 2.5μm
Outside: Solid lines
Inside: Dashed lines
Par
ticle
s·cm
-3
102
103
104
Indo
orO
utdo
or
0
0.5
19 20 21 22 23 24 25Nov
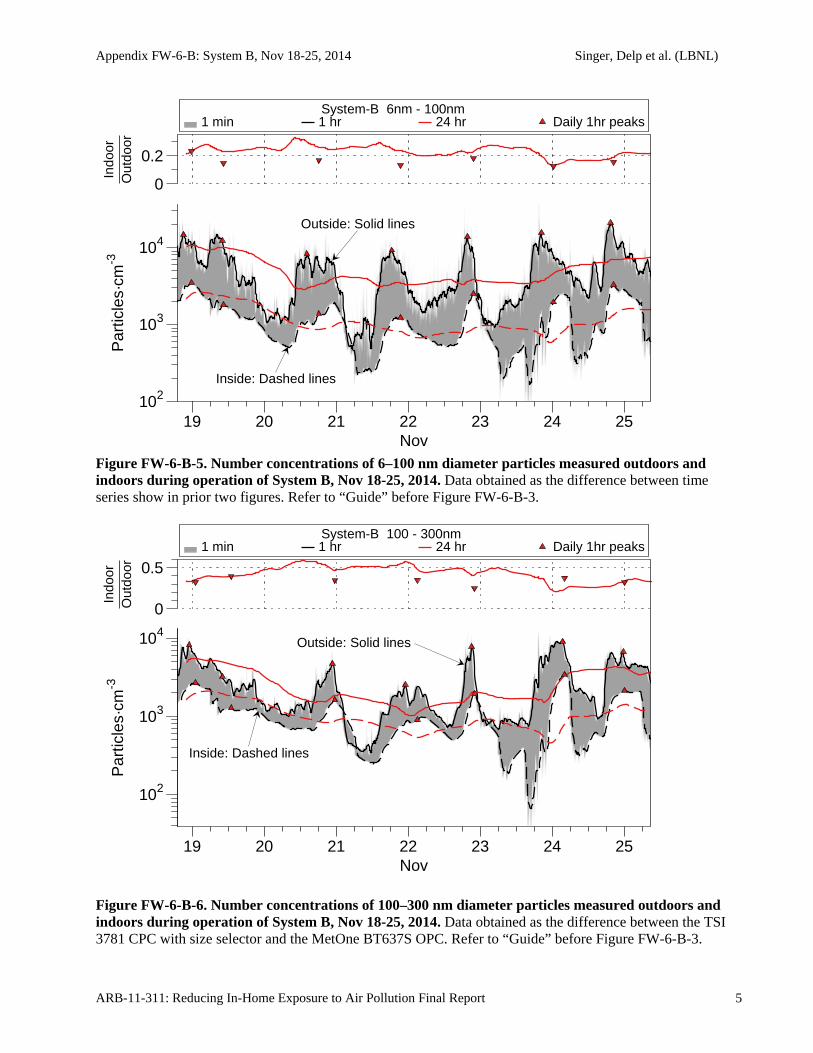
Appendix FW-6-B: System B, Nov 18-25, 2014 Singer, Delp et al. (LBNL)
ARB-11-311: Reducing In-Home Exposure to Air Pollution Final Report 5
Figure FW-6-B-5. Number concentrations of 6–100 nm diameter particles measured outdoors and indoors during operation of System B, Nov 18-25, 2014. Data obtained as the difference between time series show in prior two figures. Refer to “Guide” before Figure FW-6-B-3.
Figure FW-6-B-6. Number concentrations of 100–300 nm diameter particles measured outdoors and indoors during operation of System B, Nov 18-25, 2014. Data obtained as the difference between the TSI 3781 CPC with size selector and the MetOne BT637S OPC. Refer to “Guide” before Figure FW-6-B-3.
1 min 1 hr 24 hr Daily 1hr peaks System-B 6nm - 100nm
Outside: Solid lines
Inside: Dashed lines
Par
ticle
s·cm
-3
102
103
104
Indo
orO
utdo
or
0
0.2
19 20 21 22 23 24 25Nov
1 min 1 hr 24 hr Daily 1hr peaks System-B 100 - 300nm
Outside: Solid lines
Inside: Dashed lines
102
103
104
Par
ticle
s·cm
-3In
door
Out
door
0
0.5
19 20 21 22 23 24 25Nov
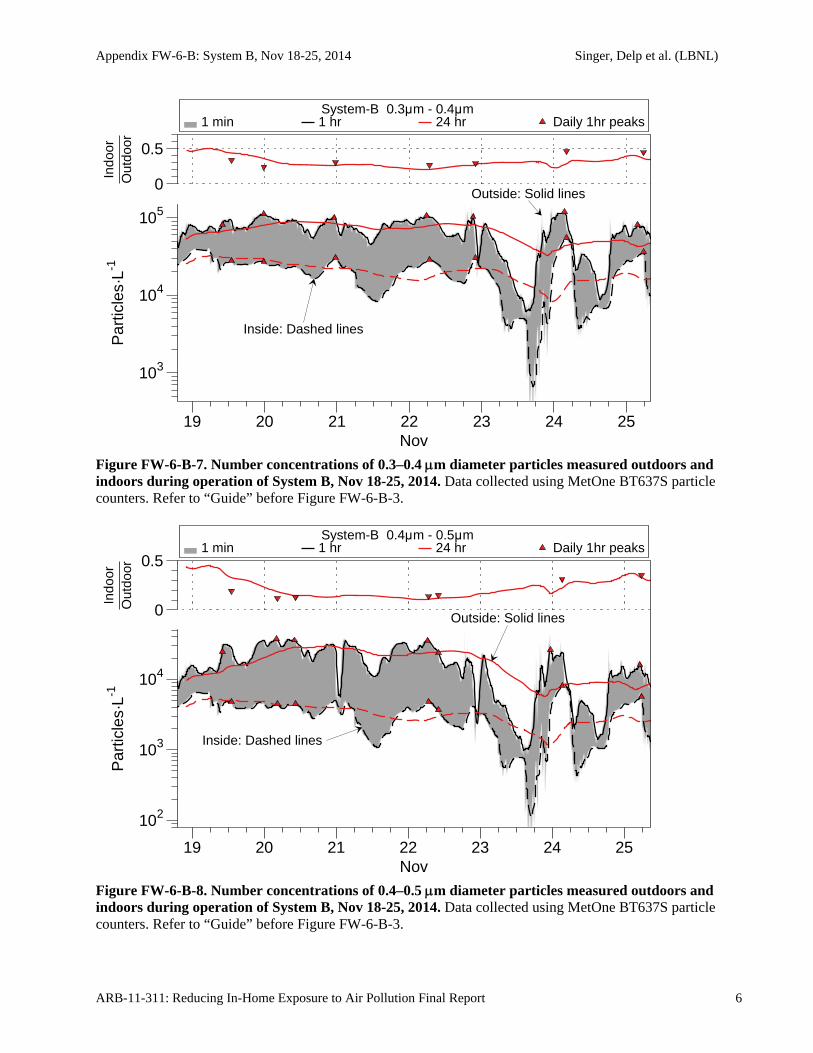
Appendix FW-6-B: System B, Nov 18-25, 2014 Singer, Delp et al. (LBNL)
ARB-11-311: Reducing In-Home Exposure to Air Pollution Final Report 6
Figure FW-6-B-7. Number concentrations of 0.3–0.4 m diameter particles measured outdoors and indoors during operation of System B, Nov 18-25, 2014. Data collected using MetOne BT637S particle counters. Refer to “Guide” before Figure FW-6-B-3.
Figure FW-6-B-8. Number concentrations of 0.4–0.5 m diameter particles measured outdoors and indoors during operation of System B, Nov 18-25, 2014. Data collected using MetOne BT637S particle counters. Refer to “Guide” before Figure FW-6-B-3.
1 min 1 hr 24 hr Daily 1hr peaks System-B 0.3μm - 0.4μm
Outside: Solid lines
Inside: Dashed lines
Par
ticle
s·L-1
103
104
105
Indo
orO
utdo
or
0
0.5
19 20 21 22 23 24 25Nov
1 min 1 hr 24 hr Daily 1hr peaks System-B 0.4μm - 0.5μm
Outside: Solid lines
Inside: Dashed lines
Par
ticle
s·L-1
102
103
104
Indo
orO
utdo
or
0
0.5
19 20 21 22 23 24 25Nov
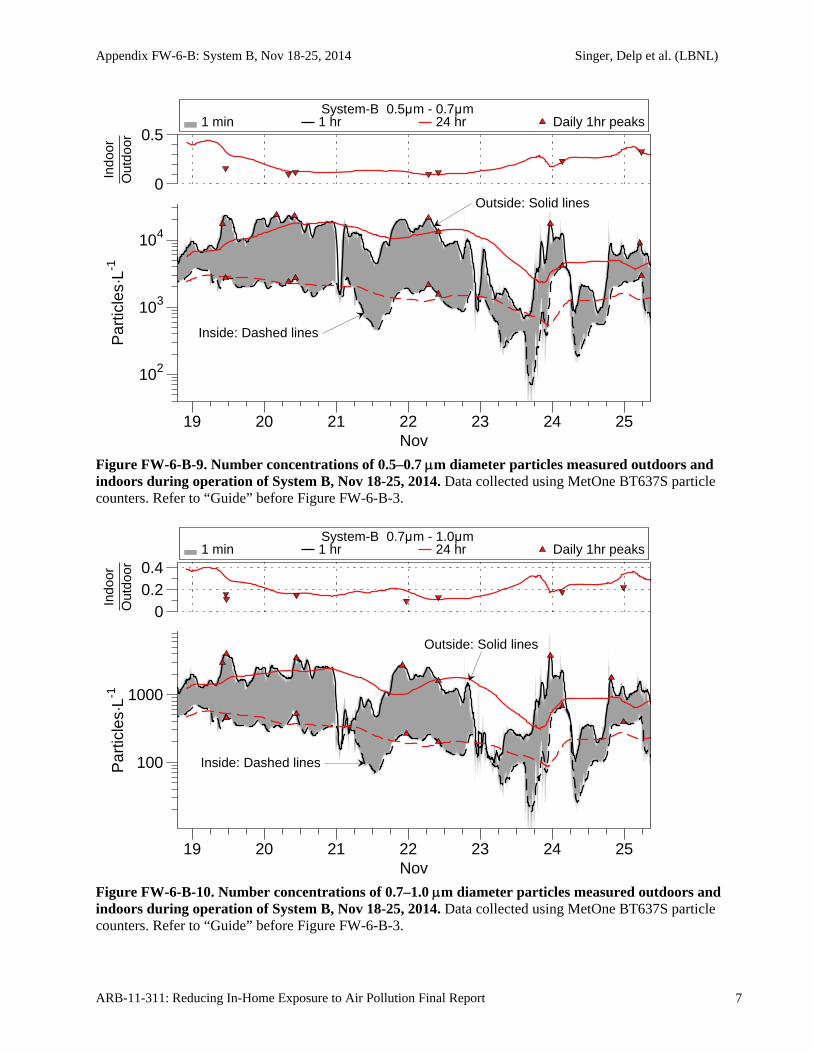
Appendix FW-6-B: System B, Nov 18-25, 2014 Singer, Delp et al. (LBNL)
ARB-11-311: Reducing In-Home Exposure to Air Pollution Final Report 7
Figure FW-6-B-9. Number concentrations of 0.5–0.7 m diameter particles measured outdoors and indoors during operation of System B, Nov 18-25, 2014. Data collected using MetOne BT637S particle counters. Refer to “Guide” before Figure FW-6-B-3.
Figure FW-6-B-10. Number concentrations of 0.7–1.0 m diameter particles measured outdoors and indoors during operation of System B, Nov 18-25, 2014. Data collected using MetOne BT637S particle counters. Refer to “Guide” before Figure FW-6-B-3.
1 min 1 hr 24 hr Daily 1hr peaks System-B 0.5μm - 0.7μm
Outside: Solid lines
Inside: Dashed linesPar
ticle
s·L-1
102
103
104
Indo
orO
utdo
or
0
0.5
19 20 21 22 23 24 25Nov
1 min 1 hr 24 hr Daily 1hr peaks System-B 0.7μm - 1.0μm
Outside: Solid lines
Inside: Dashed linesPar
ticle
s·L-1
100
1000
Indo
orO
utdo
or
00.20.4
19 20 21 22 23 24 25Nov
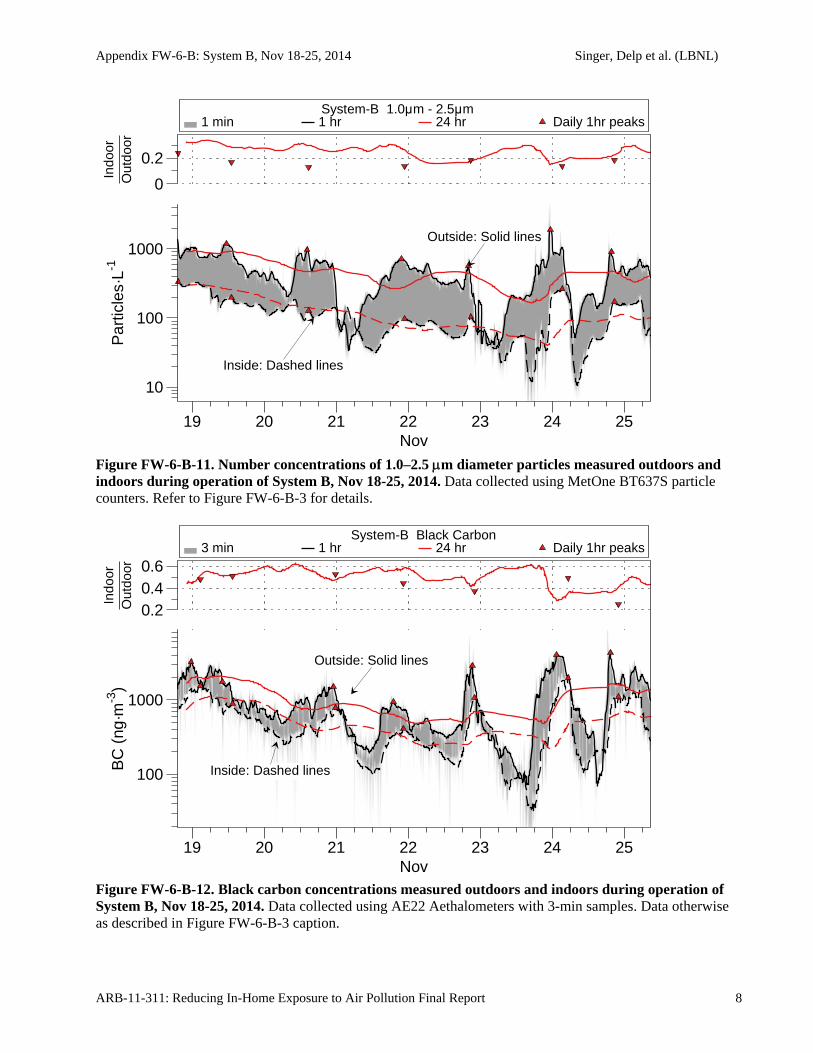
Appendix FW-6-B: System B, Nov 18-25, 2014 Singer, Delp et al. (LBNL)
ARB-11-311: Reducing In-Home Exposure to Air Pollution Final Report 8
Figure FW-6-B-11. Number concentrations of 1.0–2.5 m diameter particles measured outdoors and indoors during operation of System B, Nov 18-25, 2014. Data collected using MetOne BT637S particle counters. Refer to Figure FW-6-B-3 for details.
Figure FW-6-B-12. Black carbon concentrations measured outdoors and indoors during operation of System B, Nov 18-25, 2014. Data collected using AE22 Aethalometers with 3-min samples. Data otherwise as described in Figure FW-6-B-3 caption.
1 min 1 hr 24 hr Daily 1hr peaks System-B 1.0μm - 2.5μm
Outside: Solid lines
Inside: Dashed lines
Par
ticle
s·L-1
10
100
1000
Indo
orO
utdo
or
0
0.2
19 20 21 22 23 24 25Nov
3 min 1 hr 24 hr Daily 1hr peaks System-B Black Carbon
Outside: Solid lines
Inside: Dashed linesBC
(ng
·m-3
)
100
1000
Indo
orO
utdo
or
0.20.40.6
19 20 21 22 23 24 25Nov
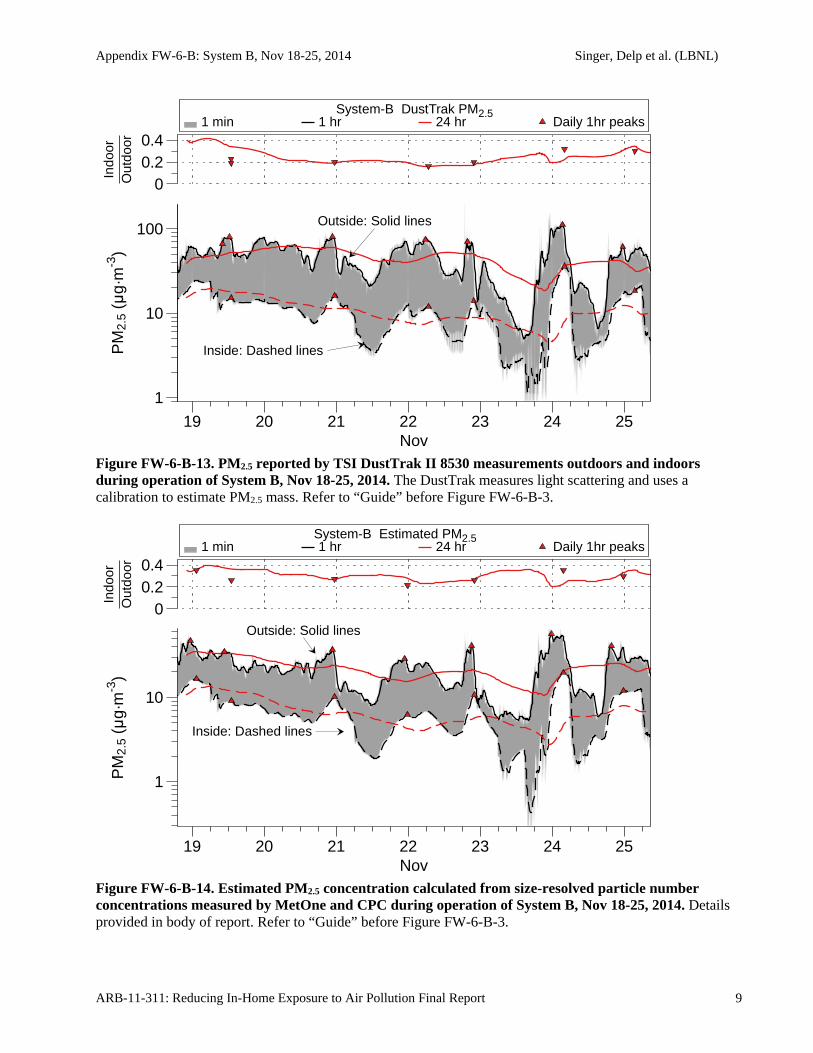
Appendix FW-6-B: System B, Nov 18-25, 2014 Singer, Delp et al. (LBNL)
ARB-11-311: Reducing In-Home Exposure to Air Pollution Final Report 9
Figure FW-6-B-13. PM2.5 reported by TSI DustTrak II 8530 measurements outdoors and indoors during operation of System B, Nov 18-25, 2014. The DustTrak measures light scattering and uses a calibration to estimate PM2.5 mass. Refer to “Guide” before Figure FW-6-B-3.
Figure FW-6-B-14. Estimated PM2.5 concentration calculated from size-resolved particle number concentrations measured by MetOne and CPC during operation of System B, Nov 18-25, 2014. Details provided in body of report. Refer to “Guide” before Figure FW-6-B-3.
1 min 1 hr 24 hr Daily 1hr peaks System-B DustTrak PM2.5
1
10
100 Outside: Solid lines
Inside: Dashed linesPM
2.5
(μg·
m-3
)In
door
Out
door
00.20.4
19 20 21 22 23 24 25Nov
1 min 1 hr 24 hr Daily 1hr peaks System-B Estimated PM2.5
Outside: Solid lines
Inside: Dashed lines
PM
2.5
(μg·
m-3
)
1
10
Indo
orO
utdo
or
00.20.4
19 20 21 22 23 24 25Nov
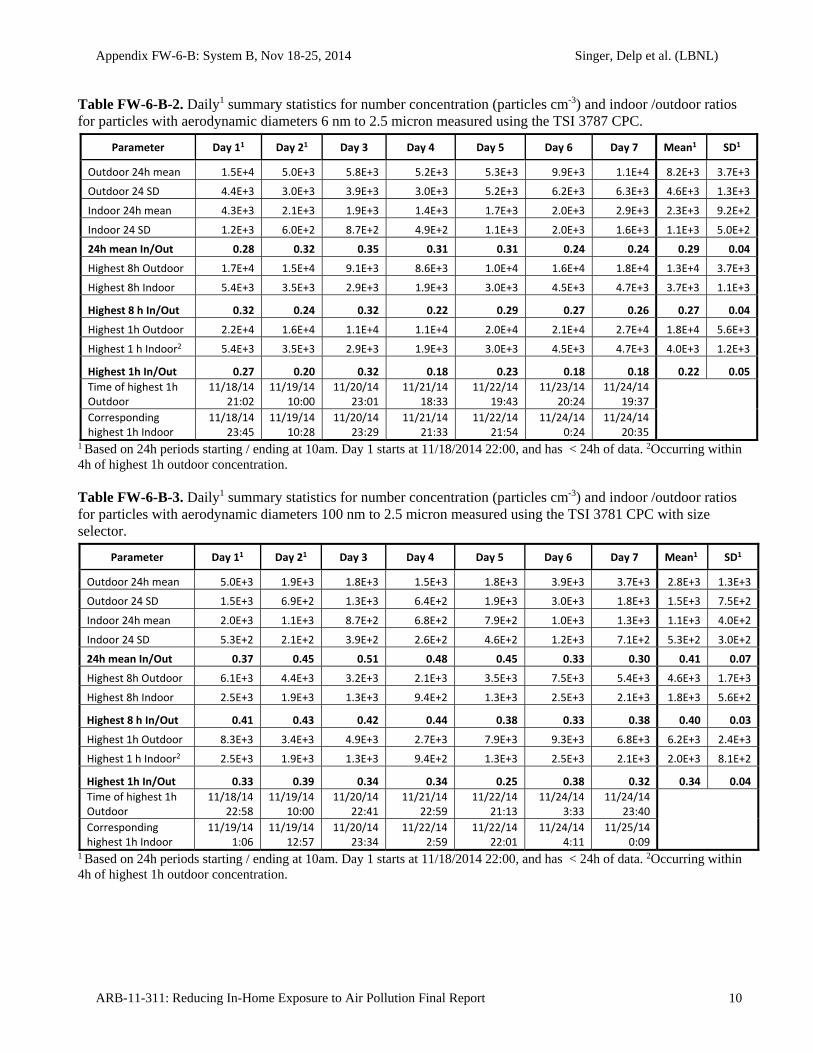
Appendix FW-6-B: System B, Nov 18-25, 2014 Singer, Delp et al. (LBNL)
ARB-11-311: Reducing In-Home Exposure to Air Pollution Final Report 10
Table FW-6-B-2. Daily1 summary statistics for number concentration (particles cm-3) and indoor /outdoor ratios for particles with aerodynamic diameters 6 nm to 2.5 micron measured using the TSI 3787 CPC.
Parameter Day 11 Day 21 Day 3 Day 4 Day 5 Day 6 Day 7 Mean1 SD1
Outdoor 24h mean 1.5E+4 5.0E+3 5.8E+3 5.2E+3 5.3E+3 9.9E+3 1.1E+4 8.2E+3 3.7E+3
Outdoor 24 SD 4.4E+3 3.0E+3 3.9E+3 3.0E+3 5.2E+3 6.2E+3 6.3E+3 4.6E+3 1.3E+3
Indoor 24h mean 4.3E+3 2.1E+3 1.9E+3 1.4E+3 1.7E+3 2.0E+3 2.9E+3 2.3E+3 9.2E+2
Indoor 24 SD 1.2E+3 6.0E+2 8.7E+2 4.9E+2 1.1E+3 2.0E+3 1.6E+3 1.1E+3 5.0E+2
24h mean In/Out 0.28 0.32 0.35 0.31 0.31 0.24 0.24 0.29 0.04
Highest 8h Outdoor 1.7E+4 1.5E+4 9.1E+3 8.6E+3 1.0E+4 1.6E+4 1.8E+4 1.3E+4 3.7E+3
Highest 8h Indoor 5.4E+3 3.5E+3 2.9E+3 1.9E+3 3.0E+3 4.5E+3 4.7E+3 3.7E+3 1.1E+3
Highest 8 h In/Out 0.32 0.24 0.32 0.22 0.29 0.27 0.26 0.27 0.04
Highest 1h Outdoor 2.2E+4 1.6E+4 1.1E+4 1.1E+4 2.0E+4 2.1E+4 2.7E+4 1.8E+4 5.6E+3
Highest 1 h Indoor2 5.4E+3 3.5E+3 2.9E+3 1.9E+3 3.0E+3 4.5E+3 4.7E+3 4.0E+3 1.2E+3
Highest 1h In/Out 0.27 0.20 0.32 0.18 0.23 0.18 0.18 0.22 0.05
Time of highest 1h Outdoor
11/18/14 21:02
11/19/14 10:00
11/20/14 23:01
11/21/14 18:33
11/22/14 19:43
11/23/14 20:24
11/24/14 19:37
Corresponding highest 1h Indoor
11/18/14 23:45
11/19/14 10:28
11/20/14 23:29
11/21/14 21:33
11/22/14 21:54
11/24/14 0:24
11/24/14 20:35
1 Based on 24h periods starting / ending at 10am. Day 1 starts at 11/18/2014 22:00, and has < 24h of data. 2Occurring within 4h of highest 1h outdoor concentration.
Table FW-6-B-3. Daily1 summary statistics for number concentration (particles cm-3) and indoor /outdoor ratios for particles with aerodynamic diameters 100 nm to 2.5 micron measured using the TSI 3781 CPC with size selector.
Parameter Day 11 Day 21 Day 3 Day 4 Day 5 Day 6 Day 7 Mean1 SD1
Outdoor 24h mean 5.0E+3 1.9E+3 1.8E+3 1.5E+3 1.8E+3 3.9E+3 3.7E+3 2.8E+3 1.3E+3
Outdoor 24 SD 1.5E+3 6.9E+2 1.3E+3 6.4E+2 1.9E+3 3.0E+3 1.8E+3 1.5E+3 7.5E+2
Indoor 24h mean 2.0E+3 1.1E+3 8.7E+2 6.8E+2 7.9E+2 1.0E+3 1.3E+3 1.1E+3 4.0E+2
Indoor 24 SD 5.3E+2 2.1E+2 3.9E+2 2.6E+2 4.6E+2 1.2E+3 7.1E+2 5.3E+2 3.0E+2
24h mean In/Out 0.37 0.45 0.51 0.48 0.45 0.33 0.30 0.41 0.07
Highest 8h Outdoor 6.1E+3 4.4E+3 3.2E+3 2.1E+3 3.5E+3 7.5E+3 5.4E+3 4.6E+3 1.7E+3
Highest 8h Indoor 2.5E+3 1.9E+3 1.3E+3 9.4E+2 1.3E+3 2.5E+3 2.1E+3 1.8E+3 5.6E+2
Highest 8 h In/Out 0.41 0.43 0.42 0.44 0.38 0.33 0.38 0.40 0.03
Highest 1h Outdoor 8.3E+3 3.4E+3 4.9E+3 2.7E+3 7.9E+3 9.3E+3 6.8E+3 6.2E+3 2.4E+3
Highest 1 h Indoor2 2.5E+3 1.9E+3 1.3E+3 9.4E+2 1.3E+3 2.5E+3 2.1E+3 2.0E+3 8.1E+2
Highest 1h In/Out 0.33 0.39 0.34 0.34 0.25 0.38 0.32 0.34 0.04
Time of highest 1h Outdoor
11/18/14 22:58
11/19/14 10:00
11/20/14 22:41
11/21/14 22:59
11/22/14 21:13
11/24/14 3:33
11/24/14 23:40
Corresponding highest 1h Indoor
11/19/14 1:06
11/19/14 12:57
11/20/14 23:34
11/22/14 2:59
11/22/14 22:01
11/24/14 4:11
11/25/14 0:09
1 Based on 24h periods starting / ending at 10am. Day 1 starts at 11/18/2014 22:00, and has < 24h of data. 2Occurring within 4h of highest 1h outdoor concentration.
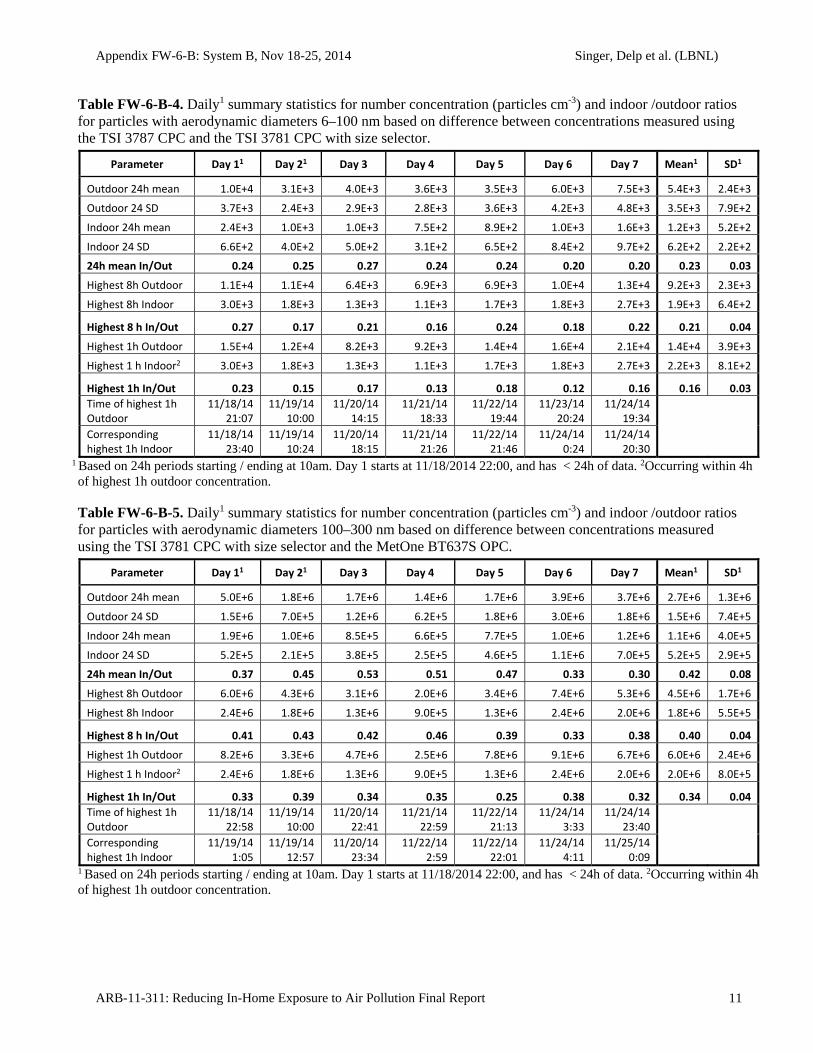
Appendix FW-6-B: System B, Nov 18-25, 2014 Singer, Delp et al. (LBNL)
ARB-11-311: Reducing In-Home Exposure to Air Pollution Final Report 11
Table FW-6-B-4. Daily1 summary statistics for number concentration (particles cm-3) and indoor /outdoor ratios for particles with aerodynamic diameters 6–100 nm based on difference between concentrations measured using the TSI 3787 CPC and the TSI 3781 CPC with size selector.
Parameter Day 11 Day 21 Day 3 Day 4 Day 5 Day 6 Day 7 Mean1 SD1
Outdoor 24h mean 1.0E+4 3.1E+3 4.0E+3 3.6E+3 3.5E+3 6.0E+3 7.5E+3 5.4E+3 2.4E+3
Outdoor 24 SD 3.7E+3 2.4E+3 2.9E+3 2.8E+3 3.6E+3 4.2E+3 4.8E+3 3.5E+3 7.9E+2
Indoor 24h mean 2.4E+3 1.0E+3 1.0E+3 7.5E+2 8.9E+2 1.0E+3 1.6E+3 1.2E+3 5.2E+2
Indoor 24 SD 6.6E+2 4.0E+2 5.0E+2 3.1E+2 6.5E+2 8.4E+2 9.7E+2 6.2E+2 2.2E+2
24h mean In/Out 0.24 0.25 0.27 0.24 0.24 0.20 0.20 0.23 0.03
Highest 8h Outdoor 1.1E+4 1.1E+4 6.4E+3 6.9E+3 6.9E+3 1.0E+4 1.3E+4 9.2E+3 2.3E+3
Highest 8h Indoor 3.0E+3 1.8E+3 1.3E+3 1.1E+3 1.7E+3 1.8E+3 2.7E+3 1.9E+3 6.4E+2
Highest 8 h In/Out 0.27 0.17 0.21 0.16 0.24 0.18 0.22 0.21 0.04
Highest 1h Outdoor 1.5E+4 1.2E+4 8.2E+3 9.2E+3 1.4E+4 1.6E+4 2.1E+4 1.4E+4 3.9E+3
Highest 1 h Indoor2 3.0E+3 1.8E+3 1.3E+3 1.1E+3 1.7E+3 1.8E+3 2.7E+3 2.2E+3 8.1E+2
Highest 1h In/Out 0.23 0.15 0.17 0.13 0.18 0.12 0.16 0.16 0.03
Time of highest 1h Outdoor
11/18/14 21:07
11/19/14 10:00
11/20/14 14:15
11/21/14 18:33
11/22/14 19:44
11/23/14 20:24
11/24/14 19:34
Corresponding highest 1h Indoor
11/18/14 23:40
11/19/14 10:24
11/20/14 18:15
11/21/14 21:26
11/22/14 21:46
11/24/14 0:24
11/24/14 20:30
1 Based on 24h periods starting / ending at 10am. Day 1 starts at 11/18/2014 22:00, and has < 24h of data. 2Occurring within 4h of highest 1h outdoor concentration.
Table FW-6-B-5. Daily1 summary statistics for number concentration (particles cm-3) and indoor /outdoor ratios for particles with aerodynamic diameters 100–300 nm based on difference between concentrations measured using the TSI 3781 CPC with size selector and the MetOne BT637S OPC.
Parameter Day 11 Day 21 Day 3 Day 4 Day 5 Day 6 Day 7 Mean1 SD1
Outdoor 24h mean 5.0E+6 1.8E+6 1.7E+6 1.4E+6 1.7E+6 3.9E+6 3.7E+6 2.7E+6 1.3E+6
Outdoor 24 SD 1.5E+6 7.0E+5 1.2E+6 6.2E+5 1.8E+6 3.0E+6 1.8E+6 1.5E+6 7.4E+5
Indoor 24h mean 1.9E+6 1.0E+6 8.5E+5 6.6E+5 7.7E+5 1.0E+6 1.2E+6 1.1E+6 4.0E+5
Indoor 24 SD 5.2E+5 2.1E+5 3.8E+5 2.5E+5 4.6E+5 1.1E+6 7.0E+5 5.2E+5 2.9E+5
24h mean In/Out 0.37 0.45 0.53 0.51 0.47 0.33 0.30 0.42 0.08
Highest 8h Outdoor 6.0E+6 4.3E+6 3.1E+6 2.0E+6 3.4E+6 7.4E+6 5.3E+6 4.5E+6 1.7E+6
Highest 8h Indoor 2.4E+6 1.8E+6 1.3E+6 9.0E+5 1.3E+6 2.4E+6 2.0E+6 1.8E+6 5.5E+5
Highest 8 h In/Out 0.41 0.43 0.42 0.46 0.39 0.33 0.38 0.40 0.04
Highest 1h Outdoor 8.2E+6 3.3E+6 4.7E+6 2.5E+6 7.8E+6 9.1E+6 6.7E+6 6.0E+6 2.4E+6
Highest 1 h Indoor2 2.4E+6 1.8E+6 1.3E+6 9.0E+5 1.3E+6 2.4E+6 2.0E+6 2.0E+6 8.0E+5
Highest 1h In/Out 0.33 0.39 0.34 0.35 0.25 0.38 0.32 0.34 0.04
Time of highest 1h Outdoor
11/18/14 22:58
11/19/14 10:00
11/20/14 22:41
11/21/14 22:59
11/22/14 21:13
11/24/14 3:33
11/24/14 23:40
Corresponding highest 1h Indoor
11/19/14 1:05
11/19/14 12:57
11/20/14 23:34
11/22/14 2:59
11/22/14 22:01
11/24/14 4:11
11/25/14 0:09
1 Based on 24h periods starting / ending at 10am. Day 1 starts at 11/18/2014 22:00, and has < 24h of data. 2Occurring within 4h of highest 1h outdoor concentration.
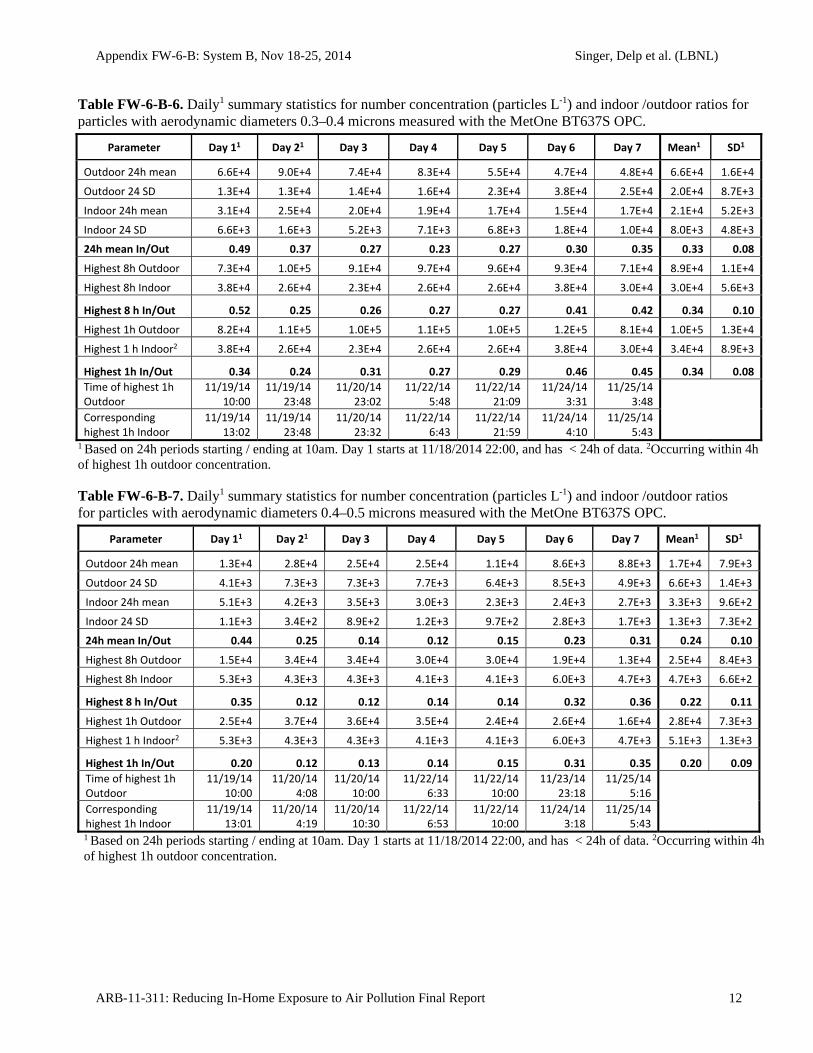
Appendix FW-6-B: System B, Nov 18-25, 2014 Singer, Delp et al. (LBNL)
ARB-11-311: Reducing In-Home Exposure to Air Pollution Final Report 12
Table FW-6-B-6. Daily1 summary statistics for number concentration (particles L-1) and indoor /outdoor ratios for particles with aerodynamic diameters 0.3–0.4 microns measured with the MetOne BT637S OPC.
Parameter Day 11 Day 21 Day 3 Day 4 Day 5 Day 6 Day 7 Mean1 SD1
Outdoor 24h mean 6.6E+4 9.0E+4 7.4E+4 8.3E+4 5.5E+4 4.7E+4 4.8E+4 6.6E+4 1.6E+4
Outdoor 24 SD 1.3E+4 1.3E+4 1.4E+4 1.6E+4 2.3E+4 3.8E+4 2.5E+4 2.0E+4 8.7E+3
Indoor 24h mean 3.1E+4 2.5E+4 2.0E+4 1.9E+4 1.7E+4 1.5E+4 1.7E+4 2.1E+4 5.2E+3
Indoor 24 SD 6.6E+3 1.6E+3 5.2E+3 7.1E+3 6.8E+3 1.8E+4 1.0E+4 8.0E+3 4.8E+3
24h mean In/Out 0.49 0.37 0.27 0.23 0.27 0.30 0.35 0.33 0.08
Highest 8h Outdoor 7.3E+4 1.0E+5 9.1E+4 9.7E+4 9.6E+4 9.3E+4 7.1E+4 8.9E+4 1.1E+4
Highest 8h Indoor 3.8E+4 2.6E+4 2.3E+4 2.6E+4 2.6E+4 3.8E+4 3.0E+4 3.0E+4 5.6E+3
Highest 8 h In/Out 0.52 0.25 0.26 0.27 0.27 0.41 0.42 0.34 0.10
Highest 1h Outdoor 8.2E+4 1.1E+5 1.0E+5 1.1E+5 1.0E+5 1.2E+5 8.1E+4 1.0E+5 1.3E+4
Highest 1 h Indoor2 3.8E+4 2.6E+4 2.3E+4 2.6E+4 2.6E+4 3.8E+4 3.0E+4 3.4E+4 8.9E+3
Highest 1h In/Out 0.34 0.24 0.31 0.27 0.29 0.46 0.45 0.34 0.08
Time of highest 1h Outdoor
11/19/14 10:00
11/19/14 23:48
11/20/14 23:02
11/22/14 5:48
11/22/14 21:09
11/24/14 3:31
11/25/14 3:48
Corresponding highest 1h Indoor
11/19/14 13:02
11/19/14 23:48
11/20/14 23:32
11/22/14 6:43
11/22/14 21:59
11/24/14 4:10
11/25/14 5:43
1 Based on 24h periods starting / ending at 10am. Day 1 starts at 11/18/2014 22:00, and has < 24h of data. 2Occurring within 4h of highest 1h outdoor concentration.
Table FW-6-B-7. Daily1 summary statistics for number concentration (particles L-1) and indoor /outdoor ratios for particles with aerodynamic diameters 0.4–0.5 microns measured with the MetOne BT637S OPC.
Parameter Day 11 Day 21 Day 3 Day 4 Day 5 Day 6 Day 7 Mean1 SD1
Outdoor 24h mean 1.3E+4 2.8E+4 2.5E+4 2.5E+4 1.1E+4 8.6E+3 8.8E+3 1.7E+4 7.9E+3
Outdoor 24 SD 4.1E+3 7.3E+3 7.3E+3 7.7E+3 6.4E+3 8.5E+3 4.9E+3 6.6E+3 1.4E+3
Indoor 24h mean 5.1E+3 4.2E+3 3.5E+3 3.0E+3 2.3E+3 2.4E+3 2.7E+3 3.3E+3 9.6E+2
Indoor 24 SD 1.1E+3 3.4E+2 8.9E+2 1.2E+3 9.7E+2 2.8E+3 1.7E+3 1.3E+3 7.3E+2
24h mean In/Out 0.44 0.25 0.14 0.12 0.15 0.23 0.31 0.24 0.10
Highest 8h Outdoor 1.5E+4 3.4E+4 3.4E+4 3.0E+4 3.0E+4 1.9E+4 1.3E+4 2.5E+4 8.4E+3
Highest 8h Indoor 5.3E+3 4.3E+3 4.3E+3 4.1E+3 4.1E+3 6.0E+3 4.7E+3 4.7E+3 6.6E+2
Highest 8 h In/Out 0.35 0.12 0.12 0.14 0.14 0.32 0.36 0.22 0.11
Highest 1h Outdoor 2.5E+4 3.7E+4 3.6E+4 3.5E+4 2.4E+4 2.6E+4 1.6E+4 2.8E+4 7.3E+3
Highest 1 h Indoor2 5.3E+3 4.3E+3 4.3E+3 4.1E+3 4.1E+3 6.0E+3 4.7E+3 5.1E+3 1.3E+3
Highest 1h In/Out 0.20 0.12 0.13 0.14 0.15 0.31 0.35 0.20 0.09
Time of highest 1h Outdoor
11/19/14 10:00
11/20/14 4:08
11/20/14 10:00
11/22/14 6:33
11/22/14 10:00
11/23/14 23:18
11/25/14 5:16
Corresponding highest 1h Indoor
11/19/14 13:01
11/20/14 4:19
11/20/14 10:30
11/22/14 6:53
11/22/14 10:00
11/24/14 3:18
11/25/14 5:43
1 Based on 24h periods starting / ending at 10am. Day 1 starts at 11/18/2014 22:00, and has < 24h of data. 2Occurring within 4h of highest 1h outdoor concentration.
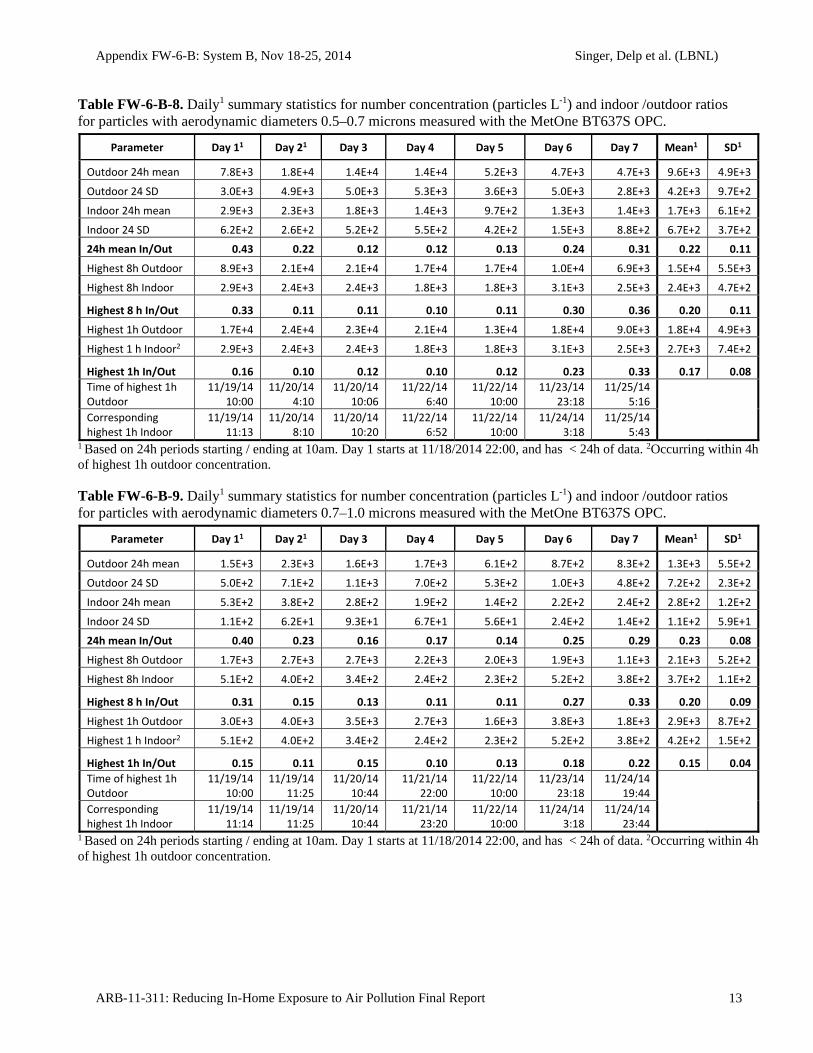
Appendix FW-6-B: System B, Nov 18-25, 2014 Singer, Delp et al. (LBNL)
ARB-11-311: Reducing In-Home Exposure to Air Pollution Final Report 13
Table FW-6-B-8. Daily1 summary statistics for number concentration (particles L-1) and indoor /outdoor ratios for particles with aerodynamic diameters 0.5–0.7 microns measured with the MetOne BT637S OPC.
Parameter Day 11 Day 21 Day 3 Day 4 Day 5 Day 6 Day 7 Mean1 SD1
Outdoor 24h mean 7.8E+3 1.8E+4 1.4E+4 1.4E+4 5.2E+3 4.7E+3 4.7E+3 9.6E+3 4.9E+3
Outdoor 24 SD 3.0E+3 4.9E+3 5.0E+3 5.3E+3 3.6E+3 5.0E+3 2.8E+3 4.2E+3 9.7E+2
Indoor 24h mean 2.9E+3 2.3E+3 1.8E+3 1.4E+3 9.7E+2 1.3E+3 1.4E+3 1.7E+3 6.1E+2
Indoor 24 SD 6.2E+2 2.6E+2 5.2E+2 5.5E+2 4.2E+2 1.5E+3 8.8E+2 6.7E+2 3.7E+2
24h mean In/Out 0.43 0.22 0.12 0.12 0.13 0.24 0.31 0.22 0.11
Highest 8h Outdoor 8.9E+3 2.1E+4 2.1E+4 1.7E+4 1.7E+4 1.0E+4 6.9E+3 1.5E+4 5.5E+3
Highest 8h Indoor 2.9E+3 2.4E+3 2.4E+3 1.8E+3 1.8E+3 3.1E+3 2.5E+3 2.4E+3 4.7E+2
Highest 8 h In/Out 0.33 0.11 0.11 0.10 0.11 0.30 0.36 0.20 0.11
Highest 1h Outdoor 1.7E+4 2.4E+4 2.3E+4 2.1E+4 1.3E+4 1.8E+4 9.0E+3 1.8E+4 4.9E+3
Highest 1 h Indoor2 2.9E+3 2.4E+3 2.4E+3 1.8E+3 1.8E+3 3.1E+3 2.5E+3 2.7E+3 7.4E+2
Highest 1h In/Out 0.16 0.10 0.12 0.10 0.12 0.23 0.33 0.17 0.08
Time of highest 1h Outdoor
11/19/14 10:00
11/20/14 4:10
11/20/14 10:06
11/22/14 6:40
11/22/14 10:00
11/23/14 23:18
11/25/14 5:16
Corresponding highest 1h Indoor
11/19/14 11:13
11/20/14 8:10
11/20/14 10:20
11/22/14 6:52
11/22/14 10:00
11/24/14 3:18
11/25/14 5:43
1 Based on 24h periods starting / ending at 10am. Day 1 starts at 11/18/2014 22:00, and has < 24h of data. 2Occurring within 4h of highest 1h outdoor concentration.
Table FW-6-B-9. Daily1 summary statistics for number concentration (particles L-1) and indoor /outdoor ratios for particles with aerodynamic diameters 0.7–1.0 microns measured with the MetOne BT637S OPC.
Parameter Day 11 Day 21 Day 3 Day 4 Day 5 Day 6 Day 7 Mean1 SD1
Outdoor 24h mean 1.5E+3 2.3E+3 1.6E+3 1.7E+3 6.1E+2 8.7E+2 8.3E+2 1.3E+3 5.5E+2
Outdoor 24 SD 5.0E+2 7.1E+2 1.1E+3 7.0E+2 5.3E+2 1.0E+3 4.8E+2 7.2E+2 2.3E+2
Indoor 24h mean 5.3E+2 3.8E+2 2.8E+2 1.9E+2 1.4E+2 2.2E+2 2.4E+2 2.8E+2 1.2E+2
Indoor 24 SD 1.1E+2 6.2E+1 9.3E+1 6.7E+1 5.6E+1 2.4E+2 1.4E+2 1.1E+2 5.9E+1
24h mean In/Out 0.40 0.23 0.16 0.17 0.14 0.25 0.29 0.23 0.08
Highest 8h Outdoor 1.7E+3 2.7E+3 2.7E+3 2.2E+3 2.0E+3 1.9E+3 1.1E+3 2.1E+3 5.2E+2
Highest 8h Indoor 5.1E+2 4.0E+2 3.4E+2 2.4E+2 2.3E+2 5.2E+2 3.8E+2 3.7E+2 1.1E+2
Highest 8 h In/Out 0.31 0.15 0.13 0.11 0.11 0.27 0.33 0.20 0.09
Highest 1h Outdoor 3.0E+3 4.0E+3 3.5E+3 2.7E+3 1.6E+3 3.8E+3 1.8E+3 2.9E+3 8.7E+2
Highest 1 h Indoor2 5.1E+2 4.0E+2 3.4E+2 2.4E+2 2.3E+2 5.2E+2 3.8E+2 4.2E+2 1.5E+2
Highest 1h In/Out 0.15 0.11 0.15 0.10 0.13 0.18 0.22 0.15 0.04
Time of highest 1h Outdoor
11/19/14 10:00
11/19/14 11:25
11/20/14 10:44
11/21/14 22:00
11/22/14 10:00
11/23/14 23:18
11/24/14 19:44
Corresponding highest 1h Indoor
11/19/14 11:14
11/19/14 11:25
11/20/14 10:44
11/21/14 23:20
11/22/14 10:00
11/24/14 3:18
11/24/14 23:44
1 Based on 24h periods starting / ending at 10am. Day 1 starts at 11/18/2014 22:00, and has < 24h of data. 2Occurring within 4h of highest 1h outdoor concentration.
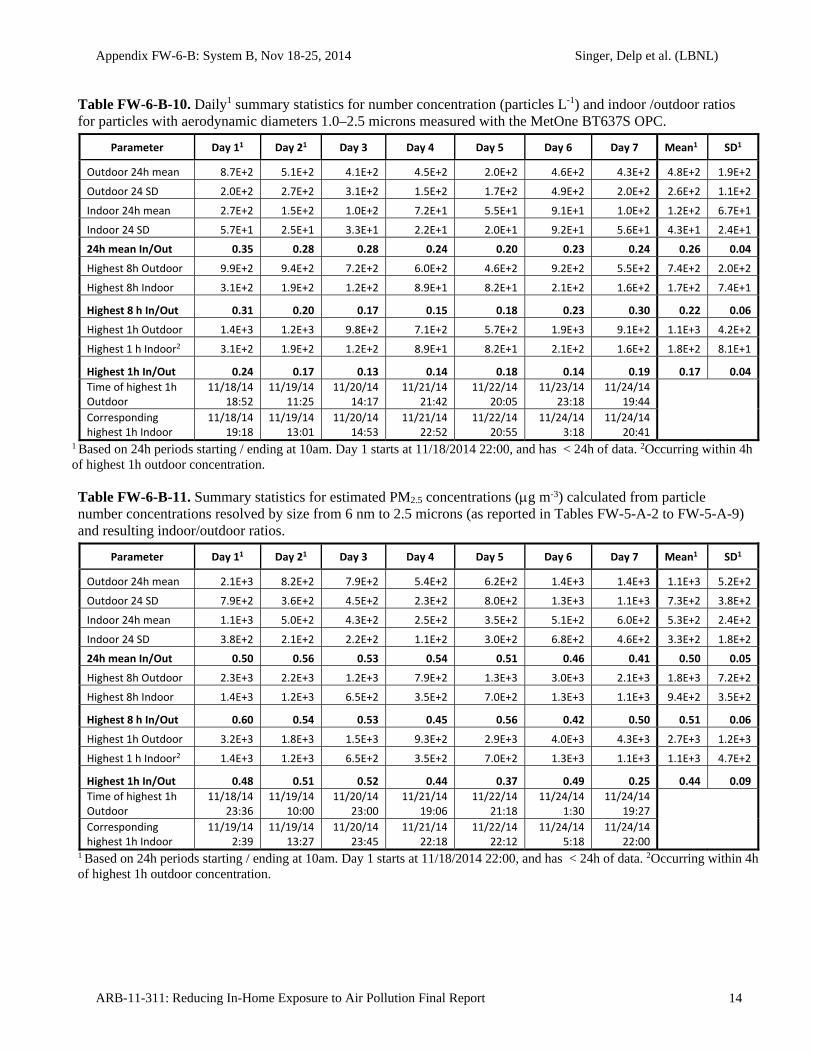
Appendix FW-6-B: System B, Nov 18-25, 2014 Singer, Delp et al. (LBNL)
ARB-11-311: Reducing In-Home Exposure to Air Pollution Final Report 14
Table FW-6-B-10. Daily1 summary statistics for number concentration (particles L-1) and indoor /outdoor ratios for particles with aerodynamic diameters 1.0–2.5 microns measured with the MetOne BT637S OPC.
Parameter Day 11 Day 21 Day 3 Day 4 Day 5 Day 6 Day 7 Mean1 SD1
Outdoor 24h mean 8.7E+2 5.1E+2 4.1E+2 4.5E+2 2.0E+2 4.6E+2 4.3E+2 4.8E+2 1.9E+2
Outdoor 24 SD 2.0E+2 2.7E+2 3.1E+2 1.5E+2 1.7E+2 4.9E+2 2.0E+2 2.6E+2 1.1E+2
Indoor 24h mean 2.7E+2 1.5E+2 1.0E+2 7.2E+1 5.5E+1 9.1E+1 1.0E+2 1.2E+2 6.7E+1
Indoor 24 SD 5.7E+1 2.5E+1 3.3E+1 2.2E+1 2.0E+1 9.2E+1 5.6E+1 4.3E+1 2.4E+1
24h mean In/Out 0.35 0.28 0.28 0.24 0.20 0.23 0.24 0.26 0.04
Highest 8h Outdoor 9.9E+2 9.4E+2 7.2E+2 6.0E+2 4.6E+2 9.2E+2 5.5E+2 7.4E+2 2.0E+2
Highest 8h Indoor 3.1E+2 1.9E+2 1.2E+2 8.9E+1 8.2E+1 2.1E+2 1.6E+2 1.7E+2 7.4E+1
Highest 8 h In/Out 0.31 0.20 0.17 0.15 0.18 0.23 0.30 0.22 0.06
Highest 1h Outdoor 1.4E+3 1.2E+3 9.8E+2 7.1E+2 5.7E+2 1.9E+3 9.1E+2 1.1E+3 4.2E+2
Highest 1 h Indoor2 3.1E+2 1.9E+2 1.2E+2 8.9E+1 8.2E+1 2.1E+2 1.6E+2 1.8E+2 8.1E+1
Highest 1h In/Out 0.24 0.17 0.13 0.14 0.18 0.14 0.19 0.17 0.04
Time of highest 1h Outdoor
11/18/14 18:52
11/19/14 11:25
11/20/14 14:17
11/21/14 21:42
11/22/14 20:05
11/23/14 23:18
11/24/14 19:44
Corresponding highest 1h Indoor
11/18/14 19:18
11/19/14 13:01
11/20/14 14:53
11/21/14 22:52
11/22/14 20:55
11/24/14 3:18
11/24/14 20:41
1 Based on 24h periods starting / ending at 10am. Day 1 starts at 11/18/2014 22:00, and has < 24h of data. 2Occurring within 4h of highest 1h outdoor concentration.
Table FW-6-B-11. Summary statistics for estimated PM2.5 concentrations (g m-3) calculated from particle number concentrations resolved by size from 6 nm to 2.5 microns (as reported in Tables FW-5-A-2 to FW-5-A-9) and resulting indoor/outdoor ratios.
Parameter Day 11 Day 21 Day 3 Day 4 Day 5 Day 6 Day 7 Mean1 SD1
Outdoor 24h mean 2.1E+3 8.2E+2 7.9E+2 5.4E+2 6.2E+2 1.4E+3 1.4E+3 1.1E+3 5.2E+2
Outdoor 24 SD 7.9E+2 3.6E+2 4.5E+2 2.3E+2 8.0E+2 1.3E+3 1.1E+3 7.3E+2 3.8E+2
Indoor 24h mean 1.1E+3 5.0E+2 4.3E+2 2.5E+2 3.5E+2 5.1E+2 6.0E+2 5.3E+2 2.4E+2
Indoor 24 SD 3.8E+2 2.1E+2 2.2E+2 1.1E+2 3.0E+2 6.8E+2 4.6E+2 3.3E+2 1.8E+2
24h mean In/Out 0.50 0.56 0.53 0.54 0.51 0.46 0.41 0.50 0.05
Highest 8h Outdoor 2.3E+3 2.2E+3 1.2E+3 7.9E+2 1.3E+3 3.0E+3 2.1E+3 1.8E+3 7.2E+2
Highest 8h Indoor 1.4E+3 1.2E+3 6.5E+2 3.5E+2 7.0E+2 1.3E+3 1.1E+3 9.4E+2 3.5E+2
Highest 8 h In/Out 0.60 0.54 0.53 0.45 0.56 0.42 0.50 0.51 0.06
Highest 1h Outdoor 3.2E+3 1.8E+3 1.5E+3 9.3E+2 2.9E+3 4.0E+3 4.3E+3 2.7E+3 1.2E+3
Highest 1 h Indoor2 1.4E+3 1.2E+3 6.5E+2 3.5E+2 7.0E+2 1.3E+3 1.1E+3 1.1E+3 4.7E+2
Highest 1h In/Out 0.48 0.51 0.52 0.44 0.37 0.49 0.25 0.44 0.09
Time of highest 1h Outdoor
11/18/14 23:36
11/19/14 10:00
11/20/14 23:00
11/21/14 19:06
11/22/14 21:18
11/24/14 1:30
11/24/14 19:27
Corresponding highest 1h Indoor
11/19/14 2:39
11/19/14 13:27
11/20/14 23:45
11/21/14 22:18
11/22/14 22:12
11/24/14 5:18
11/24/14 22:00
1 Based on 24h periods starting / ending at 10am. Day 1 starts at 11/18/2014 22:00, and has < 24h of data. 2Occurring within 4h of highest 1h outdoor concentration.
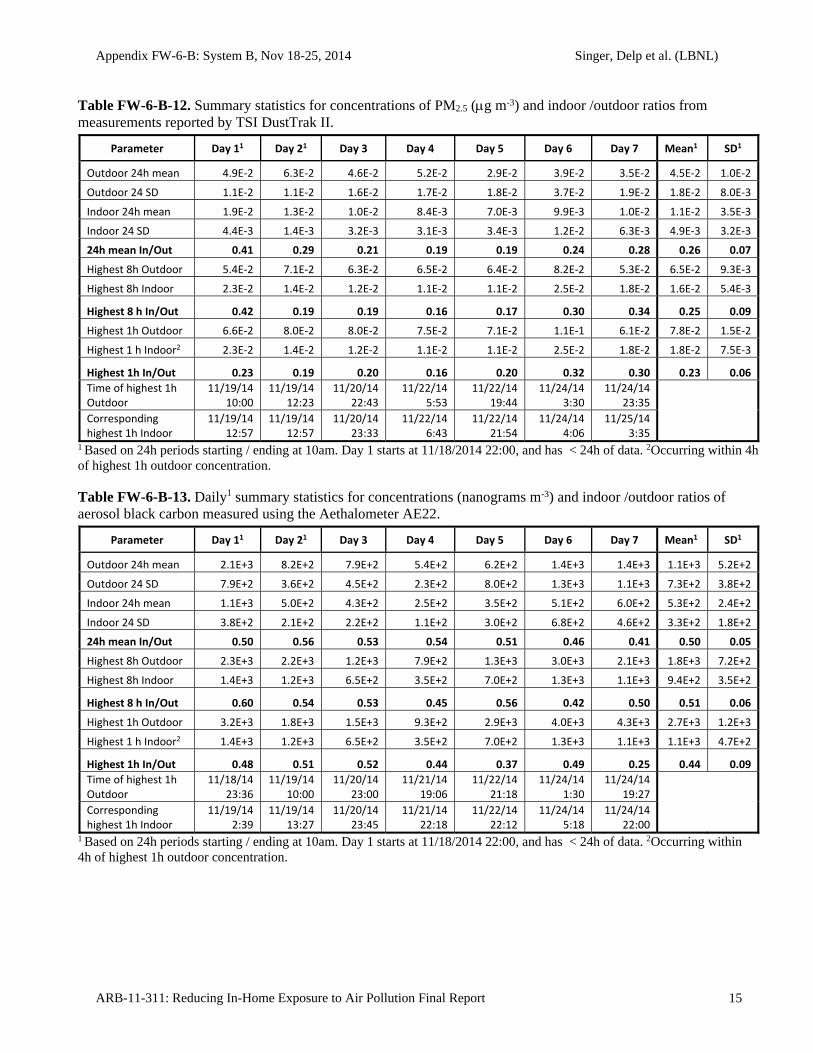
Appendix FW-6-B: System B, Nov 18-25, 2014 Singer, Delp et al. (LBNL)
ARB-11-311: Reducing In-Home Exposure to Air Pollution Final Report 15
Table FW-6-B-12. Summary statistics for concentrations of PM2.5 (g m-3) and indoor /outdoor ratios from measurements reported by TSI DustTrak II.
Parameter Day 11 Day 21 Day 3 Day 4 Day 5 Day 6 Day 7 Mean1 SD1
Outdoor 24h mean 4.9E‐2 6.3E‐2 4.6E‐2 5.2E‐2 2.9E‐2 3.9E‐2 3.5E‐2 4.5E‐2 1.0E‐2
Outdoor 24 SD 1.1E‐2 1.1E‐2 1.6E‐2 1.7E‐2 1.8E‐2 3.7E‐2 1.9E‐2 1.8E‐2 8.0E‐3
Indoor 24h mean 1.9E‐2 1.3E‐2 1.0E‐2 8.4E‐3 7.0E‐3 9.9E‐3 1.0E‐2 1.1E‐2 3.5E‐3
Indoor 24 SD 4.4E‐3 1.4E‐3 3.2E‐3 3.1E‐3 3.4E‐3 1.2E‐2 6.3E‐3 4.9E‐3 3.2E‐3
24h mean In/Out 0.41 0.29 0.21 0.19 0.19 0.24 0.28 0.26 0.07
Highest 8h Outdoor 5.4E‐2 7.1E‐2 6.3E‐2 6.5E‐2 6.4E‐2 8.2E‐2 5.3E‐2 6.5E‐2 9.3E‐3
Highest 8h Indoor 2.3E‐2 1.4E‐2 1.2E‐2 1.1E‐2 1.1E‐2 2.5E‐2 1.8E‐2 1.6E‐2 5.4E‐3
Highest 8 h In/Out 0.42 0.19 0.19 0.16 0.17 0.30 0.34 0.25 0.09
Highest 1h Outdoor 6.6E‐2 8.0E‐2 8.0E‐2 7.5E‐2 7.1E‐2 1.1E‐1 6.1E‐2 7.8E‐2 1.5E‐2
Highest 1 h Indoor2 2.3E‐2 1.4E‐2 1.2E‐2 1.1E‐2 1.1E‐2 2.5E‐2 1.8E‐2 1.8E‐2 7.5E‐3
Highest 1h In/Out 0.23 0.19 0.20 0.16 0.20 0.32 0.30 0.23 0.06
Time of highest 1h Outdoor
11/19/14 10:00
11/19/14 12:23
11/20/14 22:43
11/22/14 5:53
11/22/14 19:44
11/24/14 3:30
11/24/14 23:35
Corresponding highest 1h Indoor
11/19/14 12:57
11/19/14 12:57
11/20/14 23:33
11/22/14 6:43
11/22/14 21:54
11/24/14 4:06
11/25/14 3:35
1 Based on 24h periods starting / ending at 10am. Day 1 starts at 11/18/2014 22:00, and has < 24h of data. 2Occurring within 4h of highest 1h outdoor concentration.
Table FW-6-B-13. Daily1 summary statistics for concentrations (nanograms m-3) and indoor /outdoor ratios of aerosol black carbon measured using the Aethalometer AE22.
Parameter Day 11 Day 21 Day 3 Day 4 Day 5 Day 6 Day 7 Mean1 SD1
Outdoor 24h mean 2.1E+3 8.2E+2 7.9E+2 5.4E+2 6.2E+2 1.4E+3 1.4E+3 1.1E+3 5.2E+2
Outdoor 24 SD 7.9E+2 3.6E+2 4.5E+2 2.3E+2 8.0E+2 1.3E+3 1.1E+3 7.3E+2 3.8E+2
Indoor 24h mean 1.1E+3 5.0E+2 4.3E+2 2.5E+2 3.5E+2 5.1E+2 6.0E+2 5.3E+2 2.4E+2
Indoor 24 SD 3.8E+2 2.1E+2 2.2E+2 1.1E+2 3.0E+2 6.8E+2 4.6E+2 3.3E+2 1.8E+2
24h mean In/Out 0.50 0.56 0.53 0.54 0.51 0.46 0.41 0.50 0.05
Highest 8h Outdoor 2.3E+3 2.2E+3 1.2E+3 7.9E+2 1.3E+3 3.0E+3 2.1E+3 1.8E+3 7.2E+2
Highest 8h Indoor 1.4E+3 1.2E+3 6.5E+2 3.5E+2 7.0E+2 1.3E+3 1.1E+3 9.4E+2 3.5E+2
Highest 8 h In/Out 0.60 0.54 0.53 0.45 0.56 0.42 0.50 0.51 0.06
Highest 1h Outdoor 3.2E+3 1.8E+3 1.5E+3 9.3E+2 2.9E+3 4.0E+3 4.3E+3 2.7E+3 1.2E+3
Highest 1 h Indoor2 1.4E+3 1.2E+3 6.5E+2 3.5E+2 7.0E+2 1.3E+3 1.1E+3 1.1E+3 4.7E+2
Highest 1h In/Out 0.48 0.51 0.52 0.44 0.37 0.49 0.25 0.44 0.09
Time of highest 1h Outdoor
11/18/14 23:36
11/19/14 10:00
11/20/14 23:00
11/21/14 19:06
11/22/14 21:18
11/24/14 1:30
11/24/14 19:27
Corresponding highest 1h Indoor
11/19/14 2:39
11/19/14 13:27
11/20/14 23:45
11/21/14 22:18
11/22/14 22:12
11/24/14 5:18
11/24/14 22:00
1 Based on 24h periods starting / ending at 10am. Day 1 starts at 11/18/2014 22:00, and has < 24h of data. 2Occurring within 4h of highest 1h outdoor concentration.
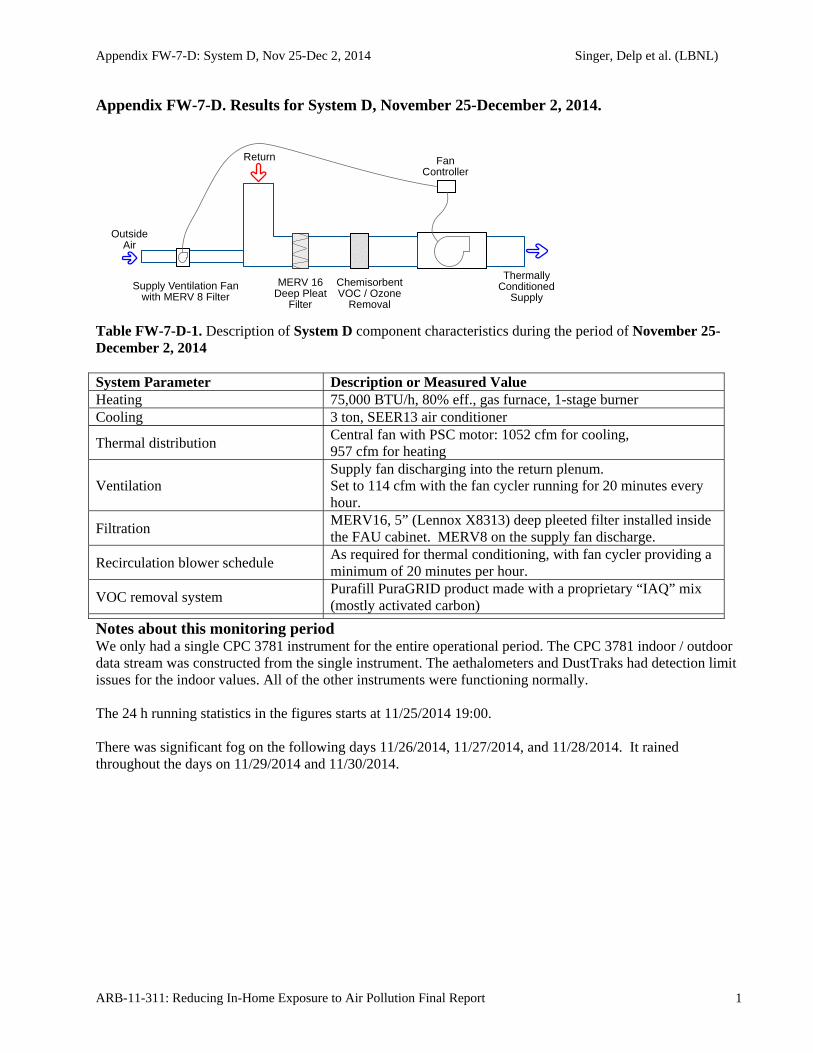
Appendix FW-7-D: System D, Nov 25-Dec 2, 2014 Singer, Delp et al. (LBNL)
ARB-11-311: Reducing In-Home Exposure to Air Pollution Final Report 1
Appendix FW-7-D. Results for System D, November 25-December 2, 2014.
Table FW-7-D-1. Description of System D component characteristics during the period of November 25-December 2, 2014 System Parameter Description or Measured Value Heating 75,000 BTU/h, 80% eff., gas furnace, 1-stage burner Cooling 3 ton, SEER13 air conditioner
Thermal distribution Central fan with PSC motor: 1052 cfm for cooling, 957 cfm for heating
Ventilation Supply fan discharging into the return plenum. Set to 114 cfm with the fan cycler running for 20 minutes every hour.
Filtration MERV16, 5” (Lennox X8313) deep pleeted filter installed inside the FAU cabinet. MERV8 on the supply fan discharge.
Recirculation blower schedule As required for thermal conditioning, with fan cycler providing a minimum of 20 minutes per hour.
VOC removal system Purafill PuraGRID product made with a proprietary “IAQ” mix (mostly activated carbon)
Notes about this monitoring period We only had a single CPC 3781 instrument for the entire operational period. The CPC 3781 indoor / outdoor data stream was constructed from the single instrument. The aethalometers and DustTraks had detection limit issues for the indoor values. All of the other instruments were functioning normally. The 24 h running statistics in the figures starts at 11/25/2014 19:00. There was significant fog on the following days 11/26/2014, 11/27/2014, and 11/28/2014. It rained throughout the days on 11/29/2014 and 11/30/2014.
OutsideAir
ThermallyConditioned
Supply
FanController
Supply Ventilation Fanwith MERV 8 Filter
MERV 16Deep Pleat
Filter
ChemisorbentVOC / Ozone
Removal
Return
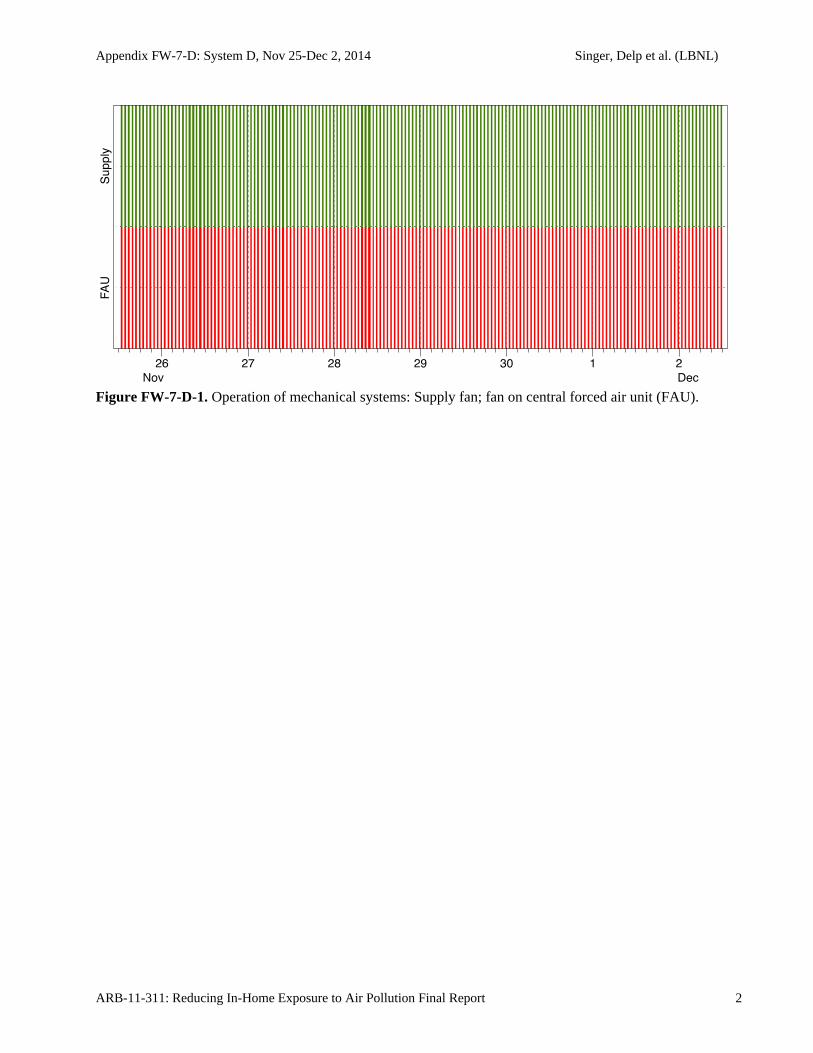
Appendix FW-7-D: System D, Nov 25-Dec 2, 2014 Singer, Delp et al. (LBNL)
ARB-11-311: Reducing In-Home Exposure to Air Pollution Final Report 2
Figure FW-7-D-1. Operation of mechanical systems: Supply fan; fan on central forced air unit (FAU).
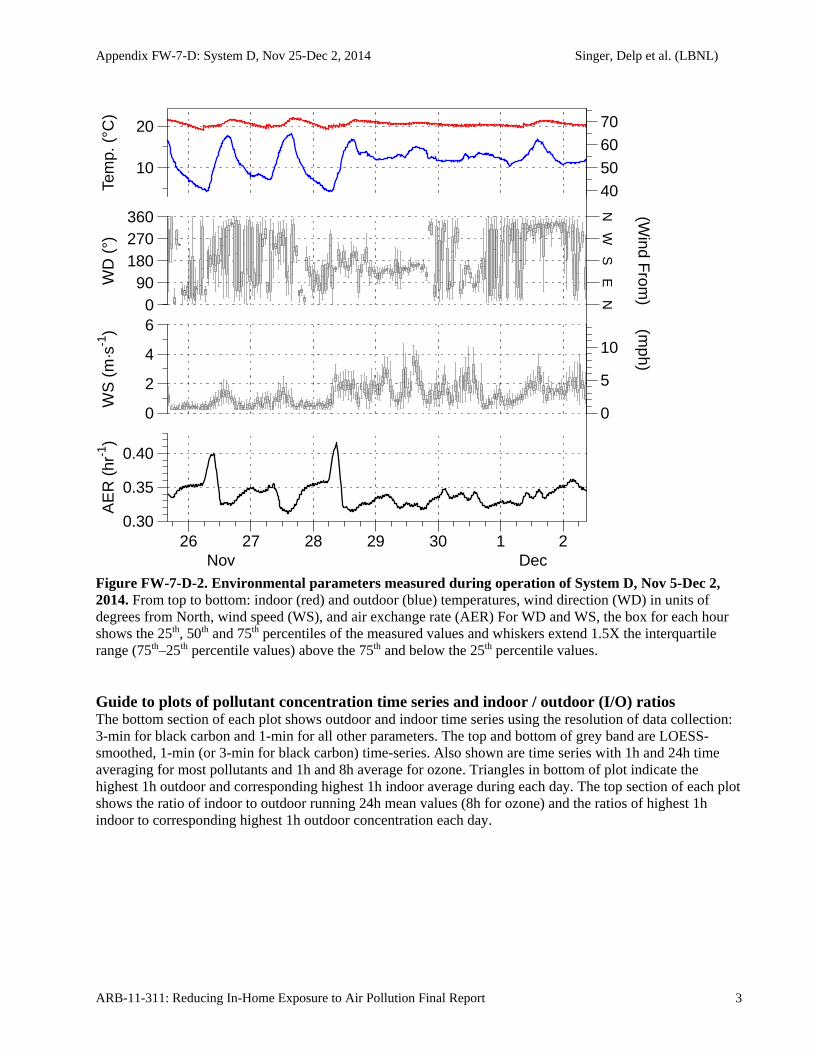
Appendix FW-7-D: System D, Nov 25-Dec 2, 2014 Singer, Delp et al. (LBNL)
ARB-11-311: Reducing In-Home Exposure to Air Pollution Final Report 3
Figure FW-7-D-2. Environmental parameters measured during operation of System D, Nov 5-Dec 2, 2014. From top to bottom: indoor (red) and outdoor (blue) temperatures, wind direction (WD) in units of degrees from North, wind speed (WS), and air exchange rate (AER) For WD and WS, the box for each hour shows the 25th, 50th and 75th percentiles of the measured values and whiskers extend 1.5X the interquartile range (75th–25th percentile values) above the 75th and below the 25th percentile values. Guide to plots of pollutant concentration time series and indoor / outdoor (I/O) ratios The bottom section of each plot shows outdoor and indoor time series using the resolution of data collection: 3-min for black carbon and 1-min for all other parameters. The top and bottom of grey band are LOESS-smoothed, 1-min (or 3-min for black carbon) time-series. Also shown are time series with 1h and 24h time averaging for most pollutants and 1h and 8h average for ozone. Triangles in bottom of plot indicate the highest 1h outdoor and corresponding highest 1h indoor average during each day. The top section of each plot shows the ratio of indoor to outdoor running 24h mean values (8h for ozone) and the ratios of highest 1h indoor to corresponding highest 1h outdoor concentration each day.
0
5
10
40506070
NE
SW
N
(mph)
(Wind F
rom)
AE
R (
hr-1
)
0.30
0.35
0.40
WS
(m
·s-1
)
0
2
4
6
WD
(°)
090
180270360
Tem
p. (
°C)
10
20
26 27 28 29 30 1 2Nov Dec
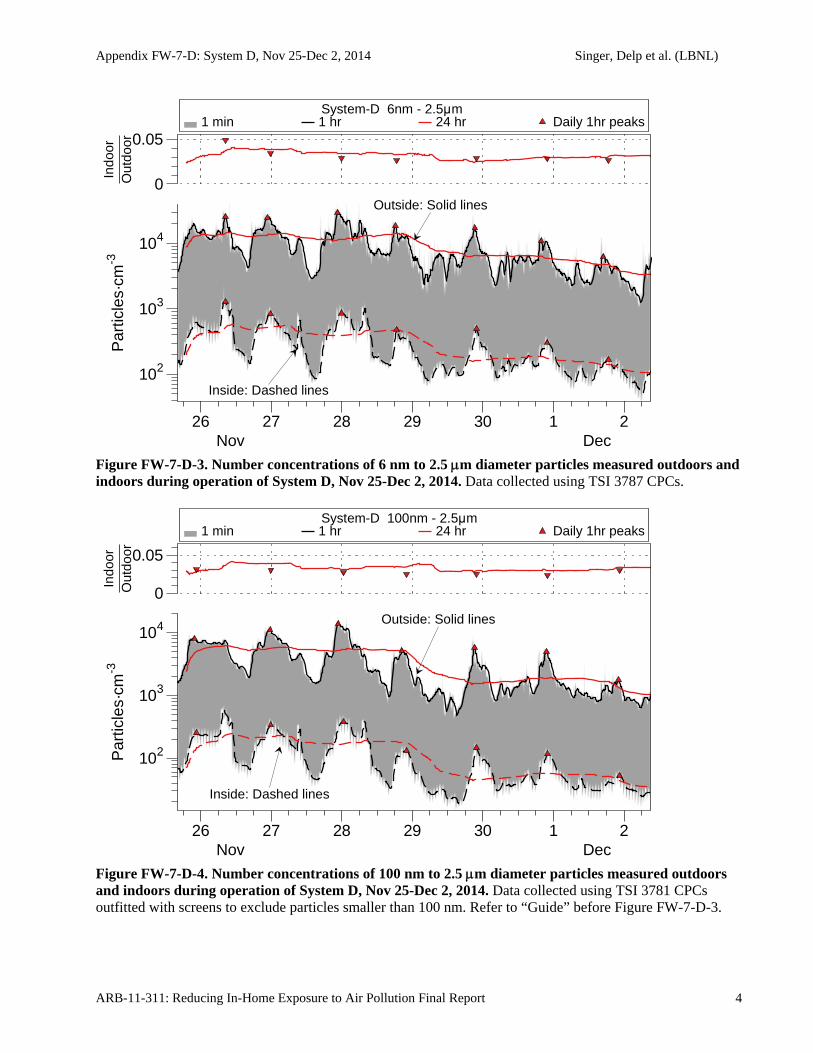
Appendix FW-7-D: System D, Nov 25-Dec 2, 2014 Singer, Delp et al. (LBNL)
ARB-11-311: Reducing In-Home Exposure to Air Pollution Final Report 4
Figure FW-7-D-3. Number concentrations of 6 nm to 2.5 m diameter particles measured outdoors and indoors during operation of System D, Nov 25-Dec 2, 2014. Data collected using TSI 3787 CPCs.
Figure FW-7-D-4. Number concentrations of 100 nm to 2.5 m diameter particles measured outdoors and indoors during operation of System D, Nov 25-Dec 2, 2014. Data collected using TSI 3781 CPCs outfitted with screens to exclude particles smaller than 100 nm. Refer to “Guide” before Figure FW-7-D-3.
1 min 1 hr 24 hr Daily 1hr peaks System-D 6nm - 2.5μm
Outside: Solid lines
Inside: Dashed lines
Par
ticle
s·cm
-3
102
103
104
Indo
orO
utdo
or
0
0.05
26 27 28 29 30 1 2Nov Dec
1 min 1 hr 24 hr Daily 1hr peaks System-D 100nm - 2.5μm
Outside: Solid lines
Inside: Dashed lines
Par
ticle
s·cm
-3
102
103
104
Indo
orO
utdo
or
0
0.05
26 27 28 29 30 1 2Nov Dec
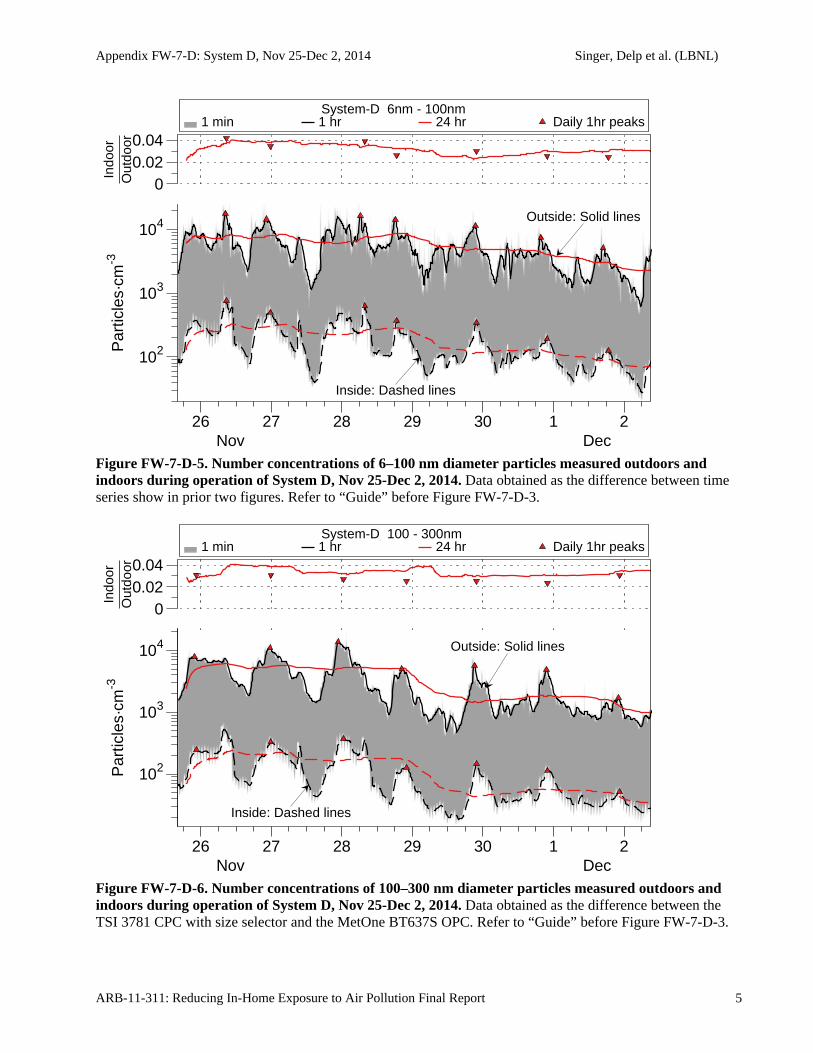
Appendix FW-7-D: System D, Nov 25-Dec 2, 2014 Singer, Delp et al. (LBNL)
ARB-11-311: Reducing In-Home Exposure to Air Pollution Final Report 5
Figure FW-7-D-5. Number concentrations of 6–100 nm diameter particles measured outdoors and indoors during operation of System D, Nov 25-Dec 2, 2014. Data obtained as the difference between time series show in prior two figures. Refer to “Guide” before Figure FW-7-D-3.
Figure FW-7-D-6. Number concentrations of 100–300 nm diameter particles measured outdoors and indoors during operation of System D, Nov 25-Dec 2, 2014. Data obtained as the difference between the TSI 3781 CPC with size selector and the MetOne BT637S OPC. Refer to “Guide” before Figure FW-7-D-3.
1 min 1 hr 24 hr Daily 1hr peaks System-D 6nm - 100nm
Outside: Solid lines
Inside: Dashed lines
Par
ticle
s·cm
-3
102
103
104
Indo
orO
utdo
or
00.020.04
26 27 28 29 30 1 2Nov Dec
1 min 1 hr 24 hr Daily 1hr peaks System-D 100 - 300nm
Outside: Solid lines
Inside: Dashed lines
102
103
104
Par
ticle
s·cm
-3In
door
Out
door
00.020.04
26 27 28 29 30 1 2Nov Dec
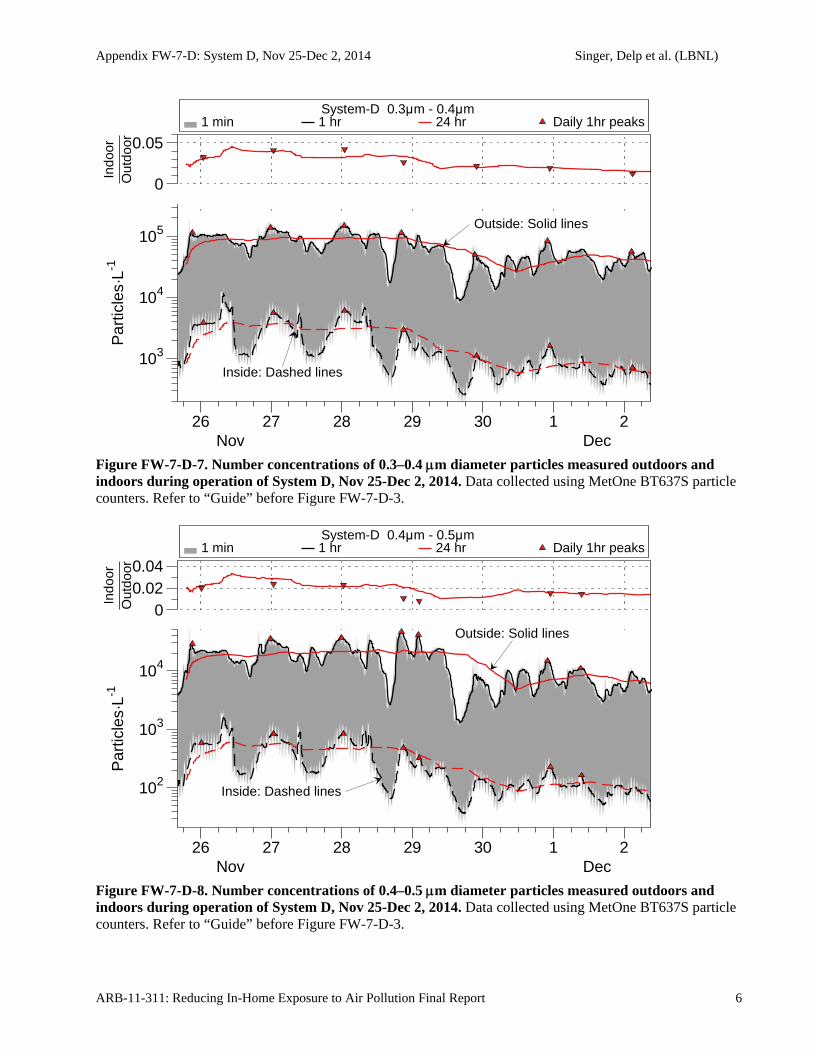
Appendix FW-7-D: System D, Nov 25-Dec 2, 2014 Singer, Delp et al. (LBNL)
ARB-11-311: Reducing In-Home Exposure to Air Pollution Final Report 6
Figure FW-7-D-7. Number concentrations of 0.3–0.4 m diameter particles measured outdoors and indoors during operation of System D, Nov 25-Dec 2, 2014. Data collected using MetOne BT637S particle counters. Refer to “Guide” before Figure FW-7-D-3.
Figure FW-7-D-8. Number concentrations of 0.4–0.5 m diameter particles measured outdoors and indoors during operation of System D, Nov 25-Dec 2, 2014. Data collected using MetOne BT637S particle counters. Refer to “Guide” before Figure FW-7-D-3.
1 min 1 hr 24 hr Daily 1hr peaks System-D 0.3μm - 0.4μm
Outside: Solid lines
Inside: Dashed lines
Par
ticle
s·L-1
103
104
105
Indo
orO
utdo
or
0
0.05
26 27 28 29 30 1 2Nov Dec
1 min 1 hr 24 hr Daily 1hr peaks System-D 0.4μm - 0.5μm
Outside: Solid lines
Inside: Dashed lines
Par
ticle
s·L-1
102
103
104
Indo
orO
utdo
or
00.020.04
26 27 28 29 30 1 2Nov Dec
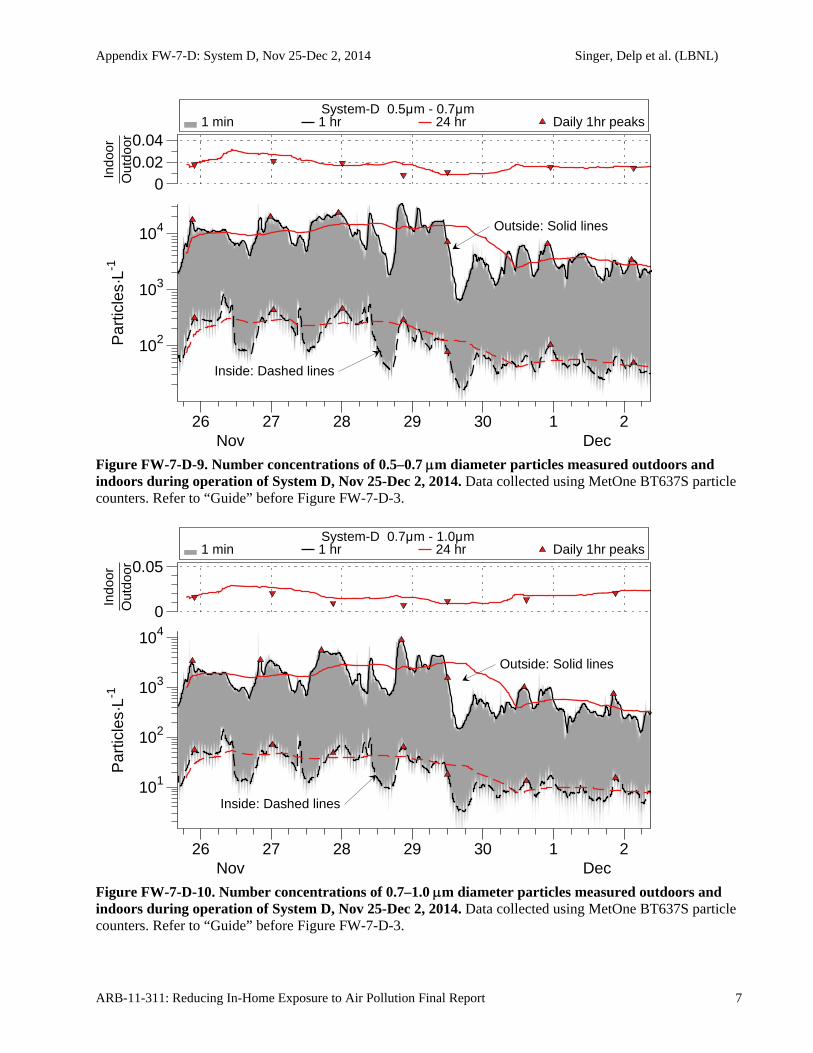
Appendix FW-7-D: System D, Nov 25-Dec 2, 2014 Singer, Delp et al. (LBNL)
ARB-11-311: Reducing In-Home Exposure to Air Pollution Final Report 7
Figure FW-7-D-9. Number concentrations of 0.5–0.7 m diameter particles measured outdoors and indoors during operation of System D, Nov 25-Dec 2, 2014. Data collected using MetOne BT637S particle counters. Refer to “Guide” before Figure FW-7-D-3.
Figure FW-7-D-10. Number concentrations of 0.7–1.0 m diameter particles measured outdoors and indoors during operation of System D, Nov 25-Dec 2, 2014. Data collected using MetOne BT637S particle counters. Refer to “Guide” before Figure FW-7-D-3.
1 min 1 hr 24 hr Daily 1hr peaks System-D 0.5μm - 0.7μm
Outside: Solid lines
Inside: Dashed lines
Par
ticle
s·L-1
102
103
104
Indo
orO
utdo
or
00.020.04
26 27 28 29 30 1 2Nov Dec
1 min 1 hr 24 hr Daily 1hr peaks System-D 0.7μm - 1.0μm
Outside: Solid lines
Inside: Dashed lines
Par
ticle
s·L-1
101
102
103
104
Indo
orO
utdo
or
0
0.05
26 27 28 29 30 1 2Nov Dec
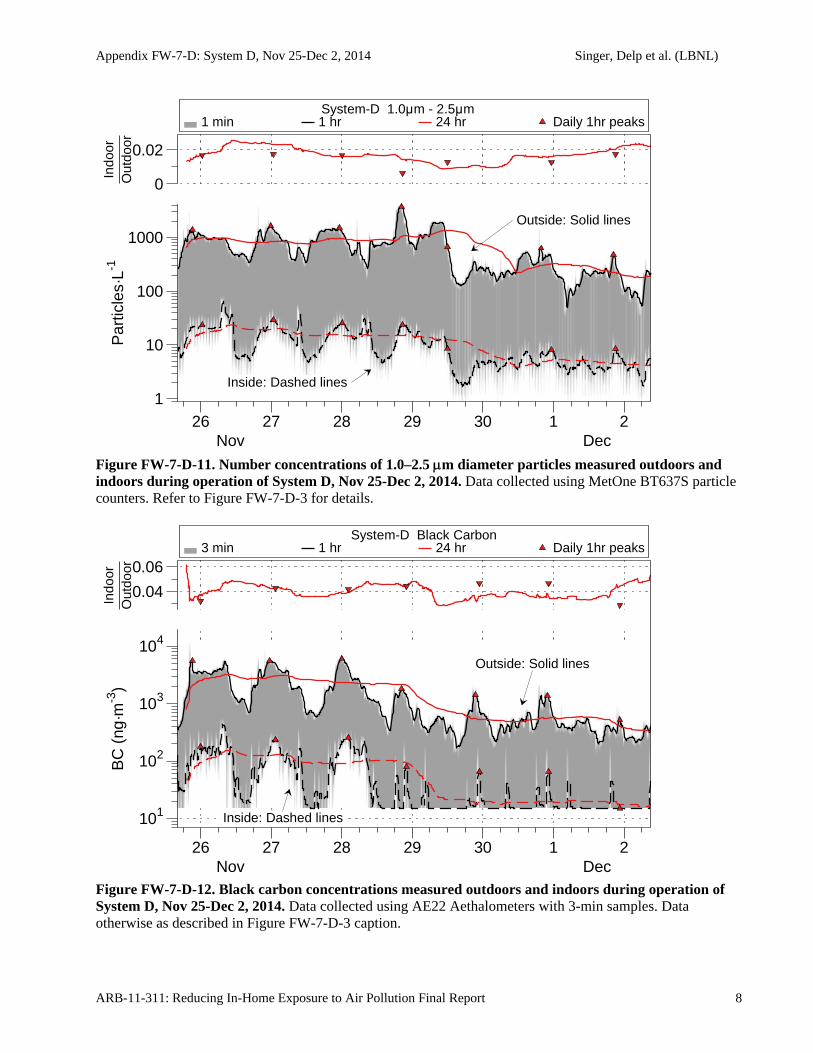
Appendix FW-7-D: System D, Nov 25-Dec 2, 2014 Singer, Delp et al. (LBNL)
ARB-11-311: Reducing In-Home Exposure to Air Pollution Final Report 8
Figure FW-7-D-11. Number concentrations of 1.0–2.5 m diameter particles measured outdoors and indoors during operation of System D, Nov 25-Dec 2, 2014. Data collected using MetOne BT637S particle counters. Refer to Figure FW-7-D-3 for details.
Figure FW-7-D-12. Black carbon concentrations measured outdoors and indoors during operation of System D, Nov 25-Dec 2, 2014. Data collected using AE22 Aethalometers with 3-min samples. Data otherwise as described in Figure FW-7-D-3 caption.
1 min 1 hr 24 hr Daily 1hr peaks System-D 1.0μm - 2.5μm
Outside: Solid lines
Inside: Dashed lines
Par
ticle
s·L-1
1
10
100
1000
Indo
orO
utdo
or
0
0.02
26 27 28 29 30 1 2Nov Dec
3 min 1 hr 24 hr Daily 1hr peaks System-D Black Carbon
Outside: Solid lines
Inside: Dashed lines
BC
(ng
·m-3
)
101
102
103
104
Indo
orO
utdo
or
0.04
0.06
26 27 28 29 30 1 2Nov Dec
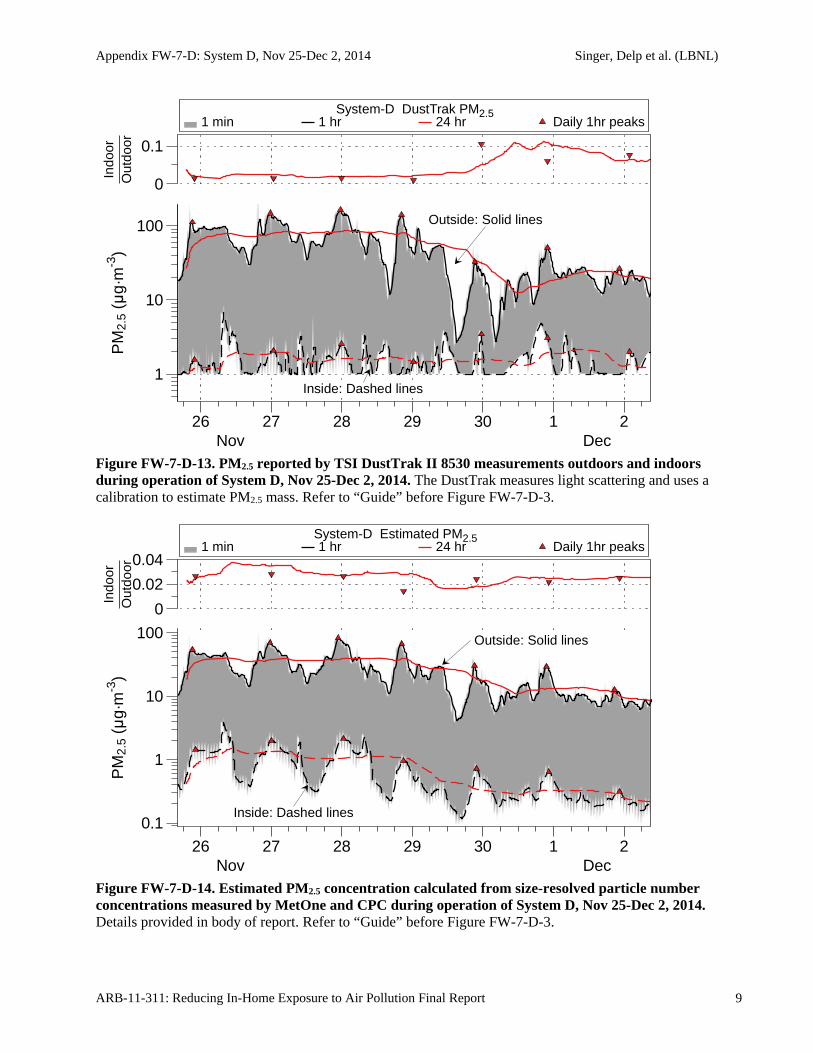
Appendix FW-7-D: System D, Nov 25-Dec 2, 2014 Singer, Delp et al. (LBNL)
ARB-11-311: Reducing In-Home Exposure to Air Pollution Final Report 9
Figure FW-7-D-13. PM2.5 reported by TSI DustTrak II 8530 measurements outdoors and indoors during operation of System D, Nov 25-Dec 2, 2014. The DustTrak measures light scattering and uses a calibration to estimate PM2.5 mass. Refer to “Guide” before Figure FW-7-D-3.
Figure FW-7-D-14. Estimated PM2.5 concentration calculated from size-resolved particle number concentrations measured by MetOne and CPC during operation of System D, Nov 25-Dec 2, 2014. Details provided in body of report. Refer to “Guide” before Figure FW-7-D-3.
1 min 1 hr 24 hr Daily 1hr peaks System-D DustTrak PM2.5
1
10
100 Outside: Solid lines
Inside: Dashed lines
PM
2.5
(μg·
m-3
)In
door
Out
door
0
0.1
26 27 28 29 30 1 2Nov Dec
1 min 1 hr 24 hr Daily 1hr peaks System-D Estimated PM2.5
Outside: Solid lines
Inside: Dashed lines
PM
2.5
(μg·
m-3
)
0.1
1
10
100
Indo
orO
utdo
or
0
0.02
0.04
26 27 28 29 30 1 2Nov Dec

Appendix FW-7-D: System D, Nov 25-Dec 2, 2014 Singer, Delp et al. (LBNL)
ARB-11-311: Reducing In-Home Exposure to Air Pollution Final Report 10
Table FW-7-D-2. Daily1 summary statistics for number concentration (particles cm-3) and indoor /outdoor ratios for particles with aerodynamic diameters 6 nm to 2.5 micron measured using the TSI 3787 CPC.
Parameter Day 11 Day 21 Day 3 Day 4 Day 5 Day 6 Day 7 Mean1 SD1
Outdoor 24h mean 1.4E+4 1.2E+4 1.3E+4 7.3E+3 6.5E+3 5.0E+3 3.5E+3 8.8E+3 3.8E+3
Outdoor 24 SD 5.5E+3 5.9E+3 9.5E+3 4.2E+3 3.6E+3 2.6E+3 1.7E+3 4.7E+3 2.4E+3
Indoor 24h mean 5.5E+2 4.2E+2 4.5E+2 1.9E+2 1.8E+2 1.5E+2 1.1E+2 2.9E+2 1.6E+2
Indoor 24 SD 3.2E+2 2.2E+2 2.8E+2 1.1E+2 9.9E+1 6.7E+1 3.6E+1 1.6E+2 1.0E+2
24h mean In/Out 0.03 0.04 0.03 0.03 0.03 0.03 0.03 0.03 0.00
Highest 8h Outdoor 1.6E+4 1.9E+4 2.0E+4 1.2E+4 1.0E+4 7.5E+3 4.7E+3 1.3E+4 5.3E+3
Highest 8h Indoor 7.5E+2 6.5E+2 6.7E+2 4.7E+2 2.9E+2 2.1E+2 1.4E+2 4.6E+2 2.3E+2
Highest 8 h In/Out 0.05 0.03 0.03 0.04 0.03 0.03 0.03 0.03 0.01
Highest 1h Outdoor 2.6E+4 2.4E+4 2.9E+4 1.8E+4 1.7E+4 1.1E+4 6.3E+3 1.9E+4 7.7E+3
Highest 1 h Indoor2 7.5E+2 6.5E+2 6.7E+2 4.7E+2 2.9E+2 2.1E+2 1.4E+2 6.3E+2 3.5E+2
Highest 1h In/Out 0.05 0.03 0.03 0.03 0.03 0.03 0.03 0.03 0.01
Time of highest 1h Outdoor
11/26/14 8:22
11/26/14 22:38
11/27/14 22:32
11/28/14 18:13
11/29/14 21:18
11/30/14 19:47
12/1/14 16:53
Corresponding highest 1h Indoor
11/26/14 8:26
11/26/14 23:46
11/27/14 23:54
11/28/14 18:45
11/29/14 21:47
11/30/14 21:50
12/1/14 18:36
1 Based on 24h periods starting / ending at noon. Day 1 starts at 11/25/2014 19:00, and has < 24h of data. 2Occurring within 4h of highest 1h outdoor concentration.
Table FW-7-D-3. Daily1 summary statistics for number concentration (particles cm-3) and indoor /outdoor ratios for particles with aerodynamic diameters 100 nm to 2.5 micron measured using the TSI 3781 CPC with size selector.
Parameter Day 11 Day 21 Day 3 Day 4 Day 5 Day 6 Day 7 Mean1 SD1
Outdoor 24h mean 5.8E+3 5.4E+3 5.3E+3 2.0E+3 1.7E+3 1.8E+3 1.0E+3 3.3E+3 1.9E+3
Outdoor 24 SD 2.0E+3 2.6E+3 3.8E+3 1.3E+3 1.2E+3 1.1E+3 3.2E+2 1.8E+3 1.1E+3
Indoor 24h mean 2.4E+2 1.8E+2 1.8E+2 5.8E+1 5.1E+1 5.5E+1 3.4E+1 1.1E+2 7.6E+1
Indoor 24 SD 1.4E+2 9.3E+1 1.2E+2 3.5E+1 3.3E+1 2.6E+1 9.5E+0 6.5E+1 4.8E+1
24h mean In/Out 0.03 0.04 0.03 0.03 0.03 0.03 0.03 0.03 0.00
Highest 8h Outdoor 7.2E+3 8.5E+3 9.7E+3 3.7E+3 3.0E+3 2.8E+3 1.3E+3 5.2E+3 3.0E+3
Highest 8h Indoor 2.6E+2 2.7E+2 3.0E+2 1.9E+2 8.9E+1 8.2E+1 4.3E+1 1.8E+2 9.7E+1
Highest 8 h In/Out 0.04 0.03 0.03 0.05 0.03 0.03 0.03 0.03 0.01
Highest 1h Outdoor 8.0E+3 1.1E+4 1.4E+4 5.1E+3 5.8E+3 4.9E+3 1.7E+3 7.2E+3 3.8E+3
Highest 1 h Indoor2 2.6E+2 2.7E+2 3.0E+2 1.9E+2 8.9E+1 8.2E+1 4.3E+1 2.0E+2 1.1E+2
Highest 1h In/Out 0.03 0.03 0.03 0.03 0.03 0.02 0.03 0.03 0.00
Time of highest 1h Outdoor
11/25/14 21:50
11/26/14 23:35
11/27/14 22:42
11/28/14 20:27
11/29/14 21:14
11/30/14 21:39
12/1/14 22:06
Corresponding highest 1h Indoor
11/25/14 22:28
11/26/14 23:53
11/28/14 0:33
11/28/14 22:01
11/29/14 21:46
11/30/14 21:57
12/1/14 22:35
1 Based on 24h periods starting / ending at noon. Day 1 starts at 11/25/2014 19:00, and has < 24h of data. 2Occurring within 4h of highest 1h outdoor concentration.
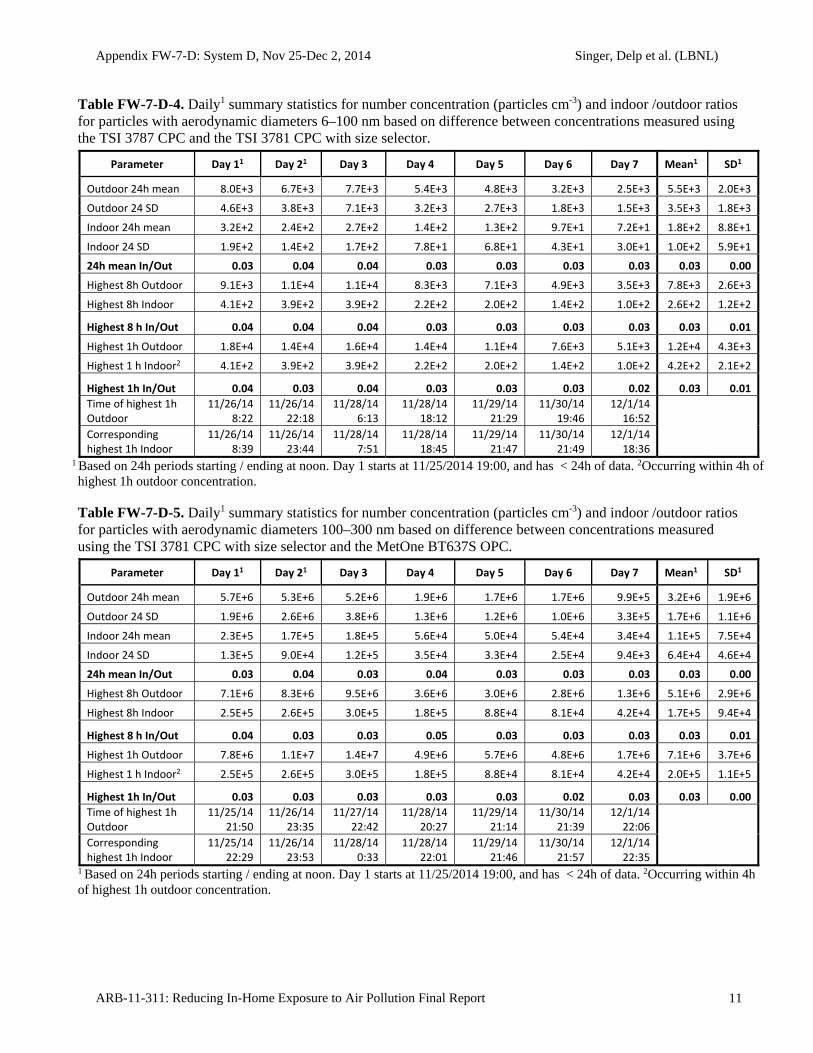
Appendix FW-7-D: System D, Nov 25-Dec 2, 2014 Singer, Delp et al. (LBNL)
ARB-11-311: Reducing In-Home Exposure to Air Pollution Final Report 11
Table FW-7-D-4. Daily1 summary statistics for number concentration (particles cm-3) and indoor /outdoor ratios for particles with aerodynamic diameters 6–100 nm based on difference between concentrations measured using the TSI 3787 CPC and the TSI 3781 CPC with size selector.
Parameter Day 11 Day 21 Day 3 Day 4 Day 5 Day 6 Day 7 Mean1 SD1
Outdoor 24h mean 8.0E+3 6.7E+3 7.7E+3 5.4E+3 4.8E+3 3.2E+3 2.5E+3 5.5E+3 2.0E+3
Outdoor 24 SD 4.6E+3 3.8E+3 7.1E+3 3.2E+3 2.7E+3 1.8E+3 1.5E+3 3.5E+3 1.8E+3
Indoor 24h mean 3.2E+2 2.4E+2 2.7E+2 1.4E+2 1.3E+2 9.7E+1 7.2E+1 1.8E+2 8.8E+1
Indoor 24 SD 1.9E+2 1.4E+2 1.7E+2 7.8E+1 6.8E+1 4.3E+1 3.0E+1 1.0E+2 5.9E+1
24h mean In/Out 0.03 0.04 0.04 0.03 0.03 0.03 0.03 0.03 0.00
Highest 8h Outdoor 9.1E+3 1.1E+4 1.1E+4 8.3E+3 7.1E+3 4.9E+3 3.5E+3 7.8E+3 2.6E+3
Highest 8h Indoor 4.1E+2 3.9E+2 3.9E+2 2.2E+2 2.0E+2 1.4E+2 1.0E+2 2.6E+2 1.2E+2
Highest 8 h In/Out 0.04 0.04 0.04 0.03 0.03 0.03 0.03 0.03 0.01
Highest 1h Outdoor 1.8E+4 1.4E+4 1.6E+4 1.4E+4 1.1E+4 7.6E+3 5.1E+3 1.2E+4 4.3E+3
Highest 1 h Indoor2 4.1E+2 3.9E+2 3.9E+2 2.2E+2 2.0E+2 1.4E+2 1.0E+2 4.2E+2 2.1E+2
Highest 1h In/Out 0.04 0.03 0.04 0.03 0.03 0.03 0.02 0.03 0.01
Time of highest 1h Outdoor
11/26/14 8:22
11/26/14 22:18
11/28/14 6:13
11/28/14 18:12
11/29/14 21:29
11/30/14 19:46
12/1/14 16:52
Corresponding highest 1h Indoor
11/26/14 8:39
11/26/14 23:44
11/28/14 7:51
11/28/14 18:45
11/29/14 21:47
11/30/14 21:49
12/1/14 18:36
1 Based on 24h periods starting / ending at noon. Day 1 starts at 11/25/2014 19:00, and has < 24h of data. 2Occurring within 4h of highest 1h outdoor concentration.
Table FW-7-D-5. Daily1 summary statistics for number concentration (particles cm-3) and indoor /outdoor ratios for particles with aerodynamic diameters 100–300 nm based on difference between concentrations measured using the TSI 3781 CPC with size selector and the MetOne BT637S OPC.
Parameter Day 11 Day 21 Day 3 Day 4 Day 5 Day 6 Day 7 Mean1 SD1
Outdoor 24h mean 5.7E+6 5.3E+6 5.2E+6 1.9E+6 1.7E+6 1.7E+6 9.9E+5 3.2E+6 1.9E+6
Outdoor 24 SD 1.9E+6 2.6E+6 3.8E+6 1.3E+6 1.2E+6 1.0E+6 3.3E+5 1.7E+6 1.1E+6
Indoor 24h mean 2.3E+5 1.7E+5 1.8E+5 5.6E+4 5.0E+4 5.4E+4 3.4E+4 1.1E+5 7.5E+4
Indoor 24 SD 1.3E+5 9.0E+4 1.2E+5 3.5E+4 3.3E+4 2.5E+4 9.4E+3 6.4E+4 4.6E+4
24h mean In/Out 0.03 0.04 0.03 0.04 0.03 0.03 0.03 0.03 0.00
Highest 8h Outdoor 7.1E+6 8.3E+6 9.5E+6 3.6E+6 3.0E+6 2.8E+6 1.3E+6 5.1E+6 2.9E+6
Highest 8h Indoor 2.5E+5 2.6E+5 3.0E+5 1.8E+5 8.8E+4 8.1E+4 4.2E+4 1.7E+5 9.4E+4
Highest 8 h In/Out 0.04 0.03 0.03 0.05 0.03 0.03 0.03 0.03 0.01
Highest 1h Outdoor 7.8E+6 1.1E+7 1.4E+7 4.9E+6 5.7E+6 4.8E+6 1.7E+6 7.1E+6 3.7E+6
Highest 1 h Indoor2 2.5E+5 2.6E+5 3.0E+5 1.8E+5 8.8E+4 8.1E+4 4.2E+4 2.0E+5 1.1E+5
Highest 1h In/Out 0.03 0.03 0.03 0.03 0.03 0.02 0.03 0.03 0.00
Time of highest 1h Outdoor
11/25/14 21:50
11/26/14 23:35
11/27/14 22:42
11/28/14 20:27
11/29/14 21:14
11/30/14 21:39
12/1/14 22:06
Corresponding highest 1h Indoor
11/25/14 22:29
11/26/14 23:53
11/28/14 0:33
11/28/14 22:01
11/29/14 21:46
11/30/14 21:57
12/1/14 22:35
1 Based on 24h periods starting / ending at noon. Day 1 starts at 11/25/2014 19:00, and has < 24h of data. 2Occurring within 4h of highest 1h outdoor concentration.
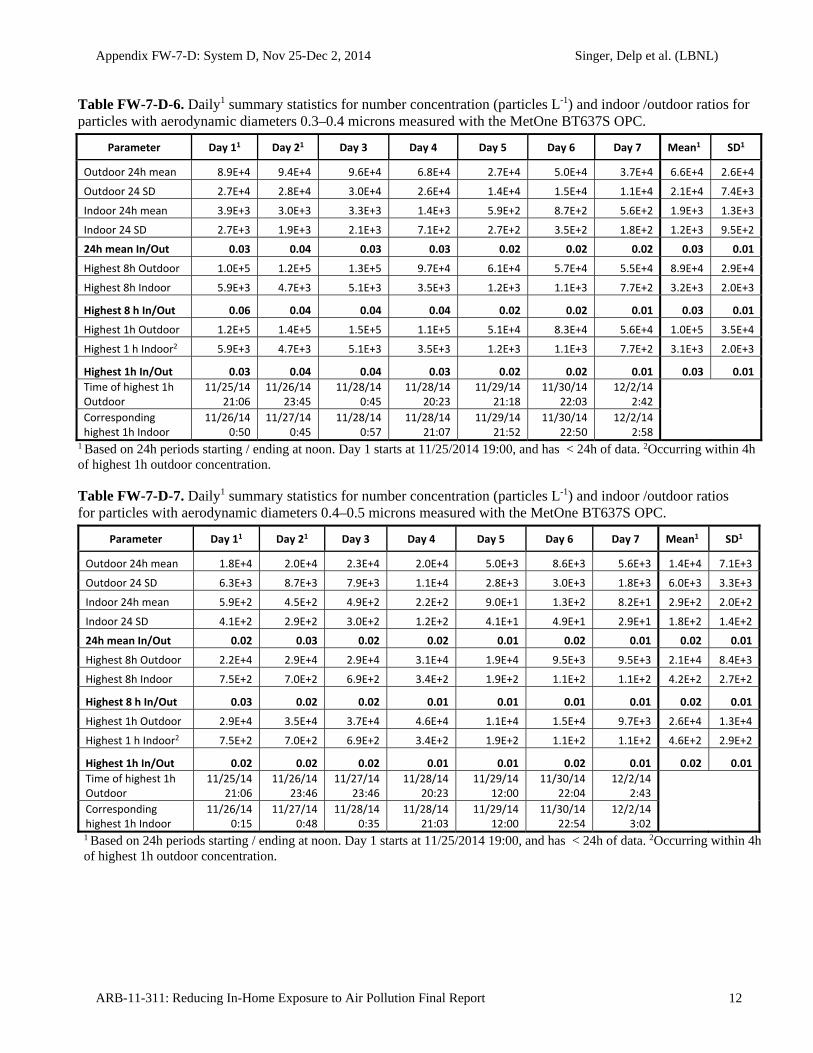
Appendix FW-7-D: System D, Nov 25-Dec 2, 2014 Singer, Delp et al. (LBNL)
ARB-11-311: Reducing In-Home Exposure to Air Pollution Final Report 12
Table FW-7-D-6. Daily1 summary statistics for number concentration (particles L-1) and indoor /outdoor ratios for particles with aerodynamic diameters 0.3–0.4 microns measured with the MetOne BT637S OPC.
Parameter Day 11 Day 21 Day 3 Day 4 Day 5 Day 6 Day 7 Mean1 SD1
Outdoor 24h mean 8.9E+4 9.4E+4 9.6E+4 6.8E+4 2.7E+4 5.0E+4 3.7E+4 6.6E+4 2.6E+4
Outdoor 24 SD 2.7E+4 2.8E+4 3.0E+4 2.6E+4 1.4E+4 1.5E+4 1.1E+4 2.1E+4 7.4E+3
Indoor 24h mean 3.9E+3 3.0E+3 3.3E+3 1.4E+3 5.9E+2 8.7E+2 5.6E+2 1.9E+3 1.3E+3
Indoor 24 SD 2.7E+3 1.9E+3 2.1E+3 7.1E+2 2.7E+2 3.5E+2 1.8E+2 1.2E+3 9.5E+2
24h mean In/Out 0.03 0.04 0.03 0.03 0.02 0.02 0.02 0.03 0.01
Highest 8h Outdoor 1.0E+5 1.2E+5 1.3E+5 9.7E+4 6.1E+4 5.7E+4 5.5E+4 8.9E+4 2.9E+4
Highest 8h Indoor 5.9E+3 4.7E+3 5.1E+3 3.5E+3 1.2E+3 1.1E+3 7.7E+2 3.2E+3 2.0E+3
Highest 8 h In/Out 0.06 0.04 0.04 0.04 0.02 0.02 0.01 0.03 0.01
Highest 1h Outdoor 1.2E+5 1.4E+5 1.5E+5 1.1E+5 5.1E+4 8.3E+4 5.6E+4 1.0E+5 3.5E+4
Highest 1 h Indoor2 5.9E+3 4.7E+3 5.1E+3 3.5E+3 1.2E+3 1.1E+3 7.7E+2 3.1E+3 2.0E+3
Highest 1h In/Out 0.03 0.04 0.04 0.03 0.02 0.02 0.01 0.03 0.01
Time of highest 1h Outdoor
11/25/14 21:06
11/26/14 23:45
11/28/14 0:45
11/28/14 20:23
11/29/14 21:18
11/30/14 22:03
12/2/14 2:42
Corresponding highest 1h Indoor
11/26/14 0:50
11/27/14 0:45
11/28/14 0:57
11/28/14 21:07
11/29/14 21:52
11/30/14 22:50
12/2/14 2:58
1 Based on 24h periods starting / ending at noon. Day 1 starts at 11/25/2014 19:00, and has < 24h of data. 2Occurring within 4h of highest 1h outdoor concentration.
Table FW-7-D-7. Daily1 summary statistics for number concentration (particles L-1) and indoor /outdoor ratios for particles with aerodynamic diameters 0.4–0.5 microns measured with the MetOne BT637S OPC.
Parameter Day 11 Day 21 Day 3 Day 4 Day 5 Day 6 Day 7 Mean1 SD1
Outdoor 24h mean 1.8E+4 2.0E+4 2.3E+4 2.0E+4 5.0E+3 8.6E+3 5.6E+3 1.4E+4 7.1E+3
Outdoor 24 SD 6.3E+3 8.7E+3 7.9E+3 1.1E+4 2.8E+3 3.0E+3 1.8E+3 6.0E+3 3.3E+3
Indoor 24h mean 5.9E+2 4.5E+2 4.9E+2 2.2E+2 9.0E+1 1.3E+2 8.2E+1 2.9E+2 2.0E+2
Indoor 24 SD 4.1E+2 2.9E+2 3.0E+2 1.2E+2 4.1E+1 4.9E+1 2.9E+1 1.8E+2 1.4E+2
24h mean In/Out 0.02 0.03 0.02 0.02 0.01 0.02 0.01 0.02 0.01
Highest 8h Outdoor 2.2E+4 2.9E+4 2.9E+4 3.1E+4 1.9E+4 9.5E+3 9.5E+3 2.1E+4 8.4E+3
Highest 8h Indoor 7.5E+2 7.0E+2 6.9E+2 3.4E+2 1.9E+2 1.1E+2 1.1E+2 4.2E+2 2.7E+2
Highest 8 h In/Out 0.03 0.02 0.02 0.01 0.01 0.01 0.01 0.02 0.01
Highest 1h Outdoor 2.9E+4 3.5E+4 3.7E+4 4.6E+4 1.1E+4 1.5E+4 9.7E+3 2.6E+4 1.3E+4
Highest 1 h Indoor2 7.5E+2 7.0E+2 6.9E+2 3.4E+2 1.9E+2 1.1E+2 1.1E+2 4.6E+2 2.9E+2
Highest 1h In/Out 0.02 0.02 0.02 0.01 0.01 0.02 0.01 0.02 0.01
Time of highest 1h Outdoor
11/25/14 21:06
11/26/14 23:46
11/27/14 23:46
11/28/14 20:23
11/29/14 12:00
11/30/14 22:04
12/2/14 2:43
Corresponding highest 1h Indoor
11/26/14 0:15
11/27/14 0:48
11/28/14 0:35
11/28/14 21:03
11/29/14 12:00
11/30/14 22:54
12/2/14 3:02
1 Based on 24h periods starting / ending at noon. Day 1 starts at 11/25/2014 19:00, and has < 24h of data. 2Occurring within 4h of highest 1h outdoor concentration.
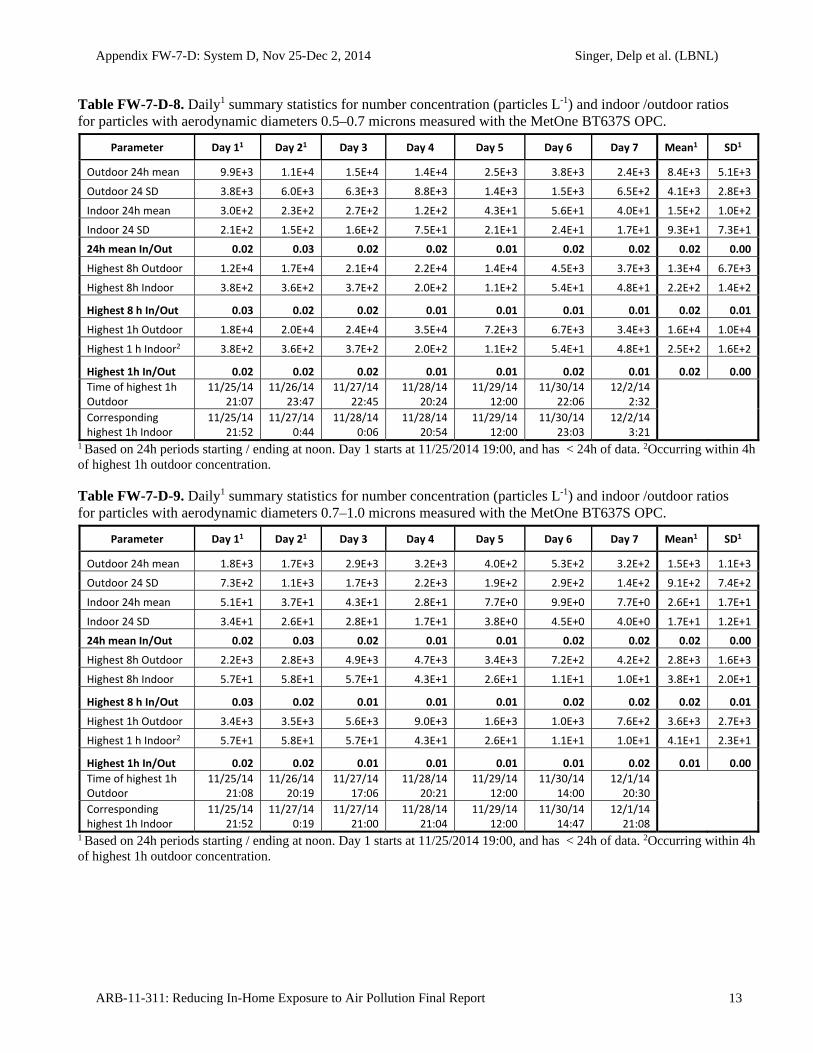
Appendix FW-7-D: System D, Nov 25-Dec 2, 2014 Singer, Delp et al. (LBNL)
ARB-11-311: Reducing In-Home Exposure to Air Pollution Final Report 13
Table FW-7-D-8. Daily1 summary statistics for number concentration (particles L-1) and indoor /outdoor ratios for particles with aerodynamic diameters 0.5–0.7 microns measured with the MetOne BT637S OPC.
Parameter Day 11 Day 21 Day 3 Day 4 Day 5 Day 6 Day 7 Mean1 SD1
Outdoor 24h mean 9.9E+3 1.1E+4 1.5E+4 1.4E+4 2.5E+3 3.8E+3 2.4E+3 8.4E+3 5.1E+3
Outdoor 24 SD 3.8E+3 6.0E+3 6.3E+3 8.8E+3 1.4E+3 1.5E+3 6.5E+2 4.1E+3 2.8E+3
Indoor 24h mean 3.0E+2 2.3E+2 2.7E+2 1.2E+2 4.3E+1 5.6E+1 4.0E+1 1.5E+2 1.0E+2
Indoor 24 SD 2.1E+2 1.5E+2 1.6E+2 7.5E+1 2.1E+1 2.4E+1 1.7E+1 9.3E+1 7.3E+1
24h mean In/Out 0.02 0.03 0.02 0.02 0.01 0.02 0.02 0.02 0.00
Highest 8h Outdoor 1.2E+4 1.7E+4 2.1E+4 2.2E+4 1.4E+4 4.5E+3 3.7E+3 1.3E+4 6.7E+3
Highest 8h Indoor 3.8E+2 3.6E+2 3.7E+2 2.0E+2 1.1E+2 5.4E+1 4.8E+1 2.2E+2 1.4E+2
Highest 8 h In/Out 0.03 0.02 0.02 0.01 0.01 0.01 0.01 0.02 0.01
Highest 1h Outdoor 1.8E+4 2.0E+4 2.4E+4 3.5E+4 7.2E+3 6.7E+3 3.4E+3 1.6E+4 1.0E+4
Highest 1 h Indoor2 3.8E+2 3.6E+2 3.7E+2 2.0E+2 1.1E+2 5.4E+1 4.8E+1 2.5E+2 1.6E+2
Highest 1h In/Out 0.02 0.02 0.02 0.01 0.01 0.02 0.01 0.02 0.00
Time of highest 1h Outdoor
11/25/14 21:07
11/26/14 23:47
11/27/14 22:45
11/28/14 20:24
11/29/14 12:00
11/30/14 22:06
12/2/14 2:32
Corresponding highest 1h Indoor
11/25/14 21:52
11/27/14 0:44
11/28/14 0:06
11/28/14 20:54
11/29/14 12:00
11/30/14 23:03
12/2/14 3:21
1 Based on 24h periods starting / ending at noon. Day 1 starts at 11/25/2014 19:00, and has < 24h of data. 2Occurring within 4h of highest 1h outdoor concentration.
Table FW-7-D-9. Daily1 summary statistics for number concentration (particles L-1) and indoor /outdoor ratios for particles with aerodynamic diameters 0.7–1.0 microns measured with the MetOne BT637S OPC.
Parameter Day 11 Day 21 Day 3 Day 4 Day 5 Day 6 Day 7 Mean1 SD1
Outdoor 24h mean 1.8E+3 1.7E+3 2.9E+3 3.2E+3 4.0E+2 5.3E+2 3.2E+2 1.5E+3 1.1E+3
Outdoor 24 SD 7.3E+2 1.1E+3 1.7E+3 2.2E+3 1.9E+2 2.9E+2 1.4E+2 9.1E+2 7.4E+2
Indoor 24h mean 5.1E+1 3.7E+1 4.3E+1 2.8E+1 7.7E+0 9.9E+0 7.7E+0 2.6E+1 1.7E+1
Indoor 24 SD 3.4E+1 2.6E+1 2.8E+1 1.7E+1 3.8E+0 4.5E+0 4.0E+0 1.7E+1 1.2E+1
24h mean In/Out 0.02 0.03 0.02 0.01 0.01 0.02 0.02 0.02 0.00
Highest 8h Outdoor 2.2E+3 2.8E+3 4.9E+3 4.7E+3 3.4E+3 7.2E+2 4.2E+2 2.8E+3 1.6E+3
Highest 8h Indoor 5.7E+1 5.8E+1 5.7E+1 4.3E+1 2.6E+1 1.1E+1 1.0E+1 3.8E+1 2.0E+1
Highest 8 h In/Out 0.03 0.02 0.01 0.01 0.01 0.02 0.02 0.02 0.01
Highest 1h Outdoor 3.4E+3 3.5E+3 5.6E+3 9.0E+3 1.6E+3 1.0E+3 7.6E+2 3.6E+3 2.7E+3
Highest 1 h Indoor2 5.7E+1 5.8E+1 5.7E+1 4.3E+1 2.6E+1 1.1E+1 1.0E+1 4.1E+1 2.3E+1
Highest 1h In/Out 0.02 0.02 0.01 0.01 0.01 0.01 0.02 0.01 0.00
Time of highest 1h Outdoor
11/25/14 21:08
11/26/14 20:19
11/27/14 17:06
11/28/14 20:21
11/29/14 12:00
11/30/14 14:00
12/1/14 20:30
Corresponding highest 1h Indoor
11/25/14 21:52
11/27/14 0:19
11/27/14 21:00
11/28/14 21:04
11/29/14 12:00
11/30/14 14:47
12/1/14 21:08
1 Based on 24h periods starting / ending at noon. Day 1 starts at 11/25/2014 19:00, and has < 24h of data. 2Occurring within 4h of highest 1h outdoor concentration.
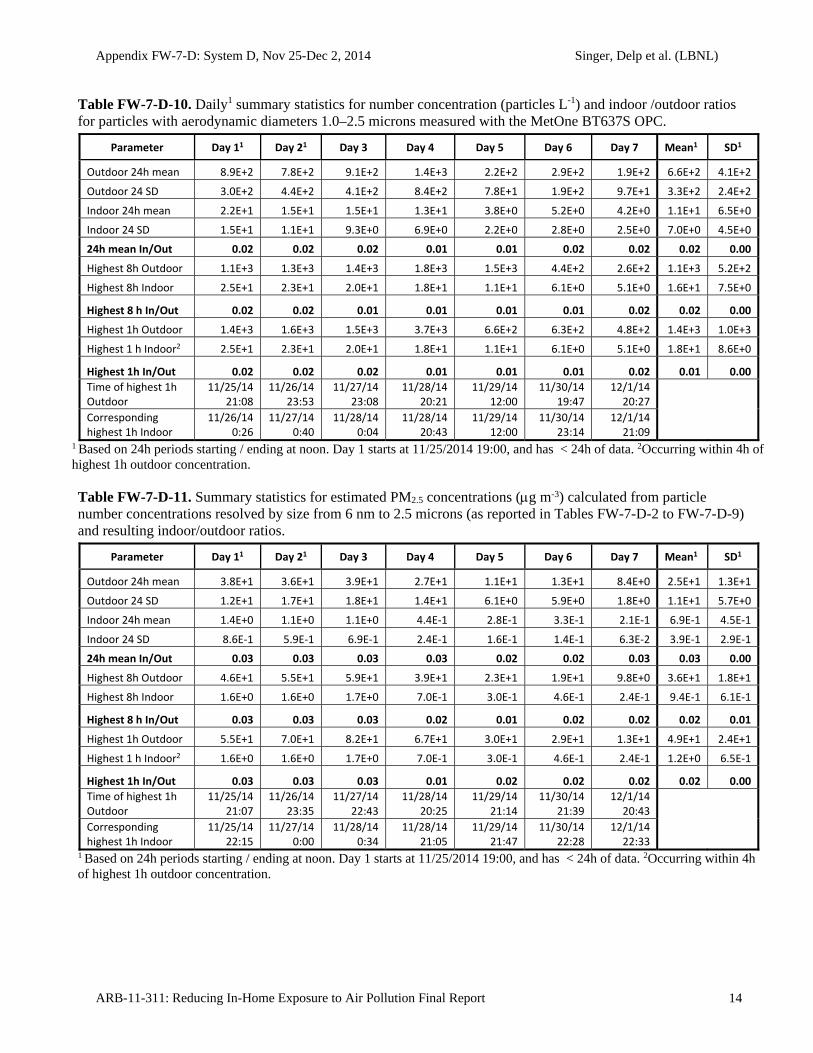
Appendix FW-7-D: System D, Nov 25-Dec 2, 2014 Singer, Delp et al. (LBNL)
ARB-11-311: Reducing In-Home Exposure to Air Pollution Final Report 14
Table FW-7-D-10. Daily1 summary statistics for number concentration (particles L-1) and indoor /outdoor ratios for particles with aerodynamic diameters 1.0–2.5 microns measured with the MetOne BT637S OPC.
Parameter Day 11 Day 21 Day 3 Day 4 Day 5 Day 6 Day 7 Mean1 SD1
Outdoor 24h mean 8.9E+2 7.8E+2 9.1E+2 1.4E+3 2.2E+2 2.9E+2 1.9E+2 6.6E+2 4.1E+2
Outdoor 24 SD 3.0E+2 4.4E+2 4.1E+2 8.4E+2 7.8E+1 1.9E+2 9.7E+1 3.3E+2 2.4E+2
Indoor 24h mean 2.2E+1 1.5E+1 1.5E+1 1.3E+1 3.8E+0 5.2E+0 4.2E+0 1.1E+1 6.5E+0
Indoor 24 SD 1.5E+1 1.1E+1 9.3E+0 6.9E+0 2.2E+0 2.8E+0 2.5E+0 7.0E+0 4.5E+0
24h mean In/Out 0.02 0.02 0.02 0.01 0.01 0.02 0.02 0.02 0.00
Highest 8h Outdoor 1.1E+3 1.3E+3 1.4E+3 1.8E+3 1.5E+3 4.4E+2 2.6E+2 1.1E+3 5.2E+2
Highest 8h Indoor 2.5E+1 2.3E+1 2.0E+1 1.8E+1 1.1E+1 6.1E+0 5.1E+0 1.6E+1 7.5E+0
Highest 8 h In/Out 0.02 0.02 0.01 0.01 0.01 0.01 0.02 0.02 0.00
Highest 1h Outdoor 1.4E+3 1.6E+3 1.5E+3 3.7E+3 6.6E+2 6.3E+2 4.8E+2 1.4E+3 1.0E+3
Highest 1 h Indoor2 2.5E+1 2.3E+1 2.0E+1 1.8E+1 1.1E+1 6.1E+0 5.1E+0 1.8E+1 8.6E+0
Highest 1h In/Out 0.02 0.02 0.02 0.01 0.01 0.01 0.02 0.01 0.00
Time of highest 1h Outdoor
11/25/14 21:08
11/26/14 23:53
11/27/14 23:08
11/28/14 20:21
11/29/14 12:00
11/30/14 19:47
12/1/14 20:27
Corresponding highest 1h Indoor
11/26/14 0:26
11/27/14 0:40
11/28/14 0:04
11/28/14 20:43
11/29/14 12:00
11/30/14 23:14
12/1/14 21:09
1 Based on 24h periods starting / ending at noon. Day 1 starts at 11/25/2014 19:00, and has < 24h of data. 2Occurring within 4h of highest 1h outdoor concentration.
Table FW-7-D-11. Summary statistics for estimated PM2.5 concentrations (g m-3) calculated from particle number concentrations resolved by size from 6 nm to 2.5 microns (as reported in Tables FW-7-D-2 to FW-7-D-9) and resulting indoor/outdoor ratios.
Parameter Day 11 Day 21 Day 3 Day 4 Day 5 Day 6 Day 7 Mean1 SD1
Outdoor 24h mean 3.8E+1 3.6E+1 3.9E+1 2.7E+1 1.1E+1 1.3E+1 8.4E+0 2.5E+1 1.3E+1
Outdoor 24 SD 1.2E+1 1.7E+1 1.8E+1 1.4E+1 6.1E+0 5.9E+0 1.8E+0 1.1E+1 5.7E+0
Indoor 24h mean 1.4E+0 1.1E+0 1.1E+0 4.4E‐1 2.8E‐1 3.3E‐1 2.1E‐1 6.9E‐1 4.5E‐1
Indoor 24 SD 8.6E‐1 5.9E‐1 6.9E‐1 2.4E‐1 1.6E‐1 1.4E‐1 6.3E‐2 3.9E‐1 2.9E‐1
24h mean In/Out 0.03 0.03 0.03 0.03 0.02 0.02 0.03 0.03 0.00
Highest 8h Outdoor 4.6E+1 5.5E+1 5.9E+1 3.9E+1 2.3E+1 1.9E+1 9.8E+0 3.6E+1 1.8E+1
Highest 8h Indoor 1.6E+0 1.6E+0 1.7E+0 7.0E‐1 3.0E‐1 4.6E‐1 2.4E‐1 9.4E‐1 6.1E‐1
Highest 8 h In/Out 0.03 0.03 0.03 0.02 0.01 0.02 0.02 0.02 0.01
Highest 1h Outdoor 5.5E+1 7.0E+1 8.2E+1 6.7E+1 3.0E+1 2.9E+1 1.3E+1 4.9E+1 2.4E+1
Highest 1 h Indoor2 1.6E+0 1.6E+0 1.7E+0 7.0E‐1 3.0E‐1 4.6E‐1 2.4E‐1 1.2E+0 6.5E‐1
Highest 1h In/Out 0.03 0.03 0.03 0.01 0.02 0.02 0.02 0.02 0.00
Time of highest 1h Outdoor
11/25/14 21:07
11/26/14 23:35
11/27/14 22:43
11/28/14 20:25
11/29/14 21:14
11/30/14 21:39
12/1/14 20:43
Corresponding highest 1h Indoor
11/25/14 22:15
11/27/14 0:00
11/28/14 0:34
11/28/14 21:05
11/29/14 21:47
11/30/14 22:28
12/1/14 22:33
1 Based on 24h periods starting / ending at noon. Day 1 starts at 11/25/2014 19:00, and has < 24h of data. 2Occurring within 4h of highest 1h outdoor concentration.
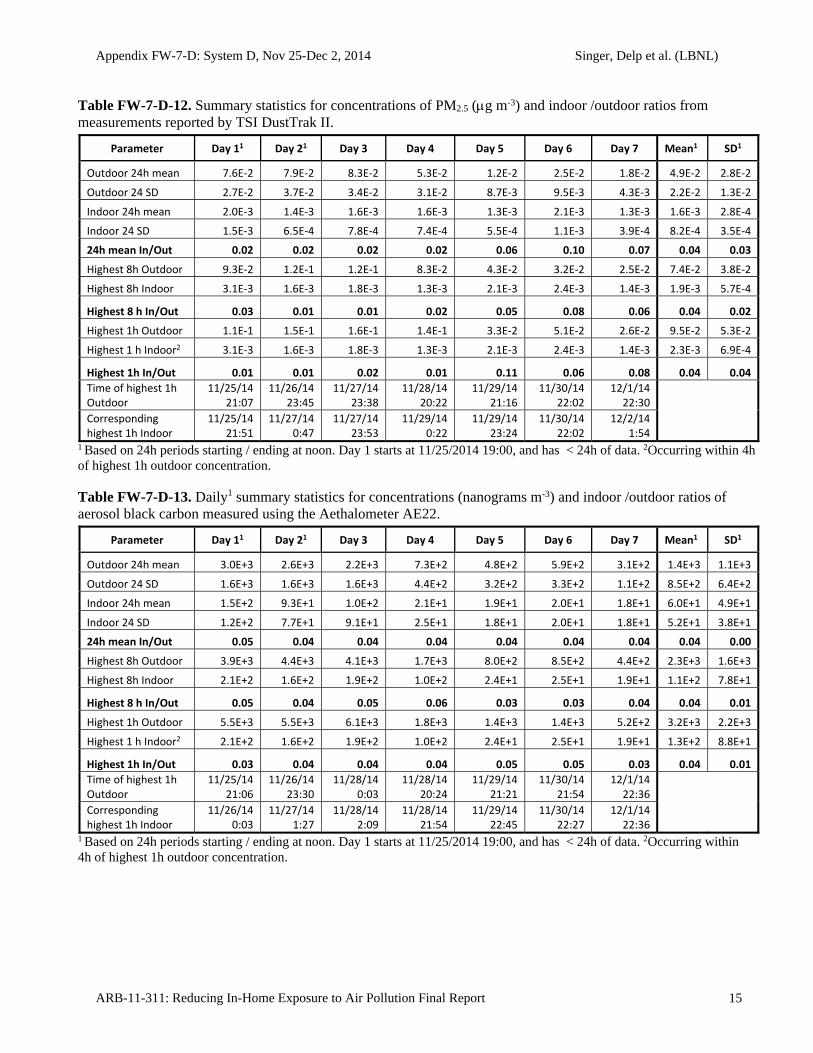
Appendix FW-7-D: System D, Nov 25-Dec 2, 2014 Singer, Delp et al. (LBNL)
ARB-11-311: Reducing In-Home Exposure to Air Pollution Final Report 15
Table FW-7-D-12. Summary statistics for concentrations of PM2.5 (g m-3) and indoor /outdoor ratios from measurements reported by TSI DustTrak II.
Parameter Day 11 Day 21 Day 3 Day 4 Day 5 Day 6 Day 7 Mean1 SD1
Outdoor 24h mean 7.6E‐2 7.9E‐2 8.3E‐2 5.3E‐2 1.2E‐2 2.5E‐2 1.8E‐2 4.9E‐2 2.8E‐2
Outdoor 24 SD 2.7E‐2 3.7E‐2 3.4E‐2 3.1E‐2 8.7E‐3 9.5E‐3 4.3E‐3 2.2E‐2 1.3E‐2
Indoor 24h mean 2.0E‐3 1.4E‐3 1.6E‐3 1.6E‐3 1.3E‐3 2.1E‐3 1.3E‐3 1.6E‐3 2.8E‐4
Indoor 24 SD 1.5E‐3 6.5E‐4 7.8E‐4 7.4E‐4 5.5E‐4 1.1E‐3 3.9E‐4 8.2E‐4 3.5E‐4
24h mean In/Out 0.02 0.02 0.02 0.02 0.06 0.10 0.07 0.04 0.03
Highest 8h Outdoor 9.3E‐2 1.2E‐1 1.2E‐1 8.3E‐2 4.3E‐2 3.2E‐2 2.5E‐2 7.4E‐2 3.8E‐2
Highest 8h Indoor 3.1E‐3 1.6E‐3 1.8E‐3 1.3E‐3 2.1E‐3 2.4E‐3 1.4E‐3 1.9E‐3 5.7E‐4
Highest 8 h In/Out 0.03 0.01 0.01 0.02 0.05 0.08 0.06 0.04 0.02
Highest 1h Outdoor 1.1E‐1 1.5E‐1 1.6E‐1 1.4E‐1 3.3E‐2 5.1E‐2 2.6E‐2 9.5E‐2 5.3E‐2
Highest 1 h Indoor2 3.1E‐3 1.6E‐3 1.8E‐3 1.3E‐3 2.1E‐3 2.4E‐3 1.4E‐3 2.3E‐3 6.9E‐4
Highest 1h In/Out 0.01 0.01 0.02 0.01 0.11 0.06 0.08 0.04 0.04
Time of highest 1h Outdoor
11/25/14 21:07
11/26/14 23:45
11/27/14 23:38
11/28/14 20:22
11/29/14 21:16
11/30/14 22:02
12/1/14 22:30
Corresponding highest 1h Indoor
11/25/14 21:51
11/27/14 0:47
11/27/14 23:53
11/29/14 0:22
11/29/14 23:24
11/30/14 22:02
12/2/14 1:54
1 Based on 24h periods starting / ending at noon. Day 1 starts at 11/25/2014 19:00, and has < 24h of data. 2Occurring within 4h of highest 1h outdoor concentration.
Table FW-7-D-13. Daily1 summary statistics for concentrations (nanograms m-3) and indoor /outdoor ratios of aerosol black carbon measured using the Aethalometer AE22.
Parameter Day 11 Day 21 Day 3 Day 4 Day 5 Day 6 Day 7 Mean1 SD1
Outdoor 24h mean 3.0E+3 2.6E+3 2.2E+3 7.3E+2 4.8E+2 5.9E+2 3.1E+2 1.4E+3 1.1E+3
Outdoor 24 SD 1.6E+3 1.6E+3 1.6E+3 4.4E+2 3.2E+2 3.3E+2 1.1E+2 8.5E+2 6.4E+2
Indoor 24h mean 1.5E+2 9.3E+1 1.0E+2 2.1E+1 1.9E+1 2.0E+1 1.8E+1 6.0E+1 4.9E+1
Indoor 24 SD 1.2E+2 7.7E+1 9.1E+1 2.5E+1 1.8E+1 2.0E+1 1.8E+1 5.2E+1 3.8E+1
24h mean In/Out 0.05 0.04 0.04 0.04 0.04 0.04 0.04 0.04 0.00
Highest 8h Outdoor 3.9E+3 4.4E+3 4.1E+3 1.7E+3 8.0E+2 8.5E+2 4.4E+2 2.3E+3 1.6E+3
Highest 8h Indoor 2.1E+2 1.6E+2 1.9E+2 1.0E+2 2.4E+1 2.5E+1 1.9E+1 1.1E+2 7.8E+1
Highest 8 h In/Out 0.05 0.04 0.05 0.06 0.03 0.03 0.04 0.04 0.01
Highest 1h Outdoor 5.5E+3 5.5E+3 6.1E+3 1.8E+3 1.4E+3 1.4E+3 5.2E+2 3.2E+3 2.2E+3
Highest 1 h Indoor2 2.1E+2 1.6E+2 1.9E+2 1.0E+2 2.4E+1 2.5E+1 1.9E+1 1.3E+2 8.8E+1
Highest 1h In/Out 0.03 0.04 0.04 0.04 0.05 0.05 0.03 0.04 0.01
Time of highest 1h Outdoor
11/25/14 21:06
11/26/14 23:30
11/28/14 0:03
11/28/14 20:24
11/29/14 21:21
11/30/14 21:54
12/1/14 22:36
Corresponding highest 1h Indoor
11/26/14 0:03
11/27/14 1:27
11/28/14 2:09
11/28/14 21:54
11/29/14 22:45
11/30/14 22:27
12/1/14 22:36
1 Based on 24h periods starting / ending at noon. Day 1 starts at 11/25/2014 19:00, and has < 24h of data. 2Occurring within 4h of highest 1h outdoor concentration.
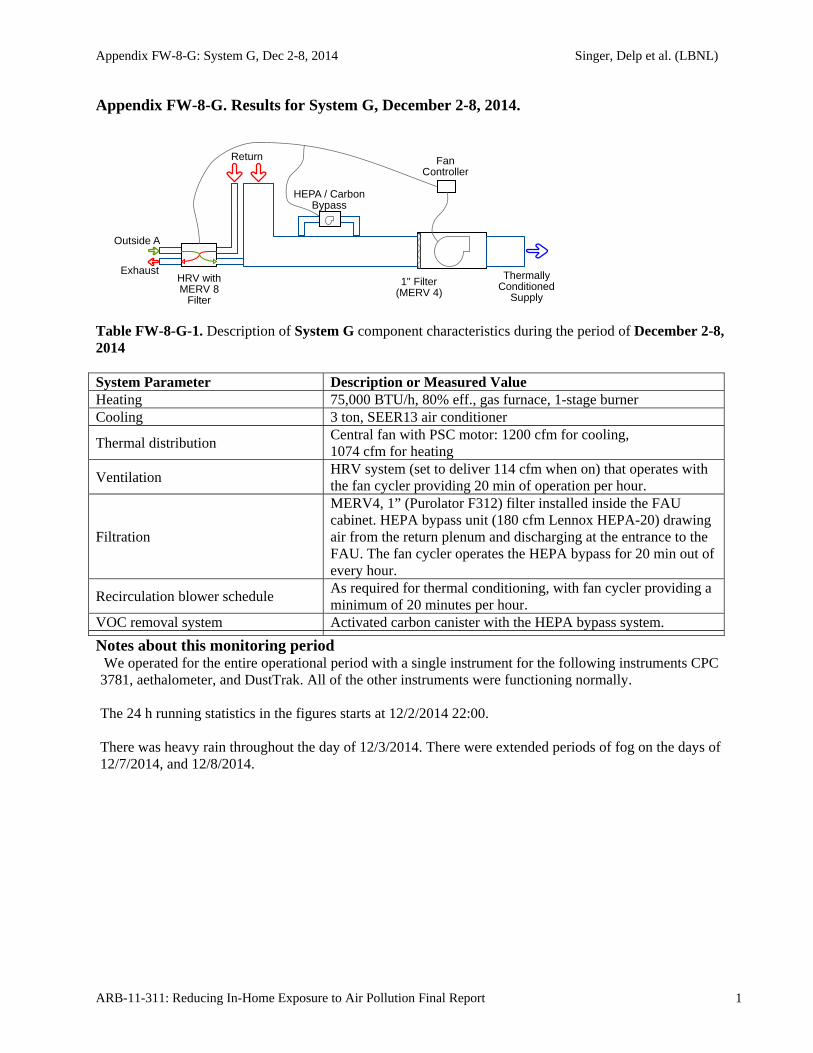
Appendix FW-8-G: System G, Dec 2-8, 2014 Singer, Delp et al. (LBNL)
ARB-11-311: Reducing In-Home Exposure to Air Pollution Final Report 1
Appendix FW-8-G. Results for System G, December 2-8, 2014.
Table FW-8-G-1. Description of System G component characteristics during the period of December 2-8, 2014 System Parameter Description or Measured Value Heating 75,000 BTU/h, 80% eff., gas furnace, 1-stage burner Cooling 3 ton, SEER13 air conditioner
Thermal distribution Central fan with PSC motor: 1200 cfm for cooling, 1074 cfm for heating
Ventilation HRV system (set to deliver 114 cfm when on) that operates with the fan cycler providing 20 min of operation per hour.
Filtration
MERV4, 1” (Purolator F312) filter installed inside the FAU cabinet. HEPA bypass unit (180 cfm Lennox HEPA-20) drawing air from the return plenum and discharging at the entrance to the FAU. The fan cycler operates the HEPA bypass for 20 min out of every hour.
Recirculation blower schedule As required for thermal conditioning, with fan cycler providing a minimum of 20 minutes per hour.
VOC removal system Activated carbon canister with the HEPA bypass system.
Notes about this monitoring period
We operated for the entire operational period with a single instrument for the following instruments CPC 3781, aethalometer, and DustTrak. All of the other instruments were functioning normally. The 24 h running statistics in the figures starts at 12/2/2014 22:00. There was heavy rain throughout the day of 12/3/2014. There were extended periods of fog on the days of 12/7/2014, and 12/8/2014.
HRV withMERV 8
Filter
Exhaust
Outside Air
ThermallyConditioned
Supply
FanController
HEPA / CarbonBypass
1" Filter(MERV 4)
Return
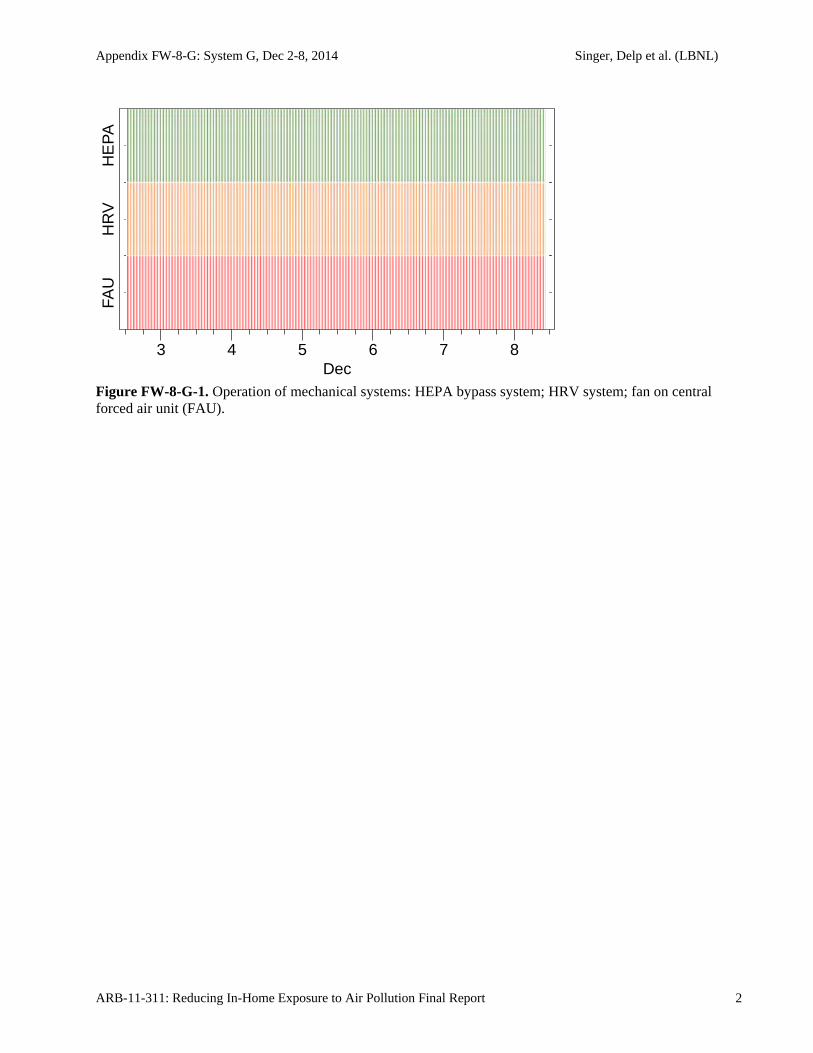
Appendix FW-8-G: System G, Dec 2-8, 2014 Singer, Delp et al. (LBNL)
ARB-11-311: Reducing In-Home Exposure to Air Pollution Final Report 2
Figure FW-8-G-1. Operation of mechanical systems: HEPA bypass system; HRV system; fan on central forced air unit (FAU).
FAU
HR
VH
EP
A
3 4 5 6 7 8Dec
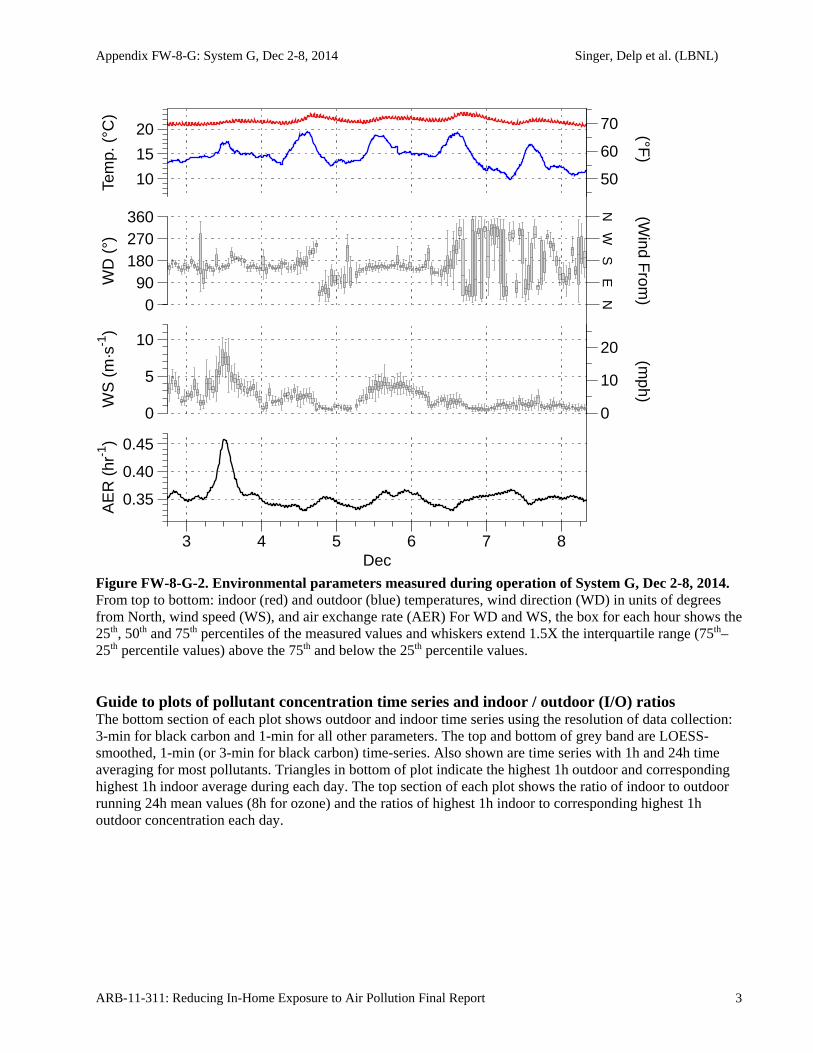
Appendix FW-8-G: System G, Dec 2-8, 2014 Singer, Delp et al. (LBNL)
ARB-11-311: Reducing In-Home Exposure to Air Pollution Final Report 3
Figure FW-8-G-2. Environmental parameters measured during operation of System G, Dec 2-8, 2014. From top to bottom: indoor (red) and outdoor (blue) temperatures, wind direction (WD) in units of degrees from North, wind speed (WS), and air exchange rate (AER) For WD and WS, the box for each hour shows the 25th, 50th and 75th percentiles of the measured values and whiskers extend 1.5X the interquartile range (75th–25th percentile values) above the 75th and below the 25th percentile values. Guide to plots of pollutant concentration time series and indoor / outdoor (I/O) ratios The bottom section of each plot shows outdoor and indoor time series using the resolution of data collection: 3-min for black carbon and 1-min for all other parameters. The top and bottom of grey band are LOESS-smoothed, 1-min (or 3-min for black carbon) time-series. Also shown are time series with 1h and 24h time averaging for most pollutants. Triangles in bottom of plot indicate the highest 1h outdoor and corresponding highest 1h indoor average during each day. The top section of each plot shows the ratio of indoor to outdoor running 24h mean values (8h for ozone) and the ratios of highest 1h indoor to corresponding highest 1h outdoor concentration each day.
0
10
20
50
60
70
NE
SW
N
(mph)
(Wind F
rom)
(°F)
AE
R (
hr-1
)
0.35
0.40
0.45
WS
(m
·s-1
)
0
5
10
WD
(°)
090
180270360
Tem
p. (
°C)
10
15
20
3 4 5 6 7 8Dec
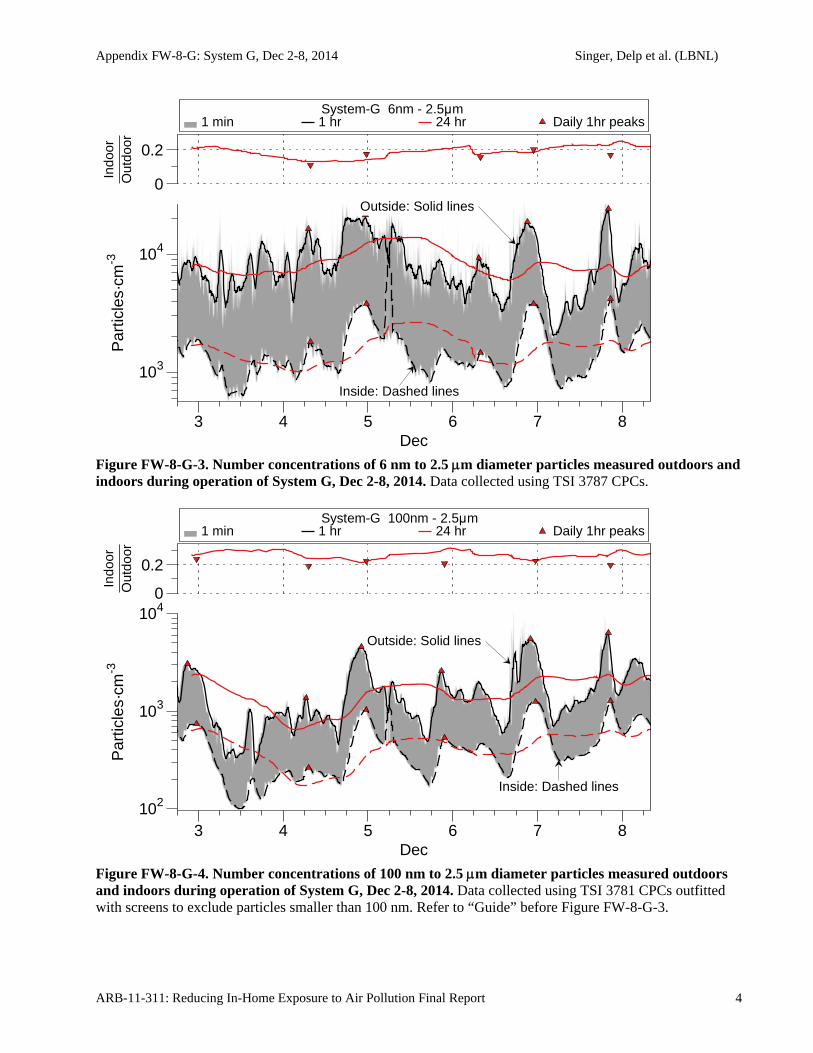
Appendix FW-8-G: System G, Dec 2-8, 2014 Singer, Delp et al. (LBNL)
ARB-11-311: Reducing In-Home Exposure to Air Pollution Final Report 4
Figure FW-8-G-3. Number concentrations of 6 nm to 2.5 m diameter particles measured outdoors and indoors during operation of System G, Dec 2-8, 2014. Data collected using TSI 3787 CPCs.
Figure FW-8-G-4. Number concentrations of 100 nm to 2.5 m diameter particles measured outdoors and indoors during operation of System G, Dec 2-8, 2014. Data collected using TSI 3781 CPCs outfitted with screens to exclude particles smaller than 100 nm. Refer to “Guide” before Figure FW-8-G-3.
1 min 1 hr 24 hr Daily 1hr peaks System-G 6nm - 2.5μm
Outside: Solid lines
Inside: Dashed lines
Par
ticle
s·cm
-3
103
104
Indo
orO
utdo
or
0
0.2
3 4 5 6 7 8Dec
1 min 1 hr 24 hr Daily 1hr peaks System-G 100nm - 2.5μm
Outside: Solid lines
Inside: Dashed lines
Par
ticle
s·cm
-3
102
103
104
Indo
orO
utdo
or
0
0.2
3 4 5 6 7 8Dec
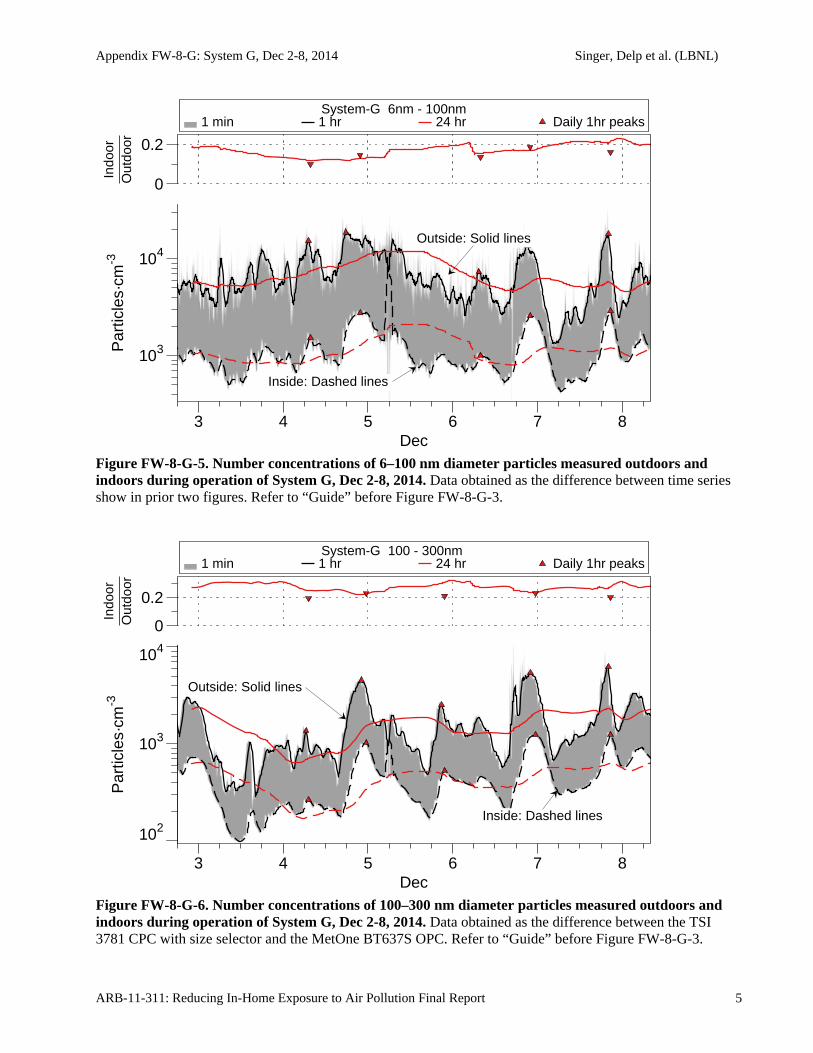
Appendix FW-8-G: System G, Dec 2-8, 2014 Singer, Delp et al. (LBNL)
ARB-11-311: Reducing In-Home Exposure to Air Pollution Final Report 5
Figure FW-8-G-5. Number concentrations of 6–100 nm diameter particles measured outdoors and indoors during operation of System G, Dec 2-8, 2014. Data obtained as the difference between time series show in prior two figures. Refer to “Guide” before Figure FW-8-G-3.
Figure FW-8-G-6. Number concentrations of 100–300 nm diameter particles measured outdoors and indoors during operation of System G, Dec 2-8, 2014. Data obtained as the difference between the TSI 3781 CPC with size selector and the MetOne BT637S OPC. Refer to “Guide” before Figure FW-8-G-3.
1 min 1 hr 24 hr Daily 1hr peaks System-G 6nm - 100nm
Outside: Solid lines
Inside: Dashed lines
Par
ticle
s·cm
-3
103
104
Indo
orO
utdo
or
0
0.2
3 4 5 6 7 8Dec
1 min 1 hr 24 hr Daily 1hr peaks System-G 100 - 300nm
Outside: Solid lines
Inside: Dashed lines
102
103
104
Par
ticle
s·cm
-3In
door
Out
door
0
0.2
3 4 5 6 7 8Dec
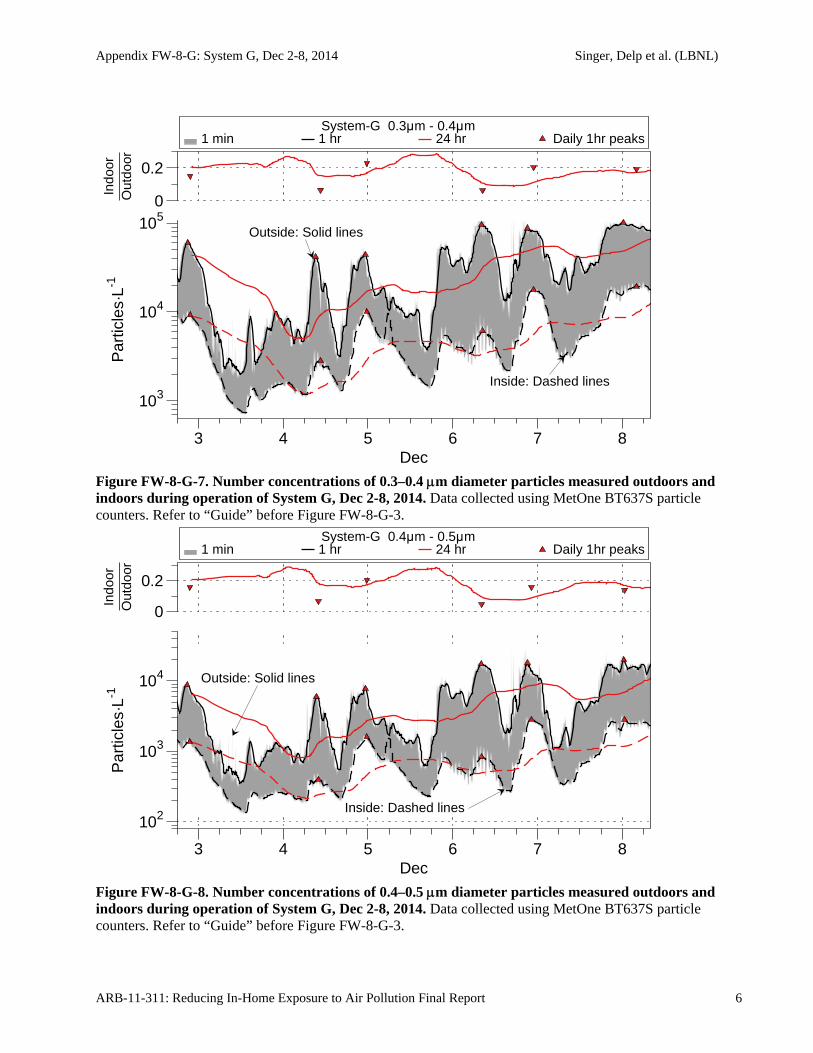
Appendix FW-8-G: System G, Dec 2-8, 2014 Singer, Delp et al. (LBNL)
ARB-11-311: Reducing In-Home Exposure to Air Pollution Final Report 6
Figure FW-8-G-7. Number concentrations of 0.3–0.4 m diameter particles measured outdoors and indoors during operation of System G, Dec 2-8, 2014. Data collected using MetOne BT637S particle counters. Refer to “Guide” before Figure FW-8-G-3.
Figure FW-8-G-8. Number concentrations of 0.4–0.5 m diameter particles measured outdoors and indoors during operation of System G, Dec 2-8, 2014. Data collected using MetOne BT637S particle counters. Refer to “Guide” before Figure FW-8-G-3.
1 min 1 hr 24 hr Daily 1hr peaks System-G 0.3μm - 0.4μm
Outside: Solid lines
Inside: Dashed lines
Par
ticle
s·L-1
103
104
105
Indo
orO
utdo
or
0
0.2
3 4 5 6 7 8Dec
1 min 1 hr 24 hr Daily 1hr peaks System-G 0.4μm - 0.5μm
Outside: Solid lines
Inside: Dashed lines
Par
ticle
s·L-1
102
103
104
Indo
orO
utdo
or
0
0.2
3 4 5 6 7 8Dec
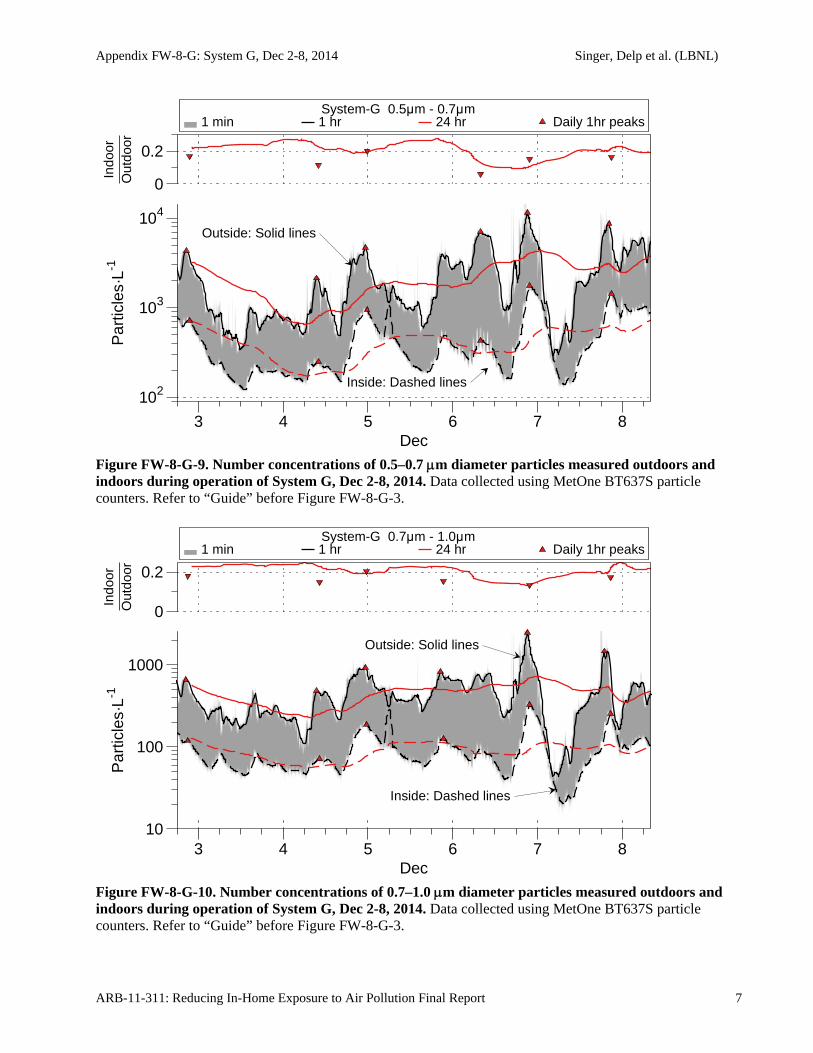
Appendix FW-8-G: System G, Dec 2-8, 2014 Singer, Delp et al. (LBNL)
ARB-11-311: Reducing In-Home Exposure to Air Pollution Final Report 7
Figure FW-8-G-9. Number concentrations of 0.5–0.7 m diameter particles measured outdoors and indoors during operation of System G, Dec 2-8, 2014. Data collected using MetOne BT637S particle counters. Refer to “Guide” before Figure FW-8-G-3.
Figure FW-8-G-10. Number concentrations of 0.7–1.0 m diameter particles measured outdoors and indoors during operation of System G, Dec 2-8, 2014. Data collected using MetOne BT637S particle counters. Refer to “Guide” before Figure FW-8-G-3.
1 min 1 hr 24 hr Daily 1hr peaks System-G 0.5μm - 0.7μm
Outside: Solid lines
Inside: Dashed lines
Par
ticle
s·L-1
102
103
104
Indo
orO
utdo
or
0
0.2
3 4 5 6 7 8Dec
1 min 1 hr 24 hr Daily 1hr peaks System-G 0.7μm - 1.0μm
Outside: Solid lines
Inside: Dashed lines
Par
ticle
s·L-1
10
100
1000
Indo
orO
utdo
or
0
0.2
3 4 5 6 7 8Dec
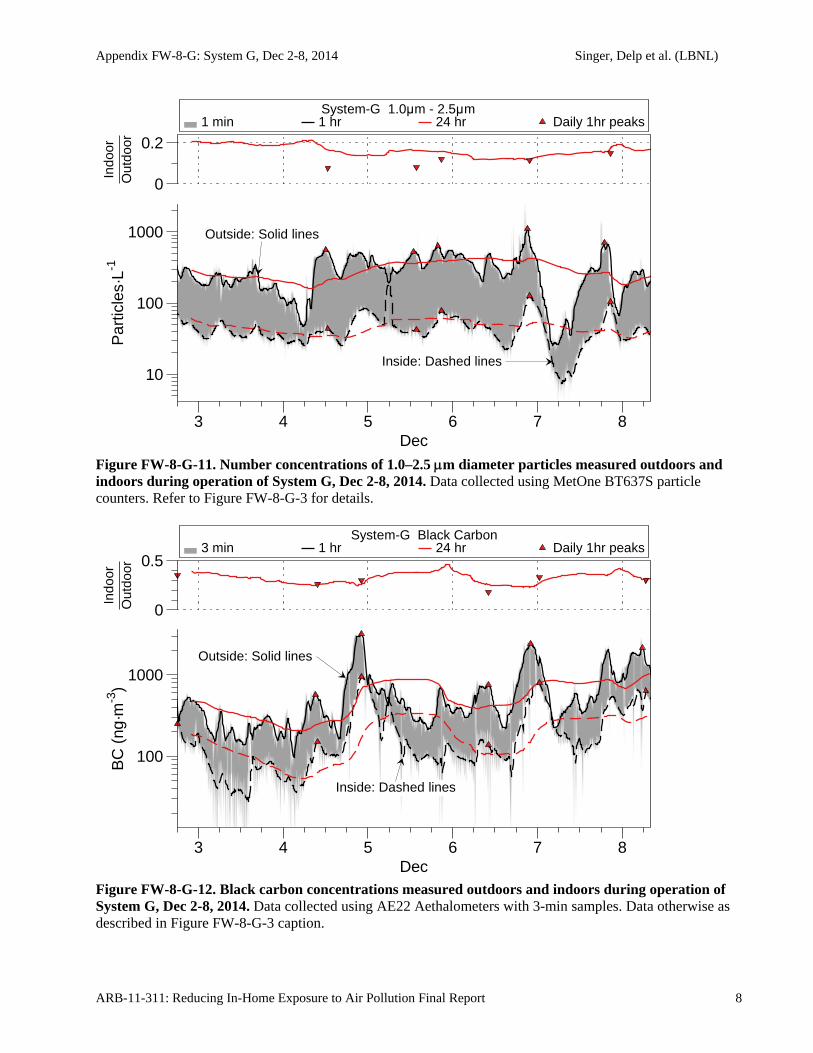
Appendix FW-8-G: System G, Dec 2-8, 2014 Singer, Delp et al. (LBNL)
ARB-11-311: Reducing In-Home Exposure to Air Pollution Final Report 8
Figure FW-8-G-11. Number concentrations of 1.0–2.5 m diameter particles measured outdoors and indoors during operation of System G, Dec 2-8, 2014. Data collected using MetOne BT637S particle counters. Refer to Figure FW-8-G-3 for details.
Figure FW-8-G-12. Black carbon concentrations measured outdoors and indoors during operation of System G, Dec 2-8, 2014. Data collected using AE22 Aethalometers with 3-min samples. Data otherwise as described in Figure FW-8-G-3 caption.
1 min 1 hr 24 hr Daily 1hr peaks System-G 1.0μm - 2.5μm
Outside: Solid lines
Inside: Dashed lines
Par
ticle
s·L-1
10
100
1000
Indo
orO
utdo
or
0
0.2
3 4 5 6 7 8Dec
3 min 1 hr 24 hr Daily 1hr peaks System-G Black Carbon
Outside: Solid lines
Inside: Dashed lines
BC
(ng
·m-3
)
100
1000
Indo
orO
utdo
or
0
0.5
3 4 5 6 7 8Dec
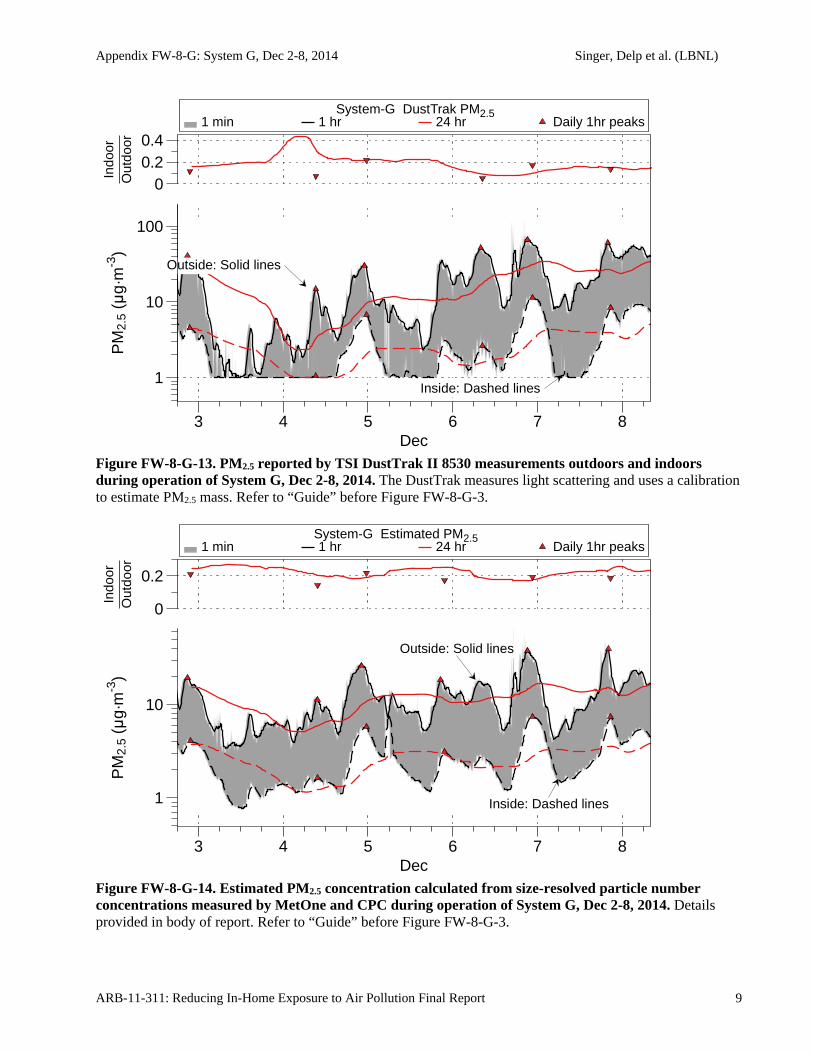
Appendix FW-8-G: System G, Dec 2-8, 2014 Singer, Delp et al. (LBNL)
ARB-11-311: Reducing In-Home Exposure to Air Pollution Final Report 9
Figure FW-8-G-13. PM2.5 reported by TSI DustTrak II 8530 measurements outdoors and indoors during operation of System G, Dec 2-8, 2014. The DustTrak measures light scattering and uses a calibration to estimate PM2.5 mass. Refer to “Guide” before Figure FW-8-G-3.
Figure FW-8-G-14. Estimated PM2.5 concentration calculated from size-resolved particle number concentrations measured by MetOne and CPC during operation of System G, Dec 2-8, 2014. Details provided in body of report. Refer to “Guide” before Figure FW-8-G-3.
1 min 1 hr 24 hr Daily 1hr peaks System-G DustTrak PM2.5
1
10
100
Outside: Solid lines
Inside: Dashed lines
PM
2.5
(μg·
m-3
)In
door
Out
door
00.20.4
3 4 5 6 7 8Dec
1 min 1 hr 24 hr Daily 1hr peaks System-G Estimated PM2.5
Outside: Solid lines
Inside: Dashed lines
PM
2.5
(μg·
m-3
)
1
10
Indo
orO
utdo
or
0
0.2
3 4 5 6 7 8Dec
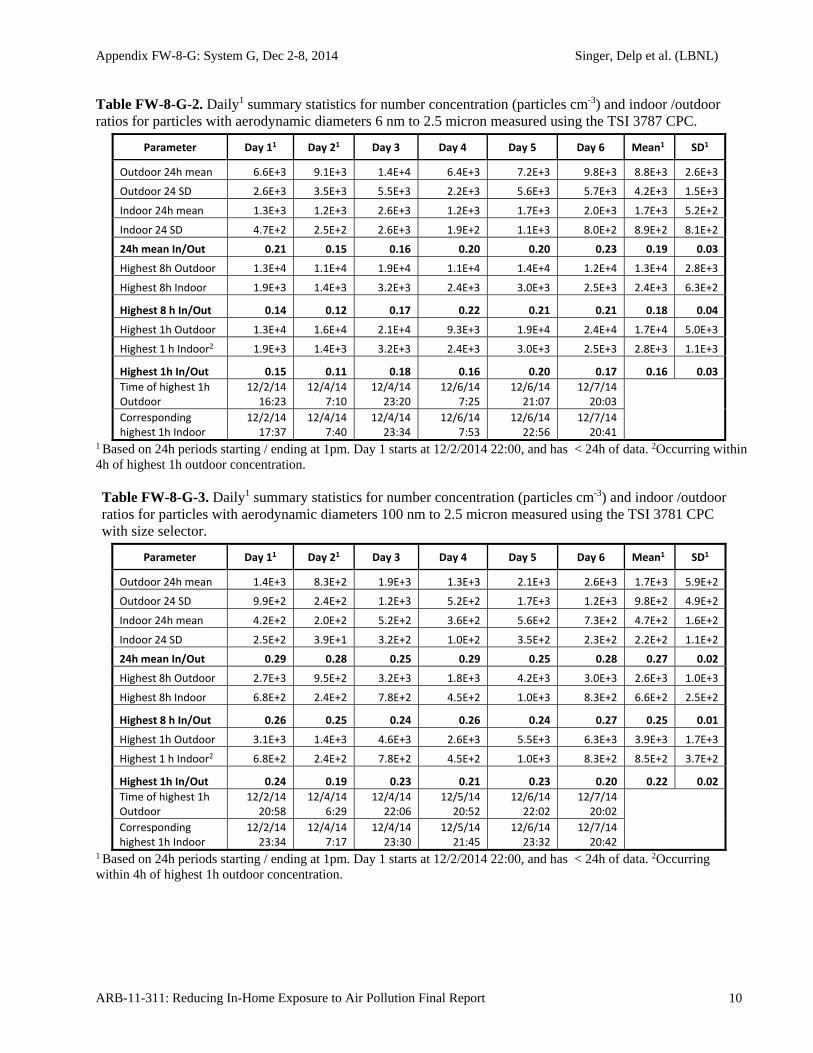
Appendix FW-8-G: System G, Dec 2-8, 2014 Singer, Delp et al. (LBNL)
ARB-11-311: Reducing In-Home Exposure to Air Pollution Final Report 10
Table FW-8-G-2. Daily1 summary statistics for number concentration (particles cm-3) and indoor /outdoor ratios for particles with aerodynamic diameters 6 nm to 2.5 micron measured using the TSI 3787 CPC.
Parameter Day 11 Day 21 Day 3 Day 4 Day 5 Day 6 Mean1 SD1
Outdoor 24h mean 6.6E+3 9.1E+3 1.4E+4 6.4E+3 7.2E+3 9.8E+3 8.8E+3 2.6E+3
Outdoor 24 SD 2.6E+3 3.5E+3 5.5E+3 2.2E+3 5.6E+3 5.7E+3 4.2E+3 1.5E+3
Indoor 24h mean 1.3E+3 1.2E+3 2.6E+3 1.2E+3 1.7E+3 2.0E+3 1.7E+3 5.2E+2
Indoor 24 SD 4.7E+2 2.5E+2 2.6E+3 1.9E+2 1.1E+3 8.0E+2 8.9E+2 8.1E+2
24h mean In/Out 0.21 0.15 0.16 0.20 0.20 0.23 0.19 0.03
Highest 8h Outdoor 1.3E+4 1.1E+4 1.9E+4 1.1E+4 1.4E+4 1.2E+4 1.3E+4 2.8E+3
Highest 8h Indoor 1.9E+3 1.4E+3 3.2E+3 2.4E+3 3.0E+3 2.5E+3 2.4E+3 6.3E+2
Highest 8 h In/Out 0.14 0.12 0.17 0.22 0.21 0.21 0.18 0.04
Highest 1h Outdoor 1.3E+4 1.6E+4 2.1E+4 9.3E+3 1.9E+4 2.4E+4 1.7E+4 5.0E+3
Highest 1 h Indoor2 1.9E+3 1.4E+3 3.2E+3 2.4E+3 3.0E+3 2.5E+3 2.8E+3 1.1E+3
Highest 1h In/Out 0.15 0.11 0.18 0.16 0.20 0.17 0.16 0.03
Time of highest 1h Outdoor
12/2/14 16:23
12/4/14 7:10
12/4/14 23:20
12/6/14 7:25
12/6/14 21:07
12/7/14 20:03
Corresponding highest 1h Indoor
12/2/14 17:37
12/4/14 7:40
12/4/14 23:34
12/6/14 7:53
12/6/14 22:56
12/7/14 20:41
1 Based on 24h periods starting / ending at 1pm. Day 1 starts at 12/2/2014 22:00, and has < 24h of data. 2Occurring within 4h of highest 1h outdoor concentration. Table FW-8-G-3. Daily1 summary statistics for number concentration (particles cm-3) and indoor /outdoor ratios for particles with aerodynamic diameters 100 nm to 2.5 micron measured using the TSI 3781 CPC with size selector.
Parameter Day 11 Day 21 Day 3 Day 4 Day 5 Day 6 Mean1 SD1
Outdoor 24h mean 1.4E+3 8.3E+2 1.9E+3 1.3E+3 2.1E+3 2.6E+3 1.7E+3 5.9E+2
Outdoor 24 SD 9.9E+2 2.4E+2 1.2E+3 5.2E+2 1.7E+3 1.2E+3 9.8E+2 4.9E+2
Indoor 24h mean 4.2E+2 2.0E+2 5.2E+2 3.6E+2 5.6E+2 7.3E+2 4.7E+2 1.6E+2
Indoor 24 SD 2.5E+2 3.9E+1 3.2E+2 1.0E+2 3.5E+2 2.3E+2 2.2E+2 1.1E+2
24h mean In/Out 0.29 0.28 0.25 0.29 0.25 0.28 0.27 0.02
Highest 8h Outdoor 2.7E+3 9.5E+2 3.2E+3 1.8E+3 4.2E+3 3.0E+3 2.6E+3 1.0E+3
Highest 8h Indoor 6.8E+2 2.4E+2 7.8E+2 4.5E+2 1.0E+3 8.3E+2 6.6E+2 2.5E+2
Highest 8 h In/Out 0.26 0.25 0.24 0.26 0.24 0.27 0.25 0.01
Highest 1h Outdoor 3.1E+3 1.4E+3 4.6E+3 2.6E+3 5.5E+3 6.3E+3 3.9E+3 1.7E+3
Highest 1 h Indoor2 6.8E+2 2.4E+2 7.8E+2 4.5E+2 1.0E+3 8.3E+2 8.5E+2 3.7E+2
Highest 1h In/Out 0.24 0.19 0.23 0.21 0.23 0.20 0.22 0.02
Time of highest 1h Outdoor
12/2/14 20:58
12/4/14 6:29
12/4/14 22:06
12/5/14 20:52
12/6/14 22:02
12/7/14 20:02
Corresponding highest 1h Indoor
12/2/14 23:34
12/4/14 7:17
12/4/14 23:30
12/5/14 21:45
12/6/14 23:32
12/7/14 20:42
1 Based on 24h periods starting / ending at 1pm. Day 1 starts at 12/2/2014 22:00, and has < 24h of data. 2Occurring within 4h of highest 1h outdoor concentration.
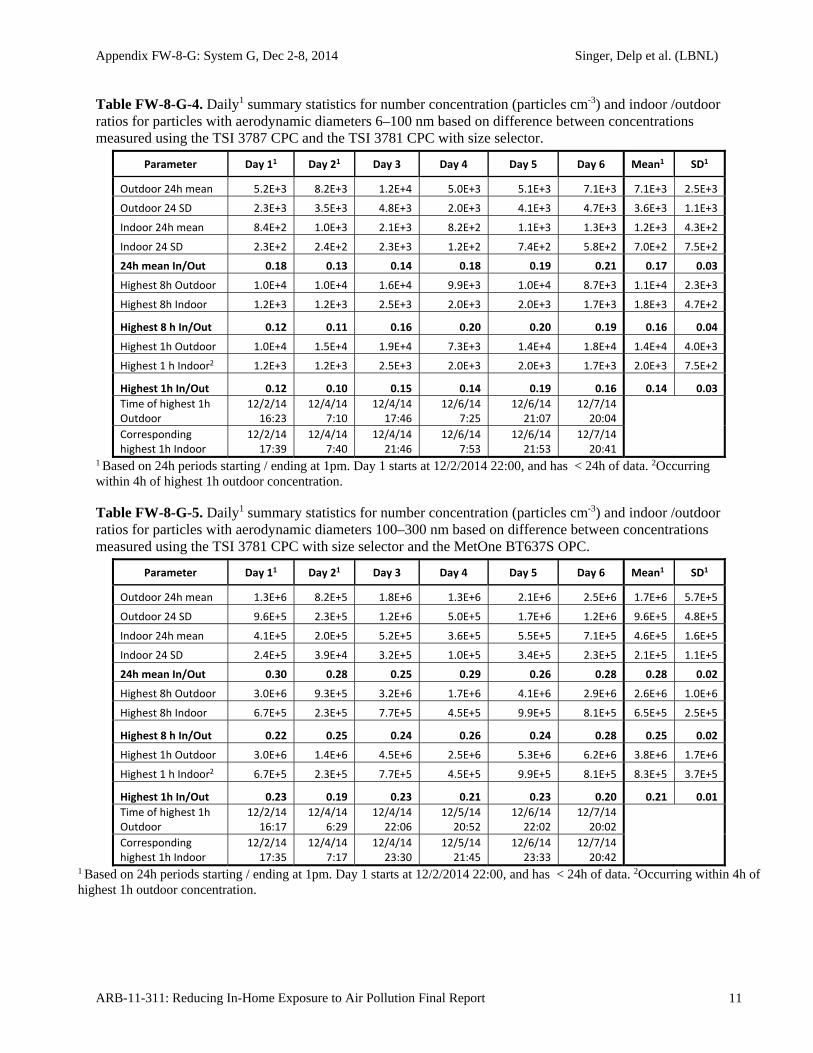
Appendix FW-8-G: System G, Dec 2-8, 2014 Singer, Delp et al. (LBNL)
ARB-11-311: Reducing In-Home Exposure to Air Pollution Final Report 11
Table FW-8-G-4. Daily1 summary statistics for number concentration (particles cm-3) and indoor /outdoor ratios for particles with aerodynamic diameters 6–100 nm based on difference between concentrations measured using the TSI 3787 CPC and the TSI 3781 CPC with size selector.
Parameter Day 11 Day 21 Day 3 Day 4 Day 5 Day 6 Mean1 SD1
Outdoor 24h mean 5.2E+3 8.2E+3 1.2E+4 5.0E+3 5.1E+3 7.1E+3 7.1E+3 2.5E+3
Outdoor 24 SD 2.3E+3 3.5E+3 4.8E+3 2.0E+3 4.1E+3 4.7E+3 3.6E+3 1.1E+3
Indoor 24h mean 8.4E+2 1.0E+3 2.1E+3 8.2E+2 1.1E+3 1.3E+3 1.2E+3 4.3E+2
Indoor 24 SD 2.3E+2 2.4E+2 2.3E+3 1.2E+2 7.4E+2 5.8E+2 7.0E+2 7.5E+2
24h mean In/Out 0.18 0.13 0.14 0.18 0.19 0.21 0.17 0.03
Highest 8h Outdoor 1.0E+4 1.0E+4 1.6E+4 9.9E+3 1.0E+4 8.7E+3 1.1E+4 2.3E+3
Highest 8h Indoor 1.2E+3 1.2E+3 2.5E+3 2.0E+3 2.0E+3 1.7E+3 1.8E+3 4.7E+2
Highest 8 h In/Out 0.12 0.11 0.16 0.20 0.20 0.19 0.16 0.04
Highest 1h Outdoor 1.0E+4 1.5E+4 1.9E+4 7.3E+3 1.4E+4 1.8E+4 1.4E+4 4.0E+3
Highest 1 h Indoor2 1.2E+3 1.2E+3 2.5E+3 2.0E+3 2.0E+3 1.7E+3 2.0E+3 7.5E+2
Highest 1h In/Out 0.12 0.10 0.15 0.14 0.19 0.16 0.14 0.03
Time of highest 1h Outdoor
12/2/14 16:23
12/4/14 7:10
12/4/14 17:46
12/6/14 7:25
12/6/14 21:07
12/7/14 20:04
Corresponding highest 1h Indoor
12/2/14 17:39
12/4/14 7:40
12/4/14 21:46
12/6/14 7:53
12/6/14 21:53
12/7/14 20:41
1 Based on 24h periods starting / ending at 1pm. Day 1 starts at 12/2/2014 22:00, and has < 24h of data. 2Occurring within 4h of highest 1h outdoor concentration. Table FW-8-G-5. Daily1 summary statistics for number concentration (particles cm-3) and indoor /outdoor ratios for particles with aerodynamic diameters 100–300 nm based on difference between concentrations measured using the TSI 3781 CPC with size selector and the MetOne BT637S OPC.
Parameter Day 11 Day 21 Day 3 Day 4 Day 5 Day 6 Mean1 SD1
Outdoor 24h mean 1.3E+6 8.2E+5 1.8E+6 1.3E+6 2.1E+6 2.5E+6 1.7E+6 5.7E+5
Outdoor 24 SD 9.6E+5 2.3E+5 1.2E+6 5.0E+5 1.7E+6 1.2E+6 9.6E+5 4.8E+5
Indoor 24h mean 4.1E+5 2.0E+5 5.2E+5 3.6E+5 5.5E+5 7.1E+5 4.6E+5 1.6E+5
Indoor 24 SD 2.4E+5 3.9E+4 3.2E+5 1.0E+5 3.4E+5 2.3E+5 2.1E+5 1.1E+5
24h mean In/Out 0.30 0.28 0.25 0.29 0.26 0.28 0.28 0.02
Highest 8h Outdoor 3.0E+6 9.3E+5 3.2E+6 1.7E+6 4.1E+6 2.9E+6 2.6E+6 1.0E+6
Highest 8h Indoor 6.7E+5 2.3E+5 7.7E+5 4.5E+5 9.9E+5 8.1E+5 6.5E+5 2.5E+5
Highest 8 h In/Out 0.22 0.25 0.24 0.26 0.24 0.28 0.25 0.02
Highest 1h Outdoor 3.0E+6 1.4E+6 4.5E+6 2.5E+6 5.3E+6 6.2E+6 3.8E+6 1.7E+6
Highest 1 h Indoor2 6.7E+5 2.3E+5 7.7E+5 4.5E+5 9.9E+5 8.1E+5 8.3E+5 3.7E+5
Highest 1h In/Out 0.23 0.19 0.23 0.21 0.23 0.20 0.21 0.01
Time of highest 1h Outdoor
12/2/14 16:17
12/4/14 6:29
12/4/14 22:06
12/5/14 20:52
12/6/14 22:02
12/7/14 20:02
Corresponding highest 1h Indoor
12/2/14 17:35
12/4/14 7:17
12/4/14 23:30
12/5/14 21:45
12/6/14 23:33
12/7/14 20:42
1 Based on 24h periods starting / ending at 1pm. Day 1 starts at 12/2/2014 22:00, and has < 24h of data. 2Occurring within 4h of highest 1h outdoor concentration.
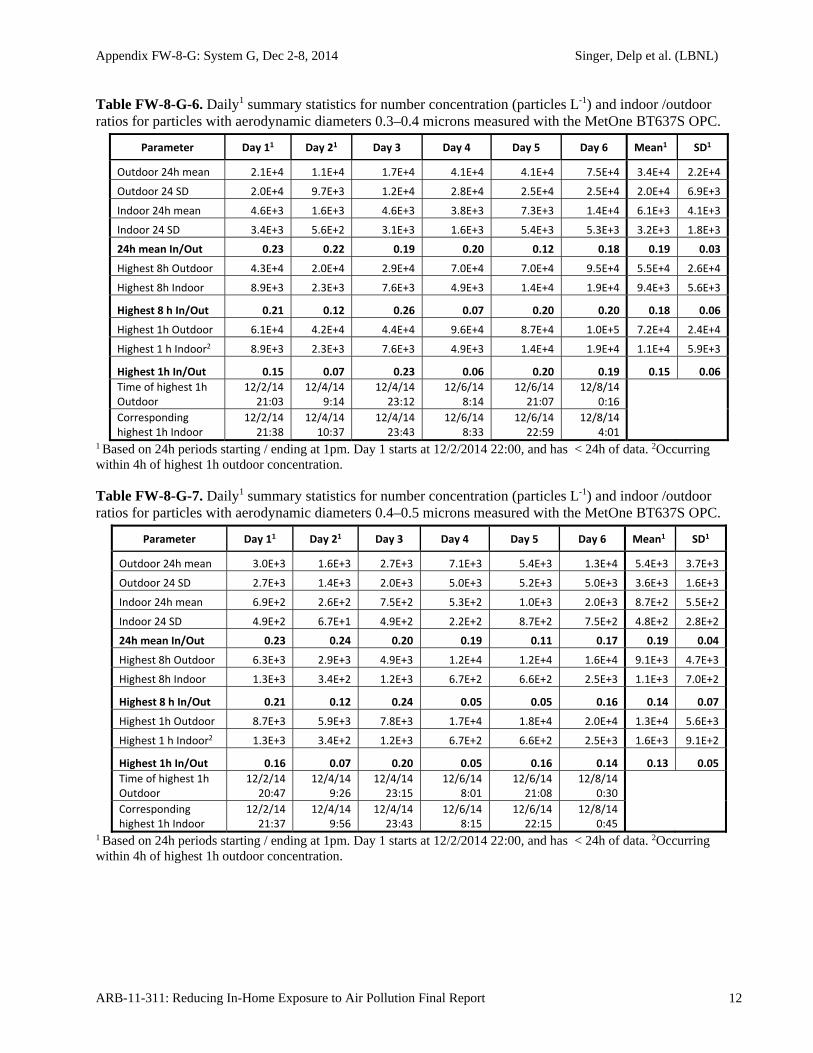
Appendix FW-8-G: System G, Dec 2-8, 2014 Singer, Delp et al. (LBNL)
ARB-11-311: Reducing In-Home Exposure to Air Pollution Final Report 12
Table FW-8-G-6. Daily1 summary statistics for number concentration (particles L-1) and indoor /outdoor ratios for particles with aerodynamic diameters 0.3–0.4 microns measured with the MetOne BT637S OPC.
Parameter Day 11 Day 21 Day 3 Day 4 Day 5 Day 6 Mean1 SD1
Outdoor 24h mean 2.1E+4 1.1E+4 1.7E+4 4.1E+4 4.1E+4 7.5E+4 3.4E+4 2.2E+4
Outdoor 24 SD 2.0E+4 9.7E+3 1.2E+4 2.8E+4 2.5E+4 2.5E+4 2.0E+4 6.9E+3
Indoor 24h mean 4.6E+3 1.6E+3 4.6E+3 3.8E+3 7.3E+3 1.4E+4 6.1E+3 4.1E+3
Indoor 24 SD 3.4E+3 5.6E+2 3.1E+3 1.6E+3 5.4E+3 5.3E+3 3.2E+3 1.8E+3
24h mean In/Out 0.23 0.22 0.19 0.20 0.12 0.18 0.19 0.03
Highest 8h Outdoor 4.3E+4 2.0E+4 2.9E+4 7.0E+4 7.0E+4 9.5E+4 5.5E+4 2.6E+4
Highest 8h Indoor 8.9E+3 2.3E+3 7.6E+3 4.9E+3 1.4E+4 1.9E+4 9.4E+3 5.6E+3
Highest 8 h In/Out 0.21 0.12 0.26 0.07 0.20 0.20 0.18 0.06
Highest 1h Outdoor 6.1E+4 4.2E+4 4.4E+4 9.6E+4 8.7E+4 1.0E+5 7.2E+4 2.4E+4
Highest 1 h Indoor2 8.9E+3 2.3E+3 7.6E+3 4.9E+3 1.4E+4 1.9E+4 1.1E+4 5.9E+3
Highest 1h In/Out 0.15 0.07 0.23 0.06 0.20 0.19 0.15 0.06
Time of highest 1h Outdoor
12/2/14 21:03
12/4/14 9:14
12/4/14 23:12
12/6/14 8:14
12/6/14 21:07
12/8/14 0:16
Corresponding highest 1h Indoor
12/2/14 21:38
12/4/14 10:37
12/4/14 23:43
12/6/14 8:33
12/6/14 22:59
12/8/14 4:01
1 Based on 24h periods starting / ending at 1pm. Day 1 starts at 12/2/2014 22:00, and has < 24h of data. 2Occurring within 4h of highest 1h outdoor concentration. Table FW-8-G-7. Daily1 summary statistics for number concentration (particles L-1) and indoor /outdoor ratios for particles with aerodynamic diameters 0.4–0.5 microns measured with the MetOne BT637S OPC.
Parameter Day 11 Day 21 Day 3 Day 4 Day 5 Day 6 Mean1 SD1
Outdoor 24h mean 3.0E+3 1.6E+3 2.7E+3 7.1E+3 5.4E+3 1.3E+4 5.4E+3 3.7E+3
Outdoor 24 SD 2.7E+3 1.4E+3 2.0E+3 5.0E+3 5.2E+3 5.0E+3 3.6E+3 1.6E+3
Indoor 24h mean 6.9E+2 2.6E+2 7.5E+2 5.3E+2 1.0E+3 2.0E+3 8.7E+2 5.5E+2
Indoor 24 SD 4.9E+2 6.7E+1 4.9E+2 2.2E+2 8.7E+2 7.5E+2 4.8E+2 2.8E+2
24h mean In/Out 0.23 0.24 0.20 0.19 0.11 0.17 0.19 0.04
Highest 8h Outdoor 6.3E+3 2.9E+3 4.9E+3 1.2E+4 1.2E+4 1.6E+4 9.1E+3 4.7E+3
Highest 8h Indoor 1.3E+3 3.4E+2 1.2E+3 6.7E+2 6.6E+2 2.5E+3 1.1E+3 7.0E+2
Highest 8 h In/Out 0.21 0.12 0.24 0.05 0.05 0.16 0.14 0.07
Highest 1h Outdoor 8.7E+3 5.9E+3 7.8E+3 1.7E+4 1.8E+4 2.0E+4 1.3E+4 5.6E+3
Highest 1 h Indoor2 1.3E+3 3.4E+2 1.2E+3 6.7E+2 6.6E+2 2.5E+3 1.6E+3 9.1E+2
Highest 1h In/Out 0.16 0.07 0.20 0.05 0.16 0.14 0.13 0.05
Time of highest 1h Outdoor
12/2/14 20:47
12/4/14 9:26
12/4/14 23:15
12/6/14 8:01
12/6/14 21:08
12/8/14 0:30
Corresponding highest 1h Indoor
12/2/14 21:37
12/4/14 9:56
12/4/14 23:43
12/6/14 8:15
12/6/14 22:15
12/8/14 0:45
1 Based on 24h periods starting / ending at 1pm. Day 1 starts at 12/2/2014 22:00, and has < 24h of data. 2Occurring within 4h of highest 1h outdoor concentration.
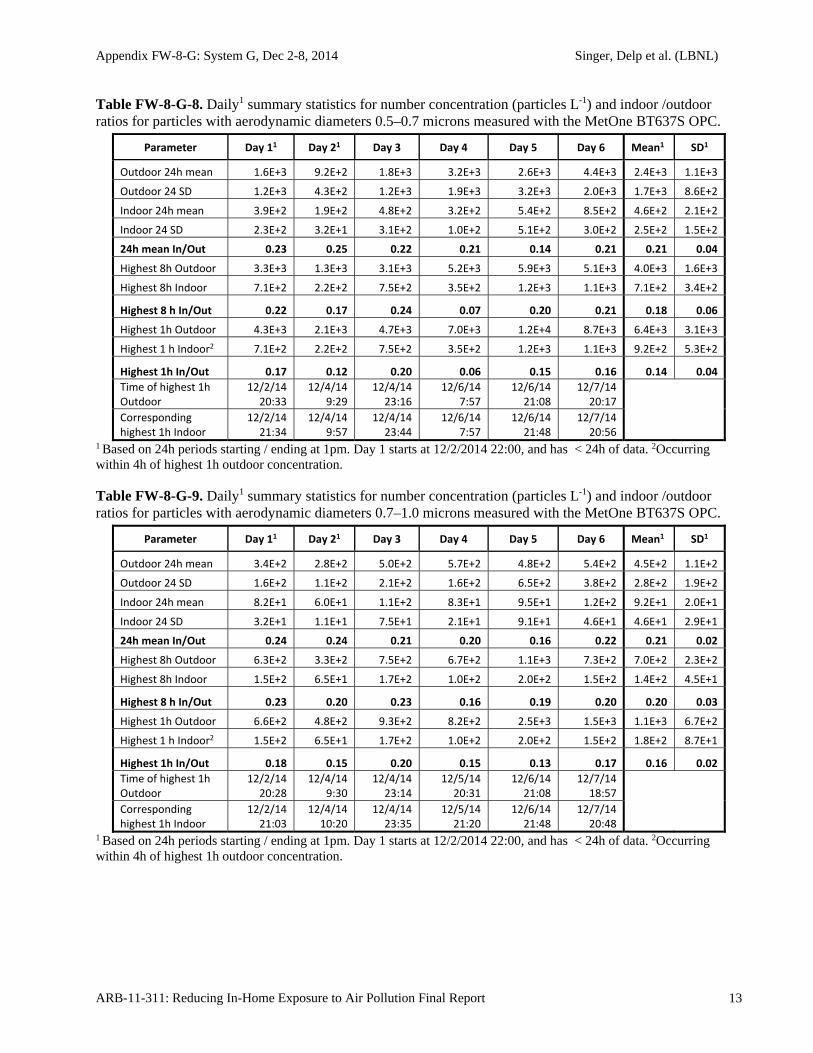
Appendix FW-8-G: System G, Dec 2-8, 2014 Singer, Delp et al. (LBNL)
ARB-11-311: Reducing In-Home Exposure to Air Pollution Final Report 13
Table FW-8-G-8. Daily1 summary statistics for number concentration (particles L-1) and indoor /outdoor ratios for particles with aerodynamic diameters 0.5–0.7 microns measured with the MetOne BT637S OPC.
Parameter Day 11 Day 21 Day 3 Day 4 Day 5 Day 6 Mean1 SD1
Outdoor 24h mean 1.6E+3 9.2E+2 1.8E+3 3.2E+3 2.6E+3 4.4E+3 2.4E+3 1.1E+3
Outdoor 24 SD 1.2E+3 4.3E+2 1.2E+3 1.9E+3 3.2E+3 2.0E+3 1.7E+3 8.6E+2
Indoor 24h mean 3.9E+2 1.9E+2 4.8E+2 3.2E+2 5.4E+2 8.5E+2 4.6E+2 2.1E+2
Indoor 24 SD 2.3E+2 3.2E+1 3.1E+2 1.0E+2 5.1E+2 3.0E+2 2.5E+2 1.5E+2
24h mean In/Out 0.23 0.25 0.22 0.21 0.14 0.21 0.21 0.04
Highest 8h Outdoor 3.3E+3 1.3E+3 3.1E+3 5.2E+3 5.9E+3 5.1E+3 4.0E+3 1.6E+3
Highest 8h Indoor 7.1E+2 2.2E+2 7.5E+2 3.5E+2 1.2E+3 1.1E+3 7.1E+2 3.4E+2
Highest 8 h In/Out 0.22 0.17 0.24 0.07 0.20 0.21 0.18 0.06
Highest 1h Outdoor 4.3E+3 2.1E+3 4.7E+3 7.0E+3 1.2E+4 8.7E+3 6.4E+3 3.1E+3
Highest 1 h Indoor2 7.1E+2 2.2E+2 7.5E+2 3.5E+2 1.2E+3 1.1E+3 9.2E+2 5.3E+2
Highest 1h In/Out 0.17 0.12 0.20 0.06 0.15 0.16 0.14 0.04
Time of highest 1h Outdoor
12/2/14 20:33
12/4/14 9:29
12/4/14 23:16
12/6/14 7:57
12/6/14 21:08
12/7/14 20:17
Corresponding highest 1h Indoor
12/2/14 21:34
12/4/14 9:57
12/4/14 23:44
12/6/14 7:57
12/6/14 21:48
12/7/14 20:56
1 Based on 24h periods starting / ending at 1pm. Day 1 starts at 12/2/2014 22:00, and has < 24h of data. 2Occurring within 4h of highest 1h outdoor concentration. Table FW-8-G-9. Daily1 summary statistics for number concentration (particles L-1) and indoor /outdoor ratios for particles with aerodynamic diameters 0.7–1.0 microns measured with the MetOne BT637S OPC.
Parameter Day 11 Day 21 Day 3 Day 4 Day 5 Day 6 Mean1 SD1
Outdoor 24h mean 3.4E+2 2.8E+2 5.0E+2 5.7E+2 4.8E+2 5.4E+2 4.5E+2 1.1E+2
Outdoor 24 SD 1.6E+2 1.1E+2 2.1E+2 1.6E+2 6.5E+2 3.8E+2 2.8E+2 1.9E+2
Indoor 24h mean 8.2E+1 6.0E+1 1.1E+2 8.3E+1 9.5E+1 1.2E+2 9.2E+1 2.0E+1
Indoor 24 SD 3.2E+1 1.1E+1 7.5E+1 2.1E+1 9.1E+1 4.6E+1 4.6E+1 2.9E+1
24h mean In/Out 0.24 0.24 0.21 0.20 0.16 0.22 0.21 0.02
Highest 8h Outdoor 6.3E+2 3.3E+2 7.5E+2 6.7E+2 1.1E+3 7.3E+2 7.0E+2 2.3E+2
Highest 8h Indoor 1.5E+2 6.5E+1 1.7E+2 1.0E+2 2.0E+2 1.5E+2 1.4E+2 4.5E+1
Highest 8 h In/Out 0.23 0.20 0.23 0.16 0.19 0.20 0.20 0.03
Highest 1h Outdoor 6.6E+2 4.8E+2 9.3E+2 8.2E+2 2.5E+3 1.5E+3 1.1E+3 6.7E+2
Highest 1 h Indoor2 1.5E+2 6.5E+1 1.7E+2 1.0E+2 2.0E+2 1.5E+2 1.8E+2 8.7E+1
Highest 1h In/Out 0.18 0.15 0.20 0.15 0.13 0.17 0.16 0.02
Time of highest 1h Outdoor
12/2/14 20:28
12/4/14 9:30
12/4/14 23:14
12/5/14 20:31
12/6/14 21:08
12/7/14 18:57
Corresponding highest 1h Indoor
12/2/14 21:03
12/4/14 10:20
12/4/14 23:35
12/5/14 21:20
12/6/14 21:48
12/7/14 20:48
1 Based on 24h periods starting / ending at 1pm. Day 1 starts at 12/2/2014 22:00, and has < 24h of data. 2Occurring within 4h of highest 1h outdoor concentration.
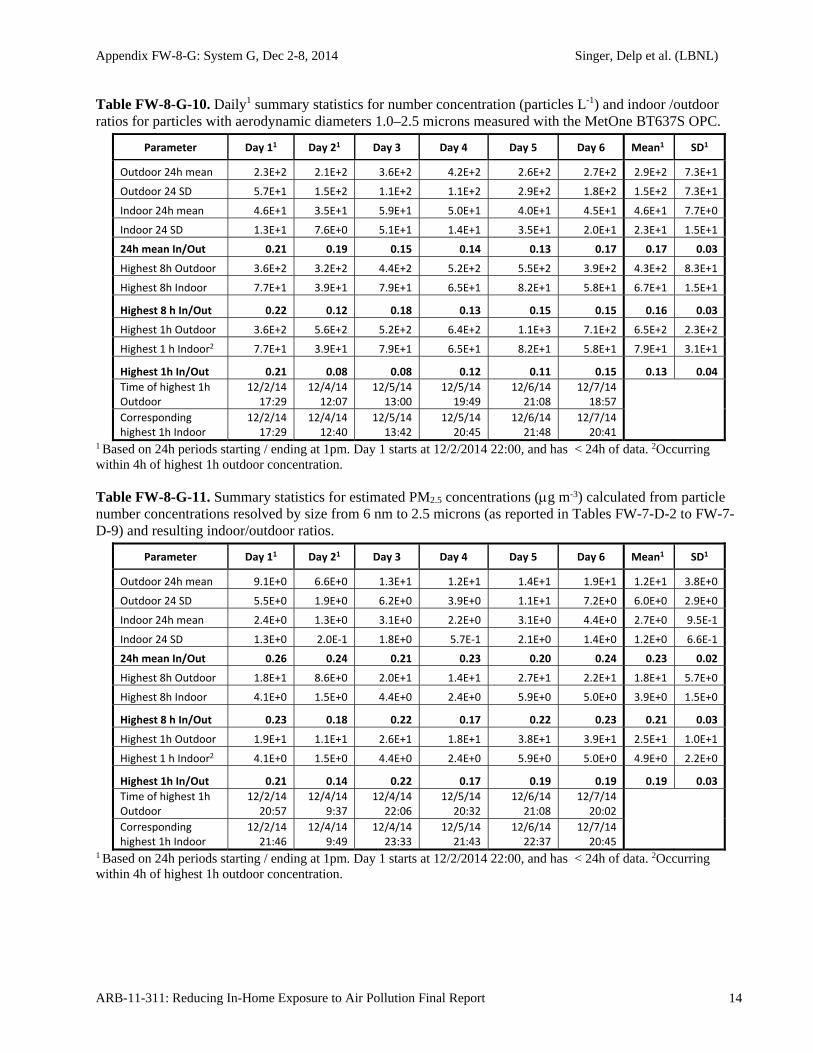
Appendix FW-8-G: System G, Dec 2-8, 2014 Singer, Delp et al. (LBNL)
ARB-11-311: Reducing In-Home Exposure to Air Pollution Final Report 14
Table FW-8-G-10. Daily1 summary statistics for number concentration (particles L-1) and indoor /outdoor ratios for particles with aerodynamic diameters 1.0–2.5 microns measured with the MetOne BT637S OPC.
Parameter Day 11 Day 21 Day 3 Day 4 Day 5 Day 6 Mean1 SD1
Outdoor 24h mean 2.3E+2 2.1E+2 3.6E+2 4.2E+2 2.6E+2 2.7E+2 2.9E+2 7.3E+1
Outdoor 24 SD 5.7E+1 1.5E+2 1.1E+2 1.1E+2 2.9E+2 1.8E+2 1.5E+2 7.3E+1
Indoor 24h mean 4.6E+1 3.5E+1 5.9E+1 5.0E+1 4.0E+1 4.5E+1 4.6E+1 7.7E+0
Indoor 24 SD 1.3E+1 7.6E+0 5.1E+1 1.4E+1 3.5E+1 2.0E+1 2.3E+1 1.5E+1
24h mean In/Out 0.21 0.19 0.15 0.14 0.13 0.17 0.17 0.03
Highest 8h Outdoor 3.6E+2 3.2E+2 4.4E+2 5.2E+2 5.5E+2 3.9E+2 4.3E+2 8.3E+1
Highest 8h Indoor 7.7E+1 3.9E+1 7.9E+1 6.5E+1 8.2E+1 5.8E+1 6.7E+1 1.5E+1
Highest 8 h In/Out 0.22 0.12 0.18 0.13 0.15 0.15 0.16 0.03
Highest 1h Outdoor 3.6E+2 5.6E+2 5.2E+2 6.4E+2 1.1E+3 7.1E+2 6.5E+2 2.3E+2
Highest 1 h Indoor2 7.7E+1 3.9E+1 7.9E+1 6.5E+1 8.2E+1 5.8E+1 7.9E+1 3.1E+1
Highest 1h In/Out 0.21 0.08 0.08 0.12 0.11 0.15 0.13 0.04
Time of highest 1h Outdoor
12/2/14 17:29
12/4/14 12:07
12/5/14 13:00
12/5/14 19:49
12/6/14 21:08
12/7/14 18:57
Corresponding highest 1h Indoor
12/2/14 17:29
12/4/14 12:40
12/5/14 13:42
12/5/14 20:45
12/6/14 21:48
12/7/14 20:41
1 Based on 24h periods starting / ending at 1pm. Day 1 starts at 12/2/2014 22:00, and has < 24h of data. 2Occurring within 4h of highest 1h outdoor concentration. Table FW-8-G-11. Summary statistics for estimated PM2.5 concentrations (g m-3) calculated from particle number concentrations resolved by size from 6 nm to 2.5 microns (as reported in Tables FW-7-D-2 to FW-7-D-9) and resulting indoor/outdoor ratios.
Parameter Day 11 Day 21 Day 3 Day 4 Day 5 Day 6 Mean1 SD1
Outdoor 24h mean 9.1E+0 6.6E+0 1.3E+1 1.2E+1 1.4E+1 1.9E+1 1.2E+1 3.8E+0
Outdoor 24 SD 5.5E+0 1.9E+0 6.2E+0 3.9E+0 1.1E+1 7.2E+0 6.0E+0 2.9E+0
Indoor 24h mean 2.4E+0 1.3E+0 3.1E+0 2.2E+0 3.1E+0 4.4E+0 2.7E+0 9.5E‐1
Indoor 24 SD 1.3E+0 2.0E‐1 1.8E+0 5.7E‐1 2.1E+0 1.4E+0 1.2E+0 6.6E‐1
24h mean In/Out 0.26 0.24 0.21 0.23 0.20 0.24 0.23 0.02
Highest 8h Outdoor 1.8E+1 8.6E+0 2.0E+1 1.4E+1 2.7E+1 2.2E+1 1.8E+1 5.7E+0
Highest 8h Indoor 4.1E+0 1.5E+0 4.4E+0 2.4E+0 5.9E+0 5.0E+0 3.9E+0 1.5E+0
Highest 8 h In/Out 0.23 0.18 0.22 0.17 0.22 0.23 0.21 0.03
Highest 1h Outdoor 1.9E+1 1.1E+1 2.6E+1 1.8E+1 3.8E+1 3.9E+1 2.5E+1 1.0E+1
Highest 1 h Indoor2 4.1E+0 1.5E+0 4.4E+0 2.4E+0 5.9E+0 5.0E+0 4.9E+0 2.2E+0
Highest 1h In/Out 0.21 0.14 0.22 0.17 0.19 0.19 0.19 0.03
Time of highest 1h Outdoor
12/2/14 20:57
12/4/14 9:37
12/4/14 22:06
12/5/14 20:32
12/6/14 21:08
12/7/14 20:02
Corresponding highest 1h Indoor
12/2/14 21:46
12/4/14 9:49
12/4/14 23:33
12/5/14 21:43
12/6/14 22:37
12/7/14 20:45
1 Based on 24h periods starting / ending at 1pm. Day 1 starts at 12/2/2014 22:00, and has < 24h of data. 2Occurring within 4h of highest 1h outdoor concentration.
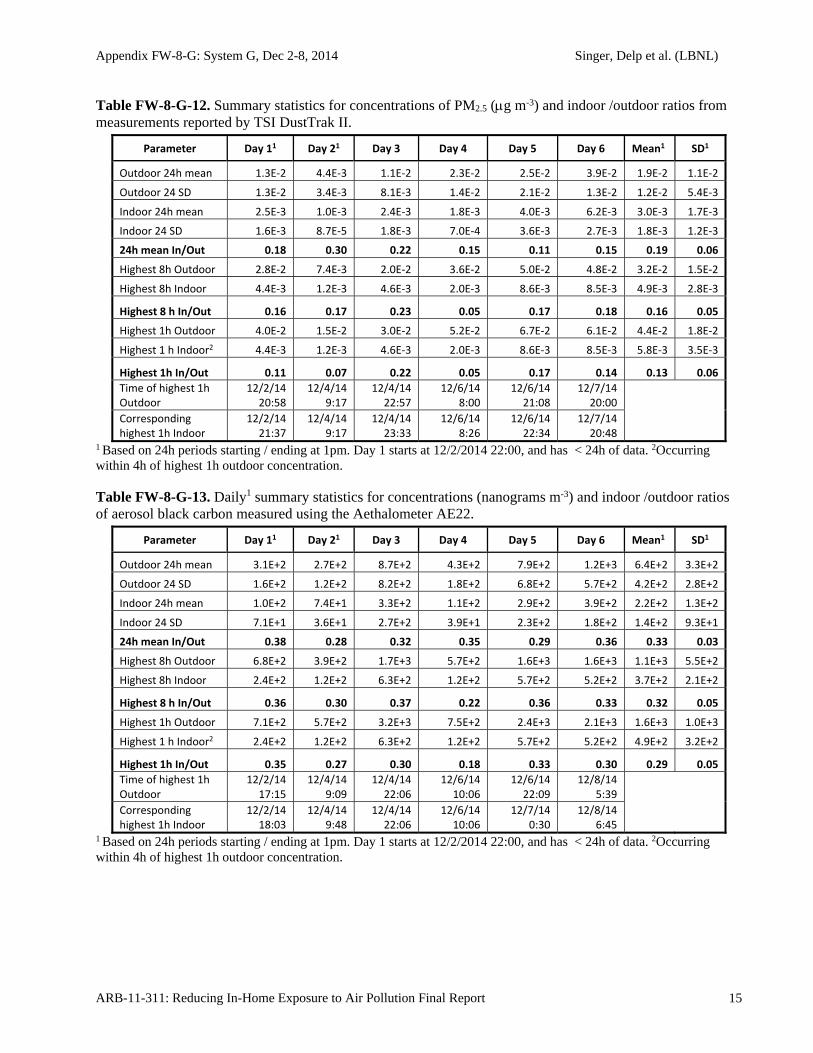
Appendix FW-8-G: System G, Dec 2-8, 2014 Singer, Delp et al. (LBNL)
ARB-11-311: Reducing In-Home Exposure to Air Pollution Final Report 15
Table FW-8-G-12. Summary statistics for concentrations of PM2.5 (g m-3) and indoor /outdoor ratios from measurements reported by TSI DustTrak II.
Parameter Day 11 Day 21 Day 3 Day 4 Day 5 Day 6 Mean1 SD1
Outdoor 24h mean 1.3E‐2 4.4E‐3 1.1E‐2 2.3E‐2 2.5E‐2 3.9E‐2 1.9E‐2 1.1E‐2
Outdoor 24 SD 1.3E‐2 3.4E‐3 8.1E‐3 1.4E‐2 2.1E‐2 1.3E‐2 1.2E‐2 5.4E‐3
Indoor 24h mean 2.5E‐3 1.0E‐3 2.4E‐3 1.8E‐3 4.0E‐3 6.2E‐3 3.0E‐3 1.7E‐3
Indoor 24 SD 1.6E‐3 8.7E‐5 1.8E‐3 7.0E‐4 3.6E‐3 2.7E‐3 1.8E‐3 1.2E‐3
24h mean In/Out 0.18 0.30 0.22 0.15 0.11 0.15 0.19 0.06
Highest 8h Outdoor 2.8E‐2 7.4E‐3 2.0E‐2 3.6E‐2 5.0E‐2 4.8E‐2 3.2E‐2 1.5E‐2
Highest 8h Indoor 4.4E‐3 1.2E‐3 4.6E‐3 2.0E‐3 8.6E‐3 8.5E‐3 4.9E‐3 2.8E‐3
Highest 8 h In/Out 0.16 0.17 0.23 0.05 0.17 0.18 0.16 0.05
Highest 1h Outdoor 4.0E‐2 1.5E‐2 3.0E‐2 5.2E‐2 6.7E‐2 6.1E‐2 4.4E‐2 1.8E‐2
Highest 1 h Indoor2 4.4E‐3 1.2E‐3 4.6E‐3 2.0E‐3 8.6E‐3 8.5E‐3 5.8E‐3 3.5E‐3
Highest 1h In/Out 0.11 0.07 0.22 0.05 0.17 0.14 0.13 0.06
Time of highest 1h Outdoor
12/2/14 20:58
12/4/14 9:17
12/4/14 22:57
12/6/14 8:00
12/6/14 21:08
12/7/14 20:00
Corresponding highest 1h Indoor
12/2/14 21:37
12/4/14 9:17
12/4/14 23:33
12/6/14 8:26
12/6/14 22:34
12/7/14 20:48
1 Based on 24h periods starting / ending at 1pm. Day 1 starts at 12/2/2014 22:00, and has < 24h of data. 2Occurring within 4h of highest 1h outdoor concentration. Table FW-8-G-13. Daily1 summary statistics for concentrations (nanograms m-3) and indoor /outdoor ratios of aerosol black carbon measured using the Aethalometer AE22.
Parameter Day 11 Day 21 Day 3 Day 4 Day 5 Day 6 Mean1 SD1
Outdoor 24h mean 3.1E+2 2.7E+2 8.7E+2 4.3E+2 7.9E+2 1.2E+3 6.4E+2 3.3E+2
Outdoor 24 SD 1.6E+2 1.2E+2 8.2E+2 1.8E+2 6.8E+2 5.7E+2 4.2E+2 2.8E+2
Indoor 24h mean 1.0E+2 7.4E+1 3.3E+2 1.1E+2 2.9E+2 3.9E+2 2.2E+2 1.3E+2
Indoor 24 SD 7.1E+1 3.6E+1 2.7E+2 3.9E+1 2.3E+2 1.8E+2 1.4E+2 9.3E+1
24h mean In/Out 0.38 0.28 0.32 0.35 0.29 0.36 0.33 0.03
Highest 8h Outdoor 6.8E+2 3.9E+2 1.7E+3 5.7E+2 1.6E+3 1.6E+3 1.1E+3 5.5E+2
Highest 8h Indoor 2.4E+2 1.2E+2 6.3E+2 1.2E+2 5.7E+2 5.2E+2 3.7E+2 2.1E+2
Highest 8 h In/Out 0.36 0.30 0.37 0.22 0.36 0.33 0.32 0.05
Highest 1h Outdoor 7.1E+2 5.7E+2 3.2E+3 7.5E+2 2.4E+3 2.1E+3 1.6E+3 1.0E+3
Highest 1 h Indoor2 2.4E+2 1.2E+2 6.3E+2 1.2E+2 5.7E+2 5.2E+2 4.9E+2 3.2E+2
Highest 1h In/Out 0.35 0.27 0.30 0.18 0.33 0.30 0.29 0.05
Time of highest 1h Outdoor
12/2/14 17:15
12/4/14 9:09
12/4/14 22:06
12/6/14 10:06
12/6/14 22:09
12/8/14 5:39
Corresponding highest 1h Indoor
12/2/14 18:03
12/4/14 9:48
12/4/14 22:06
12/6/14 10:06
12/7/14 0:30
12/8/14 6:45
1 Based on 24h periods starting / ending at 1pm. Day 1 starts at 12/2/2014 22:00, and has < 24h of data. 2Occurring within 4h of highest 1h outdoor concentration.
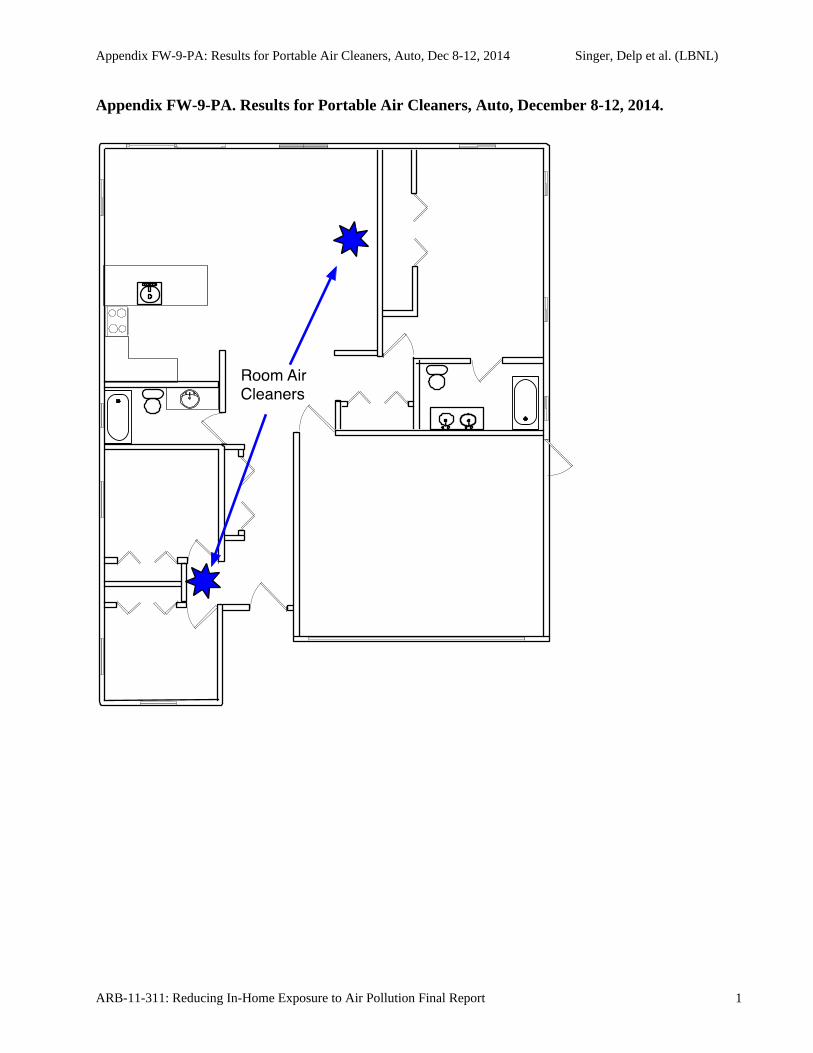
Appendix FW-9-PA: Results for Portable Air Cleaners, Auto, Dec 8-12, 2014 Singer, Delp et al. (LBNL)
ARB-11-311: Reducing In-Home Exposure to Air Pollution Final Report 1
Appendix FW-9-PA. Results for Portable Air Cleaners, Auto, December 8-12, 2014.
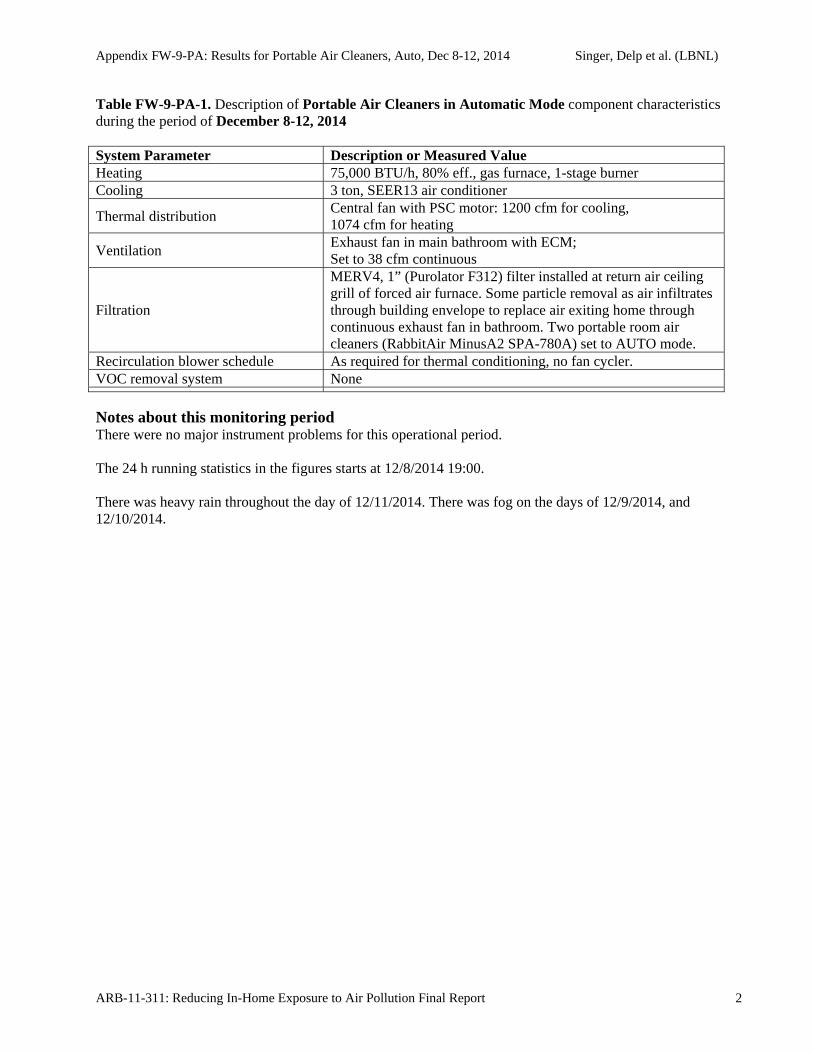
Appendix FW-9-PA: Results for Portable Air Cleaners, Auto, Dec 8-12, 2014 Singer, Delp et al. (LBNL)
ARB-11-311: Reducing In-Home Exposure to Air Pollution Final Report 2
Table FW-9-PA-1. Description of Portable Air Cleaners in Automatic Mode component characteristics during the period of December 8-12, 2014 System Parameter Description or Measured Value Heating 75,000 BTU/h, 80% eff., gas furnace, 1-stage burner Cooling 3 ton, SEER13 air conditioner
Thermal distribution Central fan with PSC motor: 1200 cfm for cooling, 1074 cfm for heating
Ventilation Exhaust fan in main bathroom with ECM; Set to 38 cfm continuous
Filtration
MERV4, 1” (Purolator F312) filter installed at return air ceiling grill of forced air furnace. Some particle removal as air infiltrates through building envelope to replace air exiting home through continuous exhaust fan in bathroom. Two portable room air cleaners (RabbitAir MinusA2 SPA-780A) set to AUTO mode.
Recirculation blower schedule As required for thermal conditioning, no fan cycler. VOC removal system None
Notes about this monitoring period There were no major instrument problems for this operational period. The 24 h running statistics in the figures starts at 12/8/2014 19:00. There was heavy rain throughout the day of 12/11/2014. There was fog on the days of 12/9/2014, and 12/10/2014.
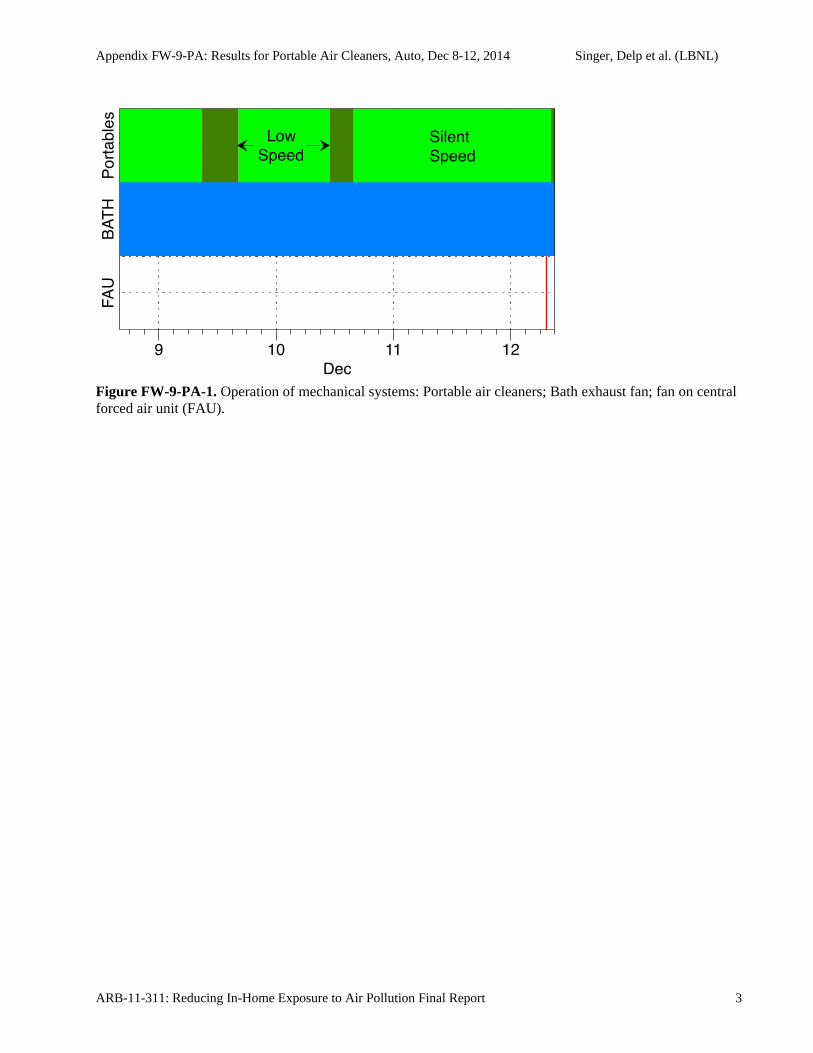
Appendix FW-9-PA: Results for Portable Air Cleaners, Auto, Dec 8-12, 2014 Singer, Delp et al. (LBNL)
ARB-11-311: Reducing In-Home Exposure to Air Pollution Final Report 3
Figure FW-9-PA-1. Operation of mechanical systems: Portable air cleaners; Bath exhaust fan; fan on central forced air unit (FAU).
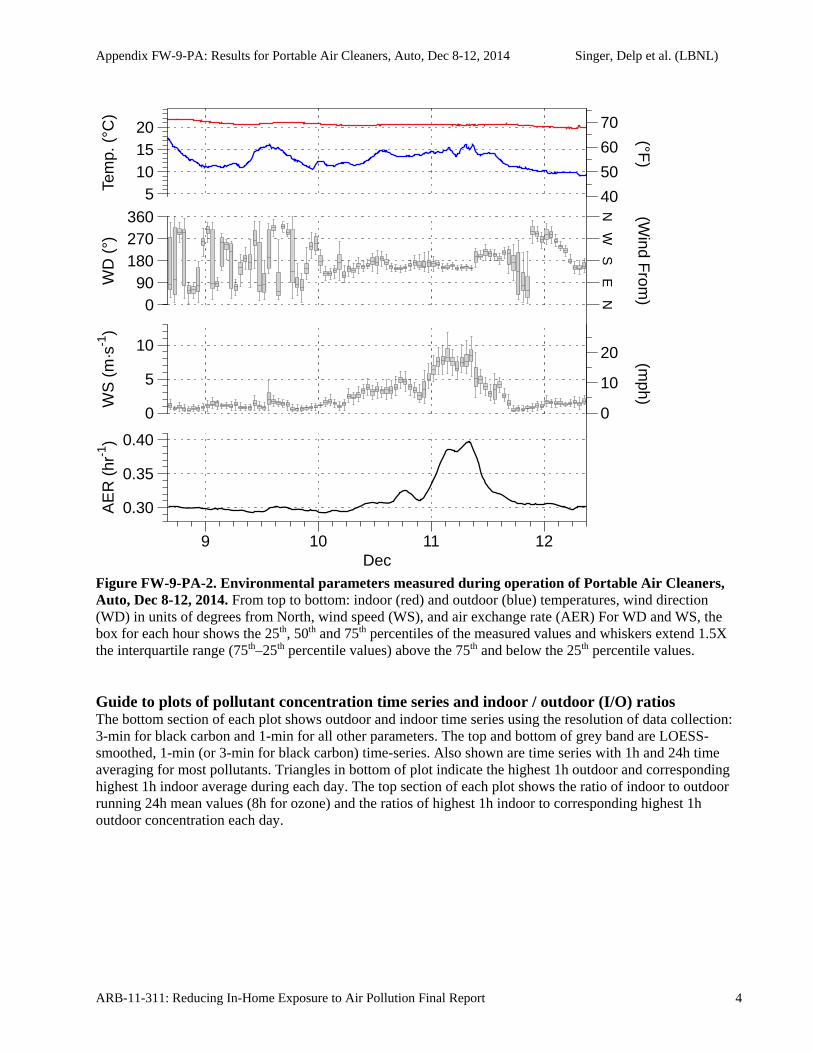
Appendix FW-9-PA: Results for Portable Air Cleaners, Auto, Dec 8-12, 2014 Singer, Delp et al. (LBNL)
ARB-11-311: Reducing In-Home Exposure to Air Pollution Final Report 4
Figure FW-9-PA-2. Environmental parameters measured during operation of Portable Air Cleaners, Auto, Dec 8-12, 2014. From top to bottom: indoor (red) and outdoor (blue) temperatures, wind direction (WD) in units of degrees from North, wind speed (WS), and air exchange rate (AER) For WD and WS, the box for each hour shows the 25th, 50th and 75th percentiles of the measured values and whiskers extend 1.5X the interquartile range (75th–25th percentile values) above the 75th and below the 25th percentile values. Guide to plots of pollutant concentration time series and indoor / outdoor (I/O) ratios The bottom section of each plot shows outdoor and indoor time series using the resolution of data collection: 3-min for black carbon and 1-min for all other parameters. The top and bottom of grey band are LOESS-smoothed, 1-min (or 3-min for black carbon) time-series. Also shown are time series with 1h and 24h time averaging for most pollutants. Triangles in bottom of plot indicate the highest 1h outdoor and corresponding highest 1h indoor average during each day. The top section of each plot shows the ratio of indoor to outdoor running 24h mean values (8h for ozone) and the ratios of highest 1h indoor to corresponding highest 1h outdoor concentration each day.
0
10
20
40
50
60
70
NE
SW
N
(mph)
(Wind F
rom)
(°F)
AE
R (
hr-1
)
0.30
0.35
0.40
WS
(m
·s-1
)
0
5
10
WD
(°)
090
180270360
Tem
p. (
°C)
5101520
9 10 11 12Dec
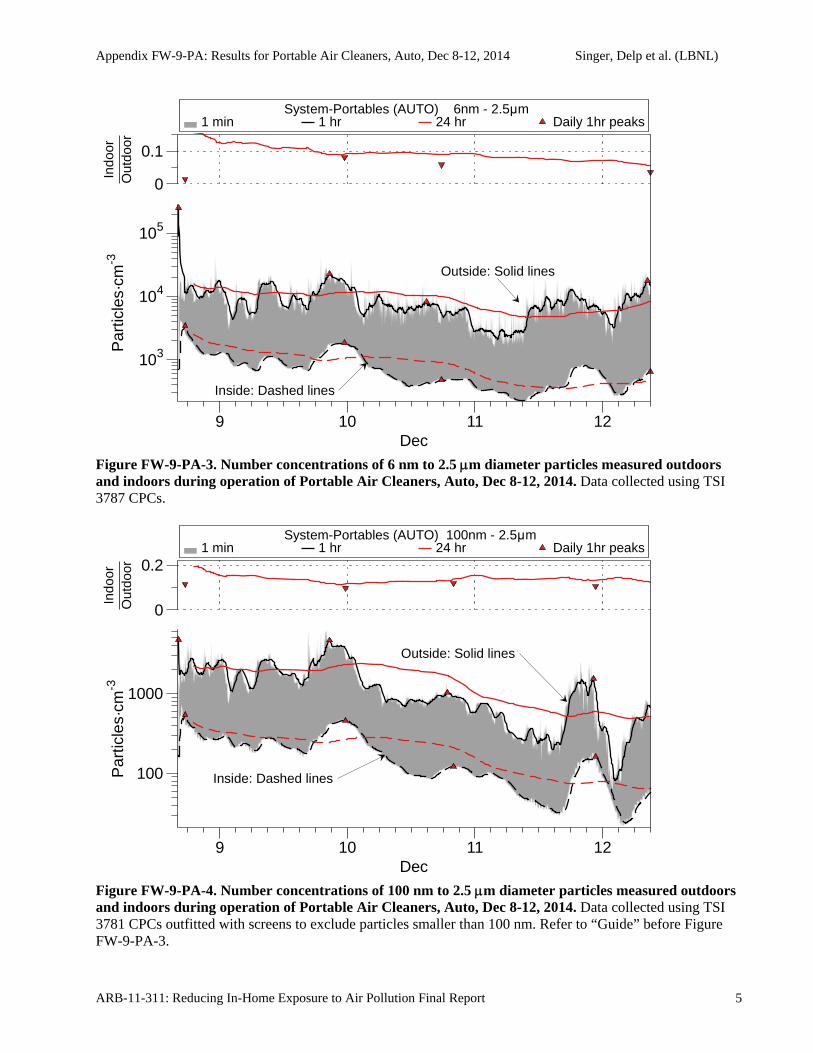
Appendix FW-9-PA: Results for Portable Air Cleaners, Auto, Dec 8-12, 2014 Singer, Delp et al. (LBNL)
ARB-11-311: Reducing In-Home Exposure to Air Pollution Final Report 5
Figure FW-9-PA-3. Number concentrations of 6 nm to 2.5 m diameter particles measured outdoors and indoors during operation of Portable Air Cleaners, Auto, Dec 8-12, 2014. Data collected using TSI 3787 CPCs.
Figure FW-9-PA-4. Number concentrations of 100 nm to 2.5 m diameter particles measured outdoors and indoors during operation of Portable Air Cleaners, Auto, Dec 8-12, 2014. Data collected using TSI 3781 CPCs outfitted with screens to exclude particles smaller than 100 nm. Refer to “Guide” before Figure FW-9-PA-3.
1 min 1 hr 24 hr Daily 1hr peaks System-Portables (AUTO) 6nm - 2.5μm
Outside: Solid lines
Inside: Dashed lines
Par
ticle
s·cm
-3
103
104
105
Indo
orO
utdo
or
0
0.1
9 10 11 12Dec
1 min 1 hr 24 hr Daily 1hr peaks System-Portables (AUTO) 100nm - 2.5μm
Outside: Solid lines
Inside: Dashed linesPar
ticle
s·cm
-3
100
1000
Indo
orO
utdo
or
0
0.2
9 10 11 12Dec
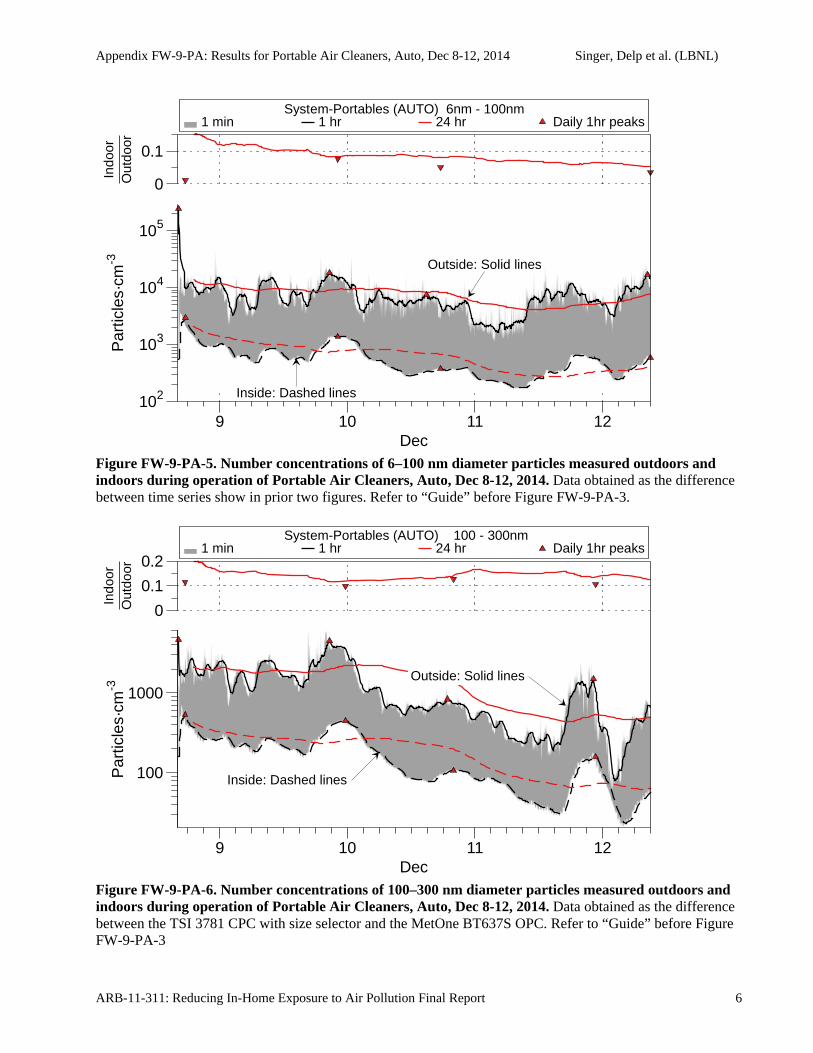
Appendix FW-9-PA: Results for Portable Air Cleaners, Auto, Dec 8-12, 2014 Singer, Delp et al. (LBNL)
ARB-11-311: Reducing In-Home Exposure to Air Pollution Final Report 6
Figure FW-9-PA-5. Number concentrations of 6–100 nm diameter particles measured outdoors and indoors during operation of Portable Air Cleaners, Auto, Dec 8-12, 2014. Data obtained as the difference between time series show in prior two figures. Refer to “Guide” before Figure FW-9-PA-3.
Figure FW-9-PA-6. Number concentrations of 100–300 nm diameter particles measured outdoors and indoors during operation of Portable Air Cleaners, Auto, Dec 8-12, 2014. Data obtained as the difference between the TSI 3781 CPC with size selector and the MetOne BT637S OPC. Refer to “Guide” before Figure FW-9-PA-3
1 min 1 hr 24 hr Daily 1hr peaks System-Portables (AUTO) 6nm - 100nm
Outside: Solid lines
Inside: Dashed lines
Par
ticle
s·cm
-3
102
103
104
105
Indo
orO
utdo
or
0
0.1
9 10 11 12Dec
1 min 1 hr 24 hr Daily 1hr peaks System-Portables (AUTO) 100 - 300nm
Outside: Solid lines
Inside: Dashed lines100
1000
Par
ticle
s·cm
-3In
door
Out
door
0
0.1
0.2
9 10 11 12Dec
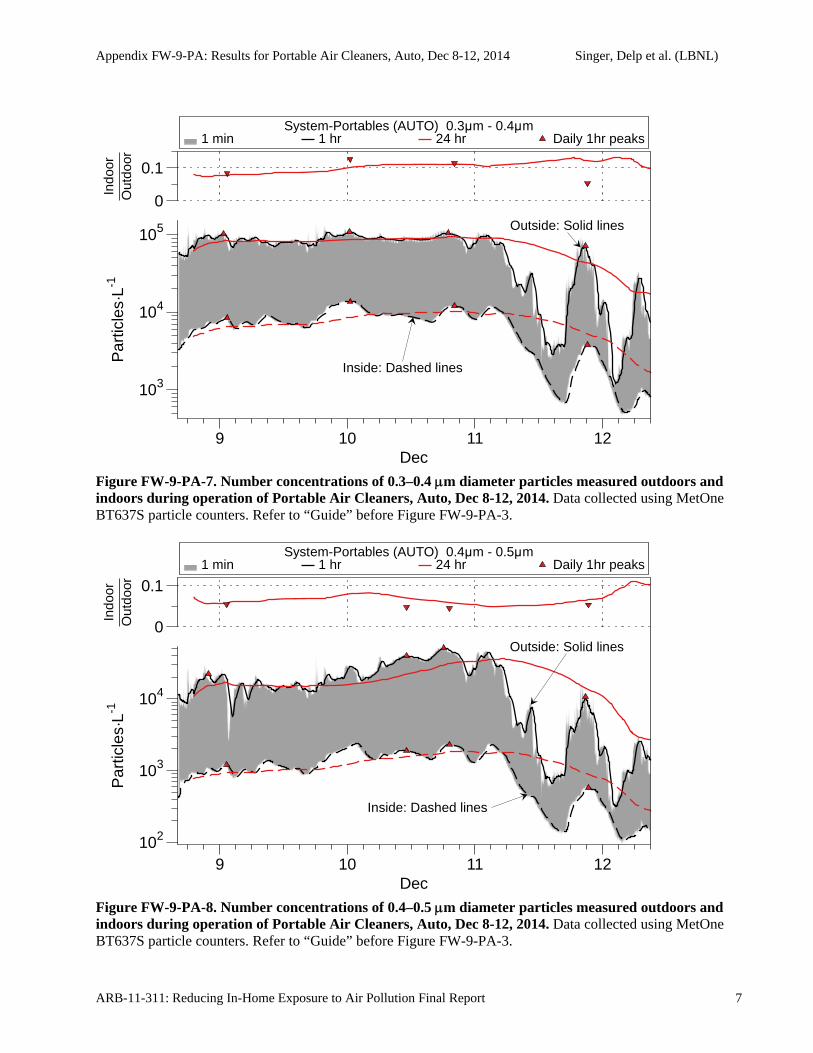
Appendix FW-9-PA: Results for Portable Air Cleaners, Auto, Dec 8-12, 2014 Singer, Delp et al. (LBNL)
ARB-11-311: Reducing In-Home Exposure to Air Pollution Final Report 7
Figure FW-9-PA-7. Number concentrations of 0.3–0.4 m diameter particles measured outdoors and indoors during operation of Portable Air Cleaners, Auto, Dec 8-12, 2014. Data collected using MetOne BT637S particle counters. Refer to “Guide” before Figure FW-9-PA-3.
Figure FW-9-PA-8. Number concentrations of 0.4–0.5 m diameter particles measured outdoors and indoors during operation of Portable Air Cleaners, Auto, Dec 8-12, 2014. Data collected using MetOne BT637S particle counters. Refer to “Guide” before Figure FW-9-PA-3.
1 min 1 hr 24 hr Daily 1hr peaks System-Portables (AUTO) 0.3μm - 0.4μm
Outside: Solid lines
Inside: Dashed lines
Par
ticle
s·L-1
103
104
105
Indo
orO
utdo
or
0
0.1
9 10 11 12Dec
1 min 1 hr 24 hr Daily 1hr peaks System-Portables (AUTO) 0.4μm - 0.5μm
Outside: Solid lines
Inside: Dashed lines
Par
ticle
s·L-1
102
103
104
Indo
orO
utdo
or
0
0.1
9 10 11 12Dec
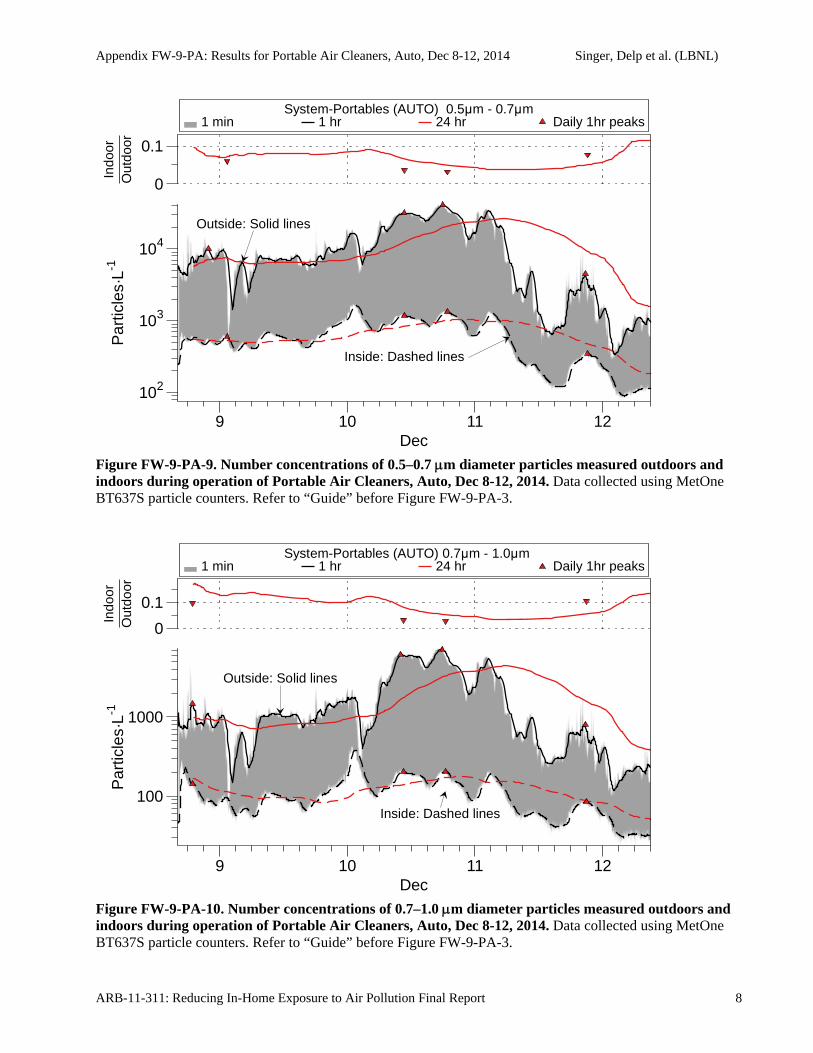
Appendix FW-9-PA: Results for Portable Air Cleaners, Auto, Dec 8-12, 2014 Singer, Delp et al. (LBNL)
ARB-11-311: Reducing In-Home Exposure to Air Pollution Final Report 8
Figure FW-9-PA-9. Number concentrations of 0.5–0.7 m diameter particles measured outdoors and indoors during operation of Portable Air Cleaners, Auto, Dec 8-12, 2014. Data collected using MetOne BT637S particle counters. Refer to “Guide” before Figure FW-9-PA-3.
Figure FW-9-PA-10. Number concentrations of 0.7–1.0 m diameter particles measured outdoors and indoors during operation of Portable Air Cleaners, Auto, Dec 8-12, 2014. Data collected using MetOne BT637S particle counters. Refer to “Guide” before Figure FW-9-PA-3.
1 min 1 hr 24 hr Daily 1hr peaks System-Portables (AUTO) 0.5μm - 0.7μm
Outside: Solid lines
Inside: Dashed lines
Par
ticle
s·L-1
102
103
104
Indo
orO
utdo
or
0
0.1
9 10 11 12Dec
1 min 1 hr 24 hr Daily 1hr peaks System-Portables (AUTO) 0.7μm - 1.0μm
Outside: Solid lines
Inside: Dashed lines
Par
ticle
s·L-1
100
1000
Indo
orO
utdo
or
0
0.1
9 10 11 12Dec
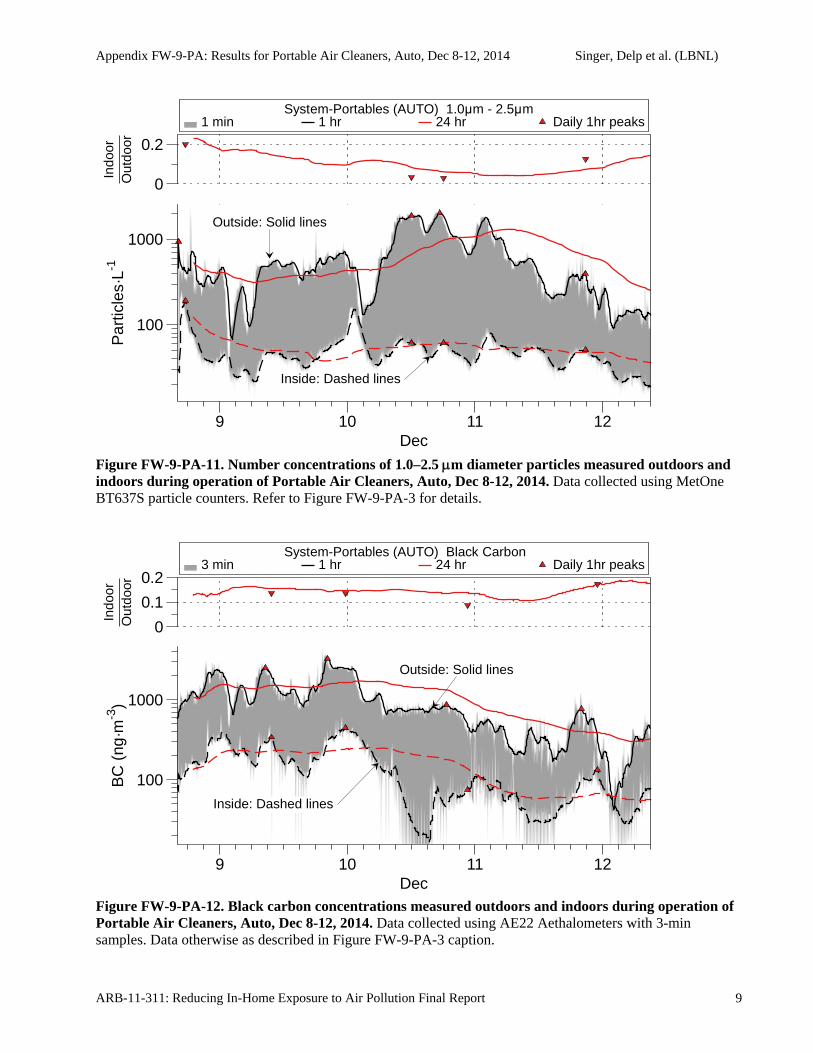
Appendix FW-9-PA: Results for Portable Air Cleaners, Auto, Dec 8-12, 2014 Singer, Delp et al. (LBNL)
ARB-11-311: Reducing In-Home Exposure to Air Pollution Final Report 9
Figure FW-9-PA-11. Number concentrations of 1.0–2.5 m diameter particles measured outdoors and indoors during operation of Portable Air Cleaners, Auto, Dec 8-12, 2014. Data collected using MetOne BT637S particle counters. Refer to Figure FW-9-PA-3 for details.
Figure FW-9-PA-12. Black carbon concentrations measured outdoors and indoors during operation of Portable Air Cleaners, Auto, Dec 8-12, 2014. Data collected using AE22 Aethalometers with 3-min samples. Data otherwise as described in Figure FW-9-PA-3 caption.
1 min 1 hr 24 hr Daily 1hr peaks System-Portables (AUTO) 1.0μm - 2.5μm
Outside: Solid lines
Inside: Dashed lines
Par
ticle
s·L-1
100
1000
Indo
orO
utdo
or
0
0.2
9 10 11 12Dec
3 min 1 hr 24 hr Daily 1hr peaks System-Portables (AUTO) Black Carbon
Outside: Solid lines
Inside: Dashed lines
BC
(ng
·m-3
)
100
1000
Indo
orO
utdo
or
0
0.1
0.2
9 10 11 12Dec
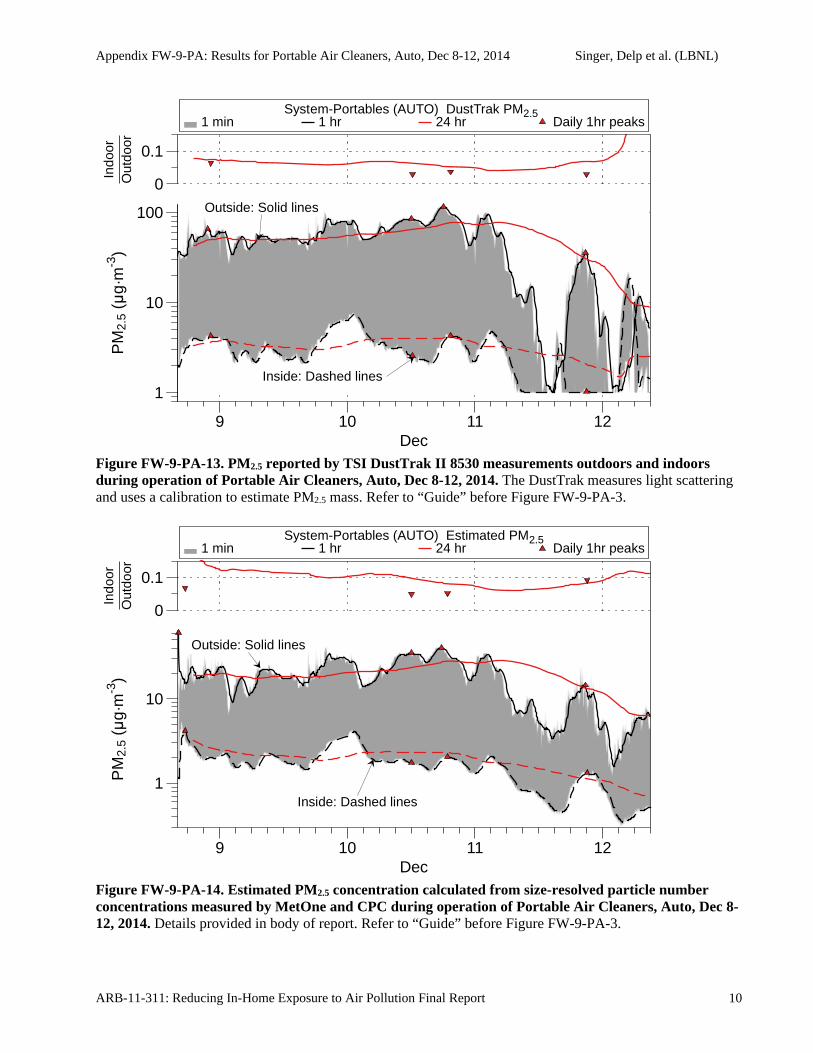
Appendix FW-9-PA: Results for Portable Air Cleaners, Auto, Dec 8-12, 2014 Singer, Delp et al. (LBNL)
ARB-11-311: Reducing In-Home Exposure to Air Pollution Final Report 10
Figure FW-9-PA-13. PM2.5 reported by TSI DustTrak II 8530 measurements outdoors and indoors during operation of Portable Air Cleaners, Auto, Dec 8-12, 2014. The DustTrak measures light scattering and uses a calibration to estimate PM2.5 mass. Refer to “Guide” before Figure FW-9-PA-3.
Figure FW-9-PA-14. Estimated PM2.5 concentration calculated from size-resolved particle number concentrations measured by MetOne and CPC during operation of Portable Air Cleaners, Auto, Dec 8-12, 2014. Details provided in body of report. Refer to “Guide” before Figure FW-9-PA-3.
1 min 1 hr 24 hr Daily 1hr peaks System-Portables (AUTO) DustTrak PM2.5
1
10
100 Outside: Solid lines
Inside: Dashed lines
PM
2.5
(μg·
m-3
)In
door
Out
door
0
0.1
9 10 11 12Dec
1 min 1 hr 24 hr Daily 1hr peaks System-Portables (AUTO) Estimated PM2.5
Outside: Solid lines
Inside: Dashed lines
PM
2.5
(μg·
m-3
)
1
10
Indo
orO
utdo
or
0
0.1
9 10 11 12Dec
Appendix FW-9-PA: Results for Portable Air Cleaners, Auto, Dec 8-12, 2014 Singer, Delp et al. (LBNL)
ARB-11-311: Reducing In-Home Exposure to Air Pollution Final Report 11
Table FW-9-PA-2. Daily1 summary statistics for number concentration (particles cm-3) and indoor /outdoor ratios for particles with aerodynamic diameters 6 nm to 2.5 micron measured using the TSI 3787 CPC.
Parameter Day 11 Day 21 Day 3 Day 4 Mean1 SD1
Outdoor 24h mean 1.1E+4 1.0E+4 4.8E+3 8.7E+3 8.8E+3 2.5E+3
Outdoor 24 SD 1.2E+4 5.6E+3 2.5E+3 3.8E+3 6.0E+3 3.8E+3
Indoor 24h mean 1.2E+3 9.7E+2 3.6E+2 5.1E+2 7.7E+2 3.5E+2
Indoor 24 SD 6.3E+2 4.8E+2 9.2E+1 1.7E+2 3.4E+2 2.2E+2
24h mean In/Out 0.13 0.10 0.09 0.07 0.09 0.02
Highest 8h Outdoor 2.5E+5 1.6E+4 7.0E+3 9.7E+3 7.0E+4 1.0E+5
Highest 8h Indoor 3.1E+3 1.6E+3 5.1E+2 4.2E+2 1.4E+3 1.1E+3
Highest 8 h In/Out 0.01 0.10 0.07 0.04 0.06 0.03
Highest 1h Outdoor 2.5E+5 2.3E+4 8.1E+3 1.8E+4 7.4E+4 1.0E+5
Highest 1 h Indoor2 3.1E+3 1.6E+3 5.1E+2 4.2E+2 1.6E+3 1.2E+3
Highest 1h In/Out 0.01 0.08 0.06 0.04 0.05 0.02
Time of highest 1h Outdoor
12/8/14 16:18
12/9/14 20:40
12/10/14 14:57
12/12/14 8:30
Corresponding highest 1h Indoor
12/8/14 17:29
12/9/14 23:29
12/10/14 17:45
12/12/14 8:59
1 Based on 24h periods starting / ending at 1pm. Day 1 starts at 12/8/2014 19:00, and has < 24h of data. 2Occurring within 4h of highest 1h outdoor concentration. Table FW-9-PA-3. Daily1 summary statistics for number concentration (particles cm-3) and indoor /outdoor ratios for particles with aerodynamic diameters 100 nm to 2.5 micron measured using the TSI 3781 CPC with size selector.
Parameter Day 11 Day 21 Day 3 Day 4 Mean1 SD1
Outdoor 24h mean 2.0E+3 1.9E+3 6.1E+2 5.7E+2 1.3E+3 6.8E+2
Outdoor 24 SD 5.8E+2 1.2E+3 2.6E+2 4.7E+2 6.3E+2 3.6E+2
Indoor 24h mean 2.7E+2 2.5E+2 8.6E+1 6.9E+1 1.7E+2 9.3E+1
Indoor 24 SD 8.0E+1 1.2E+2 2.6E+1 4.6E+1 6.7E+1 3.5E+1
24h mean In/Out 0.16 0.12 0.14 0.14 0.14 0.01
Highest 8h Outdoor 4.7E+3 3.4E+3 8.9E+2 9.5E+2 2.5E+3 1.6E+3
Highest 8h Indoor 4.9E+2 4.0E+2 1.1E+2 1.2E+2 2.8E+2 1.7E+2
Highest 8 h In/Out 0.10 0.12 0.12 0.12 0.12 0.01
Highest 1h Outdoor 4.7E+3 4.6E+3 1.0E+3 1.5E+3 3.0E+3 1.7E+3
Highest 1 h Indoor2 4.9E+2 4.0E+2 1.1E+2 1.2E+2 3.2E+2 1.8E+2
Highest 1h In/Out 0.11 0.10 0.12 0.11 0.11 0.01
Time of highest 1h Outdoor
12/8/14 16:17
12/9/14 20:40
12/10/14 18:46
12/11/14 22:19
Corresponding highest 1h Indoor
12/8/14 17:28
12/9/14 23:38
12/10/14 20:00
12/11/14 22:44
1 Based on 24h periods starting / ending at 1pm. Day 1 starts at 12/8/2014 19:00, and has < 24h of data. 2Occurring within 4h of highest 1h outdoor concentration.

Appendix FW-9-PA: Results for Portable Air Cleaners, Auto, Dec 8-12, 2014 Singer, Delp et al. (LBNL)
ARB-11-311: Reducing In-Home Exposure to Air Pollution Final Report 12
Table FW-9-PA-4. Daily1 summary statistics for number concentration (particles cm-3) and indoor /outdoor ratios for particles with aerodynamic diameters 6–100 nm based on difference between concentrations measured using the TSI 3787 CPC and the TSI 3781 CPC with size selector.
Parameter Day 11 Day 21 Day 3 Day 4 Mean1 SD1
Outdoor 24h mean 9.2E+3 8.5E+3 4.2E+3 8.1E+3 7.5E+3 2.0E+3
Outdoor 24 SD 1.2E+4 4.5E+3 2.4E+3 3.7E+3 5.7E+3 3.8E+3
Indoor 24h mean 9.5E+2 7.2E+2 2.8E+2 4.4E+2 6.0E+2 2.6E+2
Indoor 24 SD 5.5E+2 3.6E+2 7.2E+1 1.3E+2 2.8E+2 1.9E+2
24h mean In/Out 0.12 0.09 0.08 0.06 0.09 0.02
Highest 8h Outdoor 2.4E+5 1.3E+4 6.2E+3 9.4E+3 6.8E+4 1.0E+5
Highest 8h Indoor 2.6E+3 1.2E+3 3.8E+2 3.8E+2 1.1E+3 9.0E+2
Highest 8 h In/Out 0.01 0.09 0.06 0.04 0.05 0.03
Highest 1h Outdoor 2.4E+5 1.8E+4 7.4E+3 1.7E+4 7.1E+4 9.9E+4
Highest 1 h Indoor2 2.6E+3 1.2E+3 3.8E+2 3.8E+2 1.3E+3 1.0E+3
Highest 1h In/Out 0.01 0.08 0.05 0.03 0.04 0.02
Time of highest 1h Outdoor
12/8/14 16:18
12/9/14 20:40
12/10/14 14:57
12/12/14 8:29
Corresponding highest 1h Indoor
12/8/14 17:30
12/9/14 22:14
12/10/14 17:34
12/12/14 8:59
1 Based on 24h periods starting / ending at 1pm. Day 1 starts at 12/8/2014 19:00, and has < 24h of data. 2Occurring within 4h of highest 1h outdoor concentration. Table FW-9-PA-5. Daily1 summary statistics for number concentration (particles cm-3) and indoor /outdoor ratios for particles with aerodynamic diameters 100–300 nm based on difference between concentrations measured using the TSI 3781 CPC with size selector and the MetOne BT637S OPC.
Parameter Day 11 Day 21 Day 3 Day 4 Mean1 SD1
Outdoor 24h mean 1.9E+6 1.8E+6 5.0E+5 5.5E+5 1.2E+6 6.6E+5
Outdoor 24 SD 5.7E+5 1.2E+6 2.0E+5 4.5E+5 6.1E+5 3.8E+5
Indoor 24h mean 2.7E+5 2.4E+5 7.5E+4 6.7E+4 1.6E+5 9.0E+4
Indoor 24 SD 8.1E+4 1.2E+5 2.2E+4 4.4E+4 6.6E+4 3.6E+4
24h mean In/Out 0.17 0.13 0.15 0.14 0.15 0.01
Highest 8h Outdoor 4.6E+6 3.3E+6 7.2E+5 9.1E+5 2.4E+6 1.6E+6
Highest 8h Indoor 4.8E+5 3.8E+5 1.2E+5 1.1E+5 2.7E+5 1.6E+5
Highest 8 h In/Out 0.10 0.12 0.17 0.12 0.13 0.02
Highest 1h Outdoor 4.6E+6 4.5E+6 8.3E+5 1.5E+6 2.9E+6 1.7E+6
Highest 1 h Indoor2 4.8E+5 3.8E+5 1.2E+5 1.1E+5 3.1E+5 1.8E+5
Highest 1h In/Out 0.11 0.10 0.13 0.11 0.11 0.01
Time of highest 1h Outdoor
12/8/14 16:17
12/9/14 20:40
12/10/14 18:48
12/11/14 22:19
Corresponding highest 1h Indoor
12/8/14 17:28
12/9/14 23:38
12/10/14 20:00
12/11/14 22:44
1 Based on 24h periods starting / ending at 1pm. Day 1 starts at 12/8/2014 19:00, and has < 24h of data. 2Occurring within 4h of highest 1h outdoor concentration.
Appendix FW-9-PA: Results for Portable Air Cleaners, Auto, Dec 8-12, 2014 Singer, Delp et al. (LBNL)
ARB-11-311: Reducing In-Home Exposure to Air Pollution Final Report 13
Table FW-9-PA-6. Daily1 summary statistics for number concentration (particles L-1) and indoor /outdoor ratios for particles with aerodynamic diameters 0.3–0.4 microns measured with the MetOne BT637S OPC.
Parameter Day 11 Day 21 Day 3 Day 4 Mean1 SD1
Outdoor 24h mean 8.1E+4 8.9E+4 6.7E+4 1.7E+4 6.4E+4 2.8E+4
Outdoor 24 SD 1.3E+4 1.1E+4 3.3E+4 2.0E+4 1.9E+4 8.5E+3
Indoor 24h mean 7.0E+3 9.8E+3 8.0E+3 1.5E+3 6.6E+3 3.1E+3
Indoor 24 SD 1.2E+3 2.2E+3 3.2E+3 1.0E+3 1.9E+3 8.5E+2
24h mean In/Out 0.08 0.10 0.11 0.12 0.10 0.02
Highest 8h Outdoor 8.9E+4 9.9E+4 9.5E+4 3.3E+4 7.9E+4 2.7E+4
Highest 8h Indoor 7.3E+3 1.2E+4 1.0E+4 2.6E+3 8.1E+3 3.7E+3
Highest 8 h In/Out 0.08 0.13 0.11 0.08 0.10 0.02
Highest 1h Outdoor 1.0E+5 1.1E+5 1.0E+5 7.1E+4 9.6E+4 1.5E+4
Highest 1 h Indoor2 7.3E+3 1.2E+4 1.0E+4 2.6E+3 9.5E+3 3.8E+3
Highest 1h In/Out 0.08 0.13 0.12 0.05 0.09 0.03
Time of highest 1h Outdoor
12/9/14 0:42
12/10/14 0:26
12/10/14 18:56
12/11/14 20:45
Corresponding highest 1h Indoor
12/9/14 1:22
12/10/14 0:30
12/10/14 20:06
12/11/14 21:10
1 Based on 24h periods starting / ending at 1pm. Day 1 starts at 12/8/2014 19:00, and has < 24h of data. 2Occurring within 4h of highest 1h outdoor concentration. Table FW-9-PA-7. Daily1 summary statistics for number concentration (particles L-1) and indoor /outdoor ratios for particles with aerodynamic diameters 0.4–0.5 microns measured with the MetOne BT637S OPC.
Parameter Day 11 Day 21 Day 3 Day 4 Mean1 SD1
Outdoor 24h mean 1.5E+4 2.4E+4 2.7E+4 2.5E+3 1.7E+4 9.4E+3
Outdoor 24 SD 4.4E+3 8.7E+3 1.6E+4 2.8E+3 8.1E+3 5.3E+3
Indoor 24h mean 1.0E+3 1.6E+3 1.4E+3 2.5E+2 1.1E+3 5.2E+2
Indoor 24 SD 1.8E+2 4.0E+2 6.5E+2 1.5E+2 3.5E+2 2.0E+2
24h mean In/Out 0.06 0.07 0.06 0.08 0.07 0.01
Highest 8h Outdoor 1.8E+4 3.4E+4 4.2E+4 6.0E+3 2.5E+4 1.4E+4
Highest 8h Indoor 1.0E+3 1.8E+3 1.9E+3 6.6E+2 1.3E+3 5.2E+2
Highest 8 h In/Out 0.06 0.05 0.05 0.11 0.07 0.03
Highest 1h Outdoor 2.2E+4 3.9E+4 5.1E+4 1.1E+4 3.1E+4 1.5E+4
Highest 1 h Indoor2 1.0E+3 1.8E+3 1.9E+3 6.6E+2 1.5E+3 6.7E+2
Highest 1h In/Out 0.05 0.05 0.05 0.05 0.05 0.00
Time of highest 1h Outdoor
12/8/14 21:51
12/10/14 11:10
12/10/14 18:10
12/11/14 20:46
Corresponding highest 1h Indoor
12/9/14 1:21
12/10/14 11:10
12/10/14 19:10
12/11/14 21:18
1 Based on 24h periods starting / ending at 1pm. Day 1 starts at 12/8/2014 19:00, and has < 24h of data. 2Occurring within 4h of highest 1h outdoor concentration.
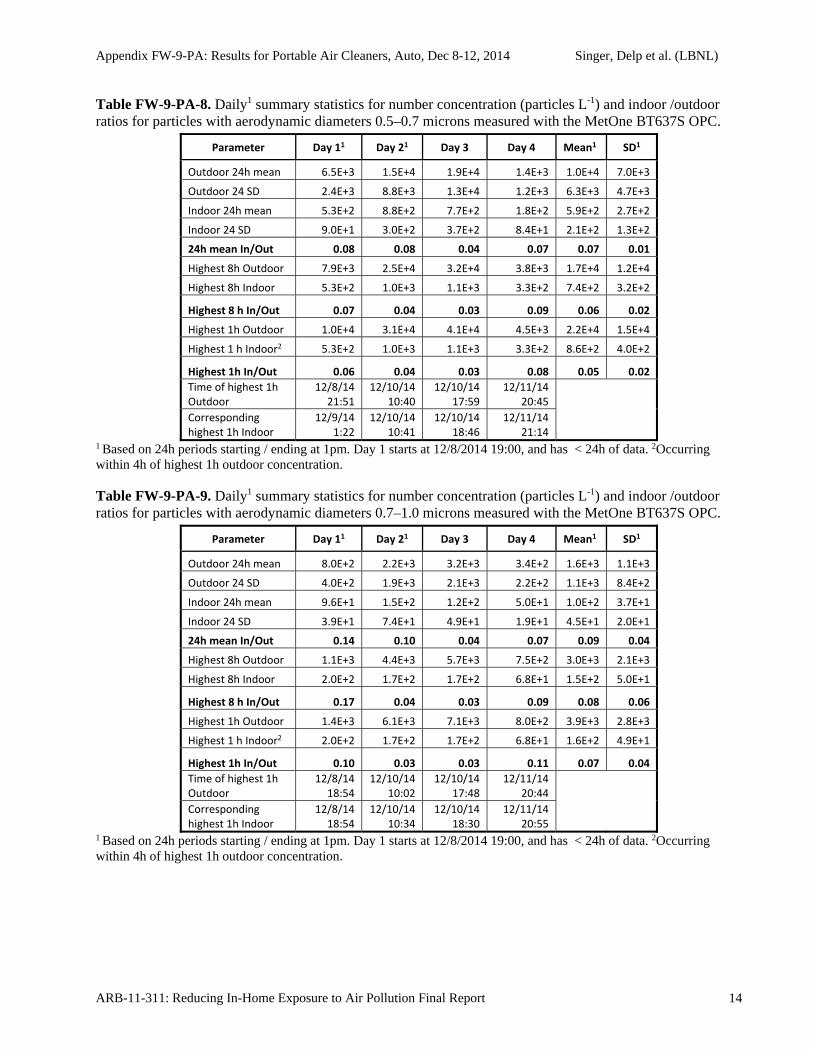
Appendix FW-9-PA: Results for Portable Air Cleaners, Auto, Dec 8-12, 2014 Singer, Delp et al. (LBNL)
ARB-11-311: Reducing In-Home Exposure to Air Pollution Final Report 14
Table FW-9-PA-8. Daily1 summary statistics for number concentration (particles L-1) and indoor /outdoor ratios for particles with aerodynamic diameters 0.5–0.7 microns measured with the MetOne BT637S OPC.
Parameter Day 11 Day 21 Day 3 Day 4 Mean1 SD1
Outdoor 24h mean 6.5E+3 1.5E+4 1.9E+4 1.4E+3 1.0E+4 7.0E+3
Outdoor 24 SD 2.4E+3 8.8E+3 1.3E+4 1.2E+3 6.3E+3 4.7E+3
Indoor 24h mean 5.3E+2 8.8E+2 7.7E+2 1.8E+2 5.9E+2 2.7E+2
Indoor 24 SD 9.0E+1 3.0E+2 3.7E+2 8.4E+1 2.1E+2 1.3E+2
24h mean In/Out 0.08 0.08 0.04 0.07 0.07 0.01
Highest 8h Outdoor 7.9E+3 2.5E+4 3.2E+4 3.8E+3 1.7E+4 1.2E+4
Highest 8h Indoor 5.3E+2 1.0E+3 1.1E+3 3.3E+2 7.4E+2 3.2E+2
Highest 8 h In/Out 0.07 0.04 0.03 0.09 0.06 0.02
Highest 1h Outdoor 1.0E+4 3.1E+4 4.1E+4 4.5E+3 2.2E+4 1.5E+4
Highest 1 h Indoor2 5.3E+2 1.0E+3 1.1E+3 3.3E+2 8.6E+2 4.0E+2
Highest 1h In/Out 0.06 0.04 0.03 0.08 0.05 0.02
Time of highest 1h Outdoor
12/8/14 21:51
12/10/14 10:40
12/10/14 17:59
12/11/14 20:45
Corresponding highest 1h Indoor
12/9/14 1:22
12/10/14 10:41
12/10/14 18:46
12/11/14 21:14
1 Based on 24h periods starting / ending at 1pm. Day 1 starts at 12/8/2014 19:00, and has < 24h of data. 2Occurring within 4h of highest 1h outdoor concentration. Table FW-9-PA-9. Daily1 summary statistics for number concentration (particles L-1) and indoor /outdoor ratios for particles with aerodynamic diameters 0.7–1.0 microns measured with the MetOne BT637S OPC.
Parameter Day 11 Day 21 Day 3 Day 4 Mean1 SD1
Outdoor 24h mean 8.0E+2 2.2E+3 3.2E+3 3.4E+2 1.6E+3 1.1E+3
Outdoor 24 SD 4.0E+2 1.9E+3 2.1E+3 2.2E+2 1.1E+3 8.4E+2
Indoor 24h mean 9.6E+1 1.5E+2 1.2E+2 5.0E+1 1.0E+2 3.7E+1
Indoor 24 SD 3.9E+1 7.4E+1 4.9E+1 1.9E+1 4.5E+1 2.0E+1
24h mean In/Out 0.14 0.10 0.04 0.07 0.09 0.04
Highest 8h Outdoor 1.1E+3 4.4E+3 5.7E+3 7.5E+2 3.0E+3 2.1E+3
Highest 8h Indoor 2.0E+2 1.7E+2 1.7E+2 6.8E+1 1.5E+2 5.0E+1
Highest 8 h In/Out 0.17 0.04 0.03 0.09 0.08 0.06
Highest 1h Outdoor 1.4E+3 6.1E+3 7.1E+3 8.0E+2 3.9E+3 2.8E+3
Highest 1 h Indoor2 2.0E+2 1.7E+2 1.7E+2 6.8E+1 1.6E+2 4.9E+1
Highest 1h In/Out 0.10 0.03 0.03 0.11 0.07 0.04
Time of highest 1h Outdoor
12/8/14 18:54
12/10/14 10:02
12/10/14 17:48
12/11/14 20:44
Corresponding highest 1h Indoor
12/8/14 18:54
12/10/14 10:34
12/10/14 18:30
12/11/14 20:55
1 Based on 24h periods starting / ending at 1pm. Day 1 starts at 12/8/2014 19:00, and has < 24h of data. 2Occurring within 4h of highest 1h outdoor concentration.
Appendix FW-9-PA: Results for Portable Air Cleaners, Auto, Dec 8-12, 2014 Singer, Delp et al. (LBNL)
ARB-11-311: Reducing In-Home Exposure to Air Pollution Final Report 15
Table FW-9-PA-10. Daily1 summary statistics for number concentration (particles L-1) and indoor /outdoor ratios for particles with aerodynamic diameters 1.0–2.5 microns measured with the MetOne BT637S OPC.
Parameter Day 11 Day 21 Day 3 Day 4 Mean1 SD1
Outdoor 24h mean 3.7E+2 7.2E+2 1.0E+3 2.1E+2 5.8E+2 3.2E+2
Outdoor 24 SD 2.1E+2 5.3E+2 5.0E+2 1.1E+2 3.4E+2 1.8E+2
Indoor 24h mean 4.9E+1 5.8E+1 5.1E+1 3.3E+1 4.8E+1 9.1E+0
Indoor 24 SD 3.7E+1 2.7E+1 1.1E+1 1.0E+1 2.1E+1 1.1E+1
24h mean In/Out 0.19 0.11 0.05 0.09 0.11 0.05
Highest 8h Outdoor 9.4E+2 1.3E+3 1.7E+3 5.1E+2 1.1E+3 4.4E+2
Highest 8h Indoor 1.6E+2 5.7E+1 5.6E+1 5.0E+1 8.1E+1 4.7E+1
Highest 8 h In/Out 0.17 0.05 0.03 0.10 0.09 0.05
Highest 1h Outdoor 9.4E+2 1.9E+3 2.0E+3 4.0E+2 1.3E+3 6.7E+2
Highest 1 h Indoor2 1.6E+2 5.7E+1 5.6E+1 5.0E+1 9.1E+1 5.7E+1
Highest 1h In/Out 0.20 0.03 0.03 0.13 0.10 0.07
Time of highest 1h Outdoor
12/8/14 16:19
12/10/14 12:02
12/10/14 17:25
12/11/14 20:43
Corresponding highest 1h Indoor
12/8/14 17:30
12/10/14 12:02
12/10/14 18:08
12/11/14 20:51
1 Based on 24h periods starting / ending at 1pm. Day 1 starts at 12/8/2014 19:00, and has < 24h of data. 2Occurring within 4h of highest 1h outdoor concentration. Table FW-9-PA-11. Summary statistics for estimated PM2.5 concentrations (g m-3) calculated from particle number concentrations resolved by size from 6 nm to 2.5 microns (as reported in Tables FW-9-PA-2 to FW-9-PA-9) and resulting indoor/outdoor ratios.
Parameter Day 11 Day 21 Day 3 Day 4 Mean1 SD1
Outdoor 24h mean 1.8E+1 2.4E+1 2.2E+1 6.2E+0 1.8E+1 6.9E+0
Outdoor 24 SD 5.1E+0 7.3E+0 1.1E+1 3.8E+0 6.8E+0 2.8E+0
Indoor 24h mean 2.1E+0 2.3E+0 1.4E+0 6.9E‐1 1.6E+0 6.3E‐1
Indoor 24 SD 6.0E‐1 7.7E‐1 4.4E‐1 3.3E‐1 5.4E‐1 1.7E‐1
24h mean In/Out 0.13 0.11 0.07 0.09 0.10 0.02
Highest 8h Outdoor 6.1E+1 2.8E+1 3.4E+1 9.2E+0 3.3E+1 1.8E+1
Highest 8h Indoor 3.7E+0 1.8E+0 1.8E+0 1.0E+0 2.1E+0 9.8E‐1
Highest 8 h In/Out 0.06 0.06 0.05 0.11 0.07 0.02
Highest 1h Outdoor 6.1E+1 3.5E+1 4.0E+1 1.4E+1 3.7E+1 1.6E+1
Highest 1 h Indoor2 3.7E+0 1.8E+0 1.8E+0 1.0E+0 2.3E+0 1.1E+0
Highest 1h In/Out 0.07 0.05 0.05 0.09 0.07 0.02
Time of highest 1h Outdoor
12/8/14 16:18
12/10/14 12:02
12/10/14 17:43
12/11/14 20:44
Corresponding highest 1h Indoor
12/8/14 17:29
12/10/14 12:02
12/10/14 18:52
12/11/14 21:05
1 Based on 24h periods starting / ending at 1pm. Day 1 starts at 12/8/2014 19:00, and has < 24h of data. 2Occurring within 4h of highest 1h outdoor concentration.

Appendix FW-9-PA: Results for Portable Air Cleaners, Auto, Dec 8-12, 2014 Singer, Delp et al. (LBNL)
ARB-11-311: Reducing In-Home Exposure to Air Pollution Final Report 16
Table FW-9-PA-12. Summary statistics for concentrations of PM2.5 (g m-3) and indoor /outdoor ratios from measurements reported by TSI DustTrak II.
Parameter Day 11 Day 21 Day 3 Day 4 Mean1 SD1
Outdoor 24h mean 5.0E‐2 6.6E‐2 5.6E‐2 9.2E‐3 4.5E‐2 2.2E‐2
Outdoor 24 SD 9.8E‐3 1.5E‐2 3.5E‐2 1.0E‐2 1.7E‐2 1.1E‐2
Indoor 24h mean 3.2E‐3 4.0E‐3 2.7E‐3 2.8E‐3 3.2E‐3 5.2E‐4
Indoor 24 SD 6.9E‐4 1.6E‐3 1.2E‐3 4.5E‐3 2.0E‐3 1.5E‐3
24h mean In/Out 0.07 0.06 0.05 0.11 0.07 0.02
Highest 8h Outdoor 5.5E‐2 7.4E‐2 9.0E‐2 1.8E‐2 5.9E‐2 2.7E‐2
Highest 8h Indoor 3.9E‐3 3.0E‐3 3.4E‐3 3.3E‐3 3.4E‐3 3.1E‐4
Highest 8 h In/Out 0.07 0.04 0.04 0.19 0.08 0.06
Highest 1h Outdoor 6.5E‐2 8.5E‐2 1.1E‐1 3.6E‐2 7.5E‐2 2.9E‐2
Highest 1 h Indoor2 3.9E‐3 3.0E‐3 3.4E‐3 3.3E‐3 3.0E‐3 1.4E‐3
Highest 1h In/Out 0.06 0.03 0.04 0.03 0.04 0.01
Time of highest 1h Outdoor
12/8/14 21:47
12/10/14 11:59
12/10/14 18:04
12/11/14 20:50
Corresponding highest 1h Indoor
12/8/14 22:20
12/10/14 12:17
12/10/14 19:28
12/11/14 20:58
1 Based on 24h periods starting / ending at 1pm. Day 1 starts at 12/8/2014 19:00, and has < 24h of data. 2Occurring within 4h of highest 1h outdoor concentration. Table FW-9-PA-13. Daily1 summary statistics for concentrations (nanograms m-3) and indoor /outdoor ratios of aerosol black carbon measured using the Aethalometer AE22.
Parameter Day 11 Day 21 Day 3 Day 4 Mean1 SD1
Outdoor 24h mean 1.5E+3 1.4E+3 5.2E+2 3.2E+2 9.4E+2 5.2E+2
Outdoor 24 SD 5.8E+2 7.8E+2 2.2E+2 2.2E+2 4.5E+2 2.4E+2
Indoor 24h mean 2.3E+2 2.1E+2 5.9E+1 6.3E+1 1.4E+2 7.8E+1
Indoor 24 SD 9.2E+1 1.3E+2 4.2E+1 3.5E+1 7.4E+1 3.8E+1
24h mean In/Out 0.15 0.15 0.13 0.16 0.15 0.01
Highest 8h Outdoor 1.7E+3 2.4E+3 8.0E+2 4.7E+2 1.3E+3 7.5E+2
Highest 8h Indoor 2.8E+2 3.6E+2 9.1E+1 8.8E+1 2.1E+2 1.2E+2
Highest 8 h In/Out 0.17 0.15 0.11 0.19 0.16 0.03
Highest 1h Outdoor 2.5E+3 3.3E+3 8.6E+2 7.6E+2 1.9E+3 1.1E+3
Highest 1 h Indoor2 2.8E+2 3.6E+2 9.1E+1 8.8E+1 2.5E+2 1.5E+2
Highest 1h In/Out 0.14 0.14 0.09 0.17 0.13 0.03
Time of highest 1h Outdoor
12/9/14 8:33
12/9/14 20:12
12/10/14 18:39
12/11/14 20:00
Corresponding highest 1h Indoor
12/9/14 9:42
12/9/14 23:42
12/10/14 22:39
12/11/14 23:00
1 Based on 24h periods starting / ending at 1pm. Day 1 starts at 12/8/2014 19:00, and has < 24h of data. 2Occurring within 4h of highest 1h outdoor concentration.
Appendix FW-10-PM: Results for Portable Air Cleaners, Med Speed, Dec 12-15, 2014 Singer, Delp et al. (LBNL)
ARB-11-311: Reducing In-Home Exposure to Air Pollution Final Report 1
Appendix FW-10-PM. Results for Portable Air Cleaners, Medium Speed, December 12-15, 2014.
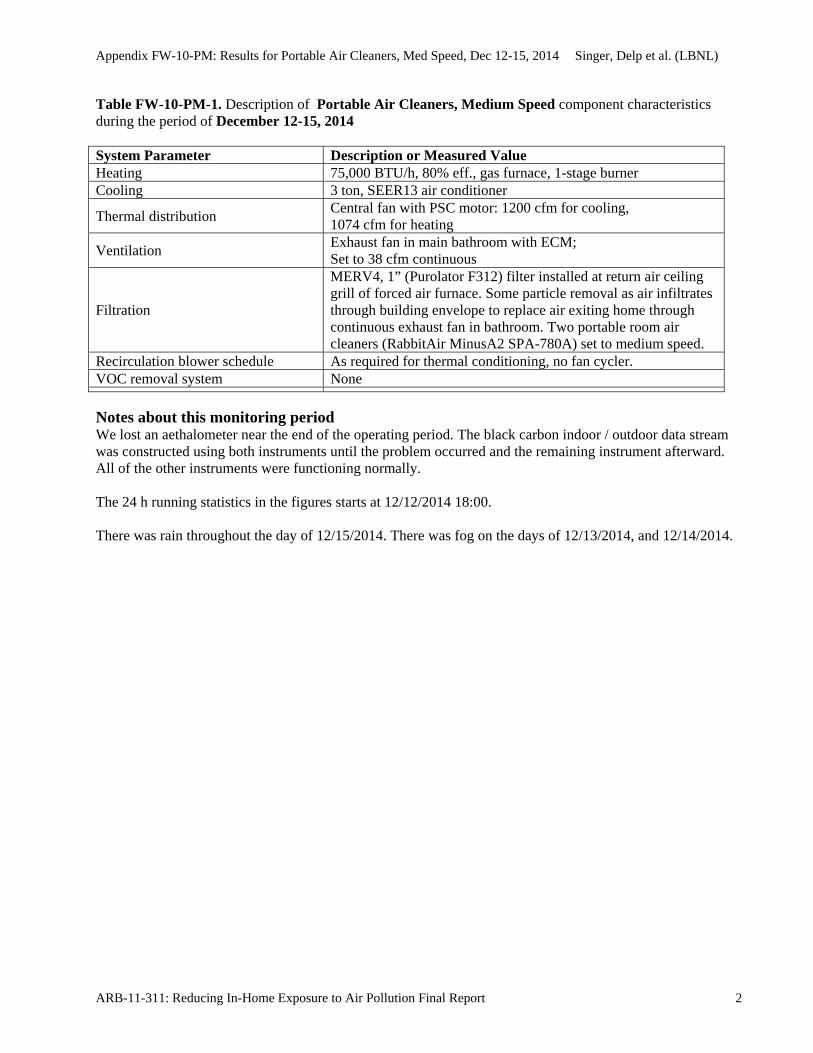
Appendix FW-10-PM: Results for Portable Air Cleaners, Med Speed, Dec 12-15, 2014 Singer, Delp et al. (LBNL)
ARB-11-311: Reducing In-Home Exposure to Air Pollution Final Report 2
Table FW-10-PM-1. Description of Portable Air Cleaners, Medium Speed component characteristics during the period of December 12-15, 2014 System Parameter Description or Measured Value Heating 75,000 BTU/h, 80% eff., gas furnace, 1-stage burner Cooling 3 ton, SEER13 air conditioner
Thermal distribution Central fan with PSC motor: 1200 cfm for cooling, 1074 cfm for heating
Ventilation Exhaust fan in main bathroom with ECM; Set to 38 cfm continuous
Filtration
MERV4, 1” (Purolator F312) filter installed at return air ceiling grill of forced air furnace. Some particle removal as air infiltrates through building envelope to replace air exiting home through continuous exhaust fan in bathroom. Two portable room air cleaners (RabbitAir MinusA2 SPA-780A) set to medium speed.
Recirculation blower schedule As required for thermal conditioning, no fan cycler. VOC removal system None
Notes about this monitoring period We lost an aethalometer near the end of the operating period. The black carbon indoor / outdoor data stream was constructed using both instruments until the problem occurred and the remaining instrument afterward. All of the other instruments were functioning normally. The 24 h running statistics in the figures starts at 12/12/2014 18:00. There was rain throughout the day of 12/15/2014. There was fog on the days of 12/13/2014, and 12/14/2014.
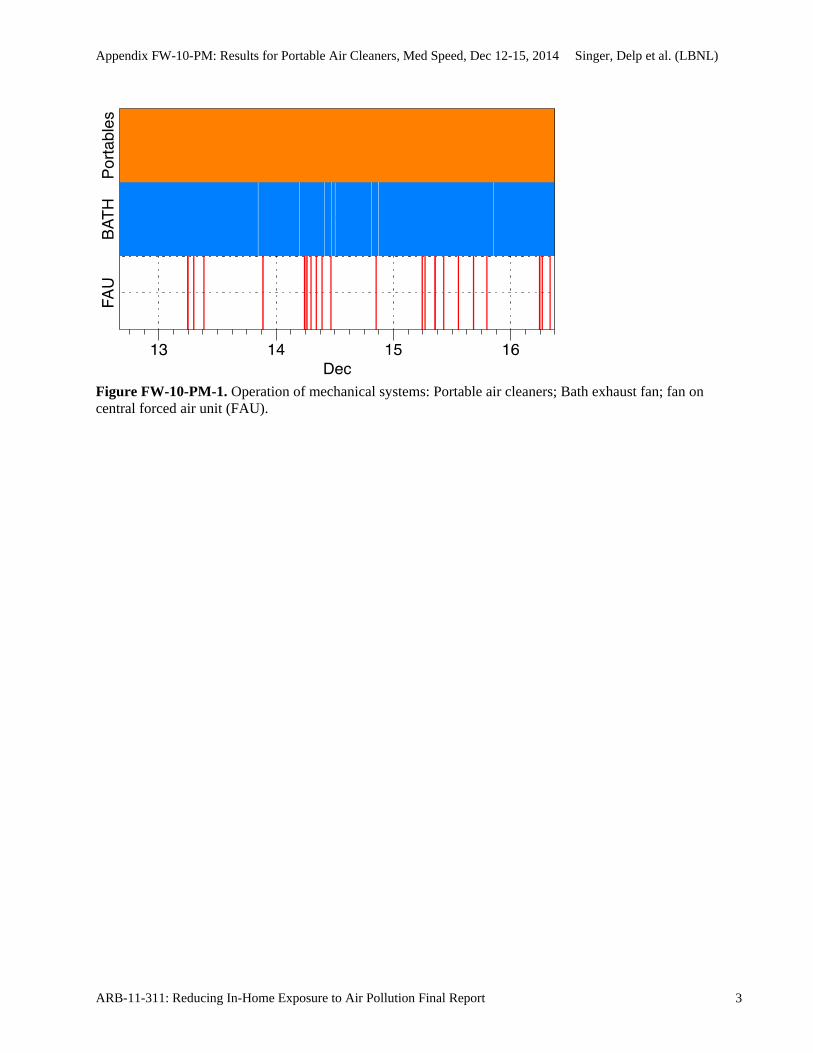
Appendix FW-10-PM: Results for Portable Air Cleaners, Med Speed, Dec 12-15, 2014 Singer, Delp et al. (LBNL)
ARB-11-311: Reducing In-Home Exposure to Air Pollution Final Report 3
Figure FW-10-PM-1. Operation of mechanical systems: Portable air cleaners; Bath exhaust fan; fan on central forced air unit (FAU).
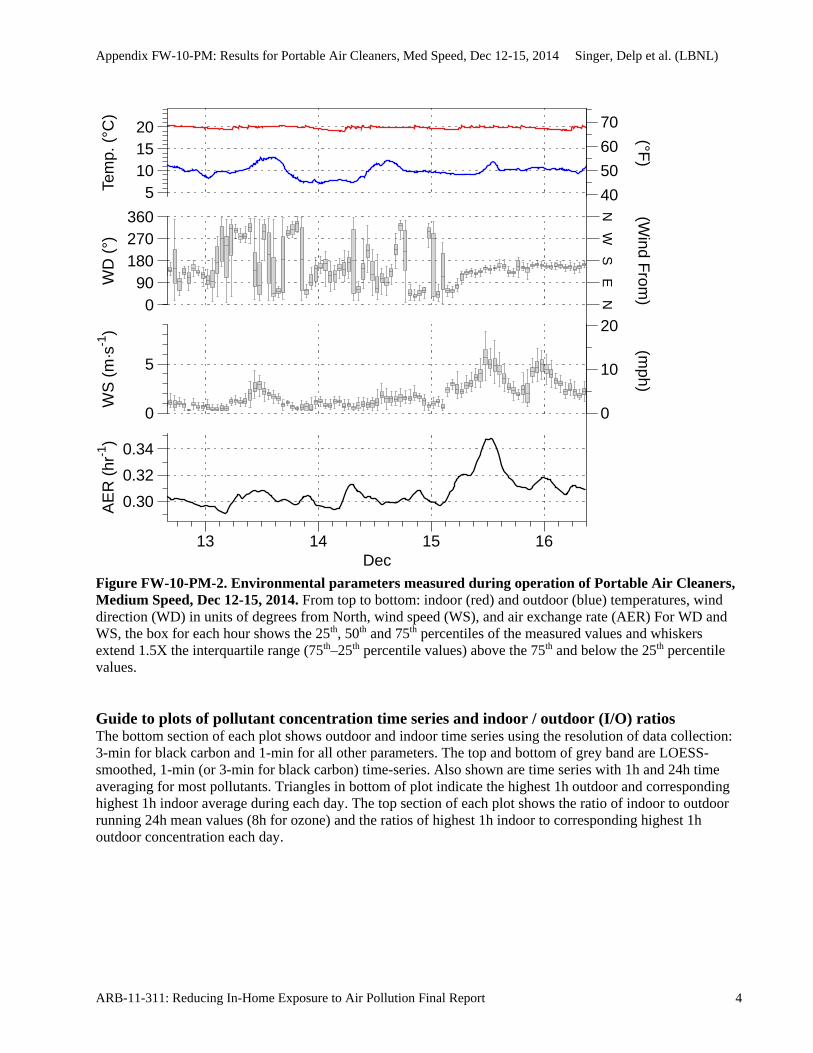
Appendix FW-10-PM: Results for Portable Air Cleaners, Med Speed, Dec 12-15, 2014 Singer, Delp et al. (LBNL)
ARB-11-311: Reducing In-Home Exposure to Air Pollution Final Report 4
Figure FW-10-PM-2. Environmental parameters measured during operation of Portable Air Cleaners, Medium Speed, Dec 12-15, 2014. From top to bottom: indoor (red) and outdoor (blue) temperatures, wind direction (WD) in units of degrees from North, wind speed (WS), and air exchange rate (AER) For WD and WS, the box for each hour shows the 25th, 50th and 75th percentiles of the measured values and whiskers extend 1.5X the interquartile range (75th–25th percentile values) above the 75th and below the 25th percentile values. Guide to plots of pollutant concentration time series and indoor / outdoor (I/O) ratios The bottom section of each plot shows outdoor and indoor time series using the resolution of data collection: 3-min for black carbon and 1-min for all other parameters. The top and bottom of grey band are LOESS-smoothed, 1-min (or 3-min for black carbon) time-series. Also shown are time series with 1h and 24h time averaging for most pollutants. Triangles in bottom of plot indicate the highest 1h outdoor and corresponding highest 1h indoor average during each day. The top section of each plot shows the ratio of indoor to outdoor running 24h mean values (8h for ozone) and the ratios of highest 1h indoor to corresponding highest 1h outdoor concentration each day.
0
10
20
40
50
60
70
NE
SW
N
(mph)
(Wind F
rom)
(°F)
AE
R (
hr-1
)
0.30
0.32
0.34
WS
(m
·s-1
)
0
5
WD
(°)
090
180270360
Tem
p. (
°C)
5101520
13 14 15 16Dec
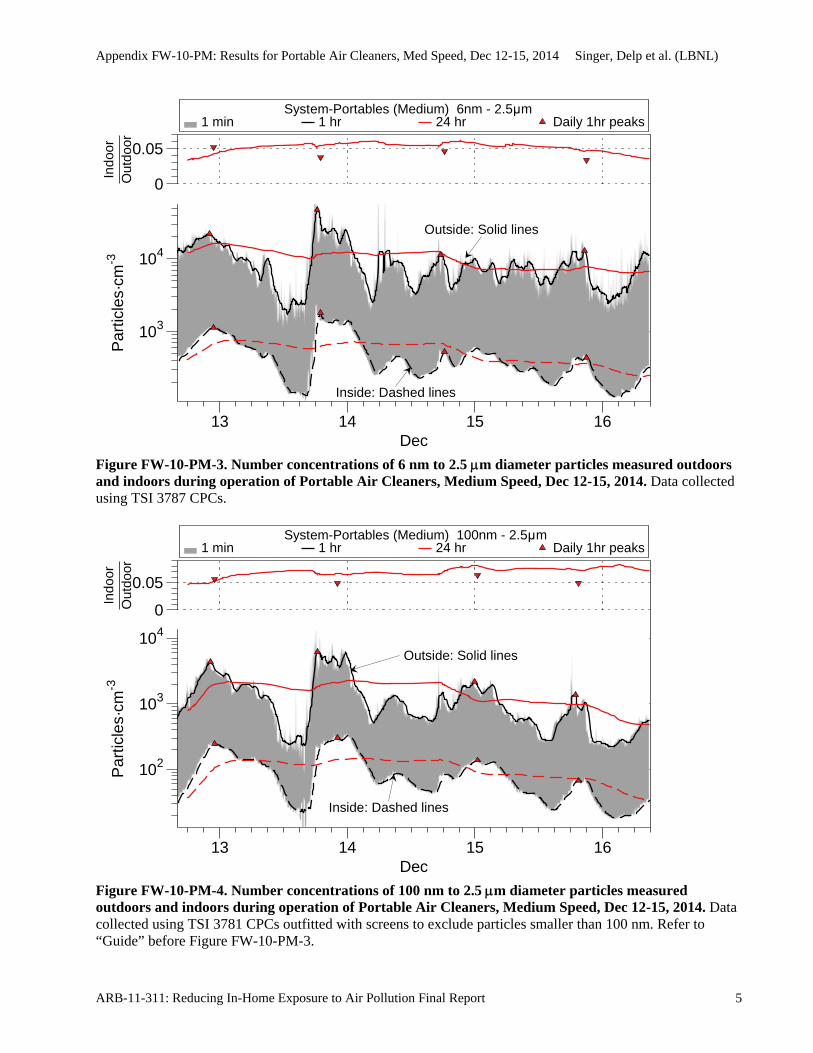
Appendix FW-10-PM: Results for Portable Air Cleaners, Med Speed, Dec 12-15, 2014 Singer, Delp et al. (LBNL)
ARB-11-311: Reducing In-Home Exposure to Air Pollution Final Report 5
Figure FW-10-PM-3. Number concentrations of 6 nm to 2.5 m diameter particles measured outdoors and indoors during operation of Portable Air Cleaners, Medium Speed, Dec 12-15, 2014. Data collected using TSI 3787 CPCs.
Figure FW-10-PM-4. Number concentrations of 100 nm to 2.5 m diameter particles measured outdoors and indoors during operation of Portable Air Cleaners, Medium Speed, Dec 12-15, 2014. Data collected using TSI 3781 CPCs outfitted with screens to exclude particles smaller than 100 nm. Refer to “Guide” before Figure FW-10-PM-3.
1 min 1 hr 24 hr Daily 1hr peaks System-Portables (Medium) 6nm - 2.5μm
Outside: Solid lines
Inside: Dashed lines
Par
ticle
s·cm
-3
103
104
Indo
orO
utdo
or
0
0.05
13 14 15 16Dec
1 min 1 hr 24 hr Daily 1hr peaks System-Portables (Medium) 100nm - 2.5μm
Outside: Solid lines
Inside: Dashed lines
Par
ticle
s·cm
-3
102
103
104
Indo
orO
utdo
or
0
0.05
13 14 15 16Dec
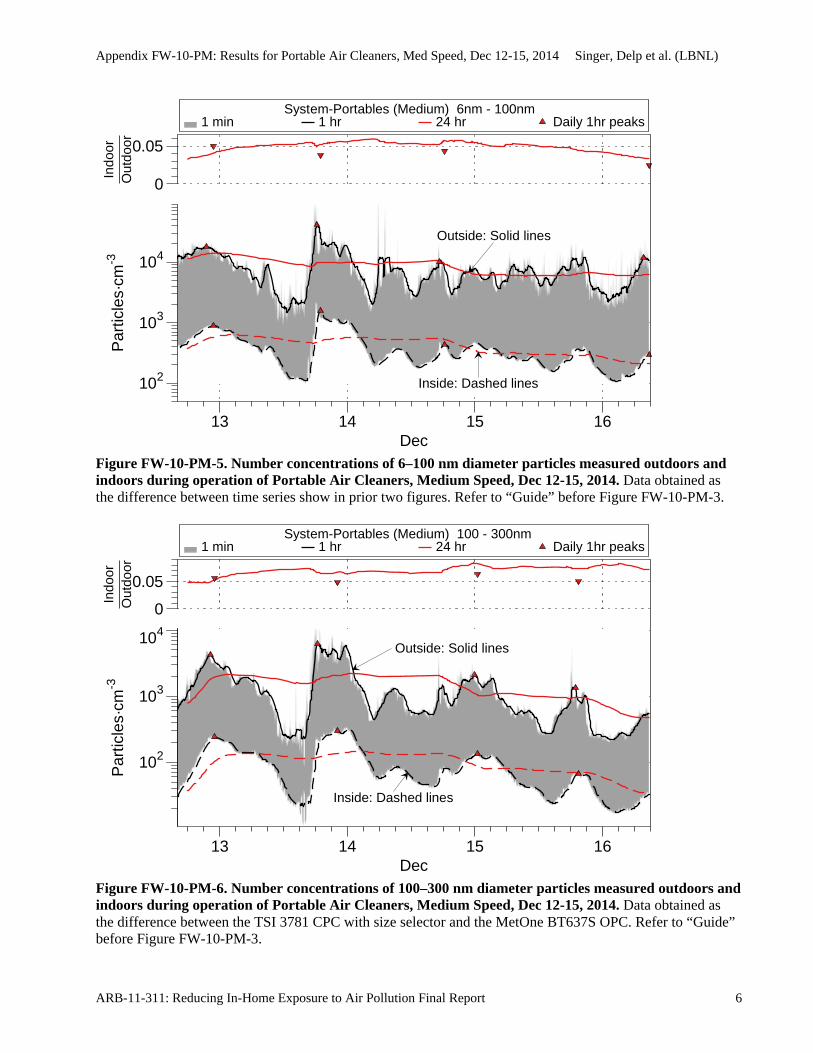
Appendix FW-10-PM: Results for Portable Air Cleaners, Med Speed, Dec 12-15, 2014 Singer, Delp et al. (LBNL)
ARB-11-311: Reducing In-Home Exposure to Air Pollution Final Report 6
Figure FW-10-PM-5. Number concentrations of 6–100 nm diameter particles measured outdoors and indoors during operation of Portable Air Cleaners, Medium Speed, Dec 12-15, 2014. Data obtained as the difference between time series show in prior two figures. Refer to “Guide” before Figure FW-10-PM-3.
Figure FW-10-PM-6. Number concentrations of 100–300 nm diameter particles measured outdoors and indoors during operation of Portable Air Cleaners, Medium Speed, Dec 12-15, 2014. Data obtained as the difference between the TSI 3781 CPC with size selector and the MetOne BT637S OPC. Refer to “Guide” before Figure FW-10-PM-3.
1 min 1 hr 24 hr Daily 1hr peaks System-Portables (Medium) 6nm - 100nm
Outside: Solid lines
Inside: Dashed lines
Par
ticle
s·cm
-3
102
103
104
Indo
orO
utdo
or
0
0.05
13 14 15 16Dec
1 min 1 hr 24 hr Daily 1hr peaks System-Portables (Medium) 100 - 300nm
Outside: Solid lines
Inside: Dashed lines
102
103
104
Par
ticle
s·cm
-3In
door
Out
door
0
0.05
13 14 15 16Dec
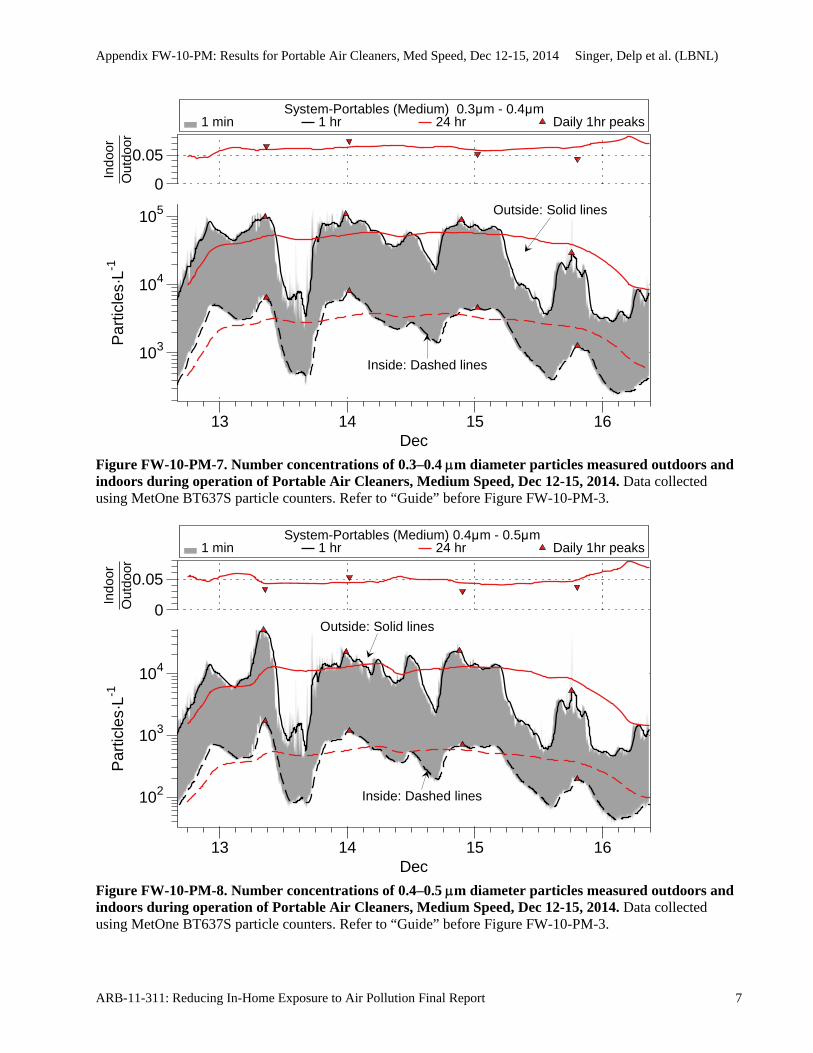
Appendix FW-10-PM: Results for Portable Air Cleaners, Med Speed, Dec 12-15, 2014 Singer, Delp et al. (LBNL)
ARB-11-311: Reducing In-Home Exposure to Air Pollution Final Report 7
Figure FW-10-PM-7. Number concentrations of 0.3–0.4 m diameter particles measured outdoors and indoors during operation of Portable Air Cleaners, Medium Speed, Dec 12-15, 2014. Data collected using MetOne BT637S particle counters. Refer to “Guide” before Figure FW-10-PM-3.
Figure FW-10-PM-8. Number concentrations of 0.4–0.5 m diameter particles measured outdoors and indoors during operation of Portable Air Cleaners, Medium Speed, Dec 12-15, 2014. Data collected using MetOne BT637S particle counters. Refer to “Guide” before Figure FW-10-PM-3.
1 min 1 hr 24 hr Daily 1hr peaks System-Portables (Medium) 0.3μm - 0.4μm
Outside: Solid lines
Inside: Dashed lines
Par
ticle
s·L-1
103
104
105
Indo
orO
utdo
or
0
0.05
13 14 15 16Dec
1 min 1 hr 24 hr Daily 1hr peaks System-Portables (Medium) 0.4μm - 0.5μm
Outside: Solid lines
Inside: Dashed lines
Par
ticle
s·L-1
102
103
104
Indo
orO
utdo
or
0
0.05
13 14 15 16Dec
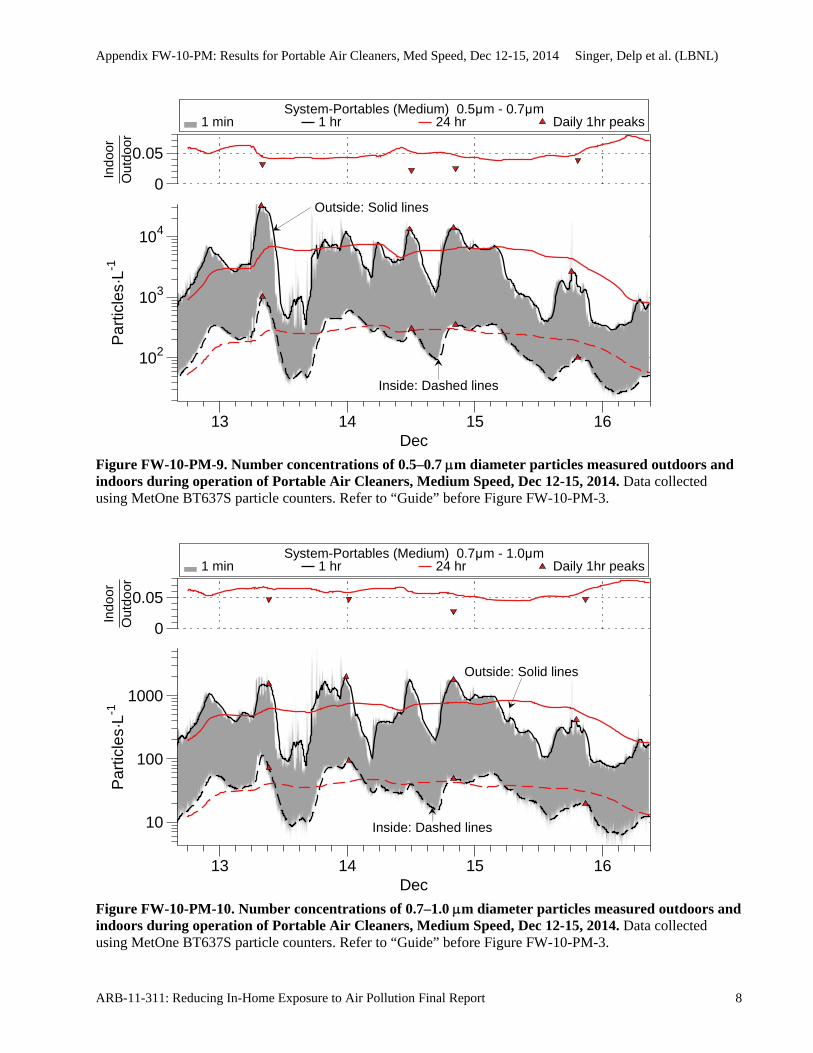
Appendix FW-10-PM: Results for Portable Air Cleaners, Med Speed, Dec 12-15, 2014 Singer, Delp et al. (LBNL)
ARB-11-311: Reducing In-Home Exposure to Air Pollution Final Report 8
Figure FW-10-PM-9. Number concentrations of 0.5–0.7 m diameter particles measured outdoors and indoors during operation of Portable Air Cleaners, Medium Speed, Dec 12-15, 2014. Data collected using MetOne BT637S particle counters. Refer to “Guide” before Figure FW-10-PM-3.
Figure FW-10-PM-10. Number concentrations of 0.7–1.0 m diameter particles measured outdoors and indoors during operation of Portable Air Cleaners, Medium Speed, Dec 12-15, 2014. Data collected using MetOne BT637S particle counters. Refer to “Guide” before Figure FW-10-PM-3.
1 min 1 hr 24 hr Daily 1hr peaks System-Portables (Medium) 0.5μm - 0.7μm
Outside: Solid lines
Inside: Dashed lines
Par
ticle
s·L-1
102
103
104
Indo
orO
utdo
or
0
0.05
13 14 15 16Dec
1 min 1 hr 24 hr Daily 1hr peaks System-Portables (Medium) 0.7μm - 1.0μm
Outside: Solid lines
Inside: Dashed lines
Par
ticle
s·L-1
10
100
1000
Indo
orO
utdo
or
0
0.05
13 14 15 16Dec
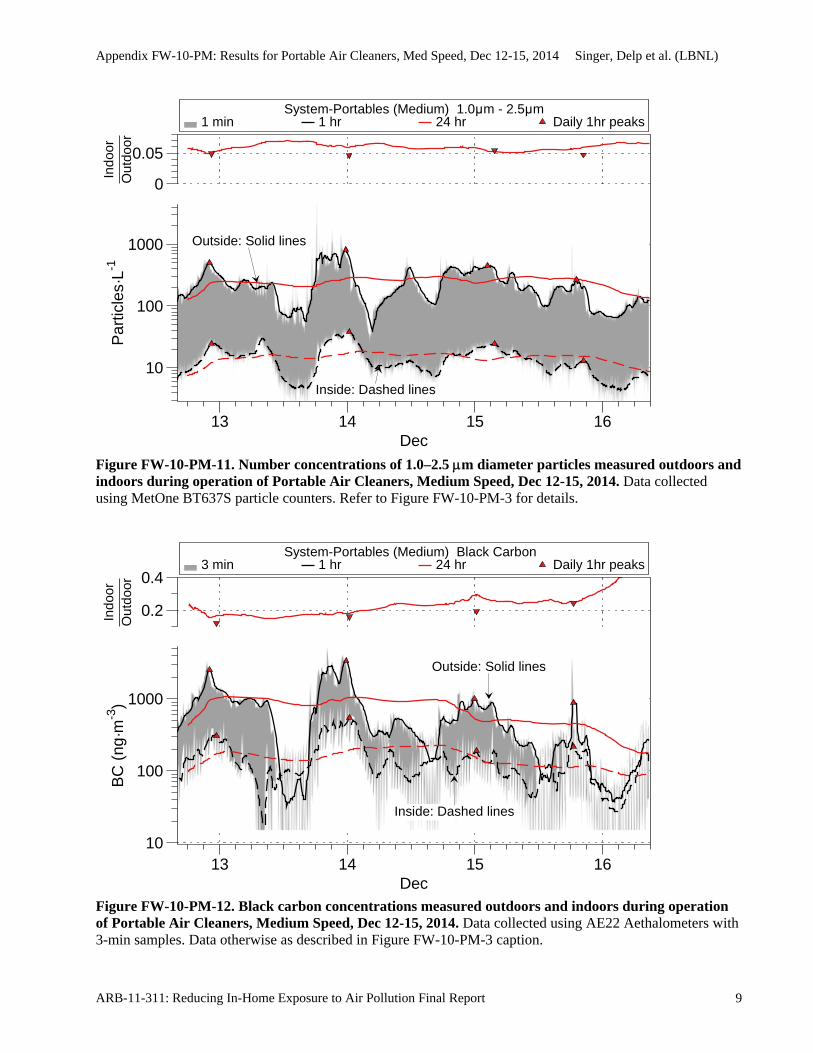
Appendix FW-10-PM: Results for Portable Air Cleaners, Med Speed, Dec 12-15, 2014 Singer, Delp et al. (LBNL)
ARB-11-311: Reducing In-Home Exposure to Air Pollution Final Report 9
Figure FW-10-PM-11. Number concentrations of 1.0–2.5 m diameter particles measured outdoors and indoors during operation of Portable Air Cleaners, Medium Speed, Dec 12-15, 2014. Data collected using MetOne BT637S particle counters. Refer to Figure FW-10-PM-3 for details.
Figure FW-10-PM-12. Black carbon concentrations measured outdoors and indoors during operation of Portable Air Cleaners, Medium Speed, Dec 12-15, 2014. Data collected using AE22 Aethalometers with 3-min samples. Data otherwise as described in Figure FW-10-PM-3 caption.
1 min 1 hr 24 hr Daily 1hr peaks System-Portables (Medium) 1.0μm - 2.5μm
Outside: Solid lines
Inside: Dashed lines
Par
ticle
s·L-1
10
100
1000
Indo
orO
utdo
or
0
0.05
13 14 15 16Dec
3 min 1 hr 24 hr Daily 1hr peaks System-Portables (Medium) Black Carbon
Outside: Solid lines
Inside: Dashed lines
BC
(ng
·m-3
)
10
100
1000
Indo
orO
utdo
or
0.2
0.4
13 14 15 16Dec

Appendix FW-10-PM: Results for Portable Air Cleaners, Med Speed, Dec 12-15, 2014 Singer, Delp et al. (LBNL)
ARB-11-311: Reducing In-Home Exposure to Air Pollution Final Report 10
Figure FW-10-PM-13. PM2.5 reported by TSI DustTrak II 8530 measurements outdoors and indoors during operation of Portable Air Cleaners, Medium Speed, Dec 12-15, 2014. The DustTrak measures light scattering and uses a calibration to estimate PM2.5 mass. Refer to “Guide” before Figure FW-10-PM-3.
Figure FW-10-PM-14. Estimated PM2.5 concentration calculated from size-resolved particle number concentrations measured by MetOne and CPC during operation of Portable Air Cleaners, Medium Speed, Dec 12-15, 2014. Details provided in body of report. Refer to “Guide” before Figure FW-10-PM-3.
1 min 1 hr 24 hr Daily 1hr peaks System-Portables (Medium) DustTrak PM2.5
1
10
100 Outside: Solid lines
Inside: Dashed lines
PM
2.5
(μg·
m-3
)In
door
Out
door
0
0.1
13 14 15 16Dec
1 min 1 hr 24 hr Daily 1hr peaks System-Portables (Medium) Estimated PM2.5
Outside: Solid lines
Inside: Dashed lines
PM
2.5
(μg·
m-3
)
1
10
100
Indo
orO
utdo
or
0
0.05
13 14 15 16Dec
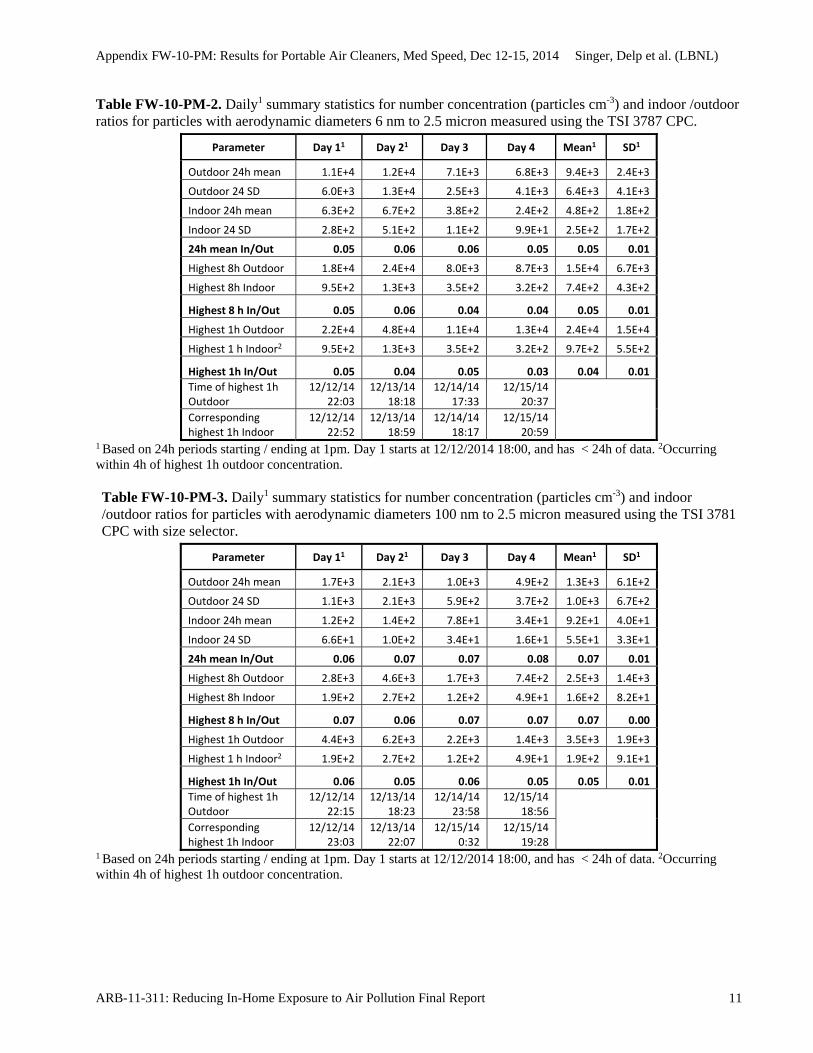
Appendix FW-10-PM: Results for Portable Air Cleaners, Med Speed, Dec 12-15, 2014 Singer, Delp et al. (LBNL)
ARB-11-311: Reducing In-Home Exposure to Air Pollution Final Report 11
Table FW-10-PM-2. Daily1 summary statistics for number concentration (particles cm-3) and indoor /outdoor ratios for particles with aerodynamic diameters 6 nm to 2.5 micron measured using the TSI 3787 CPC.
Parameter Day 11 Day 21 Day 3 Day 4 Mean1 SD1
Outdoor 24h mean 1.1E+4 1.2E+4 7.1E+3 6.8E+3 9.4E+3 2.4E+3
Outdoor 24 SD 6.0E+3 1.3E+4 2.5E+3 4.1E+3 6.4E+3 4.1E+3
Indoor 24h mean 6.3E+2 6.7E+2 3.8E+2 2.4E+2 4.8E+2 1.8E+2
Indoor 24 SD 2.8E+2 5.1E+2 1.1E+2 9.9E+1 2.5E+2 1.7E+2
24h mean In/Out 0.05 0.06 0.06 0.05 0.05 0.01
Highest 8h Outdoor 1.8E+4 2.4E+4 8.0E+3 8.7E+3 1.5E+4 6.7E+3
Highest 8h Indoor 9.5E+2 1.3E+3 3.5E+2 3.2E+2 7.4E+2 4.3E+2
Highest 8 h In/Out 0.05 0.06 0.04 0.04 0.05 0.01
Highest 1h Outdoor 2.2E+4 4.8E+4 1.1E+4 1.3E+4 2.4E+4 1.5E+4
Highest 1 h Indoor2 9.5E+2 1.3E+3 3.5E+2 3.2E+2 9.7E+2 5.5E+2
Highest 1h In/Out 0.05 0.04 0.05 0.03 0.04 0.01
Time of highest 1h Outdoor
12/12/14 22:03
12/13/14 18:18
12/14/14 17:33
12/15/14 20:37
Corresponding highest 1h Indoor
12/12/14 22:52
12/13/14 18:59
12/14/14 18:17
12/15/14 20:59
1 Based on 24h periods starting / ending at 1pm. Day 1 starts at 12/12/2014 18:00, and has < 24h of data. 2Occurring within 4h of highest 1h outdoor concentration. Table FW-10-PM-3. Daily1 summary statistics for number concentration (particles cm-3) and indoor /outdoor ratios for particles with aerodynamic diameters 100 nm to 2.5 micron measured using the TSI 3781 CPC with size selector.
Parameter Day 11 Day 21 Day 3 Day 4 Mean1 SD1
Outdoor 24h mean 1.7E+3 2.1E+3 1.0E+3 4.9E+2 1.3E+3 6.1E+2
Outdoor 24 SD 1.1E+3 2.1E+3 5.9E+2 3.7E+2 1.0E+3 6.7E+2
Indoor 24h mean 1.2E+2 1.4E+2 7.8E+1 3.4E+1 9.2E+1 4.0E+1
Indoor 24 SD 6.6E+1 1.0E+2 3.4E+1 1.6E+1 5.5E+1 3.3E+1
24h mean In/Out 0.06 0.07 0.07 0.08 0.07 0.01
Highest 8h Outdoor 2.8E+3 4.6E+3 1.7E+3 7.4E+2 2.5E+3 1.4E+3
Highest 8h Indoor 1.9E+2 2.7E+2 1.2E+2 4.9E+1 1.6E+2 8.2E+1
Highest 8 h In/Out 0.07 0.06 0.07 0.07 0.07 0.00
Highest 1h Outdoor 4.4E+3 6.2E+3 2.2E+3 1.4E+3 3.5E+3 1.9E+3
Highest 1 h Indoor2 1.9E+2 2.7E+2 1.2E+2 4.9E+1 1.9E+2 9.1E+1
Highest 1h In/Out 0.06 0.05 0.06 0.05 0.05 0.01
Time of highest 1h Outdoor
12/12/14 22:15
12/13/14 18:23
12/14/14 23:58
12/15/14 18:56
Corresponding highest 1h Indoor
12/12/14 23:03
12/13/14 22:07
12/15/14 0:32
12/15/14 19:28
1 Based on 24h periods starting / ending at 1pm. Day 1 starts at 12/12/2014 18:00, and has < 24h of data. 2Occurring within 4h of highest 1h outdoor concentration.

Appendix FW-10-PM: Results for Portable Air Cleaners, Med Speed, Dec 12-15, 2014 Singer, Delp et al. (LBNL)
ARB-11-311: Reducing In-Home Exposure to Air Pollution Final Report 12
Table FW-10-PM-4. Daily1 summary statistics for number concentration (particles cm-3) and indoor /outdoor ratios for particles with aerodynamic diameters 6–100 nm based on difference between concentrations measured using the TSI 3787 CPC and the TSI 3781 CPC with size selector.
Parameter Day 11 Day 21 Day 3 Day 4 Mean1 SD1
Outdoor 24h mean 9.7E+3 1.0E+4 6.1E+3 6.3E+3 8.0E+3 1.8E+3
Outdoor 24 SD 5.2E+3 1.2E+4 2.3E+3 3.8E+3 5.7E+3 3.5E+3
Indoor 24h mean 5.1E+2 5.3E+2 3.0E+2 2.1E+2 3.9E+2 1.4E+2
Indoor 24 SD 2.2E+2 4.2E+2 8.1E+1 8.4E+1 2.0E+2 1.4E+2
24h mean In/Out 0.04 0.05 0.05 0.04 0.05 0.01
Highest 8h Outdoor 1.5E+4 2.0E+4 7.0E+3 8.0E+3 1.2E+4 5.2E+3
Highest 8h Indoor 7.6E+2 1.1E+3 2.8E+2 2.7E+2 6.0E+2 3.4E+2
Highest 8 h In/Out 0.05 0.05 0.04 0.03 0.04 0.01
Highest 1h Outdoor 1.8E+4 4.2E+4 1.0E+4 1.2E+4 2.0E+4 1.3E+4
Highest 1 h Indoor2 7.6E+2 1.1E+3 2.8E+2 2.7E+2 8.0E+2 5.0E+2
Highest 1h In/Out 0.05 0.04 0.04 0.02 0.04 0.01
Time of highest 1h Outdoor
12/12/14 21:29
12/13/14 18:17
12/14/14 17:21
12/16/14 7:45
Corresponding highest 1h Indoor
12/12/14 22:46
12/13/14 18:59
12/14/14 18:17
12/16/14 8:44
1 Based on 24h periods starting / ending at 1pm. Day 1 starts at 12/12/2014 18:00, and has < 24h of data. 2Occurring within 4h of highest 1h outdoor concentration. Table FW-10-PM-5. Daily1 summary statistics for number concentration (particles cm-3) and indoor /outdoor ratios for particles with aerodynamic diameters 100–300 nm based on difference between concentrations measured using the TSI 3781 CPC with size selector and the MetOne BT637S OPC.
Parameter Day 11 Day 21 Day 3 Day 4 Mean1 SD1
Outdoor 24h mean 1.6E+6 2.0E+6 9.7E+5 4.8E+5 1.3E+6 5.9E+5
Outdoor 24 SD 1.1E+6 2.1E+6 5.6E+5 3.6E+5 1.0E+6 6.7E+5
Indoor 24h mean 1.2E+5 1.3E+5 7.4E+4 3.3E+4 8.9E+4 3.9E+4
Indoor 24 SD 6.5E+4 9.9E+4 3.2E+4 1.6E+4 5.3E+4 3.2E+4
24h mean In/Out 0.06 0.07 0.07 0.08 0.07 0.01
Highest 8h Outdoor 2.8E+6 4.5E+6 1.6E+6 7.2E+5 2.4E+6 1.4E+6
Highest 8h Indoor 1.9E+5 2.6E+5 1.1E+5 4.8E+4 1.5E+5 8.0E+4
Highest 8 h In/Out 0.07 0.06 0.07 0.07 0.07 0.00
Highest 1h Outdoor 4.3E+6 6.2E+6 2.1E+6 1.3E+6 3.5E+6 1.9E+6
Highest 1 h Indoor2 1.9E+5 2.6E+5 1.1E+5 4.8E+4 1.8E+5 8.9E+4
Highest 1h In/Out 0.06 0.05 0.06 0.05 0.05 0.01
Time of highest 1h Outdoor
12/12/14 22:15
12/13/14 18:23
12/14/14 23:58
12/15/14 18:56
Corresponding highest 1h Indoor
12/12/14 23:03
12/13/14 22:07
12/15/14 0:32
12/15/14 19:28
1 Based on 24h periods starting / ending at 1pm. Day 1 starts at 12/12/2014 18:00, and has < 24h of data. 2Occurring within 4h of highest 1h outdoor concentration.
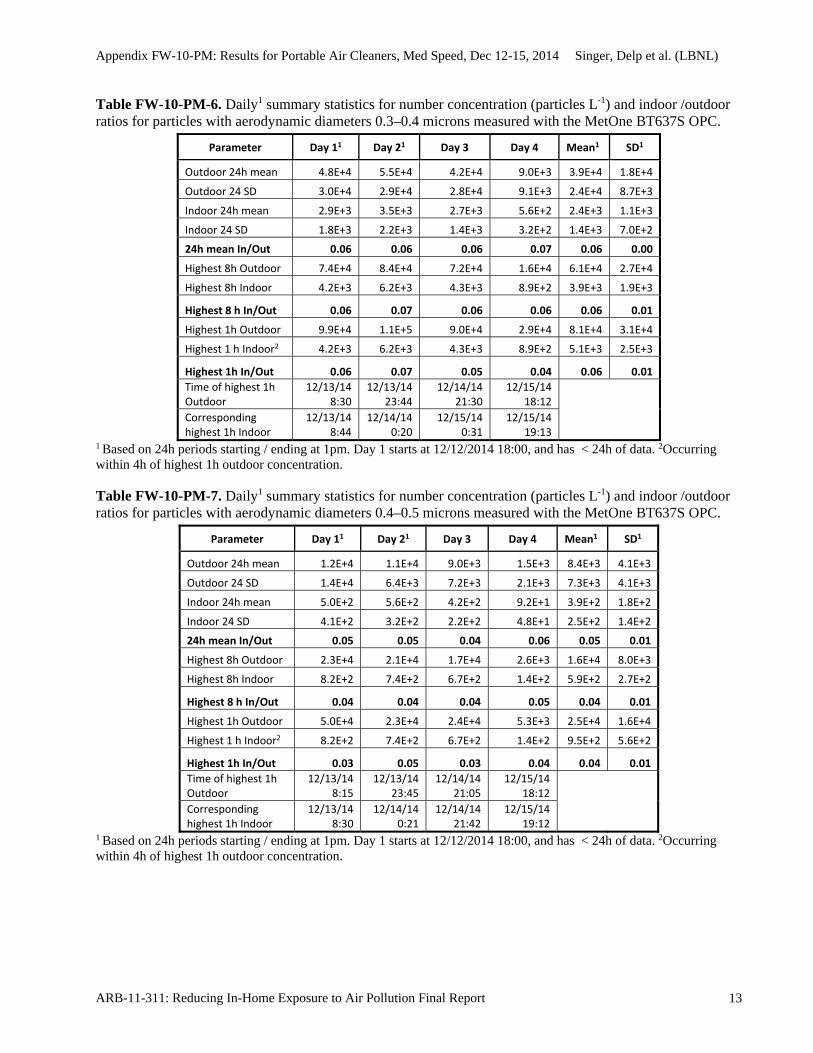
Appendix FW-10-PM: Results for Portable Air Cleaners, Med Speed, Dec 12-15, 2014 Singer, Delp et al. (LBNL)
ARB-11-311: Reducing In-Home Exposure to Air Pollution Final Report 13
Table FW-10-PM-6. Daily1 summary statistics for number concentration (particles L-1) and indoor /outdoor ratios for particles with aerodynamic diameters 0.3–0.4 microns measured with the MetOne BT637S OPC.
Parameter Day 11 Day 21 Day 3 Day 4 Mean1 SD1
Outdoor 24h mean 4.8E+4 5.5E+4 4.2E+4 9.0E+3 3.9E+4 1.8E+4
Outdoor 24 SD 3.0E+4 2.9E+4 2.8E+4 9.1E+3 2.4E+4 8.7E+3
Indoor 24h mean 2.9E+3 3.5E+3 2.7E+3 5.6E+2 2.4E+3 1.1E+3
Indoor 24 SD 1.8E+3 2.2E+3 1.4E+3 3.2E+2 1.4E+3 7.0E+2
24h mean In/Out 0.06 0.06 0.06 0.07 0.06 0.00
Highest 8h Outdoor 7.4E+4 8.4E+4 7.2E+4 1.6E+4 6.1E+4 2.7E+4
Highest 8h Indoor 4.2E+3 6.2E+3 4.3E+3 8.9E+2 3.9E+3 1.9E+3
Highest 8 h In/Out 0.06 0.07 0.06 0.06 0.06 0.01
Highest 1h Outdoor 9.9E+4 1.1E+5 9.0E+4 2.9E+4 8.1E+4 3.1E+4
Highest 1 h Indoor2 4.2E+3 6.2E+3 4.3E+3 8.9E+2 5.1E+3 2.5E+3
Highest 1h In/Out 0.06 0.07 0.05 0.04 0.06 0.01
Time of highest 1h Outdoor
12/13/14 8:30
12/13/14 23:44
12/14/14 21:30
12/15/14 18:12
Corresponding highest 1h Indoor
12/13/14 8:44
12/14/14 0:20
12/15/14 0:31
12/15/14 19:13
1 Based on 24h periods starting / ending at 1pm. Day 1 starts at 12/12/2014 18:00, and has < 24h of data. 2Occurring within 4h of highest 1h outdoor concentration. Table FW-10-PM-7. Daily1 summary statistics for number concentration (particles L-1) and indoor /outdoor ratios for particles with aerodynamic diameters 0.4–0.5 microns measured with the MetOne BT637S OPC.
Parameter Day 11 Day 21 Day 3 Day 4 Mean1 SD1
Outdoor 24h mean 1.2E+4 1.1E+4 9.0E+3 1.5E+3 8.4E+3 4.1E+3
Outdoor 24 SD 1.4E+4 6.4E+3 7.2E+3 2.1E+3 7.3E+3 4.1E+3
Indoor 24h mean 5.0E+2 5.6E+2 4.2E+2 9.2E+1 3.9E+2 1.8E+2
Indoor 24 SD 4.1E+2 3.2E+2 2.2E+2 4.8E+1 2.5E+2 1.4E+2
24h mean In/Out 0.05 0.05 0.04 0.06 0.05 0.01
Highest 8h Outdoor 2.3E+4 2.1E+4 1.7E+4 2.6E+3 1.6E+4 8.0E+3
Highest 8h Indoor 8.2E+2 7.4E+2 6.7E+2 1.4E+2 5.9E+2 2.7E+2
Highest 8 h In/Out 0.04 0.04 0.04 0.05 0.04 0.01
Highest 1h Outdoor 5.0E+4 2.3E+4 2.4E+4 5.3E+3 2.5E+4 1.6E+4
Highest 1 h Indoor2 8.2E+2 7.4E+2 6.7E+2 1.4E+2 9.5E+2 5.6E+2
Highest 1h In/Out 0.03 0.05 0.03 0.04 0.04 0.01
Time of highest 1h Outdoor
12/13/14 8:15
12/13/14 23:45
12/14/14 21:05
12/15/14 18:12
Corresponding highest 1h Indoor
12/13/14 8:30
12/14/14 0:21
12/14/14 21:42
12/15/14 19:12
1 Based on 24h periods starting / ending at 1pm. Day 1 starts at 12/12/2014 18:00, and has < 24h of data. 2Occurring within 4h of highest 1h outdoor concentration.

Appendix FW-10-PM: Results for Portable Air Cleaners, Med Speed, Dec 12-15, 2014 Singer, Delp et al. (LBNL)
ARB-11-311: Reducing In-Home Exposure to Air Pollution Final Report 14
Table FW-10-PM-8. Daily1 summary statistics for number concentration (particles L-1) and indoor /outdoor ratios for particles with aerodynamic diameters 0.5–0.7 microns measured with the MetOne BT637S OPC.
Parameter Day 11 Day 21 Day 3 Day 4 Mean1 SD1
Outdoor 24h mean 6.2E+3 5.7E+3 4.8E+3 8.5E+2 4.4E+3 2.1E+3
Outdoor 24 SD 8.5E+3 4.0E+3 3.9E+3 9.7E+2 4.4E+3 2.7E+3
Indoor 24h mean 2.6E+2 2.9E+2 2.2E+2 5.3E+1 2.0E+2 9.1E+1
Indoor 24 SD 2.4E+2 1.6E+2 1.1E+2 2.4E+1 1.3E+2 7.9E+1
24h mean In/Out 0.05 0.05 0.04 0.06 0.05 0.01
Highest 8h Outdoor 1.3E+4 1.2E+4 9.1E+3 1.4E+3 8.9E+3 4.6E+3
Highest 8h Indoor 4.4E+2 4.0E+2 3.3E+2 7.7E+1 3.1E+2 1.4E+2
Highest 8 h In/Out 0.03 0.03 0.04 0.06 0.04 0.01
Highest 1h Outdoor 3.2E+4 1.3E+4 1.4E+4 2.6E+3 1.5E+4 1.1E+4
Highest 1 h Indoor2 4.4E+2 4.0E+2 3.3E+2 7.7E+1 4.5E+2 3.5E+2
Highest 1h In/Out 0.03 0.02 0.03 0.04 0.03 0.01
Time of highest 1h Outdoor
12/13/14 7:46
12/14/14 11:45
12/14/14 20:01
12/15/14 18:12
Corresponding highest 1h Indoor
12/13/14 8:01
12/14/14 12:02
12/14/14 20:24
12/15/14 19:22
1 Based on 24h periods starting / ending at 1pm. Day 1 starts at 12/12/2014 18:00, and has < 24h of data. 2Occurring within 4h of highest 1h outdoor concentration. Table FW-10-PM-9. Daily1 summary statistics for number concentration (particles L-1) and indoor /outdoor ratios for particles with aerodynamic diameters 0.7–1.0 microns measured with the MetOne BT637S OPC.
Parameter Day 11 Day 21 Day 3 Day 4 Mean1 SD1
Outdoor 24h mean 5.8E+2 7.3E+2 6.8E+2 1.7E+2 5.4E+2 2.2E+2
Outdoor 24 SD 4.4E+2 6.6E+2 4.7E+2 1.3E+2 4.3E+2 1.9E+2
Indoor 24h mean 3.7E+1 4.2E+1 3.5E+1 1.2E+1 3.2E+1 1.2E+1
Indoor 24 SD 2.5E+1 2.5E+1 1.5E+1 4.8E+0 1.7E+1 8.4E+0
24h mean In/Out 0.06 0.06 0.05 0.07 0.06 0.01
Highest 8h Outdoor 8.6E+2 1.3E+3 1.2E+3 2.7E+2 8.9E+2 3.9E+2
Highest 8h Indoor 5.5E+1 7.2E+1 5.1E+1 2.4E+1 5.1E+1 1.7E+1
Highest 8 h In/Out 0.06 0.06 0.04 0.09 0.06 0.02
Highest 1h Outdoor 1.5E+3 2.0E+3 1.8E+3 4.1E+2 1.4E+3 6.1E+2
Highest 1 h Indoor2 5.5E+1 7.2E+1 5.1E+1 2.4E+1 5.9E+1 2.8E+1
Highest 1h In/Out 0.05 0.05 0.03 0.05 0.04 0.01
Time of highest 1h Outdoor
12/13/14 9:15
12/13/14 23:45
12/14/14 19:58
12/15/14 19:02
Corresponding highest 1h Indoor
12/13/14 9:15
12/14/14 0:17
12/14/14 19:58
12/15/14 20:46
1 Based on 24h periods starting / ending at 1pm. Day 1 starts at 12/12/2014 18:00, and has < 24h of data. 2Occurring within 4h of highest 1h outdoor concentration.
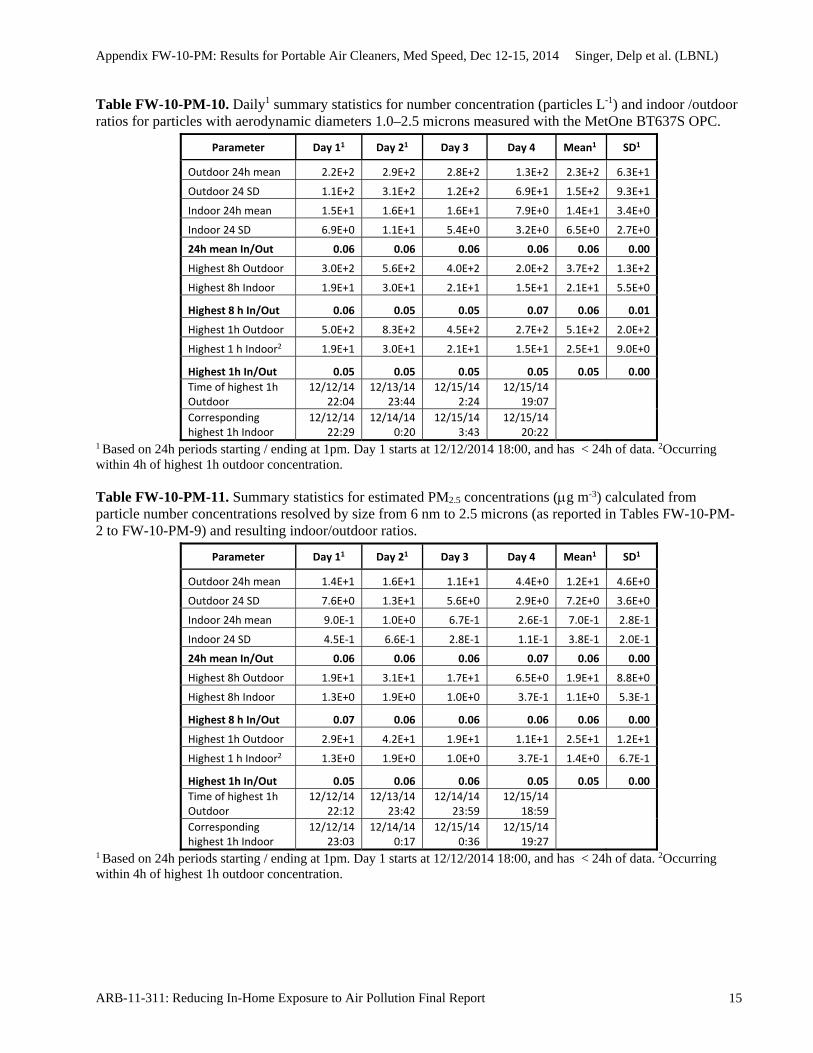
Appendix FW-10-PM: Results for Portable Air Cleaners, Med Speed, Dec 12-15, 2014 Singer, Delp et al. (LBNL)
ARB-11-311: Reducing In-Home Exposure to Air Pollution Final Report 15
Table FW-10-PM-10. Daily1 summary statistics for number concentration (particles L-1) and indoor /outdoor ratios for particles with aerodynamic diameters 1.0–2.5 microns measured with the MetOne BT637S OPC.
Parameter Day 11 Day 21 Day 3 Day 4 Mean1 SD1
Outdoor 24h mean 2.2E+2 2.9E+2 2.8E+2 1.3E+2 2.3E+2 6.3E+1
Outdoor 24 SD 1.1E+2 3.1E+2 1.2E+2 6.9E+1 1.5E+2 9.3E+1
Indoor 24h mean 1.5E+1 1.6E+1 1.6E+1 7.9E+0 1.4E+1 3.4E+0
Indoor 24 SD 6.9E+0 1.1E+1 5.4E+0 3.2E+0 6.5E+0 2.7E+0
24h mean In/Out 0.06 0.06 0.06 0.06 0.06 0.00
Highest 8h Outdoor 3.0E+2 5.6E+2 4.0E+2 2.0E+2 3.7E+2 1.3E+2
Highest 8h Indoor 1.9E+1 3.0E+1 2.1E+1 1.5E+1 2.1E+1 5.5E+0
Highest 8 h In/Out 0.06 0.05 0.05 0.07 0.06 0.01
Highest 1h Outdoor 5.0E+2 8.3E+2 4.5E+2 2.7E+2 5.1E+2 2.0E+2
Highest 1 h Indoor2 1.9E+1 3.0E+1 2.1E+1 1.5E+1 2.5E+1 9.0E+0
Highest 1h In/Out 0.05 0.05 0.05 0.05 0.05 0.00
Time of highest 1h Outdoor
12/12/14 22:04
12/13/14 23:44
12/15/14 2:24
12/15/14 19:07
Corresponding highest 1h Indoor
12/12/14 22:29
12/14/14 0:20
12/15/14 3:43
12/15/14 20:22
1 Based on 24h periods starting / ending at 1pm. Day 1 starts at 12/12/2014 18:00, and has < 24h of data. 2Occurring within 4h of highest 1h outdoor concentration. Table FW-10-PM-11. Summary statistics for estimated PM2.5 concentrations (g m-3) calculated from particle number concentrations resolved by size from 6 nm to 2.5 microns (as reported in Tables FW-10-PM-2 to FW-10-PM-9) and resulting indoor/outdoor ratios.
Parameter Day 11 Day 21 Day 3 Day 4 Mean1 SD1
Outdoor 24h mean 1.4E+1 1.6E+1 1.1E+1 4.4E+0 1.2E+1 4.6E+0
Outdoor 24 SD 7.6E+0 1.3E+1 5.6E+0 2.9E+0 7.2E+0 3.6E+0
Indoor 24h mean 9.0E‐1 1.0E+0 6.7E‐1 2.6E‐1 7.0E‐1 2.8E‐1
Indoor 24 SD 4.5E‐1 6.6E‐1 2.8E‐1 1.1E‐1 3.8E‐1 2.0E‐1
24h mean In/Out 0.06 0.06 0.06 0.07 0.06 0.00
Highest 8h Outdoor 1.9E+1 3.1E+1 1.7E+1 6.5E+0 1.9E+1 8.8E+0
Highest 8h Indoor 1.3E+0 1.9E+0 1.0E+0 3.7E‐1 1.1E+0 5.3E‐1
Highest 8 h In/Out 0.07 0.06 0.06 0.06 0.06 0.00
Highest 1h Outdoor 2.9E+1 4.2E+1 1.9E+1 1.1E+1 2.5E+1 1.2E+1
Highest 1 h Indoor2 1.3E+0 1.9E+0 1.0E+0 3.7E‐1 1.4E+0 6.7E‐1
Highest 1h In/Out 0.05 0.06 0.06 0.05 0.05 0.00
Time of highest 1h Outdoor
12/12/14 22:12
12/13/14 23:42
12/14/14 23:59
12/15/14 18:59
Corresponding highest 1h Indoor
12/12/14 23:03
12/14/14 0:17
12/15/14 0:36
12/15/14 19:27
1 Based on 24h periods starting / ending at 1pm. Day 1 starts at 12/12/2014 18:00, and has < 24h of data. 2Occurring within 4h of highest 1h outdoor concentration.
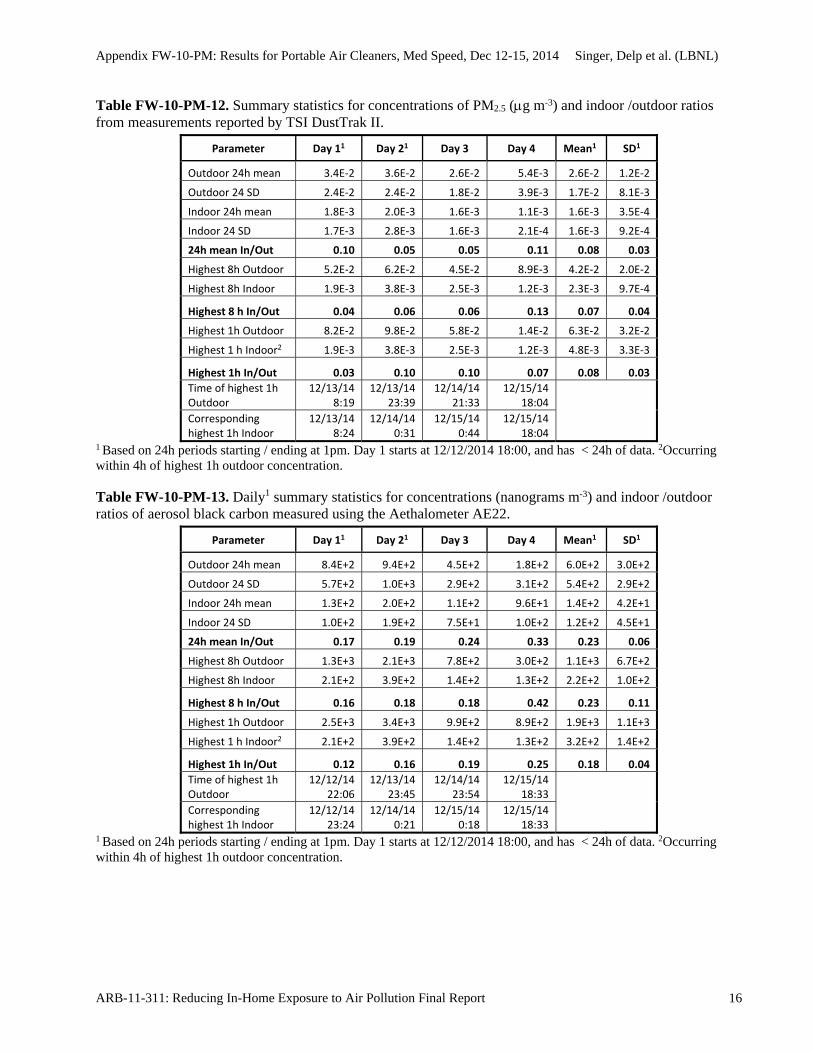
Appendix FW-10-PM: Results for Portable Air Cleaners, Med Speed, Dec 12-15, 2014 Singer, Delp et al. (LBNL)
ARB-11-311: Reducing In-Home Exposure to Air Pollution Final Report 16
Table FW-10-PM-12. Summary statistics for concentrations of PM2.5 (g m-3) and indoor /outdoor ratios from measurements reported by TSI DustTrak II.
Parameter Day 11 Day 21 Day 3 Day 4 Mean1 SD1
Outdoor 24h mean 3.4E‐2 3.6E‐2 2.6E‐2 5.4E‐3 2.6E‐2 1.2E‐2
Outdoor 24 SD 2.4E‐2 2.4E‐2 1.8E‐2 3.9E‐3 1.7E‐2 8.1E‐3
Indoor 24h mean 1.8E‐3 2.0E‐3 1.6E‐3 1.1E‐3 1.6E‐3 3.5E‐4
Indoor 24 SD 1.7E‐3 2.8E‐3 1.6E‐3 2.1E‐4 1.6E‐3 9.2E‐4
24h mean In/Out 0.10 0.05 0.05 0.11 0.08 0.03
Highest 8h Outdoor 5.2E‐2 6.2E‐2 4.5E‐2 8.9E‐3 4.2E‐2 2.0E‐2
Highest 8h Indoor 1.9E‐3 3.8E‐3 2.5E‐3 1.2E‐3 2.3E‐3 9.7E‐4
Highest 8 h In/Out 0.04 0.06 0.06 0.13 0.07 0.04
Highest 1h Outdoor 8.2E‐2 9.8E‐2 5.8E‐2 1.4E‐2 6.3E‐2 3.2E‐2
Highest 1 h Indoor2 1.9E‐3 3.8E‐3 2.5E‐3 1.2E‐3 4.8E‐3 3.3E‐3
Highest 1h In/Out 0.03 0.10 0.10 0.07 0.08 0.03
Time of highest 1h Outdoor
12/13/14 8:19
12/13/14 23:39
12/14/14 21:33
12/15/14 18:04
Corresponding highest 1h Indoor
12/13/14 8:24
12/14/14 0:31
12/15/14 0:44
12/15/14 18:04
1 Based on 24h periods starting / ending at 1pm. Day 1 starts at 12/12/2014 18:00, and has < 24h of data. 2Occurring within 4h of highest 1h outdoor concentration. Table FW-10-PM-13. Daily1 summary statistics for concentrations (nanograms m-3) and indoor /outdoor ratios of aerosol black carbon measured using the Aethalometer AE22.
Parameter Day 11 Day 21 Day 3 Day 4 Mean1 SD1
Outdoor 24h mean 8.4E+2 9.4E+2 4.5E+2 1.8E+2 6.0E+2 3.0E+2
Outdoor 24 SD 5.7E+2 1.0E+3 2.9E+2 3.1E+2 5.4E+2 2.9E+2
Indoor 24h mean 1.3E+2 2.0E+2 1.1E+2 9.6E+1 1.4E+2 4.2E+1
Indoor 24 SD 1.0E+2 1.9E+2 7.5E+1 1.0E+2 1.2E+2 4.5E+1
24h mean In/Out 0.17 0.19 0.24 0.33 0.23 0.06
Highest 8h Outdoor 1.3E+3 2.1E+3 7.8E+2 3.0E+2 1.1E+3 6.7E+2
Highest 8h Indoor 2.1E+2 3.9E+2 1.4E+2 1.3E+2 2.2E+2 1.0E+2
Highest 8 h In/Out 0.16 0.18 0.18 0.42 0.23 0.11
Highest 1h Outdoor 2.5E+3 3.4E+3 9.9E+2 8.9E+2 1.9E+3 1.1E+3
Highest 1 h Indoor2 2.1E+2 3.9E+2 1.4E+2 1.3E+2 3.2E+2 1.4E+2
Highest 1h In/Out 0.12 0.16 0.19 0.25 0.18 0.04
Time of highest 1h Outdoor
12/12/14 22:06
12/13/14 23:45
12/14/14 23:54
12/15/14 18:33
Corresponding highest 1h Indoor
12/12/14 23:24
12/14/14 0:21
12/15/14 0:18
12/15/14 18:33
1 Based on 24h periods starting / ending at 1pm. Day 1 starts at 12/12/2014 18:00, and has < 24h of data. 2Occurring within 4h of highest 1h outdoor concentration.
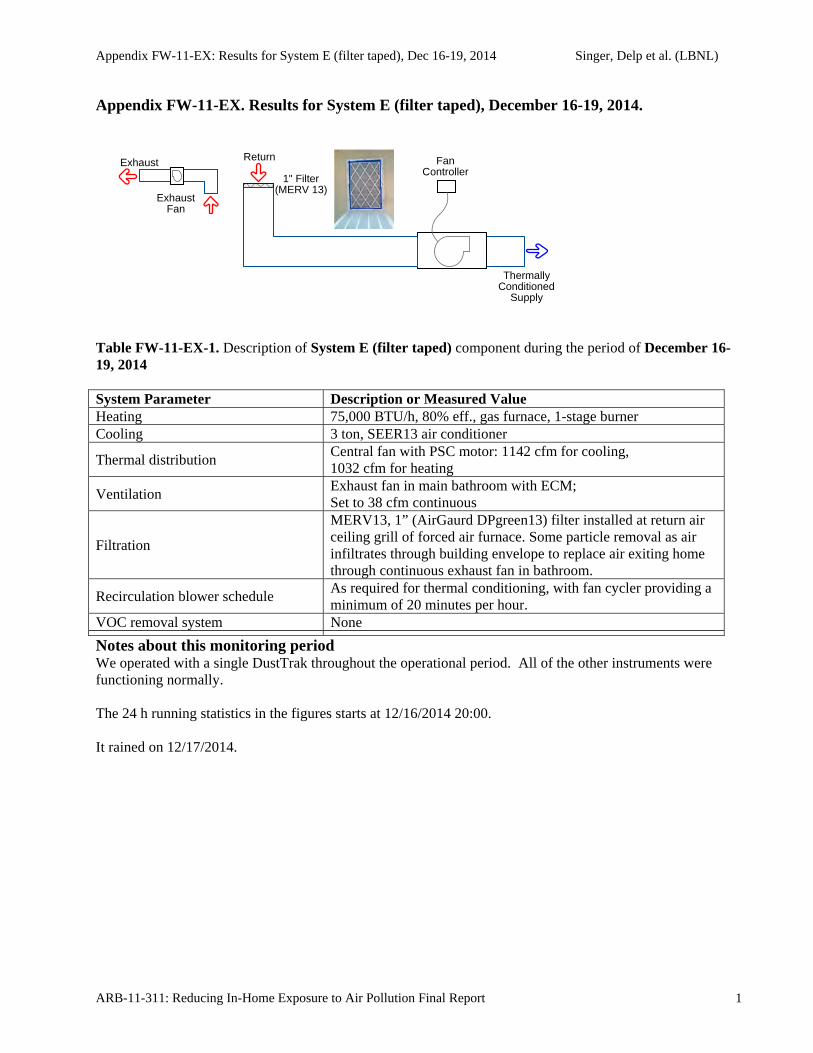
Appendix FW-11-EX: Results for System E (filter taped), Dec 16-19, 2014 Singer, Delp et al. (LBNL)
ARB-11-311: Reducing In-Home Exposure to Air Pollution Final Report 1
Appendix FW-11-EX. Results for System E (filter taped), December 16-19, 2014.
Table FW-11-EX-1. Description of System E (filter taped) component during the period of December 16-19, 2014 System Parameter Description or Measured Value Heating 75,000 BTU/h, 80% eff., gas furnace, 1-stage burner Cooling 3 ton, SEER13 air conditioner
Thermal distribution Central fan with PSC motor: 1142 cfm for cooling, 1032 cfm for heating
Ventilation Exhaust fan in main bathroom with ECM; Set to 38 cfm continuous
Filtration
MERV13, 1” (AirGaurd DPgreen13) filter installed at return air ceiling grill of forced air furnace. Some particle removal as air infiltrates through building envelope to replace air exiting home through continuous exhaust fan in bathroom.
Recirculation blower schedule As required for thermal conditioning, with fan cycler providing a minimum of 20 minutes per hour.
VOC removal system None
Notes about this monitoring period We operated with a single DustTrak throughout the operational period. All of the other instruments were functioning normally. The 24 h running statistics in the figures starts at 12/16/2014 20:00. It rained on 12/17/2014.
Exhaust
ThermallyConditioned
Supply
FanController
ExhaustFan
1" Filter(MERV 13)
Return
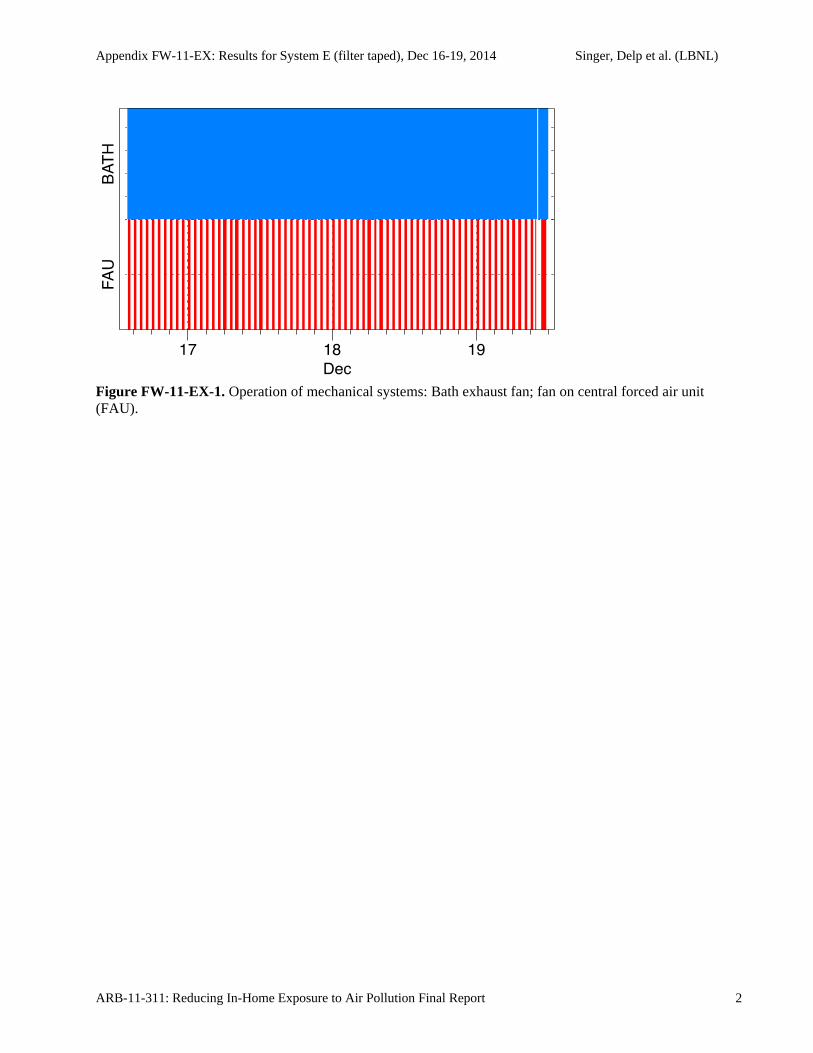
Appendix FW-11-EX: Results for System E (filter taped), Dec 16-19, 2014 Singer, Delp et al. (LBNL)
ARB-11-311: Reducing In-Home Exposure to Air Pollution Final Report 2
Figure FW-11-EX-1. Operation of mechanical systems: Bath exhaust fan; fan on central forced air unit (FAU).
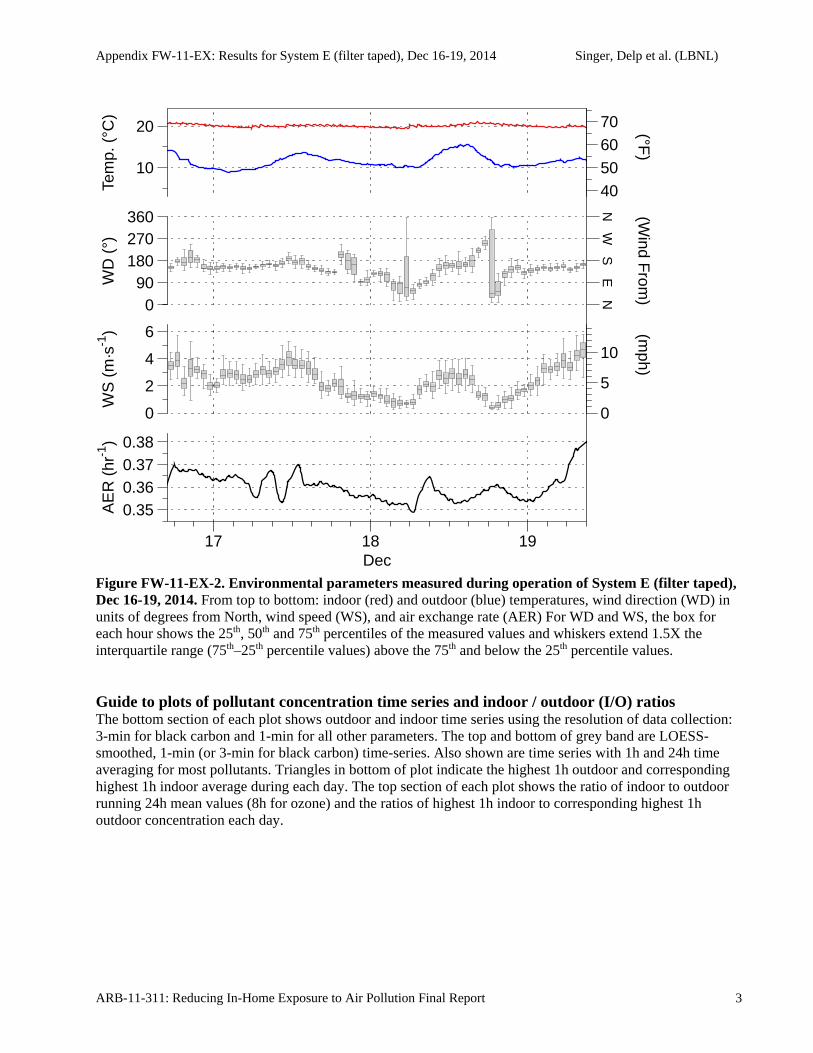
Appendix FW-11-EX: Results for System E (filter taped), Dec 16-19, 2014 Singer, Delp et al. (LBNL)
ARB-11-311: Reducing In-Home Exposure to Air Pollution Final Report 3
Figure FW-11-EX-2. Environmental parameters measured during operation of System E (filter taped), Dec 16-19, 2014. From top to bottom: indoor (red) and outdoor (blue) temperatures, wind direction (WD) in units of degrees from North, wind speed (WS), and air exchange rate (AER) For WD and WS, the box for each hour shows the 25th, 50th and 75th percentiles of the measured values and whiskers extend 1.5X the interquartile range (75th–25th percentile values) above the 75th and below the 25th percentile values. Guide to plots of pollutant concentration time series and indoor / outdoor (I/O) ratios The bottom section of each plot shows outdoor and indoor time series using the resolution of data collection: 3-min for black carbon and 1-min for all other parameters. The top and bottom of grey band are LOESS-smoothed, 1-min (or 3-min for black carbon) time-series. Also shown are time series with 1h and 24h time averaging for most pollutants. Triangles in bottom of plot indicate the highest 1h outdoor and corresponding highest 1h indoor average during each day. The top section of each plot shows the ratio of indoor to outdoor running 24h mean values (8h for ozone) and the ratios of highest 1h indoor to corresponding highest 1h outdoor concentration each day.
0
5
10
40506070
NE
SW
N
(mph)
(Wind F
rom)
(°F)
AE
R (
hr-1
)
0.350.360.370.38
WS
(m
·s-1
)
0
2
4
6
WD
(°)
090
180270360
Tem
p. (
°C)
10
20
17 18 19Dec
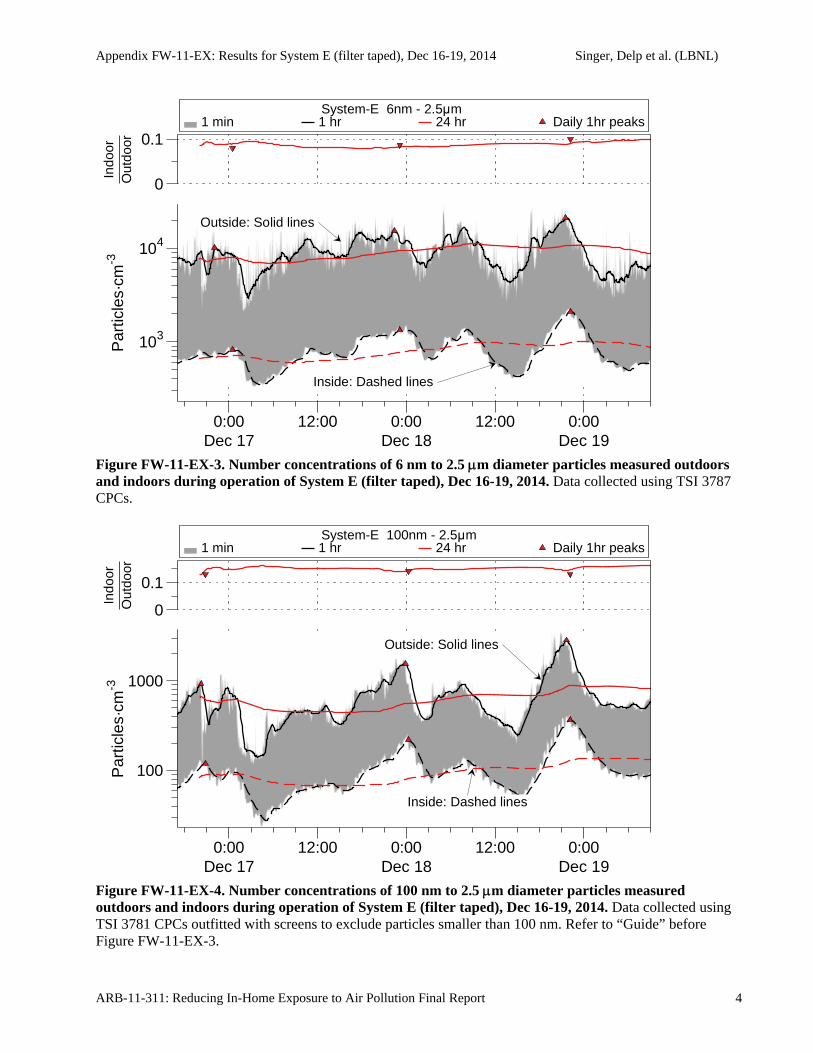
Appendix FW-11-EX: Results for System E (filter taped), Dec 16-19, 2014 Singer, Delp et al. (LBNL)
ARB-11-311: Reducing In-Home Exposure to Air Pollution Final Report 4
Figure FW-11-EX-3. Number concentrations of 6 nm to 2.5 m diameter particles measured outdoors and indoors during operation of System E (filter taped), Dec 16-19, 2014. Data collected using TSI 3787 CPCs.
Figure FW-11-EX-4. Number concentrations of 100 nm to 2.5 m diameter particles measured outdoors and indoors during operation of System E (filter taped), Dec 16-19, 2014. Data collected using TSI 3781 CPCs outfitted with screens to exclude particles smaller than 100 nm. Refer to “Guide” before Figure FW-11-EX-3.
1 min 1 hr 24 hr Daily 1hr peaks System-E 6nm - 2.5μm
Outside: Solid lines
Inside: Dashed lines
Par
ticle
s·cm
-3
103
104
Indo
orO
utdo
or
0
0.1
0:00 12:00 0:00 12:00 0:00Dec 17 Dec 18 Dec 19
1 min 1 hr 24 hr Daily 1hr peaks System-E 100nm - 2.5μm
Outside: Solid lines
Inside: Dashed lines
Par
ticle
s·cm
-3
100
1000
Indo
orO
utdo
or
0
0.1
0:00 12:00 0:00 12:00 0:00Dec 17 Dec 18 Dec 19
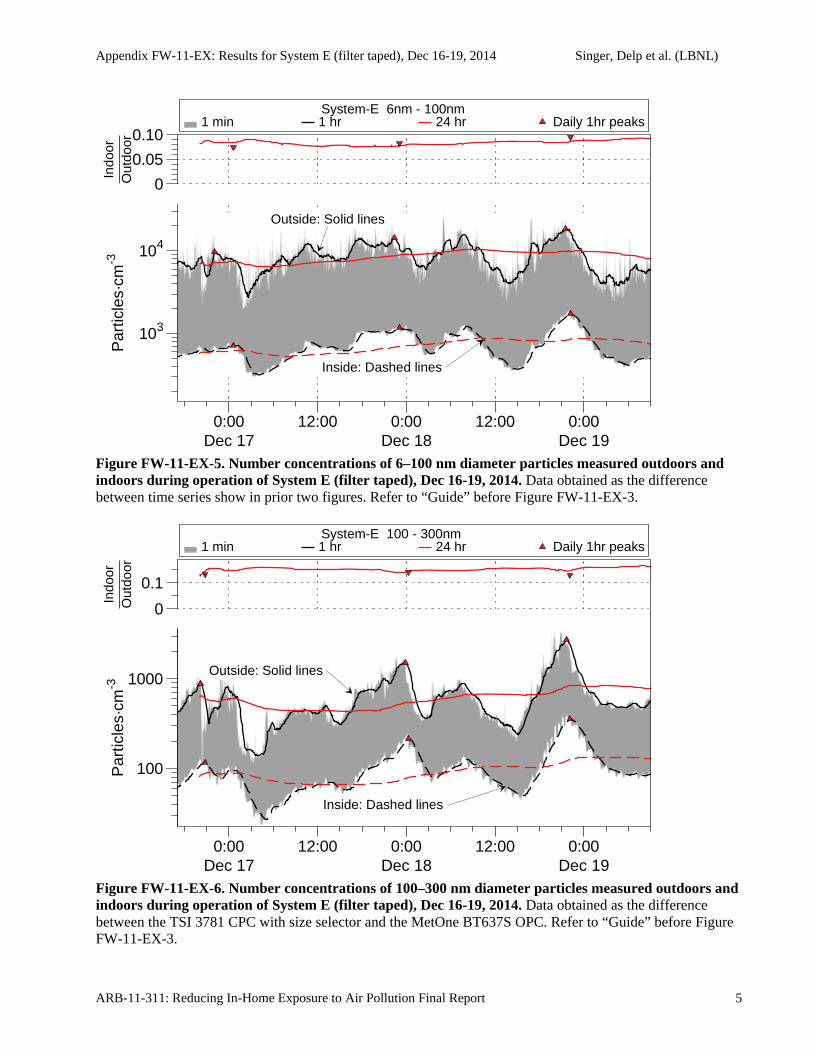
Appendix FW-11-EX: Results for System E (filter taped), Dec 16-19, 2014 Singer, Delp et al. (LBNL)
ARB-11-311: Reducing In-Home Exposure to Air Pollution Final Report 5
Figure FW-11-EX-5. Number concentrations of 6–100 nm diameter particles measured outdoors and indoors during operation of System E (filter taped), Dec 16-19, 2014. Data obtained as the difference between time series show in prior two figures. Refer to “Guide” before Figure FW-11-EX-3.
Figure FW-11-EX-6. Number concentrations of 100–300 nm diameter particles measured outdoors and indoors during operation of System E (filter taped), Dec 16-19, 2014. Data obtained as the difference between the TSI 3781 CPC with size selector and the MetOne BT637S OPC. Refer to “Guide” before Figure FW-11-EX-3.
1 min 1 hr 24 hr Daily 1hr peaks System-E 6nm - 100nm
Outside: Solid lines
Inside: Dashed lines
Par
ticle
s·cm
-3
103
104
Indo
orO
utdo
or
0
0.05
0.10
0:00 12:00 0:00 12:00 0:00Dec 17 Dec 18 Dec 19
1 min 1 hr 24 hr Daily 1hr peaks System-E 100 - 300nm
Outside: Solid lines
Inside: Dashed lines
100
1000
Par
ticle
s·cm
-3In
door
Out
door
0
0.1
0:00 12:00 0:00 12:00 0:00Dec 17 Dec 18 Dec 19
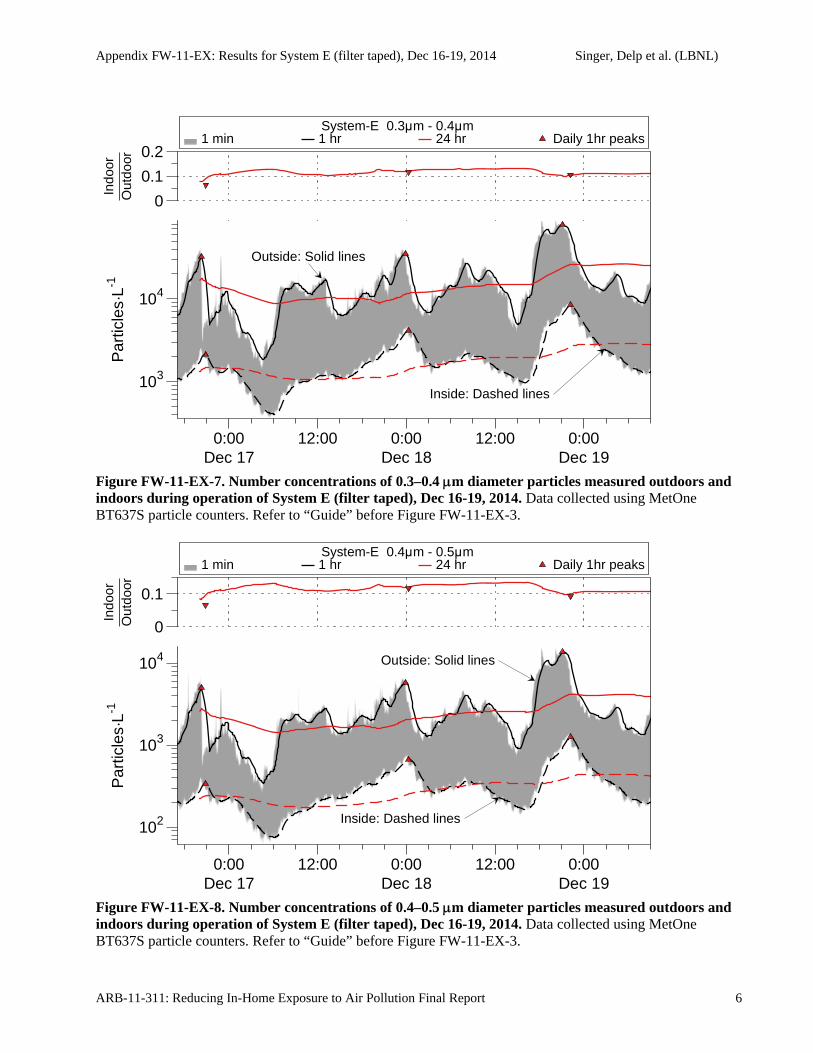
Appendix FW-11-EX: Results for System E (filter taped), Dec 16-19, 2014 Singer, Delp et al. (LBNL)
ARB-11-311: Reducing In-Home Exposure to Air Pollution Final Report 6
Figure FW-11-EX-7. Number concentrations of 0.3–0.4 m diameter particles measured outdoors and indoors during operation of System E (filter taped), Dec 16-19, 2014. Data collected using MetOne BT637S particle counters. Refer to “Guide” before Figure FW-11-EX-3.
Figure FW-11-EX-8. Number concentrations of 0.4–0.5 m diameter particles measured outdoors and indoors during operation of System E (filter taped), Dec 16-19, 2014. Data collected using MetOne BT637S particle counters. Refer to “Guide” before Figure FW-11-EX-3.
1 min 1 hr 24 hr Daily 1hr peaks System-E 0.3μm - 0.4μm
Outside: Solid lines
Inside: Dashed lines
Par
ticle
s·L-1
103
104
Indo
orO
utdo
or
0
0.1
0.2
0:00 12:00 0:00 12:00 0:00Dec 17 Dec 18 Dec 19
1 min 1 hr 24 hr Daily 1hr peaks System-E 0.4μm - 0.5μm
Outside: Solid lines
Inside: Dashed lines
Par
ticle
s·L-1
102
103
104
Indo
orO
utdo
or
0
0.1
0:00 12:00 0:00 12:00 0:00Dec 17 Dec 18 Dec 19
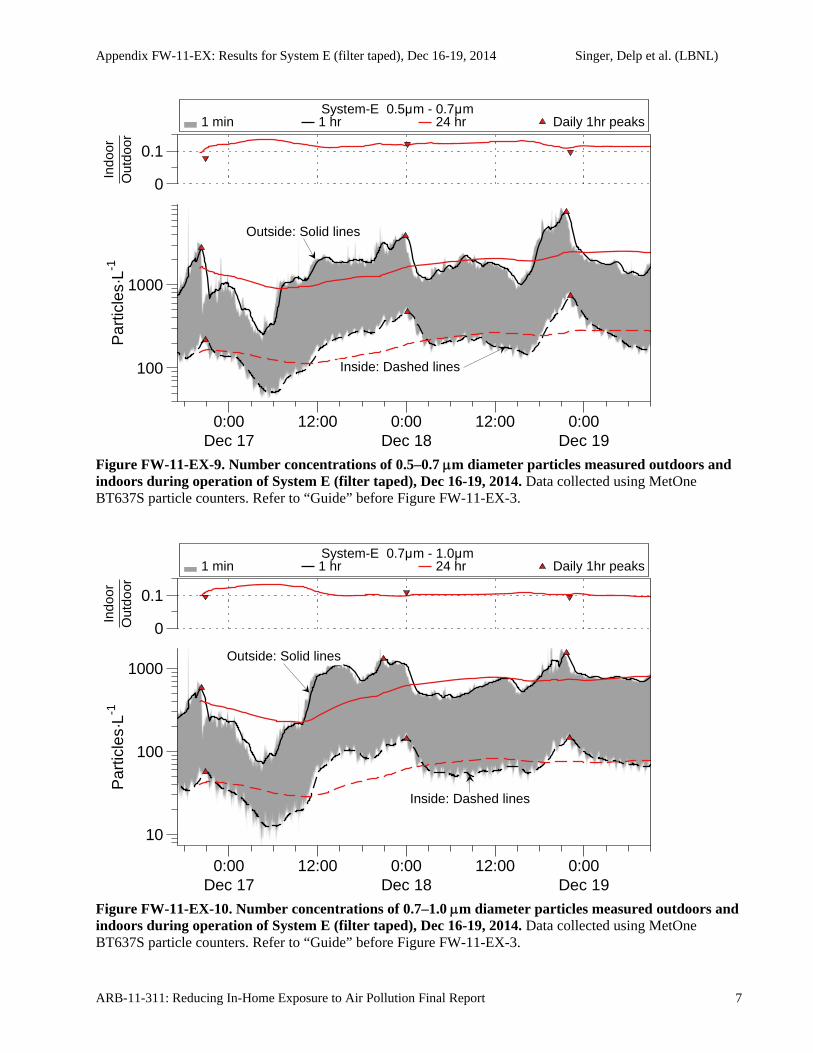
Appendix FW-11-EX: Results for System E (filter taped), Dec 16-19, 2014 Singer, Delp et al. (LBNL)
ARB-11-311: Reducing In-Home Exposure to Air Pollution Final Report 7
Figure FW-11-EX-9. Number concentrations of 0.5–0.7 m diameter particles measured outdoors and indoors during operation of System E (filter taped), Dec 16-19, 2014. Data collected using MetOne BT637S particle counters. Refer to “Guide” before Figure FW-11-EX-3.
Figure FW-11-EX-10. Number concentrations of 0.7–1.0 m diameter particles measured outdoors and indoors during operation of System E (filter taped), Dec 16-19, 2014. Data collected using MetOne BT637S particle counters. Refer to “Guide” before Figure FW-11-EX-3.
1 min 1 hr 24 hr Daily 1hr peaks System-E 0.5μm - 0.7μm
Outside: Solid lines
Inside: Dashed lines
Par
ticle
s·L-1
100
1000
Indo
orO
utdo
or
0
0.1
0:00 12:00 0:00 12:00 0:00Dec 17 Dec 18 Dec 19
1 min 1 hr 24 hr Daily 1hr peaks System-E 0.7μm - 1.0μm
Outside: Solid lines
Inside: Dashed lines
Par
ticle
s·L-1
10
100
1000
Indo
orO
utdo
or
0
0.1
0:00 12:00 0:00 12:00 0:00Dec 17 Dec 18 Dec 19
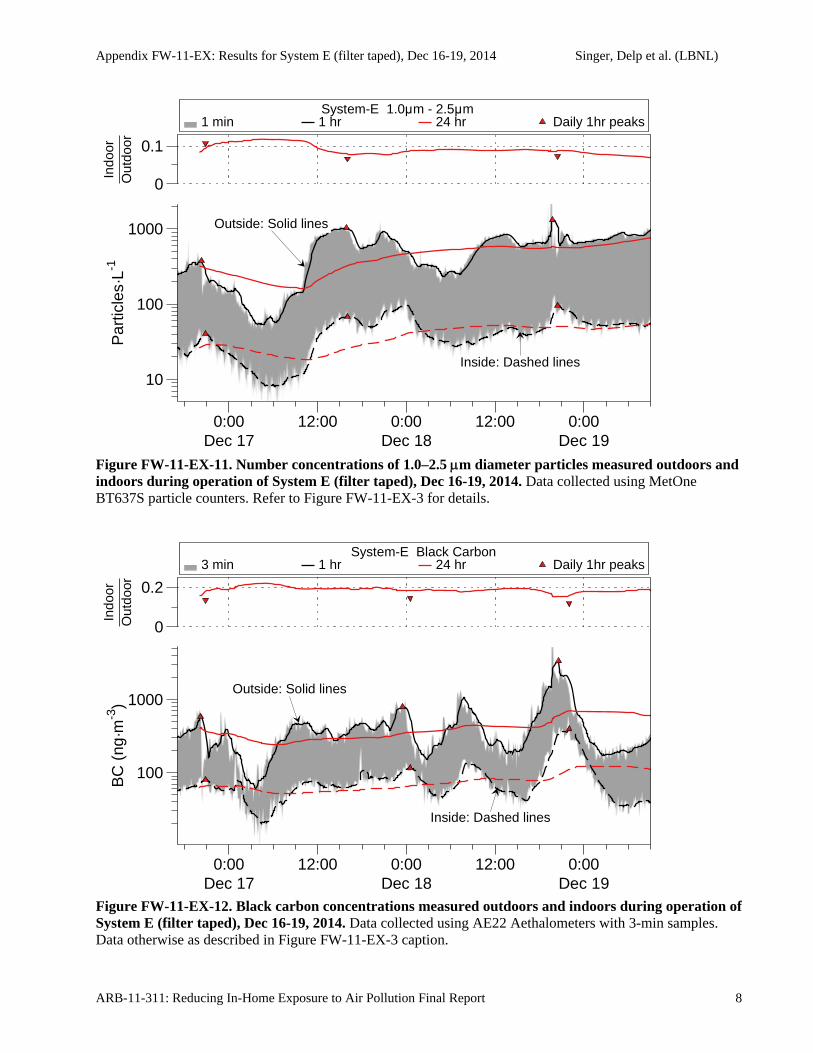
Appendix FW-11-EX: Results for System E (filter taped), Dec 16-19, 2014 Singer, Delp et al. (LBNL)
ARB-11-311: Reducing In-Home Exposure to Air Pollution Final Report 8
Figure FW-11-EX-11. Number concentrations of 1.0–2.5 m diameter particles measured outdoors and indoors during operation of System E (filter taped), Dec 16-19, 2014. Data collected using MetOne BT637S particle counters. Refer to Figure FW-11-EX-3 for details.
Figure FW-11-EX-12. Black carbon concentrations measured outdoors and indoors during operation of System E (filter taped), Dec 16-19, 2014. Data collected using AE22 Aethalometers with 3-min samples. Data otherwise as described in Figure FW-11-EX-3 caption.
1 min 1 hr 24 hr Daily 1hr peaks System-E 1.0μm - 2.5μm
Outside: Solid lines
Inside: Dashed lines
Par
ticle
s·L-1
10
100
1000
Indo
orO
utdo
or
0
0.1
0:00 12:00 0:00 12:00 0:00Dec 17 Dec 18 Dec 19
3 min 1 hr 24 hr Daily 1hr peaks System-E Black Carbon
Outside: Solid lines
Inside: Dashed lines
BC
(ng
·m-3
)
100
1000
Indo
orO
utdo
or
0
0.2
0:00 12:00 0:00 12:00 0:00Dec 17 Dec 18 Dec 19
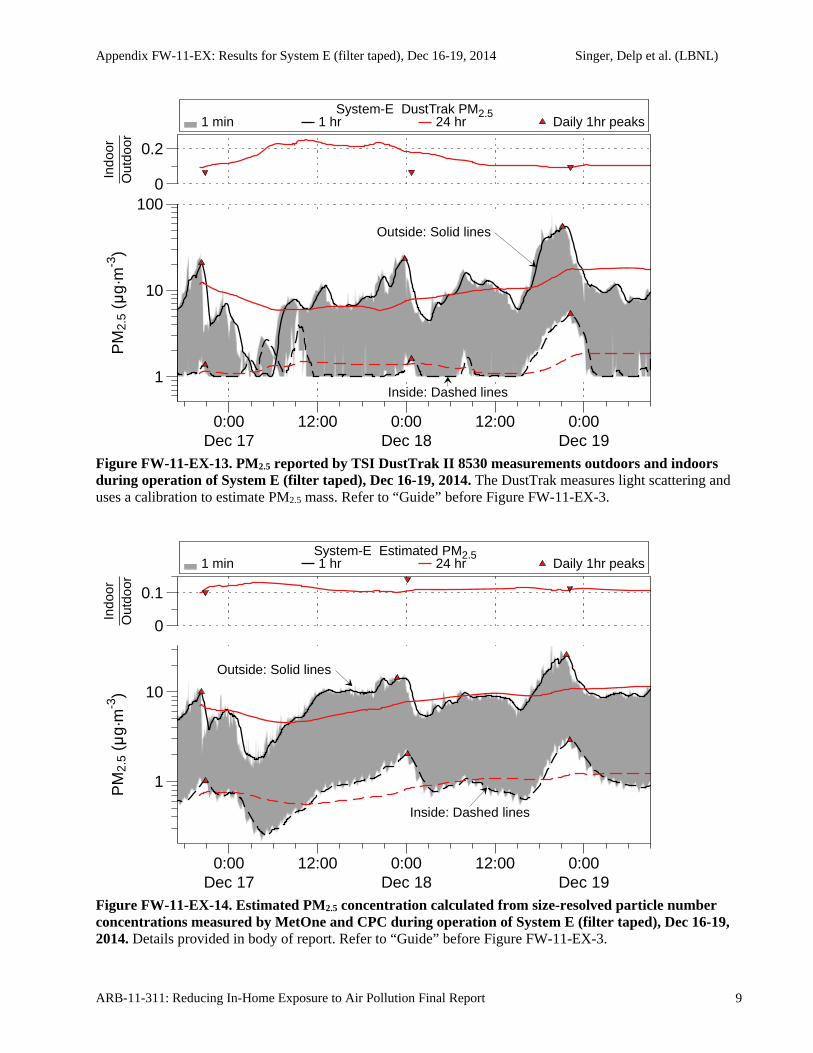
Appendix FW-11-EX: Results for System E (filter taped), Dec 16-19, 2014 Singer, Delp et al. (LBNL)
ARB-11-311: Reducing In-Home Exposure to Air Pollution Final Report 9
Figure FW-11-EX-13. PM2.5 reported by TSI DustTrak II 8530 measurements outdoors and indoors during operation of System E (filter taped), Dec 16-19, 2014. The DustTrak measures light scattering and uses a calibration to estimate PM2.5 mass. Refer to “Guide” before Figure FW-11-EX-3.
Figure FW-11-EX-14. Estimated PM2.5 concentration calculated from size-resolved particle number concentrations measured by MetOne and CPC during operation of System E (filter taped), Dec 16-19, 2014. Details provided in body of report. Refer to “Guide” before Figure FW-11-EX-3.
1 min 1 hr 24 hr Daily 1hr peaks System-E DustTrak PM2.5
1
10
100
Outside: Solid lines
Inside: Dashed lines
PM
2.5
(μg·
m-3
)In
door
Out
door
0
0.2
0:00 12:00 0:00 12:00 0:00Dec 17 Dec 18 Dec 19
1 min 1 hr 24 hr Daily 1hr peaks System-E Estimated PM2.5
Outside: Solid lines
Inside: Dashed lines
PM
2.5
(μg·
m-3
)
1
10
Indo
orO
utdo
or
0
0.1
0:00 12:00 0:00 12:00 0:00Dec 17 Dec 18 Dec 19
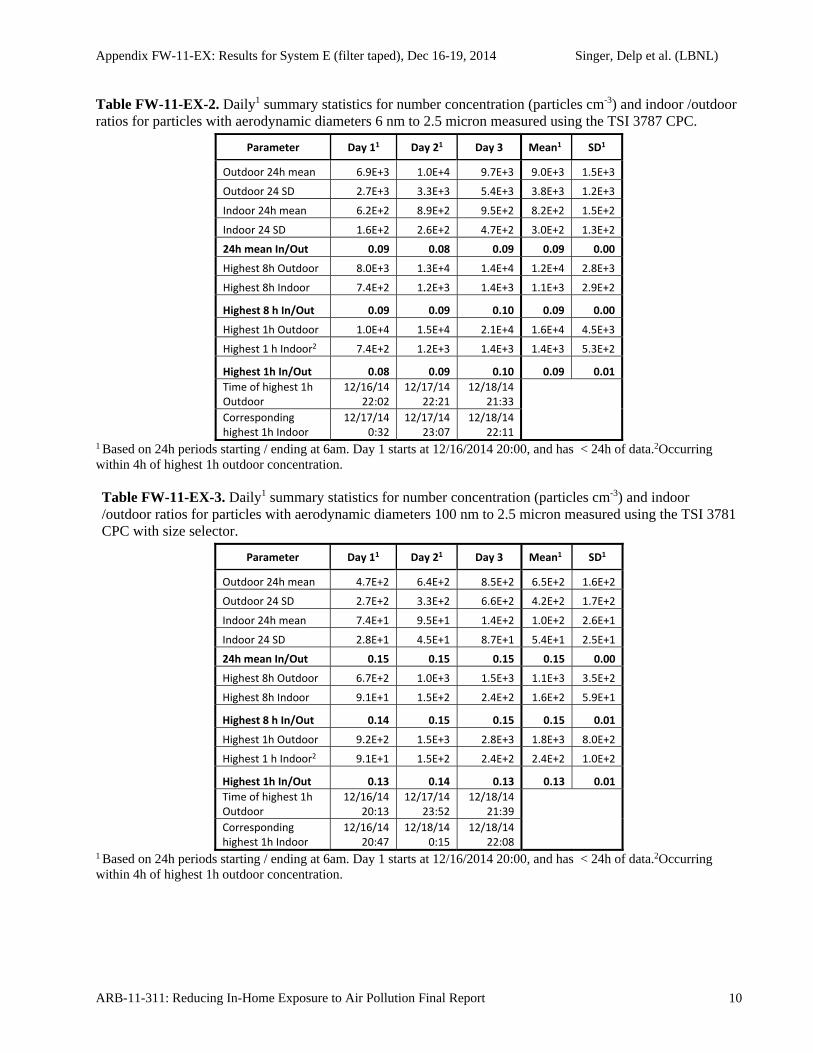
Appendix FW-11-EX: Results for System E (filter taped), Dec 16-19, 2014 Singer, Delp et al. (LBNL)
ARB-11-311: Reducing In-Home Exposure to Air Pollution Final Report 10
Table FW-11-EX-2. Daily1 summary statistics for number concentration (particles cm-3) and indoor /outdoor ratios for particles with aerodynamic diameters 6 nm to 2.5 micron measured using the TSI 3787 CPC.
Parameter Day 11 Day 21 Day 3 Mean1 SD1
Outdoor 24h mean 6.9E+3 1.0E+4 9.7E+3 9.0E+3 1.5E+3
Outdoor 24 SD 2.7E+3 3.3E+3 5.4E+3 3.8E+3 1.2E+3
Indoor 24h mean 6.2E+2 8.9E+2 9.5E+2 8.2E+2 1.5E+2
Indoor 24 SD 1.6E+2 2.6E+2 4.7E+2 3.0E+2 1.3E+2
24h mean In/Out 0.09 0.08 0.09 0.09 0.00
Highest 8h Outdoor 8.0E+3 1.3E+4 1.4E+4 1.2E+4 2.8E+3
Highest 8h Indoor 7.4E+2 1.2E+3 1.4E+3 1.1E+3 2.9E+2
Highest 8 h In/Out 0.09 0.09 0.10 0.09 0.00
Highest 1h Outdoor 1.0E+4 1.5E+4 2.1E+4 1.6E+4 4.5E+3
Highest 1 h Indoor2 7.4E+2 1.2E+3 1.4E+3 1.4E+3 5.3E+2
Highest 1h In/Out 0.08 0.09 0.10 0.09 0.01
Time of highest 1h Outdoor
12/16/14 22:02
12/17/14 22:21
12/18/14 21:33
Corresponding highest 1h Indoor
12/17/14 0:32
12/17/14 23:07
12/18/14 22:11
1 Based on 24h periods starting / ending at 6am. Day 1 starts at 12/16/2014 20:00, and has < 24h of data.2Occurring within 4h of highest 1h outdoor concentration. Table FW-11-EX-3. Daily1 summary statistics for number concentration (particles cm-3) and indoor /outdoor ratios for particles with aerodynamic diameters 100 nm to 2.5 micron measured using the TSI 3781 CPC with size selector.
Parameter Day 11 Day 21 Day 3 Mean1 SD1
Outdoor 24h mean 4.7E+2 6.4E+2 8.5E+2 6.5E+2 1.6E+2
Outdoor 24 SD 2.7E+2 3.3E+2 6.6E+2 4.2E+2 1.7E+2
Indoor 24h mean 7.4E+1 9.5E+1 1.4E+2 1.0E+2 2.6E+1
Indoor 24 SD 2.8E+1 4.5E+1 8.7E+1 5.4E+1 2.5E+1
24h mean In/Out 0.15 0.15 0.15 0.15 0.00
Highest 8h Outdoor 6.7E+2 1.0E+3 1.5E+3 1.1E+3 3.5E+2
Highest 8h Indoor 9.1E+1 1.5E+2 2.4E+2 1.6E+2 5.9E+1
Highest 8 h In/Out 0.14 0.15 0.15 0.15 0.01
Highest 1h Outdoor 9.2E+2 1.5E+3 2.8E+3 1.8E+3 8.0E+2
Highest 1 h Indoor2 9.1E+1 1.5E+2 2.4E+2 2.4E+2 1.0E+2
Highest 1h In/Out 0.13 0.14 0.13 0.13 0.01
Time of highest 1h Outdoor
12/16/14 20:13
12/17/14 23:52
12/18/14 21:39
Corresponding highest 1h Indoor
12/16/14 20:47
12/18/14 0:15
12/18/14 22:08
1 Based on 24h periods starting / ending at 6am. Day 1 starts at 12/16/2014 20:00, and has < 24h of data.2Occurring within 4h of highest 1h outdoor concentration.
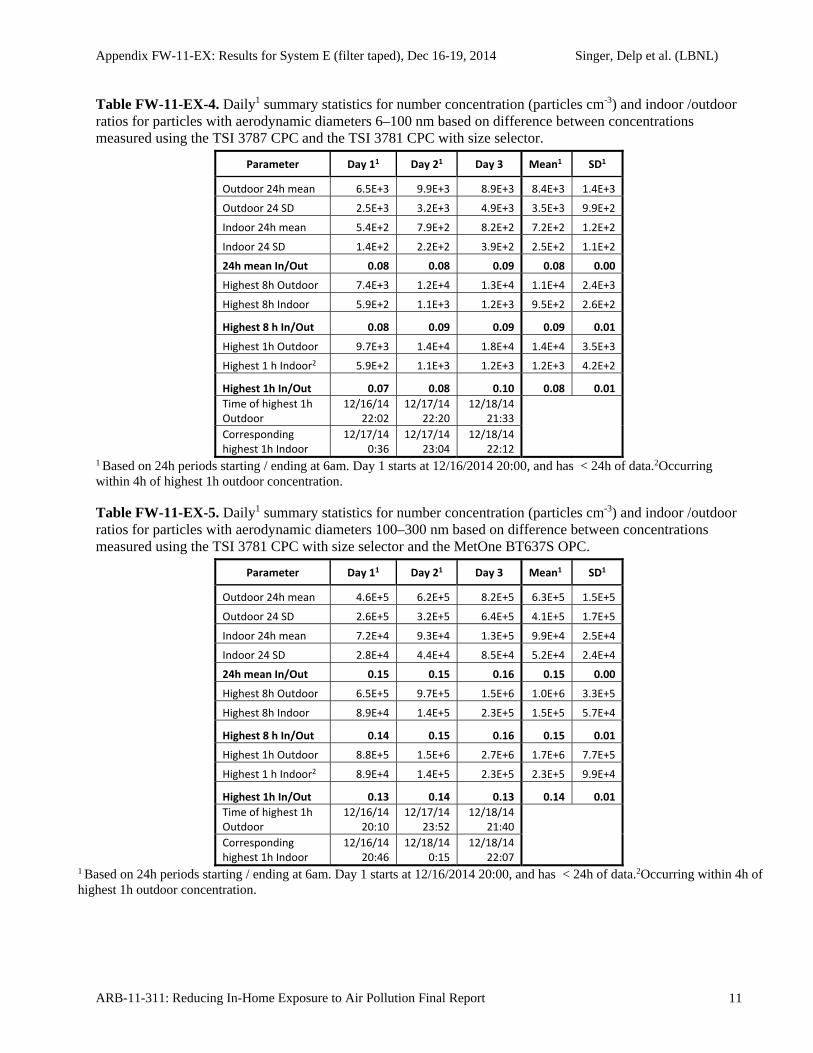
Appendix FW-11-EX: Results for System E (filter taped), Dec 16-19, 2014 Singer, Delp et al. (LBNL)
ARB-11-311: Reducing In-Home Exposure to Air Pollution Final Report 11
Table FW-11-EX-4. Daily1 summary statistics for number concentration (particles cm-3) and indoor /outdoor ratios for particles with aerodynamic diameters 6–100 nm based on difference between concentrations measured using the TSI 3787 CPC and the TSI 3781 CPC with size selector.
Parameter Day 11 Day 21 Day 3 Mean1 SD1
Outdoor 24h mean 6.5E+3 9.9E+3 8.9E+3 8.4E+3 1.4E+3
Outdoor 24 SD 2.5E+3 3.2E+3 4.9E+3 3.5E+3 9.9E+2
Indoor 24h mean 5.4E+2 7.9E+2 8.2E+2 7.2E+2 1.2E+2
Indoor 24 SD 1.4E+2 2.2E+2 3.9E+2 2.5E+2 1.1E+2
24h mean In/Out 0.08 0.08 0.09 0.08 0.00
Highest 8h Outdoor 7.4E+3 1.2E+4 1.3E+4 1.1E+4 2.4E+3
Highest 8h Indoor 5.9E+2 1.1E+3 1.2E+3 9.5E+2 2.6E+2
Highest 8 h In/Out 0.08 0.09 0.09 0.09 0.01
Highest 1h Outdoor 9.7E+3 1.4E+4 1.8E+4 1.4E+4 3.5E+3
Highest 1 h Indoor2 5.9E+2 1.1E+3 1.2E+3 1.2E+3 4.2E+2
Highest 1h In/Out 0.07 0.08 0.10 0.08 0.01
Time of highest 1h Outdoor
12/16/14 22:02
12/17/14 22:20
12/18/14 21:33
Corresponding highest 1h Indoor
12/17/14 0:36
12/17/14 23:04
12/18/14 22:12
1 Based on 24h periods starting / ending at 6am. Day 1 starts at 12/16/2014 20:00, and has < 24h of data.2Occurring within 4h of highest 1h outdoor concentration. Table FW-11-EX-5. Daily1 summary statistics for number concentration (particles cm-3) and indoor /outdoor ratios for particles with aerodynamic diameters 100–300 nm based on difference between concentrations measured using the TSI 3781 CPC with size selector and the MetOne BT637S OPC.
Parameter Day 11 Day 21 Day 3 Mean1 SD1
Outdoor 24h mean 4.6E+5 6.2E+5 8.2E+5 6.3E+5 1.5E+5
Outdoor 24 SD 2.6E+5 3.2E+5 6.4E+5 4.1E+5 1.7E+5
Indoor 24h mean 7.2E+4 9.3E+4 1.3E+5 9.9E+4 2.5E+4
Indoor 24 SD 2.8E+4 4.4E+4 8.5E+4 5.2E+4 2.4E+4
24h mean In/Out 0.15 0.15 0.16 0.15 0.00
Highest 8h Outdoor 6.5E+5 9.7E+5 1.5E+6 1.0E+6 3.3E+5
Highest 8h Indoor 8.9E+4 1.4E+5 2.3E+5 1.5E+5 5.7E+4
Highest 8 h In/Out 0.14 0.15 0.16 0.15 0.01
Highest 1h Outdoor 8.8E+5 1.5E+6 2.7E+6 1.7E+6 7.7E+5
Highest 1 h Indoor2 8.9E+4 1.4E+5 2.3E+5 2.3E+5 9.9E+4
Highest 1h In/Out 0.13 0.14 0.13 0.14 0.01
Time of highest 1h Outdoor
12/16/14 20:10
12/17/14 23:52
12/18/14 21:40
Corresponding highest 1h Indoor
12/16/14 20:46
12/18/14 0:15
12/18/14 22:07
1 Based on 24h periods starting / ending at 6am. Day 1 starts at 12/16/2014 20:00, and has < 24h of data.2Occurring within 4h of highest 1h outdoor concentration.

Appendix FW-11-EX: Results for System E (filter taped), Dec 16-19, 2014 Singer, Delp et al. (LBNL)
ARB-11-311: Reducing In-Home Exposure to Air Pollution Final Report 12
Table FW-11-EX-6. Daily1 summary statistics for number concentration (particles L-1) and indoor /outdoor ratios for particles with aerodynamic diameters 0.3–0.4 microns measured with the MetOne BT637S OPC.
Parameter Day 11 Day 21 Day 3 Mean1 SD1
Outdoor 24h mean 8.9E+3 1.3E+4 2.6E+4 1.6E+4 7.4E+3
Outdoor 24 SD 8.6E+3 6.8E+3 2.1E+4 1.2E+4 6.5E+3
Indoor 24h mean 1.2E+3 1.7E+3 2.9E+3 1.9E+3 7.2E+2
Indoor 24 SD 4.9E+2 9.0E+2 2.0E+3 1.1E+3 6.5E+2
24h mean In/Out 0.12 0.12 0.12 0.12 0.00
Highest 8h Outdoor 1.8E+4 1.8E+4 4.9E+4 2.8E+4 1.5E+4
Highest 8h Indoor 1.5E+3 2.7E+3 5.3E+3 3.2E+3 1.6E+3
Highest 8 h In/Out 0.08 0.15 0.11 0.11 0.03
Highest 1h Outdoor 3.3E+4 3.5E+4 7.9E+4 4.9E+4 2.1E+4
Highest 1 h Indoor2 1.5E+3 2.7E+3 5.3E+3 4.9E+3 2.6E+3
Highest 1h In/Out 0.07 0.12 0.11 0.10 0.02
Time of highest 1h Outdoor
12/16/14 20:15
12/17/14 23:52
12/18/14 21:08
Corresponding highest 1h Indoor
12/16/14 20:53
12/18/14 0:19
12/18/14 22:11
1 Based on 24h periods starting / ending at 6am. Day 1 starts at 12/16/2014 20:00, and has < 24h of data.2Occurring within 4h of highest 1h outdoor concentration. Table FW-11-EX-7. Daily1 summary statistics for number concentration (particles L-1) and indoor /outdoor ratios for particles with aerodynamic diameters 0.4–0.5 microns measured with the MetOne BT637S OPC.
Parameter Day 11 Day 21 Day 3 Mean1 SD1
Outdoor 24h mean 1.4E+3 2.4E+3 4.1E+3 2.6E+3 1.1E+3
Outdoor 24 SD 1.3E+3 1.1E+3 3.5E+3 2.0E+3 1.1E+3
Indoor 24h mean 1.9E+2 3.0E+2 4.4E+2 3.1E+2 1.0E+2
Indoor 24 SD 7.4E+1 1.5E+2 2.8E+2 1.7E+2 8.7E+1
24h mean In/Out 0.13 0.12 0.12 0.12 0.00
Highest 8h Outdoor 2.8E+3 3.3E+3 7.8E+3 4.6E+3 2.3E+3
Highest 8h Indoor 2.5E+2 4.7E+2 7.6E+2 4.9E+2 2.1E+2
Highest 8 h In/Out 0.09 0.14 0.10 0.11 0.02
Highest 1h Outdoor 5.1E+3 5.8E+3 1.4E+4 8.1E+3 3.9E+3
Highest 1 h Indoor2 2.5E+2 4.7E+2 7.6E+2 7.5E+2 3.8E+2
Highest 1h In/Out 0.07 0.12 0.09 0.09 0.02
Time of highest 1h Outdoor
12/16/14 20:16
12/17/14 23:53
12/18/14 21:09
Corresponding highest 1h Indoor
12/16/14 20:49
12/18/14 0:19
12/18/14 22:13
1 Based on 24h periods starting / ending at 6am. Day 1 starts at 12/16/2014 20:00, and has < 24h of data.2Occurring within 4h of highest 1h outdoor concentration.
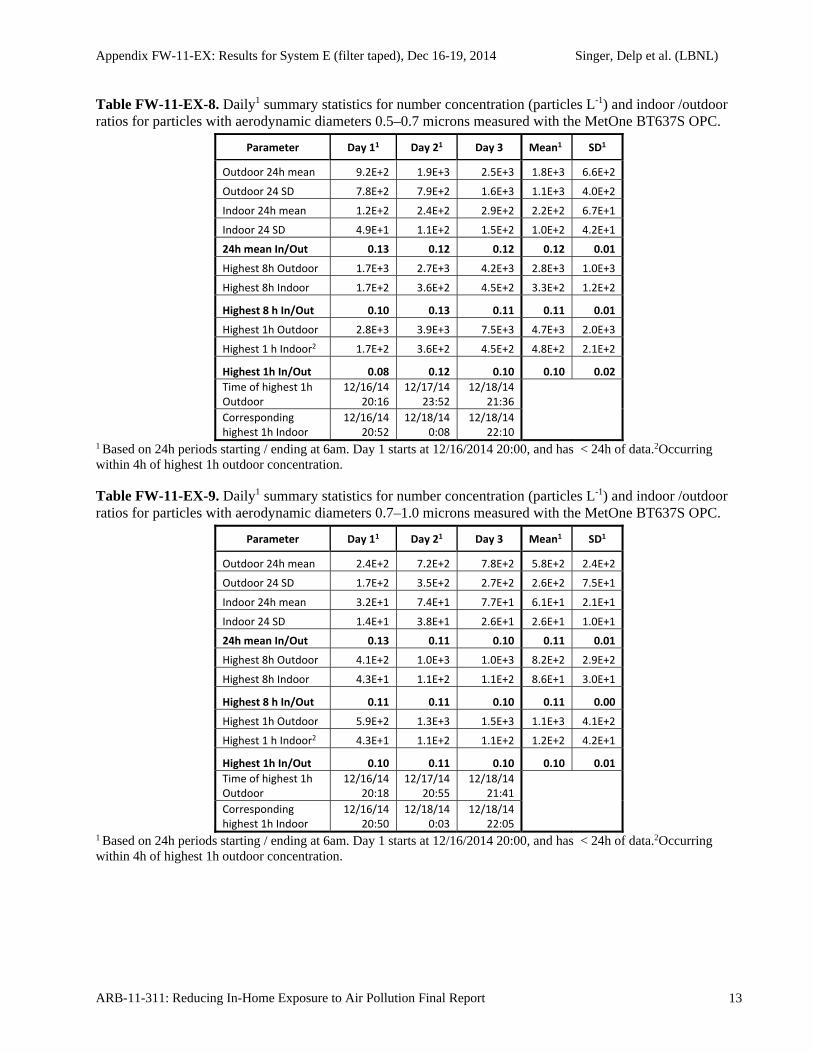
Appendix FW-11-EX: Results for System E (filter taped), Dec 16-19, 2014 Singer, Delp et al. (LBNL)
ARB-11-311: Reducing In-Home Exposure to Air Pollution Final Report 13
Table FW-11-EX-8. Daily1 summary statistics for number concentration (particles L-1) and indoor /outdoor ratios for particles with aerodynamic diameters 0.5–0.7 microns measured with the MetOne BT637S OPC.
Parameter Day 11 Day 21 Day 3 Mean1 SD1
Outdoor 24h mean 9.2E+2 1.9E+3 2.5E+3 1.8E+3 6.6E+2
Outdoor 24 SD 7.8E+2 7.9E+2 1.6E+3 1.1E+3 4.0E+2
Indoor 24h mean 1.2E+2 2.4E+2 2.9E+2 2.2E+2 6.7E+1
Indoor 24 SD 4.9E+1 1.1E+2 1.5E+2 1.0E+2 4.2E+1
24h mean In/Out 0.13 0.12 0.12 0.12 0.01
Highest 8h Outdoor 1.7E+3 2.7E+3 4.2E+3 2.8E+3 1.0E+3
Highest 8h Indoor 1.7E+2 3.6E+2 4.5E+2 3.3E+2 1.2E+2
Highest 8 h In/Out 0.10 0.13 0.11 0.11 0.01
Highest 1h Outdoor 2.8E+3 3.9E+3 7.5E+3 4.7E+3 2.0E+3
Highest 1 h Indoor2 1.7E+2 3.6E+2 4.5E+2 4.8E+2 2.1E+2
Highest 1h In/Out 0.08 0.12 0.10 0.10 0.02
Time of highest 1h Outdoor
12/16/14 20:16
12/17/14 23:52
12/18/14 21:36
Corresponding highest 1h Indoor
12/16/14 20:52
12/18/14 0:08
12/18/14 22:10
1 Based on 24h periods starting / ending at 6am. Day 1 starts at 12/16/2014 20:00, and has < 24h of data.2Occurring within 4h of highest 1h outdoor concentration. Table FW-11-EX-9. Daily1 summary statistics for number concentration (particles L-1) and indoor /outdoor ratios for particles with aerodynamic diameters 0.7–1.0 microns measured with the MetOne BT637S OPC.
Parameter Day 11 Day 21 Day 3 Mean1 SD1
Outdoor 24h mean 2.4E+2 7.2E+2 7.8E+2 5.8E+2 2.4E+2
Outdoor 24 SD 1.7E+2 3.5E+2 2.7E+2 2.6E+2 7.5E+1
Indoor 24h mean 3.2E+1 7.4E+1 7.7E+1 6.1E+1 2.1E+1
Indoor 24 SD 1.4E+1 3.8E+1 2.6E+1 2.6E+1 1.0E+1
24h mean In/Out 0.13 0.11 0.10 0.11 0.01
Highest 8h Outdoor 4.1E+2 1.0E+3 1.0E+3 8.2E+2 2.9E+2
Highest 8h Indoor 4.3E+1 1.1E+2 1.1E+2 8.6E+1 3.0E+1
Highest 8 h In/Out 0.11 0.11 0.10 0.11 0.00
Highest 1h Outdoor 5.9E+2 1.3E+3 1.5E+3 1.1E+3 4.1E+2
Highest 1 h Indoor2 4.3E+1 1.1E+2 1.1E+2 1.2E+2 4.2E+1
Highest 1h In/Out 0.10 0.11 0.10 0.10 0.01
Time of highest 1h Outdoor
12/16/14 20:18
12/17/14 20:55
12/18/14 21:41
Corresponding highest 1h Indoor
12/16/14 20:50
12/18/14 0:03
12/18/14 22:05
1 Based on 24h periods starting / ending at 6am. Day 1 starts at 12/16/2014 20:00, and has < 24h of data.2Occurring within 4h of highest 1h outdoor concentration.
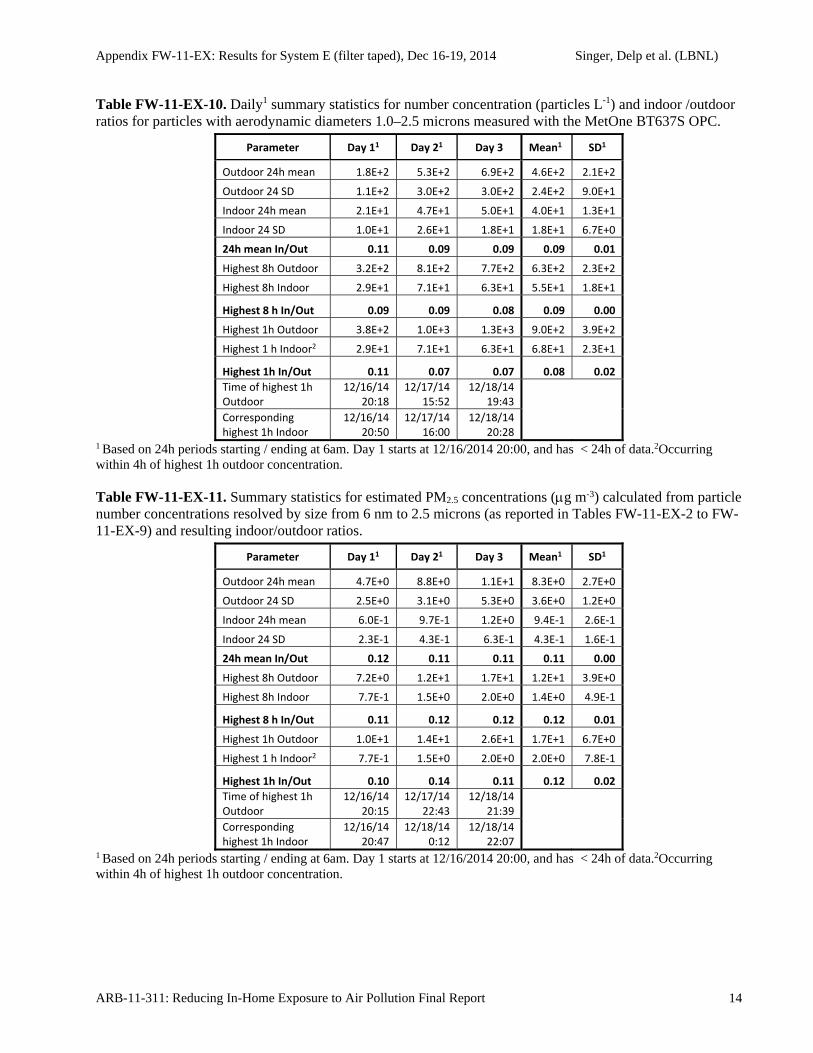
Appendix FW-11-EX: Results for System E (filter taped), Dec 16-19, 2014 Singer, Delp et al. (LBNL)
ARB-11-311: Reducing In-Home Exposure to Air Pollution Final Report 14
Table FW-11-EX-10. Daily1 summary statistics for number concentration (particles L-1) and indoor /outdoor ratios for particles with aerodynamic diameters 1.0–2.5 microns measured with the MetOne BT637S OPC.
Parameter Day 11 Day 21 Day 3 Mean1 SD1
Outdoor 24h mean 1.8E+2 5.3E+2 6.9E+2 4.6E+2 2.1E+2
Outdoor 24 SD 1.1E+2 3.0E+2 3.0E+2 2.4E+2 9.0E+1
Indoor 24h mean 2.1E+1 4.7E+1 5.0E+1 4.0E+1 1.3E+1
Indoor 24 SD 1.0E+1 2.6E+1 1.8E+1 1.8E+1 6.7E+0
24h mean In/Out 0.11 0.09 0.09 0.09 0.01
Highest 8h Outdoor 3.2E+2 8.1E+2 7.7E+2 6.3E+2 2.3E+2
Highest 8h Indoor 2.9E+1 7.1E+1 6.3E+1 5.5E+1 1.8E+1
Highest 8 h In/Out 0.09 0.09 0.08 0.09 0.00
Highest 1h Outdoor 3.8E+2 1.0E+3 1.3E+3 9.0E+2 3.9E+2
Highest 1 h Indoor2 2.9E+1 7.1E+1 6.3E+1 6.8E+1 2.3E+1
Highest 1h In/Out 0.11 0.07 0.07 0.08 0.02
Time of highest 1h Outdoor
12/16/14 20:18
12/17/14 15:52
12/18/14 19:43
Corresponding highest 1h Indoor
12/16/14 20:50
12/17/14 16:00
12/18/14 20:28
1 Based on 24h periods starting / ending at 6am. Day 1 starts at 12/16/2014 20:00, and has < 24h of data.2Occurring within 4h of highest 1h outdoor concentration. Table FW-11-EX-11. Summary statistics for estimated PM2.5 concentrations (g m-3) calculated from particle number concentrations resolved by size from 6 nm to 2.5 microns (as reported in Tables FW-11-EX-2 to FW-11-EX-9) and resulting indoor/outdoor ratios.
Parameter Day 11 Day 21 Day 3 Mean1 SD1
Outdoor 24h mean 4.7E+0 8.8E+0 1.1E+1 8.3E+0 2.7E+0
Outdoor 24 SD 2.5E+0 3.1E+0 5.3E+0 3.6E+0 1.2E+0
Indoor 24h mean 6.0E‐1 9.7E‐1 1.2E+0 9.4E‐1 2.6E‐1
Indoor 24 SD 2.3E‐1 4.3E‐1 6.3E‐1 4.3E‐1 1.6E‐1
24h mean In/Out 0.12 0.11 0.11 0.11 0.00
Highest 8h Outdoor 7.2E+0 1.2E+1 1.7E+1 1.2E+1 3.9E+0
Highest 8h Indoor 7.7E‐1 1.5E+0 2.0E+0 1.4E+0 4.9E‐1
Highest 8 h In/Out 0.11 0.12 0.12 0.12 0.01
Highest 1h Outdoor 1.0E+1 1.4E+1 2.6E+1 1.7E+1 6.7E+0
Highest 1 h Indoor2 7.7E‐1 1.5E+0 2.0E+0 2.0E+0 7.8E‐1
Highest 1h In/Out 0.10 0.14 0.11 0.12 0.02
Time of highest 1h Outdoor
12/16/14 20:15
12/17/14 22:43
12/18/14 21:39
Corresponding highest 1h Indoor
12/16/14 20:47
12/18/14 0:12
12/18/14 22:07
1 Based on 24h periods starting / ending at 6am. Day 1 starts at 12/16/2014 20:00, and has < 24h of data.2Occurring within 4h of highest 1h outdoor concentration.
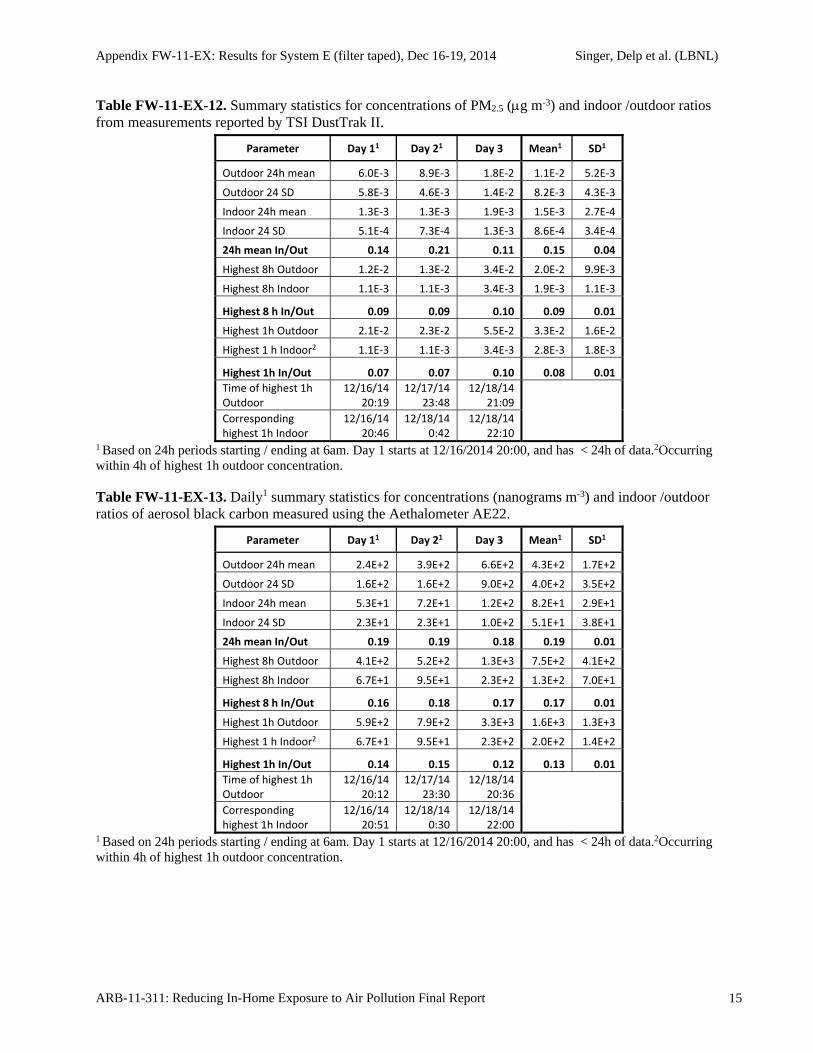
Appendix FW-11-EX: Results for System E (filter taped), Dec 16-19, 2014 Singer, Delp et al. (LBNL)
ARB-11-311: Reducing In-Home Exposure to Air Pollution Final Report 15
Table FW-11-EX-12. Summary statistics for concentrations of PM2.5 (g m-3) and indoor /outdoor ratios from measurements reported by TSI DustTrak II.
Parameter Day 11 Day 21 Day 3 Mean1 SD1
Outdoor 24h mean 6.0E‐3 8.9E‐3 1.8E‐2 1.1E‐2 5.2E‐3
Outdoor 24 SD 5.8E‐3 4.6E‐3 1.4E‐2 8.2E‐3 4.3E‐3
Indoor 24h mean 1.3E‐3 1.3E‐3 1.9E‐3 1.5E‐3 2.7E‐4
Indoor 24 SD 5.1E‐4 7.3E‐4 1.3E‐3 8.6E‐4 3.4E‐4
24h mean In/Out 0.14 0.21 0.11 0.15 0.04
Highest 8h Outdoor 1.2E‐2 1.3E‐2 3.4E‐2 2.0E‐2 9.9E‐3
Highest 8h Indoor 1.1E‐3 1.1E‐3 3.4E‐3 1.9E‐3 1.1E‐3
Highest 8 h In/Out 0.09 0.09 0.10 0.09 0.01
Highest 1h Outdoor 2.1E‐2 2.3E‐2 5.5E‐2 3.3E‐2 1.6E‐2
Highest 1 h Indoor2 1.1E‐3 1.1E‐3 3.4E‐3 2.8E‐3 1.8E‐3
Highest 1h In/Out 0.07 0.07 0.10 0.08 0.01
Time of highest 1h Outdoor
12/16/14 20:19
12/17/14 23:48
12/18/14 21:09
Corresponding highest 1h Indoor
12/16/14 20:46
12/18/14 0:42
12/18/14 22:10
1 Based on 24h periods starting / ending at 6am. Day 1 starts at 12/16/2014 20:00, and has < 24h of data.2Occurring within 4h of highest 1h outdoor concentration. Table FW-11-EX-13. Daily1 summary statistics for concentrations (nanograms m-3) and indoor /outdoor ratios of aerosol black carbon measured using the Aethalometer AE22.
Parameter Day 11 Day 21 Day 3 Mean1 SD1
Outdoor 24h mean 2.4E+2 3.9E+2 6.6E+2 4.3E+2 1.7E+2
Outdoor 24 SD 1.6E+2 1.6E+2 9.0E+2 4.0E+2 3.5E+2
Indoor 24h mean 5.3E+1 7.2E+1 1.2E+2 8.2E+1 2.9E+1
Indoor 24 SD 2.3E+1 2.3E+1 1.0E+2 5.1E+1 3.8E+1
24h mean In/Out 0.19 0.19 0.18 0.19 0.01
Highest 8h Outdoor 4.1E+2 5.2E+2 1.3E+3 7.5E+2 4.1E+2
Highest 8h Indoor 6.7E+1 9.5E+1 2.3E+2 1.3E+2 7.0E+1
Highest 8 h In/Out 0.16 0.18 0.17 0.17 0.01
Highest 1h Outdoor 5.9E+2 7.9E+2 3.3E+3 1.6E+3 1.3E+3
Highest 1 h Indoor2 6.7E+1 9.5E+1 2.3E+2 2.0E+2 1.4E+2
Highest 1h In/Out 0.14 0.15 0.12 0.13 0.01
Time of highest 1h Outdoor
12/16/14 20:12
12/17/14 23:30
12/18/14 20:36
Corresponding highest 1h Indoor
12/16/14 20:51
12/18/14 0:30
12/18/14 22:00
1 Based on 24h periods starting / ending at 6am. Day 1 starts at 12/16/2014 20:00, and has < 24h of data.2Occurring within 4h of highest 1h outdoor concentration.
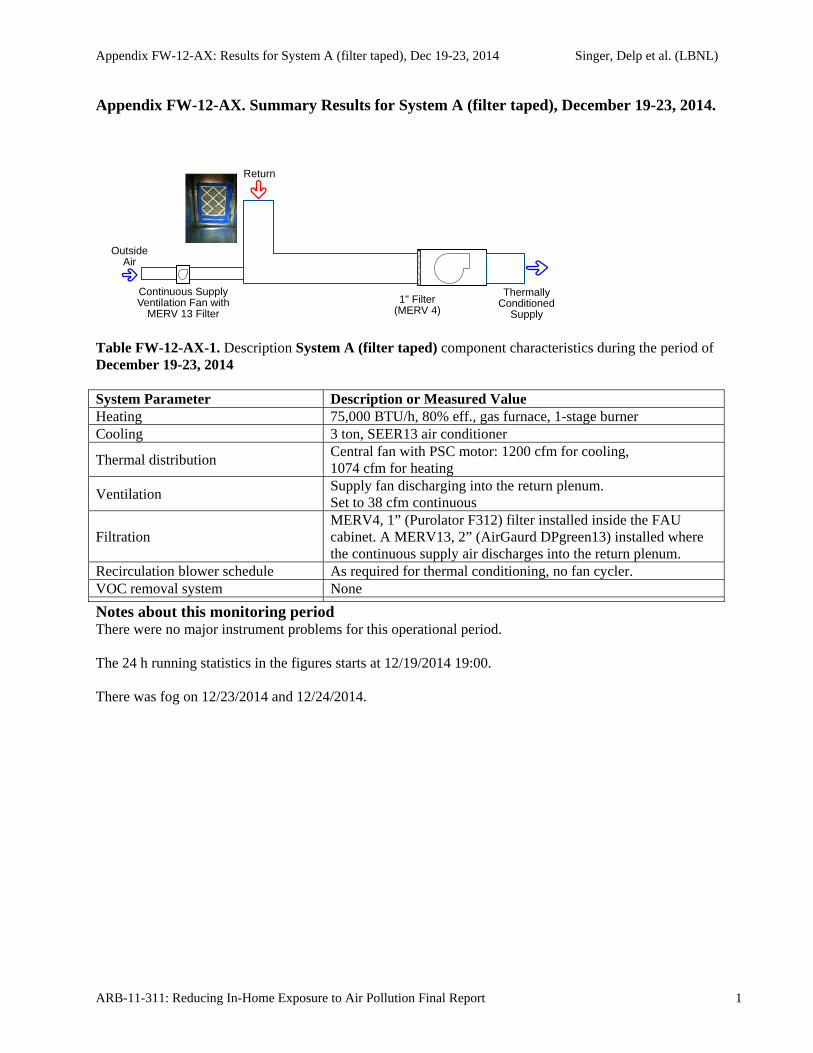
Appendix FW-12-AX: Results for System A (filter taped), Dec 19-23, 2014 Singer, Delp et al. (LBNL)
ARB-11-311: Reducing In-Home Exposure to Air Pollution Final Report 1
Appendix FW-12-AX. Summary Results for System A (filter taped), December 19-23, 2014.
Table FW-12-AX-1. Description System A (filter taped) component characteristics during the period of December 19-23, 2014 System Parameter Description or Measured Value Heating 75,000 BTU/h, 80% eff., gas furnace, 1-stage burner Cooling 3 ton, SEER13 air conditioner
Thermal distribution Central fan with PSC motor: 1200 cfm for cooling, 1074 cfm for heating
Ventilation Supply fan discharging into the return plenum. Set to 38 cfm continuous
Filtration MERV4, 1” (Purolator F312) filter installed inside the FAU cabinet. A MERV13, 2” (AirGaurd DPgreen13) installed where the continuous supply air discharges into the return plenum.
Recirculation blower schedule As required for thermal conditioning, no fan cycler. VOC removal system None
Notes about this monitoring period There were no major instrument problems for this operational period. The 24 h running statistics in the figures starts at 12/19/2014 19:00. There was fog on 12/23/2014 and 12/24/2014.
OutsideAir
ThermallyConditioned
Supply
Continuous SupplyVentilation Fan with
MERV 13 Filter1" Filter
(MERV 4)
Return
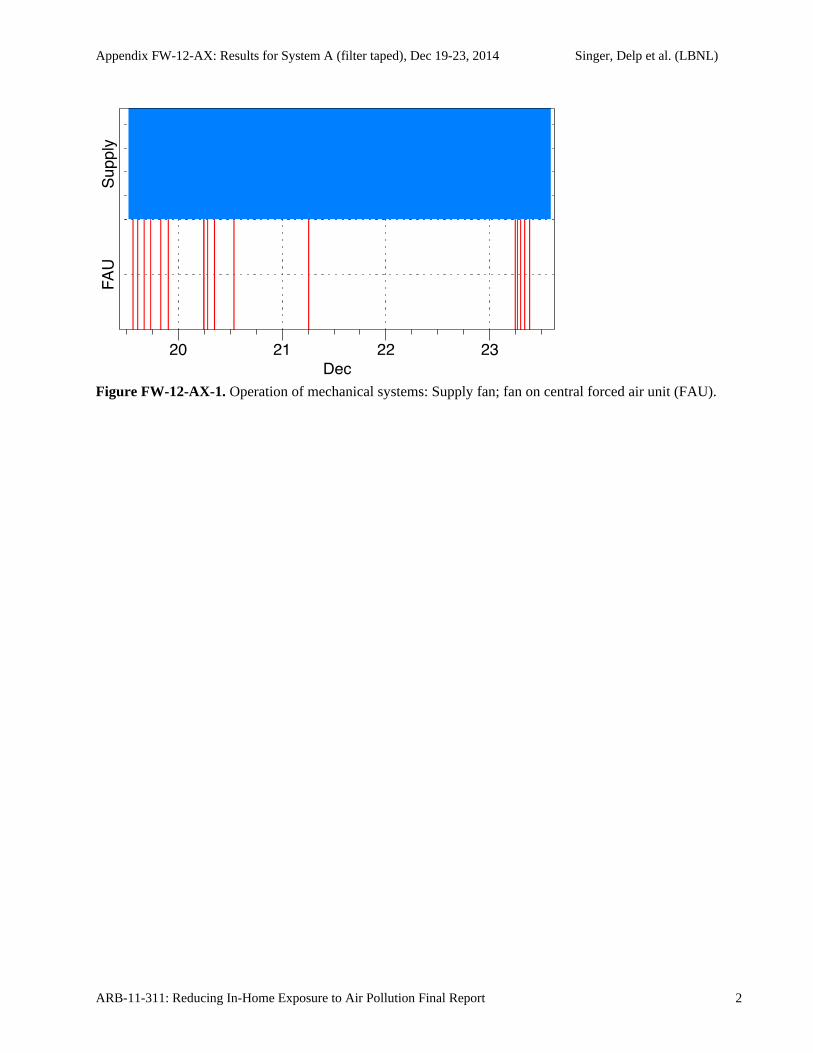
Appendix FW-12-AX: Results for System A (filter taped), Dec 19-23, 2014 Singer, Delp et al. (LBNL)
ARB-11-311: Reducing In-Home Exposure to Air Pollution Final Report 2
Figure FW-12-AX-1. Operation of mechanical systems: Supply fan; fan on central forced air unit (FAU).
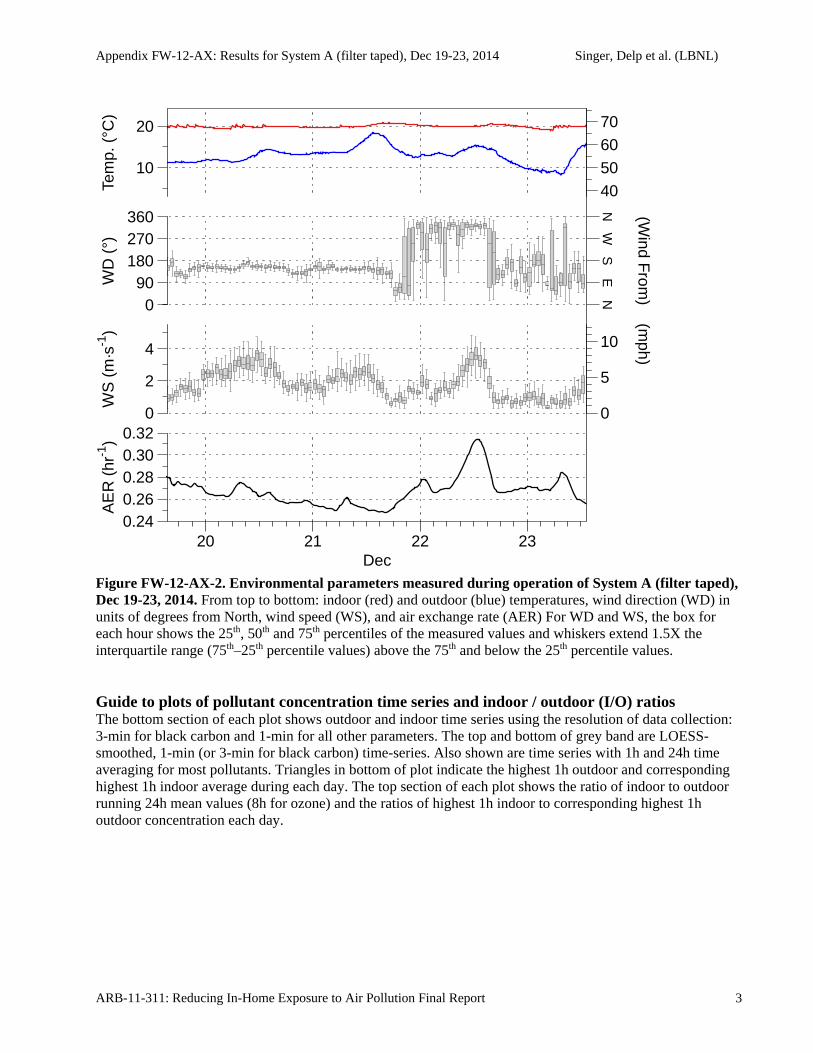
Appendix FW-12-AX: Results for System A (filter taped), Dec 19-23, 2014 Singer, Delp et al. (LBNL)
ARB-11-311: Reducing In-Home Exposure to Air Pollution Final Report 3
Figure FW-12-AX-2. Environmental parameters measured during operation of System A (filter taped), Dec 19-23, 2014. From top to bottom: indoor (red) and outdoor (blue) temperatures, wind direction (WD) in units of degrees from North, wind speed (WS), and air exchange rate (AER) For WD and WS, the box for each hour shows the 25th, 50th and 75th percentiles of the measured values and whiskers extend 1.5X the interquartile range (75th–25th percentile values) above the 75th and below the 25th percentile values. Guide to plots of pollutant concentration time series and indoor / outdoor (I/O) ratios The bottom section of each plot shows outdoor and indoor time series using the resolution of data collection: 3-min for black carbon and 1-min for all other parameters. The top and bottom of grey band are LOESS-smoothed, 1-min (or 3-min for black carbon) time-series. Also shown are time series with 1h and 24h time averaging for most pollutants. Triangles in bottom of plot indicate the highest 1h outdoor and corresponding highest 1h indoor average during each day. The top section of each plot shows the ratio of indoor to outdoor running 24h mean values (8h for ozone) and the ratios of highest 1h indoor to corresponding highest 1h outdoor concentration each day.
0
5
10
40506070
NE
SW
N
(mph)
(Wind F
rom)
AE
R (
hr-1
)
0.240.260.280.300.32
WS
(m
·s-1
)
0
2
4
WD
(°)
090
180270360
Tem
p. (
°C)
10
20
20 21 22 23Dec
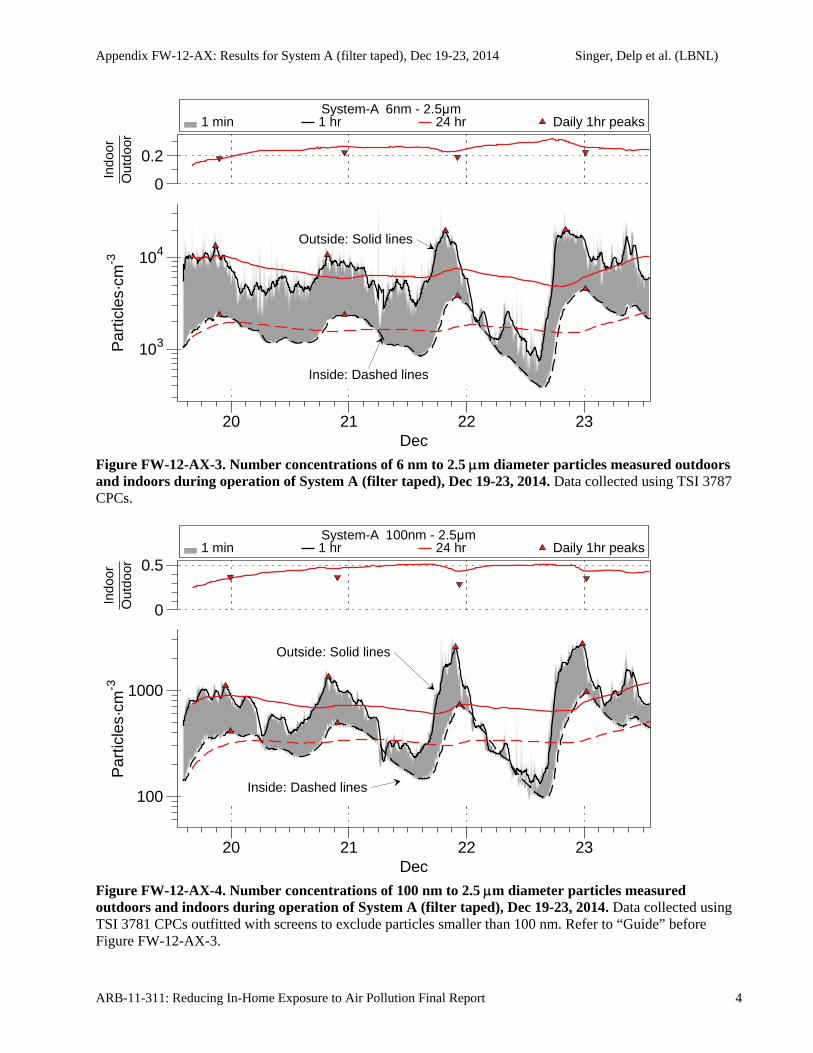
Appendix FW-12-AX: Results for System A (filter taped), Dec 19-23, 2014 Singer, Delp et al. (LBNL)
ARB-11-311: Reducing In-Home Exposure to Air Pollution Final Report 4
Figure FW-12-AX-3. Number concentrations of 6 nm to 2.5 m diameter particles measured outdoors and indoors during operation of System A (filter taped), Dec 19-23, 2014. Data collected using TSI 3787 CPCs.
Figure FW-12-AX-4. Number concentrations of 100 nm to 2.5 m diameter particles measured outdoors and indoors during operation of System A (filter taped), Dec 19-23, 2014. Data collected using TSI 3781 CPCs outfitted with screens to exclude particles smaller than 100 nm. Refer to “Guide” before Figure FW-12-AX-3.
1 min 1 hr 24 hr Daily 1hr peaks System-A 6nm - 2.5μm
Outside: Solid lines
Inside: Dashed lines
Par
ticle
s·cm
-3
103
104
Indo
orO
utdo
or
0
0.2
20 21 22 23Dec
1 min 1 hr 24 hr Daily 1hr peaks System-A 100nm - 2.5μm
Outside: Solid lines
Inside: Dashed lines
Par
ticle
s·cm
-3
100
1000
Indo
orO
utdo
or
0
0.5
20 21 22 23Dec
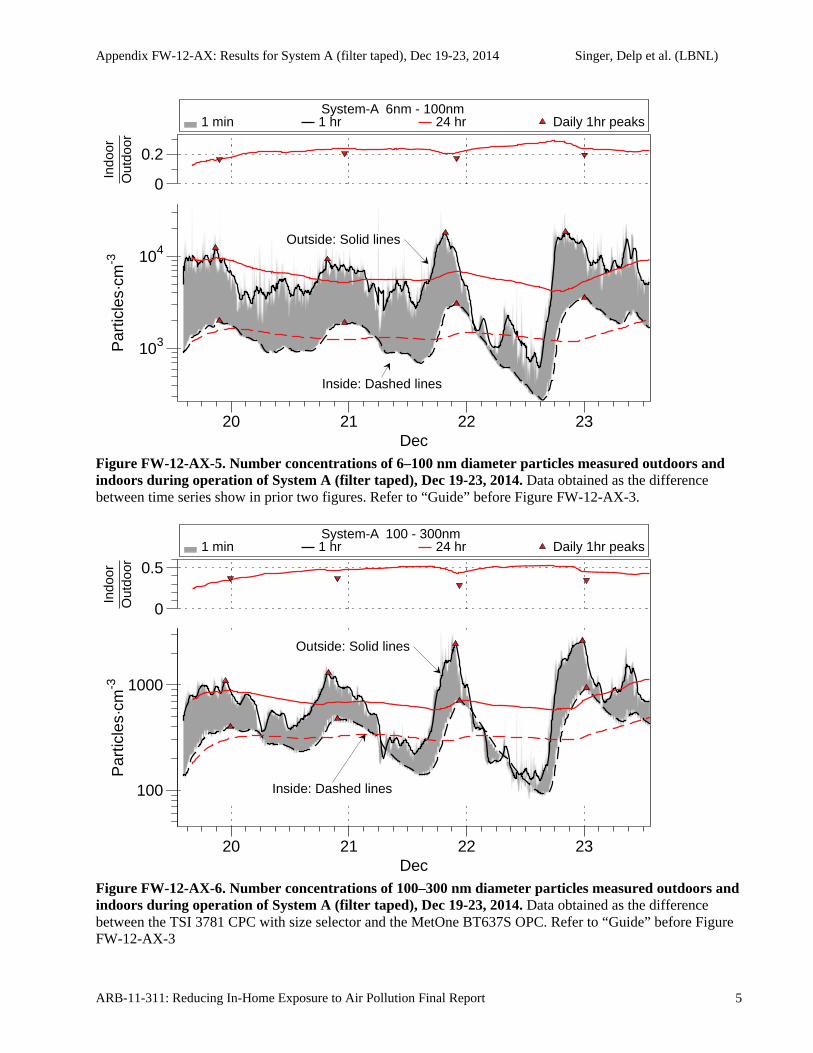
Appendix FW-12-AX: Results for System A (filter taped), Dec 19-23, 2014 Singer, Delp et al. (LBNL)
ARB-11-311: Reducing In-Home Exposure to Air Pollution Final Report 5
Figure FW-12-AX-5. Number concentrations of 6–100 nm diameter particles measured outdoors and indoors during operation of System A (filter taped), Dec 19-23, 2014. Data obtained as the difference between time series show in prior two figures. Refer to “Guide” before Figure FW-12-AX-3.
Figure FW-12-AX-6. Number concentrations of 100–300 nm diameter particles measured outdoors and indoors during operation of System A (filter taped), Dec 19-23, 2014. Data obtained as the difference between the TSI 3781 CPC with size selector and the MetOne BT637S OPC. Refer to “Guide” before Figure FW-12-AX-3
1 min 1 hr 24 hr Daily 1hr peaks System-A 6nm - 100nm
Outside: Solid lines
Inside: Dashed lines
Par
ticle
s·cm
-3
103
104
Indo
orO
utdo
or
0
0.2
20 21 22 23Dec
1 min 1 hr 24 hr Daily 1hr peaks System-A 100 - 300nm
Outside: Solid lines
Inside: Dashed lines100
1000
Par
ticle
s·cm
-3In
door
Out
door
0
0.5
20 21 22 23Dec
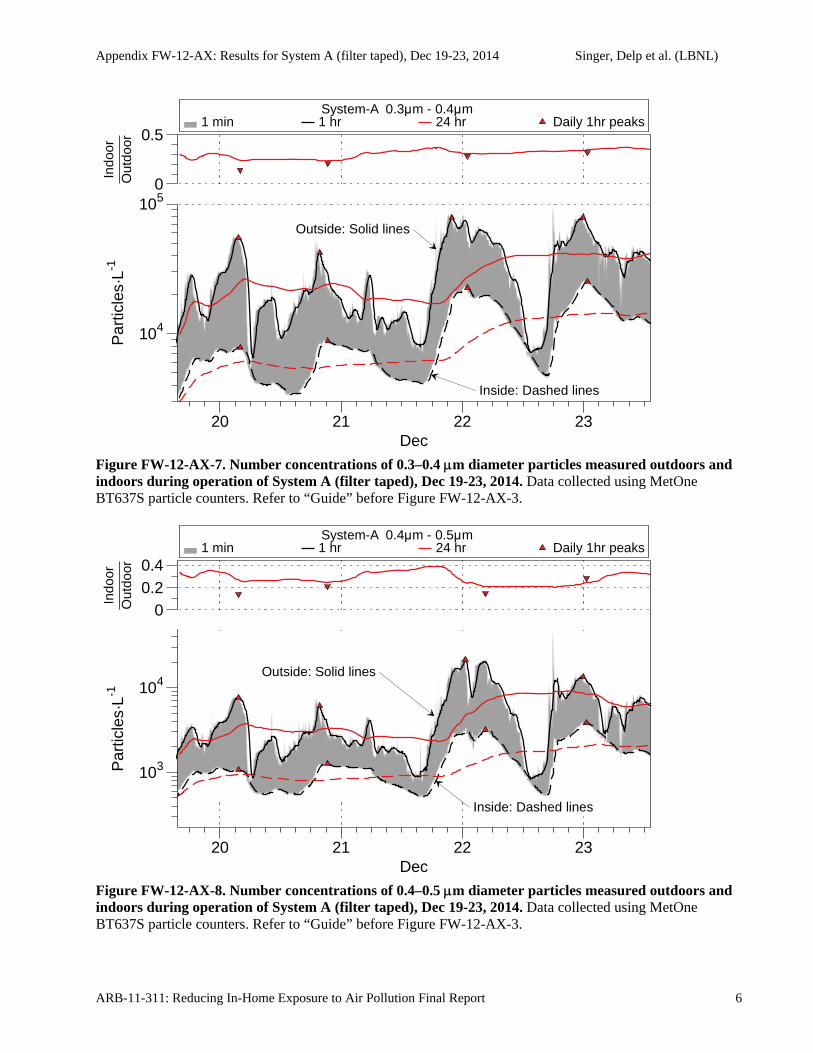
Appendix FW-12-AX: Results for System A (filter taped), Dec 19-23, 2014 Singer, Delp et al. (LBNL)
ARB-11-311: Reducing In-Home Exposure to Air Pollution Final Report 6
Figure FW-12-AX-7. Number concentrations of 0.3–0.4 m diameter particles measured outdoors and indoors during operation of System A (filter taped), Dec 19-23, 2014. Data collected using MetOne BT637S particle counters. Refer to “Guide” before Figure FW-12-AX-3.
Figure FW-12-AX-8. Number concentrations of 0.4–0.5 m diameter particles measured outdoors and indoors during operation of System A (filter taped), Dec 19-23, 2014. Data collected using MetOne BT637S particle counters. Refer to “Guide” before Figure FW-12-AX-3.
1 min 1 hr 24 hr Daily 1hr peaks System-A 0.3μm - 0.4μm
Outside: Solid lines
Inside: Dashed lines
Par
ticle
s·L-1
104
105
Indo
orO
utdo
or
0
0.5
20 21 22 23Dec
1 min 1 hr 24 hr Daily 1hr peaks System-A 0.4μm - 0.5μm
Outside: Solid lines
Inside: Dashed lines
Par
ticle
s·L-1
103
104
Indo
orO
utdo
or
00.20.4
20 21 22 23Dec
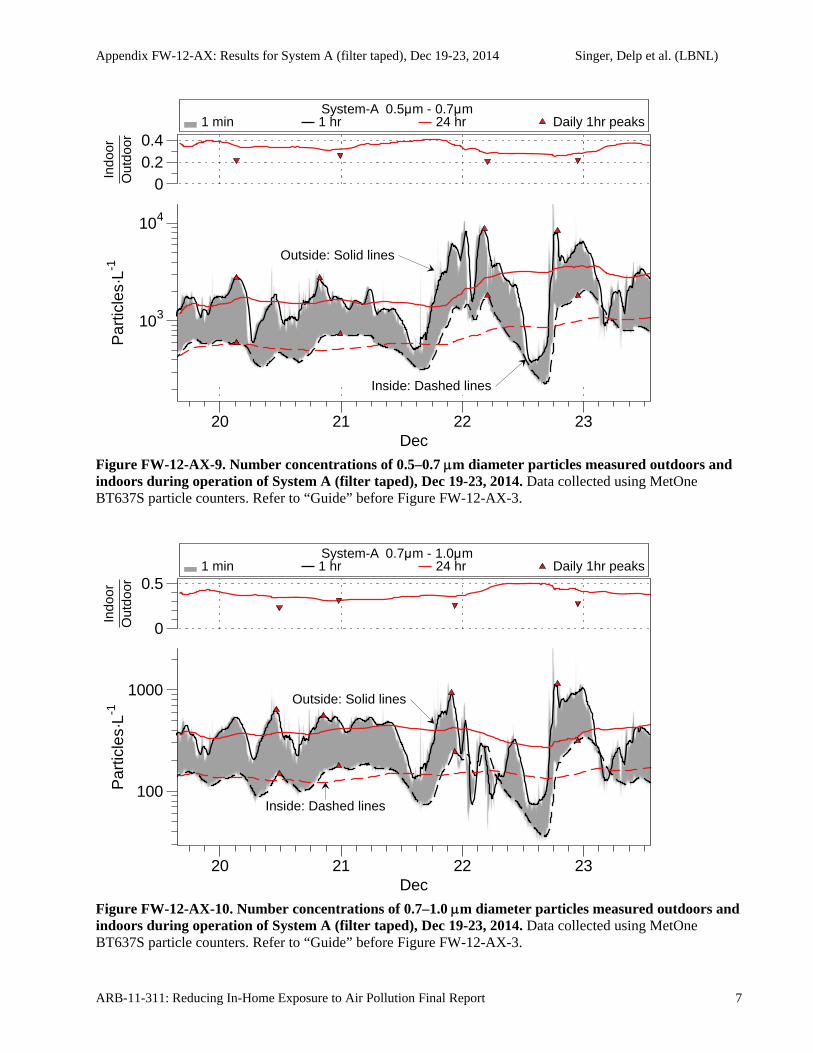
Appendix FW-12-AX: Results for System A (filter taped), Dec 19-23, 2014 Singer, Delp et al. (LBNL)
ARB-11-311: Reducing In-Home Exposure to Air Pollution Final Report 7
Figure FW-12-AX-9. Number concentrations of 0.5–0.7 m diameter particles measured outdoors and indoors during operation of System A (filter taped), Dec 19-23, 2014. Data collected using MetOne BT637S particle counters. Refer to “Guide” before Figure FW-12-AX-3.
Figure FW-12-AX-10. Number concentrations of 0.7–1.0 m diameter particles measured outdoors and indoors during operation of System A (filter taped), Dec 19-23, 2014. Data collected using MetOne BT637S particle counters. Refer to “Guide” before Figure FW-12-AX-3.
1 min 1 hr 24 hr Daily 1hr peaks System-A 0.5μm - 0.7μm
Outside: Solid lines
Inside: Dashed lines
Par
ticle
s·L-1
103
104
Indo
orO
utdo
or
00.20.4
20 21 22 23Dec
1 min 1 hr 24 hr Daily 1hr peaks System-A 0.7μm - 1.0μm
Outside: Solid lines
Inside: Dashed lines
Par
ticle
s·L-1
100
1000
Indo
orO
utdo
or
0
0.5
20 21 22 23Dec
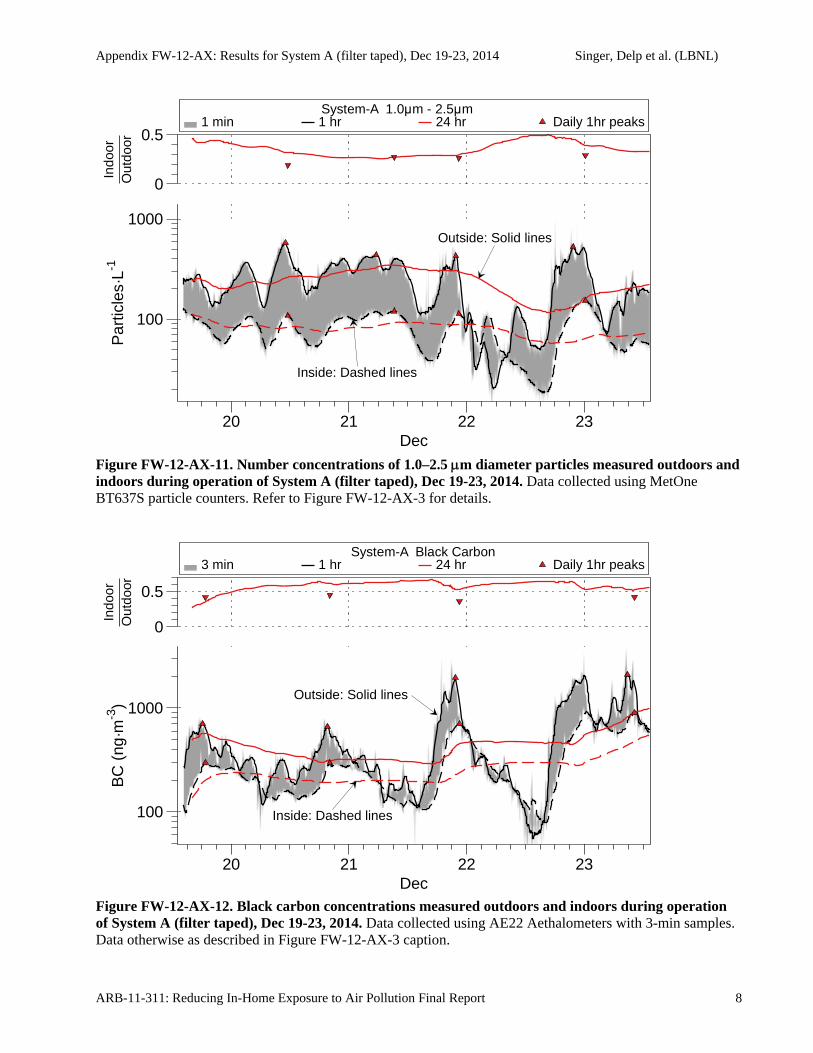
Appendix FW-12-AX: Results for System A (filter taped), Dec 19-23, 2014 Singer, Delp et al. (LBNL)
ARB-11-311: Reducing In-Home Exposure to Air Pollution Final Report 8
Figure FW-12-AX-11. Number concentrations of 1.0–2.5 m diameter particles measured outdoors and indoors during operation of System A (filter taped), Dec 19-23, 2014. Data collected using MetOne BT637S particle counters. Refer to Figure FW-12-AX-3 for details.
Figure FW-12-AX-12. Black carbon concentrations measured outdoors and indoors during operation of System A (filter taped), Dec 19-23, 2014. Data collected using AE22 Aethalometers with 3-min samples. Data otherwise as described in Figure FW-12-AX-3 caption.
1 min 1 hr 24 hr Daily 1hr peaks System-A 1.0μm - 2.5μm
Outside: Solid lines
Inside: Dashed lines
Par
ticle
s·L-1
100
1000
Indo
orO
utdo
or
0
0.5
20 21 22 23Dec
3 min 1 hr 24 hr Daily 1hr peaks System-A Black Carbon
Outside: Solid lines
Inside: Dashed lines
BC
(ng
·m-3
)
100
1000
Indo
orO
utdo
or
0
0.5
20 21 22 23Dec
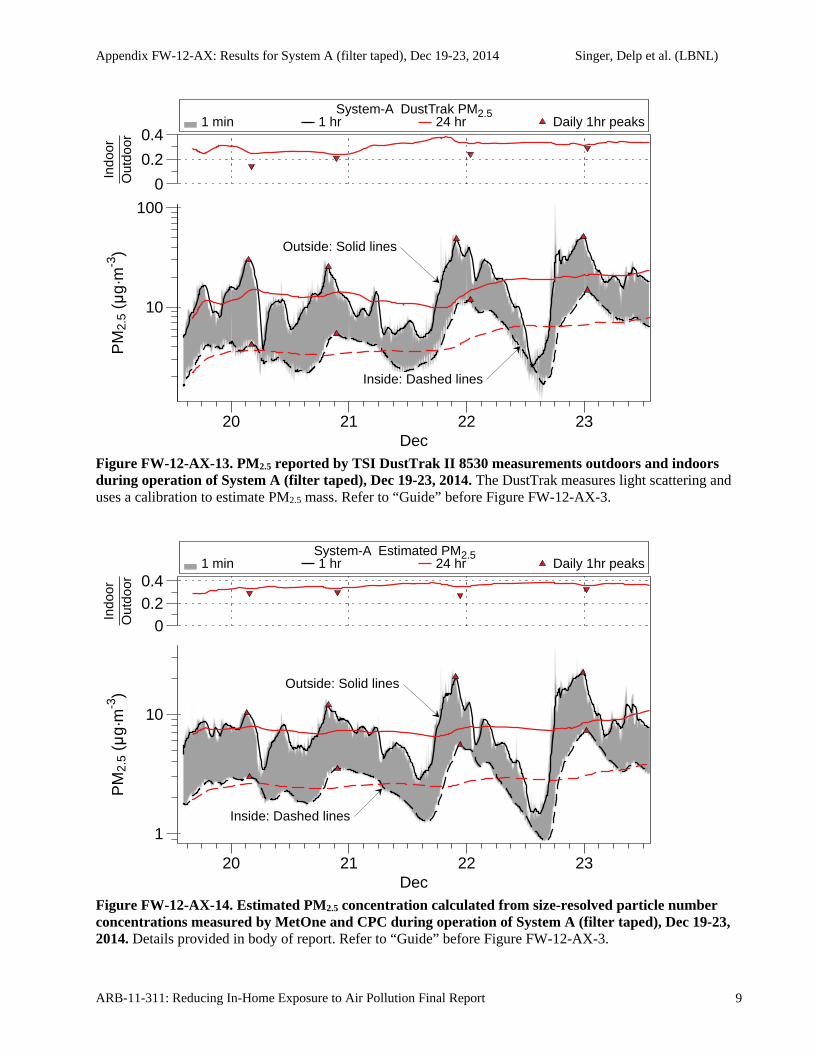
Appendix FW-12-AX: Results for System A (filter taped), Dec 19-23, 2014 Singer, Delp et al. (LBNL)
ARB-11-311: Reducing In-Home Exposure to Air Pollution Final Report 9
Figure FW-12-AX-13. PM2.5 reported by TSI DustTrak II 8530 measurements outdoors and indoors during operation of System A (filter taped), Dec 19-23, 2014. The DustTrak measures light scattering and uses a calibration to estimate PM2.5 mass. Refer to “Guide” before Figure FW-12-AX-3.
Figure FW-12-AX-14. Estimated PM2.5 concentration calculated from size-resolved particle number concentrations measured by MetOne and CPC during operation of System A (filter taped), Dec 19-23, 2014. Details provided in body of report. Refer to “Guide” before Figure FW-12-AX-3.
1 min 1 hr 24 hr Daily 1hr peaks System-A DustTrak PM2.5
10
100
Outside: Solid lines
Inside: Dashed lines
PM
2.5
(μg·
m-3
)In
door
Out
door
0
0.2
0.4
20 21 22 23Dec
1 min 1 hr 24 hr Daily 1hr peaks System-A Estimated PM2.5
Outside: Solid lines
Inside: Dashed lines
PM
2.5
(μg·
m-3
)
1
10
Indo
orO
utdo
or
00.20.4
20 21 22 23Dec
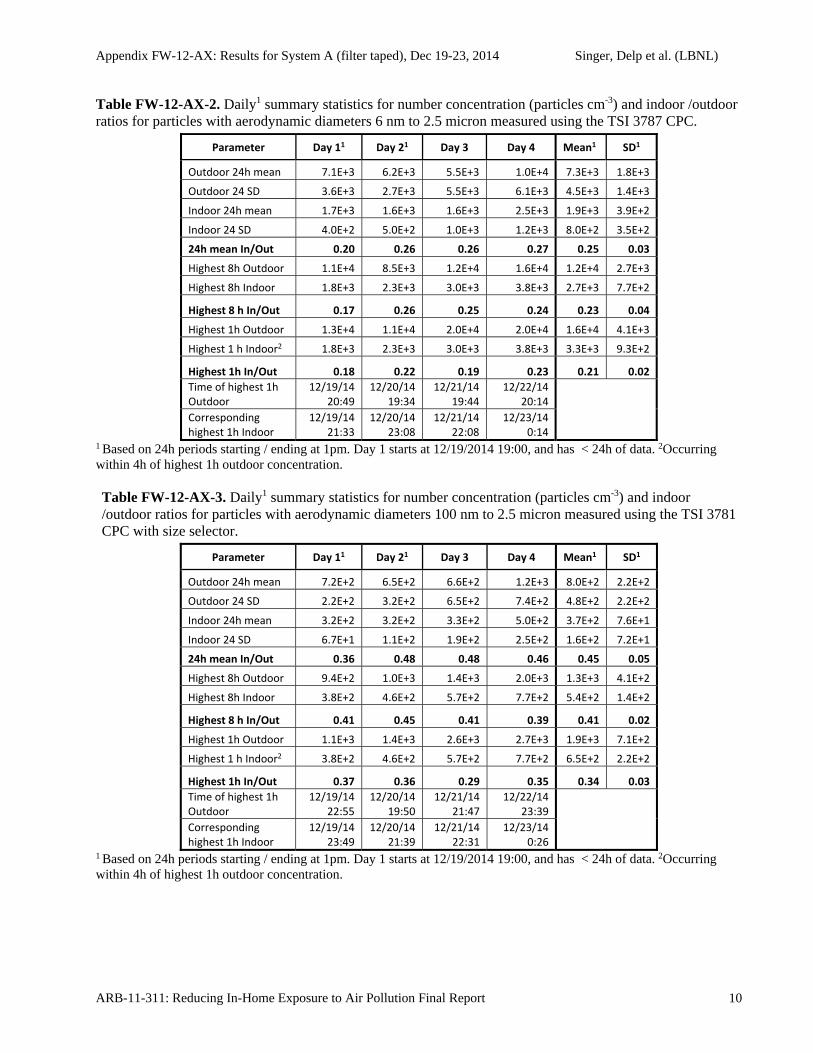
Appendix FW-12-AX: Results for System A (filter taped), Dec 19-23, 2014 Singer, Delp et al. (LBNL)
ARB-11-311: Reducing In-Home Exposure to Air Pollution Final Report 10
Table FW-12-AX-2. Daily1 summary statistics for number concentration (particles cm-3) and indoor /outdoor ratios for particles with aerodynamic diameters 6 nm to 2.5 micron measured using the TSI 3787 CPC.
Parameter Day 11 Day 21 Day 3 Day 4 Mean1 SD1
Outdoor 24h mean 7.1E+3 6.2E+3 5.5E+3 1.0E+4 7.3E+3 1.8E+3
Outdoor 24 SD 3.6E+3 2.7E+3 5.5E+3 6.1E+3 4.5E+3 1.4E+3
Indoor 24h mean 1.7E+3 1.6E+3 1.6E+3 2.5E+3 1.9E+3 3.9E+2
Indoor 24 SD 4.0E+2 5.0E+2 1.0E+3 1.2E+3 8.0E+2 3.5E+2
24h mean In/Out 0.20 0.26 0.26 0.27 0.25 0.03
Highest 8h Outdoor 1.1E+4 8.5E+3 1.2E+4 1.6E+4 1.2E+4 2.7E+3
Highest 8h Indoor 1.8E+3 2.3E+3 3.0E+3 3.8E+3 2.7E+3 7.7E+2
Highest 8 h In/Out 0.17 0.26 0.25 0.24 0.23 0.04
Highest 1h Outdoor 1.3E+4 1.1E+4 2.0E+4 2.0E+4 1.6E+4 4.1E+3
Highest 1 h Indoor2 1.8E+3 2.3E+3 3.0E+3 3.8E+3 3.3E+3 9.3E+2
Highest 1h In/Out 0.18 0.22 0.19 0.23 0.21 0.02
Time of highest 1h Outdoor
12/19/14 20:49
12/20/14 19:34
12/21/14 19:44
12/22/14 20:14
Corresponding highest 1h Indoor
12/19/14 21:33
12/20/14 23:08
12/21/14 22:08
12/23/14 0:14
1 Based on 24h periods starting / ending at 1pm. Day 1 starts at 12/19/2014 19:00, and has < 24h of data. 2Occurring within 4h of highest 1h outdoor concentration. Table FW-12-AX-3. Daily1 summary statistics for number concentration (particles cm-3) and indoor /outdoor ratios for particles with aerodynamic diameters 100 nm to 2.5 micron measured using the TSI 3781 CPC with size selector.
Parameter Day 11 Day 21 Day 3 Day 4 Mean1 SD1
Outdoor 24h mean 7.2E+2 6.5E+2 6.6E+2 1.2E+3 8.0E+2 2.2E+2
Outdoor 24 SD 2.2E+2 3.2E+2 6.5E+2 7.4E+2 4.8E+2 2.2E+2
Indoor 24h mean 3.2E+2 3.2E+2 3.3E+2 5.0E+2 3.7E+2 7.6E+1
Indoor 24 SD 6.7E+1 1.1E+2 1.9E+2 2.5E+2 1.6E+2 7.2E+1
24h mean In/Out 0.36 0.48 0.48 0.46 0.45 0.05
Highest 8h Outdoor 9.4E+2 1.0E+3 1.4E+3 2.0E+3 1.3E+3 4.1E+2
Highest 8h Indoor 3.8E+2 4.6E+2 5.7E+2 7.7E+2 5.4E+2 1.4E+2
Highest 8 h In/Out 0.41 0.45 0.41 0.39 0.41 0.02
Highest 1h Outdoor 1.1E+3 1.4E+3 2.6E+3 2.7E+3 1.9E+3 7.1E+2
Highest 1 h Indoor2 3.8E+2 4.6E+2 5.7E+2 7.7E+2 6.5E+2 2.2E+2
Highest 1h In/Out 0.37 0.36 0.29 0.35 0.34 0.03
Time of highest 1h Outdoor
12/19/14 22:55
12/20/14 19:50
12/21/14 21:47
12/22/14 23:39
Corresponding highest 1h Indoor
12/19/14 23:49
12/20/14 21:39
12/21/14 22:31
12/23/14 0:26
1 Based on 24h periods starting / ending at 1pm. Day 1 starts at 12/19/2014 19:00, and has < 24h of data. 2Occurring within 4h of highest 1h outdoor concentration.
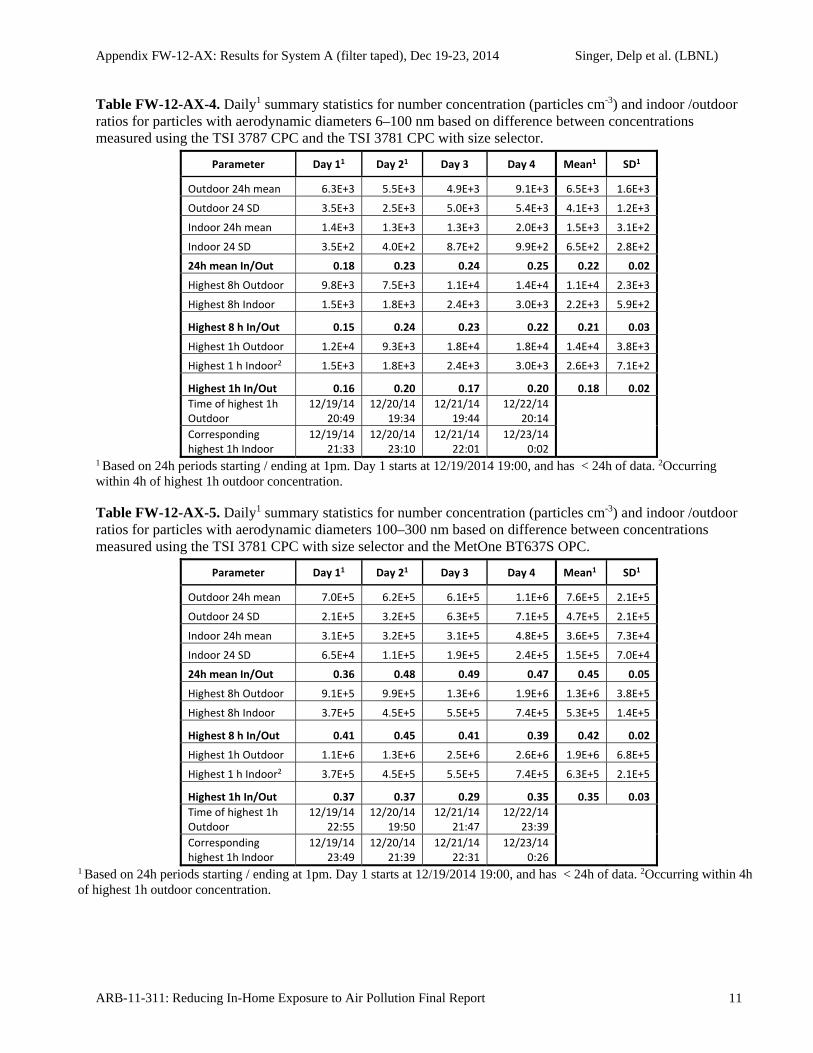
Appendix FW-12-AX: Results for System A (filter taped), Dec 19-23, 2014 Singer, Delp et al. (LBNL)
ARB-11-311: Reducing In-Home Exposure to Air Pollution Final Report 11
Table FW-12-AX-4. Daily1 summary statistics for number concentration (particles cm-3) and indoor /outdoor ratios for particles with aerodynamic diameters 6–100 nm based on difference between concentrations measured using the TSI 3787 CPC and the TSI 3781 CPC with size selector.
Parameter Day 11 Day 21 Day 3 Day 4 Mean1 SD1
Outdoor 24h mean 6.3E+3 5.5E+3 4.9E+3 9.1E+3 6.5E+3 1.6E+3
Outdoor 24 SD 3.5E+3 2.5E+3 5.0E+3 5.4E+3 4.1E+3 1.2E+3
Indoor 24h mean 1.4E+3 1.3E+3 1.3E+3 2.0E+3 1.5E+3 3.1E+2
Indoor 24 SD 3.5E+2 4.0E+2 8.7E+2 9.9E+2 6.5E+2 2.8E+2
24h mean In/Out 0.18 0.23 0.24 0.25 0.22 0.02
Highest 8h Outdoor 9.8E+3 7.5E+3 1.1E+4 1.4E+4 1.1E+4 2.3E+3
Highest 8h Indoor 1.5E+3 1.8E+3 2.4E+3 3.0E+3 2.2E+3 5.9E+2
Highest 8 h In/Out 0.15 0.24 0.23 0.22 0.21 0.03
Highest 1h Outdoor 1.2E+4 9.3E+3 1.8E+4 1.8E+4 1.4E+4 3.8E+3
Highest 1 h Indoor2 1.5E+3 1.8E+3 2.4E+3 3.0E+3 2.6E+3 7.1E+2
Highest 1h In/Out 0.16 0.20 0.17 0.20 0.18 0.02
Time of highest 1h Outdoor
12/19/14 20:49
12/20/14 19:34
12/21/14 19:44
12/22/14 20:14
Corresponding highest 1h Indoor
12/19/14 21:33
12/20/14 23:10
12/21/14 22:01
12/23/14 0:02
1 Based on 24h periods starting / ending at 1pm. Day 1 starts at 12/19/2014 19:00, and has < 24h of data. 2Occurring within 4h of highest 1h outdoor concentration. Table FW-12-AX-5. Daily1 summary statistics for number concentration (particles cm-3) and indoor /outdoor ratios for particles with aerodynamic diameters 100–300 nm based on difference between concentrations measured using the TSI 3781 CPC with size selector and the MetOne BT637S OPC.
Parameter Day 11 Day 21 Day 3 Day 4 Mean1 SD1
Outdoor 24h mean 7.0E+5 6.2E+5 6.1E+5 1.1E+6 7.6E+5 2.1E+5
Outdoor 24 SD 2.1E+5 3.2E+5 6.3E+5 7.1E+5 4.7E+5 2.1E+5
Indoor 24h mean 3.1E+5 3.2E+5 3.1E+5 4.8E+5 3.6E+5 7.3E+4
Indoor 24 SD 6.5E+4 1.1E+5 1.9E+5 2.4E+5 1.5E+5 7.0E+4
24h mean In/Out 0.36 0.48 0.49 0.47 0.45 0.05
Highest 8h Outdoor 9.1E+5 9.9E+5 1.3E+6 1.9E+6 1.3E+6 3.8E+5
Highest 8h Indoor 3.7E+5 4.5E+5 5.5E+5 7.4E+5 5.3E+5 1.4E+5
Highest 8 h In/Out 0.41 0.45 0.41 0.39 0.42 0.02
Highest 1h Outdoor 1.1E+6 1.3E+6 2.5E+6 2.6E+6 1.9E+6 6.8E+5
Highest 1 h Indoor2 3.7E+5 4.5E+5 5.5E+5 7.4E+5 6.3E+5 2.1E+5
Highest 1h In/Out 0.37 0.37 0.29 0.35 0.35 0.03
Time of highest 1h Outdoor
12/19/14 22:55
12/20/14 19:50
12/21/14 21:47
12/22/14 23:39
Corresponding highest 1h Indoor
12/19/14 23:49
12/20/14 21:39
12/21/14 22:31
12/23/14 0:26
1 Based on 24h periods starting / ending at 1pm. Day 1 starts at 12/19/2014 19:00, and has < 24h of data. 2Occurring within 4h of highest 1h outdoor concentration.
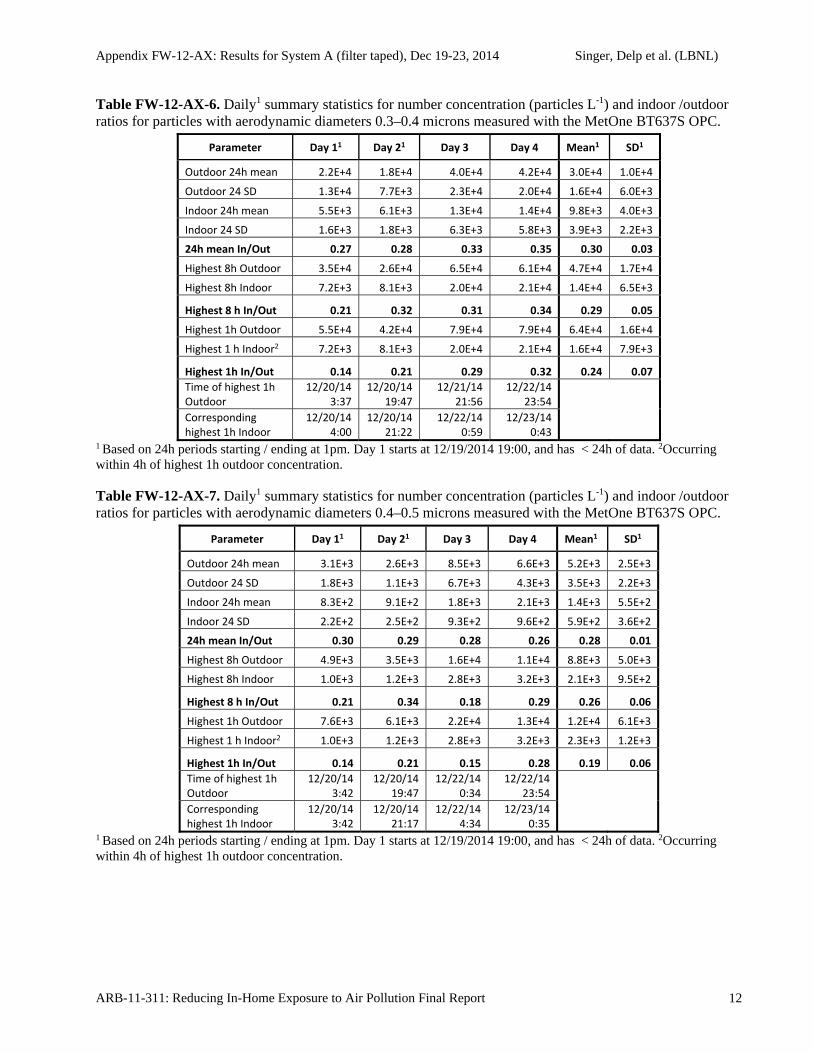
Appendix FW-12-AX: Results for System A (filter taped), Dec 19-23, 2014 Singer, Delp et al. (LBNL)
ARB-11-311: Reducing In-Home Exposure to Air Pollution Final Report 12
Table FW-12-AX-6. Daily1 summary statistics for number concentration (particles L-1) and indoor /outdoor ratios for particles with aerodynamic diameters 0.3–0.4 microns measured with the MetOne BT637S OPC.
Parameter Day 11 Day 21 Day 3 Day 4 Mean1 SD1
Outdoor 24h mean 2.2E+4 1.8E+4 4.0E+4 4.2E+4 3.0E+4 1.0E+4
Outdoor 24 SD 1.3E+4 7.7E+3 2.3E+4 2.0E+4 1.6E+4 6.0E+3
Indoor 24h mean 5.5E+3 6.1E+3 1.3E+4 1.4E+4 9.8E+3 4.0E+3
Indoor 24 SD 1.6E+3 1.8E+3 6.3E+3 5.8E+3 3.9E+3 2.2E+3
24h mean In/Out 0.27 0.28 0.33 0.35 0.30 0.03
Highest 8h Outdoor 3.5E+4 2.6E+4 6.5E+4 6.1E+4 4.7E+4 1.7E+4
Highest 8h Indoor 7.2E+3 8.1E+3 2.0E+4 2.1E+4 1.4E+4 6.5E+3
Highest 8 h In/Out 0.21 0.32 0.31 0.34 0.29 0.05
Highest 1h Outdoor 5.5E+4 4.2E+4 7.9E+4 7.9E+4 6.4E+4 1.6E+4
Highest 1 h Indoor2 7.2E+3 8.1E+3 2.0E+4 2.1E+4 1.6E+4 7.9E+3
Highest 1h In/Out 0.14 0.21 0.29 0.32 0.24 0.07
Time of highest 1h Outdoor
12/20/14 3:37
12/20/14 19:47
12/21/14 21:56
12/22/14 23:54
Corresponding highest 1h Indoor
12/20/14 4:00
12/20/14 21:22
12/22/14 0:59
12/23/14 0:43
1 Based on 24h periods starting / ending at 1pm. Day 1 starts at 12/19/2014 19:00, and has < 24h of data. 2Occurring within 4h of highest 1h outdoor concentration. Table FW-12-AX-7. Daily1 summary statistics for number concentration (particles L-1) and indoor /outdoor ratios for particles with aerodynamic diameters 0.4–0.5 microns measured with the MetOne BT637S OPC.
Parameter Day 11 Day 21 Day 3 Day 4 Mean1 SD1
Outdoor 24h mean 3.1E+3 2.6E+3 8.5E+3 6.6E+3 5.2E+3 2.5E+3
Outdoor 24 SD 1.8E+3 1.1E+3 6.7E+3 4.3E+3 3.5E+3 2.2E+3
Indoor 24h mean 8.3E+2 9.1E+2 1.8E+3 2.1E+3 1.4E+3 5.5E+2
Indoor 24 SD 2.2E+2 2.5E+2 9.3E+2 9.6E+2 5.9E+2 3.6E+2
24h mean In/Out 0.30 0.29 0.28 0.26 0.28 0.01
Highest 8h Outdoor 4.9E+3 3.5E+3 1.6E+4 1.1E+4 8.8E+3 5.0E+3
Highest 8h Indoor 1.0E+3 1.2E+3 2.8E+3 3.2E+3 2.1E+3 9.5E+2
Highest 8 h In/Out 0.21 0.34 0.18 0.29 0.26 0.06
Highest 1h Outdoor 7.6E+3 6.1E+3 2.2E+4 1.3E+4 1.2E+4 6.1E+3
Highest 1 h Indoor2 1.0E+3 1.2E+3 2.8E+3 3.2E+3 2.3E+3 1.2E+3
Highest 1h In/Out 0.14 0.21 0.15 0.28 0.19 0.06
Time of highest 1h Outdoor
12/20/14 3:42
12/20/14 19:47
12/22/14 0:34
12/22/14 23:54
Corresponding highest 1h Indoor
12/20/14 3:42
12/20/14 21:17
12/22/14 4:34
12/23/14 0:35
1 Based on 24h periods starting / ending at 1pm. Day 1 starts at 12/19/2014 19:00, and has < 24h of data. 2Occurring within 4h of highest 1h outdoor concentration.
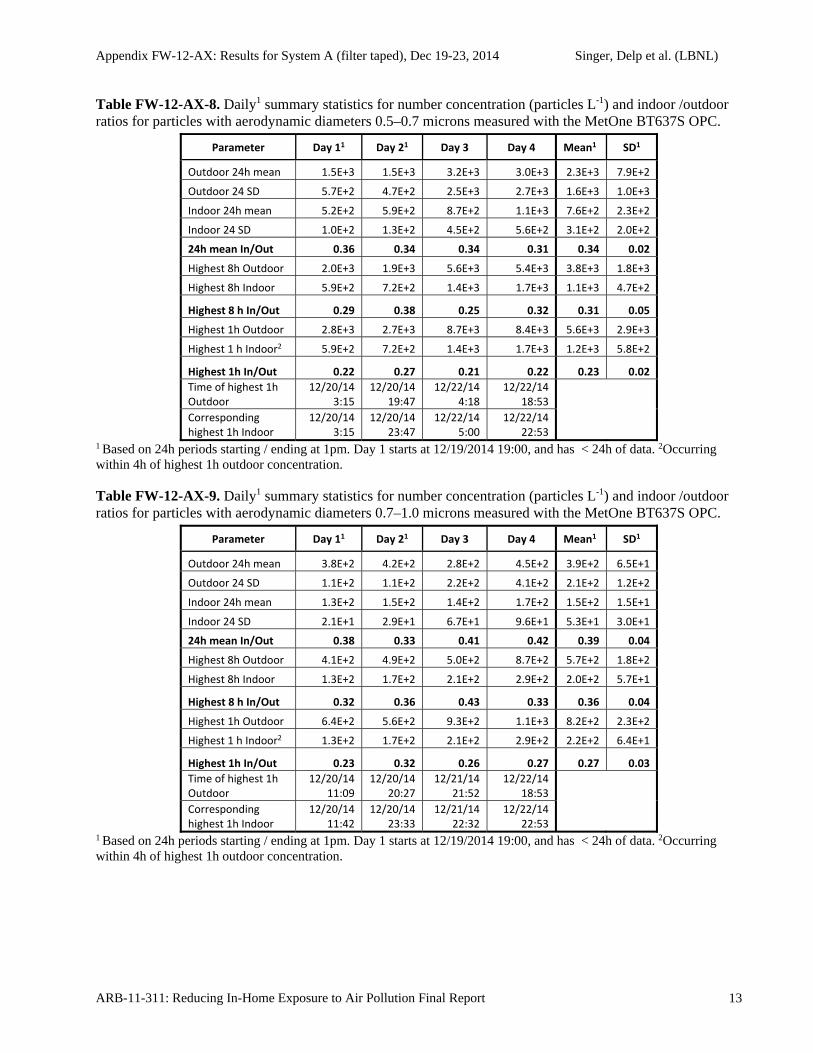
Appendix FW-12-AX: Results for System A (filter taped), Dec 19-23, 2014 Singer, Delp et al. (LBNL)
ARB-11-311: Reducing In-Home Exposure to Air Pollution Final Report 13
Table FW-12-AX-8. Daily1 summary statistics for number concentration (particles L-1) and indoor /outdoor ratios for particles with aerodynamic diameters 0.5–0.7 microns measured with the MetOne BT637S OPC.
Parameter Day 11 Day 21 Day 3 Day 4 Mean1 SD1
Outdoor 24h mean 1.5E+3 1.5E+3 3.2E+3 3.0E+3 2.3E+3 7.9E+2
Outdoor 24 SD 5.7E+2 4.7E+2 2.5E+3 2.7E+3 1.6E+3 1.0E+3
Indoor 24h mean 5.2E+2 5.9E+2 8.7E+2 1.1E+3 7.6E+2 2.3E+2
Indoor 24 SD 1.0E+2 1.3E+2 4.5E+2 5.6E+2 3.1E+2 2.0E+2
24h mean In/Out 0.36 0.34 0.34 0.31 0.34 0.02
Highest 8h Outdoor 2.0E+3 1.9E+3 5.6E+3 5.4E+3 3.8E+3 1.8E+3
Highest 8h Indoor 5.9E+2 7.2E+2 1.4E+3 1.7E+3 1.1E+3 4.7E+2
Highest 8 h In/Out 0.29 0.38 0.25 0.32 0.31 0.05
Highest 1h Outdoor 2.8E+3 2.7E+3 8.7E+3 8.4E+3 5.6E+3 2.9E+3
Highest 1 h Indoor2 5.9E+2 7.2E+2 1.4E+3 1.7E+3 1.2E+3 5.8E+2
Highest 1h In/Out 0.22 0.27 0.21 0.22 0.23 0.02
Time of highest 1h Outdoor
12/20/14 3:15
12/20/14 19:47
12/22/14 4:18
12/22/14 18:53
Corresponding highest 1h Indoor
12/20/14 3:15
12/20/14 23:47
12/22/14 5:00
12/22/14 22:53
1 Based on 24h periods starting / ending at 1pm. Day 1 starts at 12/19/2014 19:00, and has < 24h of data. 2Occurring within 4h of highest 1h outdoor concentration. Table FW-12-AX-9. Daily1 summary statistics for number concentration (particles L-1) and indoor /outdoor ratios for particles with aerodynamic diameters 0.7–1.0 microns measured with the MetOne BT637S OPC.
Parameter Day 11 Day 21 Day 3 Day 4 Mean1 SD1
Outdoor 24h mean 3.8E+2 4.2E+2 2.8E+2 4.5E+2 3.9E+2 6.5E+1
Outdoor 24 SD 1.1E+2 1.1E+2 2.2E+2 4.1E+2 2.1E+2 1.2E+2
Indoor 24h mean 1.3E+2 1.5E+2 1.4E+2 1.7E+2 1.5E+2 1.5E+1
Indoor 24 SD 2.1E+1 2.9E+1 6.7E+1 9.6E+1 5.3E+1 3.0E+1
24h mean In/Out 0.38 0.33 0.41 0.42 0.39 0.04
Highest 8h Outdoor 4.1E+2 4.9E+2 5.0E+2 8.7E+2 5.7E+2 1.8E+2
Highest 8h Indoor 1.3E+2 1.7E+2 2.1E+2 2.9E+2 2.0E+2 5.7E+1
Highest 8 h In/Out 0.32 0.36 0.43 0.33 0.36 0.04
Highest 1h Outdoor 6.4E+2 5.6E+2 9.3E+2 1.1E+3 8.2E+2 2.3E+2
Highest 1 h Indoor2 1.3E+2 1.7E+2 2.1E+2 2.9E+2 2.2E+2 6.4E+1
Highest 1h In/Out 0.23 0.32 0.26 0.27 0.27 0.03
Time of highest 1h Outdoor
12/20/14 11:09
12/20/14 20:27
12/21/14 21:52
12/22/14 18:53
Corresponding highest 1h Indoor
12/20/14 11:42
12/20/14 23:33
12/21/14 22:32
12/22/14 22:53
1 Based on 24h periods starting / ending at 1pm. Day 1 starts at 12/19/2014 19:00, and has < 24h of data. 2Occurring within 4h of highest 1h outdoor concentration.

Appendix FW-12-AX: Results for System A (filter taped), Dec 19-23, 2014 Singer, Delp et al. (LBNL)
ARB-11-311: Reducing In-Home Exposure to Air Pollution Final Report 14
Table FW-12-AX-10. Daily1 summary statistics for number concentration (particles L-1) and indoor /outdoor ratios for particles with aerodynamic diameters 1.0–2.5 microns measured with the MetOne BT637S OPC.
Parameter Day 11 Day 21 Day 3 Day 4 Mean1 SD1
Outdoor 24h mean 2.7E+2 3.2E+2 1.3E+2 2.2E+2 2.3E+2 7.2E+1
Outdoor 24 SD 1.1E+2 7.7E+1 1.1E+2 1.5E+2 1.1E+2 2.6E+1
Indoor 24h mean 8.4E+1 9.3E+1 6.2E+1 7.3E+1 7.8E+1 1.2E+1
Indoor 24 SD 2.0E+1 2.3E+1 2.8E+1 4.1E+1 2.8E+1 8.2E+0
24h mean In/Out 0.39 0.28 0.35 0.41 0.36 0.05
Highest 8h Outdoor 3.3E+2 3.8E+2 3.3E+2 4.0E+2 3.6E+2 2.9E+1
Highest 8h Indoor 8.0E+1 1.1E+2 1.1E+2 1.2E+2 1.1E+2 1.6E+1
Highest 8 h In/Out 0.24 0.30 0.32 0.31 0.29 0.03
Highest 1h Outdoor 5.7E+2 4.4E+2 4.3E+2 5.3E+2 4.9E+2 6.1E+1
Highest 1 h Indoor2 8.0E+1 1.1E+2 1.1E+2 1.2E+2 1.2E+2 1.7E+1
Highest 1h In/Out 0.19 0.27 0.27 0.29 0.25 0.04
Time of highest 1h Outdoor
12/20/14 11:05
12/21/14 5:33
12/21/14 21:50
12/22/14 21:43
Corresponding highest 1h Indoor
12/20/14 11:35
12/21/14 9:13
12/21/14 22:27
12/23/14 0:11
1 Based on 24h periods starting / ending at 1pm. Day 1 starts at 12/19/2014 19:00, and has < 24h of data. 2Occurring within 4h of highest 1h outdoor concentration. Table FW-12-AX-11. Summary statistics for estimated PM2.5 concentrations (g m-3) calculated from particle number concentrations resolved by size from 6 nm to 2.5 microns (as reported in Tables FW-12-AX-2 to FW-12-AX9) and resulting indoor/outdoor ratios.
Parameter Day 11 Day 21 Day 3 Day 4 Mean1 SD1
Outdoor 24h mean 7.2E+0 6.9E+0 7.5E+0 1.1E+1 8.1E+0 1.5E+0
Outdoor 24 SD 1.7E+0 2.1E+0 4.9E+0 6.1E+0 3.7E+0 1.9E+0
Indoor 24h mean 2.5E+0 2.6E+0 2.9E+0 3.9E+0 2.9E+0 5.5E‐1
Indoor 24 SD 3.9E‐1 6.6E‐1 1.4E+0 1.9E+0 1.1E+0 5.8E‐1
24h mean In/Out 0.32 0.35 0.37 0.37 0.35 0.02
Highest 8h Outdoor 8.3E+0 9.1E+0 1.3E+1 1.7E+1 1.2E+1 3.6E+0
Highest 8h Indoor 2.8E+0 3.3E+0 4.5E+0 5.9E+0 4.2E+0 1.2E+0
Highest 8 h In/Out 0.34 0.37 0.35 0.34 0.35 0.01
Highest 1h Outdoor 1.0E+1 1.2E+1 2.1E+1 2.2E+1 1.6E+1 5.3E+0
Highest 1 h Indoor2 2.8E+0 3.3E+0 4.5E+0 5.9E+0 4.8E+0 1.7E+0
Highest 1h In/Out 0.29 0.30 0.27 0.32 0.29 0.02
Time of highest 1h Outdoor
12/20/14 3:14
12/20/14 19:48
12/21/14 21:48
12/22/14 23:46
Corresponding highest 1h Indoor
12/20/14 3:44
12/20/14 21:42
12/21/14 22:41
12/23/14 0:25
1 Based on 24h periods starting / ending at 1pm. Day 1 starts at 12/19/2014 19:00, and has < 24h of data. 2Occurring within 4h of highest 1h outdoor concentration.

Appendix FW-12-AX: Results for System A (filter taped), Dec 19-23, 2014 Singer, Delp et al. (LBNL)
ARB-11-311: Reducing In-Home Exposure to Air Pollution Final Report 15
Table FW-12-AX-12. Summary statistics for concentrations of PM2.5 (g m-3) and indoor /outdoor ratios from measurements reported by TSI DustTrak II.
Parameter Day 11 Day 21 Day 3 Day 4 Mean1 SD1
Outdoor 24h mean 1.3E‐2 1.1E‐2 1.9E‐2 2.3E‐2 1.6E‐2 5.0E‐3
Outdoor 24 SD 6.5E‐3 5.0E‐3 1.2E‐2 1.4E‐2 9.4E‐3 3.7E‐3
Indoor 24h mean 3.4E‐3 3.6E‐3 6.5E‐3 7.7E‐3 5.3E‐3 1.9E‐3
Indoor 24 SD 7.9E‐4 1.1E‐3 3.1E‐3 3.6E‐3 2.2E‐3 1.2E‐3
24h mean In/Out 0.27 0.28 0.34 0.33 0.31 0.03
Highest 8h Outdoor 1.9E‐2 1.6E‐2 3.2E‐2 3.8E‐2 2.6E‐2 9.1E‐3
Highest 8h Indoor 4.0E‐3 4.8E‐3 1.0E‐2 1.2E‐2 7.6E‐3 3.3E‐3
Highest 8 h In/Out 0.21 0.30 0.31 0.31 0.28 0.04
Highest 1h Outdoor 3.0E‐2 2.5E‐2 4.8E‐2 5.1E‐2 3.8E‐2 1.1E‐2
Highest 1 h Indoor2 4.0E‐3 4.8E‐3 1.0E‐2 1.2E‐2 9.0E‐3 4.4E‐3
Highest 1h In/Out 0.14 0.21 0.24 0.29 0.22 0.05
Time of highest 1h Outdoor
12/20/14 3:34
12/20/14 19:48
12/21/14 21:54
12/22/14 23:54
Corresponding highest 1h Indoor
12/20/14 4:10
12/20/14 21:25
12/22/14 0:44
12/23/14 0:40
1 Based on 24h periods starting / ending at 1pm. Day 1 starts at 12/19/2014 19:00, and has < 24h of data. 2Occurring within 4h of highest 1h outdoor concentration. Table FW-12-AX-13. Daily1 summary statistics for concentrations (nanograms m-3) and indoor /outdoor ratios of aerosol black carbon measured using the Aethalometer AE22.
Parameter Day 11 Day 21 Day 3 Day 4 Mean1 SD1
Outdoor 24h mean 3.5E+2 3.0E+2 4.7E+2 9.8E+2 5.2E+2 2.7E+2
Outdoor 24 SD 1.5E+2 1.4E+2 5.0E+2 6.3E+2 3.5E+2 2.1E+2
Indoor 24h mean 2.0E+2 2.0E+2 3.0E+2 5.5E+2 3.1E+2 1.4E+2
Indoor 24 SD 5.6E+1 6.6E+1 1.9E+2 2.7E+2 1.5E+2 9.0E+1
24h mean In/Out 0.48 0.62 0.61 0.59 0.57 0.06
Highest 8h Outdoor 5.7E+2 4.6E+2 1.0E+3 1.4E+3 8.5E+2 3.6E+2
Highest 8h Indoor 2.4E+2 2.8E+2 5.4E+2 7.3E+2 4.5E+2 2.0E+2
Highest 8 h In/Out 0.41 0.60 0.54 0.53 0.52 0.07
Highest 1h Outdoor 7.0E+2 6.6E+2 2.0E+3 2.1E+3 1.4E+3 6.8E+2
Highest 1 h Indoor2 2.4E+2 2.8E+2 5.4E+2 7.3E+2 5.5E+2 2.6E+2
Highest 1h In/Out 0.42 0.45 0.36 0.42 0.41 0.03
Time of highest 1h Outdoor
12/19/14 18:12
12/20/14 19:39
12/21/14 21:42
12/23/14 8:45
Corresponding highest 1h Indoor
12/19/14 18:42
12/20/14 20:09
12/21/14 22:30
12/23/14 10:15
1 Based on 24h periods starting / ending at 1pm. Day 1 starts at 12/19/2014 19:00, and has < 24h of data. 2Occurring within 4h of highest 1h outdoor concentration.


![Fwd: [Fwd: [Fwd: [Fwd: Fw: Fw: foarte frumosi]]]]](https://img.pdfslide.net/doc/110x75/58e7f5801a28abf13f8b490d/fwd-fwd-fwd-fwd-fw-fw-foarte-frumosi.jpg)
![FW: [Fwd: FW: LAS DESPENSAS DEL MUNDO]](https://img.pdfslide.net/doc/110x75/55abd98e1a28ab5a678b4721/fw-fwd-fw-las-despensas-del-mundo.jpg)


![FW: [Fwd: FW: Beautiful_TIBET]](https://img.pdfslide.net/doc/110x75/54b8dcf94a79592d6a8b4612/fw-fwd-fw-beautifultibet.jpg)

