Embed Size (px)
Citation preview
APPENDIX G Water Quality Modeling of Miramar Reservoir
in Support of Assessment of Nutrients
and Productivity


FINAL
Task #: Kleinfelder Contract # H166753
Task Name: Water Quality Modeling of Miramar Reservoir in Support of Assessment of Nutrients and Productivity
Prepared For:
City of San Diego
Public Utilities Department
San Diego, California
August 25th, 2017
This is a final technical memorandum.


WATER QUALITY MODELING OF MIRAMAR RESERVOIR
FINAL REPORT August 2017 // 1
Table of Contents 1. Summary ........................................................................................................................................... 2
1.1 Background ................................................................................................................................ 2
1.1.1 Reservoir Background ......................................................................................................... 2
1.1.2 Study Objectives .................................................................................................................. 2
1.2 Alternatives Considered .............................................................................................................. 3
1.2.1 General Approach ............................................................................................................... 3
1.2.2 Newly-Identified Nutrient Loadings ...................................................................................... 3
1.3 Findings ...................................................................................................................................... 4
2. Model Calibration ............................................................................................................................... 4
2.1 CAEDYM Calibration Setup ........................................................................................................ 5
2.2 CAEDYM Calibration Results ..................................................................................................... 5
2.2.1 Moderate Nutrient Loadings................................................................................................. 5
2.2.2 High Nutrient Loadings ........................................................................................................ 5
2.2.3 Discussion of Calibration ..................................................................................................... 6
3. Modeling Conditions .......................................................................................................................... 6
4. CAEDYM Modeling Results ............................................................................................................... 7
4.1 TP = 0.004 mg/L in PW ............................................................................................................... 7
4.1.1 Moderate Nutrient Loadings................................................................................................. 7
4.1.2 High Nutrient Loadings ........................................................................................................ 9
4.1.3 Discussion ........................................................................................................................... 9
4.2 TP = 0.007 mg/L in PW ............................................................................................................. 10
4.3 TP = 0.010 mg/L in PW ............................................................................................................. 10
4.4 Discussion of Model Run Results ............................................................................................. 11
5. Conclusions ..................................................................................................................................... 11
Appendix A: References ......................................................................................................................... 31
Appendix B: Additional Figures ............................................................................................................... 32

WATER QUALITY MODELING OF MIRAMAR RESERVOIR
FINAL REPORT August 2017 // 2
1. Summary
1.1 Background 1.1.1 Reservoir Background
Miramar Reservoir (MR) (Figure 1.1), located in the Scripps Ranch community of San Diego, is owned, operated and maintained by the City of San Diego (City). The reservoir is adjacent to Miramar Water Treatment Plant (WTP), which serves the northern part of the City. MR has a maximum depth of 114 feet (ft) and a water storage capacity of 6,682 acre-feet (ac-ft).
In 2016, Water Quality Solutions Inc. (WQS) completed a limnological and detention study for MR, under an agreement with Kleinfelder, in support of the City’s effort of augmenting 30 million gallons per day (MGD) of Purified Water (PW) to MR. The work included identifying overall strategies for adding PW to MR. The work also involved developing and applying a three-dimensional water quality model for MR, including the calibration of Estuary and Lake Coastal Ocean Model (ELCOM) and Computational Aquatic Ecosystem Dynamic Model (CAEDYM) for a two-year period (2013 – 2014). After that, the calibrated models were used to perform some limited future “what-if” scenarios to assess the mixing and dilution of PW in MR. The work also included performing future “what-if” CAEDYM model scenarios to assess long-term water quality changes in the reservoir after PW addition. The results of the work were reviewed by an Independent Advisory Panel (IAP), the California Department of Public Health (now known as Division of Drinking Water – DDW), and the Regional Water Quality Control Board (RWQCB). The consensus of the various reviews was that the addition of PW to MR does not produce any significant public health or water quality issues.
Since then, the City has retained WQS to provide additional water quality modeling for MR in support of ongoing design of the Pure Water Program facilities, which is the subject of this technical memorandum. This work is performed by WQS under sub-contracts with R.F. Yeager and Kleinfelder, on behalf of the City of San Diego.
All the previously completed modeling used various assumptions concerning nutrient loadings to MR. In particular, it considered nutrient loadings from inflows and internal nutrient loadings from anoxic sediments, but did not consider possible loadings from atmospheric deposition, birds, aquatic shoreline plants, etc. These sources were not included in the previous water quality modeling due to the lack of information about their magnitude at that time. Since the modeling was completed, the City has retained Dudek Environmental Consultants (Dudek) to re-assess the above potential nutrient loadings to MR. Dudek identified these unaccounted nutrient loadings with magnitudes comparable to the nutrient loadings of inflows. Since the algal growth in MR is controlled by phosphorus (WQS, 2016), it is important to add these newly-identified nutrient loadings, especially phosphorus, to the water quality modeling of MR.
1.1.2 Study Objectives
The overall objective of this study is to determine the potential effects of PW, at an average inflow rate of 30 MGD, on water quality in MR, especially algal production, when considering newly-identified nutrient loading sources such as atmospheric deposition and aquatic plants.

WATER QUALITY MODELING OF MIRAMAR RESERVOIR
FINAL REPORT August 2017 // 3
1.2 Alternatives Considered 1.2.1 General Approach
The nutrient loading calculations by Dudek included two scenarios for the newly-identified nutrient loadings: a moderate and a high scenario (Dukek, 2017). With the newly-identified loadings to the reservoir, some CAEDYM model parameters for algal growth needed to be updated so that the measured and computed water quality parameters remain in agreement. As a result, this study included performing two recalibrations, one for each of the newly-identified loading scenarios; i.e., moderate and high. The recalibrations were for the same two-year period (2013 – 2014) used in (WQS 2016).
An examination of in-reservoir chlorophyll a concentrations revealed that the values rarely dropped below 0.1 to 0.2 µg/L. Modeling results from (WQS 2016), however, showed significantly lower values when algal productivity was low. To address this, different from the previous water quality modeling, two algal groups are considered in this study. The first algal group used in the model generally grows with more favorable algal growth conditions including high solar radiation, favorable temperature, and relatively more abundant nutrients. A second algal group, which is a background algal group, was used to represent the algal species that are insensitive to seasonal variation of water temperature and can be sustained at low nutrient levels. This group of algae was capped at a chlorophyll a concentration of 0.2 µg/L.
After each model recalibration, the model was run for future scenarios whereby the present imported water inflow (labelled as “WTP return” in City documents, such as flow mass balance tables, and the previous documents produced by WQS) to MR, originating from Lake Skinner, was replaced with PW inflow. The methodologies for performing the new CAEDYM simulations presented herein closely followed those previously used in WQS’s water quality modeling for MR (WQS, 2016). The same computational grid, inflow and outflow quantities, modeling period (four years), and meteorology data were used. The new CAEDYM simulations differ from previous simulations by using:
• additional nutrient loading calculations as developed by Dudek.
• a PW inflow diffuser (Figure 1.1), as being developed in the 60% design of the Pure Water facilities, versus a point source in the previous analyses.
• three values for total phosphorus (TP) concentrations in PW, ranging from 0.004 to 0.010 mg/L, versus a value of 0.004 mg/L used previously.
1.2.2 Newly-Identified Nutrient Loadings
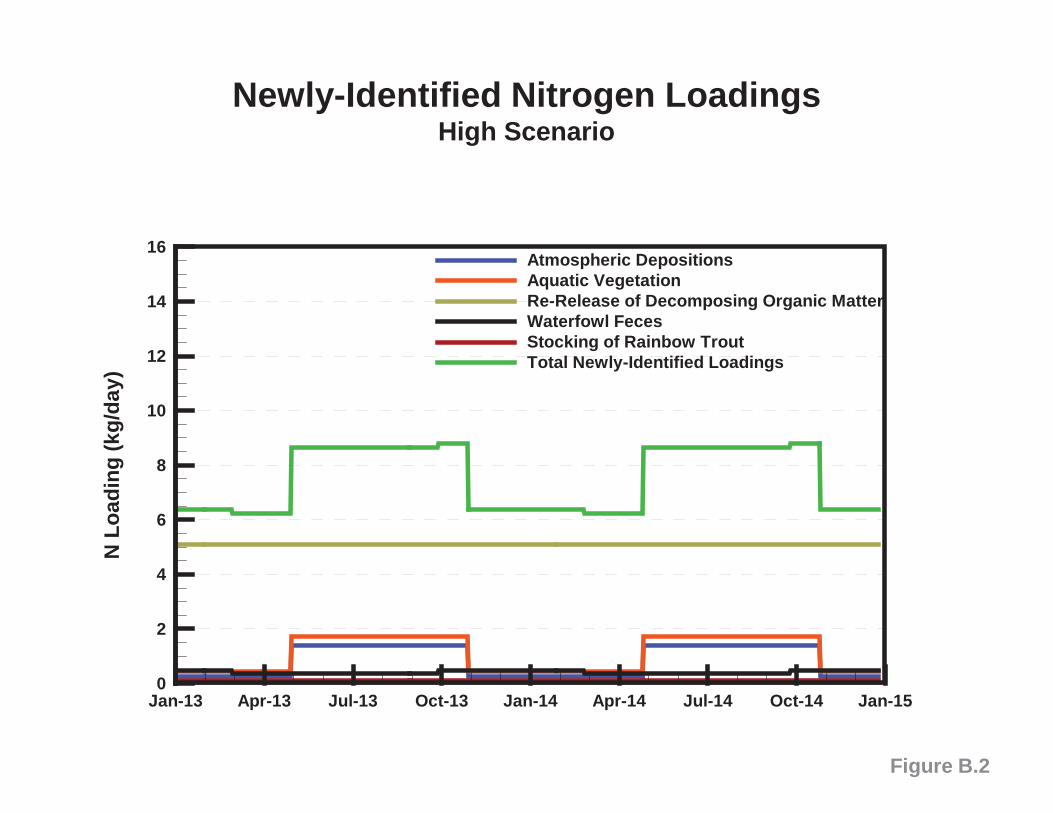
Dudek’s study (Dudek, 2017) identified five additional potential sources that may contribute nutrients to MR but were not considered in the previous water quality modeling. These newly-identified nutrient sources include atmospheric deposition, decomposition of aquatic vegetation, faunal contributions (waterfowl feces and stocking of rainbow trout), and internal nutrient cycling in the oxic zone. The nutrient loadings from these five sources were estimated for two scenarios: a moderate scenario and a high scenario. Figures B.1 – B.4 presents the loadings of nitrogen (N) and phosphorus (P) for each scenario. Details about estimates of these newly-identified nutrient loadings can be found in (Dudek, 2017).

WATER QUALITY MODELING OF MIRAMAR RESERVOIR
FINAL REPORT August 2017 // 4
Besides the newly-identified nutrient loadings, the water quality model in this study also considered nutrient loadings from inflows (imported water, sludge return, etc.) and internal nutrient loadings from anoxic sediments, similar to the previous study (WQS, 2016). Similar to the previous water quality modeling, the nutrient concentrations in the sludge return were considered to be 10% of those in the imported water. The flow rate of the sludge return was relatively small, which made the nutrient loadings from the sludge return relatively insignificant. The total loadings from the newly-identified nutrient sources were compared to the nutrient loadings from the reservoir’s inflows and the internal loadings from anoxic sediments in Figure 1.2. The nutrient loadings from the newly-identified sources are comparable to those from the imported water and the internal loadings from anoxic sediments; therefore, it is important to consider these sources in the water quality modeling for MR. The daily average TP loadings from various sources are compared in Table 1.1 for both the calibration and the future scenario, in which the PW TP concentration is 0.004 mg/L.
Table 1.1: Average Total Phosphorus Loadings (kg/day): Calibration vs. Future Scenario
Sources Moderate Nutrient Loadings High Nutrient Loadings
Calibration Future Scenario Calibration Future Scenario TP in PW = 0.004 mg/L TP in PW = 0.004 mg/L
Imported Water 0.81 N/A 0.81 N/A Sludge Return 0.03 0.03 0.03 0.03
Newly-Identified Nutrient Sources 0.48 0.48 0.83 0.83
Internal Loading from Anoxic Sediments 0.20 0.16 0.20 0.16
Purified Water N/A 0.45 N/A 0.45 Total 1.52 1.12 1.87 1.47
1.3 Findings Based on the calibrations and future scenario simulations, the following conclusions have been
drawn:
• The moderate and high nutrient loading scenarios did not seem to differ significantly, other than showing a slightly higher algal concentration in the simulation with the high nutrient loadings;
• Under the conditions of moderate nutrient loadings,
o For various future scenarios with different TP concentrations in the PW inflow, the model predicted that most water quality variables’ (DO, pH, and nutrients) trends are not greatly changed from (WQS 2016);
o In the calibrations, the two-year average chlorophyll a level is 0.42 µg/L; while the average chlorophyll a levels for the first two years of the future scenarios were predicted to range from 0.24 µg/L to 0.30 µg/L with various TP concentrations in the PW inflow.
2. Model Calibration With the newly-identified loadings to the reservoir, some CAEDYM model parameters for algal
growth needed to be updated so that the measured and computed water quality parameters remain in

WATER QUALITY MODELING OF MIRAMAR RESERVOIR
FINAL REPORT August 2017 // 5
agreement. As a result, this study included performing two recalibrations, one for each of the newly-identified loading scenarios (moderate and high).
2.1 CAEDYM Calibration Setup The computer grid setup, initial conditions and inflow water quality inputs for CAEDYM calibration
were the same as the calibration in the previous water quality modeling (WQS, 2016). The main difference from the previous study was that the calibration in this new study considered the additional nutrient loadings from the potential sources identified by Dudek. The calibration was carried out for each of the two nutrient loading scenarios: moderate and high.
2.2 CAEDYM Calibration Results The calibration results were presented through comparisons between the CAEDYM simulation
results and measured in-reservoir data focusing on dissolved oxygen (DO), nutrients, chlorophyll a, and pH.
2.2.1 Moderate Nutrient Loadings
Table 2.1 summarizes the statistical metrics for the calibration of parameters under the scenario of moderate nutrient loadings. Figure 2.1 presents a comparison plot of the simulated and measured chlorophyll a concentrations at the water surface. Figures B.5 – B.12 present the comparison plots of the simulated and measured values of the other water quality data, including water temperature, DO, nutrients, and pH.
Table 2.1: Calibration Metrics (Moderate Nutrient Loadings)
Parameters Root Mean Square Error (RMSE) Relative RMSE1 Mean Error2
Surface and Bottom Temperature 0.65 ⁰C 4.5% 0.22 ⁰C Surface and Bottom Conductivity 22.6 µS/cm 8.1% 13.0 µS/cm
Surface and Bottom Dissolved Oxygen 0.82 mg/L 7.4% 0.23 mg/L Surface and Bottom Total Nitrogen 0.18 mg/L 17.2% 0.03 mg/L
Surface and Bottom Total Phosphorus 0.05 mg/L 14.8% 0.01 mg/L Surface Chlorophyll a 0.44 µg/L 18.4% -0.06 µg/L
Surface and Bottom pH 0.20 14.2% 0.08 Note: 1. Relative RMSE = RMSE/|PARmax – PARmin|, where PARmax and PARmin are from measured data. 2. Mean error is the average of (PARmeasured – PARsimulated).
2.2.2 High Nutrient Loadings
Table 2.2 summarizes the statistical metrics for the calibration of parameters under the scenario of high nutrient loadings. Figure 2.2 presents a comparison plot of the simulated and measured chlorophyll a concentrations at the water surface. Figures B.13 – B.20 present the comparison plots of the simulated and measured values of the other water quality data, including water temperature, DO, nutrients, and pH.

WATER QUALITY MODELING OF MIRAMAR RESERVOIR
FINAL REPORT August 2017 // 6
Table 2.2: Calibration Metrics (High Nutrient Loadings)
Parameters Root Mean Square Error (RMSE) Relative RMSE1 Mean Error2
Surface and Bottom Temperature 0.65 ⁰C 4.5% 0.20 ⁰C Surface and Bottom Conductivity 22.3 µS/cm 8.0% 12.2 µS/cm
Surface and Bottom Dissolved Oxygen 0.83 mg/L 7.4% 0.24 mg/L Surface and Bottom Total Nitrogen 0.19 mg/L 18.6% 0.00 mg/L
Surface and Bottom Total Phosphorus 0.05 mg/L 14.7% 0.01 mg/L Surface Chlorophyll a 0.44 µg/L 18.5% -0.07 µg/L
Surface and Bottom pH 0.20 14.3% 0.08 Note: 1. Relative RMSE = RMSE/|PARmax – PARmin|, where PARmax and PARmin are from measured data. 2. Mean error is the average of (PARmeasured – PARsimulated).
2.2.3 Discussion of Calibration
For both the moderate and high nutrient loading scenarios, the calibrated model replicated the overall reservoir behaviors well, including surface and bottom temperatures, thermocline depth, surface and bottom conductivities, DO and nutrient levels in both epilimnion and hypolimnion, and surface algal levels. Overall the calibration metrics indicated a good calibration. Water temperature, conductivity, and DO were predicted with lower relative RMSEs, while nutrients (nitrogen and phosphorus, whose behavior depends on temperature and DO) and chlorophyll a and pH (depending on all other variables) were predicted with higher relative RMSEs.
The RMSEs of water temperature, conductivity, DO, nutrients, and pH in the re-calibrations were generally similar to the initial calibration performed in the previous study (WQS, 2016). The RMSE of chlorophyll a in the re-calibration was 0.4 µg/L, approximately a 40% improvement from the initial calibration (WQS, 2016). It is likely that the implementation of a second algal group sustained at low nutrient levels helped improve the chlorophyll a calibration.
3. Modeling Conditions To evaluate how the PW may affect water quality of MR, four (4) future CAEDYM simulations
were performed for a four-year modeling period under different scenarios of the newly-identified nutrient loadings. Note that the simulation period of the CAEDYM runs was four years, double that of the ELCOM runs. This was done in order to investigate the longer-term effects of the PW on water qualify of MR. The model inputs (meteorology, inflows, outflows, etc.) of the second two-year simulation period were simply a repetition of the first two-years.
Most of the modeling conditions in this study were identical to the previous water quality modeling study (WQS, 2016), including the PW inflow rates, outflow rates, open Port #2, and nominal operating water surface elevation (WSEL). Aside from updated nutrient loadings (Dudek 2017), the work presented herein incorporates a PW inflow diffuser (Figure 1.1), as being developed in the 60% design of the Pure Water facilities, instead of a point source in the previous analyses. It is noted that, while the diffuser increases initial dilution of the PW, the diffuser is not expected to greatly alter the overall water quality in the reservoir as algal growth and other water quality processes occur on time scales of weeks to months. Furthermore, the work presented herein considers three TP concentrations with TP = 0.004, 0.007, and 0.010 mg/L, versus a single value of 0.004 mg/L in (WQS 2016). The range of TP values in

WATER QUALITY MODELING OF MIRAMAR RESERVOIR
FINAL REPORT August 2017 // 7
the PW was based on discussions between the City and Trussell Technologies. The four CAEDYM future scenario model runs are summarized in Table 3.1.
Table 3.1: Summary of CAEDYM Future Scenario Model Runs Run # TP Concentration in PW (mg/L) Newly-Identified Nutrient Loadings
1 0.004 Moderate 2 0.004 High 3 0.007 Moderate 4 0.010 Moderate
4. CAEDYM Modeling Results This section presents the results of the CAEDYM model runs. The WSEL of the CAEDYM runs is
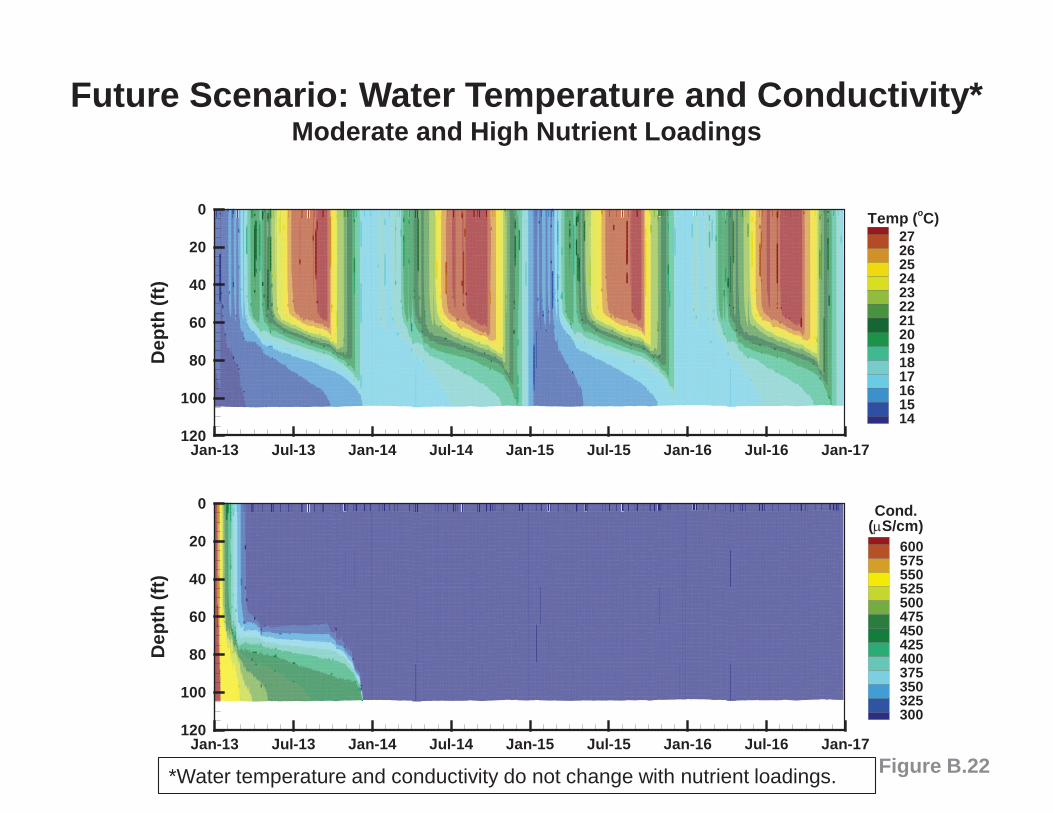
shown in Figure B.21. Similar to the two-year ELCOM model runs, the simulated WSEL remained relatively constant, within ±1 ft of the normal operating elevation (EL = 706 ft), corresponding to a water volume of approximately 5,500 acre-feet. The contour plots of water temperature and conductivity of the CAEDYM runs are shown in Figure B.22 for the four-year modeling period. Similar to the two-year ELCOM model run results, the PW, with relatively warm temperature and low salinity, deepens the thermocline and decreases the reservoir conductivity. Note that WSEL, water temperature and conductivity do not change with nutrient loadings. The subsections below present the nutrient and algae modeling results, focusing on DO, nutrients, chlorophyll a, and pH.
4.1 TP = 0.004 mg/L in PW 4.1.1 Moderate Nutrient Loadings
4.1.1.1 Dissolved Oxygen Figure 4.1 presents the simulated surface and bottom DO concentrations under the condition of a
PW inflow rate of 30 MGD, TP = 0.004 mg/L in PW, and moderate nutrient loadings from the newly-identified nutrient sources. The surface DO concentrations remain nearly saturated. Bottom DO steadily decreases during the spring and summer months, a result of algal decay, sediment oxygen demand, and lack of replenishment from the atmosphere. The bottom of MR becomes anoxic during the summer and fall. DO is replenished as the reservoir begins turnover during the winter.
Table 4.1 lists the hypolimnetic anoxia (bottom DO values being less than 0.5 mg/L) period for each year, compared to the calibration. For Year 1, the hypolimnetic anoxia period is predicted to last 249 days (or 68% of the time). For the next three years, the hypolimnetic anoxia period is predicted to last 199 – 212 days (or 55% – 58% of the time), slightly shorter than the length of the hypolimnetic anoxia periods of the calibration. The longer hypolimnetic anoxia period for Year 1 in the CAEDYM run is a result of stratification starting earlier in Year 1, likely due to the introduction of warm PW inflow forming a thermocline earlier. The introduction of PW, however, does not show a significant effect on DO after Year 1.

WATER QUALITY MODELING OF MIRAMAR RESERVOIR
FINAL REPORT August 2017 // 8
Table 4.1: Summary of Simulated DO (TP = 0.004 mg/L in PW; Moderate Nutrient Loadings)
Year Calibration Moderate Nutrient Loadings
Bottom Anoxia Period1
Days under Anoxia: Total Days (Percentage)
Bottom Anoxia Period1
Days under Anoxia: Total Days (Percentage)
Year 1 5/11 – 12/11 215 (59%) 4/5 – 12/9 249 (68%) Year 2 5/10 – 12/19 224 (61%) 5/4 – 12/1 212 (58%) Year 3 N/A N/A 5/21 – 12/5 199 (55%) Year 4 N/A N/A 5/6 – 11/25 204 (56%)
Note: 1. Anoxia is defined here as the bottom DO being less than 0.5 mg/L.
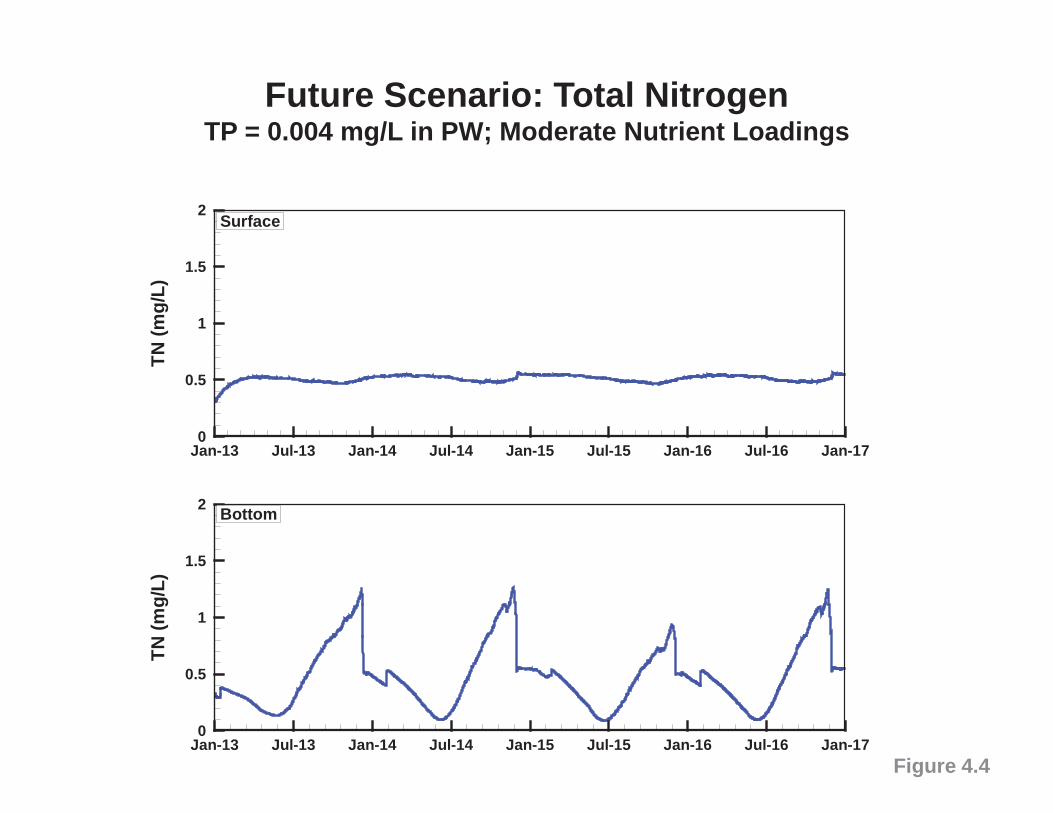
4.1.1.2 Nutrients Figures 4.2, 4.3, and 4.4 illustrate the simulated ammonia (NH4-N), nitrate (NO3-N), and total
nitrogen (TN), respectively. Figures 4.5 and 4.6 show the simulated soluble reactive phosphorus (SRP) and total phosphorus (TP), respectively. For the reservoir’s hypolimnion, TN and TP began to increase in the spring of every year as DO values decreased, a result of decaying organic matter and internal nutrient recycling from the sediments during anoxic or low DO conditions. The simulation shows similar trends during the last three years but a different trend during Year 1. In Year 1, the concentration of NO3-N at the bottom is lower, and the sediment release periods of NH4-N and SRP are longer, caused by the longer hypolimnetic anoxia period during Year 1. In general, the simulation shows high concentrations of nitrogen and low concentrations of phosphorus at the surface, a result of year-round high-rate inflow of PW with relatively high nitrogen and low phosphorus concentrations.
4.1.1.3 Chlorophyll a Figure 4.7 presents the simulated surface chlorophyll a concentrations. In general, after
reservoir turnover in winter, the reservoir surface is replenished by the phosphorus from the hypolimnion, resulting in an algal growth peak in the spring. Low phosphorus concentrations in the reservoir surface water limit algal growth during winter, summer, and fall. The peak value of surface chlorophyll a concentrations in Year 1 is higher than that of the other three years because of the existing phosphorus in the water column at the beginning of this simulation. In the next three years, the surface phosphorus concentrations are very low, a result of year-round high-rate inflow of PW with low phosphorus concentrations, thus limiting the algal growth.
Table 4.2 summarizes annual average surface chlorophyll a concentrations for the simulation under the moderate nutrient loading scenario, compared to the calibration. The average chlorophyll a concentration is predicted to be 0.26 µg/L for Year 1 and 0.21 or 0.22 µg/L for the next three years, which is lower than the algal levels in the calibration. This indicates that a PW inflow rate of 30 MGD is predicted to produce lower algal levels (i.e., low surface chlorophyll a concentrations) and higher water clarity, due to the relatively low phosphorus concentrations in the year-round high-rate inflow of PW.
Note that chlorophyll a has been measured in MR, using an in situ fluorometric method, to an accuracy of 0.1 ug/l. That is to say, field measurements of chlorophyll a are accurate to one digit to the right of the decimal point. In this memorandum the numerical modeling results for chlorophyll a are presented with two digits to the right of the decimal point. This is done to show possible differences between various model scenarios. However, the model results for chlorophyll a, as presented herein, may imply a level of precision greater than can be measured in the field. The reader is cautioned to keep this in mind when assessing model outcomes for chlorophyll a.

WATER QUALITY MODELING OF MIRAMAR RESERVOIR
FINAL REPORT August 2017 // 9
Table 4.2: Annual Average Surface Chlorophyll a (µg/L) (TP = 0.004 mg/L; Moderate Nutrient Loadings)
Year Calibration Future Scenario: TP = 0.004 mg/L in PW; Moderate Nutrient Loadings
Year 1 0.47 0.26 Year 2 0.37 0.21 Year 3 N/A 0.22 Year 4 N/A 0.21
4.1.1.4 pH Figure 4.8 illustrates the simulated pH for the reservoir surface and bottom. Surface pH values
depend largely on algal productivity as elevated pH is generally an indicator of algal blooms. Algal levels are predicted to be relatively low in MR; therefore, the pH at the reservoir surface is predicted to be fairly constant for all four years, at ~8.2 during each simulated year. Bottom pH values depend largely on the development of the thermocline. The pH at the reservoir bottom is predicted to be around 7.2 when the reservoir is stratified and at a higher level, peaking at ~8.0, during turnover.
4.1.2 High Nutrient Loadings
The results of the model run under the high nutrient loadings scenario were generally similar to the results of the model run under the moderate nutrient loadings scenario, except for a slightly longer anoxic period for Year 4 (Table 4.3) and slightly higher average chlorophyll a level for Year 1 and Year 3 (Figure 4.9 and Table 4.4). The detailed results of this run are presented in Figures B.23 – B.29.
Table 4.3: Summary of Simulated DO (TP = 0.004 mg/L; High Nutrient Loadings)
Year Calibration High Nutrient Loadings
Bottom Anoxia Period1
Days under Anoxia: Total Days (Percentage)
Bottom Anoxia Period1
Days under Anoxia: Total Days (Percentage)
Year 1 5/11 – 12/10 214 (59%) 4/5 – 12/9 249 (68%) Year 2 5/10 – 12/19 224 (61%) 5/4 – 12/1 212 (58%) Year 3 N/A N/A 5/21 – 12/5 199 (55%) Year 4 N/A N/A 5/6 – 11/29 208 (57%)
Note: 1. Anoxia is defined here as the bottom DO being less than 0.5 mg/L.
Table 4.4: Annual Average Surface Chlorophyll a (µg/L) (TP = 0.004 mg/L; High Nutrient Loadings)
Year Calibration Future Scenario: TP = 0.004 mg/L in PW; High Nutrient Loadings
Year 1 0.47 0.28 Year 2 0.37 0.21 Year 3 N/A 0.24 Year 4 N/A 0.21
4.1.3 Discussion
The annual average surface chlorophyll a levels predicted in this study are compared to the values predicted from the previous water quality modeling in (WQS, 2016) in Table 4.5. The implementation of a background algal group sustained at low nutrient levels resulted in more reasonable future scenario simulations.

WATER QUALITY MODELING OF MIRAMAR RESERVOIR
FINAL REPORT August 2017 // 10
Table 4.5: Comparison of Predicted Annual Average Surface Chlorophyll a (µg/L) (TP = 0.004 mg/L)
Year Previous Study1:
TP = 0.004 mg/L in PW; No Additional Nutrient Loadings
Future Scenario2: TP = 0.004 mg/L in PW;
Moderate Nutrient Loadings
Future Scenario2: TP = 0.004 mg/L in PW; High Nutrient Loadings
Year 1 0.24 0.26 0.28 Year 2 0.04 0.21 0.21 Year 3 0.03 0.22 0.24 Year 4 0.03 0.21 0.21
Note: 1. The PW inflow enters MR as a surface inflow (WQS, 2016); 2. The PW inflow enters MR through a diffuser.
4.2 TP = 0.007 mg/L in PW
For the scenario with TP = 0.004 mg/L in PW, the modeling results did not show significant difference between the moderate and high nutrient loadings. As a result, for the future scenarios with TP = 0.007 mg/L and TP = 0.010 mg/L in PW, only the condition of moderate nutrient loadings was simulated.
The results of the model run with TP = 0.007 mg/L in PW showed a higher average chlorophyll a level for Year 1 and Year 3 (Figure 4.10 and Table 4.6) than the scenario with TP = 0.004 mg/L in PW. The detailed results of this run are presented in Figures B.30 – B.36. The results of other parameters, including DO, nutrients, and pH were similar to those of the scenario with TP = 0.004 mg/L in PW.
Table 4.6: Annual Average Surface Chlorophyll a (µg/L) (TP = 0.007 mg/L; Moderate Nutrient Loadings)
Year Calibration Future Scenario: TP = 0.007 mg/L in PW; Moderate Nutrient Loadings
Year 1 0.47 0.31 Year 2 0.37 0.22 Year 3 N/A 0.27 Year 4 N/A 0.21
4.3 TP = 0.010 mg/L in PW The results of the model run with TP = 0.010 mg/L in PW showed a higher average chlorophyll a
level for all four years (Figure 4.11 and Table 4.7) than the scenarios with lower PW TP concentrations. For Year 1, this model run predicted about 38% higher chlorophyll a concentrations than the model run with TP = 0.004 mg/L. For Year 3, it was about 55% more than the model run with TP = 0.004 mg/L. The detailed results of this model run are presented in Figures B.37 – B.43. The results of other parameters, including DO, nutrients, and pH were similar to those of the scenarios discussed above.
Table 4.7: Annual Average Surface Chlorophyll a (µg/L) (TP = 0.010 mg/L; Moderate Nutrient Loadings)
Year Calibration Future Scenario: TP = 0.010 mg/L in PW; Moderate Nutrient Loadings
Year 1 0.47 0.36 Year 2 0.37 0.23 Year 3 N/A 0.34 Year 4 N/A 0.23

WATER QUALITY MODELING OF MIRAMAR RESERVOIR
FINAL REPORT August 2017 // 11
4.4 Discussion of Model Run Results The simulated chlorophyll a concentrations for different scenarios of TP concentration in PW,
under the moderate nutrient loading condition, were compared to the calibration in Figure 4.12 and Table 4.8. For all three scenarios, the future scenario simulations showed a “base” algal productivity (+/- 0.2 µg/L) in Year 2 and Year 4, and less episodic increases in Year 1 and Year 3 than the calibration.
Even though the average daily TP loadings in the future scenarios were comparable to those of the calibration (Table 4.9 and Figure 4.13), the surface TP concentrations in the future scenarios were somewhat lower than those in the calibration (Figure 4.14). The algal productivity in the future scenarios was generally limited by low phosphorus concentrations near the surface.
Table 4.8: Average Chlorophyll a: Future Scenarios vs. Calibration (Moderate Nutrient Loadings)
Calibration Future Scenario
TP in PW = 0.004 mg/L
TP in PW = 0.007 mg/L
TP in PW = 0.010 mg/L
Average Chlorophyll a in Year 1 (µg/L) 0.47 0.26 0.31 0.36 Average Chlorophyll a in Year 2 (µg/L) 0.37 0.21 0.22 0.23 Average Chlorophyll a in Year 3 (µg/L) N/A 0.22 0.27 0.34 Average Chlorophyll a in Year 4 (µg/L) N/A 0.21 0.21 0.23
First-Two-Year Average (µg/L) 0.42 0.24 0.27 0.30 Four-Year Average (µg/L) N/A 0.23 0.25 0.29
Table 4.9: Summary of Average Total Phosphorus Loadings (kg/day)
Sources
Moderate Nutrient Loadings High Nutrient Loadings
Calibration Future Scenario
Calibration
Future Scenario
TP in PW = 0.004 mg/L
TP in PW = 0.007 mg/L
TP in PW = 0.010 mg/L
TP in PW = 0.004 mg/L
Imported Water 0.81 N/A N/A N/A 0.81 N/A Sludge Return 0.03 0.03 0.03 0.03 0.03 0.03
Newly-identified Nutrient Sources 0.48 0.48 0.48 0.48 0.83 0.83
Internal Loading from Anoxic Sediments 0.20 0.16 0.16 0.16 0.20 0.16
Purified Water N/A 0.45 0.79 1.13 N/A 0.45 Total 1.52 1.12 1.46 1.80 1.87 1.47
5. Conclusions Based on the calibrations and future scenario simulations, the following conclusions have been
drawn:
• The moderate and high nutrient loading scenarios did not seem to differ significantly, other than showing a slightly higher algal concentration in the simulation with the high nutrient loadings;
• Under the conditions of moderate nutrient loadings,

WATER QUALITY MODELING OF MIRAMAR RESERVOIR
FINAL REPORT August 2017 // 12
o For various future scenarios with different TP concentrations in the PW inflow, the model predicted that most water quality variables (DO, pH, and nutrients) trends are not greatly changed;
o In the calibrations, the two-year average chlorophyll a level is 0.42 µg/L; while the average chlorophyll a levels for the first two years were predicted to range from 0.24 µg/L to 0.30 µg/L for the future scenarios with various TP concentrations in the PW inflow.

Miramar Reservoir Bathymetry and Infrastructure
Figure 1.1
*Note that the number of blue dots in the figure does not represent the exact number of ports.
Elevation (ft)710700690680670660650640630620610600
OutletTower
AqueductInlet Imported Water InflowStation A
Diffuser Ports

Nutrient Loadings in Calibration
Figure 1.2
NLo
adin
g(k
g/da
y)
Jan-13 Apr-13 Jul-13 Oct-13 Jan-14 Apr-14 Jul-14 Oct-14 Jan-150
10
20
30
40
50
60 Imported WaterSludge ReturnInternal Loading from Anoxic SedimentsUnaccounted Loadings (Moderate)Unaccounted Loadings (High)
Nitrogen
PLo
adin
g(k
g/da
y)
Jan-13 Apr-13 Jul-13 Oct-13 Jan-14 Apr-14 Jul-14 Oct-14 Jan-150
1
2
3
4
5
6 Imported WaterSludge ReturnInternal Loading from Anoxic SedimentsUnaccounted Loadings (Moderate)Unaccounted Loadings (High)
Phosphorus

Calibration for Chlorophyll aModerate Nutrient Loadings
Figure 2.1
Chl
orop
hyll
a(
g/L)
Jan-13 Apr-13 Jul-13 Oct-13 Jan-14 Apr-14 Jul-14 Oct-14 Jan-150
1
2
3
4
5
MeasuredSimulated
Surface

Calibration for Chlorophyll aHigh Nutrient Loadings
Figure 2.2
Chl
orop
hyll
a(
g/L)
Jan-13 Apr-13 Jul-13 Oct-13 Jan-14 Apr-14 Jul-14 Oct-14 Jan-150
1
2
3
4
5
MeasuredSimulated
Surface

DO
(mg/
L)
Jan-13 Jul-13 Jan-14 Jul-14 Jan-15 Jul-15 Jan-16 Jul-16 Jan-170
5
10
15
20Surface
DO
(mg/
L)
Jan-13 Jul-13 Jan-14 Jul-14 Jan-15 Jul-15 Jan-16 Jul-16 Jan-170
5
10
15
20 Bottom
Future Scenario: Dissolved OxygenTP = 0.004 mg/L in PW; Moderate Nutrient Loadings
Figure 4.1

NH
4-N(m
g/L)
Jan-13 Jul-13 Jan-14 Jul-14 Jan-15 Jul-15 Jan-16 Jul-16 Jan-170
0.5
1
1.5
2Surface
NH
4-N(m
g/L)
Jan-13 Jul-13 Jan-14 Jul-14 Jan-15 Jul-15 Jan-16 Jul-16 Jan-170
0.5
1
1.5
2 Bottom
Future Scenario: AmmoniaTP = 0.004 mg/L in PW; Moderate Nutrient Loadings
Figure 4.2

NO
3-N(m
g/L)
Jan-13 Jul-13 Jan-14 Jul-14 Jan-15 Jul-15 Jan-16 Jul-16 Jan-170
0.5
1
1.5
2Surface
NO
3-N(m
g/L)
Jan-13 Jul-13 Jan-14 Jul-14 Jan-15 Jul-15 Jan-16 Jul-16 Jan-170
0.5
1
1.5
2 Bottom
Future Scenario: NitrateTP = 0.004 mg/L in PW; Moderate Nutrient Loadings
Figure 4.3
TN(m
g/L)
Jan-13 Jul-13 Jan-14 Jul-14 Jan-15 Jul-15 Jan-16 Jul-16 Jan-170
0.5
1
1.5
2Surface
TN(m
g/L)
Jan-13 Jul-13 Jan-14 Jul-14 Jan-15 Jul-15 Jan-16 Jul-16 Jan-170
0.5
1
1.5
2 Bottom
Future Scenario: Total NitrogenTP = 0.004 mg/L in PW; Moderate Nutrient Loadings
Figure 4.4

SRP
(mg/
L)
Jan-13 Jul-13 Jan-14 Jul-14 Jan-15 Jul-15 Jan-16 Jul-16 Jan-170
0.2
0.4
0.6
0.8
1Surface
SRP
(mg/
L)
Jan-13 Jul-13 Jan-14 Jul-14 Jan-15 Jul-15 Jan-16 Jul-16 Jan-170
0.2
0.4
0.6
0.8
1 Bottom
Future Scenario: Soluble Reactive PhosphorusTP = 0.004 mg/L in PW; Moderate Nutrient Loadings
Figure 4.5

TP(m
g/L)
Jan-13 Jul-13 Jan-14 Jul-14 Jan-15 Jul-15 Jan-16 Jul-16 Jan-170
0.2
0.4
0.6
0.8
1Surface
TP(m
g/L)
Jan-13 Jul-13 Jan-14 Jul-14 Jan-15 Jul-15 Jan-16 Jul-16 Jan-170
0.2
0.4
0.6
0.8
1 Bottom
Future Scenario: Total PhosphorusTP = 0.004 mg/L in PW; Moderate Nutrient Loadings
Figure 4.6

Future Scenario: Chlorophyll aTP = 0.004 mg/L in PW; Moderate Nutrient Loadings
Figure 4.7

Future Scenario: pHTP = 0.004 mg/L in PW; Moderate Nutrient Loadings
Figure 4.8

Future Scenario: Chlorophyll aTP = 0.004 mg/L in PW; High Nutrient Loadings
Figure 4.9
Chl
orop
hyll
a(
g/L)
Jan-13 Jul-13 Jan-14 Jul-14 Jan-15 Jul-15 Jan-16 Jul-16 Jan-170
0.5
1
1.5
2
2.5
3
3.5
4Surface

Future Scenario: Chlorophyll aTP = 0.007 mg/L in PW; Moderate Nutrient Loadings
Figure 4.10
Chl
orop
ylla
(g/
L)
Jan-13 Jul-13 Jan-14 Jul-14 Jan-15 Jul-15 Jan-16 Jul-16 Jan-170
0.5
1
1.5
2
2.5
3
3.5
4Surface

Future Scenario: Chlorophyll aTP = 0.010 mg/L in PW; Moderate Nutrient Loadings
Figure 4.11
Chl
orop
ylla
(g/
L)
Jan-13 Jul-13 Jan-14 Jul-14 Jan-15 Jul-15 Jan-16 Jul-16 Jan-170
0.5
1
1.5
2
2.5
3
3.5
4Surface

Chlorophyll a: Calibration vs. Future ScenariosModerate Nutrient Loadings
Figure 4.12
Chl
orop
ylla
(g/
L)
Jan-13 Jul-13 Jan-14 Jul-14 Jan-15 Jul-15 Jan-16 Jul-16 Jan-170
1
2
3
4 Moderate Nutrient LoadingsSurface

Total TP Loadings*: Calibration vs. Future ScenariosModerate Nutrient Loadings
Figure 4.13
*Including the nutrient loadings from inflows, unaccounted nutrient loadings, and the internal loading from anoxic sediments
PLo
adin
g(k
g/da
y)
Jan-13 Apr-13 Jul-13 Oct-13 Jan-14 Apr-14 Jul-14 Oct-14 Jan-150
2
4
6
8CalibrationFuture Scenario (TP in PW = 0.004 mg/L)Future Scenario (TP in PW = 0.007 mg/L)Future Scenario (TP in PW = 0.010 mg/L)
Phosphorus

Surface TP Concentrations: Calibration vs. Future ScenariosModerate Nutrient Loadings
Figure 4.14
TP(m
g/L)
Jan-13 Jul-13 Jan-14 Jul-14 Jan-15 Jul-15 Jan-16 Jul-16 Jan-170
0.01
0.02
0.03
0.04 Moderate Nutrient LoadingsCalibration (Year 1 and Year 2 only)Future Scenario: TP in PW = 0.004 mg/LFuture Scenario: TP in PW = 0.007 mg/LFuture Scenario: TP in PW = 0.010 mg/L

WATER QUALITY MODELING OF MIRAMAR RESERVOIR
FINAL REPORT August 2017 // 31
Appendix A: References Dudek Environmental Consultants (2017). “Technical Memorandum on Identifying Potential Additional Sources of Nutrients to the Miramar Reservoir”, Encinitas, CA, July, 2017.
Water Quality Solutions Inc. (2016). “Limnology and Detention Study of Miramar Reservoir”, WQS Project 151005, McGaheysville, VA, August 2, 2016.

WATER QUALITY MODELING OF MIRAMAR RESERVOIR
FINAL REPORT August 2017 // 32
Appendix B: Additional Figures

NLo
adin
g(k
g/da
y)
Jan-13 Apr-13 Jul-13 Oct-13 Jan-14 Apr-14 Jul-14 Oct-14 Jan-150
2
4
6
8
10
12
14
16Atmospheric DepositionsAquatic VegetationRe-Release of Decomposing Organic MatterWaterfowl FecesStocking of Rainbow TroutTotal Newly-Identified Loadings
Newly-Identified Nitrogen LoadingsModerate Scenario
Figure B.1
NLo
adin
g(k
g/da
y)
Jan-13 Apr-13 Jul-13 Oct-13 Jan-14 Apr-14 Jul-14 Oct-14 Jan-150
2
4
6
8
10
12
14
16Atmospheric DepositionsAquatic VegetationRe-Release of Decomposing Organic MatterWaterfowl FecesStocking of Rainbow TroutTotal Newly-Identified Loadings
Newly-Identified Nitrogen LoadingsHigh Scenario
Figure B.2

PLo
adin
g(k
g/da
y)
Jan-13 Apr-13 Jul-13 Oct-13 Jan-14 Apr-14 Jul-14 Oct-14 Jan-150
0.5
1
1.5
2Atmospheric DepositionsAquatic VegetationRe-Release of Decomposing Organic MatterWaterfowl FecesStocking of Rainbow TroutTotal Newly-Identified Loadings
Newly-Identified Phosphorus LoadingsModerate Scenario
Figure B.3

PLo
adin
g(k
g/da
y)
Jan-13 Apr-13 Jul-13 Oct-13 Jan-14 Apr-14 Jul-14 Oct-14 Jan-150
0.5
1
1.5
2Atmospheric DepositionsAquatic VegetationRe-Release of Decomposing Organic MatterWaterfowl FecesStocking of Rainbow TroutTotal Newly-Identified Loadings
Newly-Identified Phosphorus LoadingsHigh Scenario
Figure B.4

Calibration for TemperatureModerate Nutrient Loadings
Figure B.5
Dep
th(ft
)
Jan-13 Apr-13 Jul-13 Oct-13 Jan-14 Apr-14 Jul-14 Oct-14 Jan-15
0
20
40
60
80
100
120
Temp (oC)2726252423222120191817161514
Measured
Dep
th(ft
)
Jan-13 Apr-13 Jul-13 Oct-13 Jan-14 Apr-14 Jul-14 Oct-14 Jan-15
0
20
40
60
80
100
120
Temp (oC)2726252423222120191817161514
Simulated

Calibration for Dissolved OxygenModerate Nutrient Loadings
Figure B.6Fi

Calibration for AmmoniaModerate Nutrient Loadings
Figure B.7
NH
4-N(m
g/L)
Jan-13 Apr-13 Jul-13 Oct-13 Jan-14 Apr-14 Jul-14 Oct-14 Jan-150
0.5
1
1.5
2
MeasuredSimulated
Surface
NH
4-N(m
g/L)
Jan-13 Apr-13 Jul-13 Oct-13 Jan-14 Apr-14 Jul-14 Oct-14 Jan-150
0.5
1
1.5
2
SimulatedBottom
*No in-reservoir data available at bottom

Calibration for NitrateModerate Nutrient Loadings
Figure B.8
NO
3-N(m
g/L)
Jan-13 Apr-13 Jul-13 Oct-13 Jan-14 Apr-14 Jul-14 Oct-14 Jan-150
0.5
1
1.5
2
MeasuredSimulated
Surface
NO
3-N(m
g/L)
Jan-13 Apr-13 Jul-13 Oct-13 Jan-14 Apr-14 Jul-14 Oct-14 Jan-150
0.5
1
1.5
2
SimulatedBottom
*No in-reservoir data available at bottom

Calibration for Total NitrogenModerate Nutrient Loadings
Figure B.9
TN(m
g/L)
Jan-13 Apr-13 Jul-13 Oct-13 Jan-14 Apr-14 Jul-14 Oct-14 Jan-150
0.5
1
1.5
2
MeasuredSimulated
Surface
TN(m
g/L)
Jan-13 Apr-13 Jul-13 Oct-13 Jan-14 Apr-14 Jul-14 Oct-14 Jan-150
0.5
1
1.5
2
MeasuredSimulated
Bottom
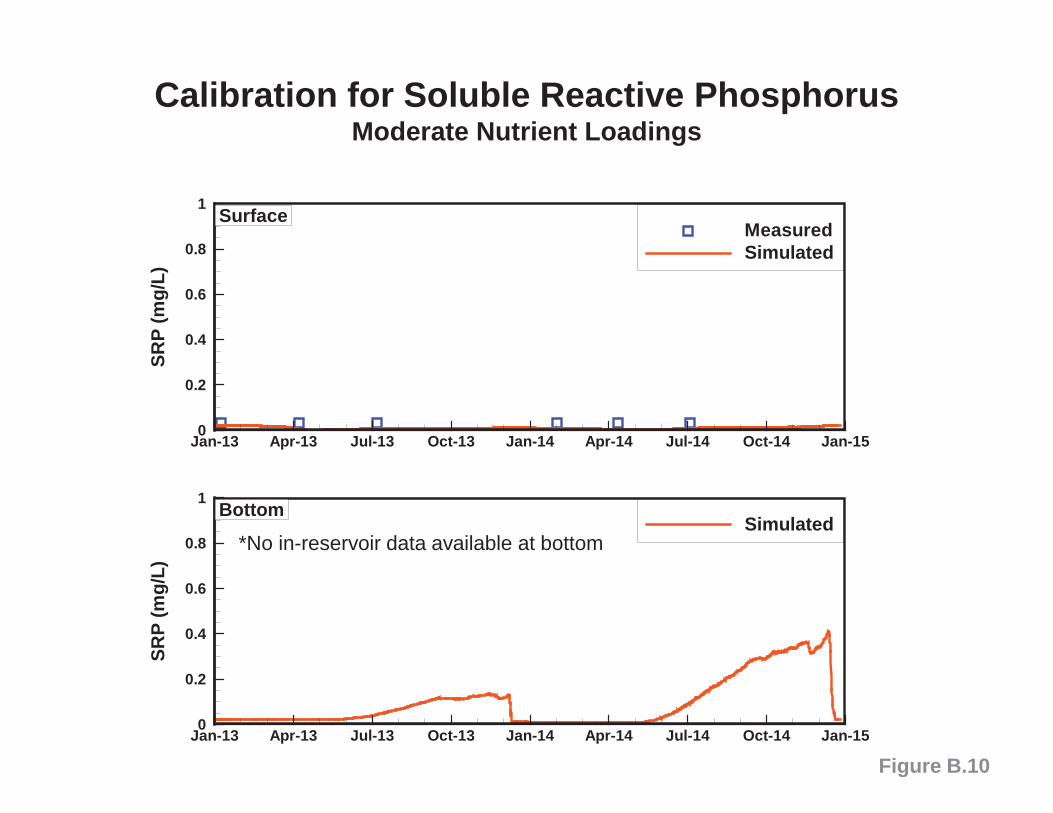
Calibration for Soluble Reactive PhosphorusModerate Nutrient Loadings
Figure B.10
SRP
(mg/
L)
Jan-13 Apr-13 Jul-13 Oct-13 Jan-14 Apr-14 Jul-14 Oct-14 Jan-150
0.2
0.4
0.6
0.8
1
MeasuredSimulated
Surface
SRP
(mg/
L)
Jan-13 Apr-13 Jul-13 Oct-13 Jan-14 Apr-14 Jul-14 Oct-14 Jan-150
0.2
0.4
0.6
0.8
1
SimulatedBottom
*No in-reservoir data available at bottom

Calibration for Total PhosphorusModerate Nutrient Loadings
Figure B.11
TP(m
g/L)
Jan-13 Apr-13 Jul-13 Oct-13 Jan-14 Apr-14 Jul-14 Oct-14 Jan-150
0.2
0.4
0.6
0.8
1
MeasuredSimulated
Surface
TP(m
g/L)
Jan-13 Apr-13 Jul-13 Oct-13 Jan-14 Apr-14 Jul-14 Oct-14 Jan-150
0.2
0.4
0.6
0.8
1
MeasuredSimulated
Bottom

Calibration for pHModerate Nutrient Loadings
Figure B.12
pH
Jan-13 Apr-13 Jul-13 Oct-13 Jan-14 Apr-14 Jul-14 Oct-14 Jan-154
6
8
10
MeasuredSimulated
Surface
pH
Jan-13 Apr-13 Jul-13 Oct-13 Jan-14 Apr-14 Jul-14 Oct-14 Jan-154
6
8
10
MeasuredSimulated
Bottom

Calibration for TemperatureHigh Nutrient Loadings
Figure B.13
Dep
th(ft
)
Jan-13 Apr-13 Jul-13 Oct-13 Jan-14 Apr-14 Jul-14 Oct-14 Jan-15
0
20
40
60
80
100
120
Temp (oC)2726252423222120191817161514
Measured
Dep
th(ft
)
Jan-13 Apr-13 Jul-13 Oct-13 Jan-14 Apr-14 Jul-14 Oct-14 Jan-15
0
20
40
60
80
100
120
Temp (oC)2726252423222120191817161514
Simulated

Calibration for Dissolved OxygenHigh Nutrient Loadings
Figure B.14
DO
(mg/
L)
Jan-13 Apr-13 Jul-13 Oct-13 Jan-14 Apr-14 Jul-14 Oct-14 Jan-150
5
10
15
20
MeasuredSimulated
Surface
DO
(mg/
L)
Jan-13 Apr-13 Jul-13 Oct-13 Jan-14 Apr-14 Jul-14 Oct-14 Jan-150
5
10
15
20
MeasuredSimulated
Bottom

Calibration for AmmoniaHigh Nutrient Loadings
Figure B.15
NH
4-N(m
g/L)
Jan-13 Apr-13 Jul-13 Oct-13 Jan-14 Apr-14 Jul-14 Oct-14 Jan-150
0.5
1
1.5
2
MeasuredSimulated
Surface
NH
4-N(m
g/L)
Jan-13 Apr-13 Jul-13 Oct-13 Jan-14 Apr-14 Jul-14 Oct-14 Jan-150
0.5
1
1.5
2
SimulatedBottom
*No in-reservoir data available at bottom
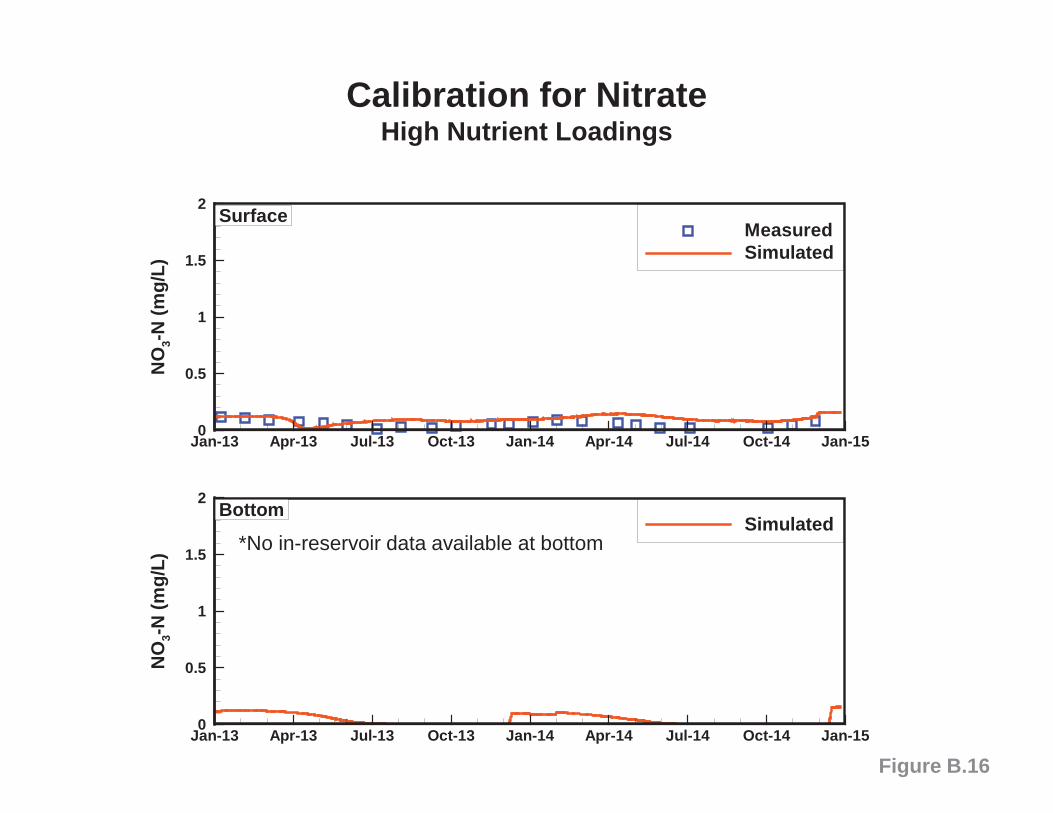
Calibration for NitrateHigh Nutrient Loadings
Figure B.16
NO
3-N(m
g/L)
Jan-13 Apr-13 Jul-13 Oct-13 Jan-14 Apr-14 Jul-14 Oct-14 Jan-150
0.5
1
1.5
2
MeasuredSimulated
Surface
NO
3-N(m
g/L)
Jan-13 Apr-13 Jul-13 Oct-13 Jan-14 Apr-14 Jul-14 Oct-14 Jan-150
0.5
1
1.5
2
SimulatedBottom
*No in-reservoir data available at bottom

Calibration for Total NitrogenHigh Nutrient Loadings
Figure B.17
TN(m
g/L)
Jan-13 Apr-13 Jul-13 Oct-13 Jan-14 Apr-14 Jul-14 Oct-14 Jan-150
0.5
1
1.5
2
MeasuredSimulated
Surface
TN(m
g/L)
Jan-13 Apr-13 Jul-13 Oct-13 Jan-14 Apr-14 Jul-14 Oct-14 Jan-150
0.5
1
1.5
2
MeasuredSimulated
Bottom

Calibration for Soluble Reactive PhosphorusHigh Nutrient Loadings
Figure B.18
SRP
(mg/
L)
Jan-13 Apr-13 Jul-13 Oct-13 Jan-14 Apr-14 Jul-14 Oct-14 Jan-150
0.2
0.4
0.6
0.8
1
MeasuredSimulated
Surface
SRP
(mg/
L)
Jan-13 Apr-13 Jul-13 Oct-13 Jan-14 Apr-14 Jul-14 Oct-14 Jan-150
0.2
0.4
0.6
0.8
1
SimulatedBottom
*No in-reservoir data available at bottom

Calibration for Total PhosphorusHigh Nutrient Loadings
Figure B.19
TP(m
g/L)
Jan-13 Apr-13 Jul-13 Oct-13 Jan-14 Apr-14 Jul-14 Oct-14 Jan-150
0.2
0.4
0.6
0.8
1
MeasuredSimulated
Surface
TP(m
g/L)
Jan-13 Apr-13 Jul-13 Oct-13 Jan-14 Apr-14 Jul-14 Oct-14 Jan-150
0.2
0.4
0.6
0.8
1
MeasuredSimulated
Bottom

Calibration for pHHigh Nutrient Loadings
Figure B.20
pH
Jan-13 Apr-13 Jul-13 Oct-13 Jan-14 Apr-14 Jul-14 Oct-14 Jan-154
6
8
10
MeasuredSimulated
Surface
pH
Jan-13 Apr-13 Jul-13 Oct-13 Jan-14 Apr-14 Jul-14 Oct-14 Jan-154
6
8
10
MeasuredSimulated
Bottom

Future Scenario: Water Surface Elevation*Moderate and High Nutrient Loadings
Figure B.21
Elev
atio
n(ft
)
Jan-13 Jul-13 Jan-14 Jul-14 Jan-15 Jul-15 Jan-16 Jul-16 Jan-17680
685
690
695
700
705
710
715
720
*Water surface elevation does not change with nutrient loadings.
Dep
th(ft
)
Jan-13 Jul-13 Jan-14 Jul-14 Jan-15 Jul-15 Jan-16 Jul-16 Jan-17
0
20
40
60
80
100
120
Temp (oC)2726252423222120191817161514
Dep
th(ft
)
Jan-13 Jul-13 Jan-14 Jul-14 Jan-15 Jul-15 Jan-16 Jul-16 Jan-17
0
20
40
60
80
100
120
600575550525500475450425400375350325300
Cond.( S/cm)
Future Scenario: Water Temperature and Conductivity*Moderate and High Nutrient Loadings
Figure B.22*Water temperature and conductivity do not change with nutrient loadings.

DO
(mg/
L)
Jan-13 Jul-13 Jan-14 Jul-14 Jan-15 Jul-15 Jan-16 Jul-16 Jan-170
5
10
15
20Surface
DO
(mg/
L)
Jan-13 Jul-13 Jan-14 Jul-14 Jan-15 Jul-15 Jan-16 Jul-16 Jan-170
5
10
15
20 Bottom
Future Scenario: Dissolved OxygenTP = 0.004 mg/L in PW; High Nutrient Loadings
Figure B.23

Future Scenario: AmmoniaTP = 0.004 mg/L in PW; High Nutrient Loadings
Figure B.24

NO
3-N(m
g/L)
Jan-13 Jul-13 Jan-14 Jul-14 Jan-15 Jul-15 Jan-16 Jul-16 Jan-170
0.5
1
1.5
2Surface
NO
3-N(m
g/L)
Jan-13 Jul-13 Jan-14 Jul-14 Jan-15 Jul-15 Jan-16 Jul-16 Jan-170
0.5
1
1.5
2 Bottom
Future Scenario: NitrateTP = 0.004 mg/L in PW; High Nutrient Loadings
Figure B.25

Future Scenario: Total NitrogenTP = 0.004 mg/L in PW; High Nutrient Loadings
Figure B.26

SRP
(mg/
L)
Jan-13 Jul-13 Jan-14 Jul-14 Jan-15 Jul-15 Jan-16 Jul-16 Jan-170
0.2
0.4
0.6
0.8
1Surface
SRP
(mg/
L)
Jan-13 Jul-13 Jan-14 Jul-14 Jan-15 Jul-15 Jan-16 Jul-16 Jan-170
0.2
0.4
0.6
0.8
1 Bottom
Future Scenario: Soluble Reactive PhosphorusTP = 0.004 mg/L in PW; High Nutrient Loadings
Figure B.27

Future Scenario: Total PhosphorusTP = 0.004 mg/L in PW; High Nutrient Loadings
Figure B.28

Future Scenario: pHTP = 0.004 mg/L in PW; High Nutrient Loadings
Figure B.29

DO
(mg/
L)
Jan-13 Jul-13 Jan-14 Jul-14 Jan-15 Jul-15 Jan-16 Jul-16 Jan-170
5
10
15
20Surface
DO
(mg/
L)
Jan-13 Jul-13 Jan-14 Jul-14 Jan-15 Jul-15 Jan-16 Jul-16 Jan-170
5
10
15
20 Bottom
Future Scenario: Dissolved OxygenTP = 0.007 mg/L in PW; Moderate Nutrient Loadings
Figure B.30

NH
4-N(m
g/L)
Jan-13 Jul-13 Jan-14 Jul-14 Jan-15 Jul-15 Jan-16 Jul-16 Jan-170
0.5
1
1.5
2Surface
NH
4-N(m
g/L)
Jan-13 Jul-13 Jan-14 Jul-14 Jan-15 Jul-15 Jan-16 Jul-16 Jan-170
0.5
1
1.5
2 Bottom
Future Scenario: AmmoniaTP = 0.007 mg/L in PW; Moderate Nutrient Loadings
Figure B.31

NO
3-N(m
g/L)
Jan-13 Jul-13 Jan-14 Jul-14 Jan-15 Jul-15 Jan-16 Jul-16 Jan-170
0.5
1
1.5
2Surface
NO
3-N(m
g/L)
Jan-13 Jul-13 Jan-14 Jul-14 Jan-15 Jul-15 Jan-16 Jul-16 Jan-170
0.5
1
1.5
2 Bottom
Future Scenario: NitrateTP = 0.007 mg/L in PW; Moderate Nutrient Loadings
Figure B.32

TN(m
g/L)
Jan-13 Jul-13 Jan-14 Jul-14 Jan-15 Jul-15 Jan-16 Jul-16 Jan-170
0.5
1
1.5
2Surface
TN(m
g/L)
Jan-13 Jul-13 Jan-14 Jul-14 Jan-15 Jul-15 Jan-16 Jul-16 Jan-170
0.5
1
1.5
2 Bottom
Future Scenario: Total NitrogenTP = 0.007 mg/L in PW; Moderate Nutrient Loadings
Figure B.33

SRP
(mg/
L)
Jan-13 Jul-13 Jan-14 Jul-14 Jan-15 Jul-15 Jan-16 Jul-16 Jan-170
0.2
0.4
0.6
0.8
1Surface
SRP
(mg/
L)
Jan-13 Jul-13 Jan-14 Jul-14 Jan-15 Jul-15 Jan-16 Jul-16 Jan-170
0.2
0.4
0.6
0.8
1 Bottom
Future Scenario: Soluble Reactive PhosphorusTP = 0.007 mg/L in PW; Moderate Nutrient Loadings
Figure B.34

TP(m
g/L)
Jan-13 Jul-13 Jan-14 Jul-14 Jan-15 Jul-15 Jan-16 Jul-16 Jan-170
0.2
0.4
0.6
0.8
1Surface
TP(m
g/L)
Jan-13 Jul-13 Jan-14 Jul-14 Jan-15 Jul-15 Jan-16 Jul-16 Jan-170
0.2
0.4
0.6
0.8
1 Bottom
Future Scenario: Total PhosphorusTP = 0.007 mg/L in PW; Moderate Nutrient Loadings
Figure B.35

pH
Jan-13 Jul-13 Jan-14 Jul-14 Jan-15 Jul-15 Jan-16 Jul-16 Jan-174
5
6
7
8
9
10Surface
pH
Jan-13 Jul-13 Jan-14 Jul-14 Jan-15 Jul-15 Jan-16 Jul-16 Jan-174
5
6
7
8
9
10 Bottom
Future Scenario: pHTP = 0.007 mg/L in PW; Moderate Nutrient Loadings
Figure B.36

DO
(mg/
L)
Jan-13 Jul-13 Jan-14 Jul-14 Jan-15 Jul-15 Jan-16 Jul-16 Jan-170
5
10
15
20Surface
DO
(mg/
L)
Jan-13 Jul-13 Jan-14 Jul-14 Jan-15 Jul-15 Jan-16 Jul-16 Jan-170
5
10
15
20 Bottom
Future Scenario: Dissolved OxygenTP = 0.010 mg/L in PW; Moderate Nutrient Loadings
Figure B.37

NH
4-N(m
g/L)
Jan-13 Jul-13 Jan-14 Jul-14 Jan-15 Jul-15 Jan-16 Jul-16 Jan-170
0.5
1
1.5
2Surface
NH
4-N(m
g/L)
Jan-13 Jul-13 Jan-14 Jul-14 Jan-15 Jul-15 Jan-16 Jul-16 Jan-170
0.5
1
1.5
2 Bottom
Future Scenario: AmmoniaTP = 0.010 mg/L in PW; Moderate Nutrient Loadings
Figure B.38

NO
3-N(m
g/L)
Jan-13 Jul-13 Jan-14 Jul-14 Jan-15 Jul-15 Jan-16 Jul-16 Jan-170
0.5
1
1.5
2Surface
NO
3-N(m
g/L)
Jan-13 Jul-13 Jan-14 Jul-14 Jan-15 Jul-15 Jan-16 Jul-16 Jan-170
0.5
1
1.5
2 Bottom
Future Scenario: NitrateTP = 0.010 mg/L in PW; Moderate Nutrient Loadings
Figure B.39

TN(m
g/L)
Jan-13 Jul-13 Jan-14 Jul-14 Jan-15 Jul-15 Jan-16 Jul-16 Jan-170
0.5
1
1.5
2Surface
TN(m
g/L)
Jan-13 Jul-13 Jan-14 Jul-14 Jan-15 Jul-15 Jan-16 Jul-16 Jan-170
0.5
1
1.5
2 Bottom
Future Scenario: Total NitrogenTP = 0.010 mg/L in PW; Moderate Nutrient Loadings
Figure B.40

SRP
(mg/
L)
Jan-13 Jul-13 Jan-14 Jul-14 Jan-15 Jul-15 Jan-16 Jul-16 Jan-170
0.2
0.4
0.6
0.8
1Surface
SRP
(mg/
L)
Jan-13 Jul-13 Jan-14 Jul-14 Jan-15 Jul-15 Jan-16 Jul-16 Jan-170
0.2
0.4
0.6
0.8
1 Bottom
Future Scenario: Soluble Reactive PhosphorusTP = 0.010 mg/L in PW; Moderate Nutrient Loadings
Figure B.41

TP(m
g/L)
Jan-13 Jul-13 Jan-14 Jul-14 Jan-15 Jul-15 Jan-16 Jul-16 Jan-170
0.2
0.4
0.6
0.8
1Surface
TP(m
g/L)
Jan-13 Jul-13 Jan-14 Jul-14 Jan-15 Jul-15 Jan-16 Jul-16 Jan-170
0.2
0.4
0.6
0.8
1 Bottom
Future Scenario: Total PhosphorusTP = 0.010 mg/L in PW; Moderate Nutrient Loadings
Figure B.42

pH
Jan-13 Jul-13 Jan-14 Jul-14 Jan-15 Jul-15 Jan-16 Jul-16 Jan-174
5
6
7
8
9
10Surface
pH
Jan-13 Jul-13 Jan-14 Jul-14 Jan-15 Jul-15 Jan-16 Jul-16 Jan-174
5
6
7
8
9
10 Bottom
Future Scenario: pHTP = 0.010 mg/L in PW; Moderate Nutrient Loadings
Figure B.43