Embed Size (px)
Citation preview
California Water Service 2015 Urban Water Management Plan
Hermosa-Redondo District
Printed 5/13/2016
Appendix G: Supplemental Water Supply Information
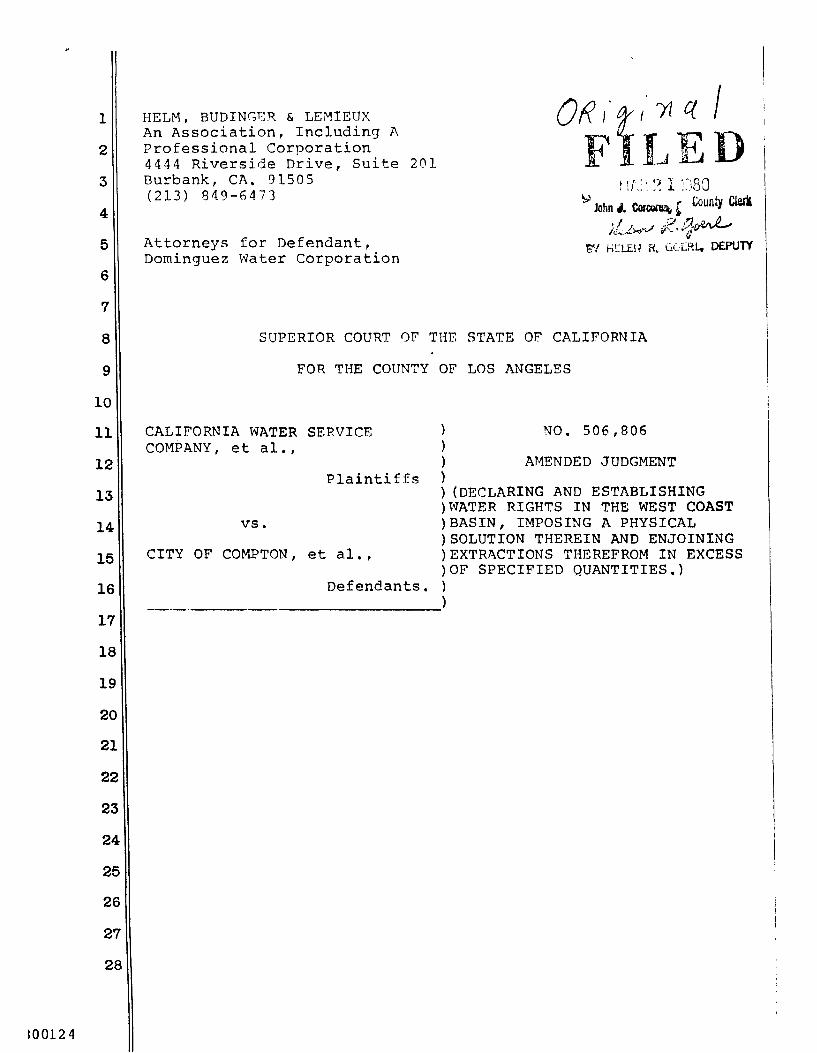
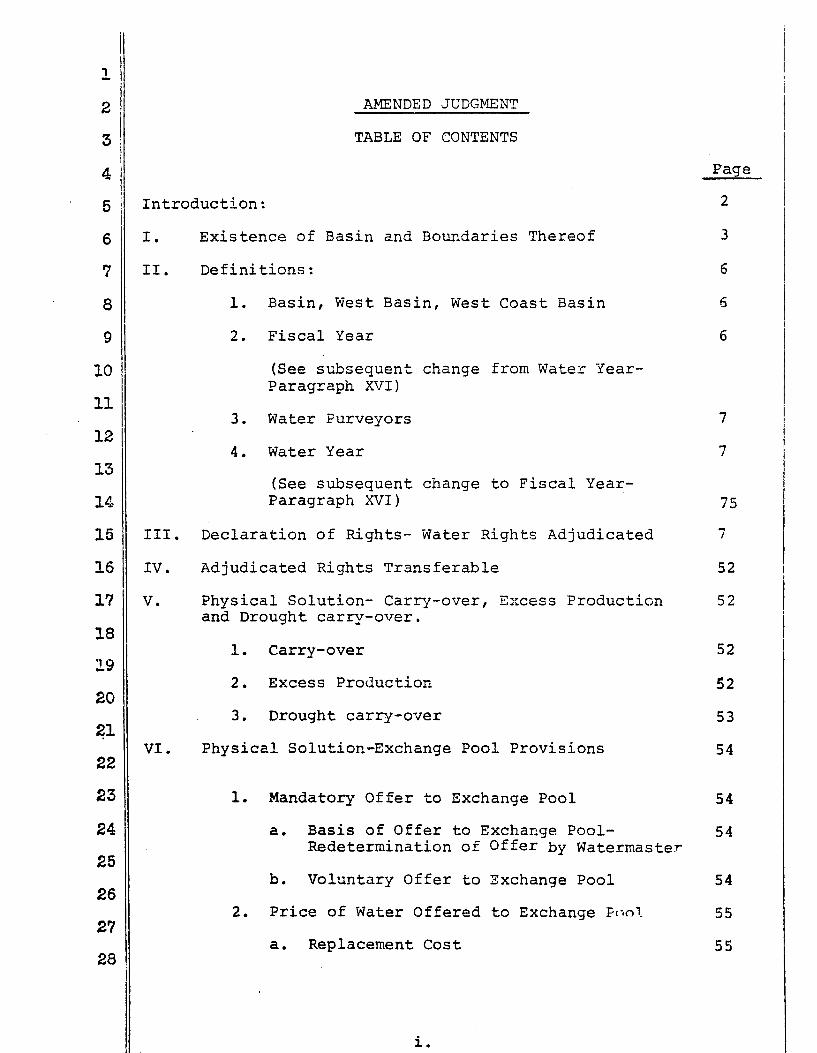
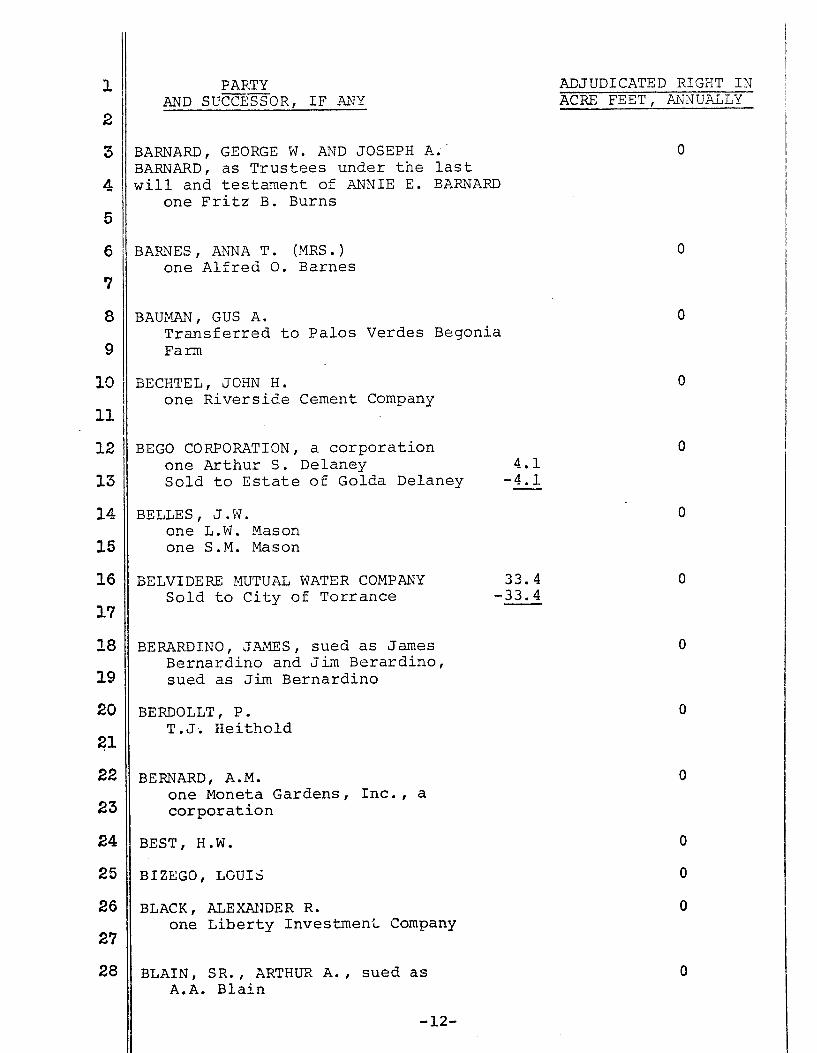
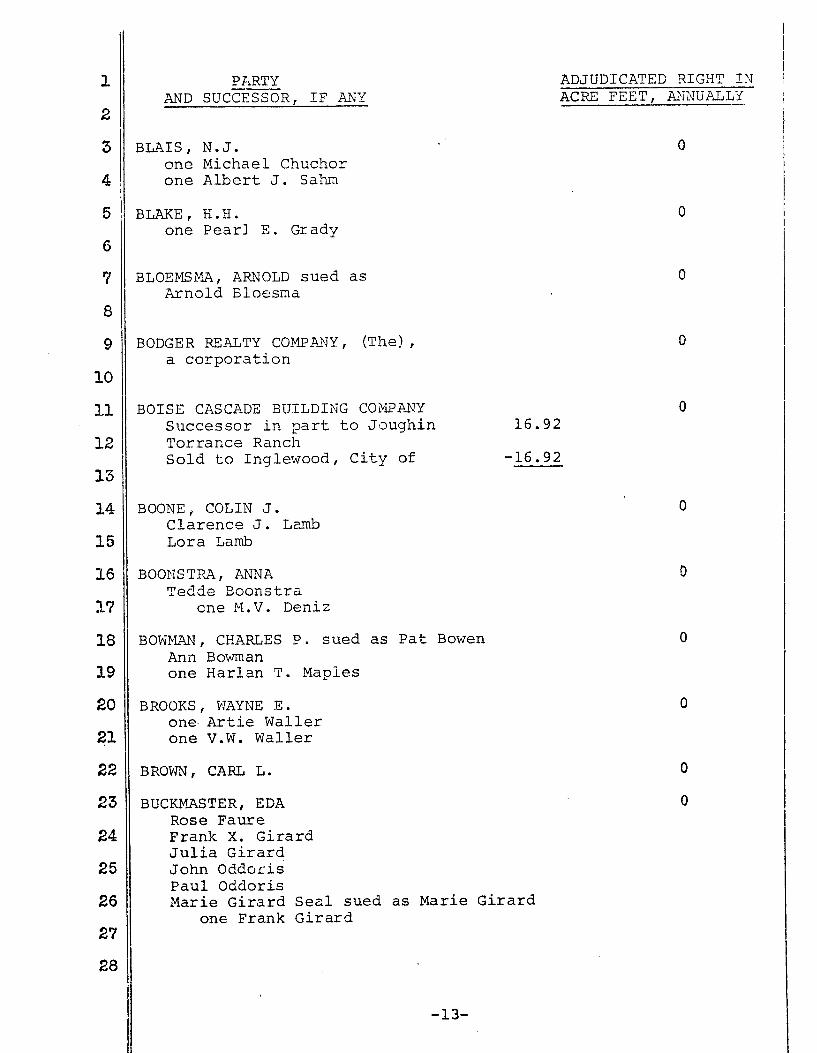
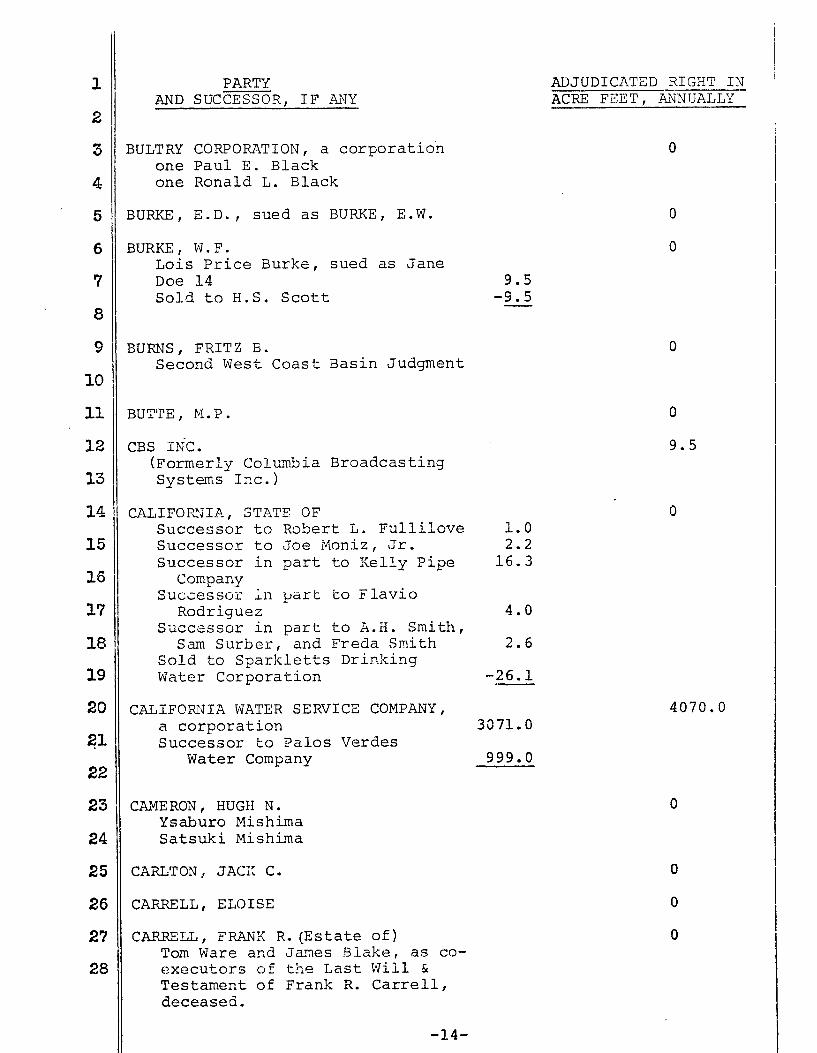
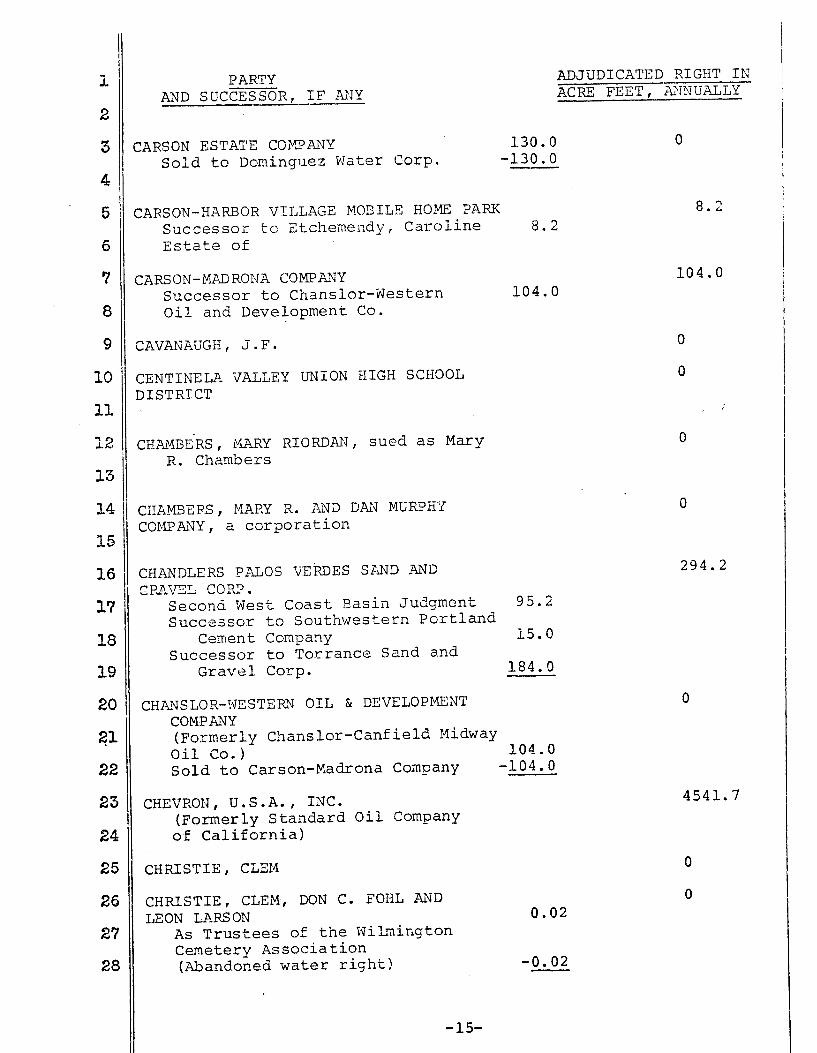
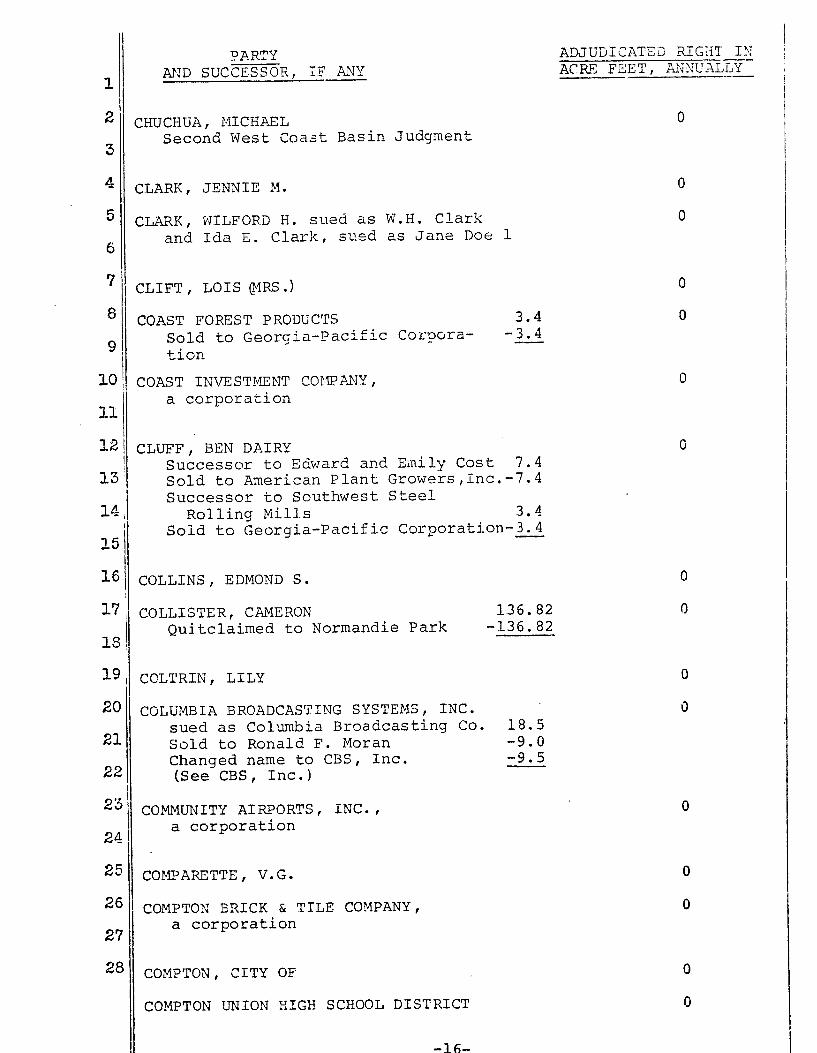
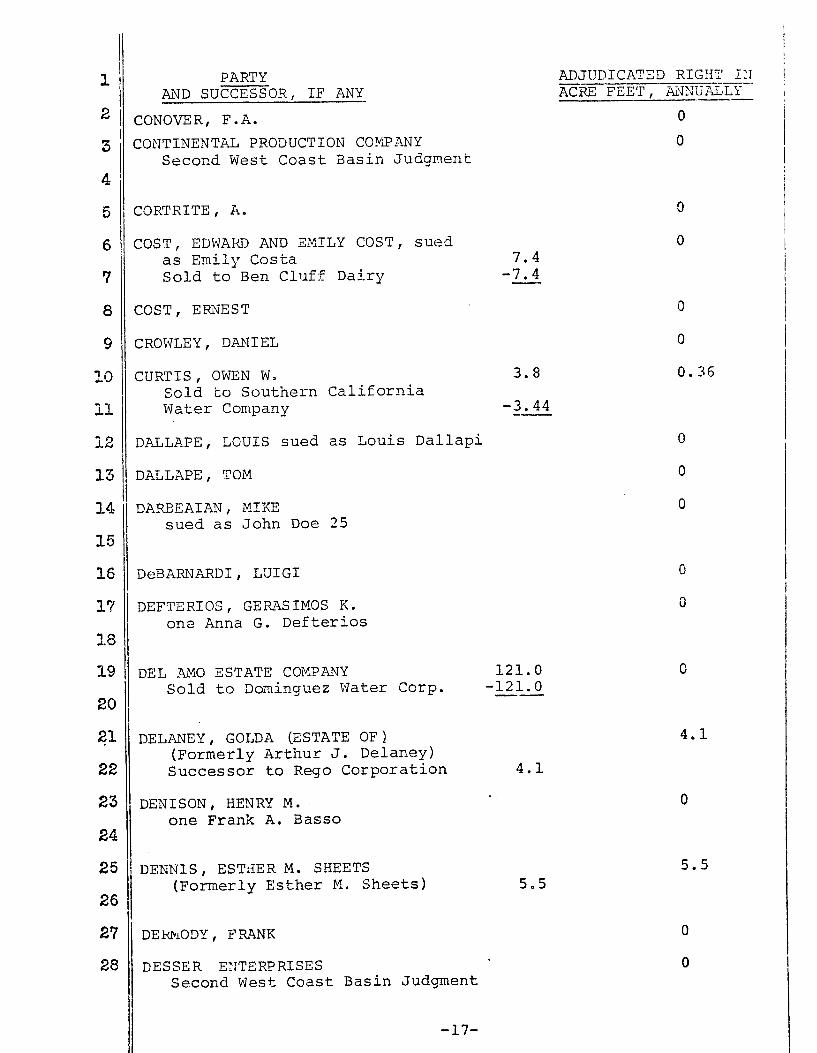
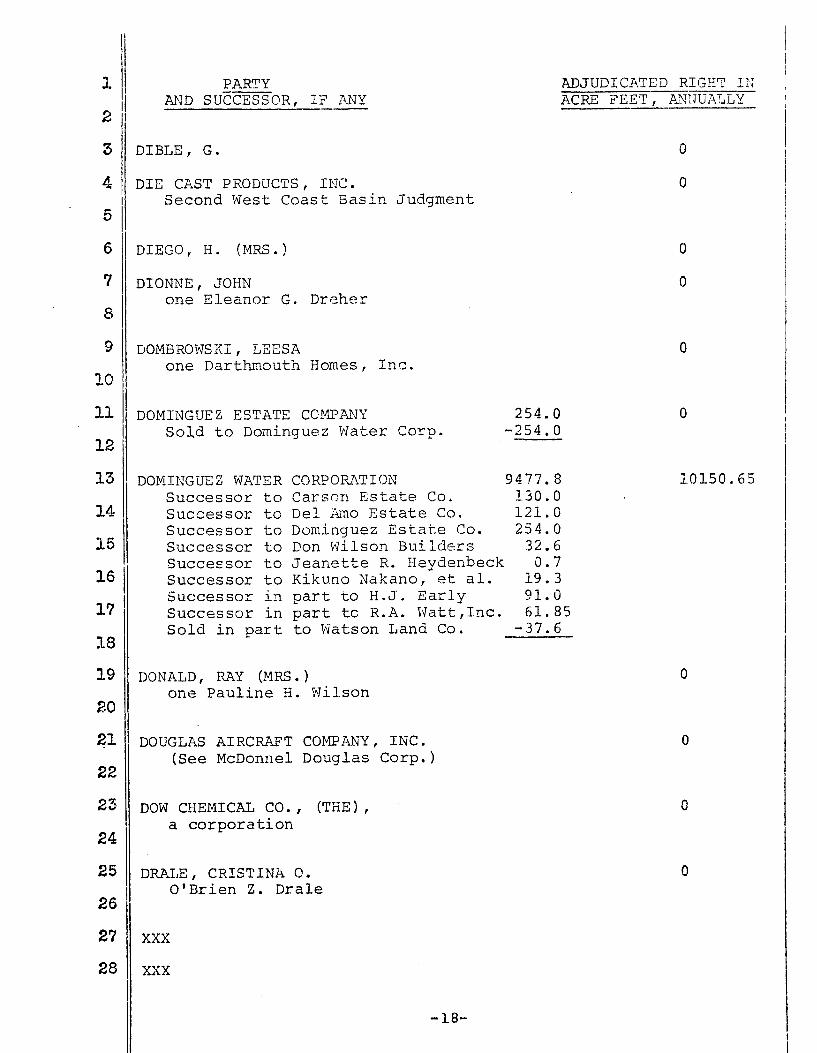
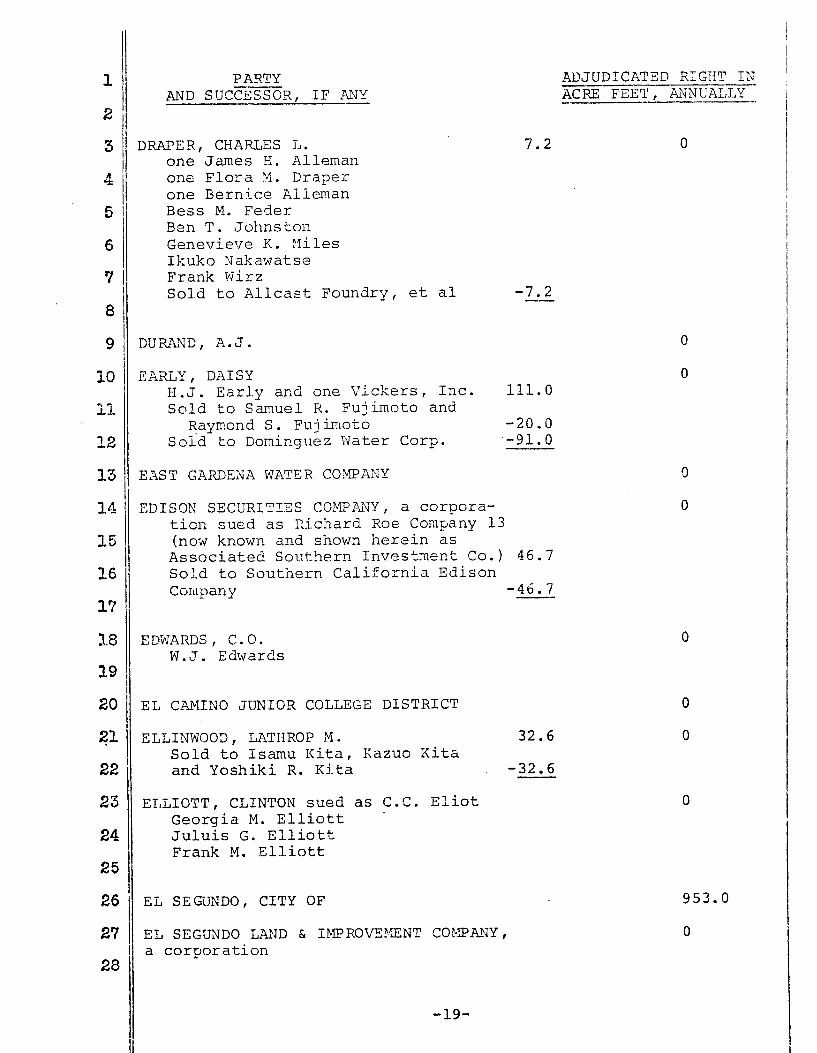
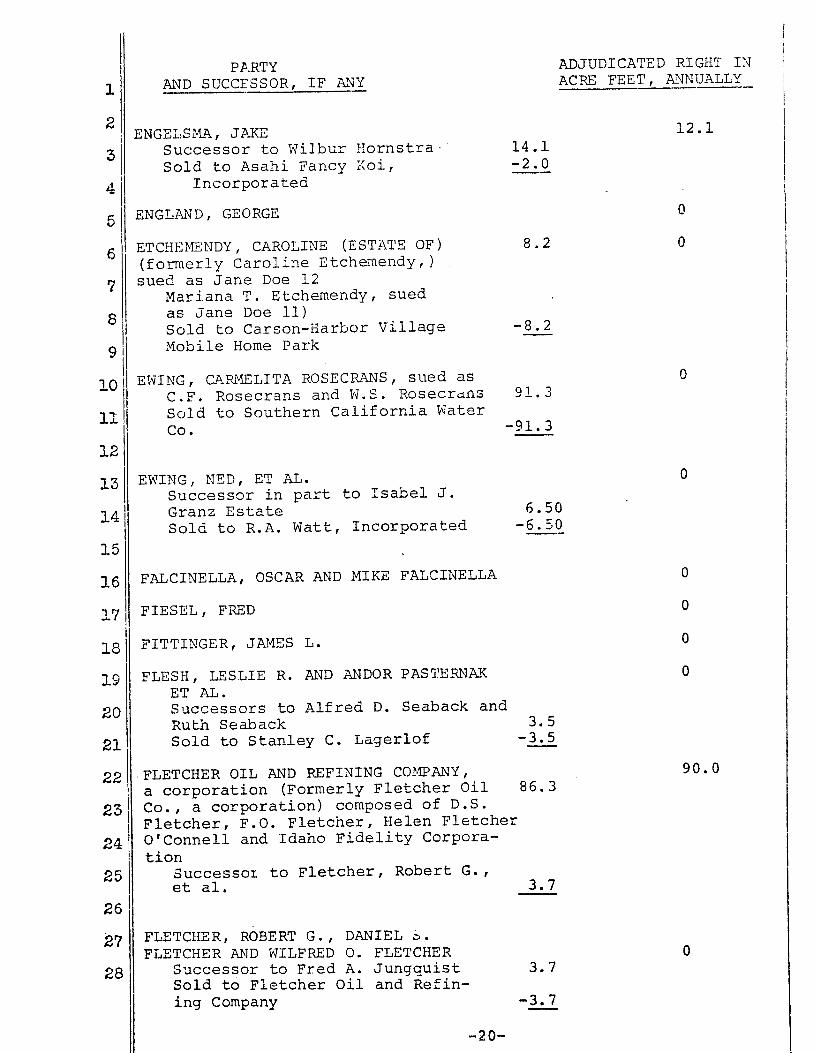
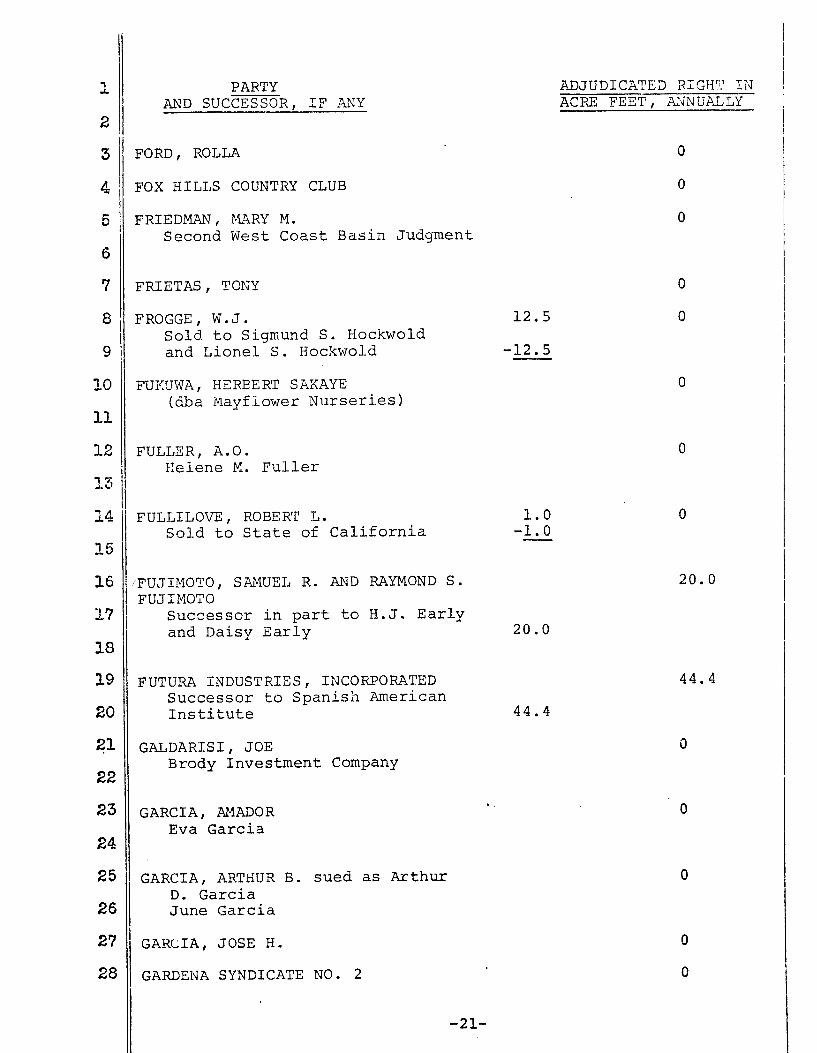
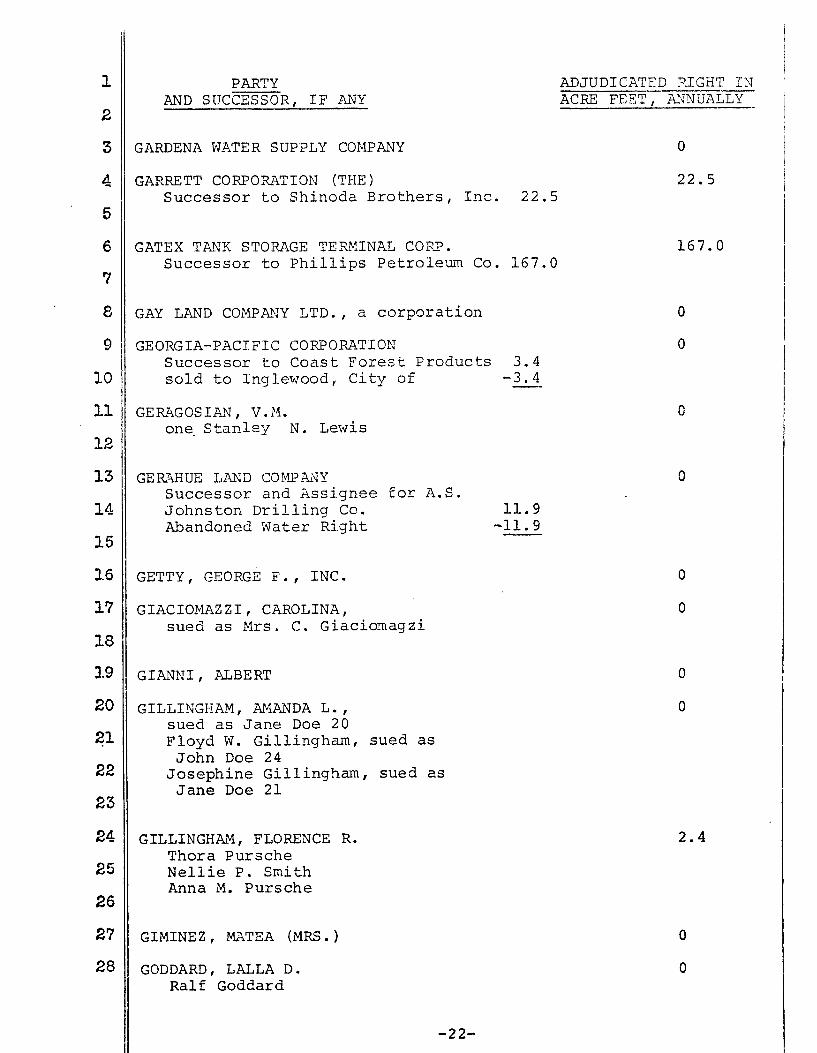
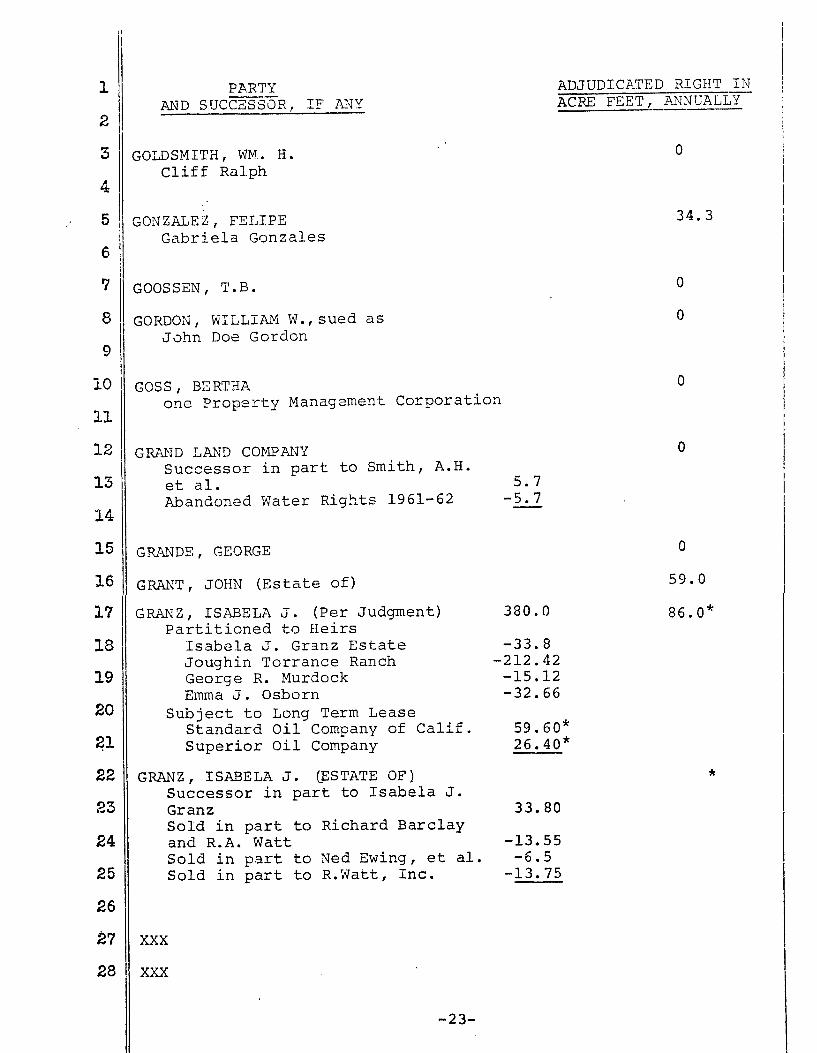
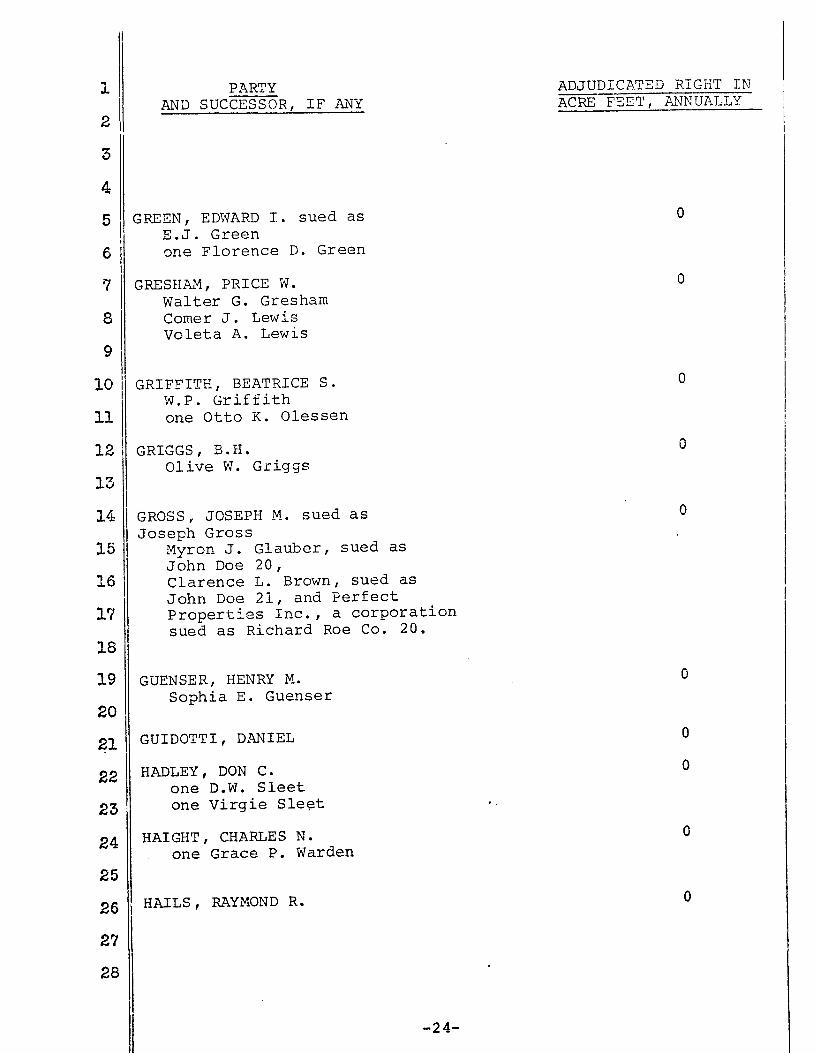
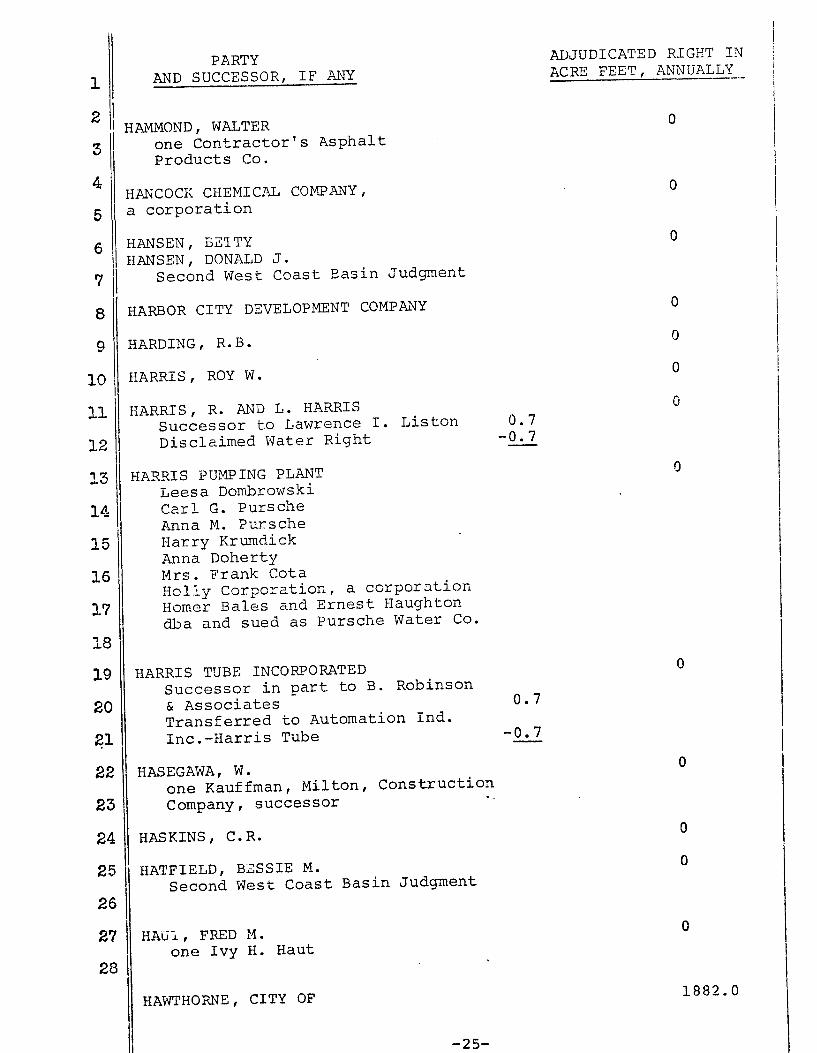
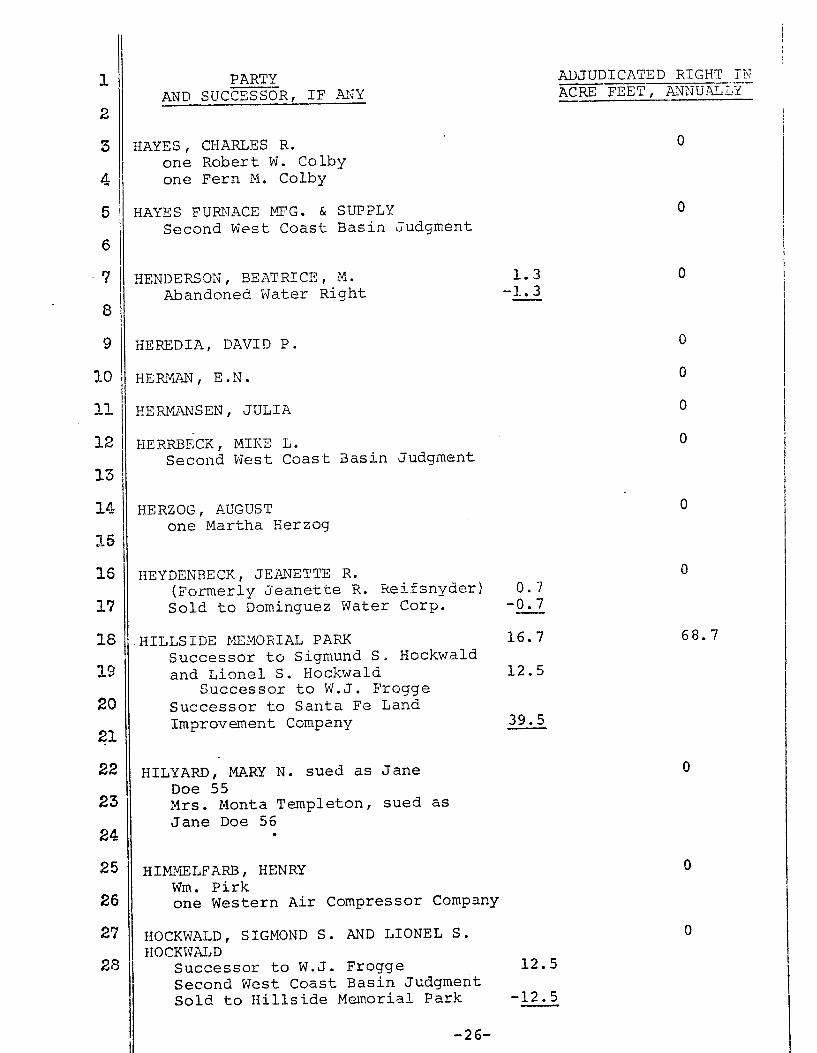
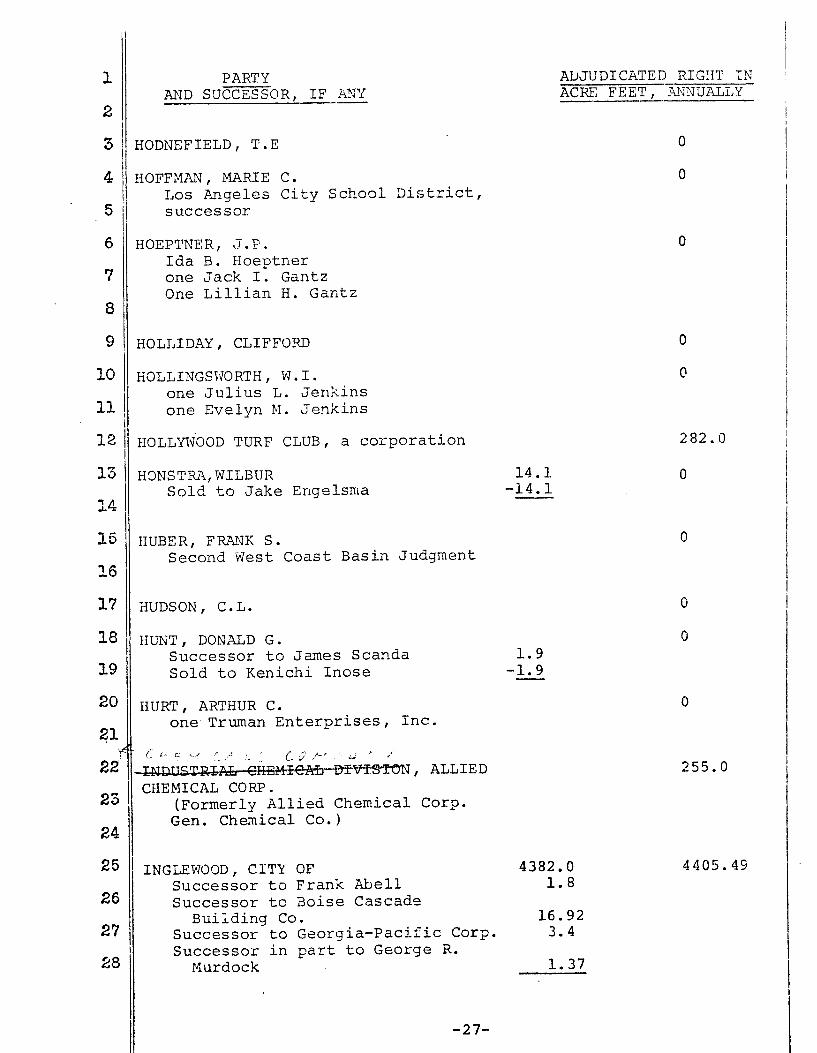
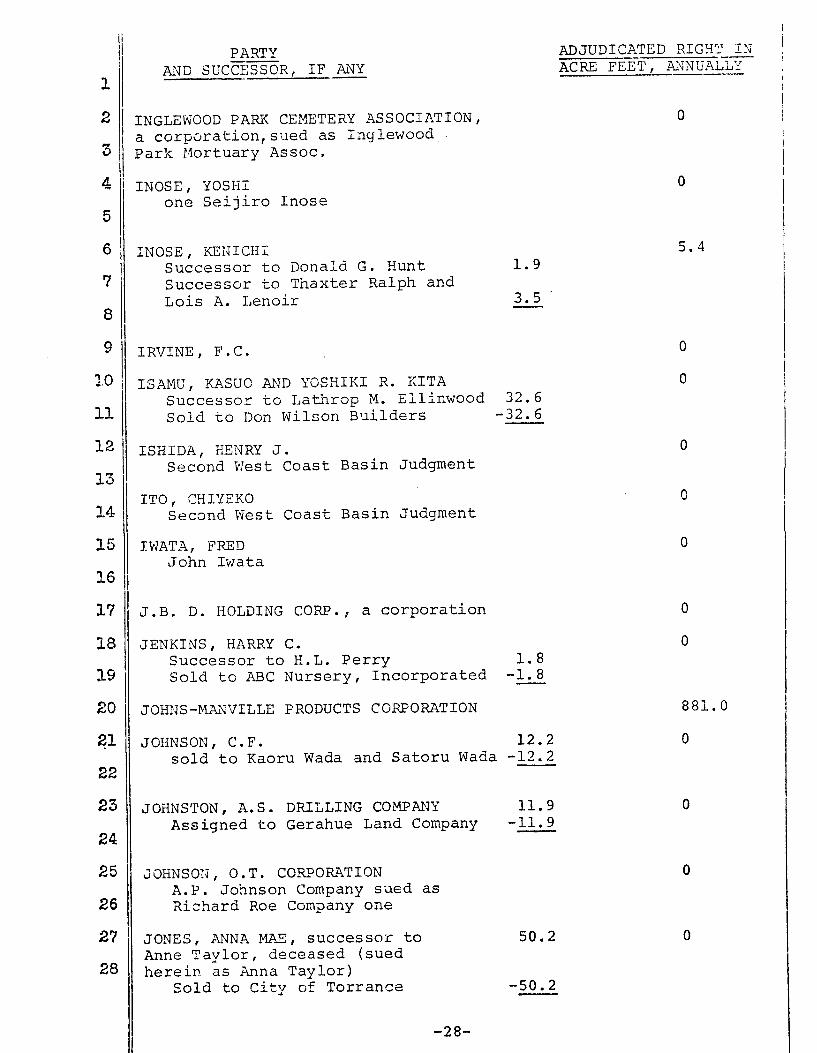
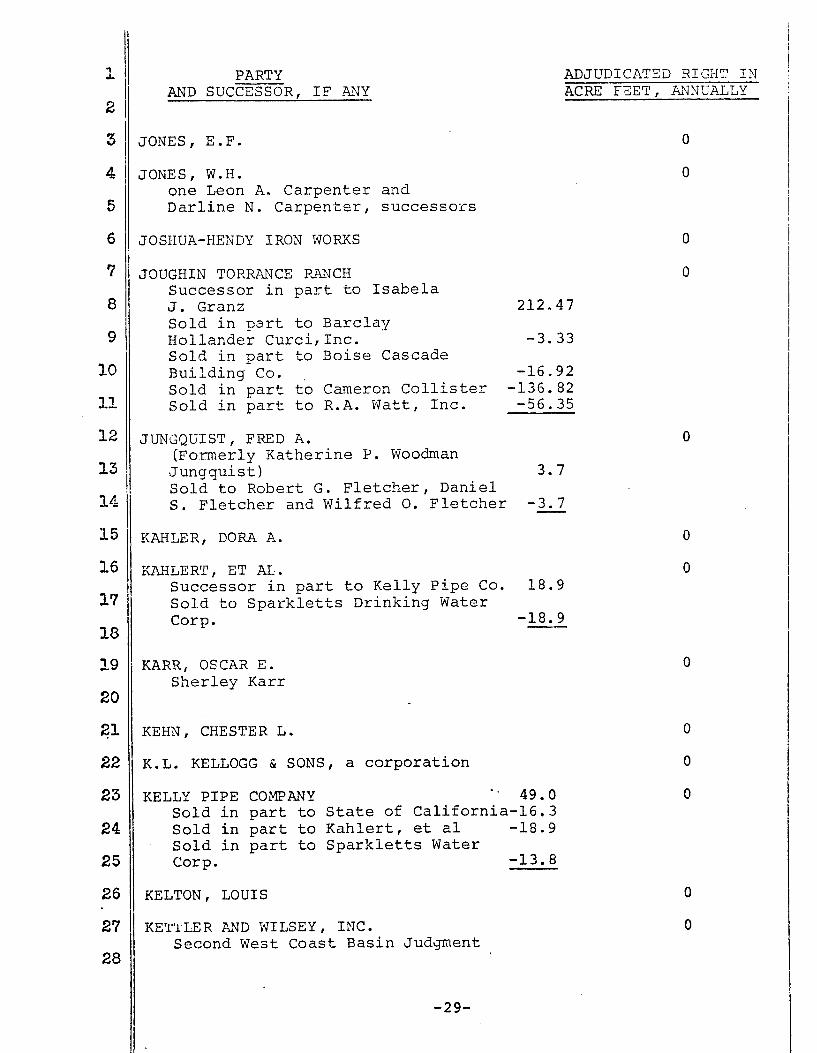
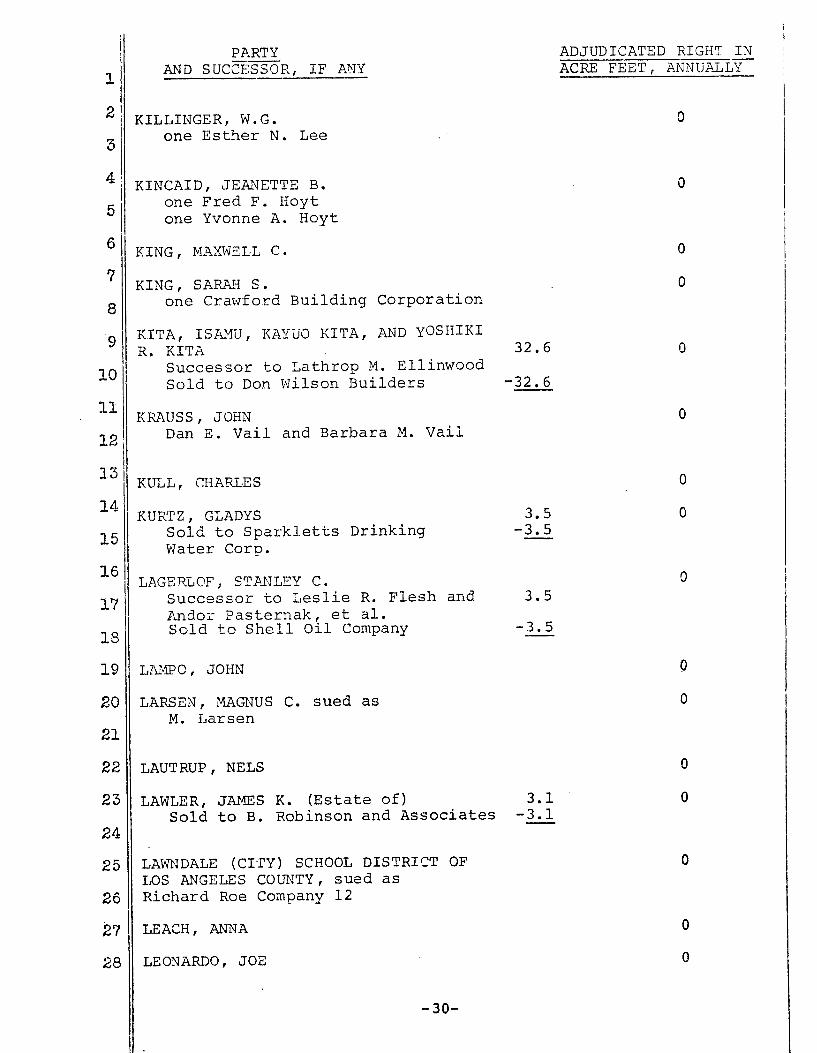
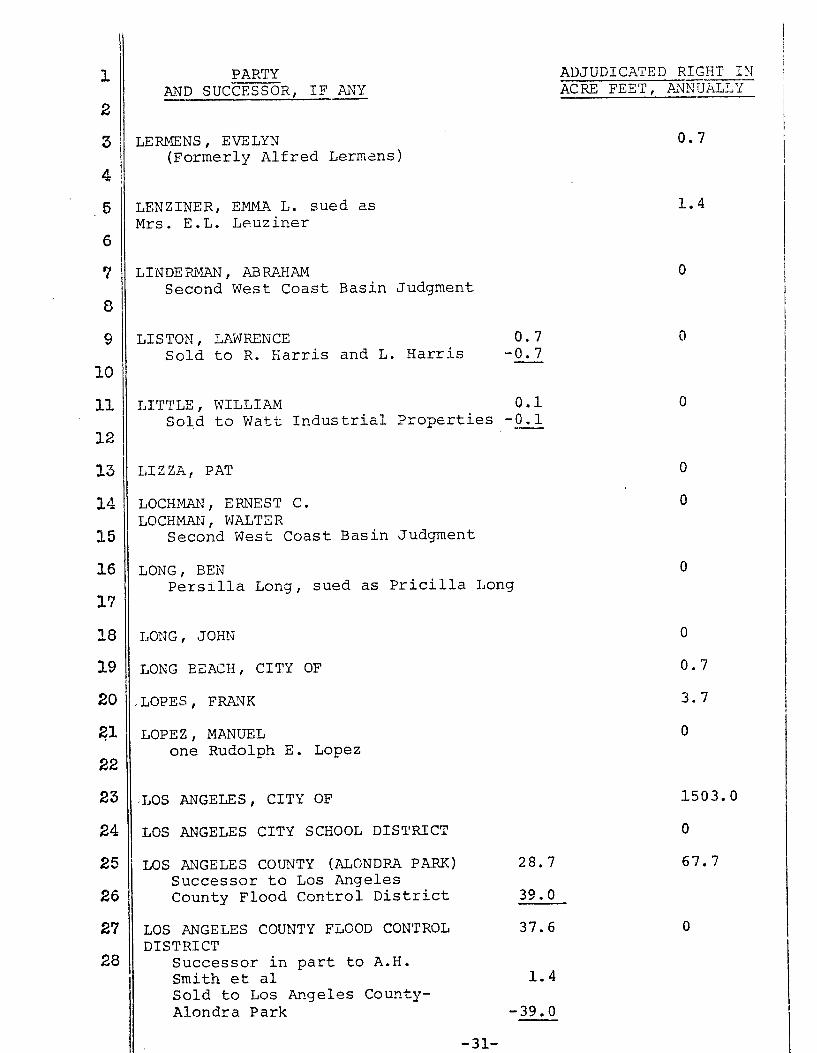
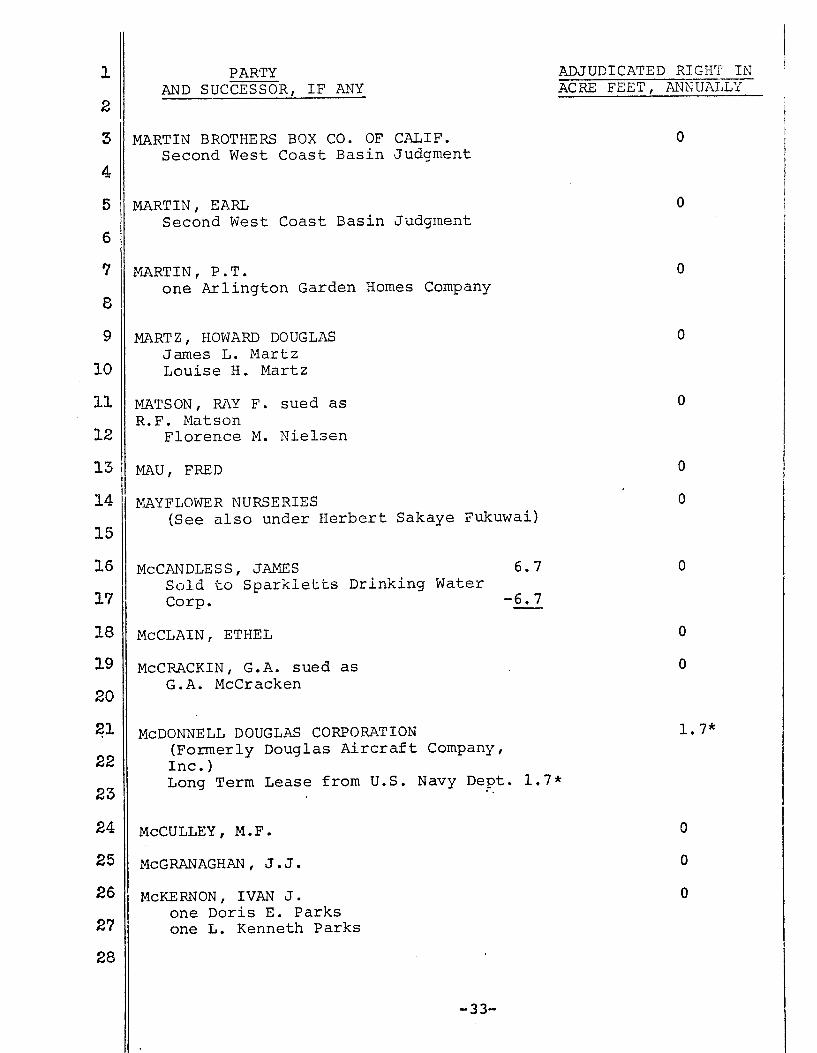
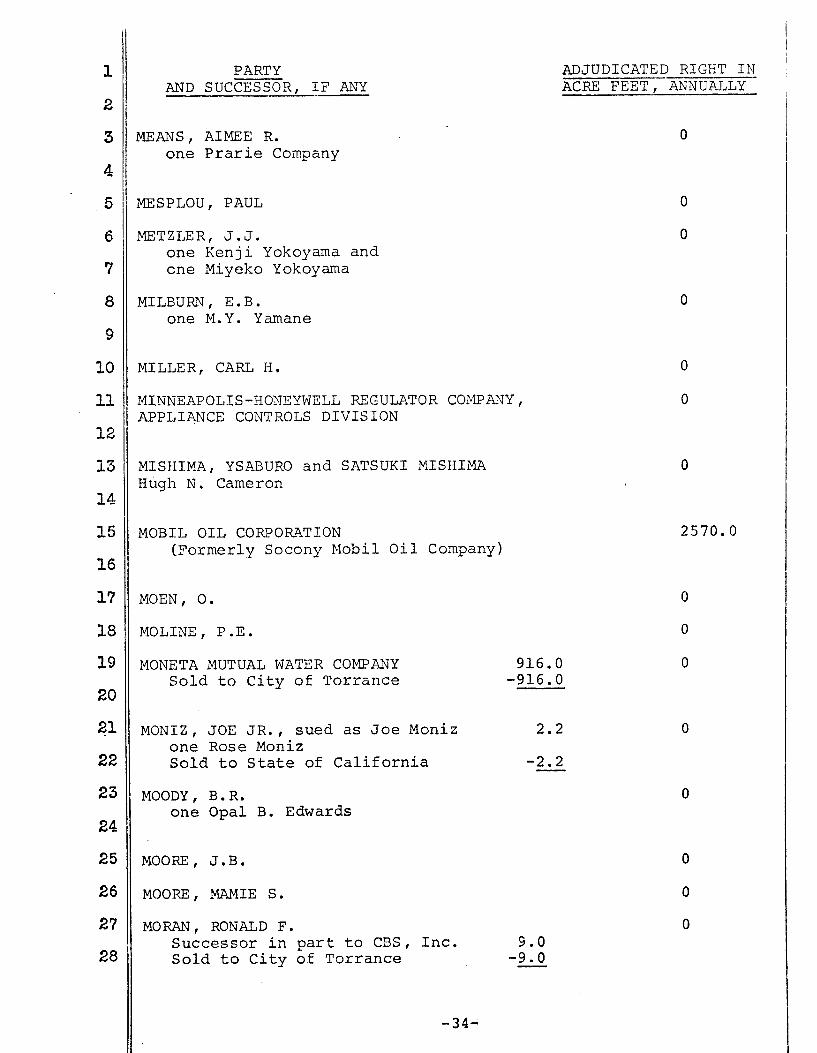
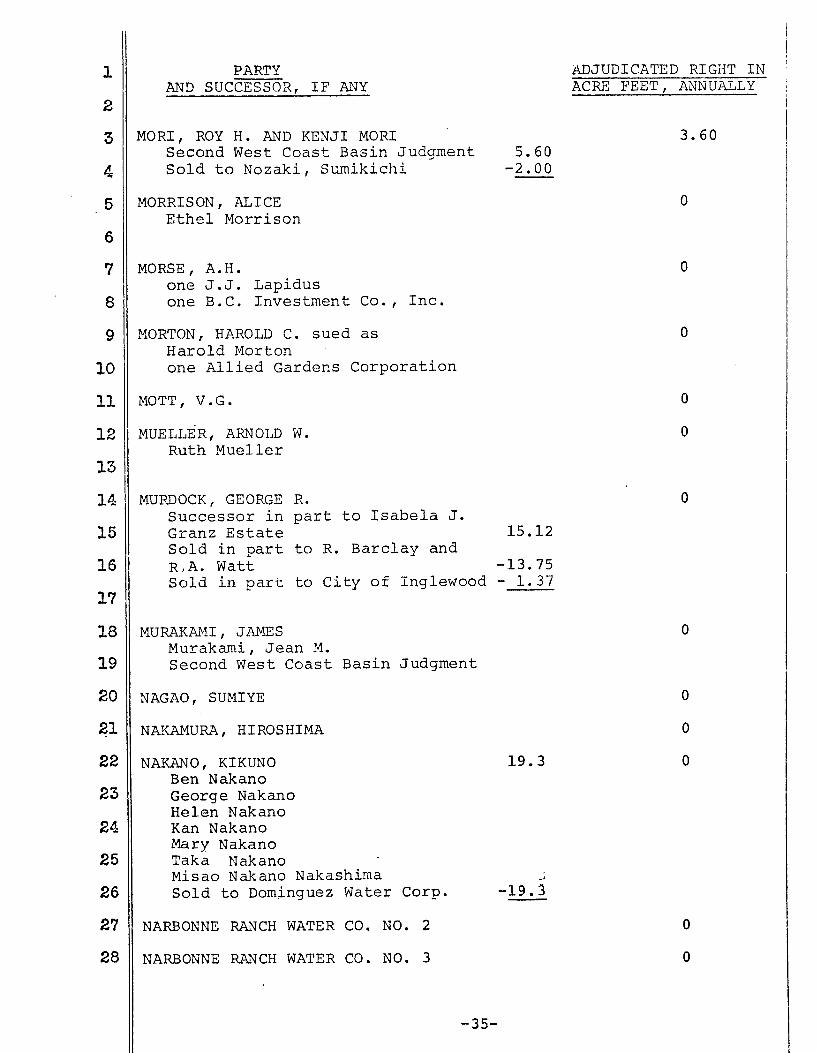
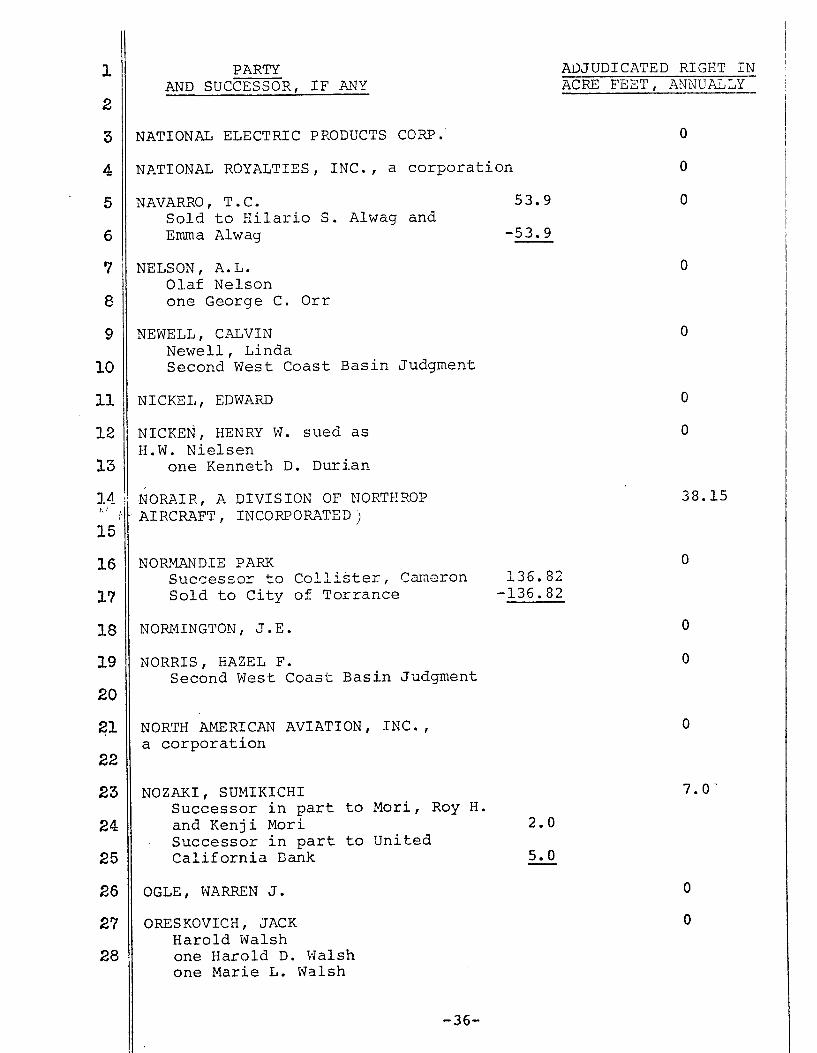
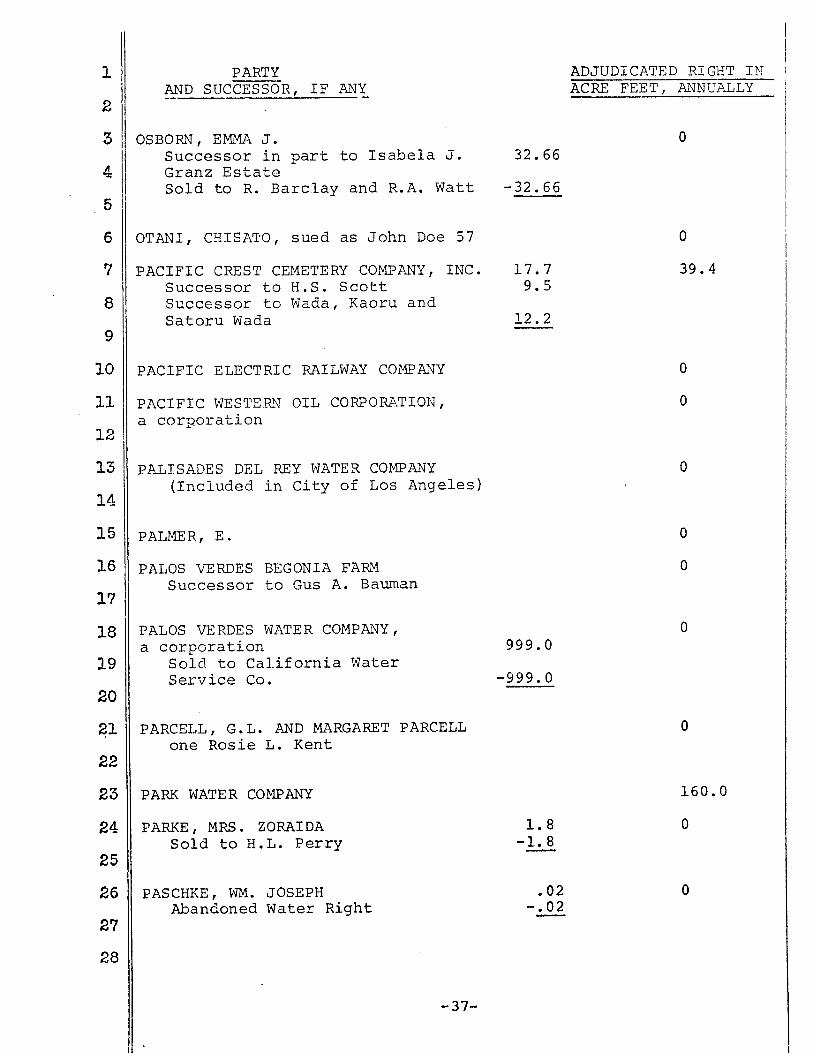
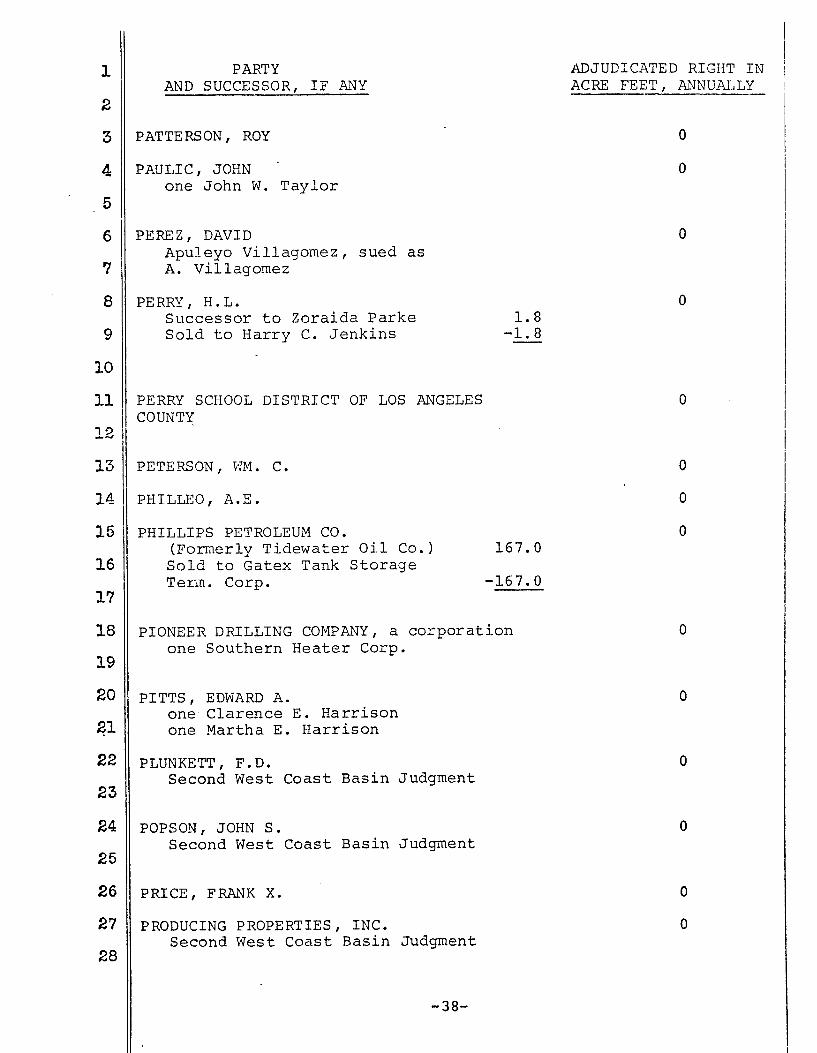
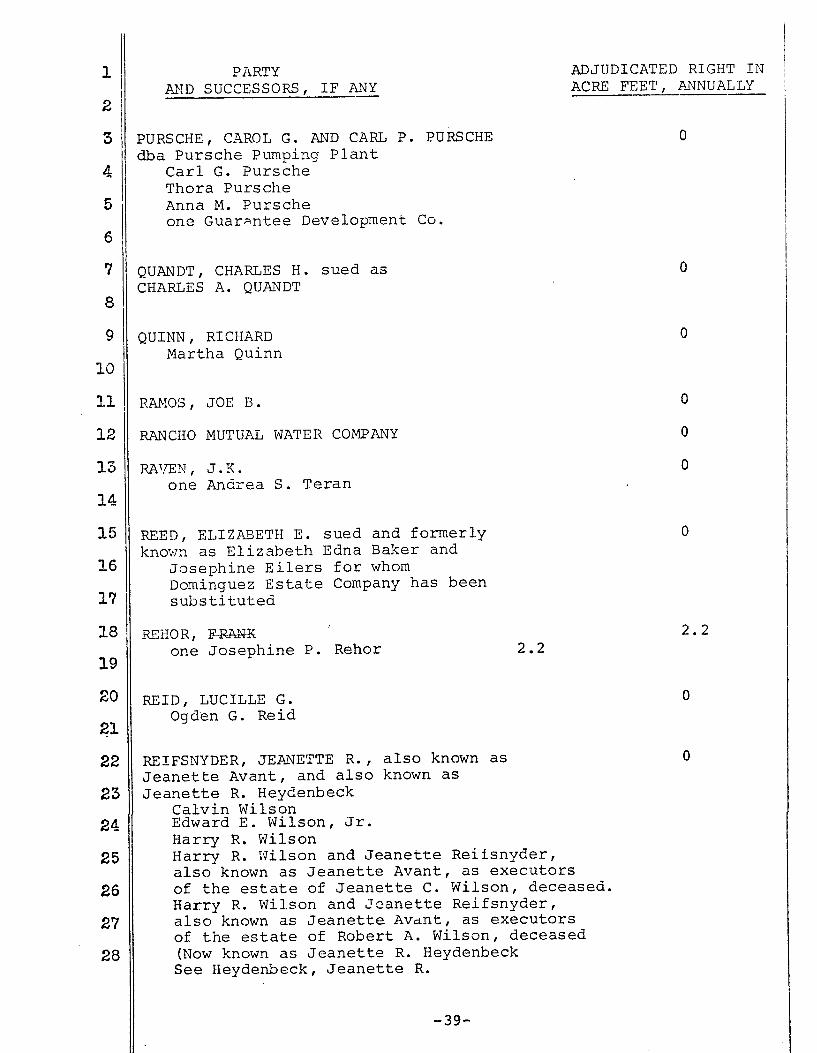
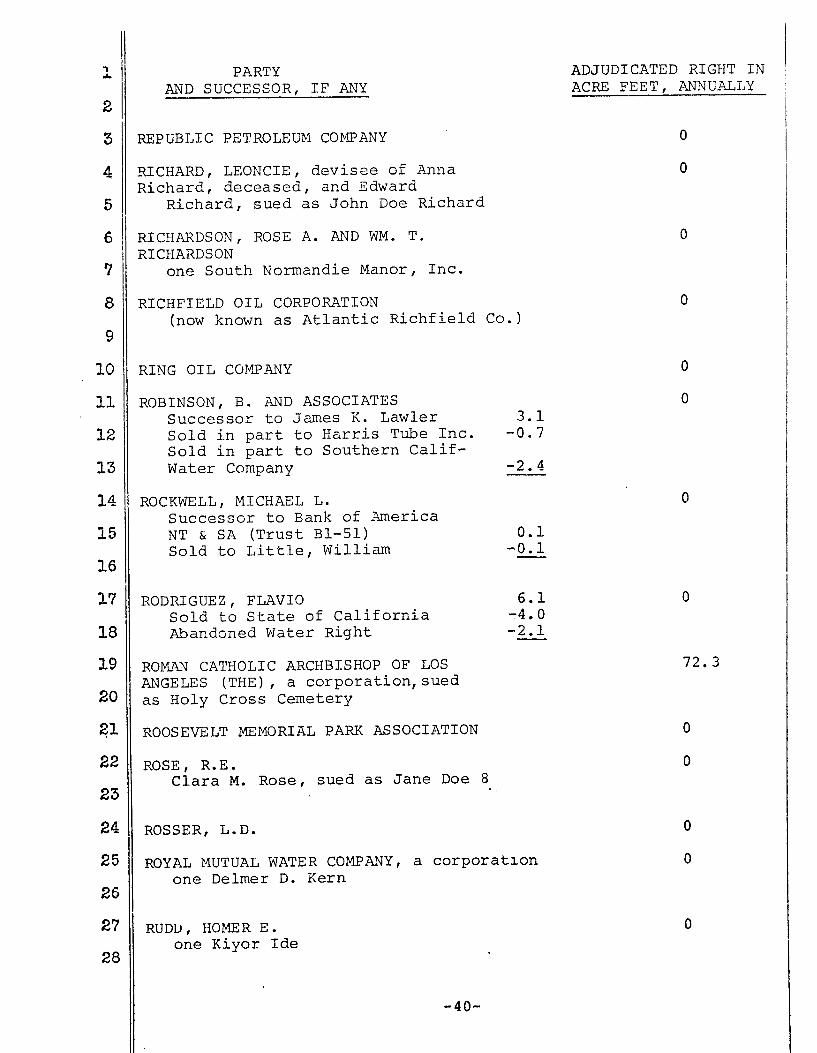
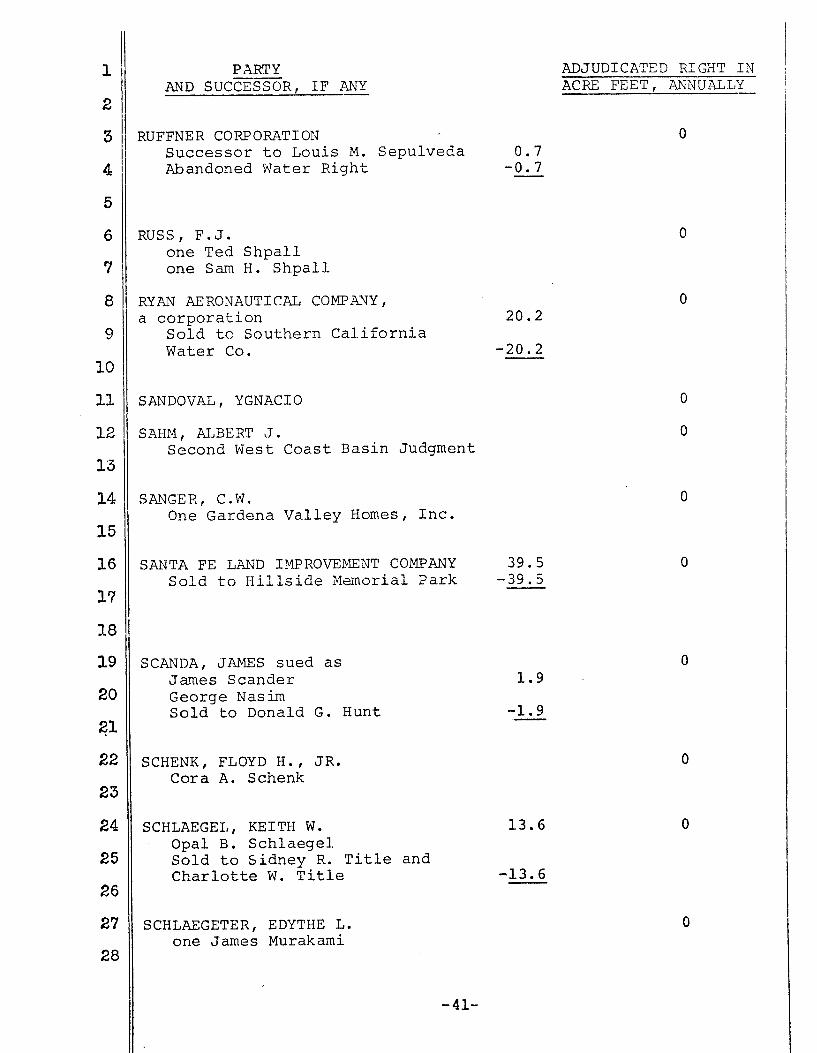
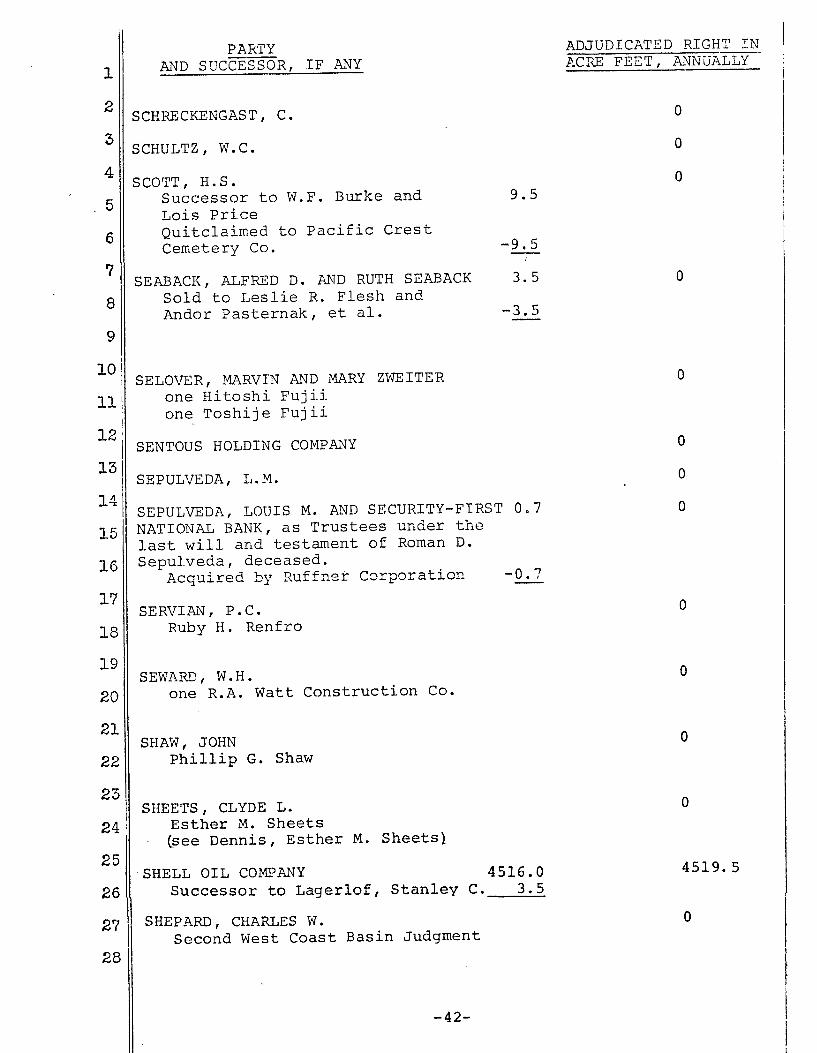
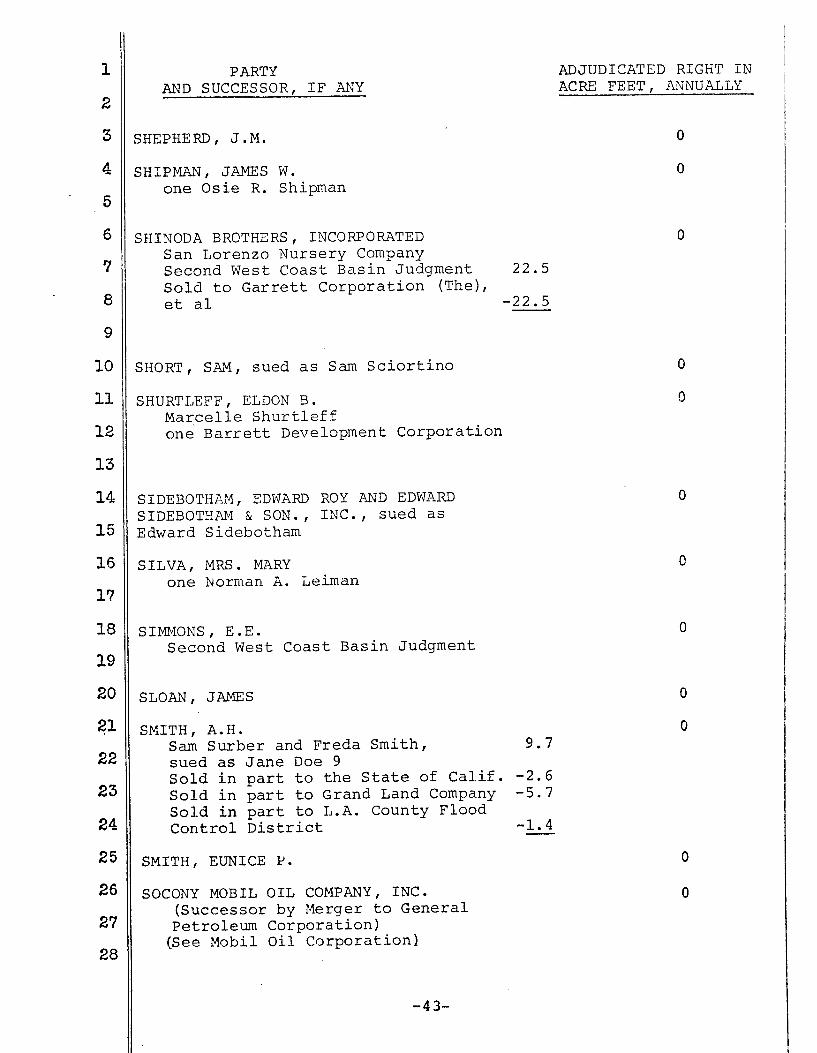
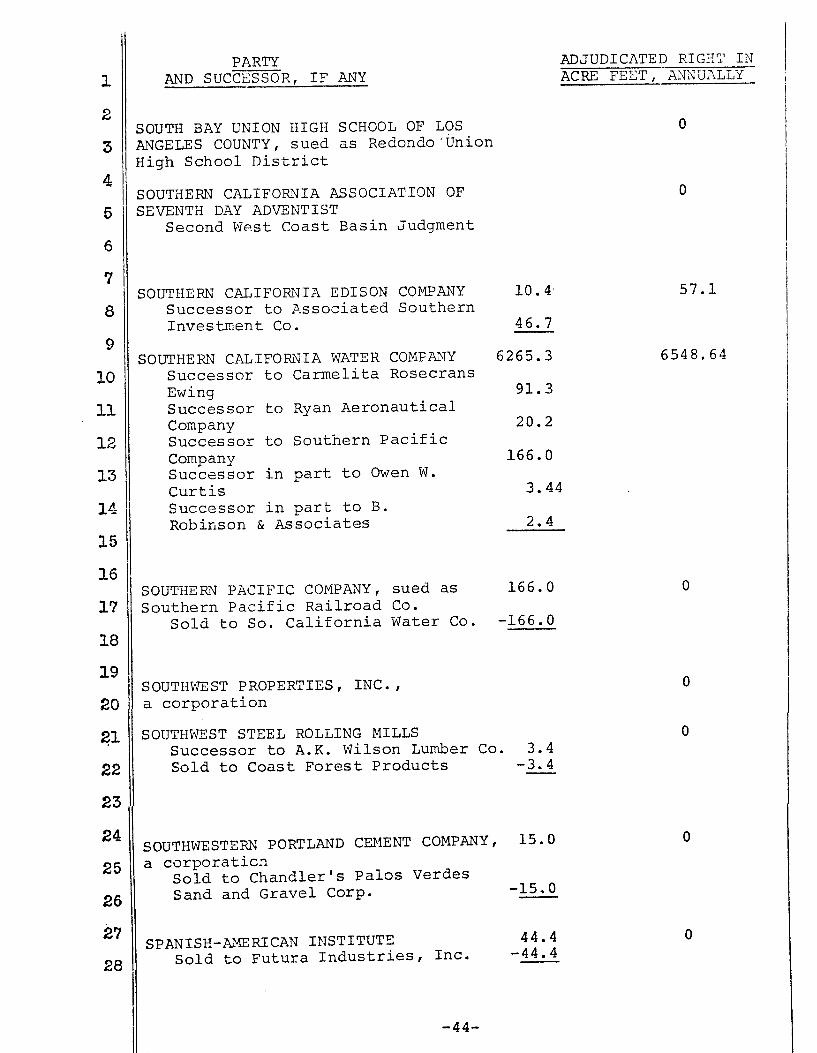
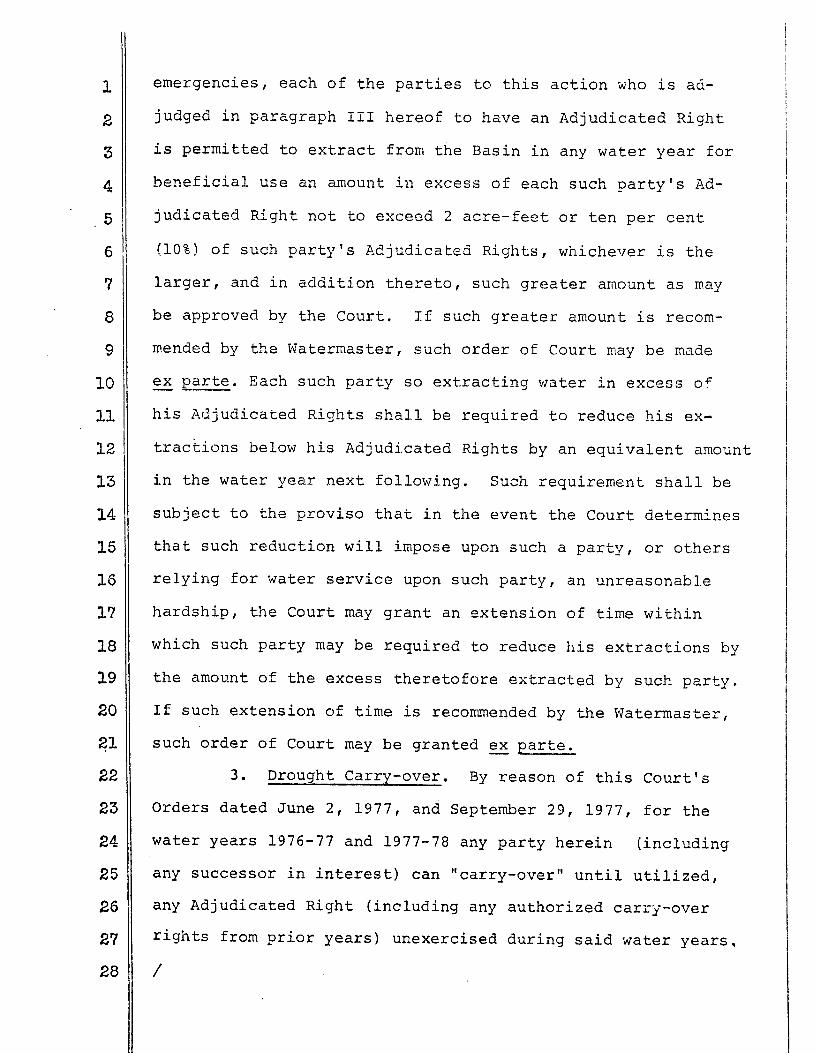
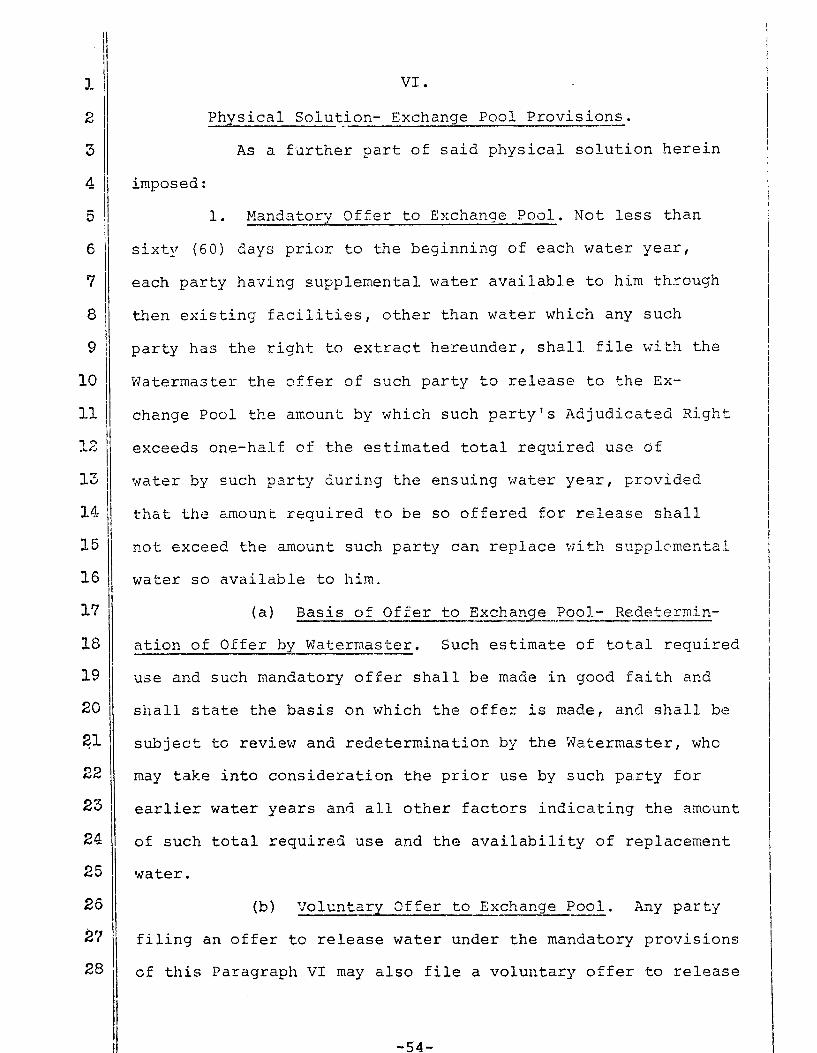
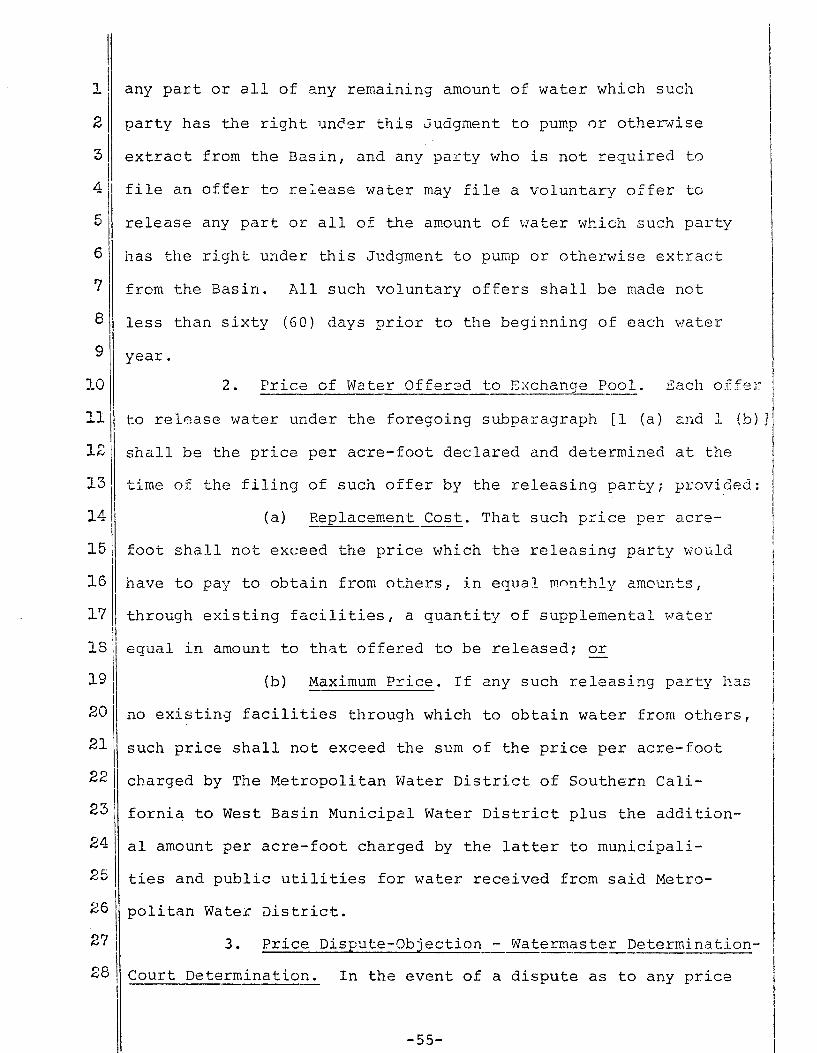
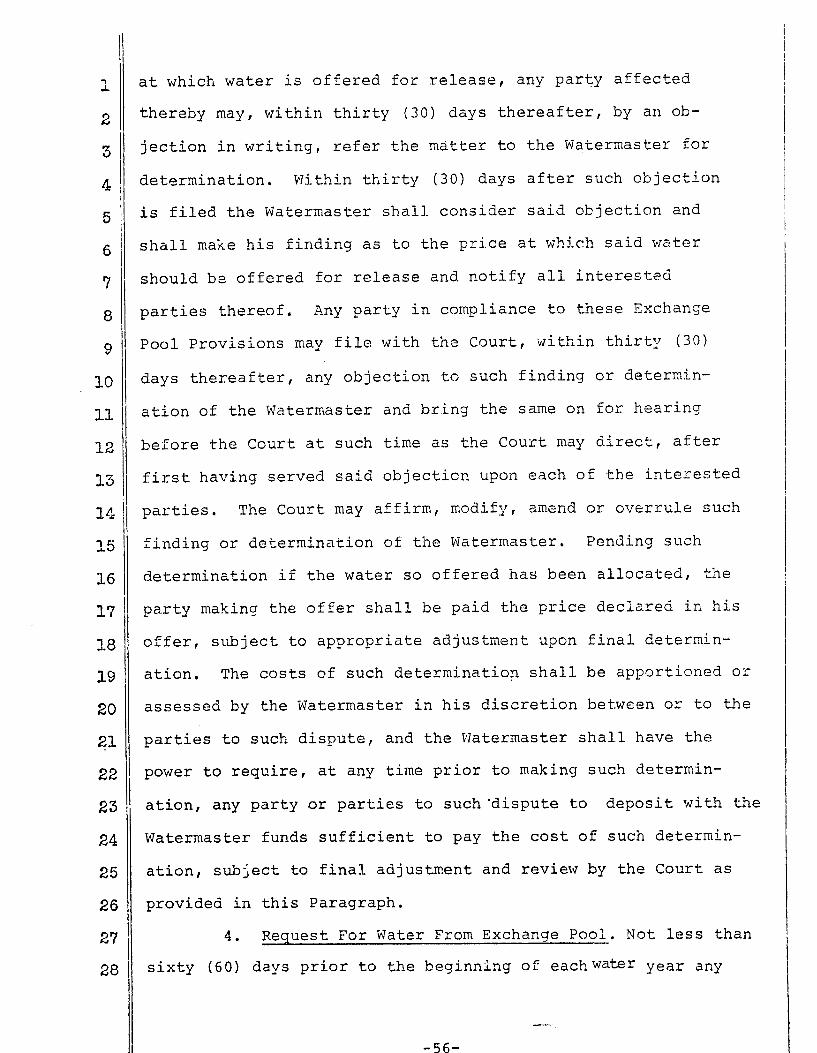
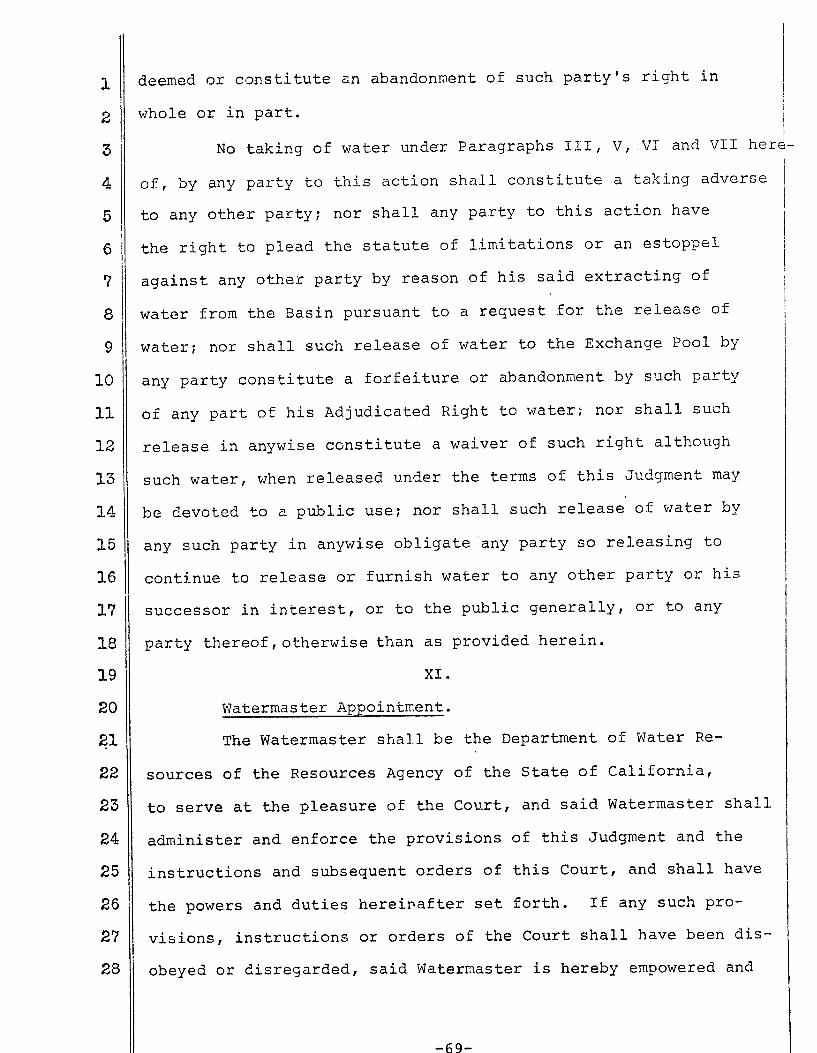
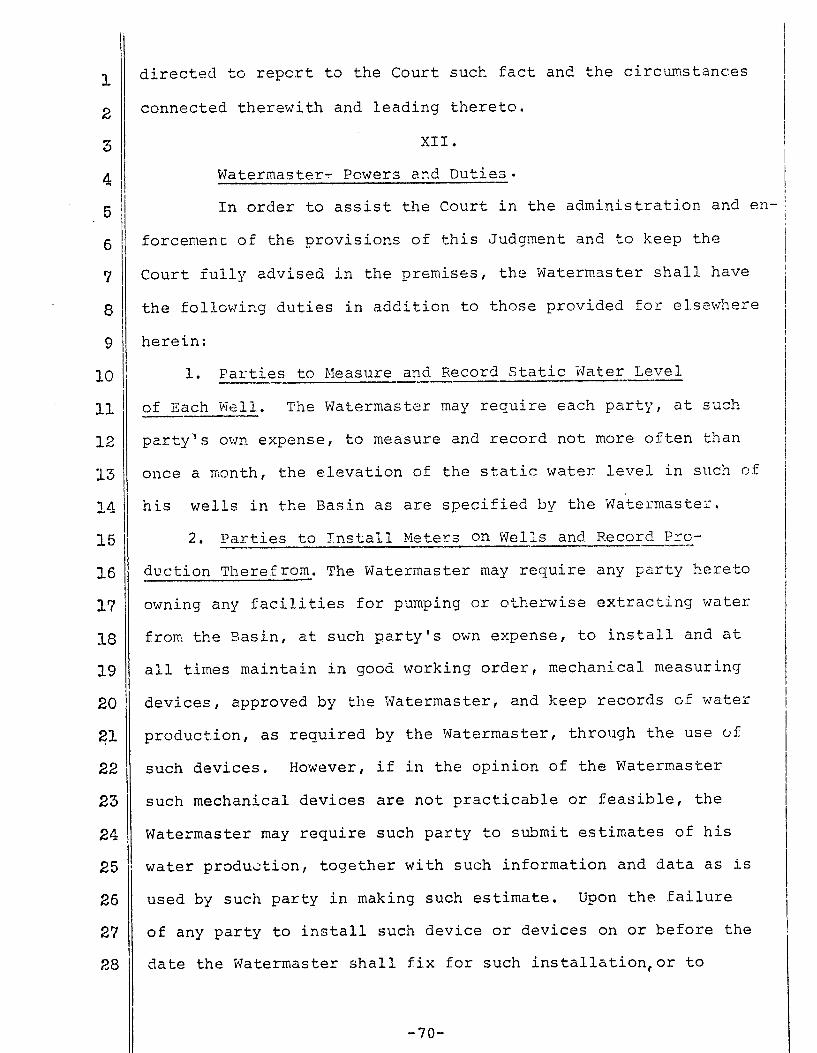
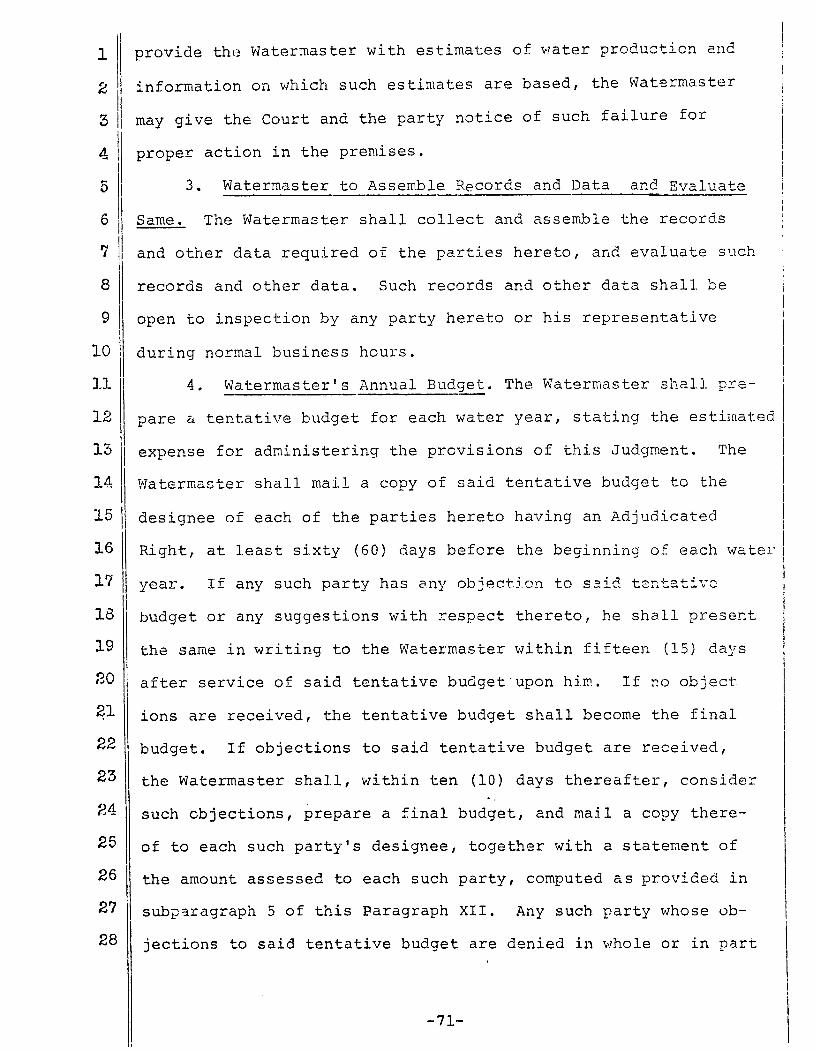
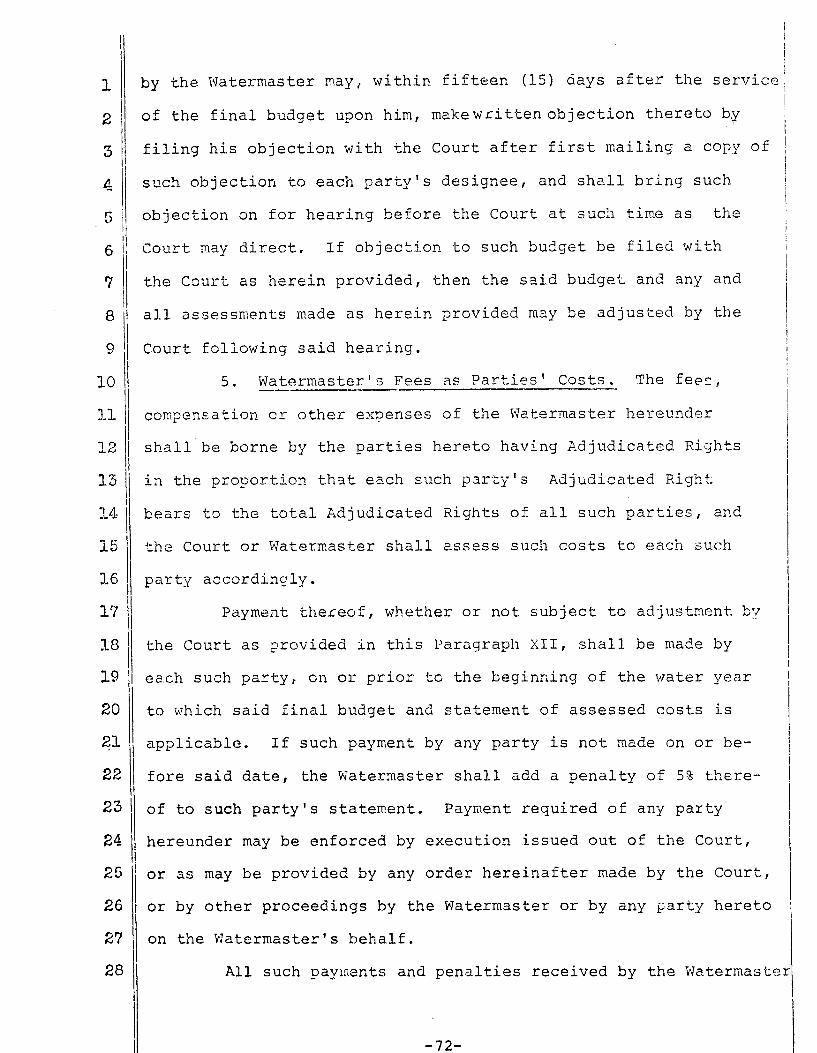
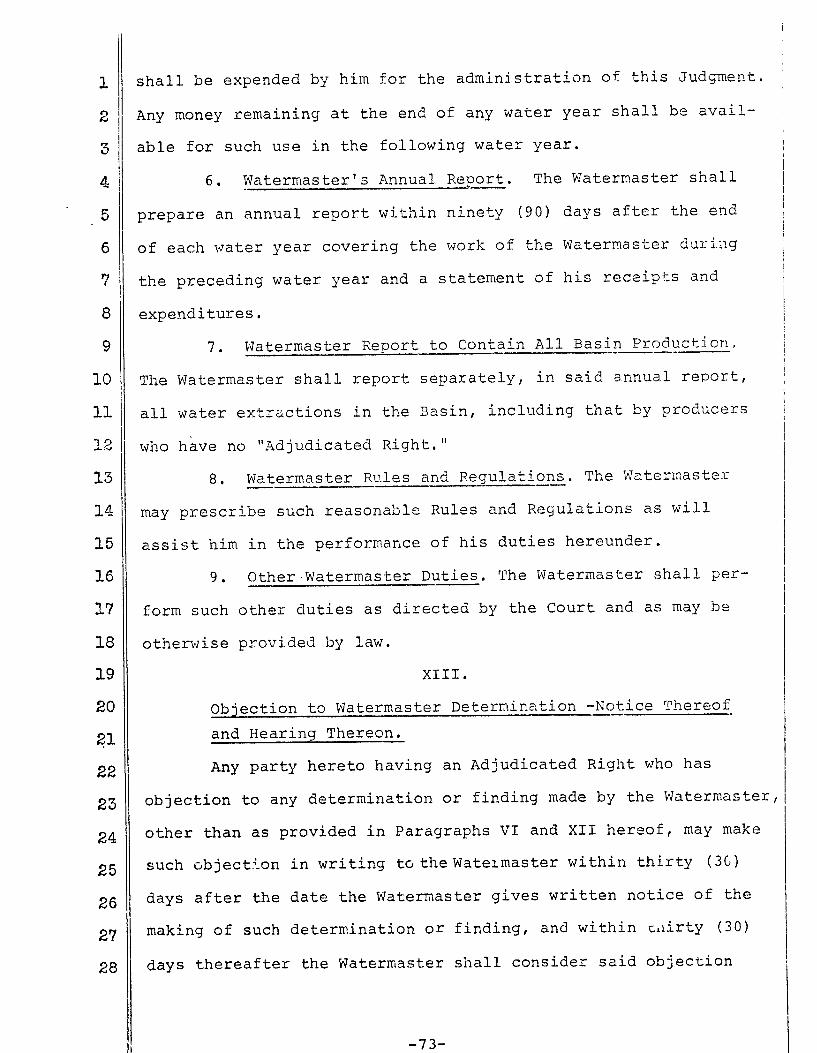
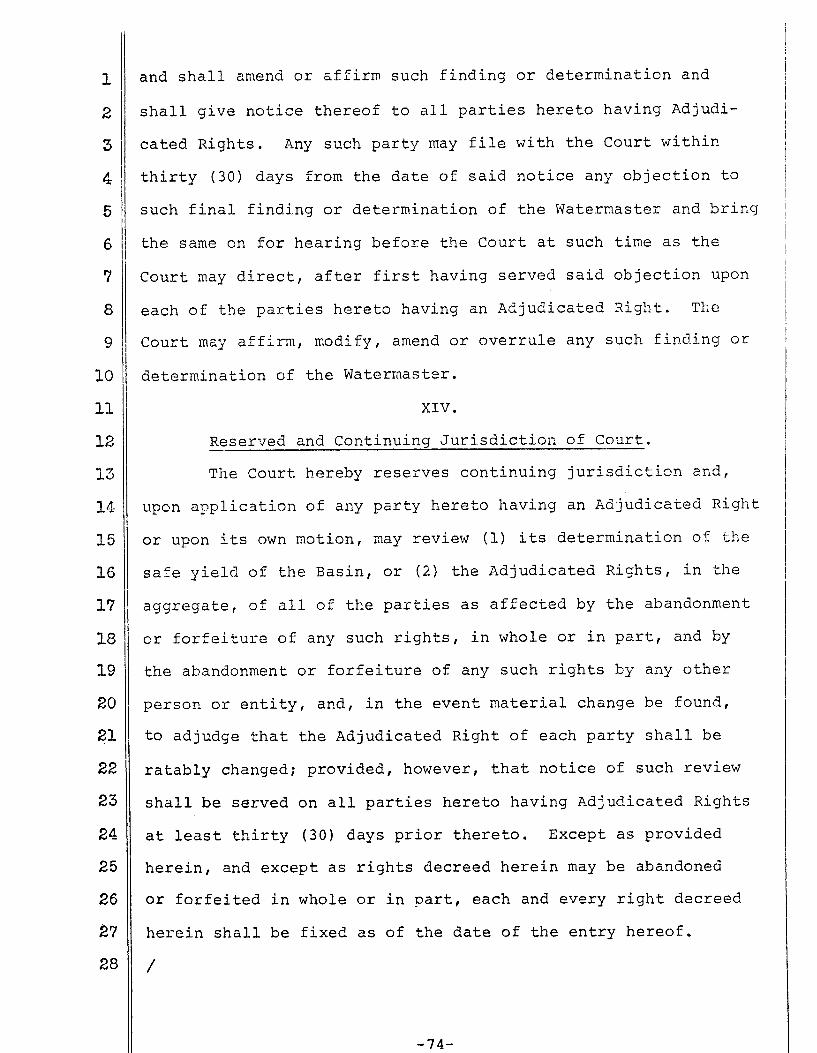
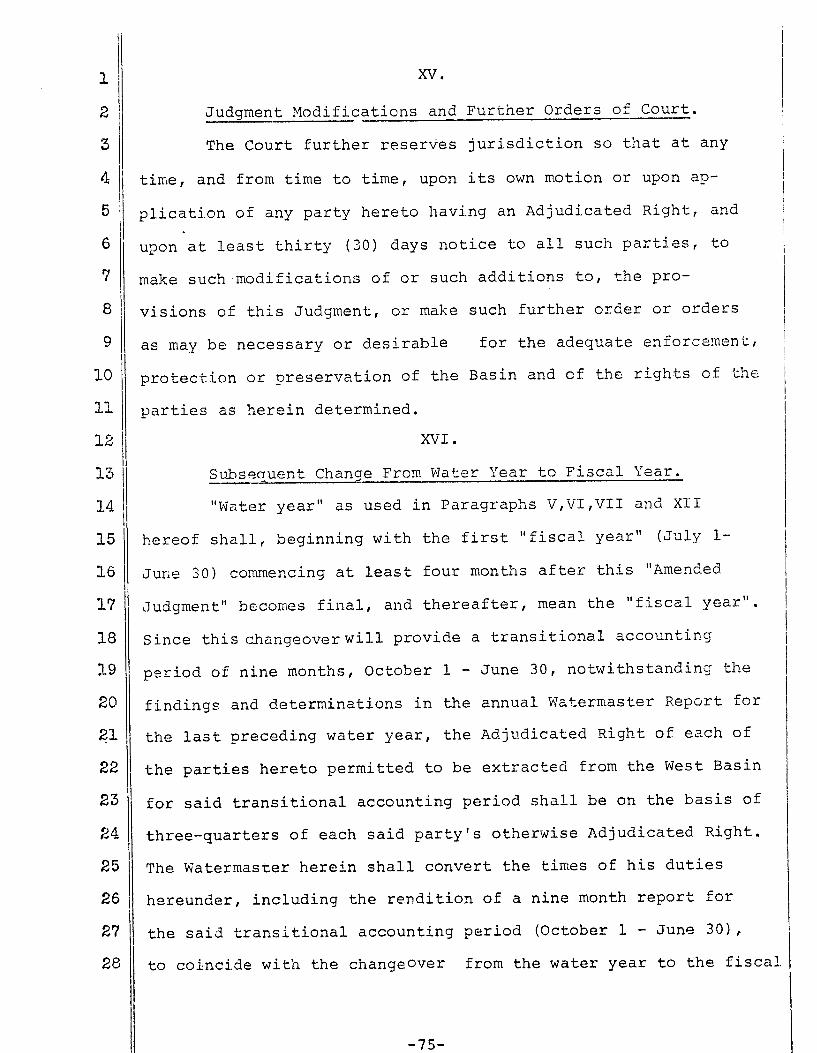
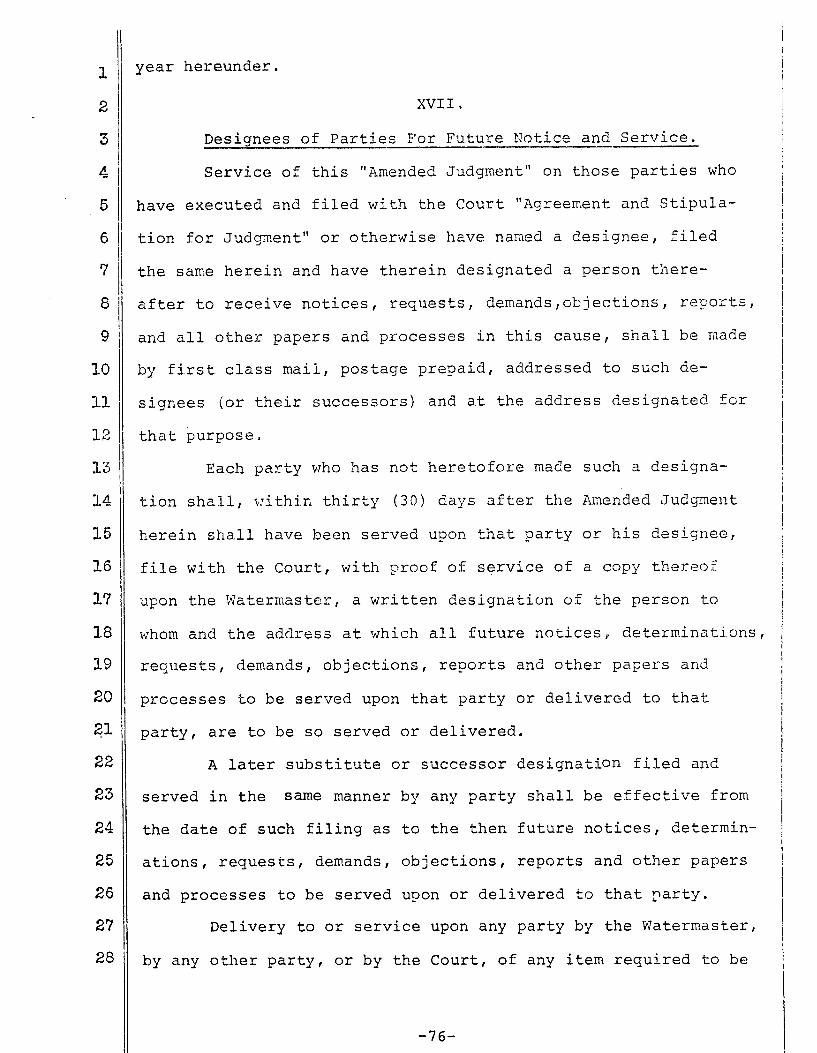
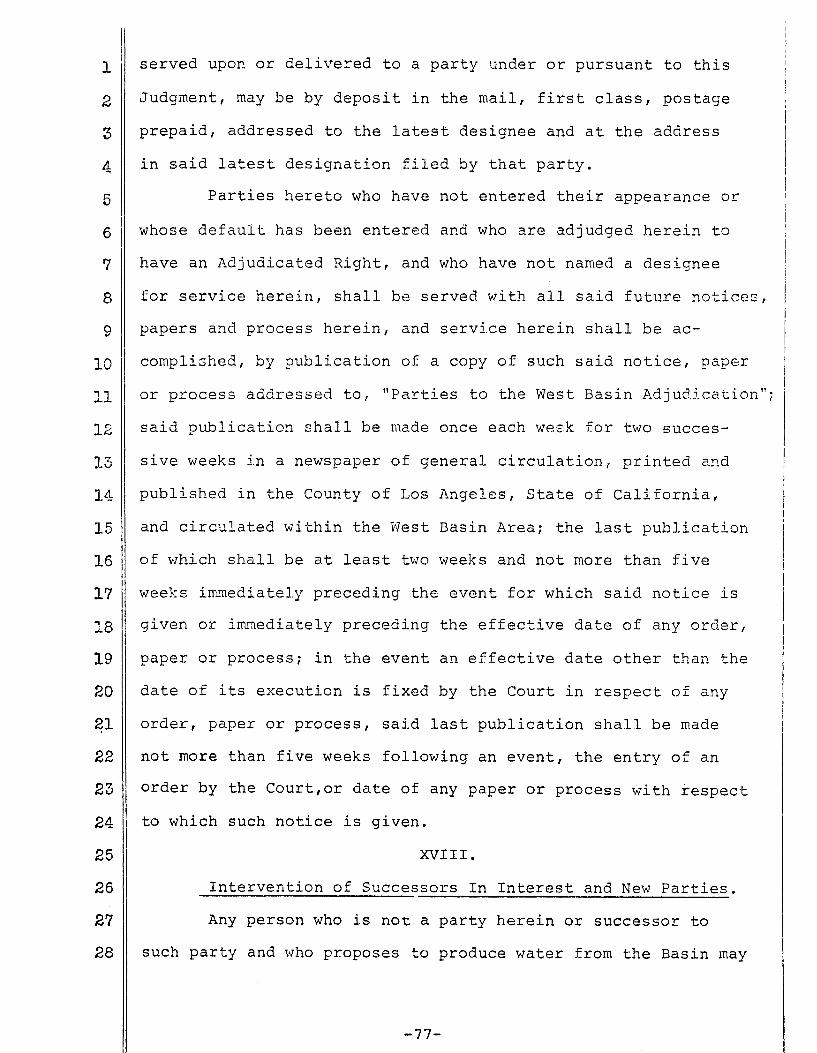
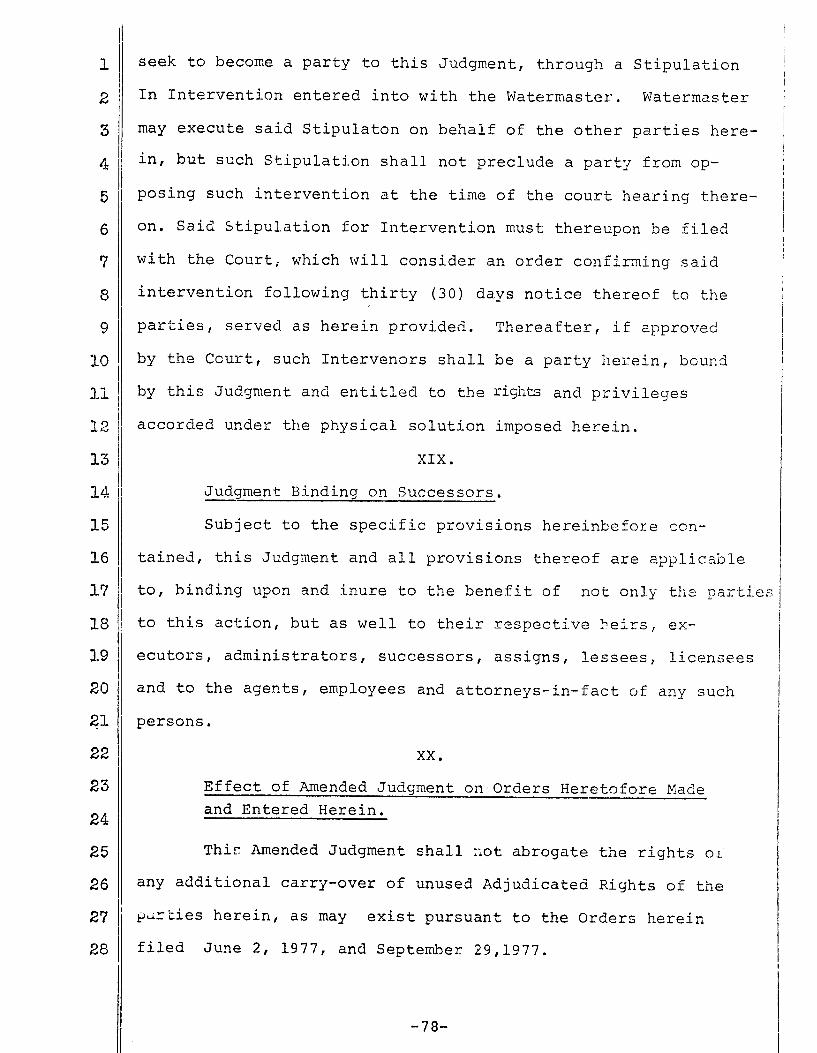
West Basin Adjudication Order
Water Replenishment District of Southern California 2015 Engineering Survey and Report
DWR Groundwater Bulletin 118
California Water Service Company 2005 Urban Water Management PlanDominguez District
Printed 10/25/2005
West Basin Adjudication Order
PAGE LEFT BLANK INTENTIONALLY

Water Replenishment Districtof Southern California
Engineering Surveyand Report
Water Replenishment District of Southern California
Engineering Survey and Report 20152015March 5, 2015Updated:May 1, 2015
Water Replenishment Districtof Southern California4040 Paramount BoulevardLakewood, CA 90712(562) 921-5521 phone(562) 921-6101 faxwww.wrd.org

Water Replenishment District Of Southern California
ENGINEERING SURVEY AND REPORT, 2015
Updated May 1, 2015
Board of Directors
Management Staff
Robb Whitaker, PE General Manager Ken Ortega, PE Assistant General Manager Ted Johnson, PG/CHG Chief Hydrogeologist Scott Ota, CPA Chief Financial Officer Francisco Leal Interim District Counsel
Professional Certification This Engineering Survey and Report has been prepared under the direct supervision of the California Professional Geologist whose signature appears below. This individual certifies that the information contained in the report has been prepared in accordance with the generally accepted principles and practices of his profession.
Theodore A. Johnson, PG, CHG Chief Hydrogeologist

Page 1 of 2
MEMORANDUM
DATE: MAY 1, 2015
TO: INTERESTED PARTIES
FROM: ROBB WHITAKER, GENERAL MANAGER
SUBJECT: UPDATED 2015 ENGINEERING SURVEY AND REPORT
The Water Replenishment District of Southern California (“WRD” or “District”) is the groundwater management agency responsible for safe and reliable groundwater in the Central Basin and West Coast Basin in southern coastal Los Angeles County. Groundwater constitutes nearly 40% of the total water demand used by the 4 million residents and businesses in the 43 cities in the WRD service area. On March 5, 2015, WRD completed an Engineering Survey and Report (“ESR”) as required by the California Water Code (Section 60300) to present information on the past, current, and anticipated future conditions in the two groundwater basins. Information is presented on groundwater pumping, groundwater conditions (water levels, overdraft, changes in storage), projects related to groundwater supply and quality, and the amount, sources, and cost of replenishment water needed to replace the annual pumping overdraft. According to Water Code Section 60305, the ESR must be completed by March of each year. However, the annual Replenishment Assessment (“RA”) assessed on groundwater production is set later in April or May. During the time frame between the March ESR and the adoption of the RA, new and updated information is sometimes received that results in necessary edits to the ESR after adoption of the RA. To document any changes, the District publishes an updated ESR following adoption of the RA. This May 1, 2015 ESR updates and replaces the earlier March 5, 2015 report and contains the latest information on replenishment water sources and costs within the District. Updated information includes the following:
On May 1, 2015, the WRD Board of Directors adopted the 2015/2016 RA at $283 per acre foot (AF) of groundwater pumped within the WRD Service area, which is a 5.6% increase from the current rate of $268. This new RA will go into effect July 1, 2015 and will be in effect through June 30, 2016. This information was added to the report as appropriate.
Page 2 of 2
Several formatting changes to the March report were made, including Table of Contents edits and font changes.
No other significant changes were made to the report.
My staff and I welcome any comments or questions you may have regarding this updated ESR. Additional copies are available by calling the District at (562) 921-5521 or by downloading it from our web site at http://www.wrd.org. Thank you for your interest on groundwater conditions in the WRD Service Area.
TABLE OF CONTENTS
GLOSSARY OF ACRONYMS .......................................................................................................... i
BOARD SUMMARY .......................................................................................................................... 1
CHAPTER 1 - INTRODUCTION ..................................................................................................... 5 Purpose of the Engineering Survey & Report ....................................................................................... 5
Scope of Engineering Survey & Report ................................................................................................ 5
Schedule for Setting the Replenishment Assessment ........................................................................... 5
CHAPTER 2 - GROUNDWATER PRODUCTION ....................................................................... 7 Adjudication and Demand .................................................................................................................... 7
Groundwater Production ....................................................................................................................... 7
Carryover and Drought Provisions ....................................................................................................... 8
CHAPTER 3 - GROUNDWATER CONDITIONS ....................................................................... 11 Introduction ......................................................................................................................................... 11
Annual Overdraft ................................................................................................................................ 11
Accumulated Overdraft ....................................................................................................................... 12
Groundwater Levels ............................................................................................................................ 13
Change in Storage ............................................................................................................................... 16
Optimum Groundwater Quantity ........................................................................................................ 16
CHAPTER 4 - GROUNDWATER REPLENISHMENT: QUANTITIES, AVAILABILITY, AND COSTS ...................................................................................................................................... 17 Sources of Replenishment Water ........................................................................................................ 17
Recommended Quantities of Replenishment Water ........................................................................... 18
Expected Availability of Replenishment Water ................................................................................. 19
Projected Cost of Replenishment Water ............................................................................................. 20
CHAPTER 5 - PROJECTS AND PROGRAMS ............................................................................ 23 001 – Leo J. Vander Lans Water Treatment Facility Project ............................................................. 23
002 – Robert W. Goldsworthy Desalter Project ................................................................................. 24
004 – Recycled Water Program .......................................................................................................... 24
005 – Groundwater Resources Planning Program .............................................................................. 25
Table of Contents
006 – Groundwater Quality Program .................................................................................................. 26
010 – Geographic Information System (“GIS”) ................................................................................. 29
011 – Regional Groundwater Monitoring Program ............................................................................ 30
012 – Safe Drinking Water Program .................................................................................................. 30
018 – Dominguez Gap Barrier Recycled Water Injection .................................................................. 31
023 – Replenishment Operations ...................................................................................................... 32
025 – Hydrogeology Program ............................................................................................................. 33
033 – Groundwater Reliability Improvement Program (“GRIP”) ...................................................... 34
035 – West Coast Seawater Barrier Monitoring Well Sampling Project ............................................ 35
038 – Engineering Program ................................................................................................................ 35
TABLES (see Tables Section after Chapter 5) Table 1: Groundwater Conditions and Replenishment Summary Table 2: Quantity and Cost of Replenishment Water for the Ensuing Water Year Table 3: WRD Projects and Programs Table 4: 30-Year Average Groundwater Balance Table 5: Historical Rainfall Table 6: Annual Overdraft Calculation Table 7: Accumulated Overdraft Calculation Table 8: Changes in Groundwater Storage Table 9: Quantity of Water Required for Artificial Replenishment Table A-1: Historical Amounts of Water Recharged in the Montebello Forebay Spreading Grounds Table A-2: Historical Amounts of Water Purchased for Injection Table A-3: Historical Amounts of the In-Lieu Program Table A-4: Historical Amounts of Replenishment Water Table A-5: Historical Amounts of Groundwater Production Table A-6: Historical Amounts of Water Use in the WRD Service Area
Table of Contents
FIGURES (see Figures Section following the Tables) Figure A: Historical Rainfall Figure B: Fluctuation of Water Levels in the Los Angeles Forebay Figure C: Fluctuation of Water Levels in the Montebello Forebay Figure D: Fluctuation of Water Levels in the Central Basin Pressure Area Figure E: Fluctuation of Water Levels in the West Coast Basin
PLATES (see Plates Section following the Figures) Plate 1: Groundwater Production for Water Year 2013/2014 Plate 2: Groundwater Elevation Contour Map for Fall 2014 Plate 3: Change in Groundwater Levels Fall 2013 to Fall 2014

Table of Contents
Page Intentionally Left Blank
i
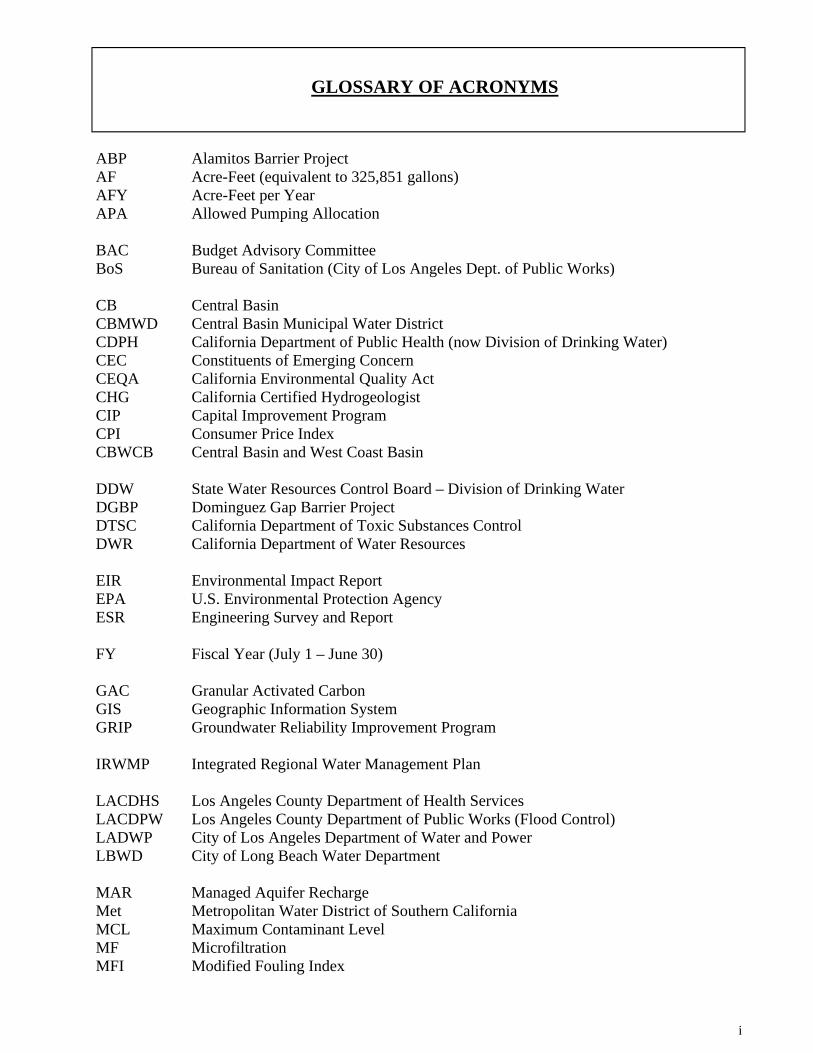
GLOSSARY OF ACRONYMS ABP Alamitos Barrier Project AF Acre-Feet (equivalent to 325,851 gallons) AFY Acre-Feet per Year APA Allowed Pumping Allocation BAC Budget Advisory Committee BoS Bureau of Sanitation (City of Los Angeles Dept. of Public Works) CB Central Basin CBMWD Central Basin Municipal Water District CDPH California Department of Public Health (now Division of Drinking Water) CEC Constituents of Emerging Concern CEQA California Environmental Quality Act CHG California Certified Hydrogeologist CIP Capital Improvement Program CPI Consumer Price Index CBWCB Central Basin and West Coast Basin DDW State Water Resources Control Board – Division of Drinking Water DGBP Dominguez Gap Barrier Project DTSC California Department of Toxic Substances Control DWR California Department of Water Resources EIR Environmental Impact Report EPA U.S. Environmental Protection Agency ESR Engineering Survey and Report FY Fiscal Year (July 1 – June 30) GAC Granular Activated Carbon GIS Geographic Information System GRIP Groundwater Reliability Improvement Program IRWMP Integrated Regional Water Management Plan LACDHS Los Angeles County Department of Health Services LACDPW Los Angeles County Department of Public Works (Flood Control) LADWP City of Los Angeles Department of Water and Power LBWD City of Long Beach Water Department MAR Managed Aquifer Recharge Met Metropolitan Water District of Southern California MCL Maximum Contaminant Level MF Microfiltration MFI Modified Fouling Index
Glossary of Acronyms
ii
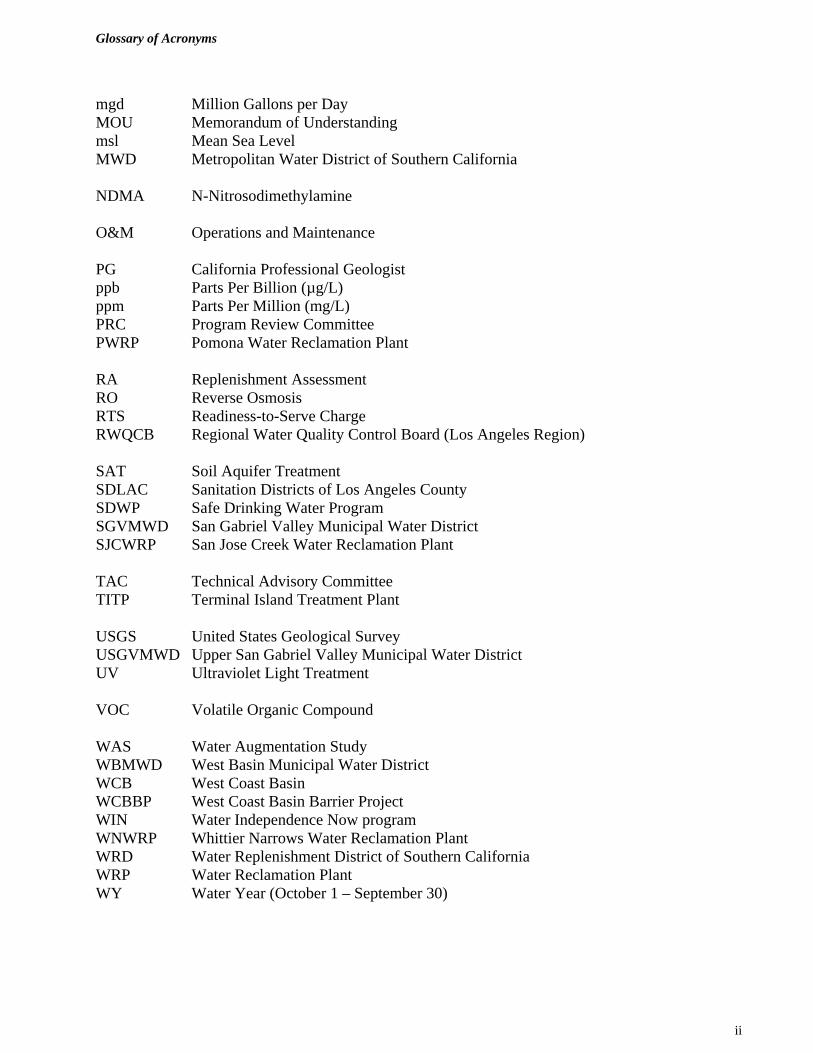
mgd Million Gallons per Day MOU Memorandum of Understanding msl Mean Sea Level MWD Metropolitan Water District of Southern California NDMA N-Nitrosodimethylamine O&M Operations and Maintenance PG California Professional Geologist ppb Parts Per Billion (µg/L) ppm Parts Per Million (mg/L) PRC Program Review Committee PWRP Pomona Water Reclamation Plant RA Replenishment Assessment RO Reverse Osmosis RTS Readiness-to-Serve Charge RWQCB Regional Water Quality Control Board (Los Angeles Region) SAT Soil Aquifer Treatment SDLAC Sanitation Districts of Los Angeles County SDWP Safe Drinking Water Program SGVMWD San Gabriel Valley Municipal Water District SJCWRP San Jose Creek Water Reclamation Plant TAC Technical Advisory Committee TITP Terminal Island Treatment Plant USGS United States Geological Survey USGVMWD Upper San Gabriel Valley Municipal Water District UV Ultraviolet Light Treatment VOC Volatile Organic Compound WAS Water Augmentation Study WBMWD West Basin Municipal Water District WCB West Coast Basin WCBBP West Coast Basin Barrier Project WIN Water Independence Now program WNWRP Whittier Narrows Water Reclamation Plant WRD Water Replenishment District of Southern California WRP Water Reclamation Plant WY Water Year (October 1 – September 30)
WRD Engineering Survey and Report, 2015 1
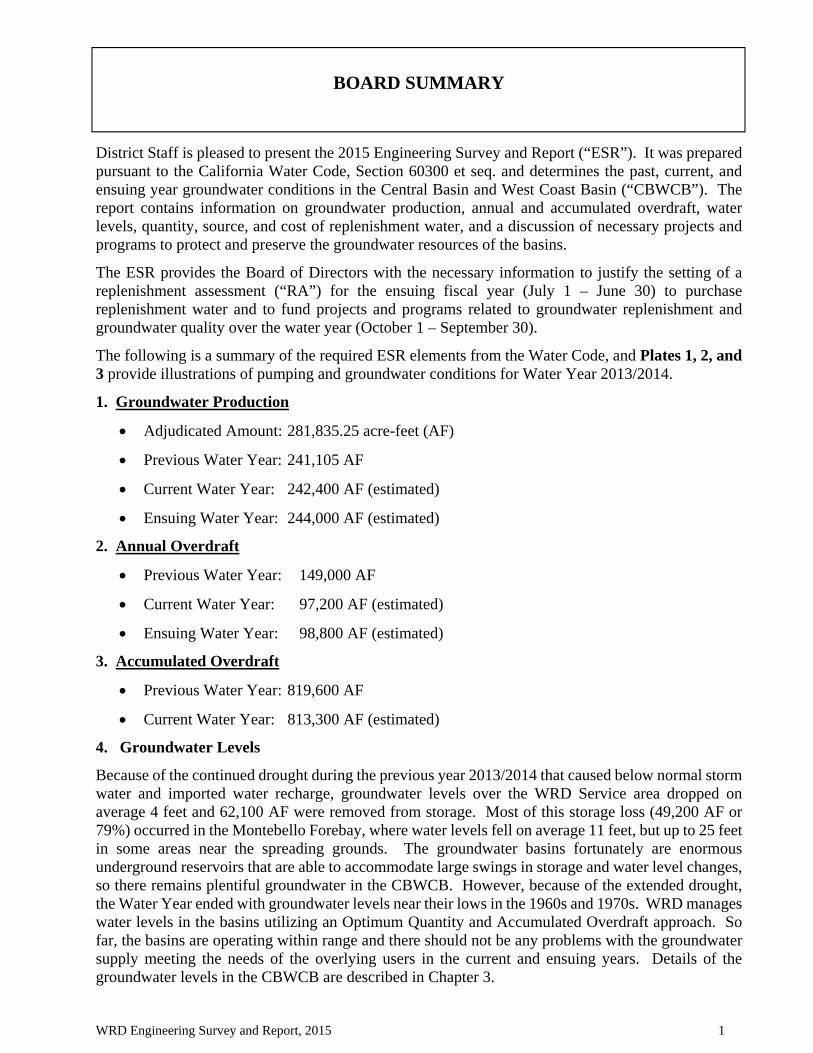
BOARD SUMMARY
District Staff is pleased to present the 2015 Engineering Survey and Report (“ESR”). It was prepared pursuant to the California Water Code, Section 60300 et seq. and determines the past, current, and ensuing year groundwater conditions in the Central Basin and West Coast Basin (“CBWCB”). The report contains information on groundwater production, annual and accumulated overdraft, water levels, quantity, source, and cost of replenishment water, and a discussion of necessary projects and programs to protect and preserve the groundwater resources of the basins.
The ESR provides the Board of Directors with the necessary information to justify the setting of a replenishment assessment (“RA”) for the ensuing fiscal year (July 1 – June 30) to purchase replenishment water and to fund projects and programs related to groundwater replenishment and groundwater quality over the water year (October 1 – September 30).
The following is a summary of the required ESR elements from the Water Code, and Plates 1, 2, and 3 provide illustrations of pumping and groundwater conditions for Water Year 2013/2014.
1. Groundwater Production
Adjudicated Amount: 281,835.25 acre-feet (AF)
Previous Water Year: 241,105 AF
Current Water Year: 242,400 AF (estimated)
Ensuing Water Year: 244,000 AF (estimated)
2. Annual Overdraft
Previous Water Year: 149,000 AF
Current Water Year: 97,200 AF (estimated)
Ensuing Water Year: 98,800 AF (estimated)
3. Accumulated Overdraft
Previous Water Year: 819,600 AF
Current Water Year: 813,300 AF (estimated)
4. Groundwater Levels
Because of the continued drought during the previous year 2013/2014 that caused below normal storm water and imported water recharge, groundwater levels over the WRD Service area dropped on average 4 feet and 62,100 AF were removed from storage. Most of this storage loss (49,200 AF or 79%) occurred in the Montebello Forebay, where water levels fell on average 11 feet, but up to 25 feet in some areas near the spreading grounds. The groundwater basins fortunately are enormous underground reservoirs that are able to accommodate large swings in storage and water level changes, so there remains plentiful groundwater in the CBWCB. However, because of the extended drought, the Water Year ended with groundwater levels near their lows in the 1960s and 1970s. WRD manages water levels in the basins utilizing an Optimum Quantity and Accumulated Overdraft approach. So far, the basins are operating within range and there should not be any problems with the groundwater supply meeting the needs of the overlying users in the current and ensuing years. Details of the groundwater levels in the CBWCB are described in Chapter 3.

Board Summary
WRD Engineering Survey and Report, 2015 2
5. Quantity of Replenishment Water Required in the Ensuing Year
The District determines replenishment water needs based on averages from a long-term (30 year) hydrologic record and computer models, meaning extremely wet years and extremely dry years in addition to average precipitation years are accounted for in deriving the average replenishment needs. Other considerations by the Board are also incorporated into replenishment water needs. Chapter 4 details the quantity of water that WRD plans to purchase in the ensuing water year. A summary is below:
Spreading Water: 71,000 AF (55,000 recycled; 16,000 imported)
Seawater Barrier Water: 32,300 AF (7,600 AF imported; 24,700 AF recycled)
In-Lieu Program Water: 0 AF (suspended due to lack of MWD seasonal water)
Total Water: 103,300 AF
6. Source of Replenishment Water
The sources of replenishment water to the District for the ensuing water year are detailed in Chapter 4. Discounted replenishment water from MWD has not been available for In-Lieu or spreading since October 2011. MWD has not yet adopted a new replenishment program and for now only the more expensive Tier 1 or Tier 2 water is potentially available. WRD is budgeting for Tier 1 water in the ensuing year. In the previous year, Tier 1 water was not sold to WRD due to low MWD supplies as a result of the drought. In the current water year, some Tier 1 is being sold to WRD for replenishment. For the ensuing year, it is currently assumed that Tier 1 water will be available. A summary of all of the sources of replenishment water available to WRD is as follows:
Recycled Water: Tertiary water for spreading is available from the Sanitation Districts of Los Angeles County (SDLAC). Advanced-treated recycled water for the West Coast Basin Barrier Project (WCBBP) is available from the West Basin Municipal Water District. Advanced-treated recycled water for the Dominguez Gap Barrier Project (DGBP) is available from the City of Los Angeles. Advanced-treated recycled water for the Alamitos Barrier Project (ABP) is available from WRD.
Imported Water: Raw river water (untreated) Tier 1 is assumed to be available for spreading from MWD and its member agencies. For the seawater barrier wells, treated potable imported water Tier 1 is assumed to be available for the WCBBP and DGBP from the West Basin Municipal Water District, and for the ABP from the City of Long Beach.
7. Cost of Replenishment Water
WRD has estimated it will need 103,300 AF of replenishment water in the ensuing year to help overcome the annual overdraft. WRD purchases replenishment water from MWD member agencies and recycled water providers. These agencies set the price for the replenishment water that WRD buys for the spreading grounds, seawater barrier injection wells, and In-Lieu water when available. The cost for replenishment water is a direct pass-through from WRD to the water suppliers on WRD’s replenishment assessment.
Using currently available information and estimates for the cost of replenishment water to WRD in the ensuing year, the estimated cost of water for the ensuing year is $42,125,595. Tables 1 and 2 provide a detailed breakdown of these costs.
These estimated costs are for water purchases only and do not include the additional costs for water replenishment and water quality projects and programs. These projects and programs are discussed in detail in Chapter 5. The anticipated costs of these projects and programs will be further discussed in
Board Summary
WRD Engineering Survey and Report, 2015 3
District budget workshops, Budget Advisory Committee (BAC) meetings, and other public meetings before the Board of Directors adopts the 2015/2016 Replenishment Assessment in May.
8. Projects and Programs
A list of the projects and programs in which WRD is involved related to groundwater replenishment and the protection and preservation of water quality is shown on Table 3. Funds are required to finance these projects and programs. Sections 60221, 60230 and 60224 of the Water Code authorize the WRD to undertake a wide range of capital projects and other programs aimed at enhancing groundwater replenishment and improving groundwater quality.
These projects and programs address any existing or potential problems related to the basin’s groundwater, and may extend beyond the District's boundaries if the threat of contamination is outside those boundaries. The programs span all phases of planning, design, and construction and are financed by the collection of a replenishment assessment. A more detailed description of each project and program is presented in Chapter 5 of the report.
9. Conclusions
Based upon the information presented in the ESR, a replenishment assessment is necessary in the ensuing year to purchase replenishment water and to finance projects and programs to perform replenishment and water quality activities. These actions will ensure sufficient supplies of high quality groundwater within the District for the benefit of the residents and businesses in the Central Basin and West Coast Basin.
Board Summary
WRD Engineering Survey and Report, 2015 4
Page Intentionally Left Blank
WRD Engineering Survey and Report, 2015 5
CHAPTER 1 - INTRODUCTION
Purpose of the Engineering Survey & Report To facilitate the Board of Directors' decisions and actions, the Water Replenishment District Act requires that an engineering survey and report (“ESR”) be prepared each year. This Engineering Survey and Report 2015 is in conformity with the requirements of Section 60300 et seq. Water Replenishment District Act and presents the necessary information on which the Board of Directors can declare whether funds shall be raised to purchase water for replenishment during the ensuing year, as well as to finance projects and programs aimed at accomplishing groundwater replenishment. With the information in this ESR, the Board can also declare whether funds shall be collected to remove contaminants from the groundwater supplies or to exercise any other power under Section 60224 of the California Water Code. The information presented in this report along with the District’s strategic planning and budget preparation presents the necessary information on which the Board of Directors can base the establishment of a replenishment assessment for the ensuing fiscal year effective July 1, 2015 through June 30, 2016.
Scope of Engineering Survey & Report This report contains specific information outlined in Chapter I, Part 6 of Division 18 of the Water Code (the Water Replenishment District Act, § 60300 and § 60301). The following is a brief description of the contents of this report:
1) a discussion of groundwater production within the District (Chapter 2);
2) an evaluation of groundwater conditions within the District, including estimates of the annual overdraft, the accumulated overdraft, changes in water levels, and the effects of water level fluctuations on the groundwater resources (Chapter 3);
3) an appraisal of the quantity, availability, and cost of replenishment water required for the ensuing water year (Chapter 4); and
4) a description of current and proposed programs and projects to accomplish replenishment goals and to protect and preserve high quality groundwater supplies within the District (Chapter 5).
Schedule for Setting the Replenishment Assessment The following actions are required by the Water Code to set the Replenishment Assessment:
1) The Board shall order the preparation of the ESR no later than the second Tuesday in February each year (see Section 60300).
2) The Board shall declare by resolution whether funds shall be collected to purchase replenishment water and to fund projects and programs related to replenishment and/or water quality activities on or before the second Tuesday in March each year and after the ESR has been completed (see Section 60305).
3) A Public Hearing will be held for the purpose of determining whether District costs will be paid for by a replenishment assessment. The Public Hearing will be opened on the second Tuesday in April and may be adjourned from time to time but will be completed by the first Tuesday in May (see Sections 60306 and 60307).
4) The Board by resolution shall levy a replenishment assessment for the ensuing fiscal year no later than the second Tuesday in May (see Sections 60315, 60316 and 60317).
Introduction
WRD Engineering Survey and Report, 2015 6
Although dates specified in the code refer generally to ‘on or before certain Tuesdays’, the Water Code (Section 60043) also states that “Whenever any act is required to be done or proceeding taken on or set for a particular day or day of the week in any month, the act may be done or proceeding set for and acted upon a day of the month otherwise specified for a regular meeting of the board”. Therefore, there is flexibility as to the actual dates when Board actions are taken regarding the ESR, adopting resolutions, conducting public hearings, and the setting the replenishment assessment.
The ESR is generally completed in March of each year to comply with the Water Code and to provide the Board with the necessary information to determine whether a replenishment assessment will be needed in the ensuing year to purchase replenishment water and to fund projects and programs related to water quality and replenishment activities. However, in the subsequent months leading up to the adoption of the replenishment assessment, new information is normally received that affects the findings presented in the March ESR. This new information is typically related to the amount of water and price that WRD expects to pay for replenishment water in the ensuing water year. The final information used by the Board when they adopt the replenishment assessment is reflected in an updated ESR that is published after adoption of the replenishment assessment.
WRD Engineering Survey and Report, 2015 7
CHAPTER 2 - GROUNDWATER PRODUCTION
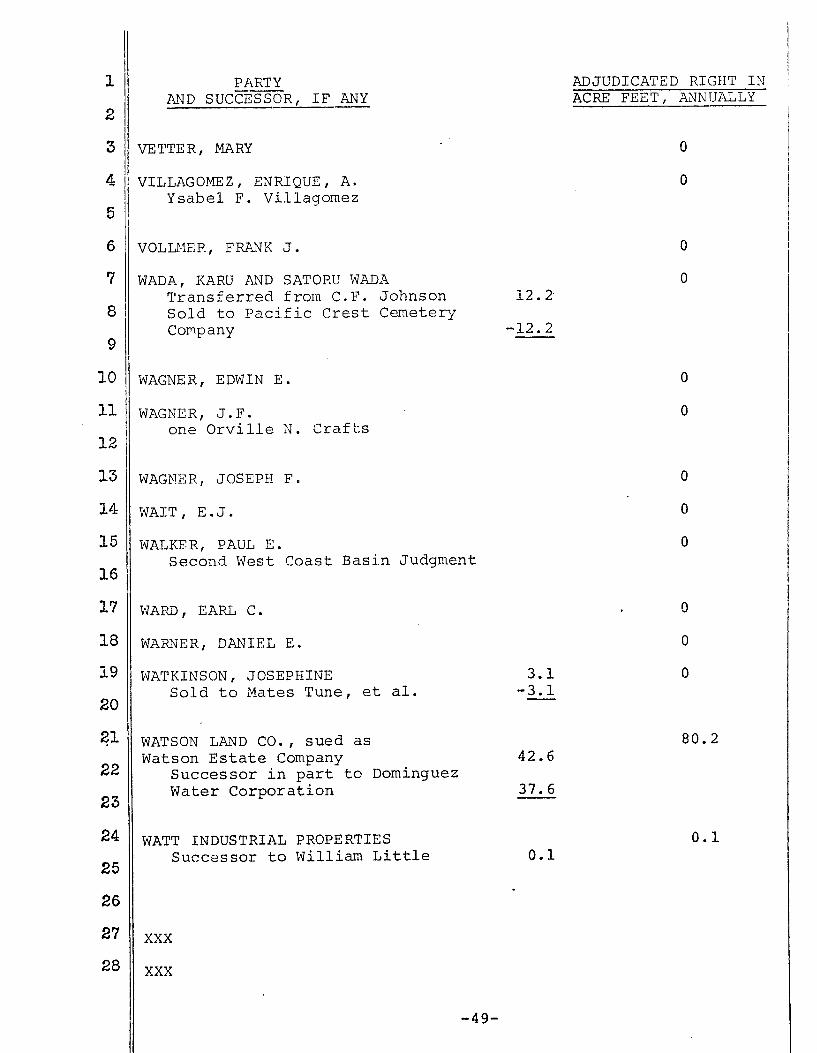
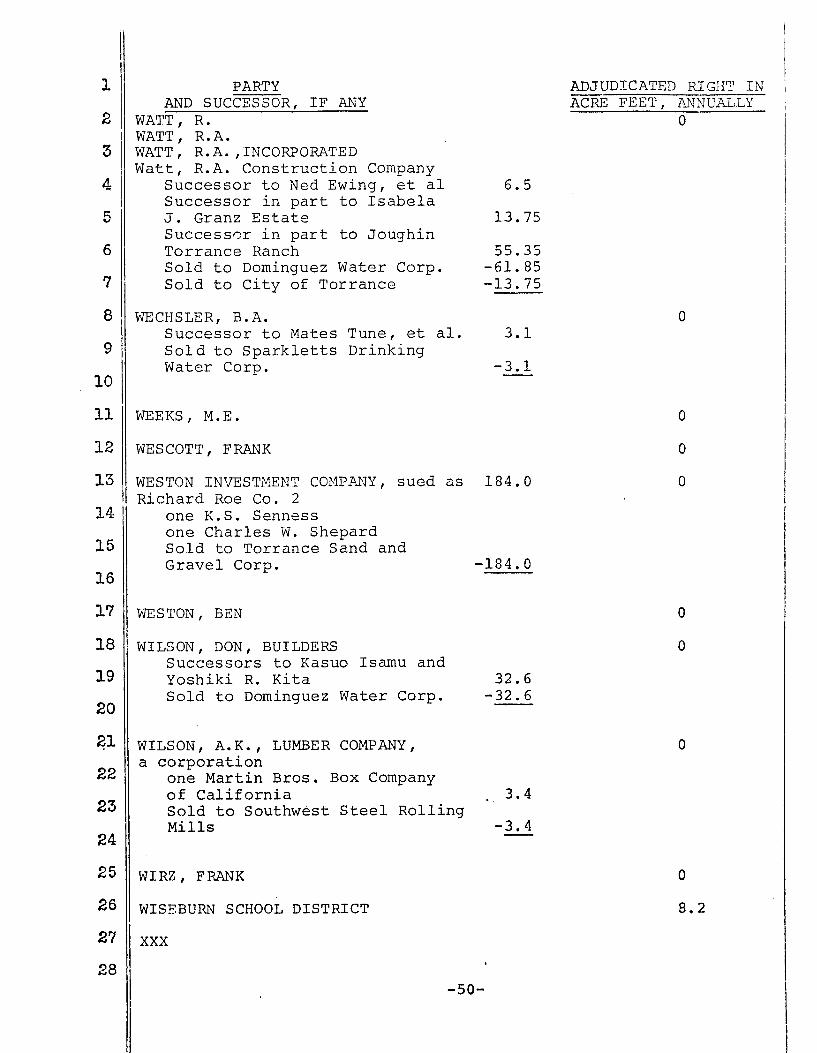
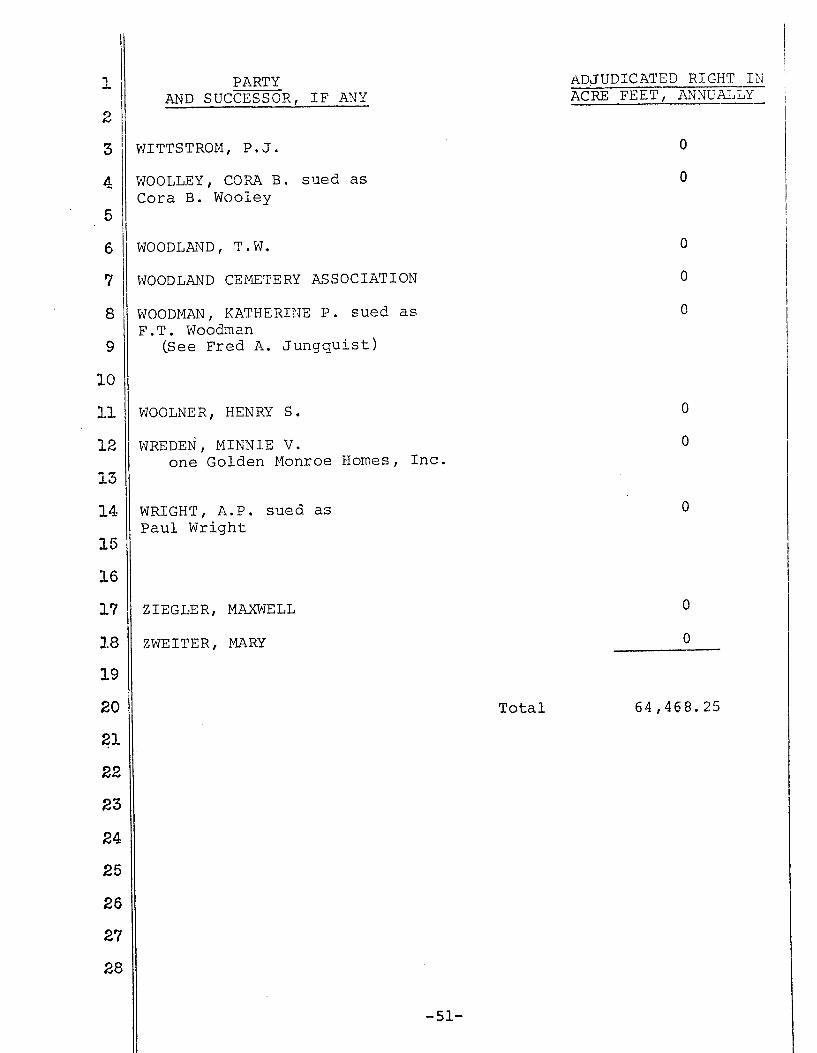
Adjudication and Demand Prior to the adjudication of groundwater rights in the early 1960s, annual production (pumping) reached levels as high as 259,400 AF in the Central Basin (“CB”) and 94,100 AF in the West Coast Basin (“WCB”). This total of 353,500 AF was more than double the natural safe yield of the basins as determined by the California Department of Water Resources in 1962 (173,400 AF). Due to this serious overdraft, water levels declined, groundwater was lost from storage, and seawater intruded into the coastal aquifers. To remedy this problem, the courts adjudicated the two basins to put a limit on pumping. The West Coast Basin adjudication was set at 64,468.25 acre-feet per year (“AFY”). The Central Basin “Allowed Pumping Allocation” (“APA”) was set at 217,367 AFY. Therefore, the current amount allowed to be pumped from both basins is 281,835.25 AFY, plus any carryover or other provisions as described at the end of this Section.
The adjudicated pumping amounts were set higher than the natural replenishment amounts, creating an annual deficit known as the “Annual Overdraft”. WRD is enabled under the California Water Code to purchase and recharge additional water to make up this overdraft, which is known as artificial replenishment or managed aquifer recharge (MAR). WRD has the authority to levy a replenishment assessment on all pumping within the District to raise the monies necessary to purchase the artificial replenishment water and to fund projects and programs necessary for replenishment and groundwater quality activities.
Groundwater Production Under the terms of Section 60326.1 of the Water Replenishment District Act, each groundwater producer must submit a report to the District summarizing their monthly production activities (quarterly for smaller producers). The information from these reports is the basis by which each producer pays the replenishment assessment.
Previous Water Year: Per the Water Code, WRD tracks and reports on groundwater production (pumping) on a Water Year (“WY”) basis covering the time frame of October 1 - September 30 of each year. For the previous WY (2013/2014), groundwater production in both basins totaled 241,105 AF, or which 198,585 AF was pumped from the CB and 42,520 AF was pumped from the WCB. Because the adjudicated rights are 281,835.25 AF, there were about 40,730 AF of available rights that were not pumped in the previous year.
Plate 1 illustrates the groundwater production in the CBWCB during the previous water year and Table A-5 presents historical pumping amounts.
Current Water Year: For the first two months of the current WY (October through November), production was 38,701 AF (32,315 AF in the CB and 6,386 AF in the WCB). This is 2,277 AF (6.2%) more than the same period of the year earlier. Because these numbers represent only 2 months of data out of 12, they are difficult to use to forecast through the rest of the year. In addition, the City of Long Beach is participating in WRD’s In-Lieu program, and will not pump up to 10,000 AF between December 2014 and April 2015. Therefore, taking into account averages over the past 3 to 5 years, excluding the anomalously low year of 2010/2011 due to the special In-lieu program, and recognizing the current In-Lieu Program, plus the continued drought, the early forecast for total pumping for the entire Water Year is 242,400 AF (200,000 AF in the CB and 42,400 AF in the WCB).
Groundwater Production
WRD Engineering Survey and Report, 2015 8
Ensuing Water Year: To estimate production for the ensuing year, recent averages are used in addition to knowledge of changing conditions that might affect pumping. Actual pumping patterns can vary considerably throughout the year based on a pumper’s individual operational needs, water demands, conservation efforts and hydrology.
To estimate the ensuing year’s groundwater pumping, WRD used the averages over the past 3 to 5 years, not including the anomalously low year of 2010/2011, and made adjustments based on anticipated conditions such as a continuing drought, conservation efforts, and reports by some pumpers that they plan on drilling new wells or bringing back online other wells, plus the continued recent trend of elevated pumping in the CB (not counting the effect of the In-Lieu Program). Using these methods produced a forecast for pumping in the ensuing WY of 244,000 AF (200,000 AF in the CB and 44,000 AF in the WCB).
Table 1 shows the groundwater production amounts for the previous, current, and ensuing water years.
Measurement of Production With few exceptions, meters installed and maintained by the individual producers measure the groundwater production from their wells. Through periodic testing by Watermaster to verify the accuracy of individual meters, corrective measures are required when necessary. The production of the few wells that are not metered is estimated on the basis of electrical energy consumed by individual pump motors or other reasonable means.
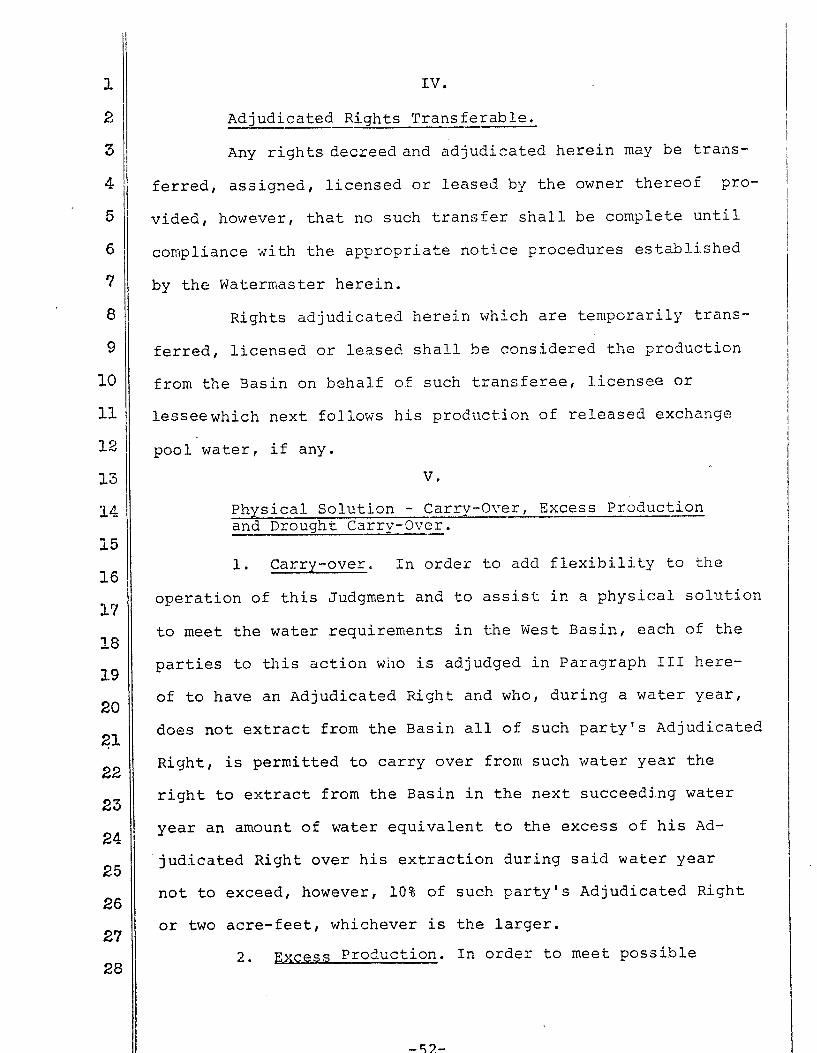
Carryover and Drought Provisions The carryover of unused pumping rights in any given year influences the actual amount of production for the ensuing year. In the 2014-2015 Administrative Year for the Central Basin Judgment (July 1 – June 30), the Central Basin carryover is 40% of the allotted pumping right, increasing to 50% in 2015-2016, 60% in 2016-2017 and each year thereafter. Beginning in the 2014-2015 Administrative Year for the West Coast Basin Judgment (July 1 – June 30) and each year thereafter, the West Coast Basin carryover is 100% of allotted pumping rights. In both the Central and West Coast Basins, the amount of carryover is reduced by the quantity of water held in a pumper’s storage account, but in no event is carryover than 20% of the allotted pumping right. These provisions of the Judgments extend the flexibility with which the pumpers can operate.
During emergency or drought conditions, WRD can allow under certain conditions an additional 27,000 AF of extractions for a four-month period (17,000 for CB and 10,000 for WCB). This provision has yet to be exercised but offers the potential use of an additional 7.8% pumping in the CB and 15% in the WCB.
The Central Basin Judgment also contains an additional Drought Carryover provision available to all Central Basin water rights holders after a declaration of a Water Emergency by the WRD Board of Directors. The Drought Carryover allows water rights holders to carryover an additional 35% of their APA (or 35 AF, whichever is larger) beyond the annual carryover described above during the period the Declared Water Emergency is in effect. The intent of the action is prevent further degradation of the groundwater basins by helping to restore groundwater levels and improving the water supply in the aquifers by providing an incentive to groundwater producers in the Central Basin to reduce pumping for a particular period of time.
Groundwater Production
WRD Engineering Survey and Report, 2015 9
A Declared Water Emergency is defined in the Central Basin Judgment as:
"A period commencing with the adoption of a resolution of the Board of Directors of the Central and West Basin Water Replenishment District [renamed Water Replenishment District of Southern California] declaring that conditions within the Central Basin relating to natural and imported supplies of water are such that, without implementation of the water emergency provisions of this Judgment, the water resources of the Central Basin risk degradation. In making such declaration, the Board of Directors shall consider any information and requests provided by water producers, purveyors and other affected entities and may, for that purpose, hold a public hearing in advance of such declaration. A Declared Water Emergency shall extend for one (1) year following such resolution, unless sooner ended by similar resolution.”
Groundwater Production
WRD Engineering Survey and Report, 2015 10
Page Intentionally Left Blank
WRD Engineering Survey and Report, 2015 11
CHAPTER 3 - GROUNDWATER CONDITIONS
Introduction The California Water Code Section 60300 requires WRD to determine annually in the Engineering Survey and Report (“ESR”) the following items related to groundwater conditions in the Central Basin and West Coast Basin (“CBWCB”):
1) Total groundwater production for the previous water year and estimates for the current and ensuing water years;
2) The Annual Overdraft for the previous water year and estimates for the current and ensuing water years;
3) The Accumulated Overdraft for previous water year and an estimate for the current water year;
4) Changes in groundwater levels (pressure levels or piezometric heights) within the District and the effects these changes have on groundwater supplies within the District; and
5) An estimate of the quantity, source, and cost of water available for replenishment during the ensuing water year;
To meet these requirements, WRD’s hydrogeologists and engineers closely monitor and collect data to manage the groundwater resources of the District throughout the year. They track groundwater levels from WRD’s network of specialized monitoring wells and from groundwater producers’ production wells. They update and run computer models developed by the United States Geological Survey (“USGS”) and others to simulate groundwater conditions and to predict future conditions. They use their geographic information system (“GIS”) and database management system to store, analyze, map, and report on the information required for the ESR. They work closely with the Los Angeles County Department of Public Works (“LACDPW”) on spreading grounds and seawater barrier wells to determine current and future operational impacts to groundwater supplies. They work closely with the Metropolitan Water District of Southern California (“MWD” or “Met”), the local MWD member agencies, and the Sanitation Districts of Los Angeles County (“SDLAC”) on the current and future availability of replenishment water. They also work with regulators on replenishment criteria for water quality and recycled water use, and with the groundwater pumpers, the pumpers’ Technical Advisory Committee (“TAC”), the Budget Advisory Committee (“BAC”), and other stakeholders to discuss the current and future groundwater conditions and beneficial projects and programs within the District and neighboring basins.
The information on Annual Overdraft, Accumulated Overdraft, water levels, and change in storage are discussed in the remainder of this chapter. Groundwater production was previously discussed in Chapter 2. The estimated quantity, source, and cost of replenishment water will be discussed in Chapter 4. Projects and programs are discussed in Chapter 5.
Annual Overdraft Section 60022 of the Water Replenishment District Act defines Annual Overdraft as "...the amount...by which the quantity of groundwater removed by any natural or artificial means from the groundwater supplies within such replenishment district during the water year exceeds the quantity
of non-saline water replaced therein by the replenishment of such groundwater supplies in such water year by any natural or artificial means other than replenishment under the provisions of Part 6 of this act or by any other governmental agency or entity." (Part 6 of the Act pertains to water that WRD
Groundwater Conditions
WRD Engineering Survey and Report, 2015 12
purchases for replenishment). Therefore, the Annual Overdraft equals the natural inflows to basins (not including WRD purchased water) minus all of the outflows (mostly pumping). There is an Annual Overdraft almost every year for the simple fact that the groundwater extractions typically exceed the natural groundwater replenishment. It has been one of the District's main responsibilities since 1959 to help make up this Annual Overdraft by purchasing artificial replenishment water to recharge the aquifers and supplement the natural recharge.
To determine the Annual Overdraft for the previous water year, WRD determines the inflows and outflows of the CBWCB. In the previous Water Year 2013/2014, natural inflows (storm water capture, areal recharge, and net groundwater underflow) totaled 92,095 AF and WRD or others contributed 86,910 AF of recharge water at the seawater barrier wells and spreading grounds. Total natural and artificial inflows, therefore, equaled 179,005 AF. Total pumping in the basins was 241,105 AF, partially reduced due to WRD’s In-Lieu incentive program. The Annual Overdraft is the natural inflows minus total outflows, or 149,010 AF (rounded to 149,000 AF).
For the current and ensuing WY estimates for Annual Overdraft, the concept of “Average Annual Groundwater Deficiency” is utilized. The Average Annual Groundwater Deficiency is the long-term average of natural inflows minus total outflows and represents the long term average deficit (Annual Overdraft) in the basins. The development of the USGS/WRD computer model derived these long term average inflow and outflow terms. Table 4 presents this information, which concluded that the Average Annual Groundwater Deficiency is 105,385 AFY. Values of the average deficiency are based on the 30-year average inflows and outflows as calculated by the computer model which ran from October 1970 through September 2000. Long-term average inflows are influenced by the amount of precipitation falling on the District as well as for storm water capture at the spreading grounds. Table 5 and Figure A show the historical precipitation at LACDPW Station #107D, located in Downey near the Montebello Forebay, or alternate stations nearby if Station #107D data are not reliable or available.
The calculation of the Average Annual Groundwater Deficiency represents in general that WRD needs to replenish about 105,385 AFY assuming long-term average conditions over that 30 year period for the water balance to reach equilibrium, the overall change in storage to equal zero, and groundwater levels to remain relatively constant. As shown in Table 6, adjustments are made to the long term average inflows and outflows for the current and ensuing WY to reflect estimates of the Annual Overdraft for those particular years. The current year has been average to dry to date, and pumping is expected to be less than the model period average in the current and ensuing years. Therefore, the projected Annual Overdrafts for the current and ensuing years are expected to be less than the long term average. Based on these adjustments, the current year Annual Overdraft is estimated at 97,200 AF and the ensuing year is estimated at 98,800 AF.
Accumulated Overdraft Section 60023 of the Water Replenishment District Act defines "Accumulated Overdraft" as "...the aggregate amount…by which the quantity of ground water removed by any natural or artificial means from the groundwater supplies…during all preceding water years shall have exceeded the quantity of non-saline water replaced therein by the replenishment of such ground water supplies in such water years by any natural or artificial means…”
In connection with the preparation of Bulletin No. 104-Appendix A (1961), the DWR estimated that the historically utilized storage (Accumulated Overdraft) between the high water year of 1904 and 19571 was 1,080,000 AF (780,000 in CB, 300,000 in WCB). Much of this storage removal was from the forebay areas (Montebello Forebay and Los Angeles Forebay), where aquifers are merged, unconfined and serve as the "headwaters" to the confined pressure aquifers. Storage loss from the 1 DWR Bulletin 104-A did not refer to the ending year for the storage determination. WRD has assumed it to be the year 1957, as this is the end year for their detailed storage analysis presented in Bulletin 104-B – Safe Yield Determination.
Groundwater Conditions
WRD Engineering Survey and Report, 2015 13
confined and completely full, deeper aquifers was minimal in comparison or was replaced by seawater intrusion, which cannot be accounted for under the language of the Water Code since it is considered saline water.
The goal of groundwater basin management by WRD is to ensure a sufficient supply of safe and reliable groundwater in the basins for annual use by the pumpers, to keep a sufficient supply in storage for times of drought when imported water supplies may be curtailed for several consecutive years as well as to keep suitable room available in the basins to receive natural water replenishment in very wet years, such as an El Niño type year.
To compute the Accumulated Overdraft since this initial amount of 1,080,000 AF, WRD takes each consecutive year's Annual Overdraft and replenishment activities and determines the change in storage. It adds to or subtracts the corresponding value from the Accumulated Overdraft. Since the base level, the aggregate excess of extractions over recharge from the basins has been reduced due to the replenishment by LACDPW in the earlier years and WRD since 1959, the reduction of pumping established by the adjudications, and the replenishment from the seawater barrier well injection. The Accumulated Overdraft at the end of the previous WY was determined to be 819,600 AF. For the current year, the Accumulated Overdraft is forecast to improve to 813,300 AF due to the purchase of imported water for spreading and the average to dry precipitation to date. This could change if hydrology or pumping patterns or planned artificial replenishment activities vary considerably in the near future.
Table 7 presents information for the previous and current Accumulated Overdraft estimate. The annual changes in storage are presented on Table 8.
Groundwater Levels A groundwater elevation contour map representing water levels within the District in fall 2014 (end of the water year) was prepared for this report and is presented as Plate 2. The data for the map were collected from wells that are screened in the deeper basin aquifers where the majority of groundwater pumping occurs. These deeper aquifers include the Upper San Pedro Formation aquifers, including the Lynwood, Silverado, and Sunnyside. Water level data was obtained from WRD’s network of monitoring wells and from groundwater production wells that are screened in the deeper aquifers.
As can be seen on Plate 2, groundwater elevations range from a high of about 170 feet above mean sea level (msl) in the northeast portion of the basin above the spreading grounds in the Whittier Narrows to a low of about 120 feet below mean sea level (msl) in the Gardena and Long Beach areas. With the exception of the Montebello Forebay and along the West Coast Basin Barrier Project, the majority of groundwater levels in the District are below sea level (red colored contours on Plate 2), which is why continued injection at the seawater barriers is needed to prevent saltwater intrusion.
Plate 2 also shows the location of the key wells used for long-term water level data. These long-term hydrographs have been presented in the ESR for years, and provide a consistent basis from which to compare changing water levels. A discussion of water levels observed in the key wells is presented below.
Los Angeles Forebay
The Los Angeles Forebay occupies the westerly portion of the Central Basin Non-Pressure Area. Historically a recharge area for the Los Angeles River, this forebay's natural recharge capability has been substantially reduced since the river channel was lined and open areas paved over. Recharge is now limited to deep percolation of precipitation in limited areas, In-Lieu replenishment when available, subsurface inflow from the Montebello Forebay, the northern portion of the Central Basin outside of WRD's boundary, and the San Fernando Valley through the Los Angeles Narrows.
Groundwater Conditions
WRD Engineering Survey and Report, 2015 14
Key well #2778 (2S/13W-10A01) represents the water level conditions of the Los Angeles Forebay (see Figure B). The water level high was observed in 1938 at an elevation of approximately 70 feet msl and by 1962 water levels had fallen nearly 180 feet to an elevation of -109 ft msl due to basin over-pumping and lack of sufficient natural recharge. Since then, basin adjudication and managed aquifer recharge by WRD and others have improved water levels in this area. At the end of WY 2013/2014, groundwater levels were at an elevation of -21.7 feet msl and were 2.3 feet lower than the previous year. The average water level change throughout the entire Los Angeles Forebay was a drop of 5.5 feet.
Montebello Forebay
The Montebello Forebay lies in the northeastern portion of the Central Basin and connects with the San Gabriel Basin to the north through the Whittier Narrows. The Rio Hondo and San Gabriel River Coastal Spreading Grounds (often called the “Montebello Forebay Spreading Grounds”) provide a substantial amount of recharge water to the CBWCB since the aquifers there are unconfined and allow easy infiltration of surface water impounded at the spreading grounds to the deeper groundwater.
Three key wells help describe the groundwater level conditions in the Montebello Forebay, a northern well, a middle well, and a southeastern well (Plate 2). The historic water levels in these three key wells are discussed below:
Well Pico1_4 (2S/11W-18C07) is in the northern part of the Montebello Forebay. The upper chart on Figure C shows the water levels for this well. Historic water levels at this well or its predecessors have ranged from a high elevation of 164.7 feet above mean sea level in April 1944 to a low of 42.8 feet msl in December 1957. At the end of WY 2013/2014, groundwater levels in this well were at an elevation of 82.7 feet msl and were 14.4 feet lower than the previous year.
Well 1601T (2S/12W-24M08) is centrally located between the Rio Hondo and San Gabriel spreading grounds. This well is monitored weekly to assess water levels in the middle of the forebay. The center chart on Figure C shows the water levels for this well. The historic water level high was observed in 1942 at an elevation of 137.8 feet above mean sea level, but by 1957 it had fallen 117 feet to an all-time low elevation of 20.9 feet msl due to basin over-pumping and insufficient natural recharge. As described above for the Los Angeles Forebay, adjudication of pumping rights and managed aquifer recharge helped restore water levels in the Montebello Forebay. At the end of WY 2013/2014, groundwater levels in this well were at an elevation of 60.3 feet msl and were 12.5 feet lower than the previous year. So far in the current year, water levels have risen about 5 feet due to December rains and imported water for spreading being purchased by WRD. As of February 2015, water levels are at an elevation of 65 feet msl.
Well 1615P (3S/12W-01A06) is located downgradient and southeast of the spreading grounds near the southern end of the Montebello Forebay. Water level responses in this well are typically less pronounced than the other two wells because it is further from the spreading grounds and the recharge that occurs there. The lower chart on Figure C shows the water level history for this well. The historic water level high was observed in 1947 at an elevation of 113.6 feet above mean sea level but by 1957 had dropped 102 feet to an all-time low elevation of 11.4 feet msl. Since then, water levels have recovered. At the end of WY 2013/2014, groundwater levels were at an elevation of 42.1 feet msl and were 10.8 feet lower than the previous year.
The average water level change throughout the entire Montebello Forebay during the previous water year was a decline of 11 feet due to the continued drought and lack of imported water for spreading.
Groundwater Conditions
WRD Engineering Survey and Report, 2015 15
Central Basin Pressure Area
The District monitors key wells 906D (4S/13W-12K01) and 460K (4S/12W-28H09) which represent the conditions of the pressurized groundwater levels in the Central Basin Pressure Area. The hydrographs for these two wells are shown on Figure D.
Groundwater highs were observed in these wells in 1935 when they began to continually drop over 110 feet until their lows in 1961 due to the over-pumping and insufficient natural recharge. Groundwater levels recovered substantially during the early 1960s as a result of replenishment operations and reduced pumping. Between 1995 and 2007 there were 100-foot swings in water levels each year between winter and summer caused by pumping pattern changes by some of the Central Basin producers who operate with more groundwater in the summer months and less groundwater in the winter months, and took advantage of the MWD and WRD In-Lieu programs. From May 2007 to March 2011 the In-Lieu water was not available, so pumping remained more constant throughout those years and water levels remain low. Since then, In-Lieu with the City of Long Beach has occurred on several occasions, with resulting water levels rising as the pumps go off, and falling when the pumps come on.
At the end of WY 2013/2014, groundwater levels in well 906D were at an elevation of -73.2 ft msl and were 11.3 feet lower than the previous year. Water levels in well 460K were at an elevation of -108.2 ft msl and were 17.3 feet lower than the previous year. The average change in water levels in the entire Central Basin Pressure Area during the previous water year was a drop of 9.2 feet.
West Coast Basin
The West Coast Basin is adjacent to the Central Basin along the Newport-Inglewood Uplift, which is a series of discontinuous, sub-parallel hills and faults that act as a partial barrier to groundwater flow. Groundwater moves across the uplift based on water levels on both sides and the “tightness” (permeability) of the uplift along its various reaches, both horizontally and vertically.
Figure E shows the hydrographs of key well Wilmington1_3 and well Lawndale1_4 (which replaces historic well 760C from now on since 760C does not have regular readings, and Lawndale 1_4 is a dedicated monitoring well installed by WRD in 2013 in the same zone as 760C and 3,000 feet away to represent similar water levels and trends). These two wells represent the general conditions of the water levels in the West Coast Basin. In 1955, the control of groundwater extractions in the West Coast Basin resulted in stabilizing and reversal of the declining water levels in the center of the basin whereas at the eastern end near the Dominguez Gap Barrier water levels continued to decline until about 1971, when a recovery began due mostly to the startup of the Dominguez Gap Barrier Project.
At the end of the previous WY 2013/2014, water levels in well Lawndale1_4 were at an elevation of -15.9 ft msl and were 1.3 feet higher than the previous year. Water levels in well Wilmington1_3 were at an elevation of -36.5 ft msl and were 2.2 feet higher than the previous year. Over the entire West Coast Basin, the average water level change was a drop of 1.6 feet.
Plate 3 shows the water level changes over the entire CBWCB over the previous water year. Because of the dry year and reduced replenishment water, the WRD service area saw on average a decrease in water levels of 4 feet, with specific regions having greater or lesser amounts as described above.
For the current WY, October through December saw above normal precipitation, but January and February have been below normal, producing an overall pattern or average to slightly below average precipitation so far. WRD is maximizing recycled water replenishment within regulatory limits, and is currently purchasing imported water for spreading. Therefore, the District expects water levels to stay the same or decrease somewhat in the current water year.
Groundwater Conditions
WRD Engineering Survey and Report, 2015 16
Because the current groundwater levels in the CBWCB are within historic ranges and the anticipated replenishment activities by WRD will continue as planned, the District anticipates that there will continue to be sufficient supplies of safe and reliable groundwater to meet the demands of the pumpers in our service area in the current and ensuing years.
Change in Storage The District determines the annual change in groundwater storage by comparing water levels from one year to the next, and factoring in the storage coefficients of the major aquifer layers. Rising groundwater means there is an increase in the amount of groundwater in storage whereas a drop in groundwater levels means there is a decrease in storage. Using groundwater elevation data collected from WRD's monitoring well network and selected production wells, the District constructs a groundwater level change map showing water level differences from one year to the next (Plate 3). The data from this map are converted to grids in the District’s Geographic Information System (GIS) and multiplied by the storage coefficient value grids for the aquifer layers as obtained from the USGS calibrated Modflow computer model of the District. This calculation produces the change in storage value for the previous water year.
For WY 2013/2014, there was an overall drop in water levels with a resulting loss from storage in the amount of 62,100 AF. Most of this storage loss (49,200 AF or 79%) occurred in the Montebello Forebay, which is the gateway for large amounts of recharge water to enter the aquifer systems and flow into the rest of the District. This loss from storage occurred due to the dry year resulting in reduced replenishment water from a lack of both storm water and imported water. However, the groundwater basins are operating properly as an enormous underground reservoir – accepting water and rising when replenishment water is plentiful and pumping demands are low, and draining to meet the demands when replenishment water is lacking and pumping is high. Table 8 provides the historical groundwater storage changes in the CBWCB.
Optimum Groundwater Quantity In response to a 2002 State audit of the District’s activities, the Board of Directors adopted an Optimum Quantity for groundwater amounts in the CBWCB. The Optimum Quantity is based on the Accumulated Overdraft (AOD) concept described in the Water Code and this ESR. The historic maximum groundwater drawdown due to over pumping reported in the CBWCB between 1904 and 1957 was 1,080,000 AF. This is defined as the historic maximum AOD. As pumping eased and artificial replenishment occurred, more water was put back into the basins and the AOD was reduced resulting in rising water levels.
After considerable analysis and discussion, the Board of Directors on April 19, 2006 established an Optimum Quantity of an AOD of 612,000 AF. This value was based on an extensive review of over 70 years of water level fluctuations in the District and recognizing that at the end of WY 1999/2000 groundwater amounts were at an acceptable quantity to sustain the adjudicated pumping rights in the basins. The AOD at that time was 611,900 AF (rounded to 612,000 AF), and therefore was set by the Board of Directors as the Optimum Quantity.
The Board of Directors on April 19, 2006 also adopted a policy to make up the Optimum Quantity should it fall too low. The policy is as follows:
An Accumulated Overdraft greater than the Optimum Quantity is a deficit. WRD will make up the deficit within a 20 year period as decided by the Board on an annual
basis. If the deficit is within 5 percent of the Optimum Quantity, then no action needs to be taken to allow for natural replenishment to makeup the deficit.
The Accumulated Overdraft at the end of WY 2013/2014 was 819,600 AF, or 207,600 AF below the Optimum Quantity.
WRD Engineering Survey and Report, 2015 17
CHAPTER 4 - GROUNDWATER REPLENISHMENT: QUANTITIES, AVAILABILITY, AND COSTS
As discussed in the previous chapter, the Central Basin and West Coast Basin (“CBWCB”) have an annual overdraft because more groundwater is pumped out than is naturally replaced. The District purchases supplemental water (artificial replenishment water) each year to help offset this overdraft through managed aquifer recharge. The purchased water enters the groundwater basins at the Montebello Forebay spreading grounds, at the seawater barrier injection wells, and through the District's In-Lieu Program. The purpose of this Chapter is to determine the quantities of water needed for purchase in the ensuing year and to determine the availability and cost of that water.
Sources of Replenishment Water The District currently has available to it recycled and imported water sources for use as artificial replenishment water. These two sources are described below:
Recycled Water: Recycled water is wastewater from the sewer systems that is reclaimed through extensive treatment at water reclamation plants (“WRP”s). The water is treated to high quality standards so that it can be reused safely, and offsets the need to use more expensive and sometimes less available imported water. Some agencies and businesses use recycled water for non-potable purposes, such as for irrigation of parks, golf courses, and street medians, or for industrial purposes (known as “purple-pipe projects”). WRD has successfully used recycled water for groundwater recharge since 1962. In semi-arid areas such as Southern California where groundwater and imported water are in short supply, recycled water has proven to be a safe and reliable additional resource to supplement the water supply. Recycled water is used at the spreading grounds and the seawater barrier wells. Although recycled water is high quality, relatively low cost, and a reliable supply all year long, the District is limited by regulatory agencies in the amount it can use for replenishment. Therefore, imported water is also used for recharge.
Imported Water: Raw river water from northern California (State Water Project) and the Colorado River is imported into Southern California by the Metropolitan Water District of Southern California (“MWD” or “Met”) and the City of Los Angeles Department of Water and Power (DWP). MWD sells this water as raw or treated to their member agencies for multiple uses, including potable water and groundwater recharge. WRD uses raw (untreated) imported water at the spreading grounds and uses treated potable water for injection at the seawater barrier wells and the In-Lieu program. Because of treatment and transportation costs, imported water is the most expensive type for groundwater replenishment. Prior to October 2011, MWD offered seasonally-available discounted water that could be purchased for replenishment. In turn for the discount, it was considered by MWD to be interruptible and they could stop deliveries at any time. But due to a lack of surplus supplies caused by drought and other factors, MWD has eliminated offering this type of discounted interruptible water. Instead, replenishment agencies such as WRD must now purchase what is known as “Tier 1” or “Tier 2” water from MWD member agencies for spreading and In-Lieu. This water is at a higher price and relies on available allocation from the member agency, but supposed to be firm delivery water (not interruptible); although during extreme droughts MWD can reduce or halt sales to replenishment agencies, as it did in 2014/2015. The seawater barrier injection water has been Tier 1 treated water for decades and has to date not been interrupted by MWD.
Groundwater Replenishment
WRD Engineering Survey and Report, 2015 18
Recommended Quantities of Replenishment Water With the information presented in the preceding chapters regarding the pumping demands in the CBWCB and the overall condition of the groundwater basins, WRD can estimate its projected need for replenishment water in the ensuing year.
Spreading
Groundwater recharge through surface spreading occurs in the Montebello Forebay Spreading Grounds adjacent to the Rio Hondo and the San Gabriel River, within the unlined portion of the San Gabriel River, and behind the Whittier Narrows Dam in the Whittier Narrows Reservoir. Owned and operated by the Los Angeles County Department of Public Works (“LACDPW”), they were originally constructed in 1938 for flood control and conservation of local storm water, but have been used since the 1950s to replenish the basins with imported water and since 1962 with recycled water.
Since recycled water is a high quality, less expensive, and available year-round source of replenishment water, the District maximizes its use within established regulatory limits. These limits are discussed below under “Expected Availability of Replenishment Water”. The District has historically targeted 50,000 AFY of recycled water for spreading to meet regulatory limits. However, with the recent modifications to the District’s permit to allow 45% recycled water over a running 10-year average (see below under Expected Availability of Replenishment Water), the District can now target 55,000 AFY of recycled water as long as sufficient dilution water is available from storm water and imported water.
Additional replenishment water is needed beyond the 55,000 AFY of recycled water and will have to come from imported water. In 2003, the WRD Board adopted the long term average of 27,600 AFY of imported water to purchase for spreading. This value was based on long-term (30 year) averages of the overall water budget of the basins using the USGS computer model. The 2003 ESR discusses the derivation of this value in more detail.
Since that time, the District has invested in cooperative projects with the LACDPW to capture more storm water and to lessen the need for imported water as part of WRD’s Water Independence Now program, or WIN. Improvements to the Whittier Narrows Conservation Pool are expected to conserve an additional 3,000 AFY of storm water on average. Two new rubber dams were built in the San Gabriel River near Valley Boulevard and are expected to conserve an additional 3,600 AFY on average. And with the revisions to the recycled water permit discussed in the previous paragraph, 5,000 additional AF of recycled water can be planned thus lowering imported water by 5,000 AFY. Therefore, the new Long Term Average for imported spreading demands is 16,000 AFY, which is the targeted amount for the ensuing year.
Table 9 presents the anticipated imported water replenishment needs at the spreading grounds.
Injection
Another way of replenishing the groundwater supply is to inject water at the three seawater intrusion barriers owned and operated by the LACDPW, including the West Coast Basin Barrier, Dominguez Gap Barrier, and Alamitos Barrier. Although the primary purpose of the barriers is for seawater intrusion control, groundwater replenishment also occurs as the freshwater is injected into the CBWCB aquifers and then moves inland towards pumping wells.
To determine the amount of barrier water estimated for the ensuing year, WRD under an Agreement with LACDPW gets annual estimates from the expected demand at the barriers. WRD reviews these estimates; reviews recent 5-year averages of actual injection amounts, and makes adjustments as necessary. For the ensuing year, WRD estimates the West Coast Basin Barrier Project will require 19,000 AF, of which the majority (14,300 AF) will be recycled water from WBMWD’s Edward C.
Groundwater Replenishment
WRD Engineering Survey and Report, 2015 19
Little Water Recycling Facility and the remaining 14,300 AF will be imported water. For the Dominguez Gap Barrier Project, a total of 8,000 AF is expected to be needed, of which 5,600 AF will be recycled water from the City of Los Angeles’ Terminal Island Treatment Plant (maximum amount currently allowed by permit) and 2,400 of imported water. For the Alamitos Barrier Project, a total of 5,300 AF will be required by WRD (does not include barrier water purchased by Orange County Water District for their side of the barrier), which includes 4,800 AF of recycled water from the expanded Leo J. Vander Lans Water Treatment Facility plant and 500 AF of imported water.
The total barrier demand for WRD in the ensuing year is estimated at 32,300 AF, including 7,600 AF imported water (24%) and 24,700 AF of recycled water (76%) (see Table 9).
In-Lieu Replenishment Water
The basic premise of WRD’s In-Lieu Program is to offset the pumping in the basin to lower the annual overdraft and reduce the artificial replenishment needs. It helps provide an alternate means of replenishing the groundwater supply by encouraging basin pumpers to purchase imported water when available instead of pumping groundwater. This can help raise water levels in areas that are otherwise more difficult to address. MWD has ceased providing seasonally discounted water for the In-Lieu program since 2011, so WRD’s program has been put on hold with the exception of a few localized projects with the City of Long Beach. For the previous year, WRD had an In-Lieu Program with Long Beach for 4,371 AF, which helped keep groundwater in the CBWCB. For the ensuing year, WRD is not budgeting for the In-Lieu program, although may consider new programs if opportunities arise.
Expected Availability of Replenishment Water The availability of water supplies for the ensuing water year has been taken into account when determining how funds should be raised. If a particular resource is expected to be unavailable during a given year, money can still be raised to fund the purchase of that quantity of water in a succeeding year.
Recycled Water
Recycled water is reliable all year round but its use for recharge is capped by regulatory limits. The current limits for recycled water spreading in the Montebello Forebay are established by the Los Angeles Regional Water Quality Control Board (“RWQCB”) and are detailed in Order No. 91-100 adopted on September 9, 1991 with amendments on April 2, 2009 under Order No. R4-2009-0048 and June 4, 2013 (letter approval from RWQCB Executive Officer). On April 10, 2014, under Order No. R4-2009-0048-A-01, the RWQCB approved a request by WRD to increase the allowable percentage of recycled water to be recharged at the Montebello Forebay spreading grounds from 35% to 45% over a 10-year running average as a drought relief measure. This major action will allow continued use of historic amounts of recycled water for longer periods of time should the dry conditions continue, and might allow for additional recycled water for recharge should normal to wet hydrologic conditions return. This will allow WRD to continue to maximize use of recycled water for groundwater recharge as part of its Water Independence Now, or WIN, initiative.
The Sanitation Districts of Los Angeles County (“SDLAC”) provides the recycled water to WRD for spreading by LACDPW. This water comes from the Whittier Narrows Water Reclamation Plant (“WNWRP”), San Jose Creek Water Reclamation Plant (“SJCWRP”), and Pomona Water Reclamation Plant (“PWRP”). For planning purposes, the District assumes purchasing 55,000 AFY of recycled water in the ensuing year, although this amount can vary based on percentage limits and availability of the recycled water and the spreading grounds.
Groundwater Replenishment
WRD Engineering Survey and Report, 2015 20
Recycled water for injection into the seawater barrier wells comes from different agencies depending on the specific barrier. At the WCBBP, the water is provided by WBMWD's Edward C. Little Water Recycling Facility. Per regulatory limits, this resource can provide up to 100% recycled water to the Barrier under their Phase V construction activities, although the volumes produced from the plant have not reached 100%, partially due to the barrier requiring more water than the plant can produce and partially due to the continued ramping up of deliveries from the Phase V plant and conditions imposed by the barrier’s owner/operator, the LACDPW.
Recycled water for the DGBP is typically available from the City of Los Angeles’ Terminal Island Treatment Plant (Harbor Recycled Water Project). The plant is permitted to provide the barrier with a maximum of 5 million gallons per day (mgd), averaged daily (equivalent to 5,600 AFY if running at 5 mgd for the full year), or 50% of the total barrier supply over a 5-year averaging period, calculated by a running monthly average over the preceding 60 months, whichever is less. For the ensuing year, it is estimated that of the 8,000 AF demand next year, 5,600 AF will be recycled water and 2,400 AF will be imported water. Efforts are underway to expand the plant’s treatment capabilities and increase the recycled percentage amount to 100% to eliminate the need for imported water.
Recycled water for the ABP is available from WRD's Leo J. Vander Lans Water Treatment Facility. This treatment plant was permitted to provide up to 100% of the barrier with recycled water in 2014 and is expected to run at this rate starting in early 2015. For the ensuing year, of the 5,300 AF estimated to be injected at the barrier on the WRD-side of the barrier (not including the Orange County side), an estimate of 4,800 AF will be recycled water and 500 AF will be imported water to make up any plant shut downs for maintenance or other issues.
Imported Water
Since October 2011, MWD terminated its discounted replenishment water program which the District utilized since 1959, and has not yet offered a new replenishment program. Replenishment agencies must rely on the more expensive Tier 1 water if it is available from MWD-member agencies, or pay the even higher priced Tier 2 water if Tier 1 water is unavailable. Over the past few years, WRD has budgeted for Tier 1 water for the spreading grounds and the In-Lieu program.
For the imported water used for injection at the seawater barrier wells, the District had paid the treated Tier 1 rate for decades to ensure availability. Because of the increasing price of Tier 1 water, the District is looking at ways to reduce costs. Methods such as reduction of pumping near the barriers, increased recycled water to offset imported water, or banking water at lower seasonal rates are being explored or implemented. At the ABP, the City of Long Beach and WRD have entered into an agreement to bank seasonal treated water and Tier 1 water through inland injection wells and then extract the water for injection at the barriers when needed, thus saving considerable costs on barrier water. In 2009/2010, the 2,000 AF of Tier 1 water banked in 2008/2009 was utilized. The seasonal water banked in 2004/2005 through 2006/2007 has 2,160 AF remaining and can be called at any time that serves the District most effectively.
Projected Cost of Replenishment Water WRD has estimated it will need 103,300 AF of replenishment water in the ensuing year. Using currently available information and estimates for the cost of replenishment water to WRD from the various water suppliers, this water will cost WRD approximately $42,125,595. Costs may change over the next few months as the other agencies adopt their budgets, and any changes will be incorporated into an updated ESR.
Groundwater Replenishment
WRD Engineering Survey and Report, 2015 21
Tables 1 and 2 provide a detailed breakdown of the estimated replenishment water costs for the ensuing water year. These estimated costs are for water purchases only and do not include the additional costs for water replenishment and water quality projects and programs. These projects and programs are discussed in detail in Chapter 5. The anticipated costs of these projects and programs will be further discussed in District budget workshops, Budget Advisory Committee (“BAC”), and other public meetings before the Board of Directors adopts the 2015/2016 Replenishment Assessment in May.
Groundwater Replenishment
WRD Engineering Survey and Report, 2015 22
Page Intentionally Left Blank
WRD Engineering Survey and Report, 2015 23
CHAPTER 5 - PROJECTS AND PROGRAMS California Water Code Sections 60220 through 60226 describe the broad purposes and powers of the District to perform any acts necessary to replenish, protect, and preserve the groundwater supplies of the District. In order to meet its statutory responsibilities, WRD has instituted numerous projects and programs in a continuing effort to effectively manage groundwater replenishment and groundwater quality in the Central Basin and West Coast Basin (“CBWCB”). These projects and programs include activities that enhance the replenishment program, increase the reliability of the groundwater resources, improve and protect groundwater quality, and ensure that the groundwater supplies are suitable for beneficial uses. These projects and programs have had a positive influence on the basins, and WRD anticipates continuing these activities into the ensuing year. The following is a discussion of the projects and programs that WRD intends to continue or initiate during the ensuing year. 001 – Leo J. Vander Lans Water Treatment Facility Project The Leo J. Vander Lans Water Treatment Facility provides advanced treated recycled water to the Alamitos Seawater Intrusion Barrier. The facility receives tertiary-treated water from the Sanitation Districts and provides the advanced treatment through a process train that includes microfiltration (MF), reverse-osmosis (RO), and ultraviolet light (UV). The facility’s operations permit was approved by the Los Angeles Regional Water Quality Control Board (“RWQCB”) on September 1, 2005, and the replenishment operations of this facility started in October 2005. The product water has since been discharging to the barrier to replace up to 50% of the potable imported water formerly used, thereby improving the reliability and quality of the water supply to the barrier. The plant has been producing 3 million gallons a day (“MGD”) for delivery to the barrier. The Long Beach Water Department (“LBWD”) is responsible for operation and maintenance of the treatment plant under contract with WRD. The facility was expanded in late 2015 to increase the capacity to 8 MGD, with the operations permit amended by the RWQCB for the expanded facility. It is capable of providing up to 100% of the barrier demand with advanced treated recycled water, thereby eliminating altogether the need for imported water. The facility expansion added unique treatment process enhancements to reduce facility’s waste generations. The process enhancements include (1) a third-stage RO to increase recovery from the original 85% to 92.5%; and (2) a MF backwash waste treatment system that recovers approximately 95% of the backwash waste stream through dissolve air flotation (DAF) treatment and a follow-up polishing MF. With these process enhancements, the facility has been expanded to almost triple the production capacity without any increases in waste generations. Expected operations costs for the coming year will involve operation and maintenance of the plant and groundwater monitoring at the barrier. Because the primary purpose of this project is to provide a more reliable means of replenishing the basin through injection, 100% of the costs are drawn from the Replenishment Fund. The capital costs for the expansion are funded by federal and state grants as well as the District’s bond proceeds.
Projects and Programs
WRD Engineering Survey and Report, 2015 24
002 – Robert W. Goldsworthy Desalter Project The Robert W. Goldsworthy Desalter has been operating since 2002 to remove over 20,000 AF of brackish groundwater from a seawater intrusion plume (aka “saline plume”) in the Torrance area that was stranded inland of the West Coast Basin Barrier after the barrier project was put into operation in the 1950s and 1960s. The production well and desalting facility are located within the City of Torrance and the product water is delivered for potable use to the City’s distribution system. The treatment plant capacity is about 2,200 AFY. The City is responsible for operation and maintenance of the treatment plant under contract with WRD. The District has completed a final design for expanding the Goldsworthy Desalter. The expansion project includes an increase of treatment capacity to a total 4,800 AFY, the addition of two new source water wells, and associated conveyance pipelines and pump stations. Construction of these new facilities is expected to begin in the middle of 2015. The purpose of the desalter expansion is directly related to remediating degraded groundwater quality and costs will be funded through WRD’s Capital Improvement Program. Expected costs for the coming year will involve capital improvements for the plant expansion as well as operation and maintenance of the plant. Additional measures may be necessary in the future to fully contain and remediate the saline plume, which extends outside of the Torrance area. WRD is completing work on a groundwater master plan for the West Coast Basin to determine long-term solutions to this problem. The District continues to work with the City of Torrance Municipal Water Department, the pumpers’ Technical Advisory Committee, and other West Coast Basin stakeholders on the future of the saline plume removal in the West Coast Basin. 004 – Recycled Water Program Recycled water or reclaimed municipal wastewater has been successfully used for groundwater recharge by WRD since 1962. Recycled water provides a reliable source of high quality water for surface spreading in the Montebello Forebay and for injection at the seawater intrusion barriers. In light of the recurring drought conditions in California and uncertainties about future water availability and increasing cost of imported water supplies, recycled water has become increasingly vital as a replenishment source. In order to ensure that the use of recycled water for groundwater recharge remains a safe and reliable practice, WRD participates in various research and monitoring activities, proactively contributes to the regulatory and legislative development processes, and engages in information exchange and dialogue with regulatory agencies and other recycled water users. The District continues to closely coordinate with the Sanitation Districts of Los Angeles County (SDLAC), which produces the recycled water used for surface spreading in the Montebello Forebay, on permit compliance activities, including groundwater monitoring, assessment, and reporting. Many monitoring and production wells are sampled frequently by WRD staff, and the results are reported to the regulatory agencies. In addition to compliance monitoring and sampling associated with the spreading grounds, WRD is partnering with others to more fully investigate the effectiveness of soil aquifer treatment (SAT) during groundwater recharge. A recent research conducted at the test basin adjacent to the spreading grounds augmented past research efforts by characterizing the percolation process and by quantifying the filtering and purifying properties of the underlying soil with respect to constituents of concern, such as nitrogen, total organic carbon, and chemicals of emerging concern (CECs). The District
Projects and Programs
WRD Engineering Survey and Report, 2015 25
continues to be vigilant in monitoring research on the occurrence, significance, attenuation, and removal of CECs, including pharmaceuticals, endocrine disruptors, and personal care products. Three separate groundwater tracer studies were performed in 2003-2005, 2005-2006, and 2010-2011 for the purpose of tracking and verifying the movement of recycled water from the spreading grounds by testing the monitoring wells and the production wells. Results showed that the depth rather than the horizontal distance from the recharge ponds is the key factor influencing arrival times of recycled water to wells. Travel time to deeper wells is greater than to shallower wells, even if the deeper wells are located much closer to the spreading grounds than shallower wells. In some cases, WRD made modifications to wells to seal off their shallow perforations so that the wells would only produce from the deeper aquifers. Tracer tests conducted subsequent to well modification demonstrated an increased travel time compared to earlier results. These efforts, in addition to periodic studies assessing health effects and toxicological issues, are necessary to provide continued assurances that the use of recycled water for groundwater recharge remains safe and compliant with all regulatory standards. In response to the prolonged drought, WRD worked closely with the regulatory agencies to allow a greater amount of recycled water to be used for spreading at the Montebello Forebay Spreading Grounds, through an amendment of the existing permit in 2014. This amendment will allow WRD to continue to utilize recycled water even when storm water and imported water become scare or unavailable. As required by the permit amendment, WRD will implement additional monitoring when the recycled water contribution reaches forty percent. In addition, WRD, in concert with other stakeholders, worked closely with the State Water Resources Control Board’s Division of Drinking Water (DDW; formerly, California Department of Public Health) to review, update, and help shape the regulations on groundwater recharge using recycled water, which became effective in June 2014. Recycled water is also injected into the Los Angeles County Department of Public Works’ three seawater intrusion barriers located along the coast of Los Angeles County (Alamitos, West Coast, and Dominguez Gap barriers). Highly purified recycled water used for injection at the Alamitos Barrier is produced at WRD’s Leo J. Vander Lans Water Treatment Facility. The recycled water for the Dominguez Gap Barrier is generated at the City of Los Angeles’ Terminal Island Water Reclamation Plant. And the recycled water for the West Coast Barrier is produced at the West Basin Municipal Water Districts’ Edward C. Little Water Recycling Facility. Extensive recycled water monitoring and regular groundwater modeling are performed to ensure that the treatment plants are operating as intended and that the injected water is making a positive contribution to the groundwater basins. All three barrier projects are in various phases of expanding the recycled water produced for the barrier operations, with the ultimate goal of completely phasing out the potable water used at the barriers. Alamitos Barrier will reach the goal of 100% recycled water recharge in 2015, with the other two barriers following in the near future. Projects under this program help improve the reliability and utilization of an available local resource, i.e. locally produced recycled water. This resource is used to improve replenishment capabilities and is thus funded from the Replenishment Fund. 005 – Groundwater Resources Planning Program The Groundwater Resources Planning Program was instituted to evaluate basin management issues and to provide a means of assessing project impacts in the District’s service area. Prior to moving forward with a prospective project, an extensive evaluation is undertaken. Within the Groundwater Resources Planning Program, new projects and programs are analyzed based on benefits to overall basin management. This analysis includes performing an extensive economic evaluation to compare
Projects and Programs
WRD Engineering Survey and Report, 2015 26
estimated costs with anticipated benefits. As part of this evaluation process, all capital projects are brought to the District’s Technical Advisory Committee for review and recommendation. The culmination of this review and evaluation process is the adoption of the five - year Capital Improvement Program (“CIP”) by the District’s Board of Directors. Under this program, District staff will continue to monitor state and federal funding programs to determine applicability to the District’s list of prospective projects. In the coming year, the District will continue participation in Integrated Regional Water Management Planning (“IRWMP”) for Greater Los Angeles County. Collaborative development of the region’s IRWM plan is a requirement for entities to secure grant funding under Proposition 84 that was passed in November 2006 and Proposition 1 that was passed in November 2014. Grant applications for Proposition 84, Round 4 are expected to be submitted to the California Department of Water Resources in the upcoming year. The District anticipates submitting an application for the Groundwater Reliability Improvement Program (“GRIP”) under this program. Projects under the Groundwater Resources Planning Program serve to improve replenishment operations and general basin management. Accordingly, this program is also wholly funded through the Replenishment Fund. 006 – Groundwater Quality Program This program is an ongoing effort to address water quality issues that affect WRD projects and the pumpers’ facilities. The District monitors and evaluates the impacts of proposed, pending and recently promulgated drinking water regulations and legislation. The District assesses the justification and reasoning used to draft these proposals and, if warranted, joins in coordinated efforts with other interested agencies to resolve concerns during the early phases of the regulatory and/or legislative process. Annually, the District offers a groundwater quality workshop to water purveyors. At the workshop, field experts and regulators provide information on the latest water quality regulations, state of the groundwater in the local basins, information on the cutting edge technology for contaminant removal or well rehabilitation, and other topics that are of key interest to the District’s water purveyors. This year’s annual workshop is anticipated to feature speakers from the State Water Resources Control Board to help deconstruct the requirements of the 2014 Statewide Permit for Drinking Water Discharges and to help respond to questions from the purveyors. The annual workshop also gives a comprehensive overview of the resources provided under the District’s Groundwater Quality Program. The District continually evaluates compliance with current and anticipated water quality regulations in production wells, monitoring wells, and spreading/injection waters of the basins. WRD proactively investigates any potential non-compliance situations to confirm or determine the causes of noncompliance, develops recommended courses of action and estimates their associated costs to address the problem, and implements the best alternative to achieve compliance. Effective January 1, 2007, the District assumed responsibility for the Central Basin Title 22 Groundwater Monitoring Program. The program involves working with participating pumpers to comply with regulatory requirements for well water monitoring, including: (1) scheduling the collection and analysis of samples for Title 22 compliance required by the State Water Resources Control Board (SWRCB) Division of Drinking Water (DDW) and special sampling such as the Unregulated Contaminant Monitoring Rule (“UCMR”) required by the United States Environmental
Projects and Programs
WRD Engineering Survey and Report, 2015 27
Protection Agency (“EPA”); (2) coordinating the submittal of results to the SWRCB DDW; and 3) preparing the annual Consumer Confidence Reports for the pumpers. This program is available to pumpers who choose to participate and agree to reimburse the District the actual monitoring costs, including District staff time in administering the program. The District presently has 22 pumpers/participants in this program, which involves a total of 84 wells. In recent years, new Chemicals of Emerging Concern (CECs) have been identified nationwide as potentially impacting surface water and groundwater. CECs can be broadly defined as any synthetic or naturally occurring chemical or any microorganism that is not commonly monitored in the environment but has been recently detected in the environment. CECs such as pharmaceuticals and personal care products, perfluorinated compounds, polybrominated diphenyl ethers, and others may pose a potential threat to water resources. Their detection in the environment does not necessarily mean that they pose a health threat at their measured concentrations. WRD is actively monitoring surface spreading and injection activities for water quality constituents, including many CECs. In addition, the District supports research evaluating CEC removals using innovative treatment technologies. WRD’s service area contains a large and diverse industrial and commercial base. Consequently, many potential groundwater contamination sources exist within District boundaries. Examples of potential contamination sources include leaking underground storage tanks, petroleum pipeline leaks at refineries and petrochemical plants, and discharges from dry cleaning facilities, auto repair shops, metal works facilities, and others. Such contamination sources may pose a threat to the drinking water aquifers. Accordingly, WRD established its Groundwater Contamination Prevention Program as a key component of the Groundwater Quality Program in an effort to minimize or eliminate threats to groundwater supplies. The Groundwater Contamination Prevention Program includes several ongoing efforts: Central Basin and West Coast Basin Groundwater Contamination Forum: More than 10 years
ago, WRD established this data-sharing and discussion forum with key stakeholders including the EPA, the California Department of Toxic Substances Control (“DTSC”), the RWQCB, the SWRCB DDW, the United States Geological Survey (“USGS”), and various cities and purveyors. Stakeholders drafted and signed a Memorandum of Understanding (“MOU”) agreeing to meet regularly and share data on contaminated groundwater sites within the District. WRD acts as the meeting coordinator and data repository/distributor, helping stakeholders to characterize the extent of contamination to identify potential pathways for contaminants in shallow aquifers to reach deeper drinking water aquifers and develop optimal methods for remediating contaminated groundwater.
With the cooperation and support of all stakeholders in the Groundwater Contamination Forum, WRD developed a list of high-priority contaminated groundwater sites located within the District. This list is a living document, subject to cleanup and “closure” of sites, as well as discovery of new sites warranting further attention. Currently, the list includes 48 sites across the CBWCB. WRD works with the lead regulatory agencies for each of these sites to keep abreast of their status, offer data collection, review and recommendations as needed, and facilitate progress in site characterization and cleanup.
In 2012, WRD formed the Los Angeles Forebay Groundwater Task Force to coordinate and align
regulators and water purveyors/agencies to collaboratively address groundwater contamination in the Los Angeles Forebay that is a threat to drinking water resources. The Task Force members currently include WRD, DTSC, EPA, RWQCB, SWRCB DDW, USGS, City of Vernon, City of
Projects and Programs
WRD Engineering Survey and Report, 2015 28
Los Angeles and others. WRD and DTSC are investigating and collecting data to assess the extent of regional volatile organic compound and perchlorate plumes and find the source(s) of this contamination. This data will be utilized by the regulatory agencies to eventually facilitate remediation of the plumes.
WRD remains committed to projects seeking opportunities and innovative project concepts to enhance capture and recharge of local stormwater runoff in order to augment local groundwater resources, as follows: For over a decade, the District has participated on the Technical Advisory Committee (“TAC”) for
the Water Augmentation Study (“WAS”) of the Los Angeles and San Gabriel Rivers Watershed Council. WAS is a multi‐year investigation into the feasibility of capturing more local storm runoff, which would otherwise discharge into the storm drains, channels, and ultimately be lost to the ocean. Local stormwater captured from small‐scale sites (e.g. neighborhoods, parks, ball fields, etc.) using various infiltration practices (e.g. bioswales, infiltration basins, and porous pavements) represents a potential source of new replenishment water, above and beyond the stormwater currently captured and used for percolation at the existing spreading grounds. As a TAC member, WRD helps to steer the study to examine and ensure that this new source of recharge water does not degrade groundwater quality if allowed to percolate at local sites. In 2012, with financial contributions from the District, two lysimeters were installed as part of the WAS investigation to evaluate the potential impacts of the locally captured stormwater on groundwater quantity and quality at the Elmer Avenue neighborhood BMP demonstration project constructed in 2009. Monitoring of the lysimeters began in early 2013 and extended through 2014. The results of the water quality sampling at Elmer Avenue is summarized in Council for Watershed Health’s 2014 Annual Monitoring Report for Prop 84 Storm Water Grant Program Agreement #12‐425‐550 (Assessing the Effect of Long‐Term Stormwater Infiltration on Groundwater Quality; Continued Monitoring of the Los Angeles Basin Water Augmentation Study Infiltration Best Management Practices (BMPs)).
The Stormwater Recharge Feasibility Study, which began mid‐2011 and was completed in August 2012, investigated regional and distributed alternatives to capture more stormwater from parcels within the District service area for groundwater recharge. To identify and prioritize catchments or parcels with greatest potential to provide additional groundwater recharge and reduce pollutant loading to surface water bodies, an in‐depth, regional assessment was conducted using spatial analysis and locally developed models, including the Structural Best management practices Prioritization and Analysis Tool (“SBPAT”), the Groundwater Augmentation Model (“GWAM”), and the WRD/USGS MODular three‐dimensional finite‐difference ground‐water FLOW model (“MODFLOW”). The assessment considered a suite of factors important to siting groundwater recharge projects (e.g. surface flows, soil conditions, depth to water, and subsurface geologic conditions, preexisting contamination, and permanent dewatering activities) as well as local water quality objectives. The study identified 17 high priority catchments within the District service area where expected water supply benefits were estimated at 4,300 AFY if appropriate infiltration facilities are installed and maintained. A single 100 acre catchment was selected, and concept designs for a catchment-wide pilot stormwater capture and recharge facilities were completed. Results from the analyses and pilot project are scalable to inform future decisions about widespread implementation of distributed and regional stormwater capture projects. Findings of the study were presented to
Projects and Programs
WRD Engineering Survey and Report, 2015 29
various audiences, including water purveyors, regulators, local environmental groups, and at regional and national stormwater conferences. The benefit cost analyses, which examined multiple factors including but not limited to water quality improvements, water supply benefits, and social benefits garnered wide interest from water quality agencies, water supply agencies, and policymakers. In 2012, the District partnered with the City of Los Angeles Bureau of Sanitation (the lead applicant) to pursue Proposition 84 funding (Safe Drinking Water, Water Quality and Supply, Flood Control, River and Coastal Protection Bond Act of 2006) to implement a portion of the concept design to increase stormwater infiltration and to assist the City of Los Angeles in its compliance with total maximum daily load (water quality-related) requirements. The proposed project area is located in the City of Los Angeles south of the 10 freeway and east of the 110 freeway. The combined watershed of all proposed stormwater infiltration projects is approximately 228 acres with mixed land uses. In 2013, the City was awarded $2,939,361 by the State Water Resources Control Board to construct and monitor the project. Known as the “Broadway Neighborhood Stormwater Greenway (Broadway) Project, this project is pending completion in 2015.
Much of the work for the coming year will involve additional investigations at well sites known to have contaminated water, continued tracking of water quality regulations and policies affecting production and replenishment operations, further characterization of contaminant migration into the deeper aquifers, and monitoring and expediting cleanup activities at contaminated sites. All work under this program is related to water quality and cleanup efforts and is funded from the Clean Water Fund. 010 – Geographic Information System (“GIS”) The District maintains an extensive in-house database and Geographic Information System (GIS). The database includes water level and water quality data for WRD’s service area with information drawn not only from the District’s Regional Groundwater Monitoring Program and permit compliance monitoring, but also from water quality data obtained from the DDW. The system requires continuous update and maintenance but serves as a powerful tool for understanding basin characteristics and overall basin health. The GIS is used to provide better planning and basin management. It is used to organize and store an extensive database of spatial information, including well locations, water level data, water quality information, well construction data, production data, aquifer locations, and computer model files. In the coming year, this information will be further integrated with readily available data from other state and federal agencies, as well as other District departments. Staff uses the system daily for project support and database management. Specific information is available upon request to any District pumper or stakeholder and can be delivered through the preparation of maps, tables, reports, or in other compatible formats. Additionally, the District has made its web-based Interactive Well Search tool available to selected users. This web site provides these users with limited access to WRD’s water quality and production database. District staff will continue to streamline and refine the existing data management system and website as well as satisfy both internal and external data requests. As part of the streamlining of the data, staff will work closely with other District departments to evaluate and implement updates to the District’s existing system to facilitate the seamless transfer of data and access to that data. Additionally, District staff will continue the development of applications to more efficiently manage and report groundwater
Projects and Programs
WRD Engineering Survey and Report, 2015 30
production information. Continued use, upkeep, and maintenance of the GIS are planned for the coming year. The use of the system supports both replenishment activities and groundwater quality efforts. Accordingly, the cost for this program is equally split between the Replenishment and Clean Water Funds. 011 – Regional Groundwater Monitoring Program WRD has been monitoring groundwater quality and water levels in the CBWCB for over 50 years. The Regional Groundwater Monitoring Program provides for the collection of basic information used for groundwater basin management including groundwater level data and water quality data. It currently consists of a network of over 300 WRD and USGS-installed monitoring wells at over 55 locations throughout the District, supplemented by the existing groundwater production wells operated by the water purveyors. The information generated by this program is stored in the District’s GIS and provides the basis to better understand the dynamic changes in the Central Basin and West Coast Basin. WRD hydrogeologists and engineers, provide the in-house capability to collect, analyze and report groundwater data. Water quality samples from the monitoring wells are collected twice a year and analyzed for numerous common constituents such as general minerals, volatile organic compounds, metals, and general physical properties, as well as “special study constituents” on a case by case basis such as perchlorate, n-nitrosodimethylamine (“NDMA”), hexavalent chromium, 1,4-dioxane, and CECs. Water levels are measured in most monitoring wells with automatic data loggers daily, while water levels in all monitoring wells are measured by WRD field staff a minimum of four times per year. On an annual basis, staff prepares the Regional Groundwater Monitoring Report that documents groundwater level and groundwater quality conditions throughout the District. This report is distributed to the stakeholders in WRD and is also available on the District’s website. In 2011, the National Groundwater Associated presented WRD with the “2011 Groundwater Protection Project Award” in recognition of the regional groundwater monitoring program. WRD is also the designated groundwater monitoring entity for the CBWCB under the State of California’s CASGEM program (California Statewide Groundwater Elevation Monitoring). WRD collects water level data from 28 of its nested monitoring wells and uploads it to the State’s CASGEM website on a regular basis for seasonal and long-term water level trend tracking. Public access to the CASGEM website is at www.water.ca.gov/groundwater/casgem. Most of the work during the ensuing year will involve the on-going collection of water levels and water quality samples from the WRDs monitoring wells, continuous well and equipment maintenance, and annual reporting activities. Work associated with the Regional Groundwater Monitoring Program also supports activities relating to both replenishment and water quality projects. The program is funded equally by the Replenishment and Clean Water Funds. 012 – Safe Drinking Water Program WRD’s Safe Drinking Water Program (“SDWP”) has operated since 1991 and is intended to promote the cleanup of groundwater resources at specific well locations. Through the installation of wellhead treatment facilities at existing production wells, the District removes contaminants from the underground supply and delivers the extracted water for potable purposes. Projects implemented through this program are accomplished in collaboration with well owners.
Projects and Programs
WRD Engineering Survey and Report, 2015 31
One component of the program focuses on the removal of VOCs and offers financial assistance for the design, equipment and installation at the selected treatment facility. Another component offers zero-interest loans for secondary constituents of concern that affect a specific production well. The capital costs of wellhead treatment facilities range from $800,000 to over $2,000,000. Due to financial constraints, the initial cost is generally prohibitive to most pumpers. Financial assistance through the District’s SDWP makes project implementation much more feasible. There are several projects in various stages of implementation and new candidates for participation are under evaluation. A total of 16 facilities have been completed and are online and one facility has successfully completed removal of the contamination and no longer needs to treat. While continued funding of this program is anticipated for next year, the District has revised the guidelines of the SDWP to place a greater priority on projects involving VOC contamination or other anthropogenic (man-made) constituents, now classified as Priority A Projects. Treatment projects for naturally-occurring constituents are classified as Priority B Projects and funded as a secondary priority, on a case-by-case basis and only if program monies are still available during the fiscal year. While such projects are of interest to WRD, availability of funding for them will not be determined until after the budget process is completed. The District recently revised the Safe Drinking Water Program to include a revolving fund plan for Priority B Projects and implementation of a revitalization plan to maximize program participation. The Safe Drinking Water Program now includes a third component, the Disadvantage Communities (DAC) Outreach Assistance Program, which will provide assistance to water systems in Disadvantaged areas with applying for State funding. Projects under the SDWP involve the treatment of contaminated groundwater for subsequent beneficial use. This water quality improvement assists in meeting the District’s groundwater cleanup objectives. 018 – Dominguez Gap Barrier Recycled Water Injection This Project involves the delivery of recycled water from the City of Los Angeles Department of Public Works - Bureau of Sanitation (BOS) Terminal Island Water Reclamation Plant/Advanced Water Treatment Facility (AWTF) to the Dominguez Gap Barrier (DGB). Delivery of recycled water to the barrier, which commenced in late February 2006, was temporarily interrupted for about a year starting November 2011 when the AWTF shut down for plant upgrade and maintenance. Recycled water delivery to the DGB resumed in December 2012. Prior to injection at the barrier, the recycled water produced at the AWTF undergoes advanced treatment processes including microfiltration, reverse osmosis, and chlorination. The DGB injection project was permitted by LARWQCB in conjunction with DDW for up to 5 mgd of recycled water and 50% recycled water contribution (meaning recycled water may not exceed 50% of the total injected volume with the remainder consisting of potable water). Water quality requirements, including turbidity and modified fouling index (MFI), must also be satisfied to minimize potential fouling of DGB injection wells owned and operated by the County of Los Angeles Department of Public Works. WRD is working with BOS to expand the amount of recycled water produced for the DGB, with the ultimate goal of eliminating all potable water used for barrier injection. While BOS is responsible for the treatment and the water quality monitoring of the recycled water and LADWP for the delivery of the recycled water to the DGB, WRD has responsibility for groundwater monitoring and compliance. As part of the DGB injection permit requirements, WRD conducts
Projects and Programs
WRD Engineering Survey and Report, 2015 32
groundwater monitoring to measure and track water quality conditions, evaluate potential impact of recycled water on groundwater, and identify potential problems well before recycled water arrives at any downgradient drinking water wells. In addition, an extensive tracer study was conducted from the start of recycled water injection in February 2006 through fall 2010 to determine the extent of travel and movement of the recycled water blend through the aquifers. The tracer study confirmed that after injection, adequate mixing and further blending of recycled water with diluent water occurs in the ground and that groundwater samples collected were representative of the recycled water blend. Recycled water use at the seawater intrusion barriers in Los Angeles County improves the reliability of a supply in continuous demand. Traditionally, water purchases for the barriers have been viewed as a replenishment function. Therefore, this program is funded 100% through the Replenishment Fund. 023 – Replenishment Operations WRD actively monitors the operation and maintenance practices at the LACDPW-owned and operated spreading grounds and seawater barriers within the District. Optimizing replenishment opportunities is fundamentally important to WRD, in part because imported and recycled water deliveries directly affect the District’s annual budget. Consequently, the District seeks to ensure that the conservation of stormwater is maximized, and that imported and recycled water replenishment is optimized. Due to the reduction and unreliability of imported water for replenishment, WRD is working on its Water Independence Now (“WIN”) program to eventually become independent from imported water for groundwater recharge. Currently, the District needs about 21,900 AF of imported water for recharge; 16,000 AF for spreading and 5,900 AF for injection at the seawater barriers. By maximizing the use of recycled water and stormwater, the amount of imported water needed can eventually be reduced or eliminated, thereby providing the groundwater basins with full replenishment needs through locally-derived water. WRD coordinates regular meetings with LACDPW, MWD, SDLAC, and other water interests to discuss replenishment water availability, spreading grounds operations, barrier operations, scheduling of replenishment deliveries, seawater barrier improvements, upcoming maintenance activities, and facility outages or shutdowns. The District tracks groundwater levels in the Montebello Forebay weekly to assess general basin conditions and determine the level of artificial replenishment needed. WRD also monitors the amount of recycled water used at the spreading grounds and seawater barriers to maximize use while complying with pertinent regulatory limits. While improvements undertaken in recent years by LACDPW/WRD (e.g., expansion of Whittier Narrows Conservation Pool, installation of rubber dams on San Gabriel River, Interconnection Pipeline) have considerably increased the stormwater portion of WRD’s supply portfolio, the potential for further increasing the use of stormwater for groundwater augmentation remains significant. Working with the Army Corps of Engineers and LACDPW on additional improvements to the Whittier Narrows Conservation Pool will allow capture of more stormwater, as will development of Montebello Forebay projects to lower the water table through increased pumping and delivery downgradient to free up underground space to capture more storm water and/or recycled water. WRD has submitted a request to the Army Corps of Engineers for a temporary deviation for the Whittier Narrows Conservation Pool to increase the operational water surface elevation (WSE) from 201.6 feet to 205 feet for three years beginning WY 2015-16. During this period, WRD will pursue a permanent Army Corps of Engineers operational change from WSE 201.6 feet to WSE 205 feet.
Projects and Programs
WRD Engineering Survey and Report, 2015 33
The District plans to continue working with the LACDPW on several design projects for the Rio Hondo and San Gabriel Coastal Spreading Grounds with the goal of increasing the volume of recycled water conserved. The District is continually looking for opportunities to work with the LACDPW on improvement projects at the recharge facilities. Several potential projects have been identified and are being further evaluated to determine if they should be pursued. Two such projects are planned for completion this fiscal year. These projects consist of the construction of turnout structures along the San Gabriel River which will allow the delivery of increased recycled water to 1) the San Gabriel Coastal Spreading Grounds – Basin #2 & Interconnection Pipeline and 2) the portion of the unlined San Gabriel River south of Rubber Dam #4. Together these two turnout structures will help increase the spreading of recycled water at the San Gabriel Coastal and Rio Hondo Coastal Spreading Grounds and minimize the loss of recycled water to the ocean. As its name implies, the Replenishment Operations Program deals primarily with replenishment issues and therefore its costs are borne by the Replenishment Fund. 025 – Hydrogeology Program This program accounts for the projects and programs related to hydrogeologic investigations of the District and surrounding areas to ensure safe and reliable groundwater. Work performed under this program includes the preparation of the annual Engineering Survey and Report, which incorporates the calculation and determination of annual overdraft, accumulated overdraft, changes in storage, pumping amounts, and replenishment water availability into a document to help the District assess its replenishment needs and costs in the ensuing year. Extensive amounts of data are compiled and analyzed by staff to determine these values. Maps are created showing water levels in the basins and production patterns and amounts. Much of this information is published in Technical Bulletins – easy to read two-page documents that summarize groundwater issues of importance in the District. An ongoing effort at the District to better characterize the hydrogeologic conditions across the Central and West Coast Basins is called the "Hydrogeologic Conceptual Model". This long-term project involves compiling and interpreting the extensive amounts of data generated during drilling and logging of the WRD/USGS monitoring wells and collected from historical information for production wells and oil wells within the District. In 2013, WRD obtained extensive seismic reflection data which is being analyzed to help fill in gaps in the geologic structure. The ultimate goal of this project is to incorporate the data in WRD's database/GIS and apply the system to generate aquifer surfaces and cross-sections for comparison with historical interpretations of basin hydrogeology. The final conceptual model will significantly improve the understanding of the aquifer depths, extents and thicknesses throughout the District and will assist staff, pumpers and stakeholders with planning for groundwater resource projects such as new well drilling, storage opportunities or modeling. The data will also be made available on WRD's website to be used as a reference source for hydrogeologic interpretations and to fill project-related data requests. The conceptual model updates are being incorporated into the USGS numerical model updates. The updates to the numerical model are being performed based on the new information gleaned from the additional aquifer-specific WRD monitoring wells installed since 2000 and the extensive groundwater monitoring that the District has performed since then to identify trends in groundwater levels. The upgrades will also include refining the model’s resolution to 1/8-mile square cells versus the previous model’s 1/2 - mile cells, and creating more than 10 vertical layers to simulate groundwater flow in the various aquifers versus the previous model’s 4 layers. The model has also been converted to the newest version of Modflow known as Unstructured Grids (USG), which allows better simulation of groundwater flow in the complex geology of the Central and West Coast Basins. New seismic
Projects and Programs
WRD Engineering Survey and Report, 2015 34
reflection data purchased by WRD in 2013 will also be incorporated into the model. Time frames for model calculation will improve from annual measurements to quarterly. All of these upgrades will lead to a much improved groundwater modeling simulator for the District’s future management efforts. This model is a significant analytical tool utilized by WRD to determine basin benefits and impacts of changes proposed in the management of the Central Basin and West Coast Basin. It is anticipated that this model will be completed in 2015 or early 2016. Hydrogeologic analysis is also needed for projects associated with groundwater quality concerns and specific cleanup projects. Staff work may include investigative surveys, data research, and oversight of specific project studies. Such efforts are used to relate water quality concerns with potential impact to basin resources. An example of this type of staff work is the District’s Well Profiling Program. The District assists pumpers in evaluating drinking water supply well contamination. Services may include existing data collection and review and field tasks such as spinner logging and depth-discrete sampling. WRD’s evaluation helps pumpers to determine the best course of action; e.g., sealing off a particular screened interval of a well, wellhead treatment, or well destruction. Salt / Nutrient Management Plans are a new State requirement for all groundwater basins throughout California. The Plans are required as part of the Recycled Water Policy issued by the State Water Resources Control Board (“SWRCB”) and effective as of May 14, 2009. As stated in the Policy, its purpose is to “establish uniform requirements for recycled water use and to develop sustainable water supplies throughout the state”. The SWRCB therefore “supports and encourages every region…to develop a Salt / Nutrient Management Plan by 2014”. WRD along with other stakeholders completed the SNMP in 2014 and the Regional Water Quality Control Board adopted a Basin Plan Amendment to incorporate the SNMP in February 2015. Follow up work will be to monitor the salt and nutrient concentrations in the District over time, and compare results to the model predictions in the SNMP. Modeling of groundwater flow and movement of injected recycled water at the Alamitos and Dominguez Gap seawater barriers are also included in this program. These efforts are required under permits for the recycled water injection and will continue in the ensuing year. In 2013, WRD received a grant from MWD through WBMWD to perform groundwater tracer tests using noble gasses at the three seawater barrier systems. Use of noble gasses instead of other compounds, if found effective, will provide a cost-effective means to reliably follow the movement of injected water through the aquifers. This project was initiated in 2014, and monitoring will continue in 2015 and 2016, with a final report issued in 2016. The Hydrogeology Program addresses both groundwater replenishment objectives and groundwater quality matters. The cost of the program is evenly split between the Replenishment and Clean Water Funds. 033 – Groundwater Reliability Improvement Program (“GRIP”) The WRD continues to pursue projects through its Water Independence Now (“WIN”) program to develop local and sustainable sources of water for use in groundwater replenishment activities. This has become increasingly important in light of persistent drought conditions in the state and environmental and regulatory issues that limit delivery of imported water to the Los Angeles area. To address these issues, WRD is seeking alternative sources of water to offset the imported water used for replenishment in the Montebello Forebay. This program is referred to as the Groundwater Reliability Improvement Program (“GRIP”). The goal of GRIP is to offset the current use of imported
Projects and Programs
WRD Engineering Survey and Report, 2015 35
water by providing up to 21,000 AFY of recharge using reliable alternative supply sources (e.g., recycled water, storm water) for replenishment via the Montebello Forebay. The primary goals of GRIP are to: Provide a sustainable and reliable supply for replenishing the Basins; Protect groundwater quality; Minimize the environmental/energy footprint of any option or options selected; Comply with pertinent regulatory requirements employing an institutionally feasible approach; Minimize cost to agencies using ground water; and Engage stakeholders in the decision making process. The GRIP Advanced Water Treatment Facility (AWTF) will provide 10,000 AFY of highly treated recycled water to the Montebello Forebay for groundwater recharge to better identify the design/operation parameters of GRIP. The additional 11,000 AFY of 21,000 AFY to be provided as part of the GRIP will come from tertiary treated recycled water from the SDLAC’s San Jose Creek Water Reclamation Plant. The District has recently purchased a 5.2 acre parcel in the City of Pico Rivera which will be the future site for the GRIP AWTF. As a result of this recent development, the previously completed Draft Environmental Impact Report (“DEIR”) for GRIP and is being amended and will be made available for public review in early spring of 2015. Once public comments are incorporated in the document, the EIR will be presented to the WRD Board of Directors for adoption in the summer of 2015. Thereafter, full scale design and regulatory permitting efforts will commence to be followed by construction. Additional information related to GRIP may be found at www.wrd.org/grip. GRIP efforts are part of WRD’s capital improvement program and are funded primarily through bond proceeds. 035 – West Coast Seawater Barrier Monitoring Well Sampling Project In a cooperative agreement with West Basin Municipal Water District (“WBMWD”), WRD has been contracted to sample eight West Coast Barrier monitoring wells to help satisfy WBMWD’s permit compliance criteria for recycled water injection into the West Coast Barrier. WRD’s hydrogeologists sample the eight wells quarterly and submit the samples to WBMWD’s laboratory for analysis. Sampling of the monitoring wells is required by WBMWD’s Regional Water Quality Control Board permit, which enforces the monitoring and testing of the recycled water that is injected into the West Coast Basin Barrier to prevent seawater intrusion. WBMWD fully reimburses WRD for its sample collection activities and therefore there are no impacts on the WRD replenishment assessment. 038 – Engineering Program The Engineering Department provides technical, engineering, program management, and hands on support on capital improvement projects ranging from concept development through engineering design, project management and construction inspections. The engineering department is also responsible for developing, updating, and managing the capital improvement program (CIP) and its related projects. The engineering department prepares and/or oversees the preparation plans, specifications and engineer’s estimates of probable construction costs (PS&E’s), or creates request for proposals/qualifications (RFPs/RFQs) for professional engineering consultation and construction management services depending on the size and specific needs of the project.
Projects and Programs
WRD Engineering Survey and Report, 2015 36
This engineering department receives and reviews public bids and provides recommendations to various committees and the Board of Directors to award contracts. The engineering department also applies, secures, and administers/manages grants from various, Federal, State, and Local organizations to supplement funds allocated by WRD. The engineering department also provides (oversees) project planning and environmental review/entitlement services for its CIP projects. The engineering department monitors construction work in progress, reviews/approves progress pay estimates, and provides quality assurance/control oversight services on approved development projects to ensure compliance with Board goals and objectives. The Engineering Program is intended to provide a mechanism for engineering staff to plan and further develop alternatives for potential capital improvement projects. Not all CIP project concepts develop into multi-year capital improvement program projects, and more often than not require many months of advanced planning and concept development before being capitalized. The Engineering Program deals primarily with replenishment issues and therefore its costs are borne by the Replenishment Fund until such time as alternative capital improvement program funding is identified.

TABLES

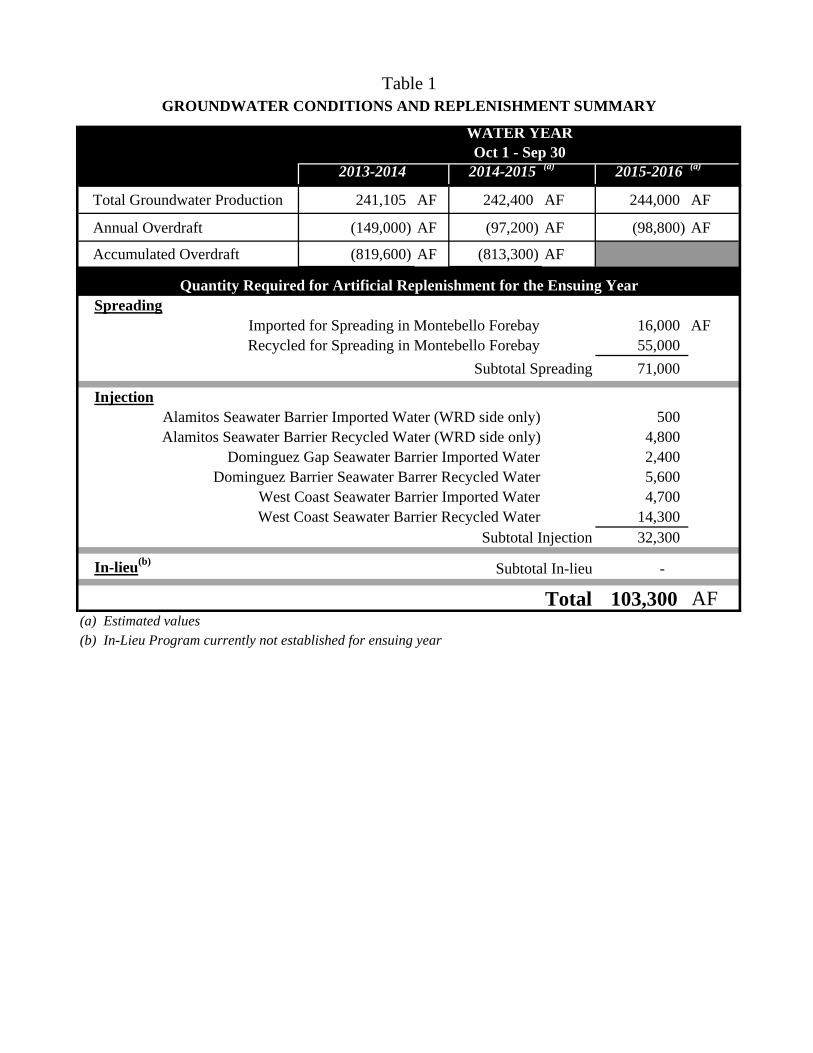
Table 1GROUNDWATER CONDITIONS AND REPLENISHMENT SUMMARY
WATER YEAROct 1 - Sep 30
2013-2014 2014-2015 (a) 2015-2016 (a)
Total Groundwater Production 241,105 AF 242,400 AF 244,000 AF
Annual Overdraft (149,000) AF (97,200) AF (98,800) AF
Accumulated Overdraft (819,600) AF (813,300) AF
Quantity Required for Artificial Replenishment for the Ensuing YearSpreading
Imported for Spreading in Montebello Forebay 16,000 AFRecycled for Spreading in Montebello Forebay 55,000
Subtotal Spreading 71,000
InjectionAlamitos Seawater Barrier Imported Water (WRD side only) 500 Alamitos Seawater Barrier Recycled Water (WRD side only) 4,800
Dominguez Gap Seawater Barrier Imported Water 2,400 Dominguez Barrier Seawater Barrer Recycled Water 5,600
West Coast Seawater Barrier Imported Water 4,700West Coast Seawater Barrier Recycled Water 14,300
Subtotal Injection 32,300
In-lieu(b) Subtotal In-lieu -
Total 103,300 AF(a) Estimated values(b) In-Lieu Program currently not established for ensuing year
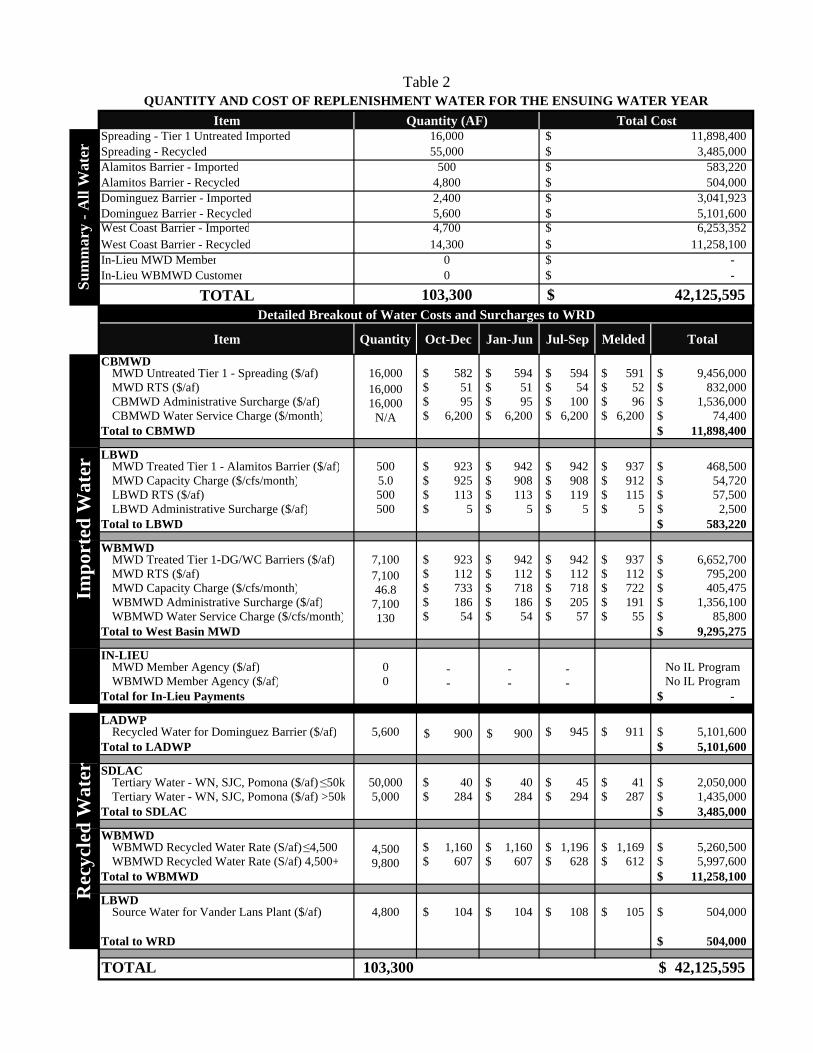
Table 2QUANTITY AND COST OF REPLENISHMENT WATER FOR THE ENSUING WATER YEAR
Item Quantity (AF) Total CostSpreading - Tier 1 Untreated ImportedSpreading - RecycledAlamitos Barrier - ImportedAlamitos Barrier - RecycledDominguez Barrier - ImportedDominguez Barrier - RecycledWest Coast Barrier - ImportedWest Coast Barrier - RecycledIn-Lieu MWD MemberIn-Lieu WBMWD Customer
TOTALDetailed Breakout of Water Costs and Surcharges to WRD
Item Quantity Oct-Dec Jan-Jun Jul-Sep Melded TotalCBMWD
MWD Untreated Tier 1 - Spreading ($/af) 16,000 582$ 594$ 594$ 591$ 9,456,000$ MWD RTS ($/af) 16,000 51$ 51$ 54$ 52$ 832,000$ CBMWD Administrative Surcharge ($/af) 16,000 95$ 95$ 100$ 96$ 1,536,000$ CBMWD Water Service Charge ($/month) N/A 6,200$ 6,200$ 6,200$ 6,200$ 74,400$
Total to CBMWD 11,898,400$
LBWDMWD Treated Tier 1 - Alamitos Barrier ($/af) 500 923$ 942$ 942$ 937$ 468,500$ MWD Capacity Charge ($/cfs/month) 5.0 925$ 908$ 908$ 912$ 54,720$ LBWD RTS ($/af) 500 113$ 113$ 119$ 115$ 57,500$ LBWD Administrative Surcharge ($/af) 500 5$ 5$ 5$ 5$ 2,500$
Total to LBWD 583,220$
WBMWDMWD Treated Tier 1-DG/WC Barriers ($/af) 7,100 923$ 942$ 942$ 937$ 6,652,700$ MWD RTS ($/af) 7,100 112$ 112$ 112$ 112$ 795,200$ MWD Capacity Charge ($/cfs/month) 46.8 733$ 718$ 718$ 722$ 405,475$ WBMWD Administrative Surcharge ($/af) 7,100 186$ 186$ 205$ 191$ 1,356,100$ WBMWD Water Service Charge ($/cfs/month) 130 54$ 54$ 57$ 55$ 85,800$
Total to West Basin MWD 9,295,275$
IN-LIEUMWD Member Agency ($/af) 0 - - - No IL ProgramWBMWD Member Agency ($/af) 0 - - - No IL Program
Total for In-Lieu Payments -$
LADWPRecycled Water for Dominguez Barrier ($/af) 5,600 900$ 900$ 945$ 911$ 5,101,600$
Total to LADWP 5,101,600$
SDLACTertiary Water - WN, SJC, Pomona ($/af) ≤50k 50,000 40$ 40$ 45$ 41$ 2,050,000$ Tertiary Water - WN, SJC, Pomona ($/af) >50k 5,000 284$ 284$ 294$ 287$ 1,435,000$
Total to SDLAC 3,485,000$
WBMWDWBMWD Recycled Water Rate (S/af) ≤4,500 4,500 1,160$ 1,160$ 1,196$ 1,169$ 5,260,500$ WBMWD Recycled Water Rate (S/af) 4,500+ 9,800 607$ 607$ 628$ 612$ 5,997,600$
Total to WBMWD 11,258,100$
LBWDSource Water for Vander Lans Plant ($/af) 4,800 104$ 104$ 108$ 105$ 504,000$
Total to WRD 504,000$
TOTAL 103,300 42,125,595$
42,125,595$
00
103,300
3,485,000$ 583,220$ 504,000$
3,041,923$ 5,101,600$ 6,253,352$
Rec
ycle
d W
ater
4,70014,300
Impo
rted
Wat
erSu
mm
ary
- All
Wat
er
16,000 11,898,400$
-$ -$
55,000500
4,8002,400
11,258,100$
5,600
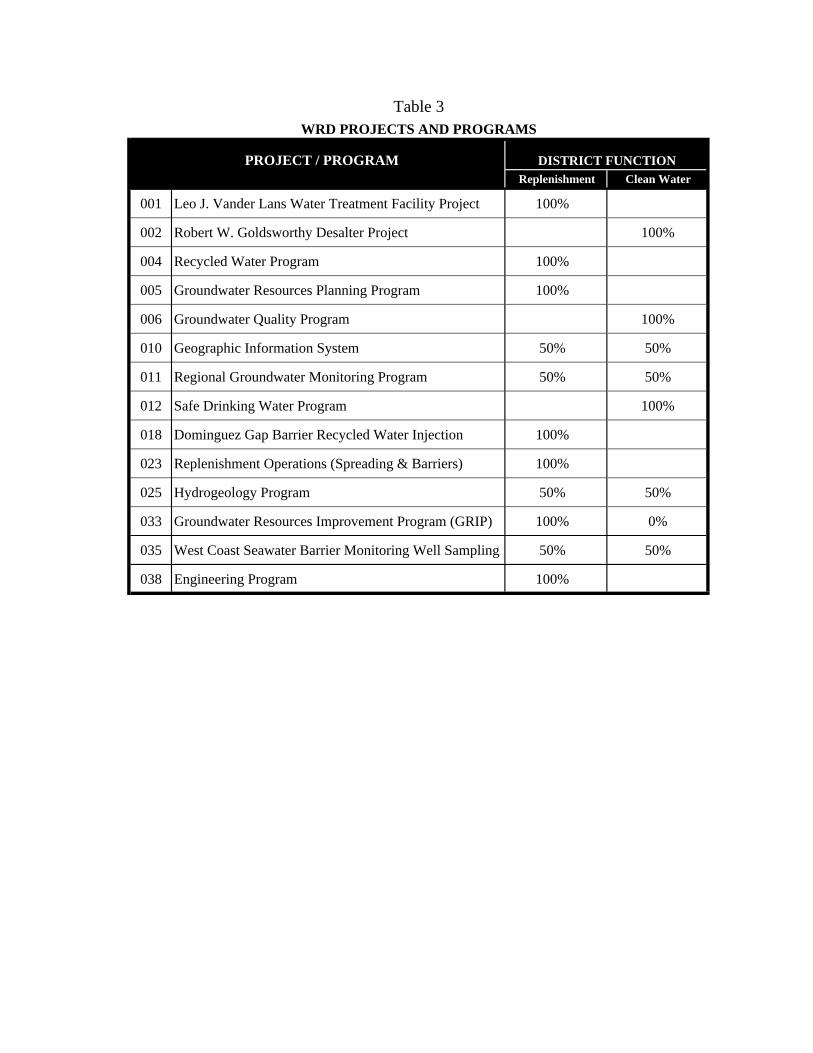
Table 3WRD PROJECTS AND PROGRAMS
PROJECT / PROGRAM DISTRICT FUNCTIONReplenishment Clean Water
001 Leo J. Vander Lans Water Treatment Facility Project 100%
002 Robert W. Goldsworthy Desalter Project 100%
004 Recycled Water Program 100%
005 Groundwater Resources Planning Program 100%
006 Groundwater Quality Program 100%
010 Geographic Information System 50% 50%
011 Regional Groundwater Monitoring Program 50% 50%
012 Safe Drinking Water Program 100%
018 Dominguez Gap Barrier Recycled Water Injection 100%
023 Replenishment Operations (Spreading & Barriers) 100%
025 Hydrogeology Program 50% 50%
033 Groundwater Resources Improvement Program (GRIP) 100% 0%
035 West Coast Seawater Barrier Monitoring Well Sampling 50% 50%
038 Engineering Program 100%
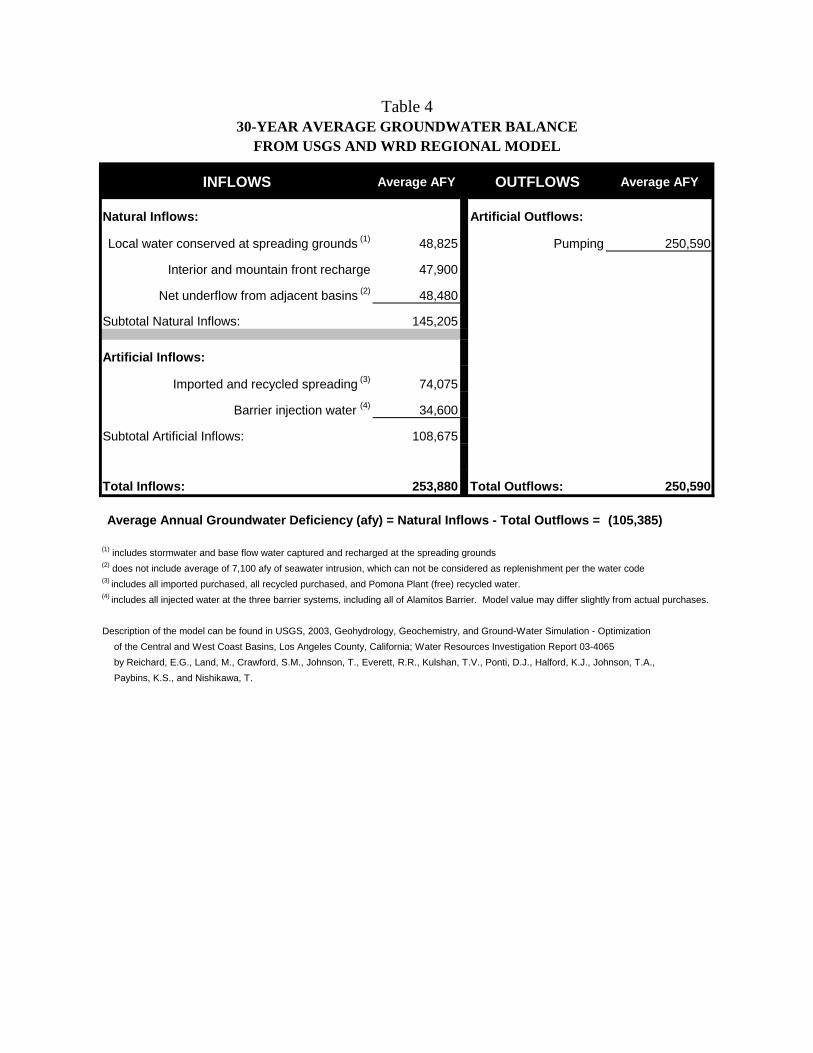
Table 430-YEAR AVERAGE GROUNDWATER BALANCE
FROM USGS AND WRD REGIONAL MODEL
INFLOWS Average AFY OUTFLOWS Average AFY
Natural Inflows: Artificial Outflows:
Local water conserved at spreading grounds (1)
48,825 Pumping 250,590
Interior and mountain front recharge 47,900
Net underflow from adjacent basins (2)
48,480
Subtotal Natural Inflows: 145,205
Artificial Inflows:
Imported and recycled spreading (3)
74,075
Barrier injection water (4)
34,600
Subtotal Artificial Inflows: 108,675
Total Inflows: 253,880 Total Outflows: 250,590
Average Annual Groundwater Deficiency (afy) = Natural Inflows - Total Outflows = (105,385)
(1) includes stormwater and base flow water captured and recharged at the spreading grounds
(2) does not include average of 7,100 afy of seawater intrusion, which can not be considered as replenishment per the water code
(3) includes all imported purchased, all recycled purchased, and Pomona Plant (free) recycled water.
(4) includes all injected water at the three barrier systems, including all of Alamitos Barrier. Model value may differ slightly from actual purchases.
Description of the model can be found in USGS, 2003, Geohydrology, Geochemistry, and Ground-Water Simulation - Optimization
of the Central and West Coast Basins, Los Angeles County, California; Water Resources Investigation Report 03-4065
by Reichard, E.G., Land, M., Crawford, S.M., Johnson, T., Everett, R.R., Kulshan, T.V., Ponti, D.J., Halford, K.J., Johnson, T.A.,
Paybins, K.S., and Nishikawa, T.
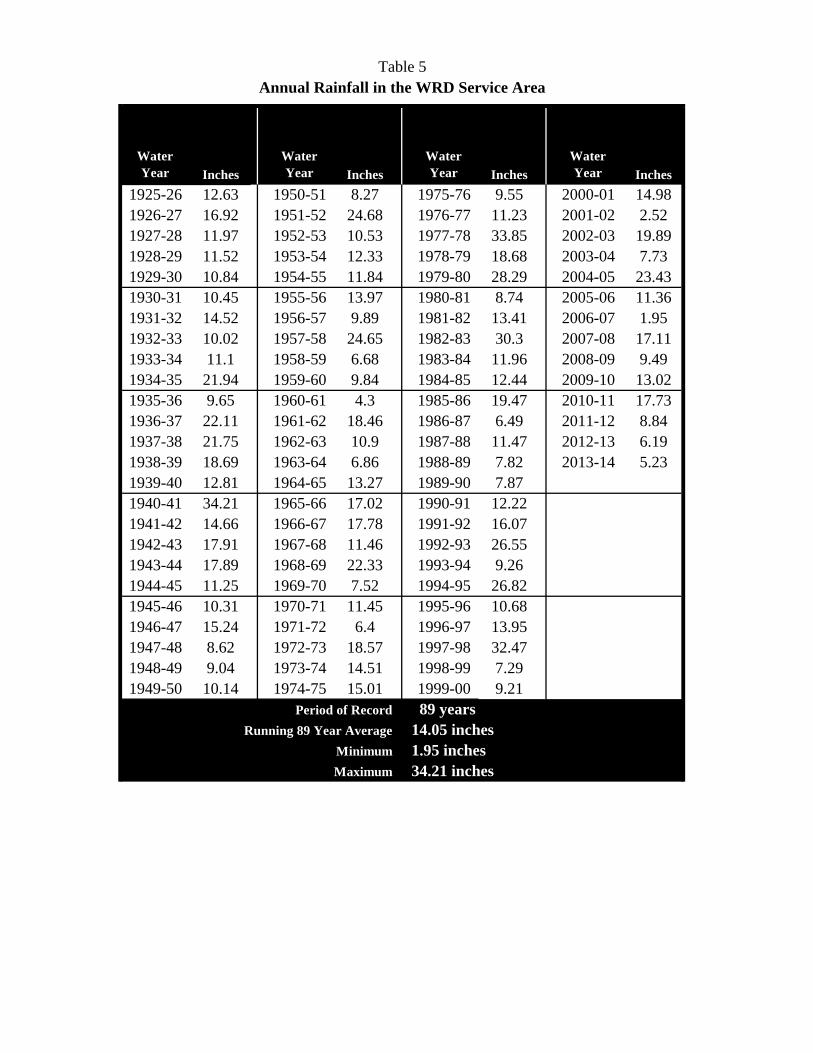
Table 5Annual Rainfall in the WRD Service Area
WaterYear Inches
WaterYear Inches
WaterYear Inches
WaterYear Inches
1925-26 12.63 1950-51 8.27 1975-76 9.55 2000-01 14.981926-27 16.92 1951-52 24.68 1976-77 11.23 2001-02 2.521927-28 11.97 1952-53 10.53 1977-78 33.85 2002-03 19.891928-29 11.52 1953-54 12.33 1978-79 18.68 2003-04 7.731929-30 10.84 1954-55 11.84 1979-80 28.29 2004-05 23.431930-31 10.45 1955-56 13.97 1980-81 8.74 2005-06 11.361931-32 14.52 1956-57 9.89 1981-82 13.41 2006-07 1.951932-33 10.02 1957-58 24.65 1982-83 30.3 2007-08 17.111933-34 11.1 1958-59 6.68 1983-84 11.96 2008-09 9.491934-35 21.94 1959-60 9.84 1984-85 12.44 2009-10 13.021935-36 9.65 1960-61 4.3 1985-86 19.47 2010-11 17.731936-37 22.11 1961-62 18.46 1986-87 6.49 2011-12 8.841937-38 21.75 1962-63 10.9 1987-88 11.47 2012-13 6.191938-39 18.69 1963-64 6.86 1988-89 7.82 2013-14 5.231939-40 12.81 1964-65 13.27 1989-90 7.871940-41 34.21 1965-66 17.02 1990-91 12.221941-42 14.66 1966-67 17.78 1991-92 16.071942-43 17.91 1967-68 11.46 1992-93 26.551943-44 17.89 1968-69 22.33 1993-94 9.261944-45 11.25 1969-70 7.52 1994-95 26.821945-46 10.31 1970-71 11.45 1995-96 10.681946-47 15.24 1971-72 6.4 1996-97 13.951947-48 8.62 1972-73 18.57 1997-98 32.471948-49 9.04 1973-74 14.51 1998-99 7.291949-50 10.14 1974-75 15.01 1999-00 9.21
Period of RecordRunning 89 Year Average 14.05 inches
Minimum 1.95 inchesMaximum 34.21 inches
89 years
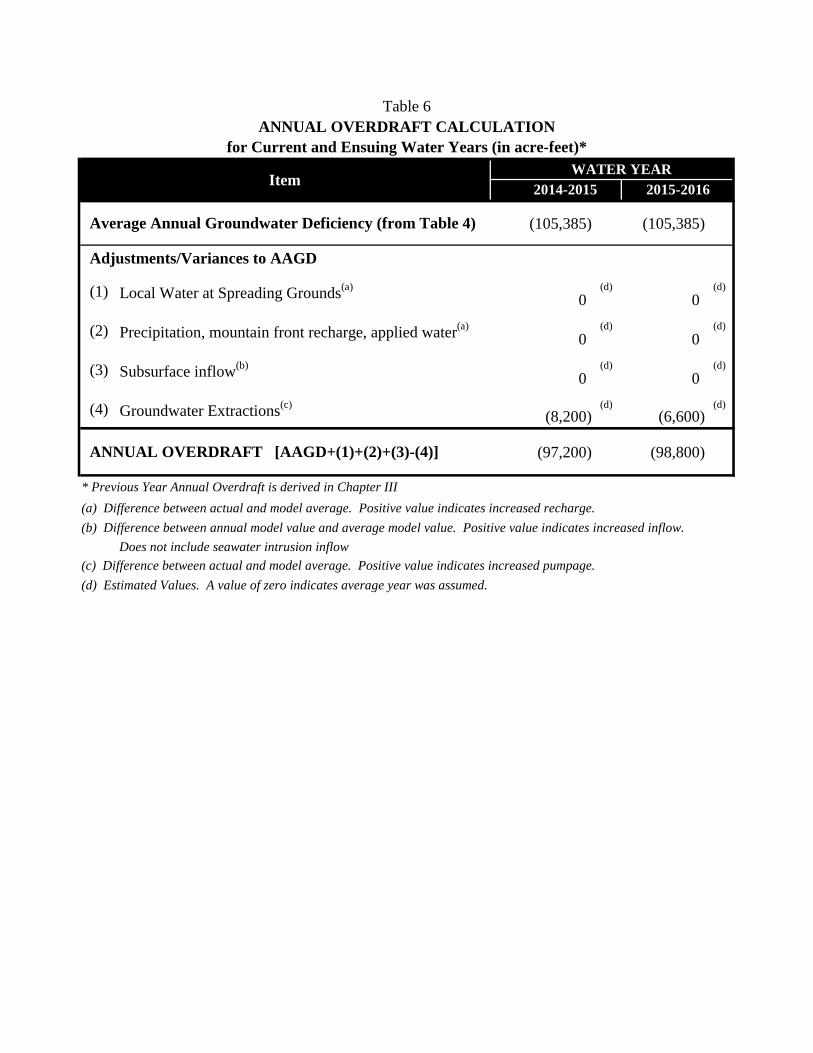
Table 6ANNUAL OVERDRAFT CALCULATION
for Current and Ensuing Water Years (in acre-feet)*WATER YEAR
2014-2015 2015-2016
(105,385) (105,385)
(1) Local Water at Spreading Grounds(a)0
(d)0
(d)
(2) Precipitation, mountain front recharge, applied water(a)0
(d)0
(d)
(3) Subsurface inflow(b)0
(d)0
(d)
(4) Groundwater Extractions(c)(8,200)
(d)(6,600)
(d)
(97,200) (98,800)
Does not include seawater intrusion inflow
Item
ANNUAL OVERDRAFT [AAGD+(1)+(2)+(3)-(4)]
* Previous Year Annual Overdraft is derived in Chapter III
(a) Difference between actual and model average. Positive value indicates increased recharge.
(d) Estimated Values. A value of zero indicates average year was assumed.
(c) Difference between actual and model average. Positive value indicates increased pumpage.
Adjustments/Variances to AAGD
Average Annual Groundwater Deficiency (from Table 4)
(b) Difference between annual model value and average model value. Positive value indicates increased inflow.
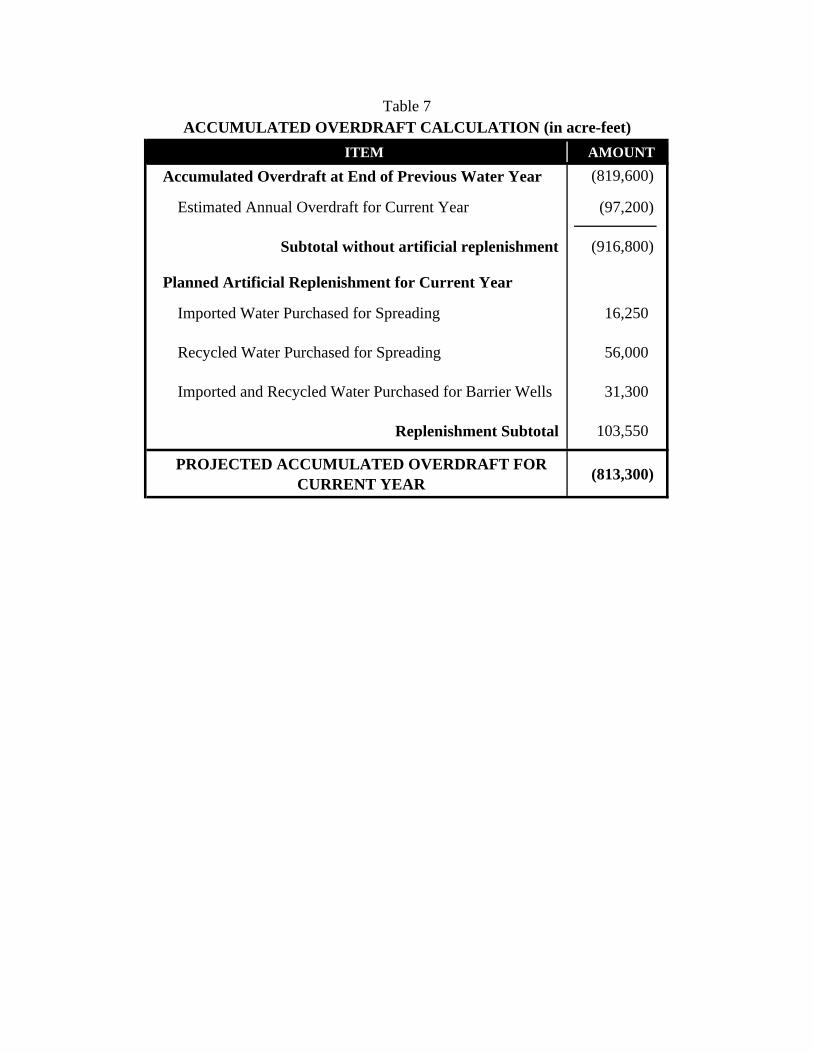
Table 7ACCUMULATED OVERDRAFT CALCULATION (in acre-feet)
ITEM AMOUNT
Accumulated Overdraft at End of Previous Water Year (819,600)
Estimated Annual Overdraft for Current Year (97,200)
Subtotal without artificial replenishment (916,800)
Planned Artificial Replenishment for Current Year
Imported Water Purchased for Spreading 16,250
Recycled Water Purchased for Spreading 56,000
Imported and Recycled Water Purchased for Barrier Wells 31,300
Replenishment Subtotal 103,550
PROJECTED ACCUMULATED OVERDRAFT FOR CURRENT YEAR (813,300)
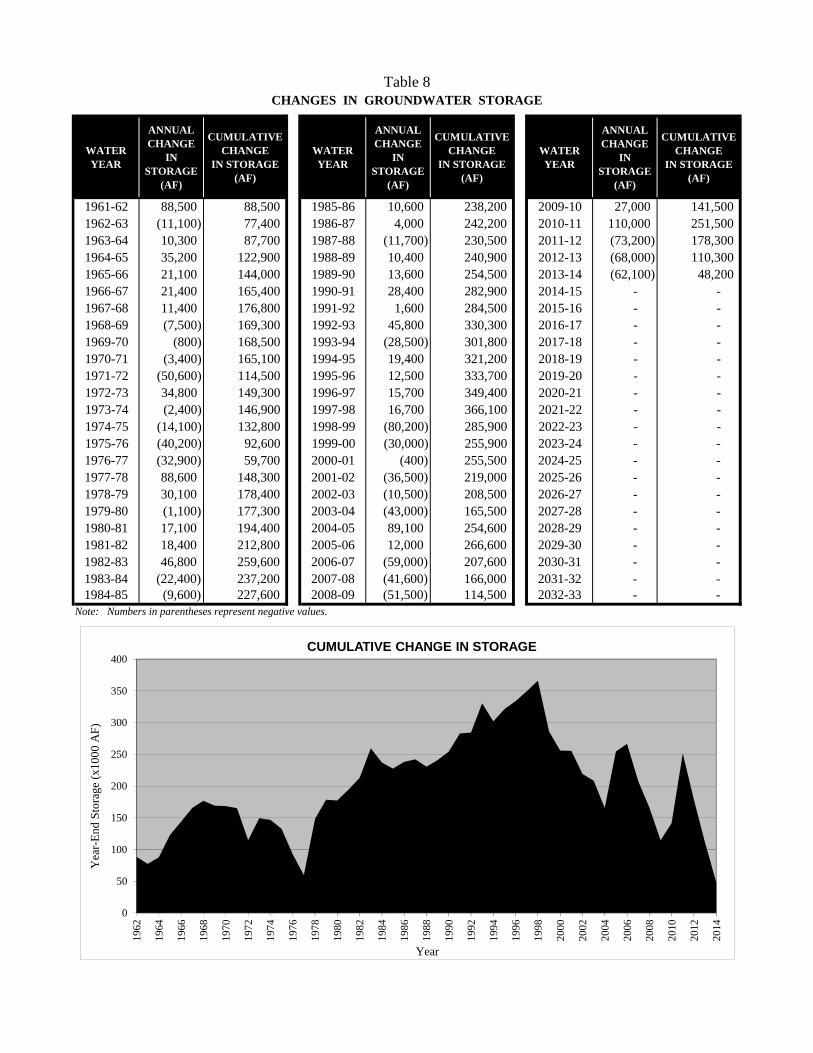
Table 8CHANGES IN GROUNDWATER STORAGE
WATERYEAR
ANNUAL CHANGE
IN STORAGE
(AF)
CUMULATIVECHANGE
IN STORAGE(AF)
WATERYEAR
ANNUAL CHANGE
IN STORAGE
(AF)
CUMULATIVECHANGE
IN STORAGE(AF)
WATERYEAR
ANNUAL CHANGE
IN STORAGE
(AF)
CUMULATIVECHANGE
IN STORAGE(AF)
1961-62 88,500 88,500 1985-86 10,600 238,200 2009-10 27,000 141,500 1962-63 (11,100) 77,400 1986-87 4,000 242,200 2010-11 110,000 251,500 1963-64 10,300 87,700 1987-88 (11,700) 230,500 2011-12 (73,200) 178,300 1964-65 35,200 122,900 1988-89 10,400 240,900 2012-13 (68,000) 110,300 1965-66 21,100 144,000 1989-90 13,600 254,500 2013-14 (62,100) 48,200 1966-67 21,400 165,400 1990-91 28,400 282,900 2014-15 - - 1967-68 11,400 176,800 1991-92 1,600 284,500 2015-16 - - 1968-69 (7,500) 169,300 1992-93 45,800 330,300 2016-17 - - 1969-70 (800) 168,500 1993-94 (28,500) 301,800 2017-18 - - 1970-71 (3,400) 165,100 1994-95 19,400 321,200 2018-19 - - 1971-72 (50,600) 114,500 1995-96 12,500 333,700 2019-20 - - 1972-73 34,800 149,300 1996-97 15,700 349,400 2020-21 - - 1973-74 (2,400) 146,900 1997-98 16,700 366,100 2021-22 - - 1974-75 (14,100) 132,800 1998-99 (80,200) 285,900 2022-23 - - 1975-76 (40,200) 92,600 1999-00 (30,000) 255,900 2023-24 - - 1976-77 (32,900) 59,700 2000-01 (400) 255,500 2024-25 - - 1977-78 88,600 148,300 2001-02 (36,500) 219,000 2025-26 - - 1978-79 30,100 178,400 2002-03 (10,500) 208,500 2026-27 - - 1979-80 (1,100) 177,300 2003-04 (43,000) 165,500 2027-28 - - 1980-81 17,100 194,400 2004-05 89,100 254,600 2028-29 - - 1981-82 18,400 212,800 2005-06 12,000 266,600 2029-30 - - 1982-83 46,800 259,600 2006-07 (59,000) 207,600 2030-31 - - 1983-84 (22,400) 237,200 2007-08 (41,600) 166,000 2031-32 - - 1984-85 (9,600) 227,600 2008-09 (51,500) 114,500 2032-33 - -
Note: Numbers in parentheses represent negative values.
0
50
100
150
200
250
300
350
400
1962
1964
1966
1968
1970
1972
1974
1976
1978
1980
1982
1984
1986
1988
1990
1992
1994
1996
1998
2000
2002
2004
2006
2008
2010
2012
2014
Yea
r-En
d St
orag
e (x
1000
AF)
Year
CUMULATIVE CHANGE IN STORAGE
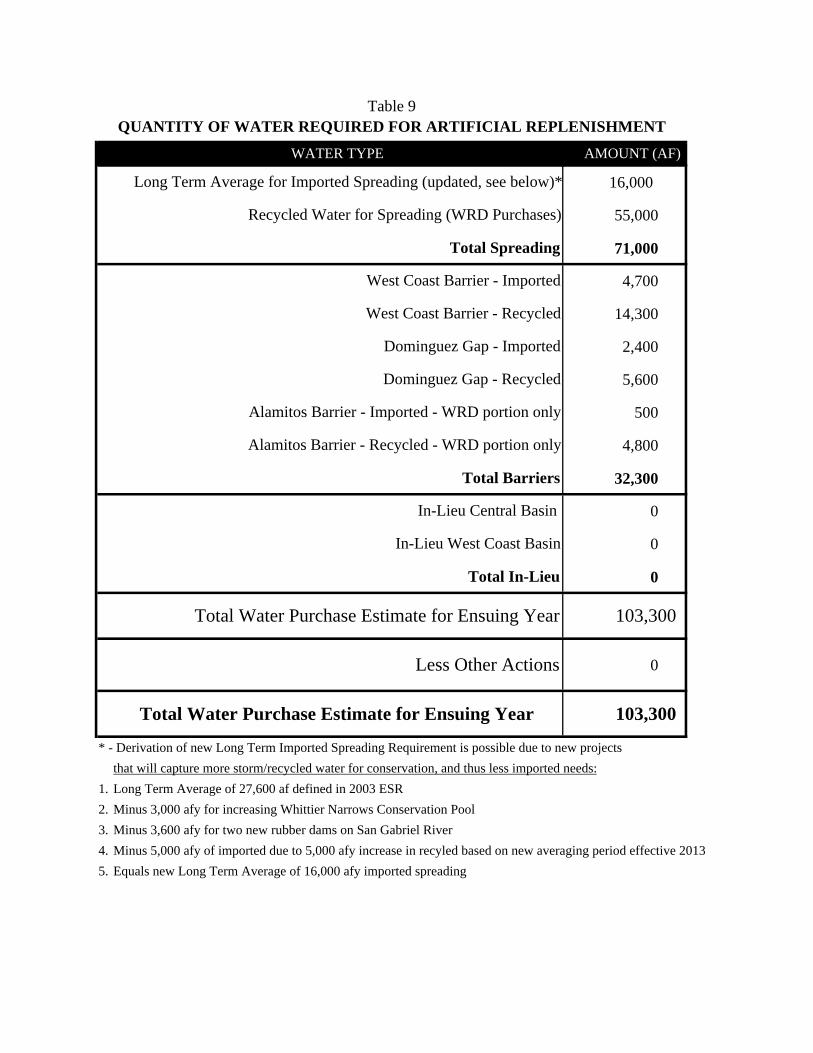
16,000
55,000
71,000
4,700
14,300
2,400
5,600
500
4,800
32,300
0
0
0
0
* - Derivation of new Long Term Imported Spreading Requirement is possible due to new projectsthat will capture more storm/recycled water for conservation, and thus less imported needs:
1. Long Term Average of 27,600 af defined in 2003 ESR2. Minus 3,000 afy for increasing Whittier Narrows Conservation Pool3. Minus 3,600 afy for two new rubber dams on San Gabriel River4. Minus 5,000 afy of imported due to 5,000 afy increase in recyled based on new averaging period effective 20135. Equals new Long Term Average of 16,000 afy imported spreading
Long Term Average for Imported Spreading (updated, see below)*
Recycled Water for Spreading (WRD Purchases)
Total Spreading
Table 9QUANTITY OF WATER REQUIRED FOR ARTIFICIAL REPLENISHMENT
AMOUNT (AF)WATER TYPE
West Coast Barrier - Imported
West Coast Barrier - Recycled
Dominguez Gap - Imported
Dominguez Gap - Recycled
Alamitos Barrier - Imported - WRD portion only
Alamitos Barrier - Recycled - WRD portion only
In-Lieu Central Basin
In-Lieu West Coast Basin
Total In-Lieu
Total Barriers
Less Other Actions
Total Water Purchase Estimate for Ensuing Year 103,300
103,300 Total Water Purchase Estimate for Ensuing Year
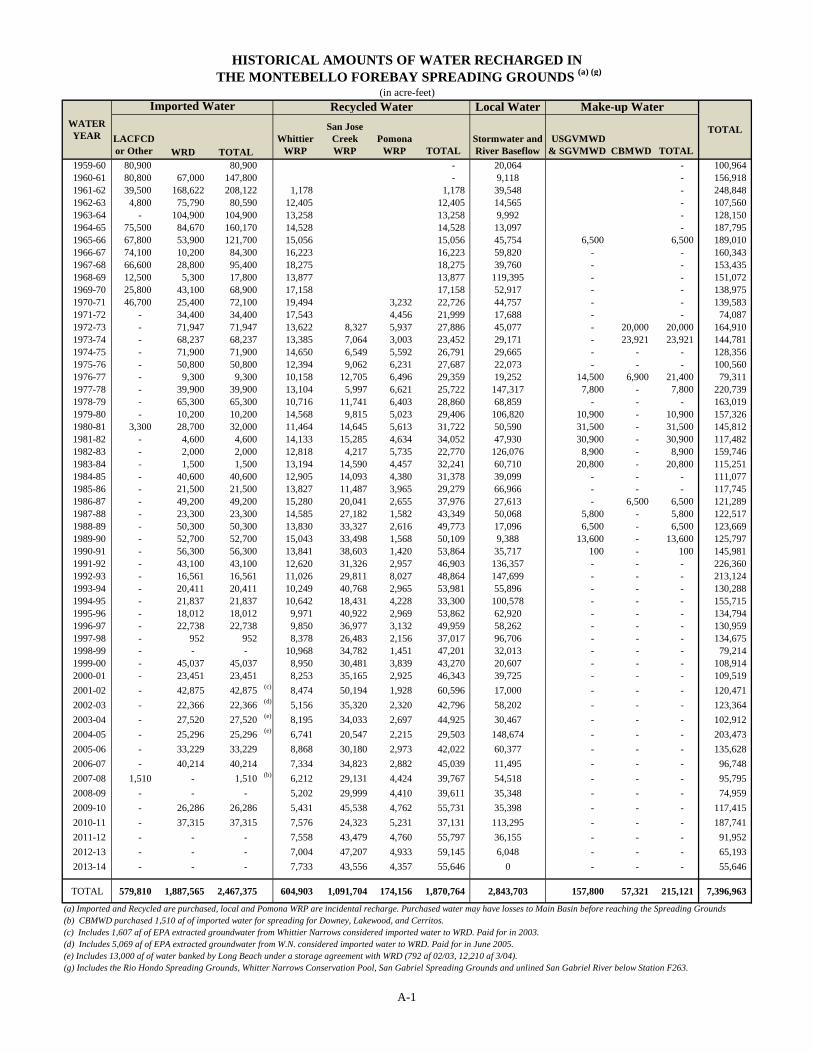
HISTORICAL AMOUNTS OF WATER RECHARGED IN THE MONTEBELLO FOREBAY SPREADING GROUNDS (a) (g)
(in acre-feet)Imported Water Recycled Water Local Water Make-up Water
LACFCD or Other WRD TOTAL
Whittier WRP
San Jose Creek WRP
Pomona WRP TOTAL
Stormwater and River Baseflow
USGVMWD& SGVMWD CBMWD TOTAL
1959-60 80,900 80,900 - 20,064 - 100,964 1960-61 80,800 67,000 147,800 - 9,118 - 156,918 1961-62 39,500 168,622 208,122 1,178 1,178 39,548 - 248,848 1962-63 4,800 75,790 80,590 12,405 12,405 14,565 - 107,560 1963-64 - 104,900 104,900 13,258 13,258 9,992 - 128,150 1964-65 75,500 84,670 160,170 14,528 14,528 13,097 - 187,795 1965-66 67,800 53,900 121,700 15,056 15,056 45,754 6,500 6,500 189,010 1966-67 74,100 10,200 84,300 16,223 16,223 59,820 - - 160,343 1967-68 66,600 28,800 95,400 18,275 18,275 39,760 - - 153,435 1968-69 12,500 5,300 17,800 13,877 13,877 119,395 - - 151,072 1969-70 25,800 43,100 68,900 17,158 17,158 52,917 - - 138,975 1970-71 46,700 25,400 72,100 19,494 3,232 22,726 44,757 - - 139,583 1971-72 - 34,400 34,400 17,543 4,456 21,999 17,688 - - 74,087 1972-73 - 71,947 71,947 13,622 8,327 5,937 27,886 45,077 - 20,000 20,000 164,910 1973-74 - 68,237 68,237 13,385 7,064 3,003 23,452 29,171 - 23,921 23,921 144,781 1974-75 - 71,900 71,900 14,650 6,549 5,592 26,791 29,665 - - - 128,356 1975-76 - 50,800 50,800 12,394 9,062 6,231 27,687 22,073 - - - 100,560 1976-77 - 9,300 9,300 10,158 12,705 6,496 29,359 19,252 14,500 6,900 21,400 79,311 1977-78 - 39,900 39,900 13,104 5,997 6,621 25,722 147,317 7,800 - 7,800 220,739 1978-79 - 65,300 65,300 10,716 11,741 6,403 28,860 68,859 - - - 163,019 1979-80 - 10,200 10,200 14,568 9,815 5,023 29,406 106,820 10,900 - 10,900 157,326 1980-81 3,300 28,700 32,000 11,464 14,645 5,613 31,722 50,590 31,500 - 31,500 145,812 1981-82 - 4,600 4,600 14,133 15,285 4,634 34,052 47,930 30,900 - 30,900 117,482 1982-83 - 2,000 2,000 12,818 4,217 5,735 22,770 126,076 8,900 - 8,900 159,746 1983-84 - 1,500 1,500 13,194 14,590 4,457 32,241 60,710 20,800 - 20,800 115,251 1984-85 - 40,600 40,600 12,905 14,093 4,380 31,378 39,099 - - - 111,077 1985-86 - 21,500 21,500 13,827 11,487 3,965 29,279 66,966 - - - 117,745 1986-87 - 49,200 49,200 15,280 20,041 2,655 37,976 27,613 - 6,500 6,500 121,289 1987-88 - 23,300 23,300 14,585 27,182 1,582 43,349 50,068 5,800 - 5,800 122,517 1988-89 - 50,300 50,300 13,830 33,327 2,616 49,773 17,096 6,500 - 6,500 123,669 1989-90 - 52,700 52,700 15,043 33,498 1,568 50,109 9,388 13,600 - 13,600 125,797 1990-91 - 56,300 56,300 13,841 38,603 1,420 53,864 35,717 100 - 100 145,981 1991-92 - 43,100 43,100 12,620 31,326 2,957 46,903 136,357 - - - 226,360 1992-93 - 16,561 16,561 11,026 29,811 8,027 48,864 147,699 - - - 213,124 1993-94 - 20,411 20,411 10,249 40,768 2,965 53,981 55,896 - - - 130,288 1994-95 - 21,837 21,837 10,642 18,431 4,228 33,300 100,578 - - - 155,715 1995-96 - 18,012 18,012 9,971 40,922 2,969 53,862 62,920 - - - 134,794 1996-97 - 22,738 22,738 9,850 36,977 3,132 49,959 58,262 - - - 130,959 1997-98 - 952 952 8,378 26,483 2,156 37,017 96,706 - - - 134,675 1998-99 - - - 10,968 34,782 1,451 47,201 32,013 - - - 79,214 1999-00 - 45,037 45,037 8,950 30,481 3,839 43,270 20,607 - - - 108,914 2000-01 - 23,451 23,451 8,253 35,165 2,925 46,343 39,725 - - - 109,519 2001-02 - 42,875 42,875 (c) 8,474 50,194 1,928 60,596 17,000 - - - 120,471 2002-03 - 22,366 22,366 (d) 5,156 35,320 2,320 42,796 58,202 - - - 123,364 2003-04 - 27,520 27,520 (e) 8,195 34,033 2,697 44,925 30,467 - - - 102,912 2004-05 - 25,296 25,296 (e) 6,741 20,547 2,215 29,503 148,674 - - - 203,473 2005-06 - 33,229 33,229 8,868 30,180 2,973 42,022 60,377 - - - 135,628 2006-07 - 40,214 40,214 7,334 34,823 2,882 45,039 11,495 - - - 96,748 2007-08 1,510 - 1,510 (b) 6,212 29,131 4,424 39,767 54,518 - - - 95,795 2008-09 - - - 5,202 29,999 4,410 39,611 35,348 - - - 74,959 2009-10 - 26,286 26,286 5,431 45,538 4,762 55,731 35,398 - - - 117,415 2010-11 - 37,315 37,315 7,576 24,323 5,231 37,131 113,295 - - - 187,741 2011-12 - - - 7,558 43,479 4,760 55,797 36,155 - - - 91,952 2012-13 - - - 7,004 47,207 4,933 59,145 6,048 - - - 65,193 2013-14 - - - 7,733 43,556 4,357 55,646 0 - - - 55,646
TOTAL 579,810 1,887,565 2,467,375 604,903 1,091,704 174,156 1,870,764 2,843,703 157,800 57,321 215,121 7,396,963
(a) Imported and Recycled are purchased, local and Pomona WRP are incidental recharge. Purchased water may have losses to Main Basin before reaching the Spreading Grounds(b) CBMWD purchased 1,510 af of imported water for spreading for Downey, Lakewood, and Cerritos.(c) Includes 1,607 af of EPA extracted groundwater from Whittier Narrows considered imported water to WRD. Paid for in 2003.(d) Includes 5,069 af of EPA extracted groundwater from W.N. considered imported water to WRD. Paid for in June 2005.(e) Includes 13,000 af of water banked by Long Beach under a storage agreement with WRD (792 af 02/03, 12,210 af 3/04).(g) Includes the Rio Hondo Spreading Grounds, Whitter Narrows Conservation Pool, San Gabriel Spreading Grounds and unlined San Gabriel River below Station F263.
WATER YEAR TOTAL
A-1
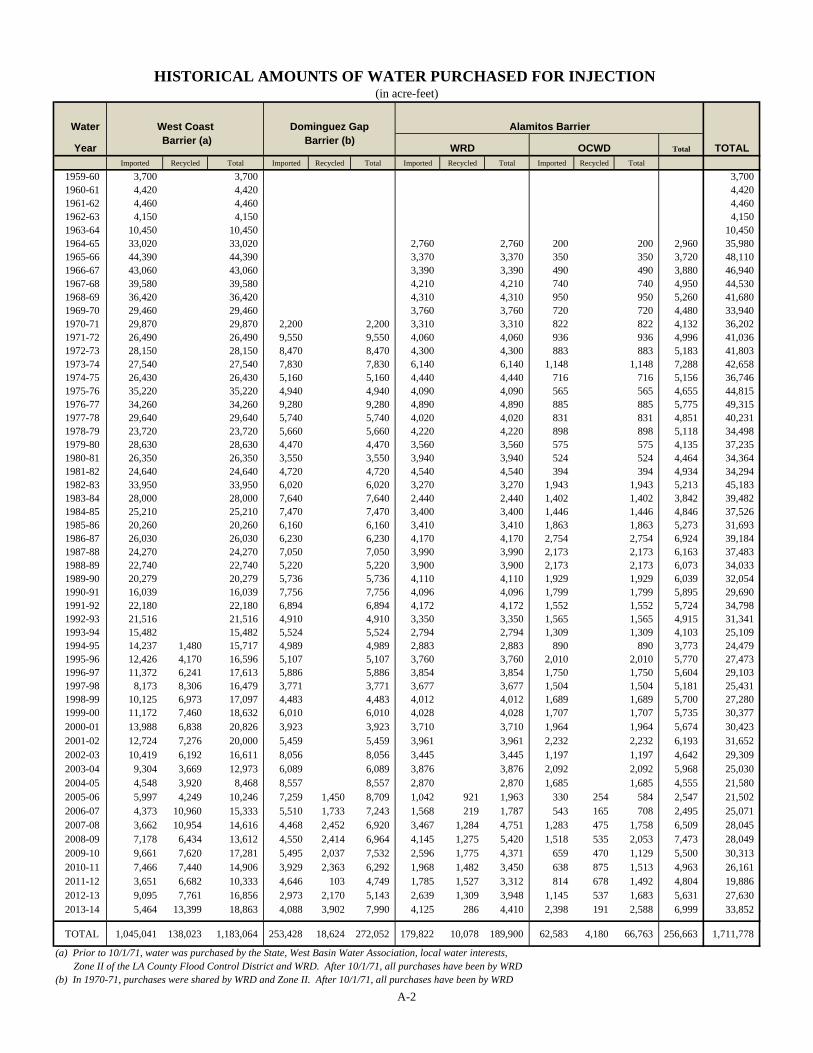
HISTORICAL AMOUNTS OF WATER PURCHASED FOR INJECTION (in acre-feet)
Water West Coast Dominguez Gap Alamitos Barrier
Year Barrier (a) Barrier (b)
WRD OCWD Total TOTALImported Recycled Total Imported Recycled Total Imported Recycled Total Imported Recycled Total
1959-60 3,700 3,700 3,700 1960-61 4,420 4,420 4,420 1961-62 4,460 4,460 4,460 1962-63 4,150 4,150 4,150 1963-64 10,450 10,450 10,450 1964-65 33,020 33,020 2,760 2,760 200 200 2,960 35,980 1965-66 44,390 44,390 3,370 3,370 350 350 3,720 48,110 1966-67 43,060 43,060 3,390 3,390 490 490 3,880 46,940 1967-68 39,580 39,580 4,210 4,210 740 740 4,950 44,530 1968-69 36,420 36,420 4,310 4,310 950 950 5,260 41,680 1969-70 29,460 29,460 3,760 3,760 720 720 4,480 33,940 1970-71 29,870 29,870 2,200 2,200 3,310 3,310 822 822 4,132 36,202 1971-72 26,490 26,490 9,550 9,550 4,060 4,060 936 936 4,996 41,036 1972-73 28,150 28,150 8,470 8,470 4,300 4,300 883 883 5,183 41,803 1973-74 27,540 27,540 7,830 7,830 6,140 6,140 1,148 1,148 7,288 42,658 1974-75 26,430 26,430 5,160 5,160 4,440 4,440 716 716 5,156 36,746 1975-76 35,220 35,220 4,940 4,940 4,090 4,090 565 565 4,655 44,815 1976-77 34,260 34,260 9,280 9,280 4,890 4,890 885 885 5,775 49,315 1977-78 29,640 29,640 5,740 5,740 4,020 4,020 831 831 4,851 40,231 1978-79 23,720 23,720 5,660 5,660 4,220 4,220 898 898 5,118 34,498 1979-80 28,630 28,630 4,470 4,470 3,560 3,560 575 575 4,135 37,235 1980-81 26,350 26,350 3,550 3,550 3,940 3,940 524 524 4,464 34,364 1981-82 24,640 24,640 4,720 4,720 4,540 4,540 394 394 4,934 34,294 1982-83 33,950 33,950 6,020 6,020 3,270 3,270 1,943 1,943 5,213 45,183 1983-84 28,000 28,000 7,640 7,640 2,440 2,440 1,402 1,402 3,842 39,482 1984-85 25,210 25,210 7,470 7,470 3,400 3,400 1,446 1,446 4,846 37,526 1985-86 20,260 20,260 6,160 6,160 3,410 3,410 1,863 1,863 5,273 31,693 1986-87 26,030 26,030 6,230 6,230 4,170 4,170 2,754 2,754 6,924 39,184 1987-88 24,270 24,270 7,050 7,050 3,990 3,990 2,173 2,173 6,163 37,483 1988-89 22,740 22,740 5,220 5,220 3,900 3,900 2,173 2,173 6,073 34,033 1989-90 20,279 20,279 5,736 5,736 4,110 4,110 1,929 1,929 6,039 32,054 1990-91 16,039 16,039 7,756 7,756 4,096 4,096 1,799 1,799 5,895 29,690 1991-92 22,180 22,180 6,894 6,894 4,172 4,172 1,552 1,552 5,724 34,798 1992-93 21,516 21,516 4,910 4,910 3,350 3,350 1,565 1,565 4,915 31,341 1993-94 15,482 15,482 5,524 5,524 2,794 2,794 1,309 1,309 4,103 25,109 1994-95 14,237 1,480 15,717 4,989 4,989 2,883 2,883 890 890 3,773 24,479 1995-96 12,426 4,170 16,596 5,107 5,107 3,760 3,760 2,010 2,010 5,770 27,473 1996-97 11,372 6,241 17,613 5,886 5,886 3,854 3,854 1,750 1,750 5,604 29,103 1997-98 8,173 8,306 16,479 3,771 3,771 3,677 3,677 1,504 1,504 5,181 25,431 1998-99 10,125 6,973 17,097 4,483 4,483 4,012 4,012 1,689 1,689 5,700 27,280 1999-00 11,172 7,460 18,632 6,010 6,010 4,028 4,028 1,707 1,707 5,735 30,377 2000-01 13,988 6,838 20,826 3,923 3,923 3,710 3,710 1,964 1,964 5,674 30,423 2001-02 12,724 7,276 20,000 5,459 5,459 3,961 3,961 2,232 2,232 6,193 31,652 2002-03 10,419 6,192 16,611 8,056 8,056 3,445 3,445 1,197 1,197 4,642 29,309 2003-04 9,304 3,669 12,973 6,089 6,089 3,876 3,876 2,092 2,092 5,968 25,030 2004-05 4,548 3,920 8,468 8,557 8,557 2,870 2,870 1,685 1,685 4,555 21,580 2005-06 5,997 4,249 10,246 7,259 1,450 8,709 1,042 921 1,963 330 254 584 2,547 21,502 2006-07 4,373 10,960 15,333 5,510 1,733 7,243 1,568 219 1,787 543 165 708 2,495 25,071 2007-08 3,662 10,954 14,616 4,468 2,452 6,920 3,467 1,284 4,751 1,283 475 1,758 6,509 28,045 2008-09 7,178 6,434 13,612 4,550 2,414 6,964 4,145 1,275 5,420 1,518 535 2,053 7,473 28,049 2009-10 9,661 7,620 17,281 5,495 2,037 7,532 2,596 1,775 4,371 659 470 1,129 5,500 30,313 2010-11 7,466 7,440 14,906 3,929 2,363 6,292 1,968 1,482 3,450 638 875 1,513 4,963 26,161 2011-12 3,651 6,682 10,333 4,646 103 4,749 1,785 1,527 3,312 814 678 1,492 4,804 19,886 2012-13 9,095 7,761 16,856 2,973 2,170 5,143 2,639 1,309 3,948 1,145 537 1,683 5,631 27,630 2013-14 5,464 13,399 18,863 4,088 3,902 7,990 4,125 286 4,410 2,398 191 2,588 6,999 33,852
TOTAL 1,045,041 138,023 1,183,064 253,428 18,624 272,052 179,822 10,078 189,900 62,583 4,180 66,763 256,663 1,711,778
(a) Prior to 10/1/71, water was purchased by the State, West Basin Water Association, local water interests, Zone II of the LA County Flood Control District and WRD. After 10/1/71, all purchases have been by WRD(b) In 1970-71, purchases were shared by WRD and Zone II. After 10/1/71, all purchases have been by WRD
A-2
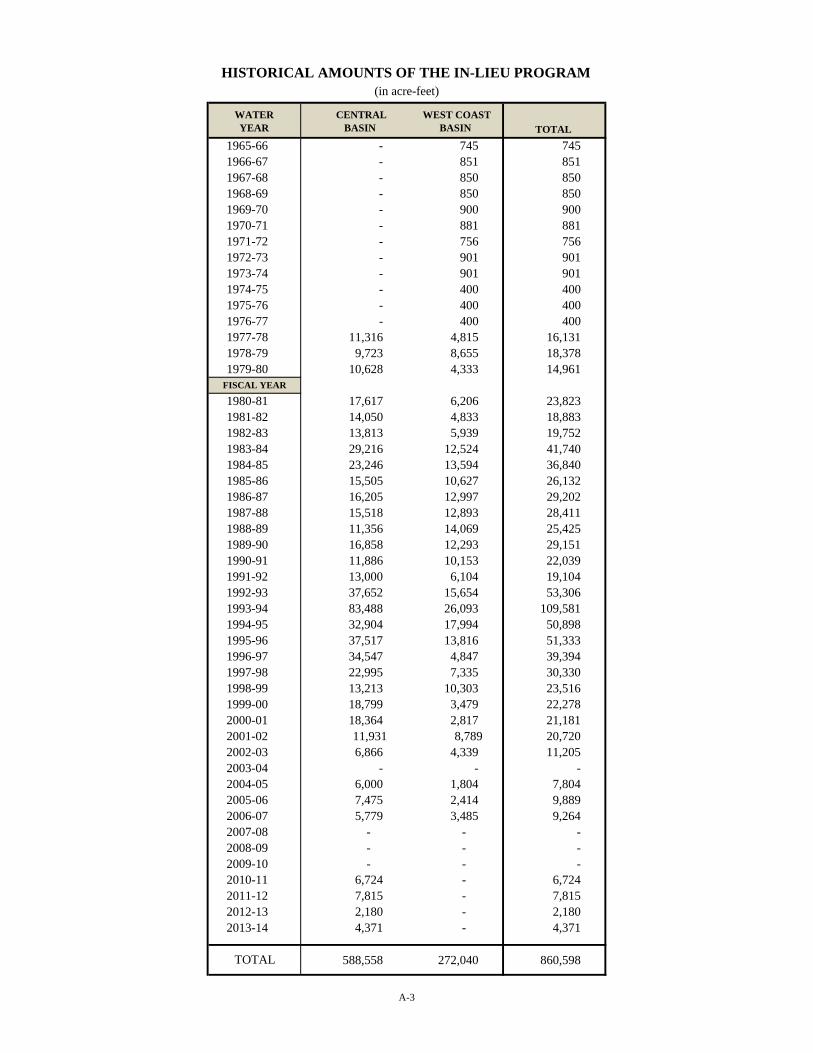
1965-66 - 745 745 1966-67 - 851 851 1967-68 - 850 850 1968-69 - 850 850 1969-70 - 900 900 1970-71 - 881 881 1971-72 - 756 756 1972-73 - 901 901 1973-74 - 901 901 1974-75 - 400 400 1975-76 - 400 400 1976-77 - 400 400 1977-78 11,316 4,815 16,131 1978-79 9,723 8,655 18,378 1979-80 10,628 4,333 14,961
1980-81 17,617 6,206 23,823 1981-82 14,050 4,833 18,883 1982-83 13,813 5,939 19,752 1983-84 29,216 12,524 41,740 1984-85 23,246 13,594 36,840 1985-86 15,505 10,627 26,132 1986-87 16,205 12,997 29,202 1987-88 15,518 12,893 28,411 1988-89 11,356 14,069 25,425 1989-90 16,858 12,293 29,151 1990-91 11,886 10,153 22,039 1991-92 13,000 6,104 19,104 1992-93 37,652 15,654 53,306 1993-94 83,488 26,093 109,581 1994-95 32,904 17,994 50,898 1995-96 37,517 13,816 51,333 1996-97 34,547 4,847 39,394 1997-98 22,995 7,335 30,330 1998-99 13,213 10,303 23,516 1999-00 18,799 3,479 22,278 2000-01 18,364 2,817 21,181 2001-02 11,931 8,789 20,720 2002-03 6,866 4,339 11,205 2003-04 - - - 2004-05 6,000 1,804 7,804 2005-06 7,475 2,414 9,889 2006-07 5,779 3,485 9,264 2007-08 - - - 2008-09 - - - 2009-10 - - - 2010-11 6,724 - 6,724 2011-12 7,815 - 7,815 2012-13 2,180 - 2,180 2013-14 4,371 - 4,371
588,558 272,040 860,598 TOTAL
FISCAL YEAR
HISTORICAL AMOUNTS OF THE IN-LIEU PROGRAM(in acre-feet)
WATERYEAR
CENTRALBASIN TOTAL
WEST COASTBASIN
A-3
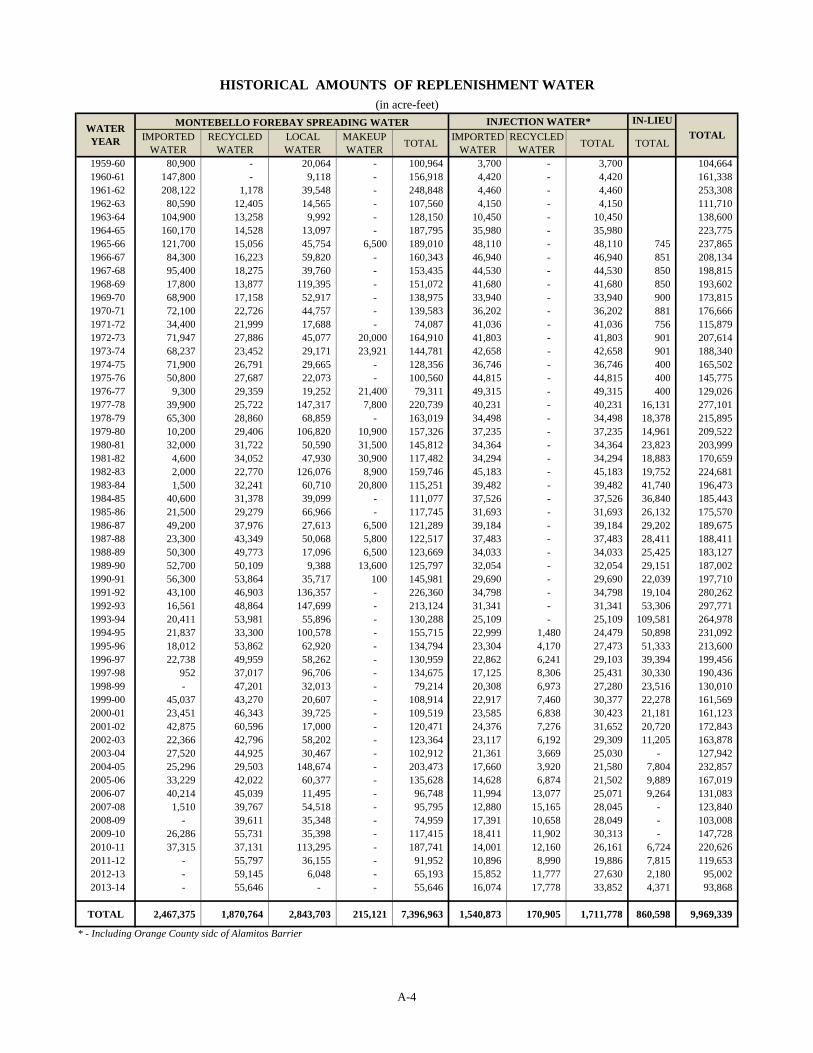
HISTORICAL AMOUNTS OF REPLENISHMENT WATER(in acre-feet)
MONTEBELLO FOREBAY SPREADING WATER INJECTION WATER* IN-LIEUIMPORTED
WATERRECYCLED
WATERLOCAL WATER
MAKEUP WATER TOTAL IMPORTED
WATERRECYCLED
WATER TOTAL TOTAL
1959-60 80,900 - 20,064 - 100,964 3,700 - 3,700 104,664 1960-61 147,800 - 9,118 - 156,918 4,420 - 4,420 161,338 1961-62 208,122 1,178 39,548 - 248,848 4,460 - 4,460 253,308 1962-63 80,590 12,405 14,565 - 107,560 4,150 - 4,150 111,710 1963-64 104,900 13,258 9,992 - 128,150 10,450 - 10,450 138,600 1964-65 160,170 14,528 13,097 - 187,795 35,980 - 35,980 223,775 1965-66 121,700 15,056 45,754 6,500 189,010 48,110 - 48,110 745 237,865 1966-67 84,300 16,223 59,820 - 160,343 46,940 - 46,940 851 208,134 1967-68 95,400 18,275 39,760 - 153,435 44,530 - 44,530 850 198,815 1968-69 17,800 13,877 119,395 - 151,072 41,680 - 41,680 850 193,602 1969-70 68,900 17,158 52,917 - 138,975 33,940 - 33,940 900 173,815 1970-71 72,100 22,726 44,757 - 139,583 36,202 - 36,202 881 176,666 1971-72 34,400 21,999 17,688 - 74,087 41,036 - 41,036 756 115,879 1972-73 71,947 27,886 45,077 20,000 164,910 41,803 - 41,803 901 207,614 1973-74 68,237 23,452 29,171 23,921 144,781 42,658 - 42,658 901 188,340 1974-75 71,900 26,791 29,665 - 128,356 36,746 - 36,746 400 165,502 1975-76 50,800 27,687 22,073 - 100,560 44,815 - 44,815 400 145,775 1976-77 9,300 29,359 19,252 21,400 79,311 49,315 - 49,315 400 129,026 1977-78 39,900 25,722 147,317 7,800 220,739 40,231 - 40,231 16,131 277,101 1978-79 65,300 28,860 68,859 - 163,019 34,498 - 34,498 18,378 215,895 1979-80 10,200 29,406 106,820 10,900 157,326 37,235 - 37,235 14,961 209,522 1980-81 32,000 31,722 50,590 31,500 145,812 34,364 - 34,364 23,823 203,999 1981-82 4,600 34,052 47,930 30,900 117,482 34,294 - 34,294 18,883 170,659 1982-83 2,000 22,770 126,076 8,900 159,746 45,183 - 45,183 19,752 224,681 1983-84 1,500 32,241 60,710 20,800 115,251 39,482 - 39,482 41,740 196,473 1984-85 40,600 31,378 39,099 - 111,077 37,526 - 37,526 36,840 185,443 1985-86 21,500 29,279 66,966 - 117,745 31,693 - 31,693 26,132 175,570 1986-87 49,200 37,976 27,613 6,500 121,289 39,184 - 39,184 29,202 189,675 1987-88 23,300 43,349 50,068 5,800 122,517 37,483 - 37,483 28,411 188,411 1988-89 50,300 49,773 17,096 6,500 123,669 34,033 - 34,033 25,425 183,127 1989-90 52,700 50,109 9,388 13,600 125,797 32,054 - 32,054 29,151 187,002 1990-91 56,300 53,864 35,717 100 145,981 29,690 - 29,690 22,039 197,710 1991-92 43,100 46,903 136,357 - 226,360 34,798 - 34,798 19,104 280,262 1992-93 16,561 48,864 147,699 - 213,124 31,341 - 31,341 53,306 297,771 1993-94 20,411 53,981 55,896 - 130,288 25,109 - 25,109 109,581 264,978 1994-95 21,837 33,300 100,578 - 155,715 22,999 1,480 24,479 50,898 231,092 1995-96 18,012 53,862 62,920 - 134,794 23,304 4,170 27,473 51,333 213,600 1996-97 22,738 49,959 58,262 - 130,959 22,862 6,241 29,103 39,394 199,456 1997-98 952 37,017 96,706 - 134,675 17,125 8,306 25,431 30,330 190,436 1998-99 - 47,201 32,013 - 79,214 20,308 6,973 27,280 23,516 130,010 1999-00 45,037 43,270 20,607 - 108,914 22,917 7,460 30,377 22,278 161,569 2000-01 23,451 46,343 39,725 - 109,519 23,585 6,838 30,423 21,181 161,123 2001-02 42,875 60,596 17,000 - 120,471 24,376 7,276 31,652 20,720 172,843 2002-03 22,366 42,796 58,202 - 123,364 23,117 6,192 29,309 11,205 163,878 2003-04 27,520 44,925 30,467 - 102,912 21,361 3,669 25,030 - 127,942 2004-05 25,296 29,503 148,674 - 203,473 17,660 3,920 21,580 7,804 232,857 2005-06 33,229 42,022 60,377 - 135,628 14,628 6,874 21,502 9,889 167,019 2006-07 40,214 45,039 11,495 - 96,748 11,994 13,077 25,071 9,264 131,083 2007-08 1,510 39,767 54,518 - 95,795 12,880 15,165 28,045 - 123,840 2008-09 - 39,611 35,348 - 74,959 17,391 10,658 28,049 - 103,008 2009-10 26,286 55,731 35,398 - 117,415 18,411 11,902 30,313 - 147,728 2010-11 37,315 37,131 113,295 - 187,741 14,001 12,160 26,161 6,724 220,626 2011-12 - 55,797 36,155 - 91,952 10,896 8,990 19,886 7,815 119,653 2012-13 - 59,145 6,048 - 65,193 15,852 11,777 27,630 2,180 95,002 2013-14 - 55,646 - - 55,646 16,074 17,778 33,852 4,371 93,868
TOTAL 2,467,375 1,870,764 2,843,703 215,121 7,396,963 1,540,873 170,905 1,711,778 860,598 9,969,339
* - Including Orange County sidc of Alamitos Barrier
WATERYEAR TOTAL
A-4
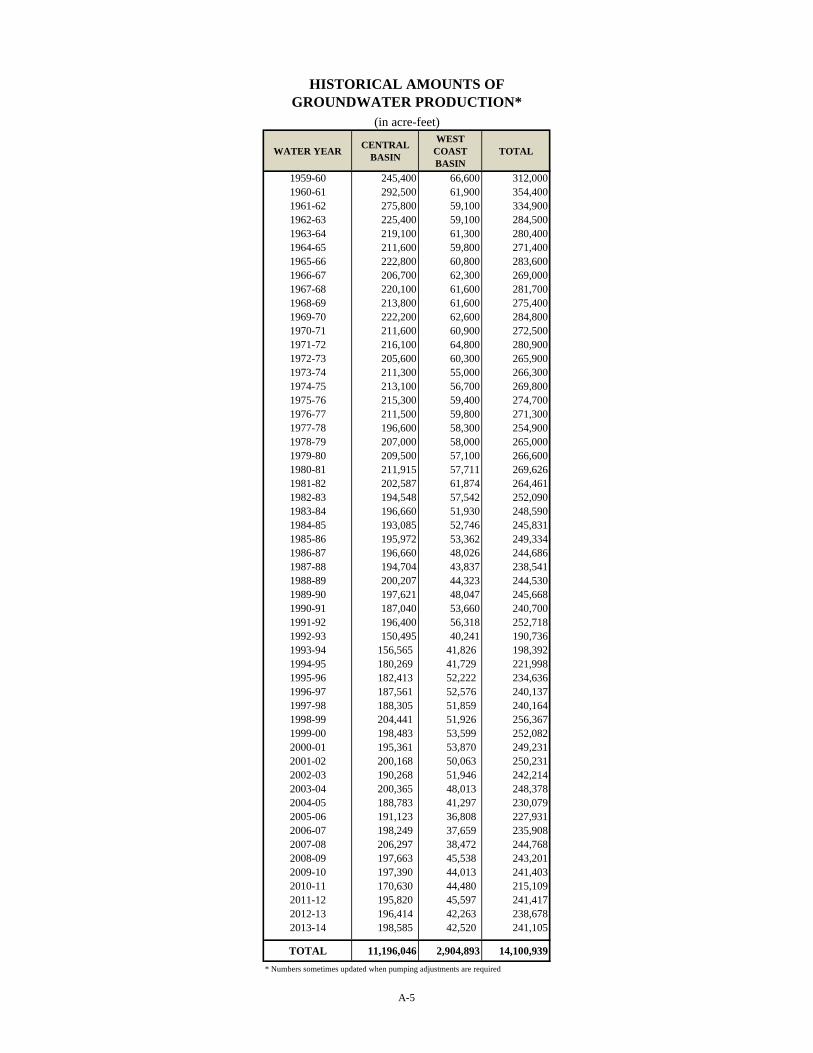
HISTORICAL AMOUNTS OF GROUNDWATER PRODUCTION*
(in acre-feet)
WATER YEAR CENTRAL BASIN
WEST COAST BASIN
TOTAL
1959-60 245,400 66,600 312,0001960-61 292,500 61,900 354,4001961-62 275,800 59,100 334,9001962-63 225,400 59,100 284,5001963-64 219,100 61,300 280,4001964-65 211,600 59,800 271,4001965-66 222,800 60,800 283,6001966-67 206,700 62,300 269,0001967-68 220,100 61,600 281,7001968-69 213,800 61,600 275,4001969-70 222,200 62,600 284,8001970-71 211,600 60,900 272,5001971-72 216,100 64,800 280,9001972-73 205,600 60,300 265,9001973-74 211,300 55,000 266,3001974-75 213,100 56,700 269,8001975-76 215,300 59,400 274,7001976-77 211,500 59,800 271,3001977-78 196,600 58,300 254,9001978-79 207,000 58,000 265,0001979-80 209,500 57,100 266,6001980-81 211,915 57,711 269,6261981-82 202,587 61,874 264,4611982-83 194,548 57,542 252,0901983-84 196,660 51,930 248,5901984-85 193,085 52,746 245,8311985-86 195,972 53,362 249,3341986-87 196,660 48,026 244,6861987-88 194,704 43,837 238,5411988-89 200,207 44,323 244,5301989-90 197,621 48,047 245,6681990-91 187,040 53,660 240,7001991-92 196,400 56,318 252,7181992-93 150,495 40,241 190,7361993-94 156,565 41,826 198,3921994-95 180,269 41,729 221,9981995-96 182,413 52,222 234,6361996-97 187,561 52,576 240,1371997-98 188,305 51,859 240,1641998-99 204,441 51,926 256,3671999-00 198,483 53,599 252,0822000-01 195,361 53,870 249,2312001-02 200,168 50,063 250,2312002-03 190,268 51,946 242,2142003-04 200,365 48,013 248,3782004-05 188,783 41,297 230,0792005-06 191,123 36,808 227,9312006-07 198,249 37,659 235,9082007-08 206,297 38,472 244,7682008-09 197,663 45,538 243,2012009-10 197,390 44,013 241,4032010-11 170,630 44,480 215,1092011-12 195,820 45,597 241,4172012-13 196,414 42,263 238,6782013-14 198,585 42,520 241,105
TOTAL 11,196,046 2,904,893 14,100,939* Numbers sometimes updated when pumping adjustments are required
A-5
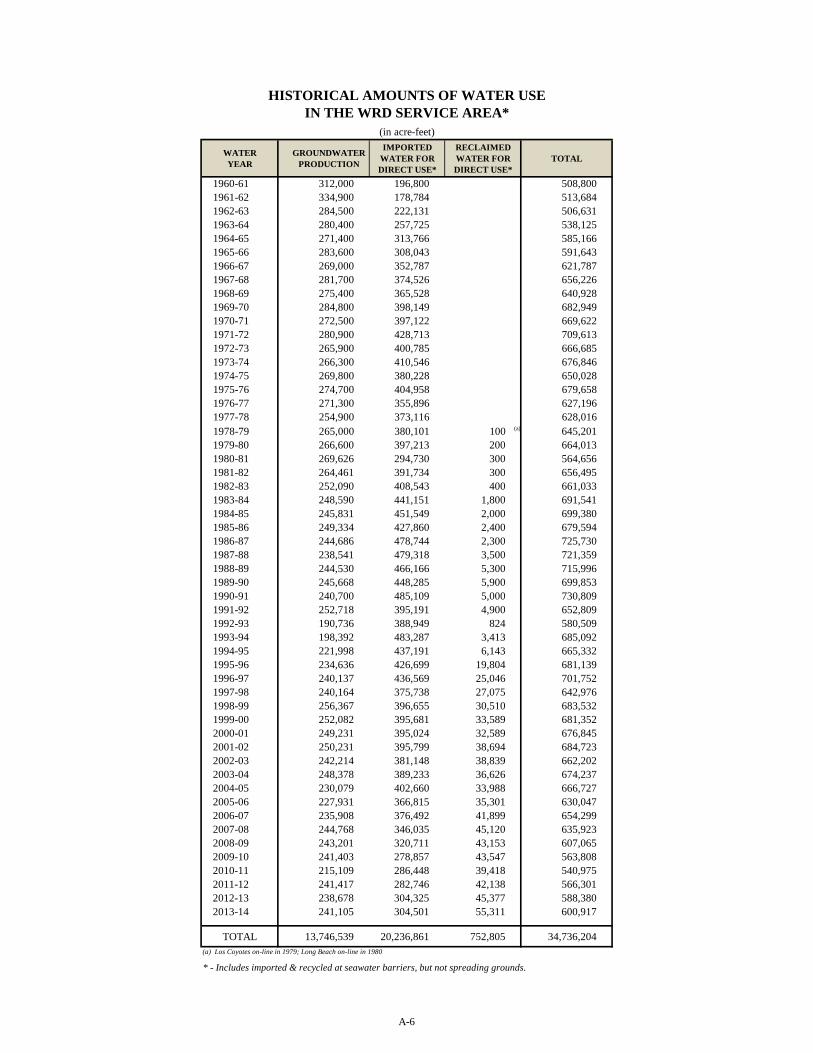
HISTORICAL AMOUNTS OF WATER USEIN THE WRD SERVICE AREA*
(in acre-feet)
WATERYEAR
GROUNDWATERPRODUCTION
IMPORTEDWATER FORDIRECT USE*
RECLAIMEDWATER FORDIRECT USE*
TOTAL
1960-61 312,000 196,800 508,800 1961-62 334,900 178,784 513,684 1962-63 284,500 222,131 506,631 1963-64 280,400 257,725 538,125 1964-65 271,400 313,766 585,166 1965-66 283,600 308,043 591,643 1966-67 269,000 352,787 621,787 1967-68 281,700 374,526 656,226 1968-69 275,400 365,528 640,928 1969-70 284,800 398,149 682,949 1970-71 272,500 397,122 669,622 1971-72 280,900 428,713 709,613 1972-73 265,900 400,785 666,685 1973-74 266,300 410,546 676,846 1974-75 269,800 380,228 650,028 1975-76 274,700 404,958 679,658 1976-77 271,300 355,896 627,196 1977-78 254,900 373,116 628,016 1978-79 265,000 380,101 100 (a) 645,201 1979-80 266,600 397,213 200 664,013 1980-81 269,626 294,730 300 564,656 1981-82 264,461 391,734 300 656,495 1982-83 252,090 408,543 400 661,033 1983-84 248,590 441,151 1,800 691,541 1984-85 245,831 451,549 2,000 699,380 1985-86 249,334 427,860 2,400 679,594 1986-87 244,686 478,744 2,300 725,730 1987-88 238,541 479,318 3,500 721,359 1988-89 244,530 466,166 5,300 715,996 1989-90 245,668 448,285 5,900 699,853 1990-91 240,700 485,109 5,000 730,809 1991-92 252,718 395,191 4,900 652,809 1992-93 190,736 388,949 824 580,509 1993-94 198,392 483,287 3,413 685,092 1994-95 221,998 437,191 6,143 665,332 1995-96 234,636 426,699 19,804 681,139 1996-97 240,137 436,569 25,046 701,752 1997-98 240,164 375,738 27,075 642,976 1998-99 256,367 396,655 30,510 683,532 1999-00 252,082 395,681 33,589 681,352 2000-01 249,231 395,024 32,589 676,845 2001-02 250,231 395,799 38,694 684,723 2002-03 242,214 381,148 38,839 662,202 2003-04 248,378 389,233 36,626 674,237 2004-05 230,079 402,660 33,988 666,727 2005-06 227,931 366,815 35,301 630,047 2006-07 235,908 376,492 41,899 654,299 2007-08 244,768 346,035 45,120 635,923 2008-09 243,201 320,711 43,153 607,065 2009-10 241,403 278,857 43,547 563,808 2010-11 215,109 286,448 39,418 540,975 2011-12 241,417 282,746 42,138 566,301 2012-13 238,678 304,325 45,377 588,380 2013-14 241,105 304,501 55,311 600,917
TOTAL 13,746,539 20,236,861 752,805 34,736,204 (a) Los Coyotes on-line in 1979; Long Beach on-line in 1980
* - Includes imported & recycled at seawater barriers, but not spreading grounds.
A-6


FIGURES

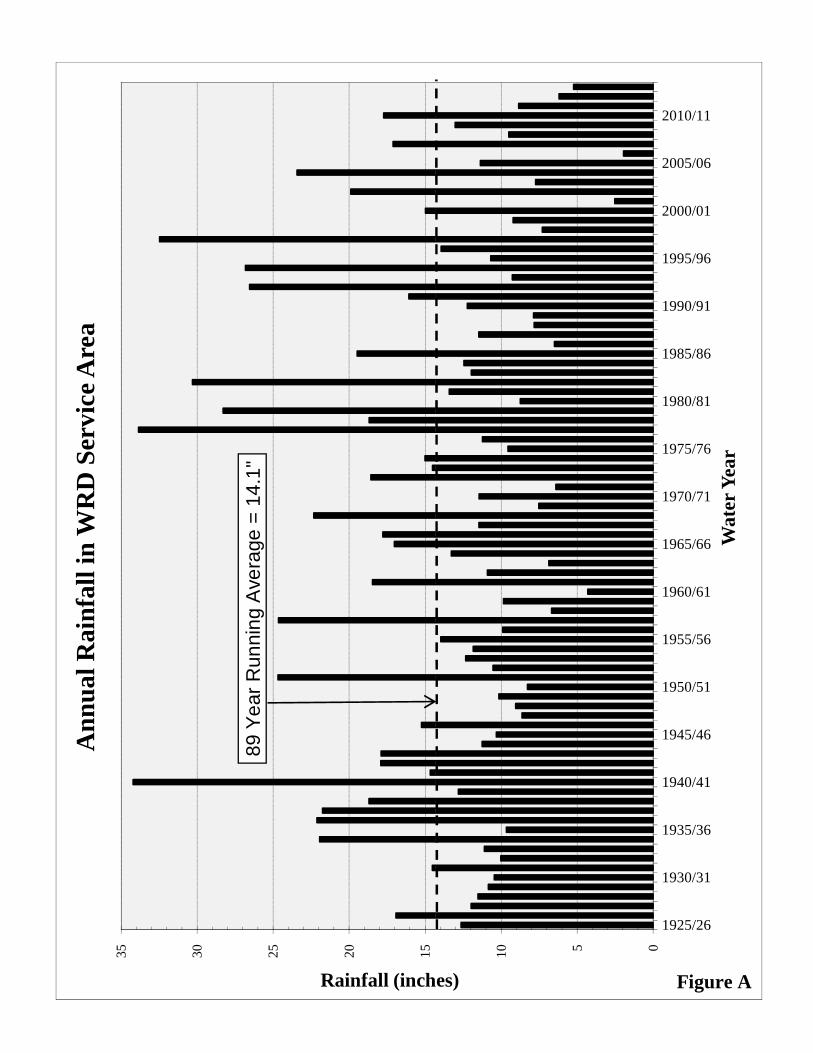
15
20
25
30
35
Rainfall (inch
Ann
ual R
ainf
all i
n W
RD
Ser
vice
Are
a
89 Y
ear
Run
nin
g A
ve
rage =
14
.1"
0 5 10
1925/26
1930/31
1935/36
1940/41
1945/46
1950/51
1955/56
1960/61
1965/66
1970/71
1975/76
1980/81
1985/86
1990/91
1995/96
2000/01
2005/06
2010/11
es)
Wat
er Y
ear
Figure A
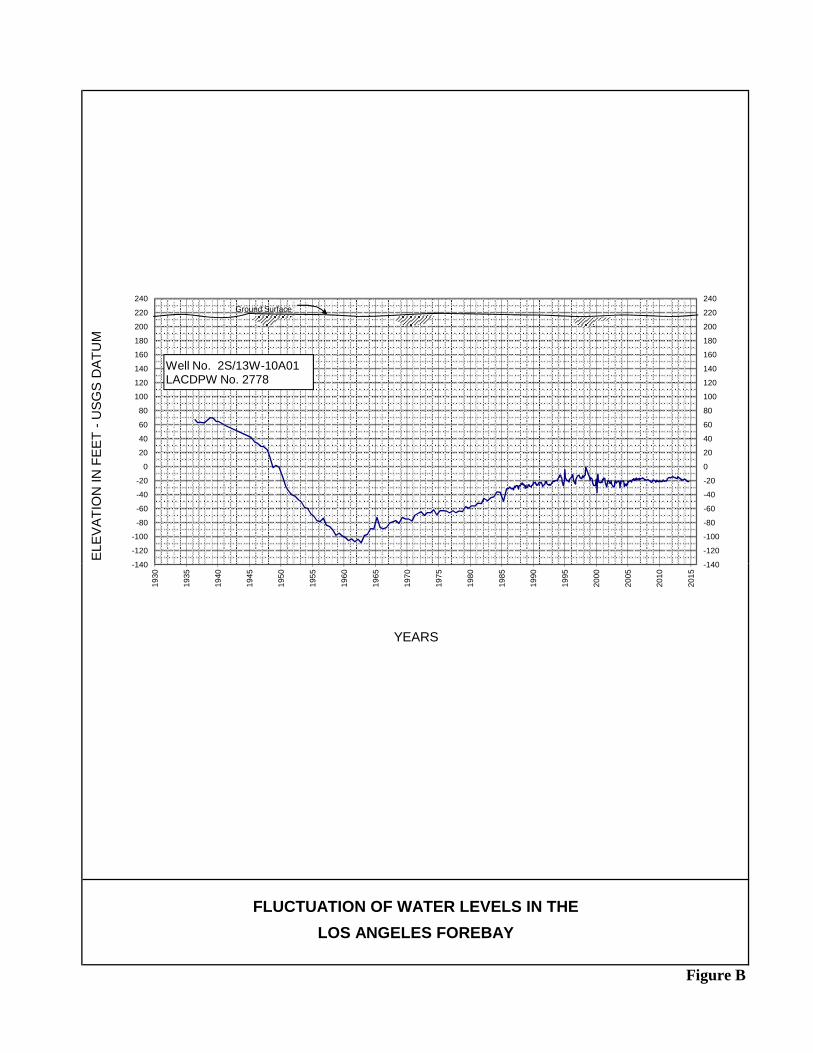
140
-120
-100
-80
-60
-40
-20
0
20
40
60
80
100
120
140
160
180
200
220
240
140
-120
-100
-80
-60
-40
-20
0
20
40
60
80
100
120
140
160
180
200
220
240
Well No. 2S/13W-10A01LACDPW No. 2778
Ground Surface
ELE
VA
TIO
N I
N F
EE
T -
US
GS
DA
TU
M
FLUCTUATION OF WATER LEVELS IN THE
LOS ANGELES FOREBAY
Figure B
-140 -140
19
30
19
35
19
40
19
45
19
50
19
55
19
60
19
65
19
70
19
75
19
80
19
85
19
90
19
95
20
00
20
05
20
10
20
15
YEARS
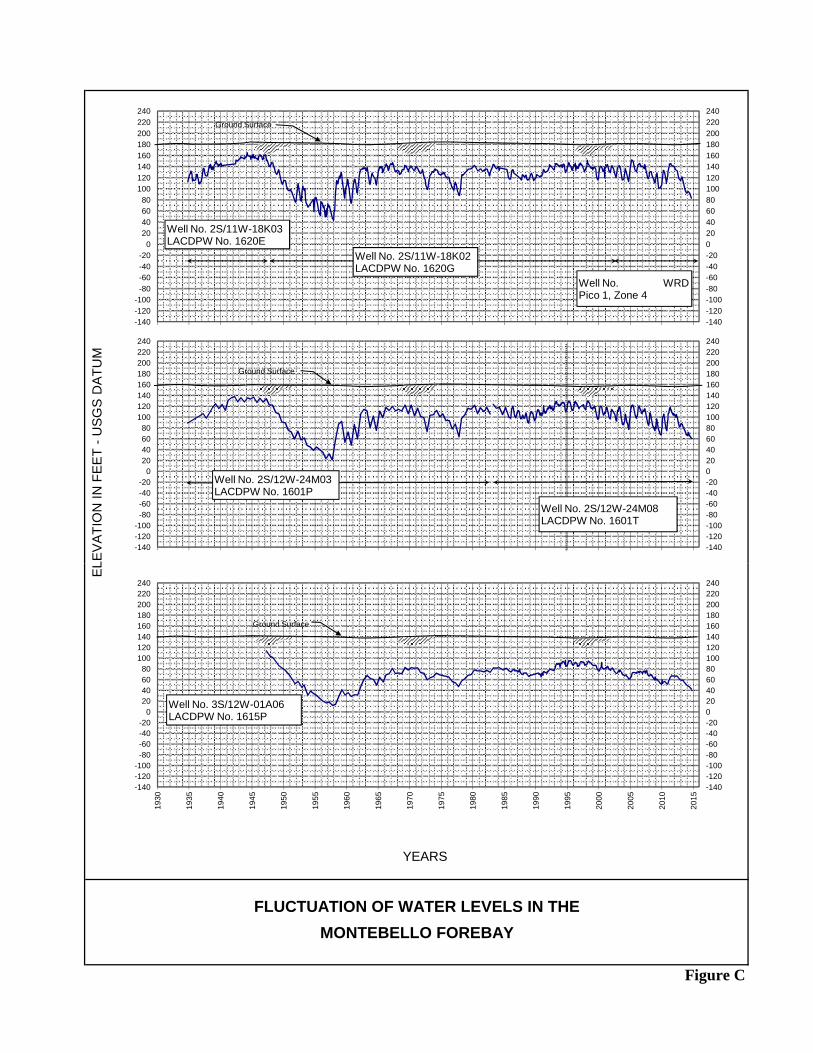
-140
-120
-100
-80
-60
-40
-20
0
20
40
60
80
100
120
140
160
180
200
220
240
-140
-120
-100
-80
-60
-40
-20
0
20
40
60
80
100
120
140
160
180
200
220
240
1930
1935
1940
1945
1950
1955
1960
1965
1970
1975
1980
1985
1990
1995
2000
2005
2010
2015
Ground Surface
Well No. 2S/11W-18K03LACDPW No. 1620E
Well No. 2S/11W-18K02LACDPW No. 1620G
Well No. WRD Pico 1, Zone 4
-140
-120
-100
-80
-60
-40
-20
0
20
40
60
80
100
120
140
160
180
200
220
240
-140
-120
-100
-80
-60
-40
-20
0
20
40
60
80
100
120
140
160
180
200
220
240
30
35
40
45
50
55
60
65
70
75
80
85
90
95
00
05
10
15
Ground Surface
Well No. 2S/12W-24M03LACDPW No. 1601P
Well No. 2S/12W-24M08LACDPW No. 1601T
LE
VA
TIO
N I
N F
EE
T -
US
GS
DA
TU
M
FLUCTUATION OF WATER LEVELS IN THE
MONTEBELLO FOREBAY
Figure C
YEARS
193
193
194
194
195
195
196
196
197
197
198
198
199
199
200
200
201
201
-140
-120
-100
-80
-60
-40
-20
0
20
40
60
80
100
120
140
160
180
200
220
240
-140
-120
-100
-80
-60
-40
-20
0
20
40
60
80
100
120
140
160
180
200
220
240
19
30
19
35
19
40
19
45
19
50
19
55
19
60
19
65
19
70
19
75
19
80
19
85
19
90
19
95
20
00
20
05
20
10
20
15
Ground Surface
Well No. 3S/12W-01A06LACDPW No. 1615P
EL
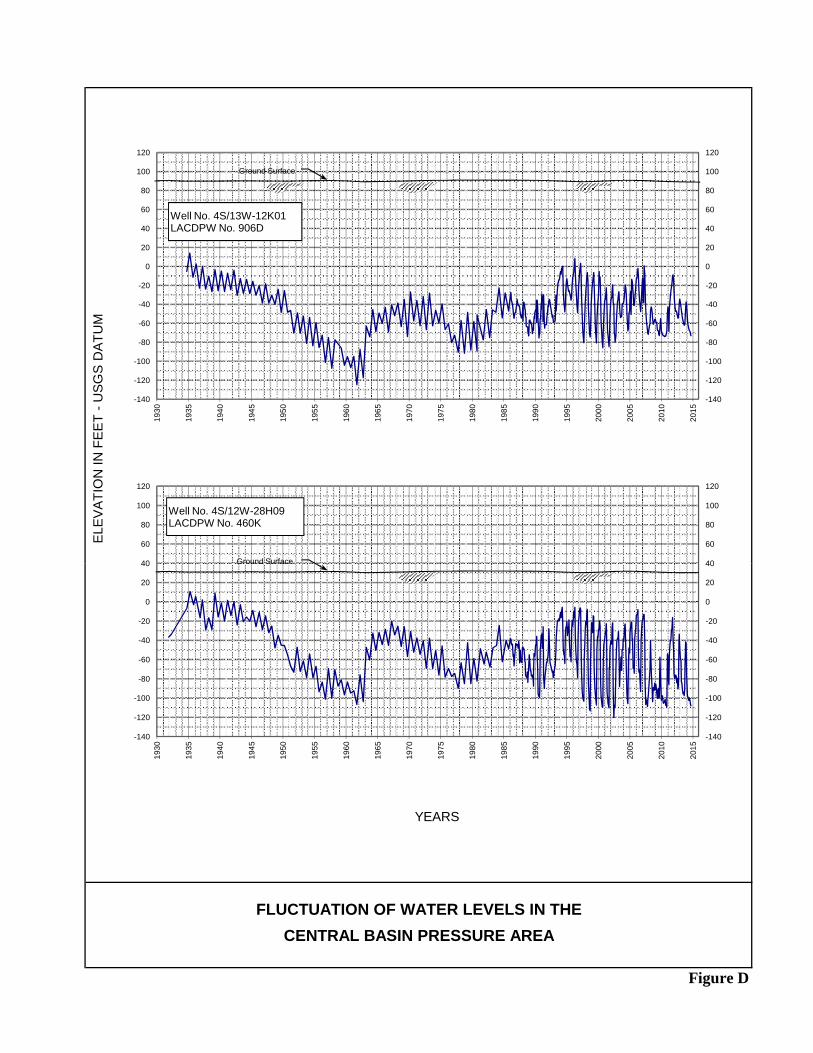
-140
-120
-100
-80
-60
-40
-20
0
20
40
60
80
100
120
-140
-120
-100
-80
-60
-40
-20
0
20
40
60
80
100
1201
93
0
19
35
19
40
19
45
19
50
19
55
19
60
19
65
19
70
19
75
19
80
19
85
19
90
19
95
20
00
20
05
20
10
20
15
Well No. 4S/13W-12K01LACDPW No. 906D
Ground Surface
40
60
80
100
120
40
60
80
100
120
Well No. 4S/12W-28H09LACDPW No. 460K
Ground Surface
ELE
VA
TIO
N I
N F
EE
T -
US
GS
DA
TU
M
FLUCTUATION OF WATER LEVELS IN THE
CENTRAL BASIN PRESSURE AREA
Figure D
-140
-120
-100
-80
-60
-40
-20
0
20
40
-140
-120
-100
-80
-60
-40
-20
0
20
40
19
30
19
35
19
40
19
45
19
50
19
55
19
60
19
65
19
70
19
75
19
80
19
85
19
90
19
95
20
00
20
05
20
10
20
15
Ground Surface
YEARS
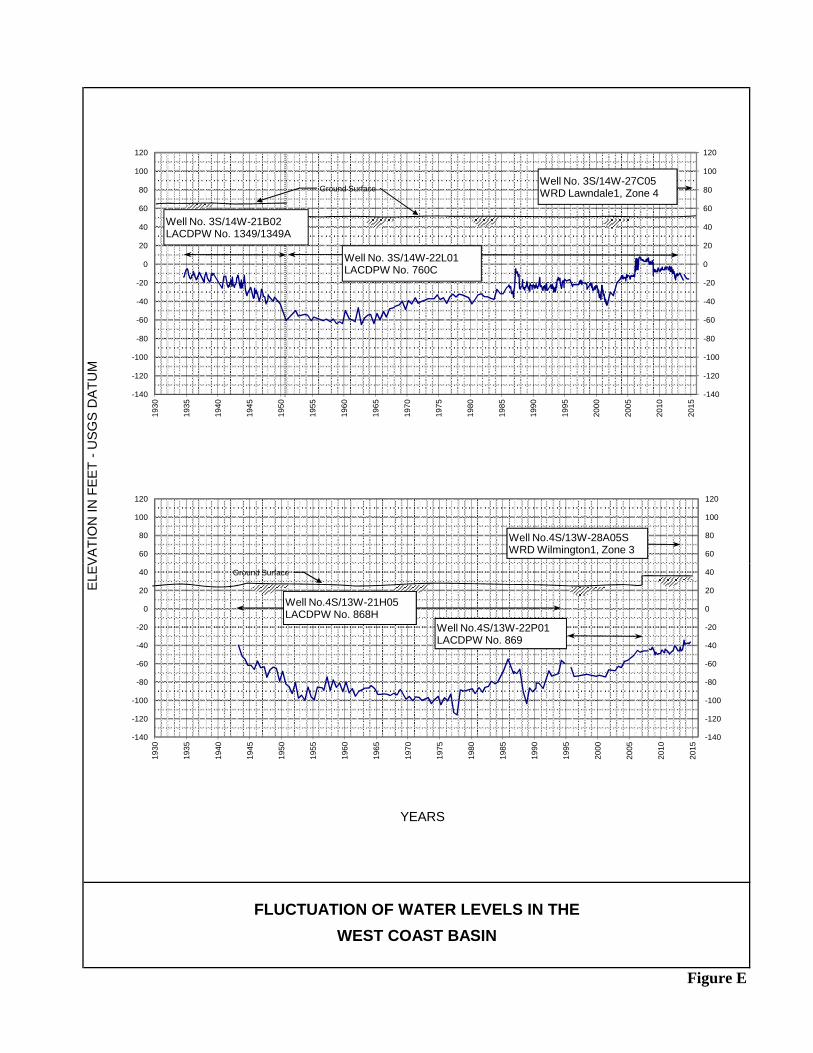
-140
-120
-100
-80
-60
-40
-20
0
20
40
60
80
100
120
-140
-120
-100
-80
-60
-40
-20
0
20
40
60
80
100
1201
93
0
19
35
19
40
19
45
19
50
19
55
19
60
19
65
19
70
19
75
19
80
19
85
19
90
19
95
20
00
20
05
20
10
20
15
Ground Surface
Well No. 3S/14W-22L01LACDPW No. 760C
Well No. 3S/14W-21B02LACDPW No. 1349/1349A
Well No. 3S/14W-27C05WRD Lawndale1, Zone 4
60
80
100
120
60
80
100
120
Well No.4S/13W-28A05S WRD Wilmington1, Zone 3
VA
TIO
N I
N F
EE
T -
US
GS
DA
TU
M
FLUCTUATION OF WATER LEVELS IN THE
WEST COAST BASIN
Figure E
YEARS
-140
-120
-100
-80
-60
-40
-20
0
20
40
-140
-120
-100
-80
-60
-40
-20
0
20
40
19
30
19
35
19
40
19
45
19
50
19
55
19
60
19
65
19
70
19
75
19
80
19
85
19
90
19
95
20
00
20
05
20
10
20
15
Ground Surface
Well No.4S/13W-22P01LACDPW No. 869
Well No.4S/13W-21H05LACDPW No. 868H
ELE
V


PLATES

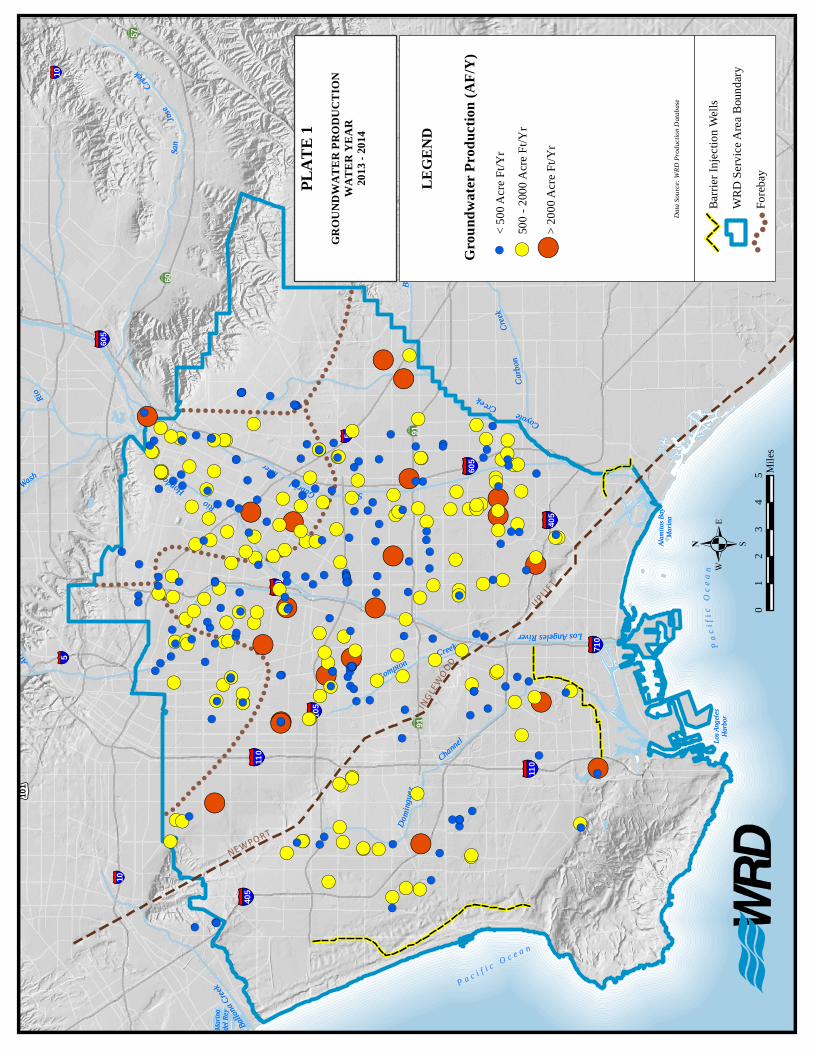
RioHondo
Brea
Cre e k
San
Jose
Creek
Arroyo
Seco
River
Rio
Hondo
CoyoteCreek
Alhambra
Wash
Ballon
a Cree
k
ComptonCreek
Carbo
nCr
eek
Domi
ngue
z
Channel
LosAngelesRiver
Marin
adel
Rey
Alami
tos Ba
yMa
rina
Los A
ngele
sHa
rbor
P a c i f i c O c e a n
Paci
fic
Oce
a n
SanGabriel
! ! ! ! ! ! ! ! !
!! ! ! ! ! ! ! ! ! ! ! ! ! ! ! !!!
!!
!!
!!
!!
!!
!!!!!!
!!
!!!
!!!
!! ! ! ! ! !
!!!
!!!
!!
!!
!!
!!!!!!!!!
!!!!
!!
!!!
!!
!!
!!!
!!!
!!!
!!
!!
!!!
!!!!!!!!!!!!!!!!!!!!!
!!
!!
!
RioHondo
Brea
Cre e k
San
Jose
Creek
Arroyo
Seco
River
Rio
Hondo
CoyoteCreek
Alhambra
Wash
Ballon
a Cree
k
ComptonCreek
Carbo
nCr
eek
Domi
ngue
z
Channel
LosAngelesRiver
Marin
adel
Rey
Alami
tos Ba
yMa
rina
Los A
ngele
sHa
rbor
P a c i f i c O c e a n
Paci
fic
Oce
a n
SanGabriel
INGLEWOOD
UPLIFT
NEWPORT
§̈ ¦710
§̈ ¦710
§̈ ¦5
§̈ ¦405
§̈ ¦110
§̈ ¦10
§̈ ¦105
§̈ ¦605
§̈ ¦10
ÄÅ57
ÄÅ91
ÄÅ60
£ ¤101
§̈ ¦110
§̈ ¦405
§̈ ¦605
ÄÅ91
§̈ ¦5 §̈ ¦5
! (
! (! (
! (
! (
! (
! (! (
! (
! (! (
! (
! (
! (
! (
! (
! (
! (! (
! (! (
! (
! (
! (
! (
! (
! (
! (
! (
! (
! (
! (
! (
! (
! (! (
! (
! (
! ( ! (
! (
! (
! (
! (
! (
! (
! (
! ( ! (! (
! (
! (
! (! (
! (! (
! (
! (
! (
! (! (! (
! (
! (
! (! (
! (
! (
! (
! (
! (
! (
! (
! (
! (
! (
! (
! (
! (
! (
! (
! (
! (! (
! (
! (
! (
! (! (
! (
! (
! (
! ( ! (
! (
! (
! (
! (
! (
! (! (
! (
! (
! ( ! (
! (! (
! (
! (
! (! (
! (! (
! (
! (! (
! (
! (
! (
! (
! (
! (
! (
! (
! (
! (
! (
! (
! (
! ( ! (! (
! (
! (! (
! (
! (! (! (
! (
! (
! (
! (
! (
! (
! (! (
! (
! (
! (! (
! (
! (
! (
! ( ! (
! (
! (
! (! (
! (
! (
! ( ! ( ! ( ! (
! (
! (
! (
! (! ( ! (
! (
! (! (
! (
! (
! ( ! (
! (
! (
! (
! (
! (
! (
! (
! (
! (
! (
! (
! (
! (
! (
! (
! (
! (
! (
! (
! (
! (
! (
! (
! (
! (! (
! (
! (
! (
! (
! (
! (
! (
! (
! (
! (
! (
! (
! (
! (
! (
! (
! (
! (
! (
! (
! (
! (
! (
! (
! (
! (
! (
! (
! (! (
! (
! (
! (
! (
! (
! (
! (
! (
! (! (
! (
! (
! (
! (
! (
! (
! (
! (
! (
! (
! (
! (
! (! (! (
! (! (
! (! (
! (
! (
! (
! (
! (
! (! (
! (
! (! (
! (
! (! (! (
! (
! (
! (
! (
! (
! (! (
! (
! (
! (
! (
! (
! (
! (
! (! (
! (
! (
! (
! (
! (
! (
! (
! (
! (
! (
! (! ( ! (
! (
! (
! (! (
! (
! ( ! (
! (
! (
! (
! (
! (
! (
! (
! (
! (
! (
! (
! (
! (
! (
! (
! (! (
! (
! (
! (! (
! (
! (
! (
! (
! (! (
! (
! (
! (
! (
! (
! (
! (
! (
! (
! (
! (! (
! ( ! (! (! (! (
! ( ! (
! (
! (
! (
.0
51
23
4M
iles
GROU
NDW
ATER
PROD
UCTI
ONW
ATER
YEA
R20
13 - 2
014
PLAT
E 1
LEGE
ND
Data
Sourc
e: WR
D Pr
oduc
tion D
ataba
se
Grou
ndwa
ter Pr
oduc
tion (
AF/Y
)! (
< 5
00
Acre
Ft/
Yr
! (50
0 -
200
0 A
cre
Ft/
Yr
! (>
20
00
Acre
Ft/
Yr
Barr
ier
Inje
cti
on
Wel
ls
WR
D S
erv
ice
Are
a B
ou
nd
ary
!
!!!
!
!
Fo
reb
ay

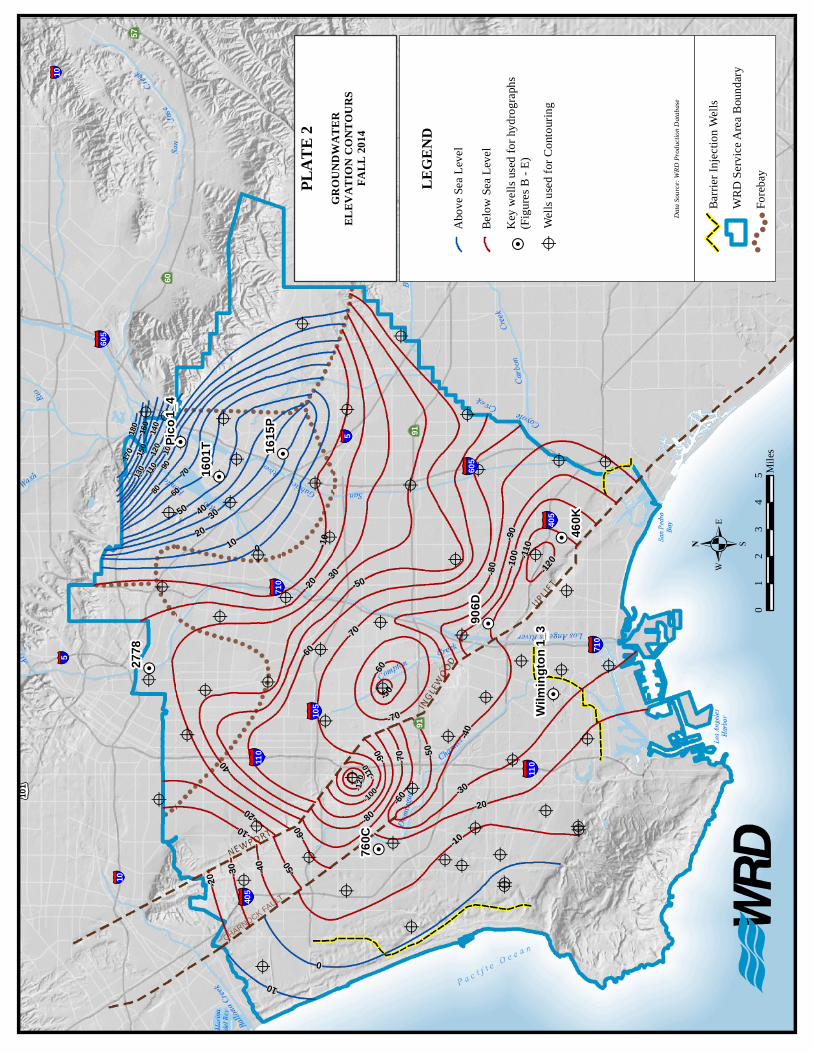
180
-50
-60-50
170
-120
-40-30-20
160
-110
10
150
-120
-10
-60
140
-100
130
-50
-60
120
-20
-90
-80
-110
-70
-40
40
-70
-100
50 3020
60
70
8090
10
100
-90
-30-20
110
-10
0
0
-20
-80
-10
-70
-60-30
-40
-50
??
?
?
?
?
?
?
?
???
?
?
?
??
?
??
?
?
?
?
?
?
?
?
?
??
?
?
?
?
?
?
?
?
?
?
?
?
?
?
?
?
?
?
?
? ?
?
?
?
?
?
?
?
??
?
§̈ ¦710
§̈ ¦710
§̈ ¦5
§̈ ¦405
§̈ ¦110
§̈ ¦10
§̈ ¦105
§̈ ¦605
§̈ ¦10
ÄÆ57
ÄÆ91
ÄÆ60
£ ¤101
§̈ ¦110
§̈ ¦405
§̈ ¦605
ÄÆ91
§̈ ¦5 §̈ ¦5
!H
!H
!H
!H
!H
!H
!H
!H
1615
P
460K
2778
906D
760C
1601
TPico 1
_4
Wilm
ingto
n 1_3
CHARNOCK F
AULT
.0
51
23
4M
iles
GROU
NDW
ATER
ELEV
ATIO
N CO
NTOU
RSFA
LL 20
14
PLAT
E 2
LEGE
ND
Data
Sourc
e: WR
D Pr
oduc
tion D
ataba
se
Abo
ve
Sea L
evel
Belo
w S
ea L
evel
!HK
ey w
ell
s use
d f
or
hy
dro
gra
ph
s
(Fig
ure
s B
- E
)
?W
ells
use
d f
or
Co
nto
uri
ng
Barr
ier
Inje
cti
on
Wel
ls
WR
D S
erv
ice
Are
a B
ou
nd
ary
!
!!!
!
!
Fo
reb
ay

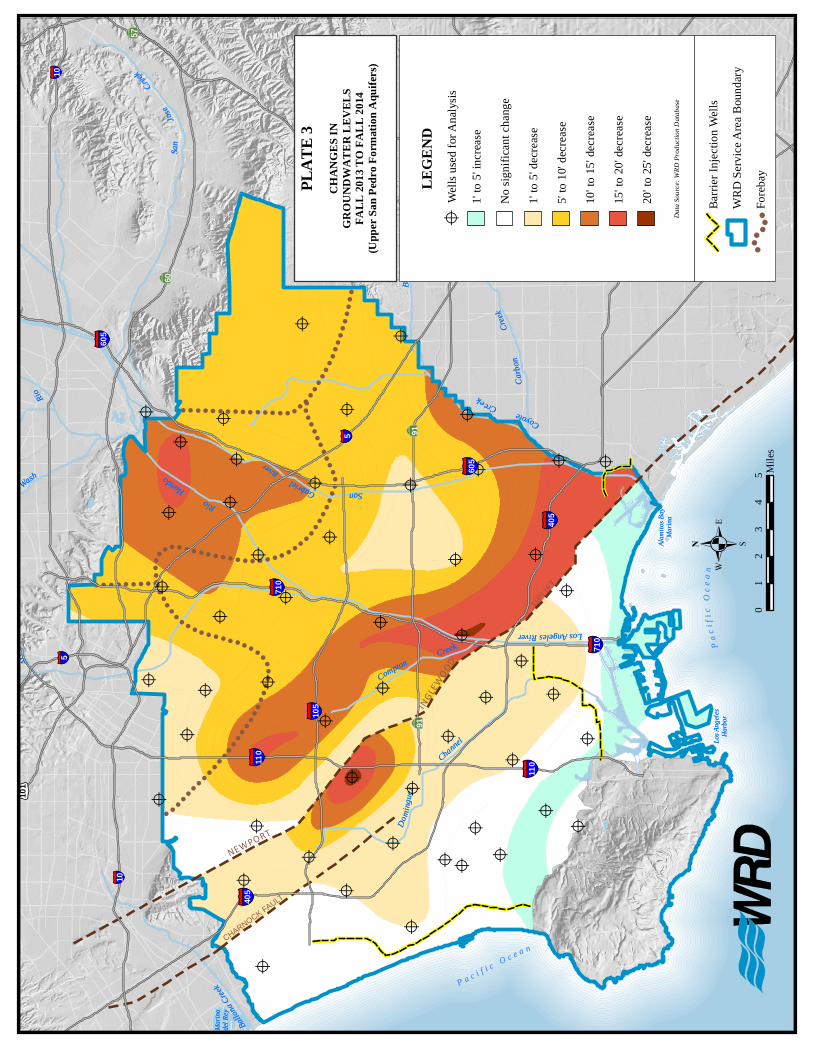
RioHondo
Brea
Cre e k
San
Jose
Creek
Arroyo
Seco
River
Rio
Hondo
CoyoteCreek
Alhambra
Wash
Ballon
a Cree
k
ComptonCreek
Carbo
nCr
eek
Domi
ngue
z
Channel
LosAngelesRiver
Marin
adel
Rey
Alami
tos Ba
yMa
rina
Los A
ngele
sHa
rbor
P a c i f i c O c e a n
Paci
fic
Oce
a n
SanGabriel
! ! ! ! ! ! ! ! !
!! ! ! ! ! ! ! ! ! ! ! ! ! ! ! !!!
!!
!!
!!
!!
!!
!!!!!!
!!
!!!
!!!
!! ! ! ! ! !
!!!
!!!
!!
!!
!!
!!!!!!!!!
!!!!
!!
!!!
!!
!!
!!!
!!!
!!!
!!
!!
!!!
!!!!!!!!!!!!!!!!!!!!!
!!
!!
!
RioHondo
Brea
Cre e k
San
Jose
Creek
Arroyo
Seco
River
Rio
Hondo
CoyoteCreek
Alhambra
Wash
Ballon
a Cree
k
ComptonCreek
Carbo
nCr
eek
Domi
ngue
z
Channel
LosAngelesRiver
Marin
adel
Rey
Alami
tos Ba
yMa
rina
Los A
ngele
sHa
rbor
P a c i f i c O c e a n
Paci
fic
Oce
a n
SanGabriel
INGLEWOOD
UPLIFT
NEWPORT
?
?
?
?
?
?
??
?
?
?
?
?
?
?
?
??
?
?
?
?
??
?
?
?
?
?
?
?
?
?
?
?
?
?
?
?
?
?
?
?
? ?
?
?
?
?
?
?
?
??
§̈ ¦710
§̈ ¦710
§̈ ¦5
§̈ ¦405
§̈ ¦110
§̈ ¦10
§̈ ¦105
§̈ ¦605
§̈ ¦10
ÄÅ57
ÄÅ91
ÄÅ60
£ ¤101
§̈ ¦110
§̈ ¦405
§̈ ¦605
ÄÅ91
§̈ ¦5 §̈ ¦5
CHARNOCK F
AULT
.0
51
23
4M
iles
CHAN
GES I
NGR
OUND
WAT
ER L
EVEL
SFA
LL 20
13 T
O FA
LL 20
14(U
pper
San P
edro
Form
ation
Aqu
ifers)
PLAT
E 3
LEGE
ND
Data
Sourc
e: WR
D Pr
oduc
tion D
ataba
se
?W
ells
use
d f
or
An
alysi
s
1' to
5' i
ncre
ase
No
sig
nif
ican
t ch
ang
e
1' to
5' d
ecr
eas
e
5' to
10' d
ecre
ase
10
' to
15
' decre
ase
15
' to
20
' decre
ase
20
' to
25
' decre
ase
Barr
ier
Inje
cti
on
Wel
ls
WR
D S
erv
ice
Are
a B
ou
nd
ary
!
!!!
!
!
Fo
reb
ay


Water Replenishment Districtof Southern California
Engineering Surveyand Report
Water Replenishment District of Southern California
Engineering Survey and Report 2015
2015March 5, 2015Updated:May 1, 2015
Water Replenishment Districtof Southern California4040 Paramount BoulevardLakewood, CA 90712(562) 921-5521 phone(562) 921-6101 faxwww.wrd.org
C A L I F O R N I A ’ S G R O U N D W A T E R U P D A T E 2 0 0 3 145
Ch
ap
te
r 7
| Ce
nt
ra
l Co
as
t H
yd
ro
l og
i c R
eg
i on
South Coast Hydrologic Region
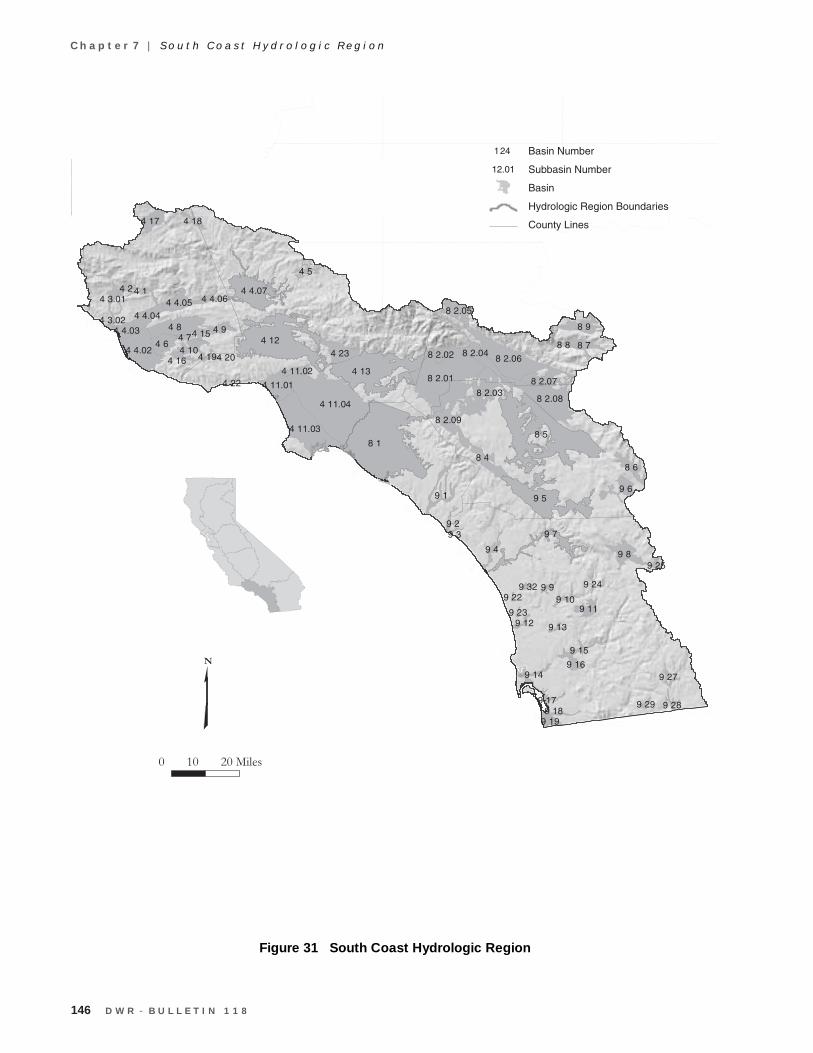
146 D W R - B U L L E T I N 1 1 8
C h a p t e r 7 | S o u t h C o a s t H y d r o l o g i c R e g i o n
Figure 31 South Coast Hydrologic Region
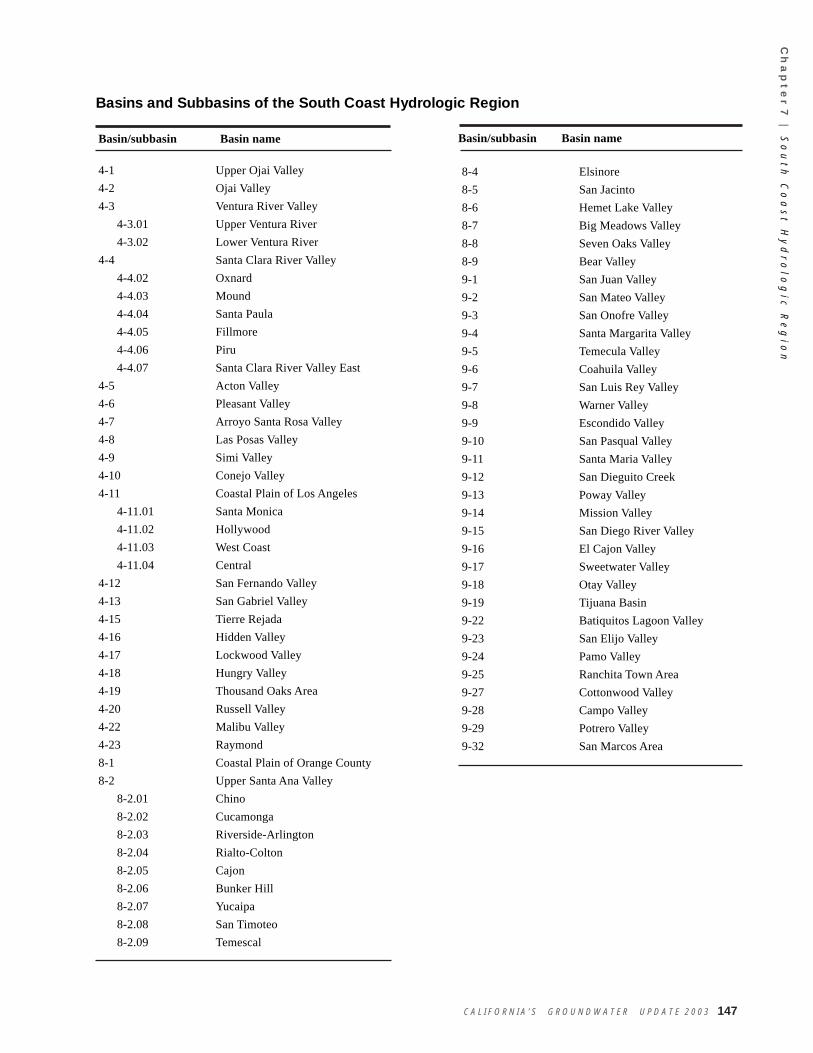
C A L I F O R N I A ’ S G R O U N D W A T E R U P D A T E 2 0 0 3 147
Ch
ap
te
r 7
| So
ut
h C
oa
st
Hy
dr
ol o
gi c
Re
gi o
n
8-4 Elsinore8-5 San Jacinto8-6 Hemet Lake Valley8-7 Big Meadows Valley8-8 Seven Oaks Valley8-9 Bear Valley9-1 San Juan Valley9-2 San Mateo Valley9-3 San Onofre Valley9-4 Santa Margarita Valley9-5 Temecula Valley9-6 Coahuila Valley9-7 San Luis Rey Valley9-8 Warner Valley9-9 Escondido Valley9-10 San Pasqual Valley9-11 Santa Maria Valley9-12 San Dieguito Creek9-13 Poway Valley9-14 Mission Valley9-15 San Diego River Valley9-16 El Cajon Valley9-17 Sweetwater Valley9-18 Otay Valley9-19 Tijuana Basin9-22 Batiquitos Lagoon Valley9-23 San Elijo Valley9-24 Pamo Valley9-25 Ranchita Town Area9-27 Cottonwood Valley9-28 Campo Valley9-29 Potrero Valley9-32 San Marcos Area
Basin/subbasin Basin name
4-1 Upper Ojai Valley4-2 Ojai Valley4-3 Ventura River Valley 4-3.01 Upper Ventura River 4-3.02 Lower Ventura River4-4 Santa Clara River Valley 4-4.02 Oxnard 4-4.03 Mound 4-4.04 Santa Paula 4-4.05 Fillmore 4-4.06 Piru 4-4.07 Santa Clara River Valley East4-5 Acton Valley4-6 Pleasant Valley4-7 Arroyo Santa Rosa Valley4-8 Las Posas Valley4-9 Simi Valley4-10 Conejo Valley4-11 Coastal Plain of Los Angeles 4-11.01 Santa Monica 4-11.02 Hollywood 4-11.03 West Coast 4-11.04 Central4-12 San Fernando Valley4-13 San Gabriel Valley4-15 Tierre Rejada4-16 Hidden Valley4-17 Lockwood Valley4-18 Hungry Valley4-19 Thousand Oaks Area4-20 Russell Valley4-22 Malibu Valley4-23 Raymond8-1 Coastal Plain of Orange County8-2 Upper Santa Ana Valley 8-2.01 Chino 8-2.02 Cucamonga 8-2.03 Riverside-Arlington 8-2.04 Rialto-Colton 8-2.05 Cajon 8-2.06 Bunker Hill 8-2.07 Yucaipa 8-2.08 San Timoteo 8-2.09 Temescal
Basins and Subbasins of the South Coast Hydrologic Region
Basin/subbasin Basin name
148 D W R - B U L L E T I N 1 1 8
C h a p t e r 7 | S o u t h C o a s t H y d r o l o g i c R e g i o n
Description of the RegionThe South Coast HR covers approximately 6.78 million acres (10,600 square miles) of the southernCalifornia watershed that drains to the Pacific Ocean (Figure 31). The HR is bounded on the west by thePacific Ocean and the watershed divide near the Ventura-Santa Barbara County line. The northern boundarycorresponds to the crest of the Transverse Ranges through the San Gabriel and San Bernardino mountains.The eastern boundary lies along the crest of the San Jacinto Mountains and low-lying hills of the PeninsularRange that form a drainage boundary with the Colorado River HR. The southern boundary is theinternational boundary with the Republic of Mexico. Significant geographic features include the coastalplain, the central Transverse Ranges, the Peninsular Ranges, and the San Fernando, San Gabriel, Santa AnaRiver, and Santa Clara River valleys.
The South Coast HR includes all of Orange County, most of San Diego and Los Angeles Counties, parts ofRiverside, San Bernardino, and Ventura counties, and a small amount of Kern and Santa Barbara Counties.This HR is divided into Los Angeles, Santa Ana and San Diego subregions, RWQCBs 4, 8, and 9respectively. Groundwater basins are numbered according to these subregions. Basin numbers in the LosAngeles subregion are preceded by a 4, in Santa Ana by an 8, and in San Diego by a 9. The Los Angelessubregion contains the Ventura, Santa Clara, Los Angeles, and San Gabriel River drainages, Santa Anaencompasses the Santa Ana River drainage, and San Diego includes the Santa Maria River, San Luis ReyRiver and the San Diego River and other drainage systems.
According to 2000 census data, about 17 million people live within the boundaries of the South Coast HR,approximately 50 percent of the population of California. Because this HR amounts to only about 7 percentof the surface area of the State, this has the highest population density of any HR in California (DWR 1998).Major population centers include the metropolitan areas surrounding Ventura, Los Angeles, San Diego, SanBernardino, and Riverside.
The South Coast HR has 56 delineated groundwater basins. Twenty-one basins are in subregion 4 (LosAngeles), eight basins in subregion 8 (Santa Ana), and 27 basins in subregion 9 (San Diego).
The Los Angeles subregion overlies 21 groundwater basins and encompasses most of Ventura and LosAngeles counties. Within this subregion, the Ventura River Valley, Santa Clara River Valley, and CoastalPlain of Los Angeles basins are divided into subbasins. The basins in the Los Angeles subregion underlie1.01 million acres (1,580 square miles) or about 40 percent of the total surface area of the subregion.
The Santa Ana subregion overlies eight groundwater basins and encompasses most of Orange County andparts of Los Angeles, San Bernardino, and Riverside counties. The Upper Santa Ana Valley GroundwaterBasin is divided into nine subbasins. Groundwater basins underlie 979,000 acres (1,520 square miles) orabout 54 percent of the Santa Ana subregion.
The San Diego subregion overlies 27 groundwater basins, encompasses most of San Diego County, andincludes parts of Orange and Riverside counties. Groundwater basins underlie about 277,000 acres(433 square miles) or about 11 percent of the surface of the San Diego subregion.
Overall, groundwater basins underlie about 2.27 million acres (3,530 square miles) or about 33 percent of theSouth Coast HR.
C A L I F O R N I A ’ S G R O U N D W A T E R U P D A T E 2 0 0 3 149
Ch
ap
te
r 7
| So
ut
h C
oa
st
Hy
dr
ol o
gi c
Re
gi o
n
Groundwater DevelopmentGroundwater has been used in the South Coast HR for well over 100 years. High demand and use ofgroundwater in Southern California has given rise to many disputes over management and pumping rights,with the resolution of these cases playing a large role in the establishment and clarification of water rightslaw in California. Raymond Groundwater Basin, located in this HR, was the first adjudicated basin in theState. Of the 16 adjudicated basins in California, 11 are in the South Coast HR. Groundwater provides about23 percent of water demand in normal years and about 29 percent in drought years (DWR 1998).
Groundwater is found in unconfined alluvial aquifers in most of the basins of the San Diego subregion andthe inland basins of the Santa Ana and Los Angeles subregions. In some larger basins, typified by thoseunderlying the coastal plain, groundwater occurs in multiple aquifers separated by aquitards that createconfined groundwater conditions. Basins range in depth from tens or hundreds of feet in smaller basins, tothousands of feet in larger basins. The thickness of aquifers varies from tens to hundreds of feet. Well yieldsvary in this HR depending on aquifer characteristics and well location, size, and use. Some aquifers arecapable of yielding thousands of gallons per minute to municipal wells.
Conjunctive UseConjunctive use of surface water and groundwater is a long-standing practice in the region. At present, muchof the potable water used in Southern California is imported from the Colorado River and from sources in theeastern Sierra and Northern California. Several reservoirs are operated primarily for the purpose of storingsurface water for domestic and irrigation use, but groundwater basins are also recharged from the outflow ofsome reservoirs. The concept is to maintain streamflow over a longer period of time than would occur withoutregulated flow and thus provide for increased recharge of groundwater basins. Most of the larger basins in thisHR are highly managed, with many conjunctive use projects being developed to optimize water supply.
Coastal basins in this HR are prone to intrusion of seawater. Seawater intrusion barriers are maintainedalong the Los Angeles and Orange County sections of the coastal plain. In Orange County, recycled water isinjected into the ground to form a mound of groundwater between the coast and the main groundwater basin.In Los Angeles County, imported and recycled water is injected to maintain a seawater intrusion barrier.
Groundwater QualityGroundwater in basins of the Los Angeles subregion is mainly calcium sulfate and calcium bicarbonate incharacter. Nitrate content is elevated in some parts of the subregion. Volatile organic compounds (VOCs)have created groundwater impairments in some of the industrialized portions of the region. The San GabrielValley and San Fernando Valley groundwater basins both have multiple sites of contamination from VOCs.The main constituents in the contamination plumes are trichloroethylene (TCE) and tetrachloroethylene(PCE). Some of the locations have been declared federal Superfund sites. Contamination plumes containinghigh concentrations of TCE and PCE also occur in the Bunker Hill Subbasin of the Upper Santa Ana ValleyGroundwater Basin. Some of these plumes are also designated as Superfund sites. Perchlorate is emergingas an important contaminant in several areas in the South Coast HR.
Groundwater in basins of the Santa Ana subregion is primarily calcium and sodium bicarbonate in character.Local impairments from excess nitrate or VOCs have been recognized. Groundwater and surface water inthe Chino Subbasin of the Santa Ana River Valley Groundwater Basin have elevated nitrate concentrations,partly derived from a large dairy industry in that area. In Orange County, water from the Santa Ana Riverprovides a large part of the groundwater replenishment. Wetlands maintained along the Santa Ana River nearthe boundary of the Upper Santa Ana River and Orange County Groundwater Basins provide effectiveremoval of nitrate from surface water, while maintaining critical habitat for endangered species.
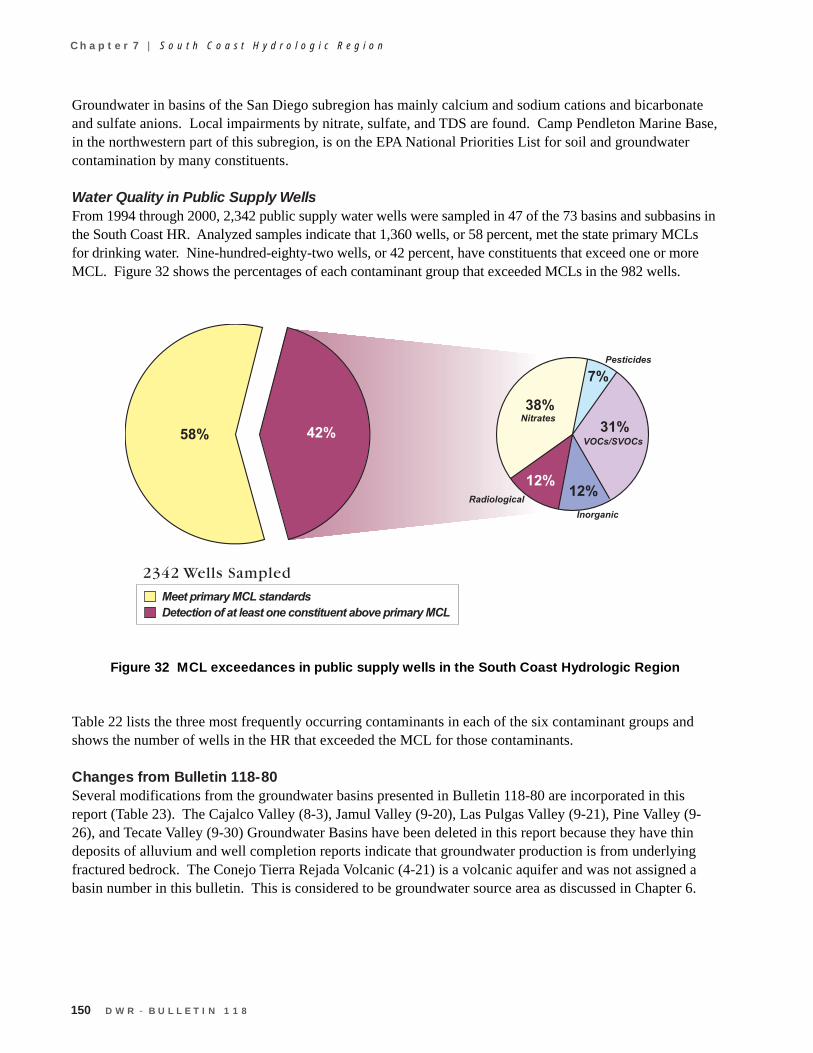
150 D W R - B U L L E T I N 1 1 8
C h a p t e r 7 | S o u t h C o a s t H y d r o l o g i c R e g i o n
Groundwater in basins of the San Diego subregion has mainly calcium and sodium cations and bicarbonateand sulfate anions. Local impairments by nitrate, sulfate, and TDS are found. Camp Pendleton Marine Base,in the northwestern part of this subregion, is on the EPA National Priorities List for soil and groundwatercontamination by many constituents.
Water Quality in Public Supply WellsFrom 1994 through 2000, 2,342 public supply water wells were sampled in 47 of the 73 basins and subbasins inthe South Coast HR. Analyzed samples indicate that 1,360 wells, or 58 percent, met the state primary MCLsfor drinking water. Nine-hundred-eighty-two wells, or 42 percent, have constituents that exceed one or moreMCL. Figure 32 shows the percentages of each contaminant group that exceeded MCLs in the 982 wells.
Figure 32 MCL exceedances in public supply wells in the South Coast Hydrologic Region
Table 22 lists the three most frequently occurring contaminants in each of the six contaminant groups andshows the number of wells in the HR that exceeded the MCL for those contaminants.
Changes from Bulletin 118-80Several modifications from the groundwater basins presented in Bulletin 118-80 are incorporated in thisreport (Table 23). The Cajalco Valley (8-3), Jamul Valley (9-20), Las Pulgas Valley (9-21), Pine Valley (9-26), and Tecate Valley (9-30) Groundwater Basins have been deleted in this report because they have thindeposits of alluvium and well completion reports indicate that groundwater production is from underlyingfractured bedrock. The Conejo Tierra Rejada Volcanic (4-21) is a volcanic aquifer and was not assigned abasin number in this bulletin. This is considered to be groundwater source area as discussed in Chapter 6.
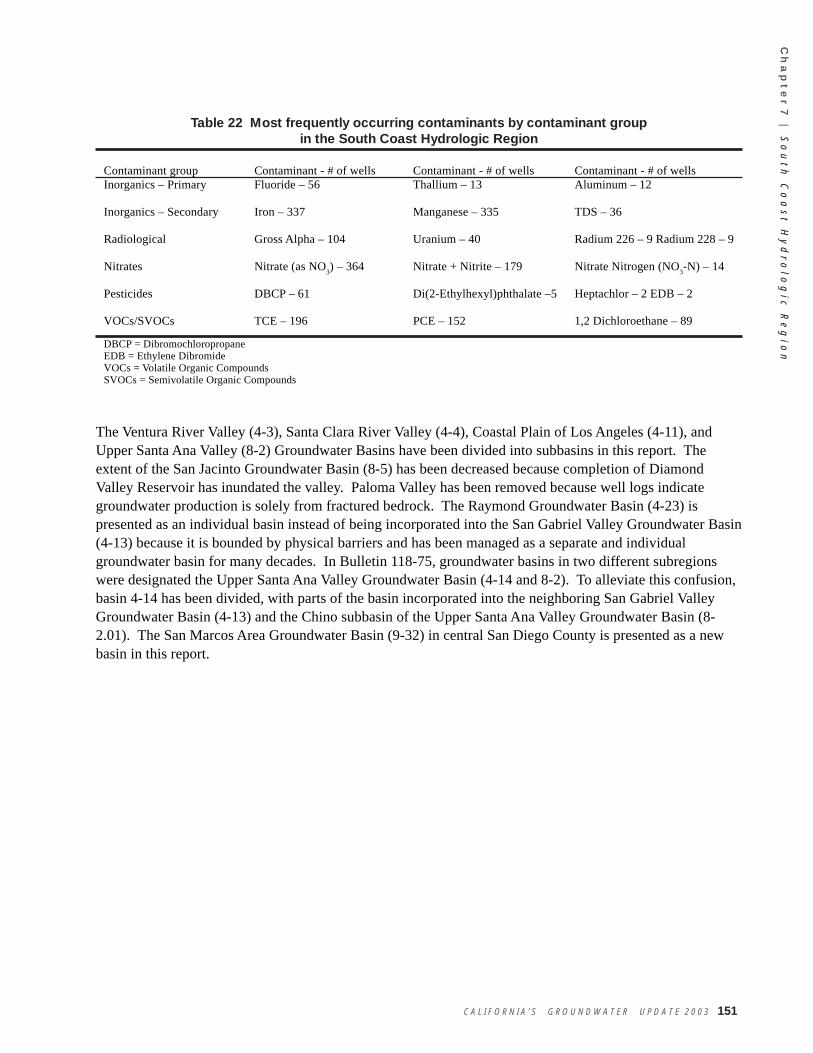
C A L I F O R N I A ’ S G R O U N D W A T E R U P D A T E 2 0 0 3 151
Ch
ap
te
r 7
| So
ut
h C
oa
st
Hy
dr
ol o
gi c
Re
gi o
n
Table 22 Most frequently occurring contaminants by contaminant groupin the South Coast Hydrologic Region
Contaminant group Contaminant - # of wells Contaminant - # of wells Contaminant - # of wellsInorganics – Primary Fluoride – 56 Thallium – 13 Aluminum – 12
Inorganics – Secondary Iron – 337 Manganese – 335 TDS – 36
Radiological Gross Alpha – 104 Uranium – 40 Radium 226 – 9 Radium 228 – 9
Nitrates Nitrate (as NO3) – 364 Nitrate + Nitrite – 179 Nitrate Nitrogen (NO3-N) – 14
Pesticides DBCP – 61 Di(2-Ethylhexyl)phthalate –5 Heptachlor – 2 EDB – 2
VOCs/SVOCs TCE – 196 PCE – 152 1,2 Dichloroethane – 89
DBCP = DibromochloropropaneEDB = Ethylene DibromideVOCs = Volatile Organic CompoundsSVOCs = Semivolatile Organic Compounds
The Ventura River Valley (4-3), Santa Clara River Valley (4-4), Coastal Plain of Los Angeles (4-11), andUpper Santa Ana Valley (8-2) Groundwater Basins have been divided into subbasins in this report. Theextent of the San Jacinto Groundwater Basin (8-5) has been decreased because completion of DiamondValley Reservoir has inundated the valley. Paloma Valley has been removed because well logs indicategroundwater production is solely from fractured bedrock. The Raymond Groundwater Basin (4-23) ispresented as an individual basin instead of being incorporated into the San Gabriel Valley Groundwater Basin(4-13) because it is bounded by physical barriers and has been managed as a separate and individualgroundwater basin for many decades. In Bulletin 118-75, groundwater basins in two different subregionswere designated the Upper Santa Ana Valley Groundwater Basin (4-14 and 8-2). To alleviate this confusion,basin 4-14 has been divided, with parts of the basin incorporated into the neighboring San Gabriel ValleyGroundwater Basin (4-13) and the Chino subbasin of the Upper Santa Ana Valley Groundwater Basin (8-2.01). The San Marcos Area Groundwater Basin (9-32) in central San Diego County is presented as a newbasin in this report.
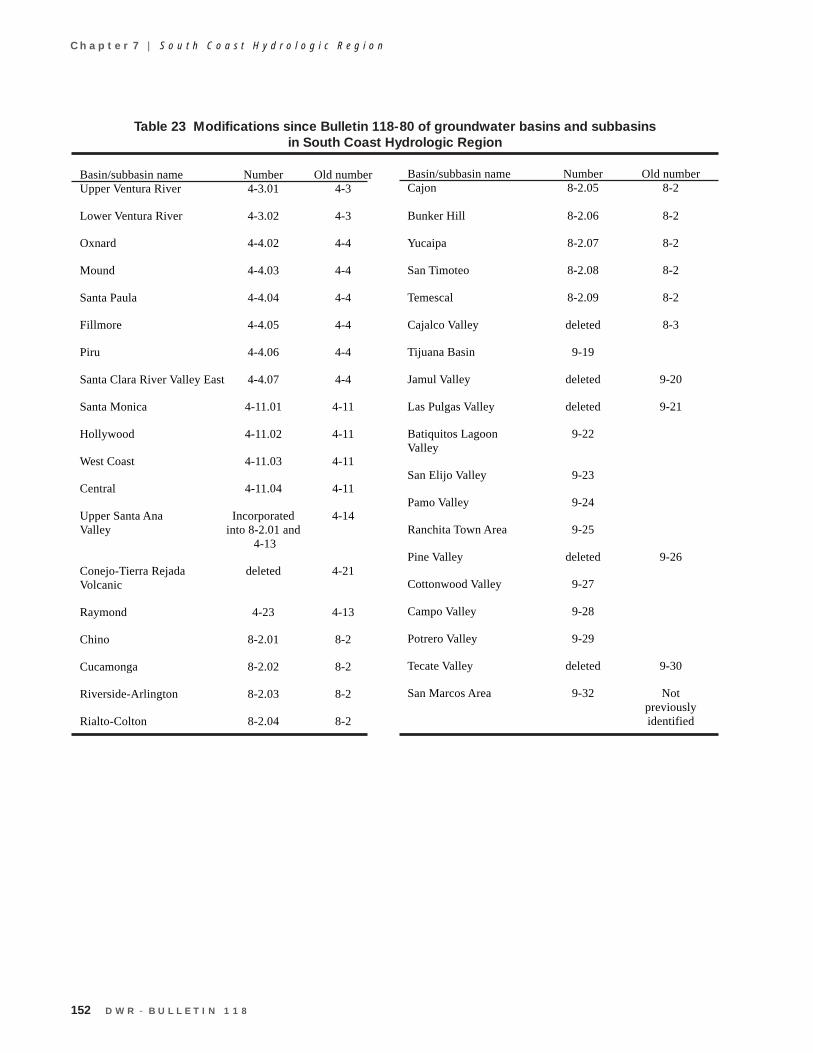
152 D W R - B U L L E T I N 1 1 8
C h a p t e r 7 | S o u t h C o a s t H y d r o l o g i c R e g i o n
Table 23 Modifications since Bulletin 118-80 of groundwater basins and subbasinsin South Coast Hydrologic Region
Basin/subbasin name Number Old numberUpper Ventura River 4-3.01 4-3
Lower Ventura River 4-3.02 4-3
Oxnard 4-4.02 4-4
Mound 4-4.03 4-4
Santa Paula 4-4.04 4-4
Fillmore 4-4.05 4-4
Piru 4-4.06 4-4
Santa Clara River Valley East 4-4.07 4-4
Santa Monica 4-11.01 4-11
Hollywood 4-11.02 4-11
West Coast 4-11.03 4-11
Central 4-11.04 4-11
Upper Santa Ana Incorporated 4-14Valley into 8-2.01 and
4-13
Conejo-Tierra Rejada deleted 4-21Volcanic
Raymond 4-23 4-13
Chino 8-2.01 8-2
Cucamonga 8-2.02 8-2
Riverside-Arlington 8-2.03 8-2
Rialto-Colton 8-2.04 8-2
Basin/subbasin name Number Old numberCajon 8-2.05 8-2
Bunker Hill 8-2.06 8-2
Yucaipa 8-2.07 8-2
San Timoteo 8-2.08 8-2
Temescal 8-2.09 8-2
Cajalco Valley deleted 8-3
Tijuana Basin 9-19
Jamul Valley deleted 9-20
Las Pulgas Valley deleted 9-21
Batiquitos Lagoon 9-22Valley
San Elijo Valley 9-23
Pamo Valley 9-24
Ranchita Town Area 9-25
Pine Valley deleted 9-26
Cottonwood Valley 9-27
Campo Valley 9-28
Potrero Valley 9-29
Tecate Valley deleted 9-30
San Marcos Area 9-32 Notpreviouslyidentified
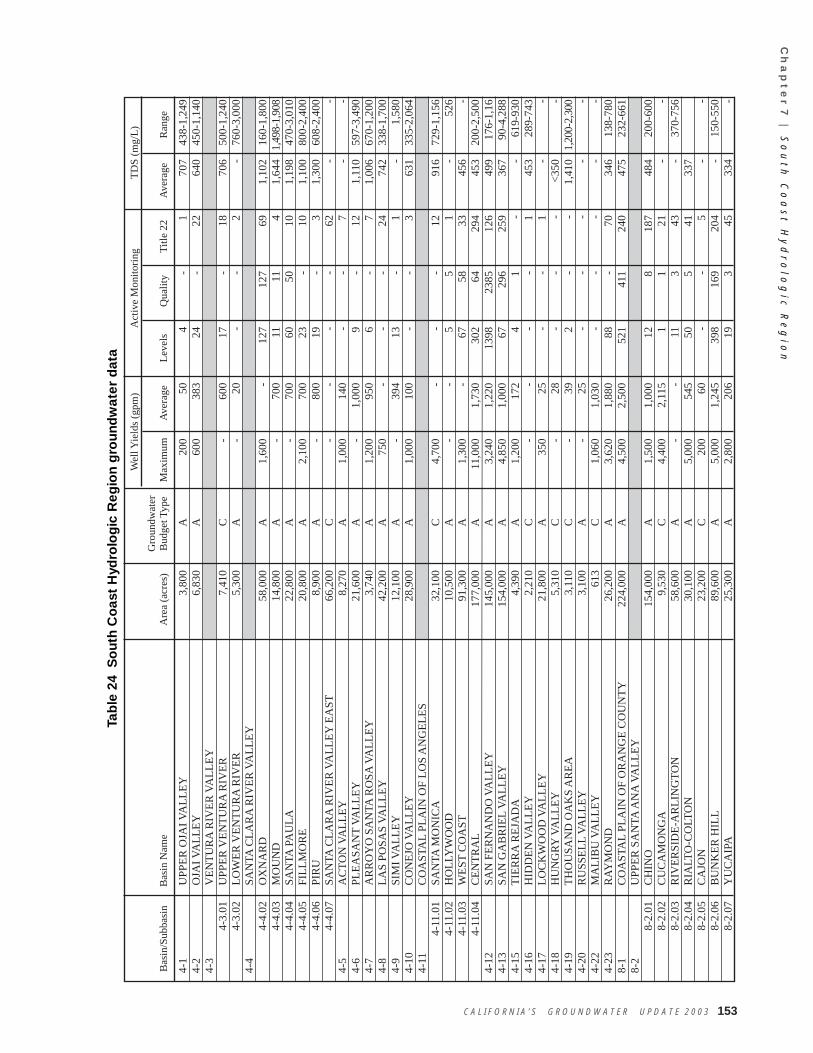
C A L I F O R N I A ’ S G R O U N D W A T E R U P D A T E 2 0 0 3 153
Ch
ap
te
r 7
| So
ut
h C
oa
st
Hy
dr
ol o
gi c
Re
gi o
n
Wel
l Yie
lds (
gpm
)A
ctiv
e M
onito
ring
TDS
(mg/
L)G
roun
dwat
erB
asin
/Sub
basi
nB
asin
Nam
eA
rea
(acr
es)
Bud
get T
ype
Max
imum
Ave
rage
Leve
ls Q
ualit
yTi
tle 2
2Av
erag
eR
ange
Tab
le 2
4 S
ou
th C
oas
t H
ydro
log
ic R
egio
n g
rou
nd
wat
er d
ata
4-1
UPP
ER O
JAI V
ALL
EY3,
800
A20
050
4 -
1 7
0743
8-1,
249
4-2
OJA
I VA
LLEY
6,83
0A
600
383
24 -
22 6
4045
0-1,
140
4-3
VEN
TUR
A R
IVER
VA
LLEY
4-3.
01U
PPER
VEN
TUR
A R
IVER
7,41
0C
-60
017
-18
706
500-
1,24
04-
3.02
LOW
ER V
ENTU
RA
RIV
ER5,
300
A -
20 -
-2
-76
0-3,
000
4-4
SAN
TA C
LAR
A R
IVER
VA
LLEY
4-4.
02O
XN
AR
D58
,000
A1,
600
-12
712
769
1,1
0216
0-1,
800
4-4.
03M
OU
ND
14,8
00A
-70
011
114
1,6
441,
498-
1,90
84-
4.04
SAN
TA P
AU
LA22
,800
A -
700
6050
10 1
,198
470-
3,01
04-
4.05
FILL
MO
RE
20,8
00A
2,10
070
023
-10
1,1
0080
0-2,
400
4-4.
06PI
RU
8,90
0A
-80
019
-3
1,3
0060
8-2,
400
4-4.
07SA
NTA
CLA
RA
RIV
ER V
ALL
EY E
AST
66,2
00C
- -
- -
62 -
-4-
5A
CTO
N V
ALL
EY8,
270
A1,
000
140
- -
7 -
-4-
6PL
EASA
NT
VALL
EY21
,600
A -
1,00
09
-12
1,1
1059
7-3,
490
4-7
AR
RO
YO
SA
NTA
RO
SA V
ALL
EY3,
740
A1,
200
950
6 -
7 1
,006
670-
1,20
04-
8LA
S PO
SAS
VALL
EY42
,200
A75
0 -
- -
24 7
4233
8-1,
700
4-9
SIM
I VA
LLEY
12,1
00A
-39
413
-1
-1,
580
4-10
CO
NEJ
O V
ALL
EY28
,900
A1,
000
100
- -
3 6
3133
5-2,
064
4-11
CO
AST
AL
PLA
IN O
F LO
S A
NG
ELES
4-11
.01
SAN
TA M
ON
ICA
32,1
00C
4,70
0 -
- -
12 9
1672
9-1,
156
4-11
.02
HO
LLY
WO
OD
10,5
00A
- -
55
1 -
526
4-11
.03
WES
T C
OA
ST91
,300
A1,
300
-67
5833
456
-4-
11.0
4C
ENTR
AL
177,
000
A11
,000
1,73
030
264
294
453
200-
2,50
04-
12SA
N F
ERN
AN
DO
VA
LLEY
145,
000
A3,
240
1,22
013
9823
8512
6 4
9917
6-1,
164-
13SA
N G
AB
RIE
L VA
LLEY
154,
000
A4,
850
1,00
067
296
259
367
90-4
,288
4-15
TIER
RA
REJ
AD
A4,
390
A1,
200
172
41
- -
619-
930
4-16
HID
DEN
VA
LLEY
2,21
0C
- -
- -
1 4
5328
9-74
34-
17LO
CK
WO
OD
VA
LLEY
21,8
00A
350
25 -
-1
- -
4-18
HU
NG
RY V
ALL
EY5,
310
C -
28 -
- -
<35
0 -
4-19
THO
USA
ND
OA
KS
AR
EA3,
110
C -
392
- -
1,4
101,
200-
2,30
04-
20R
USS
ELL
VALL
EY3,
100
A -
25 -
- -
- -
4-22
MA
LIB
U V
ALL
EY61
3C
1,06
01,
030
- -
- -
-4-
23R
AYM
ON
D26
,200
A3,
620
1,88
088
-70
346
138-
780
8-1
CO
AST
AL
PLA
IN O
F O
RA
NG
E C
OU
NTY
224,
000
A4,
500
2,50
052
141
124
0 4
7523
2-66
18-
2U
PPER
SA
NTA
AN
A V
ALL
EY8-
2.01
CH
INO
154,
000
A1,
500
1,00
012
818
7 4
8420
0-60
08-
2.02
CU
CA
MO
NG
A9,
530
C4,
400
2,11
51
121
- -
8-2.
03R
IVER
SID
E-A
RLI
NG
TON
58,6
00A
- -
113
43 -
370-
756
8-2.
04R
IALT
O-C
OLT
ON
30,1
00A
5,00
054
550
541
337
8-2.
05C
AJO
N23
,200
C20
060
- -
5 -
-8-
2.06
BU
NK
ER H
ILL
89,6
00A
5,00
01,
245
398
169
204
-15
0-55
08-
2.07
YU
CA
IPA
25,3
00A
2,80
020
619
345
334
-
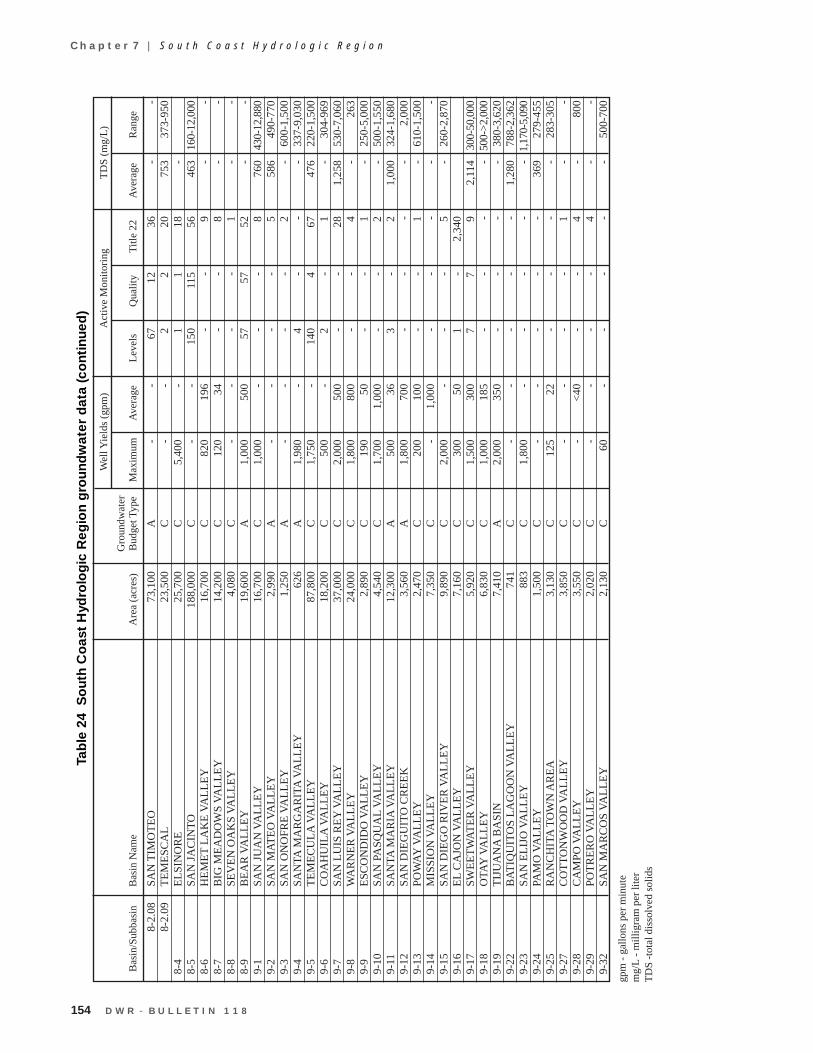
154 D W R - B U L L E T I N 1 1 8
C h a p t e r 7 | S o u t h C o a s t H y d r o l o g i c R e g i o n
8-2.
08SA
N T
IMO
TEO
73,1
00A
- -
6712
36 -
-8-
2.09
TEM
ESC
AL
23,5
00C
- -
22
20 7
5337
3-95
08-
4EL
SIN
OR
E25
,700
C5,
400
-1
118
-8-
5SA
N JA
CIN
TO18
8,00
0C
- -
150
115
56 4
6316
0-12
,000
8-6
HEM
ET L
AK
E VA
LLEY
16,7
00C
820
196
- -
9 -
-8-
7B
IG M
EAD
OW
S VA
LLEY
14,2
00C
120
34 -
-8
- -
8-8
SEV
EN O
AK
S VA
LLEY
4,08
0C
- -
- -
1 -
-8-
9B
EAR
VA
LLEY
19,6
00A
1,00
050
057
5752
- -
9-1
SAN
JUA
N V
ALL
EY16
,700
C1,
000
- -
-8
760
430-
12,8
809-
2SA
N M
ATEO
VA
LLEY
2,99
0A
- -
- -
5 5
8649
0-77
09-
3SA
N O
NO
FRE
VALL
EY1,
250
A -
- -
-2
-60
0-1,
500
9-4
SAN
TA M
AR
GA
RIT
A V
ALL
EY62
6A
1,98
0 -
4 -
- -
337-
9,03
09-
5TE
MEC
ULA
VA
LLEY
87,8
00C
1,75
0 -
140
467
476
220-
1,50
09-
6C
OA
HU
ILA
VA
LLEY
18,2
00C
500
-2
-1
-30
4-96
99-
7SA
N L
UIS
REY
VA
LLEY
37,0
00C
2,00
050
0 -
-28
1,2
5853
0-7,
060
9-8
WA
RN
ER V
ALL
EY24
,000
C1,
800
800
- -
4 -
263
9-9
ESC
ON
DID
O V
ALL
EY2,
890
C19
050
- -
1 -
250-
5,00
09-
10SA
N P
ASQ
UA
L VA
LLEY
4,54
0C
1,70
01,
000
- -
2 -
500-
1,55
09-
11SA
NTA
MA
RIA
VA
LLEY
12,3
00A
500
363
-2
1,0
0032
4-1,
680
9-12
SAN
DIE
GU
ITO
CR
EEK
3,56
0A
1,80
070
0 -
- -
-2,
000
9-13
POW
AY V
ALL
EY2,
470
C20
010
0 -
-1
-61
0-1,
500
9-14
MIS
SIO
N V
ALL
EY7,
350
C -
1,00
0 -
- -
- -
9-15
SAN
DIE
GO
RIV
ER V
ALL
EY9,
890
C2,
000
- -
-5
-26
0-2,
870
9-16
EL C
AJO
N V
ALL
EY7,
160
C30
050
1 -
2,34
09-
17SW
EETW
ATER
VA
LLEY
5,92
0C
1,50
030
07
79
2,1
1430
0-50
,000
9-18
OTA
Y V
ALL
EY6,
830
C1,
000
185
- -
- -
500-
>2,0
009-
19TI
JUA
NA
BA
SIN
7,41
0A
2,00
035
0 -
- -
-38
0-3,
620
9-22
BAT
IQU
ITO
S LA
GO
ON
VA
LLEY
741
C -
- -
- -
1,2
8078
8-2,
362
9-23
SAN
ELI
JO V
ALL
EY88
3C
1,80
0 -
- -
- -
1,17
0-5,
090
9-24
PAM
O V
ALL
EY1,
500
C -
- -
- -
369
279-
455
9-25
RA
NC
HIT
A T
OW
N A
REA
3,13
0C
125
22 -
- -
-28
3-30
59-
27C
OTT
ON
WO
OD
VA
LLEY
3,85
0C
- -
- -
1 -
-9-
28C
AM
PO V
ALL
EY3,
550
C -
<40
- -
4 -
800
9-29
POTR
ERO
VA
LLEY
2,02
0C
- -
- -
4 -
-9-
32SA
N M
AR
CO
S VA
LLEY
2,13
0C
60 -
- -
- -
500-
700
gpm
- ga
llons
per
min
ute
mg/
L - m
illig
ram
per
lite
rTD
S -to
tal d
isso
lved
solid
s
Wel
l Yie
lds (
gpm
)A
ctiv
e M
onito
ring
TDS
(mg/
L)G
roun
dwat
erB
asin
/Sub
basi
nB
asin
Nam
eA
rea
(acr
es)
Bud
get T
ype
Max
imum
Ave
rage
Leve
ls Q
ualit
yTi
tle 2
2Av
erag
eR
ange
Tab
le 2
4 S
ou
th C
oas
t H
ydro
log
ic R
egio
n g
rou
nd
wat
er d
ata
(co
nti
nu
ed)
Hydrologic Region South Coast California’s Groundwater Thousand Oaks Area Groundwater Basin Bulletin 118
Last update 2/27/04
Thousand Oaks Area Groundwater Basin
• Groundwater Basin Number: 4-19 • County: Ventura, Los Angeles • Surface Area: 3,110 acres (4.9 square miles) Basin Boundaries and Hydrology This groundwater basin underlies a small valley between Lake Sherwood and Thousand Oaks in southeastern Ventura County and western Los Angeles County. The basin is bounded by semi-permeable rocks of the Santa Monica Mountains (CSWRB 1953; DWR 1959). The valley is drained by Conejo Creek and Triunfo Canyon. Average annual precipitation ranges from 16 to 20 inches. Hydrogeologic Information Water Bearing Formations Groundwater is found mainly in alluvium, although it is also produced from other older rock units (VCPWA 2002). Groundwater in the basin is unconfined in the Quaternary age alluvium that fills Triunfo Canyon and underlying Conejo Creek. The Miocene age Modelo and Topanga Formations contain productive sandstone beds, and some groundwater is produced from fractures in the Modelo, Conejo, and Topanga Formations (CSWRB 1953; DWR 1959). Restrictive Structures Water levels indicate that a groundwater divide exists near Thousand Oaks coincident with a surface drainage divide (CSWRB 1953). Recharge Areas Recharge to the basin is by percolation of precipitation to the valley floor and stream flow. Groundwater Level Trends Hydrographs show that water levels remained fairly stable during 1979 through 1999. Seasonal change in water level ranges from about 10 to 20 feet. Groundwater moves northwest near Thousand Oaks and southward near Triunfo Canyon (CSWRB 1953). Groundwater Storage Groundwater Storage Capacity. The total storage capacity is estimated at 130,000 af (VCPWA 2002). Groundwater in Storage. The basin is estimated to have been about 87 percent full in 1999 (Panaro 2000), or to have had about 113,000 af in storage.
Hydrologic Region South Coast California’s Groundwater Thousand Oaks Area Groundwater Basin Bulletin 118
Last update 2/27/04
Groundwater Budget (Type C) No subsurface inflow is known to occur to the basin (CSWRB 1953). Groundwater Quality Characterization. Groundwater in the basin is magnesium-calcium-sodium sulfate in character. TDS content in the basin ranges from 1,200 to 2,300 mg/L with the average at 1,410 mg/L (VCPWA 1996). Impairments. High alkalinity and hardness are prevalent in wells deeper than 100 feet, influencing taste and quality characteristics (VCPWA 1996). TDS is high in this basin Well Characteristics
Well yields (gal/min)
Municipal/Irrigation Range: Average: 39 gal/min (Panaro 2000)
Total depths (ft)
Domestic Range: Average:
Municipal/Irrigation Range: Average:
Active Monitoring Data Agency Parameter Number of wells
/measurement frequency Ventura County Public Works Agency
Groundwater levels 2
Basin Management Groundwater management:
Water agencies
Public Ventura County Public Works Agency, City of Thousand Oaks Public Works Department.
Private California Water Service Company – Westlake District, California American Water Company
References Cited California Department of Water Resources (DWR). 1959. Water Quality and Water Quality
Problems, Ventura County. Bulletin 75. Two Volumes. 195 p.
California State Water Resources Board (CSWRB). 1953. Ventura County Investigation. Bulletin 12. Two Volumes.
Panaro, D. 2000. Fox Canyon Groundwater Management Agency: Written Communication to R.R. Davis (DWR), March 21, 2000.
Ventura County Public Works Agency (VCPWA). 1996. Ventura County Groundwater Quality Assessment Report. 57 p.
. 2002. “Ventura County Groundwater Basins.” http://www.ventura.org/vcpwa/wre/wrd/pages/BASINS.htm (March 2002).
Hydrologic Region South Coast California’s Groundwater Thousand Oaks Area Groundwater Basin Bulletin 118
Last update 2/27/04
Additional References California Department of Public Works, Division of Water Resources (CDPW). 1933.
Ventura County Investigation. Bulletin 46.
. 1965. Ventura County and Upper Santa Clara River Drainage Area Land and Water Use Survey, 1961. Bulletin 122. 59 p.
California Department of Water Resources (DWR). 1975. California’s ground water. Bulletin 118. 135 p.
, Southern District. 1981. Ventura County and Upper Santa Clara River Drainage Area Land Use Study, 1980: District Report. 25 p.
Leason F. P. & Associates. 1959. Upper Ventura River Valley and Ojai Valley Sewerage Study. Pasadena, Calif.: The Associates.
Richardson, H. E., and others. 1968. Ventura River Project Extensions, Feasibility Study, Ground-Water Geology and Resources Appendix. United States Bureau of Reclamation (USBR): unnumbered Report.
Turner, J. M. 1971. Ventura County Water Resources management Study, Geohydrology of the Ventura River System. Ventura County Department of Public Works, Flood Control District: Unnumbered Report.
Errata Changes made to the basin description will be noted here.