Embed Size (px)
Citation preview
Appendix H
Noise and Vibration Technical Memorandum

Proposed Navy Base Intermodal Container Transfer Facility North Charleston, SC
Noise and Vibration Technical Memorandum
April 2017
Prepared for:
U.S. Army Corps of Engineers
Charleston District
69-A Hagood Avenue
Charleston, SC 29403
Prepared by:
Atkins North America, Inc. 5200 77 Center Drive Suite 500 Charlotte, NC 28217

iii
Contents
Page
List of Figures ............................................................................................................................................... v
List of Tables ................................................................................................................................................ v
1.0 EXISTING NOISE AND VIBRATION MEASUREMENTS ............................................................... 1
1.1 AMBIENT NOISE ................................................................................................................................ 1
1.2 RAIL NOISE AND VIBRATION ....................................................................................................... 1
1.3 NOISE OF TRAIN OPERATIONS AT ICTF .................................................................................... 3
2.0 TRAFFIC NOISE ANALYSIS .................................................................................................................... 5
2.1 TRAFFIC NOISE SCREENING PROCEDURE ............................................................................... 5
2.2 TRAFFIC NOISE SENSITIVE RECEPTORS .................................................................................. 5
2.3 TRAFFIC DATA FOR NOISE PREDICTION .................................................................................. 6
2.4 TRAFFIC NOISE MODELING METHODOLOGY ...................................................................... 22
2.5 TRAFFIC NOISE MODEL VALIDATION .................................................................................... 23
2.6 TRAFFIC NOISE PREDICTION. ..................................................................................................... 23
2.6.1 No Action Alternative ........................................................................................................ 23
2.6.2 Build Alternatives ............................................................................................................... 29
3.0 RAIL NOISE ANALYSIS .......................................................................................................................... 47
3.1 RAIL NOISE SCREENING PROCEDURE .................................................................................... 47
3.2 RAIL DATA FOR NOISE PREDICTION ....................................................................................... 47
3.3 RAIL NOISE MODELING METHODOLOGY .............................................................................. 51
3.4 CUT SECTION AND NOISE WALLS ............................................................................................ 51
3.5 RAIL NOISE CONTOURS ............................................................................................................... 52
4.0 RAIL VIBRATION ANALYSIS ............................................................................................................... 65
4.1 RAIL VIBRATION MODELING ..................................................................................................... 65
4.2 VIBRATION RECEPTORS .............................................................................................................. 66
5.0 CONSTRUCTION NOISE ANALYSIS .................................................................................................. 67
5.1 NOISE FROM CONSTRUCTION EQUIPMENT .......................................................................... 67
5.2 CONSTRUCTION NOISE AT SENSITIVE RECEIVERS ............................................................ 69
5.3 TRENCH/WALL CONSTRUCTION NOISE ................................................................................. 70
6.0 OPERATIONAL NOISE ANALYSIS ..................................................................................................... 71
6.1 NOISE FROM TRAIN OPERATIONS ............................................................................................ 71
6.2 NOISE FROM CRANE OPERATIONS .......................................................................................... 71
6.3 OTHER OPERATIONAL NOISE SOURCES ................................................................................ 71
6.4 OPERATIONAL NOISE PROPAGATION AND ATTENUATION ........................................... 72
Contents
Page
iv
7.0 ADDITIVE NOISE IMPACTS .................................................................................................................. 75
7.1 ADDITIVE NOISE IMPACT OF TRAFFIC AND TRAIN ACTIVITIES ................................... 75
7.2 ADDITIVE NOISE IMPACT OF TRAFFIC AND RIVER CENTER SITE
OPERATIONS .................................................................................................................................... 76
Contents
v
Figures
Page
H-1 Noise Monitoring Locations ................................................................................................................... 2
H-2 Sound Level Meter Installation .............................................................................................................. 3
H-3 ICTF Study Area Noise Prediction Locations - Modeled Road Segments .......................................... 7
H-3a Noise Prediction Locations at N. Rhett Ave. [Zoom-in 1] ................................................................... 8
H-3b Noise Prediction Locations at Montague Ave. [Zoom-in 2] ................................................................ 9
H-3c Noise Prediction Locations at Virginia Ave. [Zoom-in 3] .................................................................. 10
H-3d Noise Prediction Locations at Noisette Boulevard [Zoom-in 4] ........................................................ 11
H-3e Noise Prediction Locations at St. Johns Ave. (North) [Zoom-in 5] ................................................... 12
H-3f Noise Prediction Locations at Spruill Ave. and St. Johns Ave. (South) [Zoom-in 6] ....................... 13
H-3g Noise Prediction Locations at Spruill Ave. (at McMillan Ave.) [Zoom-in 7] ................................... 14
H-3h Noise Prediction Locations at Spruill Ave. and Cosgrove Ave. [Zoom-in 8] ................................... 15
H-3i Noise Prediction Locations at Spruill Ave. (North of Reynolds Ave.) [Zoom-in 9] ......................... 16
H-3j Noise Prediction Locations at Spruill Ave. (South of Reynolds Ave.) [Zoom-in 10] ....................... 17
H-3k Noise Prediction Locations at Port Drayage Road [Zoom-in 11] ...................................................... 18
H-3l Noise Prediction Locations at Spruill Ave. and Port Drayage Road [Zoom-in 12] .......................... 19
H-4 Adjusted Reference Curve for Vibration Levels of Locomotive Powered Freight ........................... 65
Tables
H-1 Traffic Volume Data for Base Year 2013 Existing Conditions .......................................................... 20
H-2 Traffic Volume Data for No-Action Alternative 2038 Conditions .................................................... 20
H-3 Traffic Volume Data for Full Build-out Design Year 2038, Alternatives 1, 3, and 4 ....................... 21
H-4 Traffic Volume Data for Full Build-out Design Year 2038, Alternative 2 ........................................ 21
H-5 Traffic Volume Data for Full Build-out Design Year 2038, Alternatives 5, 6, and 7 ....................... 22
H-6 TNM Predictions vs. Field Noise Measurements ............................................................................... 23
H-7 Traffic Noise Levels for 2038 No-Action Alternative and 2013 Existing Conditions ...................... 24
H-8 2038 Traffic Noise Levels for Alternatives 1, 3, and 4 vs No-Action Alternative ............................ 30
H-9 2038 Traffic Noise Levels for Alternative 2 vs No-Action Alternative ............................................. 35
H-10 2038 Traffic Noise Levels for Alternatives 5, 6, and 7 vs No-Action Alternative ............................ 40
H-11 Rail Operations Data for Base Year 2013 Existing Conditions ......................................................... 48
H-12 Rail Operations Data for No-Action Alternative 2038 Conditions .................................................... 48
H-13 Rail Operations Data for Full Build-out Design Year 2038, Alternatives 1 and 5 ............................ 49
H-14 Rail Operations Data for Full Build-out Design Year 2038, Alternative 2 ........................................ 49
H-15 Rail Operations Data for Full Build-out Design Year 2038, Alternatives 3 and 6 ............................ 50
H-16 Rail Operations Data for Full Build-out Design Year 2038, Alternatives 4 and 7 ............................ 50
H-17 2038 No-Action Alternative Rail Segment DNL Contour Distances ................................................ 53
H-18 2038 No-Action Alternative Rail Crossing DNL Contour Distances ................................................ 53
H-19 2038 Alternative 1 Rail Segment DNL Contour Distances ................................................................ 54
Contents
Tables, cont’d.
Page
vi
H-20 2038 Alternative 1 Rail Crossing DNL Contour Distances ................................................................ 54
H-21 2038 Alternative 2 Rail Segment DNL Contour Distances ................................................................ 55
H-22 2038 Alternative 2 Rail Crossing Noise Contour Distances ............................................................... 56
H-23 2038 Alternatives 3 Rail Segment DNL Contour Distances .............................................................. 57
H-24 2038 Alternative 3 Rail Crossing DNL Contour Distances ................................................................ 57
H-25 2038 Alternative 4 Rail Segment DNL Contour Distances ................................................................ 58
H-26 2038 Alternative 4 Rail Crossing DNL Contour Distances ................................................................ 58
H-27 2038 Alternative 5 Rail Segment DNL Contour Distances ................................................................ 59
H-28 2038 Alternative 5 Rail Crossing DNL Contour Distances ................................................................ 59
H-29 2038 Alternative 6 Rail Segment DNL Contour Distances ................................................................ 60
H-30 2038 Alternative 6 Rail Crossing DNL Contour Distances ................................................................ 61
H-31 2038 Alternative 7 Rail Segment DNL Contour Distances ................................................................ 62
H-32 2038 Alternative 7 Rail Crossing DNL Contour Distances ................................................................ 62
H-33 Vibration Receptors .............................................................................................................................. 66
H-34 Construction Equipment Noise Emission Levels and Usage Factors ................................................ 68
H-35 Distance from Construction Equipment to Noise Level of 80 dB(A) ................................................ 70
H-36 Operational Noise Source Levels ......................................................................................................... 72
vii
Introduction
This technical memorandum provides supplemental information for Chapters 3.12 and 4.12 of the EIS for
the proposed Navy Base Intermodal Container Transfer Facility (ICTF). It discusses details of the noise
and vibration analyses conducted for the assessment of the existing conditions of the affected environment
and the potential environmental impacts of the Proposed Project, No Action Alternative, and Alternatives 2
through 7.
A general discussion of the metrics used to quantify noise and vibration effects on the environment is
provided in Sections 3.12.1 and 3.12.2 of the EIS, respectively. The noise monitoring program undertaken
to establish the existing noise levels in the study area is described in Section 1.0 of the memorandum. It
also describes the field data collection of the noise and ground vibration related to freight train operations
in the study area. Sections 2.0 through 6.0 of the memorandum describe the analyses performed for traffic
noise, rail noise, rail vibration, construction noise and operational noise, respectively. Section 7.0 addresses
additive impacts of noise generated by traffic, rail, or ICTF operations in instances where two sources
contribute to the overall environment. Some materials presented in the memorandum may reiterate
provisions of the EIS Chapters 3.12 and 4.12 to provide a more complete representation of the study
methodology and results. In other cases, the results and discussions presented in EIS are simply referenced
in the memorandum to avoid unnecessary duplication.

Introduction
viii
This page intentionally left blank.
1
1.0 EXISTING NOISE AND VIBRATION MEASUREMENTS
1.1 AMBIENT NOISE
The initial step in a noise analysis involves determining the existing baseline noise conditions in the vicinity
of the project site. Existing noise conditions in the study area are addressed in EIS sub-section 3.12.3. A
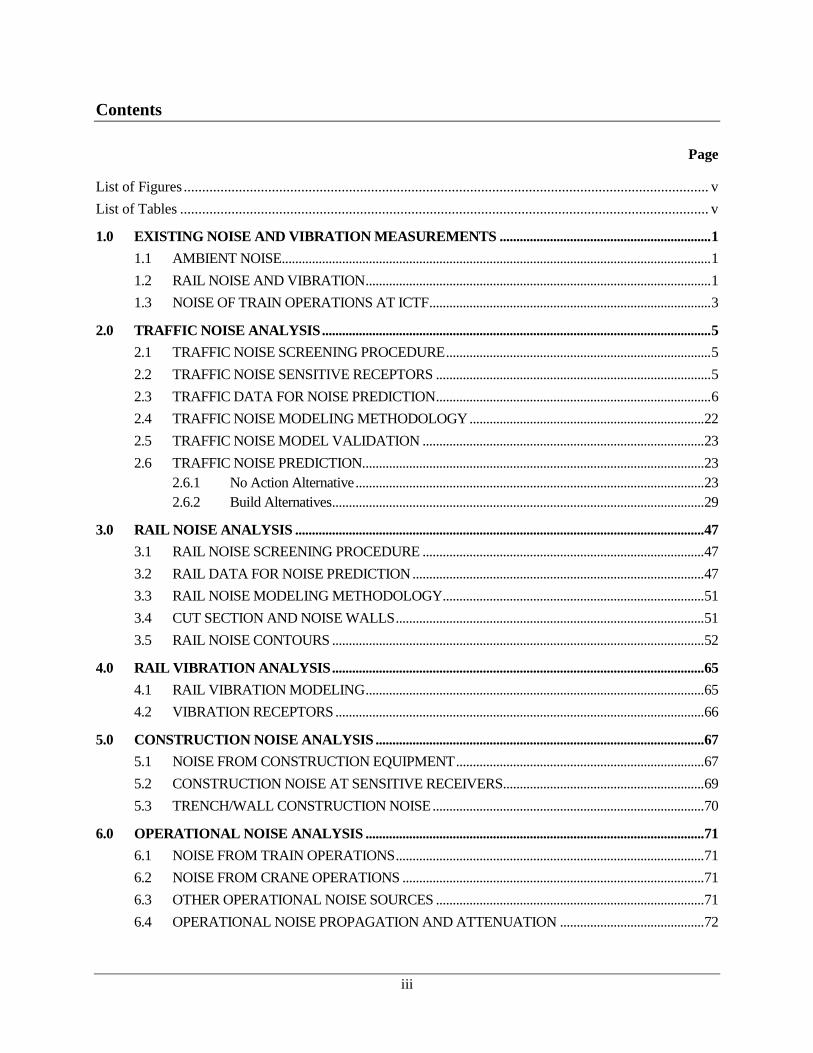
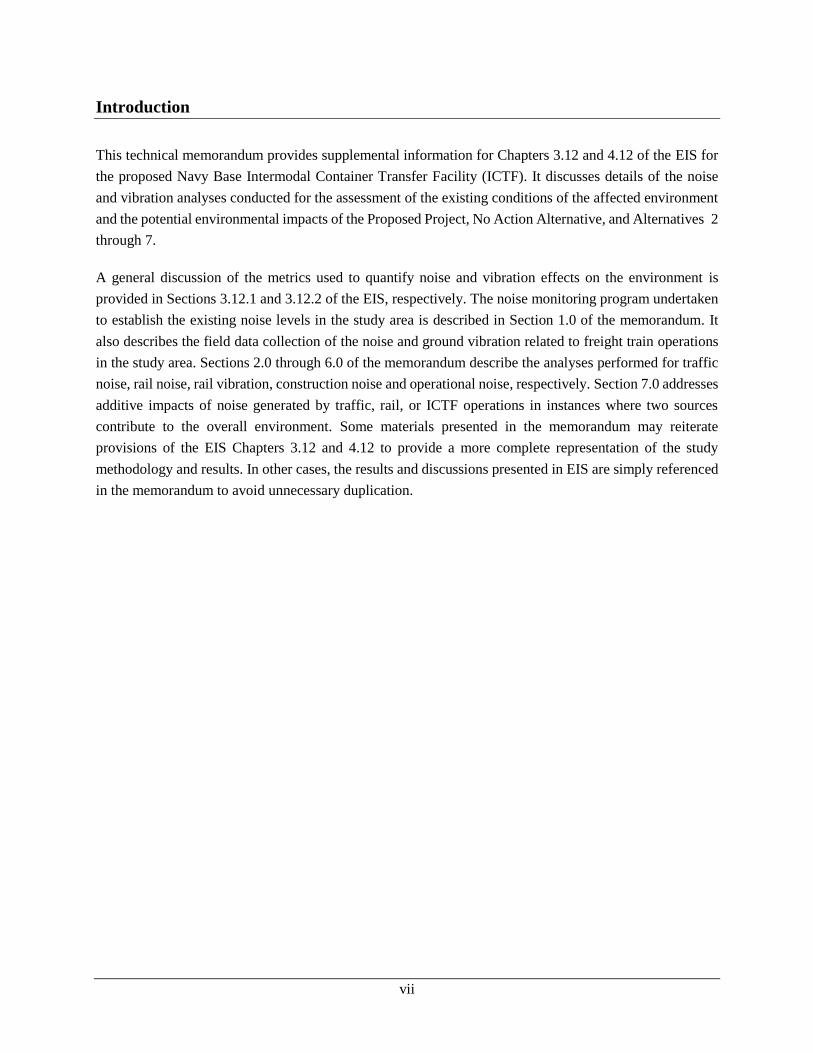
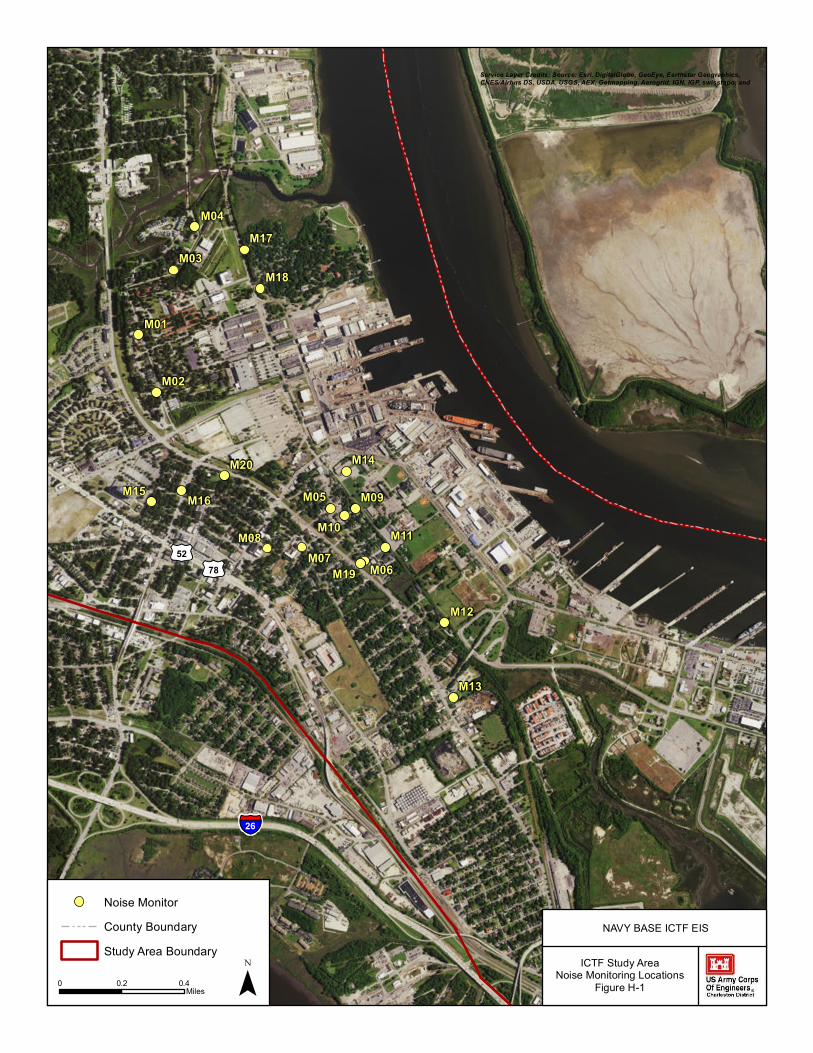
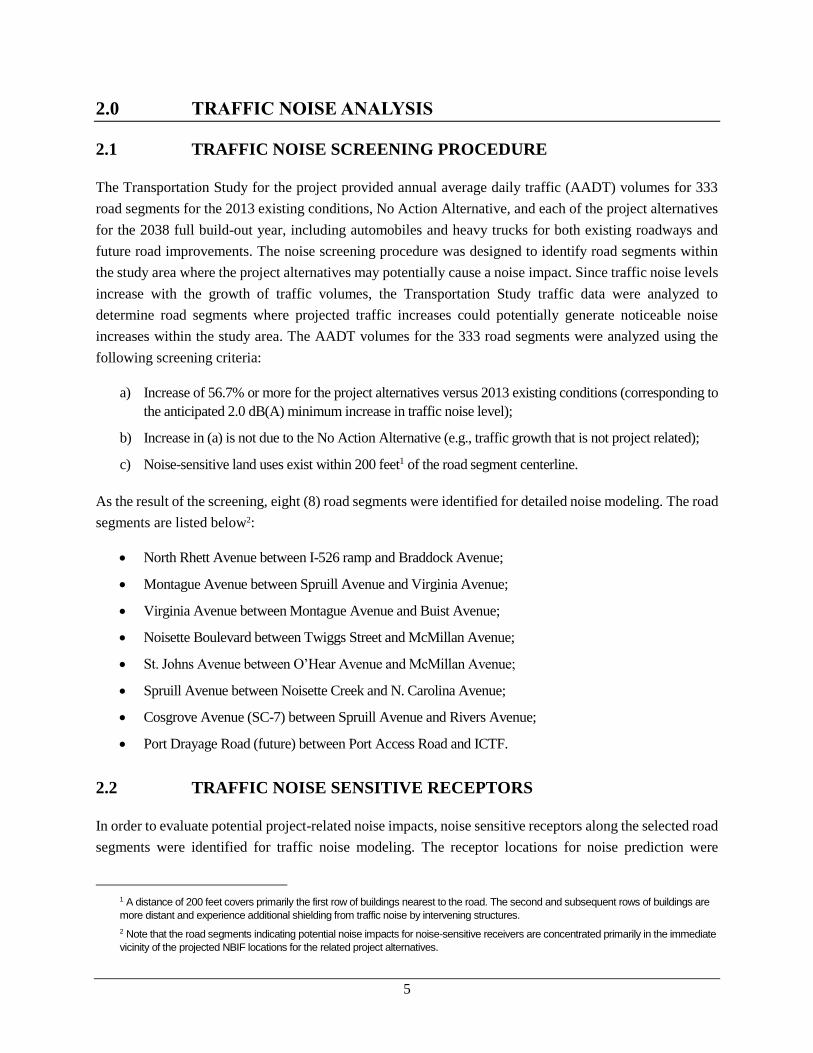
noise survey was conducted in the Navy Base ICTF study area in July and August 2014. The survey
included noise monitoring in 20 locations, which were selected in proximity to the Proposed Project and
River Center sites where potential noise effects are anticipated, i.e. relatively close (within 1,000 feet) to
the future ICTF footprint. A mix of land uses was monitored including residential, institutional, public and
recreational areas. The noise monitoring locations are shown in the EIS Figure 3.12-3, which is reproduced
in Figure H-1 for convenience. In each monitoring location, a Larson Davis Model LD824 integrating sound
level meter was installed on a 4 to 5 feet tripod. The calibrated sound level meter was programmed to record
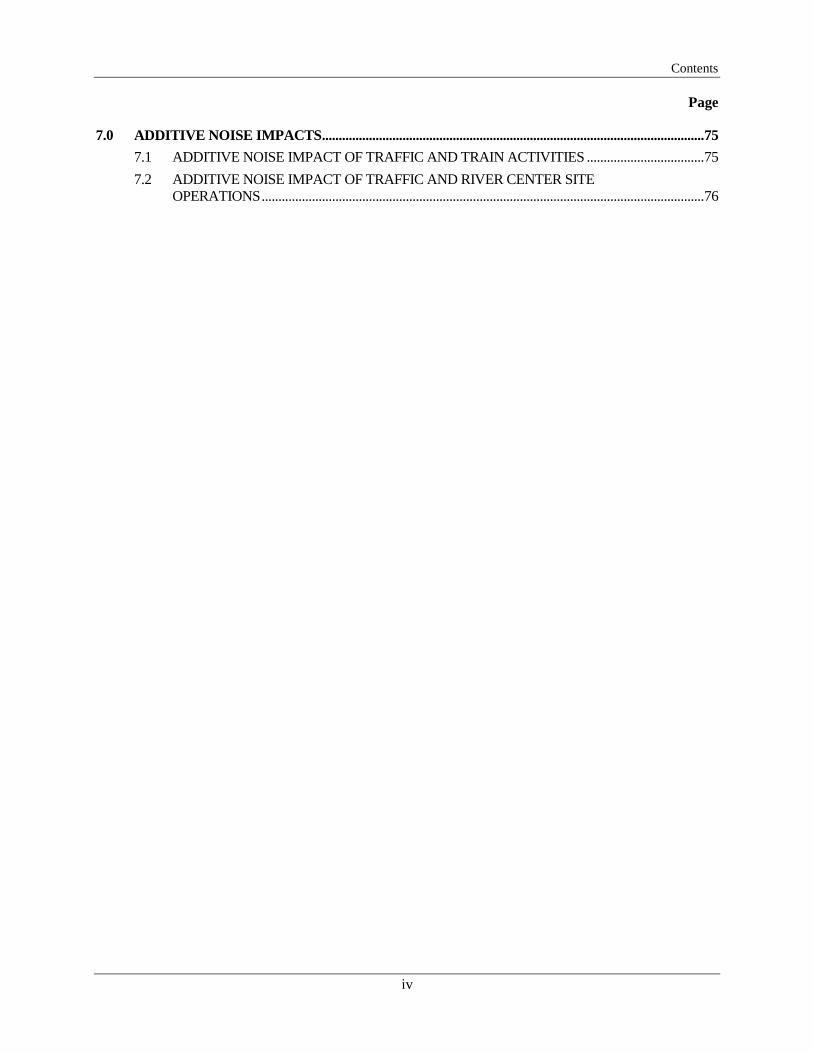
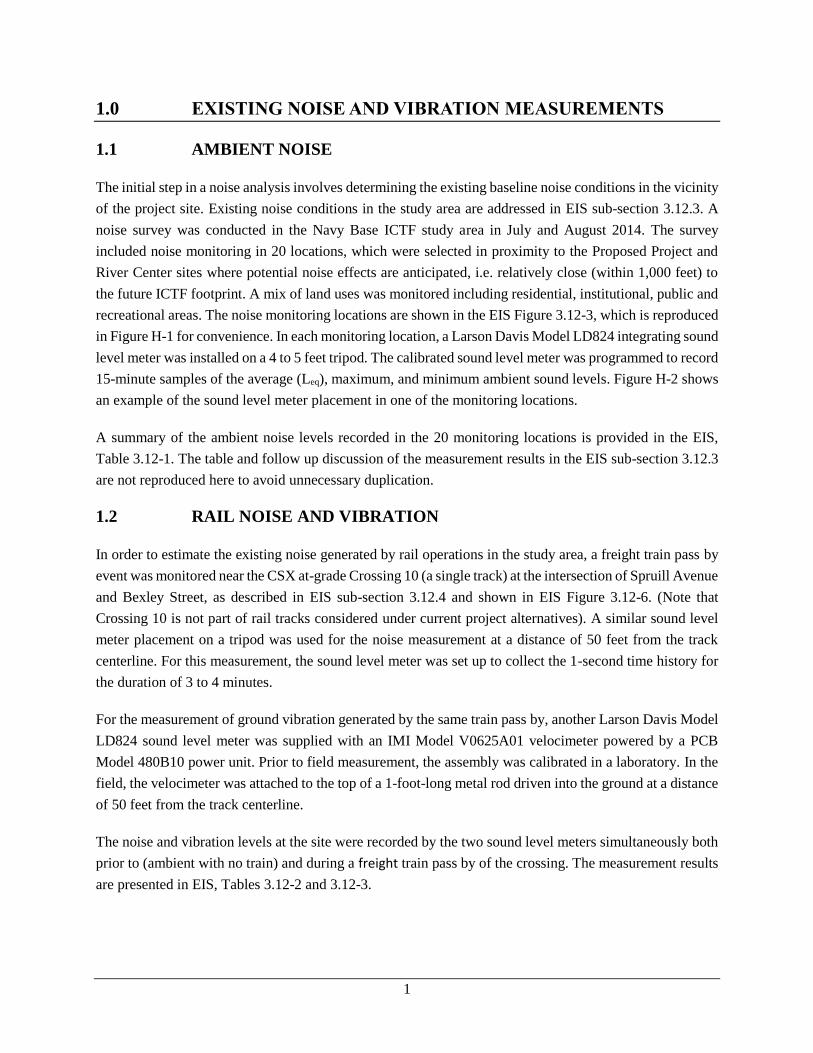
15-minute samples of the average (Leq), maximum, and minimum ambient sound levels. Figure H-2 shows
an example of the sound level meter placement in one of the monitoring locations.
A summary of the ambient noise levels recorded in the 20 monitoring locations is provided in the EIS,
Table 3.12-1. The table and follow up discussion of the measurement results in the EIS sub-section 3.12.3
are not reproduced here to avoid unnecessary duplication.
1.2 RAIL NOISE AND VIBRATION
In order to estimate the existing noise generated by rail operations in the study area, a freight train pass by
event was monitored near the CSX at-grade Crossing 10 (a single track) at the intersection of Spruill Avenue
and Bexley Street, as described in EIS sub-section 3.12.4 and shown in EIS Figure 3.12-6. (Note that
Crossing 10 is not part of rail tracks considered under current project alternatives). A similar sound level
meter placement on a tripod was used for the noise measurement at a distance of 50 feet from the track
centerline. For this measurement, the sound level meter was set up to collect the 1-second time history for
the duration of 3 to 4 minutes.
For the measurement of ground vibration generated by the same train pass by, another Larson Davis Model
LD824 sound level meter was supplied with an IMI Model V0625A01 velocimeter powered by a PCB
Model 480B10 power unit. Prior to field measurement, the assembly was calibrated in a laboratory. In the
field, the velocimeter was attached to the top of a 1-foot-long metal rod driven into the ground at a distance
of 50 feet from the track centerline.
The noise and vibration levels at the site were recorded by the two sound level meters simultaneously both
prior to (ambient with no train) and during a freight train pass by of the crossing. The measurement results
are presented in EIS, Tables 3.12-2 and 3.12-3.
§̈¦26
£¤52£¤78
M09
M08M07
M06
M05
M04
M03
M02
M01
M20
M19
M18
M17
M16M15
M14
M13
M12
M11M10
ICTF Study AreaNoise Monitoring Locations
Figure H-1¯0 0.2 0.4Miles
Noise MonitorCounty BoundaryStudy Area Boundary
Service Layer Credits: Source: Esri, DigitalGlobe, GeoEye, Earthstar Geographics,CNES/Airbus DS, USDA, USGS, AEX, Getmapping, Aerogrid, IGN, IGP, swisstopo, and
NAVY BASE ICTF EIS
EIS for the Proposed Navy Base Appendix H: Noise and Vibration
Intermodal Container Transfer Facility Technical Memorandum
3
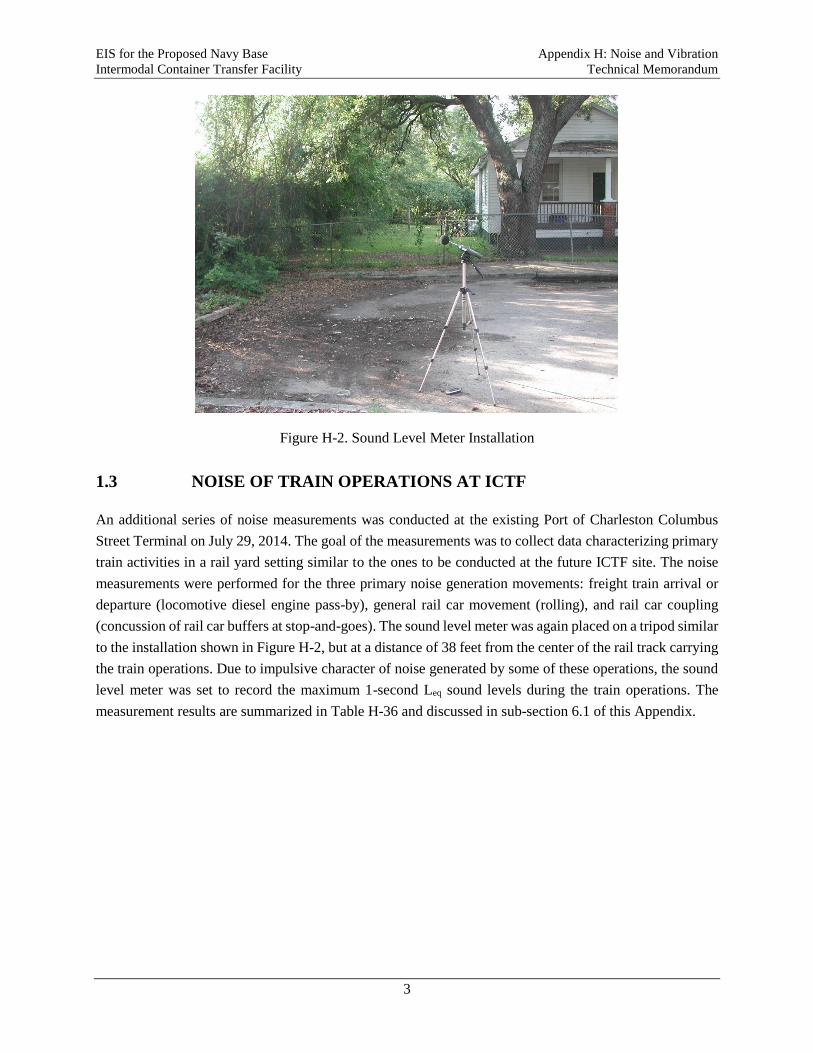
Figure H-2. Sound Level Meter Installation
1.3 NOISE OF TRAIN OPERATIONS AT ICTF
An additional series of noise measurements was conducted at the existing Port of Charleston Columbus
Street Terminal on July 29, 2014. The goal of the measurements was to collect data characterizing primary
train activities in a rail yard setting similar to the ones to be conducted at the future ICTF site. The noise
measurements were performed for the three primary noise generation movements: freight train arrival or
departure (locomotive diesel engine pass-by), general rail car movement (rolling), and rail car coupling
(concussion of rail car buffers at stop-and-goes). The sound level meter was again placed on a tripod similar
to the installation shown in Figure H-2, but at a distance of 38 feet from the center of the rail track carrying
the train operations. Due to impulsive character of noise generated by some of these operations, the sound
level meter was set to record the maximum 1-second Leq sound levels during the train operations. The
measurement results are summarized in Table H-36 and discussed in sub-section 6.1 of this Appendix.

EIS for the Proposed Navy Base Appendix H: Noise and Vibration
Intermodal Container Transfer Facility Technical Memorandum
4
This page intentionally left blank.
5
2.0 TRAFFIC NOISE ANALYSIS
2.1 TRAFFIC NOISE SCREENING PROCEDURE
The Transportation Study for the project provided annual average daily traffic (AADT) volumes for 333
road segments for the 2013 existing conditions, No Action Alternative, and each of the project alternatives
for the 2038 full build-out year, including automobiles and heavy trucks for both existing roadways and
future road improvements. The noise screening procedure was designed to identify road segments within
the study area where the project alternatives may potentially cause a noise impact. Since traffic noise levels
increase with the growth of traffic volumes, the Transportation Study traffic data were analyzed to
determine road segments where projected traffic increases could potentially generate noticeable noise
increases within the study area. The AADT volumes for the 333 road segments were analyzed using the
following screening criteria:
a) Increase of 56.7% or more for the project alternatives versus 2013 existing conditions (corresponding to
the anticipated 2.0 dB(A) minimum increase in traffic noise level);
b) Increase in (a) is not due to the No Action Alternative (e.g., traffic growth that is not project related);
c) Noise-sensitive land uses exist within 200 feet1 of the road segment centerline.
As the result of the screening, eight (8) road segments were identified for detailed noise modeling. The road
segments are listed below2:
North Rhett Avenue between I-526 ramp and Braddock Avenue;
Montague Avenue between Spruill Avenue and Virginia Avenue;
Virginia Avenue between Montague Avenue and Buist Avenue;
Noisette Boulevard between Twiggs Street and McMillan Avenue;
St. Johns Avenue between O’Hear Avenue and McMillan Avenue;
Spruill Avenue between Noisette Creek and N. Carolina Avenue;
Cosgrove Avenue (SC-7) between Spruill Avenue and Rivers Avenue;
Port Drayage Road (future) between Port Access Road and ICTF.
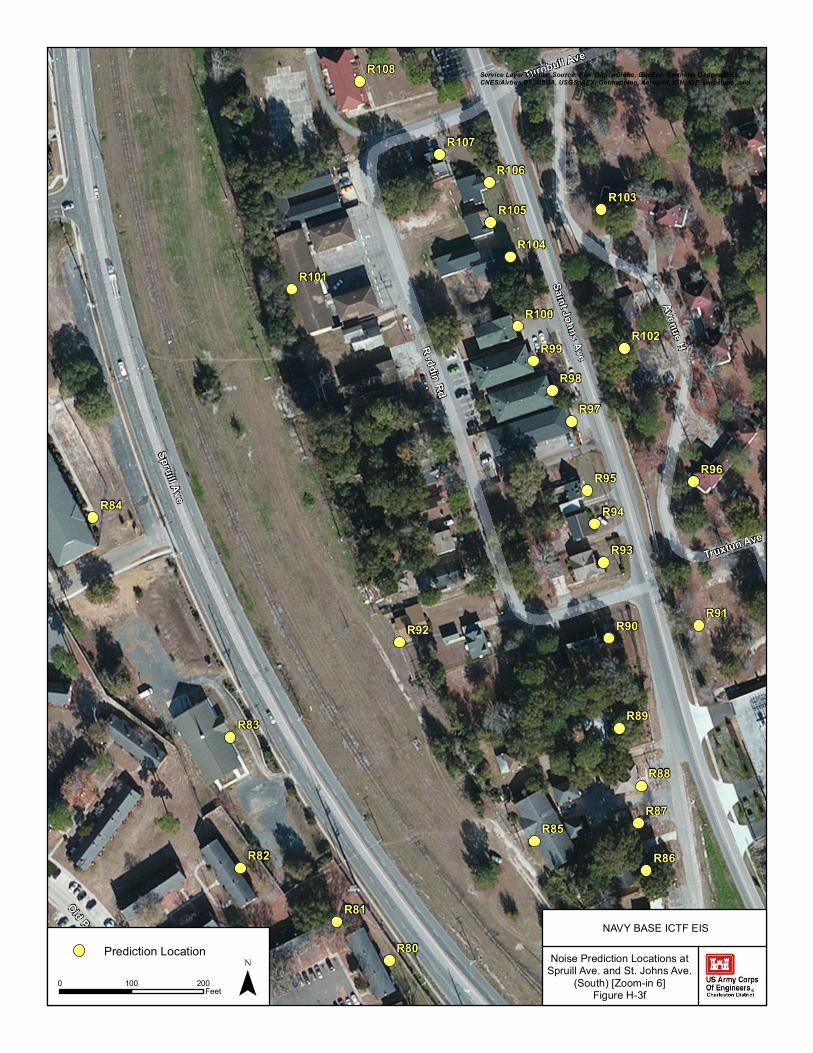
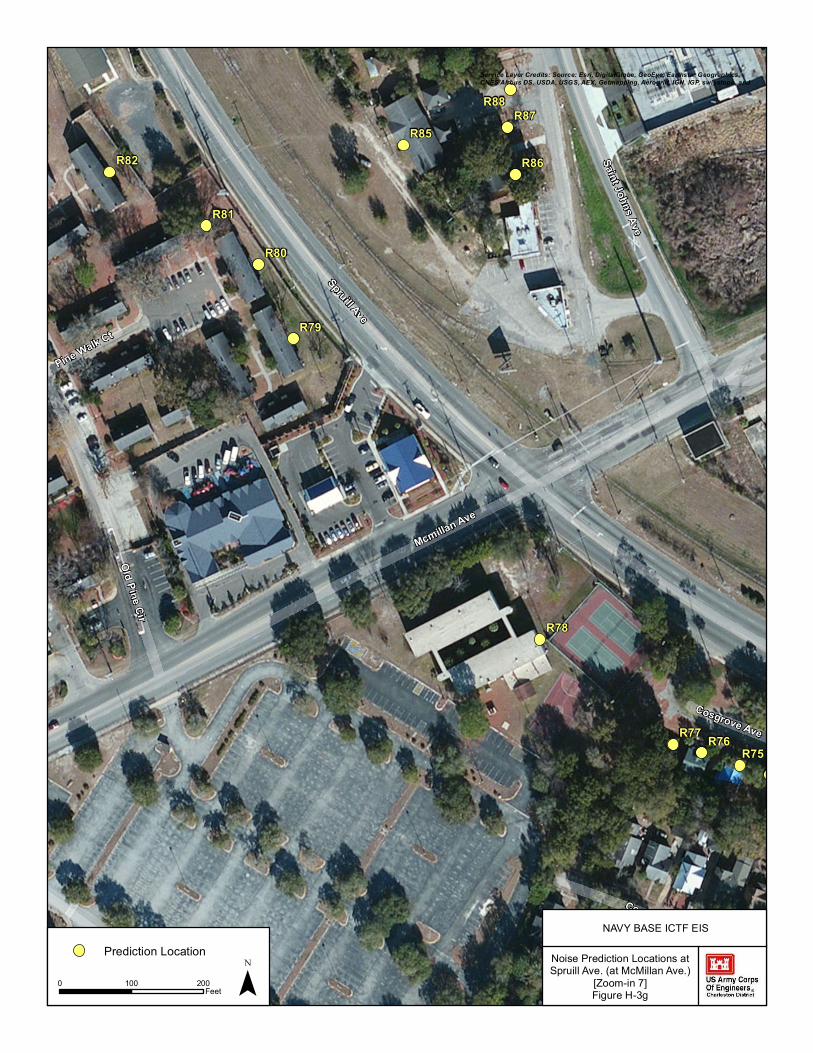
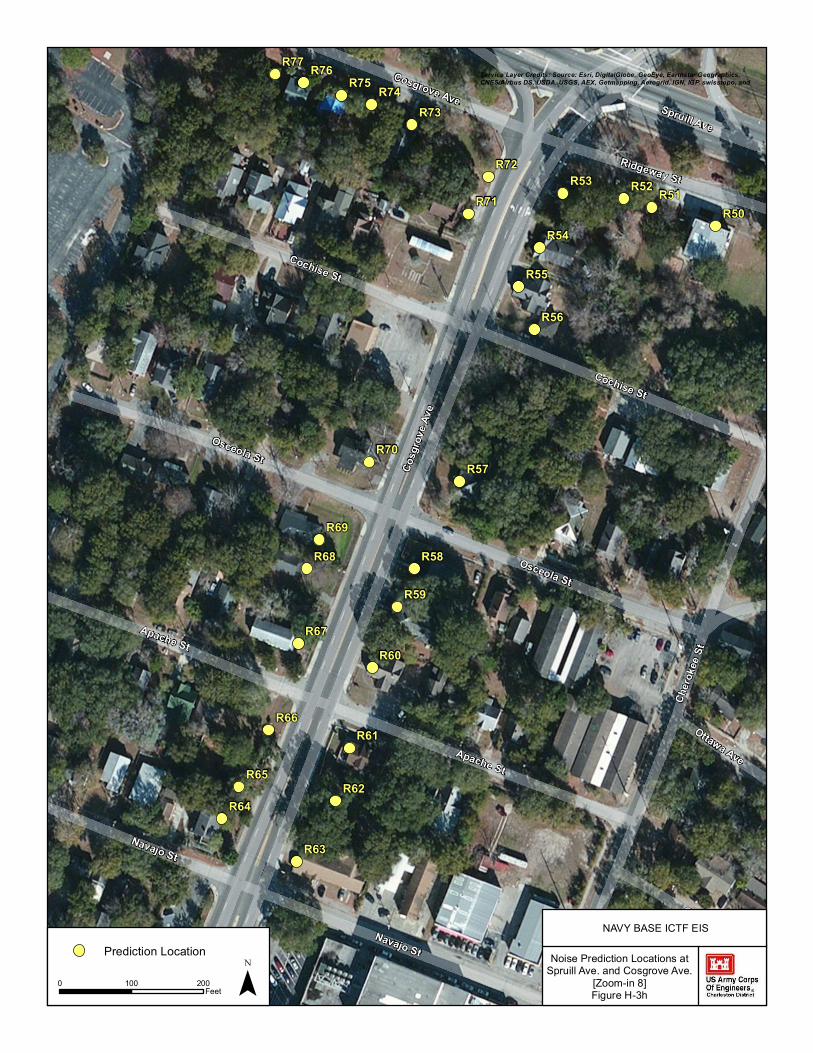
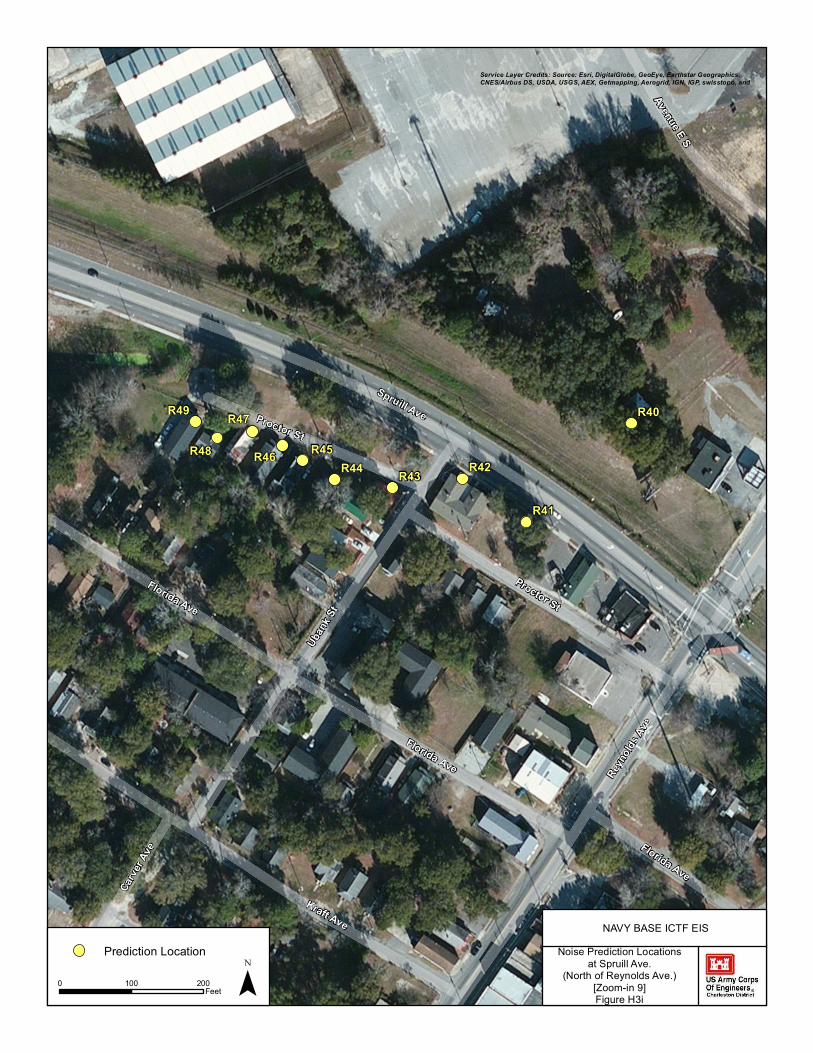
2.2 TRAFFIC NOISE SENSITIVE RECEPTORS
In order to evaluate potential project-related noise impacts, noise sensitive receptors along the selected road
segments were identified for traffic noise modeling. The receptor locations for noise prediction were
1 A distance of 200 feet covers primarily the first row of buildings nearest to the road. The second and subsequent rows of buildings are
more distant and experience additional shielding from traffic noise by intervening structures. 2 Note that the road segments indicating potential noise impacts for noise-sensitive receivers are concentrated primarily in the immediate
vicinity of the projected NBIF locations for the related project alternatives.
EIS for the Proposed Navy Base Appendix H: Noise and Vibration
Intermodal Container Transfer Facility Technical Memorandum
6
selected at building facades exposed to roadways, at a height of 5 feet above the ground. One hundred fifty
(150) receptor locations were identified for the project alternatives, representing mostly residential land
uses (single- and multi-family residences), as well as churches, schools, parks and recreation areas. Several
commercial areas and vacant lots exposed to traffic noise were included for informational purposes.
Additional eighteen (18) receptors exposed to future Port Drayage Road under the River Center Site
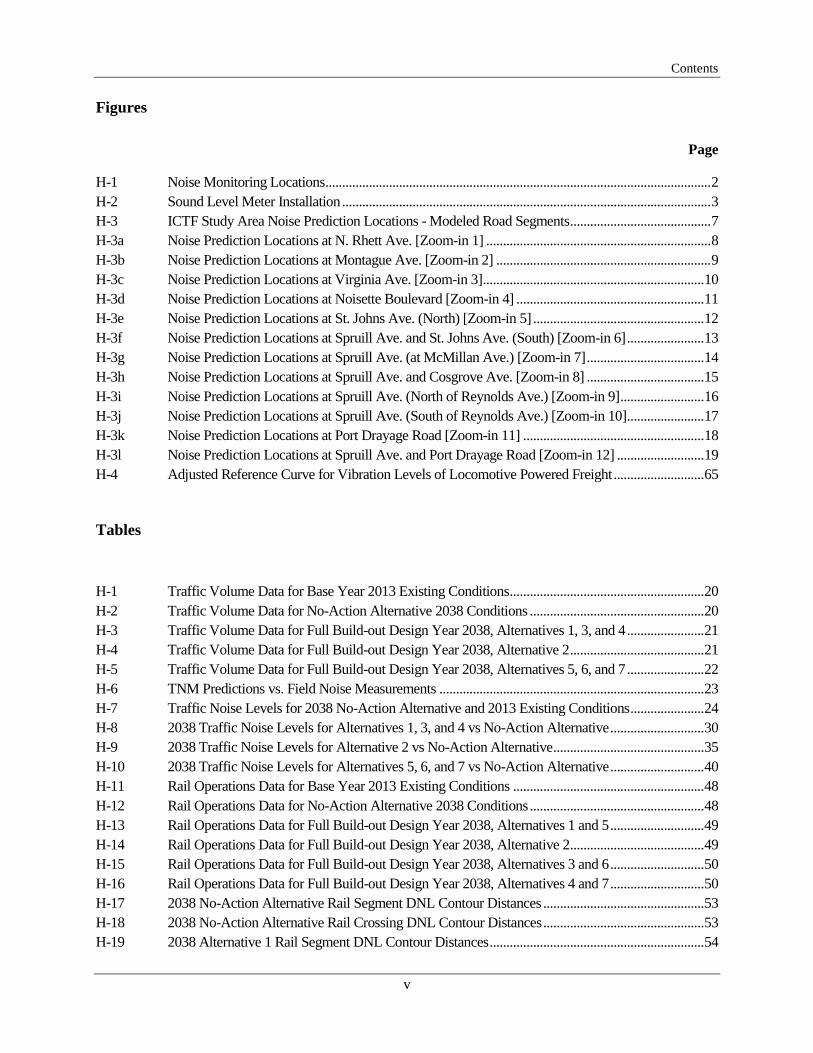
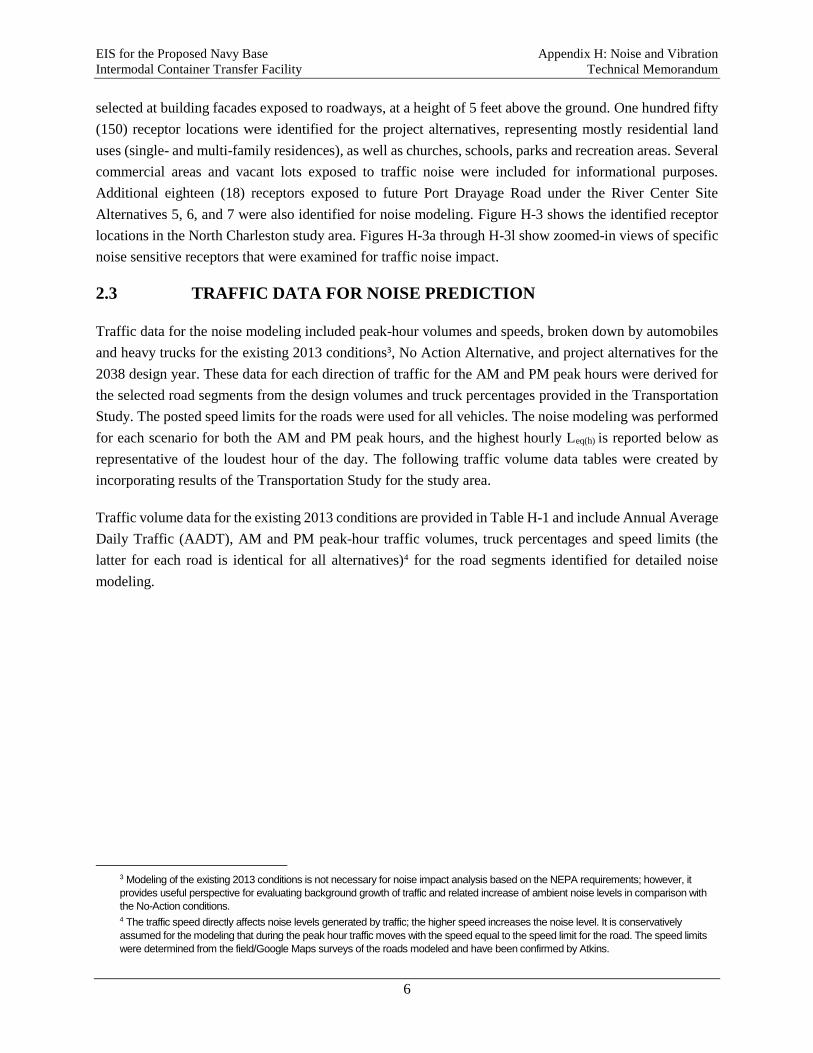
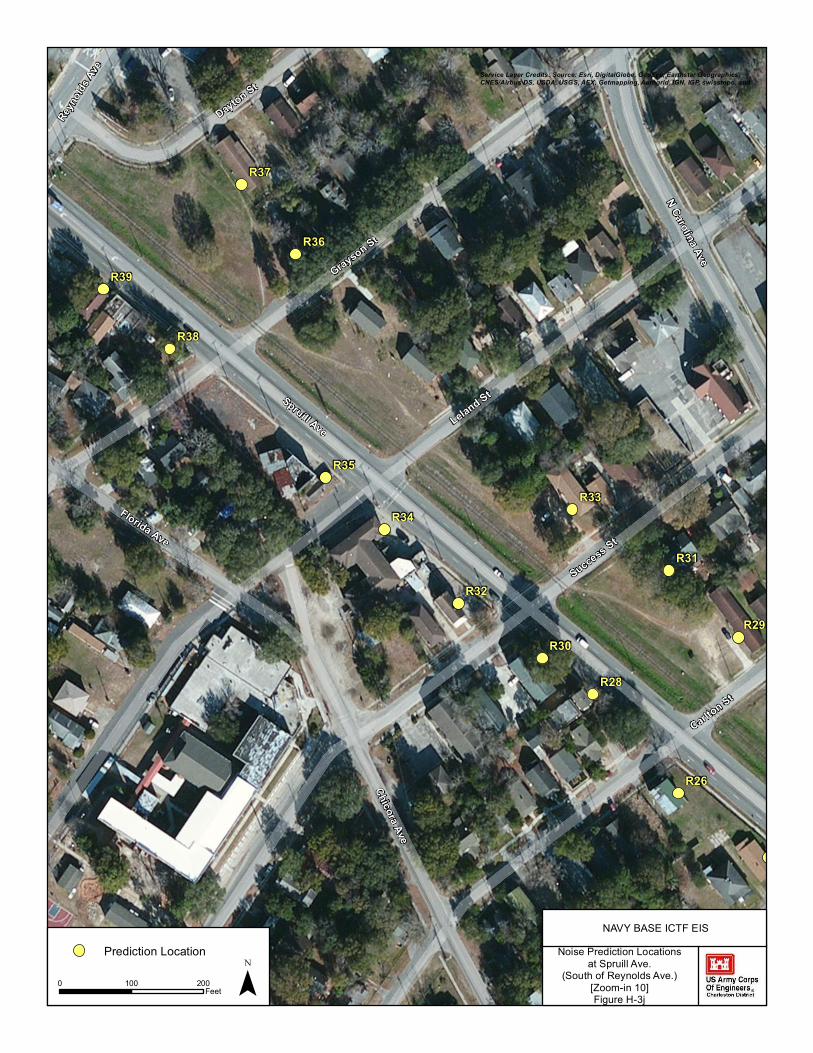
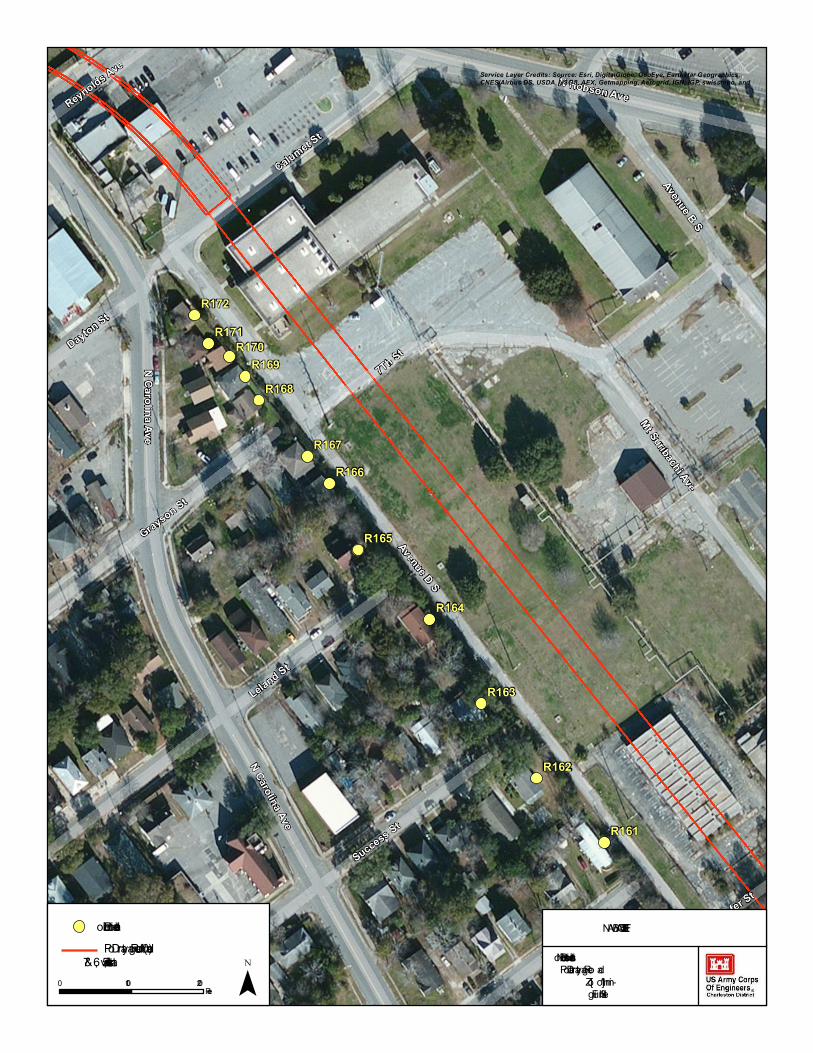
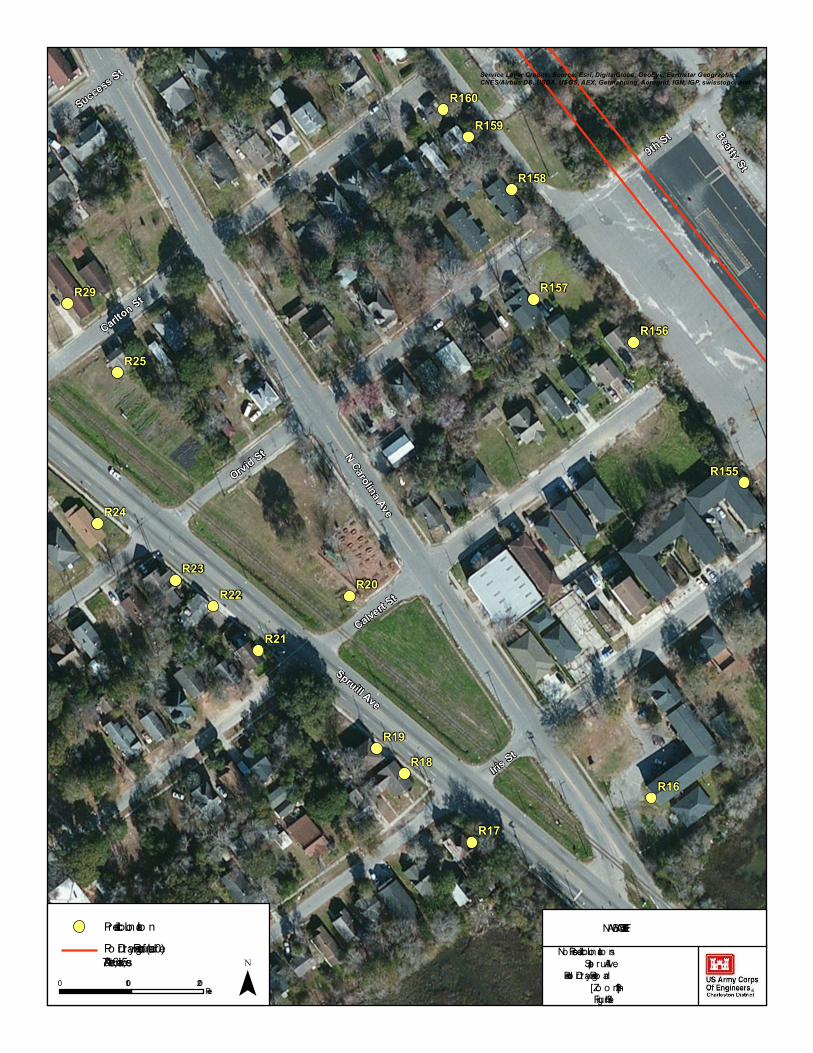
Alternatives 5, 6, and 7 were also identified for noise modeling. Figure H-3 shows the identified receptor
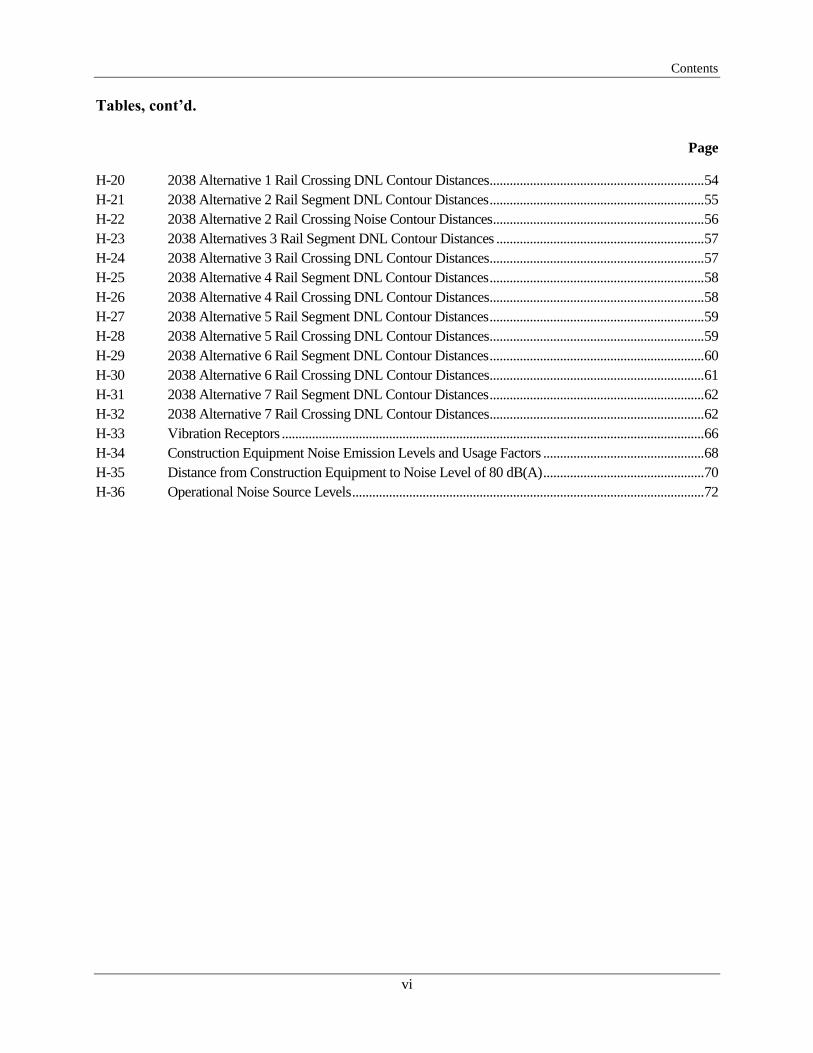
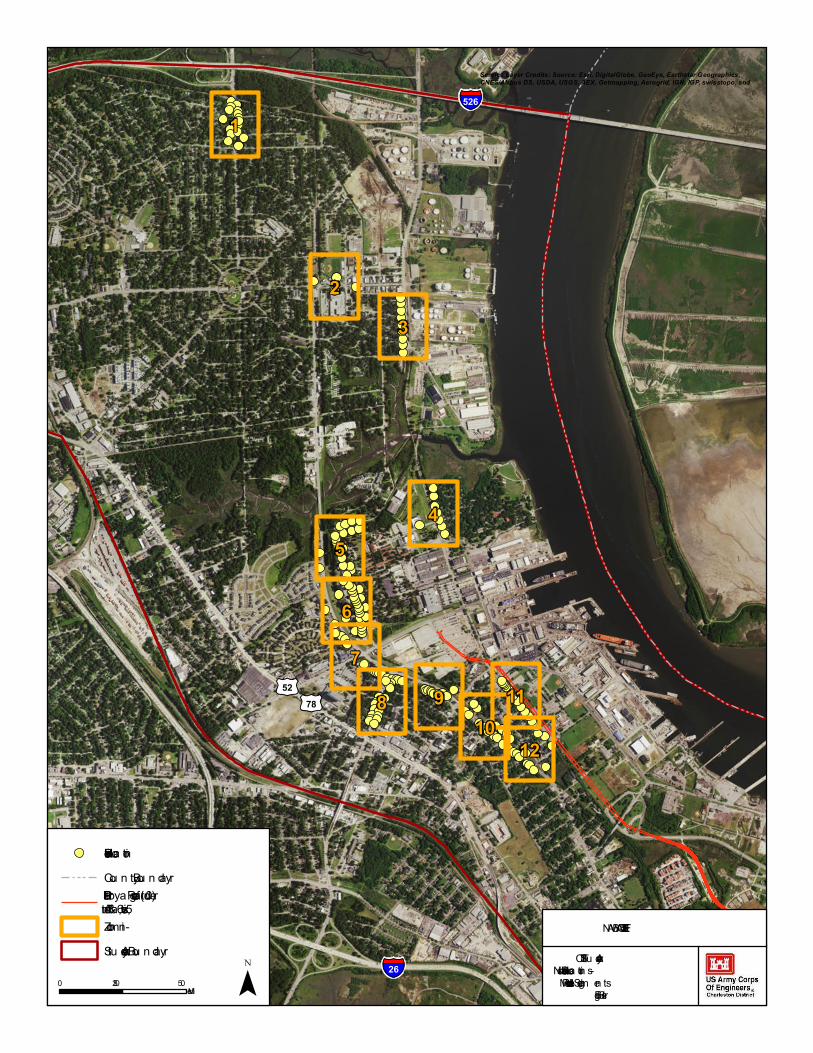
locations in the North Charleston study area. Figures H-3a through H-3l show zoomed-in views of specific
noise sensitive receptors that were examined for traffic noise impact.
2.3 TRAFFIC DATA FOR NOISE PREDICTION
Traffic data for the noise modeling included peak-hour volumes and speeds, broken down by automobiles
and heavy trucks for the existing 2013 conditions3, No Action Alternative, and project alternatives for the
2038 design year. These data for each direction of traffic for the AM and PM peak hours were derived for
the selected road segments from the design volumes and truck percentages provided in the Transportation
Study. The posted speed limits for the roads were used for all vehicles. The noise modeling was performed
for each scenario for both the AM and PM peak hours, and the highest hourly Leq(h) is reported below as
representative of the loudest hour of the day. The following traffic volume data tables were created by
incorporating results of the Transportation Study for the study area.
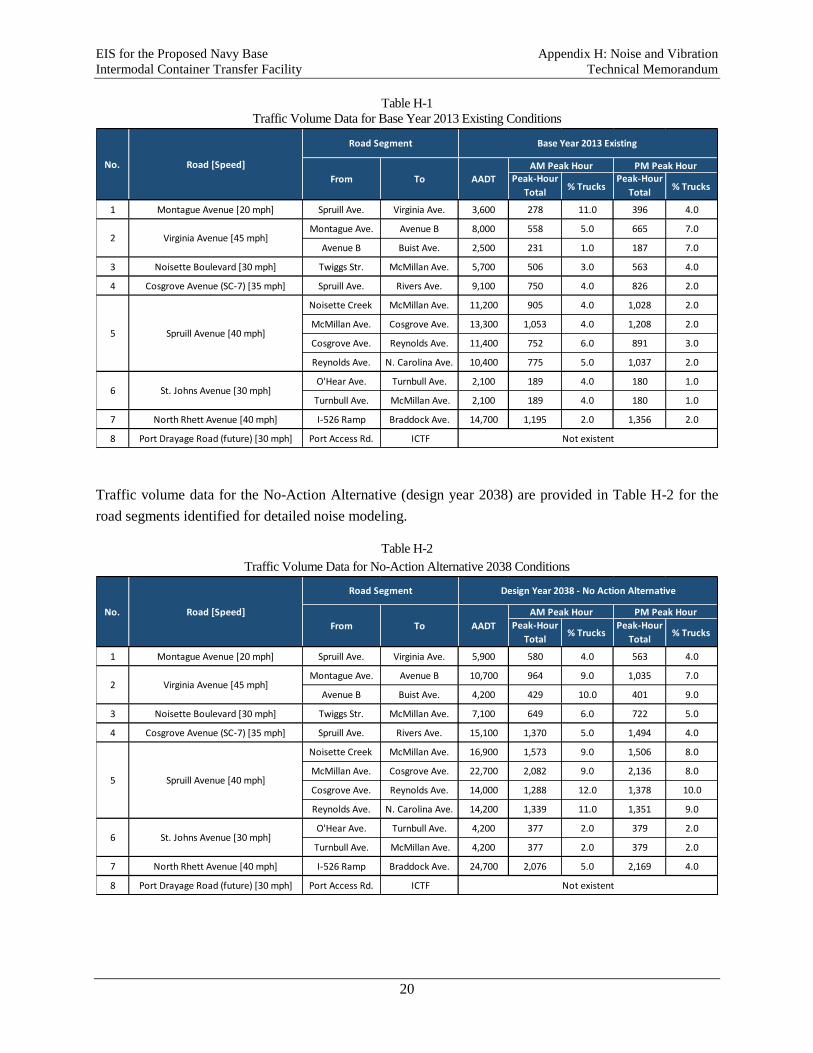
Traffic volume data for the existing 2013 conditions are provided in Table H-1 and include Annual Average
Daily Traffic (AADT), AM and PM peak-hour traffic volumes, truck percentages and speed limits (the
latter for each road is identical for all alternatives)4 for the road segments identified for detailed noise
modeling.
3 Modeling of the existing 2013 conditions is not necessary for noise impact analysis based on the NEPA requirements; however, it
provides useful perspective for evaluating background growth of traffic and related increase of ambient noise levels in comparison with
the No-Action conditions. 4 The traffic speed directly affects noise levels generated by traffic; the higher speed increases the noise level. It is conservatively
assumed for the modeling that during the peak hour traffic moves with the speed equal to the speed limit for the road. The speed limits
were determined from the field/Google Maps surveys of the roads modeled and have been confirmed by Atkins.
§̈¦526
§̈¦26
£¤52£¤78
2
6
97
4
3
8
1
5
1110
12
ICTF Stu dy AreaNoise Prediction Loca tion s -Modeled Roa d Segm en ts
Figu re H-3¯0 0.25 0.5Miles
Service Layer Credits: Source: Esri, DigitalGlobe, GeoEye, Earthstar Geographics,CNES/Airbus DS, USDA, USGS, AEX, Getmapping, Aerogrid, IGN, IGP, swisstopo, and
NAVY BASE ICTF EIS
Prediction Loca tionCou n ty Bou n da ry
Zoom -inStu dy Area Bou nda ry
Port Dra ya ge Roa d (fu tu re) – Altern a tives 5, 6, & 7
N Rhett Ave
Victoria Ave
Braddock Ave
Camden St
Sherwood St
Alph
a St
Braddock Ave
R139
R141
R140
R143
R142
R154
R144
R146
R145
R147
R148
R149R150
R151
R152
R153
¯0 100 200Feet
Prediction Location
Service Layer Credits: Source: Esri, DigitalGlobe, GeoEye, Earthstar Geographics,CNES/Airbus DS, USDA, USGS, AEX, Getmapping, Aerogrid, IGN, IGP, swisstopo, and
NAVY BASE ICTF EIS
Noise Prediction Locationsat N. Rhett Ave. [Zoom-in 1]
Figure H-3a
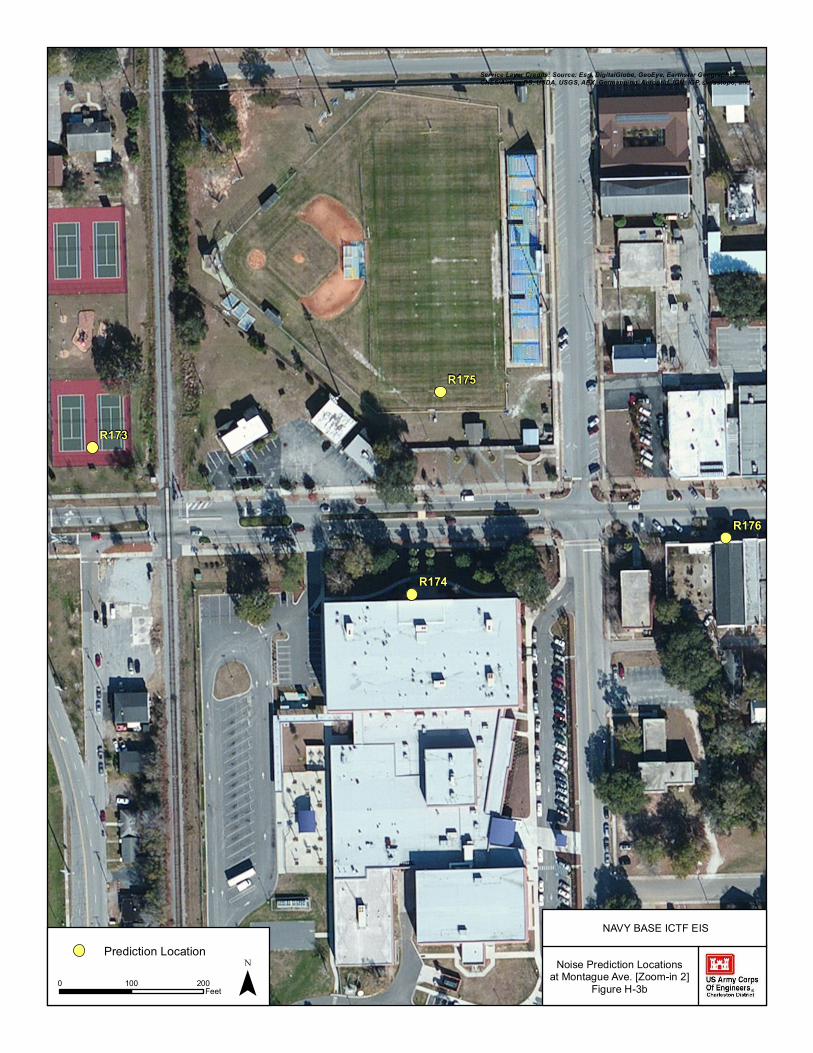
R175
R176
R174
R173
¯0 100 200Feet
Service Layer Credits: Source: Esri, DigitalGlobe, GeoEye, Earthstar Geographics,CNES/Airbus DS, USDA, USGS, AEX, Getmapping, Aerogrid, IGN, IGP, swisstopo, and
NAVY BASE ICTF EIS
Noise Prediction Locationsat Montague Ave. [Zoom-in 2]
Figure H-3b
Prediction Location
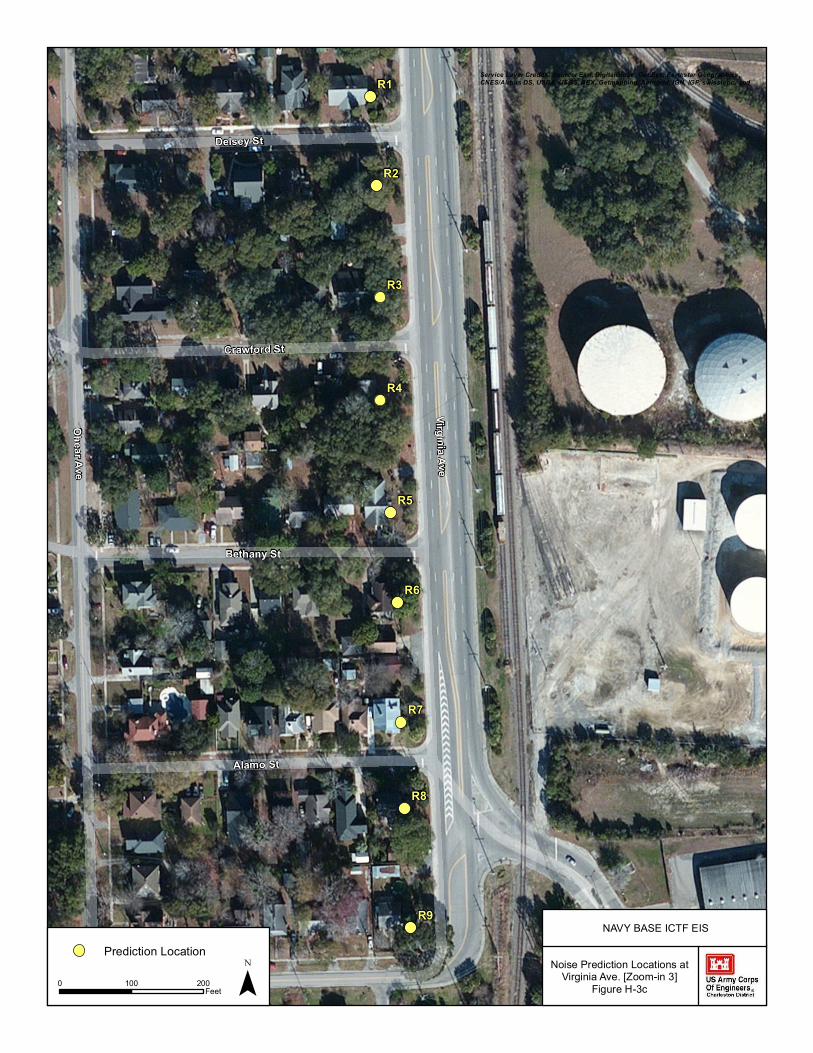
Ohear Ave
Virginia Ave
Buist Ave
Alamo St
Delsey St
Bethany St
Crawford St
Avenue B N
R1
R2
R3
R4
R5
R6
R7
R8
R9
¯0 100 200Feet
Prediction Location
Service Layer Credits: Source: Esri, DigitalGlobe, GeoEye, Earthstar Geographics,CNES/Airbus DS, USDA, USGS, AEX, Getmapping, Aerogrid, IGN, IGP, swisstopo, and
NAVY BASE ICTF EIS
Noise Prediction Locations atVirginia Ave. [Zoom-in 3]
Figure H-3c
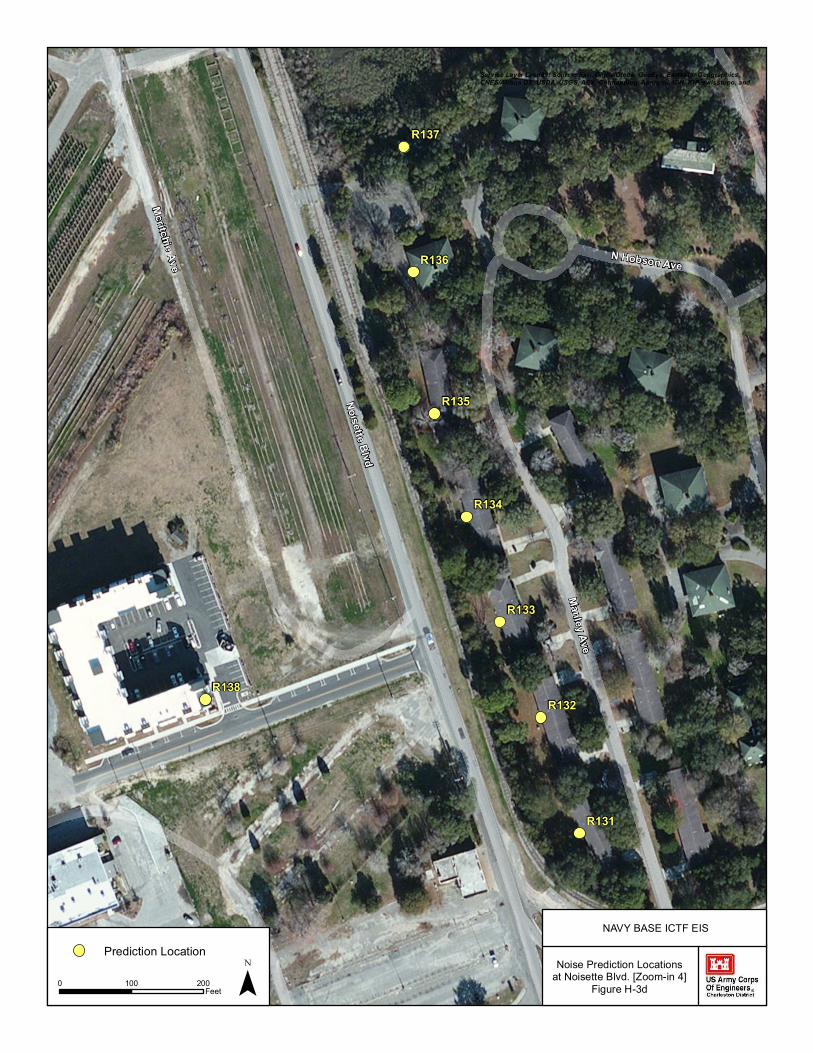
Noisette Blvd
Mcritchie Ave
Manley Ave
Turnbull Ave
N Hobson Ave
R137
R138
R136
R135
R134
R133
R132
R131
¯0 100 200Feet
Prediction Location
Service Layer Credits: Source: Esri, DigitalGlobe, GeoEye, Earthstar Geographics,CNES/Airbus DS, USDA, USGS, AEX, Getmapping, Aerogrid, IGN, IGP, swisstopo, and
NAVY BASE ICTF EIS
Noise Prediction Locationsat Noisette Blvd. [Zoom-in 4]
Figure H-3d
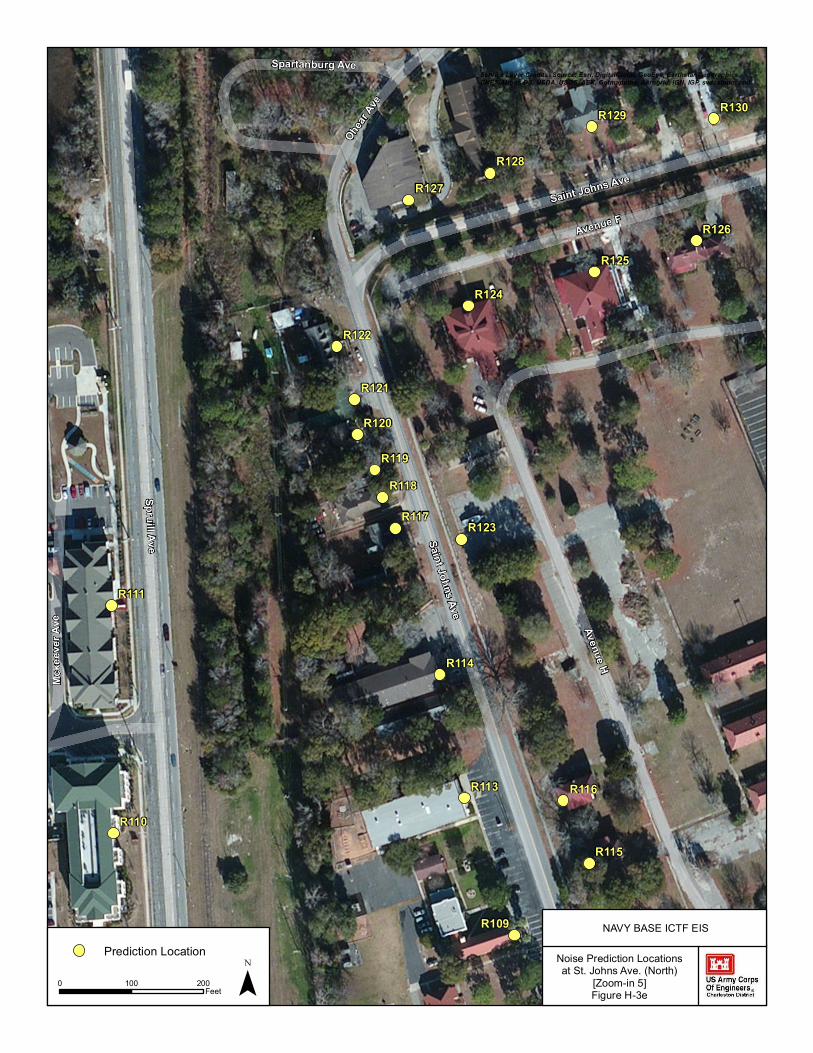
R109
R130R129
R128R127
R126
R125
R124
R122
R121
R120
R119R118
R117 R123
R114
R113 R116
R115
R111
R110
Spruill Ave
Avenue H
Saint Johns Ave
Avenue F
Ohear A
ve
Mcke
ever
Ave
Turnbull Ave
Spartanburg Ave
Saint Johns Ave
¯0 100 200Feet
Prediction Location
Service Layer Credits: Source: Esri, DigitalGlobe, GeoEye, Earthstar Geographics,CNES/Airbus DS, USDA, USGS, AEX, Getmapping, Aerogrid, IGN, IGP, swisstopo, and
NAVY BASE ICTF EIS
Noise Prediction Locationsat St. Johns Ave. (North)
[Zoom-in 5]Figure H-3e
Spruill Ave
Saint Johns Ave
Avenue HReddin Rd
Old Pine Cir
Turnbull Ave
Truxtun Ave
R82
R99
R98
R97
R95
R94
R96
R93
R92R91
R90
R89
R88
R87
R86
R85
R80
R81
R83
R84
R108
R107R106
R105
R101
R104
R100
R103
R102
¯0 100 200Feet
Prediction Location
Service Layer Credits: Source: Esri, DigitalGlobe, GeoEye, Earthstar Geographics,CNES/Airbus DS, USDA, USGS, AEX, Getmapping, Aerogrid, IGN, IGP, swisstopo, and
NAVY BASE ICTF EIS
Noise Prediction Locations atSpruill Ave. and St. Johns Ave.
(South) [Zoom-in 6]Figure H-3f
R75R76R77
R78
R82
R88R87
R86
R85
R79
R80
R81
Spruill Ave
Mcmillan Ave
Old Pine Cir
Saint Johns Ave
Cochise St
Parking Lot
Cosgrove Ave
Pine Walk Ct
¯0 100 200Feet
Prediction LocationNAVY BASE ICTF EIS
Service Layer Credits: Source: Esri, DigitalGlobe, GeoEye, Earthstar Geographics,CNES/Airbus DS, USDA, USGS, AEX, Getmapping, Aerogrid, IGN, IGP, swisstopo, and
Noise Prediction Locations atSpruill Ave. (at McMillan Ave.)
[Zoom-in 7]Figure H-3g
Osceola St
Apache St
Cochise St
Navajo St
Chero
kee S
t
Ridgeway St
Cosgrove Ave Spruill Ave
Goldenrod St
Ottawa Ave
Cosg
rove A
ve
Cochise St
Osceola St
Apache St
Navajo St
R71
R63
R62
R61
R60
R59
R58
R64
R65
R66
R67
R68
R69
R70R57
R56
R55
R54R50
R51R52R53R72
R73R74R75
R76R77
¯0 100 200Feet
Prediction LocationNAVY BASE ICTF EIS
Noise Prediction Locations atSpruill Ave. and Cosgrove Ave.
[Zoom-in 8]Figure H-3h
Service Layer Credits: Source: Esri, DigitalGlobe, GeoEye, Earthstar Geographics,CNES/Airbus DS, USDA, USGS, AEX, Getmapping, Aerogrid, IGN, IGP, swisstopo, and
R41
R42R43R44R45R46
R47
R48
R49 R40Spruill Ave
Florida Ave
Kraft Ave
Uban
k St
Reyn
olds A
ve
Proctor St
Carve
r Ave
Avenue E S
Ottawa Ave Grayson
St
Proctor St
Florida Ave
Florida Ave
¯0 100 200Feet
Prediction LocationNAVY BASE ICTF EIS
Service Layer Credits: Source: Esri, DigitalGlobe, GeoEye, Earthstar Geographics,CNES/Airbus DS, USDA, USGS, AEX, Getmapping, Aerogrid, IGN, IGP, swisstopo, and
Noise Prediction Locationsat Spruill Ave.
(North of Reynolds Ave.)[Zoom-in 9]Figure H3i
Leland StSpruill Ave
Success St
Grayson St
Carlton St
Chicora Ave
Dayton St
N Carolina Ave
Florida Ave
Orvid St
Reyn
olds A
ve
N Atlantic Ave
R26
R28
R30R29
R31
R33
R32
R34
R35
R37
R36
R38
R39
¯0 100 200Feet
Prediction LocationNAVY BASE ICTF EIS
Service Layer Credits: Source: Esri, DigitalGlobe, GeoEye, Earthstar Geographics,CNES/Airbus DS, USDA, USGS, AEX, Getmapping, Aerogrid, IGN, IGP, swisstopo, and
Noise Prediction Locationsat Spruill Ave.
(South of Reynolds Ave.)[Zoom-in 10]Figure H-3j
R33
R172
R171R170
R169R168
R167R166
R165
R164
R163
R162
R161
R160R159
R158
7Th St
N Carolina Ave
Leland St
Calumet St
Success St
N Hobson Ave
Avenue B S
Grayson St
Mt Suribachi Ave
Carlton St
Avenue D S
Dayton St
Cofer St
Reynolds Ave
Avenue D S
N Carolina Ave
¯0 100 200Feet
NAVY BASE ICTF EIS
Service Layer Credits: Source: Esri, DigitalGlobe, GeoEye, Earthstar Geographics,CNES/Airbus DS, USDA, USGS, AEX, Getmapping, Aerogrid, IGN, IGP, swisstopo, and
No ise Predictio n Lo catio nsat Po rt Drayage Ro ad
[Zo o m-in 11]Figure H-3k
Predictio n Lo catio nPo rt Drayage Ro ad (future) – Alternatives 5, 6, & 7
R16
R17
R18R19
R20
R21
R22R23
R24
R25
R29
R160R159
R158
R157
R156
R155
Iris St
Spruill Ave
Orvid St N Carolina Ave
Carlton St
Ramp
9th St
Success StBeatty St
Calvert St
¯0 100 200Feet
NAVY BASE ICTF EIS
Service Layer Credits: Source: Esri, DigitalGlobe, GeoEye, Earthstar Geographics,CNES/Airbus DS, USDA, USGS, AEX, Getmapping, Aerogrid, IGN, IGP, swisstopo, and
No ise Predictio n Lo catio nsat Sp ruill Ave.
and Po rt Drayage Ro ad[Zo o m-in 12]Figure H-3l
Predictio n Lo catio nPo rt Drayage Ro ad (future) – Alternatives 5, 6, & 7
EIS for the Proposed Navy Base Appendix H: Noise and Vibration
Intermodal Container Transfer Facility Technical Memorandum
20
Table H-1
Traffic Volume Data for Base Year 2013 Existing Conditions
Traffic volume data for the No-Action Alternative (design year 2038) are provided in Table H-2 for the
road segments identified for detailed noise modeling.
Table H-2
Traffic Volume Data for No-Action Alternative 2038 Conditions
Peak-Hour
Total% Trucks
Peak-Hour
Total% Trucks
1 Montague Avenue [20 mph] Spruill Ave. Virginia Ave. 3,600 278 11.0 396 4.0
Montague Ave. Avenue B 8,000 558 5.0 665 7.0
Avenue B Buist Ave. 2,500 231 1.0 187 7.0
3 Noisette Boulevard [30 mph] Twiggs Str. McMillan Ave. 5,700 506 3.0 563 4.0
4 Cosgrove Avenue (SC-7) [35 mph] Spruill Ave. Rivers Ave. 9,100 750 4.0 826 2.0
Noisette Creek McMillan Ave. 11,200 905 4.0 1,028 2.0
McMillan Ave. Cosgrove Ave. 13,300 1,053 4.0 1,208 2.0
Cosgrove Ave. Reynolds Ave. 11,400 752 6.0 891 3.0
Reynolds Ave. N. Carolina Ave. 10,400 775 5.0 1,037 2.0
O'Hear Ave. Turnbull Ave. 2,100 189 4.0 180 1.0
Turnbull Ave. McMillan Ave. 2,100 189 4.0 180 1.0
7 North Rhett Avenue [40 mph] I-526 Ramp Braddock Ave. 14,700 1,195 2.0 1,356 2.0
8 Port Drayage Road (future) [30 mph] Port Access Rd. ICTF
No. Road [Speed]
Road Segment
PM Peak Hour
5
AADT
AM Peak Hour
ToFrom
Base Year 2013 Existing
2 Virginia Avenue [45 mph]
St. Johns Avenue [30 mph]6
Spruill Avenue [40 mph]
Not existent
Peak-Hour
Total% Trucks
Peak-Hour
Total% Trucks
1 Montague Avenue [20 mph] Spruill Ave. Virginia Ave. 5,900 580 4.0 563 4.0
Montague Ave. Avenue B 10,700 964 9.0 1,035 7.0
Avenue B Buist Ave. 4,200 429 10.0 401 9.0
3 Noisette Boulevard [30 mph] Twiggs Str. McMillan Ave. 7,100 649 6.0 722 5.0
4 Cosgrove Avenue (SC-7) [35 mph] Spruill Ave. Rivers Ave. 15,100 1,370 5.0 1,494 4.0
Noisette Creek McMillan Ave. 16,900 1,573 9.0 1,506 8.0
McMillan Ave. Cosgrove Ave. 22,700 2,082 9.0 2,136 8.0
Cosgrove Ave. Reynolds Ave. 14,000 1,288 12.0 1,378 10.0
Reynolds Ave. N. Carolina Ave. 14,200 1,339 11.0 1,351 9.0
O'Hear Ave. Turnbull Ave. 4,200 377 2.0 379 2.0
Turnbull Ave. McMillan Ave. 4,200 377 2.0 379 2.0
7 North Rhett Avenue [40 mph] I-526 Ramp Braddock Ave. 24,700 2,076 5.0 2,169 4.0
8 Port Drayage Road (future) [30 mph] Port Access Rd. ICTF
No.
Road Segment Design Year 2038 - No Action Alternative
From To AADT
AM Peak Hour PM Peak Hour
2 Virginia Avenue [45 mph]
6 St. Johns Avenue [30 mph]
5 Spruill Avenue [40 mph]
Road [Speed]
Not existent
EIS for the Proposed Navy Base Appendix H: Noise and Vibration
Intermodal Container Transfer Facility Technical Memorandum
21
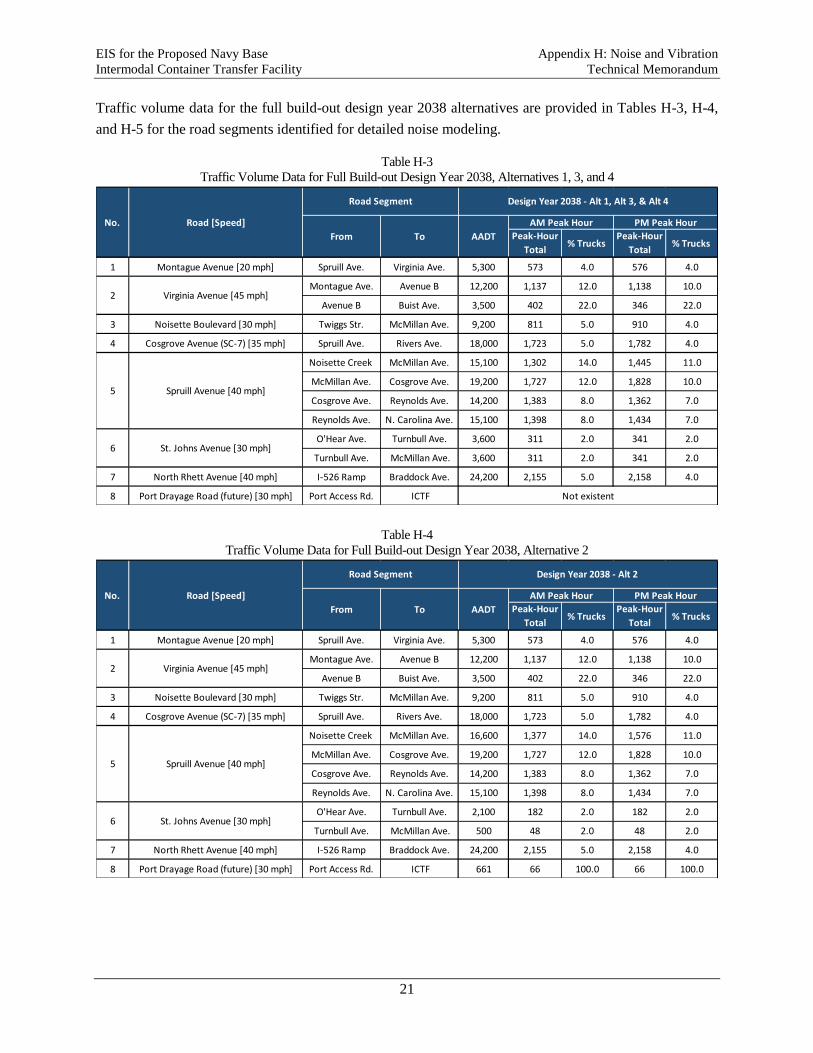
Traffic volume data for the full build-out design year 2038 alternatives are provided in Tables H-3, H-4,
and H-5 for the road segments identified for detailed noise modeling.
Table H-3
Traffic Volume Data for Full Build-out Design Year 2038, Alternatives 1, 3, and 4
Table H-4
Traffic Volume Data for Full Build-out Design Year 2038, Alternative 2
Peak-Hour
Total% Trucks
Peak-Hour
Total% Trucks
1 Montague Avenue [20 mph] Spruill Ave. Virginia Ave. 5,300 573 4.0 576 4.0
Montague Ave. Avenue B 12,200 1,137 12.0 1,138 10.0
Avenue B Buist Ave. 3,500 402 22.0 346 22.0
3 Noisette Boulevard [30 mph] Twiggs Str. McMillan Ave. 9,200 811 5.0 910 4.0
4 Cosgrove Avenue (SC-7) [35 mph] Spruill Ave. Rivers Ave. 18,000 1,723 5.0 1,782 4.0
Noisette Creek McMillan Ave. 15,100 1,302 14.0 1,445 11.0
McMillan Ave. Cosgrove Ave. 19,200 1,727 12.0 1,828 10.0
Cosgrove Ave. Reynolds Ave. 14,200 1,383 8.0 1,362 7.0
Reynolds Ave. N. Carolina Ave. 15,100 1,398 8.0 1,434 7.0
O'Hear Ave. Turnbull Ave. 3,600 311 2.0 341 2.0
Turnbull Ave. McMillan Ave. 3,600 311 2.0 341 2.0
7 North Rhett Avenue [40 mph] I-526 Ramp Braddock Ave. 24,200 2,155 5.0 2,158 4.0
8 Port Drayage Road (future) [30 mph] Port Access Rd. ICTF
Design Year 2038 - Alt 1, Alt 3, & Alt 4
From To AADT
AM Peak Hour PM Peak Hour
Road Segment
5 Spruill Avenue [40 mph]
6 St. Johns Avenue [30 mph]
2 Virginia Avenue [45 mph]
No. Road [Speed]
Not existent
Peak-Hour
Total% Trucks
Peak-Hour
Total% Trucks
1 Montague Avenue [20 mph] Spruill Ave. Virginia Ave. 5,300 573 4.0 576 4.0
Montague Ave. Avenue B 12,200 1,137 12.0 1,138 10.0
Avenue B Buist Ave. 3,500 402 22.0 346 22.0
3 Noisette Boulevard [30 mph] Twiggs Str. McMillan Ave. 9,200 811 5.0 910 4.0
4 Cosgrove Avenue (SC-7) [35 mph] Spruill Ave. Rivers Ave. 18,000 1,723 5.0 1,782 4.0
Noisette Creek McMillan Ave. 16,600 1,377 14.0 1,576 11.0
McMillan Ave. Cosgrove Ave. 19,200 1,727 12.0 1,828 10.0
Cosgrove Ave. Reynolds Ave. 14,200 1,383 8.0 1,362 7.0
Reynolds Ave. N. Carolina Ave. 15,100 1,398 8.0 1,434 7.0
O'Hear Ave. Turnbull Ave. 2,100 182 2.0 182 2.0
Turnbull Ave. McMillan Ave. 500 48 2.0 48 2.0
7 North Rhett Avenue [40 mph] I-526 Ramp Braddock Ave. 24,200 2,155 5.0 2,158 4.0
8 Port Drayage Road (future) [30 mph] Port Access Rd. ICTF 661 66 100.0 66 100.0
No. Road [Speed]
Road Segment Design Year 2038 - Alt 2
From To AADT
AM Peak Hour PM Peak Hour
5 Spruill Avenue [40 mph]
6 St. Johns Avenue [30 mph]
2 Virginia Avenue [45 mph]
EIS for the Proposed Navy Base Appendix H: Noise and Vibration
Intermodal Container Transfer Facility Technical Memorandum
22
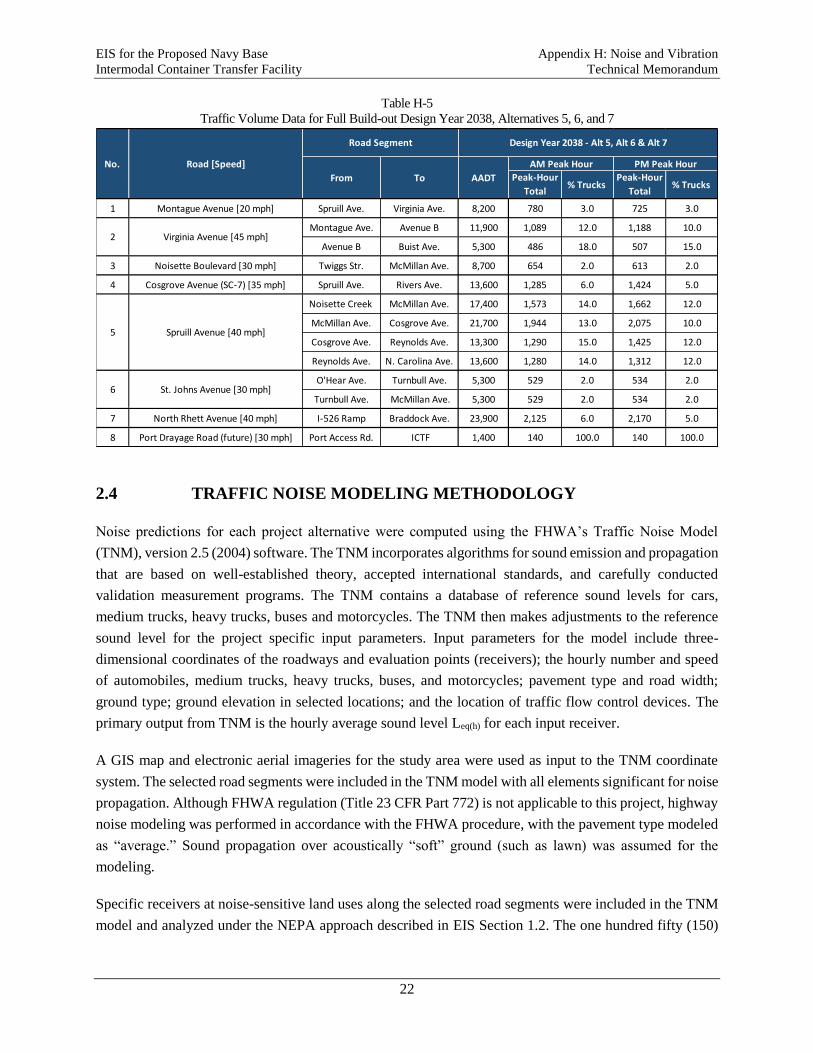
Table H-5
Traffic Volume Data for Full Build-out Design Year 2038, Alternatives 5, 6, and 7
2.4 TRAFFIC NOISE MODELING METHODOLOGY
Noise predictions for each project alternative were computed using the FHWA’s Traffic Noise Model
(TNM), version 2.5 (2004) software. The TNM incorporates algorithms for sound emission and propagation
that are based on well-established theory, accepted international standards, and carefully conducted
validation measurement programs. The TNM contains a database of reference sound levels for cars,
medium trucks, heavy trucks, buses and motorcycles. The TNM then makes adjustments to the reference
sound level for the project specific input parameters. Input parameters for the model include three-
dimensional coordinates of the roadways and evaluation points (receivers); the hourly number and speed
of automobiles, medium trucks, heavy trucks, buses, and motorcycles; pavement type and road width;
ground type; ground elevation in selected locations; and the location of traffic flow control devices. The
primary output from TNM is the hourly average sound level Leq(h) for each input receiver.
A GIS map and electronic aerial imageries for the study area were used as input to the TNM coordinate
system. The selected road segments were included in the TNM model with all elements significant for noise
propagation. Although FHWA regulation (Title 23 CFR Part 772) is not applicable to this project, highway
noise modeling was performed in accordance with the FHWA procedure, with the pavement type modeled
as “average.” Sound propagation over acoustically “soft” ground (such as lawn) was assumed for the
modeling.
Specific receivers at noise-sensitive land uses along the selected road segments were included in the TNM
model and analyzed under the NEPA approach described in EIS Section 1.2. The one hundred fifty (150)
Peak-Hour
Total% Trucks
Peak-Hour
Total% Trucks
1 Montague Avenue [20 mph] Spruill Ave. Virginia Ave. 8,200 780 3.0 725 3.0
Montague Ave. Avenue B 11,900 1,089 12.0 1,188 10.0
Avenue B Buist Ave. 5,300 486 18.0 507 15.0
3 Noisette Boulevard [30 mph] Twiggs Str. McMillan Ave. 8,700 654 2.0 613 2.0
4 Cosgrove Avenue (SC-7) [35 mph] Spruill Ave. Rivers Ave. 13,600 1,285 6.0 1,424 5.0
Noisette Creek McMillan Ave. 17,400 1,573 14.0 1,662 12.0
McMillan Ave. Cosgrove Ave. 21,700 1,944 13.0 2,075 10.0
Cosgrove Ave. Reynolds Ave. 13,300 1,290 15.0 1,425 12.0
Reynolds Ave. N. Carolina Ave. 13,600 1,280 14.0 1,312 12.0
O'Hear Ave. Turnbull Ave. 5,300 529 2.0 534 2.0
Turnbull Ave. McMillan Ave. 5,300 529 2.0 534 2.0
7 North Rhett Avenue [40 mph] I-526 Ramp Braddock Ave. 23,900 2,125 6.0 2,170 5.0
8 Port Drayage Road (future) [30 mph] Port Access Rd. ICTF 1,400 140 100.0 140 100.0
PM Peak HourNo. Road [Speed]
Road Segment
6 St. Johns Avenue [30 mph]
5 Spruill Avenue [40 mph]
2 Virginia Avenue [45 mph]
Design Year 2038 - Alt 5, Alt 6 & Alt 7
From To AADT
AM Peak Hour
EIS for the Proposed Navy Base Appendix H: Noise and Vibration
Intermodal Container Transfer Facility Technical Memorandum
23
receiver locations identified as described in section 2.2 of this memorandum represent mostly residential
land uses (single- and multi-family residences), churches, schools, parks and recreation areas.
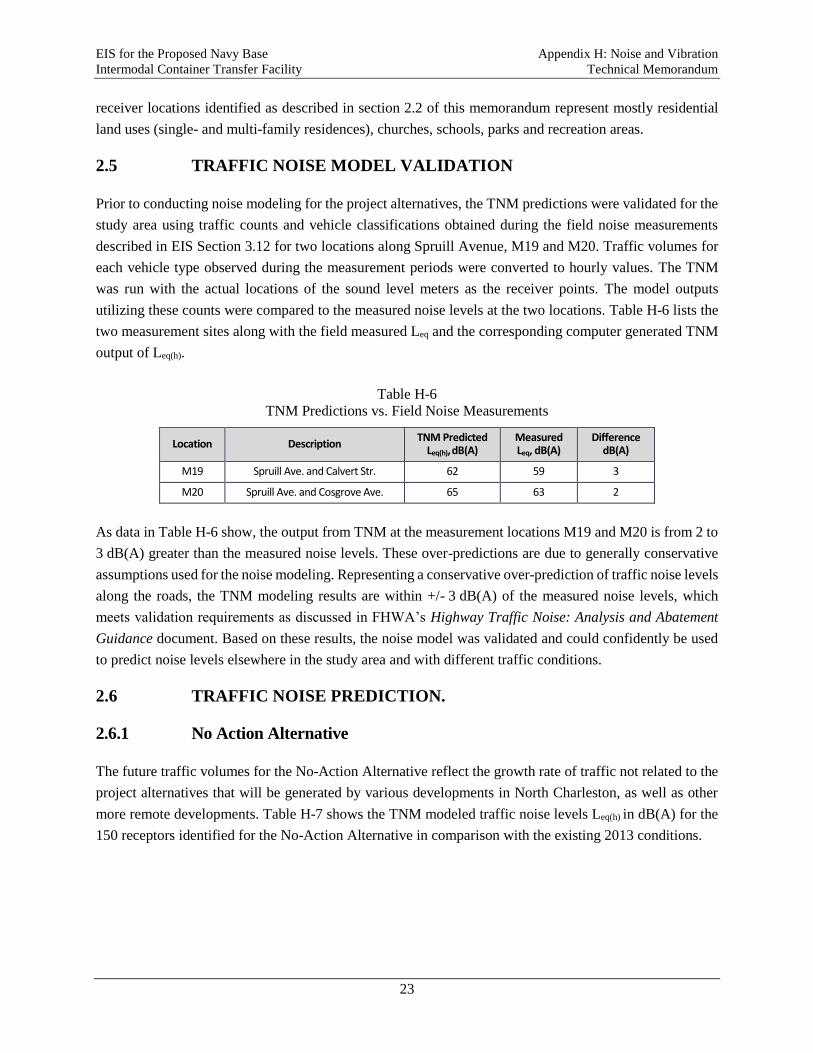
2.5 TRAFFIC NOISE MODEL VALIDATION
Prior to conducting noise modeling for the project alternatives, the TNM predictions were validated for the
study area using traffic counts and vehicle classifications obtained during the field noise measurements
described in EIS Section 3.12 for two locations along Spruill Avenue, M19 and M20. Traffic volumes for
each vehicle type observed during the measurement periods were converted to hourly values. The TNM
was run with the actual locations of the sound level meters as the receiver points. The model outputs
utilizing these counts were compared to the measured noise levels at the two locations. Table H-6 lists the
two measurement sites along with the field measured Leq and the corresponding computer generated TNM
output of Leq(h).
Table H-6
TNM Predictions vs. Field Noise Measurements
Location Description TNM Predicted
Leq(h), dB(A) Measured Leq, dB(A)
Difference dB(A)
M19 Spruill Ave. and Calvert Str. 62 59 3
M20 Spruill Ave. and Cosgrove Ave. 65 63 2
As data in Table H-6 show, the output from TNM at the measurement locations M19 and M20 is from 2 to
3 dB(A) greater than the measured noise levels. These over-predictions are due to generally conservative
assumptions used for the noise modeling. Representing a conservative over-prediction of traffic noise levels
along the roads, the TNM modeling results are within +/- 3 dB(A) of the measured noise levels, which
meets validation requirements as discussed in FHWA’s Highway Traffic Noise: Analysis and Abatement
Guidance document. Based on these results, the noise model was validated and could confidently be used
to predict noise levels elsewhere in the study area and with different traffic conditions.
2.6 TRAFFIC NOISE PREDICTION.
2.6.1 No Action Alternative
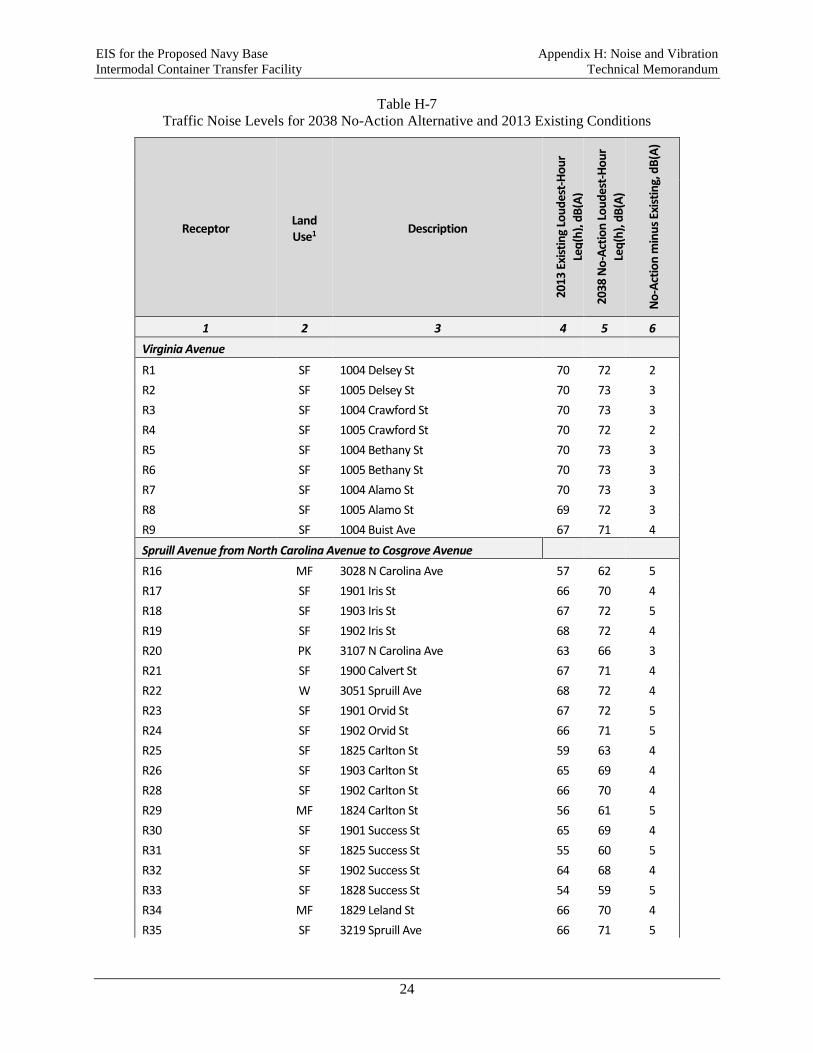
The future traffic volumes for the No-Action Alternative reflect the growth rate of traffic not related to the
project alternatives that will be generated by various developments in North Charleston, as well as other
more remote developments. Table H-7 shows the TNM modeled traffic noise levels Leq(h) in dB(A) for the
150 receptors identified for the No-Action Alternative in comparison with the existing 2013 conditions.
EIS for the Proposed Navy Base Appendix H: Noise and Vibration
Intermodal Container Transfer Facility Technical Memorandum
24
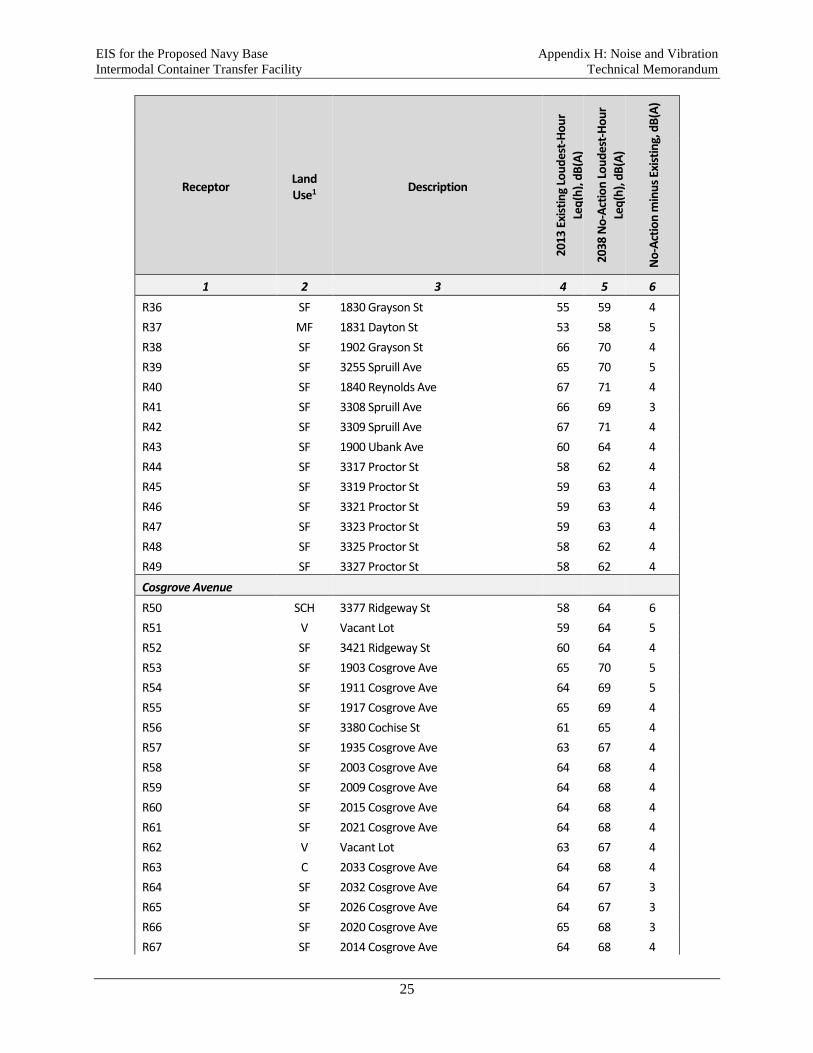
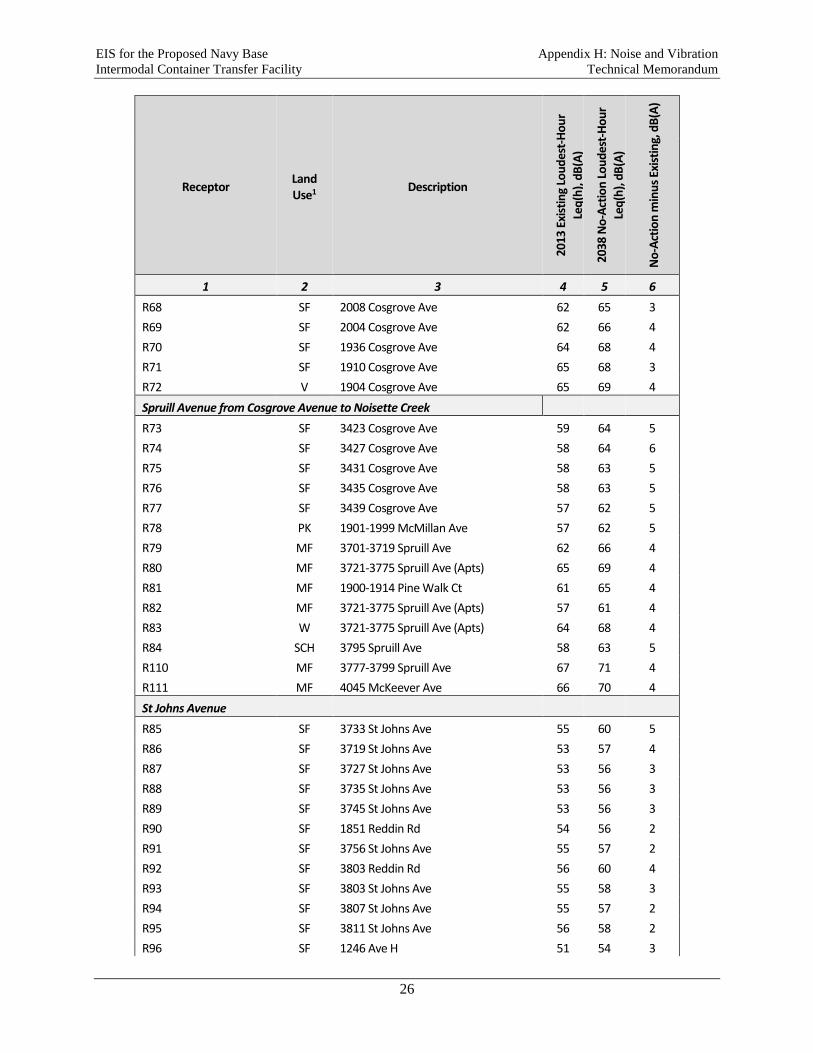
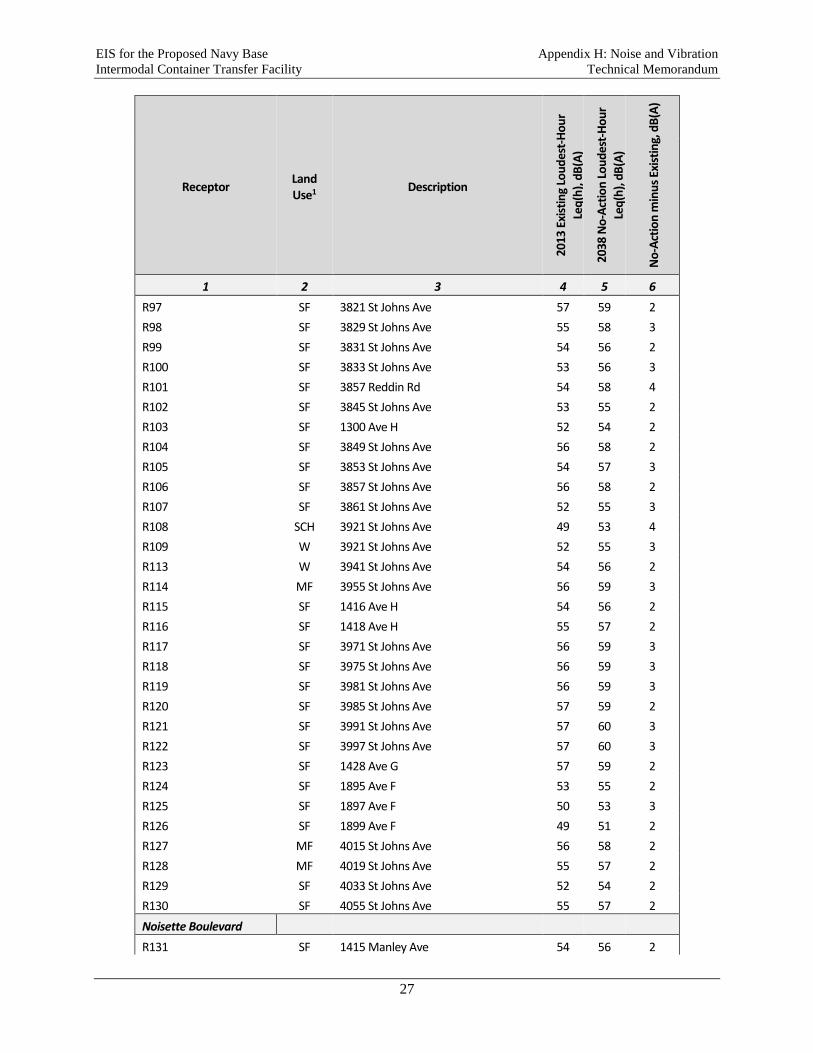
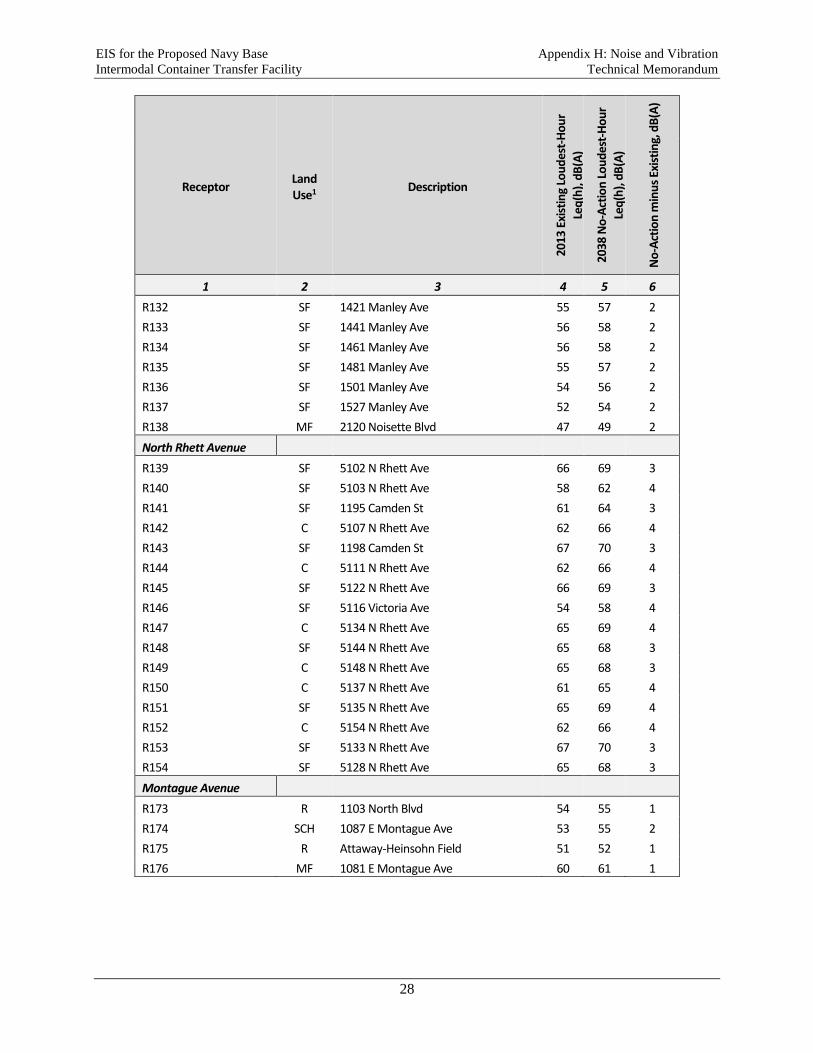
Table H-7
Traffic Noise Levels for 2038 No-Action Alternative and 2013 Existing Conditions
Receptor Land Use1
Description
2013
Exi
stin
g Lo
ud
est-
Ho
ur
Leq
(h),
dB
(A)
2038
No
-Act
ion
Lo
ud
est-
Ho
ur
Leq
(h),
dB
(A)
No
-Act
ion
min
us
Exis
tin
g, d
B(A
)
1 2 3 4 5 6
Virginia Avenue
R1 SF 1004 Delsey St 70 72 2
R2 SF 1005 Delsey St 70 73 3
R3 SF 1004 Crawford St 70 73 3
R4 SF 1005 Crawford St 70 72 2
R5 SF 1004 Bethany St 70 73 3
R6 SF 1005 Bethany St 70 73 3
R7 SF 1004 Alamo St 70 73 3
R8 SF 1005 Alamo St 69 72 3
R9 SF 1004 Buist Ave 67 71 4
Spruill Avenue from North Carolina Avenue to Cosgrove Avenue
R16 MF 3028 N Carolina Ave 57 62 5
R17 SF 1901 Iris St 66 70 4
R18 SF 1903 Iris St 67 72 5
R19 SF 1902 Iris St 68 72 4
R20 PK 3107 N Carolina Ave 63 66 3
R21 SF 1900 Calvert St 67 71 4
R22 W 3051 Spruill Ave 68 72 4
R23 SF 1901 Orvid St 67 72 5
R24 SF 1902 Orvid St 66 71 5
R25 SF 1825 Carlton St 59 63 4
R26 SF 1903 Carlton St 65 69 4
R28 SF 1902 Carlton St 66 70 4
R29 MF 1824 Carlton St 56 61 5
R30 SF 1901 Success St 65 69 4
R31 SF 1825 Success St 55 60 5
R32 SF 1902 Success St 64 68 4
R33 SF 1828 Success St 54 59 5
R34 MF 1829 Leland St 66 70 4
R35 SF 3219 Spruill Ave 66 71 5
EIS for the Proposed Navy Base Appendix H: Noise and Vibration
Intermodal Container Transfer Facility Technical Memorandum
25
Receptor Land Use1
Description
2013
Exi
stin
g Lo
ud
est-
Ho
ur
Leq
(h),
dB
(A)
2038
No
-Act
ion
Lo
ud
est-
Ho
ur
Leq
(h),
dB
(A)
No
-Act
ion
min
us
Exis
tin
g, d
B(A
)
1 2 3 4 5 6
R36 SF 1830 Grayson St 55 59 4
R37 MF 1831 Dayton St 53 58 5
R38 SF 1902 Grayson St 66 70 4
R39 SF 3255 Spruill Ave 65 70 5
R40 SF 1840 Reynolds Ave 67 71 4
R41 SF 3308 Spruill Ave 66 69 3
R42 SF 3309 Spruill Ave 67 71 4
R43 SF 1900 Ubank Ave 60 64 4
R44 SF 3317 Proctor St 58 62 4
R45 SF 3319 Proctor St 59 63 4
R46 SF 3321 Proctor St 59 63 4
R47 SF 3323 Proctor St 59 63 4
R48 SF 3325 Proctor St 58 62 4
R49 SF 3327 Proctor St 58 62 4
Cosgrove Avenue
R50 SCH 3377 Ridgeway St 58 64 6
R51 V Vacant Lot 59 64 5
R52 SF 3421 Ridgeway St 60 64 4
R53 SF 1903 Cosgrove Ave 65 70 5
R54 SF 1911 Cosgrove Ave 64 69 5
R55 SF 1917 Cosgrove Ave 65 69 4
R56 SF 3380 Cochise St 61 65 4
R57 SF 1935 Cosgrove Ave 63 67 4
R58 SF 2003 Cosgrove Ave 64 68 4
R59 SF 2009 Cosgrove Ave 64 68 4
R60 SF 2015 Cosgrove Ave 64 68 4
R61 SF 2021 Cosgrove Ave 64 68 4
R62 V Vacant Lot 63 67 4
R63 C 2033 Cosgrove Ave 64 68 4
R64 SF 2032 Cosgrove Ave 64 67 3
R65 SF 2026 Cosgrove Ave 64 67 3
R66 SF 2020 Cosgrove Ave 65 68 3
R67 SF 2014 Cosgrove Ave 64 68 4
EIS for the Proposed Navy Base Appendix H: Noise and Vibration
Intermodal Container Transfer Facility Technical Memorandum
26
Receptor Land Use1
Description
2013
Exi
stin
g Lo
ud
est-
Ho
ur
Leq
(h),
dB
(A)
2038
No
-Act
ion
Lo
ud
est-
Ho
ur
Leq
(h),
dB
(A)
No
-Act
ion
min
us
Exis
tin
g, d
B(A
)
1 2 3 4 5 6
R68 SF 2008 Cosgrove Ave 62 65 3
R69 SF 2004 Cosgrove Ave 62 66 4
R70 SF 1936 Cosgrove Ave 64 68 4
R71 SF 1910 Cosgrove Ave 65 68 3
R72 V 1904 Cosgrove Ave 65 69 4
Spruill Avenue from Cosgrove Avenue to Noisette Creek
R73 SF 3423 Cosgrove Ave 59 64 5
R74 SF 3427 Cosgrove Ave 58 64 6
R75 SF 3431 Cosgrove Ave 58 63 5
R76 SF 3435 Cosgrove Ave 58 63 5
R77 SF 3439 Cosgrove Ave 57 62 5
R78 PK 1901-1999 McMillan Ave 57 62 5
R79 MF 3701-3719 Spruill Ave 62 66 4
R80 MF 3721-3775 Spruill Ave (Apts) 65 69 4
R81 MF 1900-1914 Pine Walk Ct 61 65 4
R82 MF 3721-3775 Spruill Ave (Apts) 57 61 4
R83 W 3721-3775 Spruill Ave (Apts) 64 68 4
R84 SCH 3795 Spruill Ave 58 63 5
R110 MF 3777-3799 Spruill Ave 67 71 4
R111 MF 4045 McKeever Ave 66 70 4
St Johns Avenue
R85 SF 3733 St Johns Ave 55 60 5
R86 SF 3719 St Johns Ave 53 57 4
R87 SF 3727 St Johns Ave 53 56 3
R88 SF 3735 St Johns Ave 53 56 3
R89 SF 3745 St Johns Ave 53 56 3
R90 SF 1851 Reddin Rd 54 56 2
R91 SF 3756 St Johns Ave 55 57 2
R92 SF 3803 Reddin Rd 56 60 4
R93 SF 3803 St Johns Ave 55 58 3
R94 SF 3807 St Johns Ave 55 57 2
R95 SF 3811 St Johns Ave 56 58 2
R96 SF 1246 Ave H 51 54 3
EIS for the Proposed Navy Base Appendix H: Noise and Vibration
Intermodal Container Transfer Facility Technical Memorandum
27
Receptor Land Use1
Description
2013
Exi
stin
g Lo
ud
est-
Ho
ur
Leq
(h),
dB
(A)
2038
No
-Act
ion
Lo
ud
est-
Ho
ur
Leq
(h),
dB
(A)
No
-Act
ion
min
us
Exis
tin
g, d
B(A
)
1 2 3 4 5 6
R97 SF 3821 St Johns Ave 57 59 2
R98 SF 3829 St Johns Ave 55 58 3
R99 SF 3831 St Johns Ave 54 56 2
R100 SF 3833 St Johns Ave 53 56 3
R101 SF 3857 Reddin Rd 54 58 4
R102 SF 3845 St Johns Ave 53 55 2
R103 SF 1300 Ave H 52 54 2
R104 SF 3849 St Johns Ave 56 58 2
R105 SF 3853 St Johns Ave 54 57 3
R106 SF 3857 St Johns Ave 56 58 2
R107 SF 3861 St Johns Ave 52 55 3
R108 SCH 3921 St Johns Ave 49 53 4
R109 W 3921 St Johns Ave 52 55 3
R113 W 3941 St Johns Ave 54 56 2
R114 MF 3955 St Johns Ave 56 59 3
R115 SF 1416 Ave H 54 56 2
R116 SF 1418 Ave H 55 57 2
R117 SF 3971 St Johns Ave 56 59 3
R118 SF 3975 St Johns Ave 56 59 3
R119 SF 3981 St Johns Ave 56 59 3
R120 SF 3985 St Johns Ave 57 59 2
R121 SF 3991 St Johns Ave 57 60 3
R122 SF 3997 St Johns Ave 57 60 3
R123 SF 1428 Ave G 57 59 2
R124 SF 1895 Ave F 53 55 2
R125 SF 1897 Ave F 50 53 3
R126 SF 1899 Ave F 49 51 2
R127 MF 4015 St Johns Ave 56 58 2
R128 MF 4019 St Johns Ave 55 57 2
R129 SF 4033 St Johns Ave 52 54 2
R130 SF 4055 St Johns Ave 55 57 2
Noisette Boulevard
R131 SF 1415 Manley Ave 54 56 2
EIS for the Proposed Navy Base Appendix H: Noise and Vibration
Intermodal Container Transfer Facility Technical Memorandum
28
Receptor Land Use1
Description
2013
Exi
stin
g Lo
ud
est-
Ho
ur
Leq
(h),
dB
(A)
2038
No
-Act
ion
Lo
ud
est-
Ho
ur
Leq
(h),
dB
(A)
No
-Act
ion
min
us
Exis
tin
g, d
B(A
)
1 2 3 4 5 6
R132 SF 1421 Manley Ave 55 57 2
R133 SF 1441 Manley Ave 56 58 2
R134 SF 1461 Manley Ave 56 58 2
R135 SF 1481 Manley Ave 55 57 2
R136 SF 1501 Manley Ave 54 56 2
R137 SF 1527 Manley Ave 52 54 2
R138 MF 2120 Noisette Blvd 47 49 2
North Rhett Avenue
R139 SF 5102 N Rhett Ave 66 69 3
R140 SF 5103 N Rhett Ave 58 62 4
R141 SF 1195 Camden St 61 64 3
R142 C 5107 N Rhett Ave 62 66 4
R143 SF 1198 Camden St 67 70 3
R144 C 5111 N Rhett Ave 62 66 4
R145 SF 5122 N Rhett Ave 66 69 3
R146 SF 5116 Victoria Ave 54 58 4
R147 C 5134 N Rhett Ave 65 69 4
R148 SF 5144 N Rhett Ave 65 68 3
R149 C 5148 N Rhett Ave 65 68 3
R150 C 5137 N Rhett Ave 61 65 4
R151 SF 5135 N Rhett Ave 65 69 4
R152 C 5154 N Rhett Ave 62 66 4
R153 SF 5133 N Rhett Ave 67 70 3
R154 SF 5128 N Rhett Ave 65 68 3
Montague Avenue
R173 R 1103 North Blvd 54 55 1
R174 SCH 1087 E Montague Ave 53 55 2
R175 R Attaway-Heinsohn Field 51 52 1
R176 MF 1081 E Montague Ave 60 61 1
EIS for the Proposed Navy Base Appendix H: Noise and Vibration
Intermodal Container Transfer Facility Technical Memorandum
29
The loudest-hour Leq(h) at the receptors for the existing conditions (column 4) vary considerably for the
selected roads. At the receptors along Virginia Avenue, the existing noise levels are relatively high, from
67 to 70 dB(A). The existing loudest-hour noise levels at the receptors along St. Johns Avenue are relatively
low, from 49 to 57 dB(A). Consistent with the growth in traffic volumes that are not project related, the
traffic noise levels for the 2038 No-Action Alternative would exceed the existing 2013 noise levels. As can
be seen from Table H-7, the loudest-hour noise levels for the No-Action Alternative would increase by 1 to
6 dB(A) versus the existing 2013 condition for most of the noise receptors. For several receptors along
Cosgrove Avenue/Spruill Avenue, the increase in traffic noise levels up to 6 dB(A) is projected for the No-
Action Alternative compared to the 2013 existing conditions. This increase would be caused by growth of
traffic volumes, including an increase in the number of heavy trucks during the loudest hour projected for
the No-Action Alternative. The No-Action loudest-hour noise levels at the receptors would vary for
different road segments. The lowest No-Action noise levels of 52 to 55 dB(A) would be experienced at
several receptors along Montague Avenue. Several noise-sensitive receptors along Spruill Avenue and
Virginia Avenue would be subject to relatively high traffic noise levels up to 73 dB(A) under the No-Action
Alternative. The No-Action noise level increase versus the existing condition does not constitute the
project-related noise impact. Noise levels for the No-Action Alternative are used as a baseline to which the
project alternatives are compared in the sub-sections below to determine noise impact for the project
alternatives.
2.6.2 Build Alternatives
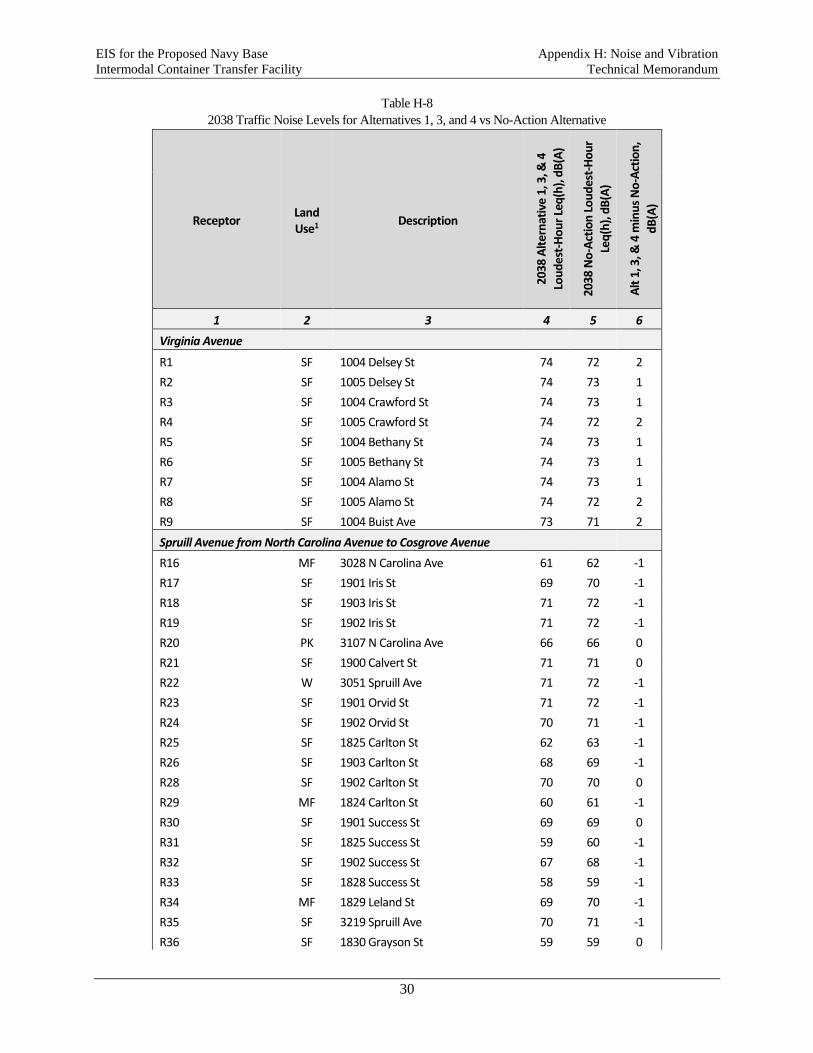
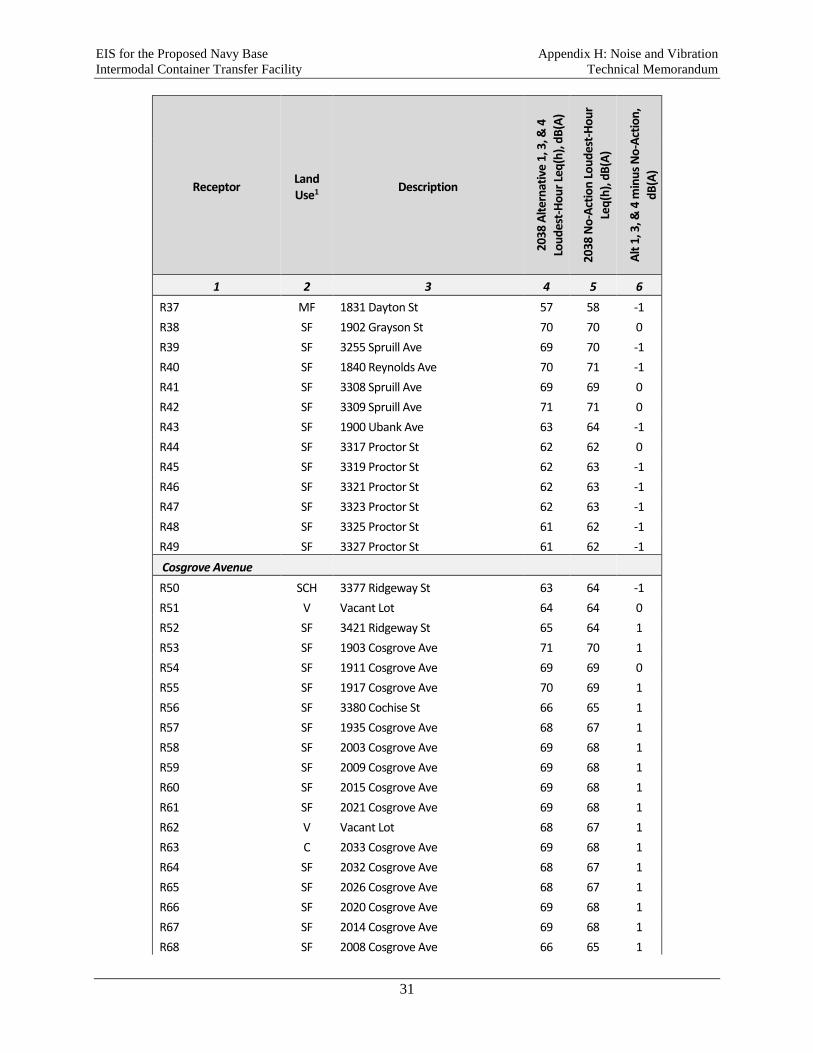
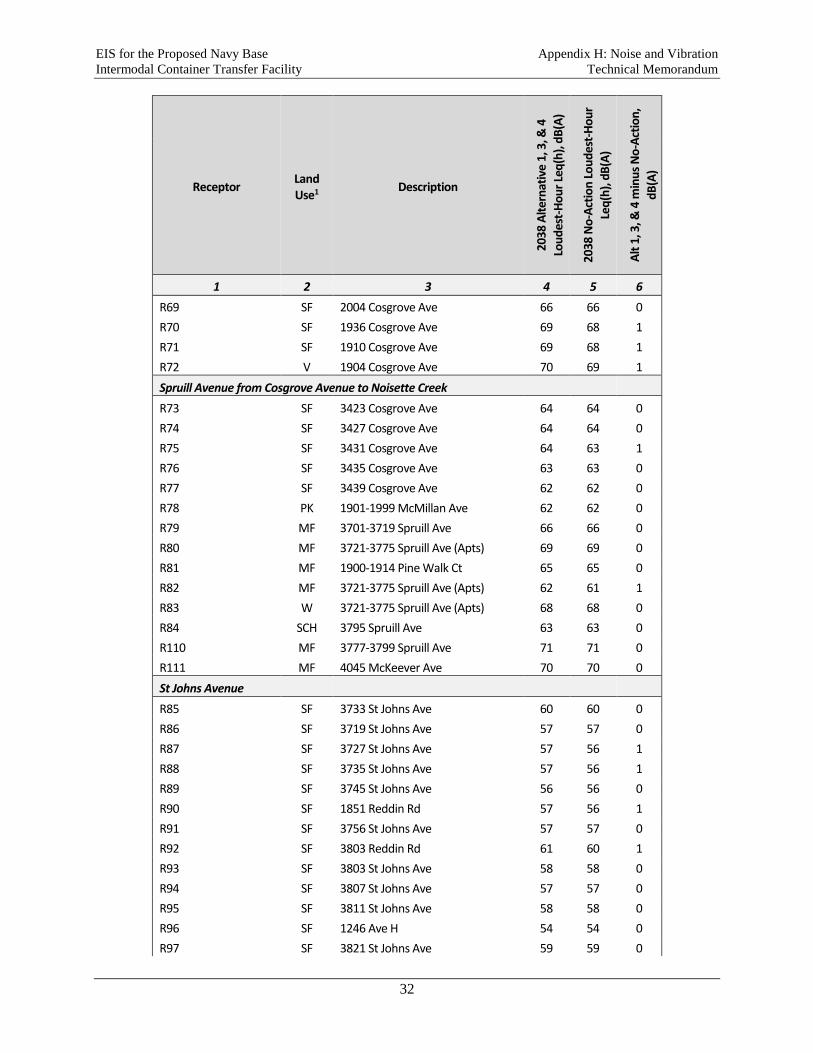
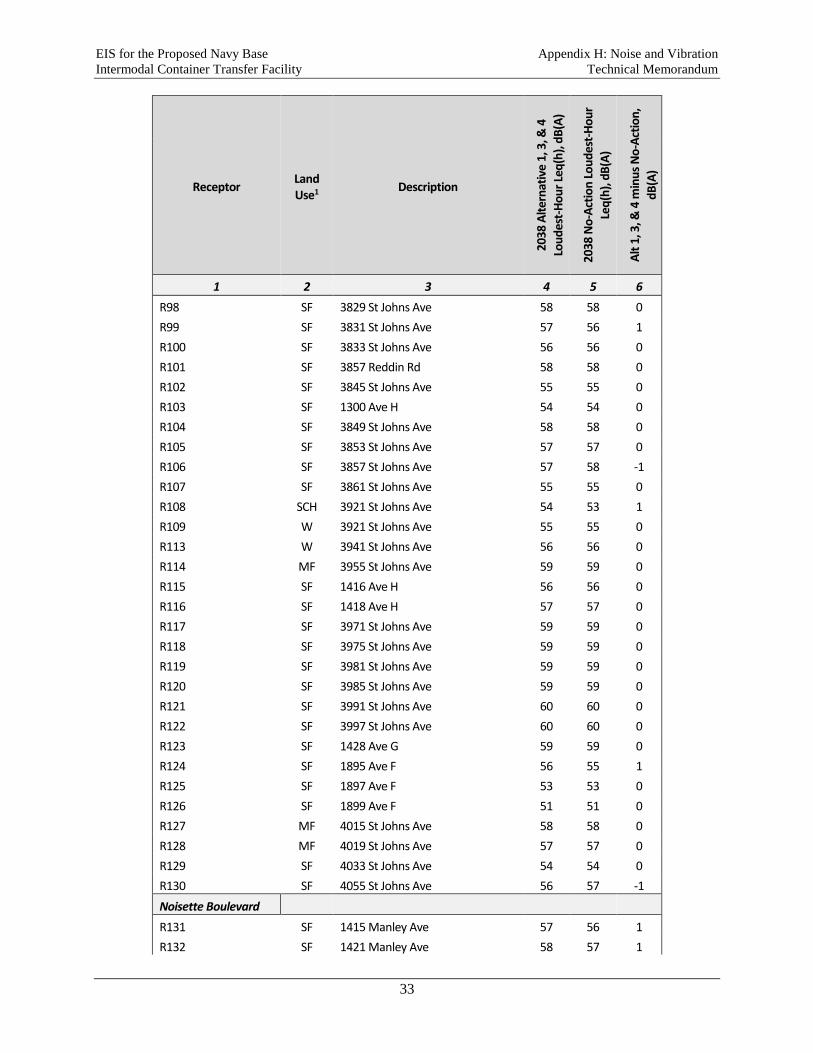
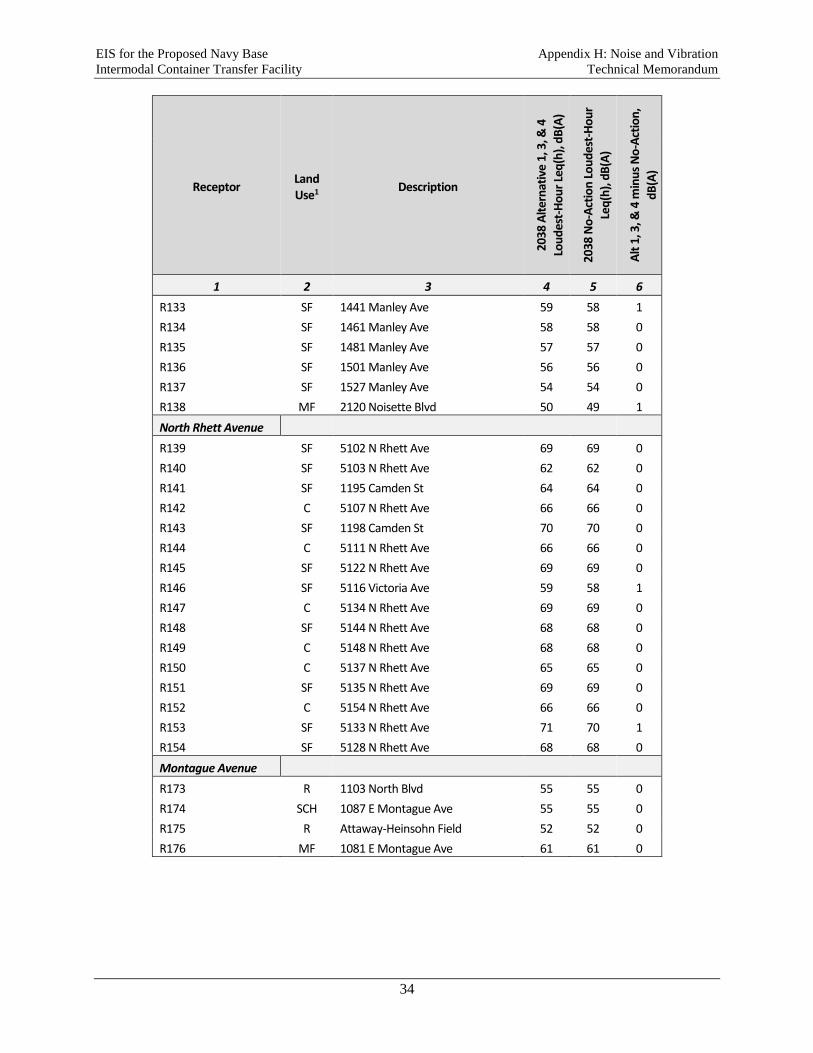
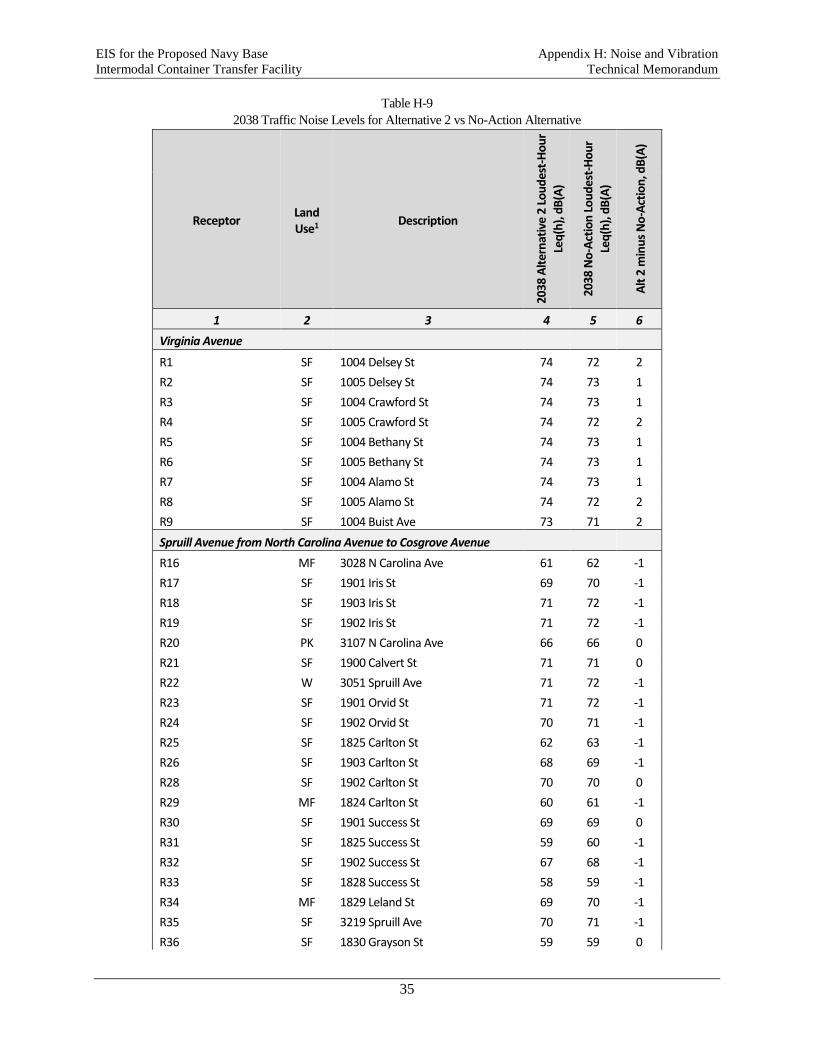
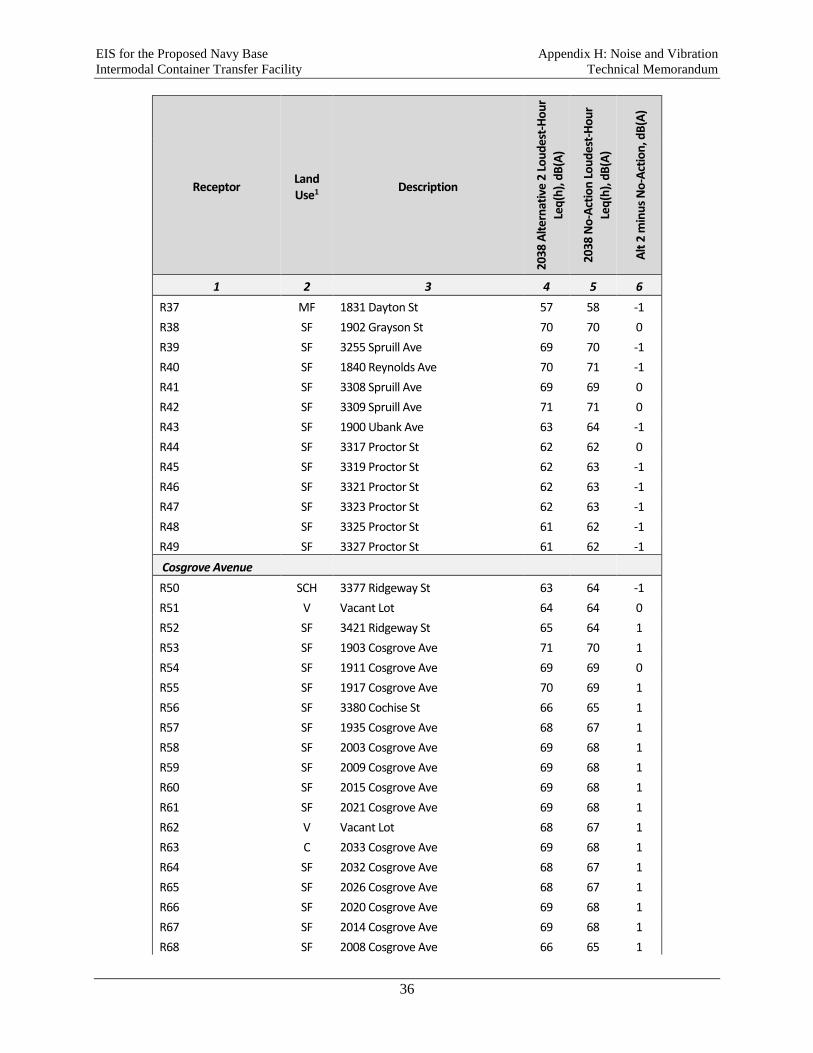
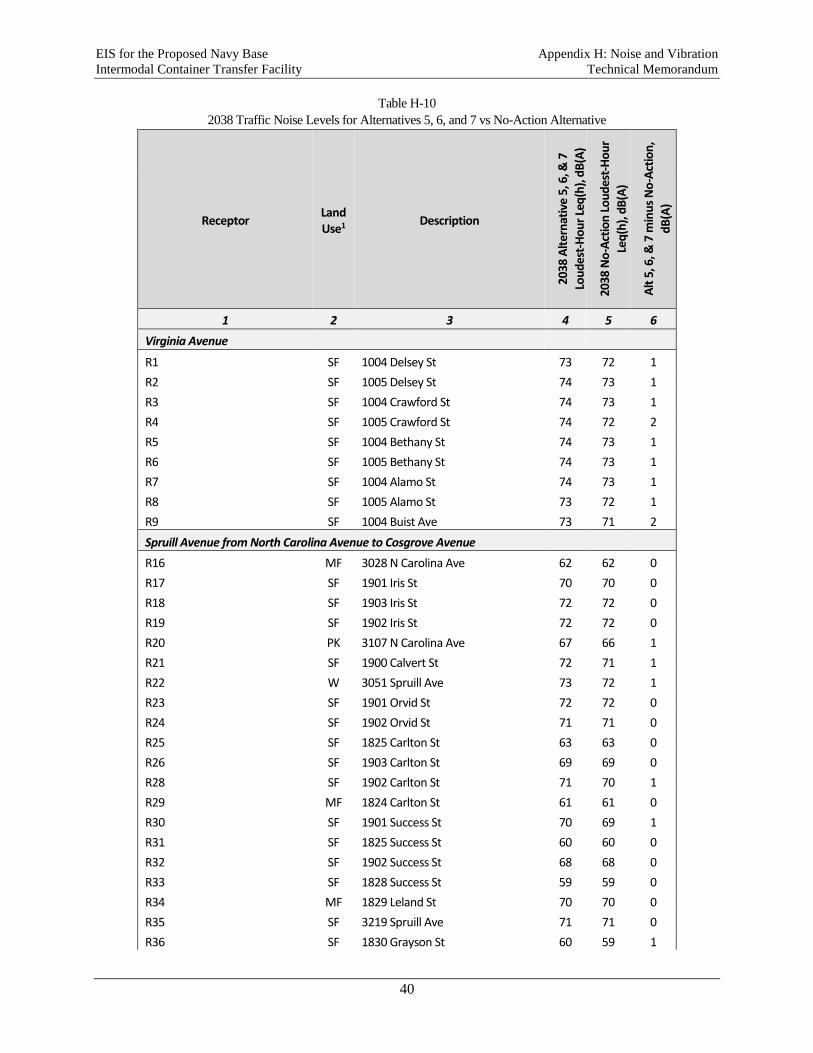
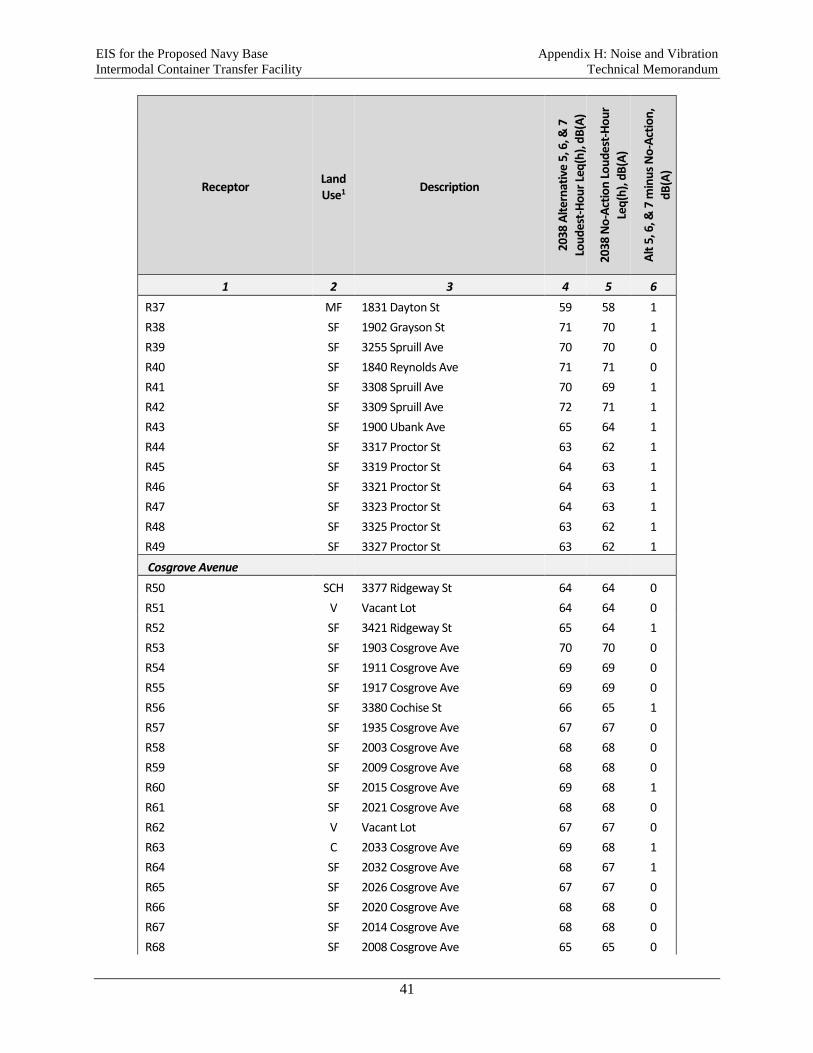
Tables H-8, H-9, and H-10 show the TNM modeled traffic noise levels Leq(h) in dB(A) for receptors
identified for Alternatives 1 through 7 and compare those with the No-Action noise levels discussed in the
previous section. Since traffic projections for Alternatives 1, 3, and 4 are identical, the modeled noise levels
for these three alternatives are also identical and are all identified in Table H-8. Likewise, Alternatives 5,
6, and 7 are identical and are included in Table H-10. Eighteen additional receivers are included for
Alternatives 5, 6, and 7 in order to capture estimated traffic noise due to the proposed build location of Port
drayage road for the River Center site. Positive values in column 6 indicate an increase in the noise level
due to the selected build alternative in comparison with No-Action Alternative, and thus a potential for
noise impact. Zero values indicate no change in the noise level between the build alternative and No-Action
Alternative (no impact). The traffic volumes for some of the road segments for certain alternatives (for
example, Spruill Avenue and St. Johns Avenue for Alternative 1) are predicted lower than for the No-
Action Alternative due to projected changes in the traffic patterns for these road segments; these traffic
volume decreases result in reduction of the noise levels generated for a number of receptors and the negative
values of related differentials indicated in column 6 of the tables (improvement of noise conditions).
EIS for the Proposed Navy Base Appendix H: Noise and Vibration
Intermodal Container Transfer Facility Technical Memorandum
30
Table H-8
2038 Traffic Noise Levels for Alternatives 1, 3, and 4 vs No-Action Alternative
Receptor Land Use1
Description
2038
Alt
ern
ativ
e 1,
3, &
4
Lou
des
t-H
ou
r Le
q(h
), d
B(A
)
2038
No
-Act
ion
Lo
ud
est-
Ho
ur
Leq
(h),
dB
(A)
Alt
1, 3
, & 4
min
us
No
-Act
ion
,
dB
(A)
1 2 3 4 5 6
Virginia Avenue
R1 SF 1004 Delsey St 74 72 2
R2 SF 1005 Delsey St 74 73 1
R3 SF 1004 Crawford St 74 73 1
R4 SF 1005 Crawford St 74 72 2
R5 SF 1004 Bethany St 74 73 1
R6 SF 1005 Bethany St 74 73 1
R7 SF 1004 Alamo St 74 73 1
R8 SF 1005 Alamo St 74 72 2
R9 SF 1004 Buist Ave 73 71 2
Spruill Avenue from North Carolina Avenue to Cosgrove Avenue
R16 MF 3028 N Carolina Ave 61 62 -1
R17 SF 1901 Iris St 69 70 -1
R18 SF 1903 Iris St 71 72 -1
R19 SF 1902 Iris St 71 72 -1
R20 PK 3107 N Carolina Ave 66 66 0
R21 SF 1900 Calvert St 71 71 0
R22 W 3051 Spruill Ave 71 72 -1
R23 SF 1901 Orvid St 71 72 -1
R24 SF 1902 Orvid St 70 71 -1
R25 SF 1825 Carlton St 62 63 -1
R26 SF 1903 Carlton St 68 69 -1
R28 SF 1902 Carlton St 70 70 0
R29 MF 1824 Carlton St 60 61 -1
R30 SF 1901 Success St 69 69 0
R31 SF 1825 Success St 59 60 -1
R32 SF 1902 Success St 67 68 -1
R33 SF 1828 Success St 58 59 -1
R34 MF 1829 Leland St 69 70 -1
R35 SF 3219 Spruill Ave 70 71 -1
R36 SF 1830 Grayson St 59 59 0
EIS for the Proposed Navy Base Appendix H: Noise and Vibration
Intermodal Container Transfer Facility Technical Memorandum
31
Receptor Land Use1
Description
2038
Alt
ern
ativ
e 1,
3, &
4
Lou
des
t-H
ou
r Le
q(h
), d
B(A
)
2038
No
-Act
ion
Lo
ud
est-
Ho
ur
Leq
(h),
dB
(A)
Alt
1, 3
, & 4
min
us
No
-Act
ion
,
dB
(A)
1 2 3 4 5 6
R37 MF 1831 Dayton St 57 58 -1
R38 SF 1902 Grayson St 70 70 0
R39 SF 3255 Spruill Ave 69 70 -1
R40 SF 1840 Reynolds Ave 70 71 -1
R41 SF 3308 Spruill Ave 69 69 0
R42 SF 3309 Spruill Ave 71 71 0
R43 SF 1900 Ubank Ave 63 64 -1
R44 SF 3317 Proctor St 62 62 0
R45 SF 3319 Proctor St 62 63 -1
R46 SF 3321 Proctor St 62 63 -1
R47 SF 3323 Proctor St 62 63 -1
R48 SF 3325 Proctor St 61 62 -1
R49 SF 3327 Proctor St 61 62 -1
Cosgrove Avenue
R50 SCH 3377 Ridgeway St 63 64 -1
R51 V Vacant Lot 64 64 0
R52 SF 3421 Ridgeway St 65 64 1
R53 SF 1903 Cosgrove Ave 71 70 1
R54 SF 1911 Cosgrove Ave 69 69 0
R55 SF 1917 Cosgrove Ave 70 69 1
R56 SF 3380 Cochise St 66 65 1
R57 SF 1935 Cosgrove Ave 68 67 1
R58 SF 2003 Cosgrove Ave 69 68 1
R59 SF 2009 Cosgrove Ave 69 68 1
R60 SF 2015 Cosgrove Ave 69 68 1
R61 SF 2021 Cosgrove Ave 69 68 1
R62 V Vacant Lot 68 67 1
R63 C 2033 Cosgrove Ave 69 68 1
R64 SF 2032 Cosgrove Ave 68 67 1
R65 SF 2026 Cosgrove Ave 68 67 1
R66 SF 2020 Cosgrove Ave 69 68 1
R67 SF 2014 Cosgrove Ave 69 68 1
R68 SF 2008 Cosgrove Ave 66 65 1
EIS for the Proposed Navy Base Appendix H: Noise and Vibration
Intermodal Container Transfer Facility Technical Memorandum
32
Receptor Land Use1
Description
2038
Alt
ern
ativ
e 1,
3, &
4
Lou
des
t-H
ou
r Le
q(h
), d
B(A
)
2038
No
-Act
ion
Lo
ud
est-
Ho
ur
Leq
(h),
dB
(A)
Alt
1, 3
, & 4
min
us
No
-Act
ion
,
dB
(A)
1 2 3 4 5 6
R69 SF 2004 Cosgrove Ave 66 66 0
R70 SF 1936 Cosgrove Ave 69 68 1
R71 SF 1910 Cosgrove Ave 69 68 1
R72 V 1904 Cosgrove Ave 70 69 1
Spruill Avenue from Cosgrove Avenue to Noisette Creek
R73 SF 3423 Cosgrove Ave 64 64 0
R74 SF 3427 Cosgrove Ave 64 64 0
R75 SF 3431 Cosgrove Ave 64 63 1
R76 SF 3435 Cosgrove Ave 63 63 0
R77 SF 3439 Cosgrove Ave 62 62 0
R78 PK 1901-1999 McMillan Ave 62 62 0
R79 MF 3701-3719 Spruill Ave 66 66 0
R80 MF 3721-3775 Spruill Ave (Apts) 69 69 0
R81 MF 1900-1914 Pine Walk Ct 65 65 0
R82 MF 3721-3775 Spruill Ave (Apts) 62 61 1
R83 W 3721-3775 Spruill Ave (Apts) 68 68 0
R84 SCH 3795 Spruill Ave 63 63 0
R110 MF 3777-3799 Spruill Ave 71 71 0
R111 MF 4045 McKeever Ave 70 70 0
St Johns Avenue
R85 SF 3733 St Johns Ave 60 60 0
R86 SF 3719 St Johns Ave 57 57 0
R87 SF 3727 St Johns Ave 57 56 1
R88 SF 3735 St Johns Ave 57 56 1
R89 SF 3745 St Johns Ave 56 56 0
R90 SF 1851 Reddin Rd 57 56 1
R91 SF 3756 St Johns Ave 57 57 0
R92 SF 3803 Reddin Rd 61 60 1
R93 SF 3803 St Johns Ave 58 58 0
R94 SF 3807 St Johns Ave 57 57 0
R95 SF 3811 St Johns Ave 58 58 0
R96 SF 1246 Ave H 54 54 0
R97 SF 3821 St Johns Ave 59 59 0
EIS for the Proposed Navy Base Appendix H: Noise and Vibration
Intermodal Container Transfer Facility Technical Memorandum
33
Receptor Land Use1
Description
2038
Alt
ern
ativ
e 1,
3, &
4
Lou
des
t-H
ou
r Le
q(h
), d
B(A
)
2038
No
-Act
ion
Lo
ud
est-
Ho
ur
Leq
(h),
dB
(A)
Alt
1, 3
, & 4
min
us
No
-Act
ion
,
dB
(A)
1 2 3 4 5 6
R98 SF 3829 St Johns Ave 58 58 0
R99 SF 3831 St Johns Ave 57 56 1
R100 SF 3833 St Johns Ave 56 56 0
R101 SF 3857 Reddin Rd 58 58 0
R102 SF 3845 St Johns Ave 55 55 0
R103 SF 1300 Ave H 54 54 0
R104 SF 3849 St Johns Ave 58 58 0
R105 SF 3853 St Johns Ave 57 57 0
R106 SF 3857 St Johns Ave 57 58 -1
R107 SF 3861 St Johns Ave 55 55 0
R108 SCH 3921 St Johns Ave 54 53 1
R109 W 3921 St Johns Ave 55 55 0
R113 W 3941 St Johns Ave 56 56 0
R114 MF 3955 St Johns Ave 59 59 0
R115 SF 1416 Ave H 56 56 0
R116 SF 1418 Ave H 57 57 0
R117 SF 3971 St Johns Ave 59 59 0
R118 SF 3975 St Johns Ave 59 59 0
R119 SF 3981 St Johns Ave 59 59 0
R120 SF 3985 St Johns Ave 59 59 0
R121 SF 3991 St Johns Ave 60 60 0
R122 SF 3997 St Johns Ave 60 60 0
R123 SF 1428 Ave G 59 59 0
R124 SF 1895 Ave F 56 55 1
R125 SF 1897 Ave F 53 53 0
R126 SF 1899 Ave F 51 51 0
R127 MF 4015 St Johns Ave 58 58 0
R128 MF 4019 St Johns Ave 57 57 0
R129 SF 4033 St Johns Ave 54 54 0
R130 SF 4055 St Johns Ave 56 57 -1
Noisette Boulevard
R131 SF 1415 Manley Ave 57 56 1
R132 SF 1421 Manley Ave 58 57 1
EIS for the Proposed Navy Base Appendix H: Noise and Vibration
Intermodal Container Transfer Facility Technical Memorandum
34
Receptor Land Use1
Description
2038
Alt
ern
ativ
e 1,
3, &
4
Lou
des
t-H
ou
r Le
q(h
), d
B(A
)
2038
No
-Act
ion
Lo
ud
est-
Ho
ur
Leq
(h),
dB
(A)
Alt
1, 3
, & 4
min
us
No
-Act
ion
,
dB
(A)
1 2 3 4 5 6
R133 SF 1441 Manley Ave 59 58 1
R134 SF 1461 Manley Ave 58 58 0
R135 SF 1481 Manley Ave 57 57 0
R136 SF 1501 Manley Ave 56 56 0
R137 SF 1527 Manley Ave 54 54 0
R138 MF 2120 Noisette Blvd 50 49 1
North Rhett Avenue
R139 SF 5102 N Rhett Ave 69 69 0
R140 SF 5103 N Rhett Ave 62 62 0
R141 SF 1195 Camden St 64 64 0
R142 C 5107 N Rhett Ave 66 66 0
R143 SF 1198 Camden St 70 70 0
R144 C 5111 N Rhett Ave 66 66 0
R145 SF 5122 N Rhett Ave 69 69 0
R146 SF 5116 Victoria Ave 59 58 1
R147 C 5134 N Rhett Ave 69 69 0
R148 SF 5144 N Rhett Ave 68 68 0
R149 C 5148 N Rhett Ave 68 68 0
R150 C 5137 N Rhett Ave 65 65 0
R151 SF 5135 N Rhett Ave 69 69 0
R152 C 5154 N Rhett Ave 66 66 0
R153 SF 5133 N Rhett Ave 71 70 1
R154 SF 5128 N Rhett Ave 68 68 0
Montague Avenue
R173 R 1103 North Blvd 55 55 0
R174 SCH 1087 E Montague Ave 55 55 0
R175 R Attaway-Heinsohn Field 52 52 0
R176 MF 1081 E Montague Ave 61 61 0
EIS for the Proposed Navy Base Appendix H: Noise and Vibration
Intermodal Container Transfer Facility Technical Memorandum
35
Table H-9
2038 Traffic Noise Levels for Alternative 2 vs No-Action Alternative
Receptor Land Use1
Description
2038
Alt
ern
ativ
e 2
Lou
des
t-H
ou
r
Leq
(h),
dB
(A)
2038
No
-Act
ion
Lo
ud
est-
Ho
ur
Leq
(h),
dB
(A)
Alt
2 m
inu
s N
o-A
ctio
n, d
B(A
)
1 2 3 4 5 6
Virginia Avenue
R1 SF 1004 Delsey St 74 72 2
R2 SF 1005 Delsey St 74 73 1
R3 SF 1004 Crawford St 74 73 1
R4 SF 1005 Crawford St 74 72 2
R5 SF 1004 Bethany St 74 73 1
R6 SF 1005 Bethany St 74 73 1
R7 SF 1004 Alamo St 74 73 1
R8 SF 1005 Alamo St 74 72 2
R9 SF 1004 Buist Ave 73 71 2
Spruill Avenue from North Carolina Avenue to Cosgrove Avenue
R16 MF 3028 N Carolina Ave 61 62 -1
R17 SF 1901 Iris St 69 70 -1
R18 SF 1903 Iris St 71 72 -1
R19 SF 1902 Iris St 71 72 -1
R20 PK 3107 N Carolina Ave 66 66 0
R21 SF 1900 Calvert St 71 71 0
R22 W 3051 Spruill Ave 71 72 -1
R23 SF 1901 Orvid St 71 72 -1
R24 SF 1902 Orvid St 70 71 -1
R25 SF 1825 Carlton St 62 63 -1
R26 SF 1903 Carlton St 68 69 -1
R28 SF 1902 Carlton St 70 70 0
R29 MF 1824 Carlton St 60 61 -1
R30 SF 1901 Success St 69 69 0
R31 SF 1825 Success St 59 60 -1
R32 SF 1902 Success St 67 68 -1
R33 SF 1828 Success St 58 59 -1
R34 MF 1829 Leland St 69 70 -1
R35 SF 3219 Spruill Ave 70 71 -1
R36 SF 1830 Grayson St 59 59 0
EIS for the Proposed Navy Base Appendix H: Noise and Vibration
Intermodal Container Transfer Facility Technical Memorandum
36
Receptor Land Use1
Description
2038
Alt
ern
ativ
e 2
Lou
des
t-H
ou
r
Leq
(h),
dB
(A)
2038
No
-Act
ion
Lo
ud
est-
Ho
ur
Leq
(h),
dB
(A)
Alt
2 m
inu
s N
o-A
ctio
n, d
B(A
)
1 2 3 4 5 6
R37 MF 1831 Dayton St 57 58 -1
R38 SF 1902 Grayson St 70 70 0
R39 SF 3255 Spruill Ave 69 70 -1
R40 SF 1840 Reynolds Ave 70 71 -1
R41 SF 3308 Spruill Ave 69 69 0
R42 SF 3309 Spruill Ave 71 71 0
R43 SF 1900 Ubank Ave 63 64 -1
R44 SF 3317 Proctor St 62 62 0
R45 SF 3319 Proctor St 62 63 -1
R46 SF 3321 Proctor St 62 63 -1
R47 SF 3323 Proctor St 62 63 -1
R48 SF 3325 Proctor St 61 62 -1
R49 SF 3327 Proctor St 61 62 -1
Cosgrove Avenue
R50 SCH 3377 Ridgeway St 63 64 -1
R51 V Vacant Lot 64 64 0
R52 SF 3421 Ridgeway St 65 64 1
R53 SF 1903 Cosgrove Ave 71 70 1
R54 SF 1911 Cosgrove Ave 69 69 0
R55 SF 1917 Cosgrove Ave 70 69 1
R56 SF 3380 Cochise St 66 65 1
R57 SF 1935 Cosgrove Ave 68 67 1
R58 SF 2003 Cosgrove Ave 69 68 1
R59 SF 2009 Cosgrove Ave 69 68 1
R60 SF 2015 Cosgrove Ave 69 68 1
R61 SF 2021 Cosgrove Ave 69 68 1
R62 V Vacant Lot 68 67 1
R63 C 2033 Cosgrove Ave 69 68 1
R64 SF 2032 Cosgrove Ave 68 67 1
R65 SF 2026 Cosgrove Ave 68 67 1
R66 SF 2020 Cosgrove Ave 69 68 1
R67 SF 2014 Cosgrove Ave 69 68 1
R68 SF 2008 Cosgrove Ave 66 65 1

EIS for the Proposed Navy Base Appendix H: Noise and Vibration
Intermodal Container Transfer Facility Technical Memorandum
37
Receptor Land Use1
Description
2038
Alt
ern
ativ
e 2
Lou
des
t-H
ou
r
Leq
(h),
dB
(A)
2038
No
-Act
ion
Lo
ud
est-
Ho
ur
Leq
(h),
dB
(A)
Alt
2 m
inu
s N
o-A
ctio
n, d
B(A
)
1 2 3 4 5 6
R69 SF 2004 Cosgrove Ave 66 66 0
R70 SF 1936 Cosgrove Ave 69 68 1
R71 SF 1910 Cosgrove Ave 69 68 1
R72 V 1904 Cosgrove Ave 70 69 1
Spruill Avenue from Cosgrove Avenue to Noisette Creek
R73 SF 3423 Cosgrove Ave 64 64 0
R74 SF 3427 Cosgrove Ave 64 64 0
R75 SF 3431 Cosgrove Ave 64 63 1
R76 SF 3435 Cosgrove Ave 63 63 0
R77 SF 3439 Cosgrove Ave 62 62 0
R78 PK 1901-1999 McMillan Ave 62 62 0
R79 MF 3701-3719 Spruill Ave 67 66 1
R80 MF 3721-3775 Spruill Ave (Apts) 69 69 0
R81 MF 1900-1914 Pine Walk Ct 66 65 1
R82 MF 3721-3775 Spruill Ave (Apts) 62 61 1
R83 W 3721-3775 Spruill Ave (Apts) 68 68 0
R84 SCH 3795 Spruill Ave 63 63 0
R110 MF 3777-3799 Spruill Ave 71 71 0
R111 MF 4045 McKeever Ave 70 70 0
St Johns Avenue
R85 SF 3733 St Johns Ave 60 60 0
R86 SF 3719 St Johns Ave 57 57 0
R87 SF 3727 St Johns Ave 56 56 0
R88 SF 3735 St Johns Ave 55 56 -1
R89 SF 3745 St Johns Ave 55 56 -1
R90 SF 1851 Reddin Rd 55 56 -1
R91 SF 3756 St Johns Ave 53 57 -4
R92 SF 3803 Reddin Rd 61 60 1
R93 SF 3803 St Johns Ave 54 58 -4
R94 SF 3807 St Johns Ave 54 57 -3
R95 SF 3811 St Johns Ave 54 58 -4
R96 SF 1246 Ave H 51 54 -3
R97 SF 3821 St Johns Ave 54 59 -5

EIS for the Proposed Navy Base Appendix H: Noise and Vibration
Intermodal Container Transfer Facility Technical Memorandum
38
Receptor Land Use1
Description
2038
Alt
ern
ativ
e 2
Lou
des
t-H
ou
r
Leq
(h),
dB
(A)
2038
No
-Act
ion
Lo
ud
est-
Ho
ur
Leq
(h),
dB
(A)
Alt
2 m
inu
s N
o-A
ctio
n, d
B(A
)
1 2 3 4 5 6
R98 SF 3829 St Johns Ave 54 58 -4
R99 SF 3831 St Johns Ave 54 56 -2
R100 SF 3833 St Johns Ave 53 56 -3
R101 SF 3857 Reddin Rd 59 58 1
R102 SF 3845 St Johns Ave 52 55 -3
R103 SF 1300 Ave H 51 54 -3
R104 SF 3849 St Johns Ave 54 58 -4
R105 SF 3853 St Johns Ave 53 57 -4
R106 SF 3857 St Johns Ave 54 58 -4
R107 SF 3861 St Johns Ave 53 55 -2
R108 SCH 3921 St Johns Ave 53 53 0
R109 W 3921 St Johns Ave 53 55 -2
R113 W 3941 St Johns Ave 55 56 -1
R114 MF 3955 St Johns Ave 57 59 -2
R115 SF 1416 Ave H 54 56 -2
R116 SF 1418 Ave H 55 57 -2
R117 SF 3971 St Johns Ave 58 59 -1
R118 SF 3975 St Johns Ave 58 59 -1
R119 SF 3981 St Johns Ave 58 59 -1
R120 SF 3985 St Johns Ave 58 59 -1
R121 SF 3991 St Johns Ave 59 60 -1
R122 SF 3997 St Johns Ave 59 60 -1
R123 SF 1428 Ave G 57 59 -2
R124 SF 1895 Ave F 55 55 0
R125 SF 1897 Ave F 52 53 -1
R126 SF 1899 Ave F 50 51 -1
R127 MF 4015 St Johns Ave 57 58 -1
R128 MF 4019 St Johns Ave 55 57 -2
R129 SF 4033 St Johns Ave 53 54 -1
R130 SF 4055 St Johns Ave 54 57 -3
Noisette Boulevard
R131 SF 1415 Manley Ave 57 56 1
R132 SF 1421 Manley Ave 58 57 1

EIS for the Proposed Navy Base Appendix H: Noise and Vibration
Intermodal Container Transfer Facility Technical Memorandum
39
Receptor Land Use1
Description
2038
Alt
ern
ativ
e 2
Lou
des
t-H
ou
r
Leq
(h),
dB
(A)
2038
No
-Act
ion
Lo
ud
est-
Ho
ur
Leq
(h),
dB
(A)
Alt
2 m
inu
s N
o-A
ctio
n, d
B(A
)
1 2 3 4 5 6
R133 SF 1441 Manley Ave 59 58 1
R134 SF 1461 Manley Ave 58 58 0
R135 SF 1481 Manley Ave 57 57 0
R136 SF 1501 Manley Ave 56 56 0
R137 SF 1527 Manley Ave 54 54 0
R138 MF 2120 Noisette Blvd 50 49 1
North Rhett Avenue
R139 SF 5102 N Rhett Ave 69 69 0
R140 SF 5103 N Rhett Ave 62 62 0
R141 SF 1195 Camden St 64 64 0
R142 C 5107 N Rhett Ave 66 66 0
R143 SF 1198 Camden St 70 70 0
R144 C 5111 N Rhett Ave 66 66 0
R145 SF 5122 N Rhett Ave 69 69 0
R146 SF 5116 Victoria Ave 59 58 1
R147 C 5134 N Rhett Ave 69 69 0
R148 SF 5144 N Rhett Ave 68 68 0
R149 C 5148 N Rhett Ave 68 68 0
R150 C 5137 N Rhett Ave 65 65 0
R151 SF 5135 N Rhett Ave 69 69 0
R152 C 5154 N Rhett Ave 66 66 0
R153 SF 5133 N Rhett Ave 71 70 1
R154 SF 5128 N Rhett Ave 68 68 0
Montague Avenue
R173 R 1103 North Blvd 55 55 0
R174 SCH 1087 E Montague Ave 55 55 0
R175 R Attaway-Heinsohn Field 52 52 0
R176 MF 1081 E Montague Ave 61 61 0
EIS for the Proposed Navy Base Appendix H: Noise and Vibration
Intermodal Container Transfer Facility Technical Memorandum
40
Table H-10
2038 Traffic Noise Levels for Alternatives 5, 6, and 7 vs No-Action Alternative
Receptor Land Use1
Description
2038
Alt
ern
ativ
e 5,
6, &
7
Lou
des
t-H
ou
r Le
q(h
), d
B(A
)
2038
No
-Act
ion
Lo
ud
est-
Ho
ur
Leq
(h),
dB
(A)
Alt
5, 6
, & 7
min
us
No
-Act
ion
,
dB
(A)
1 2 3 4 5 6
Virginia Avenue
R1 SF 1004 Delsey St 73 72 1
R2 SF 1005 Delsey St 74 73 1
R3 SF 1004 Crawford St 74 73 1
R4 SF 1005 Crawford St 74 72 2
R5 SF 1004 Bethany St 74 73 1
R6 SF 1005 Bethany St 74 73 1
R7 SF 1004 Alamo St 74 73 1
R8 SF 1005 Alamo St 73 72 1
R9 SF 1004 Buist Ave 73 71 2
Spruill Avenue from North Carolina Avenue to Cosgrove Avenue
R16 MF 3028 N Carolina Ave 62 62 0
R17 SF 1901 Iris St 70 70 0
R18 SF 1903 Iris St 72 72 0
R19 SF 1902 Iris St 72 72 0
R20 PK 3107 N Carolina Ave 67 66 1
R21 SF 1900 Calvert St 72 71 1
R22 W 3051 Spruill Ave 73 72 1
R23 SF 1901 Orvid St 72 72 0
R24 SF 1902 Orvid St 71 71 0
R25 SF 1825 Carlton St 63 63 0
R26 SF 1903 Carlton St 69 69 0
R28 SF 1902 Carlton St 71 70 1
R29 MF 1824 Carlton St 61 61 0
R30 SF 1901 Success St 70 69 1
R31 SF 1825 Success St 60 60 0
R32 SF 1902 Success St 68 68 0
R33 SF 1828 Success St 59 59 0
R34 MF 1829 Leland St 70 70 0
R35 SF 3219 Spruill Ave 71 71 0
R36 SF 1830 Grayson St 60 59 1
EIS for the Proposed Navy Base Appendix H: Noise and Vibration
Intermodal Container Transfer Facility Technical Memorandum
41
Receptor Land Use1
Description
2038
Alt
ern
ativ
e 5,
6, &
7
Lou
des
t-H
ou
r Le
q(h
), d
B(A
)
2038
No
-Act
ion
Lo
ud
est-
Ho
ur
Leq
(h),
dB
(A)
Alt
5, 6
, & 7
min
us
No
-Act
ion
,
dB
(A)
1 2 3 4 5 6
R37 MF 1831 Dayton St 59 58 1
R38 SF 1902 Grayson St 71 70 1
R39 SF 3255 Spruill Ave 70 70 0
R40 SF 1840 Reynolds Ave 71 71 0
R41 SF 3308 Spruill Ave 70 69 1
R42 SF 3309 Spruill Ave 72 71 1
R43 SF 1900 Ubank Ave 65 64 1
R44 SF 3317 Proctor St 63 62 1
R45 SF 3319 Proctor St 64 63 1
R46 SF 3321 Proctor St 64 63 1
R47 SF 3323 Proctor St 64 63 1
R48 SF 3325 Proctor St 63 62 1
R49 SF 3327 Proctor St 63 62 1
Cosgrove Avenue
R50 SCH 3377 Ridgeway St 64 64 0
R51 V Vacant Lot 64 64 0
R52 SF 3421 Ridgeway St 65 64 1
R53 SF 1903 Cosgrove Ave 70 70 0
R54 SF 1911 Cosgrove Ave 69 69 0
R55 SF 1917 Cosgrove Ave 69 69 0
R56 SF 3380 Cochise St 66 65 1
R57 SF 1935 Cosgrove Ave 67 67 0
R58 SF 2003 Cosgrove Ave 68 68 0
R59 SF 2009 Cosgrove Ave 68 68 0
R60 SF 2015 Cosgrove Ave 69 68 1
R61 SF 2021 Cosgrove Ave 68 68 0
R62 V Vacant Lot 67 67 0
R63 C 2033 Cosgrove Ave 69 68 1
R64 SF 2032 Cosgrove Ave 68 67 1
R65 SF 2026 Cosgrove Ave 67 67 0
R66 SF 2020 Cosgrove Ave 68 68 0
R67 SF 2014 Cosgrove Ave 68 68 0
R68 SF 2008 Cosgrove Ave 65 65 0
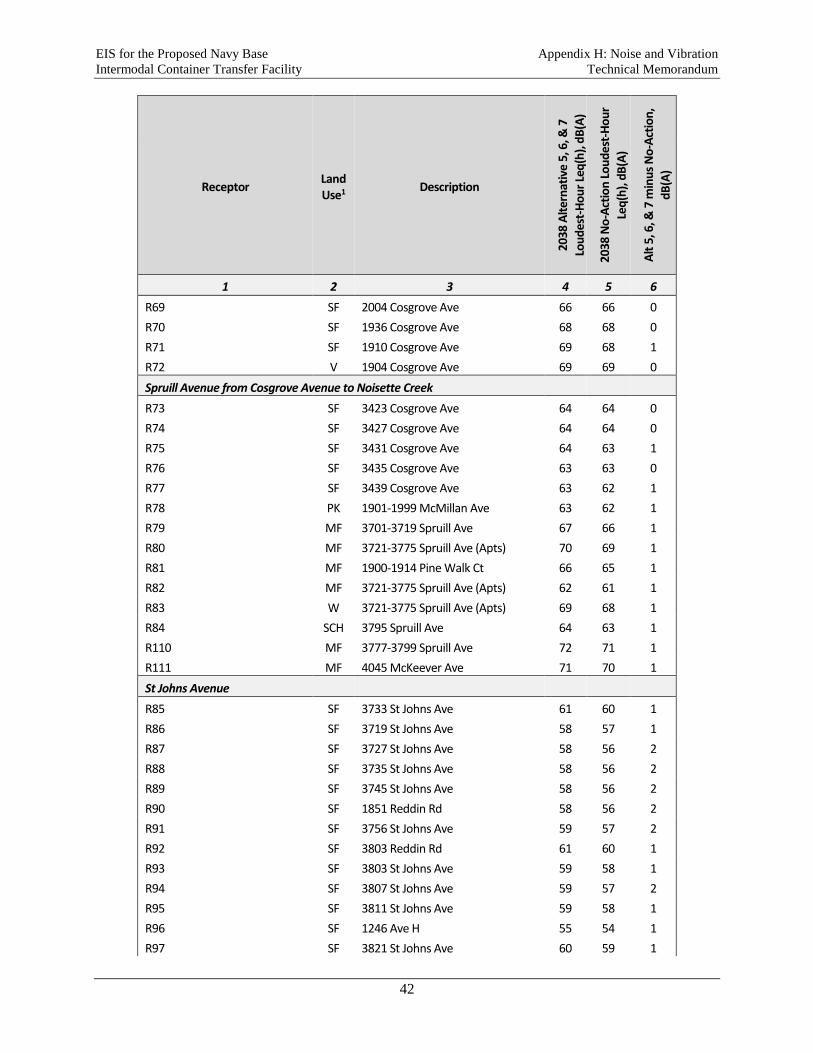
EIS for the Proposed Navy Base Appendix H: Noise and Vibration
Intermodal Container Transfer Facility Technical Memorandum
42
Receptor Land Use1
Description
2038
Alt
ern
ativ
e 5,
6, &
7
Lou
des
t-H
ou
r Le
q(h
), d
B(A
)
2038
No
-Act
ion
Lo
ud
est-
Ho
ur
Leq
(h),
dB
(A)
Alt
5, 6
, & 7
min
us
No
-Act
ion
,
dB
(A)
1 2 3 4 5 6
R69 SF 2004 Cosgrove Ave 66 66 0
R70 SF 1936 Cosgrove Ave 68 68 0
R71 SF 1910 Cosgrove Ave 69 68 1
R72 V 1904 Cosgrove Ave 69 69 0
Spruill Avenue from Cosgrove Avenue to Noisette Creek
R73 SF 3423 Cosgrove Ave 64 64 0
R74 SF 3427 Cosgrove Ave 64 64 0
R75 SF 3431 Cosgrove Ave 64 63 1
R76 SF 3435 Cosgrove Ave 63 63 0
R77 SF 3439 Cosgrove Ave 63 62 1
R78 PK 1901-1999 McMillan Ave 63 62 1
R79 MF 3701-3719 Spruill Ave 67 66 1
R80 MF 3721-3775 Spruill Ave (Apts) 70 69 1
R81 MF 1900-1914 Pine Walk Ct 66 65 1
R82 MF 3721-3775 Spruill Ave (Apts) 62 61 1
R83 W 3721-3775 Spruill Ave (Apts) 69 68 1
R84 SCH 3795 Spruill Ave 64 63 1
R110 MF 3777-3799 Spruill Ave 72 71 1
R111 MF 4045 McKeever Ave 71 70 1
St Johns Avenue
R85 SF 3733 St Johns Ave 61 60 1
R86 SF 3719 St Johns Ave 58 57 1
R87 SF 3727 St Johns Ave 58 56 2
R88 SF 3735 St Johns Ave 58 56 2
R89 SF 3745 St Johns Ave 58 56 2
R90 SF 1851 Reddin Rd 58 56 2
R91 SF 3756 St Johns Ave 59 57 2
R92 SF 3803 Reddin Rd 61 60 1
R93 SF 3803 St Johns Ave 59 58 1
R94 SF 3807 St Johns Ave 59 57 2
R95 SF 3811 St Johns Ave 59 58 1
R96 SF 1246 Ave H 55 54 1
R97 SF 3821 St Johns Ave 60 59 1
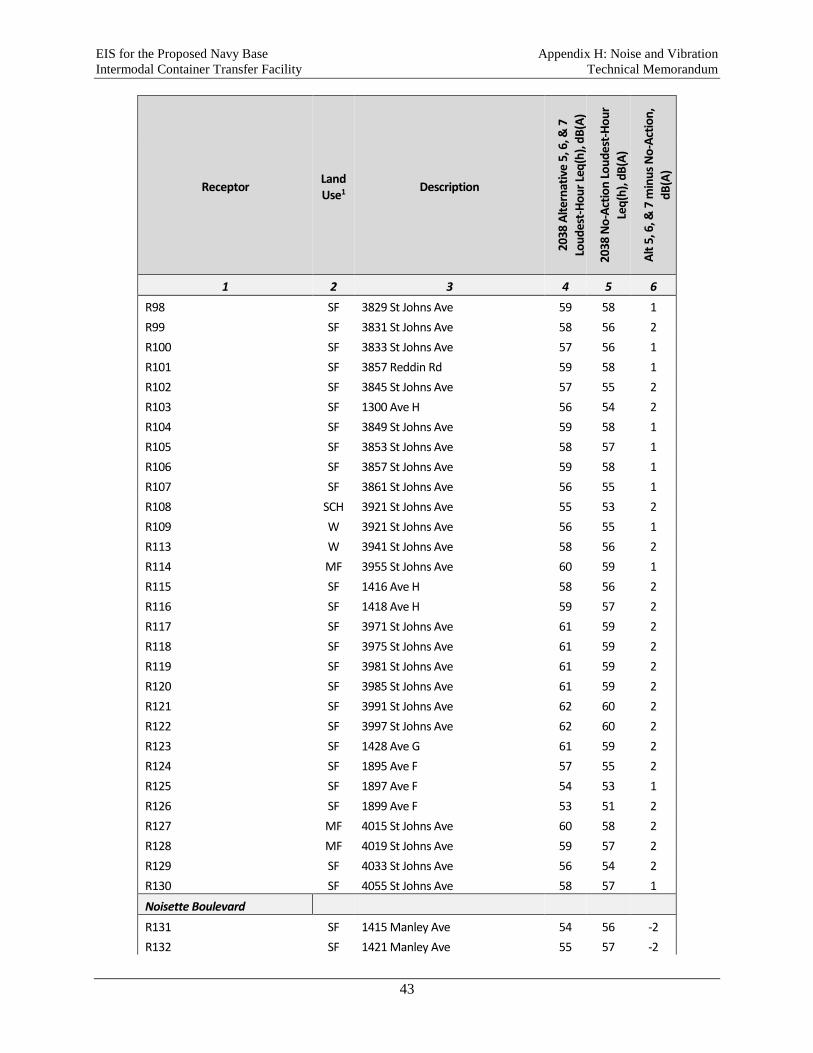
EIS for the Proposed Navy Base Appendix H: Noise and Vibration
Intermodal Container Transfer Facility Technical Memorandum
43
Receptor Land Use1
Description
2038
Alt
ern
ativ
e 5,
6, &
7
Lou
des
t-H
ou
r Le
q(h
), d
B(A
)
2038
No
-Act
ion
Lo
ud
est-
Ho
ur
Leq
(h),
dB
(A)
Alt
5, 6
, & 7
min
us
No
-Act
ion
,
dB
(A)
1 2 3 4 5 6
R98 SF 3829 St Johns Ave 59 58 1
R99 SF 3831 St Johns Ave 58 56 2
R100 SF 3833 St Johns Ave 57 56 1
R101 SF 3857 Reddin Rd 59 58 1
R102 SF 3845 St Johns Ave 57 55 2
R103 SF 1300 Ave H 56 54 2
R104 SF 3849 St Johns Ave 59 58 1
R105 SF 3853 St Johns Ave 58 57 1
R106 SF 3857 St Johns Ave 59 58 1
R107 SF 3861 St Johns Ave 56 55 1
R108 SCH 3921 St Johns Ave 55 53 2
R109 W 3921 St Johns Ave 56 55 1
R113 W 3941 St Johns Ave 58 56 2
R114 MF 3955 St Johns Ave 60 59 1
R115 SF 1416 Ave H 58 56 2
R116 SF 1418 Ave H 59 57 2
R117 SF 3971 St Johns Ave 61 59 2
R118 SF 3975 St Johns Ave 61 59 2
R119 SF 3981 St Johns Ave 61 59 2
R120 SF 3985 St Johns Ave 61 59 2
R121 SF 3991 St Johns Ave 62 60 2
R122 SF 3997 St Johns Ave 62 60 2
R123 SF 1428 Ave G 61 59 2
R124 SF 1895 Ave F 57 55 2
R125 SF 1897 Ave F 54 53 1
R126 SF 1899 Ave F 53 51 2
R127 MF 4015 St Johns Ave 60 58 2
R128 MF 4019 St Johns Ave 59 57 2
R129 SF 4033 St Johns Ave 56 54 2
R130 SF 4055 St Johns Ave 58 57 1
Noisette Boulevard
R131 SF 1415 Manley Ave 54 56 -2
R132 SF 1421 Manley Ave 55 57 -2
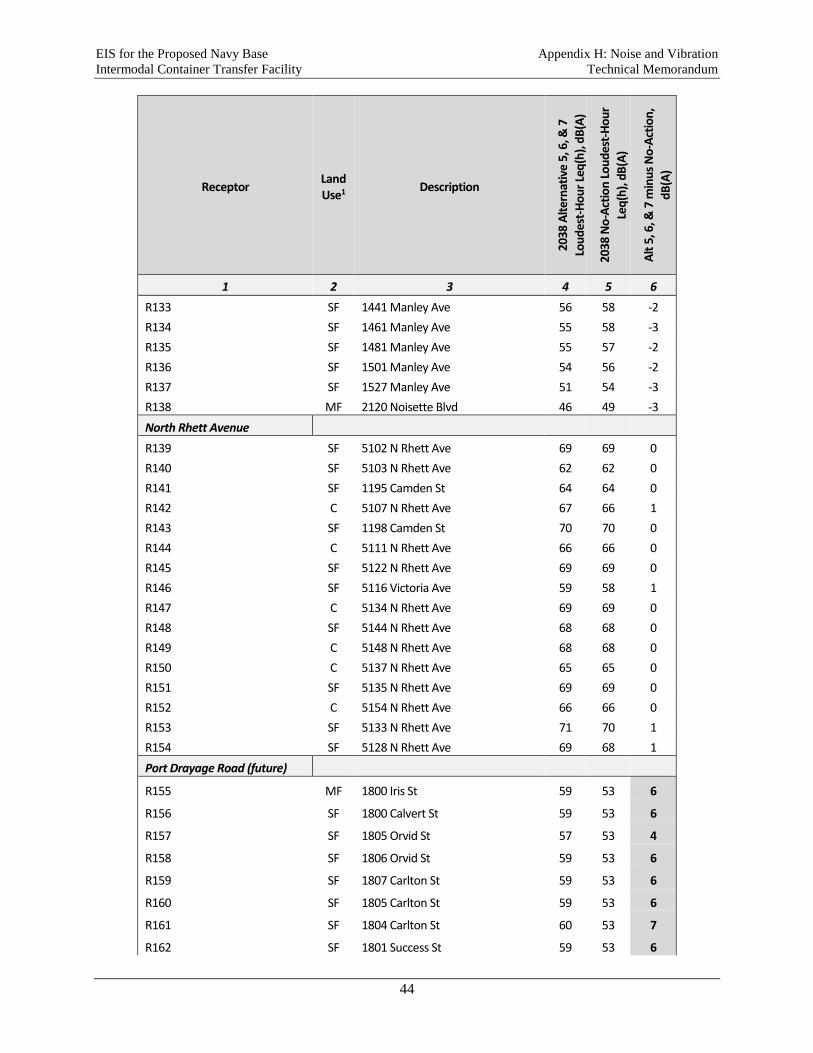
EIS for the Proposed Navy Base Appendix H: Noise and Vibration
Intermodal Container Transfer Facility Technical Memorandum
44
Receptor Land Use1
Description
2038
Alt
ern
ativ
e 5,
6, &
7
Lou
des
t-H
ou
r Le
q(h
), d
B(A
)
2038
No
-Act
ion
Lo
ud
est-
Ho
ur
Leq
(h),
dB
(A)
Alt
5, 6
, & 7
min
us
No
-Act
ion
,
dB
(A)
1 2 3 4 5 6
R133 SF 1441 Manley Ave 56 58 -2
R134 SF 1461 Manley Ave 55 58 -3
R135 SF 1481 Manley Ave 55 57 -2
R136 SF 1501 Manley Ave 54 56 -2
R137 SF 1527 Manley Ave 51 54 -3
R138 MF 2120 Noisette Blvd 46 49 -3
North Rhett Avenue
R139 SF 5102 N Rhett Ave 69 69 0
R140 SF 5103 N Rhett Ave 62 62 0
R141 SF 1195 Camden St 64 64 0
R142 C 5107 N Rhett Ave 67 66 1
R143 SF 1198 Camden St 70 70 0
R144 C 5111 N Rhett Ave 66 66 0
R145 SF 5122 N Rhett Ave 69 69 0
R146 SF 5116 Victoria Ave 59 58 1
R147 C 5134 N Rhett Ave 69 69 0
R148 SF 5144 N Rhett Ave 68 68 0
R149 C 5148 N Rhett Ave 68 68 0
R150 C 5137 N Rhett Ave 65 65 0
R151 SF 5135 N Rhett Ave 69 69 0
R152 C 5154 N Rhett Ave 66 66 0
R153 SF 5133 N Rhett Ave 71 70 1
R154 SF 5128 N Rhett Ave 69 68 1
Port Drayage Road (future)
R155 MF 1800 Iris St 59 53 6
R156 SF 1800 Calvert St 59 53 6
R157 SF 1805 Orvid St 57 53 4
R158 SF 1806 Orvid St 59 53 6
R159 SF 1807 Carlton St 59 53 6
R160 SF 1805 Carlton St 59 53 6
R161 SF 1804 Carlton St 60 53 7
R162 SF 1801 Success St 59 53 6
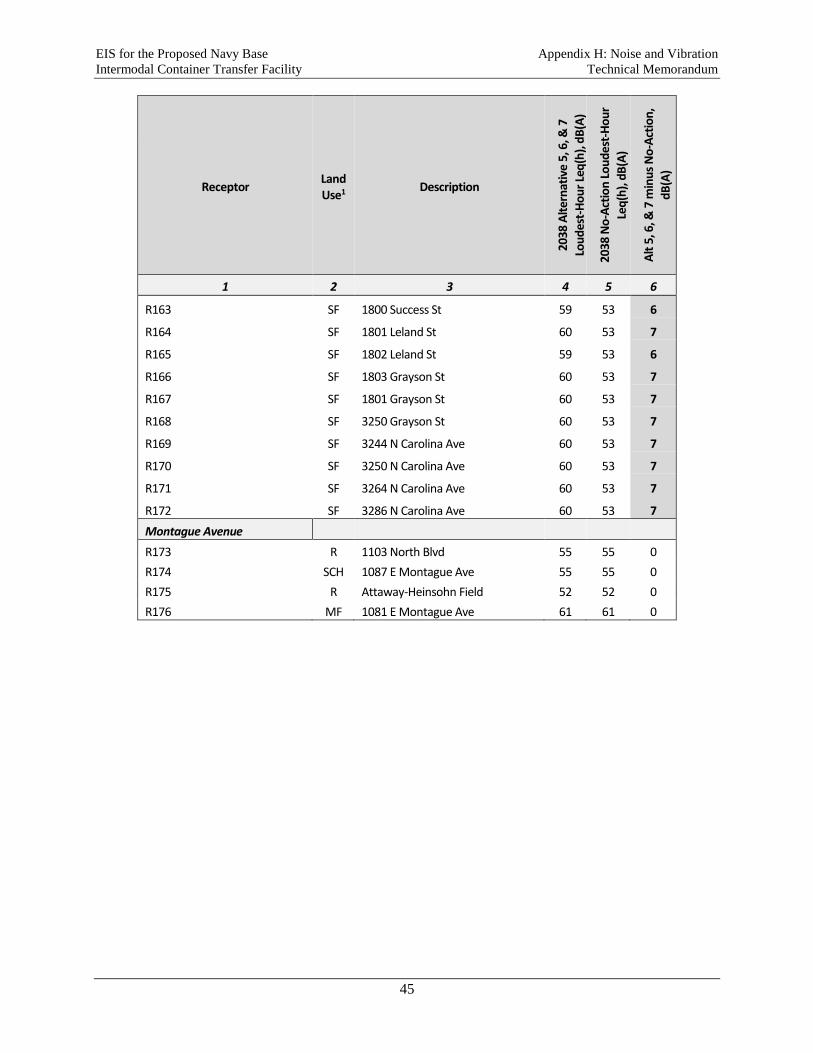
EIS for the Proposed Navy Base Appendix H: Noise and Vibration
Intermodal Container Transfer Facility Technical Memorandum
45
Receptor Land Use1
Description
2038
Alt
ern
ativ
e 5,
6, &
7
Lou
des
t-H
ou
r Le
q(h
), d
B(A
)
2038
No
-Act
ion
Lo
ud
est-
Ho
ur
Leq
(h),
dB
(A)
Alt
5, 6
, & 7
min
us
No
-Act
ion
,
dB
(A)
1 2 3 4 5 6
R163 SF 1800 Success St 59 53 6
R164 SF 1801 Leland St 60 53 7
R165 SF 1802 Leland St 59 53 6
R166 SF 1803 Grayson St 60 53 7
R167 SF 1801 Grayson St 60 53 7
R168 SF 3250 Grayson St 60 53 7
R169 SF 3244 N Carolina Ave 60 53 7
R170 SF 3250 N Carolina Ave 60 53 7
R171 SF 3264 N Carolina Ave 60 53 7
R172 SF 3286 N Carolina Ave 60 53 7
Montague Avenue
R173 R 1103 North Blvd 55 55 0
R174 SCH 1087 E Montague Ave 55 55 0
R175 R Attaway-Heinsohn Field 52 52 0
R176 MF 1081 E Montague Ave 61 61 0

EIS for the Proposed Navy Base Appendix H: Noise and Vibration
Intermodal Container Transfer Facility Technical Memorandum
46
This page intentionally left blank.
47
3.0 RAIL NOISE ANALYSIS
3.1 RAIL NOISE SCREENING PROCEDURE
The Transportation Study rail operations data for 31 at-grade crossings in the study area (20 crossings are
shown in EIS Figure 4.12-2; some include multiple nearby crossings) were analyzed to determine rail track
segments where operational changes are projected that could potentially generate noticeable noise impact.
The DNL was computed for all track segments between railroad crossings at a reference distance of 50 feet
from the tracks for all the project alternatives. The differentials were calculated between DNL for each of
the alternatives and DNL for the No-Action Alternative for the design year 2038. According to the NEPA
requirements, differentials exceeding 3 dB(A) indicate potential noise impacts in the vicinity of the rail
segment. Changes in noise level that are less than 3 dB(A) may be considered negligible under NEPA as
they are barely perceptible. The differentials for the track segments between rail crossings were analyzed
using the screening criterion of 2.5 dB(A). The track segments with the DNL differential below the
screening criterion were omitted from further analysis, since no or negligible noise impacts would be
anticipated near the track segments, as no or little change in the train operations is projected for the
particular alternative in comparison with the No-Action Alternative. Rail segments were defined using the
rail crossings with the DNL differentials of 2.5 dB(A) or higher. These segments extended in both directions
along the track centerline from each specified rail crossing to the closest nearby rail intersection. These
segments were further reviewed for the presence of noise-sensitive land uses within approximately 300 feet5
of the track centerline. If no noise-sensitive land uses are present within this screening distance, then no
further noise assessment is necessary for these areas. For noise-sensitive land uses present within the
screening distance of 300 feet from the tracks, noise assessment was conducted as follows. For each rail
segment associated with each identified crossings, DNL noise contours at 70, 65, and 60 dB(A) were
calculated as a function of distance away from the rail track centerline. The number of noise-sensitive
receiver locations in each level of the noise contours was recorded for each identified rail segment. The
majority of noise-sensitive receivers along these rail segments of interest will be single- and multi-family
residences.
3.2 RAIL DATA FOR NOISE PREDICTION
Rail operations data included are based on the Transportation Study data for rail crossings. The daily
volumes for track segments between rail crossing and times at rail crossings used for the 2013 existing
conditions are provided in Table H-11. The average train length is determined from the time spent at the
crossing, rather than the speed. According to the updated train speed info provided by Palmetto Railways,
it is assumed to be 10 mph at all rail crossings/track segments of interest for all project alternatives in the
existing year and the future 2038 year. Each train is assumed to have two locomotives pulling it.
5 A screening distance of 300 feet covers the first two rows of buildings nearest to the tracks. The second and subsequent rows of
buildings are more remote and increasingly shielded from rail noise by intervening rows of buildings.

EIS for the Proposed Navy Base Appendix H: Noise and Vibration
Intermodal Container Transfer Facility Technical Memorandum
48
Table H-11
Rail Operations Data for Base Year 2013 Existing Conditions
Rail operations data for track segments between rail crossings for the No-Action Alternative are provided
in Table H-12.
Table H-12
Rail Operations Data for No-Action Alternative 2038 Conditions
Number of
Crossings
Seconds Per
Crossing
Dorchester Road & NS Main (central) 3.1 309
Dorchester Road & CSX Main 1 (west) 2.2 99
Dorchester Road & CSX Main 2 (east) 0.0 0
Accabee Road & NS Main (central) 3.1 200
Accabee Road & CSX Main 1 (west) 2.2 99
Accabee Road & CSX Main 2 (east) 0.0 0
Misroon Street & NS Main (central) 3.1 225
Misroon Street & CSX Main 1 (west) 2.2 99
Misroon Street & CSX Main 2 (east) 0.0 0
4 Virginia Avenue & NCTC 1.1 1,551
14 Avenue B North & NCTC (existing) 1.1 2,063
Hackemann Ave & NS Main (west) 3.1 225
Hackemann Ave & CSX Main 2 (east) 0.0 0
Discher Street & CSX Main 2 0.0 0
Discher Street & CSX Main 1/NS Main 5.3 173
17 Pittsburgh Avenue & Southern Connection 0.0 0
18 Meeting/Herbert & Southern Connection 0.0 0
19 O’Hear Avenue & NCTC 0.0 0
Meeting St & CSX Main 2 (Near Spruill) 0.0 0
Spruill Ave & CSX Main 2 (Near Meeting) 0.0 020
Crossing
NumberRail Crossing
Base Year 2013 Existing
1
2
3
15
16
Number of
Crossings
Seconds Per
Crossing
Dorchester Road & NS Main (central) 3.1 431
Dorchester Road & CSX Main 1 (west) 2.2 143
Dorchester Road & CSX Main 2 (east) 0.0 0
Accabee Road & NS Main (central) 3.1 431
Accabee Road & CSX Main 1 (west) 2.2 143
Accabee Road & CSX Main 2 (east) 0.0 0
Misroon Street & NS Main (central) 3.1 329
Misroon Street & CSX Main 1 (west) 2.2 143
Misroon Street & CSX Main 2 (east) 0.0 0
4 Virginia Avenue & NCTC 1.1 1,630
14 Avenue B North & NCTC (existing) 1.1 2,129
Hackemann Ave & NS Main (west) 3.1 329
Hackemann Ave & CSX Main 2 (east) 0.0 0
Discher Street & CSX Main 2 0.0 0
Discher Street & CSX Main 1/NS Main 5.3 252
17 Pittsburgh Avenue & Southern Connection 0.0 0
18 Meeting/Herbert & Southern Connection 0.0 0
19 O’Hear Avenue & NCTC 0.0 0
Meeting St & CSX Main 2 (Near Spruill) 0.0 0
Spruill Ave & CSX Main 2 (Near Meeting) 0.0 0
Crossing
NumberRail Crossing
Design Year 2038 No-Action
1
2
3
15
16
20
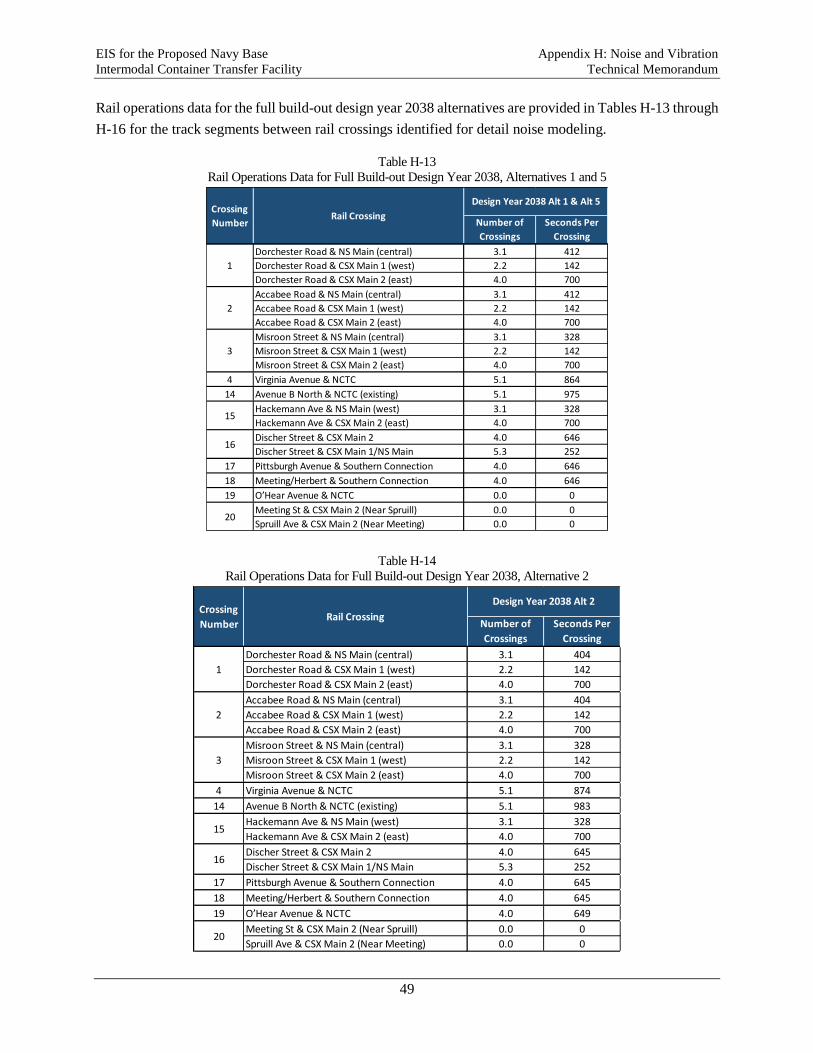
EIS for the Proposed Navy Base Appendix H: Noise and Vibration
Intermodal Container Transfer Facility Technical Memorandum
49
Rail operations data for the full build-out design year 2038 alternatives are provided in Tables H-13 through
H-16 for the track segments between rail crossings identified for detail noise modeling.
Table H-13
Rail Operations Data for Full Build-out Design Year 2038, Alternatives 1 and 5
Table H-14
Rail Operations Data for Full Build-out Design Year 2038, Alternative 2
Number of
Crossings
Seconds Per
Crossing
Dorchester Road & NS Main (central) 3.1 412
Dorchester Road & CSX Main 1 (west) 2.2 142
Dorchester Road & CSX Main 2 (east) 4.0 700
Accabee Road & NS Main (central) 3.1 412
Accabee Road & CSX Main 1 (west) 2.2 142
Accabee Road & CSX Main 2 (east) 4.0 700
Misroon Street & NS Main (central) 3.1 328
Misroon Street & CSX Main 1 (west) 2.2 142
Misroon Street & CSX Main 2 (east) 4.0 700
4 Virginia Avenue & NCTC 5.1 864
14 Avenue B North & NCTC (existing) 5.1 975
Hackemann Ave & NS Main (west) 3.1 328
Hackemann Ave & CSX Main 2 (east) 4.0 700
Discher Street & CSX Main 2 4.0 646
Discher Street & CSX Main 1/NS Main 5.3 252
17 Pittsburgh Avenue & Southern Connection 4.0 646
18 Meeting/Herbert & Southern Connection 4.0 646
19 O’Hear Avenue & NCTC 0.0 0
Meeting St & CSX Main 2 (Near Spruill) 0.0 0
Spruill Ave & CSX Main 2 (Near Meeting) 0.0 0
Rail Crossing
Design Year 2038 Alt 1 & Alt 5
20
Crossing
Number
1
2
3
15
16
Number of
Crossings
Seconds Per
Crossing
Dorchester Road & NS Main (central) 3.1 404
Dorchester Road & CSX Main 1 (west) 2.2 142
Dorchester Road & CSX Main 2 (east) 4.0 700
Accabee Road & NS Main (central) 3.1 404
Accabee Road & CSX Main 1 (west) 2.2 142
Accabee Road & CSX Main 2 (east) 4.0 700
Misroon Street & NS Main (central) 3.1 328
Misroon Street & CSX Main 1 (west) 2.2 142
Misroon Street & CSX Main 2 (east) 4.0 700
4 Virginia Avenue & NCTC 5.1 874
14 Avenue B North & NCTC (existing) 5.1 983
Hackemann Ave & NS Main (west) 3.1 328
Hackemann Ave & CSX Main 2 (east) 4.0 700
Discher Street & CSX Main 2 4.0 645
Discher Street & CSX Main 1/NS Main 5.3 252
17 Pittsburgh Avenue & Southern Connection 4.0 645
18 Meeting/Herbert & Southern Connection 4.0 645
19 O’Hear Avenue & NCTC 4.0 649
Meeting St & CSX Main 2 (Near Spruill) 0.0 0
Spruill Ave & CSX Main 2 (Near Meeting) 0.0 0
Crossing
NumberRail Crossing
Design Year 2038 Alt 2
1
2
3
15
16
20

EIS for the Proposed Navy Base Appendix H: Noise and Vibration
Intermodal Container Transfer Facility Technical Memorandum
50
Table H-15
Rail Operations Data for Full Build-out Design Year 2038, Alternatives 3 and 6
Table H-16
Rail Operations Data for Full Build-out Design Year 2038, Alternatives 4 and 7
Number of
Crossings
Seconds Per
Crossing
Dorchester Road & NS Main (central) 3.1 419
Dorchester Road & CSX Main 1 (west) 2.2 142
Dorchester Road & CSX Main 2 (east) 4.0 702
Accabee Road & NS Main (central) 3.1 419
Accabee Road & CSX Main 1 (west) 2.2 142
Accabee Road & CSX Main 2 (east) 4.0 702
Misroon Street & NS Main (central) 3.1 330
Misroon Street & CSX Main 1 (west) 2.2 142
Misroon Street & CSX Main 2 (east) 4.0 702
4 Virginia Avenue & NCTC 5.1 872
14 Avenue B North & NCTC (existing) 5.1 983
Hackemann Ave & NS Main (west) 3.1 330
Hackemann Ave & CSX Main 2 (east) 4.0 702
Discher Street & CSX Main 2 0.0 0
Discher Street & CSX Main 1/NS Main 5.3 253
17 Pittsburgh Avenue & Southern Connection 0.0 0
18 Meeting/Herbert & Southern Connection 0.0 0
19 O’Hear Avenue & NCTC 0.0 0
Meeting St & CSX Main 2 (Near Spruill) 4.0 645
Spruill Ave & CSX Main 2 (Near Meeting) 4.0 645
Design Year 2038 Alt 3 and Alt 6Crossing
NumberRail Crossing
1
2
3
15
16
20
Number of
Crossings
Seconds Per
Crossing
Dorchester Road & NS Main (central) 7.1 562
Dorchester Road & CSX Main 1 (west) 2.2 143
Dorchester Road & CSX Main 2 (east) 4.0 705
Accabee Road & NS Main (central) 7.1 562
Accabee Road & CSX Main 1 (west) 2.2 143
Accabee Road & CSX Main 2 (east) 4.0 705
Misroon Street & NS Main (central) 7.1 507
Misroon Street & CSX Main 1 (west) 2.2 143
Misroon Street & CSX Main 2 (east) 4.0 705
4 Virginia Avenue & NCTC 1.2 1,676
14 Avenue B North & NCTC (existing) 1.2 2,165
Hackemann Ave & NS Main (west) 7.1 507
Hackemann Ave & CSX Main 2 (east) 4.0 705
Discher Street & CSX Main 2 4.0 645
Discher Street & CSX Main 1/NS Main 9.3 422
17 Pittsburgh Avenue & Southern Connection 8.0 646
18 Meeting/Herbert & Southern Connection 8.0 646
19 O’Hear Avenue & NCTC 0.0 0
Meeting St & CSX Main 2 (Near Spruill) 0.0 0
Spruill Ave & CSX Main 2 (Near Meeting) 0.0 0
Design Year 2038 Alt 4 and Alt 7
1
2
3
15
16
20
Crossing
NumberRail Crossing
EIS for the Proposed Navy Base Appendix H: Noise and Vibration
Intermodal Container Transfer Facility Technical Memorandum
51
3.3 RAIL NOISE MODELING METHODOLOGY
Rail noise modeling was conducted using the Federal Transit Administration’s (FTA) CREATE Railroad
Noise Model (HMMH, 2006) following the manual Transit Noise and Vibration Impact Assessment, FTA-
VA-90-1003-06, May 2006. No measurements were required. The spreadsheet calculates noise levels based
on a reference Sound Exposure Level (SEL) that is included in a database built into the spreadsheet.
CREATE Railroad Noise Model has an SEL specific to freight locomotives and specific to freight cars.
CREATE Railroad Noise Model then adjusts the SEL for project specific parameters including train speed,
distance from noise source, number of daytime trains, number of nighttime trains, length of cars per train,
and number of locomotives per train. Based on these adjustments, the spreadsheet calculates a Day-Night
Average Sound Level (DNL or Ldn) for a specific distance.
In addition to noise from locomotive and railcar movement, locomotive horn soundings are also a part of
railroad operation noise. Under the Train Horn Rule (49 CFR Part 222), locomotive engineers must begin
to sound train warning horns from 15 to 20 seconds in advance of all public grade crossings (for train speeds
of 10 mph and below). The rule also provides an opportunity for localities nationwide to mitigate the effects
of train horn noise by establishing quiet zones. In a quiet zone, railroads have been directed to cease the
routine sounding of their horns when approaching public highway-rail grade crossings. Localities desiring
to establish a quiet zone are first required to mitigate the increased risk caused by the absence of a horn.
Horn soundings were modeled for all rail crossings in the study area, with the exception of crossings with
currently established 24-hour quiet zones listed in EIS Section 3.12.4. Additionally, quiet zones currently
proposed for seven crossings in the study area are listed below by the street name, DOT identification
number, and crossing number indicated in EIS Figure 4.12-2.
Virginia Ave. (721439M) - Crossing 4
N. Rhett St. (721434D) - Crossing 5
Attaway St. (721433W) - Crossing 6
Rivers Ave. (721432P) - Crossing 8
Durant Ave. (632152S) - Crossing 12
Braddock Ave. (632151K) - Crossing 13
Virginia Ave. at Ave. B (9258984Y) - Crossing 14
However, since these seven crossings are not yet designated as quiet zones, horn soundings were still
modeled for these crossings.
3.4 CUT SECTION AND NOISE WALLS
Alternatives 1 and 3 contain plans for a ground cut section (trench) and two sound walls for several
segments of the North lead rail tracks. The trench is designed to level the ground under the tracks. The
sound walls designated E and F are designed to reduce the noise levels due to rail activities entering and
EIS for the Proposed Navy Base Appendix H: Noise and Vibration
Intermodal Container Transfer Facility Technical Memorandum
52
exiting the ICTF facility through the North lead tracks. The dimensions of the trench change depending on
the track location (station). If the trench is significantly deep, the edge of the trench blocks the line of sight
between the source and receiver, and the trench provides significant noise reduction effect (attenuation).
For shallower trench segments, the edge of the trench would also provide some shielding effects for the
receiver. The effective source height for trains with diesel-electric locomotives is 8 feet above the track
according to Figure 6-5 of the FTA Noise and Vibration Manual. The height of the receiver is assumed
5 feet. The noise attenuation provided by the trench is calculated based on the path length distance geometry
following the equations in Table 6-9 and Figure 6-7 of FTA Manual. The resultant terrain shielding
attenuation factor for a given rail location is applied to the output sound level computed by the CREATE
rail noise model (for the flat terrain condition).
When a 10-foot-tall sound wall is present over the flat ground (no trench), the path length difference
between the source and receiver is computed using the same equations. Since the wall is taller than the
effective source height, the line of sight between the source and receiver is broken by the wall, which
significantly increases the attenuation factor. When using this equation, the resultant attenuation factor is
only dependent on the geometry (path length difference). When both the wall and rail trench are present,
combining a 10-foot-tall sound wall with the trench depth always breaks the line of sight between the
effective train source and a receiver. With the barrier attenuation equation applied to this geometry, the
maximum attenuation value of 15 dB(A) is reached. That attenuation factor is applied to the output sound
level from the CREATE rail noise model to calculate the DNL noise contour locations.
3.5 RAIL NOISE CONTOURS
Tables H-17 through H-32 provide information regarding the size of DNL contours along rail segments and
crossings due to rail activity for the No-Action Alternative and all seven build alternatives. Specifics on the
DNL contours are given in terms of distance from the rail centerline. Contours extend in a perpendicular
manner from the rail line. At non-quiet zone rail crossings, the contour expands its size from the segment
contour due to locomotive horn soundings. The crossing contours extend 200 feet away from the crossings
along the rail line. All study area crossings are shown in the following tables, including crossings that are
not impacted due to increased rail activity as a result of the various build alternatives. For several track
segments with identical rail operations under different alternatives, the tables below provide identical DNL
contour distances. The same is valid for several rail crossings.
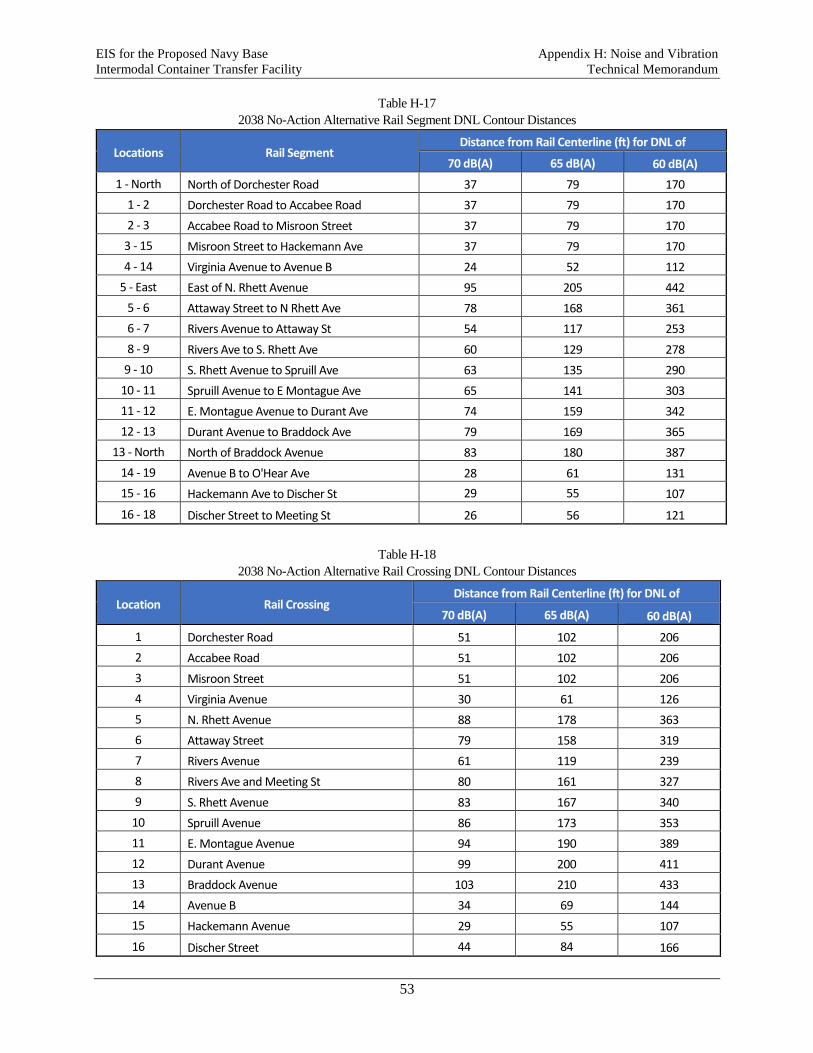
EIS for the Proposed Navy Base Appendix H: Noise and Vibration
Intermodal Container Transfer Facility Technical Memorandum
53
Table H-17
2038 No-Action Alternative Rail Segment DNL Contour Distances
Locations Rail Segment Distance from Rail Centerline (ft) for DNL of
70 dB(A) 65 dB(A) 60 dB(A)
1 - North North of Dorchester Road 37 79 170
1 - 2 Dorchester Road to Accabee Road 37 79 170
2 - 3 Accabee Road to Misroon Street 37 79 170
3 - 15 Misroon Street to Hackemann Ave 37 79 170
4 - 14 Virginia Avenue to Avenue B 24 52 112
5 - East East of N. Rhett Avenue 95 205 442
5 - 6 Attaway Street to N Rhett Ave 78 168 361
6 - 7 Rivers Avenue to Attaway St 54 117 253
8 - 9 Rivers Ave to S. Rhett Ave 60 129 278
9 - 10 S. Rhett Avenue to Spruill Ave 63 135 290
10 - 11 Spruill Avenue to E Montague Ave 65 141 303
11 - 12 E. Montague Avenue to Durant Ave 74 159 342
12 - 13 Durant Avenue to Braddock Ave 79 169 365
13 - North North of Braddock Avenue 83 180 387
14 - 19 Avenue B to O'Hear Ave 28 61 131
15 - 16 Hackemann Ave to Discher St 29 55 107
16 - 18 Discher Street to Meeting St 26 56 121
Table H-18
2038 No-Action Alternative Rail Crossing DNL Contour Distances
Location Rail Crossing Distance from Rail Centerline (ft) for DNL of
70 dB(A) 65 dB(A) 60 dB(A)
1 Dorchester Road 51 102 206
2 Accabee Road 51 102 206
3 Misroon Street 51 102 206
4 Virginia Avenue 30 61 126
5 N. Rhett Avenue 88 178 363
6 Attaway Street 79 158 319
7 Rivers Avenue 61 119 239
8 Rivers Ave and Meeting St 80 161 327
9 S. Rhett Avenue 83 167 340
10 Spruill Avenue 86 173 353
11 E. Montague Avenue 94 190 389
12 Durant Avenue 99 200 411
13 Braddock Avenue 103 210 433
14 Avenue B 34 69 144
15 Hackemann Avenue 29 55 107
16 Discher Street 44 84 166
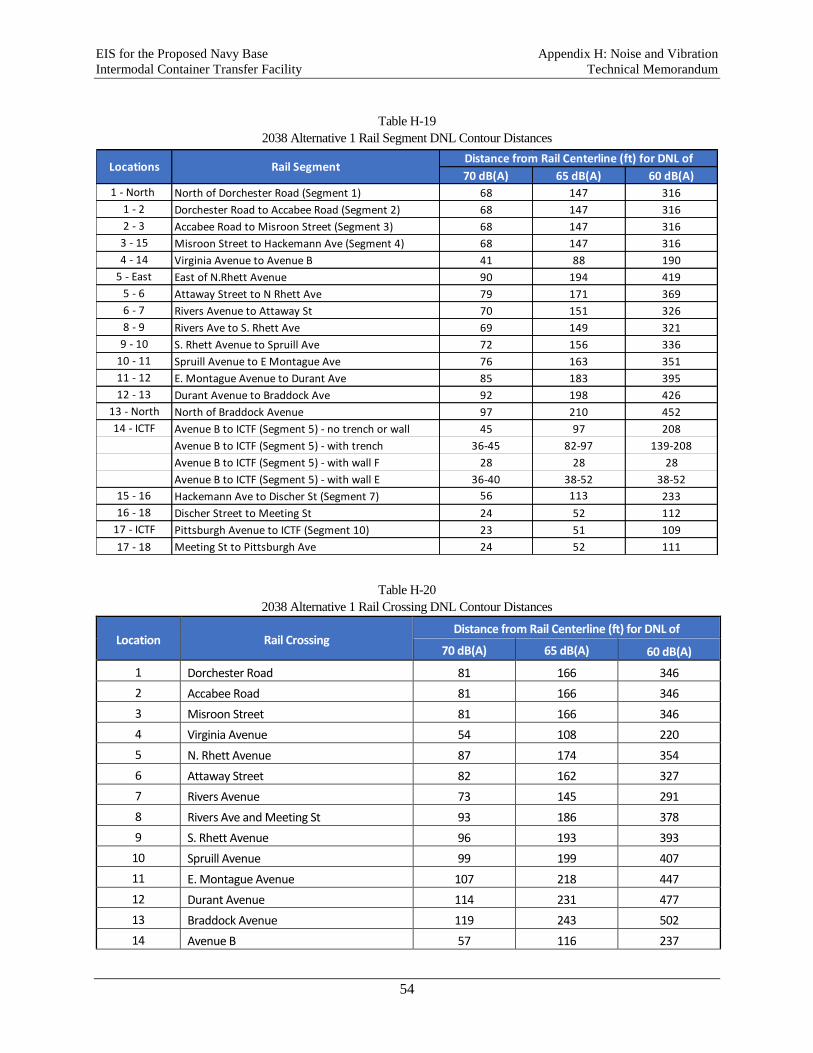
EIS for the Proposed Navy Base Appendix H: Noise and Vibration
Intermodal Container Transfer Facility Technical Memorandum
54
Table H-19
2038 Alternative 1 Rail Segment DNL Contour Distances
Table H-20
2038 Alternative 1 Rail Crossing DNL Contour Distances
Location Rail Crossing Distance from Rail Centerline (ft) for DNL of
70 dB(A) 65 dB(A) 60 dB(A)
1 Dorchester Road 81 166 346
2 Accabee Road 81 166 346
3 Misroon Street 81 166 346
4 Virginia Avenue 54 108 220
5 N. Rhett Avenue 87 174 354
6 Attaway Street 82 162 327
7 Rivers Avenue 73 145 291
8 Rivers Ave and Meeting St 93 186 378
9 S. Rhett Avenue 96 193 393
10 Spruill Avenue 99 199 407
11 E. Montague Avenue 107 218 447
12 Durant Avenue 114 231 477
13 Braddock Avenue 119 243 502
14 Avenue B 57 116 237
70 dB(A) 65 dB(A) 60 dB(A)
1 - North North of Dorchester Road (Segment 1) 68 147 316
1 - 2 Dorchester Road to Accabee Road (Segment 2) 68 147 316
2 - 3 Accabee Road to Misroon Street (Segment 3) 68 147 316
3 - 15 Misroon Street to Hackemann Ave (Segment 4) 68 147 316
4 - 14 Virginia Avenue to Avenue B 41 88 190
5 - East East of N.Rhett Avenue 90 194 419
5 - 6 Attaway Street to N Rhett Ave 79 171 369
6 - 7 Rivers Avenue to Attaway St 70 151 326
8 - 9 Rivers Ave to S. Rhett Ave 69 149 321
9 - 10 S. Rhett Avenue to Spruill Ave 72 156 336
10 - 11 Spruill Avenue to E Montague Ave 76 163 351
11 - 12 E. Montague Avenue to Durant Ave 85 183 395
12 - 13 Durant Avenue to Braddock Ave 92 198 426
13 - North North of Braddock Avenue 97 210 452
14 - ICTF Avenue B to ICTF (Segment 5) - no trench or wall 45 97 208
Avenue B to ICTF (Segment 5) - with trench 36-45 82-97 139-208
Avenue B to ICTF (Segment 5) - with wall F 28 28 28
Avenue B to ICTF (Segment 5) - with wall E 36-40 38-52 38-52
15 - 16 Hackemann Ave to Discher St (Segment 7) 56 113 233
16 - 18 Discher Street to Meeting St 24 52 112
17 - ICTF Pittsburgh Avenue to ICTF (Segment 10) 23 51 109
17 - 18 Meeting St to Pittsburgh Ave 24 52 111
Locations Rail SegmentDistance from Rail Centerline (ft) for DNL of
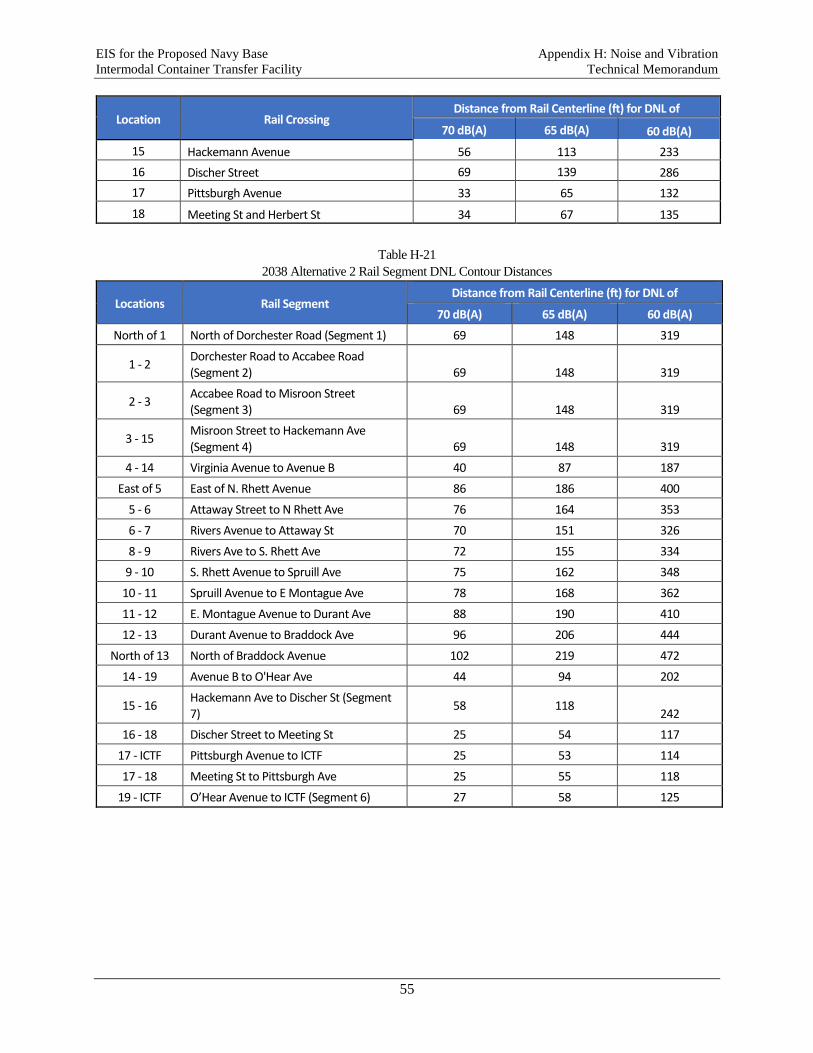
EIS for the Proposed Navy Base Appendix H: Noise and Vibration
Intermodal Container Transfer Facility Technical Memorandum
55
Location Rail Crossing Distance from Rail Centerline (ft) for DNL of
70 dB(A) 65 dB(A) 60 dB(A)
15 Hackemann Avenue 56 113 233
16 Discher Street 69 139 286
17 Pittsburgh Avenue 33 65 132
18 Meeting St and Herbert St 34 67 135
Table H-21
2038 Alternative 2 Rail Segment DNL Contour Distances
Locations Rail Segment Distance from Rail Centerline (ft) for DNL of
70 dB(A) 65 dB(A) 60 dB(A)
North of 1 North of Dorchester Road (Segment 1) 69 148 319
1 - 2 Dorchester Road to Accabee Road (Segment 2) 69 148 319
2 - 3 Accabee Road to Misroon Street (Segment 3) 69 148 319
3 - 15 Misroon Street to Hackemann Ave (Segment 4) 69 148 319
4 - 14 Virginia Avenue to Avenue B 40 87 187
East of 5 East of N. Rhett Avenue 86 186 400
5 - 6 Attaway Street to N Rhett Ave 76 164 353
6 - 7 Rivers Avenue to Attaway St 70 151 326
8 - 9 Rivers Ave to S. Rhett Ave 72 155 334
9 - 10 S. Rhett Avenue to Spruill Ave 75 162 348
10 - 11 Spruill Avenue to E Montague Ave 78 168 362
11 - 12 E. Montague Avenue to Durant Ave 88 190 410
12 - 13 Durant Avenue to Braddock Ave 96 206 444
North of 13 North of Braddock Avenue 102 219 472
14 - 19 Avenue B to O'Hear Ave 44 94 202
15 - 16 Hackemann Ave to Discher St (Segment 7)
58 118 242
16 - 18 Discher Street to Meeting St 25 54 117
17 - ICTF Pittsburgh Avenue to ICTF 25 53 114
17 - 18 Meeting St to Pittsburgh Ave 25 55 118
19 - ICTF O’Hear Avenue to ICTF (Segment 6) 27 58 125
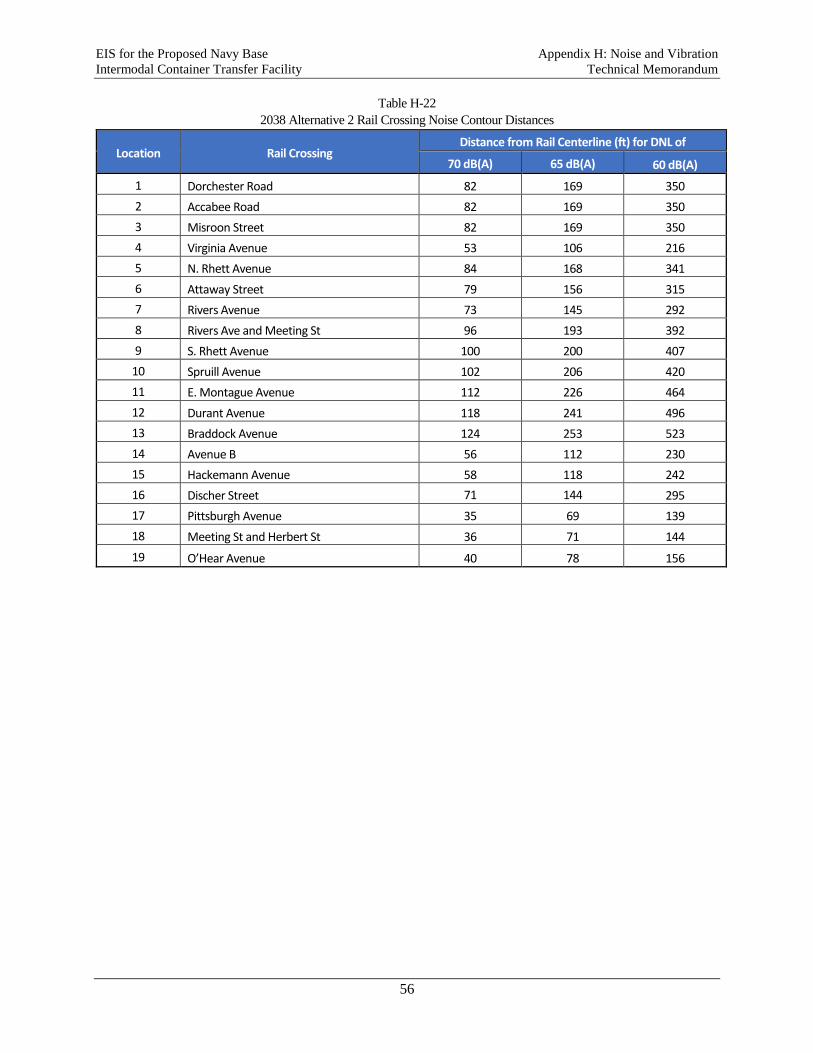
EIS for the Proposed Navy Base Appendix H: Noise and Vibration
Intermodal Container Transfer Facility Technical Memorandum
56
Table H-22
2038 Alternative 2 Rail Crossing Noise Contour Distances
Location Rail Crossing Distance from Rail Centerline (ft) for DNL of
70 dB(A) 65 dB(A) 60 dB(A)
1 Dorchester Road 82 169 350
2 Accabee Road 82 169 350
3 Misroon Street 82 169 350
4 Virginia Avenue 53 106 216
5 N. Rhett Avenue 84 168 341
6 Attaway Street 79 156 315
7 Rivers Avenue 73 145 292
8 Rivers Ave and Meeting St 96 193 392
9 S. Rhett Avenue 100 200 407
10 Spruill Avenue 102 206 420
11 E. Montague Avenue 112 226 464
12 Durant Avenue 118 241 496
13 Braddock Avenue 124 253 523
14 Avenue B 56 112 230
15 Hackemann Avenue 58 118 242
16 Discher Street 71 144 295
17 Pittsburgh Avenue 35 69 139
18 Meeting St and Herbert St 36 71 144
19 O’Hear Avenue 40 78 156
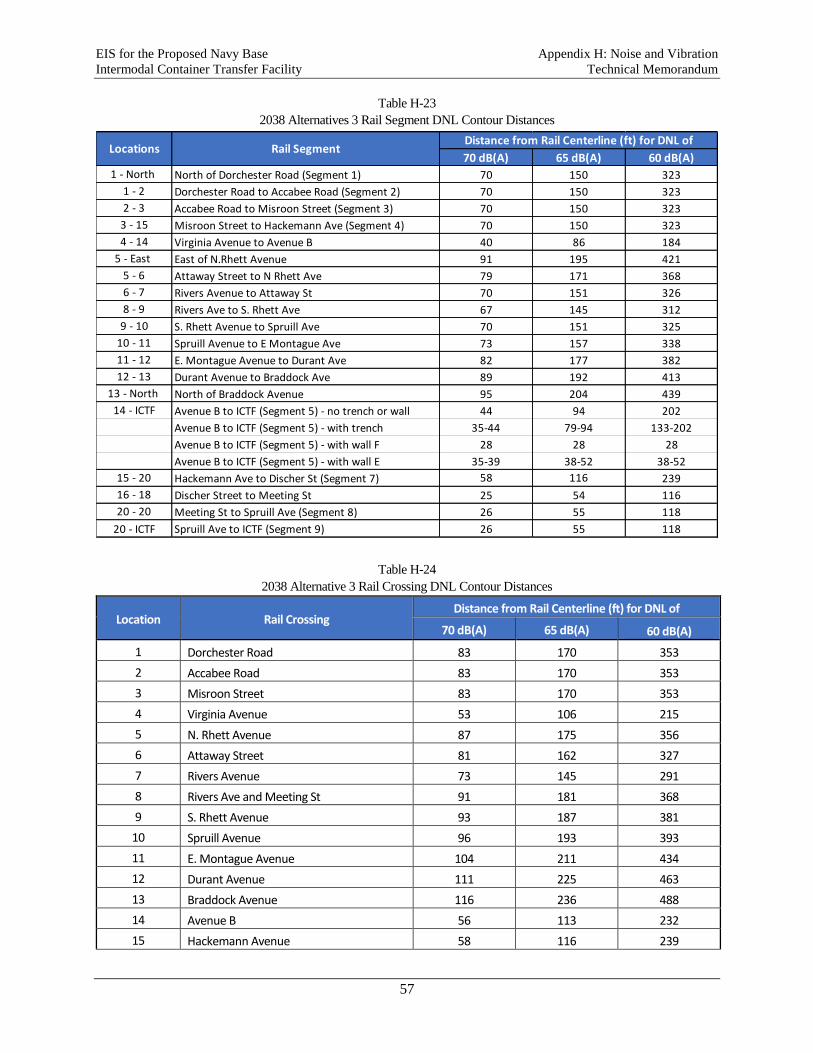
EIS for the Proposed Navy Base Appendix H: Noise and Vibration
Intermodal Container Transfer Facility Technical Memorandum
57
Table H-23
2038 Alternatives 3 Rail Segment DNL Contour Distances
Table H-24
2038 Alternative 3 Rail Crossing DNL Contour Distances
Location Rail Crossing Distance from Rail Centerline (ft) for DNL of
70 dB(A) 65 dB(A) 60 dB(A)
1 Dorchester Road 83 170 353
2 Accabee Road 83 170 353
3 Misroon Street 83 170 353
4 Virginia Avenue 53 106 215
5 N. Rhett Avenue 87 175 356
6 Attaway Street 81 162 327
7 Rivers Avenue 73 145 291
8 Rivers Ave and Meeting St 91 181 368
9 S. Rhett Avenue 93 187 381
10 Spruill Avenue 96 193 393
11 E. Montague Avenue 104 211 434
12 Durant Avenue 111 225 463
13 Braddock Avenue 116 236 488
14 Avenue B 56 113 232
15 Hackemann Avenue 58 116 239
70 dB(A) 65 dB(A) 60 dB(A)
1 - North North of Dorchester Road (Segment 1) 70 150 323
1 - 2 Dorchester Road to Accabee Road (Segment 2) 70 150 323
2 - 3 Accabee Road to Misroon Street (Segment 3) 70 150 323
3 - 15 Misroon Street to Hackemann Ave (Segment 4) 70 150 323
4 - 14 Virginia Avenue to Avenue B 40 86 184
5 - East East of N.Rhett Avenue 91 195 421
5 - 6 Attaway Street to N Rhett Ave 79 171 368
6 - 7 Rivers Avenue to Attaway St 70 151 326
8 - 9 Rivers Ave to S. Rhett Ave 67 145 312
9 - 10 S. Rhett Avenue to Spruill Ave 70 151 325
10 - 11 Spruill Avenue to E Montague Ave 73 157 338
11 - 12 E. Montague Avenue to Durant Ave 82 177 382
12 - 13 Durant Avenue to Braddock Ave 89 192 413
13 - North North of Braddock Avenue 95 204 439
14 - ICTF Avenue B to ICTF (Segment 5) - no trench or wall 44 94 202
Avenue B to ICTF (Segment 5) - with trench 35-44 79-94 133-202
Avenue B to ICTF (Segment 5) - with wall F 28 28 28
Avenue B to ICTF (Segment 5) - with wall E 35-39 38-52 38-52
15 - 20 Hackemann Ave to Discher St (Segment 7) 58 116 239
16 - 18 Discher Street to Meeting St 25 54 116
20 - 20 Meeting St to Spruill Ave (Segment 8) 26 55 118
20 - ICTF Spruill Ave to ICTF (Segment 9) 26 55 118
Locations Rail SegmentDistance from Rail Centerline (ft) for DNL of
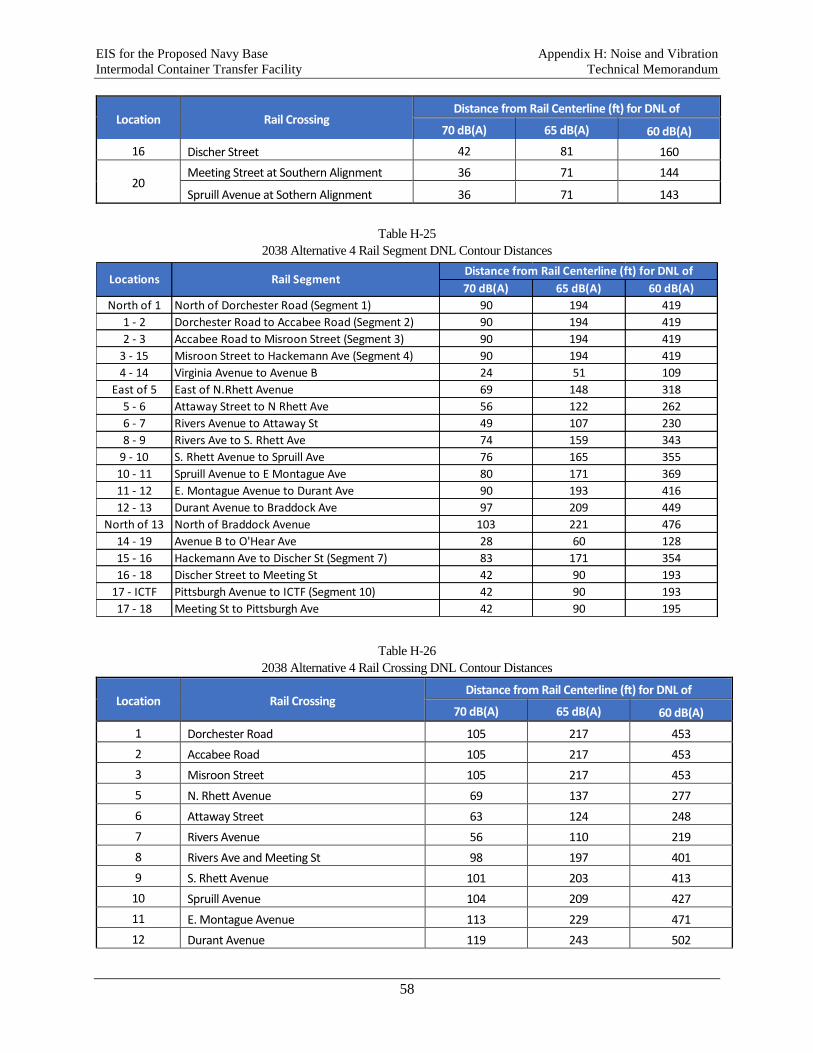
EIS for the Proposed Navy Base Appendix H: Noise and Vibration
Intermodal Container Transfer Facility Technical Memorandum
58
Location Rail Crossing Distance from Rail Centerline (ft) for DNL of
70 dB(A) 65 dB(A) 60 dB(A)
16 Discher Street 42 81 160
20 Meeting Street at Southern Alignment 36 71 144
Spruill Avenue at Sothern Alignment 36 71 143
Table H-25
2038 Alternative 4 Rail Segment DNL Contour Distances
Table H-26
2038 Alternative 4 Rail Crossing DNL Contour Distances
Location Rail Crossing Distance from Rail Centerline (ft) for DNL of
70 dB(A) 65 dB(A) 60 dB(A)
1 Dorchester Road 105 217 453
2 Accabee Road 105 217 453
3 Misroon Street 105 217 453
5 N. Rhett Avenue 69 137 277
6 Attaway Street 63 124 248
7 Rivers Avenue 56 110 219
8 Rivers Ave and Meeting St 98 197 401
9 S. Rhett Avenue 101 203 413
10 Spruill Avenue 104 209 427
11 E. Montague Avenue 113 229 471
12 Durant Avenue 119 243 502
70 dB(A) 65 dB(A) 60 dB(A)
North of 1 North of Dorchester Road (Segment 1) 90 194 419
1 - 2 Dorchester Road to Accabee Road (Segment 2) 90 194 419
2 - 3 Accabee Road to Misroon Street (Segment 3) 90 194 419
3 - 15 Misroon Street to Hackemann Ave (Segment 4) 90 194 419
4 - 14 Virginia Avenue to Avenue B 24 51 109
East of 5 East of N.Rhett Avenue 69 148 318
5 - 6 Attaway Street to N Rhett Ave 56 122 262
6 - 7 Rivers Avenue to Attaway St 49 107 230
8 - 9 Rivers Ave to S. Rhett Ave 74 159 343
9 - 10 S. Rhett Avenue to Spruill Ave 76 165 355
10 - 11 Spruill Avenue to E Montague Ave 80 171 369
11 - 12 E. Montague Avenue to Durant Ave 90 193 416
12 - 13 Durant Avenue to Braddock Ave 97 209 449
North of 13 North of Braddock Avenue 103 221 476
14 - 19 Avenue B to O'Hear Ave 28 60 128
15 - 16 Hackemann Ave to Discher St (Segment 7) 83 171 354
16 - 18 Discher Street to Meeting St 42 90 193
17 - ICTF Pittsburgh Avenue to ICTF (Segment 10) 42 90 193
17 - 18 Meeting St to Pittsburgh Ave 42 90 195
Locations Rail SegmentDistance from Rail Centerline (ft) for DNL of
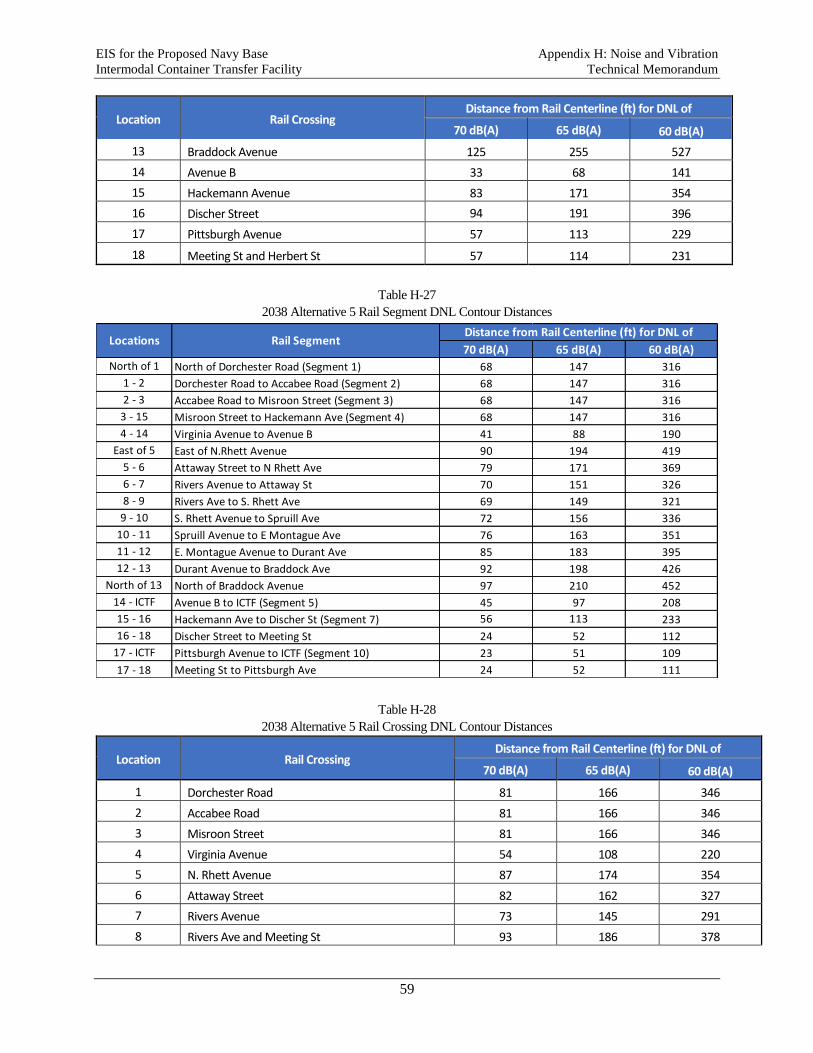
EIS for the Proposed Navy Base Appendix H: Noise and Vibration
Intermodal Container Transfer Facility Technical Memorandum
59
Location Rail Crossing Distance from Rail Centerline (ft) for DNL of
70 dB(A) 65 dB(A) 60 dB(A)
13 Braddock Avenue 125 255 527
14 Avenue B 33 68 141
15 Hackemann Avenue 83 171 354
16 Discher Street 94 191 396
17 Pittsburgh Avenue 57 113 229
18 Meeting St and Herbert St 57 114 231
Table H-27
2038 Alternative 5 Rail Segment DNL Contour Distances
Table H-28
2038 Alternative 5 Rail Crossing DNL Contour Distances
Location Rail Crossing Distance from Rail Centerline (ft) for DNL of
70 dB(A) 65 dB(A) 60 dB(A)
1 Dorchester Road 81 166 346
2 Accabee Road 81 166 346
3 Misroon Street 81 166 346
4 Virginia Avenue 54 108 220
5 N. Rhett Avenue 87 174 354
6 Attaway Street 82 162 327
7 Rivers Avenue 73 145 291
8 Rivers Ave and Meeting St 93 186 378
70 dB(A) 65 dB(A) 60 dB(A)
North of 1 North of Dorchester Road (Segment 1) 68 147 316
1 - 2 Dorchester Road to Accabee Road (Segment 2) 68 147 316
2 - 3 Accabee Road to Misroon Street (Segment 3) 68 147 316
3 - 15 Misroon Street to Hackemann Ave (Segment 4) 68 147 316
4 - 14 Virginia Avenue to Avenue B 41 88 190
East of 5 East of N.Rhett Avenue 90 194 419
5 - 6 Attaway Street to N Rhett Ave 79 171 369
6 - 7 Rivers Avenue to Attaway St 70 151 326
8 - 9 Rivers Ave to S. Rhett Ave 69 149 321
9 - 10 S. Rhett Avenue to Spruill Ave 72 156 336
10 - 11 Spruill Avenue to E Montague Ave 76 163 351
11 - 12 E. Montague Avenue to Durant Ave 85 183 395
12 - 13 Durant Avenue to Braddock Ave 92 198 426
North of 13 North of Braddock Avenue 97 210 452
14 - ICTF Avenue B to ICTF (Segment 5) 45 97 208
15 - 16 Hackemann Ave to Discher St (Segment 7) 56 113 233
16 - 18 Discher Street to Meeting St 24 52 112
17 - ICTF Pittsburgh Avenue to ICTF (Segment 10) 23 51 109
17 - 18 Meeting St to Pittsburgh Ave 24 52 111
Locations Rail SegmentDistance from Rail Centerline (ft) for DNL of
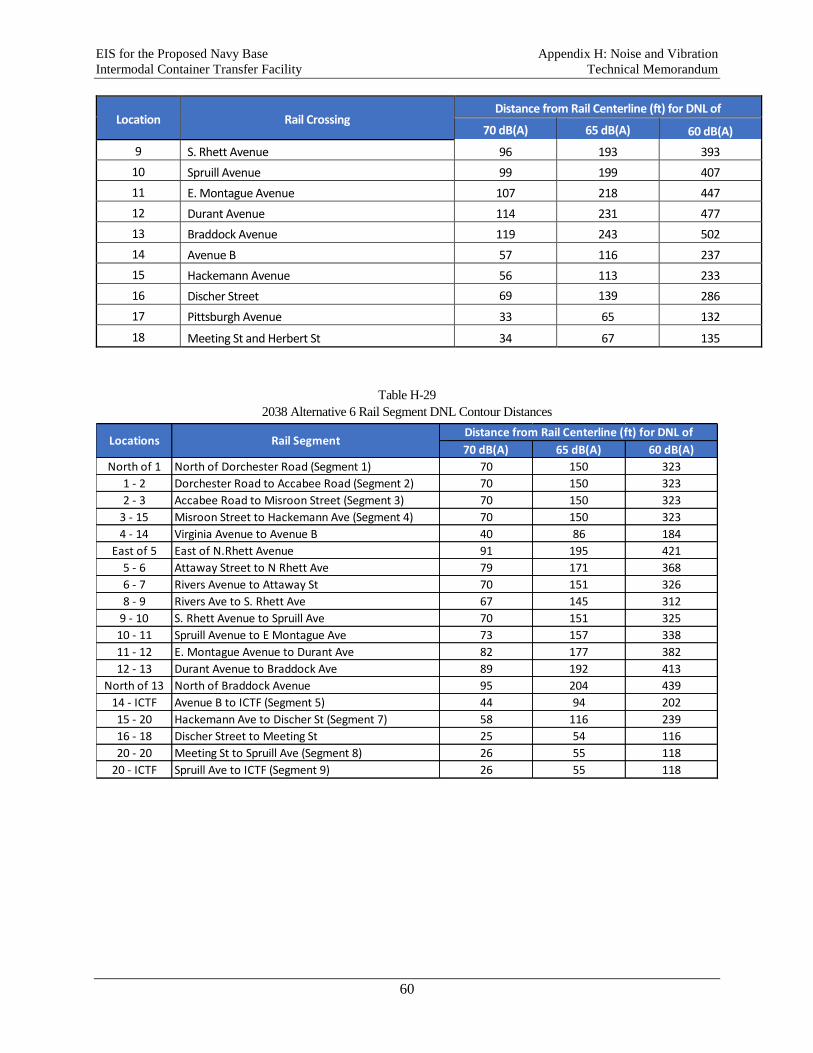
EIS for the Proposed Navy Base Appendix H: Noise and Vibration
Intermodal Container Transfer Facility Technical Memorandum
60
Location Rail Crossing Distance from Rail Centerline (ft) for DNL of
70 dB(A) 65 dB(A) 60 dB(A)
9 S. Rhett Avenue 96 193 393
10 Spruill Avenue 99 199 407
11 E. Montague Avenue 107 218 447
12 Durant Avenue 114 231 477
13 Braddock Avenue 119 243 502
14 Avenue B 57 116 237
15 Hackemann Avenue 56 113 233
16 Discher Street 69 139 286
17 Pittsburgh Avenue 33 65 132
18 Meeting St and Herbert St 34 67 135
Table H-29
2038 Alternative 6 Rail Segment DNL Contour Distances
70 dB(A) 65 dB(A) 60 dB(A)
North of 1 North of Dorchester Road (Segment 1) 70 150 323
1 - 2 Dorchester Road to Accabee Road (Segment 2) 70 150 323
2 - 3 Accabee Road to Misroon Street (Segment 3) 70 150 323
3 - 15 Misroon Street to Hackemann Ave (Segment 4) 70 150 323
4 - 14 Virginia Avenue to Avenue B 40 86 184
East of 5 East of N.Rhett Avenue 91 195 421
5 - 6 Attaway Street to N Rhett Ave 79 171 368
6 - 7 Rivers Avenue to Attaway St 70 151 326
8 - 9 Rivers Ave to S. Rhett Ave 67 145 312
9 - 10 S. Rhett Avenue to Spruill Ave 70 151 325
10 - 11 Spruill Avenue to E Montague Ave 73 157 338
11 - 12 E. Montague Avenue to Durant Ave 82 177 382
12 - 13 Durant Avenue to Braddock Ave 89 192 413
North of 13 North of Braddock Avenue 95 204 439
14 - ICTF Avenue B to ICTF (Segment 5) 44 94 202
15 - 20 Hackemann Ave to Discher St (Segment 7) 58 116 239
16 - 18 Discher Street to Meeting St 25 54 116
20 - 20 Meeting St to Spruill Ave (Segment 8) 26 55 118
20 - ICTF Spruill Ave to ICTF (Segment 9) 26 55 118
Locations Rail SegmentDistance from Rail Centerline (ft) for DNL of
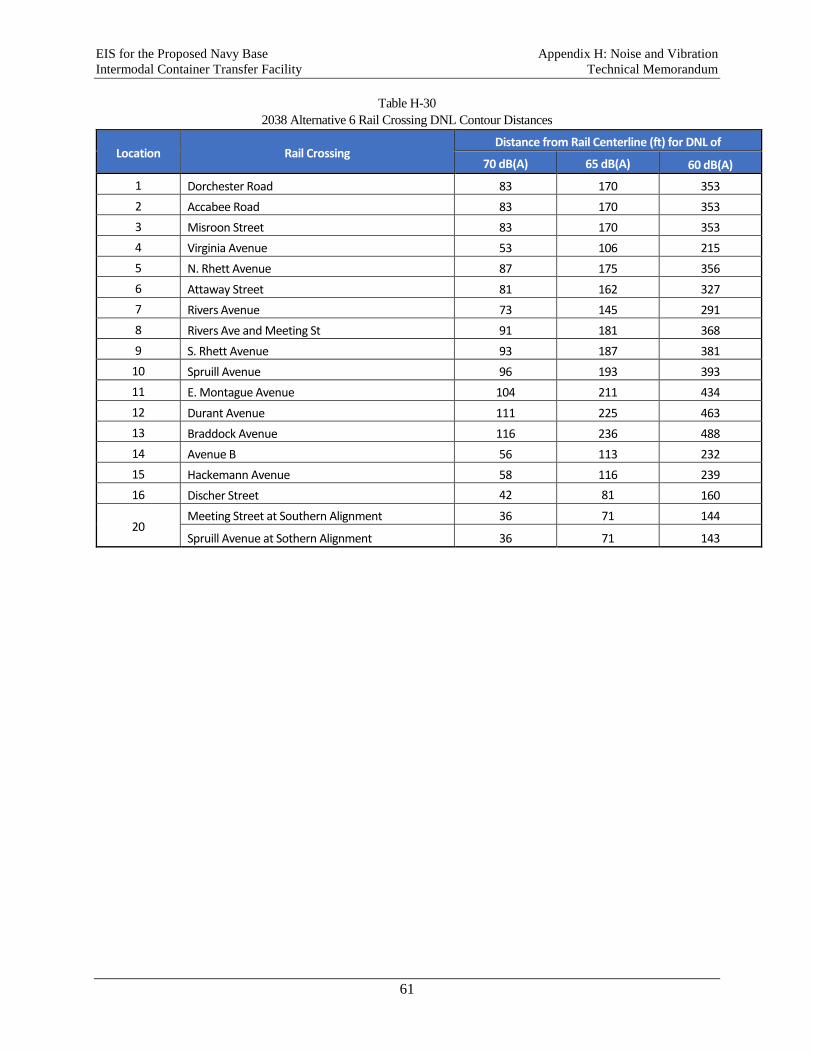
EIS for the Proposed Navy Base Appendix H: Noise and Vibration
Intermodal Container Transfer Facility Technical Memorandum
61
Table H-30
2038 Alternative 6 Rail Crossing DNL Contour Distances
Location Rail Crossing Distance from Rail Centerline (ft) for DNL of
70 dB(A) 65 dB(A) 60 dB(A)
1 Dorchester Road 83 170 353
2 Accabee Road 83 170 353
3 Misroon Street 83 170 353
4 Virginia Avenue 53 106 215
5 N. Rhett Avenue 87 175 356
6 Attaway Street 81 162 327
7 Rivers Avenue 73 145 291
8 Rivers Ave and Meeting St 91 181 368
9 S. Rhett Avenue 93 187 381
10 Spruill Avenue 96 193 393
11 E. Montague Avenue 104 211 434
12 Durant Avenue 111 225 463
13 Braddock Avenue 116 236 488
14 Avenue B 56 113 232
15 Hackemann Avenue 58 116 239
16 Discher Street 42 81 160
20 Meeting Street at Southern Alignment 36 71 144
Spruill Avenue at Sothern Alignment 36 71 143
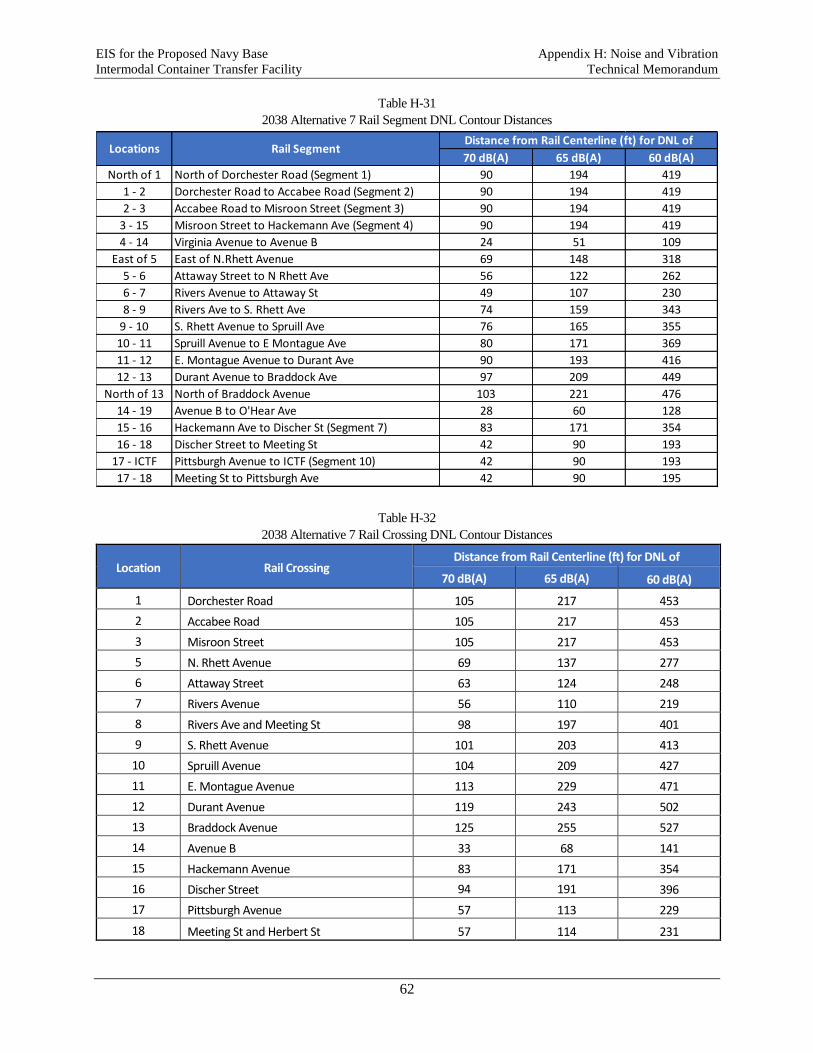
EIS for the Proposed Navy Base Appendix H: Noise and Vibration
Intermodal Container Transfer Facility Technical Memorandum
62
Table H-31
2038 Alternative 7 Rail Segment DNL Contour Distances
Table H-32
2038 Alternative 7 Rail Crossing DNL Contour Distances
Location Rail Crossing Distance from Rail Centerline (ft) for DNL of
70 dB(A) 65 dB(A) 60 dB(A)
1 Dorchester Road 105 217 453
2 Accabee Road 105 217 453
3 Misroon Street 105 217 453
5 N. Rhett Avenue 69 137 277
6 Attaway Street 63 124 248
7 Rivers Avenue 56 110 219
8 Rivers Ave and Meeting St 98 197 401
9 S. Rhett Avenue 101 203 413
10 Spruill Avenue 104 209 427
11 E. Montague Avenue 113 229 471
12 Durant Avenue 119 243 502
13 Braddock Avenue 125 255 527
14 Avenue B 33 68 141
15 Hackemann Avenue 83 171 354
16 Discher Street 94 191 396
17 Pittsburgh Avenue 57 113 229
18 Meeting St and Herbert St 57 114 231
70 dB(A) 65 dB(A) 60 dB(A)
North of 1 North of Dorchester Road (Segment 1) 90 194 419
1 - 2 Dorchester Road to Accabee Road (Segment 2) 90 194 419
2 - 3 Accabee Road to Misroon Street (Segment 3) 90 194 419
3 - 15 Misroon Street to Hackemann Ave (Segment 4) 90 194 419
4 - 14 Virginia Avenue to Avenue B 24 51 109
East of 5 East of N.Rhett Avenue 69 148 318
5 - 6 Attaway Street to N Rhett Ave 56 122 262
6 - 7 Rivers Avenue to Attaway St 49 107 230
8 - 9 Rivers Ave to S. Rhett Ave 74 159 343
9 - 10 S. Rhett Avenue to Spruill Ave 76 165 355
10 - 11 Spruill Avenue to E Montague Ave 80 171 369
11 - 12 E. Montague Avenue to Durant Ave 90 193 416
12 - 13 Durant Avenue to Braddock Ave 97 209 449
North of 13 North of Braddock Avenue 103 221 476
14 - 19 Avenue B to O'Hear Ave 28 60 128
15 - 16 Hackemann Ave to Discher St (Segment 7) 83 171 354
16 - 18 Discher Street to Meeting St 42 90 193
17 - ICTF Pittsburgh Avenue to ICTF (Segment 10) 42 90 193
17 - 18 Meeting St to Pittsburgh Ave 42 90 195
Locations Rail SegmentDistance from Rail Centerline (ft) for DNL of
EIS for the Proposed Navy Base Appendix H: Noise and Vibration
Intermodal Container Transfer Facility Technical Memorandum
63
Tables H-19 and H-23 for Alternatives 1 and 3, respectively, show a set of four rail segment options for
locations between Crossing 14 (Avenue B) and ICTF (Segment 5), with each option representing the north
lead track conditions within the Hospital District, where it could be positioned in a trench and provided
with noise walls. In this case, the DNL contour distances from the track would vary in the ranges shown
for each contour, depending on the trench/wall configuration as described in sub-section 3.4.
EIS for the Proposed Navy Base Appendix H: Noise and Vibration
Intermodal Container Transfer Facility Technical Memorandum
64
This page intentionally left blank.
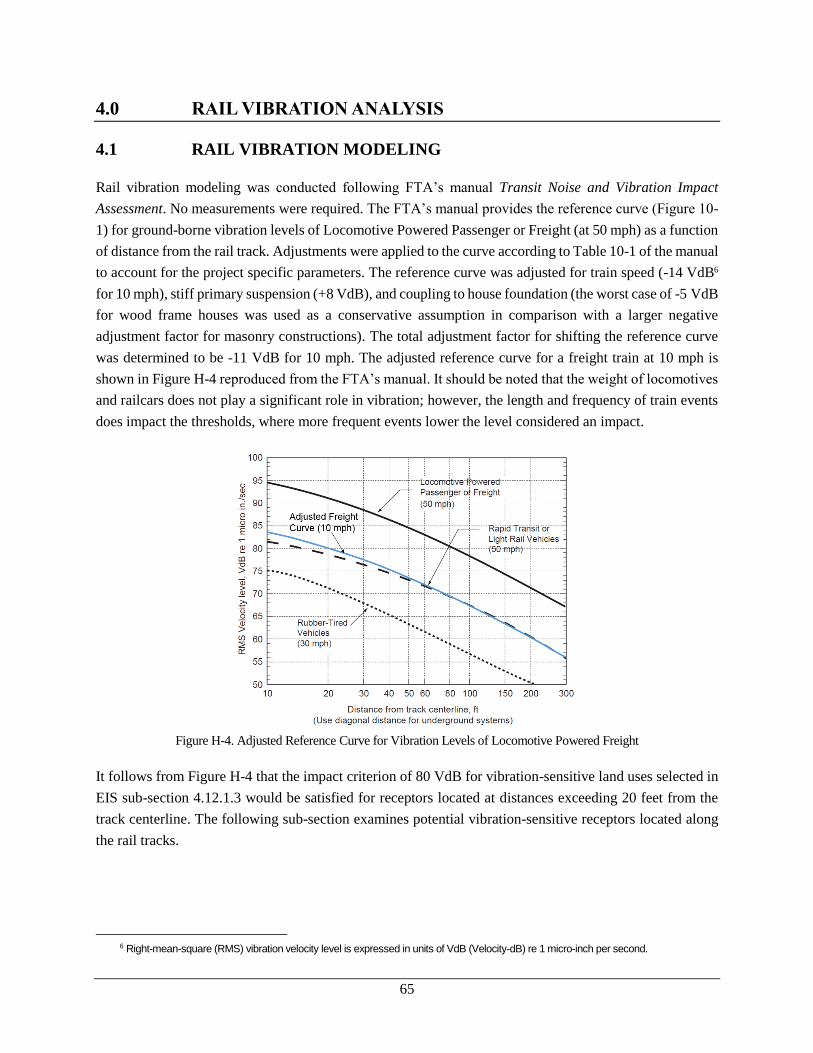
65
4.0 RAIL VIBRATION ANALYSIS
4.1 RAIL VIBRATION MODELING
Rail vibration modeling was conducted following FTA’s manual Transit Noise and Vibration Impact
Assessment. No measurements were required. The FTA’s manual provides the reference curve (Figure 10-
1) for ground-borne vibration levels of Locomotive Powered Passenger or Freight (at 50 mph) as a function
of distance from the rail track. Adjustments were applied to the curve according to Table 10-1 of the manual
to account for the project specific parameters. The reference curve was adjusted for train speed (-14 VdB6
for 10 mph), stiff primary suspension (+8 VdB), and coupling to house foundation (the worst case of -5 VdB
for wood frame houses was used as a conservative assumption in comparison with a larger negative
adjustment factor for masonry constructions). The total adjustment factor for shifting the reference curve
was determined to be -11 VdB for 10 mph. The adjusted reference curve for a freight train at 10 mph is
shown in Figure H-4 reproduced from the FTA’s manual. It should be noted that the weight of locomotives
and railcars does not play a significant role in vibration; however, the length and frequency of train events
does impact the thresholds, where more frequent events lower the level considered an impact.
Figure H-4. Adjusted Reference Curve for Vibration Levels of Locomotive Powered Freight
It follows from Figure H-4 that the impact criterion of 80 VdB for vibration-sensitive land uses selected in
EIS sub-section 4.12.1.3 would be satisfied for receptors located at distances exceeding 20 feet from the
track centerline. The following sub-section examines potential vibration-sensitive receptors located along
the rail tracks.
6 Right-mean-square (RMS) vibration velocity level is expressed in units of VdB (Velocity-dB) re 1 micro-inch per second.
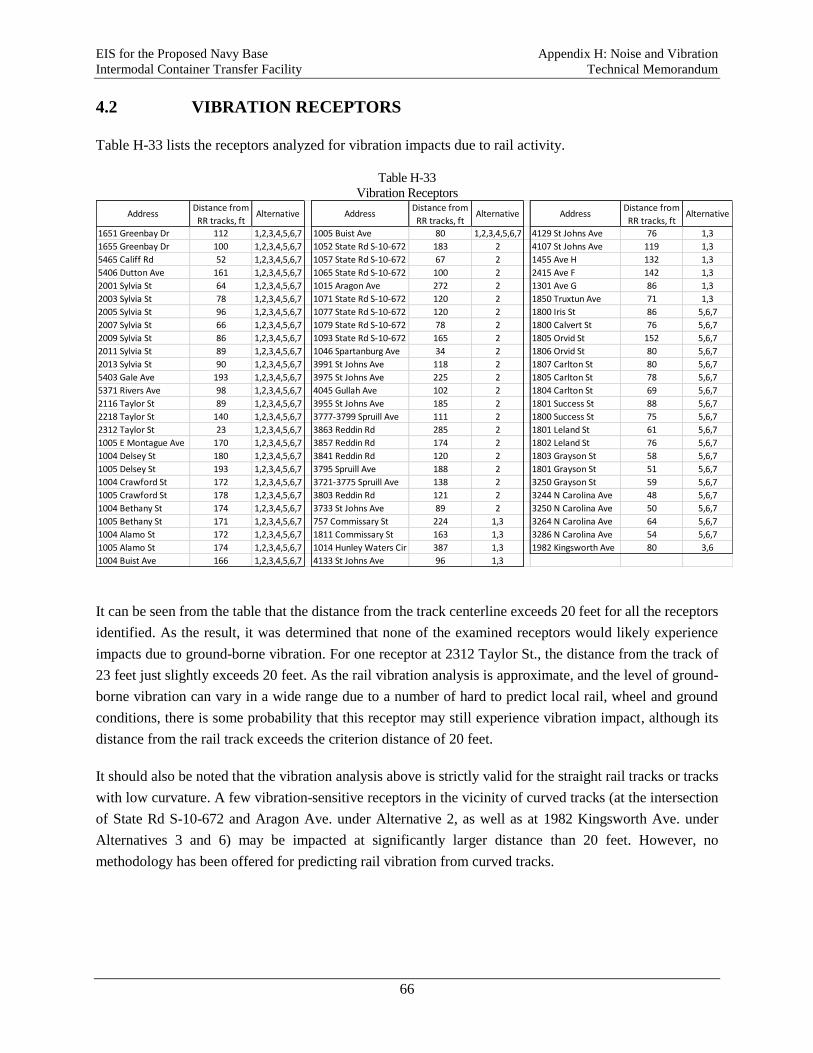
EIS for the Proposed Navy Base Appendix H: Noise and Vibration
Intermodal Container Transfer Facility Technical Memorandum
66
4.2 VIBRATION RECEPTORS
Table H-33 lists the receptors analyzed for vibration impacts due to rail activity.
Table H-33
Vibration Receptors
It can be seen from the table that the distance from the track centerline exceeds 20 feet for all the receptors
identified. As the result, it was determined that none of the examined receptors would likely experience
impacts due to ground-borne vibration. For one receptor at 2312 Taylor St., the distance from the track of
23 feet just slightly exceeds 20 feet. As the rail vibration analysis is approximate, and the level of ground-
borne vibration can vary in a wide range due to a number of hard to predict local rail, wheel and ground
conditions, there is some probability that this receptor may still experience vibration impact, although its
distance from the rail track exceeds the criterion distance of 20 feet.
It should also be noted that the vibration analysis above is strictly valid for the straight rail tracks or tracks
with low curvature. A few vibration-sensitive receptors in the vicinity of curved tracks (at the intersection
of State Rd S-10-672 and Aragon Ave. under Alternative 2, as well as at 1982 Kingsworth Ave. under
Alternatives 3 and 6) may be impacted at significantly larger distance than 20 feet. However, no
methodology has been offered for predicting rail vibration from curved tracks.
AddressDistance from
RR tracks, ftAlternative Address
Distance from
RR tracks, ftAlternative Address
Distance from
RR tracks, ftAlternative
1651 Greenbay Dr 112 1,2,3,4,5,6,7 1005 Buist Ave 80 1,2,3,4,5,6,7 4129 St Johns Ave 76 1,3
1655 Greenbay Dr 100 1,2,3,4,5,6,7 1052 State Rd S-10-672 183 2 4107 St Johns Ave 119 1,3
5465 Califf Rd 52 1,2,3,4,5,6,7 1057 State Rd S-10-672 67 2 1455 Ave H 132 1,3
5406 Dutton Ave 161 1,2,3,4,5,6,7 1065 State Rd S-10-672 100 2 2415 Ave F 142 1,3
2001 Sylvia St 64 1,2,3,4,5,6,7 1015 Aragon Ave 272 2 1301 Ave G 86 1,3
2003 Sylvia St 78 1,2,3,4,5,6,7 1071 State Rd S-10-672 120 2 1850 Truxtun Ave 71 1,3
2005 Sylvia St 96 1,2,3,4,5,6,7 1077 State Rd S-10-672 120 2 1800 Iris St 86 5,6,7
2007 Sylvia St 66 1,2,3,4,5,6,7 1079 State Rd S-10-672 78 2 1800 Calvert St 76 5,6,7
2009 Sylvia St 86 1,2,3,4,5,6,7 1093 State Rd S-10-672 165 2 1805 Orvid St 152 5,6,7
2011 Sylvia St 89 1,2,3,4,5,6,7 1046 Spartanburg Ave 34 2 1806 Orvid St 80 5,6,7
2013 Sylvia St 90 1,2,3,4,5,6,7 3991 St Johns Ave 118 2 1807 Carlton St 80 5,6,7
5403 Gale Ave 193 1,2,3,4,5,6,7 3975 St Johns Ave 225 2 1805 Carlton St 78 5,6,7
5371 Rivers Ave 98 1,2,3,4,5,6,7 4045 Gullah Ave 102 2 1804 Carlton St 69 5,6,7
2116 Taylor St 89 1,2,3,4,5,6,7 3955 St Johns Ave 185 2 1801 Success St 88 5,6,7
2218 Taylor St 140 1,2,3,4,5,6,7 3777-3799 Spruill Ave 111 2 1800 Success St 75 5,6,7
2312 Taylor St 23 1,2,3,4,5,6,7 3863 Reddin Rd 285 2 1801 Leland St 61 5,6,7
1005 E Montague Ave 170 1,2,3,4,5,6,7 3857 Reddin Rd 174 2 1802 Leland St 76 5,6,7
1004 Delsey St 180 1,2,3,4,5,6,7 3841 Reddin Rd 120 2 1803 Grayson St 58 5,6,7
1005 Delsey St 193 1,2,3,4,5,6,7 3795 Spruill Ave 188 2 1801 Grayson St 51 5,6,7
1004 Crawford St 172 1,2,3,4,5,6,7 3721-3775 Spruill Ave 138 2 3250 Grayson St 59 5,6,7
1005 Crawford St 178 1,2,3,4,5,6,7 3803 Reddin Rd 121 2 3244 N Carolina Ave 48 5,6,7
1004 Bethany St 174 1,2,3,4,5,6,7 3733 St Johns Ave 89 2 3250 N Carolina Ave 50 5,6,7
1005 Bethany St 171 1,2,3,4,5,6,7 757 Commissary St 224 1,3 3264 N Carolina Ave 64 5,6,7
1004 Alamo St 172 1,2,3,4,5,6,7 1811 Commissary St 163 1,3 3286 N Carolina Ave 54 5,6,7
1005 Alamo St 174 1,2,3,4,5,6,7 1014 Hunley Waters Cir 387 1,3 1982 Kingsworth Ave 80 3,6
1004 Buist Ave 166 1,2,3,4,5,6,7 4133 St Johns Ave 96 1,3
67
5.0 CONSTRUCTION NOISE ANALYSIS
5.1 NOISE FROM CONSTRUCTION EQUIPMENT
Construction activities would be conducted on approximately 118 acres of land over a total duration of
approximately 39 months, six (6) days per week (Monday through Saturday), with 3 acres of disturbance
per day. General site demolition and grading activities are scheduled to last approximately 21 months.
Construction of an earthen berm along the western border of the Proposed Project Site for abatement of
noise produced by ICTF operations would involve temporary activities (15 days) of loud construction
equipment in close proximity to the nearest residences, from 10 to 60 feet. Impact pile drivers would be
utilized in various locations at the site in construction of support pads for rail mounted gantry (RMG) cranes
(60 days) and for driving H-beam piles (type HP) for box culvert upgrades (30 days), as well as in
construction of bridges (remote from noise-sensitive receivers).
Noise levels generated by construction equipment vary greatly depending on factors such as the type of
equipment, specific model, operation being performed, and condition of the equipment. The equivalent
sound level (Leq) of the construction activity also depends on the fraction of time that the equipment is
operated over the time period of construction (usage factor). The dominant source of noise from most
construction equipment is the engine, usually a diesel, often without sufficient muffling. In a few cases,
such as pile-driving or pavement-breaking, noise generated by the process dominates.
Noise assessment for construction operations is conducted in accordance with the FHWA’s Roadway
Construction Noise Model (RCNM). The RCNM is a national model based on the noise calculations and
extensive construction noise data compiled for the Central Artery/Tunnel (CA/T) project in Boston, MA. It
provides a table of equipment noise emission levels (maximum levels at 50 feet) and usage factors for
representative pieces of equipment, which is reproduced in Table H-34. The model adjusts the noise
emission levels for the project specific parameters including the distance between the noise source and
receptor, number of pieces of equipment in use at the same time and usage factors.
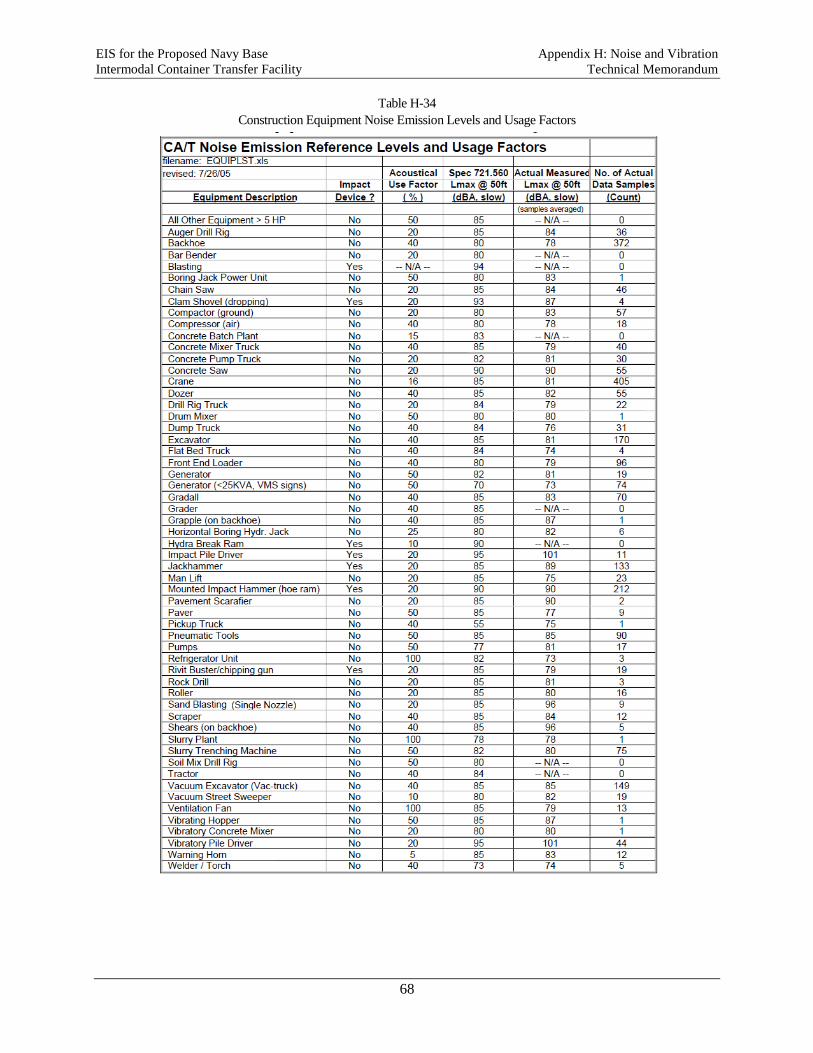
EIS for the Proposed Navy Base Appendix H: Noise and Vibration
Intermodal Container Transfer Facility Technical Memorandum
68
Table H-34
Construction Equipment Noise Emission Levels and Usage Factors
EIS for the Proposed Navy Base Appendix H: Noise and Vibration
Intermodal Container Transfer Facility Technical Memorandum
69
5.2 CONSTRUCTION NOISE AT SENSITIVE RECEIVERS
The ICTF construction at the Proposed Project Site or River Center Site would be accomplished in several
phases. Each phase would have a specific equipment mix depending on the work to be accomplished during
that phase. General site demolition and grading activities are scheduled to last approximately 14 months.
Among equipment that is scheduled to operate during the site demolition phase, the highest noise emission
levels would be generated by cranes, dump and haul trucks, excavators, front end loaders, graders and large
dozers. Demolition activities would take place at various locations throughout the large project site, and
noise levels at the noise-sensitive land uses near the site would vary noticeably depending on the distance
from the activities. Construction of an earthen berm along the western border of the Proposed Project Site
for abatement of noise from ICTF operations would last for 15 days in close proximity to the Chicora-
Cherokee community. The earthen berm construction would involve excavators, haul trucks, graders, roller
compactors, front end loaders, water trucks, and earth mover scrapers. Other ICTF yard on-site construction
activities lasting for 24 months would additionally include backhoe loaders, concrete trucks and pumps,
generators, rail production and welding machines, and other equipment. Impact pile drivers would be
utilized in various locations at the site in construction of support pads for rail mounted gantry (RMG) cranes
for 60 days and for driving H-beam piles (type HP) for box culvert upgrades for 30 days, as well as in
construction of bridges remote from noise-sensitive receivers.
Construction of a sound attenuation wall along the eastern boundary of the River Center Site for abatement
of noise from ICTF operations under Alternatives 5 through 7 would be conducted in proximity to the
residential community of CNYOQ Historic District. Impact pile drivers would be utilized in various
locations at the site in construction of the noise wall, support pads for rail mounted gantry (RMG) cranes,
and for driving H-beam piles (type HP) for box culvert upgrades.
The overall noise estimates for the nearest residential land uses in several potential scenarios of the
equipment distribution over the construction site and various construction phases at the Proposed Project
Site (Alternatives 1 through 4) are summarized in EIS Table 4.12-12. In addition, RCNM was used to
determine the distances where the noise level would reach the threshold value of 80 dB(A) for the noisiest
pieces of construction equipment individually. The data are provided in Table H-35 and may be used for
construction planning purposes. For an individual piece of equipment placed at a distance closer than shown
in the table, the noise level reaching a noise-sensitive receptor would exceed the criterion level of 80 dB(A).

EIS for the Proposed Navy Base Appendix H: Noise and Vibration
Intermodal Container Transfer Facility Technical Memorandum
70
Table H-35
Distance from Construction Equipment to Noise Level of 80 dB(A)
Construction Equipment Distance to
Noise Level of 80 dB(A), ft
1 2
Impact Pile Driver 260
Grader 56
Scraper 48
Dozer 39
Generator 38
Excavator 35
Compactor (ground) 33
Front End Loader 29
Concrete Mixer Truck 28
Concrete Pump Truck 27
Paver 26
Backhoe 24
Crane 22
Dump Truck 21
Flat Bed Truck 17
Rail Welding Machine 16
5.3 TRENCH/WALL CONSTRUCTION NOISE
Construction of a north lead track with a trench (“cut section”) under Alternatives 1 and 3 is planned for
7 months, with 60 days allocated for construction of sound/retaining walls E and F. Construction activities
would involve crawler cranes, backhoe loaders, concrete trucks, concrete pumps, mobile cranes, front end
loaders, roller compactors, water trucks, graders, and dump trucks. RCNM was utilized for modeling
several potential scenarios of the equipment distribution over the north lead construction area. For the
nearest noise-sensitive receptors (residential, a church and a school along St. John’s Avenue) located at
approximately 100 feet from the trench and/or sound wall, the estimated average construction noise levels
would vary between 74 and 79 dB(A), thus meeting the established construction noise criterion of 80 dB(A).
Construction activities of the predicted noise levels would be clearly audible over the existing ambient noise
in the surrounding community, but may be tolerable due to the short-term nature of the disturbance. No
long-term noise impact due to construction activities is predicted for the “cut section” and sound walls E
and F.
71
6.0 OPERATIONAL NOISE ANALYSIS
6.1 NOISE FROM TRAIN OPERATIONS
Train activities in a rail yard setting have three primary noise generation movements: arrival or departure
(locomotive diesel engine pass-by), general rail car movement (rolling), and rail car coupling (concussion
of rail car buffers at stop-and-goes and during switching operations). To characterize these movements,
noise measurements for rail operations similar to the ones to be conducted at ICTF were conducted at Port
of Charleston Columbus Street Terminal on July 29, 2014. The noise measurements were performed at a
distance of 38 feet from the center of the rail track carrying the train operations7. The maximum 1-second
Leq sound levels measured for the train operations are summarized in Table H-36 (no locomotive horn
soundings were observed). The average noise levels per hour for the train operations were not measured
due to time constrains. The rail car coupling is by far the loudest train operation measured [maximum
1-second Leq of 97 dB(A)], but occurred only for several seconds at a time. The average noise level per
cycle (engine passing/general car roll/car coupling) of 74 dB(A) at 38 feet from the train was determined
from the measurement record, which is 23 dB(A) below the maximum level measured for the car coupling.
Since the time sequence of train operations could vary at the proposed ICTF, the hourly average noise levels
might differ considerably from the average per cycle value determined at the Columbus Street Terminal. It
is conservatively assumed, therefore, that the hourly average noise level of train operations at ICTF would
be approximately 15 to 20 dB(A) below the maximum level measured for car coupling. No locomotive horn
sounding at the facility or near its gates was also assumed.
6.2 NOISE FROM CRANE OPERATIONS
Noise specification data for wide-span gantry cranes to be used at ICTF for transferring and processing
containers, are also summarized in Table H-36 per the “Acoustic Requirements for Container Cranes 14
60 43” by the crane manufacturer Hans Kunz Gesellschaft. The table provides the maximum permissible
acoustic emission levels as measured in specified locations at 82 feet from the crane for the three types of
movement: crane traveling, trolley traveling, and hoisting/lowering. Assuming that the three crane
movements would be about equally spread through each operating hour, the overall hourly average noise
level at a distance of 82 feet from the crane would be approximately 51 dB(A)8.
6.3 OTHER OPERATIONAL NOISE SOURCES
Container stacking for processing and storing may generate noise from impacts with other containers, truck
trailers, or the ground. Table H-36 includes data for container impact noise at a distance of 100 feet,
7 The measurement distance of 38 feet was selected based on the field conditions at the site. The measurements are used to obtain
input data for the noise analysis of operations at the ICTF facility. This part of noise impact is not analyzed using the CREATE railroad
noise model, and the measurement distance used is not associated with the CREATE reference distance of 50 feet. 8 The value of 51 dB(A) is calculated as a logarithmic sum of the average noise levels for each of the three individual crane movements
[55, 47, and 43 dB(A) from Table H-36] with a time-correction factor of minus 5 dB(A) accounting for the 20-minute operational interval
for each movement within an hour [10 log(20/60) = -5 dB(A)].
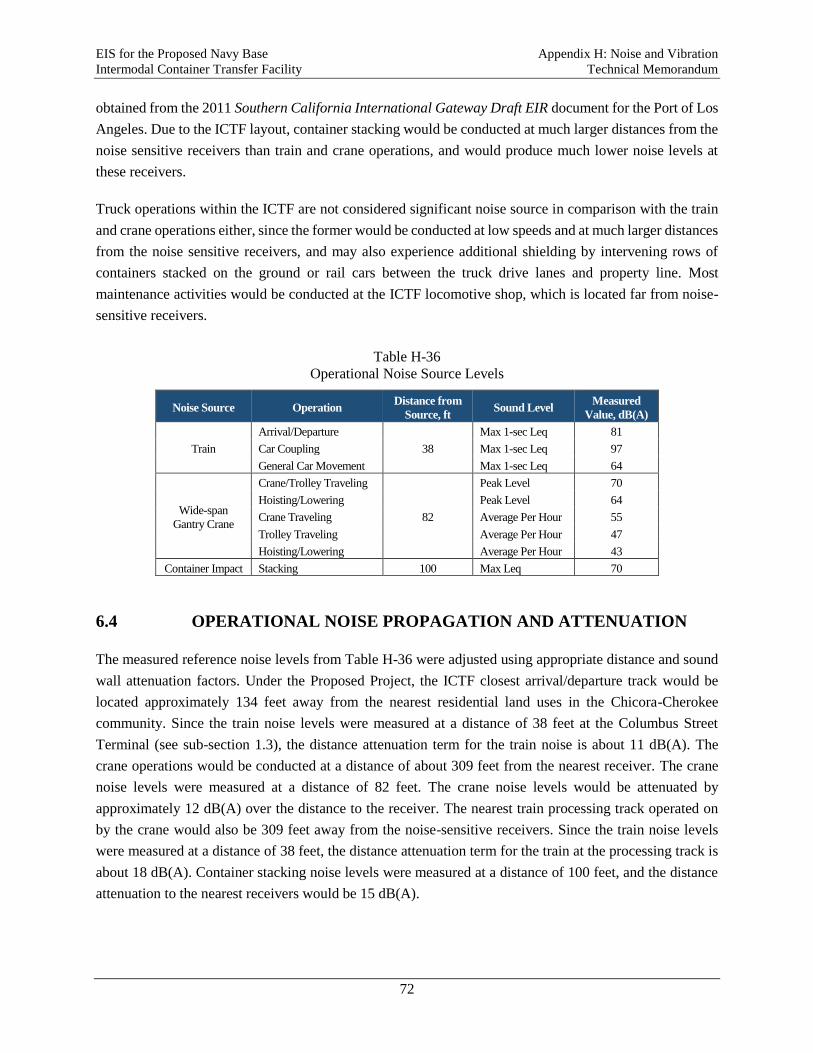
EIS for the Proposed Navy Base Appendix H: Noise and Vibration
Intermodal Container Transfer Facility Technical Memorandum
72
obtained from the 2011 Southern California International Gateway Draft EIR document for the Port of Los
Angeles. Due to the ICTF layout, container stacking would be conducted at much larger distances from the
noise sensitive receivers than train and crane operations, and would produce much lower noise levels at
these receivers.
Truck operations within the ICTF are not considered significant noise source in comparison with the train
and crane operations either, since the former would be conducted at low speeds and at much larger distances
from the noise sensitive receivers, and may also experience additional shielding by intervening rows of
containers stacked on the ground or rail cars between the truck drive lanes and property line. Most
maintenance activities would be conducted at the ICTF locomotive shop, which is located far from noise-
sensitive receivers.
Table H-36
Operational Noise Source Levels
Noise Source Operation Distance from
Source, ft Sound Level
Measured
Value, dB(A)
Train
Arrival/Departure
38
Max 1-sec Leq 81
Car Coupling Max 1-sec Leq 97
General Car Movement Max 1-sec Leq 64
Wide-span
Gantry Crane
Crane/Trolley Traveling
82
Peak Level 70
Hoisting/Lowering Peak Level 64
Crane Traveling Average Per Hour 55
Trolley Traveling Average Per Hour 47
Hoisting/Lowering Average Per Hour 43
Container Impact Stacking 100 Max Leq 70
6.4 OPERATIONAL NOISE PROPAGATION AND ATTENUATION
The measured reference noise levels from Table H-36 were adjusted using appropriate distance and sound
wall attenuation factors. Under the Proposed Project, the ICTF closest arrival/departure track would be
located approximately 134 feet away from the nearest residential land uses in the Chicora-Cherokee
community. Since the train noise levels were measured at a distance of 38 feet at the Columbus Street
Terminal (see sub-section 1.3), the distance attenuation term for the train noise is about 11 dB(A). The
crane operations would be conducted at a distance of about 309 feet from the nearest receiver. The crane
noise levels were measured at a distance of 82 feet. The crane noise levels would be attenuated by
approximately 12 dB(A) over the distance to the receiver. The nearest train processing track operated on
by the crane would also be 309 feet away from the noise-sensitive receivers. Since the train noise levels
were measured at a distance of 38 feet, the distance attenuation term for the train at the processing track is
about 18 dB(A). Container stacking noise levels were measured at a distance of 100 feet, and the distance
attenuation to the nearest receivers would be 15 dB(A).
EIS for the Proposed Navy Base Appendix H: Noise and Vibration
Intermodal Container Transfer Facility Technical Memorandum
73
An earthen berm to be constructed between the ICTF and residential community in the Proposed Project
would provide additional noise attenuation. A nearly 70-foot-wide berm 10 feet above top of rail would be
located 10 to 20 feet away from the nearest residences. A maximum noise attenuation for the berm is
estimated at 15 dB(A) following the FTA procedures (FTA 2006, Table 6-9). However, this value does not
account for temperature, wind and other weather conditions. From practical experience, a more
conservative estimation for the earthen berm attenuation is approximately 10 dB(A).
The noise analysis is summarized in EIS Table 4.12-13 for the residential receivers 10 feet away from the
berm’s foot at the Proposed Project Site (Alternatives 1 through 4). For the River Center Site (Alternatives
5 through 7), a similar noise analysis is provided in PFDEIS Table 4.12-22.
A GIS analysis of the community near the proposed berm assumed that if a house facing the berm does not
have shielding from the ICTF by other house(s), it is considered first row nearest to the berm; if there is
shielding, it is considered second row. If the berm line touches the structure of a house, that house is
assumed to be demolished. If the berm only touches the yard and not the structure, it is assumed that the
house will remain standing after the berm construction. The analysis showed that the number of houses in
the first row from the berm would be from 14 to 16. The number of houses in the second row would be at
least 10.

EIS for the Proposed Navy Base Appendix H: Noise and Vibration
Intermodal Container Transfer Facility Technical Memorandum
74
This page intentionally left blank.
75
7.0 ADDITIVE NOISE IMPACTS
7.1 ADDITIVE NOISE IMPACT OF TRAFFIC AND TRAIN
ACTIVITIES
Noise sensitive receptors along several road segments in the study area may be affected by more than one
noise source. Receptors along the following roads may experience noise impacts from both traffic and rail
generated noise under certain alternatives where rail tracks run near road segments:
Virginia Avenue between Montague Avenue and Buist Avenue (Alternatives 1, 2, 3, 5 and 6);
St. Johns Avenue between O’Hear Avenue and McMillan Avenue (Alternatives 1 and 3);
Spruill Avenue between Noisette Creek and N. Carolina Avenue (Alternative 2);
Port Drayage Road between Port Access Road and ICTF (Alternatives 5, 6, and 7).
Since traffic noise analysis and rail noise analysis above are based on two different noise metrics (Leq(h) vs.
DNL, respectively), for the assessment of additive noise impacts the units need to be converted. Following
the FTA Manual (FTA 2006, Appendix D), the DNL can be approximately represented by the value of Leq(h)
minus 2 dB(A), which gives a moderately underestimated DNL value. For the purpose of conservative
estimation of additive noise impacts, the 2 dB(A) adjustment constant was disregarded, and the DNL
generated by traffic noise was assumed approximately equal to the modeled Leq(h) levels described in section
2.0.
Residential land uses west of Virginia Avenue (the rail segment from North of Virginia Avenue to Avenue
B) are located at distances about 160 feet from the centerline of the track parallel to the street. According
to Table H-19 (PHEIS Table 4.12-10) for Alternative 1, these residences are located in the rail noise zone
between DNL of 60 and 65 dB(A). The traffic-related DNL at these residences estimated from EIS Table
4.12-9 under this alternative is approximately 74 dB(A). Since the rail-generated DNL at these residences
is much lower than DNL generated by traffic, rail noise does not provide noticeable effect in addition to
traffic noise. Thus, the negligible noise impact determined in the EIS sub-section 4.12.3.1 for traffic noise
remains unaffected by rail operations. The same conclusion is reached for this road segment under
Alternatives 2, 3, 5 and 6.
Under Alternatives 1 and 3, the proposed rail tracks would be located at a close distance from St. John’s
Avenue (between O’Hear Avenue and McMillan Avenue) in the vicinity of St. John’s Catholic Church and
School. In this area, the proposed sound wall E along St. John’s Avenue would shield rail noise from the
receptors significantly, such that the DNL generated by rail is estimated at 62 dB(A) and below. The traffic-
related DNL at these receptors (R108, R109, R113 in Table H-8) is estimated at approximately 54 to
56 dB(A). In this case, the rail-generated noise will dominate over the traffic-related noise, especially at
receptor R113 (3941 St. Johns Avenue), which would not be protected by the sound wall to the same extent
as receptors R108 and R109. As the result, the additive DNL (a logarithmic energy sum of the rail and
traffic DNLs) would reach from 57 to 64 dB(A) at these receptors. In comparison with the 2038 No-Action
EIS for the Proposed Navy Base Appendix H: Noise and Vibration
Intermodal Container Transfer Facility Technical Memorandum
76
Alternative (53 to 57 dB(A)), the estimated increase of 4 to 7 dB(A) may then be expected, that is a minor
to moderate noise impact. Moderate noise impact at receptor R113 can be reduced to a minor impact similar
to the one at receptors R108 and R109 by extending the sound wall E along St. John’s Avenue further north
(begin wall E at Station 78).
Under Alternative 2, a new rail track segment would run along Spruill Avenue from Noisette Creek to
McMillan Avenue, which may affect the noise-sensitive receptors on the west side of Spruill Avenue.
However, due to the distance from Spruill Avenue and the track, the additive traffic noise and rail noise
DNLs at receptors R78 through R84, R110 and R111 (Table H-9) would not increase by more than 3 dB(A)
in comparison with the No-Action Alternative (traffic noise only), which is a negligible impact.
Under the River Center Site Alternatives 5 through 7, a new rail track segment 10 would run from Pittsburg
Avenue to ICTF along new Port Drayage Road in the vicinity of the property line with Chicora-Cherokee
community. The predicted traffic noise levels at the nearest receptors R160 through R172 (Table H-10) on
the order of DNL 59 to 60 dB(A) would combine with the rail noise up to DNL of 62 to 63 dB(A) under
Alternatives 5 and 6. Additive DNL of up to 65 dB(A) would exceed the No-Action levels (about 53 dB(A))
by up to 12 dB(A), generating a major additive noise impact for those receptors. Under Alternative 7 with
higher train volumes at this track segment, the rail DNL from 65 to 70 dB(A) may be expected at the nearest
receptors. The additive traffic/rail DNL of up to 71 dB(A) would exceed the No-Action levels by up to
18 dB(A), producing even higher major noise impact at the nearest residences. The second and third rows
of residences along the property line are also expected to experience somewhat lesser major to moderate
additive noise impacts.
7.2 ADDITIVE NOISE IMPACT OF TRAFFIC AND RIVER CENTER
SITE OPERATIONS
Noise sensitive receptors along Noisette Boulevard in the vicinity of River Center Site would experience
both traffic noise and ICTF operational noise under Alternatives 5 through 7. Receptors R131 through R136
on Manley Avenue (Table H-10) with the traffic noise levels from 54 to 56 dB(A) (the DNL is again
assumed approximately equal to the modeled Leq(h)) would in addition receive the facility-generated
operational noise. The hourly average noise level of the ICTF train operations at the Manley Ave. receptors
is estimated in the range from 49 to 61 dB(A) (see EIS sub-section 4.12.7.5.) Assuming that the hourly
average operational noise level remains approximately steady throughout the 24-hour period, the DNL for
the ICTF train operations at the Manley Ave. receptors may be estimated to vary in the range from 55 to
67 dB(A). The range would essentially remain unaffected with the traffic noise of lower levels accounted
in, and the operational noise is expected, on average, to prevail over the traffic noise. The impacts for the
nearest receptors on Manley Avenue for daytime and nighttime River Center Site operations are
summarized in EIS sub-section 4.12.7.5. In comparison with the estimated No-Action ambient noise levels
in the community, a negligible additive noise impact due to the River Center Site operations and traffic is
expected at the nearest receptors on Manley Avenue during daytime hours (7:00 a.m. to 10:00 p.m.). For
EIS for the Proposed Navy Base Appendix H: Noise and Vibration
Intermodal Container Transfer Facility Technical Memorandum
77
nighttime hours (10:00 p.m. to 7:00 a.m.), however, the additive exterior noise levels would generate a
moderate to major impacts [up to 12 dB(A)] at those receptors.

EIS for the Proposed Navy Base Appendix H: Noise and Vibration
Intermodal Container Transfer Facility Technical Memorandum
78
This page intentionally left blank.