Embed Size (px)
Citation preview

APPENDIX IX.13
BLASTING REPORT

Golder VME Limited 2180 Meadowvale Boulevard Mississauga, Ontario, Canada L5N 5S3 Telephone (905) 819-8088 Fax (905) 819-9387
BLAST DESIGN AND OPTIMIZATION VIBRATION MEASU REMENT AND ANALYSIS EXPLOSIVES PERFORMANCE EVALUATION
October 4, 2001 012-6492 De Beers Canada Mining Inc. 702-5201 50th Avenue Yellowknife, NT X1A 3S9 Attention: Mr. Jack Haynes Asst. Site Manager RE: MINE BLASTING IMPACT ON CANADIAN FISHERIES WATERS DEBEERS SNAP LAKE PROJECT NORTHWEST TERRITORIES Dear Sir:
The following report describes the results of an impact assessment of existing and proposed future blasting operations at the Snap Lake Diamond Project as they relate to the guidelines published by the Department of Fisheries and Oceans (DFO) for the use of explosives in or near Canadian fisheries waters (1998). This assessment specifically addresses whether the DFO guidelines with respect to underwater overpressure and ground vibration effects can be met during the mining life of the Snap Lake Project. Our investigation involved the monitoring and recording of underwater overpressure and ground vibration levels during a site visit between July 14 and 22, 2001, from which overpressure and ground vibration attenuation characteristics were developed.
DFO Guidelines
The DFO “Guidelines for the Use of Explosives in or Near Canadian Fisheries Waters” set out in Section 8 that “No explosive is to be detonated in or near fish habitat that produces, or is likely to produce, an instantaneous pressure change greater than 100 kPa in the swimbladder of a fish.” Similarly in Section 9, “No explosive may be used that produces or is likely to produce, a peak particle velocity greater than 13 mm/s in a spawning bed during egg incubation”. Under conditions where these guidelines could not be met the proponent would be required to prepare a mitigative plan outlining additional procedures for protecting fish, marine mammals and their habitat.

De Beers Canada Inc. October 4, 2001 Mr. Jack Haynes - 2 - 012-6492
Golder VME
Site Visit and Monitoring Procedure
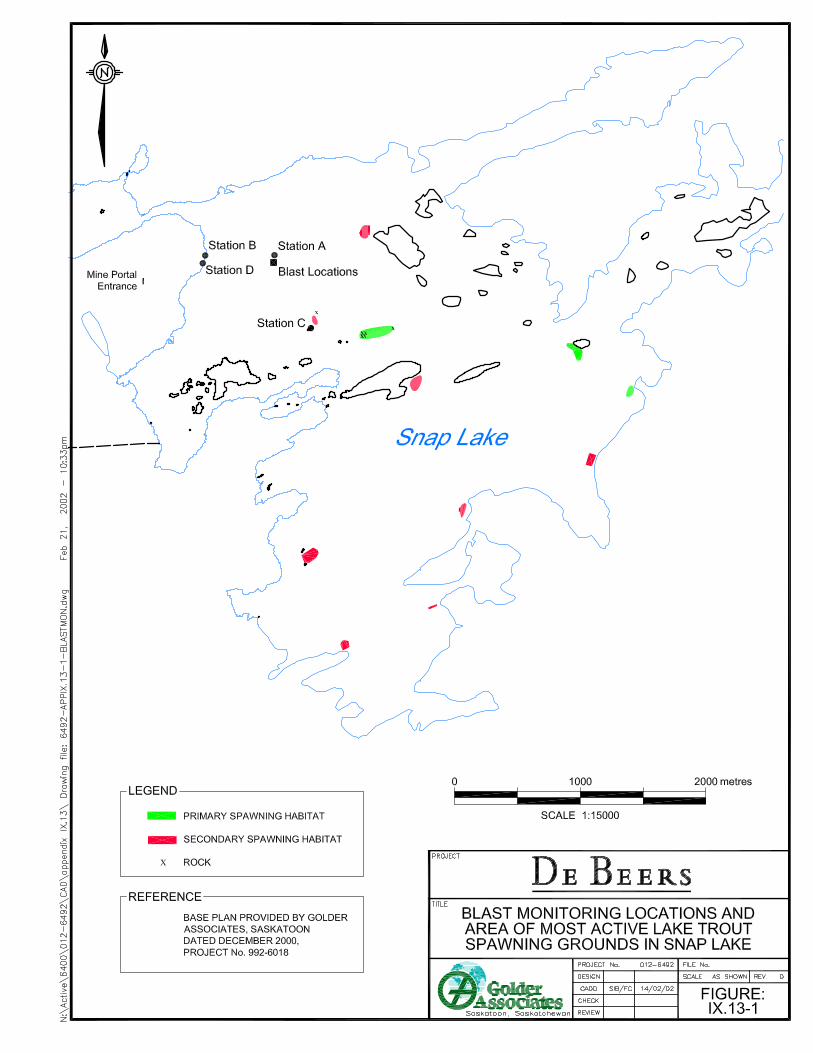
The Snap Lake Diamond Mine was visited from July 14 to 22, 2001 during which nine regular development blasts were monitored at four sites for ground vibration and overpressure effects. The four monitoring sites are shown on Figure 1 and consisted of:
Station Monitoring Location A Depth of 5 m in water approximately 1 m above lake bottom over
current blasting site. B Approximately 1 m below water surface at west shore of Snap
Lake, east of south ventilation shaft. C Spawning bed southeast of the current blasting site. D West shore of Snap Lake east of south ventilation shaft.
The two in water monitoring sites were established immediately prior to each blast. Station A was only accessible by boat during each blast (see Plate 1). A hand held GPS and radio was also necessary in establishing Station A to ensure that monitoring occurred over the actual blast site and that the correct blast window was monitored. The instrument at Station A could not be deployed on July 15 and the afternoon of July 19 due to rough waters on Snap Lake caused by high winds. The geophone transducers for monitoring ground vibration intensities at Stations C and D were spiked into the ground to ensure a secure coupling (Plates 2 and 3).
Instrumentation
Instrumentation at Stations A and B consisted of Instantel DS-477 self-triggering, digital data loggers equipped with hydrophone attachments. The instrument at Station A was programmed to measure and record peak underwater overpressure levels for a 8 to 10 second duration upon activation above a threshold trigger level that varied between 0.3 and 1.7 kPA. To ensure that data was captured during each blast, the instrument at Station B was programmed to record on a continuous basis, providing peak overpressure levels at 1 to 5 minute intervals.
Instrumentation at Stations C and D consisted of Instantel DS-077 Minimate Plus Series III self-triggering, digital seismographs capable of measuring and recording peak ground vibration levels in each of three orthogonal directions. As these instruments were unmanned during each blast, similar to Station B, each instrument was programmed to record ground vibrations on a continuous basis to ensure suitable data capture during the blast, providing peak ground vibration levels at 1 to 5 minute intervals.
De Beers Canada Inc. October 4, 2001 Mr. Jack Haynes - 3 - 012-6492
Golder VME
Blasting Procedure
The nine blasts monitored between July 14 and 22 consisted of either full face development rounds or side-wall slashes. A full face development heading measured approximately 5.0 x 5.0 m. As detailed in Table 1, each blast consisted of drilling from 12 to 157 x 44 mm diameter holes to a depth of about 4.2 m. All drilling was carried out using a twin boom jumbo. All holes were pneumatically loaded with ANFO and primed with a 32 x 400 mm semi gelatin dynamite. Perimeter holes were loaded with 19 x 600 mm diameter Xactec for wall control (Plates 4 to 6). Charge weights per hole varied from between 3.8 to 6.3 kg while charge weights per delay varied from 13 to 86 kg. Long period delays were used resulting in delay periods ranging from 250 to 1000 ms. On occasion, multiple rounds were fired together without the benefit of a delay between rounds.
All blasting occurred at a depth of approximately 160 m below Snap Lake, 550 to 580 m from the west shore, as shown on Figure 1.
Monitoring Results
The results recorded at each of the four monitoring sites during the nine blasts are summarized on Table 2. The actual waveform records are reproduced in Appendix A. While not necessarily relevant to this study, it was possible to identify from the waveform records where the actual peaks occurred and to which delays or holes they corresponded. This may be of some benefit at a later date during regular production blasting if the ground vibration or overpressure levels were to exceed the DFO guidelines.
The monitoring results given in Table 2 were used in establishing attenuation characteristics for both the ground vibration and underwater overpressure levels.
Underwater Overpressure Attenuation Curve
Cube root scaling was used in establishing the Scaled Distance relationship for underwater overpressure levels, as defined by the following relationship:
Scaled Distance (SD) = D/E0.33 where, D = distance between the blast and the monitoring station (m) E = maximum weight of explosive detonated per delay period (kg). The scatter typically seen in many scaled distance plots, as seen in Figure 2, are introduced by such factors as differing explosive products, length of collar, variations in burden distance,
De Beers Canada Inc. October 4, 2001 Mr. Jack Haynes - 4 - 012-6492
Golder VME
differing geologic conditions of the bedrock (structure etc.), different wave types, errors in blast initiation timing, degree of confinement, and differences in blast efficiencies.
The equation for the 95% regression line developed in Figure 2 can be expressed as:
P = 6352 (SD)-1.87 where P = Peak Overpressure (kPa) SD = Scaled Distance (m/kg0.33) Ground Vibration Attenuation Curve
Cube root scaling was also used in establishing the Scaled Distance plot for the ground vibration attenuation characteristics for this site.
The equation for the 95% regression line, as shown in Figure 3 can be expressed as:
PPV = 4931 (SD)-1.87 where, PPV = Peak Particle Velocity (mm/s) SD = Scaled Distance (m/kg0.33) Impact Assessment
As shown by the Scaled Distance plots, the most critical parameters for controlling ground vibration and consequently underwater overpressure levels are distance from the blast and the amount of explosive detonated per delay period. Based on the attenuation characteristics established from the development rounds discussed above, Table 3 shows the calculated maximum charge weights per delay for increasing set-back distances from a blast site for maintaining the DFO guidelines limits. It is our understanding that production blasting could conceivably approach to within 115 m of the bottom of Snap Lake
The maximum explosive loads given in Table 3 for limiting peak ground vibration and underwater overpressure levels to 13 mm/s and 100 kPa, would be 111 and 1937 kg respectively, based on a minimum distance of 115 m. Based on initial production round estimates of about 230 kg per delay as provided by the Snap Lake mine planners, the set-back distances calculated for maintaining the limiting peak ground vibration and underwater overpressure levels of 13 mm/s and 100 kPa, would be approximately 150 and 60 m respectively.
It is apparent from Table 3 that, at equivalent distances, the ground vibration limit of 13 mm/s at the nearest spawning bed becomes the more restrictive guideline when determining maximum
De Beers Canada Inc. October 4, 2001 Mr. Jack Haynes - 5 - 012-6492
Golder VME
explosive loads for the mine’s production blasts. This guideline however, is only pertinent during periods of egg incubation, and as seen in Figure 1, only applicable to specific sites that have been identified as spawning habitat. Therefore, in those circumstances when blasting could conceivably take place where the ground vibration level may exceed the DFO guideline (within 150 m of lake bottom), they should be carried out outside identified spawning and egg incubation windows. Alternatively, the maximum explosive weight detonated per delay period could be adjusted as dictated by the Scaled Distance equations.
While this assessment has been based on a series of development blasts, we recommend that additional monitoring be carried out at the commencement of production blasting to better define the equations developed for the Snap Lake site. These equations, as they become better defined may be used as a design tool for ensuring compliance with the DFO guidelines when within 150m of Snap Lake.
Conclusions
Based on the foregoing considerations, it is our opinion that blasting operations may be performed in compliance with the current blasting guidelines published by the Department of Fisheries and Oceans. As such, we do not expect that there would be a requirement for any additional mitigative measures for protecting fish, marine mammals and their habitat. Monitoring of underwater overpressure and ground vibration effects during the initial stages of regular production blasting should however, be carried out to better define the attenuation characteristics developed for this site.
If you have any questions pertaining to this report, or we can be of any further service in this matter, please do not hesitate to contact our office.
Yours very truly,
GOLDER VME LIMITED
Andrew Curic, P. Eng. Engineer Marcus V. van Bers, P.Eng. Associate AC/ac/dd \\mis_main\data\active\6000\012-6492 debeers eis document\summary report - october 2001\rpt-04oct01-mine blasting impact.doc

October, 2001 012-6492
Golder VME
TABLE 2 Snap Lake Blast Monitoring Results
Date
(2001) Blast Time
Blast No. Station A (kPa)
Station B (kPa)
Station C (mm/s)
Station D (mm/s)
July 14 July 15 July 15 July 16 July 18 July 19 July 19 July 20 July 22
03:36 12:30 21:30 22:29 02:44 05:27 18:05 16:57 05:49
1 2 3 4 5 6 7 8 9
3.7 NR NR 6.3 5.2 3.3 NR 4.8 7.0
<0.34 <0.28
0.4 <1.0 0.4 0.9 0.8 0.8 0.1
0.9 NR NR
<0.75 1.3 0.9 0.5
<1.0 0.9
1.0 0.3 1.1
<1.5 NA 2.0 0.9 0.6 0.9
NR – Denotes no record due to high winds at Snap Lake NA – Denotes reading due to electrical interference

October, 2001 012-6492
Golder VME
TABLE 3 Setback Distances for Overpressure and Ground Vibration Limits for Snap Lake
Setback Distance from the
Blast
(m)
Maximum Charge Weight per Delay in (kg) to Limit
Overpressure Levels to 100 kPa
Maximum Charge Weight per Delay in (kg) to Limit
Ground Vibration Levels to 13 mm/s
50 100 115 125 150 170 200 250 300 350 400 450 500
159 1274 1937 2488 4299 6257
10189 19900 34388 54607 81512
116060 159205
9 73
111 143 247 359 585
1142 1973 3134 4678 6660 9136


October, 2001 012-6492
Golder VME
Plate 1. Station A Monitoring Location over Blast Facing the West Shore Line.
Plate 2. Stations B and D along the West Shore of Snap Lake.

October, 2001 012-6492
Golder VME
Plate 3. Station C Monitoring Station Adjacent to a Secondary Spawning Bed.
Plate 4. Explosive Product and Non-Electric Detonators used for Blasting Operations.

October, 2001 012-6492
Golder VME
Plate 5. Blaster and Helper Loading ANFO in Blast Drill Hole.
Plate 6. Blaster Working Final Tie in Preparations with B-Line Detonating Cord.
October, 2001 012-6492
Golder VME
APPENDIX A
Sample Calculations
Ground Vibration Conversion from Overpressure Measurements for De Beers Mine Blast Operations

October, 2001 - A1 - 012-6492
Golder VME
Vibration Overpressure Estimate
Relationship between estimated peak particle velocity and pressure within the saturated rock substrate at the lake bed. The following equations are contained within the DFO’s “Guidelines for the Use of Explosives in Canadian Fisheries Waters” in Appendix III.
Pressure transfer from water to substrate
Pw = (2(ZW/ZR)PR)/(1+(ZW/ZR)) ZW/ZR = (DWCW)/(DRCR)
where Dw = density of water = 1 g/cc Cw = compressional wave velocity in water = 146300 cm/s CR = compressional wave velocity in rock = 457,200 cm/s DR = density of substrate(granitic rock) = 2.7 g/cc ZW = Acoustic impedance of water ZR = Acoustic impedance of substrate
ZW/ZR = (1*146300)/(2.7*457200) = 0.1185 PW = 2(0.1185)PR/(1.1185) = 0.212PR
PR=PW/0.212 Where, PR = pressure in substrate (kPa) PW= pressure in water (kPa) Covert kPa to dynes (gcms2), Dynes = kPa x 104 Peak Particle Velocity calculated from Overpressure in substrate
VR = (2(PR)/(DRCR)) where PR = pressure in substrate (kPa) CR = compressional wave velocity in saturated rock = 457,200 cm/s DR = density of substrate(granitic rock) = 2.7 g/cc VR = Vibration velocity in (cm/s)

October, 2001 - A2 - 012-6492
Golder VME
-------------------------------------------------------- Use 3.7 kPa from July 14th Blast No.1 at Station A PR=(3.7)/0.212 = 17.45 kPa = 17.45 x 10⁴ dynes VR = (2(17.45 x 10 4)/(2.7 x 457,200) = 0.2827 cm/s = 2.8 mm/s

October, 2001 012-6492
Golder VME
APPENDIX B
Blast Overpressure Waveforms for De Beers Mine Blast Operations

Event Report
Date/TimeTrigger SourceRangeRecord Time
Vert at 03:36:17 July 14, 2001Geo: 0.492 mm/sGeo :254 mm/s8.0 sec at 1024 sps
Serial NumberBattery LevelCalibrationFile Name
1302 V 5.51 BlastMate 11/6776.5 VoltsNovember 21, 2000 by Instantel Inc.C3O28MNM.OHO
Station AIDe Beers CanadaGolder VME LimitedJuly 30, 2001 16:44:20 (V4.30)
USBM R18507 And OSMRE
200—
100
50
MicrophonePSP LZC FreqChannel Test
(it
2
U00
DisabledN/AN/AN/A
20—
10—
5—Tran Vert Long
PPVPPVZC FreqTime (Rel. to Trig)Peak AccelerationPeak DisplacementSensorcheck
0.03 1821.1
320.014
0.0033 10.00002
Check
10.771.6
>1003.403
1.100.00905
Check
0.15935.0
2.00.119
0.01330.01 35Check
mm/sdBHzsec
gmm
x
2 5 10 20
Peak Vector Sum 10.7 mm/s at 3.403 secFrequency (Hz)
Tran: + Vert: x Long: e
NIA: Not Applicable
II
I- F
A0.0 1.0 2.0 3.0
Time Scale: 0.50 sec/div Amplitude Scale: Geo: 5.00 mm/s/divTrigger —4
NotesLocation:Client:User Name:Converted:
Extended NotesSnap Lake, NWT
Post Event Notes
xxx
x
xx
50 100
Long
Vert
Tra n
0.0
4.0 5.0 6.0 7.0 8.0
Printed: August 22, 2001 v 4.30 -4.301 Format copyrighted 1996-2001
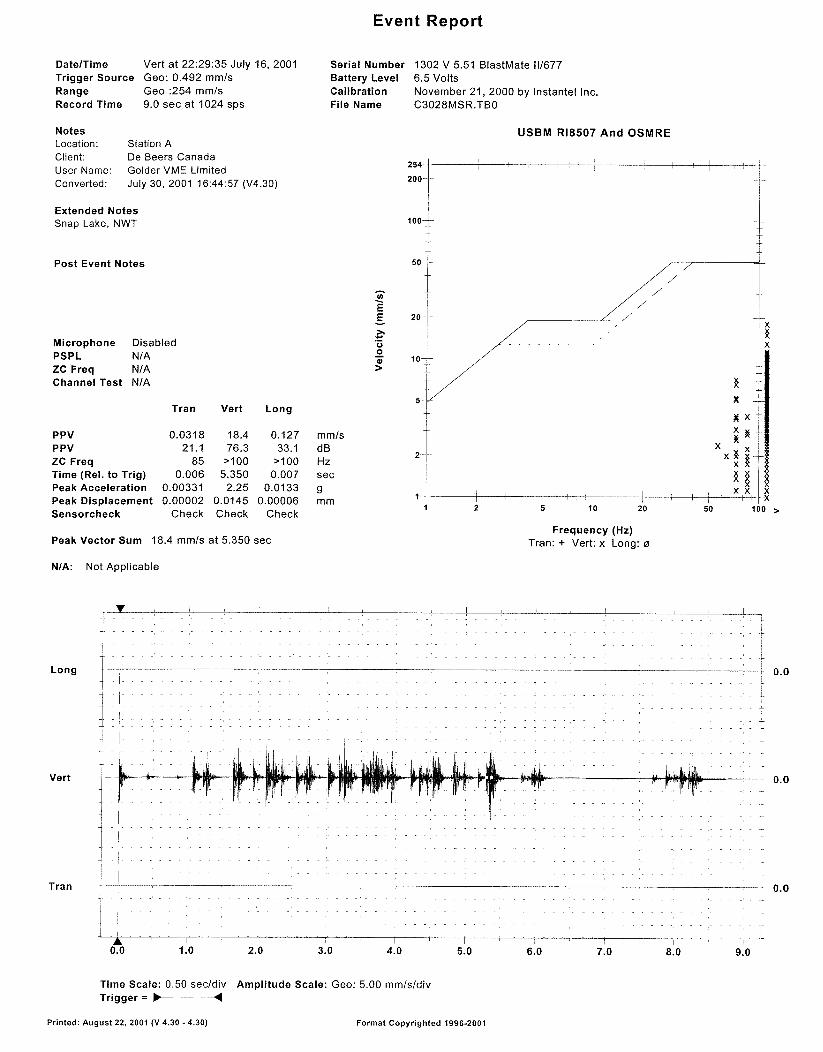
Event Report
Date/TimeTrigger SourceRangeRecord Time
Vert at 22:29:35 July 16, 2001Geo: 0.492 mm/sGeo :254 mm/s9.0 sec at 1024 sps
Serial NumberBattery LevelCalibrationFile Name
1302 V 5.51 BlastMate 11/6776.5 VoltsNovember 21, 2000 by Instantel Inc.C3028M5R.TBO
NotesLocation:Client:User Name:Converted:
Station AIDe Beers CanadaGolder VME LimitedJuly 30, 2001 16:44:57 (V4.30)
Extended NotesSnap Lake, NWT
Post Event Notes
MicrophonePSPLZC FreqChannel Test
Co
EE
U0
DisabledN/AN/AN/A
Tran Vert Long
PPVPPVZC FreqTime (Rel. to Trig)Peak AccelerationPeak DisplacementSensorcheck
0.03 1821.1
850.006
0.003310.00002
Check
18.476.3>100
5.3502.25
0. 0145Check
0.12733.1>100
0.0070.0133
0.00006Check
mm/sdBHzsec
9mm
USBM R18507 And OSMRE
3.
Peak Vector Sum 18.4 mm/s at 5.350 sec
N/A: Not Applicable
I
II
Long
Vert
Tran
A0.0
V
0.0
0.0
0.0
1.0 2.0
Time Scale: 0.50 sec/div Amplitude Scale: Geo: 5.00 mm/s/divTrigger --— —--4
Frequency (Hz)Tran: + Vert: x Long: a
3.0 4.0 5.0 6.0 7.0 8.0 9.0
Printed: August 22, 2001 tv 4.30 . 4.301 Format copyrighted 1996-2001

Event Report
Date/Time Vert at 02:44:12 July 18, 2001Trigger Source Geo: 0.492 mm/sRange Geo :254 mm/sRecord Time 9.0 sec at 1024 sps
NotesLocation:Client:User Name:Converted:
Station AIDe Beers CanadaGolder VME LimitedJuly 30, 2001 16:45:38 (V4.30)
Extended NotesSnap Lake, NWT
Post Event Notes
E
000
Microphone DisabledPSPL N/AZC Freq N/AChannel Test N/A
Tran Vert Long
PPVPPVZC FreqTime (Rel. to Trig)Peak AccelerationPeak DisplacementSensorcheck
0.047624.6
730.005
0.003310.0000 1
Check
15.174.6
>1000.009
1.390.0143Check
0.12733.1N/A
0.0090.0133
0.00006Check
mm/sdBHzsecgmm
Serial Number 1302 V 5.51 BlastMate 11/677Battery Level 6.5 VoltsCalibration November 21, 2000 by Instantel Inc.File Name C3O28MUY.900
USBM R18507 And OSMRE
254-
200—
100-I-
I2~
x X
x --
20——
10—
5—
2—
1—2 5 10 20
Peak Vector Sum 15.1 mm/s at 0.009 secFrequency (Hz)
Tran: + Vert: x Long: a
N/A: Not Applicable
‘V
{ IF
A0.0 1.0 2.0 3.0 4.0
Time Scale: 0.50 sec/div Amplitude Scale: Geo: 5.00 mm/s/divTrigger = ~— — —4
xx~ Xx
xxxixx
~ ~—x xxx x
50 100 >
Long
Vert
Tran
0.0
0.0
0.0
5.0 6.0 7.0 8.0 9.0
Printed: August 22, 2001 tv 4.30-4.30) Format copyrighted 1900-2001

Event Report
Date/TimeTrigger SourceRangeRecord Time
Vert at 05:27:20 July 19, 2001Geo: 1.00 mm/sGeo :254 mm/s10.0 sec at 1024 sps
Serial NumberBattery LevelCalibrationFile Name
1302 V 5.51 BlastMate 11/6776.5 VoltsNovember 21, 2000 by Instantel Inc.C3028MX0.l-IKO
NotesLocation:Client:User Name:Converted:
Station AIDe Beers CanadaGolder VME LimitedJuly 30, 2001 16:46:20 (V430)
Extended NotesSnap Lake, NWT
Post Event Notes
MicrophonePSPLZC FreqChannel Test
CoEE
U00
DisabledN/AN/AN/A
Tran Vert Long
PPVPPVZC FreqTime (Rel. to Trig)Peak AccelerationPeak DisplacementSensorcheck
0.0 9.53 0.127 mm/s0.0N/A
0.0020.00.0
Check
70.6>100
4.0300.915
0.00998Check
33.1N/A
-0.0130.0133
0.00006Check
dBHzsec
gmm
USBM R18507 And OSMRE
3.
Peak Vector Sum 9.53 mm/s at 4.030 sec Tran: + Vert: x Long: e
N/A: Not Applicable
V
I-i
-4 tIF
I
A0.0 1.0 2.0 3.0 4.0 5.0 6.0 7.0 8.0 9.0 10.0
Time Scale: 0.50 sec/div Amplitude Scale: Geo: 5.00 mm/s/divTrigger fr—— — ——-—4
Frequency (Hz)
Long
Vert
Tran
0.0
0.0
0.0
Printed: August 22, 2001 ~v4,30 -4.30) Format copyrighted 1996.2001
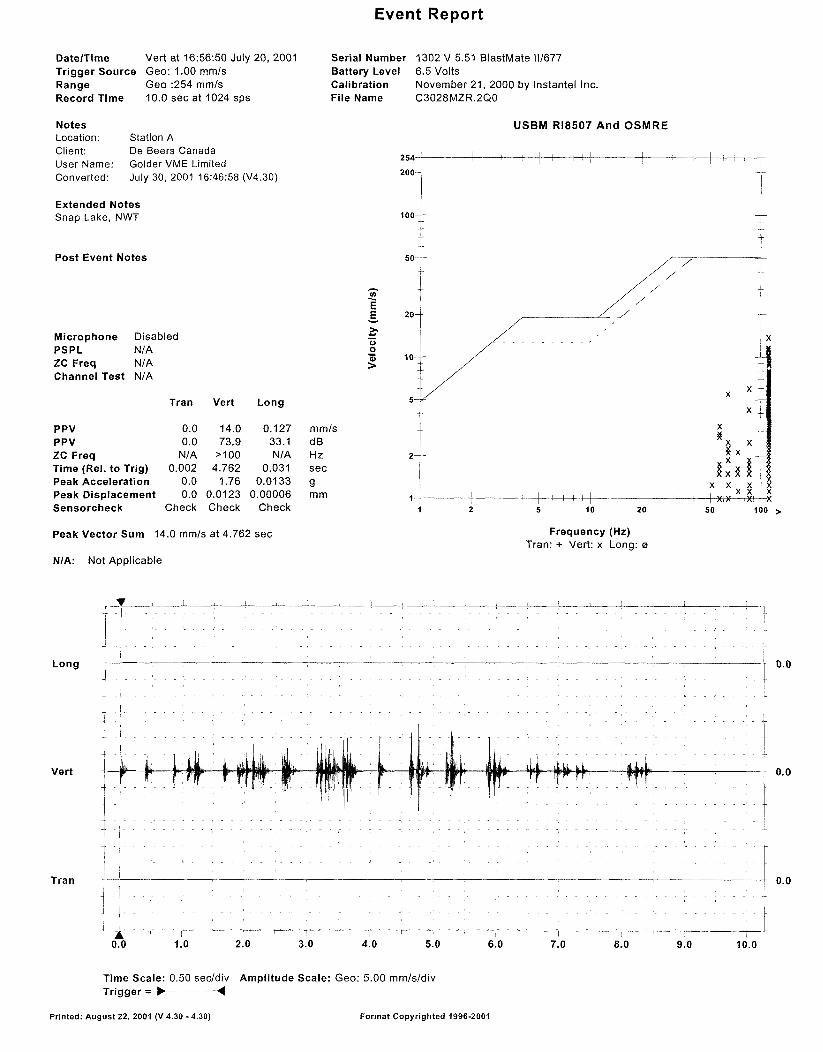
Event Report
DatelTimeTrigger SourceRangeRecord Time
Vert at 16:56:50 July 20, 2001Geo: 1.00 mm/sGeo :254 mm/s10.0 sec at 1024 sps
Serial NumberBattery LevelCalibrationFile Name
1302 V 5.51 BlastMate 11/6776.5 VoltsNovember 21, 2000 by Instantel Inc.C3O2BMZR.2Q0
NotesLocation:Client:User Name:Converted:
Station AIDe Beers CanadaGolder VME LimitedJuly 30, 2001 16:46:58 (V4.30)
Extended NotesSnap Lake, NWT
Post Event Notes
MicrophonePSPLZC FreqChannel
Co
EE
U00)
IDisabledN/AN/A
Test N/A
Tran Vert Long
PPvPPVZC FreqTime (Rel. to Trig)Peak AccelerationPeak DisplacementSensorcheck
0.00.0N/A
0.0020.00.0
Check
14.073.9
>1004.762
1.760.0123Check
0.12733.1N/A
0.0310.0133
0.00006Check
mm/sdBHzsecgmm
Peak Vector Sum 14.0 mm/s at 4.762 sec
USBM R18507 And OSMRE
Tran: + Vert: x Long: a
N/A: Not Applicable
‘U4,
-I
F K
KI t
*0.0 1.0 2.0 3.0 4.0 5.0 6.0 7.0 8.0 9.0 10.0
Time Scale: 0.50 sec/div Amplitude Scale: Geo: 5.00 mm/s/divTrigger ~----— —— ——-4
Frequency (Hz)
3.
Long
Vert
Tra n
0.0
0.0
0.0
Printed: August 22, 2001 w 4.30 .4.30) Format copyrighted 1996-2001

Event Report
Date/TimeTrigger SourceRangeRecord Time
Vert at 05:49:24 July 22, 2001Geo: 1.00 mm/sGeo :254 mm/s10.0 sec at 1024 sps
Serial NumberBattery LevelCalibrationFile Name
1302 V 5.51 BlastMate 11/6776.4 VoltsNovember 21, 2000 by Instantel Inc.C3028N2L.ICO
NotesLocation:Client:User Name:Converted:
Station AIDe Beers CanadaGolder VME LimitedJuly 24, 2001 12:08:12 (V4.30)
Extended NotesSnap Lake, NWT
Post Event Notes
MicrophonePSPLZC FreqChannel Test
Co
E
U00)
IDisabledN/AN/AN/A
Tran Vert Long
P PVPPVZC FreqTime (Rel. to Trig)Peak AccelerationPeak DisplacementSensorcheck
0.00.0N/A
0.0020.00.0
Check
20.477.2
>1003.3572.24
0.0182Check
0.12733.1N/A
0.0010.0133
0.00006Check
mm/sdBHzsecgmm
USBM R18507 And OSMRE
Peak Vector Sum 20.4 mm/s at 3.357 sec
N/A: Not Applicable
1~
I
-4-4-4
U
I
0.0 1.0 2.0 3.0 4.0 5.0 6.0 7.0 8.0 9.0 10.0
Time Scale: 0.50 sec/div Amplitude Scale: Geo: 5.00 mm/s/divTrigger p— — ——4
Frequency (Hz)Tran: + Vert: x Long: a
3.
Long
Vert
Tra n
0.0
0.0
Printed: August 22, 2001 ~v4.30 -4.30) Format copyrighted 1996-2001


![[Appendix A] - CONTRACTOR REGISTRATION · Rock Blasting Works Rock blasting works. ... [Appendix A] - CONTRACTOR REGISTRATION ... control and card access control systems,](https://img.pdfslide.net/doc/110x75/5b0522257f8b9a89208e9d89/appendix-a-contractor-blasting-works-rock-blasting-works-appendix-a-.jpg)