Embed Size (px)
Citation preview
Internal Clinical Guidelines, 2014
Gallstone Disease
1
Appendix J: Full Health Economics Report
1.1 Contents Appendix J: Full Health Economics Report ................................................................ 1
1.1 Contents ................................................................................................................ 1
1.2 Introduction ........................................................................................................... 2
1.3 Decision Problem .................................................................................................. 2
1.4 Systematic Review of Existing Literature ............................................................... 5
2 Gallstones Health Economic Model ............................................................................ 8
2.1 Model Structure ..................................................................................................... 8
2.2 Model States ......................................................................................................... 9
2.3 Model Transitions ................................................................................................ 12
2.3.1 Laparoscopic cholecystectomy with intraoperative cholangiography versus laparoscopic cholecystectomy (Q4b.1) ......................................... 13
2.3.2 Laparoscopic cholecystectomy versus conservative management (Q4b.2) .................................................................................................... 15
2.3.3 Day-case versus inpatient laparoscopic cholecystectomy (Q4b.3) ........... 17
2.3.4 Laparoscopic cholecystectomy with bile duct exploration versus laparoscopic cholecystectomy with pre-, intra- or postoperative ERCP (Q4c.1) ..................................................................................................... 18
2.3.5 ERCP and laparoscopic cholecystectomy versus ERCP alone (Q4c.2) ... 21
2.3.6 ERCP versus conservative management (Q4c.3) .................................... 23
2.3.7 Early versus delayed laparoscopic cholecystectomy (Q5a.1) ................... 25
2.3.8 Early versus delayed laparoscopic cholecystectomy following ERCP (Q5a.2) .................................................................................................... 27
2.4 Model Parameters ............................................................................................... 29
2.4.1 Initial patient distributions ......................................................................... 29
2.4.2 Probabilities of having or developing symptoms ....................................... 29
2.4.3 Baseline event probabilities...................................................................... 29
2.4.4 Probabilities of operative consequences .................................................. 30
2.4.5 Costs and Resource Use ......................................................................... 32
2.4.6 Utility Values ............................................................................................ 34
2.5 Model Assumptions ............................................................................................. 37
2.6 Sensitivity Analyses ............................................................................................. 38
3 Results and Conclusions ........................................................................................... 48
3.1 Cost effectiveness results for Review Question 4b: managing symptomatic gallbladder stones ............................................................................................... 48
3.1.1 Laparoscopic cholecystectomy with intraoperative cholangiography versus laparoscopic cholecystectomy alone (Q4b.1) ................................ 48

Internal Clinical Guidelines, 2014
Gallstone Disease
2
3.1.2 Laparoscopic cholecystectomy versus conservative management (Q4b.2) .................................................................................................... 51
3.1.3 Day-case versus inpatient laparoscopic cholecystectomy (Q4b.3) ........... 54
3.2 Cost effectiveness results for Review Question 4c: managing common bile duct stones .......................................................................................................... 57
3.2.1 Laparoscopic cholecystectomy with bile duct exploration versus laparoscopic cholecystectomy with pre-, intra- or postoperative ERCP (Q4c.1) ..................................................................................................... 57
3.2.2 ERCP and laparoscopic cholecystectomy versus ERCP alone (Q4c.2) ... 59
3.2.3 ERCP versus conservative management (Q4c.3) .................................... 62
3.3 Cost effectiveness results for Review Question 5: timing of laparoscopic cholecystectomy .................................................................................................. 65
3.3.1 Early versus delayed laparoscopic cholecystectomy (Q5a.1) ................... 65
3.3.2 Early versus delayed laparoscopic cholecystectomy following ERCP (Q5a.2) .................................................................................................... 68
3.4 Discussion ........................................................................................................... 71
3.4.1 Principal findings ...................................................................................... 71
3.4.2 Model strengths ....................................................................................... 71
3.4.3 Model limitations ...................................................................................... 71
3.4.4 Comparison with other health economic analyses .................................... 72
3.5 Conclusions ......................................................................................................... 73
1.2 Introduction
This appendix sets out the de novo health economic evaluation undertaken to assess the cost effectiveness of interventions and their timing for the treatment of symptomatic gallbladder stones and common bile duct stones. It was developed by the Internal Clinical Guidelines Programme at NICE.
1.3 Decision Problem
The health economic analysis addressed three questions from the guideline scope, based on the GDG’s question prioritisation:
Table 1: Guideline Questions Addressed by Health Economic Analysis
Question Number Question
4b Which strategies should be used for managing symptomatic gallbladder stones?
4c Which strategies should be used for managing common bile duct stones (CBDS)?
5 In adults with acute cholecystitis or symptomatic common bile duct stones, should cholecystectomy be performed during the acute episode (early) or should intervention be delayed until the acute episode has subsided (delayed)?
A number of interventions were indicated for these questions, primarily based around different presentations of laparoscopic cholecystectomy and to endoscopic retrograde cholangiopancreatography (ERCP). However, the GDG indicated that, as the interventions address different populations, pairwise rather than multiple comparisons should be undertaken in most cases. Only one multiple comparison was indicated, for question 4c.

Internal Clinical Guidelines, 2014
Gallstone Disease
3
Table 2 lists the PICO for each comparison and in each case, the comparator is taken to reflect usual care.
The GDG chose not to model the biliary stents comparison due to a lack of clinical interest in the health economic outcomes and a lack of clinical evidence. The percutaneous cholecystostomy and day-case versus inpatient ERCP comparisons were also not modelled, as no clinical studies were included for these comparisons.
Gallstones Disease
Internal Clinical Guidelines, 2014 4
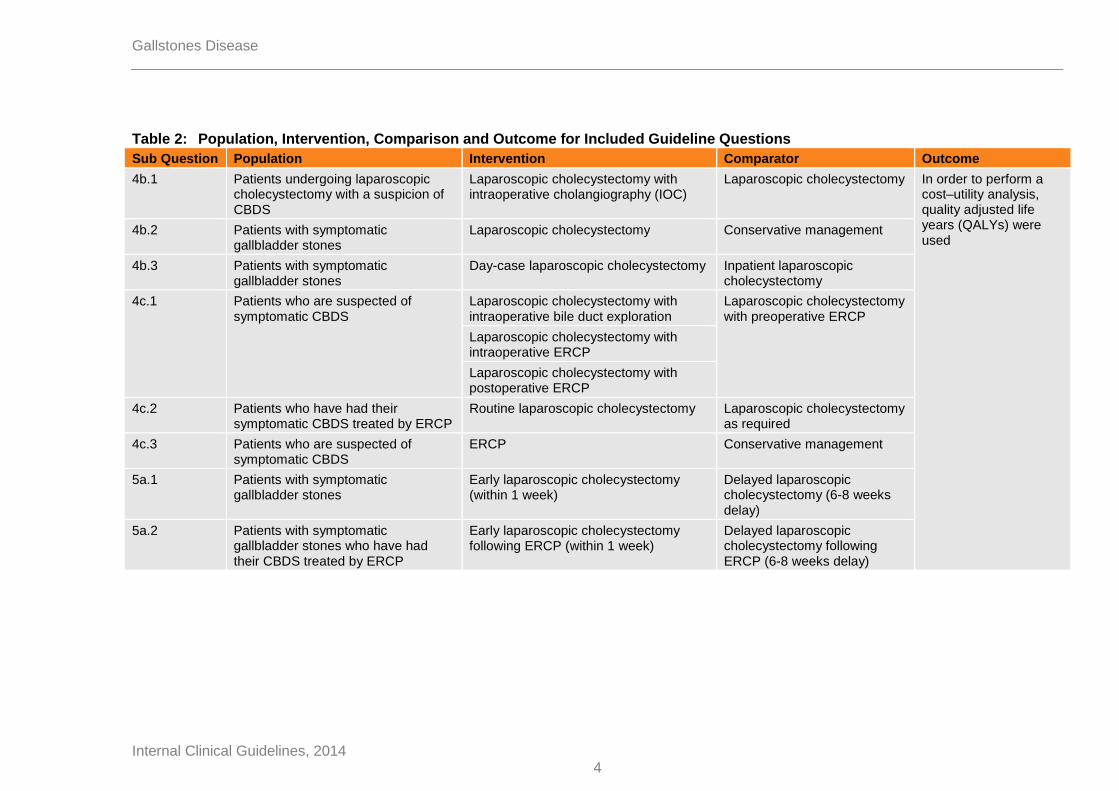
Table 2: Population, Intervention, Comparison and Outcome for Included Guideline Questions
Sub Question Population Intervention Comparator Outcome
4b.1 Patients undergoing laparoscopic cholecystectomy with a suspicion of CBDS
Laparoscopic cholecystectomy with intraoperative cholangiography (IOC)
Laparoscopic cholecystectomy In order to perform a cost–utility analysis, quality adjusted life years (QALYs) were used
4b.2 Patients with symptomatic gallbladder stones
Laparoscopic cholecystectomy Conservative management
4b.3 Patients with symptomatic gallbladder stones
Day-case laparoscopic cholecystectomy Inpatient laparoscopic cholecystectomy
4c.1 Patients who are suspected of symptomatic CBDS
Laparoscopic cholecystectomy with intraoperative bile duct exploration
Laparoscopic cholecystectomy with preoperative ERCP
Laparoscopic cholecystectomy with intraoperative ERCP
Laparoscopic cholecystectomy with postoperative ERCP
4c.2 Patients who have had their symptomatic CBDS treated by ERCP
Routine laparoscopic cholecystectomy Laparoscopic cholecystectomy as required
4c.3 Patients who are suspected of symptomatic CBDS
ERCP Conservative management
5a.1 Patients with symptomatic gallbladder stones
Early laparoscopic cholecystectomy (within 1 week)
Delayed laparoscopic cholecystectomy (6-8 weeks delay)
5a.2 Patients with symptomatic gallbladder stones who have had their CBDS treated by ERCP
Early laparoscopic cholecystectomy following ERCP (within 1 week)
Delayed laparoscopic cholecystectomy following ERCP (6-8 weeks delay)

Internal Clinical Guidelines, 2014
Gallstone Disease
5
1.4 Systematic Review of Existing Literature
One literature search was undertaken to address all comparisons in questions 4 and 5. The search was based on the clinical search with a health economic filter applied and yielded 1,396 unique citations (see appendix D for the search strategy). A number of cost–utility analyses (CUAs) were found, but only two were included that covered the populations and interventions of interest (Gurusamy et al. 2012), (Wilson et al. 2010).
Wilson et al. (2010) (see Table 3) used a decision tree to compare early and delayed laparoscopic cholecystectomy for acute cholecystitis (question 5a.1 in Table 2). Wilson et al. (2010) modelled the development of four symptoms (biliary colic, acute cholecystitis, obstructive jaundice and pancreatitis) at 9 weeks during an 18 week delay period, with a time horizon of one year. Laparoscopic cholecystectomy could result in conversion to open cholecystectomy and either could incur bile duct injury, bile leak, other or no complications. Costs were based on NHS reference costs and utilities were taken from a small non-UK, non-patient-based time trade-off study.
Whilst Wilson et al. (2010) was directly relevant to the UK NHS and to the guideline question, it had a number of limitations. The GDG felt that the delay of 18 weeks in the delayed surgery arm was too long and preferred to consider (from both a practical and evidential perspective) a 6–8 week delay. The model structure gave no consideration to the potential existence, recurrence or complications of common bile duct stones (CBDS) and to do so would require a longer time horizon than one year. Also, the model did not consider operative or background mortality. Finally the utility data did not meet the NICE reference case preference (National Institute for Health and Care Excellence 2013) for EQ-5D surveyed from patients with the disease in question and scored by the UK general public.
Gurusamy et al. (2012) (see Table 4) used a very similar decision tree to Wilson et al. (2010) to compare intraoperative and preoperative ERCP for patients with gallbladder stones and CBDS (question 4c.3 in Table 2). Gurusamy et al. (2012) modelled the successful or failed (and subsequent repeat ERCP) CBDS extraction, 6 complications of ERCP (perforation, pancreatitis, cholangitis, cholecystitis, bleeding and gastric ulcer), consequent cholecystectomy (laparoscopic or open) and mortality from symptoms and open operations. Costs were based on NHS references costs and utilities were taken from a small, non-UK, non-patient-based time trade-off study or based on assumptions.
Whilst Gurusamy et al. (2012) was directly relevant to the UK NHS, by excluding postoperative ERCP and intraoperative bile duct exploration, the model did not compare all the interventions included in this guideline question.
A third RCT-based CUA was found that was included in the clinical evidence review (Macafee et al. 2009). However, it was excluded from the health economic analysis due to serious concerns about its QALY calculations.
As no published CUAs were found that covered all included interventions, an original health economic model was constructed. The GDG felt a de novo model would better consider operative and background mortality, the long term quality of life impact of bile duct injuries, potential symptom and CBDS recurrence and the timing of multiple interventions than the existing CUAs.

Internal Clinical Guidelines, 2014
Gallstone Disease
6
Table 3: Health Economic Evidence – Early versus Delayed Laparoscopic Cholecystectomy For Acute Cholecystitis
Study, Population, Country and Quality Data Sources Other Comments
Incremental
Conclusion Uncertainty Cost Effect ICER
Wilson et al. (2010)
Acute cholecystitis
UK
Effects: authors’ own systematic review, other sources, some assumptions. Rare events modelled using non-informative priors
Costs: reference costs £UK, 2006. Adjustments made for longer early LC operations and for increased delayed LC length of stay
Utilities: small time trade-off study, not from patients or UK, some assumptions
Decision tree (1 year horizon)
18 week delay period; symptoms develop after 9 weeks
LC all done as inpatients
Discounting not applied due to short time horizon
-£820
0.05 QALYs
Early LC dominates
delayed LC
Early LC is less expensive and results in better QoL than delayed LC
ICER sensitive to extreme values of surgical complications that would not be seen in clinical practice
Differences driven by symptoms in delay and extra delayed LC length of stay
Quality of life estimates are most uncertain part of model
In PSA, early LC has 71% chance of being cost effective at £20,000/QALY
Directly Applicable
a
Potentially Serious Limitations
b,
c,d,e,f,g,h
a Utilities not from patients and not scored by UK general public
b No consideration of common bile duct stones
c Time horizon may be limited
d Some assumptions made in all data sources
e Decision tree does not allow recurrence of symptoms or common bile duct stones
f Delay period longer than found in most clinical papers
g Development of symptoms occurs later than advised by Guideline Development Group
h No consideration of operative or background mortality
Abbreviations
ICER: Incremental cost effectiveness ratio
LC: Laparoscopic cholecystectomy
PSA: Probabilistic Sensitivity Analysis
QALY: Quality adjusted life years
UK: United Kingdom

Internal Clinical Guidelines, 2014
Gallstone Disease
7
Table 4: Health Economic Evidence – Intra-Operative Versus Pre-Operative ERCP for CBDS
Study, Population, Country and Quality Data Sources Other Comments
Incremental
Conclusion Uncertainty Cost Effect ICER
Gurusamy et al. (2012) Patients with gallbladder and CBD stones suitable for LC
UK
Effects: authors’ own systematic review, other sources, some assumptions. Rare events modelled using non-informative priors
Costs: reference costs £UK, 2008. Some assumptions
Utilities: small non UK time trade-off and standard gamble studies, not from patients, some assumptions
Decision tree (3 year horizon)
Preoperative ERCP and LC done in separate hospital admissions
Discounting applied to both costs and QALYs at 3.5%
-£623 0.008 Intraoperative ERCP
dominates preoperative
ERCP
Intraoperative ERCP is less expensive and resulted in better QALYs than preoperative ERCP
ICER sensitive to extreme values of operative success that would not be seen in clinical practice
Complications and conversion rates
Cost savings predicated on necessary resource scheduling
In PSA, intraoperative ERCP has 93% chance of being cost effective at £20,000/QALY
Directly Applicable
a
Potentially Serious Limitations
b,c,d,e,f
a Utilities not from patients and not scored by UK general public
b Time horizon may be limited
c Some assumptions made in all data sources
d Decision tree does not allow recurrence of symptoms
e Delay between ERCP and LC not specified
f No consideration of ERCP or laparoscopic cholecystectomy mortality, or background mortality
Abbreviations
CBDS: Common bile duct stones
ERCP: Endoscopic retrograde cholangiopancreatography
ICER: Incremental cost effectiveness ratio
LC: Laparoscopic Cholecystectomy
PSA: Probabilistic Sensitivity Analysis
QALY: Quality adjusted life years
UK: United Kingdom

Internal Clinical Guidelines, 2014
Gallstone Disease
8
2 Gallstones Health Economic Model The model was implemented in Microsoft Excel 2010. In line with the NICE reference case (National Institute for Health and Care Excellence 2013), an NHS and PSS perspective was adopted. Costs and benefits were discounted at 3.5% per annum each and all costs were based on 2011–12 financial year.
2.1 Model Structure
A single Markov model structure was used to assess all the comparisons listed in Table 2. The GDG believed it was important, particularly for those comparisons including conservative management options, to be able to model the recurrence of symptoms and of CBDS. A Markov model was also able to more accurately capture any differences in mortality. This was also a reason to adopt a lifetime horizon. The GDG also felt strongly that bile duct injuries incur lifelong quality of life detriments that needed to be captured within the model.
A 2-week cycle length was employed in the Markov model. The GDG felt this represented an appropriate trade-off between operative length and postoperative recovery that allowed the model to adequately represent the disease without a proliferation of short-term health states. Due to the short cycle length, half-cycle correction was not applied within the model.
The gallstones model is a natural history model. Transitions between states are not necessarily by events occurring, but by changes (such as the development of symptoms) in the health of a patient. The model ‘‘knows’’ the status of a patient, even if the healthcare professionals or the patient do not. So, for instance, the model knows whether a patient has CBDS, whether or not the healthcare professional or the patient know the patient has CBDS.
The model consists of states that are groupings of options in 3 dimensions (see Figure 1). The experience of simulated patients always represents the combination of 1 option from each dimension.
In Figure 1, the blue boxes represent the underlying gallstone disease of a patient – they can be in 1 and only 1 of these states: gallbladder stones, CBDS, both or neither. Note that this is not the same as diagnosis, as the patient and/or healthcare professional may not know they have these stones.
The yellow ellipses represent things that can happen to a patient within the model. These include being asymptomatic or symptomatic or receiving an interventional procedure. The two procedures considered by the model are ERCP (for CBDS) and laparoscopic cholecystectomy (for gallbladder stones) – both have associated mortality risks. The ‘‘LC+ERCP’’ option allows for both surgeries to be undertaken in the same 2-week cycle.
The GDG gave guidance on what symptoms should be modelled (see Table 5). Symptoms are specific to the condition; however, a patient whose underlying status is ‘‘gallstones and CBDS’’ can have any of the 6 symptoms. The model treats each symptom as a mutually exclusive option, so patients can only have only 1 symptom at any time. The pancreatitis symptom option has an associated mortality risk.
The green lozenges represent the potential long-term consequences of gallstone surgery. The GDG stated that both laparoscopic and open cholecystectomy can cause bile duct injury and bile duct injuries have long-term impacts on quality of life.
There are 2 additional states that exist outside this framework: gallbladder cancer and death. These are homogeneous states in which it is not necessary to consider the underlying gallstone disease state or gallstone symptoms. Surgical, symptom-related and background mortality are considered.‘’

Internal Clinical Guidelines, 2014
Gallstone Disease
9
The scope of this guideline explicitly excludes the diagnosis and treatment of gallbladder cancer. However, the development of cancer is a possible consequence of decisions regarding the treatment of gallstone disease, especially where conservative, gallbladder in situ management approaches are concerned. Therefore, in view of its poor survival and impact on quality of life, it was felt gallbladder cancer should be considered as a possible outcome in the model for patients in conservative management arms who still have their gallbladder.
Figure 1: Dimensions of Gallstones Markov Model
Table 5: Symptoms Included in the Gallstones Model
Condition Symptom First intervention
Gallbladder Stones Biliary colic Laparoscopic cholecystectomy Acute cholecystitis
Common Bile Duct Stones Cholangitis ERCP
Jaundice
Pancreatitis
Sepsis
2.2 Model States
Model states are created by combining one of each of the blue, yellow and green dimensions. For instance, a patient could have gallstones only, be symptomatic with biliary colic and have no bile duct injury. Not all combinations of dimensions are available and not all states are relevant to each comparison. Table 6 indicates which options can be combined to produce a model state – there are up to 32 states available in the model:
Patients in the ‘‘gallstones+CBDS’’ dimension could be in any of the yellow dimensions, but only in the ‘‘no bile duct injury’’ dimension
Patients in the ‘‘gallstones only’’ option can only be in the ‘‘biliary colic’’ or ‘‘acute cholecystitis’’ symptom dimensions or the ‘‘asymptomatic’’ dimension. They could be in any of the three intervention dimensions (‘‘ERCP’’, ‘‘laparoscopic cholecystectomy’’ or ‘‘LC+ERCP’’)
Patients can only be in the ‘‘CBDS only’’ dimension following either of the laparoscopic cholecystectomy dimensions (that is, they no longer have their gallbladder)
No bile
duct injury
Bile duct
injury
Gallstones
and CBDS
Gallstones
onlyCBDS only No stones
Asymptomatic Symptomatic
LC ERCP LC + ERCP
underlying
gallstone
pathology
current patient
experience
long-term
consequences
of treatment
Gallbladder
cancer
Dead
CBDS – common bile duct stones
ERCP – endoscopic retrograde cholangiopancreatography
LC – laparoscopic cholecystectomy

Internal Clinical Guidelines, 2014
Gallstone Disease
10
Patients in the ‘‘CBDS only’’ option can be in 1 of the 4 symptom dimensions listed in Table 5, the ‘‘asymptomatic’’ dimension or the ‘‘ERCP’’ dimension. These patients may or may not have previously incurred a bile duct injury during their laparoscopic cholecystectomy
Successfully treated patients who are in the ‘‘no stones or GB’’ dimension can only be in the ‘‘asymptomatic’’ dimension, with or without bile duct injury
The gallbladder cancer state can only be entered by those in conservative management arms (comparator arms of questions 4b.2 and 4c.2, Table 2) who have not yet had a laparoscopic cholecystectomy (that is, it is only considered as a possible outcome for people with an extended period with gallbladder in situ)

Internal Clinical Guidelines, 2014
Gallstone Disease
11
Table 6: Gallstones Model States - Combinations of Elements That Exist Within the Model
Long-term consequences
Underlying pathology Asymptomatic
Symptomatic
LC ERCP LC
+ERCP Biliary Colic
Acute Cholecystitis Cholangitis Jaundice Pancreatitis Sepsis
No bile duct injury GS+CBDS X X X X X X X X X X
No bile duct injury GS X X X X X X
No bile duct injury CBDS X X X X X X
No bile duct injury No stones X
Bile duct injury GS+CBDS
Bile duct injury GS
Bile duct injury CBDS X X X X X X
Bile duct injury No stones X
Dead X
Gall bladder Cancer X

Internal Clinical Guidelines, 2014
Gallstone Disease
12
2.3 Model Transitions
The transitions available between states within the model vary between questions and are described below. Even where available transitions are listed as being the same, transition probabilities may differ due to question-specific input data (see section 2.4).
The complete range of possible states and transitions available within the model is illustrated in Figure 2. As each question relates to a particular population and set of treatment options, none of the questions includes every state and transition available in the full model. The subset of options included in each model is detailed and depicted below.
Arrows indicate possible transitions (outlined arrows indicate transitions that are only possible where a procedure fails). States with yellow shading are those in which a proportion of the cohort experience permanent sequelae of bile duct injury.
Figure 2: Possible states and transitions for gallstones Markov model
All intervention states have a risk of death, as does the symptomatic pancreatitis state, that are not listed in the transitions described below. All states include a risk of background mortality.
Known CBDS are dealt with by one or two ERCPs. The model does not contain a state to represent these second ERCPs, they are modelled as cost and utility impacts for the percentage of patients receiving them.
symptomatic
GS+CBDS
No stones
asymptomatic
CBDSERCP
CBDS
LC
GS
asymptomatic
GS
CBDS
symptomatic
LC
GS+CBDS
LC+ERCP
GS+CBDS
asymptomatic
GS+CBDS
symptomatic
GS
ERCP
GS
LC+ERCP
GS
ERCP
GS+CBDS
CBDS – common bile duct stones
ERCP – endoscopic retrograde cholangiopancreatography
GS – gallbladder stones
LC – laparoscopic cholecystectomy

Internal Clinical Guidelines, 2014
Gallstone Disease
13
2.3.1 Laparoscopic cholecystectomy with intraoperative cholangiography versus laparoscopic cholecystectomy (Q4b.1)
Available transitions for both arms of this question (Figure 3) are the same. However, the initial states differ, as do the transition probabilities. Laparoscopic cholecystectomy with intraoperative cholangiography (IOC) is modelled via the laparoscopic cholecystectomy states, but with different transition probabilities and costs.
Laparoscopic cholecystectomy patients begin in the laparoscopic cholecystectomy states with either gallstones or gallstones and CBDS. Patients with gallstones and CBDS start in either the laparoscopic cholecystectomy+ERCP state (where the IOC does find CBDS) or the laparoscopic cholecystectomy state (where the IOC does not find CBDS)a.
Patients starting in the gallstones only state transition from laparoscopic cholecystectomy to the ‘no stones’ state, with or without a bile duct injury, where they remain until they die of natural causes. Patients with gallstones and CBDS who start in the laparoscopic cholecystectomy+ERCP state have similar transitions available.
Patients with gallstones and CBDS who start in the laparoscopic cholecystectomy only state (ie the IOC does not find CBDS, even though they exist) transition to the CBDS asymptomatic and symptomatic states, with or without bile duct injury. Patients with asymptomatic CBDS can remain asymptomatic or transition to symptoms. Once patients are in symptomatic CBDS states, they transition to ERCP. Following an ERCP, patients can transition to ‘no stones and asymptomatic’ or may have remaining unknown CBDS (asymptomatic or symptomatic). Those with remaining CBDS will receive an ERCP when the CBDS cause symptoms.
a It is important to remember that the model ‘knows’ whether a patient has CBDS, even if they are not known or
found at the initial investigation.

Internal Clinical Guidelines, 2014
Gallstone Disease
14
Lap
aro
sco
pic
ch
ole
cy
ste
cto
my
Lap
aro
sco
pic
ch
ole
cy
ste
cto
my +
in
trao
pe
rati
ve
ch
ola
ng
iog
rap
hy
Green block arrows indicate possible starting states. Arrows indicate possible transitions (outlined arrows indicate transitions that are only possible where a procedure fails). States with yellow shading are those in which a proportion of the cohort experience permanent sequelae of bile duct injury. For key, see Figure 2
Figure 3: Model structure for question Q4b.1 – laparoscopic cholecystectomy with intraoperative cholangiography versus laparoscopic cholecystectomy
symptomatic
GS+CBDS
asymptomatic
GSERCP
GS+CBDS
LC+ERCP
GS+CBDS
asymptomatic
GS+CBDS
symptomatic
GS
ERCP
GS
No stones
asymptomatic
CBDSERCP
CBDS
LC
GS
CBDS
symptomatic
LC
GS+CBDS
symptomatic
GS+CBDS
asymptomatic
GS
LC
GS+CBDS
ERCP
GS+CBDS
asymptomatic
GS+CBDS
symptomatic
GS
ERCP
GS
No stones
asymptomatic
CBDSERCP
CBDS
LC+IOC
GS
CBDS
symptomatic
LC+IOC+/-ERCP
GS+CBDS

Internal Clinical Guidelines, 2014
Gallstone Disease
15
2.3.2 Laparoscopic cholecystectomy versus conservative management (Q4b.2)
Transitions for the laparoscopic cholecystectomy arm are the same as for the laparoscopic cholecystectomy arm in Q4b.1 (see section 2.3.1).
Patients in the conservative management arm start in any of the symptomatic states. They can remain symptomatic, transition to asymptomatic or transition to receiving an intervention (see Table 5). Patients with gallstones only may develop new asymptomatic or symptomatic CBDS (transition from gallstones only to gallstone and CBDS states).
Patients in the gallstones only state transition from laparoscopic cholecystectomy to the ‘no stones’ state, with or without a bile duct injury, where they remain until they die of natural causes.
Patients in the gallstones and CBDS state who transition from laparoscopic cholecystectomy go to the asymptomatic or symptomatic CBDS states (with or without a bile duct injury). Patients in the gallstones and CBDS state who transition from ERCP go to either asymptomatic or symptomatic gallstones or asymptomatic or symptomatic gallstones and CBDS (if unknown stones remain). From any of these states, patients may again remain symptomatic, become asymptomatic or receive an intervention.
Once patients reach the CBDS asymptomatic and symptomatic states (with or without bile duct injury) they remain asymptomatic or transition to symptoms. Once patients are in symptomatic CBDS states, they transition to ERCP. Following an ERCP, patients can transition to ‘no stones and asymptomatic’ or may have remaining unknown CBDS (asymptomatic or symptomatic). Those with remaining CBDS will receive an ERCP when the CBDS cause symptoms.

Internal Clinical Guidelines, 2014
Gallstone Disease
16
Lap
aro
sco
pic
ch
ole
cy
ste
cto
my
Co
nserv
ati
ve
man
ag
em
en
t
Green block arrows indicate possible starting states. Arrows indicate possible transitions (outlined arrows indicate transitions that are only possible where a procedure fails). States with yellow shading are those in which a proportion of the cohort experience permanent sequelae of bile duct injury. For key, see Figure 2
Figure 4: Model structure for question Q4b.2 – laparoscopic cholecystectomy versus conservative management
symptomatic
GS+CBDS
asymptomatic
GSERCP
GS+CBDS
LC+ERCP
GS+CBDS
asymptomatic
GS+CBDS
symptomatic
GS
ERCP
GS
No stones
asymptomatic
CBDSERCP
CBDS
LC
GS
CBDS
symptomatic
LC
GS+CBDS
LC+ERCP
GS+CBDS
ERCP
GS
symptomatic
GS+CBDS
No stones
asymptomatic
CBDSERCP
CBDS
LC
GS
asymptomatic
GS
CBDS
symptomatic
LC
GS+CBDS
ERCP
GS+CBDS
asymptomatic
GS+CBDS
symptomatic
GS

Internal Clinical Guidelines, 2014
Gallstone Disease
17
2.3.3 Day-case versus inpatient laparoscopic cholecystectomy (Q4b.3)
Transitions for both the day-case and inpatient laparoscopic cholecystectomy arms (Figure 5) are the same as for the laparoscopic cholecystectomy arm in Q4b.1 (see section 2.3.1). Transition probabilities, costs and utilities differ between arms.
Lap
aro
sco
pic
ch
ole
cy
ste
cto
my (
bo
th a
rms)
Green block arrows indicate possible starting states. Arrows indicate possible transitions (outlined arrows indicate transitions that are only possible where a procedure fails). States with yellow shading are those in which a proportion of the cohort experience permanent sequelae of bile duct injury. For key, see Figure 2
Figure 5: Model structure for question Q4b.3 – day-case versus inpatient laparoscopic cholecystectomy
symptomatic
GS+CBDS
asymptomatic
GSERCP
GS+CBDS
LC+ERCP
GS+CBDS
asymptomatic
GS+CBDS
symptomatic
GS
ERCP
GS
No stones
asymptomatic
CBDSERCP
CBDS
LC
GS
CBDS
symptomatic
LC
GS+CBDS

Internal Clinical Guidelines, 2014
Gallstone Disease
18
2.3.4 Laparoscopic cholecystectomy with bile duct exploration versus laparoscopic cholecystectomy with pre-, intra- or postoperative ERCP (Q4c.1)
This question explores 4 different approaches to the management of people who are suspected of symptomatic CBDS.
Patients in the laparoscopic cholecystectomy with bile duct exploration arm begin the laparoscopic cholecystectomy states with either gallstones only or gallstones and CBDS. They follow the transitions outlined for the laparoscopic cholecystectomy arm of question Q4b.1 (see section 2.3.1), but as bile duct exploration is undertaken, those starting with gallstones and CBDS are able to transition to the asymptomatic no stones state (with or without bile duct injury). In a proportion of patients, CBDS remain undiscovered; these people enter the CBDS only section of the model and receive ERCP if and when they become symptomatic; assuming the ERCP is successful, they move to ‘no stones’ where they remain until they die of background mortality.
Patients in the preoperative ERCP arm start in the ERCP states with either gallstones only or gallstones and CBDS. They receive a laparoscopic cholecystectomy in the second cycle. Patients with no new or remaining unknown CBDS transition to the asymptomatic ‘no stones’ state (with or without bile duct injury). Patients with new or remaining unknown CBDS will receive an ERCP when the CBDS cause symptoms. Following an ERCP, patients can transition to ‘no stones and asymptomatic’ or may have remaining unknown CBDS (asymptomatic or symptomatic)
In the laparoscopic cholecystectomy with intraoperative ERCP arm, patients follow analogous transitions to those in the laparoscopic cholecystectomy with bile duct exploration arm. This is also true in the laparoscopic cholecystectomy with postoperative ERCP arm, as both procedures are assumed to take place during the same 2-week model cycle; however, costs, quality of life and exit probabilities are different from the intraoperative variant.

Internal Clinical Guidelines, 2014
Gallstone Disease
19
Lap
aro
sco
pic
ch
ole
cy
ste
cto
my +
bile d
uct
exp
lora
tio
n
Lap
aro
sco
pic
ch
ole
cy
ste
cto
my w
ith
pre
op
era
tiv
e E
RC
P
continued
LC
GS+CBDS
symptomatic
GS+CBDS
asymptomatic
GSERCP
GS+CBDS
asymptomatic
GS+CBDS
symptomatic
GS
ERCP
GS
No stones
asymptomatic
CBDSERCP
CBDS
LC+BDE
GS
CBDS
symptomatic
LC+BDE
GS+CBDS
symptomatic
GS+CBDS
asymptomatic
GS
LC+ERCP
GS+CBDS
asymptomatic
GS+CBDS
symptomatic
GS
No stones
asymptomatic
CBDSERCP
CBDS
LC
GS
CBDS
symptomatic
LC
GS+CBDS
ERCP
GS
ERCP
GS+CBDS

Internal Clinical Guidelines, 2014
Gallstone Disease
20
Lap
aro
sco
pic
ch
ole
cy
ste
cto
my w
ith
in
trao
pe
rati
ve
ER
CP
Lap
aro
sco
pic
ch
ole
cy
ste
cto
my w
ith
po
sto
pera
tive
ER
CP
Green block arrows indicate possible starting states. Arrows indicate possible transitions (outlined arrows indicate transitions that are only possible where a procedure fails). States with yellow shading are those in which a proportion of the cohort experience permanent sequelae of bile duct injury. For key, see Figure 2
Figure 6: Model structure for question Q4c.1 – laparoscopic cholecystectomy with bile duct exploration versus laparoscopic cholecystectomy with pre-, intra- or post-operative ERCP
LC
GS+CBDS
symptomatic
GS+CBDS
asymptomatic
GSERCP
GS+CBDS
asymptomatic
GS+CBDS
symptomatic
GS
ERCP
GS
No stones
asymptomatic
CBDSERCP
CBDS
LC+ERCP
GS
CBDS
symptomatic
LC+ERCP
GS+CBDS
LC
GS+CBDS
symptomatic
GS+CBDS
asymptomatic
GSERCP
GS+CBDS
asymptomatic
GS+CBDS
symptomatic
GS
ERCP
GS
No stones
asymptomatic
CBDSERCP
CBDS
LC+ERCP
GS
CBDS
symptomatic
LC+ERCP
GS+CBDS

Internal Clinical Guidelines, 2014
Gallstone Disease
21
2.3.5 ERCP and laparoscopic cholecystectomy versus ERCP alone (Q4c.2)
The two clinical included studies (Boerma et al. 2002; Lau et al. 2006) enrolled patients who had undergone an ERCP and had their bile ducts cleared. Therefore, these patients can have no remaining unknown CBDS and all start in the gallbladder stone states.
In the ERCP and laparoscopic cholecystectomy arm, all patients start in the laparoscopic cholecystectomy state and can only transition to no stones with or without a bile duct injury, where they remain until they die of natural causes.
Patients in the ERCP alone arm start in the asymptomatic, biliary colic or acute cholecystitis states. During the model, asymptomatic patients can become symptomatic, and symptomatic patients transition to the laparoscopic cholecystectomy state.
Prior to laparoscopic cholecystectomy, patients can develop asymptomatic or symptomatic new CBDS. Once these become symptomatic, patients transition to the intervention appropriate to their symptom (see Table 5). If this intervention is a laparoscopic cholecystectomy, patients transition to asymptomatic or symptomatic CBDS states where they remain asymptomatic or transition to symptoms. If the intervention is an ERCP, patients transition to asymptomatic or symptomatic gallstone states and follow the starting transitions outlined above, or transition to asymptomatic or symptomatic gallstones and CBDS states (if unknown CBDS remain) and follow the transitions above for new CBDS.
Once patients are in symptomatic CBDS states, they transition to ERCP and then to ‘no stones and asymptomatic’ or may have remaining unknown CBDS (asymptomatic or symptomatic). Those with remaining CBDS will receive an ERCP when the CBDS cause symptoms.

Internal Clinical Guidelines, 2014
Gallstone Disease
22
ER
CP
an
d l
ap
aro
sco
pic
ch
ole
cyste
cto
my
ER
CP
alo
ne
Green block arrows indicate possible starting states. Arrows indicate possible transitions (outlined arrows indicate transitions that are only possible where a procedure fails). States with yellow shading are those in which a proportion of the cohort experience permanent sequelae of bile duct injury. For key, see Figure 2
Figure 7: Model structure for question Q4b.2 – ERCP and laparoscopic cholecystectomy versus ERCP alone
symptomatic
GS+CBDS
asymptomatic
GS
CBDS
symptomatic
LC
GS+CBDS
ERCP
GS+CBDS
asymptomatic
GS+CBDS
symptomatic
GS
asymptomatic
CBDSERCP
CBDS
LC+ERCP
GS+CBDS
ERCP
GS
No stones
LC
GS
ERCP
GS
LC+ERCP
GS+CBDS
symptomatic
GS+CBDS
No stones
asymptomatic
CBDSERCP
CBDS
LC
GS
asymptomatic
GS
CBDS
symptomatic
LC
GS+CBDS
ERCP
GS+CBDS
asymptomatic
GS+CBDS
symptomatic
GS

Internal Clinical Guidelines, 2014
Gallstone Disease
23
2.3.6 ERCP versus conservative management (Q4c.3)
In the ERCP arm, patients start in the ERCP states with either gallstones alone or gallstones and CBDS and transition to asymptomatic or symptomatic states. Those with gallstones alone transition to gallstones states, unless new CBDS develop in which case they transition to gallstones and CBDS states. Those who begin with gallstones and CBDS transition to gallstones alone unless they have remaining unknown stones.
If patients are in symptomatic biliary colic states they can become asymptomatic, remain symptomatic or receive a laparoscopic cholecystectomy. Those in symptomatic acute cholecystitis states all transition to laparoscopic cholecystectomy states; those in symptomatic cholangitis, jaundice, pancreatitis or sepsis states transition to ERCP states.
Patients with gallstones only who transition to laparoscopic cholecystectomy can only transition to no stones with or without a bile duct injury, where they remain until they die of natural causes. Patients with gallstones and CBDS transition to asymptomatic or symptomatic CBDS states. Patients who transition to ERCP can have remaining unknown stones and follow the starting transitions outlined above.
Once patients are in symptomatic CBDS states, they transition to ERCP and then to ‘no stones and asymptomatic’ or may have remaining unknown CBDS (asymptomatic or symptomatic). Those with remaining CBDS will receive an ERCP when the CBDS cause symptoms.
Following the GDG’s advice, all patients who have not yet transitioned through a laparoscopic cholecystectomy state are forced to do so in cycle 4 (representing 6–8 weeks after their initial ERCP).
In the conservative management arm, patients start in any of the symptomatic states. They follow the transitions outlined above for the conservative management arm in question 4b.2 (see section 2.3.2).

Internal Clinical Guidelines, 2014
Gallstone Disease
24
ER
CP
Co
nserv
ati
ve
man
ag
em
en
t
Green block arrows indicate possible starting states. Arrows indicate possible transitions (outlined arrows indicate transitions that are only possible where a procedure fails). States with yellow shading are those in which a proportion of the cohort experience permanent sequelae of bile duct injury. For key, see Figure 2
Figure 8: Model structure for question Q4c.3 – ERCP versus conservative management
LC+ERCP
GS+CBDS
No stones
asymptomatic
CBDSERCP
CBDS
LC
GS
CBDS
symptomatic
LC
GS+CBDS
ERCP
GS
ERCP
GS+CBDSsymptomatic
GS+CBDS
asymptomatic
GSERCP
GS+CBDS
asymptomatic
GS+CBDS
symptomatic
GS
LC+ERCP
GS+CBDS
ERCP
GS
symptomatic
GS+CBDS
No stones
asymptomatic
CBDSERCP
CBDS
LC
GS
asymptomatic
GS
CBDS
symptomatic
LC
GS+CBDS
ERCP
GS+CBDS
asymptomatic
GS+CBDS
symptomatic
GS

Internal Clinical Guidelines, 2014
Gallstone Disease
25
2.3.7 Early versus delayed laparoscopic cholecystectomy (Q5a.1)
In the early laparoscopic cholecystectomy arm, patients begin in the laparoscopic cholecystectomy states with either gallstones or gallstones and CBDS. Patients follow the transitions outlined above in the laparoscopic cholecystectomy arm of question Q4b.1 (see section 2.3.1).
Patients in the delayed laparoscopic cholecystectomy arm begin in any of the symptomatic states. If they have biliary colic, they can become asymptomatic, remain symptomatic or receive a laparoscopic cholecystectomy. Symptomatic acute cholecystitis patients receive a laparoscopic cholecystectomy; patients with other symptoms receive an ERCP (see Table 5) and a laparoscopic cholecystectomy in the same cycle. Patients can transition to ‘no stones and asymptomatic’ or may have remaining unknown CBDS (asymptomatic or symptomatic). Those with remaining CBDS will receive an ERCP when the CBDS cause symptoms. All patients who have not yet done so receive a laparoscopic cholecystectomy in cycle 4 (following a 6-8 delay), irrespective of asymptomatic or symptomatic states.

Internal Clinical Guidelines, 2014
Gallstone Disease
26
Earl
y l
ap
aro
sco
pic
ch
ole
cyste
cto
my
Dela
yed
lap
aro
sco
pic
ch
ole
cyste
cto
my
Green block arrows indicate possible starting states. Arrows indicate possible transitions (outlined arrows indicate transitions that are only possible where a procedure fails). States with yellow shading are those in which a proportion of the cohort experience permanent sequelae of bile duct injury. For key, see Figure 2
Figure 9: Model structure for question Q5a.1 – early versus delayed laparoscopic cholecystectomy
symptomatic
GS+CBDS
asymptomatic
GSERCP
GS+CBDS
LC+ERCP
GS+CBDS
asymptomatic
GS+CBDS
symptomatic
GS
ERCP
GS
No stones
asymptomatic
CBDSERCP
CBDS
LC
GS
CBDS
symptomatic
LC
GS+CBDS
ERCP
GS+CBDS
ERCP
GS
symptomatic
GS+CBDS
No stones
asymptomatic
CBDSERCP
CBDS
LC
GS
asymptomatic
GS
CBDS
symptomatic
asymptomatic
GS+CBDS
symptomatic
GS
LC+ERCP
GS+CBDS
LC
GS+CBDS

Internal Clinical Guidelines, 2014
Gallstone Disease
27
2.3.8 Early versus delayed laparoscopic cholecystectomy following ERCP (Q5a.2)
In this question of laparoscopic cholecystectomy timing post ERCP, patients are assumed to have a cleared common bile duct with no remaining unknown CBDS, but the potential for new CBDS to have developed since the ERCP was undertaken (presumed to be in the previous “cycle” to the start of the model). In the early arm, patients begin in the laparoscopic cholecystectomy states, with either gallstones only or gallstones and CBDS. Patients follow the transitions outlined above in the laparoscopic cholecystectomy arm of question Q4b.1 (see section 2.3.1).
Patients in the delayed laparoscopic cholecystectomy arm begin in the asymptomatic or symptomatic states with either gallstones only or gallstones and CBDS (new CBDS that have developed since the ERCP occurred and newly developed symptoms). They follow the transitions outlined in delayed laparoscopic cholecystectomy arm of questions Q5a.1 (see section 2.3.7).

Internal Clinical Guidelines, 2014
Gallstone Disease
28
Earl
y l
ap
aro
sco
pic
ch
ole
cyste
cto
my f
ollo
win
g E
RC
P
Dela
yed
lap
aro
sco
pic
ch
ole
cyste
cto
my f
ollo
win
g E
RC
P
Green block arrows indicate possible starting states. Arrows indicate possible transitions (outlined arrows indicate transitions that are only possible where a procedure fails). States with yellow shading are those in which a proportion of the cohort experience permanent sequelae of bile duct injury. For key, see Figure 2
Figure 10: Model structure for question 5a.2 – early versus delayed laparoscopic cholecystectomy following ERCP
symptomatic
GS+CBDS
asymptomatic
GSERCP
GS+CBDS
LC+ERCP
GS+CBDS
asymptomatic
GS+CBDS
symptomatic
GS
ERCP
GS
No stones
asymptomatic
CBDSERCP
CBDS
LC
GS
CBDS
symptomatic
LC
GS+CBDS
LC+ERCP
GS+CBDS
ERCP
GS
symptomatic
GS+CBDS
No stones
asymptomatic
CBDSERCP
CBDS
LC
GS
asymptomatic
GS
CBDS
symptomatic
LC
GS+CBDS
ERCP
GS+CBDS
asymptomatic
GS+CBDS
symptomatic
GS

Internal Clinical Guidelines, 2014
Gallstone Disease
29
2.4 Model Parameters All model parameters are listed in Table 19, with their sources and, where applicable, the distributions and parameters used to reflect uncertainty around their true value in probabilistic sensitivity analyses. Where possible, model parameters were sourced from the studies included in the systematic reviews of clinical evidence undertaken for this guideline. Other parameters were identified through informal searches that aimed to satisfy the principle of ‘saturation’ (that is, to ‘identify the breadth of information needs relevant to a model and sufficient information such that further efforts to identify more information would add nothing to the analysis’ (Kaltenhaler et al, 2011).
2.4.1 Initial patient distributions
As they enter the model, patients are split between having gallstones only or gallstones and CBDS, on the basis of their underlying gallstones pathology rather than whether their CBDS are known to the patient or clinician (see section 2.1). Therefore, whether or not patients have CBDS is based on the percentage of patients who were found to have CBDS and those who had remaining unknown CBDS (at ERCP or bile duct exploration).
On GDG advice, patient cohorts are assumed to be 75% female and have a mean age of 50 years. These assumptions only impact the background mortality risk and utility values and are tested in sensitivity analyses.
2.4.2 Probabilities of having or developing symptoms
Symptoms are specific to having gallstones only, gallstones and CBDS or CBDS only (see Table 5).
In arms where patients begin with symptoms, symptoms are mutually exclusive and exhaustive. None of the included clinical studies of patients with gallstones reported symptoms at baseline. Data on the numbers of patients developing symptoms were used to weight symptoms between biliary colic (62%) and acute cholecystitis at (38%) baseline and agreed by the GDG.
None of the included clinical studies of patients with gallstones and CBDS reported patients with symptomatic sepsis. The GDG felt this was unlikely and 25% of patients were assumed to have sepsis at baseline. For both baseline gallstone and CBDS, symptoms were constrained to equal 100%
The incidence of patients developing symptoms during treatment delay, conservative management or following treatment were calculated as rates, based on reported or calculated lengths of patient follow-up. Data from one included clinical study could not be used as no follow-up data were reported (Fan et al. 1993).
Pancreatitis carries a risk of mortality that is parameterised from a comparative study of pancreatitis mortality in England and Australia (Chiang et al. 2004).
Gallbladder cancer incidence in patients with gallstones is parameterised from a study included in guideline question 3 on the management asymptomatic gallstones (Attili et al. 1995). Gallbladder cancer mortality rates for England were provided by the North West Cancer Registry (North West Cancer Intelligence Service 2014).
2.4.3 Baseline event probabilities
All treatment effects are drawn from included RCTs, which means they come in the form of comparative effectiveness estimates (for example, people receiving treatment a are twice as likely to experience a given outcome than people receiving treatment b). In order to estimate transition probabilities, it is necessary to combine these relative effectiveness data with an

Internal Clinical Guidelines, 2014
Gallstone Disease
30
estimate of absolute ‘baseline’ event probability (twice as likely as what?) In combination, these data provide estimates of absolute event probabilities for all the simulated treatments.
Evidence to inform absolute baseline event probabilities may be drawn from a variety of sources(Dias et al. 2012); we chose to pool the relevant arms of RCTs from the systematic review of relative effectiveness data. All questions addressed in this model include 1 of 2 standard treatment choices – for questions about gallbladder stones, this is a standard laparoscopic cholecystectomy; for questions about common bile duct stones, it is a standard ERCP.
To increase parameter accuracy, data from standard laparoscopic cholecystectomy arms were pooled and applied in all relevant questions (see Error! Reference source not ound.). Symptoms and consequences were specific to gallstones only or gallstones and CBDS comparisons.
Table 7: Arms combined to produce baseline generic laparoscopic cholecystectomy transition probabilities
Question Number Question
Standard Laparoscopic Cholecystectomy Arm
Q4b.1 Laparoscopic cholecystectomy with IOC versus laparoscopic cholecystectomy
Laparoscopic cholecystectomy
Q4b.2 Laparoscopic cholecystectomy versus Conservative Management
Laparoscopic cholecystectomy
Q4b.3 Inpatient versus Day-case laparoscopic cholecystectomy
Inpatient laparoscopic cholecystectomy
Q5a.1 Early versus delayed laparoscopic cholecystectomy
Delayed laparoscopic cholecystectomy
Q5a.2 Early versus delayed laparoscopic cholecystectomy following ERCP
Delayed laparoscopic cholecystectomy
2.4.4 Probabilities of operative consequences
The range of operative consequences considered was based on those reported in the included clinical studies and agreed with the GDG. Some operative consequences impacted model transitions whereas some were modelled as cost and/or utility impacts only. Table 8 summarises the operative consequences modelled and their scope.
Operative consequence data were meta-analysed where appropriate against the comparator arm (see Table 2) to give natural log odds and natural log odds ratios (as reported in Table 19).
Where data were available in the included studies, inter-arm differences in operative consequences were modelled. Where comparative data were not available, operative consequences for a standard laparoscopic cholecystectomy or ERCP were assumed.

Internal Clinical Guidelines, 2014
Gallstone Disease
31
Table 8: Operative consequences included in the gallstones model
Condition and Operation Consequence Scope
Gallstones – laparoscopic cholecystectomy
Bile duct injury Transition, utility
Bile leak requiring ERCP Cost, utility, mortality
Extra ERCP required to clear CBD Cost, utility, mortality
Laparoscopic cholecystectomy required (delayed or conservative management arms only)
Transition, cost, utility and mortality
Laparoscopic to open cholecystectomy conversion
Cost
Unknown CBDS Transition, cost, utility
Laparoscopic cholecystectomy operative mortality
Transition
Gallstones and CBDS – ERCP
Bile leak requiring extra ERCP Transition, cost, utility and mortality
ERCP required (delayed or conservative management arms only)
Transition, cost, utility and mortality
Extra ERCP required to clear CBD Cost, utility, mortality
Laparoscopic cholecystectomy required (delayed or conservative management arms only)
Transition, cost, utility and mortality
Laparoscopic to open cholecystectomy conversion
Cost
New CBDS Transition
Unknown CBDS Transition, cost, utility
ERCP operative mortality Transition
Some reported operative consequences were not included in the model. For the laparoscopic cholecystectomy with intraoperative ERCP comparison (Q4c.1), switches to bile duct exploration were not modelled, as the model assumes intraoperative ERCP and bile duct exploration have the same cost and utility decrement. Known missed CBDS were not modelled, as it was felt this would double count with extra ERCPs required.
Operative mortality is parameterised from data external to the included clinical studies. There was no laparoscopic cholecystectomy mortality in the included studies and none of the included studies identified only operative mortality for ERCPs. The GDG felt it was important to include a measure of operative mortality. Data from a mid 1990s Royal College of Surgeons audit gave a laparoscopic cholecystectomy mortality rate similar to that suggested by the GDG (Dunn et al. 1994). Similarly, an overall ERCP operative mortality rate similar to that suggested by the GDG was taken from a 2004 British Society of Gastroenterology audit (Willams et al. 2006). Background mortality is taken from Office for National Statistics Life Tables (Office for National Statistics 2013).
Question 4c.1 compares laparoscopic cholecystectomy with bile duct exploration to laparoscopic cholecystectomy with pre, intra or postoperative ERCP. An indirect comparison was undertaken in the clinical evidence review (see guideline section 4.6) – the model uses direct evidence unless only indirect evidence is available.

Internal Clinical Guidelines, 2014
Gallstone Disease
32
2.4.5 Costs and Resource Use
Operative costs are based on NHS reference costs 2011-12 (Department of Health 2012). Appropriate healthcare resource groupings (HRGs) were identified using OPCS4b operation codes J18.3 for laparoscopic cholecystectomy and J43.9 for ERCP.
Table 9: HRGs Used to Cost Laparoscopic Cholecystectomy Operations
Operation HRG Code
HRG Description
Standard laparoscopic cholecystectomy
GA10D Laparoscopic Cholecystectomy, 19 years and over, with length of stay 1 day or more, without CC
GA10E Laparoscopic Cholecystectomy, 19 years and over, with length of stay 0 days, without CC
Complicated laparoscopic cholecystectomy (laparoscopic to open conversion)
GA10F Open or Laparoscopic Cholecystectomy, 19 years and over with CC
Laparoscopic cholecystectomy with bile duct exploration or intraoperative ERCP
GA07A Intermediate Open Hepatobiliary or Pancreatic Procedures, with CC
GA07B Intermediate Open Hepatobiliary or Pancreatic Procedures, without CC
(a) CC: complications and/or comorbidites
Using reference costs, it is possible to differentiate between standard, complicated and laparoscopic cholecystectomy operations that contains intraoperative bile duct activity, but not between operations containing bile duct exploration and intraoperative ERCP.
The GDG identified length of stay as a critical outcome. Accordingly, reference costs are broken down into fixed and bed day costs for laparoscopic cholecystectomy and ERCP. This assumes that the extra cost of a non-elective operation is entirely due to the additional length of stay, rather than operative costs. The average finished consultant episode (FCE) cost and length of stay of all elective and non-elective laparoscopic cholecystectomies was calculated and a cost per bed day can be ascertained (see Table 10). Similarly, the fixed and bed day costs of an ERCP were derived (see Table 11). Using these fixed and bed day costs and the average length of stay, baseline costs for each operation are calculated and shown in Table 12. For the laparoscopic cholecystectomy with ERCP state, the two interventions are assumed to occur in the same hospital admission. Here, a baseline length of stay of 5 days was assumed by the GDG.
Table 10: Derivaton of Fixed and Bed Day Costs for Laparoscopic Cholecystectomy
Laparoscopic Cholecystectomy Costs Elective Non-Elective
Average FCE cost £2,269 £3,614
Average length of stay (days) 1.47 4.98
Fixed Cost (assume equal) £1,708
Bed day cost (assume equal) £383
Table 11: Derivation of Fixed and Bed Day Costs for ERCP
ERCP Costs Elective Non-Elective
Average FCE cost £1,042 £2,471
Average length of stay (days) 1.42 6.11
Fixed Cost (assume equal) £610
Bed day cost (assume equal) £305
b Office of Population Censuses and Surveys Classification of Surgical Operations and Procedures (4th revision)
Internal Clinical Guidelines, 2014
Gallstone Disease
33
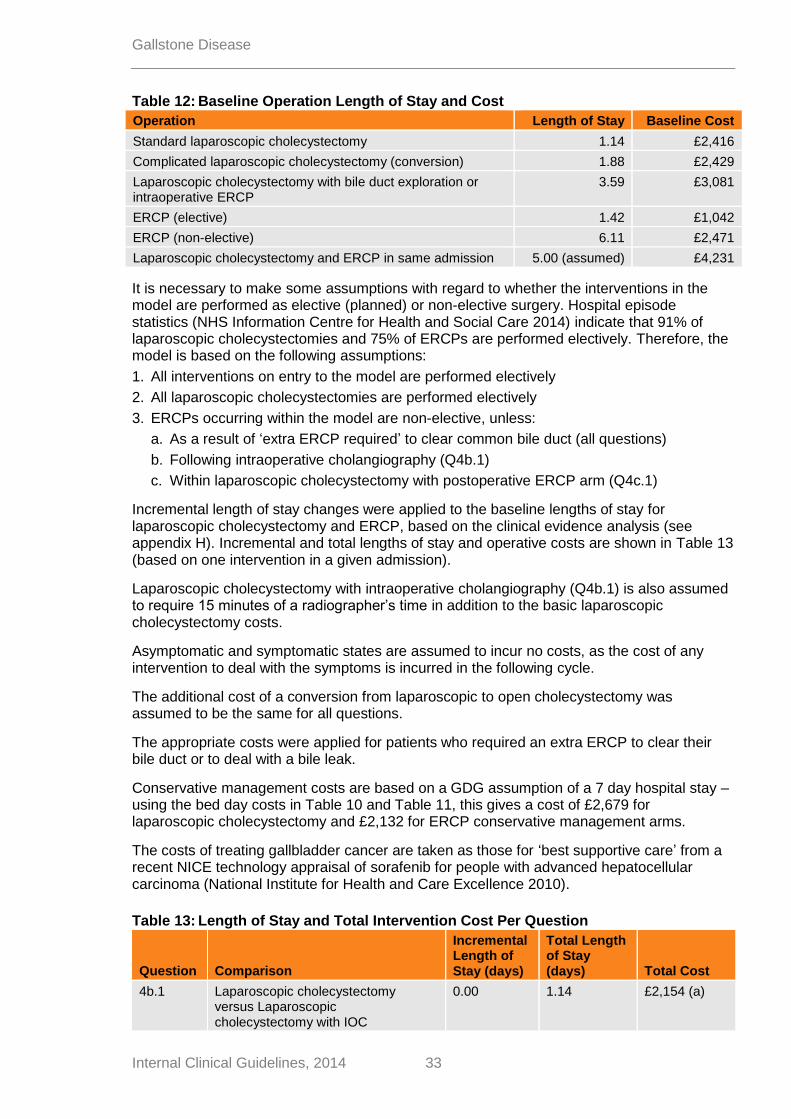
Table 12: Baseline Operation Length of Stay and Cost
Operation Length of Stay Baseline Cost
Standard laparoscopic cholecystectomy 1.14 £2,416
Complicated laparoscopic cholecystectomy (conversion) 1.88 £2,429
Laparoscopic cholecystectomy with bile duct exploration or intraoperative ERCP
3.59 £3,081
ERCP (elective) 1.42 £1,042
ERCP (non-elective) 6.11 £2,471
Laparoscopic cholecystectomy and ERCP in same admission 5.00 (assumed) £4,231
It is necessary to make some assumptions with regard to whether the interventions in the model are performed as elective (planned) or non-elective surgery. Hospital episode statistics (NHS Information Centre for Health and Social Care 2014) indicate that 91% of laparoscopic cholecystectomies and 75% of ERCPs are performed electively. Therefore, the model is based on the following assumptions:
1. All interventions on entry to the model are performed electively
2. All laparoscopic cholecystectomies are performed electively
3. ERCPs occurring within the model are non-elective, unless:
a. As a result of ‘extra ERCP required’ to clear common bile duct (all questions)
b. Following intraoperative cholangiography (Q4b.1)
c. Within laparoscopic cholecystectomy with postoperative ERCP arm (Q4c.1)
Incremental length of stay changes were applied to the baseline lengths of stay for laparoscopic cholecystectomy and ERCP, based on the clinical evidence analysis (see appendix H). Incremental and total lengths of stay and operative costs are shown in Table 13 (based on one intervention in a given admission).
Laparoscopic cholecystectomy with intraoperative cholangiography (Q4b.1) is also assumed to require 15 minutes of a radiographer’s time in addition to the basic laparoscopic cholecystectomy costs.
Asymptomatic and symptomatic states are assumed to incur no costs, as the cost of any intervention to deal with the symptoms is incurred in the following cycle.
The additional cost of a conversion from laparoscopic to open cholecystectomy was assumed to be the same for all questions.
The appropriate costs were applied for patients who required an extra ERCP to clear their bile duct or to deal with a bile leak.
Conservative management costs are based on a GDG assumption of a 7 day hospital stay – using the bed day costs in Table 10 and Table 11, this gives a cost of £2,679 for laparoscopic cholecystectomy and £2,132 for ERCP conservative management arms.
The costs of treating gallbladder cancer are taken as those for ‘best supportive care’ from a recent NICE technology appraisal of sorafenib for people with advanced hepatocellular carcinoma (National Institute for Health and Care Excellence 2010).
Table 13: Length of Stay and Total Intervention Cost Per Question
Question Comparison
Incremental Length of Stay (days)
Total Length of Stay (days) Total Cost
4b.1 Laparoscopic cholecystectomy versus Laparoscopic cholecystectomy with IOC
0.00 1.14 £2,154 (a)

Internal Clinical Guidelines, 2014
Gallstone Disease
34
Question Comparison
Incremental Length of Stay (days)
Total Length of Stay (days) Total Cost
4b.2 Laparoscopic cholecystectomy versus conservative management
0.00 1.14 £2,146 (b)
4b.3 Inpatient versus day-case Laparoscopic cholecystectomy
1.05 2.19 £2,547
4c.1 Laparoscopic cholecystectomy with preoperative ERCP
1.92 5.91 £4,145
Laparoscopic cholecystectomy with intraoperative ERCP
0.15 3.74 £3,139
Laparoscopic cholecystectomy with postoperative ERCP
2.50 6.09 £4,038
4c.2 ERCP with Laparoscopic cholecystectomy versus ERCP alone
3.34 4.48 £2,146
4c.3 ERCP versus conservative management
0.00 1.42 £1,042
(b) (c)
5a.1 Delayed versus early Laparoscopic cholecystectomy
3.07 4.21 £3,321
5a.2 Delayed versus early Laparoscopic cholecystectomy post ERCP
0.00 1.14 £2,146
(a) LC+IOC contains radiographer costs (b) Conservative management arm costs of 7 days hospital stay not shown (c) Elective ERCP cost shown
2.4.6 Utility Values
Whilst undertaking the systematic review of existing health economic literature (see section 1.4), it became apparent there is little utility data for gallstones that matches the NICE reference case (National Institute for Health and Care Excellence 2013). Existing CUAs utilise four main sources of utility data (Arseneau KO et al. 2001; Bass et al. 1993; Cook et al. 1994; Gregor and Ponich 1996), none of which meet the NICE reference case as none are sourced from patients with gallstones using the EQ-5D tool (see Table 14) and all were assessed to contain very serious limitations.
Table 14: Utility Estimates Used by Existing CUAs
Paper Source Tool
Arseneau et al. (2001) 20 healthy individuals from USA Acute pancreatitis only using standard gamble
Bass et al. (1993) 3 experts (surgeon, radiologist, gastroenterologist)
Rating scale of 15 scenarios
Cook et al. (1994) 96 member of Australian general public
TTO of 7 scenarios
Gregor and Ponich (1996) 15 health professionals familiar with condition (Canada)
Time Trade Off of 4 scenarios
A literature search was undertaken to identify existing gallstones quality of life studies relevant to this guideline that returned 979 unique citations (see Table 15 for title and abstract sift results and appendix D for the search strategy). The papers used a wide variety of tools to assess the quality of life impact of gallstone disease and those using EQ5D and SF36 were prioritised.

Internal Clinical Guidelines, 2014
Gallstone Disease
35
Table 15: Gallstones Quality of Life Literature Search - Articles Retained After Title and Abstract Sift
Quality of Life Measure Number of citations
EQ5D 1
SF36 23
GIQLI 13
Other ratings scales 12
Non-numeric scales or data not available to calculate utility scores 50
The one EQ5D article identified (Ainslie et al. 2003) did not contain sufficient data to be included. The Gastro-Intestinal Quality of Life Index (GIQLI, (Eypasch et al. 1995)) is a topic-specific quality of life tool, but it does not provide a utility score between zero and one and has not been mapped onto tools that doc. Algorithms exist that allow SF36 scores to be mapped onto utility scores between zero and one (Ara and Brazier 2008), but only 8 of the 23 articles identified contained sufficient data from a relevant population to allow SF36 data to be converted to a utility score (see Table 16). The 8 papers covered a variety of follow up periods, but none exceeded 12 months (Bitzer et al. 2008; Burney and Jones 2002; de Reuver et al. 2008; Keus et al. 2008; Moore et al. 2004; Penniston and Nakada 2007; Quintana et al. 2003; Quintana et al. 2005).
Three review papers (Carraro et al. 2011; Korolija et al. 2004; Landman et al. 2012) indicated that SF36 is a valid and recommended quality of life tool and that all main gallstone quality of life papers have been included. Table 16 illustrates that gallstone disease quality of life papers often compare forms of laparoscopic cholecystectomy (eg number and size of incisions) but do not provide data specific to the states within the model. The GDG agreed with the following assumptions that were drawn from studying the quality of life literature:
The quality of life impact of the different forms of laparoscopic cholecystectomy included in the model would be the same
Gallstone symptoms have a marked impact on quality of life
Quality of life following laparoscopic cholecystectomy returns to normal within one 4-6 weeks (the GDG agreed to model for two weeks within the model)
Bile duct injuries have long term quality of life impact. The longest available studies covered six years; the GDG agreed the impact would be lifelong
Additionally, the GDG felt there was no long term quality of life detriment attributable to living without a gallbladder.
Table 16: Summary Characteristics of Included SF36 Based Quality of Life Studies
Paper Sample Size Country Intervention Comparator
Bitzer et al. (2008) 130 Germany Laparoscopic cholecystectomy Prospective study
-
Burney et al. (2002)
140 USA Inpatient laparoscopic cholecystectomy
Outpatient laparoscopic cholecystectomy (not used)
De Reuver et al. (2008)
558 Holland Bile duct injury No bile duct injury
Keus et al. (2008) 257 Holland Laparoscopic cholecystectomy
Small incision cholecystectomy (not used)
c (Lee L et al. 2014) published a first attempt at mapping GIQLI to SF36. The mapping algorithm was based on
small numbers of respondents and was published too late towards the end of the guideline development process to be implemented

Internal Clinical Guidelines, 2014
Gallstone Disease
36
Paper Sample Size Country Intervention Comparator
Moore et al. (2004) 196 USA Bile duct injury No bile duct injury
Penniston and Nakada (2007)
189 USA Urinary stone formers
USA population norms
Quintana et al. (2003)
688 Spain Laparoscopic cholecystectomy
Open cholecystectomy (not used)
Quintana et al. (2005)
509 Spain Laparoscopic cholecystectomy prospective study
-
There are a number of key model states for which quality of life data has not been identified:
o ERCP
o Asymptomatic gallstones
o Specific symptomatic states
Rather than use utility data that does not meet the NICE reference case, the GDG were invited to suggest other diseases that have similar populations (age, gender, life expectancy), symptoms (severity, duration, recurrence) and interventions (impact, recovery) to gallstones. The GDG suggested kidney (renal) stones and appendicitis but noted that appendicitis patients tend to be younger and treated more acutely than gallstones patients.
A literature search was undertaken to identify existing kidney stones, urinary stones and appendicitis quality of life studies that were applicable to this guideline that returned 938 unique citations (see appendix D for the search strategy). One study was found to contain urinary stone quality of life data relevant to the states within this model. (Penniston and Nakada 2007) used SF36 to compare the quality of life of patients with living with urinary stones to US population norms. Their results were converted to a utility score to give a utility decrement of 0.980. The GDG agreed this would approximate the asymptomatic gallstones state.
Utility values for asymptomatic patients living with no stones were taken from UK population norms (Kind et al. 1999). Other utilities were applied as decrements to this value.
Data from the included studies were combined at various time points, using the study sample size (see Table 17). Decrements were calculated relative to the data points for 6+weeks, so the overall decrement to the UK population norms for the symptomatic states is 0.874 (0.742/0.849).
Table 17: Utility Decrements For Gallstone Patients
State Time Period Decrement Number of studies
Symptomatic (all symptoms)
Preoperative 0.742 5
In hospital 1 day 0.729 1
Laparoscopic cholecystectomy
2 weeks 0.763 2
Recovered / baseline 6 weeks and over 0.849 3
Arm specific laparoscopic cholecystectomy decrements were calculated based on the same length of stay data as used to calculate costs. The 1 day utility decrement was applied for the length of stay, with the 2 week decrement applied for the remainder of the two week cycle. In the absence of any data, the GDG assumed ERCP would incur a utility decrement half way between laparoscopic cholecystectomy and recovered. Receiving an ERCP and laparoscopic cholecystectomy in the same hospital admission was assumed to incur an additional decrement of 0.95.

Internal Clinical Guidelines, 2014
Gallstone Disease
37
The appropriate utility decrement was applied for patients who required an extra ERCP to clear their bile duct or to deal with a bile leak.
Patients who incur a bile duct injury have a utility decrement of 0.905 for the remainder of their lives, based on the weighted average of two studies comparing patients with and without bile duct injuries (de Reuver et al. 2008; Moore et al. 2004)
Based on the same NICE technology appraisal as for costs (National Institute for Health and Care Excellence 2010), the utility decrement associated with gallbladder cancer was assumed to be 0.7.
2.5 Model Assumptions
The health economic model of interventions to manage gallstones relies on a number of assumptions. These assumptions tend to arise for two reasons – either to reduce the model complexity or because no data point could be found in the evidence base. The assumptions were discussed with and agreed by the GDG and are listed in Table 18– the most important assumptions will be considered in the discussion (section 3.4). Where possible, a range of values for assumed inputs were tested in the sensitivity analyses.

Internal Clinical Guidelines, 2014
Gallstone Disease
38
Table 18: Assumptions Made in the Gallstones Health Economic Model
Area Assumption
Structure and inputs
Symptoms are mutually exclusive and specific to the underlying pathology (see Table 5)
Known CBDS are cleared by a maximum of 2 ERCPs conducted within the same 2 week cycle
Gallbladder stones are not removed without a laparoscopic cholecystectomy
Gallbladder cancer risk only applies to those in conservative management arms (as those in delayed laparoscopic cholecystectomy will have their gallbladder removed in the future)
Laparoscopic cholecystectomies do not routinely investigate the common bile duct for stones
Costs Symptomatic and asymptomatic states incur no costs
The fixed costs of elective and non-elective surgery are the same
The fixed costs of laparoscopic cholecystectomy with intraoperative cholangiography and laparoscopic cholecystectomy with bile duct exploration are the same
Interventions are assumed to be elective or non-elective (see section 2.4.5)
Intraoperative cholangiography assumed to require 15 minutes of radiographer time
Laparoscopic to open cholecystectomy conversion costs the same irrespective of laparoscopic cholecystectomy intervention
Lengths of stay for a laparoscopic cholecystectomy and ERCP in the same hospital admission and for an initial hospital stay for conservative management are assumed
Utilities All symptoms incur the same utility decrement
Utility decrements are the same for gallstones and CBDS
Post laparoscopic cholecystectomy symptoms (caused by remaining CBDS) have the same utility impact as pre laparoscopic cholecystectomy symptoms
2.6 Sensitivity Analyses
Sensitivity analyses were conducted to explore the various areas of uncertainty and their impact on the model. One-way sensitivity analyses (using point estimates of uncertainty only) were conducted to establish which model parameters have the greatest impact on the cost–utility results. Probabilistic sensitivity analyses were conducted using appropriate statistical distributions to vary all parameters simultaneously over 1,000 simulations. Sensitivity analyses parameters and distributions are listed in Table 19.

39 Internal Clinical Guidelines, 2014
Gallstone Disease
Table 19: Gallstone Model Parameters
Parameter Value (95% confidence interval) Reference Distribution and Parameters
Discount rate:
Costs 3.5% NICE (2013)
Effects 3.5% NICE (2013)
Sex (proportion male) 0.25 GDG assumption
Mean age of cohort at start 50 GDG assumption
CBDS found or Remaining Unseen Stones (initials)
Ln(odds) with LC -3.151 (-3.584, -2.719) Meta Analysis (21 RCTs) Normal: μ=-3.151; σ=0.221
Ln(Odds) with Pre-ERCP 1.184 (0.726, 1.642) Meta Analysis (40 RCT arms) Normal: μ=1.184; σ=0.234
Symptoms at baseline - CBDS
Ln(Odds) Symptoms at baseline
Acute Cholecystitis -4.500 (-6.471, -2.529) Noble et al Normal: μ=-4.500; σ=1.006
Biliary Colic 1.242 (-0.115, 2.599) Meta analysis (7 RCTs) Normal: μ=1.242; σ=0.692
Cholangitis -1.691 (-3.239, -0.143) Meta analysis (3 RCTs) Normal: μ=-1.691; σ=0.790
Jaundice -0.569 (-1.307, 0.168) Meta analysis (8 RCTs) Normal: μ=-0.569; σ=0.376
Pancreatitis -1.677 (-2.352, -1.002) Meta analysis (6 RCTs) Normal: μ=-1.677; σ=0.344
Probability of CBDS Symptoms at baseline
Sepsis 0.250 (0.055, 0.530) GDG Assumption (a) Beta: α=2.750; β=8.250
Symptoms at baseline – GS
Ln(Odds) Symptoms
Acute Cholecystitis -2.778 (-3.231, -2.326) Meta analysis (2 RCTs) Normal: μ=-2.778; σ=0.231
Biliary Colic -2.266 (-3.330, -1.203) Meta analysis (3 RCTs) Normal: μ=-2.266; σ=0.543

40 Internal Clinical Guidelines, 2014
Gallstone Disease
Parameter Value (95% confidence interval) Reference Distribution and Parameters
Symptoms during delay/Conservative Management - CBDS
Ln(rate per day) Symptoms during delay
Acute Cholecystitis -4.990 (-6.535, -3.444) Meta analysis (6 RCTs) Normal: μ=-4.990; σ=0.789
Biliary Colic -6.647 (-9.597, -3.697) Meta analysis (3 RCTs) Normal: μ=-6.647; σ=1.505
Cholangitis -6.804 (-8.878, -4.730) Meta analysis (8 RCTs) Normal: μ=-6.804; σ=1.058
Jaundice -6.054 (-8.002, -4.107) Meta analysis (4 RCTs) Normal: μ=-6.054; σ=0.994
Pancreatitis -8.786 (-10.668, -6.904) Meta analysis (7 RCTs) Normal: μ=-8.786; σ=0.960
Sepsis -3.474 (-3.961, -2.987) Meta analysis (4 RCTs) Normal: μ=-3.474; σ=0.248
Symptoms during delay/Conservative Management - gallstones
Ln(rate per day) Symptoms during delay
Acute Cholecystitis -8.133 (-10.334, -5.932) Meta analysis (4 RCTs) Normal: μ=-8.133; σ=1.123
Biliary Colic -9.250 (-10.634, -7.866) Meta analysis (2 RCTs) Normal: μ=-9.250; σ=0.706
Pancreatitis Mortality
All pancreatitis 0.00008 (0.00003, 0.00020) Chiang et al Lognormal: μ=-9.40911; σ=0.44721
Gallbladder Cancer
Incidence rate (1 death, 873 person years) 0.0011 (0.0002, 0.0081) Attili et al (Q3) Lognormal: μ=-6.7719; σ=1.0000
Mortality Rate (5 year survival 2002-2006) 0.878 (0.862, 0.894) NW Cancer Registry Beta: α=1410.376; β=195.975
Laparoscopic Cholecystectomy Consequences
Bile duct injury sustained (BDI)
Ln(Odds) with LC -4.503 (-5.344, -3.661) Meta Analysis (8 RCTs) Normal: μ=-4.503; σ=0.429
Ln(OR) LC+IOC -v- LC 0.069 (-1.691, 1.830) Meta Analysis (3 RCTs) Normal: μ=0.069; σ=0.898
Ln(OR) LC(DC) -v- LC(IP) 1.099 (-2.124, 4.322) Johansson Normal: μ=1.099; σ=1.644
Ln(OR) LC(early) -v- LC -0.043 (-1.813, 1.728) Meta Analysis (4 RCTs) Normal: μ=-0.043; σ=0.903

41 Internal Clinical Guidelines, 2014
Gallstone Disease
Parameter Value (95% confidence interval) Reference Distribution and Parameters
Bile leak (requires ERCP)
Ln(Odds) with LC -3.635 (-4.362, -2.908) Meta Analysis (7 RCTs) Normal: μ=-3.635; σ=0.371
Ln(OR) Conservative Management -v- LC 0.258 (-1.264, 1.780) Verthus et al Normal: μ=0.258; σ=0.777
Ln(OR) LC(early) -v- LC 0.910 (-0.374, 2.194) Meta Analysis (6 RCTs) Normal: μ=0.910; σ=0.655
Extra ERCP Required
Ln(OR) early LC -v- LC (post-ERCP) -1.161 (-4.387, 2.064) Reinders et al Normal: μ=-1.161; σ=1.646
LC Required (Conservative Management /Delay only)
Ln(Rate per day) with Conservative Management
-6.910 (-8.813, -5.008) Meta Analysis (5 RCTs) Normal: μ=-6.910; σ=0.971
LC to OC conversion
Ln(Odds) with LC -2.423 (-3.121, -1.725) Meta Analysis (14 RCTs) Normal: μ=-2.423; σ=0.356
Ln(OR) LC+IOC -v- LC 0.895 (-2.728, 4.518) Meta Analysis (2 RCTs) Normal: μ=0.895; σ=1.848
Ln(OR) Conservative Management -v- LC -0.030 (-1.443, 1.383) Verthus et al Normal: μ=-0.030; σ=0.721
Ln(OR) DC -v- IP -0.010 (-1.672, 1.652) Meta Analysis (3 RCTs) Normal: μ=-0.010; σ=0.848
Ln(OR) early LC -v- LC -0.224 (-0.638, 0.190) Meta Analysis (7 RCTs) Normal: μ=-0.224; σ=0.211
Ln(OR) early LC -v- LC (post-ERCP) -0.735 (-2.479, 1.009) Reinders et al Normal: μ=-0.735; σ=0.890
Remaining Unseen CBDS
Ln(Odds) with LC+IOC -1.553 (-2.602, -0.505) Meta Analysis (3 RCTs) Normal: μ=-1.553; σ=0.535
Ln(Odds) early LC -v- LC (post-ERCP) -1.609 (-4.708, 1.490) Lo et al Normal: μ=-1.609; σ=1.581
LC Operative mortality
Ln(Odds) with LC+IOC -1.553 (-2.602, -0.505) Meta Analysis (3 RCTs) Normal: μ=-1.553; σ=0.535
Ln(Odds) early LC -v- LC (post-ERCP) -1.609 (-4.708, 1.490) Lo et al Normal: μ=-1.609; σ=1.581
LC 0.0008 (0.0002, 0.0019) Dunn et al Beta: α=3.0000; β=3801.0000

42 Internal Clinical Guidelines, 2014
Gallstone Disease
Parameter Value (95% confidence interval) Reference Distribution and Parameters
ERCP Consequences
Bile leak (requires ERCP)
Ln(Odds) with Pre-ERCP -3.900 (-4.678, -3.122) Meta Analysis (7 RCTs) Normal: μ=-3.900; σ=0.397
Ln(OR) BDE -v- Pre-ERCP 0.924 (-0.256, 2.104) Meta Analysis (5 RCTs) Normal: μ=0.924; σ=0.602
Ln(OR) intra-ERCP -v- pre-ERCP -1.089 (-4.301, 2.124) El Geide (a) et al Normal: μ=-1.089; σ=1.639
Ln(OR) intra-ERCP -v- BDE -0.963 (-3.729, 1.803) Meta Analysis (2 RCTs) Normal: μ=-0.963; σ=1.411
Ln(OR) post-ERCP -v- BDE 0.647 (-3.172, 4.467) Meta Analysis (2 RCTs) Normal: μ=0.647; σ=1.949
Indirect Ln(OR) post-ERCP -v- Pre-ERCP 1.572 (-2.425, 5.569) Meta Analysis (2 RCTs) Normal: μ=1.572; σ=2.039
Ln(OR) with Conservative Management -0.019 (-2.817, 2.779) Vracko et al Normal: μ=-0.019; σ=1.428
ERCP needed (Conservative Management Only)
Ln(Rate per Day) with Conservative Management
-4.379 (-5.104, -3.654) Meta Analysis (7 RCTs) Normal: μ=-4.379; σ=0.370
Extra ERCP Required
Ln(Odds) with pre-ERCP -2.595 (-3.508, -1.681) Meta Analysis (9 RCTs) Normal: μ=-2.595; σ=0.466
Ln(OR) BDE -v- pre-ERCP -0.010 (-1.945, 1.925) Meta Analysis (6 RCTs) Normal: μ=-0.010; σ=0.987
Ln(OR) intra-ERCP -v- pre-ERCP -1.956 (-4.933, 1.020) El Geide (a) et al Normal: μ=-1.956; σ=1.519
Ln(OR) intra-ERCP -v- BDE -0.484 (-2.874, 1.906) El Geide (b) et al Normal: μ=-0.484; σ=1.219
Ln(OR) post-ERCP -v- BDE 0.724 (-2.098, 3.547) El Geide (b) et al Normal: μ=0.724; σ=1.440
Indirect Ln(OR) post-ERCP -v- pre-ERCP 0.714 (-2.708, 4.136) El Geide (b) et al Normal: μ=0.714; σ=1.746
Ln(OR) ERCP+LC -v- ERCP -3.105 (-5.132, -1.079) Meta Analysis (2 RCTs) Normal: μ=-3.105; σ=1.034
LC Required
Ln(Rate per day) with ERCP -4.334 (-5.365, -3.303) Meta Analysis (6 RCTs) Normal: μ=-4.334; σ=0.526
Ln(IRR) Conservative Management -v- ERCP -0.525 (-1.092, 0.043) Meta Analysis (4 RCTs) Normal: μ=-0.525; σ=0.290
LC to OC Conversion
Ln(Odds) with ERCP -2.773 (-3.469, -2.077) Meta Analysis (8 RCTs) Normal: μ=-2.773; σ=0.355
Ln(OR) BDE -v- pre-ERCP 0.591 (-0.099, 1.282) Meta Analysis (5 RCTs) Normal: μ=0.591; σ=0.352

43 Internal Clinical Guidelines, 2014
Gallstone Disease
Parameter Value (95% confidence interval) Reference Distribution and Parameters
Ln(OR) intra-ERCP -v- pre-ERCP -0.203 (-1.547, 1.141) El Geide (a) et al Normal: μ=-0.203; σ=0.686
Ln(OR) intra-ERCP -v- BDE -0.318 (-1.048, 0.412) Meta Analysis (2 RCTs) Normal: μ=-0.318; σ=0.372
Ln(OR) post-ERCP -v- BDE -1.092 (-3.151, 0.968) Meta Analysis (2 RCTs) Normal: μ=-1.092; σ=1.051
Indirect Ln(OR) post-ERCP -v- pre-ERCP -0.501 (-2.960, 1.959) Meta Analysis (2 RCTs) Normal: μ=-0.501; σ=1.255
Ln(OR) ERCP+LC -v- ERCP 0.510 (-0.730, 1.749) Meta Analysis (2 RCTs) Normal: μ=0.510; σ=0.632
New CBDS
Ln(Rate per day) with ERCP -9.658 (-12.677, -6.638) Meta Analysis (3 RCTs) Normal: μ=-9.658; σ=1.541
Ln(IRR) ERCP+LC -v- ERCP -3.207 (-6.029, -0.384) Lau et al Normal: μ=-3.207; σ=1.440
Ln(IRR) LC post ERCP delayed -v- early -0.042 (-2.813, 2.730) Reinders et al Normal: μ=-0.042; σ=1.414
Remaining Unseen CBDS
Ln(Odds) with ERCP -2.967 (-3.976, -1.958) Meta Analysis (6 trial arms) Normal: μ=-2.967; σ=0.515
Ln(OR) with BDE -0.424 (-2.547, 1.700) Meta Analysis (3 RCTs) Normal: μ=-0.424; σ=1.083
Ln(OR) intra-ERCP -v- BDE -2.168 (-5.103, 0.766) Meta Analysis (2 RCTs) Normal: μ=-2.168; σ=1.497
Indirect Ln(OR) intra-ERCP -v- Pre-ERCP -2.592 (-6.214, 1.030) Meta Analysis (2 RCTs) Normal: μ=-2.592; σ=1.848
Ln(OR) with ERCP+LC -3.431 (-6.262, -0.599) Lau et al Normal: μ=-3.431; σ=1.445
Ln(OR) with Conservative Management -0.808 (-3.095, 1.479) Meta Analysis (2 RCTs) Normal: μ=-0.808; σ=1.167
ERCP Operative Mortality
Ln(Odds) with ERCP (literature) -5.356 (-5.795, -4.916) Williams et al Normal: μ=-5.356; σ=0.224
Costs (c)
Laparoscopic Cholecystectomy
Fixed Cost £1,708 (£1,105, £2,440) NHS Reference Costs Gamma: α=£25; β=£68
Bed day Cost £383 (£248, £547) NHS Reference Costs Gamma: α=£25; β=£15
Average Length of Stay
Standard laparoscopic cholecystectomy
Elective 1.14 (0.76, 1.65) NHS Reference Costs Lognormal: μ=0.11; σ=0.20

44 Internal Clinical Guidelines, 2014
Gallstone Disease
Parameter Value (95% confidence interval) Reference Distribution and Parameters
Non-Elective 3.15 (2.10, 4.55) NHS Reference Costs Lognormal: μ=1.13; σ=0.20
Complicated LC (LC to OC conversion)
Elective 1.88 (1.25, 2.72) NHS Reference Costs Lognormal: μ=0.61; σ=0.20
Non-Elective 6.03 (4.01, 8.71) NHS Reference Costs Lognormal: μ=1.78; σ=0.20
LC+BDE
Elective 3.59 (2.39, 5.19) NHS Reference Costs Lognormal: μ=1.26; σ=0.20
Non-Elective 7.16 (4.76, 10.35) NHS Reference Costs Lognormal: μ=1.95; σ=0.20
ERCP
Fixed Cost £610 (£394, £871) NHS Reference Costs Gamma: α=£25; β=£24
Bed day Cost £305 (£197, £435) NHS Reference Costs Gamma: α=£25; β=£12
Average Length of Stay
Elective 1.42 (0.81, 2.48) NHS Reference Costs Lognormal: μ=0.35; σ=0.28
Non-Elective 6.11 (0.56, 67.09) NHS Reference Costs Lognormal: μ=1.81; σ=1.22
Length of stay - intervention data
Additional Length of Stay for LC+IOC 0.00 (-1.96, 1.96) Soper et al Normal: μ=0.00; σ=1.00
Extra radiographer time (hours) 0.25 (0.13, 0.45) GDG assumption Triangular: min=0.08; mode=0.25; max=0.50
Hourly radiographer cost £33 PSSRU (2012)
Additional Length of Stay for Conservative Management
0.00 GDG assumption
DC Length of Stay (RCT reported) 1.08 (1.06,1.24) Johansson et al Beta: α=4.00; β=48.00
IP Length of Stay (RCT reported) 2.13 (2.08,2.36) Johansson et al Beta: α=6.00; β=42.00
Additional Length of Stay for IP 1.05 Calculation
Additional Length of Stay for pre-ERCP 0.75 (-0.88, 2.38) Network Meta Analysis (6 RCTs)
Normal: μ=0.75; σ=0.83
Additional Length of Stay for intra-ERCP -0.68 (-3.21, 1.85) Network Meta Analysis (6 RCTs)
Normal: μ=-0.68; σ=1.29

45 Internal Clinical Guidelines, 2014
Gallstone Disease
Parameter Value (95% confidence interval) Reference Distribution and Parameters
Additional Length of Stay for post-ERCP 2.53 (-1.40, 6.46) Network Meta Analysis (6 RCTs)
Normal: μ=2.53; σ=2.01
Additional Length of Stay for ERCP+LC 3.34 (1.66, 5.02) Meta Analysis (2 RCTs) Normal: μ=3.34; σ=0.86
Additional Length of Stay for Conservative Management
0.00
Additional Length of Stay for Delayed LC 3.07 (2.46, 3.68) Meta Analysis (6 RCTs) Normal: μ=3.07; σ=0.31
Additional Length of Stay for delayed LC post ERCP
0.00 (-1.96, 1.96) Reinders et al Normal: μ=0.00; σ=1.00
LC+ERCP in same admission (assume elective)
Length of stay 5.0 (3.7, 21.6) GDG assumption Triangular: min=2.5; mode=5.0; max=25.0
Conservative Management
LC Conservative Management length of stay 7.0 (5.0, 24.4) GDG assumption Triangular: min=3.5; mode=7.0; max=28.0
ERCP Conservative Management length of stay
7.0 (5.0, 24.4) GDG assumption Triangular: min=3.5; mode=7.0; max=28.0
Gallbladder Cancer
Cost of ‘best supportive care’ per year (2008) £9,963 (£6,448, £14,231) NICE TA189 Gamma: α=£025; β=£399
PSSRU inflator 1.06 PSSRU
Utilities
Utility values (raw)
Preoperative (symptomatic) 0.742 (0.594,0.890) Meta analysis (5 RCTs) Lognormal: μ=-1.355; σ=0.148 (b)
1 day (in hospital) 0.729 (0.583,0.875) Keus et al Lognormal: μ=-1.307; σ=0.146 (b)
2 weeks (LC) 0.763 (0.611,0.916) Meta analysis (2 RCTs) Lognormal: μ=-1.440; σ=0.153 (b)
6 weeks+ (recovered) 0.849 (0.680,1.000) Meta analysis (3 RCTs) Lognormal: μ=-1.893; σ=0.170 (b)
ERCP decrement (between LC and Recovered)
0.899 (0.799,0.899) GDG Assumption Triangular: min=0.799; mode=0.899; max=0.899

46 Internal Clinical Guidelines, 2014
Gallstone Disease
Parameter Value (95% confidence interval) Reference Distribution and Parameters
Utility decrements (multiplicative, based on length of hospital stay)
Asymptomatic (living with stones) 0.980 (0.784,1.000) Penniston et al Lognormal: μ=-3.888; σ=0.196
LC+ERCP - assumed decrement to LC 0.950 (0.869, 0.986) GDG assumption Triangular: min=0.850; mode=0.950; max=1.000
BDI (long term) 0.905 (0.724,1.000) Meta analysis (2 RCTs) Lognormal: μ=-2.356; σ=0.181
Gallbladder Cancer 0.700 (0.560,0.840) NICE TA189 Lognormal: μ=-1.204; σ=0.140
Utility Population norms
Men
age < 25 0.94 (0.92, 0.96) Kind et al Beta: α=470.31; β=30.02 (b)
24 < age < 35 0.93 (0.91, 0.95) Kind et al Beta: α=779.51; β=58.67 (b)
34 < age < 45 0.91 (0.89, 0.93) Kind et al Beta: α=659.28; β=65.20 (b)
44 < age < 55 0.84 (0.80, 0.87) Kind et al Beta: α=341.41; β=65.03 (b)
54 < age < 65 0.78 (0.74, 0.82) Kind et al Beta: α=333.84; β=94.16 (b)
64 < age < 75 0.78 (0.74, 0.82) Kind et al Beta: α=388.47; β=109.57 (b)
74 < age 0.75 (0.70, 0.80) Kind et al Beta: α=192.97; β=64.32 (b)
Women
age < 25 0.94 (0.92, 0.96) Kind et al Beta: α=647.03; β=41.30 (b)
24 < age < 35 0.93 (0.92, 0.94) Kind et al Beta: α=1137.28; β=85.60 (b)
34 < age < 45 0.91 (0.89, 0.93) Kind et al Beta: α=1009.37; β=99.83 (b)
44 < age < 55 0.85 (0.82, 0.88) Kind et al Beta: α=546.15; β=96.38 (b)
54 < age < 65 0.81 (0.78, 0.84) Kind et al Beta: α=530.28; β=124.39 (b)
64 < age < 75 0.78 (0.75, 0.81) Kind et al Beta: α=556.03; β=156.83 (b)
74 < age 0.71 (0.67, 0.75) Kind et al Beta: α=412.39; β=168.44 (b)
(a) No evidence available in included studies (b) Monotonicity preserved between values in these categories in probabilistic analyses by using same random number seed for each

47 Internal Clinical Guidelines, 2014
Gallstone Disease
(c) For costs, reported confidence intervals reflect the 95% confidence interval of the distribution and parameters given (that is, the range over which 95% of values are drawn in Monte-Carlo sampling). Due to distributional assumptions, the confidence interval as shown may not precisely match the confidence interval reported in the underlying data and used for the one-way sensitivity analysis.

Gallstone Disease
Internal Clinical Guidelines, 2014 48
3 Results and conclusions
3.1 Cost effectiveness results for Review Question 4b: managing symptomatic gallbladder stones
3.1.1 Laparoscopic cholecystectomy with intraoperative cholangiography versus laparoscopic cholecystectomy alone (Q4b.1)
Laparoscopic cholecystectomy with intraoperative cholangiography is more costly and produces fewer QALYs than laparoscopic cholecystectomy alone and is therefore said to be dominated (see Table 20).
The increased costs are driven by higher laparoscopic-to-open cholecystectomy conversion rates in the IOC arm than in the laparoscopic cholecystectomy alone arm, whilst the QALY differences are small over a patient lifetime.
Table 20: Cost effectiveness results for laparoscopic cholecystectomy with intraoperative cholangiography versus laparoscopic cholecystectomy alone (Q4b.1)
Strategy
Discounted Incremental
ICER Costs QALYs Costs QALYs
Laparoscopic cholecystectomy £2475.10 16.008
Laparoscopic cholecystectomy with IOC £2612.50 15.997 £137.41 −0.010 Dominated
(a) Results represent means of 1000 probabilistic model runs
One-way sensitivity analysis (see Figure 11) indicates the result is sensitive to:
rate of bile duct injury in the intraoperative cholangiography arm
rate of laparoscopic-to-open cholecystectomy conversion in the intraoperative cholangiography arm
additional length of stay with intraoperative cholangiography (set to zero in the base case)
length of stay required to perform laparoscopic cholecystectomy and ERCP in the same hospital admission (if intraoperative cholangiography finds CBDS, set to 5 days in base case)
The first 2 parameters were subject to wide confidence intervals in the clinical evidence, and were not statistically significantly different to the rates for laparoscopic cholecystectomy (see Table 19).
In probabilistic sensitivity analyses (PSA) over 1000 simulations, laparoscopic cholecystectomy alone has a 67.4% chance of being cost effective at a threshold of £20,000 per QALY (see Figure 12). This remains fairly constant over a range of cost-per-QALY thresholds (see Figure 13).

Gallstone Disease
Internal Clinical Guidelines, 2014 49
Figure 11: Tornado plot of one-way sensitivity analysis for laparoscopic cholecystectomy with intraoperative cholangiography versus laparoscopic cholecystectomy alone
-£500
£0
£500
£1000
£1500
£2000
Average LoS: LC+BDE Elective: 2.870; 4.306
Cost: laparoscopic cholecystectomy fixed: £2050; £1366
Ln(Odds) bile leak sustained with LC: -4.362; -2.908
Average LoS: ERCP Elective: 1.136; 1.705
Per-cycle prob. develop with CBDS: cholangitis: 0.002; 0.117
Per-cycle prob. LC operative mortality: 0.0%; 0.2%
Per-cycle prob. develop with CBDS: jaundice: 0.005; 0.206
Per-cycle prob. develop with CBDS: pancreatitis: 0.014; 0.000
Per-cycle prob. develop with CBDS: sepsis: 0.235; 0.508
Cost: ERCP fixed: £488; £731
Ln(Odds) extra ERCP required with Pre-ERCP: -3.508; -1.681
Sex (proportion male): 100%; 0%
QoL: LC+ERCP - assumed decrement to LC: 0.950; 0.850
QoL: 2 weeks (LC): 0.849; 0.611
QoL: 1 day (in hospital): 0.583; 0.849
Ln(odds) occult CBDS in GS: -3.584; -2.719
QoL: Pre-operative (symptomatic): 0.594; 0.849
QoL: Asymptomatic (living with stones): 0.784; 1.000
Ln(Odds) oprerative mortality with ERCP (lit): -5.795; -4.916
QoL: 6 weeks+ (recovered): 1.000; 0.680
QoL: ERCP decrement (between LC and Recovered): 0.899; 0.663
Per-cycle prob. death with pancreatitis: 0.0%; 2.2%
Cost: LC+IOC extra radiographer time (hrs): 0.083; 0.500
Ln(Odds) Remaining Unseen CBDS with ERCP: -1.958; -3.976
Cost: ERCP bed day: £365; £244
Average LoS: ERCP Non-Elective: 7.334; 4.889
Average LoS: Standard LC Elective: 1.372; 0.915
Ln(Odds) LC to OC conversion required with LC: -3.121; -1.725
Average LoS: Complicated LC (LC to OC conversion) Elective: 1.507; 2.260
Cost: laparoscopic cholecystectomy bed day: £306; £459
Mean age of cohort at start: 80; 20
Ln(Odds) Remaining Unseen CBDS with LC+IOC: -2.602; -0.505
Ln(Odds) bile duct injury sustained with LC: -5.344; -3.661
QoL: BDI (long term): 1.000; 0.724
Ln(Odds Ratio) LC to OC conversion required with LC-v-LC+IOC: -2.728; 4.518
Costs: LC+ERCP in same admission length of stay: 2.5; 25.0
Additional LoS: LC-v-LC+IOC: -1.960; 1.960
Ln(Odds Ratio) bile duct injury sustained with LC-v-LC+IOC: -1.691; 1.830
Incremental NMB @ £20K/QALY
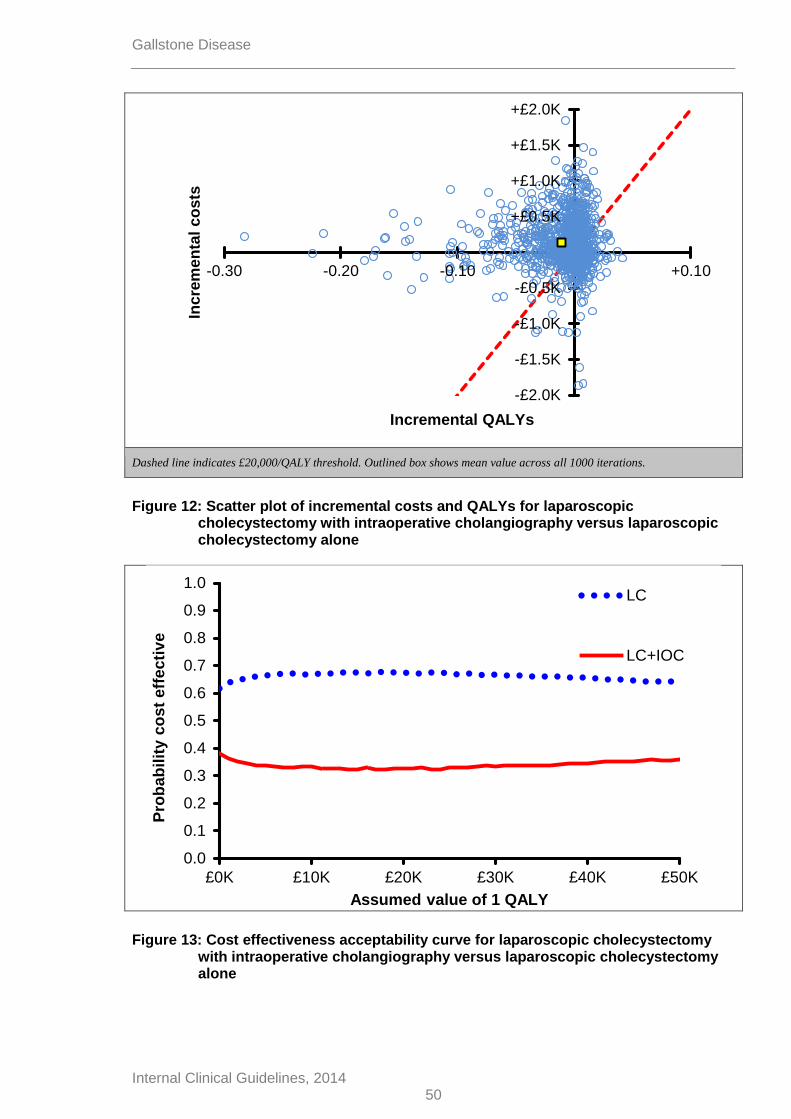
Gallstone Disease
Internal Clinical Guidelines, 2014 50
Dashed line indicates £20,000/QALY threshold. Outlined box shows mean value across all 1000 iterations.
Figure 12: Scatter plot of incremental costs and QALYs for laparoscopic cholecystectomy with intraoperative cholangiography versus laparoscopic cholecystectomy alone
Figure 13: Cost effectiveness acceptability curve for laparoscopic cholecystectomy with intraoperative cholangiography versus laparoscopic cholecystectomy alone
-£2.0K
-£1.5K
-£1.0K
-£0.5K
+£0.5K
+£1.0K
+£1.5K
+£2.0K
-0.30 -0.20 -0.10 +0.10
Incre
men
tal
co
sts
Incremental QALYs
0.0
0.1
0.2
0.3
0.4
0.5
0.6
0.7
0.8
0.9
1.0
£0K £10K £20K £30K £40K £50K
Pro
bab
ilit
y c
ost
eff
ec
tiv
e
Assumed value of 1 QALY
LC
LC+IOC

Gallstone Disease
Internal Clinical Guidelines, 2014 51
3.1.2 Laparoscopic cholecystectomy versus conservative management (Q4b.2)
Conservative management is more costly and produces fewer QALYs than laparoscopic cholecystectomy and is therefore said to be dominated (see Table 21).
In the conservative management arm, patients spend most of their lives without having their gallbladder removed – 93% of which is spent in the asymptomatic gallstones or gallstones and CBDS states. If symptomatic CBDS occur, patients receive on average 0.75 additional ERCPs. It appears that not removing the gallbladder increases the need for and exposure to further ERCPs and also gallbladder cancer. Modelled differences are likely to be exaggerated because the model considers a binary choice between laparoscopic cholecystectomy and conservative management that is unlikely to occur in clinical practice.
Table 21: Cost effectiveness results for laparoscopic cholecystectomy versus conservative management (Q4b.2)
Strategy
Discounted Incremental
ICER Costs QALYs Costs QALYs
Laparoscopic cholecystectomy £2516.33 16.009
Conservative Management £11,028.41 15.323 £8512.07 -0.686 Dominated
(a) Results represent means of 1000 probabilistic model runs
One-way sensitivity analysis (see Figure 14) indicates that the result is sensitive to:
Quality of life decrement for living with asymptomatic gallstones or gallstones and CBDS
Gallbladder cancer incidence
Mean age at start of model
It can be seen that the model is sensitive to parameters linked to leaving the gallbladder in situ for a number of years. However, it should be noted that there are no cases where laparoscopic cholecystectomy is not cost effective compared with conservative management. Laparoscopic cholecystectomy gains more QALYs than conservative management in all simulations and is less costly in 99.5% of simulations (see Figure 15). In probabilistic sensitivity analyses (PSA), over 1000 simulations laparoscopic cholecystectomy has a 100% chance of being cost effective at a threshold of £20,000 per QALY and all other thresholds tested (see Figure 16).

Gallstone Disease
Internal Clinical Guidelines, 2014 52
Figure 14: Tornado plot of one-way sensitivity analysis for laparoscopic cholecystectomy versus conservative management
£0
£10000
£20000
£30000
£40000
£50000
£60000
£70000
£80000
Ln (rate per day) LC required with ERCP: -5.365; -3.303
Ln (IRR) LC required with Cons Mgt: -1.092; 0.043
Average LoS: LC+BDE Elective: 2.870; 4.306
Additional LoS: LC-v-Cons Mgt: 0.000; 0.000
Costs: ERCP cons mgt length of stay: 3.5; 28.0
GS: prob. acute cholecystitis at baseline: 0.089; 0.038
GS: prob. biliary colic at baseline: 0.035; 0.231
CBDS: prob. jaundice at baseline: 0.213; 0.542
CBDS: prob. cholangitis at baseline: 0.038; 0.464
CBDS: prob. acute cholecystitis at baseline: 0.074; 0.002
CBDS: prob. sepsis at baseline: 0.055; 0.530
CBDS: prob. biliary colic at baseline: 0.931; 0.471
CBDS: prob. pancreatitis at baseline: 0.087; 0.268
Ln(odds) occult CBDS in GS: -3.584; -2.719
Ln(Odds Ratio) LC to OC conversion required with LC-v-Cons Mgt: -1.443;…
GB cancer: 5-yr mortality: 0.861; 0.893
Average LoS: ERCP Elective: 1.136; 1.705
Per-cycle prob. develop with CBDS: cholangitis: 0.002; 0.117
Per-cycle prob. develop with CBDS: pancreatitis: 0.000; 0.014
Average LoS: Complicated LC (LC to OC conversion) Elective: 2.260; 1.507
Per-cycle prob. develop with CBDS: jaundice: 0.005; 0.206
Ln(Odds Ratio) bile leak sustained with LC-v-Cons Mgt: -1.264; 1.780
Ln(Odds) LC to OC conversion required with LC: -1.725; -3.121
Per-cycle prob. develop with GS: biliary colic: 0.005; 0.000
Per-cycle prob. develop with CBDS: biliary colic: 0.294; 0.001
Per-cycle prob. develop with CBDS: acute cholecystitis: 0.362; 0.020
Per-cycle prob. death with pancreatitis: 0.0%; 2.2%
Per-cycle prob. develop with CBDS: sepsis: 0.235; 0.508
Cost: ERCP fixed: £488; £731
QoL: ERCP decrement (between LC and Recovered): 0.663; 0.899
Ln(Odds) extra ERCP required with Pre-ERCP: -3.508; -1.681
Ln (rate per day) ERCP required with Cons Mgt: -3.654; -5.104
QoL: 1 day (in hospital): 0.849; 0.583
QoL: 2 weeks (LC): 0.611; 0.849
Ln(Odds) bile leak sustained with LC: -2.908; -4.362
Average LoS: Standard LC Elective: 1.372; 0.915
Ln(Odds) Remaining Unseen CBDS with ERCP: -3.976; -1.958
Costs: GB cancer annual cost: £7970; £11956
QoL: Gallbladder Cancer: 0.840; 0.560
Per-cycle prob. develop with GS: acute cholecystitis: 0.037; 0.000
Average LoS: ERCP Non-Elective: 4.889; 7.334
Cost: ERCP bed day: £244; £365
Ln(Odds) oprerative mortality with ERCP (lit): -5.795; -4.916
Per-cycle prob. LC operative mortality: 0.2%; 0.0%
Ln(Odds) bile duct injury sustained with LC: -3.661; -5.344
Cost: laparoscopic cholecystectomy fixed: £2050; £1366
Cost: laparoscopic cholecystectomy bed day: £306; £459
QoL: BDI (long term): 0.724; 1.000
Sex (proportion male): 100%; 0%
QoL: Pre-operative (symptomatic): 0.849; 0.594
QoL: 6 weeks+ (recovered): 0.680; 1.000
Ln(Odds) LC required with Cons Mgt: -5.008; -8.813
Costs: LC cons mgt length of stay: 3.5; 28.0
Mean age of cohort at start: 80; 20
GB cancer: incidence per pt-yr: 0.000; 0.008
QoL: Asymptomatic (living with stones): 1.000; 0.784
Incremental NMB @ £20K/QALY
Inc. NMB = £0
Base case

Gallstone Disease
Internal Clinical Guidelines, 2014 53
Dashed line indicates £20,000/QALY threshold. Outlined box shows mean value across all 1000 iterations. Outlined box
shows mean value across all 1000 iterations. Plot shows 97.5% of simulations, missing those where incremental costs were
greater than £35,000
Figure 15: Scatter plot of incremental costs and QALYs for laparoscopic cholecystectomy versus conservative management
Figure 16: Cost effectiveness acceptability curve for laparoscopic cholecystectomy versus conservative management
-£1.0K
+£4.0K
+£9.0K
+£14.0K
+£19.0K
+£24.0K
+£29.0K
+£34.0K
-5.00 -4.00 -3.00 -2.00 -1.00 +1.00
Incre
men
tal
co
sts
Incremental QALYs
0.0
0.1
0.2
0.3
0.4
0.5
0.6
0.7
0.8
0.9
1.0
£0K £10K £20K £30K £40K £50K
Pro
ba
bil
ity c
os
t e
ffe
cti
ve
Assumed value of 1 QALY
LC
Cons Mgt

Gallstone Disease
Internal Clinical Guidelines, 2014 54
3.1.3 Day-case versus inpatient laparoscopic cholecystectomy (Q4b.3)
Inpatient laparoscopic cholecystectomy is more costly and produces more QALYs than day-case LC, at an acceptable cost per QALY of £3568/QALY (see Table 22).
The increased costs are driven by the additional length of stay in the inpatient arm. The QALY gains are driven by the worse bile duct injury rate in the day-case arm. However, this rate should be interpreted with caution as it is based on 1 RCT with 1 bile duct injury in the day-case arm and 0 events in the inpatient arm (Johansson et al. 2006) and zero event data cannot be meaningfully analysed. Hence, a 0.5 continuity correction has been added during the meta-analysis calculation. It may be more appropriate to view the QALYs as equal and inpatient laparoscopic cholecystectomy as more expensive than day-case laparoscopic cholecystectomy with comparable outcomes.
Table 22: Cost effectiveness results for day-case laparoscopic cholecystectomy versus inpatient laparoscopic cholecystectomy (Q4b.3)
Strategy
Discounted Incremental
ICER Costs QALYs Costs QALYs
Day-case laparoscopic cholecystectomy £2534.65 15.887
Inpatient laparoscopic cholecystectomy £2932.24 15.998 £397.59 0.111 £3568 / QALY
(a) Results represent means of 1000 probabilistic model runs
One-way sensitivity analysis (see Figure 17) indicates the result is sensitive to:
Odds and odds ratio of bile duct injury in both arms and
Mean age at the start of model
Under the current analysis, inpatient laparoscopic cholecystectomy is more costly than day-case laparoscopic cholecystectomy in all simulations and produces more QALYs in 73% of simulation (see Figure 18). In probabilistic sensitivity analyses over 1000 simulations, inpatient laparoscopic cholecystectomy has a 56.4% chance of being cost effective at a threshold of £20,000 per QALY compared with day-case laparoscopic cholecystectomy (see Figure 19).
These sensitivity analyses support a conclusion that the choice between day-case and inpatient laparoscopic cholecystectomy can be driven by their respective costs.

Gallstone Disease
Internal Clinical Guidelines, 2014 55
Figure 17: Tornado plot of one-way sensitivity analysis for day-case versus inpatient laparoscopic cholecystectomy
Dashed line indicates £20,000/QALY threshold. Outlined box shows mean value across all 1000 iterations.
-£200
0
£0
£2000
£4000
£6000
£8000
£10000
£12000
£14000
Average LoS: LC+BDE Elective: 2.870; 4.306
Cost: ERCP bed day: £244; £365
Average LoS: ERCP Elective: 1.136; 1.705
QoL: 6 weeks+ (recovered): 0.680; 1.000
QoL: ERCP decrement (between LC and Recovered): 0.663; 0.899
QoL: Asymptomatic (living with stones): 0.784; 1.000
QoL: BDI (long term): 0.724; 1.000
Cost: laparoscopic cholecystectomy fixed: £1366; £2050
Cost: ERCP fixed: £731; £488
Average LoS: ERCP Non-Elective: 7.334; 4.889
Per-cycle prob. death with pancreatitis: 2.2%; 0.0%
Per-cycle prob. develop with CBDS: sepsis: 0.235; 0.508
Per-cycle prob. develop with CBDS: cholangitis: 0.002; 0.117
Per-cycle prob. develop with CBDS: jaundice: 0.005; 0.206
Ln(Odds) extra ERCP required with Pre-ERCP: -1.681; -3.508
Ln(Odds) Remaining Unseen CBDS with ERCP: -1.958; -3.976
QoL: Pre-operative (symptomatic): 0.594; 0.849
Per-cycle prob. develop with CBDS: pancreatitis: 0.014; 0.000
Ln(Odds) bile leak sustained with LC: -2.908; -4.362
Average LoS: Standard LC Elective: 0.915; 1.372
Ln(odds) occult CBDS in GS: -2.719; -3.584
Ln(Odds) oprerative mortality with ERCP (lit): -4.916; -5.795
Average LoS: Complicated LC (LC to OC conversion) Elective: 2.260; 1.507
Ln(Odds) LC to OC conversion required with LC: -1.725; -3.121
Per-cycle prob. LC operative mortality: 0.2%; 0.0%
QoL: 2 weeks (LC): 0.849; 0.611
QoL: 1 day (in hospital): 0.583; 0.849
Sex (proportion male): 100%; 0%
Additional LoS: DC-v-IP: DC RCT reported: 1.055; 1.239
Ln(Odds Ratio) LC to OC conversion required with LC(DC)-v-LC(IP): -1.672;…
Additional LoS: DC-v-IP: IP RCT reported: 2.356; 2.077
Cost: laparoscopic cholecystectomy bed day: £459; £306
Mean age of cohort at start: 80; 20
Ln(Odds) bile duct injury sustained with LC: -5.344; -3.661
Ln(Odds Ratio) bile duct injury sustained with LC(DC)-v-LC(IP): -2.124; 4.322
Incremental NMB @ £20K/QALY
+£0.1K
+£0.2K
+£0.3K
+£0.4K
+£0.5K
+£0.6K
+£0.7K
+£0.8K
+£0.9K
+£1.0K
-0.10 +0.10 +0.20 +0.30 +0.40 +0.50
Incre
men
tal
co
sts
Incremental QALYs

Gallstone Disease
Internal Clinical Guidelines, 2014 56
Figure 18: Scatter plot of incremental costs and QALYs for day-case versus inpatient laparoscopic cholecystectomy
Figure 19: Cost effectiveness acceptability curve for day-case versus inpatient laparoscopic cholecystectomy
0.0
0.1
0.2
0.3
0.4
0.5
0.6
0.7
0.8
0.9
1.0
£0K £10K £20K £30K £40K £50K
Pro
ba
bil
ity c
os
t e
ffe
cti
ve
Assumed value of 1 QALY
DC LC
IP LC

Gallstone Disease
Internal Clinical Guidelines, 2014 57
3.2 Cost effectiveness results for Review Question 4c: managing common bile duct stones
3.2.1 Laparoscopic cholecystectomy with bile duct exploration versus laparoscopic cholecystectomy with pre-, intra- or postoperative ERCP (Q4c.1)
In an incremental analysis of the 4 options for managing CBDS with laparoscopic cholecystectomy, laparoscopic cholecystectomy with intraoperative ERCP was less costly and produced more QALYs than either laparoscopic cholecystectomy with bile duct exploration, laparoscopic cholecystectomy with preoperative ERCP or laparoscopic cholecystectomy with postoperative ERCP. Therefore, laparoscopic cholecystectomy with intraoperative ERCP is the dominant option (see Table 23).
Pre- and postoperative ERCP options have increased costs due to requiring 2 hospital admissions. The increased costs of bile duct exploration over intraoperative ERCP are driven by higher estimated rates of bile leaks and extra ERCPs required to clear the CBDS (both outcomes are worse for bile duct exploration). However, the QALY differences are small and the evidence on intraoperative ERCP is limited to 1 or 2 RCTs.
Also, this analysis does not take account of any implementation costs that may be required to facilitate intraoperative ERCP or bile duct exploration; such as the costs of needing and co-ordinating the lists of two consultants (surgeon and radiographer).
In PSA over 1000 replications, laparoscopic cholecystectomy with intraoperative ERCP is cost effective in 86.2% of replications, compared with other options (see Table 24 and Figure 20).
Table 23: Cost effectiveness results for laparoscopic cholecystectomy with bile duct exploration versus laparoscopic cholecystectomy with pre-, intra- or postoperative ERCP (Q4c.1)
Strategy
Discounted Incremental
ICER Costs QALYs Costs QALYs
LC with intraoperative ERCP £3013.21 15.941
LC with bile duct exploration £3672.46 15.930 £659.24 −0.011 Dominated
LC with preoperative ERCP £4124.08 15.919 £1110.87 −0.022 Dominated
LC with postoperative ERCP £8712.44 15.896 £5699.23 −0.045 Dominated
(a) Results represent means of 1000 probabilistic model runs
Table 24: Probabilistic sensitivity analysis results
Strategy Replications Cost Effective
at £20,000 / QALY Threshold
Laparoscopic cholecystectomy with intraoperative ERCP 84.6%
Laparoscopic cholecystectomy with bile duct exploration 13.5%
Laparoscopic cholecystectomy with preoperative ERCP 1.9%
Laparoscopic cholecystectomy with postoperative ERCP 0.0%

Gallstone Disease
Internal Clinical Guidelines, 2014 58
Figure 20: Cost effectiveness acceptability curve for laparoscopic cholecystectomy with bile duct exploration versus laparoscopic cholecystectomy with pre-, intra- or postoperative ERCP
0.0
0.1
0.2
0.3
0.4
0.5
0.6
0.7
0.8
0.9
1.0
£0K £10K £20K £30K £40K £50K
Pro
bab
ilit
y c
ost
eff
ecti
ve
Assumed value of 1 QALY
LC+BDE
pre-ERCP+LC
LC+intra-ERCP
LC+post-ERCP

Gallstone Disease
Internal Clinical Guidelines, 2014 59
3.2.2 ERCP and laparoscopic cholecystectomy versus ERCP alone (Q4c.2)
ERCP and laparoscopic cholecystectomy is more costly and produces more QALYs than ERCP alone, at an acceptable cost per QALY of £4680/QALY (see Table 25).
The increased costs are driven by all patients having a laparoscopic cholecystectomy in the ERCP and laparoscopic cholecystectomy arm. Whilst 96% of patients in the ERCP alone eventually receive a laparoscopic cholecystectomy (due to acute symptoms), these occur over a number of years and their costs are discounted. The increased QALYs are due to patients in the ERCP alone arm remaining in asymptomatic and symptomatic states.
Table 25: Cost effectiveness results for ERCP and laparoscopic cholecystectomy versus ERCP alone (Q4c.2)
Strategy
Discounted Incremental
ICER Costs QALYs Costs QALYs
ERCP alone £1873.52 15.919
ERCP and laparoscopic cholecystectomy £2310.48 16.012 £436.96 0.093 £4680 / QALY
(a) Results represent means of 1000 probabilistic model runs
One-way sensitivity analysis (see Figure 21) indicates the result is sensitive to:
Quality of life decrement for living with asymptomatic gallstones or gallstones and CBDS
Mean age at start of model
Probabilities of developing acute cholecystitis and biliary colic symptoms
Like in conservative management arms (see 3.1.2 and 3.2.3), the model is sensitive to parameters associated with leaving the gallbladder in situ.
In PSA, ERCP with laparoscopic cholecystectomy is more costly than ERCP alone in 95% of simulations and produces more QALYs in 99.8% of simulation (see Figure 22). Over 1,000 simulations, ERCP with laparoscopic cholecystectomy has a 98.5% chance of being cost effective at a threshold of £20,000 per QALY compared with ERCP alone (see Figure 23).

Gallstone Disease
Internal Clinical Guidelines, 2014 60
Figure 21: Tornado plot of one-way sensitivity analysis for ERCP and laparoscopic cholecystectomy versus ERCP alone
-£500
0
£0
£5000
£10000
£15000
£20000
£25000
Average LoS: LC+BDE Elective: 2.870; 4.306
Additional LoS: ditional LoS for pre-ERCP: 1.660; 5.010
Per-cycle prob. develop with CBDS: pancreatitis: 0.000; 0.014
Ln(Odds Ratio) extra ERCP required with ERCP+LC: -5.132; -1.079
Per-cycle prob. death with pancreatitis: 0.0%; 2.2%
Per-cycle prob. develop with CBDS: cholangitis: 0.002; 0.117
Per-cycle prob. develop with CBDS: jaundice: 0.005; 0.206
Ln(Odds Ratio) Remaining Unseen CBDS with ERCP+LC: -6.262; -0.599
Per-cycle prob. develop with CBDS: sepsis: 0.235; 0.508
Ln(Odds) Remaining Unseen CBDS with ERCP: -3.976; -1.958
Ln(Odds) extra ERCP required with Pre-ERCP: -3.508; -1.681
Cost: ERCP fixed: £731; £488
Per-cycle prob. develop with CBDS: biliary colic: 0.294; 0.001
Per-cycle prob. develop with CBDS: acute cholecystitis: 0.362; 0.020
QoL: 1 day (in hospital): 0.583; 0.849
Average LoS: ERCP Elective: 1.136; 1.705
QoL: ERCP decrement (between LC and Recovered): 0.663; 0.899
Ln(Odds) oprerative mortality with ERCP (lit): -4.916; -5.795
Cost: ERCP bed day: £365; £244
Average LoS: Complicated LC (LC to OC conversion) Elective: 2.260; 1.507
Average LoS: ERCP Non-Elective: 7.334; 4.889
Ln(Odds) LC to OC conversion required with ERCP: -2.077; -3.469
Average LoS: Standard LC Elective: 1.372; 0.915
Cost: laparoscopic cholecystectomy bed day: £459; £306
QoL: 2 weeks (LC): 0.611; 0.849
Sex (proportion male): 100%; 0%
Ln(Odds) bile leak sustained with Pre-ERCP: -4.678; -3.122
Ln(Odds Ratio) LC to OC conversion required with ERCP+LC: 1.749; -0.730
QoL: 6 weeks+ (recovered): 0.680; 1.000
Cost: laparoscopic cholecystectomy fixed: £2050; £1366
Ln(Odds) bile leak sustained with LC: -2.908; -4.362
QoL: Pre-operative (symptomatic): 0.849; 0.594
Per-cycle prob. LC operative mortality: 0.2%; 0.0%
Ln(Odds) bile duct injury sustained with LC: -3.661; -5.344
QoL: BDI (long term): 0.724; 1.000
Ln (IRR) New CBDS with ERCP+LC: -6.029; -0.384
Ln (rate per day) New CBDS with ERCP: -12.677; -6.638
Per-cycle prob. develop with GS: biliary colic: 0.005; 0.000
Mean age of cohort at start: 80; 20
Per-cycle prob. develop with GS: acute cholecystitis: 0.037; 0.000
QoL: Asymptomatic (living with stones): 1.000; 0.784
Incremental NMB @ £20K/QALY

Gallstone Disease
Internal Clinical Guidelines, 2014 61
Dashed line indicates £20,000/QALY threshold. Outlined box shows mean value across all 1000 iterations. Outlined box
shows mean value across all 1000 iterations Plot shows 95.8% of simulations, missing those where incremental costs are
greater than £1500 or less than -£500
Figure 22: Scatter plot of incremental costs and QALYs for ERCP with laparoscopic cholecystectomy versus ERCP alone
Figure 23: Cost effectiveness acceptability curve for ERCP with laparoscopic cholecystectomy versus ERCP alone
-£3.0K
-£2.5K
-£2.0K
-£1.5K
-£1.0K
-£0.5K
+£0.5K
+£1.0K
-0.40 -0.30 -0.20 -0.10 +0.10In
cre
men
tal
co
sts
Incremental QALYs
0.0
0.1
0.2
0.3
0.4
0.5
0.6
0.7
0.8
0.9
1.0
£0K £10K £20K £30K £40K £50K
Pro
ba
bil
ity c
os
t e
ffe
cti
ve
Assumed value of 1 QALY
ERCP+LC
ERCP alone

Gallstone Disease
Internal Clinical Guidelines, 2014 62
3.2.3 ERCP versus conservative management (Q4c.3)
Conservative management is more costly and produces fewer QALYs than ERCP and is therefore said to be dominated (see Table 26).
In the conservative management arm, patients spend most of the lives in the gallstones or gallstones and CBDS states and receive on average 1.1 additional ERCPs. The increased costs are also driven by the ERCPs in the conservative management arm being non-elective, rather than elective in the ERCP arm. The decreased QALYs in the conservative arm are due to patients remaining in asymptomatic or symptomatic states. Modelled differences are likely to be exaggerated because the model considers a binary choice between laparoscopic cholecystectomy and conservative management that is unlikely to occur in clinical practice.
Table 26: Cost effectiveness results for ERCP versus conservative management (Q4c.3)
Strategy
Discounted Incremental
ICER Costs QALYs Costs QALYs
ERCP £3366.72 15.923
Conservative management £11,437.11 15.476 £8070.39 -0.446 Dominated
(a) Results represent means of 1000 probabilistic model runs
One-way sensitivity analysis (see Figure 24) indicates that the result is sensitive to:
Quality of life decrement for living with asymptomatic gallstones or gallstones and CBDS
Gallbladder cancer incidence
Rate of new CBDS occurring
Mean age at start of model
It can be seen that the model is sensitive to parameters linked to leaving the gallbladder in situ for a number of years. However, it should be noted that there are no cases where laparoscopic cholecystectomy is not cost effective compared with conservative management.
In PSA, ERCP alone gains more QALYs than conservative management in all simulations and is less costly in 99.6% of simulations (see Figure 25). Over 1000 simulations, ERCP alone has a 100% chance of being cost effective at a threshold of £20,000 per QALY compared to conservative management (see Figure 26).
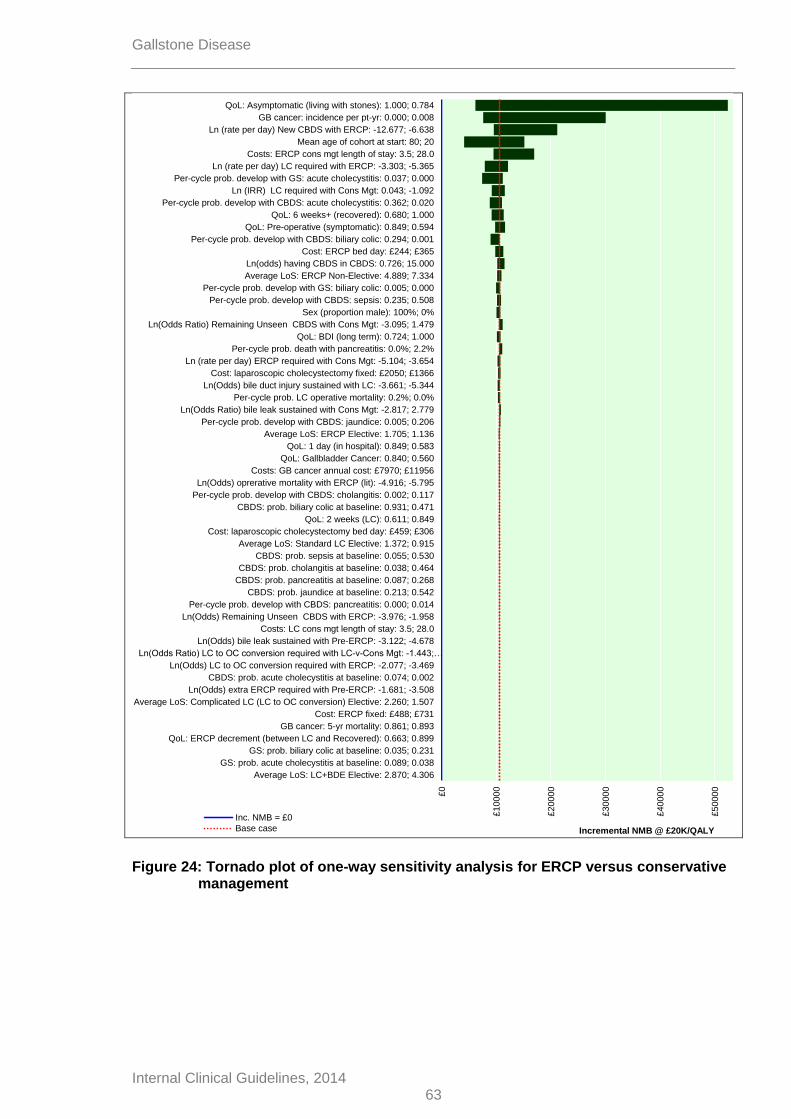
Gallstone Disease
Internal Clinical Guidelines, 2014 63
Figure 24: Tornado plot of one-way sensitivity analysis for ERCP versus conservative management
£0
£10000
£20000
£30000
£40000
£50000
£60000
Average LoS: LC+BDE Elective: 2.870; 4.306
GS: prob. acute cholecystitis at baseline: 0.089; 0.038
GS: prob. biliary colic at baseline: 0.035; 0.231
QoL: ERCP decrement (between LC and Recovered): 0.663; 0.899
GB cancer: 5-yr mortality: 0.861; 0.893
Cost: ERCP fixed: £488; £731
Average LoS: Complicated LC (LC to OC conversion) Elective: 2.260; 1.507
Ln(Odds) extra ERCP required with Pre-ERCP: -1.681; -3.508
CBDS: prob. acute cholecystitis at baseline: 0.074; 0.002
Ln(Odds) LC to OC conversion required with ERCP: -2.077; -3.469
Ln(Odds Ratio) LC to OC conversion required with LC-v-Cons Mgt: -1.443;…
Ln(Odds) bile leak sustained with Pre-ERCP: -3.122; -4.678
Costs: LC cons mgt length of stay: 3.5; 28.0
Ln(Odds) Remaining Unseen CBDS with ERCP: -3.976; -1.958
Per-cycle prob. develop with CBDS: pancreatitis: 0.000; 0.014
CBDS: prob. jaundice at baseline: 0.213; 0.542
CBDS: prob. pancreatitis at baseline: 0.087; 0.268
CBDS: prob. cholangitis at baseline: 0.038; 0.464
CBDS: prob. sepsis at baseline: 0.055; 0.530
Average LoS: Standard LC Elective: 1.372; 0.915
Cost: laparoscopic cholecystectomy bed day: £459; £306
QoL: 2 weeks (LC): 0.611; 0.849
CBDS: prob. biliary colic at baseline: 0.931; 0.471
Per-cycle prob. develop with CBDS: cholangitis: 0.002; 0.117
Ln(Odds) oprerative mortality with ERCP (lit): -4.916; -5.795
Costs: GB cancer annual cost: £7970; £11956
QoL: Gallbladder Cancer: 0.840; 0.560
QoL: 1 day (in hospital): 0.849; 0.583
Average LoS: ERCP Elective: 1.705; 1.136
Per-cycle prob. develop with CBDS: jaundice: 0.005; 0.206
Ln(Odds Ratio) bile leak sustained with Cons Mgt: -2.817; 2.779
Per-cycle prob. LC operative mortality: 0.2%; 0.0%
Ln(Odds) bile duct injury sustained with LC: -3.661; -5.344
Cost: laparoscopic cholecystectomy fixed: £2050; £1366
Ln (rate per day) ERCP required with Cons Mgt: -5.104; -3.654
Per-cycle prob. death with pancreatitis: 0.0%; 2.2%
QoL: BDI (long term): 0.724; 1.000
Ln(Odds Ratio) Remaining Unseen CBDS with Cons Mgt: -3.095; 1.479
Sex (proportion male): 100%; 0%
Per-cycle prob. develop with CBDS: sepsis: 0.235; 0.508
Per-cycle prob. develop with GS: biliary colic: 0.005; 0.000
Average LoS: ERCP Non-Elective: 4.889; 7.334
Ln(odds) having CBDS in CBDS: 0.726; 15.000
Cost: ERCP bed day: £244; £365
Per-cycle prob. develop with CBDS: biliary colic: 0.294; 0.001
QoL: Pre-operative (symptomatic): 0.849; 0.594
QoL: 6 weeks+ (recovered): 0.680; 1.000
Per-cycle prob. develop with CBDS: acute cholecystitis: 0.362; 0.020
Ln (IRR) LC required with Cons Mgt: 0.043; -1.092
Per-cycle prob. develop with GS: acute cholecystitis: 0.037; 0.000
Ln (rate per day) LC required with ERCP: -3.303; -5.365
Costs: ERCP cons mgt length of stay: 3.5; 28.0
Mean age of cohort at start: 80; 20
Ln (rate per day) New CBDS with ERCP: -12.677; -6.638
GB cancer: incidence per pt-yr: 0.000; 0.008
QoL: Asymptomatic (living with stones): 1.000; 0.784
Incremental NMB @ £20K/QALY
Inc. NMB = £0
Base case

Gallstone Disease
Internal Clinical Guidelines, 2014 64
Dashed line indicates £20,000/QALY threshold. Outlined box shows mean value across all 1000 iterations. Plot shows 99.6%
of simulations, missing those where incremental costs greater than £32,000
Figure 25: Scatter plot of incremental costs and QALYs for ERCP versus conservative management
Figure 26: Cost effectiveness acceptability curve for ERCP versus conservative management
0.0
0.1
0.2
0.3
0.4
0.5
0.6
0.7
0.8
0.9
1.0
£0K £10K £20K £30K £40K £50K
Pro
ba
bil
ity c
os
t e
ffe
cti
ve
Assumed value of 1 QALY
ERCP
Cons Mgt

Gallstone Disease
Internal Clinical Guidelines, 2014 65
3.3 Cost effectiveness results for Review Question 5: timing of laparoscopic cholecystectomy
3.3.1 Early versus delayed laparoscopic cholecystectomy (Q5a.1)
Delayed laparoscopic cholecystectomy is more costly and produces more QALYs than early laparoscopic cholecystectomy, but an ICER of over £200,000/QALY is above that which is usually accepted as being cost effective (see Table 27).
The increased costs are driven by the additional length of stay associated with delayed laparoscopic cholecystectomy; the QALY differences are small.
Table 27: Cost effectiveness results for early laparoscopic cholecystectomy versus delayed laparoscopic cholecystectomy (Q5a.1)
Strategy
Discounted Incremental
ICER Costs QALYs Costs QALYs
Early laparoscopic cholecystectomy £2728.27 15.983
Delayed laparoscopic cholecystectomy £3686.21 15.988 £957.94 0.005 £201,896 / QALY
(a) Results represent means of 1000 probabilistic model runs
One-way sensitivity analysis (see Figure 27) indicates that the result is sensitive to:
Rates of bile duct injury and bile leak in the delayed laparoscopic cholecystectomy arm
Costs and length of stay associated with delayed laparoscopic cholecystectomy
Quality of life decrements associated with delayed laparoscopic cholecystectomy
Only the bile duct injury rate would make delayed laparoscopic cholecystectomy cost effective compared with early laparoscopic cholecystectomy. This is a statistically non-significant parameter with zero events in 6 of the 8 arms compared and therefore should be interpreted with caution. In PSA, delayed laparoscopic cholecystectomy is more costly than early laparoscopic cholecystectomy in 94.3% of simulations and produces more QALYs in 42.8% of simulations (see Figure 28). Over 1000 simulations, early laparoscopic cholecystectomy has an 88.2% chance of being cost effective at a threshold of £20,000 per QALY compared with delayed laparoscopic cholecystectomy (see Figure 29).

Gallstone Disease
Internal Clinical Guidelines, 2014 66
Figure 27: Tornado plot of one-way sensitivity analysis for early versus delayed laparoscopic cholecystectomy
-£160
0
-£140
0
-£120
0
-£100
0
-£800
-£600
-£400
-£200
£0
£200
£400
Average LoS: LC+BDE Elective: 2.870; 4.306
CBDS: prob. biliary colic at baseline: 0.931; 0.471
Average LoS: ERCP Elective: 1.705; 1.136
CBDS: prob. acute cholecystitis at baseline: 0.002; 0.074
Per-cycle prob. develop with CBDS: pancreatitis: 0.000; 0.014
Per-cycle prob. develop with CBDS: cholangitis: 0.117; 0.002
Per-cycle prob. develop with CBDS: acute cholecystitis: 0.362; 0.020
Per-cycle prob. develop with CBDS: jaundice: 0.206; 0.005
CBDS: prob. jaundice at baseline: 0.213; 0.542
QoL: ERCP decrement (between LC and Recovered): 0.899; 0.663
Ln(Odds) Remaining Unseen CBDS with ERCP: -1.958; -3.976
CBDS: prob. cholangitis at baseline: 0.038; 0.464
Per-cycle prob. develop with GS: biliary colic: 0.005; 0.000
CBDS: prob. sepsis at baseline: 0.055; 0.530
Per-cycle prob. develop with CBDS: sepsis: 0.508; 0.235
Per-cycle prob. develop with CBDS: biliary colic: 0.294; 0.001
Ln(Odds) extra ERCP required with Pre-ERCP: -1.681; -3.508
Ln(odds) occult CBDS in GS: -2.719; -3.584
CBDS: prob. pancreatitis at baseline: 0.268; 0.087
Mean age of cohort at start: 80; 20
Ln(Odds) LC required with Cons Mgt: -8.813; -5.008
Sex (proportion male): 100%; 0%
Cost: laparoscopic cholecystectomy fixed: £1366; £2050
Per-cycle prob. develop with GS: acute cholecystitis: 0.037; 0.000
Per-cycle prob. LC operative mortality: 0.0%; 0.2%
Average LoS: Standard LC Elective: 0.915; 1.372
Average LoS: Complicated LC (LC to OC conversion) Elective: 2.260; 1.507
Ln(Odds) LC to OC conversion required with LC: -1.725; -3.121
GS: prob. acute cholecystitis at baseline: 0.038; 0.089
Cost: ERCP fixed: £488; £731
GS: prob. biliary colic at baseline: 0.231; 0.035
Ln(Odds Ratio) LC to OC conversion required with LC (delayed)-v-LC (early):…
Ln(Odds) bile duct injury sustained with LC: -3.661; -5.344
Per-cycle prob. death with pancreatitis: 2.2%; 0.0%
QoL: BDI (long term): 0.724; 1.000
QoL: 2 weeks (LC): 0.849; 0.611
Ln(Odds) oprerative mortality with ERCP (lit): -5.795; -4.916
QoL: 1 day (in hospital): 0.583; 0.849
Cost: ERCP bed day: £244; £365
Average LoS: ERCP Non-Elective: 4.889; 7.334
Ln(Odds) bile leak sustained with LC: -4.362; -2.908
QoL: Pre-operative (symptomatic): 0.594; 0.849
QoL: 6 weeks+ (recovered): 1.000; 0.680
QoL: Asymptomatic (living with stones): 0.784; 1.000
Additional LoS: Early-v-Delayed LC: 3.680; 2.460
Cost: laparoscopic cholecystectomy bed day: £459; £306
Ln(Odds Ratio) bile leak sustained with LC (delayed) -v- LC (early): -0.374;…
Ln(Odds Ratio) bile duct injury sustained with LC (delayed) -v- LC (early): -…
Incremental NMB @ £20K/QALY
Inc. NMB = £0Base case

Gallstone Disease
Internal Clinical Guidelines, 2014 67
Dashed line indicates £20,000/QALY threshold. Outlined box shows mean value across all 1000 iterations. Plot shows 98.0%
of simulations, missing those where incremental costs greater than £1000
Figure 28: Scatter plot of incremental costs and QALYs for early versus delayed laparoscopic cholecystectomy
Figure 29: Cost effectiveness acceptability curve for early versus delayed laparoscopic cholecystectomy
-£3.0K
-£2.5K
-£2.0K
-£1.5K
-£1.0K
-£0.5K
+£0.5K
+£1.0K
-0.40 -0.30 -0.20 -0.10 +0.10In
cre
men
tal
co
sts
Incremental QALYs
0.0
0.1
0.2
0.3
0.4
0.5
0.6
0.7
0.8
0.9
1.0
£0K £10K £20K £30K £40K £50K
Pro
ba
bil
ity c
os
t e
ffe
cti
ve
Assumed value of 1 QALY
Early LC
Delayed LC

Gallstone Disease
Internal Clinical Guidelines, 2014 68
3.3.2 Early versus delayed laparoscopic cholecystectomy following ERCP (Q5a.2)
Delayed laparoscopic cholecystectomy following ERCP is more costly and produces fewer QALYs than early laparoscopic cholecystectomy following ERCP and is therefore said to be dominated (see Table 28).
Again, the increased costs are driven by the additional length of stay associated with delayed laparoscopic cholecystectomy; the QALY differences are small.
Table 28: Cost effectiveness results for early laparoscopic cholecystectomy following ERCP versus delayed laparoscopic cholecystectomy following ERCP (Q5a.2)
Strategy
Discounted Incremental
ICER Costs QALYs Costs QALYs
Early LC following ERCP £2322.14 16.007
Delayed LC following ERCP £2402.21 16.002 £80.06 −0.005 Dominated
(b) Results represent means of 1000 probabilistic model runs
One-way sensitivity analysis (see Figure 30) indicates that the result is sensitive to:
Quality of life decrement for living with asymptomatic gallstones or gallstones and CBDS
Rate and rate ratio of new CBDS occurring
In PSA, delayed laparoscopic cholecystectomy following ERCP is more costly than early laparoscopic cholecystectomy following ERCP in 99.6% of simulations and produces less QALYs in all simulations (see Figure 31). Over 1000 simulations, early laparoscopic cholecystectomy following ERCP has a 100% chance of being cost effective at a threshold of £20,000 per QALY compared with delayed laparoscopic cholecystectomy following ERCP (see Figure 32).

Gallstone Disease
Internal Clinical Guidelines, 2014 69
Figure 30: Tornado plot of one-way sensitivity analysis for early versus delayed laparoscopic cholecystectomy following ERCP
-£100
£0
£100
£200
£300
£400
£500
£600
£700
Ln (rate per day) LC required with ERCP: -5.365; -3.303
Ln (IRR) LC required with Cons Mgt: -1.092; 0.043
Ln(Odds) LC to OC conversion required with ERCP: -3.469; -2.077
Average LoS: LC+BDE Elective: 2.870; 4.306
Ln(Odds) LC required with Cons Mgt: -5.008; -8.813
Average LoS: ERCP Elective: 1.136; 1.705
QoL: 1 day (in hospital): 0.849; 0.583
Per-cycle prob. develop with CBDS: biliary colic: 0.294; 0.001
Per-cycle prob. develop with CBDS: pancreatitis: 0.000; 0.014
Per-cycle prob. death with pancreatitis: 0.0%; 2.2%
QoL: LC+ERCP - assumed decrement to LC: 0.950; 0.850
Per-cycle prob. develop with CBDS: cholangitis: 0.002; 0.117
Per-cycle prob. develop with CBDS: acute cholecystitis: 0.362; 0.020
QoL: ERCP decrement (between LC and Recovered): 0.663; 0.899
Per-cycle prob. develop with CBDS: jaundice: 0.005; 0.206
Ln(Odds Ratio) extra ERCP required with LC-v-LC+IOC: -4.387; 2.064
Ln(Odds) Remaining Unseen CBDS with ERCP: -3.976; -1.958
Per-cycle prob. develop with CBDS: sepsis: 0.235; 0.508
Average LoS: ERCP Non-Elective: 4.889; 7.334
Cost: ERCP bed day: £244; £365
Sex (proportion male): 100%; 0%
Ln(Odds) extra ERCP required with Pre-ERCP: -3.508; -1.681
Cost: ERCP fixed: £488; £731
Ln(Odds) bile leak sustained with LC: -2.908; -4.362
QoL: 2 weeks (LC): 0.611; 0.849
Per-cycle prob. develop with GS: biliary colic: 0.000; 0.005
Cost: laparoscopic cholecystectomy fixed: £2050; £1366
Ln(Odds) oprerative mortality with ERCP (lit): -5.795; -4.916
Cost: laparoscopic cholecystectomy bed day: £459; £306
QoL: 6 weeks+ (recovered): 0.680; 1.000
Per-cycle prob. LC operative mortality: 0.2%; 0.0%
QoL: Pre-operative (symptomatic): 0.849; 0.594
Ln(Odds) bile duct injury sustained with LC: -3.661; -5.344
Average LoS: Standard LC Elective: 0.915; 1.372
Per-cycle prob. develop with GS: acute cholecystitis: 0.000; 0.037
Additional LoS: Early-v-Delayed LC post ERCP: -1.960; 1.960
Ln(Odds) Remaining Unseen CBDS with LC post ERCP timing Early: -…
QoL: BDI (long term): 0.724; 1.000
Average LoS: Complicated LC (LC to OC conversion) Elective: 2.260; 1.507
Ln(Odds) LC to OC conversion required with LC: -1.725; -3.121
Costs: LC+ERCP in same admission length of stay: 2.5; 25.0
Mean age of cohort at start: 80; 20
Ln(Odds Ratio) LC to OC conversion required with LC-v-LCpostERCP: -…
Ln(IRR) New CBDS with LC post ERCP timing Early: -2.813; 2.730
Ln (rate per day) New CBDS with ERCP: -12.677; -6.638
QoL: Asymptomatic (living with stones): 1.000; 0.784
Incremental NMB @ £20K/QALYInc. NMB = £0Base case

Gallstone Disease
Internal Clinical Guidelines, 2014 70
Dashed line indicates £20,000/QALY threshold. Outlined box shows mean value across all 1000 iterations.
Figure 31: Scatter plot of incremental costs and QALYs for early versus delayed laparoscopic cholecystectomy following ERCP
Figure 32: Cost effectiveness acceptability curve for early versus delayed laparoscopic cholecystectomy following ERCP
-£0.2K
+£0.2K
+£0.4K
+£0.6K
+£0.8K
+£1.0K
-0.05 -0.04 -0.03 -0.02 -0.01 +0.01
Incre
men
tal
co
sts
Incremental QALYs
0.0
0.1
0.2
0.3
0.4
0.5
0.6
0.7
0.8
0.9
1.0
£0K £10K £20K £30K £40K £50K
Pro
ba
bil
ity c
os
t e
ffe
cti
ve
Assumed value of 1 QALY
Early LC
Delayed LC

Gallstone Disease
Internal Clinical Guidelines, 2014 71
3.4 Discussion
3.4.1 Principal findings
An original health economic model has been developed to analyse options in the management of gallstone disease. Across a number of comparisons, the health economic analysis supports early intervention for symptomatic gallstones or CBDS. Any upfront cost of operations outweighs the long-term costs and QALY losses from not intervening.
Sensitivity analyses indicate that, in comparators where the gallbladder is not removed, the model is sensitive to related parameters, such as utility losses from living asymptomatically or symptomatically with gallstones, gallbladder cancer incidence, starting age or rates of developing symptoms.
3.4.2 Model strengths
This is the first health economic model to address a number of key issues in analysing the cost effectiveness of interventions to manage gallstone disease.
No existing cost–utility analyses have used a Markov structure to model gallstones. This allowed symptom and CBDS recurrence to be modelled and symptoms to occur over time (rather than at a fixed interval). Also, more detailed short-term operative consequences than have previously been considered could be included. A lifetime horizon incorporated long-term utility impacts of bile duct injuries.
The primary source of data for the model was the systematic review of randomised evidence undertaken for this guideline. The model structure allowed less reliance to be placed on parameters drawn from external observational evidence than is commonly seen in analogous cost–utility models.
This analysis represents the first UK cost–utility analysis comparing multiple interventions for the management of CBDS. A small number of analyses (Brown et al. 2011; Urbach et al. 2001) have previously undertaken multiple comparisons, but did not use utility as an outcome.
The flexible nature of the model states allowed many comparisons to be analysed using the same model structure. Future guidelines or updates to this guideline may be able to utilise this existing model, to incorporate new evidence on the questions answered here and/or to explore other questions and scenarios.
3.4.3 Model limitations
Whilst the model has much strength, it also has a number of limitations that need to be considered.
The heavy reliance on data from included RCTs imposes some limitations on the analysis. Results are often sensitive to parameters with zero or small numbers of events in the included studies (such as bile duct injuries). Two comparisons rely on single clinical studies (laparoscopic cholecystectomy versus conservative management, laparoscopic cholecystectomy timing post ERCP) and a number rely on just 2 studies, which may limit the generalisability of findings for those questions. In addition, we may have excluded some important operative consequences that were not reported in the included papers. However, the GDG agreed the list of operative consequences to be modelled and this list was selected after reviewing the existing clinical and economic evidence. Using a wider pool of evidence, including nonrandomised studies, may have prevented some of the issues that arose with zero and small event counts for rare consequences; however, this would also increase risk of bias.

Gallstone Disease
Internal Clinical Guidelines, 2014 72
Structurally, the model assumes that symptoms are mutually exclusive in a way that is unlikely to be clinically realistic. Modelling multiple symptoms would complicate the model in a manner that may make it unsuitable for a Markov structure and lead to the need for a discrete event simulation structure that could encompass memory of patients’ previous symptoms.
The model would be improved by using micro-costing for the different interventions. Also, symptoms are likely to incur NHS costs such as prescriptions, GP visits or A&E attendances. The lack of a cost associated with mending bile duct injuries possibly biases the analysis in favour of those interventions with higher rates of bile duct injury.
In order to estimate a bed-day cost for laparoscopic cholecystectomy and ERCP, it was necessary to assume that elective and non-elective surgery have the same fixed costs. This is particularly an issue for intraoperative ERCP and bile duct exploration, where costs only differ by a small length of stay found in the clinical evidence.
The model has not explicitly considered the costs or opportunity costs of implementing potential changes to clinical practice. This is particularly an issue for the comparison of laparoscopic cholecystectomy with bile duct exploration to laparoscopic cholecystectomy with pre-, intra- or postoperative ERCP. In this analysis laparoscopic cholecystectomy with intraoperative ERCP appears an attractive option. However, the GDG advised that few units are currently configured in a way that would make it simple to adopt this approach as a matter of routine (in particular, the elective lists of surgeons and radiologists tend not to be synchronised in a way that would make it simple to coordinate surgery and ERCP). Therefore, it may be that additional costs would be incurred in providing this treatment option, in which case, our analysis would overestimate the cost effectiveness of the approach.
A lack of UK utility data derived using EQ-5D that is specific to gallstones appears to be a major weakness of this model, although we note that the model is rarely sensitive to such parameters. However, better utility data would improve the face-validity and reliability of the analyses. There are a number of states where utility values have been assumed, including ERCP, asymptomatic gallstones and symptomatic gallstones. Also, the assumption that all symptoms incur the same utility losses is a significant simplification of a complex range of experiences.
The model relies on a number of assumptions around the timing of interventions, particularly that known CBDS are cleared by a maximum of 2 ERCPs that are conducted within the same 2-week cycle. The model could be improved by adding a state to represent extra ERCPs required to clear the bile duct, the timing of which could then be modelled more flexibly.
3.4.4 Comparison with other health economic analyses
Two existing cost–utility analyses that compared included interventions were identified (Gurusamy et al. 2012; Wilson et al. 2010).
Wilson et al. (2010) compared early and delayed laparoscopic cholecystectomy for acute cholecystitis and found early laparoscopic cholecystectomy dominates delayed laparoscopic cholecystectomy. Our analysis found that early laparoscopic cholecystectomy is cost effective compared with delayed laparoscopic cholecystectomy. Whilst the decision is similar, the conclusions are different. This is likely to be because Wilson et al. (2010) used a decision tree structure with fixed timing of symptoms and only modelled 1 year rather than a patient lifetime. When we limit the time horizon of our model to 1 year, we replicate Wilson et al.’s result.
Gurusamy et al. (2012) compared preoperative and intraoperative ERCP and, like this analysis found that intraoperative ERCP dominates pre-operative ERCP. This analysis

Gallstone Disease
Internal Clinical Guidelines, 2014 73
conducted a more thorough comparison of 4 treatment options and again, differences in costs and QALYs gained are likely to be due to model structure and time horizon.
3.5 Conclusions
An original health economic model has analysed a number of treatment comparisons in the management of gallstone disease. The analyses support early intervention for symptomatic gallstones and CBDS. Despite a number of limitations (primarily reflecting weaknesses in the underlying data), this Markov model has many strengths and represents an important step change in health economic analyses of gallstones.

Gallstone Disease
Internal Clinical Guidelines, 2014 74

Internal Clinical Guidelines, 2014
Gallstone Disease
75
Reference List Ainslie WG, Catton JA, Davides D et al. (2003) Micropuncture cholecystectomy vs conventional laparoscopic cholecystectomy: a randomized controlled trial. Surgical Endoscopy 17: 766-72
Ara R, Brazier J (2008) Deriving an algorithm to convert the eight mean SF-36 dimension scores into a mean EQ-5D preference-based score from published studies (where patient level data are not available). Value in Health 11: 1131-43
Arseneau KO, Cohn SM, Cominello F et al. (2001) Cost–utility of initial medical management for Crohn's disease perianal fistulae. Gastroenterology 120: 1640-56
Attili AF, De SA, Capri R et al. (1995) The natural history of gallstones: the GREPCO experience. The GREPCO Group. Hepatology 21: 655-60
Bass EB, Pitt HA, Lillemoe KD (1993) Cost-effectiveness of laparoscopic cholecystectomy versus open cholecystectomy. American Journal of Surgery 165: 466-71
Bitzer EM, Lorenz C, Nickel S et al. (2008) Assessing patient-reported outcomes of cholecystectomy in short-stay surgery. Surgical Endoscopy 22: 2712-9
Boerma D, Rauws EA, Keulemans YC et al. (2002) Wait-and-see policy or laparoscopic cholecystectomy after endoscopic sphincterotomy for bile-duct stones: a randomised trial. Lancet 360: 761-5
Burney RE, Jones KR (2002) Ambulatory and admitted laparoscopic cholecystectomy patients have comparable outcomes but different functional health status. Surgical Endoscopy 16: 921-6
Carraro A, Mazloum DE, Bihl F (2011) Health-related quality of life outcomes after cholecystectomy. [Review]. World Journal of Gastroenterology 17: 4945-51
Chiang DT, Anozie A, Fleming WR et al. (2004) Comparative study on acute pancreatitis management. ANZ Journal of Surgery 74: 218-21
Cook J, Richardson J, Street A (1994) A cost utility analysis of treatment options for gallstone disease: methodological issues and results. Health Economics 3: 157-68
de Reuver PR, Sprangers MA, Rauws EA et al. (2008) Impact of bile duct injury after laparoscopic cholecystectomy on quality of life: a longitudinal study after multidisciplinary treatment. Endoscopy 40: 637-43

Internal Clinical Guidelines, 2014
Gallstone Disease
76
Department of Health (2012) National Schedule of Reference Costs 2011-2012.
Dunn D, Nair R, Fowler S et al. (1994) Laparoscopic cholecystectomy in England and Wales: results of an audit by the Royal College of Surgeons of England. Annals of the Royal College of Surgeons of England 76: 269-75
Eypasch E, Williams JI, Wood-Dauphinee S et al. (1995) Gastrointestinal Quality of Life Index: development, validation and application of a new instrument. British Journal of Surgery 82: 216-22
Fan ST, Lai EC, Mok FP et al. (1993) Early treatment of acute biliary pancreatitis by endoscopic papillotomy. New England Journal of Medicine 328: 228-32
Gregor JC, Ponich TP (1996) Should ERCP be routine after an episode of 'idiopathic' pancreatitis? A cost-utility analysis. Gastrointest.Endosc 44:
118-23
Gurusamy K, Wilson E, Burroughs AK et al. (2012) Intraoperative vs preoperative endoscopic sphincterotomy in patients with gallbladder and common bile duct stones: cost-utility and value-of-information analysis. Applied Health Economics & Health Policy 10: 15-29
Kaltenthaler E, Tappenden P, Paisley S et al. (11 A.D.) Identifying and Reviewing Evidence to Inform the Conceptualisation and Population of Cost-Effectiveness Models.
Keus F, de VJ, Gooszen HG et al. (2008) Laparoscopic versus small-incision cholecystectomy: health status in a blind randomised trial. Surgical Endoscopy 22: 1649-59
Kind P, Hardman G, Macran S (1999) UK Population Norms for EQ-5D. 172
Korolija D, Sauerland S, Wood-Dauphinee S et al. (2004) Evaluation of quality of life after laparoscopic surgery: evidence-based guidelines of the European Association for Endoscopic Surgery. [Review] [147 refs]. Surgical Endoscopy 18: 879-97
Landman MP, Feurer ID, Moore DE et al. (2012) The long-term effect of bile duct injuries on health-related quality of life: a meta-analysis. HPB (Oxford) 15: 252-9
Lau JY, Leow CK, Fung TM et al. (2006) Cholecystectomy or gallbladder in situ after endoscopic sphincterotomy and bile duct stone removal in Chinese patients. Gastroenterology 130: 96-103
Lee L, Kaneva P, Latimer E et al. (2014) Mapping the Gastrointestinal Quality of Life Index to Short-Form 6D utility scores. Journal of Surgical Research 186: 135-41

Internal Clinical Guidelines, 2014
Gallstone Disease
77
Macafee DA, Humes DJ, Bouliotis G et al. (2009) Prospective randomized trial using cost-utility analysis of early versus delayed laparoscopic cholecystectomy for acute gallbladder disease. British Journal of Surgery 96: 1031-40
Moore DE, Feurer ID, Holzman MD et al. (2004) Long-term detrimental effect of bile duct injury on health-related quality of life. Archives of Surgery 139: 476-81
National Institute for Health and Care Excellence (2010) Hepatocellular carcinoma (advanced and metastatic) - sorafenib (first line) (TA189).
National Institute for Health and Care Excellence (2013) Guide to Methods of Technology Appraisal.
NHS Information Centre for Health and Social Care (2014) Hospital Episodes Statistics.
North West Cancer Intelligence Service (2014) Pancreatic Cancer Mortality.
Office for National Statistics (2013) Interim Life Tables, England and Wales 2010-2012.
Penniston KL, Nakada SY (2007) Health Related Quality of Life Differs Between Male and Female Stone Formers. The Journal of Urology 178: 2435-40
Quintana JM, Cabriada J, Arostegui I et al. (2003) Quality-of-life outcomes with laparoscopic vs open cholecystectomy. Surgical Endoscopy 17: 1129-34
Quintana JM, Cabriada J, Arostegui I et al. (2005) Health-related quality of life and appropriateness of cholecystectomy. Annals of Surgery 241: 110-8
Willams EJ, Taylor S, Fairclough P et al. (2006) Are we meeting the standards set for endoscopy? Results of a large-scale prospective survey of endoscopic retrograde cholangio-pancreatograph practice. Gut 56: 821-9
Wilson E, Gurusamy K, Gluud C et al. (2010) Cost-utility and value-of-information analysis of early versus delayed laparoscopic cholecystectomy for acute cholecystitis. British Journal of Surgery 97: 210-9