Embed Size (px)
Citation preview
Appendix L
Living with the Bay East Rockaway High School/Lister Park
Hydraulic Model Report

This page intentionally left blank.
#200-87963-18003
July 29, 2020
PRESENTED TO PRESENTED BY
Governor’s Office of Storm Recovery
25 Beaver Street
New York, New York 10004
Tetra Tech
498 Seventh Avenue
15th Floor
New York, NY 10004
P +1-646-576-4034
F +1-212-480-2836
tetratech.com
Hydraulic Model Report
Living with the Bay
East Rockaway High School/Lister Park
Living with the Bay
ERHS/Lister Park
1 July 2020
TABLE OF CONTENTS
1.0 INTRODUCTION .......................................................................................................................................................... 2
1.1 EXECUTIVE SUMMARY ....................................................................................................................................... 2
1.2 BACKGROUND AND PURPOSE ......................................................................................................................... 3
1.3 APPROACH ........................................................................................................................................................... 5
2.0 ERHS/LISTER PARK SITE CONDITIONS .................................................................................................................. 5
2.1 TOPOGRAPHY AND BATHYMETRY ................................................................................................................... 5
2.2 MODEL BOUNDARY CONDITIONS ..................................................................................................................... 6
2.3 OTHER MODEL INPUTS ...................................................................................................................................... 9
3.0 MODEL SIMULATION RESULTS .............................................................................................................................. 10
4.0 SUMMARY AND CONCLUSIONS ............................................................................................................................. 16
5.0 REFERENCES ........................................................................................................................................................... 16
LIST OF ABBREVIATIONS Term Acronym
Base Flood Elevation BFE
Cubic Feet per Second CFS
Digital Terrain Model DTM
Department of Public Works DPW
East Rockaway High School ERHS
Federal Emergency Management Agency FEMA
Feet Ft
Hydrologic Engineering Center River Analysis System HEC-RAS
Light Detection and Ranging LiDAR
Mean Recurrence Interval MRI
New York State Department of Environmental Conservation NYSDEC
North American Datum of 1983 NAD 83
North American Vertical Datum of 1988 NAVD 88
The Flood Insurance Rate Map FIRM
The Living with the Bay Program LwtB
US Army Corps of Engineers USACE
US Department of Housing and Urban Development HUD
Living with the Bay
ERHS/Lister Park
2 July 2020
1.0 INTRODUCTION
1.1 EXECUTIVE SUMMARY
The East Rockaway High School (ERHS)/Lister Park Project is a component of the Living with the Bay Program
(LWTB). LWTB is one of two US Department of Housing and Urban Development (HUD) funded programs that
originated in HUDs Rebuild by Design competition to restore community resiliency after Hurricane Sandy.
The project includes a range of improvements but only two elements are direct floodplain encroachments that have
the potential to affect flood levels in the project area. These include the proposed elevated bulkhead adjacent to
the ERHS athletic field and the construction of a flood protection berm and knee wall to protect a block of residential
homes on the west side of the project area. In addition to the elevated bulkhead, the East Rockaway School District
(ERSD) is proposing to elevate the existing athletic field two (2) feet above current grade. Preliminary design work
on the elements in the floodplain indicated that these proposed improvements, including the additional work to be
performed by ERSD, would not have any significant effects on flood levels. However, a more detailed evaluation is
required and provided herein to show that the project elements will have “no adverse effects” on the flood levels
and that their implementation would be consistent with the requirements of the New York State Department of
Environmental Conservation (NYSDEC) Floodplain management criteria for State projects in flood hazard areas
found at 6 NYCRR Part 502 and implementing guidelines. In summary, this report provides the required detailed
flooding effects of the proposed project improvements within the floodplain as compared to current existing
conditions.
The NYSDEC Floodplain Management Criteria detail the analysis steps that are necessary to satisfactorily
demonstrate that a proposed action will have “no adverse effects” within the floodplain. The analysis requires that
an approved hydraulic model be used to reproduce the 100-year flood conditions under existing conditions. The
model is then run again under proposed conditions and the results are directly compared to determine differences
in flood levels, if any. Sea level rise is not currently included in the determination of the 100-year flood levels and
is therefore not included in the analysis procedure as outlined by NYSDEC Floodplain Management Criteria.
However, the model was prepared to provide a comparative analysis of pre- and post-development conditions
whereby, the proposed improvements would have a similar if not more de minimis impact to the flood level rise if
sea level rise were taken into account. This is because the flood storage volume of the floodplain for future sea
level rise scenarios would be larger than current day and as such, the proposed fill would displace a smaller
percentage of the flood storage volume resulting in a lesser impact to flood level rise.
This study uses an approved two-dimensional numerical model of the Mill River floodplain to simulate flood
conditions under the Federal Emergency Management Agency’s (FEMA) base flood condition that has a mean
recurrence interval of 100 years. Flood simulations before and after the implementation of the proposed
improvements are run and compared to directly show any effects that the improvements have on flood levels in the
project area as required in the Floodplain Management Criteria.
The model simulation comparison demonstrates that the proposed improvements associated with the LWTB
Program and the ERSD improvements do not have any detectable changes in the flood water elevations along a
profile that extends along the channel length within the project area. Closer examination in the immediate vicinity
of the proposed site improvements indicate that they result in very small increases in flood levels. The raising of the
athletic field elevation by ERSD contributes a maximum of 0.01 ft (roughly 1/8th of an inch) in flood level increase
near the northern limits of the field. The flood protection berm and knee wall, which are part of the Lister Park
Improvements Project, contributes a maximum of 0.05 ft in flood level increase at the northern end of the berm. The
flood protection berm, however, protects a few homes along Riverside Road from flooding during the base flood
Living with the Bay
ERHS/Lister Park
3 July 2020
condition. Based upon these results, the proposed improvements satisfy the “no adverse effects” criterion as defined
by the NYSDEC Floodplain Management Criteria.
The two-dimensional numerical model of the Mill River floodplain, which accounts for proposed improvements along
the Mill River, was based on the current design scope of the LWTB ERHS/Lister Park project and the current design
scope of the ERSD capital improvements project and is subject to change upon finalization of said scopes of work.
1.2 BACKGROUND AND PURPOSE
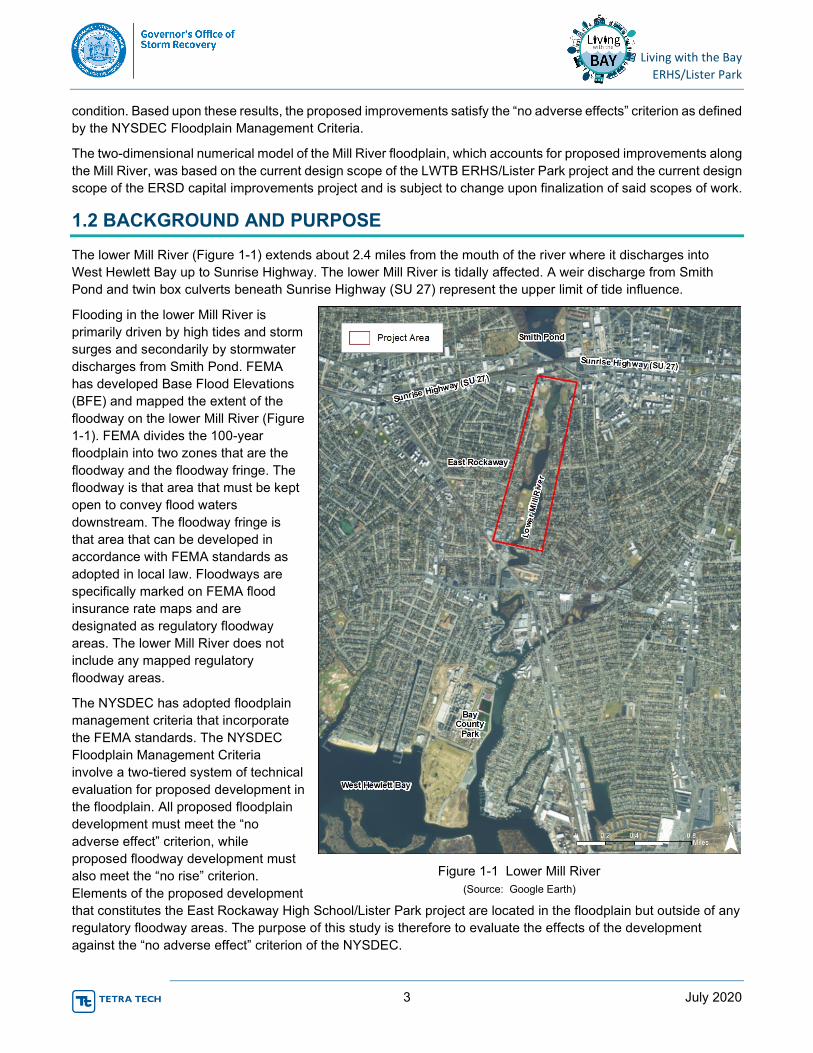
The lower Mill River (Figure 1-1) extends about 2.4 miles from the mouth of the river where it discharges into
West Hewlett Bay up to Sunrise Highway. The lower Mill River is tidally affected. A weir discharge from Smith
Pond and twin box culverts beneath Sunrise Highway (SU 27) represent the upper limit of tide influence.
Flooding in the lower Mill River is
primarily driven by high tides and storm
surges and secondarily by stormwater
discharges from Smith Pond. FEMA
has developed Base Flood Elevations
(BFE) and mapped the extent of the
floodway on the lower Mill River (Figure
1-1). FEMA divides the 100-year
floodplain into two zones that are the
floodway and the floodway fringe. The
floodway is that area that must be kept
open to convey flood waters
downstream. The floodway fringe is
that area that can be developed in
accordance with FEMA standards as
adopted in local law. Floodways are
specifically marked on FEMA flood
insurance rate maps and are
designated as regulatory floodway
areas. The lower Mill River does not
include any mapped regulatory
floodway areas.
The NYSDEC has adopted floodplain
management criteria that incorporate
the FEMA standards. The NYSDEC
Floodplain Management Criteria
involve a two-tiered system of technical
evaluation for proposed development in
the floodplain. All proposed floodplain
development must meet the “no
adverse effect” criterion, while
proposed floodway development must
also meet the “no rise” criterion.
Elements of the proposed development
that constitutes the East Rockaway High School/Lister Park project are located in the floodplain but outside of any
regulatory floodway areas. The purpose of this study is therefore to evaluate the effects of the development
against the “no adverse effect” criterion of the NYSDEC.
Figure 1-1 Lower Mill River
(Source: Google Earth)
Living with the Bay
ERHS/Lister Park
4 July 2020
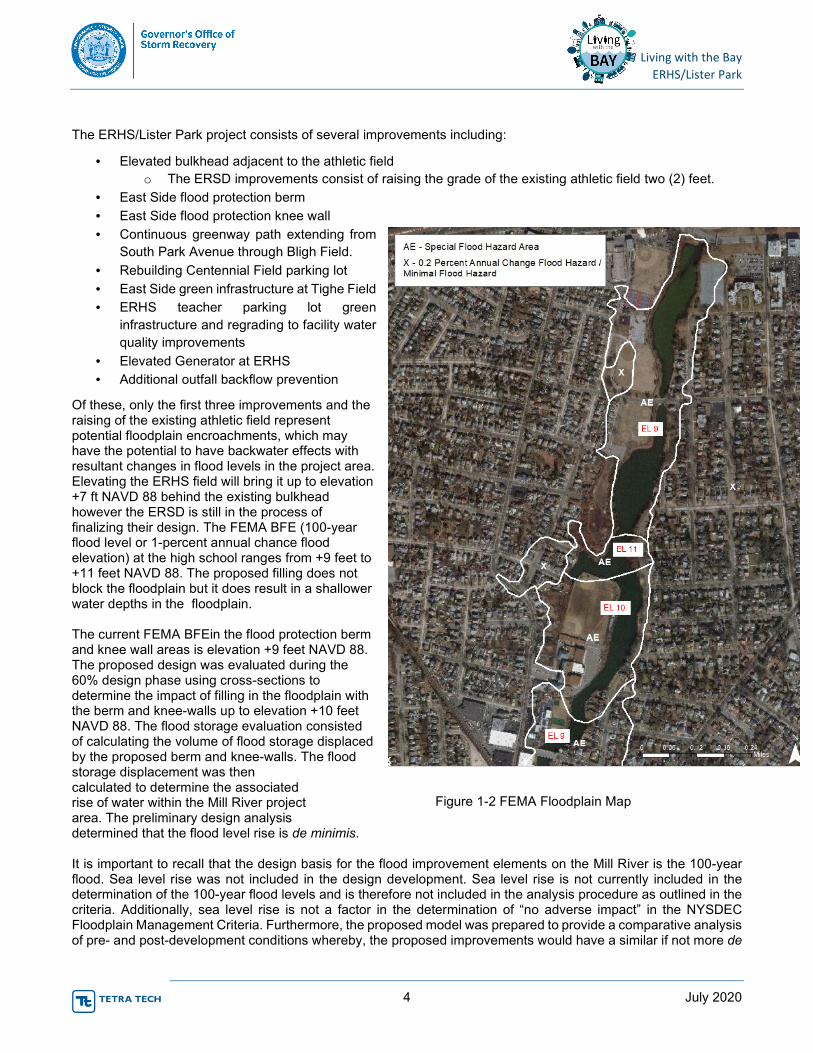
The ERHS/Lister Park project consists of several improvements including:
• Elevated bulkhead adjacent to the athletic field
o The ERSD improvements consist of raising the grade of the existing athletic field two (2) feet.
• East Side flood protection berm
• East Side flood protection knee wall
• Continuous greenway path extending from
South Park Avenue through Bligh Field.
• Rebuilding Centennial Field parking lot
• East Side green infrastructure at Tighe Field
• ERHS teacher parking lot green
infrastructure and regrading to facility water
quality improvements
• Elevated Generator at ERHS
• Additional outfall backflow prevention
Of these, only the first three improvements and the raising of the existing athletic field represent potential floodplain encroachments, which may have the potential to have backwater effects with resultant changes in flood levels in the project area. Elevating the ERHS field will bring it up to elevation +7 ft NAVD 88 behind the existing bulkhead however the ERSD is still in the process of finalizing their design. The FEMA BFE (100-year flood level or 1-percent annual chance flood elevation) at the high school ranges from +9 feet to +11 feet NAVD 88. The proposed filling does not block the floodplain but it does result in a shallower water depths in the floodplain. The current FEMA BFEin the flood protection berm and knee wall areas is elevation +9 feet NAVD 88. The proposed design was evaluated during the 60% design phase using cross-sections to determine the impact of filling in the floodplain with the berm and knee-walls up to elevation +10 feet NAVD 88. The flood storage evaluation consisted of calculating the volume of flood storage displaced by the proposed berm and knee-walls. The flood storage displacement was then calculated to determine the associated rise of water within the Mill River project area. The preliminary design analysis determined that the flood level rise is de minimis. It is important to recall that the design basis for the flood improvement elements on the Mill River is the 100-year flood. Sea level rise was not included in the design development. Sea level rise is not currently included in the determination of the 100-year flood levels and is therefore not included in the analysis procedure as outlined in the criteria. Additionally, sea level rise is not a factor in the determination of “no adverse impact” in the NYSDEC Floodplain Management Criteria. Furthermore, the proposed model was prepared to provide a comparative analysis of pre- and post-development conditions whereby, the proposed improvements would have a similar if not more de
Figure 1-2 FEMA Floodplain Map
Living with the Bay
ERHS/Lister Park
5 July 2020
minimis impact to the flood level rise if sea level rise were taken into account. This is because the flood storage volume of the floodplain for future sea level rise scenarios would be larger than current day and as such, the proposed fill would displace a smaller percentage of the flood storage volume resulting in a lesser impact to flood level rise. The purpose of this study is to provide a detailed evaluation of the effects of the proposed improvements upon current flood levels consistent with state floodplain development regulations. Although preliminary design analyses indicate that the proposed improvements do not have an adverse impact on flood levels, it is necessary to conduct a more detailed analysis to verify that the proposed improvements meet the “No Adverse Effects” criterion as defined by New York’s Floodplain Development and Floodway Guidance (NY Department of Environmental Conservation, 2020). This study provides a comparative numerical model analysis that evaluates potential differences in flood levels due to the implementation of the proposed improvements and evaluate those differences against the State’s floodplain criterion.
1.3 APPROACH
This study uses a two-dimensional numerical hydrodynamic model to simulate still water surface elevations within
the project area under flood conditions with a mean recurrence interval (MRI) of 100 years. FEMA (2009) provides
still water elevations in a limited number of locations. The closest still water elevation to the project site is in West
Hewlett Bay near the discharge of the Mill River into the Bay. It is therefore necessary to determine the still water
elevation associated with the BFE at the lower end of the project area where it can serve as a boundary condition
for the model.
FEMA considers coincident wave conditions in addition to the still water levels in developing the base flood
elevations that are mapped on the Flood Insurance Rate Maps (FEMA, 2009). The actual process adds the
component of the wave that is above the still water level to the still water level, and then rounds up to the nearest
foot. The analysis approach evaluates FEMA’s BFE and removes the wave component of the flooding to obtain
the local still water elevation. This approach is consistent with the NYSDEC Floodplain Management Criteria which
requires the use of approved hydraulic models to compare existing and future flood levels resulting from proposed
improvements. These hydraulic models do not include wave effects on flood. Only the Stillwater elevations of the
flood cases are evaluated and compared per the applicable regulations.
This study uses the RMA2 (USACE, 1994) model developed by the US Army Corps of Engineers (USACE) to
simulate the 100-year still water elevations. The RMA2, version 4.3 and up is on FEMA’s list of currently nationally
accepted hydraulic models. The analysis simulates 100-year still water level elevations pre-development (Base
Case) and post-development (Future Case) conditions. All model conditions are identical in the two simulations
except for the physical configuration changes represented by the proposed improvements. Comparisons of the 100-
year still water elevations then show water surface elevation differences if any and provide the basis for determining
compliance with the “no adverse effect” criterion of the NYSDEC.
2.0 ERHS/LISTER PARK SITE CONDITIONS
2.1 TOPOGRAPHY AND BATHYMETRY
A numerical hydrodynamic model requires the accurate representation of the configuration of the floodway. The
required floodway configuration consists of a composite of topographic and bathymetric surveys performed within
the project area over a range of dates. The following paragraphs outline these surveys.
A topographic survey was performed from October to November 2018 by Gayron de Bruin Land Surveying and
Engineering, PC in the ERHS/Lister Park Project area to identify upland surface features including site topography,
utility alignments and depths, and property boundaries. The horizontal datum is North American Datum 1983 (2011)
Living with the Bay
ERHS/Lister Park
6 July 2020
Epoch 2010 (New York State Plan Coordinate System, Long Island Zone). The vertical datum of the survey and
elevations noted in this report are North American Vertical Datum 1988.
A bathymetric survey of the Mill River bottom within the project area as well as a LiDAR survey of the riverbanks
was performed in November 2018 by Geodynamics, LLC. The surveys are to establish the bottom configuration
and the detailed configuration of the riverbanks where the living shoreline components would be implemented.
Geodynamics performed a single-beam bathymetric survey together with a 3-D mobile laser scanning survey of the
riverbanks. The survey data was digitally blended to tie the river bottom and bank survey outputs with the existing
upland LiDAR survey data, to provide a seamless digital terrain model (DTM) of the river, banks and floodplain.
The bathymetric/bank LiDAR surveys are consistent with the upland surveys. The horizontal datum is North
American Datum 1983 (2011) Epoch 2010 (New York State Plan Coordinate System, Long Island Zone). The
vertical datum of the survey and elevations noted in this report is the North American Vertical Datum 1988.
2.2 MODEL BOUNDARY CONDITIONS
Hydraulic models also require boundary conditions that establish the nature of simulated hydrodynamic conditions
that the model simulates. In this case the boundary conditions consist of:
• Upstream boundary condition – 100-year flood discharge of 2,704 cubic feet per second (cfs) through the
twin culverts located beneath Sunrise Highway at the north end of the project area
• Downstream boundary condition – 100-year still water elevation as determined in FEMA’s Flood
Insurance Study
The analysis approach evaluates FEMA’s BFE and removes the wave component of the flooding to obtain the
local still water elevation. This approach is consistent with the NYSDEC Floodplain Management Criteria which
requires the use of approve hydraulic models to compare existing and future flood levels resulting from proposed
improvements. These hydraulic models do not include wave effects on flood. Only the Stillwater elevations of the
flood cases are evaluated and compared per the applicable regulations.
The following sections provide details of the derivation and application of these boundary conditions.
Upstream Boundary Condition
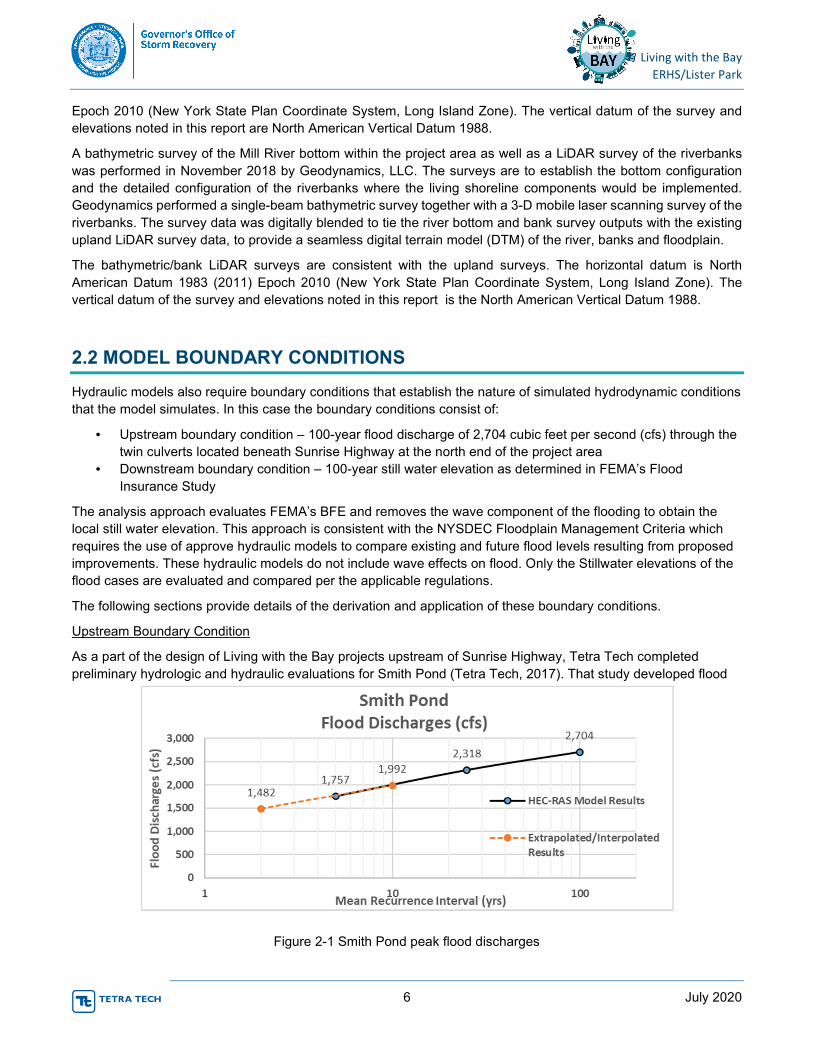
As a part of the design of Living with the Bay projects upstream of Sunrise Highway, Tetra Tech completed
preliminary hydrologic and hydraulic evaluations for Smith Pond (Tetra Tech, 2017). That study developed flood
Figure 2-1 Smith Pond peak flood discharges
Living with the Bay
ERHS/Lister Park
7 July 2020
hydrographs for a range of MRIs and routed those flows in a HEC-RAS model (USACE, 2016) through tributary
streams, Smith Pond, the weir structure at the south end of Smith Pond and the twin 5-ft x 12-ft box culverts
beneath Sunrise Highway to the open water of the Mill River at the northern end of this project. Figure 2 shows
the peak flood discharges for a range of MRI.
Final hydrologic and hydraulic analyses for Smith Pond (WSP, 2020) developed a 100-year discharge from Smith
Pond through the Sunrise Highway culverts that is 1,842 cfs. This discharge is significantly less than the 2,704 cfs
used in this model. The modeling for this study was complete by the time that the final discharge value became
available. Since this model study shows that there is “no adverse effect” on flood water levels even with an inflow
that is much larger than the final design value, it was determined that it is not necessary to rerun the model
simulations at the lower final inflow rate of 1,842 cfs.
Downstream Boundary Condition
The downstream boundary condition for the model simulations is the still water elevation associated with the FEMA
BFE. As noted earlier, FEMA published still water elevations are not available in the project area. Therefore, the
still water elevation must be obtained by removal of the wave component of the flood. The ERHS, parks and
shoreline improvements along the Mill River between Sunrise Highway on the north and Pearl Street on the south
are within the FEMA floodplain inundation Zone AE. As stated in the Nassau County Flood Insurance study (FEMA,
2009), areas identified as Zone AE are special flood hazard areas subject to inundation by the one percent annual
chance flood (100-year MRI storm event) and have coincident waves with a height of 3 ft or less. A detailed hydraulic
analysis was performed by FEMA in order to determine the water surface elevations of the one percent chance
annual flood and represented as Base Flood Elevations (BFEs). The FEMA BFEs for the project site ranges from
9 to 11 ft in existing conditions according to the Flood Insurance Rate Maps (FIRM) Numbers 36059C0218G and
36059C0219G which were revised on September 11, 2009.
Flooding in the lower Mill River extending from Sunrise Highway to its discharge into West Hempstead Bay is
primarily a tidal flood condition and not a river flood condition. This is apparent from the FEMA flood mapping for
this portion of the river. The current FEMA Flood Insurance Study (FIS, 2009) lists the stillwater elevation at the
mouth of the Mill River adjacent to Bay Park as +8.7 ft NAVD 88.
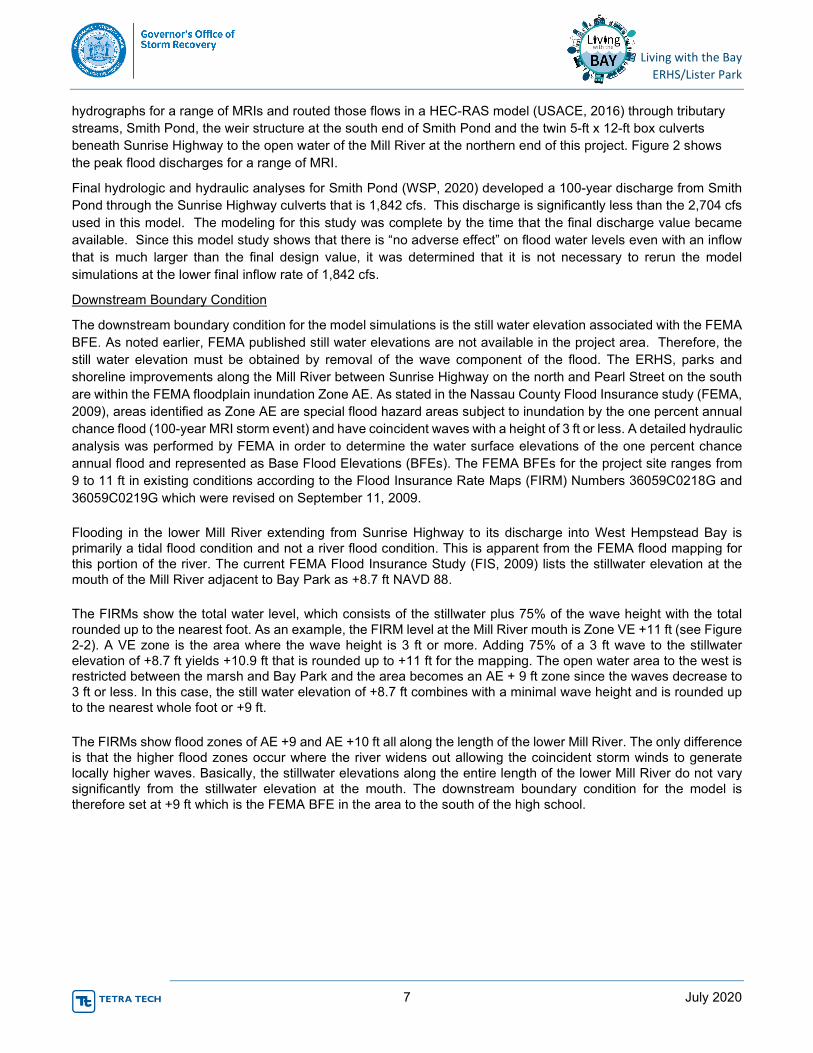
The FIRMs show the total water level, which consists of the stillwater plus 75% of the wave height with the total
rounded up to the nearest foot. As an example, the FIRM level at the Mill River mouth is Zone VE +11 ft (see Figure
2-2). A VE zone is the area where the wave height is 3 ft or more. Adding 75% of a 3 ft wave to the stillwater
elevation of +8.7 ft yields +10.9 ft that is rounded up to +11 ft for the mapping. The open water area to the west is restricted between the marsh and Bay Park and the area becomes an AE + 9 ft zone since the waves decrease to
3 ft or less. In this case, the still water elevation of +8.7 ft combines with a minimal wave height and is rounded up
to the nearest whole foot or +9 ft.
The FIRMs show flood zones of AE +9 and AE +10 ft all along the length of the lower Mill River. The only difference
is that the higher flood zones occur where the river widens out allowing the coincident storm winds to generate
locally higher waves. Basically, the stillwater elevations along the entire length of the lower Mill River do not vary
significantly from the stillwater elevation at the mouth. The downstream boundary condition for the model is
therefore set at +9 ft which is the FEMA BFE in the area to the south of the high school.
Living with the Bay
ERHS/Lister Park
8 July 2020
.
Figure 2-2 FEMA FIRMette at Mouth of the Mill River
Living with the Bay
ERHS/Lister Park
9 July 2020
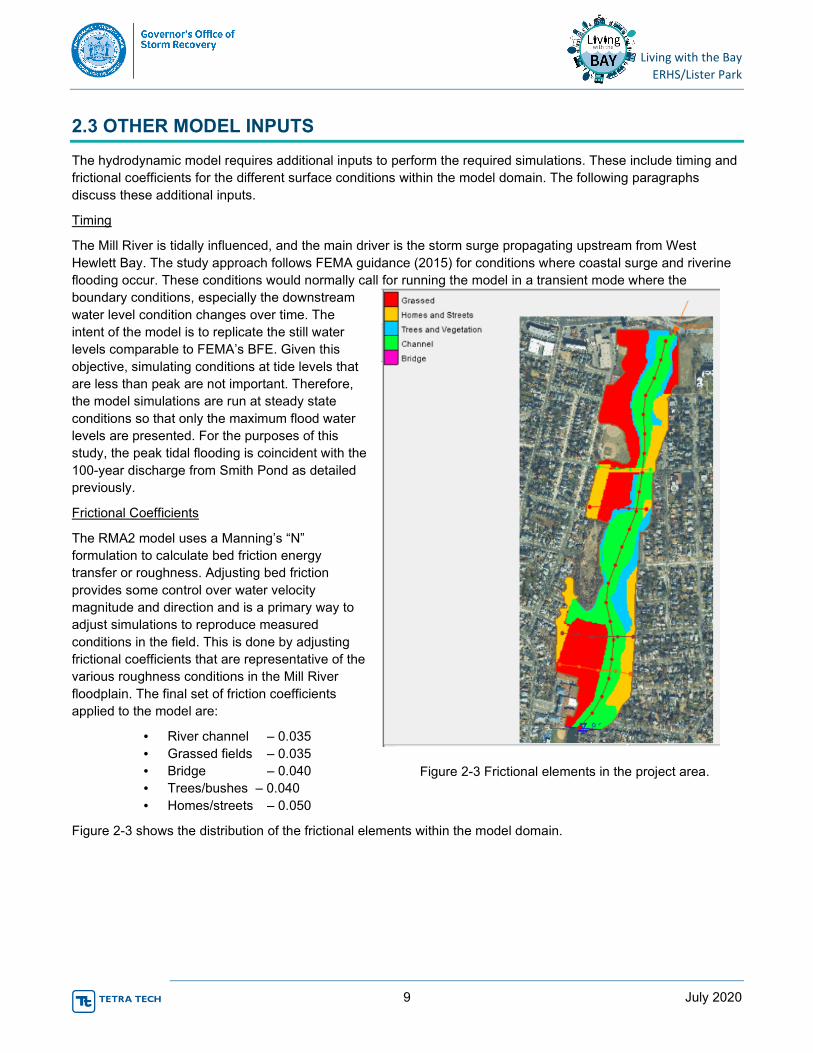
2.3 OTHER MODEL INPUTS
The hydrodynamic model requires additional inputs to perform the required simulations. These include timing and
frictional coefficients for the different surface conditions within the model domain. The following paragraphs
discuss these additional inputs.
Timing
The Mill River is tidally influenced, and the main driver is the storm surge propagating upstream from West
Hewlett Bay. The study approach follows FEMA guidance (2015) for conditions where coastal surge and riverine
flooding occur. These conditions would normally call for running the model in a transient mode where the
boundary conditions, especially the downstream
water level condition changes over time. The
intent of the model is to replicate the still water
levels comparable to FEMA’s BFE. Given this
objective, simulating conditions at tide levels that
are less than peak are not important. Therefore,
the model simulations are run at steady state
conditions so that only the maximum flood water
levels are presented. For the purposes of this
study, the peak tidal flooding is coincident with the
100-year discharge from Smith Pond as detailed
previously.
Frictional Coefficients
The RMA2 model uses a Manning’s “N”
formulation to calculate bed friction energy
transfer or roughness. Adjusting bed friction
provides some control over water velocity
magnitude and direction and is a primary way to
adjust simulations to reproduce measured
conditions in the field. This is done by adjusting
frictional coefficients that are representative of the
various roughness conditions in the Mill River
floodplain. The final set of friction coefficients
applied to the model are:
• River channel – 0.035
• Grassed fields – 0.035
• Bridge – 0.040
• Trees/bushes – 0.040
• Homes/streets – 0.050
Figure 2-3 shows the distribution of the frictional elements within the model domain.
Figure 2-3 Frictional elements in the project area.
Living with the Bay
ERHS/Lister Park
10 July 2020
3.0 MODEL SIMULATION RESULTS
Model simulations were completed for two cases:
• Base Case – consisting of the current topography, 100-year discharge from Smith Pond at the
northern end of the model domain, and 100-year still water elevation at the south end of the
model domain south of the high school, and bottom roughness conditions representative of the
existing features in the flooded area.
• Future Case – same conditions as in the base case except that:
o Elevated bulkhead adjacent to ERHS athletic field
o Elevation of the ERHS athletic field is raised by 2 ft to elevation +7 ft NAVD 88 by the
ERSD however the school district’s is still finalizing the design.
o Model elements located west of the flood protection berm and knee wall are disabled so
that no flow can pass through the area
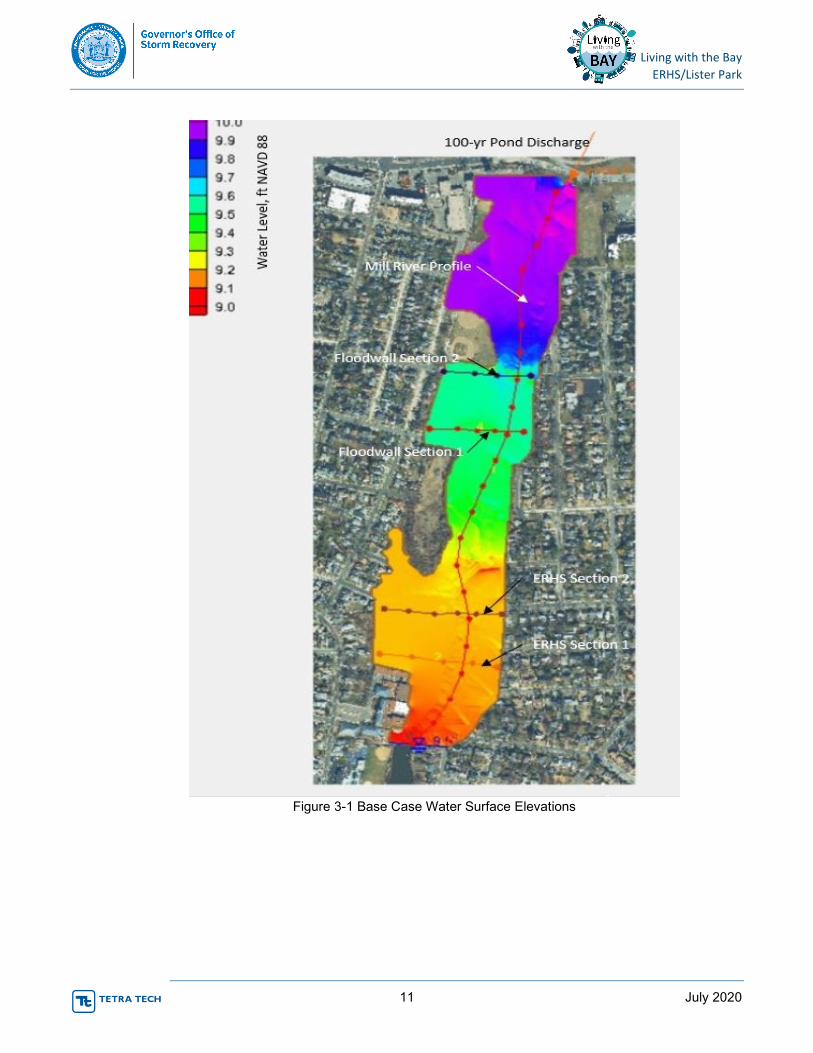
Figure 3-1 shows the water surface elevation for the base case. The water elevations range from +9 ft NAVD 88
at the south end of the model up to nearly 10 ft at Sunrise Highway. The figure also includes dotted lines that run
along and across the river channel. The points along these lines represent the points where river profile and
section elevations are extracted from the model results to create the plots. The section lines represent model
data points at the upstream and downstream sections where the elevated athletic field and the East Side flood
berm/knee walls are located.
Living with the Bay
ERHS/Lister Park
11 July 2020
Figure 3-1 Base Case Water Surface Elevations
Living with the Bay
ERHS/Lister Park
12 July 2020
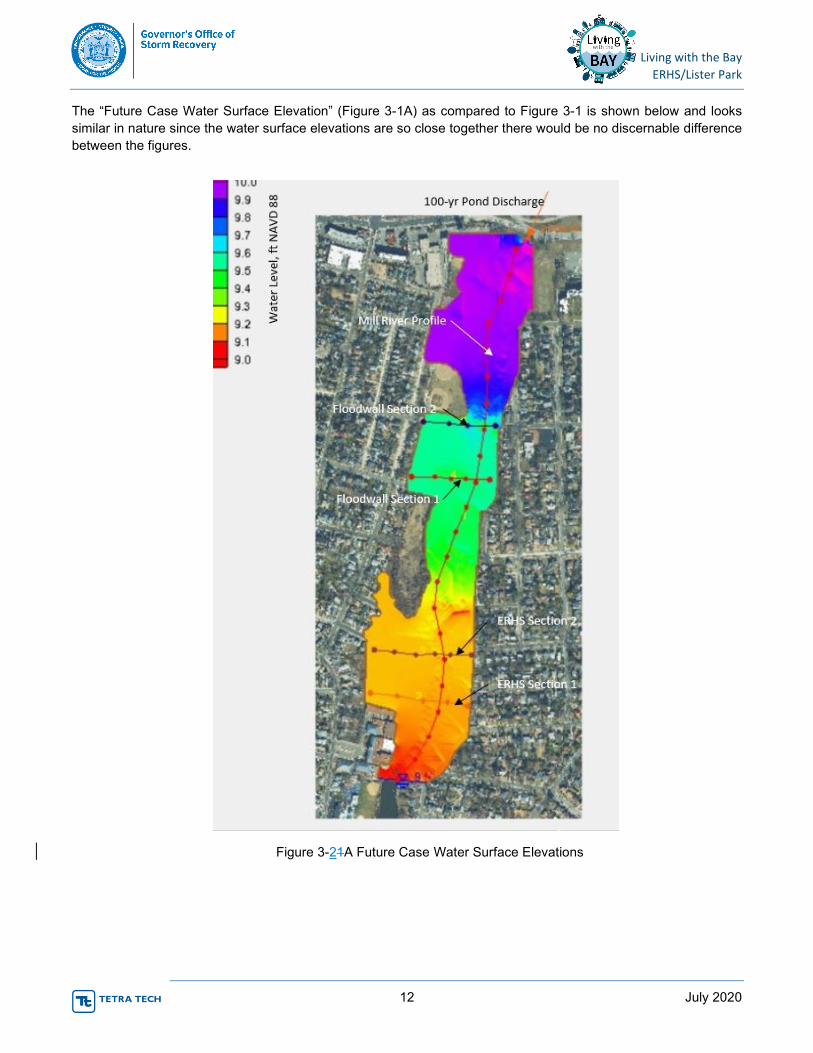
The “Future Case Water Surface Elevation” (Figure 3-1A) as compared to Figure 3-1 is shown below and looks
similar in nature since the water surface elevations are so close together there would be no discernable difference
between the figures.
Figure 3-21A Future Case Water Surface Elevations
Living with the Bay
ERHS/Lister Park
13 July 2020
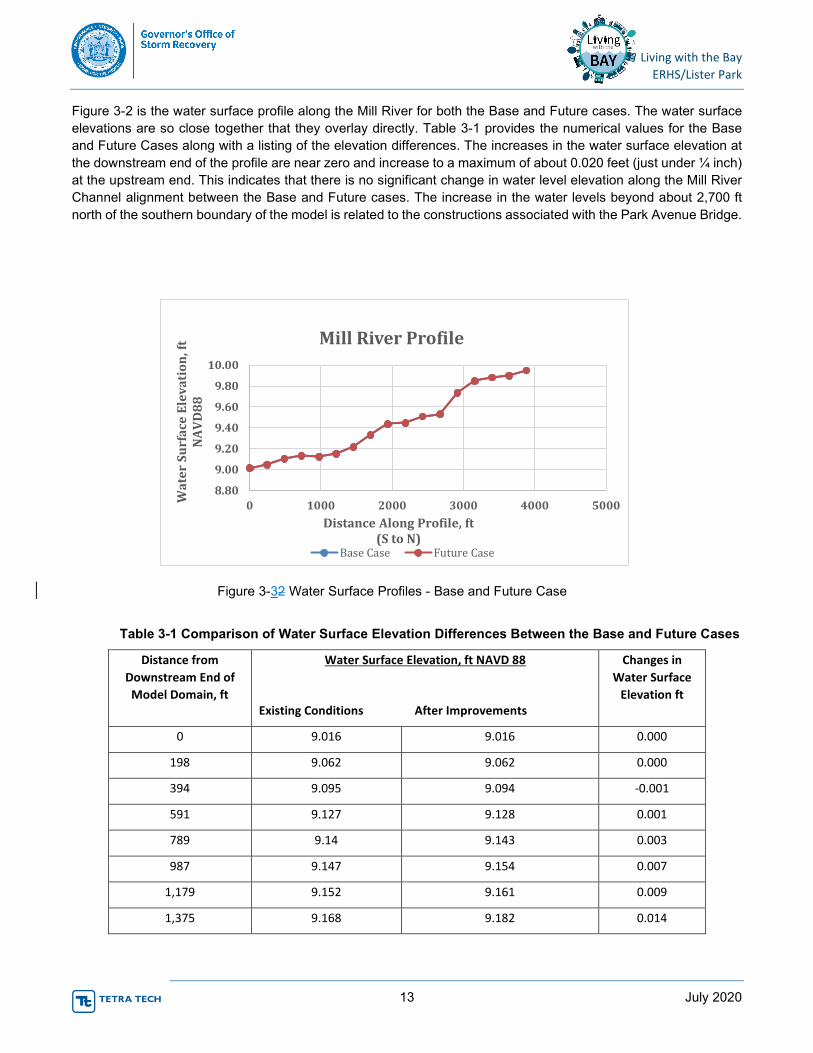
Figure 3-2 is the water surface profile along the Mill River for both the Base and Future cases. The water surface
elevations are so close together that they overlay directly. Table 3-1 provides the numerical values for the Base
and Future Cases along with a listing of the elevation differences. The increases in the water surface elevation at
the downstream end of the profile are near zero and increase to a maximum of about 0.020 feet (just under ¼ inch)
at the upstream end. This indicates that there is no significant change in water level elevation along the Mill River
Channel alignment between the Base and Future cases. The increase in the water levels beyond about 2,700 ft
north of the southern boundary of the model is related to the constructions associated with the Park Avenue Bridge.
Table 3-1 Comparison of Water Surface Elevation Differences Between the Base and Future Cases
Distance from
Downstream End of
Model Domain, ft
Water Surface Elevation, ft NAVD 88
Existing Conditions After Improvements
Changes in
Water Surface
Elevation ft
0 9.016 9.016 0.000
198 9.062 9.062 0.000
394 9.095 9.094 -0.001
591 9.127 9.128 0.001
789 9.14 9.143 0.003
987 9.147 9.154 0.007
1,179 9.152 9.161 0.009
1,375 9.168 9.182 0.014
8.80
9.00
9.20
9.40
9.60
9.80
10.00
0 1000 2000 3000 4000 5000
Wa
ter
Su
rfa
ce
Ele
va
tio
n,
ft
NA
VD
88
Distance Along Profile, ft
(S to N)
Mill River Profile
Base Case Future Case
Figure 3-32 Water Surface Profiles - Base and Future Case
Living with the Bay
ERHS/Lister Park
14 July 2020
1,571 9.288 9.301 0.013
1,769 9.369 9.382 0.013
1,967 9.437 9.449 0.012
2,165 9.435 9.447 0.012
2,362 9.484 9.496 0.012
2,560 9.513 9.529 0.016
2,758 9.534 9.555 0.021
2,955 9.736 9.757 0.021
3,153 9.829 9.849 0.020
3,350 9.882 9.902 0.020
3,546 9.902 9.922 0.020
3,744 9.908 9.928 0.020
3,942 9.919 9.939 0.020
4,139 9.884 9.904 0.020
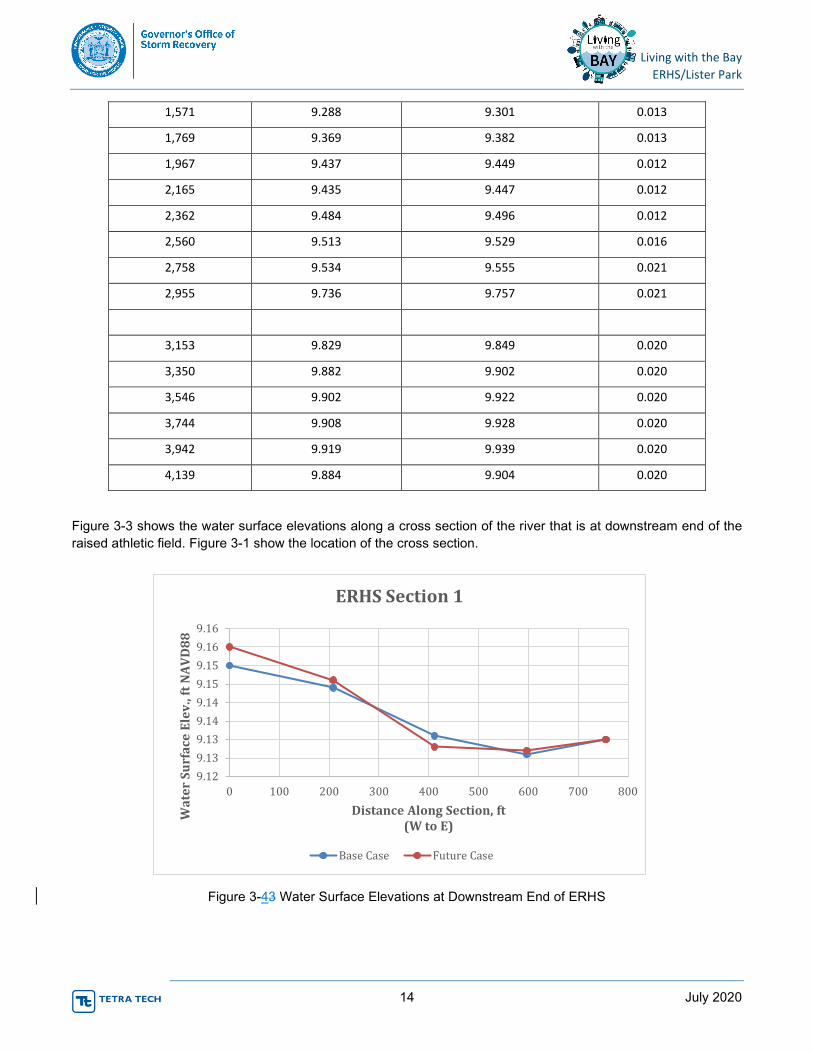
Figure 3-3 shows the water surface elevations along a cross section of the river that is at downstream end of the
raised athletic field. Figure 3-1 show the location of the cross section.
9.12
9.13
9.13
9.14
9.14
9.15
9.15
9.16
9.16
0 100 200 300 400 500 600 700 800
Wa
ter
Su
rfa
ce
Ele
v.,
ft N
AV
D8
8
Distance Along Section, ft
(W to E)
ERHS Section 1
Base Case Future Case
Figure 3-43 Water Surface Elevations at Downstream End of ERHS
Living with the Bay
ERHS/Lister Park
15 July 2020
The athletic field is on the left side of the figure and the river channel is on the right. The elevation scale is highly
exaggerated relative to the vertical to demonstrate the very small differences is water surface elevation. The
maximum difference in water surface elevations is 0.01 ft or about or about 1/8th of an inch.
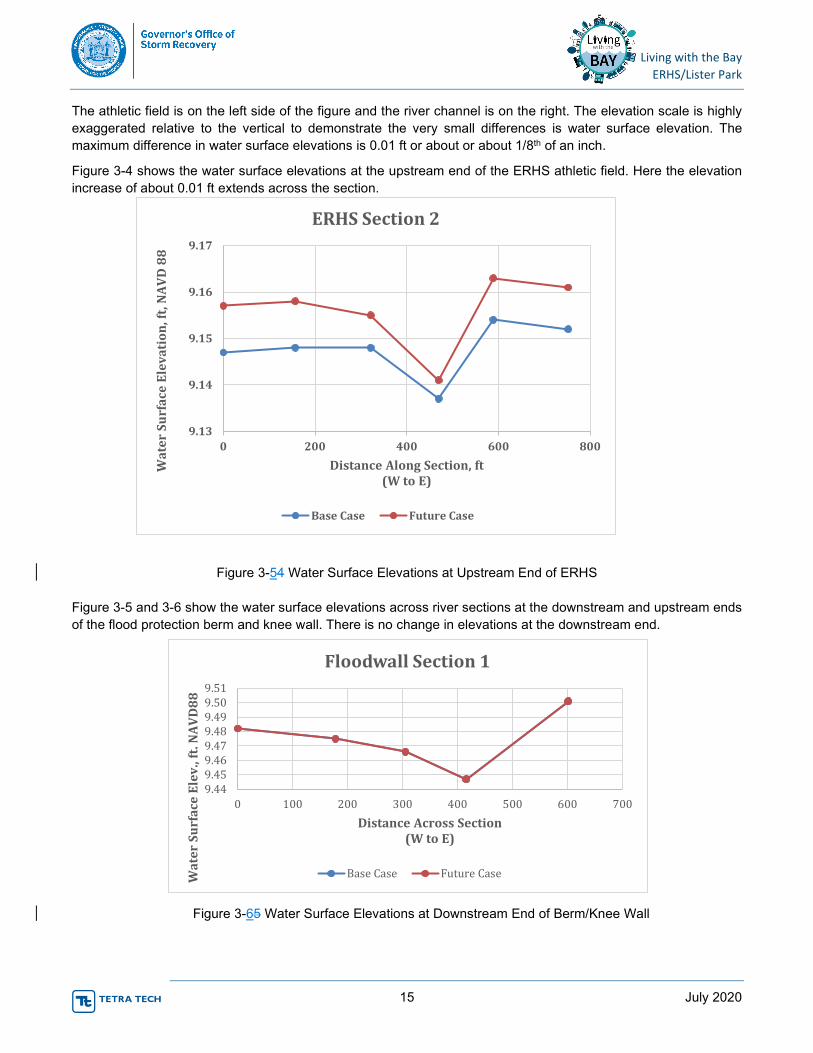
Figure 3-4 shows the water surface elevations at the upstream end of the ERHS athletic field. Here the elevation
increase of about 0.01 ft extends across the section.
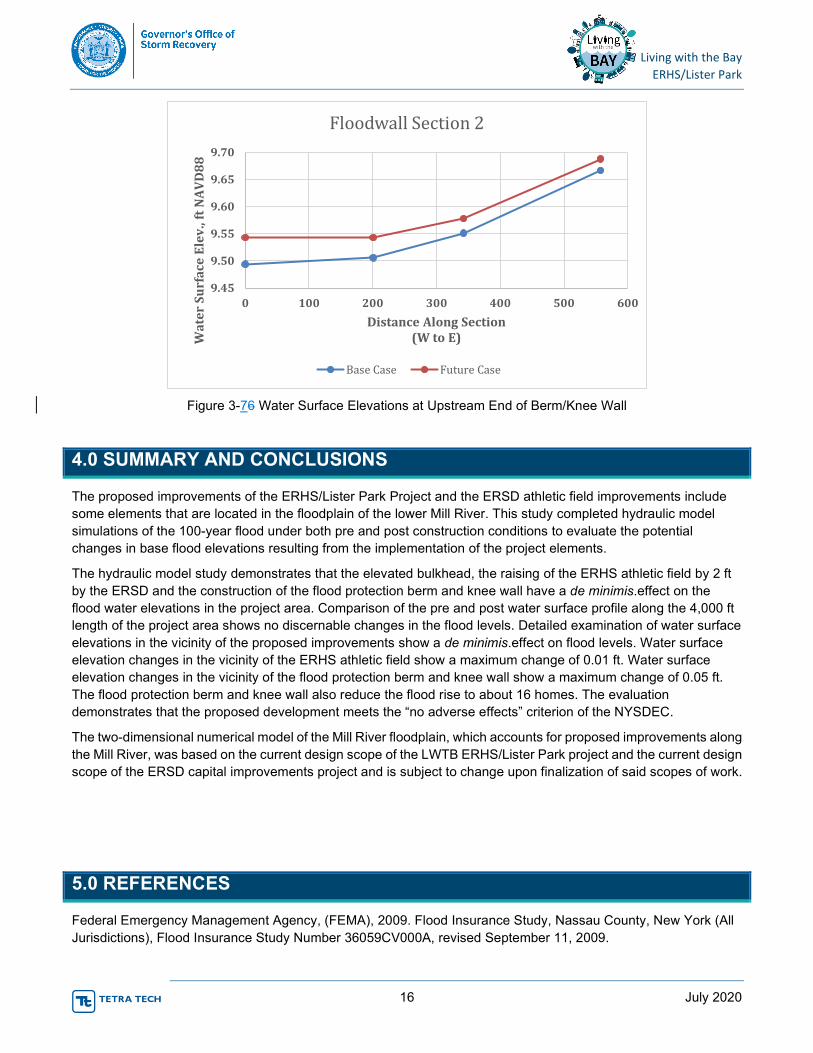
Figure 3-5 and 3-6 show the water surface elevations across river sections at the downstream and upstream ends
of the flood protection berm and knee wall. There is no change in elevations at the downstream end.
9.13
9.14
9.15
9.16
9.17
0 200 400 600 800
Wa
ter
Su
rfa
ce
Ele
va
tio
n,
ft,
NA
VD
88
Distance Along Section, ft
(W to E)
ERHS Section 2
Base Case Future Case
Figure 3-54 Water Surface Elevations at Upstream End of ERHS
9.44
9.45
9.46
9.47
9.48
9.49
9.50
9.51
0 100 200 300 400 500 600 700
Wa
ter
Su
rfa
ce
Ele
v.,
ft. N
AV
D8
8
Distance Across Section
(W to E)
Floodwall Section 1
Base Case Future Case
Figure 3-65 Water Surface Elevations at Downstream End of Berm/Knee Wall
Living with the Bay
ERHS/Lister Park
16 July 2020
4.0 SUMMARY AND CONCLUSIONS
The proposed improvements of the ERHS/Lister Park Project and the ERSD athletic field improvements include
some elements that are located in the floodplain of the lower Mill River. This study completed hydraulic model
simulations of the 100-year flood under both pre and post construction conditions to evaluate the potential
changes in base flood elevations resulting from the implementation of the project elements.
The hydraulic model study demonstrates that the elevated bulkhead, the raising of the ERHS athletic field by 2 ft
by the ERSD and the construction of the flood protection berm and knee wall have a de minimis.effect on the
flood water elevations in the project area. Comparison of the pre and post water surface profile along the 4,000 ft
length of the project area shows no discernable changes in the flood levels. Detailed examination of water surface
elevations in the vicinity of the proposed improvements show a de minimis.effect on flood levels. Water surface
elevation changes in the vicinity of the ERHS athletic field show a maximum change of 0.01 ft. Water surface
elevation changes in the vicinity of the flood protection berm and knee wall show a maximum change of 0.05 ft.
The flood protection berm and knee wall also reduce the flood rise to about 16 homes. The evaluation
demonstrates that the proposed development meets the “no adverse effects” criterion of the NYSDEC.
The two-dimensional numerical model of the Mill River floodplain, which accounts for proposed improvements along
the Mill River, was based on the current design scope of the LWTB ERHS/Lister Park project and the current design
scope of the ERSD capital improvements project and is subject to change upon finalization of said scopes of work.
5.0 REFERENCES
Federal Emergency Management Agency, (FEMA), 2009. Flood Insurance Study, Nassau County, New York (All
Jurisdictions), Flood Insurance Study Number 36059CV000A, revised September 11, 2009.
9.45
9.50
9.55
9.60
9.65
9.70
0 100 200 300 400 500 600
Wa
ter
Su
rfa
ce
Ele
v.,
ft N
AV
D8
8
Distance Along Section
(W to E)
Floodwall Section 2
Base Case Future Case
Figure 3-76 Water Surface Elevations at Upstream End of Berm/Knee Wall
Living with the Bay
ERHS/Lister Park
17 July 2020
FEMA, 2015. Guidance for Flood Risk Analysis and Mapping, Combined Coastal and Riverine Floodplain, May,
2015, URL: https://www.fema.gov/guidelines-and-standards-flood-risk-analysis-and-mapping
FEMA, 2020. Hydraulic Numerical Models Meeting the Minimum Requirement of the National Flood Insurance
Program, Currently Nationally Accepted Hydraulic Models, URL: https://www.fema.gov/hydraulic-numerical-
models-meeting-minimum-requirement-national-flood-insurance-program, Accessed 13 February 2020.
NY State Department of Environmental Conservation, 2020. Floodplain Development and Floodway Guidance,
URL: https://www.dec.ny.gov/lands/24281.html, Accessed 13 February 2020.
Tetra Tech, Inc. 2017. Living with the Bay, Smith Pond, Preliminary Design Memorandum, December 15, 2017
US Army Corps of Engineers (USACE),1997. RMA2 WES Version 4.3 Users’ Manual, RMA2 Version 4.35, 1D
and 2D Capability, Code last modified 01-14-1997.
USACE, 2016. HEC-RAS River Analysis System, Hydrologic Engineering Center, URL:
https://www.hec.usace.army.mil/software/hec-ras/documentation/HEC-RAS%205.0%20Users%20Manual.pdf
WSP, 2020. Smith Pond Rehabilitation Project (Project L), Project narrative – 100% Submission, March 5,