Embed Size (px)
Citation preview

1
APPENDIX P. Relative Load Reductions Analysis of Source Sectors and
BMPs in the Jurisdictions’ Phase II Watershed Implementation Plans (WIPs)
Analysis presented to the
BMP Verification Committee: March 13, 2013
Agriculture Workgroup: April 11, 2013
Urban Stormwater Workgroup: May 21, 2013
BMP Verification Review Panel: June 19, 2013
Objectives of analysis
Identify and quantify the relative contribution among source sectors – and the
contribution among BMPs within those sectors – to the nutrient and sediment load
reductions needed to achieve the Phase II Watershed Implementation Plan (WIP) loading
goals.
Methods
Create a NO ACTION Scenario.
Determine load reductions between Phase II WIP Scenario and NO ACTION.
Isolate each BMP in a separate scenario using Scenario Builder processing rules.
Determine load reductions from the isolated BMP scenario to the NO ACTION.
Compare the load reductions from the isolated scenarios to those from the Phase II WIP
to determine a percent share of the reductions attributable to each BMP.
For wastewater, the contribution to the total load reduction compares current
discharges (2011) to WIP discharges while BMPs outside wastewater compare No-
Action to WIPs.
Table 1. Most Common Agricultural BMP Phase II WIP Acres Watershed-Wide
BMP Acres
Conservation Plans 6,811,304
Enhanced Nutrient Application Management 2,082,419
Other Conservation-Till 2,002,283
Decision Agriculture 1,143,587
Cover Crop 1,136,034
Nutrient Application Management on Pasture 1,033,992
Nutrient Application Management on Crop 995,989
Prescribed Grazing 948,389
Land Retirement 609,407
Liquid & Poultry Injection 371,823
Continuous NoTill 321,901
Commodity Cover Crop 307,143
Precision Intensive Rotational Grazing 286,210
Forest Buffers 277,913
Crop Irrigation Management 251,767
Appendix P
2
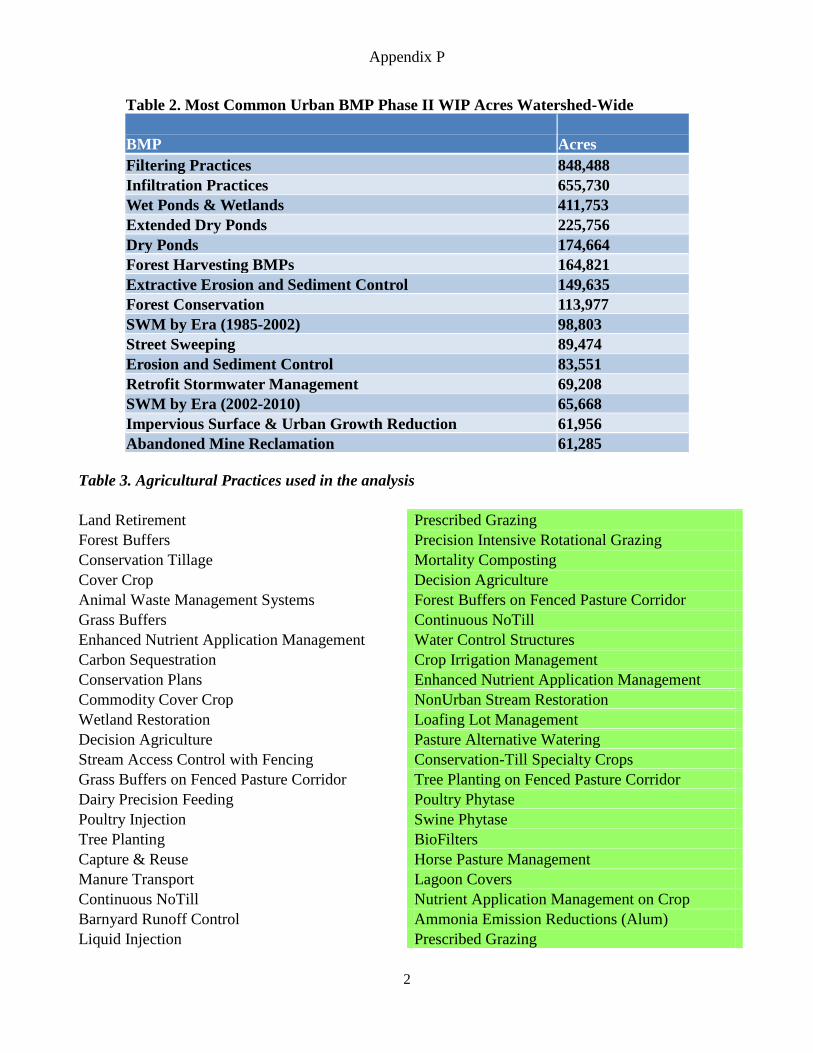
Table 2. Most Common Urban BMP Phase II WIP Acres Watershed-Wide
BMP Acres
Filtering Practices 848,488
Infiltration Practices 655,730
Wet Ponds & Wetlands 411,753
Extended Dry Ponds 225,756
Dry Ponds 174,664
Forest Harvesting BMPs 164,821
Extractive Erosion and Sediment Control 149,635
Forest Conservation 113,977
SWM by Era (1985-2002) 98,803
Street Sweeping 89,474
Erosion and Sediment Control 83,551
Retrofit Stormwater Management 69,208
SWM by Era (2002-2010) 65,668
Impervious Surface & Urban Growth Reduction 61,956
Abandoned Mine Reclamation 61,285
Table 3. Agricultural Practices used in the analysis
Land Retirement Prescribed Grazing
Forest Buffers Precision Intensive Rotational Grazing
Conservation Tillage Mortality Composting
Cover Crop Decision Agriculture
Animal Waste Management Systems Forest Buffers on Fenced Pasture Corridor
Grass Buffers Continuous NoTill
Enhanced Nutrient Application Management Water Control Structures
Carbon Sequestration Crop Irrigation Management
Conservation Plans Enhanced Nutrient Application Management
Commodity Cover Crop NonUrban Stream Restoration
Wetland Restoration Loafing Lot Management
Decision Agriculture Pasture Alternative Watering
Stream Access Control with Fencing Conservation-Till Specialty Crops
Grass Buffers on Fenced Pasture Corridor Tree Planting on Fenced Pasture Corridor
Dairy Precision Feeding Poultry Phytase
Poultry Injection Swine Phytase
Tree Planting BioFilters
Capture & Reuse Horse Pasture Management
Manure Transport Lagoon Covers
Continuous NoTill Nutrient Application Management on Crop
Barnyard Runoff Control Ammonia Emission Reductions (Alum)
Liquid Injection Prescribed Grazing
Appendix P
3
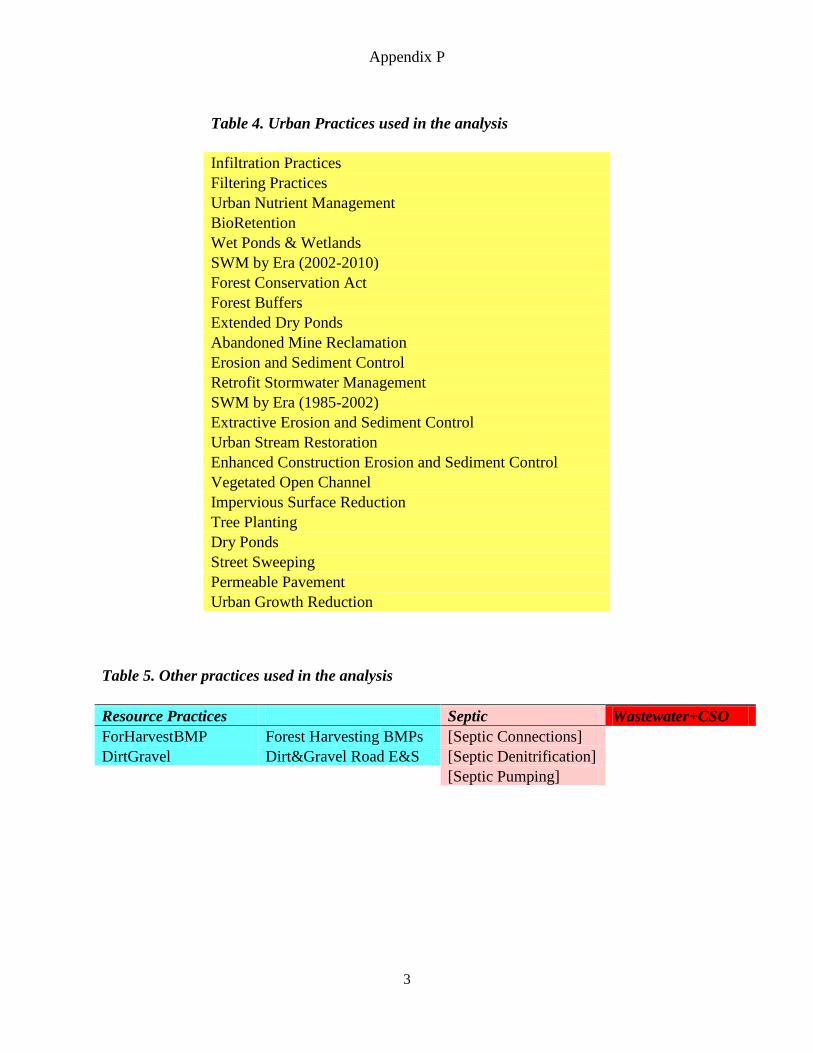
Table 4. Urban Practices used in the analysis
Infiltration Practices
Filtering Practices
Urban Nutrient Management
BioRetention
Wet Ponds & Wetlands
SWM by Era (2002-2010)
Forest Conservation Act
Forest Buffers
Extended Dry Ponds
Abandoned Mine Reclamation
Erosion and Sediment Control
Retrofit Stormwater Management
SWM by Era (1985-2002)
Extractive Erosion and Sediment Control
Urban Stream Restoration
Enhanced Construction Erosion and Sediment Control
Vegetated Open Channel
Impervious Surface Reduction
Tree Planting
Dry Ponds
Street Sweeping
Permeable Pavement
Urban Growth Reduction
Table 5. Other practices used in the analysis
Resource Practices Septic Wastewater+CSO
ForHarvestBMP Forest Harvesting BMPs [Septic Connections]
DirtGravel Dirt&Gravel Road E&S [Septic Denitrification]
[Septic Pumping]
Appendix P
4
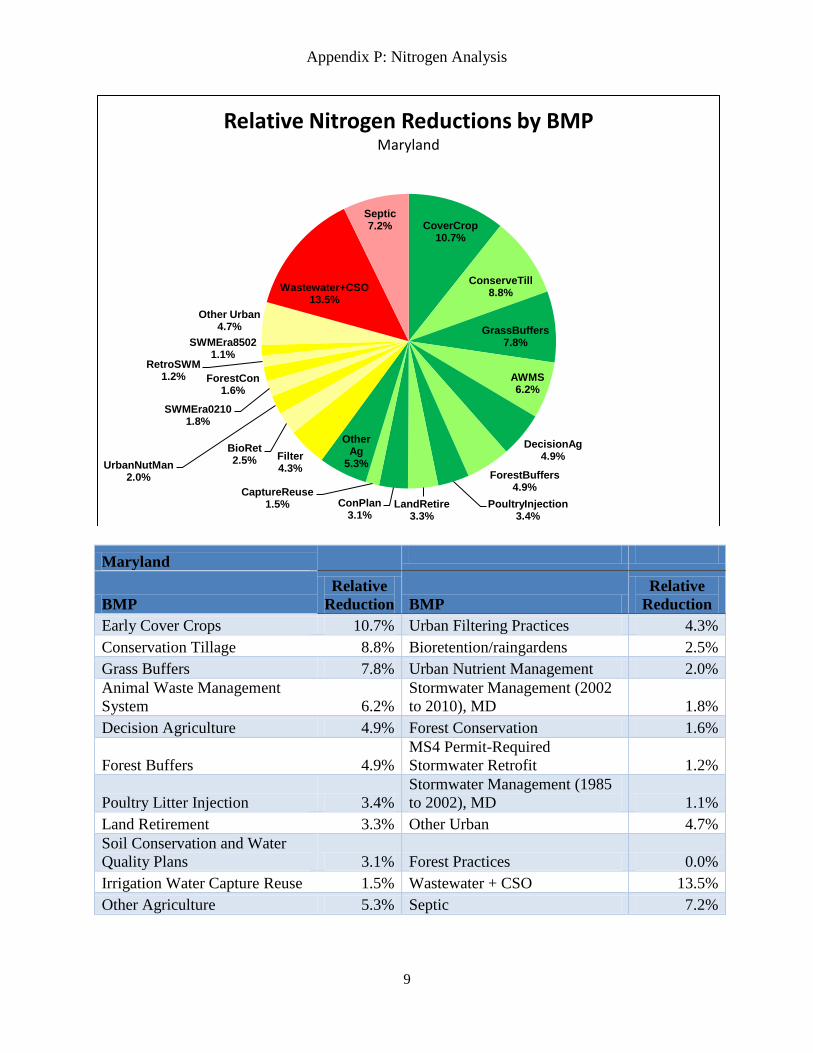
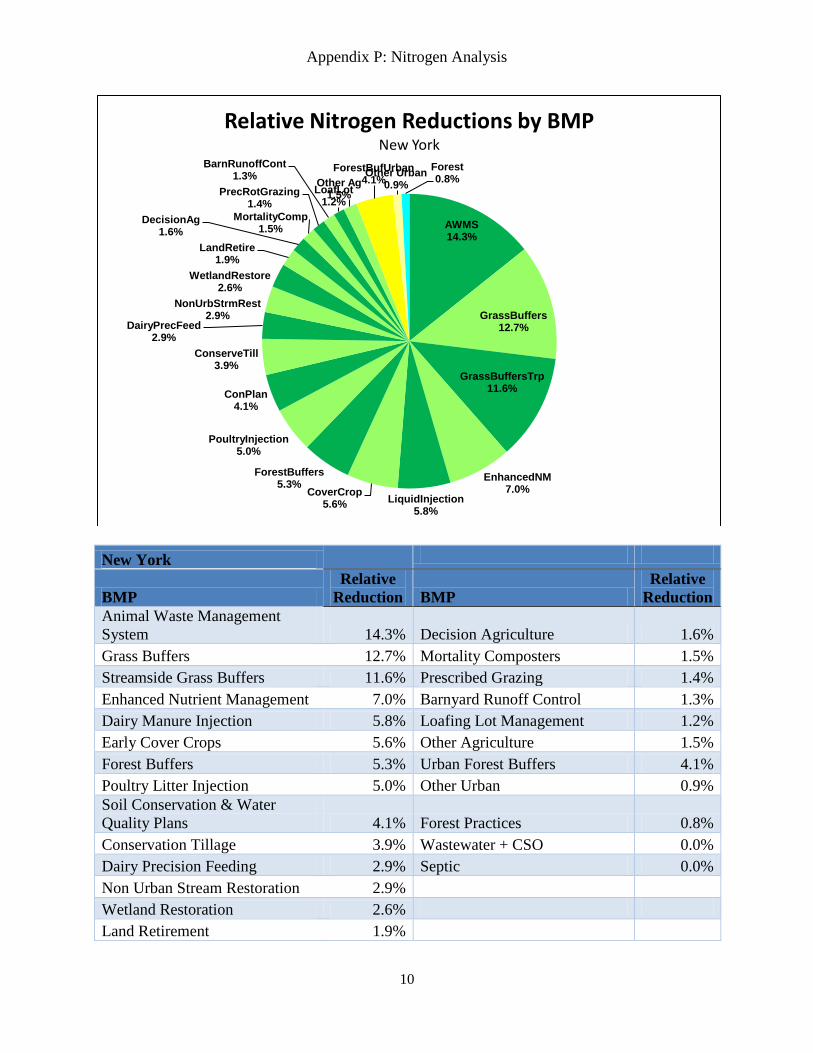
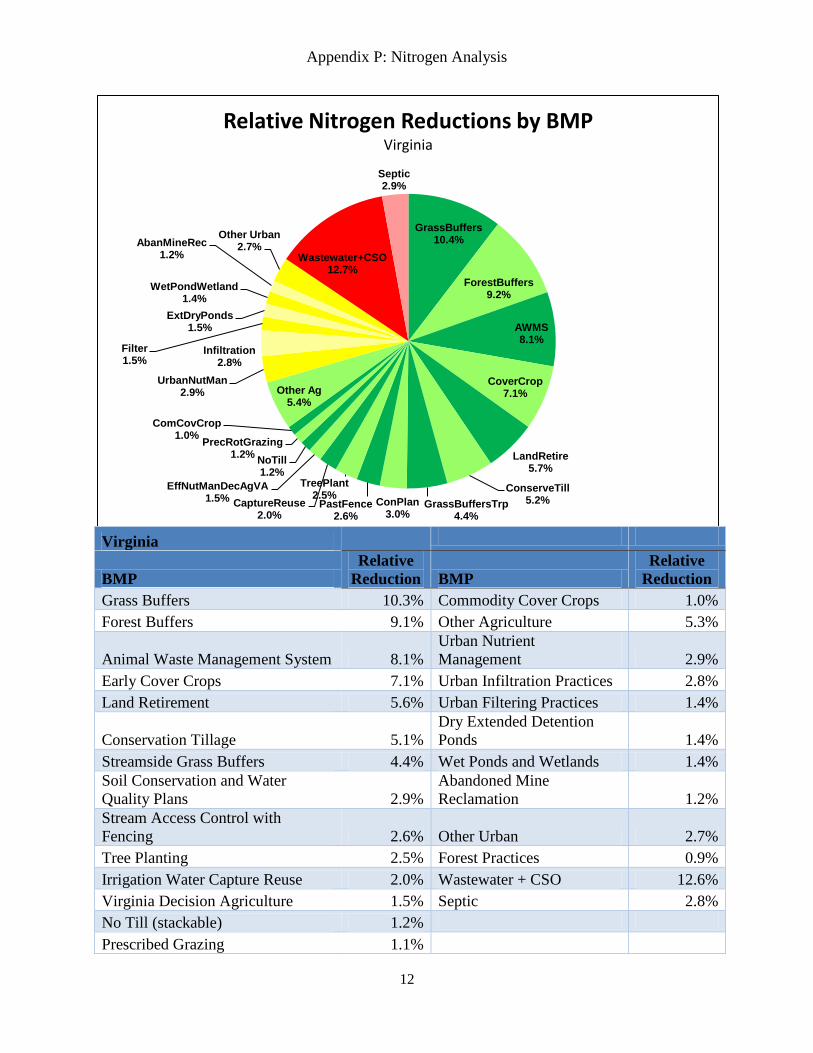
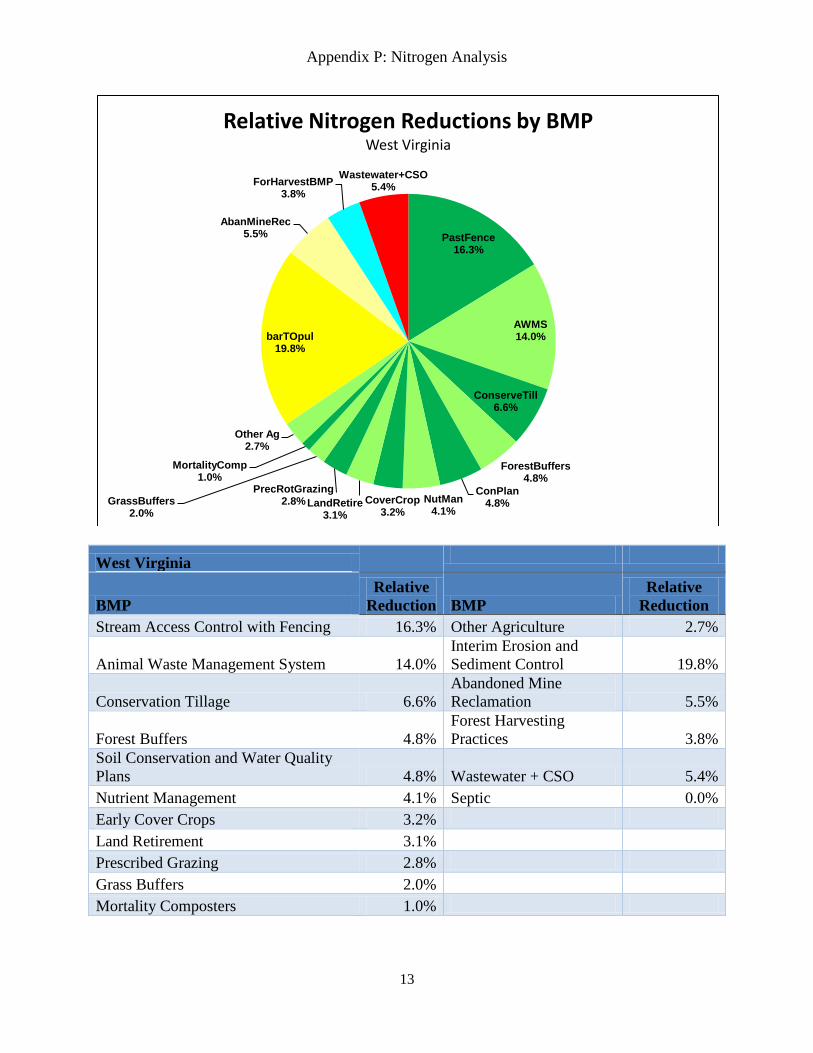
Key for the following charts:
Green = Relative reduction from an agricultural BMP (from no action scenario)
Yellow = Relative reduction from an urban stormwater BMP (from no action scenario)
Red = Wastewater + CSO reductions (from current 2011 load)
Pink = Septic reductions (from no action scenario)
Each slice in the following pie charts represents the percent of the total load reduction
attributable to planned implementation levels for that BMP. For example, for the pie chart
“Relative Nitrogen Reductions by BMP – Chesapeake Bay Watershed”, land retirement
represents 12.2% of the nitrogen reduction currently planned for by 2025, OR (85.6 million) X
(.12) = 10.3 million pounds of N reduced. The retirement includes maintaining historic levels as
well as new retirement called for in the states’ plans.

Appendix P: Nitrogen Analysis
5
Agriculture, 63.05
Urban Runoff, 14.45
Wastewater+CSO, 5.96
Septic, 2.14
Nitrogen Relative Load Reductions Chesapeake Watershed, absolute million lbs
Appendix P: Nitrogen Analysis
6
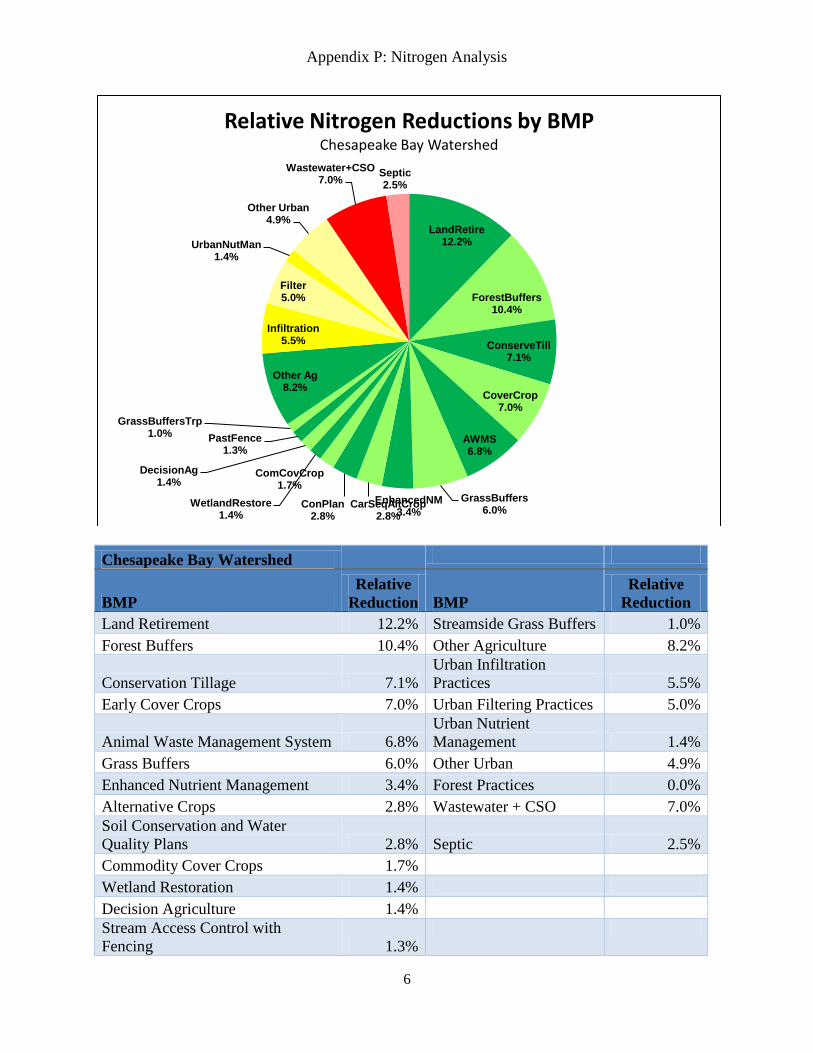
Chesapeake Bay Watershed
BMP
Relative
Reduction BMP
Relative
Reduction
Land Retirement 12.2% Streamside Grass Buffers 1.0%
Forest Buffers 10.4% Other Agriculture 8.2%
Conservation Tillage 7.1%
Urban Infiltration
Practices 5.5%
Early Cover Crops 7.0% Urban Filtering Practices 5.0%
Animal Waste Management System 6.8%
Urban Nutrient
Management 1.4%
Grass Buffers 6.0% Other Urban 4.9%
Enhanced Nutrient Management 3.4% Forest Practices 0.0%
Alternative Crops 2.8% Wastewater + CSO 7.0%
Soil Conservation and Water
Quality Plans 2.8% Septic 2.5%
Commodity Cover Crops 1.7%
Wetland Restoration 1.4%
Decision Agriculture 1.4%
Stream Access Control with
Fencing 1.3%
LandRetire 12.2%
ForestBuffers 10.4%
ConserveTill 7.1%
CoverCrop 7.0%
AWMS 6.8%
GrassBuffers 6.0%
EnhancedNM 3.4%
CarSeqAltCrop 2.8%
ConPlan 2.8%
ComCovCrop 1.7%
WetlandRestore 1.4%
DecisionAg 1.4%
PastFence 1.3%
GrassBuffersTrp 1.0%
Other Ag 8.2%
Infiltration 5.5%
Filter 5.0%
UrbanNutMan 1.4%
Other Urban 4.9%
Wastewater+CSO 7.0%
Septic 2.5%
Relative Nitrogen Reductions by BMP Chesapeake Bay Watershed
Appendix P: Nitrogen Analysis
7
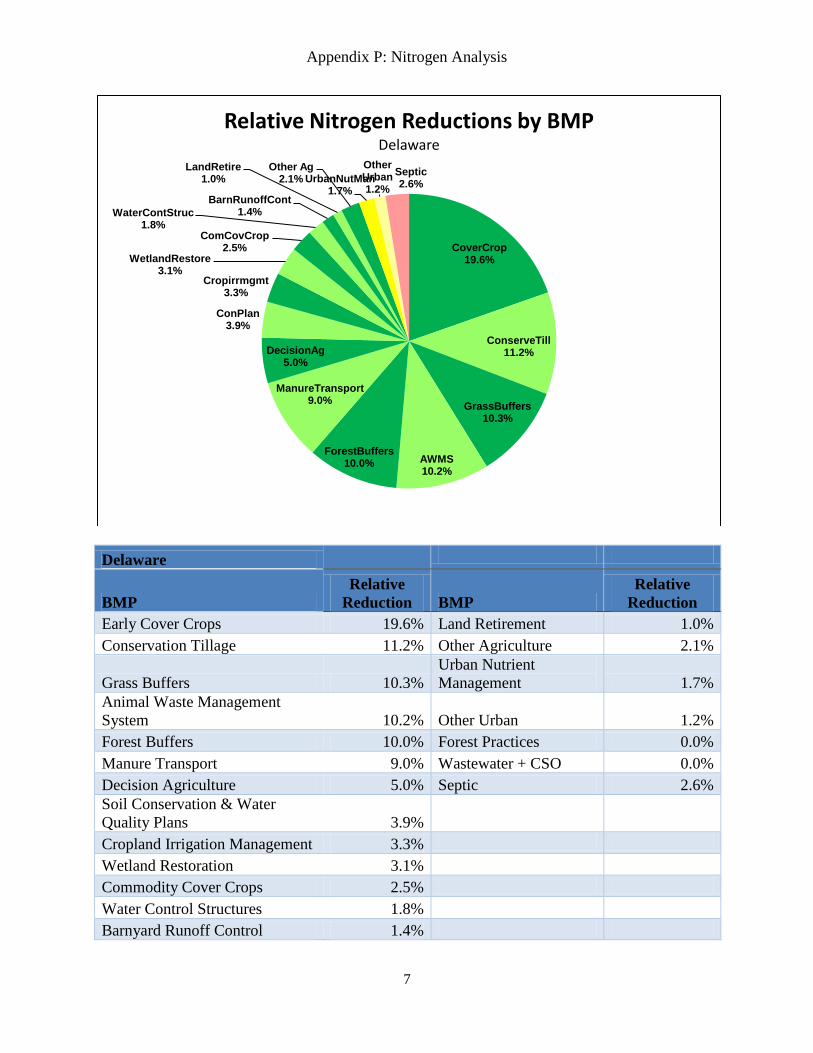
Delaware
BMP
Relative
Reduction BMP
Relative
Reduction
Early Cover Crops 19.6% Land Retirement 1.0%
Conservation Tillage 11.2% Other Agriculture 2.1%
Grass Buffers 10.3%
Urban Nutrient
Management 1.7%
Animal Waste Management
System 10.2% Other Urban 1.2%
Forest Buffers 10.0% Forest Practices 0.0%
Manure Transport 9.0% Wastewater + CSO 0.0%
Decision Agriculture 5.0% Septic 2.6%
Soil Conservation & Water
Quality Plans 3.9%
Cropland Irrigation Management 3.3%
Wetland Restoration 3.1%
Commodity Cover Crops 2.5%
Water Control Structures 1.8%
Barnyard Runoff Control 1.4%
CoverCrop 19.6%
ConserveTill 11.2%
GrassBuffers 10.3%
AWMS 10.2%
ForestBuffers 10.0%
ManureTransport 9.0%
DecisionAg 5.0%
ConPlan 3.9%
Cropirrmgmt 3.3%
WetlandRestore 3.1%
ComCovCrop 2.5%
WaterContStruc 1.8%
BarnRunoffCont 1.4%
LandRetire 1.0%
Other Ag 2.1% UrbanNutMan
1.7%
Other Urban 1.2%
Septic 2.6%
Relative Nitrogen Reductions by BMP Delaware
Appendix P: Nitrogen Analysis
8
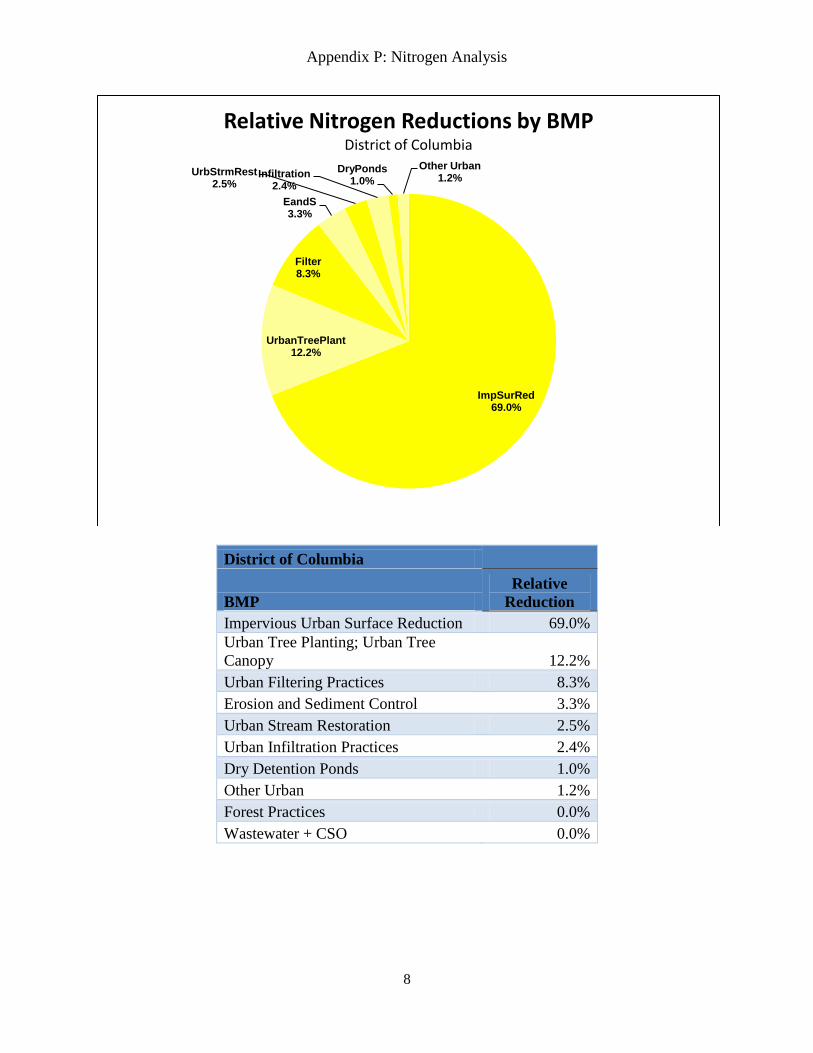
District of Columbia
BMP
Relative
Reduction
Impervious Urban Surface Reduction 69.0%
Urban Tree Planting; Urban Tree
Canopy 12.2%
Urban Filtering Practices 8.3%
Erosion and Sediment Control 3.3%
Urban Stream Restoration 2.5%
Urban Infiltration Practices 2.4%
Dry Detention Ponds 1.0%
Other Urban 1.2%
Forest Practices 0.0%
Wastewater + CSO 0.0%
ImpSurRed 69.0%
UrbanTreePlant 12.2%
Filter 8.3%
EandS 3.3%
UrbStrmRest 2.5%
Infiltration 2.4%
DryPonds 1.0%
Other Urban 1.2%
Relative Nitrogen Reductions by BMP District of Columbia
Appendix P: Nitrogen Analysis
9
Maryland
BMP
Relative
Reduction BMP
Relative
Reduction
Early Cover Crops 10.7% Urban Filtering Practices 4.3%
Conservation Tillage 8.8% Bioretention/raingardens 2.5%
Grass Buffers 7.8% Urban Nutrient Management 2.0%
Animal Waste Management
System 6.2%
Stormwater Management (2002
to 2010), MD 1.8%
Decision Agriculture 4.9% Forest Conservation 1.6%
Forest Buffers 4.9%
MS4 Permit-Required
Stormwater Retrofit 1.2%
Poultry Litter Injection 3.4%
Stormwater Management (1985
to 2002), MD 1.1%
Land Retirement 3.3% Other Urban 4.7%
Soil Conservation and Water
Quality Plans 3.1% Forest Practices 0.0%
Irrigation Water Capture Reuse 1.5% Wastewater + CSO 13.5%
Other Agriculture 5.3% Septic 7.2%
CoverCrop 10.7%
ConserveTill 8.8%
GrassBuffers 7.8%
AWMS 6.2%
DecisionAg 4.9%
ForestBuffers 4.9%
PoultryInjection 3.4%
LandRetire 3.3%
ConPlan 3.1%
CaptureReuse 1.5%
Other Ag
5.3% Filter 4.3%
BioRet 2.5% UrbanNutMan
2.0%
SWMEra0210 1.8%
ForestCon 1.6%
RetroSWM 1.2%
SWMEra8502 1.1%
Other Urban 4.7%
Wastewater+CSO 13.5%
Septic 7.2%
Relative Nitrogen Reductions by BMP Maryland
Appendix P: Nitrogen Analysis
10
New York
BMP
Relative
Reduction BMP
Relative
Reduction
Animal Waste Management
System 14.3% Decision Agriculture 1.6%
Grass Buffers 12.7% Mortality Composters 1.5%
Streamside Grass Buffers 11.6% Prescribed Grazing 1.4%
Enhanced Nutrient Management 7.0% Barnyard Runoff Control 1.3%
Dairy Manure Injection 5.8% Loafing Lot Management 1.2%
Early Cover Crops 5.6% Other Agriculture 1.5%
Forest Buffers 5.3% Urban Forest Buffers 4.1%
Poultry Litter Injection 5.0% Other Urban 0.9%
Soil Conservation & Water
Quality Plans 4.1% Forest Practices 0.8%
Conservation Tillage 3.9% Wastewater + CSO 0.0%
Dairy Precision Feeding 2.9% Septic 0.0%
Non Urban Stream Restoration 2.9%
Wetland Restoration 2.6%
Land Retirement 1.9%
AWMS 14.3%
GrassBuffers 12.7%
GrassBuffersTrp 11.6%
EnhancedNM 7.0%
LiquidInjection 5.8%
CoverCrop 5.6%
ForestBuffers 5.3%
PoultryInjection 5.0%
ConPlan 4.1%
ConserveTill 3.9%
DairyPrecFeed 2.9%
NonUrbStrmRest 2.9%
WetlandRestore 2.6%
LandRetire 1.9%
DecisionAg 1.6%
MortalityComp 1.5%
PrecRotGrazing 1.4%
BarnRunoffCont 1.3%
LoafLot 1.2%
Other Ag 1.5%
ForestBufUrban 4.1% Other Urban
0.9%
Forest 0.8%
Relative Nitrogen Reductions by BMP New York

Appendix P: Nitrogen Analysis
11
Pennsylvania
BMP
Relative
Reduction BMP
Relative
Reduction
Land Retirement 18.2% Other Agriculture 4.4%
Forest Buffers 12.9%
Urban Infiltration
Practices 8.5%
Conservation Tillage 6.9% Urban Filtering Practices 6.7%
Animal Waste Management System 5.8% Other Urban 2.5%
Enhanced Nutrient Management 5.6% Forest Practices 0.0%
Early Cover Crops 5.1% Wastewater + CSO 4.9%
Alternative Crops 4.9% Septic 0.8%
Grass Buffers 3.6%
Commodity Cover Crops 2.5%
Soil Conservation and Water
Quality Plans 2.4%
Wetland Restoration 1.8%
Stream Access Control with
Fencing 1.2%
Dairy Precision Feeding 1.2%
LandRetire 18.2%
ForestBuffers 12.9%
ConserveTill 6.9%
AWMS 5.8%
EnhancedNM 5.6%
CoverCrop 5.1%
CarSeqAltCrop 4.9%
GrassBuffers 3.6%
ComCovCrop 2.5%
ConPlan 2.4%
WetlandRestore 1.8%
PastFence 1.2%
DairyPrecFeed 1.2%
Other Ag 4.4%
Infiltration 8.5%
Filter 6.7%
Other Urban 2.5%
Wastewater+CSO 4.9%
Septic 0.8%
Relative Nitrogen Reductions by BMP Pennsylvania
Appendix P: Nitrogen Analysis
12
Virginia
BMP
Relative
Reduction BMP
Relative
Reduction
Grass Buffers 10.3% Commodity Cover Crops 1.0%
Forest Buffers 9.1% Other Agriculture 5.3%
Animal Waste Management System 8.1%
Urban Nutrient
Management 2.9%
Early Cover Crops 7.1% Urban Infiltration Practices 2.8%
Land Retirement 5.6% Urban Filtering Practices 1.4%
Conservation Tillage 5.1%
Dry Extended Detention
Ponds 1.4%
Streamside Grass Buffers 4.4% Wet Ponds and Wetlands 1.4%
Soil Conservation and Water
Quality Plans 2.9%
Abandoned Mine
Reclamation 1.2%
Stream Access Control with
Fencing 2.6% Other Urban 2.7%
Tree Planting 2.5% Forest Practices 0.9%
Irrigation Water Capture Reuse 2.0% Wastewater + CSO 12.6%
Virginia Decision Agriculture 1.5% Septic 2.8%
No Till (stackable) 1.2%
Prescribed Grazing 1.1%
GrassBuffers 10.4%
ForestBuffers 9.2%
AWMS 8.1%
CoverCrop 7.1%
LandRetire 5.7%
ConserveTill 5.2% GrassBuffersTrp
4.4%
ConPlan 3.0%
PastFence 2.6%
TreePlant 2.5%
CaptureReuse 2.0%
EffNutManDecAgVA 1.5%
NoTill 1.2%
PrecRotGrazing 1.2%
ComCovCrop 1.0%
Other Ag 5.4%
UrbanNutMan 2.9%
Infiltration 2.8%
Filter 1.5%
ExtDryPonds 1.5%
WetPondWetland 1.4%
AbanMineRec 1.2%
Other Urban 2.7%
Wastewater+CSO 12.7%
Septic 2.9%
Relative Nitrogen Reductions by BMP Virginia
Appendix P: Nitrogen Analysis
13
West Virginia
BMP
Relative
Reduction BMP
Relative
Reduction
Stream Access Control with Fencing 16.3% Other Agriculture 2.7%
Animal Waste Management System 14.0%
Interim Erosion and
Sediment Control 19.8%
Conservation Tillage 6.6%
Abandoned Mine
Reclamation 5.5%
Forest Buffers 4.8%
Forest Harvesting
Practices 3.8%
Soil Conservation and Water Quality
Plans 4.8% Wastewater + CSO 5.4%
Nutrient Management 4.1% Septic 0.0%
Early Cover Crops 3.2%
Land Retirement 3.1%
Prescribed Grazing 2.8%
Grass Buffers 2.0%
Mortality Composters 1.0%
PastFence 16.3%
AWMS 14.0%
ConserveTill 6.6%
ForestBuffers 4.8%
ConPlan 4.8% NutMan
4.1% CoverCrop
3.2% LandRetire
3.1%
PrecRotGrazing 2.8% GrassBuffers
2.0%
MortalityComp 1.0%
Other Ag 2.7%
barTOpul 19.8%
AbanMineRec 5.5%
ForHarvestBMP 3.8%
Wastewater+CSO 5.4%
Relative Nitrogen Reductions by BMP West Virginia
Appendix P: Phosphorus Analysis
14
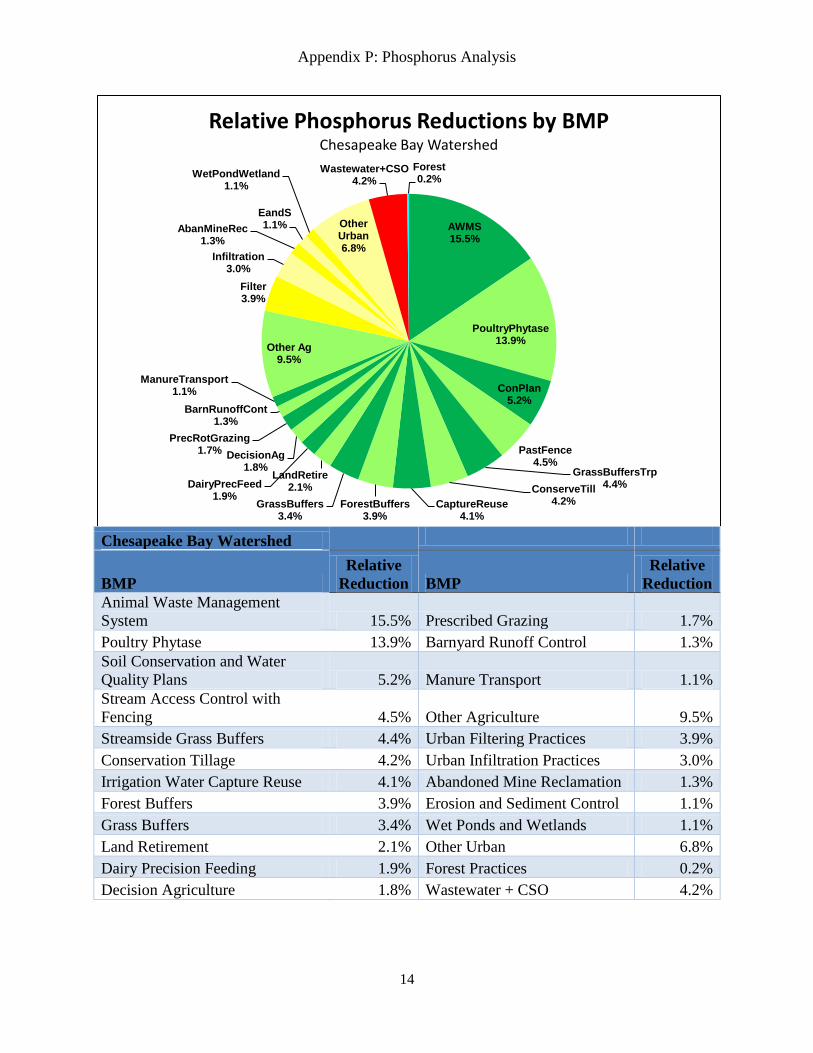
Chesapeake Bay Watershed
BMP
Relative
Reduction BMP
Relative
Reduction
Animal Waste Management
System 15.5% Prescribed Grazing 1.7%
Poultry Phytase 13.9% Barnyard Runoff Control 1.3%
Soil Conservation and Water
Quality Plans 5.2% Manure Transport 1.1%
Stream Access Control with
Fencing 4.5% Other Agriculture 9.5%
Streamside Grass Buffers 4.4% Urban Filtering Practices 3.9%
Conservation Tillage 4.2% Urban Infiltration Practices 3.0%
Irrigation Water Capture Reuse 4.1% Abandoned Mine Reclamation 1.3%
Forest Buffers 3.9% Erosion and Sediment Control 1.1%
Grass Buffers 3.4% Wet Ponds and Wetlands 1.1%
Land Retirement 2.1% Other Urban 6.8%
Dairy Precision Feeding 1.9% Forest Practices 0.2%
Decision Agriculture 1.8% Wastewater + CSO 4.2%
AWMS 15.5%
PoultryPhytase 13.9%
ConPlan 5.2%
PastFence 4.5%
GrassBuffersTrp 4.4% ConserveTill
4.2% CaptureReuse 4.1%
ForestBuffers 3.9%
GrassBuffers 3.4%
LandRetire 2.1% DairyPrecFeed
1.9%
DecisionAg 1.8%
PrecRotGrazing 1.7%
BarnRunoffCont 1.3%
ManureTransport 1.1%
Other Ag 9.5%
Filter 3.9%
Infiltration 3.0%
AbanMineRec 1.3%
EandS 1.1%
WetPondWetland 1.1%
Other Urban 6.8%
Wastewater+CSO 4.2%
Forest 0.2%
Relative Phosphorus Reductions by BMP Chesapeake Bay Watershed

Appendix P: Phosphorus Analysis
15
Delaware
BMP
Relative
Reduction
Poultry Phytase 28.1%
Animal Waste Management System 23.7%
Manure Transport 8.0%
Conservation Tillage 7.3%
Decision Agriculture 6.8%
Grass Buffers 6.7%
Forest Buffers 5.1%
Soil Conservation & Water Quality
Plans 4.0%
Wetland Restoration 2.7%
Barnyard Runoff Control 2.2%
Mortality Composters 1.7%
Other Agriculture 2.1%
Other Urban 1.7%
Forest Practices 0.0%
Wastewater + CSO 0.0%
PoultryPhytase 28.1%
AWMS 23.7%
ManureTransport 8.0%
ConserveTill 7.3%
DecisionAg 6.8%
GrassBuffers 6.7%
ForestBuffers 5.1%
ConPlan 4.0%
WetlandRestore 2.7%
BarnRunoffCont 2.2%
MortalityComp 1.7%
Other Ag 2.1%
Other Urban 1.7%
Relative Phosphorus Reductions by BMP Delaware
Appendix P: Phosphorus Analysis
16
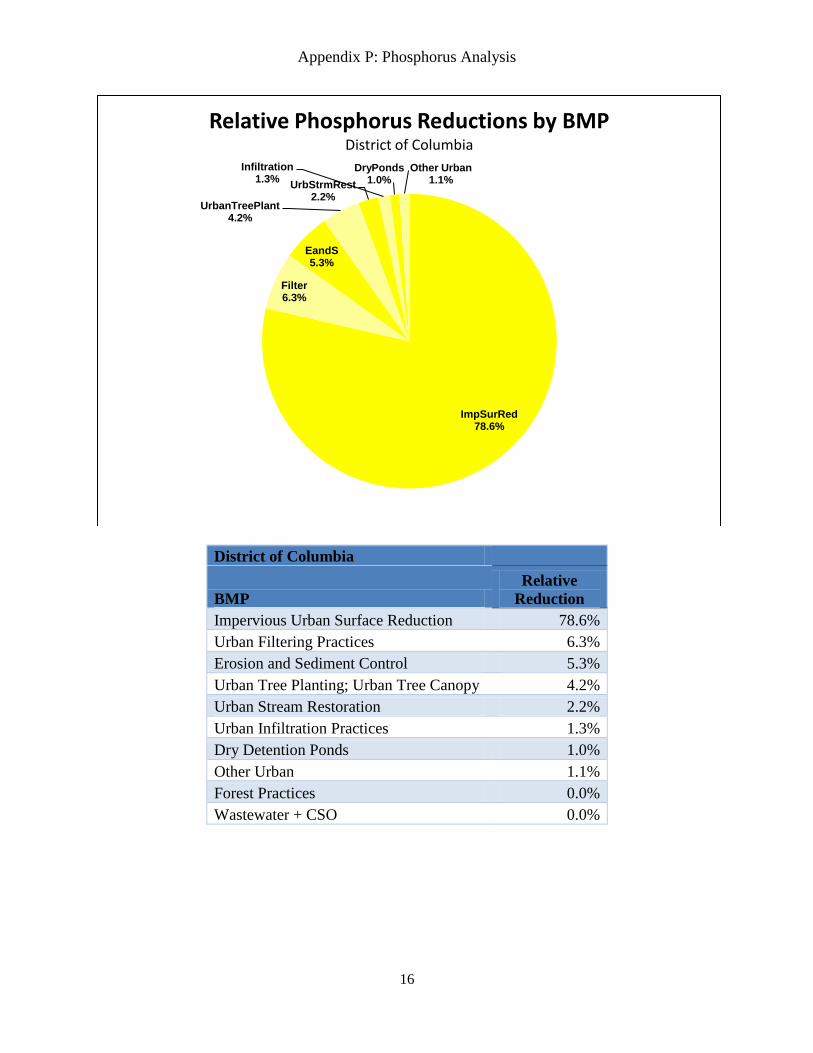
District of Columbia
BMP
Relative
Reduction
Impervious Urban Surface Reduction 78.6%
Urban Filtering Practices 6.3%
Erosion and Sediment Control 5.3%
Urban Tree Planting; Urban Tree Canopy 4.2%
Urban Stream Restoration 2.2%
Urban Infiltration Practices 1.3%
Dry Detention Ponds 1.0%
Other Urban 1.1%
Forest Practices 0.0%
Wastewater + CSO 0.0%
ImpSurRed 78.6%
Filter 6.3%
EandS 5.3%
UrbanTreePlant 4.2%
UrbStrmRest 2.2%
Infiltration 1.3%
DryPonds 1.0%
Other Urban 1.1%
Relative Phosphorus Reductions by BMP District of Columbia
Appendix P: Phosphorus Analysis
17
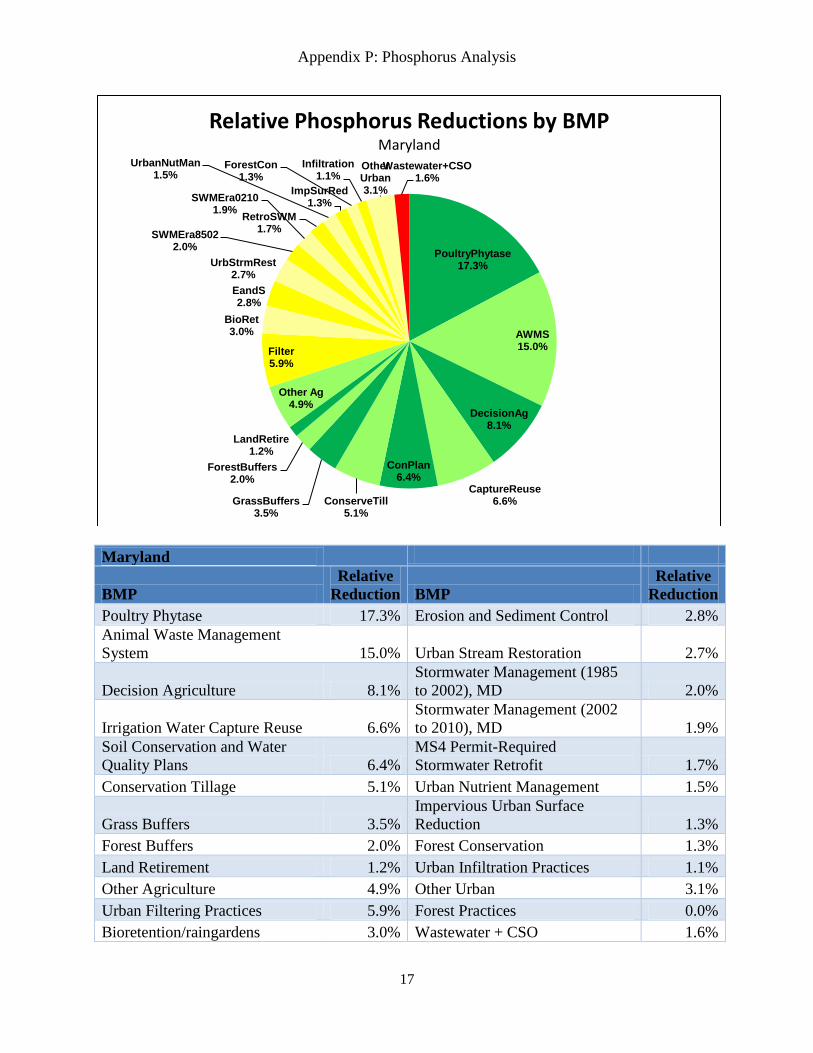
Maryland
BMP
Relative
Reduction BMP
Relative
Reduction
Poultry Phytase 17.3% Erosion and Sediment Control 2.8%
Animal Waste Management
System 15.0% Urban Stream Restoration 2.7%
Decision Agriculture 8.1%
Stormwater Management (1985
to 2002), MD 2.0%
Irrigation Water Capture Reuse 6.6%
Stormwater Management (2002
to 2010), MD 1.9%
Soil Conservation and Water
Quality Plans 6.4%
MS4 Permit-Required
Stormwater Retrofit 1.7%
Conservation Tillage 5.1% Urban Nutrient Management 1.5%
Grass Buffers 3.5%
Impervious Urban Surface
Reduction 1.3%
Forest Buffers 2.0% Forest Conservation 1.3%
Land Retirement 1.2% Urban Infiltration Practices 1.1%
Other Agriculture 4.9% Other Urban 3.1%
Urban Filtering Practices 5.9% Forest Practices 0.0%
Bioretention/raingardens 3.0% Wastewater + CSO 1.6%
PoultryPhytase 17.3%
AWMS 15.0%
DecisionAg 8.1%
CaptureReuse 6.6%
ConPlan 6.4%
ConserveTill 5.1%
GrassBuffers 3.5%
ForestBuffers 2.0%
LandRetire 1.2%
Other Ag 4.9%
Filter 5.9%
BioRet 3.0%
EandS 2.8%
UrbStrmRest 2.7%
SWMEra8502 2.0%
SWMEra0210 1.9%
RetroSWM 1.7%
UrbanNutMan 1.5%
ImpSurRed 1.3%
ForestCon 1.3%
Infiltration 1.1%
Other Urban 3.1%
Wastewater+CSO 1.6%
Relative Phosphorus Reductions by BMP Maryland

Appendix P: Phosphorus Analysis
18
New York
BMP
Relative
Reduction BMP
Relative
Reduction
Streamside Grass Buffers 13.8% Wetland Restoration 1.4%
Animal Waste Management
System 9.0% Mortality Composters 1.1%
Dairy Precision Feeding 8.5% Other Agriculture 1.7%
Non Urban Stream Restoration 7.2% Urban Forest Buffers 7.1%
Soil Conservation & Water
Quality Plans 5.9% Other Urban 1.1%
Grass Buffers 3.8% Forest Practices 0.3%
Enhanced Nutrient Management 3.1% Wastewater + CSO 22.8%
Conservation Tillage 3.0%
Prescribed Grazing 2.9%
Decision Agriculture 2.3%
Forest Buffers 1.8%
Loafing Lot Management 1.6%
Barnyard Runoff Control 1.5%
GrassBuffersTrp 13.8%
AWMS 9.0%
DairyPrecFeed 8.5%
NonUrbStrmRest 7.2% ConPlan
5.9%
GrassBuffers 3.8%
EnhancedNM 3.1%
ConserveTill 3.0%
PrecRotGrazing 2.9%
DecisionAg 2.3%
ForestBuffers 1.8%
LoafLot 1.6%
BarnRunoffCont 1.5%
WetlandRestore 1.4%
MortalityComp 1.1%
Other Ag 1.7%
ForestBufUrban 7.1%
Other Urban 1.1%
Forest 0.3%
Wastewater+CSO 22.8%
Relative Phosphorus Reductions by BMP New York

Appendix P: Phosphorus Analysis
19
Pennsylvania
BMP
Relative
Reduction BMP
Relative
Reduction
Animal Waste Management System 15.7% Grass Buffers 1.7%
Poultry Phytase 9.1% Alternative Crops 1.5%
Land Retirement 5.8% Horse Pasture Management 1.3%
Forest Buffers 5.7% Barnyard Runoff Control 1.3%
Soil Conservation and Water Quality
Plans 4.1%
Irrigation Water Capture
Reuse 1.1%
Stream Access Control with Fencing 3.8% Other Agriculture 4.7%
Nutrient Management 2.6% Urban Filtering Practices 7.2%
Continuous No Till 2.5% Urban Infiltration Practices 6.5%
Conservation Tillage 2.4%
Erosion and Sediment
Control on Extractive 2.7%
Precision Intensive Rotational
Grazing 2.0% Other Urban 2.8%
Dairy Precision Feeding 1.8% Forest Practices 0.0%
Swine Phytase 1.8% Wastewater + CSO 11.9%
AWMS 15.7%
PoultryPhytase 9.1%
LandRetire 5.8%
ForestBuffers 5.7%
ConPlan 4.1%
PastFence 3.8%
NutMan 2.6% ContinuousNT
2.5%
ConserveTill 2.4%
UpPrecIntRotGraze 2.0%
DairyPrecFeed 1.8% SwinePhytase
1.8% GrassBuffers
1.7%
CarSeqAltCrop 1.5%
HorsePasMan 1.3%
BarnRunoffCont 1.3%
CaptureReuse 1.1%
Other Ag 4.7%
Filter 7.2%
Infiltration 6.5%
EandSext 2.7%
Other Urban 2.8%
Wastewater+CSO 11.9%
Relative Phosphorus Reductions by BMP Pennsylvania
Appendix P: Phosphorus Analysis
20
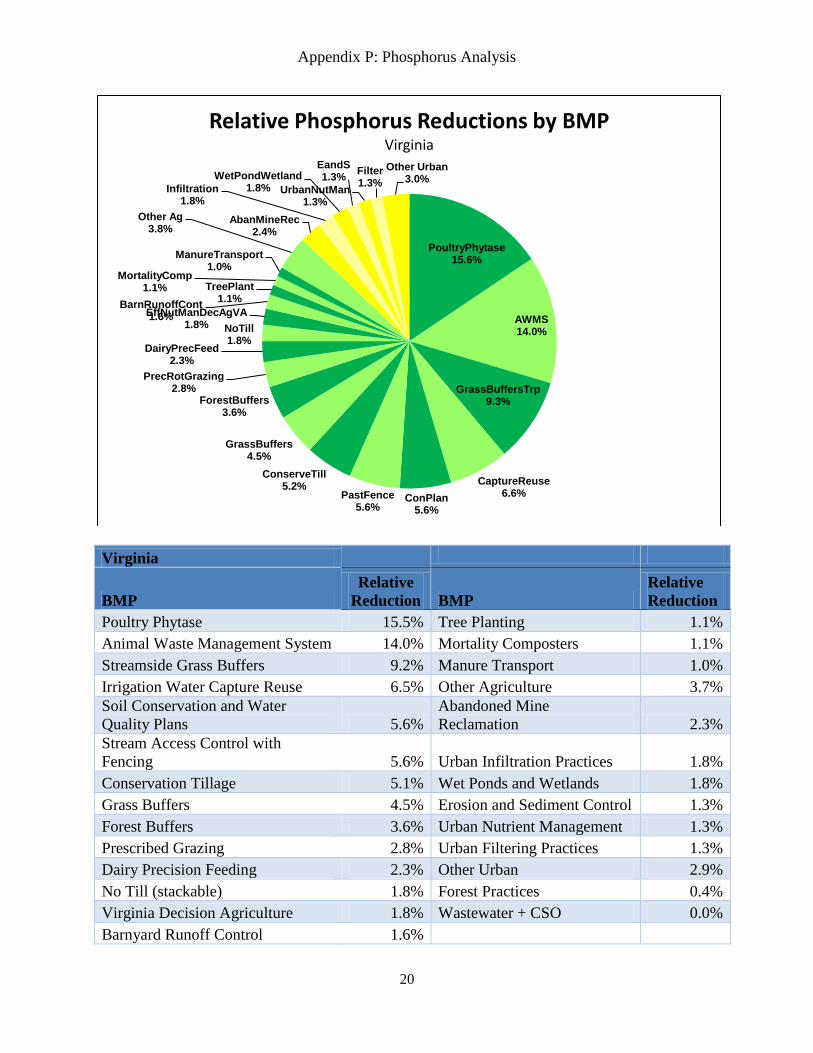
Virginia
BMP
Relative
Reduction BMP
Relative
Reduction
Poultry Phytase 15.5% Tree Planting 1.1%
Animal Waste Management System 14.0% Mortality Composters 1.1%
Streamside Grass Buffers 9.2% Manure Transport 1.0%
Irrigation Water Capture Reuse 6.5% Other Agriculture 3.7%
Soil Conservation and Water
Quality Plans 5.6%
Abandoned Mine
Reclamation 2.3%
Stream Access Control with
Fencing 5.6% Urban Infiltration Practices 1.8%
Conservation Tillage 5.1% Wet Ponds and Wetlands 1.8%
Grass Buffers 4.5% Erosion and Sediment Control 1.3%
Forest Buffers 3.6% Urban Nutrient Management 1.3%
Prescribed Grazing 2.8% Urban Filtering Practices 1.3%
Dairy Precision Feeding 2.3% Other Urban 2.9%
No Till (stackable) 1.8% Forest Practices 0.4%
Virginia Decision Agriculture 1.8% Wastewater + CSO 0.0%
Barnyard Runoff Control 1.6%
PoultryPhytase 15.6%
AWMS 14.0%
GrassBuffersTrp 9.3%
CaptureReuse 6.6% ConPlan
5.6%
PastFence 5.6%
ConserveTill 5.2%
GrassBuffers 4.5%
ForestBuffers 3.6%
PrecRotGrazing 2.8%
DairyPrecFeed 2.3%
NoTill 1.8%
EffNutManDecAgVA 1.8%
BarnRunoffCont 1.6%
TreePlant 1.1%
MortalityComp 1.1%
ManureTransport 1.0%
Other Ag 3.8%
AbanMineRec 2.4%
Infiltration 1.8%
WetPondWetland 1.8%
EandS 1.3%
UrbanNutMan 1.3%
Filter 1.3%
Other Urban 3.0%
Relative Phosphorus Reductions by BMP Virginia
Appendix P: Phosphorus Analysis
21
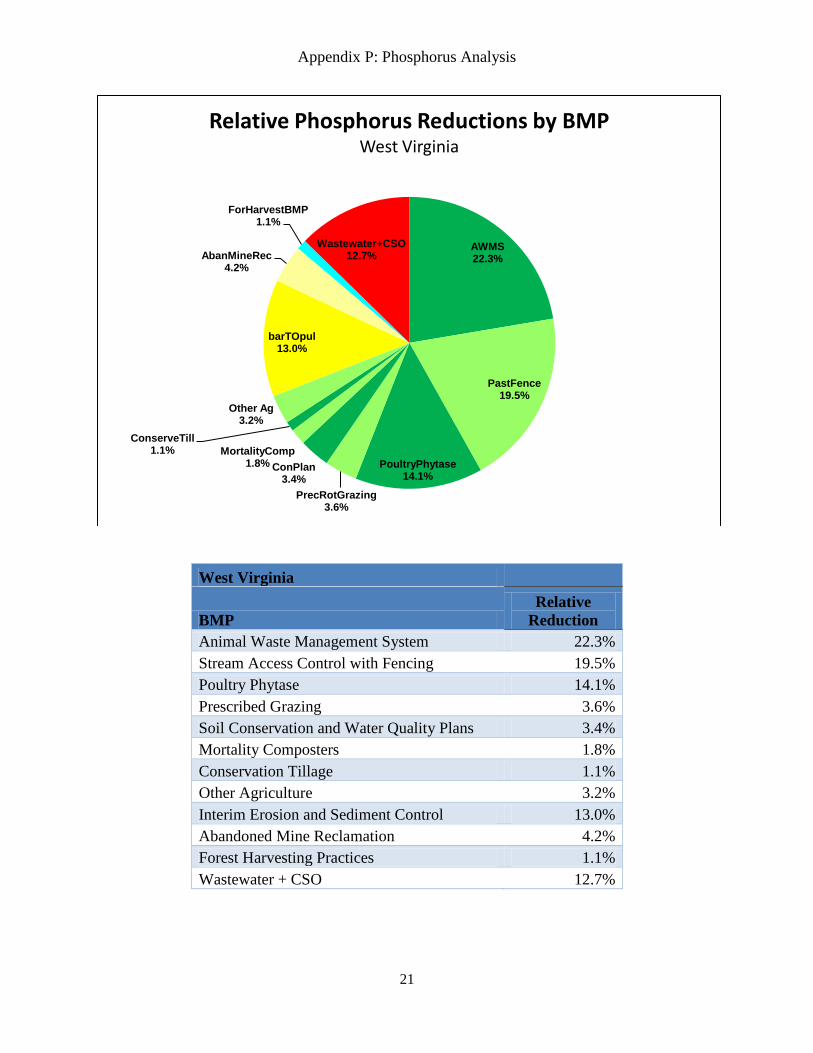
West Virginia
BMP
Relative
Reduction
Animal Waste Management System 22.3%
Stream Access Control with Fencing 19.5%
Poultry Phytase 14.1%
Prescribed Grazing 3.6%
Soil Conservation and Water Quality Plans 3.4%
Mortality Composters 1.8%
Conservation Tillage 1.1%
Other Agriculture 3.2%
Interim Erosion and Sediment Control 13.0%
Abandoned Mine Reclamation 4.2%
Forest Harvesting Practices 1.1%
Wastewater + CSO 12.7%
AWMS 22.3%
PastFence 19.5%
PoultryPhytase 14.1%
PrecRotGrazing 3.6%
ConPlan 3.4%
MortalityComp 1.8%
ConserveTill 1.1%
Other Ag 3.2%
barTOpul 13.0%
AbanMineRec 4.2%
ForHarvestBMP 1.1%
Wastewater+CSO 12.7%
Relative Phosphorus Reductions by BMP West Virginia
Appendix P: Sediment Analysis
22
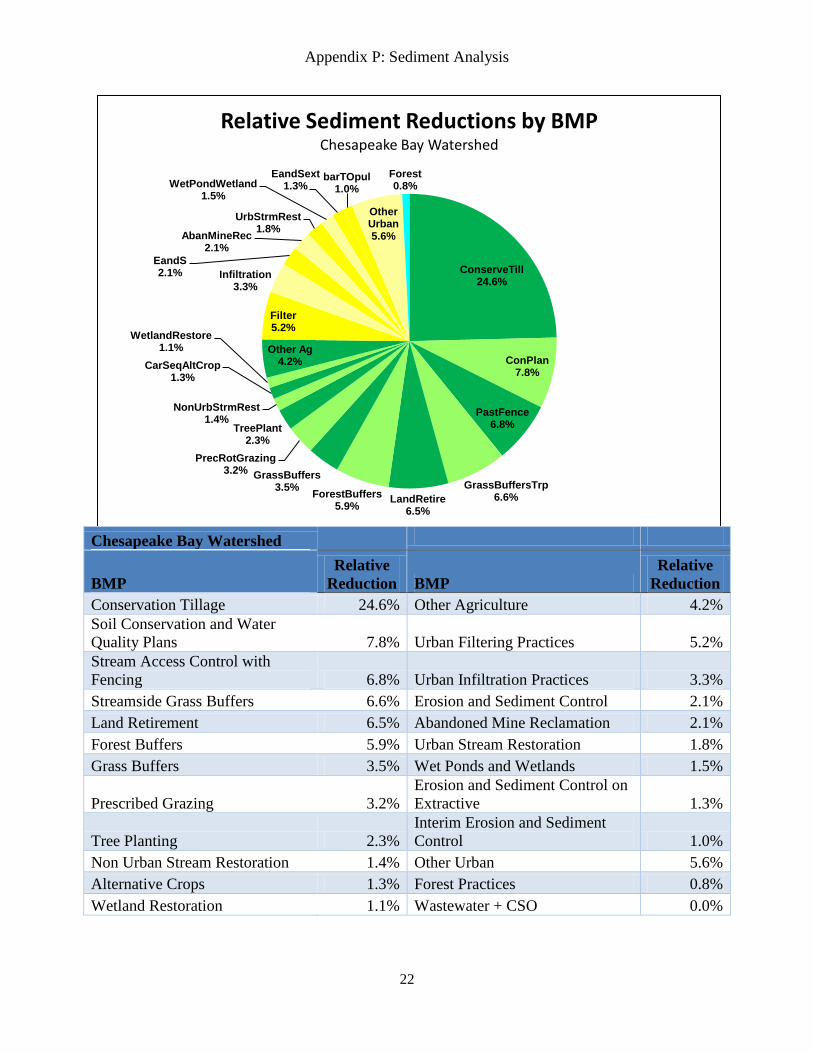
Chesapeake Bay Watershed
BMP
Relative
Reduction BMP
Relative
Reduction
Conservation Tillage 24.6% Other Agriculture 4.2%
Soil Conservation and Water
Quality Plans 7.8% Urban Filtering Practices 5.2%
Stream Access Control with
Fencing 6.8% Urban Infiltration Practices 3.3%
Streamside Grass Buffers 6.6% Erosion and Sediment Control 2.1%
Land Retirement 6.5% Abandoned Mine Reclamation 2.1%
Forest Buffers 5.9% Urban Stream Restoration 1.8%
Grass Buffers 3.5% Wet Ponds and Wetlands 1.5%
Prescribed Grazing 3.2%
Erosion and Sediment Control on
Extractive 1.3%
Tree Planting 2.3%
Interim Erosion and Sediment
Control 1.0%
Non Urban Stream Restoration 1.4% Other Urban 5.6%
Alternative Crops 1.3% Forest Practices 0.8%
Wetland Restoration 1.1% Wastewater + CSO 0.0%
ConserveTill 24.6%
ConPlan 7.8%
PastFence 6.8%
GrassBuffersTrp 6.6% LandRetire
6.5%
ForestBuffers 5.9%
GrassBuffers 3.5%
PrecRotGrazing 3.2%
TreePlant 2.3%
NonUrbStrmRest 1.4%
CarSeqAltCrop 1.3%
WetlandRestore 1.1% Other Ag
4.2%
Filter 5.2%
Infiltration 3.3%
EandS 2.1%
AbanMineRec 2.1%
UrbStrmRest 1.8%
WetPondWetland 1.5%
EandSext 1.3%
barTOpul 1.0%
Other Urban 5.6%
Forest 0.8%
Relative Sediment Reductions by BMP Chesapeake Bay Watershed
Appendix P: Sediment Analysis
23
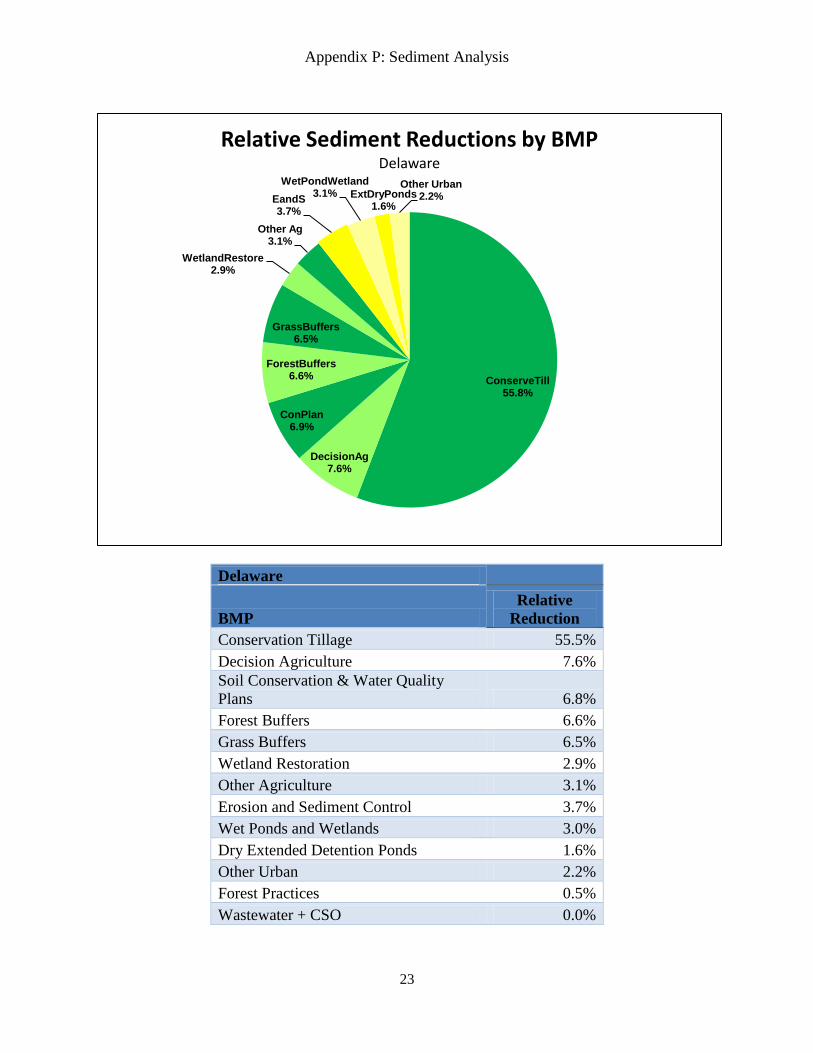
Delaware
BMP
Relative
Reduction
Conservation Tillage 55.5%
Decision Agriculture 7.6%
Soil Conservation & Water Quality
Plans 6.8%
Forest Buffers 6.6%
Grass Buffers 6.5%
Wetland Restoration 2.9%
Other Agriculture 3.1%
Erosion and Sediment Control 3.7%
Wet Ponds and Wetlands 3.0%
Dry Extended Detention Ponds 1.6%
Other Urban 2.2%
Forest Practices 0.5%
Wastewater + CSO 0.0%
ConserveTill 55.8%
DecisionAg 7.6%
ConPlan 6.9%
ForestBuffers 6.6%
GrassBuffers 6.5%
WetlandRestore 2.9%
Other Ag 3.1%
EandS 3.7%
WetPondWetland 3.1% ExtDryPonds
1.6%
Other Urban 2.2%
Relative Sediment Reductions by BMP Delaware

Appendix P: Sediment Analysis
24
District of Columbia
BMP
Relative
Reduction
Impervious Urban Surface Reduction 67.7%
Erosion and Sediment Control 16.0%
Urban Filtering Practices 7.3%
Urban Tree Planting; Urban Tree Canopy 2.8%
Urban Stream Restoration 1.9%
Street Sweeping 1.4%
Urban Infiltration Practices 1.3%
Other Urban 1.5%
Forest Practices 0.0%
Wastewater + CSO 0.0%
ImpSurRed 67.7%
EandS 16.0%
Filter 7.3%
UrbanTreePlant 2.8%
UrbStrmRest 1.9%
StreetSweep 1.4%
Infiltration 1.3%
Other Urban 1.5%
Relative Sediment Reductions by BMP District of Columbia
Appendix P: Sediment Analysis
25
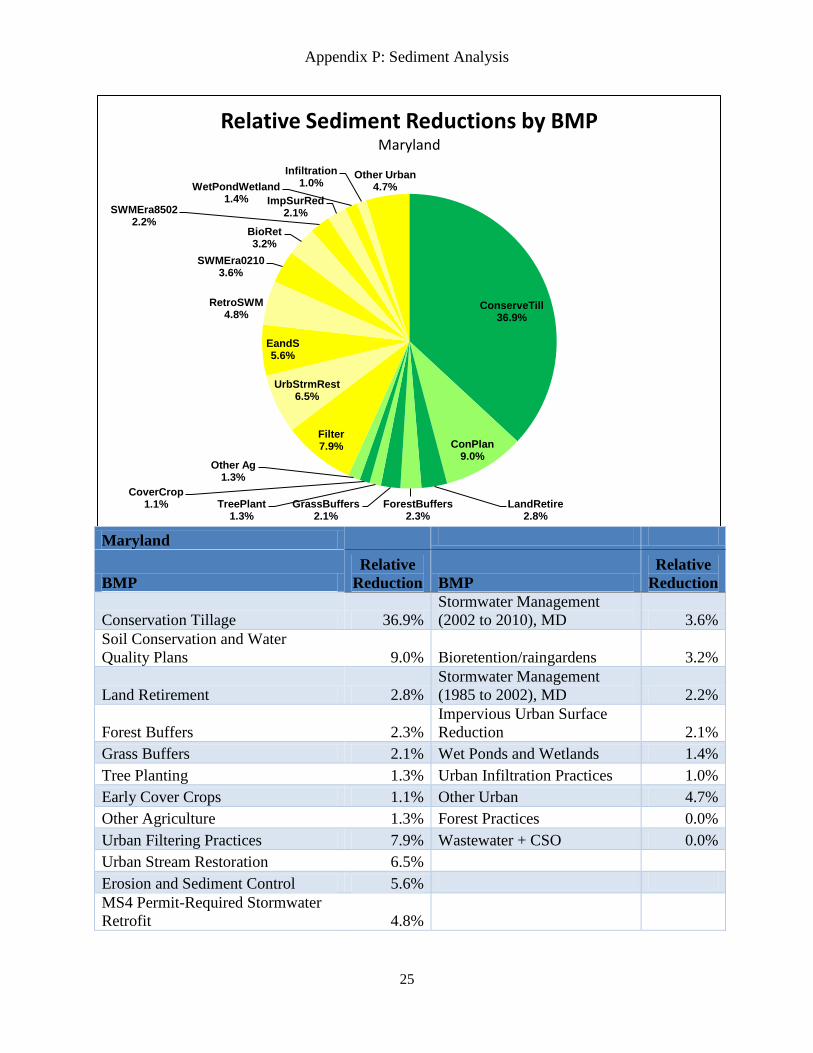
Maryland
BMP
Relative
Reduction BMP
Relative
Reduction
Conservation Tillage 36.9%
Stormwater Management
(2002 to 2010), MD 3.6%
Soil Conservation and Water
Quality Plans 9.0% Bioretention/raingardens 3.2%
Land Retirement 2.8%
Stormwater Management
(1985 to 2002), MD 2.2%
Forest Buffers 2.3%
Impervious Urban Surface
Reduction 2.1%
Grass Buffers 2.1% Wet Ponds and Wetlands 1.4%
Tree Planting 1.3% Urban Infiltration Practices 1.0%
Early Cover Crops 1.1% Other Urban 4.7%
Other Agriculture 1.3% Forest Practices 0.0%
Urban Filtering Practices 7.9% Wastewater + CSO 0.0%
Urban Stream Restoration 6.5%
Erosion and Sediment Control 5.6%
MS4 Permit-Required Stormwater
Retrofit 4.8%
ConserveTill 36.9%
ConPlan 9.0%
LandRetire 2.8%
ForestBuffers 2.3%
GrassBuffers 2.1%
TreePlant 1.3%
CoverCrop 1.1%
Other Ag 1.3%
Filter 7.9%
UrbStrmRest 6.5%
EandS 5.6%
RetroSWM 4.8%
SWMEra0210 3.6%
BioRet 3.2%
SWMEra8502 2.2%
ImpSurRed 2.1%
WetPondWetland 1.4%
Infiltration 1.0%
Other Urban 4.7%
Relative Sediment Reductions by BMP Maryland
Appendix P: Sediment Analysis
26
New York
BMP
Relative
Reduction
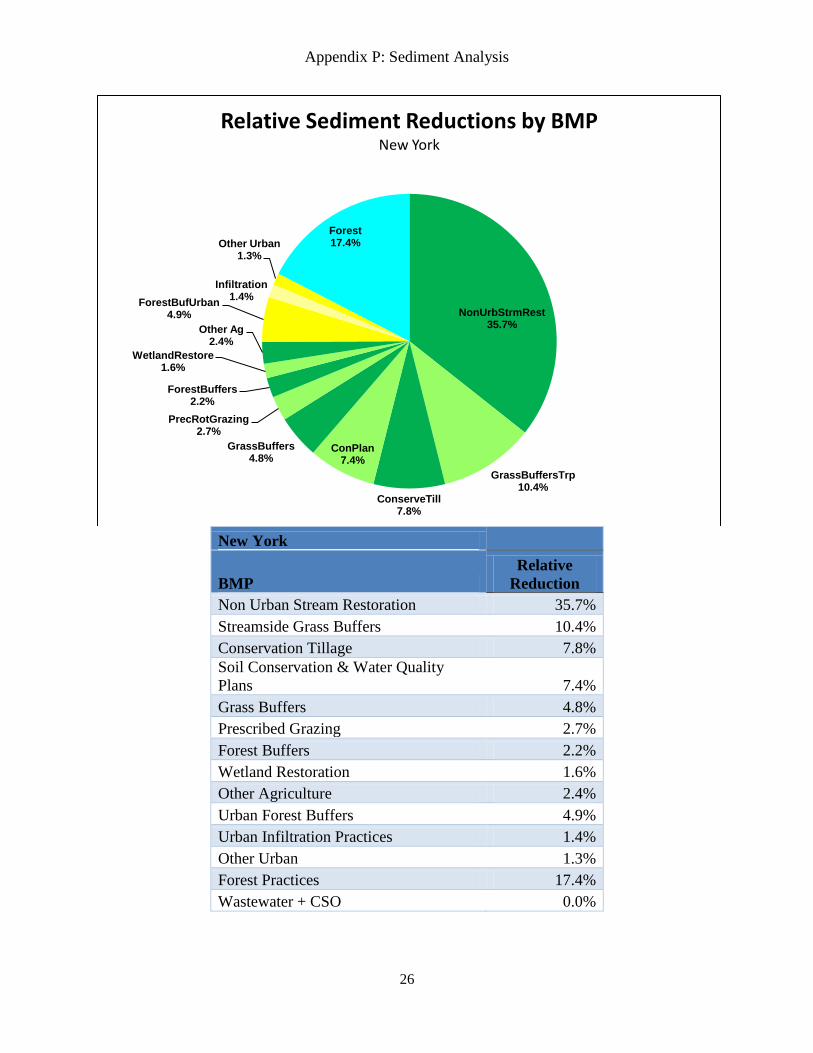
Non Urban Stream Restoration 35.7%
Streamside Grass Buffers 10.4%
Conservation Tillage 7.8%
Soil Conservation & Water Quality
Plans 7.4%
Grass Buffers 4.8%
Prescribed Grazing 2.7%
Forest Buffers 2.2%
Wetland Restoration 1.6%
Other Agriculture 2.4%
Urban Forest Buffers 4.9%
Urban Infiltration Practices 1.4%
Other Urban 1.3%
Forest Practices 17.4%
Wastewater + CSO 0.0%
NonUrbStrmRest 35.7%
GrassBuffersTrp 10.4%
ConserveTill 7.8%
ConPlan 7.4%
GrassBuffers 4.8%
PrecRotGrazing 2.7%
ForestBuffers 2.2%
WetlandRestore 1.6%
Other Ag 2.4%
ForestBufUrban 4.9%
Infiltration 1.4%
Other Urban 1.3%
Forest 17.4%
Relative Sediment Reductions by BMP New York
Appendix P: Sediment Analysis
27
Pennsylvania
BMP
Relative
Reduction BMP
Relative
Reduction
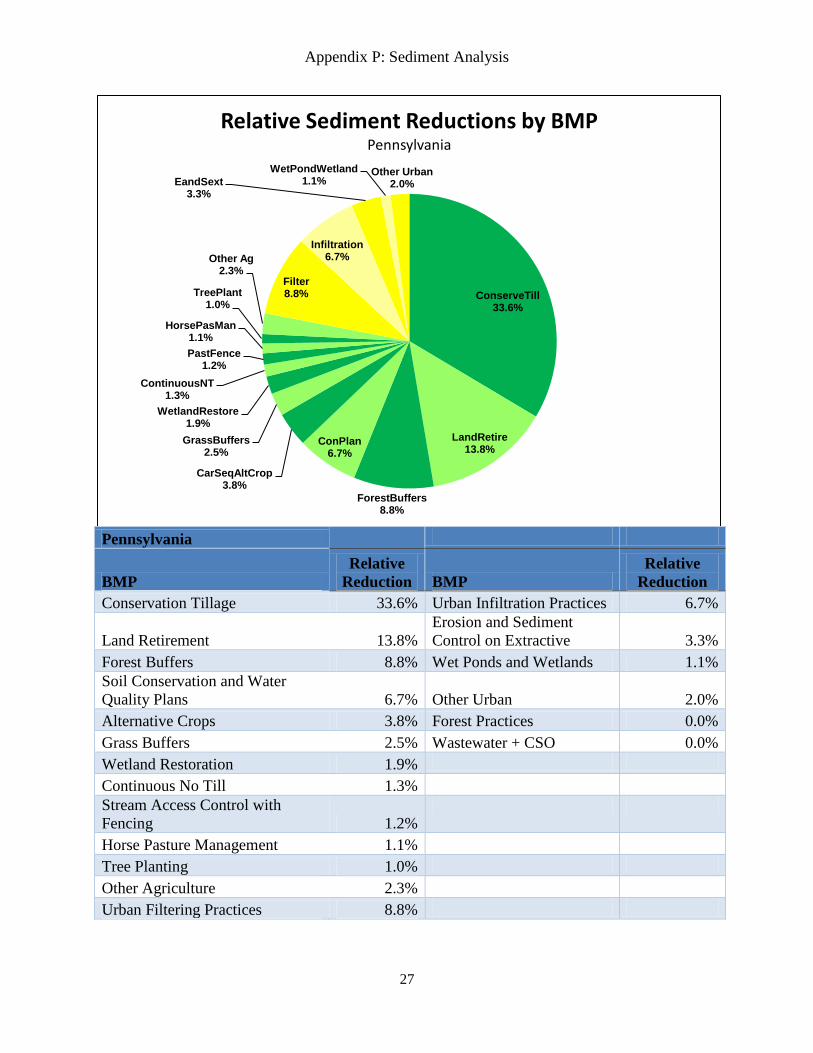
Conservation Tillage 33.6% Urban Infiltration Practices 6.7%
Land Retirement 13.8%
Erosion and Sediment
Control on Extractive 3.3%
Forest Buffers 8.8% Wet Ponds and Wetlands 1.1%
Soil Conservation and Water
Quality Plans 6.7% Other Urban 2.0%
Alternative Crops 3.8% Forest Practices 0.0%
Grass Buffers 2.5% Wastewater + CSO 0.0%
Wetland Restoration 1.9%
Continuous No Till 1.3%
Stream Access Control with
Fencing 1.2%
Horse Pasture Management 1.1%
Tree Planting 1.0%
Other Agriculture 2.3%
Urban Filtering Practices 8.8%
ConserveTill 33.6%
LandRetire 13.8%
ForestBuffers 8.8%
ConPlan 6.7%
CarSeqAltCrop 3.8%
GrassBuffers 2.5%
WetlandRestore 1.9%
ContinuousNT 1.3%
PastFence 1.2%
HorsePasMan 1.1%
TreePlant 1.0%
Other Ag 2.3%
Filter 8.8%
Infiltration 6.7%
EandSext 3.3%
WetPondWetland 1.1%
Other Urban 2.0%
Relative Sediment Reductions by BMP Pennsylvania

Appendix P: Sediment Analysis
28
Virginia
BMP
Relative
Reduction BMP
Relative
Reduction
Streamside Grass Buffers 15.2%
Erosion and Sediment
Control 2.3%
Conservation Tillage 14.8% Wet Ponds and Wetlands 2.1%
Stream Access Control with
Fencing 10.6%
Dry Extended Detention
Ponds 2.0%
Soil Conservation and Water
Quality Plans 8.5% Urban Infiltration Practices 1.9%
Prescribed Grazing 6.3% Urban Stream Restoration 1.6%
Forest Buffers 5.7% Urban Filtering Practices 1.6%
Grass Buffers 5.1% Other Urban 2.2%
Tree Planting 4.2% Forest Practices 0.8%
Land Retirement 3.5% Wastewater + CSO 0.0%
No Till (stackable) 2.1%
Non Urban Stream Restoration 1.2%
Other Agriculture 4.4%
Abandoned Mine Reclamation 3.9%
GrassBuffersTrp 15.2%
ConserveTill 14.8%
PastFence 10.6%
ConPlan 8.5%
PrecRotGrazing 6.3%
ForestBuffers 5.7%
GrassBuffers 5.1%
TreePlant 4.2%
LandRetire 3.5%
NoTill 2.1%
NonUrbStrmRest 1.2%
Other Ag 4.4%
AbanMineRec 3.9%
EandS 2.3%
WetPondWetland 2.1%
ExtDryPonds 2.0% Infiltration
1.9%
UrbStrmRest 1.6%
Filter 1.6%
Other Urban 2.2%
Forest 0.8%
Relative Sediment Reductions by BMP Virginia

Appendix P: Sediment Analysis
29
West Virginia
BMP
Relative
Reduction
Stream Access Control with Fencing 41.1%
Prescribed Grazing 7.8%
Soil Conservation and Water Quality Plans 5.5%
Conservation Tillage 2.7%
Forest Buffers 1.5%
Other Agriculture 2.3%
Interim Erosion and Sediment Control 28.9%
Abandoned Mine Reclamation 7.7%
Forest Harvesting Practices 2.5%
Wastewater + CSO 0.0%
PastFence 41.1%
PrecRotGrazing 7.8% ConPlan
5.5%
ConserveTill 2.7%
ForestBuffers 1.5%
Other Ag 2.3%
barTOpul 28.9%
AbanMineRec 7.7%
ForHarvestBMP 2.5%
Relative Sediment Reductions by BMP West Virginia