Embed Size (px)
Citation preview
Appendix to City of Melbourne 2013 Multicultural Community Demographic Profile
www.melbourne.vic.gov.au

Appendix to 2013 Multicultural Community Demographic Profile
2 / 14
Contents
Foreword ................................................................................................................. 3
1. Appendices ..................................................................................................... 4
2. Data sources ............................................................................................... 106
3. Data issues ................................................................................................. 107

3 / 14
Appendix to 2013 Multicultural Community Demographic Profile
Foreword
The City of Melbourne respectfully acknowledges the Traditional Owners of the land, the Kulin Nation. For the Wurundjeri, Boonerwrung, Taungurong, Djajawurrung and the Wathaurung groups who form the Kulin Nation, Melbourne has always been an important meeting place for events of social, educational, sporting and cultural significance. Today we are proud to say that Melbourne is a significant gathering place for all Aboriginal and Torres Strait Islander peoples, of which around 260 call the City of Melbourne home.
Context of document
This document is the appendix to the City of Melbourne 2013 Multicultural Community Demographic Profile.
Disclaimer
While all due care has been taken to ensure that the content of this report is accurate and current, there may be errors or omissions in it and no legal responsibility is accepted for the information and opinions contained within.
In addition, as the report is based on historic information that is subject to revision and assumptions in preparing forecast figures that are both difficult to predict and liable to change, we do not guarantee the reports currency.
ISBN
978-1-74250-971-6

Appendix to 2013 Multicultural Community Demographic Profile
4 / 14
1. Appendices
Table 1 – Country of birth of person
Country of birth Residents Proportion of total
Australia 38474 41% China (excludes SARs and Taiwan) 7503 8% Malaysia 5104 5% India 2952 3% Indonesia 2855 3% England 2763 3% New Zealand 2486 3% Singapore 1836 2% Hong Kong (SAR of China) 1486 2% Korea, Republic of (South) 1433 2% Vietnam 1276 1% Thailand 854 1% United States of America 833 1% Italy 681 1% Japan 625 1% Taiwan 621 1% Ireland 572 1% Philippines 531 1% Somalia 491 1% Germany 471 1% Saudi Arabia 449 <0.5% Sri Lanka 446 <0.5% Scotland 404 <0.5% Canada 395 <0.5% South Africa 394 <0.5% Iran 348 <0.5% France 343 <0.5% Ethiopia 258 <0.5% Colombia 251 <0.5% Mauritius 245 <0.5% Eritrea 202 <0.5% Poland 194 <0.5% Turkey 193 <0.5% Netherlands 189 <0.5% Greece 187 <0.5% Brazil 180 <0.2% Egypt 174 <0.2% Chile 154 <0.2% Russian Federation 152 <0.2% Sudan 144 <0.2%

5 / 14
Appendix to 2013 Multicultural Community Demographic Profile
Country of birth Residents Proportion of total
Croatia 127 <0.2% United Arab Emirates 117 <0.2% Brunei Darussalam 117 <0.2% Malta 116 <0.2% Kenya 105 <0.2% Fiji 99 <0.2% Pakistan 98 <0.2% Serbia 92 <0.2% Mexico 92 <0.2% Spain 88 <0.2% Wales 87 <0.2% Kuwait 87 <0.2% Macau (SAR of China) 86 <0.2% Sweden 85 <0.2% El Salvador 77 <0.2% Papua New Guinea 76 <0.2% Switzerland 76 <0.2% Romania 76 <0.2% Bosnia and Herzegovina 75 <0.2% Former Yugoslav Republic of Macedonia (FYROM) 73 <0.2% Northern Ireland 72 <0.2% Lebanon 72 <0.2% Bangladesh 71 <0.2% Nepal 71 <0.2% Zimbabwe 71 <0.2% Ukraine 68 <0.2% Austria 64 <0.2% Hungary 63 <0.2% Cambodia 61 <0.2% South Eastern Europe, nfd 59 <0.2% Argentina 59 <0.2% Peru 58 <0.2% Norway 57 <0.2% Israel 56 <0.2% Burma (Republic of the Union of Myanmar) 54 <0.2% Timor-Leste 52 <0.2% Venezuela, Bolivarian Republic of 49 <0.2% Iraq 46 <0.2% Belgium 40 <0.2% Czech Republic 37 <0.2% Denmark 36 <0.2% Portugal 36 <0.2% Oman 34 <0.2% Zambia 33 <0.2% Bulgaria 29 <0.2%

Appendix to 2013 Multicultural Community Demographic Profile
6 / 14
Country of birth Residents Proportion of total
Slovenia 28 <0.2% Laos 28 <0.2% Finland 26 <0.2% Cyprus 26 <0.2% Slovakia 25 <0.2% Afghanistan 23 <0.2% Uruguay 22 <0.2% Latvia 21 <0.2% Kazakhstan 21 <0.2% Libya 19 <0.2% Bahrain 19 <0.2% Syria 19 <0.2% Lithuania 17 <0.2% Eastern Europe, nfd 16 <0.2% Morocco 16 <0.2% Ghana 16 <0.2% Nigeria 16 <0.2% Tanzania 15 <0.2% Mongolia 14 <0.2% Samoa 13 <0.2% Estonia 11 <0.2% Jordan 11 <0.2% Solomon Islands 10 <0.2% Cook Islands 10 <0.2% United Kingdom, Channel Islands and Isle of Man, nfd 9 <0.2% Algeria 9 <0.2% Trinidad and Tobago 9 <0.2% Tonga 8 <0.2% Uzbekistan 8 <0.2% Uganda 8 <0.2% New Caledonia 6 <0.2% Iceland 6 <0.2% Kosovo 6 <0.2% South Sudan 6 <0.2% Yemen 6 <0.2% Maldives 6 <0.2% Ecuador 6 <0.2% Djibouti 6 <0.2% Seychelles 6 <0.2% Jamaica 5 <0.2% Namibia 5 <0.2% Gibraltar 4 <0.2% Moldova 4 <0.2% Montenegro 4 <0.2% Qatar 4 <0.2%

7 / 14
Appendix to 2013 Multicultural Community Demographic Profile
Country of birth Residents Proportion of total
Georgia 4 <0.2% Guyana 4 <0.2% Nicaragua 4 <0.2% Caribbean, nfd 4 <0.2% Bahamas 4 <0.2% Burundi 4 <0.2% Kiribati 3 <0.2% Gaza Strip and West Bank 3 <0.2% Dominican Republic 3 <0.2% Inadequately described 51 <0.2% Not stated 10624 11% Total 93627 100%
Table 2 – Ancestry
Ancestry Residents Proportion of total
Chinese 19,895 21% English 19,556 21% Australian 14,792 16% Irish 8,543 9% Scottish 6,494 7% Indian 3,551 4% Italian 3,408 4% German 2,778 3% Korean 1,488 2% Indonesian 1,406 2% Vietnamese 1,341 1.4% Greek 1,093 1.2% Dutch 1,091 1.2% Malay 1,038 1.1% New Zealander 969 1.0% Somali 949 1.0% Polish 814 0.9% Thai 778 0.8% Japanese 747 0.8% French 701 0.7% Filipino 653 0.7% Sri Lankan 511 0.5% Croatian 448 0.5% Maltese 447 0.5% Russian 447 0.5% American 441 0.5% Welsh 436 0.5% Spanish 423 0.5%

Appendix to 2013 Multicultural Community Demographic Profile
8 / 14
Ancestry Residents Proportion of total
Iranian 404 0.4% Arab, nfd 329 0.4% Turkish 304 0.3% Hungarian 279 0.3% South African 273 0.3% Lebanese 267 0.3% Eritrean 262 0.3% Serbian 238 0.3% Ethiopian 238 0.3% Maori 228 0.2% Saudi Arabian 218 0.2% Swedish 206 0.2% Macedonian 204 0.2% Ukrainian 204 0.2% Colombian 204 0.2% Egyptian 203 0.2% Canadian 196 0.2% Austrian 189 0.2% Danish 178 0.2% African, so described 167 0.2% Mauritian 161 0.2% Portuguese 154 0.2% Taiwanese 154 0.2% Chilean 154 0.2% Norwegian 150 0.2% Singaporean 142 0.2% Swiss 138 0.1% Jewish 120 0.1% Pakistani 117 0.1% Czech 115 0.1% Romanian 106 0.1% Latvian 105 0.1% Sinhalese 104 0.1% Brazilian 102 0.1% Mexican 99 0.1% European, so described 91 0.1% Cypriot 84 0.1% Slovene 75 0.1% Southern Asian, nfd 75 0.1% Nepalese 74 0.1% Finnish 73 0.1% Sudanese 73 0.1% Maritime South-East Asian, nec 72 0.1% Lithuanian 68 0.1% South Eastern European, nfd 67 0.1%

9 / 14
Appendix to 2013 Multicultural Community Demographic Profile
Ancestry Residents Proportion of total
Khmer (Cambodian) 65 0.1% Samoan 61 0.1% Burmese 59 0.1% Slovak 58 0.1% Peruvian 58 0.1% Belgian 54 0.1% Other North African and Middle Eastern, nec 54 0.1% Albanian 51 0.1% Bosnian 51 0.1% Bangladeshi 49 0.1% Tamil, nfd 49 0.1% Estonian 45 <0.1% Argentinian 44 <0.1% Bulgarian 43 <0.1% Timorese 43 <0.1% Fijian 42 <0.1% North African and Middle Eastern, nfd 42 <0.1% Lao 42 <0.1% Asian, so described 42 <0.1% Syrian 41 <0.1% Papua New Guinean 40 <0.1% Kuwaiti 40 <0.1% Anglo-Indian 40 <0.1% Zimbabwean 39 <0.1% Salvadoran 38 <0.1% Eastern European, nfd 37 <0.1% Armenian 36 <0.1% Australian Aboriginal 35 <0.1% Oromo 32 <0.1% British, nfd 29 <0.1% Bengali 28 <0.1% Afghan 28 <0.1% Venezuelan 28 <0.1% Moroccan 26 <0.1% Cook Islander 25 <0.1% Emirati 25 <0.1% Punjabi 24 <0.1% Telugu 24 <0.1% Peoples of the Americas, nfd 24 <0.1% South American, nfd 24 <0.1% Iraqi 23 <0.1% Kurdish 23 <0.1% Oceanian, nfd 22 <0.1% Omani 22 <0.1% Hispanic (North American) 22 <0.1%

Appendix to 2013 Multicultural Community Demographic Profile
10 / 14
Ancestry Residents Proportion of total
Tongan 21 <0.1% Palestinian 21 <0.1% African American 21 <0.1% Jamaican 21 <0.1% Kenyan 20 <0.1% Northern European, nfd 19 <0.1% Mongolian 19 <0.1% Fijian Indian 19 <0.1% Native North American Indian 19 <0.1% Zambian 18 <0.1% Tigrayan 18 <0.1% Eurasian, so described 17 <0.1% Montenegrin 16 <0.1% Ghanaian 16 <0.1% Uruguayan 15 <0.1% Southern and East African, nfd 15 <0.1% Javanese 14 <0.1% Sikh 14 <0.1% North-West European, nfd 13 <0.1% Jordanian 13 <0.1% Assyrian 13 <0.1% Mainland South-East Asian, nfd 13 <0.1% Southern Asian, nec 13 <0.1% Sri Lankan Tamil 12 <0.1% French Canadian 12 <0.1% Caribbean Islander, nfd 12 <0.1% Seychellois 12 <0.1% Solomon Islander 11 <0.1% Belarusan 11 <0.1% Coptic 11 <0.1% Kazakh 11 <0.1% North American, nfd 11 <0.1% Afrikaner 11 <0.1% Bahraini 10 <0.1% Bruneian 10 <0.1% Ecuadorian 10 <0.1% Nigerian 10 <0.1% Ugandan 10 <0.1% Balinese 9 <0.1% Polynesian, nfd 8 <0.1% Burgher 8 <0.1% Caribbean Islander, nec 8 <0.1% Southern and East African, nec 8 <0.1% Southern and Eastern European, nfd 7 <0.1% Peoples of the Sudan, nfd 7 <0.1%

11 / 14
Appendix to 2013 Multicultural Community Demographic Profile
Ancestry Residents Proportion of total
Trinidadian (Tobagonian) 7 <0.1% Tigre 7 <0.1% Manx 6 <0.1% Flemish 6 <0.1% Tibetan 6 <0.1% South Sudanese 5 <0.1% Berber 5 <0.1% Hazara 5 <0.1% Libyan 4 <0.1% Dinka 4 <0.1% South-East Asian, nfd 4 <0.1% Chinese Asian, nec 4 <0.1% Georgian 4 <0.1% Central and West African, nec 4 <0.1% Tanzanian 4 <0.1% Amhara 4 <0.1% Ogaden 4 <0.1% Creole, so described 4 <0.1% Torres Strait Islander 3 <0.1% I-Kiribati 3 <0.1% Niuean 3 <0.1% Tahitian 3 <0.1% Icelandic 3 <0.1% Basque 3 <0.1% Algerian 3 <0.1% Tunisian 3 <0.1% Yemeni 3 <0.1% Hmong 3 <0.1% Gujarati 3 <0.1% Malayali 3 <0.1% Maldivian 3 <0.1% Central Asian, nfd 3 <0.1% Tajik 3 <0.1% Tatar 3 <0.1% Turkmen 3 <0.1% Uighur 3 <0.1% Bolivian 3 <0.1% Paraguayan 3 <0.1% South American, nec 3 <0.1% Cuban 3 <0.1% Puerto Rican 3 <0.1% Central and West African, nfd 3 <0.1% Caucasian, so described 3 <0.1% Inadequately described 161 0.2% Not stated 11,102 12%

Appendix to 2013 Multicultural Community Demographic Profile
12 / 14
Ancestry Residents Proportion of total
Not applicable 70,731 76% Total 93,627 100%
Table 3 – Language spoken at home
Language spoken at home Residents Proportion of total
English 47437 51% Mandarin 9693 10% Cantonese 4598 5% Indonesian 2500 3% Arabic 1373 1.5% Korean 1346 1.4% Vietnamese 1285 1.4% Italian 1202 1.3% Hindi 1091 1.2% Somali 1017 1.1% Spanish 920 1.0% Chinese, nfd 784 0.8% Thai 770 0.8% Japanese 664 0.7% French 608 0.6% Malay 573 0.6% Greek 542 0.6% German 423 0.5% Tamil 402 0.4% Persian (excluding Dari) 334 0.4% Telugu 305 0.3% Min Nan 301 0.3% Sinhalese 247 0.3% Russian 241 0.3% Turkish 240 0.3% Portuguese 195 0.2% Filipino 182 0.2% Tagalog 177 0.2% Polish 168 0.2% Bengali 166 0.2% Gujarati 158 0.2% Marathi 155 0.2% Serbian 150 0.2% Croatian 149 0.2% Malayalam 148 0.2% Punjabi 136 0.1% Tigrinya 120 0.1%

13 / 14
Appendix to 2013 Multicultural Community Demographic Profile
Language spoken at home Residents Proportion of total
Dutch 111 0.1% Maltese 109 0.1% Non-verbal, so described 109 0.1% Kannada 108 0.1% Macedonian 107 0.1% Hakka 103 0.1% Urdu 101 0.1% Oromo 89 0.1% Amharic 75 0.1% Afrikaans 68 0.1% Nepali 65 0.1% Swedish 64 0.1% Hungarian 56 0.1% Hebrew 53 0.1% Ukrainian 51 0.1% Norwegian 49 0.1% Romanian 45 <0.1% Irish 44 <0.1% Mauritian Creole 44 <0.1% Bosnian 41 <0.1% Burmese 38 <0.1% Harari 38 <0.1% Auslan 35 <0.1% Khmer 34 <0.1% Danish 33 <0.1% Southern Asian Languages, nfd 29 <0.1% Finnish 27 <0.1% African Languages, nfd 27 <0.1% French Creole, nfd 25 <0.1% Czech 24 <0.1% Dinka 24 <0.1% Albanian 23 <0.1% Bulgarian 21 <0.1% Konkani 21 <0.1% Maori (New Zealand) 21 <0.1% Latvian 20 <0.1% Oriya 20 <0.1% Slovene 19 <0.1% Lao 19 <0.1% Shona 18 <0.1% Swahili 18 <0.1% Wu 17 <0.1% Samoan 17 <0.1% Pidgin, nfd 16 <0.1% Lithuanian 15 <0.1%

Appendix to 2013 Multicultural Community Demographic Profile
14 / 14
Language spoken at home Residents Proportion of total
Mongolian 14 <0.1% Serbo-Croatian/Yugoslavian, so described 13 <0.1% Slovak 12 <0.1% Tigre 11 <0.1% Yiddish 10 <0.1% Dari 10 <0.1% Gaelic (Scotland) 9 <0.1% Kurdish 9 <0.1% Hazaraghi 9 <0.1% Sindhi 9 <0.1% African Languages, nec 8 <0.1% Tongan 8 <0.1% Armenian 7 <0.1% Welsh 6 <0.1% Estonian 6 <0.1% Assyrian Neo-Aramaic 6 <0.1% Dhivehi 6 <0.1% Pashto 5 <0.1% Assamese 5 <0.1% Indo-Aryan, nec 5 <0.1% Southeast Asian Austronesian Languages, nfd 5 <0.1% Nuer 5 <0.1% Seychelles Creole 5 <0.1% Catalan 4 <0.1% Georgian 4 <0.1% Tulu 4 <0.1% Bisaya 4 <0.1% Cebuano 4 <0.1% Tibetan 4 <0.1% Bemba 4 <0.1% Ewe 4 <0.1% Tatar 3 <0.1% Burmese and Related Languages, nec 3 <0.1% Javanese 3 <0.1% Australian Indigenous Languages, nfd 3 <0.1% Zulu 3 <0.1% Maori (Cook Island) 3 <0.1% Bislama 3 <0.1% Solomon Islands Pijin 3 <0.1% Invented Languages 3 <0.1% Inadequately described 53 0.1% Not stated 10441 11%
Total 93627 100%
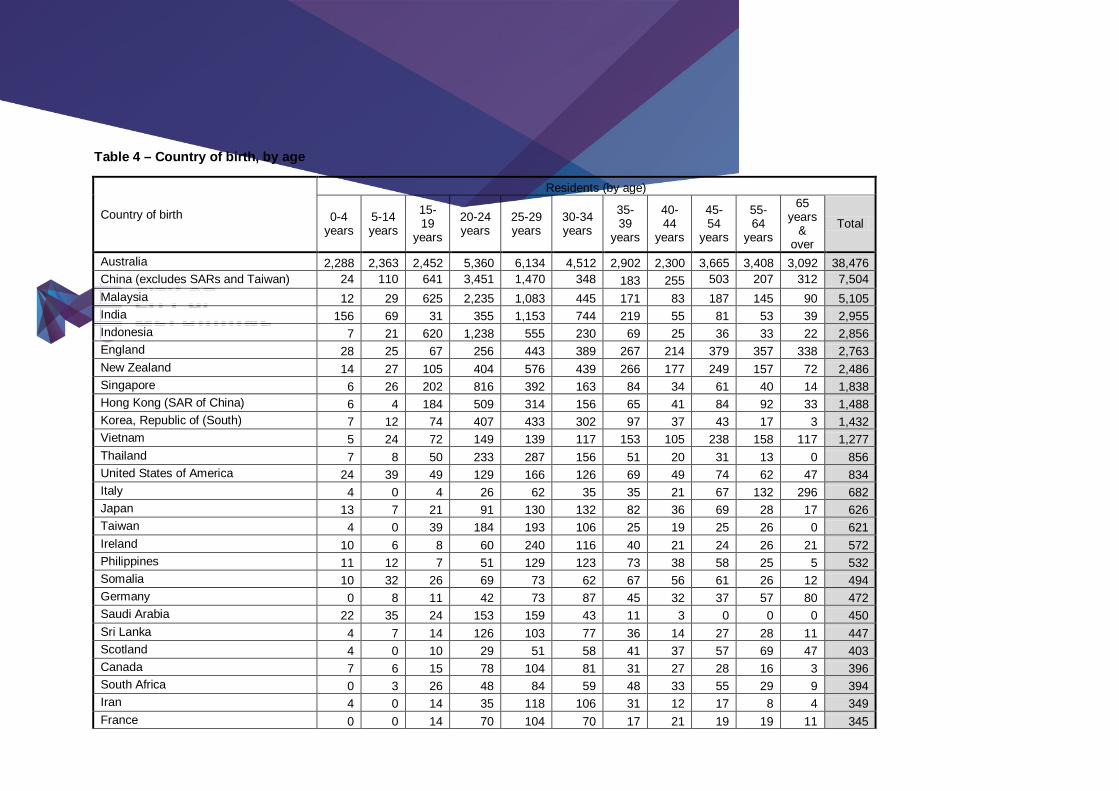
Table 4 – Country of birth, by age
Country of birth
Residents (by age)
0-4 years
5-14 years
15-19
years
20-24 years
25-29 years
30-34 years
35-39
years
40-44
years
45-54
years
55-64
years
65 years
& over
Total
Australia 2,288 2,363 2,452 5,360 6,134 4,512 2,902 2,300 3,665 3,408 3,092 38,476 China (excludes SARs and Taiwan) 24 110 641 3,451 1,470 348 183 255 503 207 312 7,504 Malaysia 12 29 625 2,235 1,083 445 171 83 187 145 90 5,105 India 156 69 31 355 1,153 744 219 55 81 53 39 2,955 Indonesia 7 21 620 1,238 555 230 69 25 36 33 22 2,856 England 28 25 67 256 443 389 267 214 379 357 338 2,763 New Zealand 14 27 105 404 576 439 266 177 249 157 72 2,486 Singapore 6 26 202 816 392 163 84 34 61 40 14 1,838 Hong Kong (SAR of China) 6 4 184 509 314 156 65 41 84 92 33 1,488 Korea, Republic of (South) 7 12 74 407 433 302 97 37 43 17 3 1,432 Vietnam 5 24 72 149 139 117 153 105 238 158 117 1,277 Thailand 7 8 50 233 287 156 51 20 31 13 0 856 United States of America 24 39 49 129 166 126 69 49 74 62 47 834 Italy 4 0 4 26 62 35 35 21 67 132 296 682 Japan 13 7 21 91 130 132 82 36 69 28 17 626 Taiwan 4 0 39 184 193 106 25 19 25 26 0 621 Ireland 10 6 8 60 240 116 40 21 24 26 21 572 Philippines 11 12 7 51 129 123 73 38 58 25 5 532 Somalia 10 32 26 69 73 62 67 56 61 26 12 494 Germany 0 8 11 42 73 87 45 32 37 57 80 472 Saudi Arabia 22 35 24 153 159 43 11 3 0 0 0 450 Sri Lanka 4 7 14 126 103 77 36 14 27 28 11 447 Scotland 4 0 10 29 51 58 41 37 57 69 47 403 Canada 7 6 15 78 104 81 31 27 28 16 3 396 South Africa 0 3 26 48 84 59 48 33 55 29 9 394 Iran 4 0 14 35 118 106 31 12 17 8 4 349 France 0 0 14 70 104 70 17 21 19 19 11 345

Appendix to 2013 Multicultural Community Demographic Profile
Country of birth
Residents (by age)
0-4 years
5-14 years
15-19
years
20-24 years
25-29 years
30-34 years
35-39
years
40-44
years
45-54
years
55-64
years
65 years
& over
Total
Ethiopia 3 16 20 34 27 30 45 28 37 8 8 256 Colombia 0 0 3 40 91 81 20 5 6 4 0 250 Mauritius 0 0 11 104 57 39 6 5 8 9 5 244 Eritrea 0 5 5 17 12 19 35 34 35 19 20 201 Poland 0 0 3 0 25 41 17 12 19 25 53 195 Turkey 0 0 0 21 19 20 15 26 32 23 38 194 Greece 0 0 0 0 9 16 3 10 29 43 78 188 Netherlands 0 0 9 12 23 27 15 13 13 40 35 187 Brazil 4 0 3 23 55 52 17 6 9 8 3 180 Egypt 4 9 9 9 15 14 11 3 22 39 41 176 Chile 4 5 0 11 23 24 12 18 19 18 20 154 Russian Federation 0 4 4 24 46 19 11 7 14 7 16 152 Sudan 0 12 17 27 24 15 7 10 15 10 8 145 Croatia 0 0 0 9 13 8 5 13 21 22 36 127 Brunei Darussalam 6 0 20 52 24 10 0 5 0 0 0 117 Malta 0 0 0 0 0 3 3 0 18 31 61 116 United Arab Emirates 3 3 14 71 22 3 0 0 0 0 0 116 Kenya 6 26 21 15 12 4 11 6 0 5 0 106 Fiji 0 5 0 11 26 18 11 6 9 7 7 100 Pakistan 0 0 7 22 34 16 10 4 0 0 5 98 Mexico 0 0 3 25 29 23 8 4 0 0 0 92 Serbia 0 0 0 8 13 10 9 5 21 10 15 91 Spain 5 0 3 0 10 16 9 10 7 4 24 88 Wales 0 0 0 7 9 14 8 16 9 14 10 87 Kuwait 0 0 42 27 12 0 0 0 4 0 0 85 Macau (SAR of China) 0 0 26 39 16 0 0 0 0 4 0 85 Sweden 0 0 3 26 18 16 9 6 6 0 0 84 Switzerland 3 0 5 9 14 14 0 13 11 3 4 76
Appendix to 2013 Multicultural Community Demographic Profile
Country of birth
Residents (by age)
0-4 years
5-14 years
15-19
years
20-24 years
25-29 years
30-34 years
35-39
years
40-44
years
45-54
years
55-64
years
65 years
& over
Total
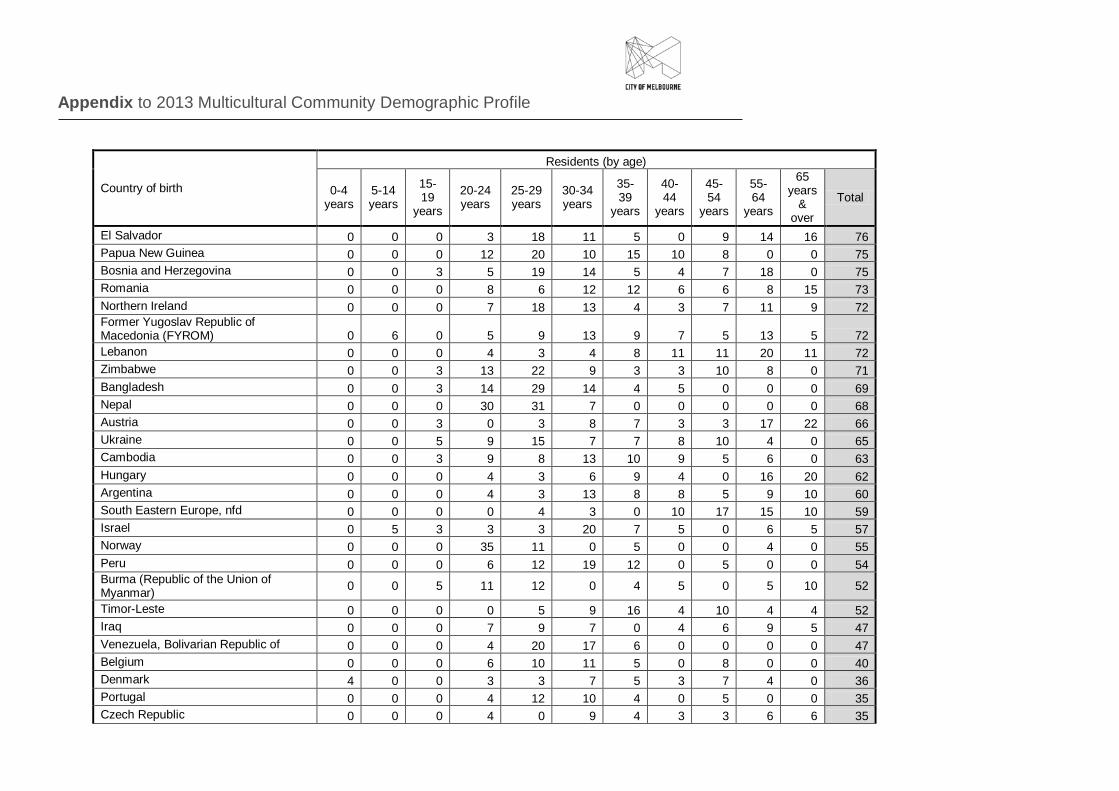
El Salvador 0 0 0 3 18 11 5 0 9 14 16 76 Papua New Guinea 0 0 0 12 20 10 15 10 8 0 0 75 Bosnia and Herzegovina 0 0 3 5 19 14 5 4 7 18 0 75 Romania 0 0 0 8 6 12 12 6 6 8 15 73 Northern Ireland 0 0 0 7 18 13 4 3 7 11 9 72 Former Yugoslav Republic of Macedonia (FYROM) 0 6 0 5 9 13 9 7 5 13 5 72 Lebanon 0 0 0 4 3 4 8 11 11 20 11 72 Zimbabwe 0 0 3 13 22 9 3 3 10 8 0 71 Bangladesh 0 0 3 14 29 14 4 5 0 0 0 69 Nepal 0 0 0 30 31 7 0 0 0 0 0 68 Austria 0 0 3 0 3 8 7 3 3 17 22 66 Ukraine 0 0 5 9 15 7 7 8 10 4 0 65 Cambodia 0 0 3 9 8 13 10 9 5 6 0 63 Hungary 0 0 0 4 3 6 9 4 0 16 20 62 Argentina 0 0 0 4 3 13 8 8 5 9 10 60 South Eastern Europe, nfd 0 0 0 0 4 3 0 10 17 15 10 59 Israel 0 5 3 3 3 20 7 5 0 6 5 57 Norway 0 0 0 35 11 0 5 0 0 4 0 55 Peru 0 0 0 6 12 19 12 0 5 0 0 54 Burma (Republic of the Union of Myanmar) 0 0 5 11 12 0 4 5 0 5 10 52
Timor-Leste 0 0 0 0 5 9 16 4 10 4 4 52 Iraq 0 0 0 7 9 7 0 4 6 9 5 47 Venezuela, Bolivarian Republic of 0 0 0 4 20 17 6 0 0 0 0 47 Belgium 0 0 0 6 10 11 5 0 8 0 0 40 Denmark 4 0 0 3 3 7 5 3 7 4 0 36 Portugal 0 0 0 4 12 10 4 0 5 0 0 35 Czech Republic 0 0 0 4 0 9 4 3 3 6 6 35

Appendix to 2013 Multicultural Community Demographic Profile
Country of birth
Residents (by age)
0-4 years
5-14 years
15-19
years
20-24 years
25-29 years
30-34 years
35-39
years
40-44
years
45-54
years
55-64
years
65 years
& over
Total
Oman 6 0 5 10 7 7 0 0 0 0 0 35 Zambia 0 4 0 3 3 7 8 3 7 0 0 35 Slovenia 0 0 0 0 4 4 0 0 4 4 13 29 Bulgaria 0 0 3 0 7 5 4 3 6 0 0 28 Finland 0 0 0 7 3 5 3 0 6 3 0 27 Laos 0 0 0 4 0 8 7 0 0 4 4 27 Cyprus 0 0 0 0 0 0 0 0 0 7 19 26 Slovakia 0 0 0 0 4 11 5 4 0 0 0 24 Afghanistan 0 0 8 6 4 3 0 0 3 0 0 24 Uruguay 0 0 0 0 0 7 4 0 4 0 7 22 Bahrain 0 0 8 7 3 3 0 0 0 0 0 21 Kazakhstan 0 0 0 7 3 6 4 0 0 0 0 20 Lithuania 0 0 0 0 4 6 5 0 0 0 4 19 Latvia 0 0 0 0 0 0 0 0 0 0 18 18 Syria 0 0 0 0 4 9 0 5 0 0 0 18 Libya 0 0 0 3 0 6 3 0 0 0 5 17 Nigeria 0 0 0 0 9 0 4 4 0 0 0 17 Eastern Europe, nfd 0 0 0 0 0 5 0 0 0 0 11 16 Ghana 0 0 0 0 0 5 0 5 6 0 0 16 Samoa 0 0 0 0 3 6 0 0 6 0 0 15 Tanzania 0 0 0 5 0 4 0 0 6 0 0 15 Morocco 0 0 0 0 4 0 5 5 0 0 0 14 Mongolia 0 0 0 0 6 8 0 0 0 0 0 14 Jordan 4 0 3 0 3 3 0 0 0 0 0 13 Solomon Islands 6 0 0 0 0 0 0 5 0 0 0 11 Estonia 0 0 0 0 7 4 0 0 0 0 0 11 New Caledonia 0 0 0 6 3 0 0 0 0 0 0 9 Uganda 0 0 0 6 0 0 3 0 0 0 0 9

Appendix to 2013 Multicultural Community Demographic Profile
Country of birth
Residents (by age)
0-4 years
5-14 years
15-19
years
20-24 years
25-29 years
30-34 years
35-39
years
40-44
years
45-54
years
55-64
years
65 years
& over
Total
Cook Islands 0 0 0 0 0 0 0 0 5 3 0 8 Uzbekistan 0 0 0 4 4 0 0 0 0 0 0 8 Ecuador 0 0 0 0 0 3 0 5 0 0 0 8 Djibouti 0 4 0 0 0 0 4 0 0 0 0 8 Tonga 0 0 0 0 0 0 0 0 0 7 0 7 Trinidad and Tobago 0 0 0 0 0 0 0 0 0 0 7 7 Seychelles 0 0 0 0 4 0 3 0 0 0 0 7 United Kingdom, Channel Islands and Isle of Man, nfd 0 0 3 0 0 0 0 3 0 0 0 6
Isle of Man 0 0 0 0 0 3 0 0 3 0 0 6 Iceland 0 0 0 3 3 0 0 0 0 0 0 6 Yemen 0 0 0 0 3 3 0 0 0 0 0 6 Jamaica 0 0 0 0 0 6 0 0 0 0 0 6 Namibia 0 0 0 0 0 0 6 0 0 0 0 6 Algeria 0 0 0 0 0 0 0 5 0 0 0 5 Burundi 0 0 0 5 0 0 0 0 0 0 0 5 Albania 0 0 0 0 0 0 0 4 0 0 0 4 Belarus 0 0 0 0 4 0 0 0 0 0 0 4 South Sudan 0 0 0 0 4 0 0 0 0 0 0 4 Qatar 0 0 0 0 4 0 0 0 0 0 0 4 Guyana 0 0 0 0 0 0 0 0 0 4 0 4 Dominican Republic 0 0 0 0 0 4 0 0 0 0 0 4 Kiribati 0 0 0 0 0 0 0 0 3 0 0 3 Jersey 0 0 0 0 3 0 0 0 0 0 0 3 Montenegro 0 0 0 0 0 0 0 0 0 3 0 3 Kosovo 0 0 3 0 0 0 0 0 0 0 0 3 Gaza Strip and West Bank 0 0 0 0 0 0 3 0 0 0 0 3 Maldives 0 0 0 0 0 0 3 0 0 0 0 3 Bermuda 0 0 0 0 3 0 0 0 0 0 0 3

Appendix to 2013 Multicultural Community Demographic Profile
Country of birth
Residents (by age)
0-4 years
5-14 years
15-19
years
20-24 years
25-29 years
30-34 years
35-39
years
40-44
years
45-54
years
55-64
years
65 years
& over
Total
Congo, Democratic Republic of 0 3 0 0 0 0 0 0 0 0 0 3 Botswana 0 0 0 3 0 0 0 0 0 0 0 3 Inadequately described 0 0 3 4 13 12 8 0 6 0 5 51 Not stated 440 490 596 2,070 1,988 1,260 775 590 958 746 712 10,625 Total 3,175 3,470 6,293 19,610 17,868 11,513 6,506 4,786 7,709 6,562 6,135 93,627
Table 5 – Language spoken at home, by age
Language spoken at home
Residents (by age)
0-4 years
5-14 years
15-19 years
20-24 years
25-29 years
30-34 years
35-44 years
45-54 years
55-64 years
65 years & over
Total
English 1,593 1,733 2,682 7,148 8,428 6,123 6,613 4,662 4,470 3,987 47,439 Mandarin 112 191 1,028 4,374 2,052 603 496 445 207 186 9,694 Cantonese 57 113 467 1,446 853 424 344 332 287 275 4,598 Indonesian 32 14 557 1,097 472 186 73 30 24 17 2,502 Arabic 79 104 110 312 262 133 139 95 63 74 1,371 Korean 24 20 75 381 385 291 113 37 14 3 1,343 Vietnamese 41 127 130 221 185 96 169 155 95 66 1,285 Italian 20 24 19 71 114 106 202 176 150 321 1,203 Hindi 55 17 15 134 462 281 81 28 13 6 1,092 Somali 136 316 88 76 71 70 143 72 26 20 1,018 Spanish 35 17 34 94 225 202 143 53 57 62 922 Chinese, nfd 6 12 98 428 91 27 41 51 13 19 786 Thai 15 20 50 211 250 133 52 32 7 0 770 Japanese 39 16 24 92 132 132 119 63 33 15 665 French 21 15 39 155 140 92 60 25 38 22 607

Appendix to 2013 Multicultural Community Demographic Profile
Language spoken at home
Residents (by age)
0-4 years
5-14 years
15-19 years
20-24 years
25-29 years
30-34 years
35-44 years
45-54 years
55-64 years
65 years & over
Total
Malay 6 4 47 318 131 27 17 8 15 0 573 Greek 9 11 20 30 48 55 123 81 63 101 541 German 20 14 13 46 66 76 69 39 29 51 423 Tamil 24 16 3 71 139 91 44 12 0 4 404 Persian (excluding Dari) 6 0 15 37 117 94 35 27 3 0 334 Telugu 25 7 5 31 115 89 33 0 0 0 305 Min Nan 3 3 17 89 69 42 27 18 19 15 302 Sinhalese 3 7 11 72 57 39 27 12 16 4 248 Russian 11 16 9 38 51 35 41 16 15 10 242 Turkish 0 11 13 39 27 27 34 28 30 32 241 Portuguese 13 0 3 19 52 54 26 12 11 5 195 Filipino 11 4 4 19 37 52 35 13 9 0 184 Tagalog 4 7 6 18 44 30 38 25 3 3 178 Polish 0 3 5 10 29 27 20 26 16 33 169 Bengali 13 0 9 25 44 48 16 8 4 0 167 Gujarati 11 4 0 26 65 34 12 5 0 0 157 Marathi 15 12 0 14 44 44 19 5 0 4 157 Croatian 3 0 0 13 21 13 25 30 18 28 151 Serbian 4 8 6 10 20 24 24 17 21 17 151 Malayalam 14 3 0 15 55 37 15 11 0 0 150 Punjabi 5 4 3 41 41 26 9 4 3 0 136 Tigrinya 8 34 10 12 3 11 20 9 5 5 117 Dutch 8 4 3 10 26 22 13 9 9 8 112 Maltese 0 0 0 0 0 7 15 10 12 65 109 Kannada 6 0 0 12 37 31 16 5 0 0 107 Macedonian 0 10 0 4 10 25 35 7 9 6 106 Non-verbal, so described 98 5 0 0 0 0 3 0 0 0 106 Hakka 4 9 10 11 20 10 17 15 4 4 104 Urdu 7 5 4 16 40 18 9 0 0 0 99

Appendix to 2013 Multicultural Community Demographic Profile
Language spoken at home
Residents (by age)
0-4 years
5-14 years
15-19 years
20-24 years
25-29 years
30-34 years
35-44 years
45-54 years
55-64 years
65 years & over
Total
Oromo 5 14 18 17 4 15 8 9 0 0 90 Amharic 8 15 0 7 6 9 24 9 0 0 78 Swedish 5 0 0 22 9 8 14 7 0 0 65 Afrikaans 0 0 3 10 16 8 14 10 3 0 64 Nepali 0 0 0 25 31 6 0 0 0 0 62 Hungarian 0 0 0 0 9 5 12 6 12 12 56 Hebrew 0 0 5 5 6 20 9 7 0 0 52 Norwegian 0 0 0 32 12 3 4 0 0 0 51 Ukrainian 0 5 0 0 6 4 15 3 9 8 50 Romanian 0 6 5 0 5 12 12 5 0 0 45 Mauritian Creole 0 0 0 24 8 6 5 0 0 0 43 Irish 0 0 0 9 19 8 5 0 0 0 41 Bosnian 3 0 4 4 7 7 6 0 9 0 40 Burmese 0 0 4 12 8 4 4 0 4 4 40 Harari 9 6 0 5 0 4 9 7 0 0 40 Khmer 4 0 3 13 8 0 7 0 0 0 35 Auslan 4 7 6 3 6 4 4 0 0 0 34 Danish 5 0 0 10 0 9 4 4 0 0 32 Finnish 4 0 6 6 7 0 7 0 0 0 30 Southern Asian Languages, nfd 0 0 0 6 9 4 3 0 4 3 29 African Languages, nfd 0 4 0 0 5 7 10 0 0 0 26 Konkani 0 4 0 0 13 5 3 0 0 0 25 Dinka 4 6 0 9 6 0 0 0 0 0 25 French Creole, nfd 0 0 0 13 8 4 0 0 0 0 25 Czech 0 0 0 0 0 5 10 0 8 0 23 Maori (New Zealand) 0 0 0 10 5 3 0 5 0 0 23 Oriya 0 0 0 5 5 8 4 0 0 0 22 Wu 0 0 0 12 10 0 0 0 0 0 22 Albanian 0 0 5 0 5 6 5 0 0 0 21

Appendix to 2013 Multicultural Community Demographic Profile
Language spoken at home
Residents (by age)
0-4 years
5-14 years
15-19 years
20-24 years
25-29 years
30-34 years
35-44 years
45-54 years
55-64 years
65 years & over
Total
Bulgarian 0 0 0 0 7 6 7 0 0 0 20 Shona 0 0 0 3 12 0 4 0 0 0 19 Slovak 0 0 0 0 4 5 8 0 0 0 17 Lao 0 0 0 0 0 10 6 0 0 0 16 Latvian 3 0 0 0 0 0 6 0 6 0 15 Slovene 0 0 0 0 0 0 10 0 0 5 15 Mongolian 0 0 3 0 5 7 0 0 0 0 15 Swahili 0 0 0 3 7 5 0 0 0 0 15 Samoan 0 0 0 0 3 6 3 0 0 3 15 Pidgin, nfd 0 0 0 0 6 0 9 0 0 0 15 Lithuanian 0 0 0 0 5 6 3 0 0 0 14 Serbo-Croatian/Yugoslavian, so described 0 0 0 0 3 3 0 0 7 0 13
Gaelic (Scotland) 0 0 0 0 6 0 0 0 5 0 11 Yiddish 0 0 0 0 0 0 0 0 11 0 11 Estonian 0 0 0 0 5 6 0 0 0 0 11 Welsh 0 0 0 0 0 5 4 0 0 0 9 Kurdish 0 3 0 3 3 0 0 0 0 0 9 Pashto 0 0 0 0 4 5 0 0 0 0 9 Hazaraghi 0 0 9 0 0 0 0 0 0 0 9 Armenian 0 0 0 0 0 4 5 0 0 0 9 Sindhi 0 0 3 0 3 3 0 0 0 0 9 Tigre 0 0 3 0 3 3 0 0 0 0 9 Dari 0 0 0 8 0 0 0 0 0 0 8 Tongan 0 0 0 0 8 0 0 0 0 0 8 Assyrian Neo-Aramaic 0 0 0 0 7 0 0 0 0 0 7 Assamese 0 0 0 0 3 0 0 0 0 3 6 Bisaya 0 0 0 0 0 5 0 0 0 0 5 African Languages, nec 0 0 0 0 0 5 0 0 0 0 5

Appendix to 2013 Multicultural Community Demographic Profile
Language spoken at home
Residents (by age)
0-4 years
5-14 years
15-19 years
20-24 years
25-29 years
30-34 years
35-44 years
45-54 years
55-64 years
65 years & over
Total
Cebuano 0 0 0 0 0 4 0 0 0 0 4 Javanese 0 0 4 0 0 0 0 0 0 0 4 Bemba 0 0 0 0 0 4 0 0 0 0 4 Nuer 0 4 0 0 0 0 0 0 0 0 4 Tok Pisin (Neomelanesian) 0 0 0 0 4 0 0 0 0 0 4 Georgian 0 0 0 0 0 0 3 0 0 0 3 Tulu 0 0 0 0 0 0 3 0 0 0 3 Dhivehi 3 0 0 0 0 0 0 0 0 0 3 Indo-Aryan, nec 0 0 0 3 0 0 0 0 0 0 3 Southeast Asian Austronesian Languages, nfd 0 0 0 0 0 0 3 0 0 0 3
Australian Indigenous Languages, nfd 0 0 0 0 3 0 0 0 0 0 3 Akan 0 0 0 0 3 0 0 0 0 0 3 Igbo 0 0 0 0 0 0 3 0 0 0 3 Xhosa 0 0 0 0 0 0 0 0 0 3 3 Seychelles Creole 0 0 0 0 0 0 3 0 0 0 3 Gilbertese 0 0 0 3 0 0 0 0 0 0 3 Solomon Islands Pijin 3 0 0 0 0 0 0 0 0 0 3 Inadequately described 5 0 7 12 11 0 13 0 0 4 52 Not stated 515 454 577 2,030 1,989 1,258 1,397 924 673 626 10,443
Total 3,176 3,468 6,297 19,610 17,867 11,511 11,293 7,704 6,562 6,139 93,627

Appendix to 2013 Multicultural Community Demographic Profile
Table 6 – Country of birth, by proficiency in English
Country of birth
Proficiency in English
Very well/ Well Not well Not at all Not
stated English
only Total
Australia 3,650 265 242 404 33,918 38,479 China* 5,778 1,176 345 60 147 7,506 Malaysia 3,668 124 11 19 1,283 5,105 India 2,256 64 48 29 562 2,959 Indonesia 2,590 69 11 32 156 2,858 England 136 0 0 9 2,621 2,766 New Zealand 121 7 0 17 2,344 2,489 Singapore 1,170 0 0 0 663 1,833 Hong Kong (SAR of China) 1,207 130 19 9 124 1,489 Korea, Republic of (South) 924 321 14 23 154 1,436 Vietnam 793 297 74 35 78 1,277 Thailand 615 131 0 10 101 857 United States of America 93 0 0 0 736 829 Italy 420 108 26 11 119 684 Japan 434 89 10 6 90 629 Taiwan 517 59 5 5 39 625 Ireland 56 0 0 0 517 573 Philippines 351 3 0 0 179 533 Somalia 383 80 20 0 12 495 Germany 267 4 0 0 201 472 Saudi Arabia 337 72 25 0 16 450 Sri Lanka 274 3 0 8 165 450 Scotland 19 0 0 3 380 402 South Africa 85 0 3 0 310 398 Canada 66 0 0 0 331 397 Iran 302 15 0 0 31 348 France 251 8 0 0 88 347

Appendix to 2013 Multicultural Community Demographic Profile
Country of birth
Proficiency in English
Very well/ Well Not well Not at all Not
stated English
only Total
Ethiopia 177 40 13 10 17 257 Colombia 193 30 0 11 20 254 Mauritius 198 0 0 0 47 245 Eritrea 150 36 9 5 3 203 Turkey 112 44 10 7 24 197 Greece 117 37 5 0 33 192 Poland 98 4 0 0 87 189 Netherlands 76 0 0 0 112 188 Brazil 146 9 0 0 29 184 Egypt 114 16 9 4 35 178 Russian Federation 103 13 0 0 39 155 Chile 97 20 10 0 24 151 Sudan 110 33 0 5 0 148 Croatia 78 11 0 6 34 129 Malta 74 10 0 0 35 119 United Arab Emirates 92 0 0 0 26 118 Brunei Darussalam 80 0 0 0 36 116 Kenya 68 0 0 0 37 105 Fiji 40 0 0 0 60 100 Pakistan 83 0 0 0 17 100 Serbia 77 6 0 0 8 91 Mexico 82 0 0 0 9 91 Wales 3 0 0 0 86 89 Spain 70 8 0 0 10 88 Macau (SAR of China) 69 19 0 0 0 88 Sweden 53 0 0 0 33 86 Kuwait 71 6 0 0 7 84 El Salvador 46 22 4 0 6 78

Appendix to 2013 Multicultural Community Demographic Profile
Country of birth
Proficiency in English
Very well/ Well Not well Not at all Not
stated English
only Total
Romania 47 0 0 0 30 77 Papua New Guinea 17 0 0 0 59 76 Former Yugoslav Republic of Macedonia (FYROM) 53 10 0 0 13 76
Switzerland 36 0 0 0 39 75 Bosnia and Herzegovina 52 11 0 0 12 75 Northern Ireland 0 0 0 0 73 73 Lebanon 48 6 0 0 18 72 Nepal 61 5 0 0 6 72 Ukraine 53 4 0 0 14 71 Zimbabwe 21 0 0 0 50 71 Austria 35 0 0 0 33 68 Bangladesh 60 0 0 0 6 66 Hungary 33 0 0 0 29 62 South Eastern Europe, nfd 29 4 0 5 23 61 Cambodia 33 6 0 6 16 61 Peru 51 0 0 0 9 60 Israel 46 0 0 0 12 58 Argentina 58 0 0 0 0 58 Norway 48 0 0 0 7 55 Timor-Leste 31 16 0 0 8 55 Burma (Republic of the Union of Myanmar) 37 0 0 0 15 52
Venezuela, Bolivarian Republic of 44 0 0 0 6 50
Iraq 36 5 0 0 5 46 Belgium 18 0 0 0 22 40 Denmark 26 0 0 0 10 36 Czech Republic 10 5 0 0 21 36

Appendix to 2013 Multicultural Community Demographic Profile
Country of birth
Proficiency in English
Very well/ Well Not well Not at all Not
stated English
only Total
Zambia 8 0 0 0 27 35 Portugal 16 5 0 0 13 34 Oman 24 0 10 0 0 34 Laos 10 4 6 0 11 31 Bulgaria 19 0 0 0 8 27 Cyprus 15 3 0 0 9 27 Finland 15 0 0 0 10 25 Slovenia 16 0 0 0 9 25 Slovakia 15 7 0 0 3 25 Latvia 12 0 0 0 10 22 Bahrain 15 0 0 0 6 21 Afghanistan 20 0 0 0 0 20 Kazakhstan 16 0 0 0 0 16 Tanzania 8 0 0 0 7 15 Eastern Europe, nfd 9 0 0 0 5 14 Lithuania 11 0 0 3 0 14 Libya 7 7 0 0 0 14 Syria 14 0 0 0 0 14 Uruguay 8 0 0 6 0 14 Samoa 8 0 0 0 4 12 Morocco 12 0 0 0 0 12 Mongolia 12 0 0 0 0 12 Ghana 12 0 0 0 0 12 Nigeria 12 0 0 0 0 12 Estonia 10 0 0 0 0 10 Jordan 4 0 6 0 0 10 United Kingdom, Channel Islands and Isle of Man, nfd 0 0 0 0 9 9
Algeria 9 0 0 0 0 9

Appendix to 2013 Multicultural Community Demographic Profile
Country of birth
Proficiency in English
Very well/ Well Not well Not at all Not
stated English
only Total
Cook Islands 4 0 0 0 4 8 Maldives 8 0 0 0 0 8 Solomon Islands 7 0 0 0 0 7 Djibouti 7 0 0 0 0 7 New Caledonia 6 0 0 0 0 6 Iceland 0 0 0 0 6 6 Yemen 6 0 0 0 0 6 Jamaica 0 0 0 0 6 6 Trinidad and Tobago 0 0 0 0 6 6 Uganda 0 3 0 0 3 6 Burundi 5 0 0 0 0 5 Gibraltar 0 0 0 0 4 4 South Sudan 4 0 0 0 0 4 Qatar 4 0 0 0 0 4 Georgia 4 0 0 0 0 4 Caribbean, nfd 4 0 0 0 0 4 Bahamas 0 0 0 0 4 4 Dominican Republic 4 0 0 0 0 4 Namibia 0 4 0 0 0 4 Uzbekistan 3 0 0 0 0 3 Ecuador 0 0 3 0 0 3 Seychelles 3 0 0 0 0 3 Inadequately described 21 0 0 0 29 50 Not stated 377 60 22 9707 463 10629
Total 31227 3554 960 10455 47431 93627

Appendix to 2013 Multicultural Community Demographic Profile
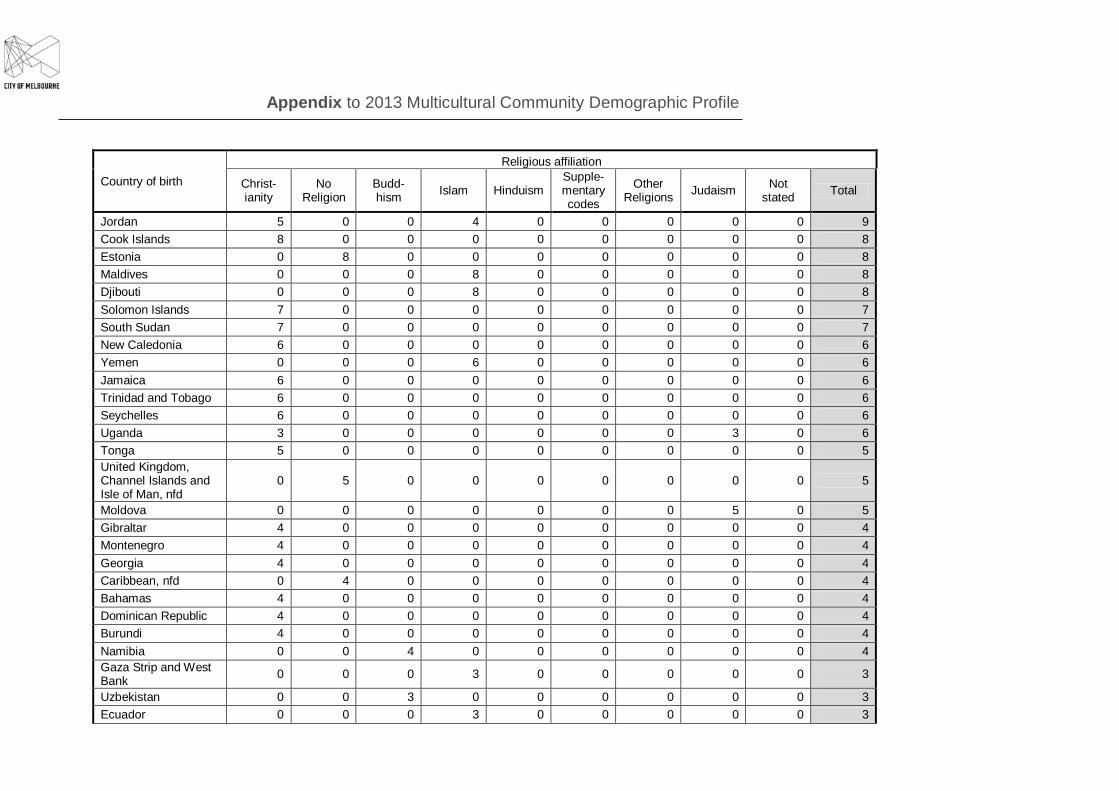
Table 7 – Religious affiliation
Country of birth Religious affiliation
Christ-ianity
No Religion
Budd-hism Islam Hinduism
Supple-mentary codes
Other Religions Judaism Not
stated Total
Australia 17,449 16,169 661 880 109 762 210 279 1,959 38,478 China (excludes SARs and Taiwan) 487 5,411 1,099 8 0 38 14 0 451 7,508
Malaysia 1,474 883 1,986 416 102 33 56 0 162 5,112 India 325 139 17 88 2,149 22 153 0 65 2,958 Indonesia 1,789 140 548 267 41 0 5 0 69 2,859 England 1,167 1,295 39 25 18 62 16 23 122 2,767 New Zealand 848 1,363 35 17 3 79 14 6 123 2,488 Singapore 829 537 260 60 40 8 28 0 79 1,841 Hong Kong (SAR of China) 425 859 107 0 5 12 0 0 84 1,492
Korea, Republic of (South) 666 585 140 0 0 13 0 0 32 1,436
Vietnam 249 371 565 0 0 0 14 0 80 1,279 Thailand 40 55 727 0 10 9 0 0 15 856 United States of America 300 388 12 6 7 24 20 32 49 838
Italy 573 93 0 0 0 0 0 0 19 685 Japan 31 352 200 0 0 3 11 0 33 630 Taiwan 94 304 194 0 0 0 7 0 25 624 Ireland 449 102 0 0 0 9 0 0 12 572 Philippines 458 50 0 0 0 8 0 0 16 532 Somalia 0 0 0 485 0 0 0 0 7 492 Germany 249 154 3 0 0 10 7 22 32 477 Saudi Arabia 12 9 0 429 0 0 0 0 0 450 Sri Lanka 118 51 209 20 44 7 0 0 0 449 Scotland 163 210 0 6 0 7 0 0 21 407 Canada 153 192 7 4 5 6 0 10 22 399 South Africa 198 125 3 7 19 9 0 21 14 396

Appendix to 2013 Multicultural Community Demographic Profile
Country of birth Religious affiliation
Christ-ianity
No Religion
Budd-hism Islam Hinduism
Supple-mentary codes
Other Religions Judaism Not
stated Total
Iran 8 112 0 166 0 9 24 0 34 353 France 127 186 0 0 0 0 0 8 21 342 Ethiopia 102 0 0 142 0 0 0 0 13 257 Colombia 198 47 0 0 0 0 0 0 6 251 Mauritius 162 23 10 0 43 0 0 0 5 243 Eritrea 34 4 0 165 0 0 0 0 0 203 Turkey 0 38 0 140 0 0 0 0 19 197 Poland 118 36 0 0 0 8 0 22 9 193 Netherlands 66 114 0 0 0 0 0 0 8 188 Greece 173 15 0 0 0 0 0 0 0 188 Brazil 108 48 3 0 0 9 8 0 8 184 Egypt 114 8 0 48 0 0 0 0 0 170 Chile 100 45 0 0 0 0 0 0 11 156 Russian Federation 81 54 0 0 0 0 0 14 5 154 Sudan 48 0 0 88 0 0 0 0 10 146 Croatia 90 27 0 0 0 0 0 0 10 127 United Arab Emirates 20 7 0 83 5 0 0 0 5 120 Brunei Darussalam 40 19 30 19 6 0 0 0 6 120 Malta 100 9 0 0 0 0 0 0 6 115 Kenya 20 17 0 59 4 0 0 0 4 104 Fiji 27 18 0 11 44 0 0 0 0 100 Pakistan 4 7 0 83 0 0 0 0 3 97 Serbia 72 20 0 0 0 0 0 0 0 92 Spain 50 38 0 0 0 0 0 0 3 91 Mexico 63 28 0 0 0 0 0 0 0 91 Wales 23 53 0 0 0 0 0 0 11 87 Kuwait 12 0 0 75 0 0 0 0 0 87 Macau (SAR of China) 19 57 5 0 0 0 0 0 6 87

Appendix to 2013 Multicultural Community Demographic Profile
Country of birth Religious affiliation
Christ-ianity
No Religion
Budd-hism Islam Hinduism
Supple-mentary codes
Other Religions Judaism Not
stated Total
Sweden 30 46 0 0 0 0 0 0 5 81 Switzerland 33 38 0 0 0 0 0 0 7 78 Papua New Guinea 49 24 0 0 0 0 0 0 4 77 El Salvador 61 16 0 0 0 0 0 0 0 77 Bosnia and Herzegovina 23 26 0 18 0 0 0 0 9 76
Northern Ireland 56 19 0 0 0 0 0 0 0 75 Former Yugoslav Republic of Macedonia (FYROM)
57 12 0 4 0 0 0 0 0 73
Romania 51 17 0 0 0 0 0 5 0 73 Lebanon 41 9 0 23 0 0 0 0 0 73 Nepal 5 4 14 0 50 0 0 0 0 73 Ukraine 35 27 0 0 0 0 0 8 0 70 Austria 38 22 0 0 0 0 0 6 0 66 Bangladesh 9 0 0 51 6 0 0 0 0 66 Zimbabwe 44 21 0 0 0 0 0 0 0 65 Cambodia 7 14 37 0 0 0 0 0 6 64 Hungary 39 12 0 0 0 0 0 5 5 61 South Eastern Europe, nfd 39 15 0 0 0 0 0 0 5 59
Argentina 42 17 0 0 0 0 0 0 0 59 Israel 0 17 0 0 0 0 0 37 4 58 Peru 49 3 0 0 0 0 6 0 0 58 Norway 9 41 0 0 0 0 0 0 6 56 Timor-Leste 32 3 12 0 0 0 4 0 0 51 Burma (Republic of the Union of Myanmar)
3 3 40 0 3 0 0 0 0 49
Venezuela, Bolivarian Republic of 40 0 0 0 0 0 0 0 5 45

Appendix to 2013 Multicultural Community Demographic Profile
Country of birth Religious affiliation
Christ-ianity
No Religion
Budd-hism Islam Hinduism
Supple-mentary codes
Other Religions Judaism Not
stated Total
Iraq 18 5 0 20 0 0 0 0 0 43 Belgium 14 24 0 0 0 0 0 0 0 38 Czech Republic 25 10 0 0 0 0 0 0 0 35 Oman 0 0 0 35 0 0 0 0 0 35 Laos 6 8 20 0 0 0 0 0 0 34 Zambia 25 5 0 0 4 0 0 0 0 34 Denmark 10 21 0 0 0 0 0 0 0 31 Portugal 19 10 0 0 0 0 0 0 0 29 Slovenia 19 9 0 0 0 0 0 0 0 28 Bulgaria 18 9 0 0 0 0 0 0 0 27 Cyprus 19 5 0 3 0 0 0 0 0 27 Finland 18 6 0 0 0 0 0 0 0 24 Slovakia 15 9 0 0 0 0 0 0 0 24 Afghanistan 0 0 0 24 0 0 0 0 0 24 Uruguay 10 11 0 0 0 0 0 0 0 21 Latvia 16 4 0 0 0 0 0 0 0 20 Kazakhstan 10 4 0 0 0 0 0 0 5 19 Bahrain 4 0 0 13 0 0 0 0 0 17 Lithuania 15 0 0 0 0 0 0 0 0 15 Nigeria 12 3 0 0 0 0 0 0 0 15 Morocco 0 0 0 14 0 0 0 0 0 14 Syria 8 3 0 0 3 0 0 0 0 14 Mongolia 0 0 14 0 0 0 0 0 0 14 Eastern Europe, nfd 8 0 0 0 0 0 0 5 0 13 Ghana 10 3 0 0 0 0 0 0 0 13 Libya 12 0 0 0 0 0 0 0 0 12 Tanzania 0 0 0 6 0 0 6 0 0 12 Samoa 11 0 0 0 0 0 0 0 0 11 Algeria 0 0 0 9 0 0 0 0 0 9
Appendix to 2013 Multicultural Community Demographic Profile
Country of birth Religious affiliation
Christ-ianity
No Religion
Budd-hism Islam Hinduism
Supple-mentary codes
Other Religions Judaism Not
stated Total
Jordan 5 0 0 4 0 0 0 0 0 9 Cook Islands 8 0 0 0 0 0 0 0 0 8 Estonia 0 8 0 0 0 0 0 0 0 8 Maldives 0 0 0 8 0 0 0 0 0 8 Djibouti 0 0 0 8 0 0 0 0 0 8 Solomon Islands 7 0 0 0 0 0 0 0 0 7 South Sudan 7 0 0 0 0 0 0 0 0 7 New Caledonia 6 0 0 0 0 0 0 0 0 6 Yemen 0 0 0 6 0 0 0 0 0 6 Jamaica 6 0 0 0 0 0 0 0 0 6 Trinidad and Tobago 6 0 0 0 0 0 0 0 0 6 Seychelles 6 0 0 0 0 0 0 0 0 6 Uganda 3 0 0 0 0 0 0 3 0 6 Tonga 5 0 0 0 0 0 0 0 0 5 United Kingdom, Channel Islands and Isle of Man, nfd
0 5 0 0 0 0 0 0 0 5
Moldova 0 0 0 0 0 0 0 5 0 5 Gibraltar 4 0 0 0 0 0 0 0 0 4 Montenegro 4 0 0 0 0 0 0 0 0 4 Georgia 4 0 0 0 0 0 0 0 0 4 Caribbean, nfd 0 4 0 0 0 0 0 0 0 4 Bahamas 4 0 0 0 0 0 0 0 0 4 Dominican Republic 4 0 0 0 0 0 0 0 0 4 Burundi 4 0 0 0 0 0 0 0 0 4 Namibia 0 0 4 0 0 0 0 0 0 4 Gaza Strip and West Bank 0 0 0 3 0 0 0 0 0 3
Uzbekistan 0 0 3 0 0 0 0 0 0 3 Ecuador 0 0 0 3 0 0 0 0 0 3

Appendix to 2013 Multicultural Community Demographic Profile
Country of birth Religious affiliation
Christ-ianity
No Religion
Budd-hism Islam Hinduism
Supple-mentary codes
Other Religions Judaism Not
stated Total
Inadequately described 17 22 0 0 0 0 0 10 0 49
Not stated 392 217 67 157 13 13 4 9 9756 10628 Total 32131 31678 7071 4206 2733 1160 607 530 13511 93627
Table 8 – Year of arrival
Country of birth Year of arrival
Before 1991
1991-1995
1996-2000
2001-2005
2006-2010 2011 Not
stated
Not applic-able
Total
Australia 0 0 0 0 0 0 0 38,474 38,474 China (excludes SARs and Taiwan) 418 269 433 1,261 4,391 371 367 0 7,510 Malaysia 490 109 303 980 2,511 530 186 0 5,109 India 146 73 72 321 1,726 464 157 0 2,959 Indonesia 62 47 316 549 1,531 271 85 0 2,861 England 1,178 119 150 278 695 191 159 0 2,770 New Zealand 426 100 230 331 943 336 127 0 2,493 Singapore 121 52 104 308 915 246 96 0 1,842 Hong Kong (SAR of China) 295 158 125 263 519 46 85 0 1,491 Korea, Republic of (South) 46 17 89 263 735 139 150 0 1,439 Vietnam 588 151 68 79 281 33 81 0 1,281 Thailand 42 21 56 150 457 66 66 0 858 United States of America 179 45 53 100 318 97 47 0 839 Italy 459 11 9 19 97 27 63 0 685 Japan 45 36 59 111 293 43 45 0 632 Taiwan 61 69 74 98 246 46 33 0 627 Ireland 98 5 16 38 299 98 21 0 575 Philippines 139 48 48 53 179 54 13 0 534

Appendix to 2013 Multicultural Community Demographic Profile
Country of birth Year of arrival
Before 1991
1991-1995
1996-2000
2001-2005
2006-2010 2011 Not
stated
Not applic-able
Total
Somalia 9 119 143 110 62 15 34 0 492 Germany 181 17 25 52 147 33 21 0 476 Saudi Arabia 7 0 8 14 339 47 36 0 451 Sri Lanka 122 45 21 49 162 33 19 0 451 Scotland 185 16 20 29 108 34 18 0 410 Canada 70 10 28 46 146 73 27 0 400 South Africa 120 31 57 60 93 19 18 0 398 Iran 39 10 14 32 193 49 14 0 351 France 48 10 25 25 155 60 25 0 348 Ethiopia 16 43 35 79 64 0 18 0 255 Colombia 3 0 10 33 164 26 18 0 254 Mauritius 40 0 18 40 135 15 0 0 248 Eritrea 8 83 58 29 20 0 6 0 204 Poland 123 24 5 6 32 0 8 0 198 Turkey 101 12 16 16 35 0 14 0 194 Netherlands 100 0 8 26 37 9 10 0 190 Greece 161 0 4 5 6 3 9 0 188 Brazil 17 7 3 17 112 15 14 0 185 Egypt 104 27 0 17 16 7 5 0 176 Russian Federation 16 20 13 41 49 6 10 0 155 Chile 82 6 0 5 40 17 5 0 155 Sudan 7 18 24 55 27 0 13 0 144 Croatia 73 8 18 11 7 0 11 0 128 Malta 108 0 0 0 0 6 5 0 119 United Arab Emirates 5 0 6 13 82 6 6 0 118 Brunei Darussalam 6 0 7 29 50 19 6 0 117 Kenya 10 6 13 24 43 0 10 0 106 Fiji 37 18 11 5 29 0 0 0 100 Pakistan 7 5 10 11 55 11 0 0 99

Appendix to 2013 Multicultural Community Demographic Profile
Country of birth Year of arrival
Before 1991
1991-1995
1996-2000
2001-2005
2006-2010 2011 Not
stated
Not applic-able
Total
Mexico 0 0 0 17 51 17 11 0 96 Serbia 39 5 25 8 16 0 0 0 93 Spain 22 6 0 8 39 6 7 0 88 Wales 36 0 0 16 27 8 0 0 87 Macau (SAR of China) 4 0 9 17 56 0 0 0 86 Sweden 10 0 7 4 49 14 0 0 84 Switzerland 25 8 8 12 13 14 0 0 80 Kuwait 0 0 0 0 45 35 0 0 80 El Salvador 66 7 0 0 0 0 5 0 78 Papua New Guinea 41 8 0 5 14 4 4 0 76 Bosnia and Herzegovina 10 30 24 0 10 0 0 0 74 Romania 30 8 6 6 24 0 0 0 74 Zimbabwe 25 0 11 22 9 5 0 0 72 Northern Ireland 36 0 6 0 28 0 0 0 70 Former Yugoslav Republic of Macedonia (FYROM) 37 4 0 12 9 0 8 0 70
Lebanon 61 0 0 9 0 0 0 0 70 Nepal 0 5 0 10 55 0 0 0 70 Ukraine 13 12 20 13 6 5 0 0 69 Austria 46 0 0 4 14 3 0 0 67 Hungary 46 0 0 0 14 0 7 0 67 Bangladesh 0 7 0 19 30 10 0 0 66 Cambodia 29 0 0 0 22 5 6 0 62 South Eastern Europe, nfd 38 0 12 0 5 0 5 0 60 Argentina 36 0 0 0 16 6 0 0 58 Israel 21 6 0 4 26 0 0 0 57 Norway 5 0 0 7 19 24 0 0 55 Timor-Leste 39 5 0 0 0 6 5 0 55 Burma (Republic of the Union of Myanmar) 9 0 0 10 22 13 0 0 54

Appendix to 2013 Multicultural Community Demographic Profile
Country of birth Year of arrival
Before 1991
1991-1995
1996-2000
2001-2005
2006-2010 2011 Not
stated
Not applic-able
Total
Peru 8 0 0 7 37 0 0 0 52 Venezuela, Bolivarian Republic of 0 0 0 0 32 17 0 0 49 Iraq 0 4 17 6 15 0 0 0 42 Belgium 16 0 5 0 18 0 0 0 39 Denmark 5 4 0 4 13 6 5 0 37 Oman 0 0 0 6 14 17 0 0 37 Zambia 14 0 0 0 10 5 4 0 33 Portugal 24 0 0 0 7 0 0 0 31 Czech Republic 24 0 0 0 0 7 0 0 31 Bulgaria 0 6 6 5 12 0 0 0 29 Laos 25 0 0 0 4 0 0 0 29 Cyprus 28 0 0 0 0 0 0 0 28 Slovenia 23 0 0 0 0 0 0 0 23 Uruguay 23 0 0 0 0 0 0 0 23 Finland 8 0 6 0 7 0 0 0 21 Afghanistan 5 0 0 6 9 0 0 0 20 Lithuania 8 0 0 0 0 5 6 0 19 Bahrain 0 0 0 5 14 0 0 0 19 Kazakhstan 0 0 0 4 14 0 0 0 18 Nigeria 4 0 0 0 6 6 0 0 16 Eastern Europe, nfd 15 0 0 0 0 0 0 0 15 Latvia 14 0 0 0 0 0 0 0 14 Mongolia 0 0 0 0 11 3 0 0 14 Tanzania 9 0 0 0 5 0 0 0 14 Slovakia 0 0 0 0 13 0 0 0 13 Libya 12 0 0 0 0 0 0 0 12 Morocco 0 0 0 0 12 0 0 0 12 Syria 6 0 6 0 0 0 0 0 12 Solomon Islands 0 0 5 0 0 5 0 0 10

Appendix to 2013 Multicultural Community Demographic Profile
Country of birth Year of arrival
Before 1991
1991-1995
1996-2000
2001-2005
2006-2010 2011 Not
stated
Not applic-able
Total
Samoa 0 0 10 0 0 0 0 0 10 Jordan 0 0 0 0 0 10 0 0 10 Estonia 0 0 0 0 9 0 0 0 9 Maldives 0 0 0 0 5 4 0 0 9 Ghana 8 0 0 0 0 0 0 0 8 United Kingdom, Channel Islands and Isle of Man, nfd 0 0 0 0 6 0 0 0 6
Algeria 0 6 0 0 0 0 0 0 6 Trinidad and Tobago 6 0 0 0 0 0 0 0 6 Seychelles 6 0 0 0 0 0 0 0 6 Cook Islands 0 5 0 0 0 0 0 0 5 South Sudan 0 0 0 5 0 0 0 0 5 Yemen 0 0 0 5 0 0 0 0 5 Georgia 0 0 5 0 0 0 0 0 5 Jamaica 0 0 0 5 0 0 0 0 5 Djibouti 0 0 5 0 0 0 0 0 5 Namibia 0 0 0 0 5 0 0 0 5 Iceland 4 0 0 0 0 0 0 0 4 Moldova 4 0 0 0 0 0 0 0 4 Montenegro 4 0 0 0 0 0 0 0 4 Gaza Strip and West Bank 0 0 0 0 4 0 0 0 4 Dominican Republic 0 0 0 0 4 0 0 0 4 Uganda 0 0 0 0 3 0 0 0 3 Inadequately described 10 0 17 9 5 0 12 0 53 Not stated 3 0 0 0 0 0 0 10624 10627 Total 7638 2001 3015 6351 19457 3821 2246 49098 93627

Appendix to 2013 Multicultural Community Demographic Profile
Table 9 – Need for assistance
Country of birth Has need for
assistance with core activities
Does not have need for assistance with
core activities Not stated Total
Australia 899 36,977 602 38,478 China (excludes SARs and Taiwan) 138 7,257 111 7,506 Malaysia 27 5,026 56 5,109 India 12 2,909 35 2,956 Indonesia 10 2,815 34 2,859 England 64 2,670 32 2,766 New Zealand 17 2,442 29 2,488 Singapore 3 1,811 23 1,837 Hong Kong (SAR of China) 22 1,452 16 1,490 Korea, Republic of (South) 3 1,409 23 1,435 Vietnam 66 1,150 57 1,273 Thailand 0 842 9 851 United States of America 10 813 11 834 Italy 109 561 15 685 Japan 5 616 5 626 Taiwan 5 610 6 621 Ireland 7 556 11 574 Philippines 3 520 11 534 Somalia 17 448 28 493 Germany 15 456 0 471 Saudi Arabia 0 435 14 449 Sri Lanka 8 435 3 446 Scotland 22 378 7 407 South Africa 6 389 0 395 Canada 0 394 0 394 Iran 4 339 6 349 France 0 339 0 339 Ethiopia 4 240 14 258

Appendix to 2013 Multicultural Community Demographic Profile
Country of birth Has need for
assistance with core activities
Does not have need for assistance with
core activities Not stated Total
Colombia 0 247 0 247 Mauritius 0 242 0 242 Eritrea 19 176 6 201 Turkey 29 162 4 195 Poland 13 178 0 191 Greece 38 150 0 188 Netherlands 7 176 3 186 Brazil 0 180 0 180 Egypt 33 140 3 176 Chile 10 139 7 156 Russian Federation 0 151 0 151 Sudan 4 132 12 148 Croatia 12 106 6 124 Malta 22 94 3 119 United Arab Emirates 0 117 0 117 Brunei Darussalam 0 115 0 115 Kenya 0 100 5 105 Fiji 5 97 0 102 Pakistan 0 97 0 97 Mexico 0 92 0 92 Serbia 6 85 0 91 Spain 3 85 0 88 Wales 0 85 0 85 Kuwait 0 85 0 85 Sweden 0 82 0 82 Macau (SAR of China) 0 78 4 82 El Salvador 8 71 0 79 Papua New Guinea 0 76 0 76 Switzerland 0 76 0 76

Appendix to 2013 Multicultural Community Demographic Profile
Country of birth Has need for
assistance with core activities
Does not have need for assistance with
core activities Not stated Total
Northern Ireland 0 75 0 75 Bosnia and Herzegovina 7 68 0 75 Former Yugoslav Republic of Macedonia (FYROM) 8 66 0 74
Romania 0 74 0 74 Lebanon 9 64 0 73 Bangladesh 0 70 0 70 Zimbabwe 0 69 0 69 Ukraine 4 64 0 68 Nepal 0 68 0 68 Austria 10 57 0 67 Hungary 5 59 0 64 Cambodia 0 57 5 62 Argentina 0 60 0 60 South Eastern Europe, nfd 4 51 4 59 Israel 0 56 0 56 Peru 0 56 0 56 Norway 0 55 0 55 Burma (Republic of the Union of Myanmar) 5 49 0 54 Timor-Leste 8 46 0 54 Venezuela, Bolivarian Republic of 0 49 0 49 Iraq 10 36 0 46 Belgium 0 38 0 38 Denmark 0 35 0 35 Oman 0 35 0 35 Portugal 0 34 0 34 Czech Republic 0 33 0 33 Zambia 0 33 0 33 Laos 0 31 0 31 Cyprus 5 23 0 28

Appendix to 2013 Multicultural Community Demographic Profile
Country of birth Has need for
assistance with core activities
Does not have need for assistance with
core activities Not stated Total
Bulgaria 0 27 0 27 Finland 0 26 0 26 Slovenia 0 25 0 25 Slovakia 0 24 0 24 Afghanistan 0 22 0 22 Uruguay 0 22 0 22 Latvia 0 21 0 21 Kazakhstan 0 21 0 21 Bahrain 0 19 0 19 Syria 0 17 0 17 Nigeria 0 17 0 17 Lithuania 0 16 0 16 Libya 0 16 0 16 Morocco 0 16 0 16 Mongolia 0 15 0 15 Ghana 0 15 0 15 Eastern Europe, nfd 0 14 0 14 Tanzania 0 14 0 14 Samoa 0 13 0 13 Jordan 0 11 0 11 Solomon Islands 0 10 0 10 Tonga 0 9 0 9 United Kingdom, Channel Islands and Isle of Man, nfd 0 9 0 9
Trinidad and Tobago 0 9 0 9 Estonia 0 8 0 8 Algeria 0 8 0 8 Uzbekistan 0 8 0 8 Uganda 0 8 0 8 Kosovo 0 0 7 7

Appendix to 2013 Multicultural Community Demographic Profile
Country of birth Has need for
assistance with core activities
Does not have need for assistance with
core activities Not stated Total
Maldives 0 7 0 7 New Caledonia 0 6 0 6 Cook Islands 0 6 0 6 Iceland 0 6 0 6 Ecuador 0 6 0 6 Djibouti 0 6 0 6 Seychelles 0 6 0 6 Yemen 0 5 0 5 Jamaica 0 5 0 5 Namibia 0 5 0 5 Gibraltar 0 4 0 4 Montenegro 0 4 0 4 South Sudan 0 4 0 4 Qatar 0 4 0 4 Guyana 0 4 0 4 Nicaragua 0 4 0 4 Caribbean, nfd 0 4 0 4 Bahamas 0 4 0 4 Burundi 0 4 0 4 Kiribati 0 0 3 3 Gaza Strip and West Bank 0 3 0 3 Georgia 0 3 0 3 Dominican Republic 0 3 0 3 Inadequately described 4 51 0 55 Not stated 66 794 9,765 10,625 Total 1,830 80,802 10,995 93,627

Appendix to 2013 Multicultural Community Demographic Profile
Table 10 – Unpaid carers for a person, by country of birth and gender
Country of birth Unpaid carers for a person
Male Female Total Australia 1,219 1,729 2,948 China (excludes SARs and Taiwan) 140 266 406 England 71 88 159 Malaysia 73 78 151 Vietnam 50 82 132 India 58 50 108 New Zealand 44 53 97 Italy 40 46 86 Hong Kong (SAR of China) 34 43 77 Somalia 20 41 61 Korea, Republic of (South) 17 39 56 Indonesia 23 28 51 Germany 19 26 45 United States of America 21 24 45 Singapore 12 27 39 Japan 11 22 33 South Africa 12 19 31 Malta 11 16 27 Sri Lanka 10 17 27 Ethiopia 10 16 26 Philippines 10 15 25 Greece 7 17 24 Taiwan 6 16 22 Scotland 11 10 21 Eritrea 7 13 20 Poland 7 11 18 Ireland 6 11 17 Egypt 9 8 17 Russian Federation 5 11 16

Appendix to 2013 Multicultural Community Demographic Profile
Country of birth Unpaid carers for a person
Male Female Total Thailand 12 3 15 France 0 13 13 Netherlands 13 0 13 Sudan 0 11 11 Iran 5 6 11 Turkey 4 7 11 Serbia 0 10 10 Cyprus 0 8 8 Portugal 7 0 7 Timor-Leste 0 7 7 Nepal 7 0 7 Austria 6 0 6 Bosnia and Herzegovina 0 6 6 South Sudan 6 0 6 Laos 0 6 6 Wales 0 5 5 Finland 0 5 5 Former Yugoslav Republic of Macedonia (FYROM) 5 0 5
El Salvador 0 5 5 Mexico 0 5 5 South Eastern Europe, nfd 4 0 4 Chile 0 4 4 Morocco 3 0 3 Not stated 38 48 86 Total 2073 2971 5044

Appendix to 2013 Multicultural Community Demographic Profile
Table 11 – Unpaid carers for a person, by country of birth and age
Country of birth Age (years)
15-19
20-24
25-29
30-34
35-39
40-44
45-49
50-54
55-59
60-64
65-69
70-74 75 + Total
Australia 96 245 274 267 234 241 260 315 331 296 203 91 93 2,946 China (excludes SARs and Taiwan) 32 143 64 24 18 31 30 24 13 7 4 7 12 409
England 0 11 9 12 7 7 24 19 20 28 13 7 0 157 Malaysia 17 53 17 8 11 4 0 10 11 6 6 4 0 147 Vietnam 3 6 9 12 20 22 11 19 14 3 0 6 5 130 India 0 11 28 29 12 5 0 5 9 0 4 0 3 106 New Zealand 4 3 6 8 9 12 11 14 9 9 8 3 0 96 Italy 0 0 0 0 0 0 0 15 10 22 9 7 17 80 Hong Kong (SAR of China) 7 18 10 11 6 0 7 0 0 12 0 0 0 71 Somalia 0 11 12 3 11 13 3 5 0 0 0 0 0 58 Indonesia 9 22 10 8 0 0 0 0 0 4 4 0 0 57 Korea, Republic of (South) 5 9 13 15 3 4 3 0 0 0 0 0 0 52 United States of America 0 4 3 3 4 5 4 5 6 5 5 0 0 44 Singapore 6 6 10 0 8 3 5 0 0 0 0 0 0 38 Germany 0 0 4 0 6 0 0 0 5 11 6 5 0 37 Japan 0 3 3 3 7 4 6 0 3 0 6 0 0 35 South Africa 0 0 4 7 0 0 5 0 4 7 0 0 0 27 Malta 0 0 0 0 0 0 4 0 3 4 5 5 5 26 Greece 0 0 0 3 0 3 0 8 3 3 0 0 5 25 Taiwan 0 6 9 5 0 5 0 0 0 0 0 0 0 25 Sri Lanka 0 3 5 3 6 0 0 5 3 0 0 0 0 25 Ethiopia 0 5 0 4 12 0 4 0 0 0 0 0 0 25 Philippines 0 0 4 9 0 0 0 6 4 0 0 0 0 23 Scotland 0 0 4 0 5 0 7 0 0 4 0 0 0 20 Thailand 0 6 6 8 0 0 0 0 0 0 0 0 0 20 Eritrea 0 0 0 0 5 0 6 5 0 0 0 4 0 20 Ireland 0 4 3 0 4 4 0 0 0 3 0 0 0 18 Poland 0 0 0 9 0 0 0 0 0 8 0 0 0 17

Appendix to 2013 Multicultural Community Demographic Profile
Country of birth Age (years)
15-19
20-24
25-29
30-34
35-39
40-44
45-49
50-54
55-59
60-64
65-69
70-74 75 + Total
Netherlands 0 0 0 0 0 0 5 0 5 5 0 0 0 15 Egypt 0 4 0 0 0 0 0 6 5 0 0 0 0 15 Russian Federation 0 0 3 0 5 5 0 0 0 0 0 0 0 13 Turkey 0 0 5 0 0 0 0 0 8 0 0 0 0 13 Canada 0 0 0 4 5 0 0 3 0 0 0 0 0 12 Timor-Leste 0 0 0 0 6 0 0 0 0 5 0 0 0 11 Serbia 0 0 0 0 0 5 5 0 0 0 0 0 0 10 Iran 0 0 0 0 6 0 0 0 0 4 0 0 0 10 France 0 0 0 0 0 0 0 0 9 0 0 0 0 9 Lebanon 0 0 0 4 0 5 0 0 0 0 0 0 0 9 Mauritius 0 0 0 0 0 6 0 0 0 0 0 0 3 9 Saudi Arabia 0 0 4 4 0 0 0 0 0 0 0 0 0 8 South Eastern Europe, nfd 0 0 0 0 0 7 0 0 0 0 0 0 0 7 Croatia 0 0 0 0 0 0 7 0 0 0 0 0 0 7 Austria 0 0 0 0 0 0 0 0 6 0 0 0 0 6 Slovenia 0 0 0 0 0 0 0 0 0 0 0 6 0 6 Algeria 0 0 0 0 0 6 0 0 0 0 0 0 0 6 Sudan 0 0 6 0 0 0 0 0 0 0 0 0 0 6 Argentina 0 0 0 0 0 6 0 0 0 0 0 0 0 6 Chile 0 0 0 0 0 0 0 0 6 0 0 0 0 6 Northern Ireland 0 0 0 0 0 0 0 0 0 5 0 0 0 5 Wales 0 0 0 0 0 0 0 0 5 0 0 0 0 5 Spain 0 0 0 0 0 5 0 0 0 0 0 0 0 5 South Sudan 0 0 5 0 0 0 0 0 0 0 0 0 0 5 United Arab Emirates 0 5 0 0 0 0 0 0 0 0 0 0 0 5 Pakistan 0 0 5 0 0 0 0 0 0 0 0 0 0 5 Nepal 0 0 4 0 0 0 0 0 0 0 0 0 0 4 Kenya 0 0 0 4 0 0 0 0 0 0 0 0 0 4 Samoa 0 0 0 3 0 0 0 0 0 0 0 0 0 3 United Kingdom, Channel 0 0 3 0 0 0 0 0 0 0 0 0 0 3

Appendix to 2013 Multicultural Community Demographic Profile
Country of birth Age (years)
15-19
20-24
25-29
30-34
35-39
40-44
45-49
50-54
55-59
60-64
65-69
70-74 75 + Total
Islands and Isle of Man, nfd Not stated 5 6 6 8 4 4 7 8 10 15 8 3 3 87 Total 184 584 548 478 414 412 414 472 502 466 281 148 146 5,049
Table 12 – Unpaid carers of children, by country of birth and age
Country of birth Age (years)
15-19
20-24
25-29
30- 34
35- 39
40- 44
45-49
50-54
55-59
60-64
65-69
70-74 75 + Total
Australia 133 240 386 733 915 810 531 315 263 311 275 153 76 5,141 China (excludes SARs and Taiwan) 9 32 51 78 75 106 102 37 24 12 8 10 7 551
India 0 9 91 197 81 17 9 11 6 3 7 3 0 434 England 0 10 17 47 89 52 62 36 15 39 27 12 15 421 New Zealand 4 14 24 51 56 43 33 22 9 13 12 0 0 281 Vietnam 0 6 23 35 65 58 36 24 11 3 6 6 0 273 Malaysia 8 32 26 56 41 19 20 15 12 11 9 4 5 258 Somalia 7 14 31 32 37 30 10 7 4 6 0 0 0 178 Indonesia 4 18 20 50 30 7 11 0 0 4 0 0 0 144 United States of America 0 11 9 19 20 17 14 13 0 8 0 0 0 111
Hong Kong (SAR of China) 0 6 13 22 14 10 13 11 6 7 0 6 0 108
Singapore 0 16 15 16 22 15 8 3 3 0 5 0 0 103 Italy 0 0 3 4 3 7 11 8 12 12 13 15 4 92 Philippines 0 5 15 19 27 12 0 9 0 0 0 0 0 87 Korea, Republic of (South) 0 0 11 32 20 8 5 4 5 0 0 0 0 85

Appendix to 2013 Multicultural Community Demographic Profile
Country of birth Age (years)
15-19
20-24
25-29
30- 34
35- 39
40- 44
45-49
50-54
55-59
60-64
65-69
70-74 75 + Total
Japan 0 3 10 23 27 12 0 3 0 0 5 0 0 83 Ethiopia 4 4 9 14 21 9 7 4 0 0 0 0 0 72 Germany 4 0 0 6 18 17 3 6 0 13 0 3 0 70 Eritrea 0 0 0 12 16 19 13 9 0 0 0 0 0 69 Saudi Arabia 3 13 27 20 4 0 0 0 0 0 0 0 0 67 Scotland 0 0 4 4 15 9 7 11 0 10 0 0 4 64 South Africa 0 0 4 4 10 10 13 8 0 8 0 0 0 57 Sri Lanka 0 4 5 12 14 4 0 3 5 0 7 0 0 54 Ireland 0 0 14 10 13 0 6 4 4 0 0 0 0 51 Thailand 0 0 11 19 7 5 8 0 0 0 0 0 0 50 Sudan 3 4 9 10 5 6 5 5 0 0 0 0 0 47 Chile 0 0 4 12 4 9 7 0 8 0 0 0 0 44 Taiwan 0 0 0 18 0 11 8 0 5 0 0 0 0 42 Netherlands 0 0 0 8 0 5 0 0 0 12 10 0 0 35 Canada 0 0 4 10 7 7 0 6 0 0 0 0 0 34 France 0 0 5 13 0 5 5 0 0 0 0 0 0 28 Poland 0 0 0 6 4 5 4 0 0 0 0 9 0 28 Russian Federation 0 0 0 7 9 5 0 0 0 5 0 0 0 26 Turkey 0 0 0 4 5 9 6 0 0 0 0 0 0 24 Iran 0 0 0 4 11 4 4 0 0 0 0 0 0 23 Lebanon 0 0 0 6 8 5 0 0 0 3 0 0 0 22 Greece 0 0 0 3 3 6 0 0 0 0 0 0 8 20 Papua New Guinea 0 0 0 3 7 5 4 0 0 0 0 0 0 19 Mauritius 0 0 0 8 6 4 0 0 0 0 0 0 0 18 Pakistan 0 5 5 7 0 0 0 0 0 0 0 0 0 17 Wales 0 0 0 0 5 0 0 5 0 0 0 6 0 16 Egypt 0 0 7 0 0 0 0 9 0 0 0 0 0 16 Argentina 0 0 0 5 4 7 0 0 0 0 0 0 0 16 Fiji 0 0 0 0 7 5 0 3 0 0 0 0 0 15 Timor-Leste 0 0 0 0 6 4 0 0 0 5 0 0 0 15

Appendix to 2013 Multicultural Community Demographic Profile
Country of birth Age (years)
15-19
20-24
25-29
30- 34
35- 39
40- 44
45-49
50-54
55-59
60-64
65-69
70-74 75 + Total
Brazil 0 0 0 6 6 3 0 0 0 0 0 0 0 15 Croatia 0 0 0 0 4 5 0 0 0 5 0 0 0 14 Former Yugoslav Republic of Macedonia (FYROM)
0 0 0 4 5 5 0 0 0 0 0 0 0 14
Switzerland 0 0 0 4 0 9 0 0 0 0 0 0 0 13 Spain 0 0 0 7 0 6 0 0 0 0 0 0 0 13 Bosnia and Herzegovina 0 0 0 7 6 0 0 0 0 0 0 0 0 13
Serbia 0 0 0 0 0 6 7 0 0 0 0 0 0 13 Brunei Darussalam 0 3 0 9 0 0 0 0 0 0 0 0 0 12 Austria 0 0 0 0 0 0 0 0 6 5 0 0 0 11 Bangladesh 0 0 5 6 0 0 0 0 0 0 0 0 0 11 Colombia 0 0 0 6 5 0 0 0 0 0 0 0 0 11 Kenya 0 5 0 0 6 0 0 0 0 0 0 0 0 11 Romania 0 0 0 0 0 10 0 0 0 0 0 0 0 10 Ukraine 0 0 7 0 3 0 0 0 0 0 0 0 0 10 Cambodia 0 0 0 4 6 0 0 0 0 0 0 0 0 10 South Eastern Europe, nfd 0 0 0 0 0 4 0 5 0 0 0 0 0 9
Samoa 0 0 0 7 0 0 0 0 0 0 0 0 0 7 Northern Ireland 3 0 0 3 0 0 0 0 0 0 0 0 0 6 Belgium 0 0 0 0 0 3 0 0 0 0 0 0 3 6 Laos 0 0 0 0 6 0 0 0 0 0 0 0 0 6 Nepal 0 0 6 0 0 0 0 0 0 0 0 0 0 6 Zimbabwe 0 0 0 6 0 0 0 0 0 0 0 0 0 6 Denmark 0 0 0 0 0 5 0 0 0 0 0 0 0 5 Sweden 0 0 0 0 5 0 0 0 0 0 0 0 0 5 Israel 0 0 0 0 0 5 0 0 0 0 0 0 0 5 Syria 0 0 0 0 0 5 0 0 0 0 0 0 0 5 Mongolia 0 0 0 5 0 0 0 0 0 0 0 0 0 5
Appendix to 2013 Multicultural Community Demographic Profile
Country of birth Age (years)
15-19
20-24
25-29
30- 34
35- 39
40- 44
45-49
50-54
55-59
60-64
65-69
70-74 75 + Total
Peru 0 0 0 5 0 0 0 0 0 0 0 0 0 5 Mexico 0 0 5 0 0 0 0 0 0 0 0 0 0 5 Zambia 0 0 0 5 0 0 0 0 0 0 0 0 0 5 Djibouti 0 0 0 0 4 0 0 0 0 0 0 0 0 4 Malta 0 0 0 0 0 0 0 0 0 0 3 0 0 3 Slovenia 0 0 0 3 0 0 0 0 0 0 0 0 0 3 Hungary 0 0 0 0 0 0 0 0 0 3 0 0 0 3 El Salvador 0 0 0 0 0 3 0 0 0 0 0 0 0 3 Inadequately described 0 0 5 0 0 0 5 0 0 0 0 0 0 10
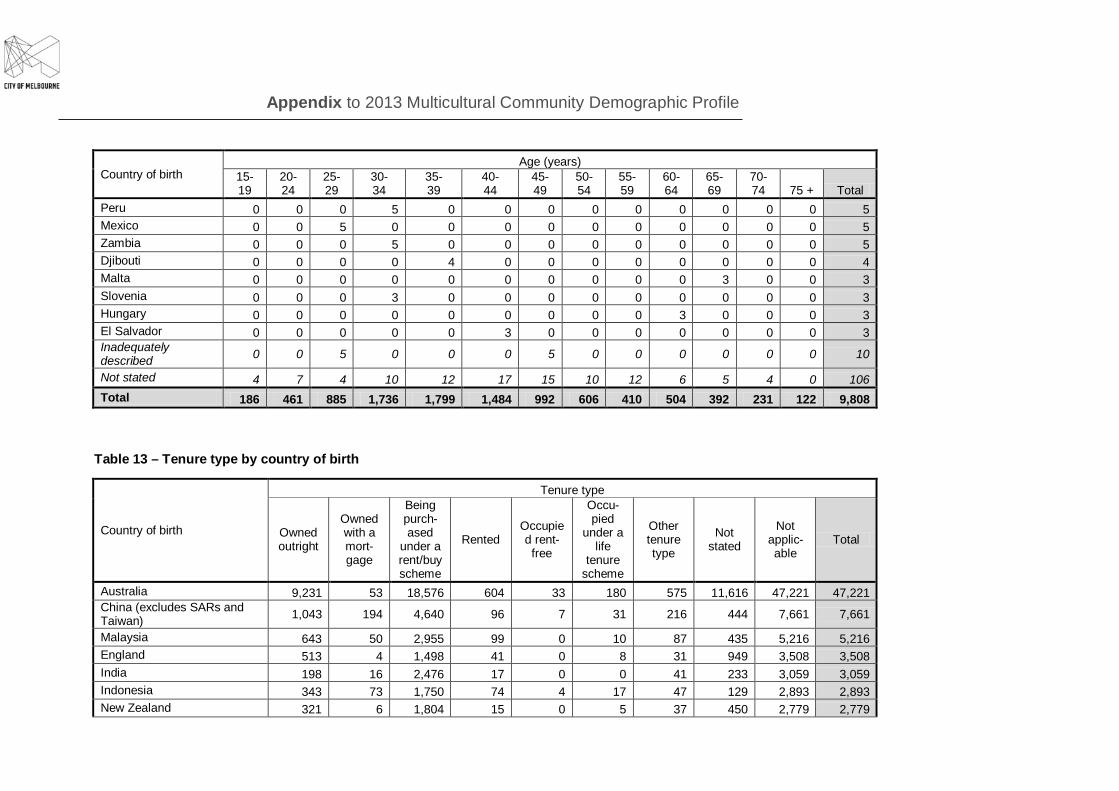
Not stated 4 7 4 10 12 17 15 10 12 6 5 4 0 106 Total 186 461 885 1,736 1,799 1,484 992 606 410 504 392 231 122 9,808
Table 13 – Tenure type by country of birth
Country of birth
Tenure type
Owned outright
Owned with a mort-gage
Being purch-ased
under a rent/buy scheme
Rented Occupied rent-free
Occu-pied
under a life
tenure scheme
Other tenure type
Not stated
Not applic-able
Total
Australia 9,231 53 18,576 604 33 180 575 11,616 47,221 47,221 China (excludes SARs and Taiwan) 1,043 194 4,640 96 7 31 216 444 7,661 7,661
Malaysia 643 50 2,955 99 0 10 87 435 5,216 5,216 England 513 4 1,498 41 0 8 31 949 3,508 3,508 India 198 16 2,476 17 0 0 41 233 3,059 3,059 Indonesia 343 73 1,750 74 4 17 47 129 2,893 2,893 New Zealand 321 6 1,804 15 0 5 37 450 2,779 2,779

Appendix to 2013 Multicultural Community Demographic Profile
Country of birth
Tenure type
Owned outright
Owned with a mort-gage
Being purch-ased
under a rent/buy scheme
Rented Occupied rent-free
Occu-pied
under a life
tenure scheme
Other tenure type
Not stated
Not applic-able
Total
Singapore 211 12 1,107 36 0 4 25 218 1,872 1,872 Hong Kong (SAR of China) 218 15 885 28 0 6 25 187 1,556 1,556 Korea, Republic of (South) 83 22 1,139 17 0 10 53 99 1,473 1,473 Vietnam 245 4 718 21 7 7 40 113 1,324 1,324 United States of America 121 0 552 17 0 0 0 170 945 945 Thailand 75 12 642 20 0 5 18 47 867 867 Italy 88 0 196 0 0 5 17 182 767 767 Japan 49 0 456 8 0 6 8 77 657 657 Taiwan 75 5 346 17 0 0 4 76 646 646 Ireland 43 0 444 0 0 0 5 95 620 620 Philippines 79 0 366 14 0 0 6 73 572 572 Germany 72 0 249 0 0 4 4 99 522 522 Scotland 75 0 213 6 0 0 5 140 506 506 South Africa 39 73 6 244 3 0 0 0 137 502 Somalia 3 6 13 414 10 0 5 41 8 500 Sri Lanka 31 78 17 261 5 3 0 5 85 485 Saudi Arabia 20 0 9 400 5 0 12 0 8 454 Canada 26 48 0 287 0 0 0 0 73 434 France 30 42 0 228 0 0 7 3 42 352 Iran 11 33 0 279 0 0 0 0 27 350 Ethiopia 0 0 0 213 0 3 5 33 16 270 Mauritius 23 28 0 172 0 0 0 0 31 254 Colombia 7 18 0 202 6 0 0 7 11 251 Netherlands 45 35 0 81 0 0 0 7 78 246 Greece 62 41 0 55 0 0 0 9 62 229 Turkey 0 29 5 140 0 0 0 9 24 207 Poland 41 43 0 86 0 0 0 9 25 204

Appendix to 2013 Multicultural Community Demographic Profile
Country of birth
Tenure type
Owned outright
Owned with a mort-gage
Being purch-ased
under a rent/buy scheme
Rented Occupied rent-free
Occu-pied
under a life
tenure scheme
Other tenure type
Not stated
Not applic-able
Total
Eritrea 0 0 0 182 0 0 7 13 0 202 Egypt 32 24 0 100 0 0 5 5 30 196 Brazil 8 5 0 142 0 0 0 3 27 185 Russian Federation 16 27 0 104 0 0 0 0 19 166 Chile 10 20 0 118 0 0 0 0 9 157 Sudan 8 0 0 121 0 0 0 4 12 145 Croatia 21 37 0 56 0 0 0 0 26 140 Malta 57 6 0 27 0 0 0 9 33 132 Fiji 5 17 0 65 0 0 0 0 41 128 Brunei Darussalam 21 12 3 64 4 0 4 0 12 120 United Arab Emirates 3 3 0 97 0 5 0 0 10 118 Kenya 0 10 0 73 0 0 0 15 15 113 Pakistan 7 3 0 74 0 0 0 0 27 111 Wales 20 19 0 41 0 0 0 0 28 108 Mexico 0 10 0 79 0 0 0 6 5 100 Zimbabwe 10 9 0 48 0 0 0 0 33 100 Serbia 6 33 0 53 0 0 0 0 7 99 Papua New Guinea 13 14 0 47 0 0 0 4 19 97 Spain 7 12 0 62 0 0 0 0 14 95 Lebanon 22 10 0 36 8 0 0 0 19 95 Sweden 0 10 0 68 0 0 0 0 14 92 Northern Ireland 10 15 0 38 0 0 0 4 24 91 Kuwait 0 4 4 70 0 0 0 5 6 89 Switzerland 7 18 0 46 0 0 0 0 17 88 Romania 5 11 0 48 0 0 0 9 15 88 Bosnia and Herzegovina 0 26 0 44 0 0 0 6 7 83 Former Yugoslav Republic of 5 19 0 45 0 0 0 0 12 81

Appendix to 2013 Multicultural Community Demographic Profile
Country of birth
Tenure type
Owned outright
Owned with a mort-gage
Being purch-ased
under a rent/buy scheme
Rented Occupied rent-free
Occu-pied
under a life
tenure scheme
Other tenure type
Not stated
Not applic-able
Total
Macedonia (FYROM) Macau (SAR of China) 10 0 6 65 0 0 0 0 0 81 Austria 22 13 0 24 0 0 0 0 20 79 Ukraine 0 29 0 37 0 0 0 0 10 76 El Salvador 0 7 0 63 0 0 0 5 0 75 Bangladesh 5 13 0 39 0 0 0 0 17 74 Hungary 22 10 0 22 0 6 0 3 10 73 South Eastern Europe, nfd 3 19 0 28 0 0 0 5 16 71 Nepal 0 5 0 52 0 0 0 0 13 70 Israel 13 7 0 38 0 0 0 0 9 67 Argentina 5 12 0 27 0 0 0 7 16 67 Cambodia 3 19 0 31 0 0 0 0 9 62 Timor-Leste 25 9 0 18 0 0 0 0 6 58 Norway 0 6 0 45 0 0 0 0 6 57 Burma (Republic of the Union of Myanmar) 0 7 0 39 0 0 0 0 11 57
Peru 0 4 0 46 0 0 0 0 7 57 Venezuela, Bolivarian Republic of 0 0 0 50 0 0 0 0 0 50
Denmark 6 4 0 19 0 0 0 0 20 49 Iraq 0 0 0 37 0 0 0 0 9 46 Belgium 12 6 0 16 0 0 0 0 11 45 Zambia 0 5 0 30 0 0 0 0 5 40 Portugal 7 5 0 12 0 0 0 0 12 36 Oman 4 0 0 27 0 0 0 5 0 36 Cyprus 12 6 0 0 0 0 0 0 17 35 Czech Republic 12 9 0 14 0 0 0 0 0 35

Appendix to 2013 Multicultural Community Demographic Profile
Country of birth
Tenure type
Owned outright
Owned with a mort-gage
Being purch-ased
under a rent/buy scheme
Rented Occupied rent-free
Occu-pied
under a life
tenure scheme
Other tenure type
Not stated
Not applic-able
Total
Laos 0 9 0 20 0 0 0 0 6 35 Finland 0 0 0 18 3 0 0 0 8 29 Afghanistan 0 5 0 15 0 0 0 0 8 28 Slovenia 8 8 0 11 0 0 0 0 0 27 Bulgaria 0 8 0 13 0 0 0 0 4 25 Kazakhstan 7 0 0 14 0 0 0 0 0 21 Uruguay 0 0 0 21 0 0 0 0 0 21 Samoa 0 0 0 14 0 0 0 0 5 19 Lithuania 5 0 0 14 0 0 0 0 0 19 Slovakia 0 0 0 19 0 0 0 0 0 19 Morocco 0 0 0 19 0 0 0 0 0 19 Latvia 7 0 0 11 0 0 0 0 0 18 Bahrain 0 0 0 14 0 0 0 0 4 18 Tanzania 3 0 0 14 0 0 0 0 0 17 Solomon Islands 0 5 0 5 0 0 0 0 5 15 Ghana 0 0 0 11 0 0 0 0 4 15 Eastern Europe, nfd 10 0 0 0 0 0 0 0 4 14 Mongolia 6 0 0 8 0 0 0 0 0 14 Syria 0 7 0 6 0 0 0 0 0 13 Trinidad and Tobago 0 5 0 5 0 0 0 0 3 13 Libya 9 0 0 3 0 0 0 0 0 12 Nigeria 0 0 0 12 0 0 0 0 0 12 Uganda 0 0 0 6 3 0 0 0 3 12 Tonga 0 6 0 5 0 0 0 0 0 11 Estonia 0 0 0 8 0 0 0 0 3 11 Algeria 0 0 0 10 0 0 0 0 0 10 Jordan 0 0 0 10 0 0 0 0 0 10

Appendix to 2013 Multicultural Community Demographic Profile
Country of birth
Tenure type
Owned outright
Owned with a mort-gage
Being purch-ased
under a rent/buy scheme
Rented Occupied rent-free
Occu-pied
under a life
tenure scheme
Other tenure type
Not stated
Not applic-able
Total
Uzbekistan 0 0 0 9 0 0 0 0 0 9 United Kingdom, Channel Islands and Isle of Man, nfd 0 0 0 7 0 0 0 0 0 7
Kosovo 0 0 0 7 0 0 0 0 0 7 New Caledonia 0 0 0 6 0 0 0 0 0 6 Djibouti 0 0 0 6 0 0 0 0 0 6 Cook Islands 0 0 0 5 0 0 0 0 0 5 Montenegro 5 0 0 0 0 0 0 0 0 5 Yemen 0 0 5 0 0 0 0 0 0 5 Bermuda 0 0 0 0 0 0 0 0 5 5 Ecuador 0 0 0 0 0 0 0 0 5 5 Burundi 0 0 0 5 0 0 0 0 0 5 Namibia 0 5 0 0 0 0 0 0 0 5 Seychelles 5 0 0 0 0 0 0 0 0 5 Isle of Man 0 0 0 0 0 0 0 0 4 4 Gibraltar 0 0 0 4 0 0 0 0 0 4 Moldova 0 0 0 4 0 0 0 0 0 4 Gaza Strip and West Bank 0 0 0 4 0 0 0 0 0 4 Maldives 0 0 0 4 0 0 0 0 0 4 Nicaragua 0 0 0 4 0 0 0 0 0 4 Caribbean, nfd 0 0 0 4 0 0 0 0 0 4 Bahamas 0 0 0 4 0 0 0 0 0 4 Dominican Republic 0 0 0 4 0 0 0 0 0 4 Kiribati 0 0 0 3 0 0 0 0 0 3 Iceland 3 0 0 0 0 0 0 0 0 3 Inadequately described 0 8 0 36 0 0 0 4 9 57 Not stated 188 134 14 645 0 0 17 8741 5667 15406

Appendix to 2013 Multicultural Community Demographic Profile
Country of birth
Tenure type
Owned outright
Owned with a mort-gage
Being purch-ased
under a rent/buy scheme
Rented Occupied rent-free
Occu-pied
under a life
tenure scheme
Other tenure type
Not stated
Not applic-able
Total
Overseas visitor 367 236 64 2531 57 0 30 506 6013 9804 Total 12320 15205 612 50399 1234 68 390 10726 28924 119878
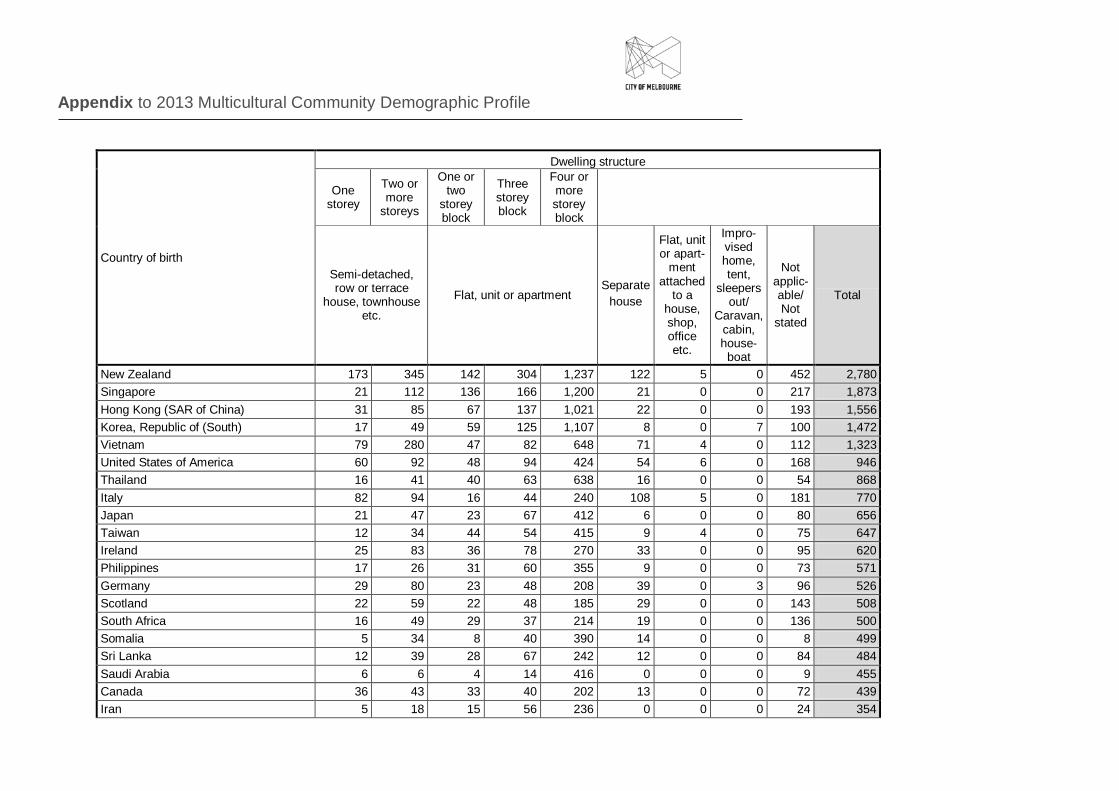
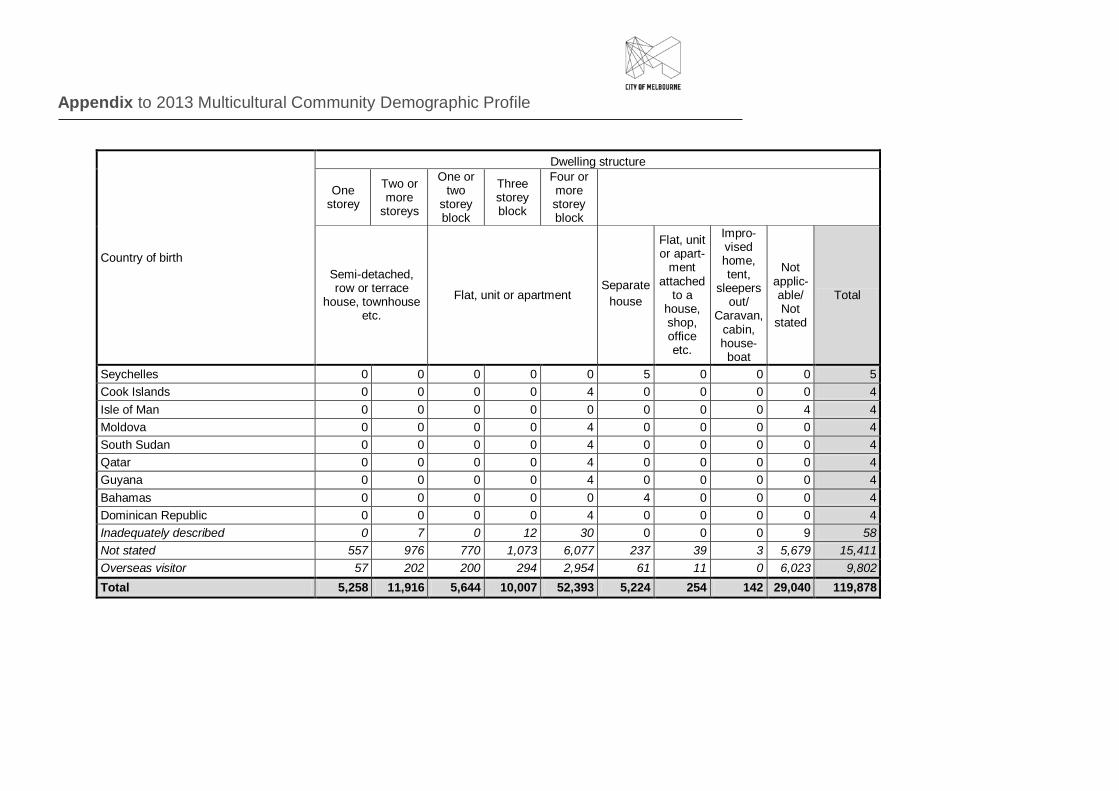
Table 14 – Dwelling structure by country of birth
Country of birth
Dwelling structure
One storey
Two or more
storeys
One or two
storey block
Three storey block
Four or more storey block
Semi-detached, row or terrace
house, townhouse etc.
Flat, unit or apartment Separate
house
Flat, unit or apart-
ment attached
to a house, shop, office etc.
Impro-vised home, tent,
sleepers out/
Caravan, cabin, house-boat
Not applic-able/ Not
stated
Total
Australia 3,223 7,165 2,218 4,454 119 3,586 136 118 11,653 47,223 China (excludes SARs and Taiwan) 142 355 431 600 5,541 141 9 0 446 7,665 Malaysia 79 323 417 448 3,397 108 0 0 443 5,215 England 197 394 158 334 1,253 196 13 5 959 3,509 India 40 91 145 307 2,212 26 3 6 232 3,062 Indonesia 18 77 196 121 2,319 24 0 0 137 2,892
Appendix to 2013 Multicultural Community Demographic Profile
Country of birth
Dwelling structure
One storey
Two or more
storeys
One or two
storey block
Three storey block
Four or more storey block
Semi-detached, row or terrace
house, townhouse etc.
Flat, unit or apartment Separate
house
Flat, unit or apart-
ment attached
to a house, shop, office etc.
Impro-vised home, tent,
sleepers out/
Caravan, cabin, house-boat
Not applic-able/ Not
stated
Total
New Zealand 173 345 142 304 1,237 122 5 0 452 2,780 Singapore 21 112 136 166 1,200 21 0 0 217 1,873 Hong Kong (SAR of China) 31 85 67 137 1,021 22 0 0 193 1,556 Korea, Republic of (South) 17 49 59 125 1,107 8 0 7 100 1,472 Vietnam 79 280 47 82 648 71 4 0 112 1,323 United States of America 60 92 48 94 424 54 6 0 168 946 Thailand 16 41 40 63 638 16 0 0 54 868 Italy 82 94 16 44 240 108 5 0 181 770 Japan 21 47 23 67 412 6 0 0 80 656 Taiwan 12 34 44 54 415 9 4 0 75 647 Ireland 25 83 36 78 270 33 0 0 95 620 Philippines 17 26 31 60 355 9 0 0 73 571 Germany 29 80 23 48 208 39 0 3 96 526 Scotland 22 59 22 48 185 29 0 0 143 508 South Africa 16 49 29 37 214 19 0 0 136 500 Somalia 5 34 8 40 390 14 0 0 8 499 Sri Lanka 12 39 28 67 242 12 0 0 84 484 Saudi Arabia 6 6 4 14 416 0 0 0 9 455 Canada 36 43 33 40 202 13 0 0 72 439 Iran 5 18 15 56 236 0 0 0 24 354

Appendix to 2013 Multicultural Community Demographic Profile
Country of birth
Dwelling structure
One storey
Two or more
storeys
One or two
storey block
Three storey block
Four or more storey block
Semi-detached, row or terrace
house, townhouse etc.
Flat, unit or apartment Separate
house
Flat, unit or apart-
ment attached
to a house, shop, office etc.
Impro-vised home, tent,
sleepers out/
Caravan, cabin, house-boat
Not applic-able/ Not
stated
Total
France 20 37 23 46 173 14 0 0 40 353 Ethiopia 3 18 13 27 189 3 0 0 15 268 Mauritius 0 17 17 16 170 4 0 0 31 255 Colombia 7 15 15 41 166 0 0 0 9 253 Netherlands 12 23 8 17 96 9 0 0 79 244 Greece 14 31 9 22 67 24 0 0 62 229 Turkey 5 24 14 18 117 5 0 0 24 207 Poland 4 35 10 25 95 9 0 0 25 203 Eritrea 0 23 6 12 157 0 3 0 0 201 Egypt 9 27 0 20 99 9 0 0 32 196 Brazil 3 21 0 18 117 4 0 0 26 189 Russian Federation 0 14 0 23 103 5 0 0 21 166 Chile 5 25 9 38 65 8 0 0 7 157 Sudan 6 17 4 15 90 3 0 0 12 147 Croatia 10 15 7 3 77 6 0 0 24 142 Malta 33 8 0 5 39 15 0 0 32 132 Fiji 0 21 0 6 57 0 0 0 42 126 United Arab Emirates 0 5 6 0 95 0 0 0 10 116 Brunei Darussalam 0 0 19 9 76 0 0 0 11 115 Kenya 0 9 6 11 68 0 0 0 17 111

Appendix to 2013 Multicultural Community Demographic Profile
Country of birth
Dwelling structure
One storey
Two or more
storeys
One or two
storey block
Three storey block
Four or more storey block
Semi-detached, row or terrace
house, townhouse etc.
Flat, unit or apartment Separate
house
Flat, unit or apart-
ment attached
to a house, shop, office etc.
Impro-vised home, tent,
sleepers out/
Caravan, cabin, house-boat
Not applic-able/ Not
stated
Total
Pakistan 0 5 0 15 60 0 0 0 29 109 Wales 10 5 5 5 43 9 0 0 29 106 Mexico 7 8 0 17 54 0 0 0 13 99 Papua New Guinea 3 15 16 8 33 4 0 0 19 98 Zimbabwe 0 7 5 16 36 0 0 0 34 98 Spain 5 10 5 4 50 10 0 0 13 97 Serbia 0 19 0 22 46 0 0 0 9 96 Lebanon 6 6 6 4 40 13 0 0 19 94 Sweden 9 9 5 8 50 0 0 0 12 93 Northern Ireland 4 14 0 8 32 6 0 0 25 89 Romania 10 5 4 7 44 0 0 0 18 88 Switzerland 5 8 0 20 33 5 0 0 16 87 Macau (SAR of China) 0 0 13 11 62 0 0 0 0 86 Kuwait 0 0 0 0 76 0 0 0 9 85 Bosnia and Herzegovina 0 6 5 15 45 0 5 0 7 83 Former Yugoslav Republic of Macedonia (FYROM) 0 16 7 6 41 0 0 0 11 81
Ukraine 0 8 5 12 44 0 0 0 9 78 El Salvador 11 26 0 12 28 0 0 0 0 77 Austria 0 0 0 11 36 5 0 0 22 74 Nepal 10 0 5 10 36 0 0 0 13 74

Appendix to 2013 Multicultural Community Demographic Profile
Country of birth
Dwelling structure
One storey
Two or more
storeys
One or two
storey block
Three storey block
Four or more storey block
Semi-detached, row or terrace
house, townhouse etc.
Flat, unit or apartment Separate
house
Flat, unit or apart-
ment attached
to a house, shop, office etc.
Impro-vised home, tent,
sleepers out/
Caravan, cabin, house-boat
Not applic-able/ Not
stated
Total
Bangladesh 0 7 0 8 43 0 0 0 15 73 South Eastern Europe, nfd 0 7 0 4 33 5 0 0 19 68 Hungary 5 0 0 0 43 5 0 0 14 67 Israel 0 10 0 13 28 8 0 0 8 67 Argentina 6 8 0 10 29 0 0 0 14 67 Cambodia 0 0 0 4 44 9 0 0 7 64 Burma (Republic of the Union of Myanmar) 0 0 0 5 45 0 0 0 12 62
Timor-Leste 0 16 0 0 17 9 11 0 6 59 Norway 0 13 0 6 33 0 0 0 6 58 Peru 0 7 0 12 28 0 0 0 8 55 Denmark 7 9 0 6 10 0 0 0 20 52 Venezuela, Bolivarian Republic of 0 0 6 8 36 0 0 0 0 50 Iraq 0 9 0 6 26 0 0 0 8 49 Cyprus 0 0 0 5 21 4 0 0 15 45 Belgium 11 12 0 0 9 0 0 0 12 44 Zambia 0 0 0 16 15 0 0 0 6 37 Portugal 11 0 0 0 9 0 0 0 14 34 Oman 0 0 0 5 29 0 0 0 0 34 Laos 0 4 0 0 22 0 0 0 7 33 Czech Republic 0 0 0 6 26 0 0 0 0 32

Appendix to 2013 Multicultural Community Demographic Profile
Country of birth
Dwelling structure
One storey
Two or more
storeys
One or two
storey block
Three storey block
Four or more storey block
Semi-detached, row or terrace
house, townhouse etc.
Flat, unit or apartment Separate
house
Flat, unit or apart-
ment attached
to a house, shop, office etc.
Impro-vised home, tent,
sleepers out/
Caravan, cabin, house-boat
Not applic-able/ Not
stated
Total
Finland 0 7 0 0 15 0 0 0 7 29 Afghanistan 0 10 0 0 10 0 0 0 8 28 Bulgaria 0 7 0 0 14 0 0 0 4 25 Slovenia 0 0 0 6 19 0 0 0 0 25 Slovakia 5 0 0 0 18 0 0 0 0 23 Uruguay 0 0 0 8 13 0 0 0 0 21 Lithuania 4 0 0 0 10 4 0 0 0 18 Bahrain 0 0 5 0 9 0 0 0 4 18 Kazakhstan 0 4 0 0 14 0 0 0 0 18 Samoa 0 0 0 4 7 0 0 0 6 17 Tanzania 0 0 0 0 17 0 0 0 0 17 Morocco 0 9 0 0 7 0 0 0 0 16 Ghana 0 0 0 5 8 0 0 0 3 16 Solomon Islands 0 5 0 0 0 5 0 0 5 15 Eastern Europe, nfd 0 0 0 0 10 0 0 0 5 15 Latvia 0 0 0 0 14 0 0 0 0 14 Syria 0 0 0 0 13 0 0 0 0 13 Mongolia 0 0 0 6 7 0 0 0 0 13 Trinidad and Tobago 0 0 0 0 4 5 0 0 4 13 United Kingdom, Channel Islands and Isle of Man, nfd 0 4 0 0 8 0 0 0 0 12

Appendix to 2013 Multicultural Community Demographic Profile
Country of birth
Dwelling structure
One storey
Two or more
storeys
One or two
storey block
Three storey block
Four or more storey block
Semi-detached, row or terrace
house, townhouse etc.
Flat, unit or apartment Separate
house
Flat, unit or apart-
ment attached
to a house, shop, office etc.
Impro-vised home, tent,
sleepers out/
Caravan, cabin, house-boat
Not applic-able/ Not
stated
Total
Libya 0 5 0 0 0 7 0 0 0 12 Tonga 0 0 0 0 10 0 0 0 0 10 Estonia 0 0 0 0 5 0 0 0 4 9 Algeria 0 0 0 9 0 0 0 0 0 9 Jordan 0 0 0 0 9 0 0 0 0 9 Uzbekistan 0 0 0 0 9 0 0 0 0 9 Iceland 0 0 0 0 8 0 0 0 0 8 Nigeria 0 0 0 0 8 0 0 0 0 8 Kosovo 0 0 0 0 7 0 0 0 0 7 New Caledonia 0 0 0 0 6 0 0 0 0 6 Djibouti 0 0 0 0 6 0 0 0 0 6 Uganda 0 0 0 0 0 0 0 0 6 6 Kiribati 0 5 0 0 0 0 0 0 0 5 Montenegro 0 0 0 0 5 0 0 0 0 5 Yemen 0 0 0 0 5 0 0 0 0 5 Maldives 0 0 0 5 0 0 0 0 0 5 Bermuda 0 0 0 0 0 0 0 0 5 5 Ecuador 0 0 0 0 0 0 0 0 5 5 Burundi 0 0 0 0 5 0 0 0 0 5 Namibia 0 0 0 0 5 0 0 0 0 5
Appendix to 2013 Multicultural Community Demographic Profile
Country of birth
Dwelling structure
One storey
Two or more
storeys
One or two
storey block
Three storey block
Four or more storey block
Semi-detached, row or terrace
house, townhouse etc.
Flat, unit or apartment Separate
house
Flat, unit or apart-
ment attached
to a house, shop, office etc.
Impro-vised home, tent,
sleepers out/
Caravan, cabin, house-boat
Not applic-able/ Not
stated
Total
Seychelles 0 0 0 0 0 5 0 0 0 5 Cook Islands 0 0 0 0 4 0 0 0 0 4 Isle of Man 0 0 0 0 0 0 0 0 4 4 Moldova 0 0 0 0 4 0 0 0 0 4 South Sudan 0 0 0 0 4 0 0 0 0 4 Qatar 0 0 0 0 4 0 0 0 0 4 Guyana 0 0 0 0 4 0 0 0 0 4 Bahamas 0 0 0 0 0 4 0 0 0 4 Dominican Republic 0 0 0 0 4 0 0 0 0 4 Inadequately described 0 7 0 12 30 0 0 0 9 58 Not stated 557 976 770 1,073 6,077 237 39 3 5,679 15,411 Overseas visitor 57 202 200 294 2,954 61 11 0 6,023 9,802 Total 5,258 11,916 5,644 10,007 52,393 5,224 254 142 29,040 119,878

Appendix to 2013 Multicultural Community Demographic Profile
Table 15 – Household composition
Country of birth One family household
Two or more family house-
hold
Lone person house-
hold
Group house-
hold
Visitors only
Other non-clas-sifiable
Not applic-able
Total
Australia 21,182 186 7,196 5,844 1,181 15 11,617 47,221 China (excludes SARs and Taiwan) 3,281 89 1,253 2,516 78 0 446 7,663 Malaysia 2,319 36 1,045 1,348 26 3 437 5,214 England 1,570 10 554 362 66 0 948 3,510 India 1,791 13 371 626 28 0 233 3,062 Indonesia 1,413 11 574 747 20 0 129 2,894 New Zealand 1,286 20 395 598 34 0 451 2,784 Singapore 649 4 546 437 16 0 220 1,872 Hong Kong (SAR of China) 680 0 307 373 8 0 189 1,557 Korea, Republic of (South) 659 5 248 446 10 0 103 1,471 Vietnam 810 35 210 136 18 0 114 1,323 United States of America 503 0 140 118 15 0 170 946 Thailand 382 6 152 272 7 0 48 867 Italy 384 10 143 43 7 0 181 768 Japan 349 6 132 96 0 0 76 659 Taiwan 258 0 143 165 8 0 75 649 Ireland 295 7 73 139 12 0 95 621 Philippines 308 5 101 88 0 0 71 573 Germany 246 0 87 75 17 0 98 523 Scotland 231 0 77 45 15 0 139 507 South Africa 211 4 91 50 9 0 136 501 Somalia 436 6 33 13 4 0 8 500 Sri Lanka 219 7 116 56 0 0 87 485 Saudi Arabia 311 0 74 52 13 0 7 457 Canada 190 0 79 93 0 0 73 435 Iran 174 0 112 45 0 0 24 355 France 189 0 48 72 0 0 42 351

Appendix to 2013 Multicultural Community Demographic Profile
Country of birth One family household
Two or more family house-
hold
Lone person house-
hold
Group house-
hold
Visitors only
Other non-clas-sifiable
Not applic-able
Total
Ethiopia 194 13 51 0 0 0 12 270 Mauritius 133 0 52 41 0 0 29 255 Colombia 147 0 19 78 0 0 9 253 Netherlands 105 0 42 14 6 0 78 245 Greece 108 0 53 3 4 0 61 229 Turkey 98 4 54 26 0 0 24 206 Poland 103 0 55 19 0 0 26 203 Eritrea 168 4 25 5 0 0 0 202 Egypt 108 0 47 11 0 0 30 196 Brazil 114 3 22 26 0 0 23 188 Russian Federation 98 0 31 17 0 0 20 166 Chile 94 3 27 25 0 0 12 161 Sudan 109 0 19 0 0 0 14 142 Croatia 60 6 42 9 0 0 24 141 Malta 52 0 38 12 0 0 34 136 Fiji 50 0 31 7 0 0 41 129 Brunei Darussalam 59 0 28 23 0 0 8 118 United Arab Emirates 35 0 39 34 0 0 9 117 Kenya 67 8 8 9 5 0 16 113 Pakistan 43 0 19 23 0 0 24 109 Wales 45 0 31 0 0 0 31 107 Zimbabwe 37 0 13 18 0 0 33 101 Mexico 47 0 15 31 0 0 6 99 Serbia 60 0 29 0 0 0 9 98 Papua New Guinea 44 0 19 6 8 0 20 97 Spain 52 0 28 0 0 0 14 94 Northern Ireland 40 0 17 13 0 0 22 92 Lebanon 34 0 30 5 4 0 19 92 Sweden 38 0 12 29 0 0 12 91

Appendix to 2013 Multicultural Community Demographic Profile
Country of birth One family household
Two or more family house-
hold
Lone person house-
hold
Group house-
hold
Visitors only
Other non-clas-sifiable
Not applic-able
Total
Kuwait 11 0 33 30 10 0 6 90 Romania 59 0 13 0 0 0 15 87 Macau (SAR of China) 38 0 18 31 0 0 0 87 Switzerland 44 0 6 16 0 0 18 84 Bosnia and Herzegovina 40 0 25 5 6 0 7 83 Austria 33 0 23 4 0 0 19 79 Former Yugoslav Republic of Macedonia (FYROM) 54 0 6 6 0 0 13 79
El Salvador 42 6 22 8 0 0 0 78 Ukraine 42 0 15 5 6 0 9 77 Nepal 38 3 4 19 0 0 13 77 Bangladesh 31 0 13 12 0 0 18 74 Hungary 39 0 18 4 0 0 12 73 South Eastern Europe, nfd 26 0 25 0 0 0 18 69 Argentina 43 0 8 0 0 0 15 66 Israel 40 0 10 6 0 0 9 65 Cambodia 40 0 8 9 0 0 8 65 Burma (Republic of the Union of Myanmar) 22 8 13 7 0 0 11 61
Peru 40 0 6 5 0 0 7 58 Norway 22 0 4 24 0 0 5 55 Timor-Leste 36 6 6 0 0 0 7 55 Denmark 21 0 10 0 0 0 20 51 Venezuela, Bolivarian Republic of 35 0 3 13 0 0 0 51 Iraq 19 0 20 3 0 0 8 50 Belgium 21 0 3 11 0 0 11 46 Cyprus 6 0 15 3 0 0 17 41 Portugal 17 0 9 0 0 0 11 37 Oman 18 0 5 12 0 0 0 35

Appendix to 2013 Multicultural Community Demographic Profile
Country of birth One family household
Two or more family house-
hold
Lone person house-
hold
Group house-
hold
Visitors only
Other non-clas-sifiable
Not applic-able
Total
Zambia 20 0 3 8 0 0 3 34 Laos 17 0 8 0 0 0 7 32 Afghanistan 9 0 4 11 0 0 7 31 Finland 14 0 6 5 0 0 5 30 Czech Republic 24 0 3 3 0 0 0 30 Slovenia 17 0 6 0 3 0 0 26 Bulgaria 17 0 0 0 0 0 5 22 Uruguay 16 0 6 0 0 0 0 22 Slovakia 18 0 3 0 0 0 0 21 Tanzania 10 0 0 8 0 3 0 21 Latvia 15 0 4 0 0 0 0 19 Kazakhstan 19 0 0 0 0 0 0 19 Lithuania 18 0 0 0 0 0 0 18 Bahrain 8 0 0 6 0 0 4 18 Solomon Islands 11 0 0 0 0 0 5 16 Samoa 7 0 0 0 0 0 9 16 Syria 11 0 5 0 0 0 0 16 Eastern Europe, nfd 11 0 0 0 0 0 4 15 Morocco 15 0 0 0 0 0 0 15 Ghana 11 0 0 0 0 0 4 15 Libya 13 0 0 0 0 0 0 13 Mongolia 8 0 4 0 0 0 0 12 Trinidad and Tobago 4 0 5 0 0 0 3 12 Uganda 9 0 0 0 0 0 3 12 Jordan 10 0 0 0 0 0 0 10 Algeria 9 0 0 0 0 0 0 9 Tonga 7 0 0 0 0 0 0 7 United Kingdom, Channel Islands and Isle of Man, nfd 7 0 0 0 0 0 0 7

Appendix to 2013 Multicultural Community Demographic Profile
Country of birth One family household
Two or more family house-
hold
Lone person house-
hold
Group house-
hold
Visitors only
Other non-clas-sifiable
Not applic-able
Total
Nigeria 0 0 7 0 0 0 0 7 Yemen 6 0 0 0 0 0 0 6 Uzbekistan 0 0 6 0 0 0 0 6 Djibouti 6 0 0 0 0 0 0 6 Namibia 6 0 0 0 0 0 0 6 New Caledonia 0 0 5 0 0 0 0 5 Iceland 5 0 0 0 0 0 0 5 Estonia 0 0 0 0 0 0 5 5 Gaza Strip and West Bank 5 0 0 0 0 0 0 5 Maldives 5 0 0 0 0 0 0 5 Ecuador 0 0 0 0 0 0 5 5 Burundi 0 0 5 0 0 0 0 5 Seychelles 5 0 0 0 0 0 0 5 Isle of Man 0 0 0 0 0 0 4 4 Montenegro 4 0 0 0 0 0 0 4 Qatar 4 0 0 0 0 0 0 4 Bermuda 0 0 0 0 0 0 4 4 Bahamas 4 0 0 0 0 0 0 4 Dominican Republic 4 0 0 0 0 0 0 4 Kiribati 3 0 0 0 0 0 0 3 Inadequately described 28 0 15 0 5 0 10 58 Not stated 645 7 288 236 202 8,362 5,668 15,408 Overseas visitor 507 3 664 255 2,158 202 6,014 9,803 Total 45,137 534 16,584 16,104 4,009 8,585 28,923 119,876

Appendix to 2013 Multicultural Community Demographic Profile
Table 16 – Household Internet connection
Country of birth Broadband connection
Dial-up connection
Other connection
No Internet connection
Not stated
Not applicable Total
Australia 28,974 731 2,493 2,552 854 11,618 47,222 China (excludes SARs and Taiwan) 6,059 170 174 527 285 447 7,662 Malaysia 4,312 99 134 126 107 437 5,215 England 2,112 53 177 170 50 948 3,510 India 2,376 53 208 143 50 232 3,062 Indonesia 2,487 74 83 66 52 131 2,893 New Zealand 1,892 34 233 125 48 450 2,782 Singapore 1,476 46 80 28 21 219 1,870 Hong Kong (SAR of China) 1,167 35 53 76 35 189 1,555 Korea, Republic of (South) 1,131 30 43 109 58 101 1,472 Vietnam 856 36 54 206 56 114 1,322 United States of America 686 12 52 21 5 169 945 Thailand 684 22 54 37 26 46 869 Italy 350 9 24 173 27 182 765 Japan 500 21 25 27 8 77 658 Taiwan 527 4 21 18 0 76 646 Ireland 407 20 36 54 12 93 622 Philippines 426 5 32 28 7 73 571 Germany 331 5 37 37 15 97 522 Scotland 282 14 29 32 13 138 508 South Africa 294 12 39 22 0 135 502 Somalia 344 8 6 83 49 9 499 Sri Lanka 342 7 20 26 5 84 484 Saudi Arabia 376 16 25 24 10 7 458 Canada 320 6 22 9 0 75 432 France 236 18 26 30 0 42 352 Iran 272 7 23 25 0 25 352 Ethiopia 104 9 5 94 40 15 267 Mauritius 191 8 19 10 0 28 256

Appendix to 2013 Multicultural Community Demographic Profile
Country of birth Broadband connection
Dial-up connection
Other connection
No Internet connection
Not stated
Not applicable Total
Colombia 190 0 20 15 17 9 251 Netherlands 144 0 5 18 0 78 245 Greece 89 8 4 63 5 60 229 Turkey 122 0 10 40 11 25 208 Eritrea 129 9 5 45 15 0 203 Poland 135 0 10 27 5 25 202 Egypt 96 9 10 48 0 33 196 Brazil 133 0 18 6 7 24 188 Russian Federation 130 0 5 11 0 21 167 Chile 105 0 0 36 6 8 155 Sudan 81 5 4 38 4 14 146 Croatia 77 0 7 31 0 26 141 Malta 46 0 0 49 6 33 134 Fiji 63 0 9 16 0 40 128 United Arab Emirates 98 0 7 0 4 9 118 Kenya 67 0 4 8 19 15 113 Pakistan 74 3 0 11 0 24 112 Brunei Darussalam 100 0 0 0 0 11 111 Wales 52 0 15 14 0 28 109 Mexico 73 4 11 3 5 5 101 Spain 56 5 6 12 4 14 97 Serbia 73 0 0 14 0 9 96 Zimbabwe 61 0 0 0 0 35 96 Lebanon 57 0 0 13 4 20 94 Sweden 62 0 11 7 0 13 93 Papua New Guinea 60 0 0 6 5 21 92 Kuwait 53 10 4 10 8 6 91 Northern Ireland 59 0 0 0 5 26 90 Macau (SAR of China) 68 12 4 3 0 0 87 Romania 57 0 0 11 0 16 84

Appendix to 2013 Multicultural Community Demographic Profile
Country of birth Broadband connection
Dial-up connection
Other connection
No Internet connection
Not stated
Not applicable Total
Switzerland 58 0 6 0 0 19 83 Former Yugoslav Republic of Macedonia (FYROM) 55 0 10 3 0 14 82
Bosnia and Herzegovina 50 0 0 17 6 8 81 El Salvador 40 0 0 33 6 0 79 Ukraine 57 0 0 11 0 8 76 Austria 47 0 7 0 0 20 74 Bangladesh 49 0 7 0 0 18 74 Nepal 41 0 5 10 5 13 74 South Eastern Europe, nfd 34 0 0 13 6 17 70 Hungary 43 0 4 11 0 12 70 Argentina 42 0 0 3 7 14 66 Israel 47 0 4 6 0 8 65 Cambodia 47 0 5 6 0 7 65 Burma (Republic of the Union of Myanmar) 42 0 10 0 0 10 62 Peru 45 0 8 0 0 7 60 Norway 47 0 5 0 0 6 58 Timor-Leste 44 0 0 8 0 6 58 Denmark 31 0 0 0 0 19 50 Venezuela, Bolivarian Republic of 46 0 4 0 0 0 50 Iraq 24 0 0 11 5 9 49 Belgium 33 0 0 0 0 12 45 Cyprus 20 0 0 5 0 15 40 Zambia 30 0 4 0 0 5 39 Laos 19 0 5 6 0 6 36 Portugal 23 0 0 0 0 12 35 Czech Republic 28 0 5 0 0 0 33 Finland 26 0 0 0 0 5 31 Oman 26 4 0 0 0 0 30 Afghanistan 18 0 0 4 0 7 29 Slovenia 22 0 0 0 5 0 27

Appendix to 2013 Multicultural Community Demographic Profile
Country of birth Broadband connection
Dial-up connection
Other connection
No Internet connection
Not stated
Not applicable Total
Bulgaria 21 0 0 0 0 4 25 Uruguay 10 4 0 11 0 0 25 Samoa 12 0 0 4 0 5 21 Kazakhstan 21 0 0 0 0 0 21 Lithuania 11 0 4 0 5 0 20 Bahrain 15 0 0 0 0 5 20 Latvia 15 0 0 3 0 0 18 Slovakia 18 0 0 0 0 0 18 Tanzania 17 0 0 0 0 0 17 Eastern Europe, nfd 11 0 0 0 0 5 16 Solomon Islands 4 0 6 0 0 5 15 Morocco 15 0 0 0 0 0 15 Ghana 11 0 0 0 0 4 15 Libya 14 0 0 0 0 0 14 United Kingdom, Channel Islands and Isle of Man, nfd 12 0 0 0 0 0 12
Mongolia 12 0 0 0 0 0 12 Nigeria 12 0 0 0 0 0 12 Estonia 7 0 0 0 0 4 11 Trinidad and Tobago 6 0 0 0 0 5 11 Uganda 8 0 0 0 0 3 11 Syria 10 0 0 0 0 0 10 Tonga 9 0 0 0 0 0 9 Algeria 9 0 0 0 0 0 9 Jordan 9 0 0 0 0 0 9 Ecuador 3 0 0 0 0 5 8 Uzbekistan 7 0 0 0 0 0 7 New Caledonia 6 0 0 0 0 0 6 Yemen 0 6 0 0 0 0 6 Namibia 6 0 0 0 0 0 6 Cook Islands 5 0 0 0 0 0 5

Appendix to 2013 Multicultural Community Demographic Profile
Country of birth Broadband connection
Dial-up connection
Other connection
No Internet connection
Not stated
Not applicable Total
Montenegro 0 5 0 0 0 0 5 Qatar 5 0 0 0 0 0 5 Maldives 5 0 0 0 0 0 5 Bermuda 0 0 0 0 0 5 5 Seychelles 0 0 0 5 0 0 5 Isle of Man 0 0 0 0 0 4 4 Gibraltar 4 0 0 0 0 0 4 Moldova 4 0 0 0 0 0 4 Bahamas 4 0 0 0 0 0 4 Dominican Republic 4 0 0 0 0 0 4 Djibouti 4 0 0 0 0 0 4 Kiribati 3 0 0 0 0 0 3 Iceland 0 0 0 0 0 3 3 Gaza Strip and West Bank 3 0 0 0 0 0 3 Jamaica 3 0 0 0 0 0 3 Inadequately described 33 5 5 4 5 9 61 Not stated 665 35 44 207 8,787 5,669 15,407 Overseas visitor 2,652 94 290 218 535 6,015 9,804 Total 66,963 1,782 4,834 6,032 11,335 28,932 119,878
Table 17 – Motor vehicle ownership
Country of birth 1 motor vehicle
2 motor vehicles
3 motor vehicles
4 or more motor
vehicles
No motor vehicles
Not stated
Not applic-able
Total
Australia 16,271 9,544 1,830 577 6,519 864 11,616 47,221 China (excludes SARs and Taiwan) 2,239 473 49 10 4,208 239 445 7,663 Malaysia 1,593 415 56 20 2,604 90 435 5,213 England 1,164 463 78 25 777 55 948 3,510 India 656 135 27 16 1,959 36 233 3,062

Appendix to 2013 Multicultural Community Demographic Profile
Country of birth 1 motor vehicle
2 motor vehicles
3 motor vehicles
4 or more motor
vehicles
No motor vehicles
Not stated
Not applic-able
Total
Indonesia 824 162 25 6 1,678 69 130 2,894 New Zealand 1,005 305 53 13 910 47 448 2,781 Singapore 534 114 27 0 950 29 218 1,872 Hong Kong (SAR of China) 484 130 20 0 706 24 190 1,554 Korea, Republic of (South) 361 52 6 0 887 62 102 1,470 Vietnam 459 213 49 11 440 38 112 1,322 United States of America 330 122 23 0 285 14 171 945 Thailand 217 50 15 0 499 40 47 868 Italy 229 125 31 8 174 20 181 768 Japan 262 42 0 0 256 17 79 656 Taiwan 193 53 0 0 315 6 78 645 Ireland 230 60 13 0 207 16 95 621 Philippines 204 48 0 0 237 6 74 569 Germany 196 82 16 5 121 6 96 522 Scotland 180 70 6 0 105 6 140 507 Somalia 243 83 4 0 104 58 8 500 South Africa 173 62 16 0 105 9 135 500 Sri Lanka 154 71 5 0 154 12 87 483 Saudi Arabia 128 21 0 0 289 8 8 454 Canada 128 53 6 0 171 8 72 438 Iran 143 28 0 0 149 6 25 351 France 119 38 0 0 141 8 42 348 Ethiopia 117 40 0 0 62 36 13 268 Mauritius 73 16 4 5 130 0 29 257 Colombia 87 19 8 0 116 11 9 250 Netherlands 85 26 5 0 48 4 78 246 Greece 54 38 6 3 45 16 63 225 Turkey 72 32 7 0 68 6 24 209 Eritrea 86 40 9 0 55 12 0 202 Poland 93 28 0 0 50 0 28 199

Appendix to 2013 Multicultural Community Demographic Profile
Country of birth 1 motor vehicle
2 motor vehicles
3 motor vehicles
4 or more motor
vehicles
No motor vehicles
Not stated
Not applic-able
Total
Egypt 77 36 0 5 47 0 31 196 Brazil 59 18 3 0 82 0 25 187 Russian Federation 64 25 0 0 55 4 20 168 Chile 58 11 0 0 66 13 10 158 Sudan 64 16 5 0 36 13 12 146 Croatia 50 19 6 0 41 0 25 141 Malta 41 14 0 6 30 11 34 136 Fiji 39 13 0 0 36 0 40 128 United Arab Emirates 33 10 0 0 64 0 9 116 Brunei Darussalam 33 6 0 0 67 0 10 116 Kenya 33 20 0 0 26 20 15 114 Wales 35 18 0 0 28 0 28 109 Pakistan 27 12 0 0 43 0 25 107 Mexico 22 8 0 3 58 6 6 103 Zimbabwe 29 17 0 0 19 0 34 99 Serbia 33 23 7 0 28 0 7 98 Lebanon 29 24 0 0 16 5 19 93 Papua New Guinea 36 8 0 0 24 4 20 92 Spain 41 7 0 0 31 0 13 92 Sweden 39 0 0 0 38 0 14 91 Northern Ireland 25 11 0 0 24 5 24 89 Switzerland 30 19 0 0 21 0 17 87 Romania 36 12 0 0 25 0 14 87 Kuwait 10 0 0 0 69 0 7 86 Bosnia and Herzegovina 24 18 4 6 23 4 6 85 Macau (SAR of China) 20 5 0 0 58 0 0 83 Former Yugoslav Republic of Macedonia (FYROM) 38 24 0 0 8 0 12 82
El Salvador 23 14 5 0 36 0 0 78 Austria 33 7 0 0 12 3 21 76

Appendix to 2013 Multicultural Community Demographic Profile
Country of birth 1 motor vehicle
2 motor vehicles
3 motor vehicles
4 or more motor
vehicles
No motor vehicles
Not stated
Not applic-able
Total
Ukraine 34 14 0 0 19 0 9 76 Nepal 7 0 0 0 49 5 13 74 Bangladesh 29 0 0 0 25 0 19 73 South Eastern Europe, nfd 23 9 0 0 22 0 16 70 Hungary 23 11 3 0 23 0 9 69 Argentina 27 6 5 0 13 0 16 67 Israel 29 11 0 0 16 0 9 65 Cambodia 21 11 0 0 23 0 8 63 Burma (Republic of the Union of Myanmar) 26 6 0 0 19 0 11 62 Timor-Leste 19 6 9 8 10 0 7 59 Peru 22 8 0 0 21 0 8 59 Norway 11 7 0 0 32 0 6 56 Denmark 7 7 0 6 11 0 19 50 Iraq 23 4 0 0 11 4 8 50 Venezuela, Bolivarian Republic of 20 0 0 0 29 0 0 49 Belgium 19 0 0 0 10 0 12 41 Cyprus 12 4 0 0 7 0 16 39 Portugal 12 0 0 0 13 0 11 36 Zambia 18 0 0 0 10 0 8 36 Oman 8 0 0 0 26 0 0 34 Laos 10 0 0 0 16 0 7 33 Finland 16 0 0 0 12 0 4 32 Czech Republic 15 8 4 0 5 0 0 32 Slovenia 12 6 0 0 11 0 0 29 Afghanistan 14 0 0 0 5 0 8 27 Bulgaria 19 0 0 0 0 0 4 23 Uruguay 18 0 0 0 5 0 0 23 Samoa 9 5 0 0 0 0 5 19 Latvia 3 6 0 0 10 0 0 19 Slovakia 13 0 0 0 6 0 0 19

Appendix to 2013 Multicultural Community Demographic Profile
Country of birth 1 motor vehicle
2 motor vehicles
3 motor vehicles
4 or more motor
vehicles
No motor vehicles
Not stated
Not applic-able
Total
Tanzania 3 0 0 3 10 0 3 19 Lithuania 7 0 0 0 11 0 0 18 Bahrain 0 0 0 0 13 0 5 18 Kazakhstan 11 0 0 0 7 0 0 18 Ghana 3 4 0 0 7 0 4 18 Morocco 3 0 0 0 8 3 3 17 Syria 4 7 0 0 5 0 0 16 Solomon Islands 0 5 0 0 5 0 5 15 Eastern Europe, nfd 7 3 0 0 0 0 4 14 Mongolia 4 0 0 0 9 0 0 13 Libya 9 0 0 0 3 0 0 12 Nigeria 8 0 0 0 4 0 0 12 Trinidad and Tobago 4 0 0 0 4 0 3 11 Iceland 5 0 0 0 5 0 0 10 Algeria 5 5 0 0 0 0 0 10 United Kingdom, Channel Islands and Isle of Man, nfd 6 0 0 0 0 3 0 9
Estonia 0 0 0 0 5 0 4 9 Jordan 0 0 0 0 9 0 0 9 Uzbekistan 0 0 3 0 6 0 0 9 Uganda 0 0 0 0 3 0 6 9 Tonga 8 0 0 0 0 0 0 8 New Caledonia 0 0 0 0 6 0 0 6 Kosovo 3 3 0 0 0 0 0 6 Yemen 6 0 0 0 0 0 0 6 Bermuda 0 0 0 0 0 0 6 6 Cook Islands 5 0 0 0 0 0 0 5 Gibraltar 0 0 0 0 5 0 0 5 Montenegro 5 0 0 0 0 0 0 5 Maldives 0 0 0 0 5 0 0 5

Appendix to 2013 Multicultural Community Demographic Profile
Country of birth 1 motor vehicle
2 motor vehicles
3 motor vehicles
4 or more motor
vehicles
No motor vehicles
Not stated
Not applic-able
Total
Ecuador 0 0 0 0 0 0 5 5 Burundi 0 0 0 0 5 0 0 5 Djibouti 5 0 0 0 0 0 0 5 Namibia 5 0 0 0 0 0 0 5 Seychelles 0 5 0 0 0 0 0 5 Kiribati 4 0 0 0 0 0 0 4 Isle of Man 0 0 0 0 0 0 4 4 Moldova 4 0 0 0 0 0 0 4 Gaza Strip and West Bank 4 0 0 0 0 0 0 4 Qatar 4 0 0 0 0 0 0 4 Guyana 4 0 0 0 0 0 0 4 Caribbean, nfd 0 0 0 0 4 0 0 4 Bahamas 0 0 0 0 4 0 0 4 Dominican Republic 0 0 0 0 4 0 0 4 Nauru 0 3 0 0 0 0 0 3 Jersey 3 0 0 0 0 0 0 3 Jamaica 3 0 0 0 0 0 0 3 Inadequately described 18 13 0 0 13 9 7 60 Not stated 382 162 33 21 340 8,804 5,666 15,408 Overseas visitor 720 145 22 0 2,353 549 6,013 9,802 Total 32,248 14,152 2,503 757 29,947 11,343 28,928 119,878

Appendix to 2013 Multicultural Community Demographic Profile
Table 18 – Educational institution attendance
Countries of birth Pre-school
Infants/ Primary
Second-ary
Tech-nical or Further Educa-tional Instit-ution*
Uni-versity
or other Tertiary Institu-
tion
Other Not stated
Not applic-able
Total
Australia 400 1,500 1,312 723 6,165 380 905 27,091 38,476 China (excludes SARs and Taiwan) 9 50 244 365 3,669 221 152 2,795 7,505 Malaysia 3 22 80 176 2,418 71 47 2,291 5,108 India 40 55 13 22 231 26 32 2,539 2,958 Indonesia 0 6 33 205 1,428 44 44 1,097 2,857 England 7 23 9 30 305 22 39 2,328 2,763 New Zealand 4 14 29 51 237 35 37 2,081 2,488 Singapore 4 9 35 43 1,054 39 21 633 1,838 Hong Kong (SAR of China) 0 0 24 47 625 32 20 739 1,487 Korea, Republic of (South) 0 6 31 178 360 100 38 719 1,432 Vietnam 3 15 35 82 216 42 54 831 1,278 Thailand 4 0 18 117 315 68 9 321 852 United States of America 10 17 32 9 210 5 7 545 835 Italy 0 0 4 12 37 7 15 608 683 Japan 5 5 7 41 100 17 4 449 628 Taiwan 0 0 17 24 232 17 5 328 623 Ireland 5 5 0 4 22 8 9 517 570 Philippines 3 7 6 19 62 14 3 420 534 Somalia 0 19 32 51 40 31 40 280 493 Germany 0 3 4 0 70 6 13 375 471 Saudi Arabia 6 23 10 27 260 30 15 77 448 Sri Lanka 0 0 0 12 146 9 5 276 448 Scotland 0 0 0 4 34 0 12 356 406 Canada 0 0 4 10 92 0 0 289 395 South Africa 0 0 8 11 70 11 6 288 394

Appendix to 2013 Multicultural Community Demographic Profile
Countries of birth Pre-school
Infants/ Primary
Second-ary
Tech-nical or Further Educa-tional Instit-ution*
Uni-versity
or other Tertiary Institu-
tion
Other Not stated
Not applic-able
Total
Iran 0 0 0 13 129 14 5 186 347 France 0 0 3 13 61 3 7 258 345 Ethiopia 0 10 33 22 12 17 36 129 259 Colombia 0 0 0 28 58 21 6 137 250 Mauritius 0 0 0 16 94 0 0 131 241 Eritrea 0 4 6 31 14 14 11 123 203 Turkey 0 0 0 9 21 3 8 154 195 Poland 0 0 0 6 14 0 7 166 193 Netherlands 0 0 0 6 22 0 5 156 189 Greece 0 0 0 0 5 0 9 175 189 Brazil 0 0 0 26 31 12 8 104 181 Egypt 0 5 6 0 20 4 11 129 175 Chile 0 6 4 9 31 6 0 99 155 Russian Federation 0 5 3 6 38 0 0 102 154 Sudan 0 5 15 14 17 15 19 60 145 Croatia 0 0 0 5 11 0 7 103 126 United Arab Emirates 0 0 6 11 77 0 4 19 117 Brunei Darussalam 0 0 0 6 66 0 0 44 116 Malta 0 0 0 0 0 0 10 104 114 Kenya 0 18 17 4 13 3 11 38 104 Fiji 0 3 0 0 10 4 3 81 101 Pakistan 0 0 4 3 31 0 0 60 98 Serbia 0 0 4 0 10 0 0 78 92 Mexico 0 0 0 0 43 0 0 48 91 Wales 0 0 0 0 9 0 0 79 88 Spain 0 0 0 0 8 4 4 72 88 Kuwait 0 0 0 8 54 7 0 18 87

Appendix to 2013 Multicultural Community Demographic Profile
Countries of birth Pre-school
Infants/ Primary
Second-ary
Tech-nical or Further Educa-tional Instit-ution*
Uni-versity
or other Tertiary Institu-
tion
Other Not stated
Not applic-able
Total
Sweden 0 0 0 0 25 0 0 59 84 Macau (SAR of China) 0 0 0 0 51 7 0 24 82 El Salvador 0 0 0 4 3 3 0 68 78 Papua New Guinea 0 0 0 4 12 0 0 60 76 Bosnia and Herzegovina 0 0 0 0 11 0 0 63 74 Northern Ireland 0 0 0 0 4 0 0 69 73 Switzerland 0 0 0 3 15 0 0 55 73 Romania 0 0 0 0 5 0 4 64 73 Former Yugoslav Republic of Macedonia (FYROM) 0 6 0 4 6 0 3 53 72
Lebanon 0 0 0 3 3 0 6 60 72 Nepal 0 0 0 6 11 13 3 37 70 Bangladesh 0 0 0 0 20 5 0 44 69 Zimbabwe 0 0 0 0 15 0 0 52 67 Ukraine 0 0 0 0 16 4 0 45 65 Austria 0 0 0 0 7 0 0 57 64 Hungary 0 0 0 0 0 0 4 59 63 Cambodia 0 0 0 0 20 0 7 35 62 Argentina 0 0 0 5 4 0 0 50 59 Peru 0 0 0 4 12 3 0 39 58 South Eastern Europe, nfd 0 0 0 0 0 0 4 53 57 Israel 0 4 0 0 12 0 0 40 56 Burma (Republic of the Union of Myanmar) 0 0 0 0 21 4 0 31 56
Norway 0 0 0 0 38 0 0 16 54 Timor-Leste 0 0 0 0 7 3 0 44 54 Iraq 0 0 0 3 12 3 0 29 47 Venezuela, Bolivarian Republic of 0 0 0 3 20 4 0 20 47

Appendix to 2013 Multicultural Community Demographic Profile
Countries of birth Pre-school
Infants/ Primary
Second-ary
Tech-nical or Further Educa-tional Instit-ution*
Uni-versity
or other Tertiary Institu-
tion
Other Not stated
Not applic-able
Total
Belgium 0 0 0 0 4 0 0 34 38 Oman 3 0 0 5 20 0 0 9 37 Czech Republic 0 0 0 0 3 0 0 32 35 Zambia 0 0 0 0 7 0 0 28 35 Denmark 0 0 0 0 10 0 0 24 34 Portugal 0 0 0 0 6 4 0 24 34 Finland 0 0 0 0 10 0 0 19 29 Laos 0 0 0 0 6 0 0 22 28 Bulgaria 0 0 0 0 8 0 0 19 27 Cyprus 0 0 0 0 0 0 0 26 26 Slovenia 0 0 0 0 0 0 0 24 24 Slovakia 0 0 0 0 5 0 0 17 22 Bahrain 0 0 0 0 13 0 0 8 21 Afghanistan 0 0 0 6 7 0 0 8 21 Latvia 0 0 0 0 0 0 0 19 19 Uruguay 0 0 0 0 0 0 0 18 18 Nigeria 0 0 0 0 5 0 0 13 18 Kazakhstan 0 0 0 0 6 0 0 11 17 Ghana 0 0 0 0 3 0 0 14 17 Eastern Europe, nfd 0 0 0 0 0 0 0 16 16 Syria 0 0 0 0 0 0 0 16 16 Mongolia 0 0 0 0 10 0 0 6 16 Samoa 0 0 0 0 0 0 0 15 15 Lithuania 0 0 0 0 0 0 0 15 15 Tanzania 0 0 0 0 5 0 0 10 15 Libya 0 0 0 0 3 0 0 11 14 Morocco 0 0 0 0 0 0 0 13 13

Appendix to 2013 Multicultural Community Demographic Profile
Countries of birth Pre-school
Infants/ Primary
Second-ary
Tech-nical or Further Educa-tional Instit-ution*
Uni-versity
or other Tertiary Institu-
tion
Other Not stated
Not applic-able
Total
Jordan 0 0 0 0 4 0 0 9 13 Uganda 0 0 0 3 0 0 0 9 12 Estonia 0 0 0 0 0 0 0 11 11 Ecuador 0 0 0 0 0 0 0 10 10 Solomon Islands 0 0 0 0 3 0 0 6 9 Tonga 0 0 0 0 0 0 0 9 9 Trinidad and Tobago 0 0 0 0 0 0 0 9 9 Seychelles 0 0 0 0 0 0 0 9 9 Cook Islands 0 0 0 0 0 0 0 8 8 Algeria 0 0 0 0 0 0 0 8 8 Uzbekistan 0 0 0 0 0 0 0 8 8 United Kingdom, Channel Islands and Isle of Man, nfd 0 0 0 0 0 0 0 7 7
Yemen 0 0 0 0 0 0 0 7 7 Jamaica 0 0 0 0 0 0 0 7 7 Namibia 0 0 0 0 3 0 4 0 7 New Caledonia 0 0 0 0 6 0 0 0 6 Montenegro 0 0 0 0 0 0 0 6 6 Iceland 0 0 0 0 0 0 0 5 5 Gaza Strip and West Bank 0 0 0 0 0 0 0 5 5 Maldives 0 0 0 0 5 0 0 0 5 Isle of Man 0 0 0 0 0 0 0 4 4 Albania 0 0 0 0 0 0 0 4 4 Moldova 0 0 0 0 0 0 0 4 4 Qatar 0 0 0 0 0 0 0 4 4 Congo, Democratic Republic of 0 0 0 0 0 0 0 4 4 Djibouti 0 0 0 0 0 4 0 0 4
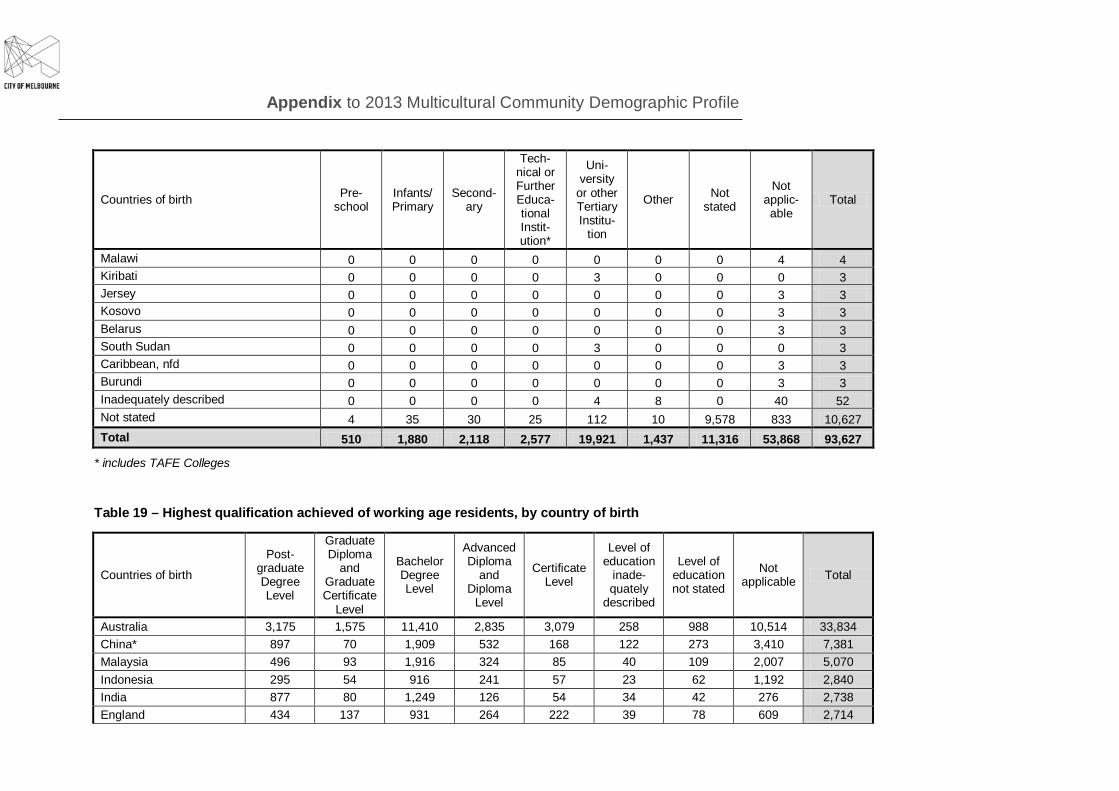
Appendix to 2013 Multicultural Community Demographic Profile
Countries of birth Pre-school
Infants/ Primary
Second-ary
Tech-nical or Further Educa-tional Instit-ution*
Uni-versity
or other Tertiary Institu-
tion
Other Not stated
Not applic-able
Total
Malawi 0 0 0 0 0 0 0 4 4 Kiribati 0 0 0 0 3 0 0 0 3 Jersey 0 0 0 0 0 0 0 3 3 Kosovo 0 0 0 0 0 0 0 3 3 Belarus 0 0 0 0 0 0 0 3 3 South Sudan 0 0 0 0 3 0 0 0 3 Caribbean, nfd 0 0 0 0 0 0 0 3 3 Burundi 0 0 0 0 0 0 0 3 3 Inadequately described 0 0 0 0 4 8 0 40 52 Not stated 4 35 30 25 112 10 9,578 833 10,627 Total 510 1,880 2,118 2,577 19,921 1,437 11,316 53,868 93,627
* includes TAFE Colleges
Table 19 – Highest qualification achieved of working age residents, by country of birth
Countries of birth
Post-graduate Degree Level
Graduate Diploma
and Graduate Certificate
Level
Bachelor Degree Level
Advanced Diploma
and Diploma
Level
Certificate Level
Level of education
inade-quately
described
Level of education not stated
Not applicable Total
Australia 3,175 1,575 11,410 2,835 3,079 258 988 10,514 33,834 China* 897 70 1,909 532 168 122 273 3,410 7,381 Malaysia 496 93 1,916 324 85 40 109 2,007 5,070 Indonesia 295 54 916 241 57 23 62 1,192 2,840 India 877 80 1,249 126 54 34 42 276 2,738 England 434 137 931 264 222 39 78 609 2,714

Appendix to 2013 Multicultural Community Demographic Profile
Countries of birth
Post-graduate Degree Level
Graduate Diploma
and Graduate Certificate
Level
Bachelor Degree Level
Advanced Diploma
and Diploma
Level
Certificate Level
Level of education
inade-quately
described
Level of education not stated
Not applicable Total
New Zealand 224 96 862 227 276 44 36 683 2,448 Singapore 189 42 579 220 18 12 45 707 1,812 Hong Kong (SAR of China) 156 29 489 97 42 22 35 607 1,477
Korea, Republic of (South) 84 18 321 203 68 29 62 631 1,416
Vietnam 75 23 248 90 76 5 79 653 1,249 Thailand 155 16 330 45 36 16 25 218 841 United States of America 201 26 299 31 18 9 17 182 783 Italy 49 8 81 55 78 9 52 350 682 Taiwan 113 12 220 35 11 8 14 212 625 Japan 71 20 238 62 30 0 15 176 612 Ireland 67 21 249 44 75 6 14 85 561 Philippines 46 0 298 30 42 0 10 93 519 Germany 131 11 112 45 50 0 28 90 467 Somalia 12 0 38 48 58 9 44 246 455 Sri Lanka 62 19 186 37 12 8 0 119 443 Scotland 65 9 122 42 40 6 21 99 404 Saudi Arabia 37 5 111 45 6 0 26 169 399 South Africa 62 24 145 49 23 12 0 81 396 Canada 74 12 181 26 18 0 10 68 389 Iran 132 6 114 26 4 0 9 51 342 France 123 7 78 26 25 0 16 65 340 Colombia 53 9 124 16 10 5 11 25 253 Mauritius 17 14 74 41 9 0 4 88 247 Ethiopia 0 0 13 9 53 0 34 129 238 Turkey 14 10 36 11 23 0 19 85 198 Poland 44 0 52 24 21 0 10 46 197 Greece 7 5 28 6 17 0 16 112 191

Appendix to 2013 Multicultural Community Demographic Profile
Countries of birth
Post-graduate Degree Level
Graduate Diploma
and Graduate Certificate
Level
Bachelor Degree Level
Advanced Diploma
and Diploma
Level
Certificate Level
Level of education
inade-quately
described
Level of education not stated
Not applicable Total
Eritrea 4 0 21 14 27 0 19 106 191 Netherlands 41 0 54 27 16 0 6 41 185 Brazil 33 11 71 18 3 3 10 31 180 Egypt 13 0 52 10 9 8 16 57 165 Russian Federation 40 0 56 16 9 0 0 31 152 Chile 16 4 31 16 24 7 12 36 146 Sudan 5 0 14 13 18 0 24 60 134 Croatia 8 0 25 10 19 0 18 46 126 Malta 5 0 7 3 15 0 25 62 117 Brunei Darussalam 14 0 50 5 0 6 0 41 116 United Arab Emirates 10 0 18 9 0 0 0 77 114 Fiji 5 7 37 16 6 0 0 29 100 Mexico 24 0 41 7 0 5 0 18 95 Pakistan 37 0 34 0 0 0 0 23 94 Serbia 14 0 37 0 5 0 0 34 90 Wales 30 7 36 7 0 0 0 8 88 Sweden 14 5 19 10 0 0 0 38 86 Macau (SAR of China) 0 0 21 0 0 0 0 64 85 Spain 28 6 22 0 7 0 0 20 83 Kuwait 9 0 9 0 0 0 4 57 79 Papua New Guinea 0 0 44 0 7 0 7 19 77 El Salvador 5 0 15 3 6 0 11 36 76 Kenya 13 0 17 6 0 0 6 33 75 Bosnia and Herzegovina 6 9 26 15 0 0 7 11 74 Northern Ireland 3 0 30 10 14 0 6 10 73 Romania 14 0 27 6 5 0 0 19 71 Lebanon 0 0 19 6 0 0 0 46 71 Zimbabwe 15 0 26 13 4 0 5 8 71

Appendix to 2013 Multicultural Community Demographic Profile
Countries of birth
Post-graduate Degree Level
Graduate Diploma
and Graduate Certificate
Level
Bachelor Degree Level
Advanced Diploma
and Diploma
Level
Certificate Level
Level of education
inade-quately
described
Level of education not stated
Not applicable Total
Switzerland 19 0 22 5 11 0 0 12 69 Former Yugoslav Republic of Macedonia (FYROM)
6 7 30 6 0 0 5 14 68
Bangladesh 19 0 30 0 0 0 0 18 67 Ukraine 16 0 23 9 6 0 0 12 66 Nepal 9 0 17 22 5 0 4 9 66 Hungary 14 0 15 6 11 0 5 12 63 Austria 27 0 16 9 0 0 3 7 62 Cambodia 0 0 27 0 0 0 6 28 61 Peru 21 0 18 12 0 0 0 10 61 Norway 4 0 14 0 4 0 0 35 57 South Eastern Europe, nfd 7 0 15 5 6 0 9 15 57
Argentina 20 0 16 3 0 0 0 17 56 Timor-Leste 0 0 6 8 4 0 8 27 53 Burma (Republic of the Union of Myanmar) 0 0 21 11 0 0 6 13 51
Israel 16 0 21 0 0 0 0 13 50 Venezuela, Bolivarian Republic of 8 6 30 0 0 0 0 6 50
Iraq 0 0 17 0 0 0 5 19 41 Belgium 13 0 20 0 0 0 0 0 33 Denmark 16 0 11 0 0 0 0 5 32 Czech Republic 0 6 5 5 5 0 0 10 31 Portugal 8 0 0 3 3 0 0 15 29 Laos 5 0 8 0 0 0 0 15 28 Slovenia 0 0 8 0 12 3 0 3 26 Zambia 0 0 23 0 3 0 0 0 26 Bulgaria 6 0 8 10 0 0 0 0 24

Appendix to 2013 Multicultural Community Demographic Profile
Countries of birth
Post-graduate Degree Level
Graduate Diploma
and Graduate Certificate
Level
Bachelor Degree Level
Advanced Diploma
and Diploma
Level
Certificate Level
Level of education
inade-quately
described
Level of education not stated
Not applicable Total
Cyprus 6 0 5 0 0 0 0 13 24 Finland 17 0 6 0 0 0 0 0 23 Oman 0 0 4 4 0 0 0 15 23 Afghanistan 0 0 4 0 0 0 5 13 22 Uruguay 0 0 0 0 0 0 5 16 21 Slovakia 6 0 0 7 0 0 0 7 20 Bahrain 0 0 5 0 0 0 0 15 20 Kazakhstan 0 0 6 6 0 0 0 6 18 Latvia 3 0 9 0 3 0 0 0 15 Syria 0 0 8 0 0 0 0 7 15 Libya 0 0 0 6 0 0 0 8 14 Eastern Europe, nfd 5 0 8 0 0 0 0 0 13 Lithuania 13 0 0 0 0 0 0 0 13 Morocco 0 0 0 0 0 0 0 13 13 Ghana 4 0 3 3 3 0 0 0 13 Nigeria 6 0 6 0 0 0 0 0 12 Tanzania 0 0 3 0 0 0 0 9 12 Samoa 0 0 0 0 0 0 0 11 11 Mongolia 0 0 11 0 0 0 0 0 11 Uganda 0 0 5 0 0 0 0 5 10 Algeria 0 0 4 0 5 0 0 0 9 Jordan 0 0 8 0 0 0 0 0 8 Maldives 0 0 0 5 0 0 0 3 8 Kosovo 0 0 0 0 0 0 0 7 7 Solomon Islands 5 0 0 0 0 0 0 0 5 Cook Islands 0 0 0 0 5 0 0 0 5 Montenegro 0 0 0 0 0 0 0 5 5 Yemen 0 0 0 5 0 0 0 0 5

Appendix to 2013 Multicultural Community Demographic Profile
Countries of birth
Post-graduate Degree Level
Graduate Diploma
and Graduate Certificate
Level
Bachelor Degree Level
Advanced Diploma
and Diploma
Level
Certificate Level
Level of education
inade-quately
described
Level of education not stated
Not applicable Total
Burundi 0 0 0 0 0 0 0 5 5 Seychelles 0 0 0 0 0 0 0 5 5 South Sudan 0 0 0 0 0 0 0 4 4 Georgia 0 0 4 0 0 0 0 0 4 Nicaragua 0 0 0 0 0 0 0 4 4 Caribbean, nfd 0 0 4 0 0 0 0 0 4 Dominican Republic 4 0 0 0 0 0 0 0 4 United Kingdom, Channel Islands and Isle of Man, nfd
0 0 0 0 0 0 0 3 3
Estonia 0 0 0 0 3 0 0 0 3 Uzbekistan 0 0 0 0 0 0 0 3 3 Ecuador 0 0 0 0 0 0 0 3 3 Trinidad and Tobago 0 0 0 0 0 0 0 3 3 Botswana 3 0 0 0 0 0 0 0 3 Inadequately described 8 0 13 6 0 0 14 9 50 Not stated 63 14 178 58 63 17 9,042 272 9,707 Total 9,220 2,533 25,533 6,366 5,150 765 11,497 25,918 86,982

Appendix to 2013 Multicultural Community Demographic Profile
Table 20 – Occupation of working age residents, by country of birth
Countries of birth
Man
ager
s
Prof
essi
onal
s
Tech
nici
ans
and
Trad
es W
orke
rs
Com
mun
ity a
nd
Pers
onal
Ser
vice
W
orke
rs
Cle
rical
and
Ad
min
istra
tive
Wor
kers
Sale
s W
orke
rs
Mac
hine
ry
Ope
rato
rs a
nd
Driv
ers
Labo
urer
s
Inad
equa
tely
de
scrib
ed
Not
sta
ted
Not
app
licab
le
Tota
l
Australia 4,141 10,578 1,407 2,139 3,564 1,941 281 563 444 96 8,685 33,839 China (excludes SARs and Taiwan) 398 725 176 351 310 329 31 155 47 40 4,822 7,384
Malaysia 208 1,162 150 233 285 150 23 77 35 5 2,745 5,073 Indonesia 102 416 117 150 229 188 9 102 10 11 1,508 2,842 India 240 1,230 138 70 174 88 21 48 56 14 663 2,742 England 389 957 122 123 238 102 16 40 41 7 681 2,716 New Zealand 314 785 161 169 329 144 53 73 32 0 392 2,452 Singapore 73 354 28 67 90 57 0 0 13 5 1,126 1,813 Hong Kong (SAR of China) 76 336 29 97 108 40 6 30 9 4 746 1,481
Korea, Republic of (South) 44 119 183 119 39 49 5 76 9 13 762 1,418
Vietnam 60 170 45 72 73 57 34 72 5 10 651 1,249 Thailand 30 72 84 126 35 24 5 46 0 3 421 846 United States of America 93 276 19 32 66 40 0 0 11 5 243 785
Italy 60 96 36 48 32 21 0 10 0 0 380 683 Taiwan 34 130 17 61 40 18 0 9 7 5 304 625 Japan 66 105 45 80 49 16 0 16 9 0 229 615 Ireland 63 215 60 28 71 11 6 22 9 4 73 562 Philippines 41 159 45 47 60 24 0 22 9 0 117 524 Germany 55 160 15 19 35 16 0 6 7 0 157 470 Somalia 5 14 16 73 4 0 46 13 9 4 271 455 Sri Lanka 34 152 21 21 33 18 0 26 6 0 136 447 Scotland 42 143 24 18 56 6 0 8 0 5 106 408 South Africa 59 144 14 24 38 18 0 0 8 0 92 397

Appendix to 2013 Multicultural Community Demographic Profile
Countries of birth
Man
ager
s
Prof
essi
onal
s
Tech
nici
ans
and
Trad
es W
orke
rs
Com
mun
ity a
nd
Pers
onal
Ser
vice
W
orke
rs
Cle
rical
and
Ad
min
istra
tive
Wor
kers
Sale
s W
orke
rs
Mac
hine
ry
Ope
rato
rs a
nd
Driv
ers
Labo
urer
s
Inad
equa
tely
de
scrib
ed
Not
sta
ted
Not
app
licab
le
Tota
l
Saudi Arabia 0 5 0 6 0 0 0 0 0 7 378 396 Canada 37 169 6 32 26 23 0 6 0 0 89 388 Iran 13 108 14 0 21 15 6 11 0 0 154 342 France 41 111 12 40 29 12 0 0 0 0 95 340 Colombia 14 36 12 41 21 10 0 63 0 3 57 257 Mauritius 22 39 17 38 33 11 0 20 0 0 69 249 Ethiopia 0 0 5 26 0 6 14 20 0 4 165 240 Poland 18 62 6 9 19 12 0 0 0 0 70 196 Turkey 20 26 15 4 7 8 0 20 0 0 96 196 Eritrea 0 0 4 30 8 5 12 15 0 0 122 196 Greece 21 34 17 0 6 0 7 9 0 0 99 193 Netherlands 23 59 0 6 26 5 0 0 0 0 68 187 Brazil 14 51 12 21 6 5 0 8 0 0 62 179 Egypt 13 37 0 0 7 0 0 0 0 0 102 159 Russian Federation 7 47 8 10 27 6 0 0 0 0 48 153 Chile 7 29 6 11 11 0 0 5 0 6 71 146 Sudan 0 7 0 6 0 0 9 0 0 7 106 135 Croatia 11 37 0 0 7 0 0 0 0 3 64 122 Brunei Darussalam 0 36 4 0 7 4 0 0 0 0 64 115 Malta 0 18 0 0 7 4 0 0 7 0 78 114 United Arab Emirates 0 15 0 0 0 0 0 0 0 0 96 111 Fiji 15 33 8 0 0 10 0 0 0 3 34 103 Pakistan 10 30 0 0 0 0 0 0 6 0 49 95 Mexico 13 25 0 13 18 0 0 0 0 0 26 95 Serbia 0 34 0 0 12 7 6 0 0 0 31 90 Macau (SAR of China) 0 15 0 0 5 7 0 0 0 0 59 86

Appendix to 2013 Multicultural Community Demographic Profile
Countries of birth
Man
ager
s
Prof
essi
onal
s
Tech
nici
ans
and
Trad
es W
orke
rs
Com
mun
ity a
nd
Pers
onal
Ser
vice
W
orke
rs
Cle
rical
and
Ad
min
istra
tive
Wor
kers
Sale
s W
orke
rs
Mac
hine
ry
Ope
rato
rs a
nd
Driv
ers
Labo
urer
s
Inad
equa
tely
de
scrib
ed
Not
sta
ted
Not
app
licab
le
Tota
l
Wales 21 32 0 0 0 6 0 0 0 0 26 85 Kuwait 0 9 0 0 5 0 0 0 0 0 70 84 Spain 6 36 0 0 0 0 0 0 0 0 40 82 Northern Ireland 15 27 7 5 0 0 3 0 0 0 22 79 Papua New Guinea 9 38 0 0 6 0 0 0 0 0 25 78 Sweden 10 19 0 8 7 5 0 0 0 0 29 78 Bosnia and Herzegovina 0 32 6 0 0 11 0 0 0 0 29 78
El Salvador 0 14 5 12 0 0 0 8 0 5 34 78 Kenya 11 18 0 5 5 0 0 0 0 0 36 75 Lebanon 10 10 0 0 5 0 0 0 0 0 49 74 Romania 20 24 0 0 0 0 0 0 0 0 29 73 Switzerland 5 25 10 8 5 6 0 0 0 0 13 72 Zimbabwe 12 28 0 0 7 12 0 0 0 0 11 70 Former Yugoslav Republic of Macedonia (FYROM)
8 24 0 0 12 0 0 0 0 0 23 67
Nepal 0 7 18 7 5 4 0 16 0 0 10 67 Ukraine 5 33 0 0 0 0 0 0 0 0 26 64 Bangladesh 0 31 0 0 0 0 0 0 0 0 33 64 Austria 0 26 0 0 0 0 0 0 0 0 37 63 Hungary 0 10 0 5 6 7 0 0 0 0 34 62 Peru 0 22 6 0 7 0 0 11 0 0 12 58 Cambodia 0 14 0 0 8 0 0 0 0 0 35 57 Argentina 0 27 0 0 0 0 0 0 0 0 27 54 South Eastern Europe, nfd 6 10 0 0 0 0 0 0 0 0 37 53
Norway 0 10 0 0 0 0 0 0 0 0 41 51

Appendix to 2013 Multicultural Community Demographic Profile
Countries of birth
Man
ager
s
Prof
essi
onal
s
Tech
nici
ans
and
Trad
es W
orke
rs
Com
mun
ity a
nd
Pers
onal
Ser
vice
W
orke
rs
Cle
rical
and
Ad
min
istra
tive
Wor
kers
Sale
s W
orke
rs
Mac
hine
ry
Ope
rato
rs a
nd
Driv
ers
Labo
urer
s
Inad
equa
tely
de
scrib
ed
Not
sta
ted
Not
app
licab
le
Tota
l
Burma (Republic of the Union of Myanmar)
0 19 0 0 0 7 0 0 0 0 25 51
Timor-Leste 0 5 0 0 0 15 0 5 0 0 24 49 Venezuela, Bolivarian Republic of 5 11 5 8 7 0 0 0 0 0 13 49
Israel 0 18 0 0 8 0 0 0 0 0 22 48 Iraq 0 8 0 0 0 0 0 0 0 0 32 40 Belgium 8 16 0 0 0 0 0 0 0 0 8 32 Denmark 11 11 0 0 0 0 0 0 0 0 10 32 Zambia 4 21 0 0 0 0 0 0 0 0 6 31 Czech Republic 0 5 0 0 11 0 0 0 0 0 13 29 Portugal 0 9 0 0 0 0 0 0 0 0 16 25 Laos 0 5 0 0 0 0 0 0 0 0 20 25 Cyprus 0 0 6 0 0 0 0 0 0 0 18 24 Slovenia 0 6 7 0 0 0 0 0 0 0 11 24 Oman 0 0 0 0 0 0 0 0 0 0 23 23 Syria 0 9 0 0 7 0 0 0 0 0 5 21 Bulgaria 0 11 0 0 0 0 0 0 0 0 9 20 Kazakhstan 6 0 0 0 0 0 0 0 0 0 14 20 Bahrain 0 0 0 0 0 0 0 0 0 0 17 17 Uruguay 0 0 0 0 0 0 0 0 0 0 17 17 Finland 0 3 0 0 0 0 0 0 0 0 13 16 Lithuania 0 6 0 0 0 0 0 0 0 0 10 16 Afghanistan 0 0 0 0 0 0 0 0 0 0 16 16 Nigeria 0 10 0 0 0 0 0 0 0 0 6 16 Slovakia 0 3 0 0 0 0 0 0 0 0 12 15 Tanzania 0 0 0 0 6 0 0 0 0 0 8 14

Appendix to 2013 Multicultural Community Demographic Profile
Countries of birth
Man
ager
s
Prof
essi
onal
s
Tech
nici
ans
and
Trad
es W
orke
rs
Com
mun
ity a
nd
Pers
onal
Ser
vice
W
orke
rs
Cle
rical
and
Ad
min
istra
tive
Wor
kers
Sale
s W
orke
rs
Mac
hine
ry
Ope
rato
rs a
nd
Driv
ers
Labo
urer
s
Inad
equa
tely
de
scrib
ed
Not
sta
ted
Not
app
licab
le
Tota
l
Libya 0 0 0 0 0 0 0 0 0 0 13 13 Latvia 0 0 0 0 0 0 0 0 0 0 11 11 Morocco 0 0 0 0 0 3 0 0 0 0 8 11 Mongolia 0 0 0 0 0 0 0 0 0 0 11 11 Ghana 0 5 0 0 0 0 0 0 0 0 6 11 Eastern Europe, nfd 0 0 0 0 0 0 0 0 0 0 8 8 Cook Islands 0 0 0 0 0 0 7 0 0 0 0 7 Kosovo 0 0 0 0 0 0 0 0 0 0 7 7 Estonia 0 0 0 7 0 0 0 0 0 0 0 7 Maldives 0 0 0 0 0 0 0 0 0 0 7 7 Uganda 0 0 0 0 0 0 0 0 0 0 7 7 New Caledonia 0 0 0 0 0 0 0 0 0 0 6 6 Samoa 0 0 0 0 0 0 0 0 0 0 6 6 United Kingdom, Channel Islands and Isle of Man, nfd
0 6 0 0 0 0 0 0 0 0 0 6
Algeria 0 0 0 0 0 0 0 0 0 0 6 6 Jordan 0 0 0 0 0 0 0 0 0 0 6 6 Yemen 0 0 0 0 0 0 0 0 0 0 6 6 Jamaica 0 6 0 0 0 0 0 0 0 0 0 6 Solomon Islands 0 0 0 0 0 0 0 0 0 0 5 5 Moldova 5 0 0 0 0 0 0 0 0 0 0 5 South Sudan 0 0 0 0 0 0 0 0 0 0 5 5 Burundi 0 0 0 0 0 0 0 0 0 0 5 5 Gibraltar 0 0 0 0 0 0 0 0 0 0 4 4 Montenegro 0 0 0 0 0 0 0 0 0 0 4 4 Gaza Strip and West Bank 0 0 0 0 0 0 0 0 0 0 4 4

Appendix to 2013 Multicultural Community Demographic Profile
Countries of birth
Man
ager
s
Prof
essi
onal
s
Tech
nici
ans
and
Trad
es W
orke
rs
Com
mun
ity a
nd
Pers
onal
Ser
vice
W
orke
rs
Cle
rical
and
Ad
min
istra
tive
Wor
kers
Sale
s W
orke
rs
Mac
hine
ry
Ope
rato
rs a
nd
Driv
ers
Labo
urer
s
Inad
equa
tely
de
scrib
ed
Not
sta
ted
Not
app
licab
le
Tota
l
Guyana 0 4 0 0 0 0 0 0 0 0 0 4 Inadequately described 0 13 0 7 0 7 0 0 0 0 23 50
Not stated 59 119 29 41 53 36 8 21 15 23 9,305 9,709 Total 7,162 20,416 3,197 4,573 6,431 3,626 608 1,652 804 292 38,221 86,982
Table 21 – Professional occupation for working age residents, by country of birth
Countries of birth
Profes-sionals
(not further
defined)
Arts & Media
Business, Human
Resource &
Marketing
Design, Engineering, Science & Transport
Education Health ICT Legal,
Social & Welfare
Total
Australia 312 734 3063 1611 1284 1456 919 1215 10594 India 40 3 184 46 13 90 845 24 1245 Malaysia 57 23 377 234 61 252 121 51 1176 England 35 57 265 162 114 142 127 70 972 New Zealand 28 41 225 130 46 146 116 66 798 China (excludes SARs and Taiwan) 34 14 274 102 93 83 96 45 741
Indonesia 24 8 138 89 30 37 103 0 429 Singapore 14 12 100 53 40 78 35 35 367 Hong Kong (SAR of China) 11 6 101 67 26 75 44 21 351
United States of America 23 10 77 48 47 23 33 27 288
Ireland 6 0 52 57 21 59 18 16 229 Vietnam 0 0 62 20 14 32 39 16 183

Appendix to 2013 Multicultural Community Demographic Profile
Countries of birth
Profes-sionals
(not further
defined)
Arts & Media
Business, Human
Resource &
Marketing
Design, Engineering, Science & Transport
Education Health ICT Legal,
Social & Welfare
Total
Canada 10 8 39 29 44 19 24 7 180 Germany 6 0 30 46 26 24 19 22 173 Philippines 0 0 35 20 5 45 67 0 172 Sri Lanka 5 0 55 17 15 49 18 8 167 South Africa 0 0 39 30 21 23 25 18 156 Scotland 5 8 38 16 27 29 12 20 155 Taiwan 0 0 22 33 11 45 24 6 141 Korea, Republic of (South) 3 0 25 27 25 35 12 4 131
France 13 0 25 34 24 4 15 9 124 Iran 8 0 8 26 13 28 25 10 118 Japan 0 8 33 29 30 7 8 0 115 Italy 0 9 22 22 21 8 9 18 109 Thailand 0 0 29 14 13 16 12 0 84 Poland 0 0 15 23 5 10 9 3 65 Netherlands 0 0 30 6 0 0 9 10 55 Brazil 0 0 0 19 0 0 31 0 50 Mauritius 0 0 20 12 0 3 7 0 42 Colombia 6 0 7 16 5 0 5 0 39 Russian Federation 0 0 19 3 0 0 15 0 37 Brunei Darussalam 0 0 13 7 0 8 8 0 36 Bosnia and Herzegovina 0 0 7 20 0 0 0 6 33
Greece 0 3 13 0 8 0 0 8 32 Serbia 0 0 6 5 0 7 6 6 30 Papua New Guinea 0 0 9 20 0 0 0 0 29 Switzerland 0 0 10 0 14 0 5 0 29 Croatia 0 0 12 8 8 0 0 0 28 Turkey 0 0 8 0 7 0 13 0 28
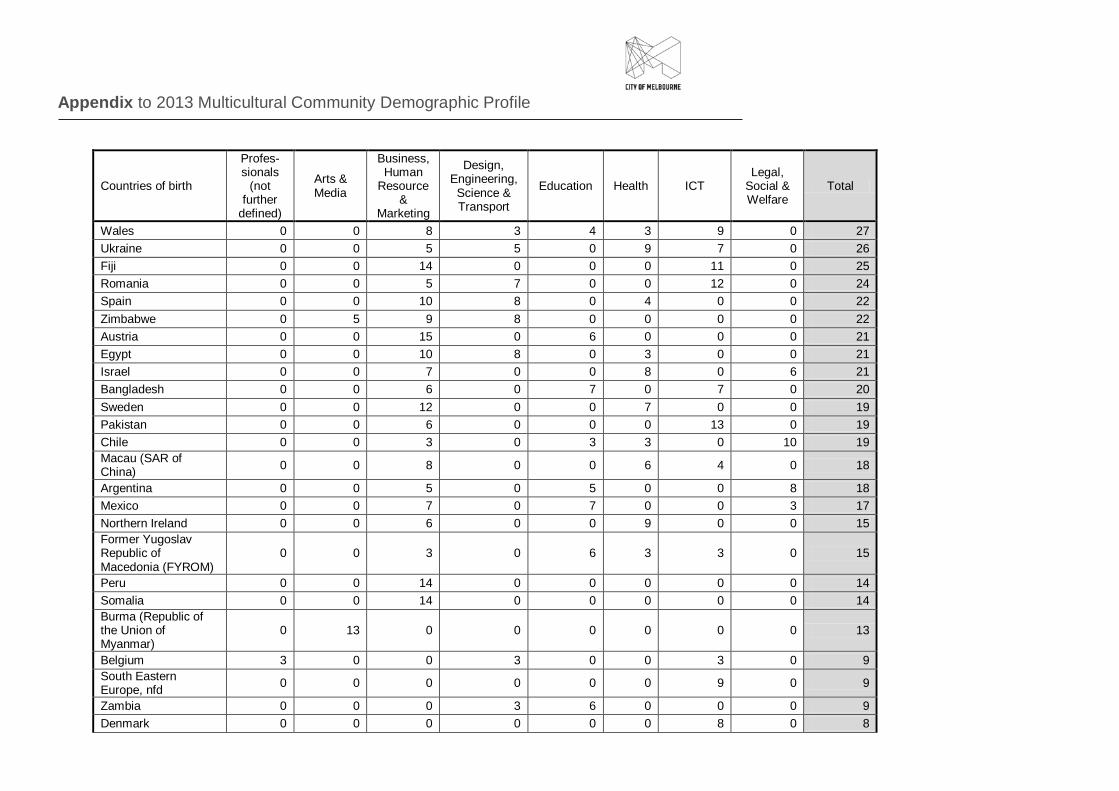
Appendix to 2013 Multicultural Community Demographic Profile
Countries of birth
Profes-sionals
(not further
defined)
Arts & Media
Business, Human
Resource &
Marketing
Design, Engineering, Science & Transport
Education Health ICT Legal,
Social & Welfare
Total
Wales 0 0 8 3 4 3 9 0 27 Ukraine 0 0 5 5 0 9 7 0 26 Fiji 0 0 14 0 0 0 11 0 25 Romania 0 0 5 7 0 0 12 0 24 Spain 0 0 10 8 0 4 0 0 22 Zimbabwe 0 5 9 8 0 0 0 0 22 Austria 0 0 15 0 6 0 0 0 21 Egypt 0 0 10 8 0 3 0 0 21 Israel 0 0 7 0 0 8 0 6 21 Bangladesh 0 0 6 0 7 0 7 0 20 Sweden 0 0 12 0 0 7 0 0 19 Pakistan 0 0 6 0 0 0 13 0 19 Chile 0 0 3 0 3 3 0 10 19 Macau (SAR of China) 0 0 8 0 0 6 4 0 18
Argentina 0 0 5 0 5 0 0 8 18 Mexico 0 0 7 0 7 0 0 3 17 Northern Ireland 0 0 6 0 0 9 0 0 15 Former Yugoslav Republic of Macedonia (FYROM)
0 0 3 0 6 3 3 0 15
Peru 0 0 14 0 0 0 0 0 14 Somalia 0 0 14 0 0 0 0 0 14 Burma (Republic of the Union of Myanmar)
0 13 0 0 0 0 0 0 13
Belgium 3 0 0 3 0 0 3 0 9 South Eastern Europe, nfd 0 0 0 0 0 0 9 0 9
Zambia 0 0 0 3 6 0 0 0 9 Denmark 0 0 0 0 0 0 8 0 8

Appendix to 2013 Multicultural Community Demographic Profile
Countries of birth
Profes-sionals
(not further
defined)
Arts & Media
Business, Human
Resource &
Marketing
Design, Engineering, Science & Transport
Education Health ICT Legal,
Social & Welfare
Total
Bulgaria 0 0 8 0 0 0 0 0 8 Hungary 0 0 0 0 0 8 0 0 8 Kuwait 0 0 0 0 0 8 0 0 8 Iraq 0 0 0 7 0 0 0 0 7 Syria 0 0 0 7 0 0 0 0 7 El Salvador 0 0 7 0 0 0 0 0 7 Nigeria 0 0 0 0 0 7 0 0 7 Kenya 0 0 7 0 0 0 0 0 7 Malta 0 0 3 3 0 0 0 0 6 Sudan 0 0 0 0 6 0 0 0 6 Cambodia 0 3 3 0 0 0 0 0 6 Norway 0 0 4 0 0 0 0 0 4 United Arab Emirates 0 0 0 3 0 0 0 0 3 Venezuela, Bolivarian Republic of 3 0 0 0 0 0 0 0 3
Dominican Republic 0 0 0 0 0 0 3 0 3 Jamaica 0 0 0 0 3 0 0 0 3 Inadequately described 0 0 3 0 3 0 0 0 6
Not stated 6 11 34 13 17 28 14 9 132 Total 652 976 5723 3179 2184 2939 2977 1777 20407
Table 22 – Personal income for working age residents, by country of birth
Countries of birth Nega-
tive income
Nil income
$1-$199
$200-$299
$300-$399
$400-$599
$600-$799
$800-$999
$1,000-
$1,249
$1,250-
$1,499
$1,500-
$1,999
$2,000 or
more
Not stated Total

Appendix to 2013 Multicultural Community Demographic Profile
Countries of birth Nega-
tive income
Nil income
$1-$199
$200-$299
$300-$399
$400-$599
$600-$799
$800-$999
$1,000-
$1,249
$1,250-
$1,499
$1,500-
$1,999
$2,000 or
more
Not stated Total
Australia 140 1901 2130 2317 1913 2696 2701 2848 3817 3184 3813 5508 871 33839 China (excludes SARs and Taiwan)
271 3174 631 553 429 533 474 408 303 180 165 113 149 7383
Malaysia 71 1625 428 328 288 362 338 380 372 263 314 249 56 5074 Indonesia 50 926 264 176 175 282 275 232 187 106 87 49 34 2843 India 0 499 66 43 65 130 174 169 323 454 486 298 34 2741 England 8 161 123 103 135 159 224 207 319 250 352 632 46 2719 New Zealand 11 147 82 76 62 143 252 354 379 246 295 376 29 2452 Singapore 24 738 149 98 65 130 99 102 137 81 96 86 11 1816 Hong Kong (SAR of China) 24 491 131 78 65 90 115 89 100 104 90 92 12 1481
Korea, Republic of (South) 71 500 85 113 95 135 134 104 71 41 34 11 23 1417
Vietnam 12 173 122 233 125 120 84 76 65 51 59 75 58 1253 Thailand 15 222 91 84 88 108 69 55 43 17 27 13 14 846 USA 17 103 50 25 34 55 45 61 86 68 78 159 6 787 Italy 7 50 25 102 113 83 52 54 54 27 39 36 42 684 Taiwan 15 188 70 28 26 44 49 45 47 44 32 30 12 630 Japan 10 145 43 43 30 55 63 61 45 23 27 62 9 616 Ireland 0 16 10 5 13 30 60 84 94 81 79 86 6 564 Philippines 0 50 26 30 23 40 55 61 63 57 67 52 0 524 Germany 6 41 17 25 31 40 41 38 43 32 63 83 12 472 Somalia 0 30 84 112 53 49 42 20 13 6 0 4 43 456 Sri Lanka 0 73 43 28 14 37 40 20 47 39 48 59 0 448 Scotland 0 23 15 19 20 30 29 29 46 34 43 103 17 408 Saudi Arabia 14 34 5 15 22 28 151 59 31 11 6 7 20 403 South Africa 0 46 25 13 17 18 15 40 39 38 50 93 6 400 Canada 5 35 24 13 14 26 34 26 67 38 49 55 7 393 France 3 52 12 21 15 19 49 26 33 38 34 38 7 347 Iran 4 66 19 24 26 49 18 22 26 27 33 25 8 347

Appendix to 2013 Multicultural Community Demographic Profile
Countries of birth Nega-
tive income
Nil income
$1-$199
$200-$299
$300-$399
$400-$599
$600-$799
$800-$999
$1,000-
$1,249
$1,250-
$1,499
$1,500-
$1,999
$2,000 or
more
Not stated Total
Colombia 0 29 9 12 33 50 38 15 17 14 17 10 12 256 Mauritius 5 47 23 24 16 25 31 29 15 7 15 7 5 249 Ethiopia 0 16 45 66 26 25 20 3 8 0 0 0 35 244 Poland 0 13 5 8 19 10 19 24 27 18 24 34 0 201 Turkey 0 10 11 43 31 25 26 6 12 0 7 17 10 198 Eritrea 0 10 16 71 21 28 18 5 4 0 0 0 22 195 Greece 6 15 0 39 38 12 13 14 12 15 5 18 7 194 Netherlands 0 20 9 11 4 15 15 20 25 21 11 39 0 190 Brazil 0 31 6 9 20 24 6 12 6 22 18 28 0 182 Egypt 0 12 14 25 27 15 6 7 12 13 14 15 8 168 Russian Federation 0 17 15 6 0 13 15 22 24 13 18 10 0 153
Chile 0 8 13 23 32 14 18 7 8 0 0 12 4 139 Sudan 0 20 34 28 9 9 14 5 6 0 0 0 13 138 Croatia 0 0 0 22 24 12 6 0 11 15 10 18 12 130 Malta 0 7 12 28 18 9 15 0 6 0 4 11 10 120 Brunei Darussalam 0 39 20 10 4 4 3 5 14 7 9 0 0 115
United Arab Emirates 0 20 7 0 5 6 42 12 8 7 0 6 0 113
Fiji 0 0 0 9 5 14 12 11 9 14 13 12 0 99 Serbia 0 10 8 3 15 0 6 5 10 6 17 13 0 93 Pakistan 0 35 5 5 9 0 0 0 8 0 0 20 8 90 Sweden 0 14 0 7 5 12 9 14 9 0 13 0 6 89 Wales 0 8 0 0 0 11 6 0 0 15 14 34 0 88 Mexico 5 10 7 10 0 11 21 6 0 12 6 0 0 88 Kuwait 0 10 0 0 3 7 46 7 0 0 4 8 0 85 Macau (SAR of China) 0 45 7 7 0 6 0 5 9 0 6 0 0 85
El Salvador 0 3 8 13 13 14 0 5 10 0 4 3 9 82 Papua New Guinea 0 0 11 6 0 0 5 6 11 0 10 29 0 78
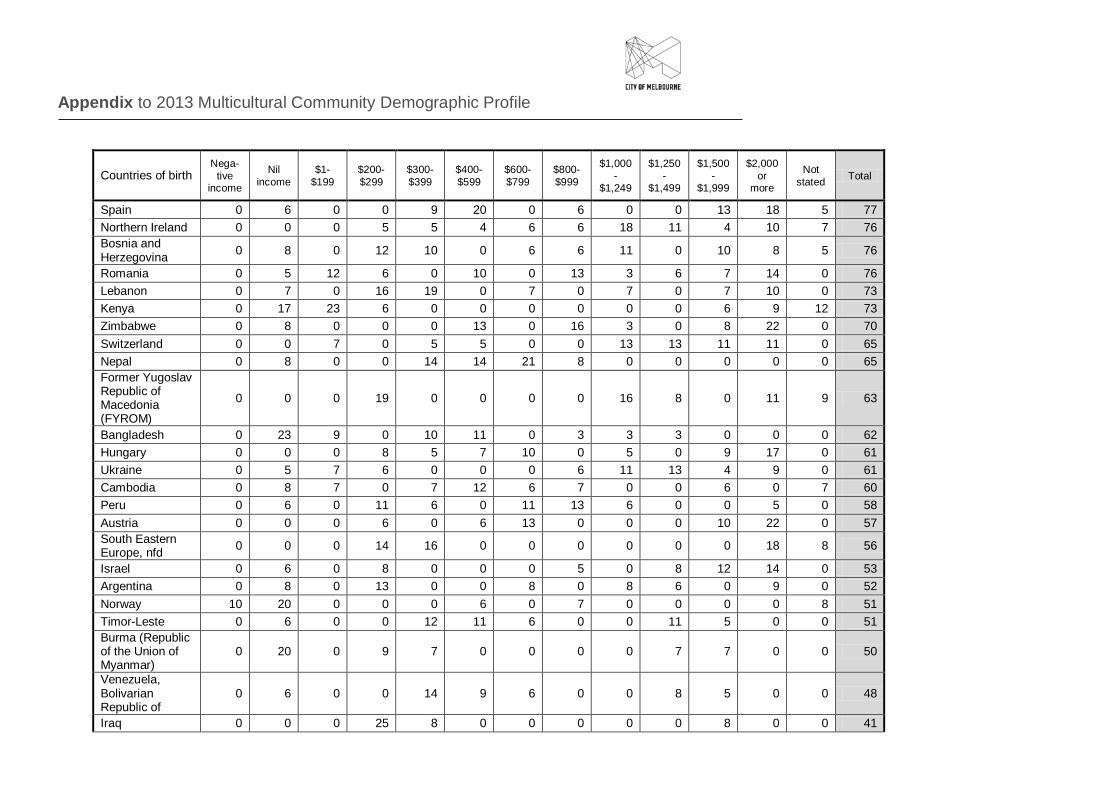
Appendix to 2013 Multicultural Community Demographic Profile
Countries of birth Nega-
tive income
Nil income
$1-$199
$200-$299
$300-$399
$400-$599
$600-$799
$800-$999
$1,000-
$1,249
$1,250-
$1,499
$1,500-
$1,999
$2,000 or
more
Not stated Total
Spain 0 6 0 0 9 20 0 6 0 0 13 18 5 77 Northern Ireland 0 0 0 5 5 4 6 6 18 11 4 10 7 76 Bosnia and Herzegovina 0 8 0 12 10 0 6 6 11 0 10 8 5 76
Romania 0 5 12 6 0 10 0 13 3 6 7 14 0 76 Lebanon 0 7 0 16 19 0 7 0 7 0 7 10 0 73 Kenya 0 17 23 6 0 0 0 0 0 0 6 9 12 73 Zimbabwe 0 8 0 0 0 13 0 16 3 0 8 22 0 70 Switzerland 0 0 7 0 5 5 0 0 13 13 11 11 0 65 Nepal 0 8 0 0 14 14 21 8 0 0 0 0 0 65 Former Yugoslav Republic of Macedonia (FYROM)
0 0 0 19 0 0 0 0 16 8 0 11 9 63
Bangladesh 0 23 9 0 10 11 0 3 3 3 0 0 0 62 Hungary 0 0 0 8 5 7 10 0 5 0 9 17 0 61 Ukraine 0 5 7 6 0 0 0 6 11 13 4 9 0 61 Cambodia 0 8 7 0 7 12 6 7 0 0 6 0 7 60 Peru 0 6 0 11 6 0 11 13 6 0 0 5 0 58 Austria 0 0 0 6 0 6 13 0 0 0 10 22 0 57 South Eastern Europe, nfd 0 0 0 14 16 0 0 0 0 0 0 18 8 56
Israel 0 6 0 8 0 0 0 5 0 8 12 14 0 53 Argentina 0 8 0 13 0 0 8 0 8 6 0 9 0 52 Norway 10 20 0 0 0 6 0 7 0 0 0 0 8 51 Timor-Leste 0 6 0 0 12 11 6 0 0 11 5 0 0 51 Burma (Republic of the Union of Myanmar)
0 20 0 9 7 0 0 0 0 7 7 0 0 50
Venezuela, Bolivarian Republic of
0 6 0 0 14 9 6 0 0 8 5 0 0 48
Iraq 0 0 0 25 8 0 0 0 0 0 8 0 0 41

Appendix to 2013 Multicultural Community Demographic Profile
Countries of birth Nega-
tive income
Nil income
$1-$199
$200-$299
$300-$399
$400-$599
$600-$799
$800-$999
$1,000-
$1,249
$1,250-
$1,499
$1,500-
$1,999
$2,000 or
more
Not stated Total
Belgium 0 0 0 0 0 0 8 6 0 0 10 7 0 31 Denmark 0 0 0 7 0 0 0 5 6 0 6 7 0 31 Zambia 0 11 0 0 0 0 0 5 7 0 0 8 0 31 Czech Republic 0 0 6 0 9 0 0 0 7 7 0 0 0 29 Slovenia 0 7 0 0 0 0 0 0 0 0 6 6 7 26 Oman 0 0 0 6 6 13 0 0 0 0 0 0 0 25 Laos 0 8 0 8 0 0 0 0 9 0 0 0 0 25 Portugal 0 3 0 3 0 3 6 3 0 3 3 0 0 24 Bulgaria 0 0 0 8 0 0 0 0 0 7 6 0 0 21 Uruguay 0 0 0 5 16 0 0 0 0 0 0 0 0 21 Afghanistan 0 7 0 7 0 6 0 0 0 0 0 0 0 20 Bahrain 0 5 6 0 0 5 0 0 0 0 0 0 0 16 Kazakhstan 0 8 0 0 0 0 0 0 0 0 0 0 8 16 Finland 0 0 0 0 0 0 0 0 3 0 9 3 0 15 Lithuania 0 8 0 0 7 0 0 0 0 0 0 0 0 15 Cyprus 0 0 10 0 0 0 0 0 0 0 3 0 0 13 Tanzania 0 13 0 0 0 0 0 0 0 0 0 0 0 13 Slovakia 0 3 0 0 0 0 0 0 0 0 9 0 0 12 Libya 0 0 6 6 0 0 0 0 0 0 0 0 0 12 Nigeria 0 0 6 0 0 0 0 0 0 6 0 0 0 12 Syria 0 0 0 0 0 0 0 0 0 0 10 0 0 10 Latvia 0 0 0 0 0 3 3 0 0 0 0 3 0 9 Morocco 0 0 0 0 0 0 9 0 0 0 0 0 0 9 Samoa 0 0 0 0 0 0 8 0 0 0 0 0 0 8 Eastern Europe, nfd 0 0 0 0 0 0 0 0 0 0 8 0 0 8
Ghana 0 8 0 0 0 0 0 0 0 0 0 0 0 8 Cook Islands 0 0 0 0 0 7 0 0 0 0 0 0 0 7 Estonia 0 0 0 0 0 7 0 0 0 0 0 0 0 7 Jordan 0 0 0 0 0 0 0 0 0 0 0 7 0 7

Appendix to 2013 Multicultural Community Demographic Profile
Countries of birth Nega-
tive income
Nil income
$1-$199
$200-$299
$300-$399
$400-$599
$600-$799
$800-$999
$1,000-
$1,249
$1,250-
$1,499
$1,500-
$1,999
$2,000 or
more
Not stated Total
Mongolia 0 7 0 0 0 0 0 0 0 0 0 0 0 7 Solomon Islands 0 0 0 0 0 6 0 0 0 0 0 0 0 6 Tonga 0 0 0 0 0 6 0 0 0 0 0 0 0 6 Kosovo 0 0 0 0 0 6 0 0 0 0 0 0 0 6 Algeria 0 0 0 6 0 0 0 0 0 0 0 0 0 6 Uganda 0 0 0 6 0 0 0 0 0 0 0 0 0 6 South Sudan 0 0 5 0 0 0 0 0 0 0 0 0 0 5 Yemen 0 0 0 5 0 0 0 0 0 0 0 0 0 5 Maldives 0 5 0 0 0 0 0 0 0 0 0 0 0 5 Botswana 0 0 0 5 0 0 0 0 0 0 0 0 0 5 Burundi 0 0 5 0 0 0 0 0 0 0 0 0 0 5 Djibouti 0 0 0 5 0 0 0 0 0 0 0 0 0 5 Inadequately described 0 16 0 0 0 0 0 0 9 0 0 9 9 43
Not stated 20 105 44 84 79 56 67 63 58 33 38 65 8999 9711 Total 824 12339 5208 5515 4597 6108 6293 6093 7334 5889 6945 9060 10777 86982

Appendix to 2013 Multicultural Community Demographic Profile
2. Data sources All data utilised in this report on Multicultural Community Demographic Profile were sourced from:
• the Australian Bureau of Statistics, 2011 Census, ‘City of Melbourne (Local Government Area)’, accessed 2013.
The majority of data utilise the Counting Persons, Place of Usual Residence database, unless inappropriate to do so whereby the Counting Persons, Place of Enumeration has been utilised.
Place of Usual Residence is the place where a person usually lives. It may, or may not be the place where the person was counted on Census Night. Each person is required to state his/her address of usual residence in Question 8. The count of persons at their usual residence is known as the de jure population count. Census counts compiled on this basis are less likely to be influenced by seasonal factors such as school holidays and snow seasons, and provide information about the usual residents of an area.
Conversely, the Place of Enumeration is the place at which the person is counted i.e. where he/she spent Census Night, which may not be where he/she usually lives.
The population count for place of enumeration is a count of every person, who spends Census Night in Australia, based on where he/she is counted. It includes people on board vessels in or between Australian ports, or on long-distance trains, buses or aircraft. This count is also known as a de facto population count.
People entering Australia from overseas before midnight on Census Night were counted where they stayed on Census Night. Visitors to Australia are counted regardless of how long they had been in the country or how long they planned to stay. People leaving an Australian port for an overseas destination before midnight on Census Night are not counted in the Census. Australian residents out of the country on Census Night, and overseas diplomatic personnel and their families in Australia are out of the scope of the Census.
This type of count provides a snapshot in any given area. Although the Census is timed to attempt to capture the typical situation, holiday resort areas, such as the Gold Coast and snow fields, may show a large enumeration count compared with the usual residence count.

Appendix to 2013 Multicultural Community Demographic Profile
3. Data issues Analysis throughout this report refers to 2011 Census data, which on Census night (9 August 2011) recorded a total of 93,627 residents living in the City of Melbourne and a total of 119,878 people present in the City of Melbourne on Census night.
The following Survey Data Confidentiality explanation is an excerpt from the Australian Bureau of Statistics (ABS) website in relation to the Census and Statistics Act 1905. The original text on the ABS website may be found here:
http://www.abs.gov.au/websitedbs/D3310114.nsf/home/CURF:+Survey+Data+Confidentiality
Survey Data Confidentiality
Care should be taken in analysing tables with cells which have a small count. Aside from the effects of the confidentiality process, sampling error and possible respondent and processing errors have greatest relative impact on small numbers and cells with large percentage RSEs.
A technique has been developed to randomly adjust cell values. Random adjustment of the data is considered to be the most satisfactory technique for avoiding the release of identifiable data. When the technique is applied, all cells are adjusted to prevent any identifiable data being exposed. These adjustments result in introduced random errors (known as perturbed data). However the information value of the table as a whole is not impaired.
The totals and subtotals in tables of counts are also subjected to small adjustments. These adjustments of totals and subtotals include modifications to preserve the additivity within tables. Although each table of this kind is internally consistent, comparisons between tables which contain similar data may show some minor discrepancies. In addition the tables at different geographic levels are adjusted independently, and tables at the higher geographic level may not be equal to the sum of the tables for the component geographic units.
Tables of sums are calculated as the product of the corresponding mean and count, and because of small adjustments the resulting table will in general not be additive.
It is not possible to determine which individual figures have been affected by random error adjustments, but the small variance which may be associated with derived totals can, for the most part, be ignored.
Residual categories and supplementary codes

Appendix to 2013 Multicultural Community Demographic Profile
Residual categories in a classification are labelled Not elsewhere classified (nec), Not elsewhere included (nei), Other or Miscellaneous. These categories are necessary because, although in a classification meaningful categories are created through the application of certain criteria, not all observations can be classified into a homogeneous group, or the size of the observations does not allow them to be separately identified. For example, in the classification of languages, the minor group 'Chinese' is composed of six distinct languages and one residual category:
Chinese: Cantonese; Hakka; Hokkien; Mandarin; Teochew; Wu; Chinese languages; nec (includes Hsiang, Kan).
The residual category is needed because the six distinct languages do not encompass all the known Chinese languages. The remainder of observations which can be classified as 'Chinese languages' are grouped together in 'Chinese languages, nec'. Supplementary codes (often called dump codes) are used to process inadequately described responses. Not further defined codes (sometimes called undefined codes) are used to process incomplete, non-specific or imprecise responses which cannot be coded to the most detailed level of a classification, but which nevertheless, contain enough information to allow them to be coded to a higher level of the classification structure. For example, country of birth responses relating to places which cannot be identified as lying within the boundaries of a country separately identified in the Standard Australian Classification of Countries (SACC), Second Edition - Revision 1 but which lie wholly within the boundaries of one of the classification's Minor Groups, are coded to that Minor Group. It is important to note the distinction between Not elsewhere classified categories and Not further defined codes. NEC categories are a formal part of a classification's structure, designed to make a classification complete and exhaustive of all observations in scope. Adequately described, specific responses are coded to nec categories in instances where a suitable substantive category is not included in the classification. As explained above, nfd codes are designed to facilitate processing by allowing inadequately described or non-specific responses to be coded to a broader level of the classification rather than be lost altogether. NFD codes are not a formal part of a classification. Other supplementary codes are also provided in classifications, for operational purposes, to facilitate the coding of responses to:
• Inadequately described, where a response contains insufficient information to be coded to any level of the classification; • Not stated, where no response is provided; and • Not applicable, where the question does not apply to the person and so no response is required (for example, Year of Arrival
in Australia is not applicable for people born in Australia).
Like nfd codes, these supplementary codes are not a formal part of a classification.

Appendix to 2013 Multicultural Community Demographic Profile
The above information and further detail related to residual categories and classifications may be found on the Australian Bureau of Statistics website:
http://www.abs.gov.au/ausstats/[email protected]/Lookup/2901.0Chapter50302011