Embed Size (px)
Citation preview

Appendix W – Metocean Monitoring Information

Metocean Measurement Monitoring Information
1
Contents 1. Introduction .................................................................................................................................................... 2
2. Surface Wave and Current Buoys ................................................................................................................. 2
Proposed Surface Wave and Current Buoy Location and Objective .................................................... 2
Wave Buoy Design ............................................................................................................................... 4
Power source, material and dimensions ............................................................................................... 6
Mooring Configuration .......................................................................................................................... 6
Data collection and transmission .......................................................................................................... 7
Deployment and Recovery Strategies .................................................................................................. 7
3. Bottom mounted ADCP ................................................................................................................................. 7
ADCP Design ....................................................................................................................................... 8
Power source, material and dimension ................................................................................................ 8
Mooring Configuration .......................................................................................................................... 8
Data collection and transmission ........................................................................................................ 10
Deployment and Recovery Strategies ................................................................................................ 11
4. Vessel Use .................................................................................................................................................. 12
5. Strategy for the US Projects ........................................................................................................................ 12
List of Figures
Figure 1 - Indicative locations for wave and/or current sensors. ........................................................................... 3
Figure 2 - Axys Technologies Triaxys wave buoy (http://axystechnologies.com/products/triaxys-directional-
wave-buoy/?open_cat=40). .................................................................................................................. 4
Figure 3 - Datawell Waverider (http://www.datawell.nl/Products/Buoys.aspx). ..................................................... 5
Figure 4 - Fugro Oceanor Seawatch Midi (https://www.fugro.com/about-fugro/our-
expertise/technology/seawatch-metocean-buoys-and-sensors#tabbed3). .......................................... 5
Figure 5 - Example mooring configuration of a Fugro wavebuoy with downward facing ADCP. .......................... 6
Figure 6 - RD Sentinel V ADCPs (left) and Nortek Signature ADCP (right). ......................................................... 8
Figure 7 - Standard ADCP mooring system with surface marker/telemetry buoy. ................................................ 9
Figure 8 - Standard ADCP mooring system with no surface marker, acoustic release recovery system and
contingency ground line. .................................................................................................................... 10
Figure 9 - Example seabed frames. Left: A tripod frame with gimbal (https://www.mooringsystems.
com/images/mounts06.jpg), right: A frame with side protection to limit the damage of fishing
operations (http://aquavision.nl/wp-content/uploads/2016/03/ADCPFrame_v11112015.pdf?x70999).
........................................................................................................................................................... 10

2
1. Introduction
During the planning, installation and operating of an offshore windfarm, knowing the meteorological and
oceanographic (metocean) conditions is essential. There are a number of instruments which can take a range
of physical measurements, each stage of a windfarm lifetime will have different requirements. Consequently,
Ocean Wind will deploy wave buoys and Acoustic Doppler Current Profilers (ADCPs) to conduct meteorological
and metocean evaluations as part of the construction activities of the Ocean Wind Project. Specifically, Ocean
Wind will collect and analyze meteorological data, inclusive of wind speed and direction, waves and currents
and information on other meteorological and metocean conditions within the Lease OCS-A 0498.
This document describes the proposed metocean monitoring during construction and operation of the Ocean
Wind Project and provides an overview of the current state-of-the art, providing information on a range of
instrumentation. In this case these instruments have been split into two broad categories: wave buoys (surface
measurement of metocean conditions) and bottom mounted current profilers.
2. Surface Wave and Current Buoys
Wave buoys deployed near the designated Ocean Wind turbine locations will provide reliable and accurate
information about the wave height, period and direction, all of which are essential parameters when planning,
installing and operating an offshore wind farm. The measured data can be fed to a forecasting system, which
can predict and report the wave conditions several days in advance.
Proposed Surface Wave and Current Buoy Location and Objective
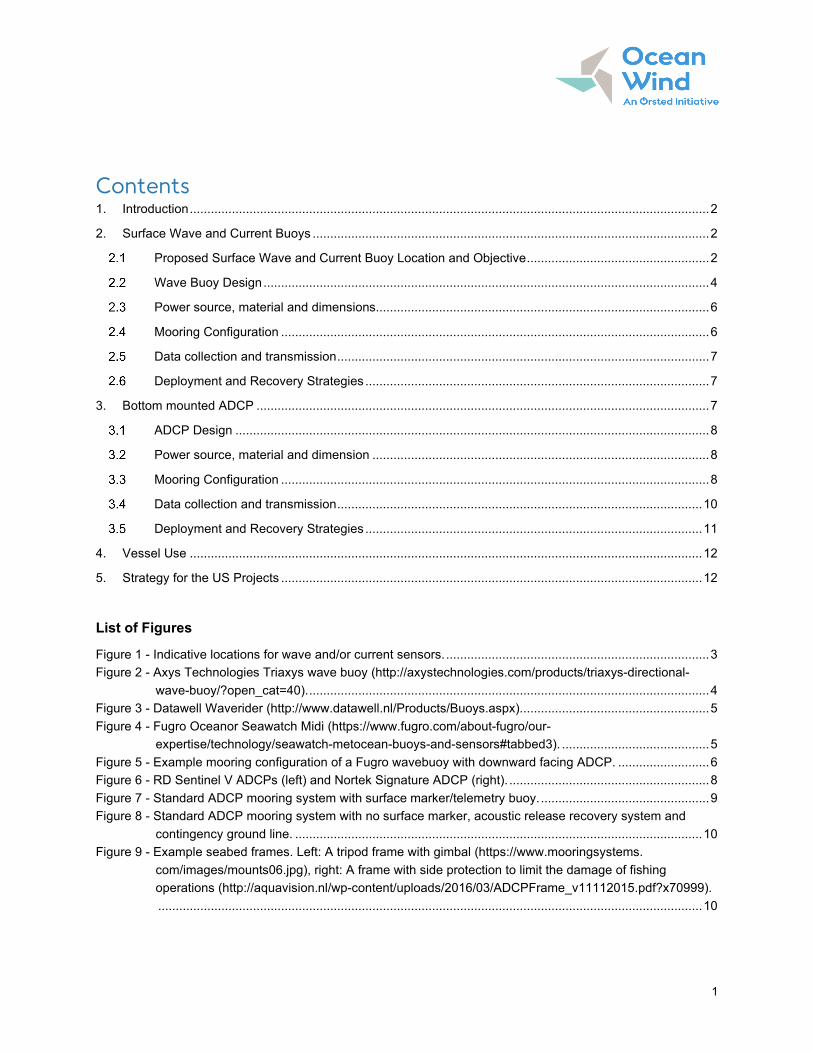
The location of the proposed metocean instruments will fall within Wind Farm Area and the proposed cable
routes (Figure 1), though the specific locations for the equipment is still being finalized.
Up to two wave buoys will be installed in the Wind Farm Area during the construction stage. After construction
one wave buoy will stay in place up to five years to support a structural monitoring campaign on one WTG. The
number and location of these buoys are to be decided once the WTG to be tested is determined. The buoy
shall be located up to a maximum distance of 500 m from the WTG.
Up to six nearshore floating or bottom mounted ADCPs are to be deployed in 10 m of water directly in front of
the cable landfall points and along the cable route at deeper locations to support the cable installation works.
Ocean Wind will ensure that these instruments will not be a hazard to navigation for vessels transiting the Wind
Farms Area; locations will be published in the local Notice to Mariners. These will provide real-time wave and
current data to the installation vessels through telemetry from a surface buoy. The exact number and location
of these instruments are pending final route and cable design. Coordination with stakeholders will ensure they
are positioned at a distance that they will not disrupt operations.
The wave buoys and ADCPs deployed during construction will provide real time data for the different vessels
operating offshore. Metocean data supports lifting operations, cargo transfer and overall weather monitoring for
logistics decisions. The metocean data from the wave buoy deployed during the initial period of operations will
support asset management, structural monitoring and marine transfer operations.
3
Figure 1 - Indicative locations for wave and/or current sensors.

4
The following sections provide metocean measurement technology on a general level and provides some
specific recommendations to be applied on the Ocean Wind project.
Wave Buoy Design
There are many different types of wave buoys available on the market. Ørsted has previously used the Axys
Triaxys, Datawell Waverider buoy and Fugro Oceanor Seawatch Midi (Figures 2 to 4). All measure wave
heights, periods and direction. They can also be equipped with a downward facing current profiler, which allows
measurement of water velocity and direction through the water column.
The following links provide more information, pictures and specification sheets:
Figure 2 - Axys Technologies Triaxys wave buoy (http://axystechnologies.com/products/triaxys-
directional-wave-buoy/?open_cat=40).

5
Figure 3 - Datawell Waverider (http://www.datawell.nl/Products/Buoys.aspx).
Figure 4 - Fugro Oceanor Seawatch Midi (https://www.fugro.com/about-fugro/our-
expertise/technology/seawatch-metocean-buoys-and-sensors#tabbed3).

6
Power source, material and dimensions
Batteries are the primary source of power for the wave buoys, and they are charged through the solar panels.
Both the Datawell and Triaxys buoys use an impact resistant stainless-steel hull. With the Triaxys buoy using a
polycarbonate dome upper half to facilitate charging of the solar panels. Also contained within the dome are
transmission antenna and a programable IALA specification navigational yellow flashing light. On the Datawell
buoy this yellow flashing light is incorporated into the whip antenna.
Mooring Configuration
The mooring system will be designed individually for the location depending on buoy type, water depth and
environmental considerations (such as whale migration). It will typically consist of an anchor weight of e.g.
800kg, and a mooring line designed exclusively, or as a combination of rope, chain or bungee, sometimes in
combination with floats (Figure 5). Shackles and eyes will ensure that deployment and decommissioning will
take place in the safest and simplest way possible.
Figure 5 - Example mooring configuration of a Fugro wavebuoy with downward facing ADCP.

7
Data collection and transmission
Wave buoys collect raw buoy motion data, also known as heave, pitch and roll, which it uses to calculate the
informative wave parameters significant wave height, wave period and mean wave direction. A downward
facing ADCP (see 3.1) can also be incorporated into the buoy hull, allowing current magnitude and direction to
be observed through the water column. It furthermore records and transmits its geographic position via the in-
built GPS.
The wave buoy will store the data locally as well transmit the data via telemetry to a satellite gateway to an
onshore server. Typically, the data will be sent both to the supplier for quality checks and to an Ørsted server.
Ørsted will receive the processed data (wave height, period and direction) from the supplier.
Deployment and Recovery Strategies
Dependent on the buoy type, the diameters can range from 0.5 m to more than 1.5 m, ranging in weight
between ~200 and 600 kg. Vessels equipped with a crane or A Frame and winch can be used for deployment
and recovery.
An example deployment for a wave buoy on these types of vessel is outlined below:
1. The full wave buoy mooring will be configured, connected and flaked out on deck.
2. The upper-most section of the riser chain will be secured to a rated hard point using an on-load
release device or sacrificial rated strop.
3. Using the vessel crane, lift the wave buoy overboard using an off-load release hook. Tag lines will be
threaded through the waterline tag line points to stabilize the load if required. A boat hook may be
required to guide the buoy away from the vessel.
4. Once in the water, release the lifting line from the wave buoy using the release device and recover the
tag lines.
5. Hand feed the upper mooring off the deck, stopping at the top of the riser chain which has been
secured to the vessel.
6. The vessel will tow the buoy slowly to the deployment location while the remaining tasks are ongoing.
7. Connect the vessel crane to the sinker weight, coupling it with an on-load quick release device.
8. Ensuring all deck personnel are stood clear of the mooring, release the upper-most section of the riser
chain by triggering the on-load release device or cutting the sacrificial rated strop. The chain will run off
the deck into the water, stopping at the sinker weight.
9. Using the vessel crane, the sinker weight will be lifted overboard on a lifting strop coupled with an on-
load quick release device. Keep the lift low to minimize any swinging action and so that the load can
be touched to deck before any such motion becomes uncontrollable. The sinker weight will be lowered
into the water to prevent the weight swinging. The safety pin on the release device will then be
removed.
10. When the vessel arrives on the deployment position, a signal will be given by the Vessel Master and
the sinker weight will be released by triggering the release mechanism. The Vessel Master and Survey
Supervisor will check the sinker has touched down on the seabed at the correct location.
11. The vessel will move away, taking care to keep propellers clear of the mooring.
3. Bottom mounted ADCP
Bottom mounted ADCP systems can provide more accurate current (direction and velocity through the water
column) measurements when compared with a buoy mounted ADCP (currently used on FLiDAR and wave

8
buoys). The use of these systems is generally discussed where accurate and high temporal resolution current
data is required.
ADCP Design
ADCPs are available from a number of suppliers though primarily Teledyne RD and Nortek (Figure 6). They all
work on the same basic principles: sending a sound pulse through the water column (at varying frequencies
dependent on depth of water and precision needed) and measuring how the frequency changes. This change
in frequency and understanding of the Doppler effect allows a speed relative to each ADCP beam to be
established. From multiple beams a direction and overall velocity can be calculated. The stability of bottom
mounted systems allows a high sampling rate which can be used to assess turbulence in the water column and
better understand variation through the water column at sub minute scales.
Figure 6 - RD Sentinel V ADCPs (left) and Nortek Signature ADCP (right).
Power source, material and dimension
The ADCP is usually a sealed canister made from a range of plastic polymers such as POM
(Polyoxymethylene) and are depth rated dependent on requirements. These canisters can also house alkaline
or lithium batteries and in some cases for a longer or more power consuming deployment additional battery
canisters may be connected to the ADCP. The size of the ADCP differs depending on the range of the
instrument, with a head diameter of 10-25 cm and height of 20 – 60 cm for water depths <100 m.
Mooring Configuration
Two standard mooring configurations and are outlined below:
The first (Figure 7) incorporates a surface marker buoy which can also be used for telemetry and navigation.
The marker buoy acts as the primary recovery method. The second (Figure 8), has no surface marker and
relies on an acoustic system to release floats which are attached to the ADCP frame, these configurations are
useful where instrument theft or sabotage is common or in regions with high current magnitudes (which can
draw down buoys or cause navigation issues).

9
Both options center around an upward facing ADCP mounted in a seabed frame. Frame designs can consist of
simple tripod designs with gimbal (for ensuring the instrument remains level) or trawl resistant features such as
low profile and protected sides (Figure 9). Additional instrumentation can also be mounted on the frame
including GPS Tracker, Tide gauge, Conductivity and temperature sensor, scour monitoring sensor, sediment
traps.
Figure 7 - Standard ADCP mooring system with surface marker/telemetry buoy.

10
Figure 8 - Standard ADCP mooring system with no surface marker, acoustic release recovery system
and contingency ground line.
Figure 9 - Example seabed frames. Left: A tripod frame with gimbal (https://www.mooringsystems.
com/images/mounts06.jpg), right: A frame with side protection to limit the damage of fishing
operations (http://aquavision.nl/wp-content/uploads/2016/03/ADCPFrame_v11112015.pdf?x70999).
The overall footprint of the instrumentation and mooring is approximately 1 m2 for frame and ground weight,
with the ground line separating these by 20-50 m dependent on water depth, the impact to sea bed in both
mooring designs is minimal, with the groundline being deployed relatively taut, and therefore no sweep with the
tides. Dependent on environmental restrictions the marker buoy maybe deployed with a chain or rope mooring.
In all cases seabed penetration generally does not exceed 0.5 m.
Data collection and transmission
Often with bottom mounted ADCP data is stored internally and only recovered on recovery. In the case of real-
time monitoring need the instrument, although when fixed to a structure the or vessel a hard line may transfer
the data in real time, the only option for a seabed mounted system is a combination of acoustic modem to

11
transfer data to a transmission buoy. Which can transmit the data via telemetry to a satellite gateway and then
to an onshore server. This does however have a significant impact on power consumption and battery use.
Deployment and Recovery Strategies
Due to the size and weight of the instrumentation (generally not exceeding 1500 kg in total) deployment and
recovery of ADCP frames and moorings can generally be conducted on any small workboat or cat equipped
with on-deck crane, winch and bow roller. A standard deployment and recovery of a buoy incorporated mooring
system (Figure 7) could consist of:
1. Riser chain loaded onto vessel winch and connected to ground weight; ground line fixed onto ground
weight/riser chain and ready to be connected to seabed frame.
2. Ground weight transferred over bow roller and riser chain used to take weight.
3. Winch used to lower riser chain to the seabed, whilst ground line is lowered in a controlled manner
alongside.
4. Riser chain secured and marker buoy connected to riser chain. Buoy then craned into water and
remaining secured chain released.
5. Frame connected to ground line and certified lowering cable/rope attached to frame and winch.
6. Vessel positions over deployment location.
7. Frame lowered to seabed and slip rope released.
Recovery utilizes the marker buoy, which is lifted on to deck, followed by winching of the riser chain and ground
weight.
A non-surface buoy mooring system can be deployed in much the same way, or with the use of acoustic
release transponders (e.g. https://www.sonardyne.com/product/acoustic-release-transponder/):
1. Frame is first connected to the secured ground line and acoustic release system with lowering cable,
which is loaded on to the vessel winch.
2. Vessel positions over deployment location and frame is lifted into the water allowing the lowering cable
to take weight of frame.
3. Winch lowers the frame to the seabed as ground line is released under control.
4. Frame lands on seabed and acoustic signal sent to release from cable.
5. Cable recovered and attached to ground weight.
6. Groundline is connected to ground weight as vessel moves away from frame position along tidal axis.
7. Ground weight lifted and lowered to seabed, lowering cable released.
Recovery in this case utilizes an acoustic release system loaded with dyneema and floats, which allows
recovery of the frame onto deck first, before winching of the groundline and ground weight.
Both mooring systems incorporate a contingency recovery system in the case of marker buoy loss or acoustic
release failure through the ground line between weight and ADCP frame can be grappled for and winched
aboard.
The need for servicing is primarily based on the battery life of the instrumentation and biofouling of the
instrument sensors but can be assumed to be between 30- and 90-days. If redeployment is required servicing
can generally be done at sea, with the instrumentation re-batteried, biofouling removed, and mooring
consumables replaced.

12
4. Vessel Use
There is a pool of vessels available of these along the US East Coast and in the past we have operated with a
range of vessels ranging from 600-ton of gross tonnage and 50 m LOA down to 150-ton and 28m LOA. Vessel
availability depends on a few factors outside Ørsted control such as: vessel commitments to other work,
weather window and proximity to site and crew certification. As a result, the vessel selection can only be
confirmed a few weeks before a suitable weather window is confirmed.
Only vessels which have been audited and approved are used for operations. For a vessel to be deemed fit for
working in the Ørsted Wind Farm sites, it needs to pass an inspection process comprising:
• Marine inspection addressing the sea worthiness of the vessel focusing on O&M equipment on board
and its condition and maintenance records.
• HSE inspection focusing on lifesaving and first aid equipment onboard and current condition.
• Check of crew offshore training certificates.
All vessels working in the US project use ultra-low sulphur diesel and consumptions vary as per distance from
shore to site. Travel speeds are typically in the region of 5-10 knots.
5. Strategy for the US Projects
The goal of deploying any measuring sensors is to know the conditions at site with enough accuracy to support
operation and design tasks. Although these sensors measure conditions passing through a single point,
conditions can be extrapolated with confidence to nearby areas as the wind farm sits in open ocean.
As timeline reference, the following measuring standard layout will comprise of:
1. During development stage (design and pre-construction) – FLiDARs are deployed within the lease
area of the offshore wind farm site. Typical duration is 1 to 2 years and the sooner the deployment the
more value can be obtained as it can timely be incorporated in the design. A single measuring location
tends to be the adopted layout.
2. During the construction stage – measurement systems can be deployed to provide real time data for
the different vessel operating offshore. It supports lifting operation, cargo transfer and overall weather
monitoring for logistics decisions. Typical duration is 1 year and centered on the summer months.
3. During the operations stage – the measuring campaign is scaled down and in-water systems are
normally no longer used since LiDAR and radar systems can be transferred to the Offshore Sub-
Station to measure wave and wind parameters.