Embed Size (px)
Citation preview

APPLES TO APPLES?: COMPARING THE PREDICTIVE VALIDITY OF THE GMAT
AND GRE FOR BUSINESS SCHOOLS, AND BUILDING A
BETTER ADMISSIONS FORMULA
by
CHARLES BLAKE BEDSOLE
(Under the Direction of Robert Toutkoushian)
ABSTRACT
This purpose of this study was to analyze the predictive validity of the GMAT and GRE
specifically for MBA program admissions purposes, and also to try and identify other factors that
may be statistically significant predictors of academic success (as defined by graduate GPA). As
of this writing, the predictive validity of the GRE for MBA programs had not been analyzed,
even though the majority of business schools globally now accept the GRE as part of their
admissions processes. A review of the current literature base was conducted which included a
historical overview of standardized testing broadly and the GMAT/GRE specifically and prior
predictive validity research specific to the GMAT/GRE and other factors thought to predict
academic success. Using a dataset which consisted of 749 total student records from three
institutions in the United States, this study used correlation, bivariate regression, and multivariate
regression techniques to determine the variables that were most important in predicting academic
success. It was found that undergraduate GPA was the strongest standalone predictor of

graduate academic success for both the GMAT and GRE test-taker subgroups. The GMAT was
a significant predictor of first-semester and final MBA GPAs, and the GRE, while not significant
in the prediction of first-semester MBA GPA, was a significant predictor of final MBA GPA and
accounted for slightly more variance than the GMAT in the sample. The study also found that
the AACSB score, a formula which combines undergraduate GPA and standardized exam score,
was the strongest predictor of MBA academic success amongst all variables collected in this
sample.
INDEX WORDS: 2013, Predictive validity, Standardized testing, Academic success, GMAT, GRE, MBA programs, Admissions Decisions

APPLES TO APPLES?: COMPARING THE PREDICTIVE VALIDITY OF THE GMAT
AND GRE FOR BUSINESS SCHOOLS, AND BUILDING A
BETTER ADMISSIONS FORMULA
by
CHARLES BLAKE BEDSOLE
BS, The University of Alabama, 2003
MA, The University of Alabama, 2006
A Dissertation Submitted to the Graduate Faculty of The University of Georgia in Partial
Fulfillment of the Requirements for the Degree
DOCTOR OF EDUCATION
ATHENS, GEORGIA
2013

© 2013
Charles Blake Bedsole
All Rights Reserved

APPLES TO APPLES?: COMPARING THE PREDICTIVE VALIDITY OF THE GMAT
AND GRE FOR BUSINESS SCHOOLS, AND BUILDING A
BETTER ADMISSIONS FORMULA
by
CHARLES BLAKE BEDSOLE
Major Professor: Robert Toutkoushian
Committee: Karen Webber
Sheila Slaughter
Electronic Version Approved:
Maureen Grasso Dean of the Graduate School The University of Georgia December 2013

iv
TABLE OF CONTENTS
Chapter 1 - Introduction .................................................................................................................. 1
Statement of the Problem ............................................................................................................ 1
Research Questions ..................................................................................................................... 4
Research Approach and Summary of Findings ........................................................................... 4
Chapter 2 - Literature Review ......................................................................................................... 6
Historical Background................................................................................................................. 6
Current Exam Structure ............................................................................................................. 10
Exam Uses ................................................................................................................................. 12
Test-Taker Statistics .................................................................................................................. 15
Admissions Processes ............................................................................................................... 19
Predictive Validity..................................................................................................................... 20
Conceptual Framework ............................................................................................................. 22
Prior GMAT Validity Studies ................................................................................................... 23
Prior GRE Validity Studies ....................................................................................................... 27
Chapter 3 - Data and Methods ...................................................................................................... 30
Data Source ............................................................................................................................... 30
Dependent Variables ................................................................................................................. 34

v
Independent Variables ............................................................................................................... 35
Analysis ..................................................................................................................................... 43
Chapter 4 - Results and Discussion .............................................................................................. 45
Descriptive Statistics ................................................................................................................. 45
Relationships Between Predictors and Standardized Exam Performance ................................ 48
Relationships Between Predictors and MBA Academic Performance ..................................... 51
Bivariate Regression – 1st Semester GPA as Dependent Variable ............................................ 58
Bivariate Regression –Final MBA GPA as Dependent Variable .............................................. 62
Multivariate Regression ............................................................................................................ 66
Chapter 5 - Conclusion ................................................................................................................. 76
Summary ................................................................................................................................... 76
Limitations and Calls for Future Study ..................................................................................... 78
References ..................................................................................................................................... 82

1
Chapter 1 - Introduction
Statement of the Problem
From its formulation in 1953, the Graduate Management Admissions Test (GMAT) has been the
standard examination used for graduate business school applications. However, when the
Graduate Management Admissions Council (GMAC) chose to leave the Educational Testing
Service (ETS) and move their test administration to Pearson Vue in 2006, ETS began marketing
the Graduate Record Examination (GRE) as an alternative to the GMAT and suggesting that the
GRE could also be used for graduate business admissions applications. However, no validity
studies have been done that look at the validity of the GRE to business graduate programs in
general or MBA programs specifically. Since admission to MBA programs at most AACSB-
accredited institutions is based largely on standardized exam score and undergraduate GPA
(Ahmadi, 1997), it is important to statistically verify that both the GRE and GMAT are valid
predictors of MBA success.
Prior validity studies have shown the GRE, GMAT, and other standardized exams (like the
LSAT, MCAT, and MAT) to be valid predictors of graduate student success (Kuncel et. al,
2007) in many academic disciplines. And the majority of the current predictive validity
literature does show that the GMAT is a statistically significant predictor of graduate success in
business programs. Many single studies cited in this paper (Bieker, 1996; Braunstein, 2006;
Hoefer, 2000; Koys, 2005; Wright and Bachrach, 2003; Wright and Palmer, 1997) found the
GMAT or a GMAT sub score to be the strongest individual predictor of academic success (either
first-semester graduate GPA or final graduate GPA) for graduate business students. Meta-

2
analyses ran in 2007 (Kuncel et al.) and 2008 (Oh et al.) also found GMAT total score to be the
most significant individual predictor of graduate academic success for business students.
However, some single studies (Hancock, 1999; Wright and Palmer, 1994) have found the GMAT
to not be a significant predictor of academic success in graduate schools in business. While
some researchers (Kuncel et al., 2007; Oh et al., 2008) agree that GMAT should be used in
admissions processes for schools of business, others (Goodrich, 1975; Grambsch, 1981; Fairtest,
2003) have argued against the usage of the GMAT. Overall, wide ranges of observed validities
are found in the research; Kuncel et al. (2007) reported a low of -.45 and a high of .76. As
discussed in further detail later, the wide range of results contributes to some of the controversy
regarding GMAT usage for MBA and other graduate business program admission procedures.
With regards to usage of the GRE in graduate admissions procedures, there are conflicting
findings as to the predictive power of the exam. Overall studies have found the exam to be a
statistically significant predictor (Sampson and Boyer, 2001; Young, 2008; Holt et al., 2006) of
graduate student academic success, and others (Katz et al, 2009; Feeley, Williams, and Wise,
2005; Sternberg and Williams, 1997) found little to no support for the usage of the GRE in
graduate admissions policies. Predictive validity differences in the literature are also seen when
looking at different academic areas. Graduate programs in engineering (Holt et al., 2006),
psychology (Fenster et al., 2001), and veterinary medicine (Powers, 2004) have found the GRE
to be a statistically significant predictor of academic success in those programs, while other
graduate programs such as journalism and physics did not find the GRE to be a significant
predictor of graduate academic success (Holt et al, 2006).
No validity studies have been done that look at the validity of the GRE to business graduate

3
programs in general or MBA programs specifically. The GMAT was specifically developed for
business graduate programs to use in the admissions process. The GRE was developed to be
more of a broad test of knowledge; it is reasonable to assume that the exam developed
specifically for business schools might be more valid a predictor of MBA academic success. It is
also reasonable to assume that the types of students that take the GRE could be different from the
body of students that takes the GMAT. The GRE population could consist of less undergraduate
business students, or students that are not as sure which type of graduate program they wish to
pursue (as GRE scores are accepted by a variety of graduate programs). Given that the current
literature is inconclusive as to the predictive validity of the GRE for business graduate programs,
and given the proliferation of business schools now accepting the GRE, if business schools (and
in particular MBA programs) are going to be using the GRE as an alternative or substitute for the
GMAT, the validity of the exam specific to graduate schools of business and the prediction of
MBA academic success should be studied. And given the inconsistencies of reported GMAT
predictive significance, it should also be studied if that exam is still a relevant predictor of
graduate academic success.
In addition to the predictive power of standardized exams, research has found that prediction of
graduate GPA gets even stronger when undergraduate GPA and standardized exam score are
included in a predictive model (Braunstein, 2002; Fish and Wilson, 2009; Hecht et al., 1989;
Paolillo, 1982; Wright and Palmer, 1994 & 1997). Koys (2005) found the combination of
GMAT and undergraduate GPA to be more significant than either measure alone. The Graduate
Admissions Council actually recommends combining the GMAT with undergraduate grade point
average in screening applicants for admission to graduate business programs (Wightman and
Leary, 1985; Graham, 1991).

4
When researchers study the predictive validity of the GMAT or other standardized exams, they
also often analyze other factors to seek their predictive abilities (or effect on standardized exam
validity) for graduate academic performance. Gender (Fairfield-Sonn et al., 2010; Braunstein,
2006; Wright and Bachrach, 2003), age (Fish and Wilson, 2009; Yang and Lu, 2001; Hoefer,
2000), prior work experience (Braunstein, 2006; Adams and Hancock, 2002; Carver Jr. and
King, 1994), undergraduate institution (Ragothaman, Carpenter, and Davies, 2009; Braunstein,
2006; Ahmadi, 1997), undergraduate major type (Fish and Wilson, 2009; Truitt, 2002; Ahmadi,
1997), citizenship status (Fish and Wilson, 2009; Koys, 2005; Yang and Lu, 2001), and
race/ethnicity (Ahmadi, 1997; Bieker, 1996) have all been analyzed in previous studies. As with
the GMAT and GRE, these studies have found varying levels of support for the predictive
validity of these factors or their effects on standardized exam predictive validity. Overprediction
and underprediction for certain subgroups such as ethnic groups and men/women are also
observed in the literature (Zwick, 2002; Wright and Bachrach, 2003).
Research Questions
This study seeks to answer the following questions:
1) Is the GMAT a statistically valid predictor of academic success for MBA programs?
2) Is the GRE a statistically valid predictor of academic success for MBA programs?
3) Is there a difference in the variance of GPAs explained by the GRE and GMAT?
4) What other variables can accurately predict student success in an MBA program?
Research Approach and Summary of Findings
Data was split into two primary subsets of students that took the GMAT and students that took
the GRE. Correlation and regression analysis techniques along with independent samples t-tests
5
were used to examine the data. The primary goal was to ascertain the predictive power of the
GMAT and GRE in relation to the proxies for academic success (first-semester and final MBA
GPAs).
Regression analysis showed that the GMAT was a statistically significant predictor of both first-
semester and final MBA GPA, explaining 8.8% of the variance in first semester GPA and 4.4%
of the variance in final MBA GPA.
The GRE was found to not be a statistically significant predictor of first-semester GPA, only
explaining 1.5% of the variance. The GRE was found to be a statistically significant predictor of
final MBA GPA and explained 5.6% of the variance in final MBA GPA.
Variables for demographic data and academic background were inserted into the exam score
regression models and did improve the result. Comprehensive models for the GMAT test-taker
subgroup accounted for 22.1% of the variance in first-semester GPA and 23.8% of the variance
in final MBA GPA. Models for the GRE test-taker subgroup explained 27.2% of the variance in
first-semester MBA GPA and 27.4% of the variance in final MBA GPA.
For both the GMAT and GRE test-taker subsets, undergraduate GPA was a stronger predictor
than the standardized exam of choice.

6
Chapter 2 - Literature Review
Given the nature of this study, it is important to look at the current literature base regarding the
historical background of standardized testing (specifically, the backgrounds of the GMAT and
GRE) and previous studies analyzing the predictive validities of the GMAT and GRE.
Historical Background
According to Rebecca Zwick (2002), standardized admissions testing dates back to China around
200 B.C…individuals applying for jobs with the Chinese Imperial Civil Service had to “undergo
an elaborate selection process with several rounds of examinations that could take years.”
University admissions tests came later and may have begun in 18th century France (Zwick,
2002).
Standardized testing for university admissions “took root in the United States during the early
part of the twentieth century.” (Zwick, 2002). Both Zwick and Calvin (2000) discuss the origins
of the SAT beginning in the 1920s and how it was developed by the same man (Carl Brigham)
that developed the Army Alpha and Beta tests used for officer selection during World War I.
Zwick writes that “the relationship between the Army Alpha and the SAT is just one example of
the interplay between the educational testing world and the U.S. military, which today boasts the
world’s largest testing program.”
Zwick summarizes the formation of the first standardized testing board as follows:
Those applying to college at the turn of the century were faced with a bewildering array
of admissions criteria. Course requirements and entrance examinations differed wildly

7
across schools. In an attempt to impose order on this chaos, the leaders of 12 top
Northeastern universities founded the College Entrance Examination Board in 1900. The
College Board created a set of examinations that were administered by the member
institutions and then shipped back to the board for painstaking hand scoring. Initially, the
Board developed essay tests in nine subject areas, including English, history, Greek, and
Latin; it later developed an exam that contained mostly multiple-choice questions – the
Scholastic Aptitude Test. This precursor to today’s SAT was first administered in 1926
to about 8,000 candidates.
Calvin (2000) writes that “the history of the use of standardized tests for admissions in higher
education is really the story of (Henry) Chauncey and ETS.” Dr. Chauncey was an assistant
dean at Harvard who became interested in standardized testing due to his role selecting “Harvard
National Scholars”. After learning of Brigham’s new Scholastic Aptitude Test, Calvin decided
to use the SAT to disperse the Harvard National Scholarships. Chauncey introduced the SAT to
other members of the Ivy League, and after also working with the Armed Forces to adopt the
SAT as part of a college deferment program, Chauncey joined the College Board in 1945 as their
first president (Calvin, 2000). After several years of negotiation, the College Board merged their
testing activities with those of the Carnegie Foundation for the Advancement of Teaching and
the American Council on Education to become the Educational Testing Service, or ETS (Zwick,
2002). By this time, in addition to the SAT, other standardized exams such as “the Graduate
Record Exam, the Medical College Admissions Test, the Law School Admissions Test, and the
Graduate Management Admissions Test had either just come out or were still being developed”
(Collins, 2000). Calvin writes the following regarding Chauncey’s work:
Chauncey was not a social engineering who was trying to change the nature of American

8
society. However, he firmly believed that large-scale standardized testing for admission
to institutions of higher education in America would bring about two things: a system for
selecting the country’s leadership that was based on scholarship and a method that would
provide universal opportunity for all its citizens. It is clear that Chauncey and ETS never
intended that their standardized tests would be used to maintain an elite based on
financial wealth and birthright, nor were these tests ever intended to favor white men
over applicants for other groups. Henry Chauncey and ETS were attempting to make real
James Bryant Conant’s vision of education as a fair and equitable way of providing
leadership and opportunity for people of the United States…since the establishment of
ETS by Chauncey 50 years ago, the goal of standardized testing in college admissions
has been to increase the opportunity for qualified applicants from all groups to achieve
admittance, rather than to design tests to maintain the position of the present elite.
But these goals are questioned by many in higher education and in the media. The debate on
standardized testing has “become a political issue that has polarized a number of people in the
United States.” (Calvin, 2000)
Opponents of standardized testing “contend that such test are designed by white men to preserve
their positions of power and that these tests discriminate negatively on the basis of ethnicity and
gender”, and that “the tests themselves are flawed instruments that are poor predictors and
should be removed from the admissions process.” Proponents of standardized testing for
admissions purposes contend that “such tests measure merit and that the opponents of
standardized tests wish to admit unqualified individuals on the basis of racial or gender
preferences and discriminate unfairly against more meritorious candidates simply on the basis of
their ethnicity and gender”, and that the exams “do significantly improve the predictive power in
the admissions process.” (Calvin, 2000)
9
This debate, and my background as an undergraduate and now graduate admissions director,
greatly interests me. As does a recent competition between ETS and a “new” standardized
testing conglomerate, Pearson VUE (founded in 1994).
In the 1940s-50s, ETS used the GRE for graduate business school admissions. According to the
GRE Test Bulletin, you will notice that the exam claims to measure “verbal, quantitative, and
analytical skills that have been acquired over a long period of time and are not related to any
specific field of study.” This did not appeal to graduate business school administrators, and in
1953, some graduate schools of business decided that they need an admissions test of their own.
Representatives “commissioned a feasibility study by ETS, and a year later the first Admission
Test for Graduate Study in Business – later renamed the Graduate Management Admission Test
– was administered.” (Zwick, 2002)
With the implementation of the GMAT, most business schools in the 50s switched their
admissions criteria to requiring the GMAT in place of required the GRE. This remained the case
until 2006, when Graduate Management Admissions Council professionals decided that they
wanted their exam administered by another corporation. In January 2006, the GMAC board
decided to go with ACT, Inc. to develop their exam, and Pearson VUE to administer the exam.
Because of this switch, ETS began actively campaigning to business schools to accept the GRE,
and over the past six years more and more business graduate programs (both MBA and
specialized Master’s degrees) have been accepting the GRE in lieu of the GMAT; applicants at
many graduate business schools can choose which exam they would like to take. In fact, Kaplan
Test Prep’s 2012 survey reports that 69% of business schools are now accepting the GRE. This
is up from only 24% of business schools in 2009. The same survey finds that while almost 70%
of the business schools give students the option to take the GRE, only 56% of schools reported a

10
greater that 10% GRE submission rate in 2012. In other words, nine out of every ten applicants
at over half of schools surveyed are still submitting GMAT scores. One reason is that in spite of
ETS and GRE marketing, applicants are still wary to try the GRE over the GMAT. The Kaplan
survey reports that 29% of business schools say that an applicant that submits a GMAT score has
an advantage over one that submits a GRE score. This again raises the question of whether
business schools should be accepting the GRE for graduate applications.
Current Exam Structure
Both the GMAT and GRE are computerized adaptive tests on very recent iterations. (The GRE
is also administered in a paper-format in some countries, but this research will focus on the
computerized version.) ETS launched the GRE Revised General Test on August 1, 2011, and
GMAC launched the latest GMAT in June 2012 with a new section measuring “Integrated
Reasoning”.
The GRE was designed to measure “basic developed abilities relevant to graduate studies”
(Briel, O’Neill, and Scheuneman, 1993). The current GRE (the GRE revised General Test)
consists of three scored sections: Analytical Writing, Verbal Reasoning, and Quantitative
Reasoning. The Analytical Writing section consists of two prompts, one to measure analysis of
an issue, and one to measure analysis of an argument. Test takers are given 30 minutes per
prompt for a total of one hour on the Analytical Writing section. According to ETS, the
Analytical Writing section should measure the test taker’s ability to: articulate complex ideas
clearly and effectively; examine claims and accompanying evidence; support ideas with relevant
reasons and examples; sustain a well-focused, coherent discussion; and control the elements of
standard written English.

11
The GRE Verbal Reasoning exam consists of two sections of 25 questions each. Test takers are
given 35 minutes per section, for a total of 75 minutes for the Verbal Reasoning component. The
Verbal Reasoning score should reflect a test taker’s ability to: analyze and draw conclusions
from discourse; reason from incomplete data; identify author’s assumptions and/or perspective;
understand multiple levels of meaning such as literal, figurative and author’s intent; select
important points; distinguish major or relevant points; summarize text; understand the structure
of a text; understand the meanings of words, sentences, and entire texts; and understand
relationships among words and concepts.
The GRE Quantitative Reasoning component also consists of two 25-question sections, but test
takers are given 40 minutes for each section. The GRE Quantitative Reasoning score should
represent the test-taker’s ability to: understand quantitative information; interpret and analyze
quantitative information; solve problems using mathematical models; apply basic mathematical
skills and elementary mathematical concepts of arithmetic, algebra, geometry, probability, and
statistics.
The newest GMAT Exam also consists of an Analytical Writing Assessment, a Quantitative
section, and a Verbal section, but also includes a new section to measure “Integrated Reasoning”.
The GMAT Analytical Writing Assessment gives a student one argument to analyze and the
student is given 30 minutes to respond.
The GMAT Quantitative section consists of 37 questions measuring data sufficiency and
problem solving skills, and test-takers are given 75 minutes to complete.
The GMAT Verbal section consists of 41 questions gauging skills related to reading

12
comprehension, critical reasoning, and sentence correction. Test-takers are given 75 minutes to
complete the Verbal section.
The GMAT Integrated Reasoning section, new as of 2012, consists of 12 questions measuring
multi-source reasoning, graphics interpretation, two-part analysis, and table analysis. Test-takers
have 30 minutes to complete the Integrated Reasoning section.
An important distinction is pointed out by Kuncel et al. (2007) regarding “domain-specific” and
“domain-general” measures. The GMAT was developed specifically to help business schools in
their admissions processes; it is a domain-specific measure. These measures analyze necessary
prior knowledge or interest in a specific topic (Kuncel et al., 2007). The GRE General Test was
created to measure “basic developed abilities relevant to performance in graduate studies” (Briel,
O’Neill, and Scheuneman, 1993) and to measure “long-term learning of material related to
graduate performance” (Kuncel, Hezlett, and Ones, 2001); it is a domain-general measure.
Domain-general measures “broadly sample prior learning or motivation to learn in general” and
are helpful because prior learning can be predictive of future learning (Kuncel et al., 2007). The
GRE was designed to help many types of programs predict a very general ability to learn; the
GMAT was designed to help a specific set of programs (graduate management programs) select
students with a more specific skill set. This could be one factor that affects the validities of the
two exams.
Exam Uses
GMAC states on their company website that the two main reasons for using the GMAT would be
1) reliability and validity and 2) standard measurement. According to the company, the GMAT
should be used over prior GPAs because “unlike grade point averages – which vary in meaning

13
according to grading standards of each school – GMAT scores provide the standard for
evaluating all test takers.”
GMAC stresses three appropriate uses of GMAT Scores:
1) Select applicants for graduate study in business
2) Select recipients for merit-based financial aid
3) Provide counseling and guidance for potential degree program and
concentration/focus decisions
Staff from GMAC also publish several guidelines for using GMAT scores on their website.
They stress not using the GMAT as the sole admissions criteria by adding in undergraduate
GPAs, work experience, and other data points. They provide free Validity Study Services to
institutions and encourage score-accepting institutions to conduct these to determine validities
specific to their programs. Another interesting recommendation is to not setting a “cutoff score”
or minimum threshold, for admissions decision. GMAC states that “using cutoff scores may
result in discrimination based on sex, age, ethnicity, or any other characteristics.”
An interesting comparison between GMAC and ETS involves score comparisons. GMAC
specifically mentions on several pages that the GMAT should not be compared with other test
scores, specifically the GRE. The site mentions that “in addition to differences between the tests,
the populations taking the tests have different characteristics.” GMAC publishes a “Side By
Side: The GMAT and the GRE” flyer that describes differences relating to the test, the candidate
pool, and services to schools. In the test structure section, GMAC writes that the GMAT is
“developed for business schools, with questions calibrated to candidates who want to attend
management programs”, while the GRE is a “general test, with questions designed for candidates

14
applying to a wide range of graduate programs.”
On the other hand, ETS encourages institutions to accept the GRE in lieu of the GMAT. ETS
and GRE even publish a concordance table for institutions to input a GRE score and get a
GMAT estimate to use for business school admissions purposes. (GMAC claims that this tool
has a standard error of prediction of 66.0 and that this should raise concerns of fairness in using
predicted scores in the admissions process.)
ETS claims that changes were made to the GRE with the revised General Test in 2011 that
changed the content to “be more aligned with the skills needed in today’s business school
programs.” The Verbal Reasoning section changed the emphasis to analyzing/measuring written
material. Antonyms, analogies, and vocabulary sections were eliminated and ideas from these
areas are now incorporated into reading passage sections. The Quantitative Reasoning section
was re-worked to emphasize “data interpretation and real-life scenarios that test takers will
encounter in graduate or business school.” The test score scale was realigned a range of 130-170
on the Verbal/Quantitative sections so that “small score differences are less likely to be
interpreted as meaningful and larger score differences stand out more clearly.”
ETS also communicates that GRE scores should not be used as standalone measures of
admissions decisions and that admissions officers should also consider “undergraduate grade-
point average, letters of recommendation, personal statements, samples of academic or
professional work and more.”
ETS currently offers no option for schools to conduct their own validity studies. (ETS did
provide this service beginning in 1978 but suspended the program in 1990 due to technical
concerns.) When inquiring with ETS about validity studies specific to business programs, I was

15
directed to one article (Kuncel et. al, 2001) and told that there were no current plans for ETS to
examine validity of the GRE specific to MBA programs or business schools.
Test-Taker Statistics
The “Profile of GMAT Candidates, 2007-08 to 2011-12”, published by GMAC, illustrates the
breakdown of GMAT test-takers. In the 2011-12 academic year, 286,529 GMATs were
administered, which is above the 10-year average of 236,744 exams. 57% of the test-takers were
male, but females posted a higher average annual growth rate (4.3%). In other words, the
disparity between male and female GMAT test-takers is shrinking.
The population of test-takers under the age of 24 has an annual average growth rate of 12.8%,
which reflects recent trends of students willing to enter (and admissions officers willing to allow
it) graduate programs right after completion of their undergraduate degree, or with only a year or
two of professional experience. Test-taker volume aged 24-30 remained fairly stagnant with an
average annual growth of 0.8%, and test-taker volume for ages 30+ dropped over the past five
year period.
The intended graduate degree of GMAT test-takers continues to be the MBA; of the 239,053
test-takers in 2011-12 that self-indicated an intended graduate degree path, 63% indicated they
planned to pursue an MBA. The next highest degree path was specialized Master’s in Business
options, which includes M.S. and M.A. degrees (with the exclusion of the Master’s of
Accountancy); 13% of test-takers indicated a desire to pursue those degree paths. 7.5% of
GMAT takers planned to pursue a Master’s of Accountancy degree, with the rest of the test-taker
pool planning to pursue Executive degrees, joint degree options, or business Ph.D. options.

16
Of the 252,246 GMAT test-takers that provided their undergraduate areas of study, 54.5% were
those with a Business or Commerce degree. Engineering degree recipients accounted for 16.4%
of test volume, followed closely by Social Sciences graduates at 15.9%. General science
graduates accounted for 5.6% of test volume, with Humanities graduates and other majors
rounding out the test pool.
ETS released their latest “Snapshot” (ETS, 2013) of GRE test-takers in March of 2013. This
report detailed test-taker volume from August 1, 2011 to June 30, 2012. The August 1, 2011
start date was chosen to capture test-takers that took the new GRE revised General Test that
launched on August 1, 2011. The “Snapshot” reports data for the 471,339 test-takers that had
valid scores on at least one measure of the test (Verbal, Quantitative, or Analytical Writing).
Of the test-takers detailed in the report, 52% were women, 41% were men, and 7% chose not to
provide a gender classification. Performance statistics revealed that women performed better on
the Analytical Writing section, men performed better on the Quantitative Reasoning section, and
ETS researches found similar performance for men and women on the Verbal Reasoning section.
68% of GRE test-takers in the August 2011-June 2012 time frame were United States citizens,
with non-United States test-takers accounting for 28% and 4% choosing not to indicate a
nationality. ETS found that the mean scores of the non-U.S. citizens were substantially higher
on the Quantitative Reasoning section, and the non-U.S. citizens scored lower than U.S. citizens
on the Verbal Reasoning and Analytical Writing sections.
The GRE “Snapshot” report further breaks down test information from U.S. citizens. Ethnic
breakdowns for those that identified as United States citizens were as follows:

17
Table 1. Ethnic Breakdown of GRE Test-Takers, 08/01/11 to 06/30/12
Ethnic Group Men Women No Response Total
American Indian 598 1,099 92 1,789
Asian 7,539 10,541 1,442 19,522
Black 7,580 18,744 1,488 27,812
Hispanic 8,169 14,265 887 23,321
White 79,397 128,934 12,375 220,706
Other 4,759 7,801 1,475 14,035
No Response 2,172 3,905 4,978 11,055
ETS found that the Asian/Asian-American subgroup of U.S. citizens scored higher on-average
than other ethnicities on the Quantitative Reasoning section. White (non-Hispanic) U.S. citizens
were found to score higher on-average than all other ethnic groups on the Verbal Reasoning and
Analytical Writing sections.
Of the 330,253 test-takers that answered a question which asked for their intended objective,
40% planned to pursue a Master’s degree and 29% planned to pursue a doctoral program. Of the
466,674 test-takers that answered a question which asked for their intended graduate major, 27%
responded with “Natural Sciences”, 26% with “Other Fields”, and 14% with “Social Sciences”.
Only 4% of the pool (18,667 test-takers) indicated that they planned to pursue a business degree.

18
ETS found that test-takers planning to pursue “Humanities and Arts” graduate majors had the
highest mean scores on the Verbal Reasoning and Analytical Writing sections, while test-takers
planning to pursue “Engineering” graduate degrees scored the highest mean scores on the
Quantitative Reasoning section.
Of the 466,528 test-takers aged 18+, 85% of the test-taker pool was aged 30 years old or
younger, with 18-22 year olds making up the highest percent (34%) of the pool. ETS found that
on average, older examinees scored better on the Verbal Reasoning than younger test-takers; the
highest mean score (153.5) was found in the over-60 subgroup. The 23-25 year old subgroup
scored the lowest on average (150.4). Younger examinees scored better on average than older
examinees on the Quantitative Reasoning section; the highest mean score (157.3) was found in
the 18-22 year old subgroup. Men outperformed women across all age groups for the
Quantitative Reasoning section. Women were found to outperform men across all age groups for
the Analytical Writing section. Men were found to score consistently across all age groups, but
younger women were found to perform slightly better on average than older women.
In a February 2012 news release, ETS reported that GRE test volume in 2011 was higher than
ever with a 13% increase over 2010. The same release reports that tests in the U.S. increased
10% while the exam base grew 25% internationally. The press release also mentions that tests
from underrepresented minorities, different undergraduate degrees, and students wishing to
pursue an MBA all increased. Another press release from the GRE website mentions that more
women than ever tested in 2011 and that the test-taker pool was the “broadest, most diverse
applicant pool in GRE history.”
In another press release, ETS (2013) reported the second-largest peak testing period (August-

19
December) in its history. GRE test volume in India and China grew by 30%. The press release
also mentions business-school specific data, including that in 2012 “the number of graduate and
business schools using the GRE grew by more than 14 percent”, including many institutions in
Europe and Asia. The press release also claims that “the acceptance of GRE scores by business
schools continues to be one of the most talked about changes in MBA admissions”. Simone
Pollard, Director of Business School Relations at ETS, is quoted saying that “business school
admissions directors are seeing 5 to 20 percent of applications being submitted with GRE scores”
and that “we anticipate the number of GRE test takers applying to business schools will continue
to rise in subsequent admissions cycles”.
Admissions Processes
Standardized exams have long been important tools to assist in the selection process of all types
of graduate programs. GRE scores are required by over 90% of doctoral programs and 81% of
Master’s programs (Norcross, Hanych, and Terranova, 1996). Programs (especially business
programs) that do not require the GRE may instead require the GMAT. Over 1,700 schools
currently use the GMAT for admissions purposes (Kuncel, Crede, and Thomas, 2007). Almost
100% of law/medical schools require the LSAT/MCAT, respectively. Graduate application
requirements may vary, but generally almost all graduate and professional schools require
similar documentation, including an application, undergraduate/graduate transcripts, a
standardized exam score, a “Statement of Purpose” or similar essay, and letters of
recommendation (Olivas, 1999). Applicants are most often screened by their GMAT scores and
final undergraduate GPAs (Wright and Palmer, 1996) and those scores are primary criteria for
admissions officers to make admit/reject decisions in the majority of graduate applications
(Benson, 1983). In fact, the GMAT is by far the most universal part of the application process

20
for ensuring that candidates have the “requisite attitude and preparation to succeed” in and MBA
program (Hancock, 1999).
Proponents of standardized exams champion their use because “scores can be reduced to
shorthand measures, which are extremely useful in sorting out applications” (Olivas, 1999).
Malone, Nelson, and Nelson (2001) identify GRE scores and GPAs as the main quantitative
measures used in admissions decisions for doctoral programs. Standardized exams are used by
admissions personnel to help mitigate chances of admitting students that might fail, and to avoid
denying admission to students that would be able to succeed (Bieker, 1996).
Predictive Validity
Validity is well documented in the current literature according to the Standards for Educational
and Psychological Testing (Young, 2008). There are five major researched validity types:
1) Construct Validity
2) Content Validity
3) Predictive Validity
4) Consequential Validity
5) External Validity
Construct validity is the measurement of how well an instrument measures the abilities that it
should be measuring. Content validity measures how well an instrument measures appropriate
content. Consequential validity measures how well an instrument demonstrates that adverse
consequences are minimal. External validity measures how well an instrument shares expected
relationships with other measures of similar constructs.

21
While all of these are important in the creation and structure of a standardized exam, this
research focuses on predictive validity…how well does an instrument predict success?
Specifically, how well do the GRE and GMAT predict academic success in an MBA program?
Why is predictive validity important? As mentioned above, the majority of admissions decisions
to business graduate programs (MBA programs specifically) are driven by GMAT scores or a
combination of GMAT scores and undergraduate GPA. If the GMAT, and now GRE, are not
valid predictors, MBA programs could run the risk of selecting many applicants that cannot
perform at acceptable levels. Conversely, programs could find themselves rejecting applicants
that are capable of performing at acceptable levels (Bieker, 1996). Given that the MBA degree is
a major entry criteria to upper-level management in many areas of business (Joyce, 2002), it is
important to make sure not only that the exams used for admission to MBA programs are valid,
but also that they are valid for all subgroups. Standardized exam bias against women could have
a “deleterious effect particularly given the increased selectivity of top MBA programs” (Wright
and Bachrach, 2003), as could bias against racial or other subgroups.
Jones (1991) defines predictive validity as the “extent to which a test score can predict
something other than itself”. This study focuses on how well can a GMAT or GRE score predict
graduate grade point average in and MBA program. Knowing the validity of standardized exams
used is important to institutions. Talento-Miller and Rudner (2005) point out that the American
Educational Research Association (AERA), the American Psychological Association (APA), and
the National Council on Measurement in Education (NCME) advise that institutions should
provide predictive validity evidence when using tests. As mentioned above, the Council for
Graduate Schools also advises individual programs to conduct validity studies when using
standardized exams for admissions decisions. Kuncel et. al (2001) states the importance of
22
studying the predictive validity of the GRE “given their widespread use”.
Conceptual Framework
Critics of prior validity studies of the GRE (and other standardized exams) claim that these
studies are a theoretical and do not explain why such exams should predict academic
performance in graduate school (Kuncel et al., 2001).
Several conceptual frameworks previously used in other validity studies will guide this research.
As with Yang and Lu’s (2001) GMAT validity study, Holton’s (1996) model of evaluation
outline factors will be used. Holton (1996) detailed evaluation factors that could be outlined
(measured) that could also determine individual performance and results. Holton (1996)
describes causal relationships among motivational elements, environmental elements,
ability/enabling elements, and outcomes (Yang and Lu, 2001). When considering graduate
business education programs in general (MBA specifically for this study), academic performance
(first-semester or final MBA GPA in this study) can be viewed as a learning outcome and can be
predicted by precedent variables such as prior academic performance measured by undergraduate
GPA or standardized exam scores (Yang and Lu, 2001).
Another framework comes from Wernimont and Campbell’s (1968) work concerning signs and
samples. As described by Kuncel et al. (2007), a sample is a direct measure of a criterion of
interest. A sign is a tool that does not directly measure a criteria but that tends to be associated
with it. Ideally, admissions decisions should focus on samples regarding an applicant’s direct
knowledge, skill, abilities, and other characteristics set by the program as relevant to succeeding
in an MBA program; however, given that samples are generally cost prohibitive and hard to
obtain, signs (such as work experience) are used (Kuncel et al., 2007). Signs are undesirable

23
when it is possible to obtain the desired characteristic without fulfilling the sign (such as “life
experiences” or internships vs. work experience) and when the connection between sign and
desired characteristics is not clear, such as with the predictive validity of prior work experience
for graduate business programs (Kuncel et al., 2007). Signs are more acceptable when they are
robust predictors, when they are more cost-effective than the process of obtaining the sample,
and when it is known that a great deal learning will occur after admission…as should be the case
of any graduate educational program (Kuncel et al., 2007).
The GMAT is considered to be a sign and a sample, given its ability to quantify a large range of
skills specific to an MBA program but also to measure a wide range of prior learning that is not
highly domain specific (Kuncel et al., 2007). Examining other predictors (like undergraduate
GPA) within the sign/sample framework can help establish their source of predictive validity
(Kuncel et al., 2007).
Hunter and Hunter (1984) demonstrate that work performance measures (in our case, graduate
GPA) can be predicted by general cognitive ability measures. Because the GMAT and GRE are
both standardized exams that serve as measures of cognitive ability, exam performance should
predict work (in this case, academic) performance…”one would expect that a student entering
graduate school with more ‘job’ knowledge would perform better than one who had less ‘job’
knowledge” (Kuncel et al., 2001).
Prior GMAT Validity Studies
There is a breadth of literature regarding GMAT predictive validity. Talento-Milller and Rudner
(2005) summarized the results of 273 studies conducted between 1997 and 2004, and Kuncel,

24
Crede, and Thomas (2007) conducted a meta-analysis of over 400 separate studies across 64,583
student cases.
Almost all GMAT validity studies (see Fairfield-Sonn et. Al, 2010; Fish and Wilson, 2009;
Braunstein, 2006; Wright and Bachrach, 2003; Braunstein, 2002; and Yang and Lu, 2001 for
recent examples) use final MBA GPA as their measure of MBA program success.
Rangothaman, Carpenter, and Davies (2009) analyzed GMAT validity for a Master’s of Public
Administration program and also used final graduate GPA as their measure of academic success.
Many studies (Braunstein, 2006; Koys, 2005; Wright and Bachrach, 2003; Hoefer, 2000; Wright
and Palmer, 1997; Bieker, 1996) found the GMAT total, GMAT Verbal sub score, or GMAT
Quantitative sub score to be the strongest individual predictor of academic success for MBA
students.
Other studies do not find the GMAT to be significant. Hancock (1999) did not find a strong
correlation between final MBA GPA and GMAT scores and also found a gender bias; in his
sample, females were outperforming males with similar GMAT scores. Wright and Palmer
(1994) found the GMAT to only be a significant predictor for a restricted range of students; for
those scoring very low or very high on the exam, predictive validity was weakened. As Kuncel,
Crede, and Thomas (2007) state, other researchers (Goodrich, 1975; Grambsch, 1981; Fairtest,
2003) have argued against the usage of the GMAT due to disagreements about its effectiveness.
There is some agreement that GMAT scores, combined with undergraduate GPA, may be the
most significant factors to predicting graduate GPA (Fish and Wilson, 2009). Fish and Wilson
list several authors reaching this conclusion, including Braunstein (2002), Wright and Palmer
(1994 and 1997), Hecht et al. (1989), and Paolillo (1982). Some authors (Braunstein, 2006;

25
Wright and Bachrach, 2003; Bieker, 1996; Carver Jr. and King, 1994) found GMAT total to be
the strongest individual predictor. Others (Hoefer, 2000; Wright and Palmer, 1997) found a
GMAT sub score to be more significant. And others (Fairfield-Sonn et al., 2010; Fish and
Wilson, 2009; Yang and Lu, 2001; Ahmadi, 1997) found undergraduate GPA to be a stronger
predictor than GMAT scores. Koys (2005) found the GMAT/GPA combo to be more significant
that either measure alone.
While GMAT and undergraduate GPA are included in almost every GMAT validity study, other
MBA performance predictors examined vary study-by-study. Yang and Lu (2001), Wright and
Bachrach (2003), Hoefer (2000), Fairfield-Sonn et al. (2010), Braunstein (2006), Bieker (1996),
and Ahmadi (1997) all include gender as an independent variable with varying results. Other
studies include age (Yang and Lu, 2001; Wright and Palmer, 1997; Hoefer, 2000; Fish and
Wilson, 2009; Bieker, 1996; Ahmadi, 1997; Hecht et al., 1989), again with conflicting results on
significance.
Work experience has been included in studies; Carver Jr. and King (1994), Braunstein (2006),
and Adams and Hancock (2002) chose to analyze the amount of post-undergraduate work
experience as a predictor of MBA success. Adams and Hancock (2002) actually found prior
work experience to be a more significant predictor than GMAT or GPA. Carver Jr. and King
(1994) found no excellent predictors in their study but did find GMAT and undergraduate GPA
to be a better predictor than work experience. Braunstein (2006) found work experience to be a
significant predictor for those students that did not have an undergraduate business degree.
Other GMAT validity studies include undergraduate institution (Braunstein, 2006; Ahmadi,
1997; Hoefer, 2000; Ragothaman, Carpenter, and Davies, 2009), undergraduate major (Fish and

26
Wilson, 2009; Ahmadi, 1997; Truitt, 2002), citizenship measures (Koys, 2005; Yang and Lu,
2001; Fish and Wilson, 2009; Hoefer, 2000), and race (Ahmadi, 1997; Bieker, 1996) as possible
variables that can predict MBA academic success. Again, these studies find differing results
regarding predictive validity of these factors.
Most studies to predict graduate business student success use regression analysis to uncover
significant predictors (Fish and Wilson, 2009). Academic researchers have commonly used
discriminant analysis, stepwise regression, and multiple regression (Ragothaman, Carpenter, and
Davies, 2009). Other methods use neural nets (Naik et al., 2004) or ANOVA (Wright and
Palmer, 1994 and 1997). As mentioned above, a wide variety of results are found in these
GMAT studies; Kuncel et al. (2007) reported a low observed validity of -.45 and a high of .76 in
the studies included in that meta-analysis. This wide range of validity contributes to some of the
controversy regarding GMAT (and other standardized exam) usage for admissions purposes
(Zwick, 2002).
Meta-analysis may provide the best evidence for GMAT validity. Kuncel et al. (2007) looked at
over 402 samples including 64,000+ students and indeed found “considerable support for the
validity of the GMAT. Across all criteria and moderator groups examined, the results indicate
that the GMAT is predictive of success.” The authors also found that “the evidence we obtained
suggests that the GMAT is not strongly moderated by gender or academic background
variables…these findings are important, because they indicate that using the GMAT does indeed
have utility for selecting students into graduate schools of business.” Interestingly, this study
also found that GMAT total score alone was more predictive than undergraduate GPA, but that
“nonetheless, the results suggest that the best approach for admitting students is the combination
of GMAT and UGPA data.” Oh et al. reanalyzed Kuncel’s data set in 2008 and corrected for

27
range restriction, which “allows for more accurate calibrations of the validities of various
admission and selection tools.” These authors found that Kuncel’s group under-estimated the
GMAT’s predictive validity by 7% and surmised that “the GMAT does better than we thought in
predicting future academic performance and persistence in business schools.” (Oh et al., 2008)
An interesting point made by the authors is that current predictive validities for other
standardized exams (including the GRE) are also probably underestimated due to not having
corrected for range restrictions; according to them, this recent evidence shows the GMAT to be
even more valid than previously believed, and should be given greater, not less, weight in MBA
admissions decisions (Oh et al., 2008).
Prior GRE Validity Studies
Given that there currently is no research that examines GRE validity for MBA programs, I
thought it would be helpful to review some GRE literature regarding validity in other types of
programs.
Similar to GMAT research, there are conflicting findings regarding GRE validity. There are
studies that find the GRE (or GRE subscores) to be predictive of success (Sampson and Boyer,
2001; Young, 2008; Holt et al., 2006; Kuncel, Hezlett, and Ones, 2001) and studies that suggest
little to no usage of the GRE for admissions purposes (Katz et al., 2009; Feeley, Williams, and
Wise, 2005; Sternberg and Williams, 1997). As with the GMAT, a wide range of relationships
between GRE scores and final graduate GPA have been observed (Holt et al., 2006).
Different disciplines have produced different findings regarding GRE validity. Engineering
(Holt et al., 2006), psychology (Fenster et al., 2001), and veterinary program (Powers, 2004)
researchers have generally supported the use of the GRE for admissions (Holt et al., 2006).

28
Other disciplines, including physics and journalism, have advised admissions committees against
using the GRE for selection (Holt et al., 2006). In an eleven-year study of Master’s and Ph.D.
students studying Communications, Feeley, Williams, and Wise (2005) found It is not
uncommon to find researchers from the same field reach differing conclusions regarding GRE
validity.
Some programs are coming up with new ways to use the GRE as an admissions tool. Luce
(2011) describes a Physician’s Assistant (PA) graduate program that used GRE data to set
thresholds for admissible students to reduce the number of academically at-risk students entering
the program. And some programs are eliminating the GRE as an admissions requirement; Katz et
al. (2009) details the University of Washington School of Nursing’s decision to eliminate the
GRE due to it becoming a “large barrier to application” that outweighed the “limited benefit of
predicting 5-8% of explained variance in GPA”.
Racial basis is also a possible factor to consider when reviewing GRE validity. Sampson and
Boyer (2001) found that GRE Verbal subscores were the most significant predictor of academic
success as measured by first-year graduate GPA, but that it was not found to be as significant for
non-traditional aged students, women, or minorities. The authors state that the GRE’s
“usefulness in predicting minority students’ success in graduate education has not been
established without equivocation” (Sampson and Boyer, 2001).
As with the GMAT, the most relevant GRE research to this study may be a meta-analysis.
Kuncel, Hezlett, and Ones (2001) conducted a comprehensive meta-analysis of GRE validity
from 1,753 samples including 82,659 graduate students. They found that all three GRE
subscores (Verbal, Quantitative, and Analytical Writing) were “generalizably valid predictors” of

29
1st-year graduate GPA and final graduate GPA as well as other less studied outcomes including
future faculty ratings and citation counts (Kuncel et al., 2001). An important distinction made in
the study is that the GRE subject tests were consistently better predictors than the GRE general
test scores.
The only GMAT/GRE direct comparison I could find in the literature was from Nilsson (1995).
The author took 60 students from the same institution that were in various degree programs;
subjects that had taken the GRE for admissions purposes were enrolled in a variety of graduate
programs but NOT business programs. The GMAT subjects were all from graduate business
programs. Nilsson (1995) found that for this small sample of students, the GRE was more
predictive of graduate GPA than the GMAT.

30
Chapter 3 - Data and Methods
Data Source
Data was requested directly from 11 institutions across the United States with full-time MBA
programs that have chosen to accept both the GMAT and GRE for admissions purposes.
Requests for data were also sent through national listservs; three institutions agreed to participate
on an anonymous basis. All three institutions are public, state flagship institutions located in the
southeastern United States and all three are located in the top 75 U.S. News and World Report
rankings for business schools. Data was collected from classes entering 2006 or later that
graduated no later than August 2013. The following table includes a brief description of the
sample:

31
Table 2. Sample Descriptive Statistics.
School A School B School C Totals
GMAT Takers
GRE Takers
GMAT Takers
GRE Takers
GMAT Takers
GRE Takers
GMAT Takers
GRE Takers
Number 299 134 255 7 52 2 606 143
Male/Female Percentage
74% M 62% M 74% M 1% ND
71% M 60% M 100% M
73% M 0.5% ND
63% M
Average Age at Enrollment
23.9 24.6 27.3 29.4 28.6 29.5 25.8 26.5
Average Undergrad.
GPA
3.46 3.45 3.30 3.35 3.25 2.87 3.38 3.44
Prior Work Exp (months)
13.4 19.0 51.6 46.7 34.4 23.0 31.5 20.4
Business Undergrad.
Degree %age
58% 36% 46% 29% 48% 0% 52% 35%
Avg. Score 630 1147 (574 adj.)
639 1280 (640 adj.)
624 1080 (540 adj.
633 1153 (577 adj.)
Avg. Total %ile Rank
72% 53% 73% 73% 69% 35% 72% 54%
Seven MBA students were eliminated from the sample due to not completing their course of
study (and having no final MBA GPA). Also, six GRE test-takers were eliminated due to having
used the new GRE revised General Test; all other GRE takers used the original GRE General
Test, which was in place until August 2011. Given the similarity of institution type, program
type (full-time MBA programs), and other demographic similarities, the data set is treated as one
aggregate sample for the analysis. The number of student cases included (749) would make this
one of the larger single validity studies on record; out of all the prior research cited in this study,
only two (Hoefer, 2000 and Fairfield-Sonn et al., 2010) had larger data sets.
It is important to point out that the majority of GRE takers came from one institution (School A),

32
and that GRE takers (143 cases) only represent 19% of the total sample; while a low percentage,
this does reflect trends reported by Kaplan and ETS regarding the low percentage of GRE test-
takers that are ultimately admitted to MBA programs. There were a larger percentage of females
in the GRE test-taker pool, and GRE test-takers were less likely to be business majors. On
average, GRE test-takers in our pool were slightly older than the GMAT sample (26.5 years old
to 25.8), possessed slightly higher undergraduate GPA’s (3.44 to 3.38), but scored almost 20
percentiles lower than their GMAT counterparts.
Independent samples t-tests were conducted to analyze some differences between means between
the GMAT and GRE group. (GRE total scores were converted to GMAT equivalents by
dividing the total score by 2; on this scale a perfect 1600 GRE is equivalent to a perfect 800
GMAT, a 1200 GRE is equivalent to a 600 GMAT, etc.) The GMAT group had an average
score of 633, and the GRE group had a converted average of 577; on average, GRE takers
performed 57 points worse (on a GMAT score scale) on their exam. With a 2-tailed significance
value of .000, this difference in adjusted exam score was found to be statistically significant;
differences in the GMAT and GRE group are likely to not be due to chance and could have
something to do with exam choice. The GRE takers in this sample performed significantly
worse on their exam than the GMAT takers in the sample did on their exam.
While a relatively small difference was observed in the means of undergraduate GPA’s between
our GMAT and GRE subgroups, this difference was not found to be statistically significant.
(The independent samples t-test reported a 2-tailed significance value of .131.) It is important to
note that the GRE group performed significantly poorer on the standardized exam than the
GMAT group but did not have significantly different undergraduate academic performance. This
might demonstrate that other factors beyond the knowledge gained from an undergraduate degree

33
program (and level of academic success in a degree program) play a role in success on
standardized exams.
The GRE test-takers were on average a year younger than their GMAT test-taker counterparts,
and the observed difference between average ages of the two test-taker subgroups was
statistically significant (.004 2-tailed sig. value). The GMAT subgroup also had around 11
months more work experience on average, and this difference was also found to be statistically
significant (.001 2-tailed sig. value).
The GRE test-takers were significantly younger and had significantly less work experience
within this sample; this could be in-part due to historical MBA admissions trends, where post-
graduate work experience is expected from applicants. Typically, at least two years of post-
graduate experience are required (or expected for most of an admitted class). It could be that
those students that chose to take the GMAT knew that they were only interested in MBA-type
graduate programs and knew the importance of post-graduate work experience in those selection
processes. Applicants that self-selected to take the GRE could easily have been interested in a
variety of graduate program offerings and may have not valued post-graduate work experience as
much. MBA admissions officers may have also been more lax on requirements for their GRE
test-takers; given that there are demonstrated significant differences in exam performance and
work experience, it could be that GRE applicants were admitted with class diversity interests
(such as racial/ethnic diversity, gender diversity, or diversity of undergraduate program) or other
interests in mind.

34
Dependent Variables
This study seeks to examine the predictive validities of the GMA T and GRE for business
programs. This study also seeks to examine whether the type of entrance exam taken, along with
other factors, can influence the future academic performance of students in MBA programs.
Final graduate GPA and first-year graduate GPA are the most commonly used dependent
variables in GMAT and GRE predictive validity studies (Kuncel et al., 2001). Consistent with
other GMAT/GRE validity studies (Fairfield-Sonn et. Al, 2010; Fish and Wilson, 2009;
Braunstein, 2006; Wright and Bachrach, 2003; Braunstein, 2002; Yang and Lu, 2001; Katz et al.,
2009), final graduate GPA is defined as a measure of academic success and is a dependent
variable of this study. However, not all MBA programs have the same curriculum throughout.
In fact, most full-time MBA programs allow students to select a “concentration” or “focus”
during the second year that can lead to students having very different class schedules while
earning the same MBA degree. However, almost all programs have students take a core
curriculum during the first semester that consists of the same course load. Because of this
variance in overall curriculum, I chose to also analyze first-semester MBA GPA as a dependent
variable as well as the final MBA program GPA to see how the predictive validity of the
GMAT/GRE holds up throughout an MBA program. Unfortunately, School B could not submit
first-semester GPA information, so there is more data available for final GPA analysis than first-
semester GPA analysis.
Other dependent variables could have been studied. Some prior studies have used
comprehensive exam scores as a dependent variable; however, MBA students from the schools
within our sample are not required to take a comprehensive exam to graduate. Degree attainment

35
and time-to-degree has also been used, but most students that begin a full-time MBA program
ultimately graduate, and in our study all students included did graduate. As stated by Kuncel,
Hezlett, and Ones (2001), attainment and time-to-degree can be a function of many different
factors as well as events beyond the control of the student, and could therefore be imperfect
measures of academic success.
Most graduate schools impose a 3.0 minimum GPA to be eligible for graduation, so this restricts
the range of final MBA GPA available; in our sample, only five students had a sub-3.0 final
graduating GPA. This range restriction in final GPA is another reason to use first-semester GPA
as a dependent variable; first-semester performance can vary widely, and our sample had a range
of 2.00-4.00 GPA.
Independent Variables
Given the current research base and literature cited earlier regarding determinants of academic
performance, I collected data on several variables to serve as independent variables. Following
is a list of all data collected along with citations relevant to each variable:
-GMAT and GRE Total Score: To measure the predictive validity of a standardized exam on
graduate academic performance, it is obvious that exam score must be included in the analysis.
Several studies, including Yang and Lu (2001), Hoefer (2000), Hancock (1999), and Wright and
Palmer (1994 and 1997) have analyzed the predictive ability of GMAT section subscores. Many
previous validity studies including Sampson and Boyer (2001), Feeley, Williams and Wise
(2005), and Luce (2011) analyzed GRE subscores. GMAT and GRE subscore data was sought
in the data collection phase but all schools could not provide it, so the predictive validity of
GMAT and GRE subscores is not studied in this analysis.

36
GMAT and GRE total scores were selected as the sole exam performance measures. Adams and
Hancock (2000), Ahmadi (1997), Bieker (1996), Gropper (2007), and others have previously
studied the impact of GMAT total score on MBA academic performance (as judged by final
MBA GPA). GRE validity studies typically focus on sub-scores; this could be because ETS
specifically advises against using “any measure involving a summation of verbal, quantitative,
analytical, analytical score, or any subtest of these scores without first conducting and
documenting a validity study for each measure” (Young, 2008). However, admissions decisions
are clearly being made off of the combined GRE score, as indicated by the data I was able to
collect from admissions offices, so it is important to analyze the predictive validity of the GRE
total score on MBA academic performance.
For the subgroup comparisons, GRE total score was used as is (maximum score of 1600). For
the final regression analysis, as mentioned above, GRE total scores were converted to GMAT
equivalents by dividing the total score by 2; on this scale a perfect 1600 GRE is equivalent to a
perfect 800 GMAT, a 1200 GRE is equivalent to a 600 GMAT, etc.
-Undergraduate GPA: Undergraduate GPA has been found to be a significant predictor of
graduate academic success in most studies (Fish & Wilson, 2009), and undergraduate GPA and
standardized exam score are the factors traditionally most important to those making admissions
decisions for MBA programs (Braunstein, 2006). Some authors (Fairfield-Sonn et al., 2010;
Fish and Wilson, 2009; Yang & Lu, 2001; Ahmadi, 1997) have found undergraduate GPA to be
the strongest single predictor of graduate GPA. Others (Braunstein, 2006; Wright and Bachrach,
2003; Bieker, 1996) found GPA to be significant, but not as significant as the GMAT. And Koys
(2005) found the GMAT/GPA combo to be more significant than either measure alone.

37
-MBA/Admissions Score: Sobol (1984) wrote about building an admissions “scale” evaluating
non-academic measures such as campus involvement, references, and goals. This scale was
found to help the predictive formula used for admissions to become stronger. School A uses a
type of overall admissions score and was able to submit data regarding the comprehensive
“MBA Score” used in their admissions process. This score includes the student GMAT or GRE
score and the GPA, but also includes other “scores” for admissions requirements such as the
entrance essay, interview, resume, and letters of recommendation.
-AACSB Score: The Association to Advance Collegiate Schools of Business, or the AACSB, is
a major accrediting body for business schools. According to the AACSB website, “AACSB
Accreditation Standards are used as the basis to evaluate a business school’s mission, operations,
faculty qualifications and contributions, programs, and other critical areas”. The AACSB has
recommended using the “AACSB Score” as a factor for making business school admissions, and
this score is used by the three institutions participating in this study. The formula for the
AACSB Score involves multiplying an applicant’s GPA by 200 and then adding that to the
applicant’s GMAT score. (For example, an applicant with a 3.0 GPA and a 650 GMAT would
have an AACSB score of 1250.) Admissions using GRE scores must first convert the GRE score
to a GMAT equivalent using a concordance chart. Since this score takes into account the two
most common predictors of graduate GPA, I thought it prudent to analyze whether or not it was
more effective than entrance exam score or undergraduate GPA alone. Because the AACSB and
MBA Scores are scales that encompass test score and undergraduate GPA, they are not included
in any multiple regression models; only the correlations and bivariate regression impacts are
analyzed.

38
-Undergraduate Institution: Hoefer (2000), Fish and Wilson (2009), and Braunstein (2006) all
included whether or not a student completed their graduate degree at the same institution as their
undergraduate degree in their predictive validity studies. Studies thus far have not shown this to
be a significant predictor of graduate success.
Institutional type could be important, particularly for business undergraduate students. If a
student that received his undergraduate degree from a business school and then enrolls in that
same business school for graduate study, that student could very well be more comfortable with
the surroundings and perhaps the faculty members of the institution and could be expected to
have an easier transition to MBA coursework than those that come from outside the institution.
Most MBA programs are stricter on applicants from their own institution, so the students that are
ultimately admitted to their same institution’s MBA program could be more academically
prepared or qualified on average than their counterparts in the program.
-Undergraduate Major: Ahmadi (1997), Braunstein (2002 and 2006), Fish and Wilson (2009),
Graham (1991), Carver Jr. and King (1994) and Adams and Hancock (2000) all analyzed
whether the type of undergraduate major received could influence graduate GPA in business
programs. This is important, because while there are many similarities in undergraduate
curriculums, there can be very different types of training and academic demands within different
undergraduate major areas (Kuncel et al., 2001). MBA students with business undergraduate
degrees may have more knowledge about core business principles which could give them an
advantage over non-business undergraduate degree recipients (especially during the first-
semester where core business concepts are typically taught). And differences from major
subgroups may have nothing to do with academic content; students with non-business
undergraduate degrees may enter an MBA program lacking confidence and feeling

39
disadvantaged when compared to their cohort members that do possess business degrees, which
could affect their academic performance in an MBA program (Braunstein, 2006).
The majority of these studies grouped undergraduate majors into two categories of “business”
and “non-business” majors. Braunstein (2002) and Adams and Hancock (2000) both found a
negative correlation between possessing a business undergraduate degree and graduate business
GPA. Braunstein (2006) found differences in the significance of predictive factors for business
and non-business undergraduate degree holders (age and work experience were found to be
significant predictors and stronger predictors than the GMAT for non-business applicants). In
contrast, Ahmadi (1997) and Carver Jr. and King (1994) found no relationship between
undergraduate major and graduate academic performance. Graham (1991) analyzed the
differences between students holding a bachelor of science degree vs. a bachelor of arts degree,
but did not find that distinction to be significant.
I am interested in the variation amongst the “non-business” majors, so this study will split
students into three major groups: those with business undergraduate degrees; those with
undergraduate degrees in a science, technology, engineering, or mathematics (STEM) field; or
all other undergraduate majors. Given the recent rise of STEM students applying to MBA
programs, and the evidence that students from STEM fields (or other quantitatively-heavy
backgrounds) may perform better on standardized exams, it seems prudent to examine these
different major groups.
-Gender: Yang and Lu (2001), Wright and Bachrach (2003), Bieker (1996), Hoefer (2000),
Fairfield-Sonn et al. (2010), Ahmadi (1997), Deckro and Wounderberg (1977), Hancock (2000),
Paolilio (1982), Graham (1991), Carver Jr. and King (1994), and Braunstein (2006) all included
40
gender and its potential effects on graduate performance in their studies. Wright and Bachrach
(2003) specifically tested for prediction bias of the GMAT against females, and did find
statistically significant evidence of a “bias effect” in the GMAT and stated that “although men
and women tended to have similar levels of objective success during the course of their MBA
programs, the GMAT scores reported by the students in this group would have under predicted
the success of the female students”. The authors go on to illustrate how “the elite schools are
forced to choose among applicants with very high GMAT scores” and “to the extent that women
with slightly lower GMAT scores may be rejected in favor of men with higher scores, any
possible bias in the GMAT would have a negative effect on women” (Wright and Bachrach,
2003). An older study by Deckro and Wounderberg (1997) also found evidence of GMAT
underprediction towards females with regards to MBA academic performance. Braunstein
(2006) found evidence that the GMAT was biased against women without an effect on graduate
academic performance, indicating again possible underprediction for females.
Other studies (Carver Jr. and King, 1994; Paolilo, 1982; Graham, 1991; Ahmadi, 1997; Yang
and Lu, 2001) did not find gender to be a statistically significant predictor of graduate student
success, and other overall studies “find that gender is an insignificant factor to predicting
graduate success” (Fish and Wilson, 2009). Given the differences in the literature, I chose to
examine gender as a predictor of academic success and possible effects on GMAT/GRE
predictive validity.
-Age: Bieker (1996), Hoefer (2000), Fish and Wilson (2009), Ahmadi (1997), Yang and Lu
(2001), and Wright and Palmer (1997) all included student age in their studies analyzing factors
that could predict graduate school performance. Academic research theorizes that the
performance of younger students can be significantly different than that of older students

41
(Bieker, 1996). Students that are older are “more likely to differ from more traditional students
in work experience, time away from school, and family obligations” (Kuncel et al., 2001). Not
only could older students academic skills decrease over time, but increased obligations might
also negatively affect their academic performance in an MBA program. However, if substantial
work experience is being gained while waiting to start an MBA program, lessons learned in the
“real world” could translate to a leg up in the classroom, so it will be interesting to see how age
predicts MBA success within our sample. While the ETS/GMAC data cited earlier does show
that exam performance (as defined by exam score) may decline with age, these prior studies
generally found student age to not have a statistically significant influence on graduate academic
performance. Braunstein (2006) did find student age to be significant specifically for non-
business undergraduate students.
-Race/Ethnicity: Bieker (1996) and Ahmadi (1997) analyzed student race/ethnicity as a
predictive factor of graduate school. Ahmadi (1997) did not find race to have a statistically
significant impact on graduate academic performance, while Bieker (1996) did find that the
GMAT did predict differently for Black and White students and that “the finding of a statistically
significant difference in the relationship between the Graduate Management Admissions Test
and the graduate grade point average for Black and White students suggests that some care must
be exercised when using the Graduate Management Admissions Test for admissions
decisions…a given score on the Graduate Management Admissions Test may not be indicative
of the same level of potential academic performance in graduate management education for all
subgroups”.
Zwick (2002) also presents evidence of racial bias (as well as gender bias) on the GMAT and
other standardized exams; Black/African-American and Latino test-takers tend to score lower

42
than Whites and Asians. “Stereotype threat” can also potentially affect graduate performance.
Stereotype threat, or the “threat of being viewed through the lens of a negative stereotype, or the
fear of doing something that would inadvertently confirm that stereotype”, can produce stress
and affect academic performance (Zwick, 2002). Minorities that are known to score poorer on
the GMAT/GRE than their counterparts, such as Black/African-Americans and Latinos, could be
experiencing stereotype threat in their MBA programs which could impact their academic
performance as measured by graduate GPA.
For the purposes of this study, students are classified as: White; Black or African-American;
Asian or Pacific Islander; Hispanic; American Indian; or Not Disclosed (several students did not
choose to disclose their race on their graduate applications, so that data was not collected).
-Prior Work Experience: Most MBA programs require or recommend post-graduate work
experience (Kuncel, Crede, and Thomas, 2007). Programs do this in part because they believe it
helps students understand the business environment and can lead to students having a better
grasp of the academic content within an MBA program (Dreher & Ryan, 2004). Professors
enjoy having MBA students with work experience that can “relate concepts and situations
discussed in class to their current or past place of employment…this type of exchange clearly
benefits the entire class, perhaps especially those students who may be wondering why class time
is being devoted to a particular topic” (Adams & Hancock, 2000). However, the predictive
validity of work experience on academic performance has rarely been studied. Adams and
Hancock (2000) did study just that and found post-undergraduate work experience to be a
statistically significant predictor of MBA final GPA and found that it was a stronger predictor
than undergraduate GPA or GMAT scores.

43
It is important to remember that prior work experience is really a “sign” and not a direct
measurement of any knowledge (a “sample); prior work experience “is measuring something that
is only associated with the actual characteristics desired by the program and not directly
quantifying the desired characteristics” (Kuncel et al., 2007).
-Citizenship: Given the enhanced growth of international students in American MBA programs,
some studies choose to analyze the significance of citizenship or other international factor (Fish
and Wilson, 2009). In theory, non-native English speakers could be at a disadvantage when
taking standardized exams written in English (Kuncel, Hezlett, and Ones, 2001). Students
moving to the United States from another country to start their MBA program could face a
steeper learning curve and language barriers within the classroom, which could impact their
graduate performance.
Yang and Lu (2001) used a student’s native language (English or non-English) as a proxy for
nationality, but found it to be an insignificant predictor. Fish and Wilson (2009) and Everett and
Armstrong (1990) included a student’s nationality as a possible predictive factor for graduate
GPA and also found country of origin to be insignificant. This study will classify students based
on possessing United States citizenship or not.
Analysis
Correlation and regression analysis techniques were employed to examine the data. The primary
goal was to ascertain the predictive power of the GMAT and GRE in relation to the proxies for
academic success (first-semester and final MBA GPAs). The secondary goal is to examine the
relationships between the other independent variables used in our analysis to establish the best
possible predictive model for MBA academic success.

44
First, Pearson correlations will be calculated between some of our predictor variables and
standardized exam score. This will help illustrate possible bias on the standardized exams and
can explain possible differences in predictive validity amongst subgroups. Then Pearson
correlations will be calculated for all of our independent variables and both dependent variables
for both the GMAT and GRE test groups. Significant results are displayed in Table 4.
A series of independent sample t-tests was conducted to compare means between various
predictor variables with the GMAT and GRE subgroup. This was done to illustrate any
significant differences in means of students from different racial/ethnic backgrounds, academic
backgrounds, gender, and other factors. These results are summarized in Tables 6 and 7.
Second, bivariate regression models were created for each of the test-taker subgroup and both
first-semester and final GPA. These results are displayed in Tables 7 through 10.
Finally, various multivariate regression models were estimated. Models were conducted
beginning with the test score variable and then subsequent models added demographic variables
and academic background variables. Regression models were established for both the GMAT
and GRE subgroups with first-semester GPA as the dependent variable; these results are
displayed in Table 11 and Table 12. Tables 13 and 14 summarize the results from the two
subgroups with final MBA GPA as the dependent variable.

45
Chapter 4 - Results and Discussion
Data was split into two groups; those that had taken the GMAT and those that had taken the
GRE. Descriptive statistics for both subgroups are as follows:
Descriptive Statistics
Table 3. Descriptive Statistics
GMAT Test-Takers GRE Test-Takers Number of Students 606 143 School Breakdown 299-School A
255-School B 52-School C
134-School A 7-School B 2-School C
Male/Female Ratio 73% M 26.5% F, 0.5% Not Declared
63% M 37% F
Race/Ethnicity Breakdown
76.8%-White; 7.8% Asian or Pacific Islander; 4.5% Black or African-American; 1.3% Hispanic; 0.7% Native American; 8.9% Not Declared
81.8%-White; 5.6% Asian or Pacific Islander; 7.0% Black or African-American; 4.9% Hispanic; 0.7% Not Declared
Undergraduate Major Breakdown
52% Business; 23% STEM; 23% Other; 2% Unknown
35% Business; 25.9% STEM; 39.1% Other
Pursued MBA at Same Institution as Completed Undergraduate?
36.6%-Yes 59.4%-Yes
Undergraduate GPA Range
0.780-4.090 (4-point scale)
2.400-4.000 (4-point scale)
Undergraduate GPA Average
3.380 (4-point scale)
3.44 (4-point scale)
Average Student Age at Enrollment
25.8 years old 26.5 years old
Exam Total Score Range
460-770 (23rd percentile-99th percentile)
900-1500 (21st percentile-98th percentile)
Exam Total Score Average
633 (approx. 72nd percentile)
1153 (577 adjusted) (approx. 54th percentile)
1st Semester MBA GPA Range
2.400-4.000 (4-point scale)
2.000-4.000 (4-point scale)
1st Semester MBA 3.633 3.438

46
GPA Average (4-point scale) (4-point scale) Final MBA GPA Range
2.660-4.000 (4-point scale)
2.833-4.000 (4-point scale)
Final MBA GPA Average
3.637 (4-point scale)
3.571 (4-point scale)
81% of the sample is GMAT test-takers, but the 19% representation of GRE takers is substantial
given the current amount of GRE test-takers admitted to MBA programs. Most of the GRE test-
takers in our sample come from School A. The GMAT sample has a higher percentage of males
and is slightly younger than the GRE sample. The GMAT sample is slightly more diverse with
regards to race/ethnicity. More students in the GMAT sample are business majors (52% vs.
35%) and more GRE test-takers had majors in the “other” category (39.1%-23%); STEM major
representation was similar in both subsets. The GMAT subgroup had a slightly lower
undergraduate GPA average but performed at a much higher level on their standardized exam
than the GRE test-takers (72nd percentile average score vs. 54th percentile average). GMAT test
takers fared almost 5% better on average during their first-semester but only fared 1.7% better in
final MBA GPA. This would make sense given that the MBA group contained almost 20% more
business undergraduate degree recipients and the fact that first-semester curriculums consist of
all introductory business courses. The small difference between the two subgroups in final GPA
makes sense given the variety of classes offered during the second year of study. It is interesting
to note that such a dramatic difference in exam percentile rank between the two exam groups
only yields a 1.7% average difference in final MBA GPA.
As mentioned previously, independent samples t-tests were conducted to analyze some
differences in means between the GMAT and GRE group. The most striking difference in the
populations was the performance on the standardized exam. The GMAT group had an average

47
score of 633, and the GRE group had a converted average of 577; on average, GRE takers
performed 57 points worse (on a GMAT score scale) on their exam. With a 2-tailed significance
value of .000, this difference in adjusted exam score was found to be statistically significant. In
other words, the GRE takers in this sample performed significantly worse on their exam than the
GMAT takers in the sample did on their exam.
The difference in undergraduate academic performance (as measured by final undergraduate
GPA) was not found to be statistically significant. (The independent samples t-test reported a 2-
tailed significance value of .131.) Again, the GRE group performed significantly poorer on the
standardized exam than the GMAT group but did not have significantly different undergraduate
academic performance. This demonstrates why it is important to analyze other possible
predictive factors beyond UGPA and exam score; clearly other factors beyond the knowledge
gained from an undergraduate degree program (and level of academic success in a degree
program) could play a role in success on standardized exams, and thus could also explain some
of the variance in graduate school performance. The GRE test-takers were significantly younger
and had significantly less work experience within this sample.
There were significant differences observed with regards to MBA program performance between
the two subgroups. The difference between GMAT and GRE test-takers in first-semester GPA
was found to be statistically significant at the .01 level; GMAT test-takers outscored their GRE
peers on average by two-tenths of a point in first-semester MBA GPA. The difference in final
MBA GPA’s was found to be statistically significant at the .05 level. GMAT test-takers finished
with a final MBA GPA that was on average five-hundredths of a point higher than GRE test-
takers.

48
Relationships Between Predictors and Standardized Exam Performance
Given the previous literature cited with regards to possible standardized exam bias and possible
academic performance differences between subgroups, it was important to analyze correlations
between some of our demographic and academic variables and actual standardized exam
performance on the GMAT or GRE. Relevant correlations are displayed in the following table:
Table 4. Correlation Coefficients (with Exam and UGPA data)
Correlation Coefficients with GMAT/GRE Total Score
Correlation Coefficients with Undergraduate GPA
Predictor Variable GMAT Subgroup
GRE Subgroup
GMAT Subgroup
GRE Subgroup
GMAT Total Score (GMATtsc) 1 N/A .117** N/A
GRE Total Score (GREtsc) N/A 1 N/A -.097
Undergraduate GPA (UGPA) .117** -.097 1 1
Undergraduate Major-Business (UGmajorB) (1 if yes, 0 if no)
-.240** -.134 .045 .052
Undergraduate Major-STEM (UGmajorS) (1 if yes, 0 if no)
.178** .166* -.062 -.047
Gender (1 if male, 0 if female) (Gender) .073 .254** -.170** -.198*
Age, in Years, at Enrollment (Age) .021 .173* -.304** -.252**
Race-White (RaceEthW) (1 if yes, 0 if no) -.001 .096 .147** .098
Race-Black or African-American (RaceEthB) (1 if yes, 0 if no)
-.128** -.233** -.088* -.033
Race-Asian or Pacific Islander (RaceEthA) (1 if yes, 0 if no)
.108* .174* -.088* -.118

49
Undergraduate Institution (UGinst) (1 if same as graduate, 0 if different)
-.151** -.181* .155** .117
Prior Post-Graduate Work Experience, in months (PGworkxp)
.039 .045 -.219** -.168*
U.S. Citizenship (UScitz) (1 if yes, 0 if no) -.219** -.090 .041 .093
**Correlation is significant at the 0.01 level (2-tailed). *Correlation is significant at the 0.05 level (2-tailed).
Overall undergraduate GPA was found to have only a slight positive correlation with
performance on the GMAT as measured by the total GMAT score, but the relationship was
statistically significant at the .01 level. Overall undergraduate GPA was found to have a very
slight negative correlation with GRE performance, but the relationship was not significant. This
lack of a strong correlation between undergraduate GPA and standardized exam score, the two
major quantitative measures used in graduate admissions decisions, could demonstrate that the
two measures measure different skills or knowledge bases. If this is the case, it is important that
the two measures be used in tandem with one another in making admissions decisions. It is
important to note that restriction of range may be influencing these findings, as we are dealing
with a very small sample of students who are admitted to MBA programs. As mentioned
throughout this study, MBA programs are typically very selective, and as seen in our sample, the
average undergraduate GPA is around a 3.4 for both the GMAT and GRE test-takers subsets.
The total sample of MBA applicants that took the GRE and GMAT would encompass a much
larger range of undergraduate GPA ranges and test score performance, which might yield a
stronger relationship between undergraduate GPA and standardized exam performance.
Black and African American students in our sample were found to have a slight negative
relationship with GMAT scores (significant at .01), and Asian or Pacific Islander students were

50
found to have a slight positive relationship with GMAT performance (significant at .05). Similar
results were seen in our GRE sample, as Black students were found to have a statistically
significant (at the .01 level) negative relationship with GRE total performance, and Asian
students were found to have a slightly smaller significant (at the .05 level) positive relationship
with GRE total scores. These are not surprising given the aggregate standardized exam data that
shows that Asian students, on average, perform slightly better than their peers, while Black or
African American students perform more poorly, on average, on the GMAT and GRE.
Undergraduate major also appeared to have a relationship with GMAT performance. Students
that majored in a business discipline as an undergraduate were found to have a mild negative
relationship with GMAT performance, and students that majored in a STEM field were found to
have a slight positive relationship with GMAT scores. Both relationships were significant at the
.01 level. While the STEM relationship might be expected (given the quantitative-heavy course
loads in most STEM majors, and the links between quantitative skills and higher exam
performance), it is surprising that completing a business degree had a negative relationship with
GMAT performance. Perhaps business undergraduate students are imbued with a false sense of
confidence with regards to their GMAT performance chances and do not prepare as much as they
should. There were also observed significant correlations with undergraduate major type and
GRE performance as STEM students had a slight positive relationship that was significant at the
.01 level. Business majors had a slight negative relationship that was not significant.
There was a statistically significant negative relationship between GMAT total score and
students that chose to pursue their MBA at the same institution as their undergraduate degree.
The GRE subgroup, like the GMAT subgroup, also had a significant negative relationship
between choosing to pursue your MBA at the same institution as your undergraduate degree and

51
exam performance; this was significant at the .05 level. There could be several reasons both
subgroups shared this relationship; students that did poorly on the exams might not believe that
they can get in at other schools and choose to apply and enroll at the school they are familiar and
comfortable with. Another possibility is that students might feel like they have an edge in the
application process if they are applying as an alumnus of a university, and therefore choose not
to prepare as hard for their standardized exam.
Being a United States citizen was also found to have a slight negative relationship on GMAT
performance. In other words, in our sample, international students performed slightly better than
domestic students. Given that most MBA programs, including the programs included in this
sample, admit relatively small percentages of international students, it is not surprising that the
international students admitted would have relatively higher GMAT scores than the domestic
students.
Gender, age, and prior work experience were not found to have statistically significant
correlations with GMAT total score. However, gender and age were significant in the GRE
subgroup of the sample. Males had a slight positive correlation, significant at the .01 level, and
age was slightly positive at the .05 level. Prior work experience was not found to have a
significant relationship with GRE scores.
Relationships Between Predictors and MBA Academic Performance
Correlations were calculated between all predictor variables for both subgroups; relevant
correlations between predictor variables and dependent variables were as follows:

52
Table 5. Correlation Coefficients (with MBA Academic Performance)
Correlation Coefficients with 1st Semester MBA GPA (SemGPA)
Correlation Coefficients with Final MBA GPA (Final GPA)
Predictor Variable GMAT Subgroup
GRE Subgroup
GMAT Subgroup
GRE Subgroup
GMAT Total Score (GMATtsc) .296** N/A .210** N/A
GRE Total Score (GREtsc) N/A .124 N/A .236**
Undergraduate GPA (UGPA) .356** .360** .417** .345**
Undergraduate Major-Business (UGmajorB) (1 if yes, 0 if no)
.035 .095 .061 .100
Undergraduate Major-STEM (UGmajorS) (1 if yes, 0 if no)
.012 .077 -.010 .058
Gender (1 if male, 0 if female) (Gender) -.034 -.017 -.039 .020
Age, in Years, at Enrollment (Age) -.111* .050 -.168** .071
Race-White (RaceEthW) (1 if yes, 0 if no) .036 .084 .116** .157
Race-Black or African-American (RaceEthB) (1 if yes, 0 if no)
-.066 -.078 -.143** -.163
Race-Asian or Pacific Islander (RaceEthA) (1 if yes, 0 if no)
-.021 .007 -.064 -.007
Undergraduate Institution (UGinst) (1 if same as graduate, 0 if different)
-.073 -.154 -.039 -.093
U.S. Citizenship (UScitz) (1 if yes, 0 if no) -.064 -.049 .014 -.088
AACSB Score (AACSBsc) .452** .400** .450** .465**
MBA Score (MBAsc) .416** .382** .431** .373**
**Correlation is significant at the 0.01 level (2-tailed). *Correlation is significant at the 0.05 level (2-tailed).

53
The GMAT exam had a statistically significant positive correlation with both first-semester and
final MBA GPA; both correlations were significant at the .01 level. The GRE had a slight
positive correlation with first-semester MBA GPA, but it was not found to be statistically
significant. The correlation between GRE total score and final MBA GPA was positive and was
found to be statistically significant at the .01 level. The correlation between GRE total score and
final MBA GPA was slightly larger than the correlation between GMAT total score and final
GPA.
Analyzing the other predictive variables, undergraduate GPA had statistically strong positive
correlations with both first-semester and final MBA GPA for both the GMAT and GRE subsets;
all correlations were significant at the .01 level. The correlations observed for undergraduate
GPA and MBA academic performance were stronger than those observed between standardized
exam score and MBA academic performance.
There was little to no correlation between undergraduate major and MBA academic
performance. Observed correlations for both the business major group and the STEM major
group were found to be statistically insignificant with relation to both first-semester and final
MBA GPA.
Gender was not found to have a significant correlation with either first-semester or final MBA
performance. Neither was undergraduate institution or U.S. citizenship; all correlations for those
variables were statistically in significant.
For the GMAT subgroup, student age was found to have a slight negative correlation with
academic performance. This correlation was significant at the .05 level for first-semester GPA
and significant at the .01 level when analyzed with final MBA GPA. Age did not have a

54
statistically significant correlation within the GRE subgroup.
Race generally did not have significant correlations with MBA performance, but there were
significant correlations observed for the Race-White and Race-Black or African American
students in the GMAT subgroup. White students had a slight positive correlation with final
MBA GPA, while Black or African-American students had a slight negative correlation with
final MBA GPA. Both correlations were significant at the .01 level.
The strongest correlations with MBA academic performance were observed with the AACSB
score variable. Within both subgroups, the AACSB variable had the highest single positive
correlation among all predictor variables, and had a higher correlation than either the
standardized exam or undergraduate GPA alone. All correlations between AACSB score and
the dependent variables were significant at the .01 level.
Only one school submitted comprehensive “MBA score” data (205 from GMAT takers and 77
from GRE takers); that data was analyzed and MBA score was also found to have strong positive
correlations with MBA academic performance across the board. All correlations were observed
to be significant at the .01 level. For both test-taker subgroups, the correlations with MBA score
were slightly smaller than those observed for AACSB score, but larger than correlations
observed with all other variables.
To further exam the data and possible significant differences between subgroups and
undergraduate performance, standardized exam performance, and MBA performance,
independent samples t-tests were conducted. Results follow in Tables 6 and 7.

55
Table 6. Independent Samples T-Tests for GMAT Subgroup
Is difference in means statistically significant (at .05)? Grouping Variable (Diff. in means)
UGPA GMAT Score 1st Semester MBA GPA
Final MBA GPA
RaceEthW
Yes (3.408-3.234)
No (630.29-630.4)
No (3.639-3.604)
Yes (3.656-3.576)
RaceEthB
Yes (3.212-3.389)
Yes (591.26-631.91)
No (3.478-3.647)
Yes (3.484-3.652)
UGmajorB No (3.398-3.359)
Yes (620.56-647.14)
No (3.650-3.628)
No (3.653-3.623)
UGmajorS No (3.328-3.393)
Yes (650.71-627.60)
No (3.648-3.640)
No (3.635-3.640)
Gender Yes (3.335-3.500)
No (635.57-626.48)
No (3.626-3.650)
No (3.631-3.653)
UScitz No (3.386-3.330)
Yes (628.22-662.09)
No (3.628-3.693)
No (3.639-3.629)
Table 7. Independent Samples T-Test for GRE Subgroup
Is difference in means statistically significant (at .05)? Grouping Variable (Diff. in means)
UGPA GRE Score 1st Semester MBA GPA
Final MBA GPA
RaceEthW
No (3.457-3.368)
No (1158.12-1126.80)
No (3.454-3.376)
No (3.606-3.490)
RaceEthB
No (3.400-3.445)
Yes (1047.00-1160.61)
No (3.340-3.447)
Yes (3.419-3.599)
UGmajorB No (3.463-3.425)
No (1130.40-1165.38)
No (3.483-3.413)
No (3.620-3.560)
UGmajorS No (3.411-3.448)
Yes (1188.11-1140.94)
No (3.483-3.421)
No (3.609-3.572)
Gender Yes (3.386-3.529)
Yes (1177.33-1112.08)
No (3.433-3.445)
No (3.586-3.574)
UScitz No (3.448-3.327)
No (1149.92-1191.82)
No (3.433-3.500)
No (3.574-3.668)
These tests do show some significant differences within both the GRE and GMAT subgroups of

56
our sample. For GMAT takers, there was a significance difference in the undergraduate GPAs
and final MBA GPAs of White and Black/African-American students. White students had a
significantly higher undergraduate GPA than other students in the sample, while Black students
had a significantly lower undergraduate GPA compared to all others in the sample. Likewise,
White students that were GMAT test-takers had a significantly higher final MBA GPA when
compared to all other students, while Black students that were GMAT test-takers had a
significantly lower final MBA GPA than all other students. Black or African-American students
also scored significantly lower on the GMAT than their counterparts within the sample; Black
students, on average, scored 40 points lower on their GMAT total score than students of other
racial/ethnic backgrounds.
For GRE takers, White students did not have statistically significant differences in undergraduate
GPA or GRE total score. Black students did not have statistically significant undergraduate
GPAs but did score significantly lower on the GRE (almost 113 points lower) than other
students. Black students that were GRE takers also had a significantly lower final MBA GPA
than other students in the sample. It appears that within our sample, for some reason less-
academically qualified (as measured by undergraduate GPA and standardized exam score) Black
or African-American students are being admitted to the MBA programs participating in this
study. Given that, it is not surprising that Black students from either exam group graduate with a
significantly lower final MBA GPA. This could be due to the fact that there are less total
numbers of Black or African-American potential students in MBA pipelines, and so competition
for these students is fiercer among top programs. It is clear that MBA programs must make sure
that academic support programs and other student service options are in place to make sure that
all students have a chance to succeed.

57
The type of undergraduate major possessed presented a significant difference in GMAT and
GRE score. Students with an undergraduate business degree had a significantly lower GMAT
score on average (621 total score compared to 647) than students from other majors, while
students with a STEM undergraduate degree had a significantly larger GMAT score (651-628)
than other GMAT takers within the sample. For the GRE takers, there was not a significant
difference amongst business majors, but students from a STEM undergraduate program scored
significantly higher than their counterparts from other types of degree programs. While major
type showed a statistically significant difference in exam score for both GMAT and GRE test-
takers, there was not a significant difference in first-semester or final MBA GPA with regards to
undergraduate major for either the GMAT or GRE test-takers.
In both the GMAT and GRE subsets, males had significantly lower undergraduate GPAs than
females. While there was not a statistically significant difference on average between males and
females in the GMAT test-taker subset, male students did score significantly higher on the GRE
than females. While there are clear differences in measures of academic preparedness between
males and females in our sample, there were not statistically significant differences in average 1st
semester or final MBA GPAs.
Non-U.S. citizens scored significantly higher than U.S. citizens within our sample of GMAT
test-takers, but there was no significant difference within the GRE subset. There was no
significant difference in either 1st semester or final MBA GPA with regards to U.S. citizenship
within our sample.
It is important to note that while there were many differences between subgroups between
average undergraduate GPAs and standardized exam scores, no demographic or academic factors

58
demonstrated a significant difference in first-semester MBA GPA. It seems that no matter what
the background, students perform about the same during the first semester. Whether this is due
to the academic structure of first semesters in MBA programs (typically introductory core
business courses), programs choosing to “ease in” students during the first semester, or other
motivational/external factors is yet to be seen.
Bivariate Regression – 1st Semester GPA as Dependent Variable
Since it is shown from the correlational analysis and t-tests that there are some statistically
significant differences between subsets of our sample with regards to standardized exam
performance and with regards to MBA academic performance, the next step in this study was to
analyze the predictive abilities of single variables. Bivariate regression was conducted for the
both the GMAT and GRE subsets; first with 1st semester MBA GPA as the dependent variable,
and then with final MBA GPA as the dependent variable. For the GRE subgroup, GRE total
score was analyzed on its own scale and also after converting the GRE total scores to the GMAT
score scale (GRE Adjusted Score).

59
Table 8. GMAT Subgroup Bivariate Regression w/SemGPA as Dependent Variable
Predictor Variable R-Square β Constant Significance Level T-Value GMAT Total Score .088 .002 2.549 .000 5.797 Undergraduate GPA .127 .269 2.709 .000 7.121 AACSB Score .205 .001 1.763 .000 9.472 MBA Score .173 .001 1.819 .000 6.536 Age .012 -.010 3.875 .039 -2.068 Undergraduate Inst. (1 if same, 0 if different)
.005 -.045 3.659 .174 -1.361
U.S. Citizenship (1 if yes, 0 if no)
.004 -.065 3.693 .235 -1.191
Previous Work Exp. In Months
.000 -5.217 3.639 .932 -.085
Gender .001 -.024 3.650 .525 -.636 Race-White .001 .035 3.604 .502 .672 Race-Black or African American
.004 -.159 3.637 .221 -1.277
Race-Asian or Pacific Islander
.000 -.023 3.637 .703 -.381
Major-Business .001 .022 3.628 .514 .653 Major-STEM .000 .009 3.639 .827 .219
Table 9. GRE Subgroup Bivariate Regression w/SemGPA as Dependent Variable
Predictor Variable R-Square β Constant Significance Level T-Value GRE Total Score .015 .000 3.018 .149 1.450 GRE Adjusted Score .015 .001 3.018 .149 1.450 Undergraduate GPA .130 .378 2.135 .000 4.467 AACSB Score .160 .002 1.371 .000 5.047 MBA Score .146 .001 1.242 .001 3.605 Undergraduate Inst. (1 if same, 0 if different)
.024 -.112 3.504 .074 -1.803
U.S. Citizenship (1 if yes, 0 if no)
.002 -.067 3.500 .569 -.570
Previous Work Exp. In Months
.000 .000 3.433 .815 .235
Age .002 .005 3.308 .567 .574

60
Gender .000 -.012 3.445 .847 -.193 Race-White .007 .078 3.376 .331 .976 Race-Black or African American
.006 -.107 3.447 .366 -.907
Race-Asian or Pacific Islander
.000 .011 3.439 .931 .086
Major-Business .009 .071 3.413 .273 1.100 Major-STEM .006 .062 3.421 .374 .892
According to the regression analysis, for the sample of all GMAT test-takers included in this
study, the GMAT total score is a significant predictor of first-semester MBA GPA, explaining
for 8.8% of the variance. The partial effect of .002 for the GMAT Total Score variable means
that for every point increase on the GMAT, first-semester GPA increases by .002 of a point. An
easier way to think about that would be that for every 100 point jump in GMAT score, first-
semester MBA GPA is predicted to increase by two-tenths of a point. In contrast, the GRE total
score variable was not found to be a valid predictor of first-semester MBA performance. The
GRE total score model is not statistically significant and only accounted for 1.5% of variance in
first-semester GPA within the GRE subgroup. Converting the GRE total score to the GMAT
score scale did not change the results of the bivariate model.
Undergraduate GPA is also a significant predictor of first-semester MBA performance for the
GMAT test-takers and can explain 12.7% of the variance in first-semester MBA GPA. The
partial effect shows that every point difference in undergraduate GPA can predict a .269
difference in first-semester GPA.
Within the GRE test-taker subgroup, undergraduate GPA was also found to be a significant
predictor and accounted for 13.0% of the variance in first-semester GPA. For the GRE takers, a
one-point difference in undergraduate GPA is projected to on average account for almost a four-

61
tenths of a point difference in first-semester GPA. In other words, the difference in a 3.0 GPA
undergraduate student and a 4.0 GPA undergraduate student could be a 3.27 first-semester GPA
and a 3.65 first-semester GPA.
Age, while not significant at the .000 level, was significant above the 95% confidence level for
our GMAT subgroup. Every additional year of age predicted a one-hundredth of a point drop in
first-semester GPA. Age was not found to be a significant predictor of first-semester GPA
within the GRE subgroup.
The other variables found to be statistically significant predictors of first-semester GPA for the
GMAT subgroup were the AACSB Score and the MBA Score variables. As a reminder, the
AACSB score formula is: (GPA*200) + GMAT Total Score (Verbal + Quantitative). For an
MBA applicant with a GPA of 3.6 and a GMAT total score of 590, their AACSB Score would
be: (3.6*200) + 590 = 1310. The AACSB score is a significant predictor and explains 20.5% of
the variance in first-semester MBA GPA (more than double that of GMAT total alone). The
MBA Score, which was only collected for part of the sample, was also a significant predictor and
was found to account for 17.3% of the variance in first-semester MBA GPA for the GMAT test-
takers.
As with the GMAT subgroup, both the AACSB score and MBA score variables were significant
(at the 99% level) predictors for first-semester GPA within our GRE subgroup. AACSB score
accounted for 16.0% of the variance while MBA score accounted for 14.6% of the variance in
first-semester GPA; this was slightly higher than the variance accounted for by undergraduate
GPA alone within the GRE subgroup. Given that the GRE was not shown to be a significant
predictor of first-semester GPA, it is not surprising that the variance accounted for by AACSB
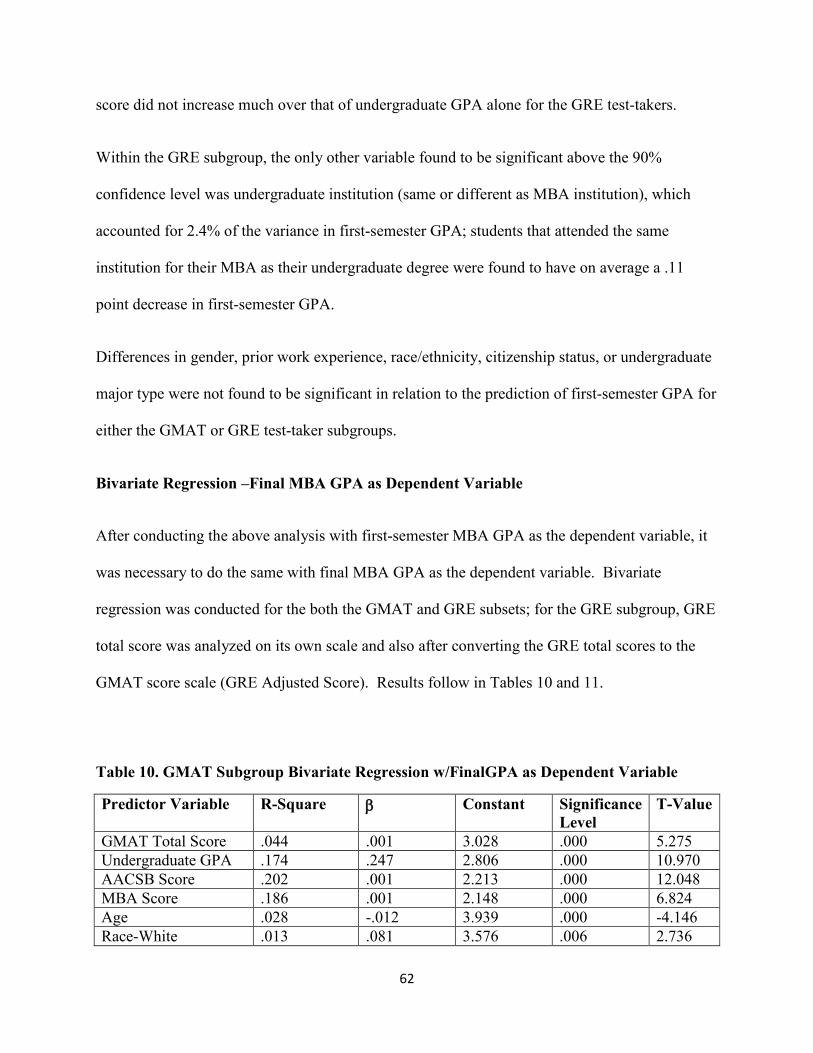
62
score did not increase much over that of undergraduate GPA alone for the GRE test-takers.
Within the GRE subgroup, the only other variable found to be significant above the 90%
confidence level was undergraduate institution (same or different as MBA institution), which
accounted for 2.4% of the variance in first-semester GPA; students that attended the same
institution for their MBA as their undergraduate degree were found to have on average a .11
point decrease in first-semester GPA.
Differences in gender, prior work experience, race/ethnicity, citizenship status, or undergraduate
major type were not found to be significant in relation to the prediction of first-semester GPA for
either the GMAT or GRE test-taker subgroups.
Bivariate Regression –Final MBA GPA as Dependent Variable
After conducting the above analysis with first-semester MBA GPA as the dependent variable, it
was necessary to do the same with final MBA GPA as the dependent variable. Bivariate
regression was conducted for the both the GMAT and GRE subsets; for the GRE subgroup, GRE
total score was analyzed on its own scale and also after converting the GRE total scores to the
GMAT score scale (GRE Adjusted Score). Results follow in Tables 10 and 11.
Table 10. GMAT Subgroup Bivariate Regression w/FinalGPA as Dependent Variable
Predictor Variable R-Square β Constant Significance Level
T-Value
GMAT Total Score .044 .001 3.028 .000 5.275 Undergraduate GPA .174 .247 2.806 .000 10.970 AACSB Score .202 .001 2.213 .000 12.048 MBA Score .186 .001 2.148 .000 6.824 Age .028 -.012 3.939 .000 -4.146 Race-White .013 .081 3.576 .006 2.736

63
Race-Black or African American
.020 -.168 .001 -3.390
Race-Asian or Pacific Islander
.004 -.058 3.649 .136 -1.493
Previous Work Exp. In Months
.010 -.001 3.661 .015 -2.430
Undergraduate Inst. (1 if same, 0 if different)
.002 .020 3.631 .341 .953
U.S. Citizenship (1 if yes, 0 if no)
.000 .010 3.629 .731 .344
Gender .002 -.022 3.653 .342 -.951 Major-Business .004 .031 3.623 .136 1.491 Major-STEM .000 -.006 3.641 .808 -.243
Table 11. GRE Subgroup Bivariate Regression w/FinalGPA as Dependent Variable
Predictor Variable R-Square β Constant Significance Level
T-Value
GRE Total Score .056 .001 2.957 .004 2.890 GRE Adjusted Score .056 .001 2.957 .004 2.890 Undergraduate GPA .119 .281 2.611 .000 4.343 AACSB Score .216 .001 1.692 .000 6.210 MBA Score .139 .001 1.980 .001 3.504 Undergraduate Inst. (1 if same, 0 if different)
.009 -.054 3.613 .269 -1.109
U.S. Citizenship (1 if yes, 0 if no)
.008 -.094 3.668 .295 -1.050
Previous Work Exp. In Months
.002 .000 3.573 .586 .546
Age .005 .006 3.438 .402 .840 Gender .000 .012 3.574 .812 .238 Race-White .025 .116 3.490 .062 1.882 Race-Black or African American
.026 -.179 3.598 .053 -1.951
Race-Asian or Pacific Islander
.000 -.009 3.586 .934 -.083
Major-Business .010 .059 3.561 .237 1.187 Major-STEM .003 .038 3.572 .494 .686
According to the bivariate regression analysis, for the sample of all GMAT test-takers included
in this study, the GMAT total score is a significant predictor of final MBA GPA and accounts for
64
4.4% of final MBA GPA. It is worth noting that the partial effect drops to .001 for GMATtsc in
the final GPA model (compared to the first-semester GPA model); a 100 point increase on the
GMAT only predicts a tenth of a point increase in final MBA GPA.
This analysis shows that the GRE total score is a statistically significant predictor of final MBA
performance and can explain 5.6% of the variance in final MBA GPA. It is worth noting that
this is 1.2% higher explained variance than the model for the GMAT test-taker subgroup that
used GMAT total score as the independent variable for predicting final MBA GPA. A hundred-
point increase on the GRE would project on average a one-tenth of a point increase in final MBA
GPA (as is the case with a hundred-point increase on the GMAT). Given that the GRE General
Test is on a scale of 0-1600 while the GMAT has a scale of 0-800, it is “easier” to move 100
points on the GRE than the GMAT. In other words, 100-point increase on the GRE is equal to a
50-point increase on the GMAT.
Undergraduate GPA was a statistically significant predictor of final MBA GPA for both
subgroups. Within our GMAT subgroup, undergraduate GPA explained 17.4% of the variance
in final MBA GPA, almost four times the explained variance of final MBA GPA when compared
to the GMAT total score alone. Within the GRE subgroup, undergraduate GPA accounted for
11.9% of the variance, making it almost twice as strong a predictor as GRE total score alone.
For both subgroups, the AACSB score variable was the strongest single predictor of final MBA
GPA. Within the GMAT test-taker sample, AACSB score accounted for 20.2% of the variance
in final MBA GPA, more explained variance than either GMAT or undergraduate GPA alone.
AACSB score accounted for 21.6% of the variance in final MBA GPA for our GRE test-takers.
65
MBA score was also a statistically significant predictor for both test-taker subgroups, accounting
for 18.6% of the variance in final MBA GPA for the GMAT subgroup and 13.9% of the variance
within the GRE subgroup. It is interesting to observe that adding other information to the
AACSB score (as the MBA score formula does) such as interview ratings and external
recommendations actually decreases the predictive power within both subgroups.
No other variables were significant standalone predictors of final MBA GPA within our GRE
test-taker subgroup. However, in contrast to the prediction of first-semester GPA, age,
race/ethnicity, and previous work experience were found to be significant (98% confidence or
higher) for predicting final MBA GPA. White students were predicted to score almost a tenth of
a point higher in final MBA GPA than other students, while Black or African American students
were predicted to score almost two-tenths of a point lower than other students. Every year of age
was predicted to account for a decline of one-hundredth of a point in final MBA GPA in our
GMAT test-taker subset; so ten years of age could account for a one-tenth drop in final MBA
GPA. Interestingly, previous work experience had a negative partial effect on final GPA within
our GMAT subgroup; each month of work experience predicted a .001 drop in final GPA.
Expanding that out, each year of post-undergraduate work experience predicted a drop of .012 in
final GPA. With work experience predicting a decrease and not increase in final GPA,
admissions officers may evaluate the emphasis placed (if any) on prior work experience as an
admissions criterion.
Citizenship, undergraduate major type, and gender were not found to be significant standalone
predictors of final MBA GPA within the GMAT subgroup.

66
Multivariate Regression
As discussed throughout this study and as evidenced in the literature, there are many factors that
may influence graduate academic performance that may also influence the predictive validity of
standardized exams. To examine how these other factors may influence the predictive validity
of the GMAT and the GRE, a series of multiple regression models was conducted. The first
model, already discussed, consists simply of the exam score (GMAT or GRE). The second
model incorporates demographic factors (race/ethnicity, gender, age, and U.S. citizenship). The
third model adds academic factors (undergraduate GPA, undergraduate major type, and
undergraduate institution type) and prior work experience. Results with first-semester MBA
GPA as the dependent variable follow in Table 12 (for the GMAT subgroup) and Table 13 (for
the GRE subgroup), and results with final MBA GPA as the dependent variable are found in
Table 14 (GMAT subgroup) and Table 15 (GRE Subgroup).
Table 12. GMAT Subgroup Multivariate Regression - 1st Semester MBA GPA as DV
Variable Model 1** (R-Square: .088) (Constant: 2.549)
Model 2** (R-Square: .102) (Constant: 2.973)
Model 3** (R-Square: .221) (Constant: 2.276)
GMAT Total Score
B: .002** T-Ratio: 5.797
B: .002** T-Ratio: 5.200
B: .001** T-Ratio: 4.781
Race-White --- B: -.011 T-Ratio: -.062
B: -.030 T-Ratio: -.186
Race-Black or AA
--- B: -.118 T-Ratio: -.563
B: -.160 T-Ratio: -.805
Race-Asian or PI
--- B: -.097 T-Ratio: -.051
B: -.129 T-Ratio: -.724
Race-Hispanic --- B: .048 T-Ratio: .208
B: .038 T-Ratio: .173
Age --- B: -.009* T-Ratio: -2.036
B: -.013 T-Ratio: -1.859
Gender --- B: -.055 T-Ratio: -1.480
B: .000 T-Ratio: -.013
U.S. Citizenship (1-yes, 0-no)
--- B: -.052 T-Ratio: -.734
B: -.079 T-Ratio: -1.190

67
Undergraduate GPA
--- -- B: .242** T-Ratio: 5.787
Major-Business --- -- B: .081* T-Ratio: 2.010
Major-STEM --- -- B: .064 T-Ratio: 1.300
UG Inst. (1-same, 0-diff.)
--- -- B: -.074* T-Ratio: -2.152
Previous Work Exp. In Months
--- -- B: .002* T-Ratio: 2.251
**Significant at .01 *Significant at .05
All three models using the GMAT total score variable were statistically significant. Adding
demographic data to the GMAT total score variable alone increased the explained variance in
first semester GPA from 8.8% in Model 1 to 10.2% in Model 2. In Model 2, only the GMAT
total score variable was significant at the 99% confidence level; the partial effect of GMAT total
score did not change after controlling for demographics. Age was significant at .05 and was the
only other significant variable in Model 2. Model 3 added academic variables as well as the
variable for months of post-undergraduate work experience obtained. Model 3 was also
statistically significant and explained 22.1% of the variance in first-semester MBA GPA for our
GMAT test-taker subset. This more than doubled the variance explained by Model 2. The
variables for GMAT total score and undergraduate GPA were the only variables significant at the
.01 level; however, the dummy variables for business undergraduates and undergraduate
institution type were significant at the .05 level, as was the variable for post-undergraduate work
experience. Controlling for other factors, business undergraduates were estimated to do slightly
better than their counterparts during the first semester, as were students that did not enter the
MBA program at their previous undergraduate institution. Controlling for the additional
variables added into Model 3 did lower the partial effect of the GMAT total score variable by
half (.002 to .001). In other words, after controlling for the demographic, academic, and work

68
experience data available, each 100-point increase in GMAT total score would project a one-
tenth of a point higher GPA in the first semester. Results for the GRE subgroup follow in Table
13.
Table 13. GRE Subgroup Multivariate Regression - 1st Semester MBA GPA as DV
Variable Model 1 (R-Square: .015) (Constant: 3.018)
Model 2 (R-Square: .035) (Constant: 2.878)
Model 3** (R-Square: .272) (Constant: .718)
GRE Adjusted Score
B: .000 T-Ratio: 1.450
B: .000 T-Ratio: 1.273
B: .000 T-Ratio: 1.055
Race-White --- B: .153 T-Ratio: .977
B: .186 T-Ratio: 1.315
Race-Black or AA
--- B: .067 T-Ratio: .363
B: .056 T-Ratio: .338
Race-Asian or PI
--- B: .025 T-Ratio: .125
B: .003 T-Ratio: .014
Age --- B: .007 T-Ratio: .660
B: .034* T-Ratio: 2.150
Gender --- B: -.036 T-Ratio: -.512
B: -.027 T-Ratio: -.406
U.S. Citizenship (1-yes, 0-no)
--- B: -.136 T-Ratio: -.958
B: -.160 T-Ratio: -1.249
Undergraduate GPA
--- -- B: .461** T-Ratio: 5.311
Major-Business --- -- B: .202** T-Ratio: 2.927
Major-STEM --- -- B: .200** T-Ratio: 2.605
UG Inst. (1-same, 0-diff.)
--- -- B: -.137* T-Ratio: -2.126
Previous Work Exp. In Months
--- -- B: -.002 T-Ratio: -1.537
**Significant at .01 *Significant at .05
As mentioned previously, the GRE adjusted score variable alone was not a statistically
significant predictor of first-semester MBA academic success. The model explained 1.5% of the
variance in first-semester GPA but was not significant, and the partial effect of GRE adjusted
score was too small to quantify. Model 2 improves the explained variance (slightly) by adding in

69
demographic data, but again the model is not statistically significant, and none of the individual
variables were significant either. Adding in the other academic data variables available, Model 3
was significant at the .01 level and explained 27.2% of the variance in first-semester MBA GPA
for our GRE test-taker subgroup. GRE adjusted score was not a significant predictor.
Undergraduate GPA and the two dummy variables for business undergraduates and STEM
undergraduates were all significant at the .01 level. The partial effect for undergraduate GPA in
Model 3 for this subset is almost double that of the partial effect of undergraduate GPA in the
GMAT subset; for GRE test takers, a one-point increase in undergraduate GPA projects almost a
half-point difference in first-semester MBA GPA. Controlling for other factors, both business
undergraduates and STEM undergraduates are estimated to score about two-tenths of a point
higher in their first-semester MBA GPA. That may seem like a minimal distinction, but the
difference in a 3.1 GPA and a 3.3 GPA can mean maintaining or losing a scholarship, as the
difference in a 2.9 and 3.1 GPA can mean falling into or coming off of academic probation.
Age and institution type were also significant predictors within Model 3, but they were
significant at the .05 level. The positive partial effect for age can be interpreted as every
additional ten years of age resulting in a three-tenths of a point increase in first-semester GPA
among the GRE test-taker subset. In contrast to the GMAT subgroup, work experience was not
significant within the GRE test-takers. The dummy variables for race/ethnicity were not
significant within either subgroup.
Regression models were also conducted with MBA final GPA as the dependent variable. Results
for the GMAT subgroup are found in Table 14.

70
Table 14. GMAT Subgroup Multivariate Regression - Final MBA GPA as DV Variable Model 1**
(R-Square: .044) (Constant: 3.028)
Model 2** (R-Square: .109) (Constant: 3.404)
Model 3** (R-Square: .238) (Constant: 2.651)
GMAT Total Score
B: .001** T-Ratio: 5.275
B: .001** T-Ratio: 5.372
B: .001** T-Ratio: 4.540
Race-White --- B: -.041 T-Ratio: -.347
B: -.090 T-Ratio: -.807
Race-Black or AA
--- B: -.181 T-Ratio: -1.424
B: -.200 T-Ratio: -1.682
Race-Asian or PI
--- B: -.152 T-Ratio: -1.203
B: -.177 T-Ratio: -1.495
Race-Hispanic --- B: .028 T-Ratio: .188
B: .022 T-Ratio: .158
Age --- B: -.011** T-Ratio: -3.711
B: -.007 T-Ratio: -1.429
Gender --- B: -.044 T-Ratio: -1.868
B: .002 T-Ratio: .099
U.S. Citizenship (1-yes, 0-no)
--- B: -.045 T-Ratio: -1.094
B: -.051 T-Ratio: -1.305
Undergraduate GPA
--- -- B: .217** T-Ratio: 8.890
Major-Business --- -- B: .060** T-Ratio: 2.477
Major-STEM --- -- B: .053 T-Ratio: 1.795
UG Inst. (1-same, 0-diff.)
--- -- B: -.030 T-Ratio: -1.390
Previous Work Exp. In Months
--- -- B: .000 T-Ratio: .972
**Significant at .01 *Significant at .05
All three models using the GMAT as a predictor of final MBA GPA are significant at the .01
level. Alone, the GMAT exam explains 4.4% of the variance in final MBA GPA. The partial
effect of .001 means that every hundred point increase in the GMAT estimates a one-tenth
increase in final MBA GPA. Controlling for demographic factors in Model 2 improves the
explained variance by more than double; Model 2 explains 10.9% of the variance in final MBA
GPA. In this model, only the GMAT total score and the variable for student age were significant

71
(both at .01). The partial effect for the GMAT score variable remained constant at .001;
controlling for demographic factors did not alter the partial effect. The negative partial effect for
age illustrates that every year of age estimates a .01 decrease in final MBA GPA; a ten-year
increase in age would estimate an average decrease of one-tenth of a point of final MBA GPA.
Adding academic background factors in Model 3 again more than doubled the power of the
model; this model explained 23.8% of the variance in final MBA GPA for our GMAT test-taker
subgroup. Controlling for demographic factors and academic background variables did not
change the predictive ability of the GMAT; the GMAT total score variable was still significant at
.01 and still measured a partial effect of .001. After controlling for academic factors and
demographic data, a hundred point increase in the GMAT still estimates a one-tenth increase in
final MBA GPA.
In Model 3, the age variable became insignificant after controlling for academic factors. GMAT
total score, undergraduate GPA, and the dummy variable for business were the three variables
significant in Model 3; all three variables were significant at the .01 level. It is important to
point out the positive partial effect of students that obtained business degrees. Our independent
sample t-tests showed that there was a significant difference with regards to undergraduate
degree type in our GMAT test-taker sample; students with business degrees scored statistically
significantly lower (621 on average for business students compared to 647 on average for other
majors) on the GMAT. But, as the regression model shows, students with an undergraduate
business degree are expected to do slightly better with regards to final MBA GPA than their
peers from other undergraduate backgrounds. This could mean that the GMAT exam
underpredicts for business undergraduates; lower scores on the GMAT (on average) for the
business undergrad group did not result in lower final MBA GPAs. More likely, this just points

72
to the fact that students with a business undergraduate degree are more prepared for and
comfortable with the type of coursework that they encounter in a graduate business program.
This point of view would seem to be strengthened by looking at the variable for STEM
undergraduate degree holders. There was a statistically significant difference in means for the
STEM undergraduates in our GMAT subgroup; the STEM students performed 22 points higher
(650-628) than their counterparts in the sample, but did not demonstrate a significant difference
in final MBA GPAs, and the dummy variable for STEM degrees was not significant in the
regression. Higher GMAT scores for the STEM degree recipients, on average, did not result in
higher final MBA GPAs. While the GMAT might be placing more emphasis on the quantitative
skills typically possessed by STEM students, resulting in higher GMAT scores, clearly those
scores do not necessarily translate to better academic success in an MBA program. While
business students may be scoring lower, on average, the importance of the coursework obtained
in undergraduate business programs should not be overlooked.
Results for the GRE subgroup regression models with final MBA GPA as the dependent variable
follow in Table 15.

73
Table 15. GRE Subgroup Multivariate Regression - Final MBA GPA as DV
Variable Model 1** (R-Square: .056) (Constant: 2.957)
Model 2* (R-Square: .100) (Constant: 2.945)
Model 3** (R-Square: .274) (Constant: 1.481)
GRE Total Score
B: .001** T-Ratio: 2.890
B: .000* T-Ratio: 2.363
B: .000* T-Ratio: 2.192
Race-White --- B: .158 T-Ratio: .213
B: .169 T-Ratio: 1.559
Race-Black or AA
--- B: .013 T-Ratio: .095
B: .003 T-Ratio: .023
Race-Asian or PI
--- B: .001 T-Ratio: .005
B: .014 T-Ratio: .105
Age --- B: .007 T-Ratio: .573
B: .020 T-Ratio: 1.703
Gender --- B: -.014 T-Ratio: -.261
B: .009 T-Ratio: .183
U.S. Citizenship (1-yes, 0-no)
--- B: -.155 T-Ratio: -1.536
B: -.079 T-Ratio: -1.584
Undergraduate GPA
--- -- B: .319** T-Ratio: 4.967
Major-Business --- -- B: .121* T-Ratio: 2.287
Major-STEM --- -- B: .098 T-Ratio: 1.673
UG Inst. (1-same, 0-diff.)
--- -- B: -.057 T-Ratio: -1.173
Previous Work Exp. In Months
--- -- B: -.001 T-Ratio: -1.037
**Significant at .01 *Significant at .05
GRE score alone was a statistically significant predictor of final MBA GPA, explaining 5.6% of
the variance in final MBA GPA. This explained variance was higher than that of the GMAT
alone (5.6% to 4.4%). The model was significant at the .01 level. Adding demographic factors
to the model (Model 2) did improve the explained variance to 10.0%; however, Model 2 was less
significant overall. Only the GRE score variable was significant (at the .05 level), however the
partial effect was apparently too small to measure.

74
Controlling for academic background data did improve the predictive power of the regression;
Model 3 explained 27.4% of the variance in final MBA GPA for the GRE test-taker subgroup
and the model was significant at the .01 level. In this model, as with Model 2, the GRE score
variable was significant at the .05 level but had a miniscule partial effect. The only other factors
significant to the model were undergraduate GPA (significant at .01) and the dummy variable for
business undergraduate degree recipients (significant at .05). Undergraduate GPA within the
GRE test-taker subgroup had a larger partial effect than for the GMAT test-taker subgroup; a
one-point increase in undergraduate GPA estimated almost a third of a point increase in final
MBA GPA for the GRE test-takers.
For the GRE subset of our sample, independent sample t-tests showed that there were significant
differences in GRE score for Black and African American students and female students; both
groups had significantly lower average test scores when compared to the rest of the sample.
After controlling for all other data available, these variables were not significant predictors in the
regression models, and for female students, there was not a significant difference in means
observed with regards to final MBA GPA. As mentioned previously, the evidence suggests that
there may be possible predictive validity differences amongst subgroups; the fact that female
students within our sample score significantly lower on average on the GRE than male students
but do not demonstrate a significant difference in final MBA GPA could illustrate possible
underprediction with regards to female students that take the GRE.
There was a significant difference observed in the means of Black and African American
students final MBA GPAs; those students were found to score almost two-tenths of a point lower
than the rest of the sample within both the GMAT and GRE subgroups. This would argue
against underprediction with regards to Black and African American students; while there were
75
statistically significant differences in GMAT and GRE scores (with Black students scoring
significantly lower than others on the standardized exams), Black and African American students
from both subgroups also scored significantly lower in final MBA GPA. Given that race was not
a significant variable in any of the regression analyses conducted, these differences in MBA
performance cannot be explained by the variables collected in this study. More investigation
should be done into what may be causing Black and African American students to perform
significantly worse than their peers in MBA programs, other than the fact that the group in our
sample was significantly less academically qualified as defined by mean undergraduate GPA (for
the GMAT subgroup only) and entrance exam score.

76
Chapter 5 - Conclusion
Summary
The GMAT exam was found to be an overall significant predictor of both first-semester MBA
GPA and final MBA GPA, echoing results found by many other researchers (Kuncel et al., 2007;
Oh et al., 2008). The GRE exam, while not a significant predictor of first-semester MBA
performance as a standalone variable, was found to be a significant predictor of final MBA
performance, and accounted for slightly more explained variance in final MBA GPA than the
GMAT exam. The validity of the GRE as a predictor of graduate school academic performance
was also found by Young (2008) and Sampson and Boyer (2001), and in a meta-analysis
conducted by Kuncel, Hezlett, and Ones (2001).
The fact that in our sample the GRE is a slightly stronger predictor of final MBA academic
performance could be due to the setup of typical MBA curriculums; the first semester is typically
core business classes that all students are mandated to take at the same time. It would make
sense to infer that the GMAT, an exam specific for graduate management education prospective
students, would align more with first-semester MBA GPA. However, there are many types of
MBA specializations or concentrations and students vary wildly in their course loads by the time
they finish their degree. This could be why the GRE predicts final MBA GPA slightly higher
than the GMAT; the broadness of the GRE could lend itself to be slightly more effective in
predicting overall graduate success. It may also be that the GRE test-taker subgroup, which did
contain significantly more non-business undergraduate students within our sample, may catch up
to the GMAT takers while progressing through the MBA program curriculum.

77
Undergraduate GPA alone predicted graduate success better than the standardized exams,
mirroring results found by Yang and Lu (2001), Fairfield-Sonn et al. (2010), Fish and Wilson
(2009), and Ahmadi (1997). Clearly, undergraduate performance should not be ignored in the
admissions process. If standardized exams are going remain a focus of admissions committees,
they should be used in conjunction with undergraduate GPA either through the AACSB score
formula or some other scale. The AACSB score was the most consistent stand-alone predictor,
accounting for 20.2% of the variance in first-semester GPA and 20.1% of the variance in final
GPA for GMAT test-takers and 15.3% of the variance in first-semester GPA and 21% of the
variance in final GPA for GRE test-takers. In all cases, the AACSB score, a combination of
GMAT/GRE and undergraduate GPA, was a stronger predictor than either the GMAT/GRE
score or undergraduate GPA alone. A similar result was reached by Koys (2005) where it was
demonstrated that the combination of GMAT and undergraduate GPA were stronger than either
measure alone.
Regarding the finding that the GRE is not a significant predictor of first-semester MBA GPA;
students have to persist beyond the first semester to complete any degree. Given that the GRE
was not measured to be a significant predictor of first semester success within this sample, and
that there was a significant difference in first-semester GPA between GMAT and GRE test-
takers (GMAT takers scored higher), GRE scores should be used very carefully, particularly with
any students deemed to be “at-risk” in other areas beyond their GRE score (such as lower
undergraduate GPA’s).
Admissions committees must also keep in mind factors that might influence exam scores more so
than actual MBA performance potential. Our sample showed that demographic data such as
race, gender, age, and major choice had possible correlations with standardized exam scores and

78
that there were statistically significant differences between many subgroups. Blacks or African
Americans had statistically significant negative correlations with both GMAT and GRE exam
score and there were significant differences in means between Black students and others (with
Black students scoring significantly lower on the standardized exams), but race/ethnicity was not
found to be a significant predictor of graduate academic performance. Men were found to have
positive correlations with both the GMAT and GRE, but only the positive relationship with GRE
score was statistically significant. The fact that gender and race/ethnicity were not found via
regression analysis to be significant predictors of MBA performance could mean that the exams
under predict for minorities and/or women students (at least on the GRE in this study), so this
should be kept in mind when making admissions decisions (Zwick, 2002; Wright and Bachrach,
2003; Hancock, 2000). While race and gender had no predictive utility within our sample in
projecting graduate academic performance, those factors could be influencing results on the
standardized exams.
Limitations and Calls for Future Study
As pointed out by Kuncel, Crede, and Thomas (2007), the most valid way to predict MBA
student success would be to set up a simulated business school complete with courses taught by
typical MBA faculty. This “MBA Biosphere” would be complete with all associated facilities
(classrooms, libraries, computer labs, etc.) and typical graduate distractions (social activities,
professional development opportunities, etc.) and then have potential MBA students attend for a
semester. If the student can handle that trial semester, then they should have success in the
program. Obviously, business schools do not have the time or the resources to set up such a
process, so they have to rely on the information available to make their admissions decisions.

79
Likewise, the best way to answer the question of whether the GRE or GMAT is more effective
would be to have all prospective MBA students take both exams, pursue their degree, and then
measure which exam most accurately predicted their level of academic success in the program.
Given the data analyzed for this study, it can be said that as a standalone factor, the GMAT is a
valid predictor of first-semester GPA while the GRE is not a statistically significant predictor of
first-semester GPA. It can also be said that the GRE and GMAT are both statistically significant
predictors of final MBA GPA and that the GRE explains more variance (5.6% compared to
4.4%) than the GMAT, but that is not sufficient to claim that the GMAT is a stronger predictor
of first-semester GPA or that the GRE is a stronger predictor of final MBA GPA.
Time was a limitation on data collection for this study. Most institutions do not keep student-
level application data and grades in the same place, so institutions participating in the study had
to find the appropriate data, pair it together, and strip it of personal identifiers before submitting
it to me for the study. The compressed timeline of this program made it hard for some
institutions to participate.
While the sample size for the GMAT subset was sufficient, collecting more information on GRE
test-takers would be recommended for future studies. However, given that the percentage of
students enrolling in MBA programs off a GRE is between 5-20% nationally, the subset in this
study is representative of GRE numbers currently.
The GRE data collected for this study contained scores from the GRE General Test, which is no
longer offered. Once enough students that took the GRE Revised General Test, launched in
August 2011, have had time to graduate, it would be interesting to compare the predictive

80
validity of the revised GRE to the validities found in this study to see if improvements were
made.
There is something to be said for the issue of statistical significance versus practical significance.
While several findings of this study are statistically significant, in practical terms they are
influencing miniscule GPA differences; a tenth of a point here, two-tenths of a point there.
While small differences in GPA can be very important with regards to certain thresholds
(maintaining a high enough GPA for financial aid awards, or keeping above a 3.00 GPA to
graduate), ultimately all of these students are graduating from MBA programs.
While the fact that around one-fifth of the variance in MBA academic performance can be
explained by two variables (undergraduate GPA and GMAT score, as evidence by the AACSB
score variable) is encouraging, research analyzing the predictive power of other variables
commonly used by MBA admissions staffs, as well as variables such as learning motivation and
desired career outcome, is needed (Yang and Lu, 2001). Seeking ways to analyze leadership
skills in applicants through interviews or other assessment methods is important (Tarr, 1986).
Any measure used by admissions committees should be “highly valid, low in cost, contribute to
existing measures, and not yield adverse impact” (Kuncel et al., 2007). Given that the
standardized exams can measure ability or knowledge but not qualitative factors such as interest
or motivation, it is important for MBA admissions committees to look for other measures to
assess other predictors of academic performance (Kuncel, Hezlett, and Ones, 2001).
Given that the institutions that participated in the study are not “open” institutions and have
certain cutoff levels for standardized exams and undergraduate GPAs, restriction of range could
be an issue with the findings. Range restriction could (and probably does) reduce the observed

81
strength between standardized exam score and the prediction of MBA academic performance. It
is difficult to prove that two variables, such as entrance exam score and final GPA, are highly
related when both variables have truncated ranges of variability (Lomax, 2001). Oh et al. (2008)
determined that adjusting for range restriction within prior GMAT validity studies could increase
observed validity by 7%.
Meta-analyses show that validity of the GMAT and GRE are likely to be seen across most
programs (Kuncel et al., 2007; Oh et al., 2008; Kuncel, Hezlett, and Ones, 2001). However,
other prior studies (Fish and Wilson, 2009; Wright and Palmer, 1997) and advice from the test
administrators themselves have shown that each program should conduct individual validity
studies regarding the predictive power of the GMAT/GRE and other variables used in
admissions processes. It is important for admissions professionals to not generalize the results in
this study to their institution; what is valid for one institution or program type may or may not be
valid for another because validity is population specific (Young, 2008). Rather, data presented
here should serve as an impetus to analyze the criteria being currently used at your particular
institution.

82
References
Adams, A.J. & Hancock, T. (2000). Work experience as a predictor of MBA performance. College Student Journal, 34(2), 211.
Ahmadi, M. (1997). An examination of the admissions criteria for the MBA programs. Education, 117(4), 540.
American Educational Research Association, American Psychological Association, and National Council on Measurement in Education. (1999). Standards for Educational and Psychological Testing. Washington, DC: American Educational Research Association.
Benson, G. (1983). GMAT – Fact or fiction. Paper presented at the Annual Meeting of the Rocky Mountain Educational Research Association.
Bieker, R. (1996). Factors affecting academic achievement in graduate management education. Journal of Education for Business, 72(1), 42-47.
Braunstein, A. (2002). Factors determining success in a graduate business program. College Student Journal, 36(3), 471.
Braunstein, A. (2006). MBA academic performance and type of undergraduate degree possessed. College Student Journal, 40(3), 685-690.
Briel, J., O’Neill, K., & Scheuneman, J. (Eds.) (1993). GRE technical manual. Princeton, NJ: Educational Testing Service.
Carver Jr., M.E. & King, T.E. (1994). An empirical investigation of the MBA admission criteria for nontraditional programs. Journal of Education for Business, 70(2), 95-98.
Council of Graduate Schools. (2012). An Essential Guide to Graduate Admissions. Washington, DC: Council of Graduate Schools.
Dobson, P., Krapljan-Barr, P., & Vielba, C. (1999). An evaluation of the validity and fairness of the graduate management admissions test (GMAT) used for MBA selection in a UK business school. International Journal of Selection & Assessment, 7, 196-202.
Everett, J. & Armstrong, R. (1990). Segmenting the MBA market: An Australian strategy. Journal of Marketing for Higher Education, 3(1), 151-163.
Fairfield-Sonn, J., Kolluri, B., Singamsetti, R., & Wahab, M. (2010). GMAT and other determinants of GPA in an MBA program. American Journal of Business Education, 3, 77-85.
Fairtest, 2003. GMAT-Padlock on MBA Admissions Gates. Retrieved from

83
http://www.fairtest.org/gmat-padlock-mba-admissions-gates-pdf.
Feeley, T., Williams, V. & Wise, T. (2005). Testing the predictive validity of the GRE exam on communication graduate student success: A case study at University of Buffalo. Communication Quarterly, 53(2), 229-245.
Fenster, A., Markus, K., Wiedemann, C., Brackett, M, & Fernandez, J. (2001). Selecting tomorrow’s forensic psychologists: A fresh look at some familiar predictors. Educational and Psychological Measurements, 61(2), 336-348.
Fish, L.A., & Wilson, F. (2009). Predicting performance of MBA students: Comparing the part-time MBA program and the one-year program. College Student Journal, 43(1), 145-160.
Fisher, J. & Resnick, D. (1990). Standardized testing and graduate business school admission: A review of issues and an analysis of a Baruch College MBA cohort. College and University, 65, 137-148.
Gayle, J., & Jones, T. (1973). Admissions standards for graduate study in management. Decision Sciences, 8, 765-769.
Goodrich, J. (1975). American standardized tests: Pseudo-indicators of ability? Educational Technology, 15, 23-25.
Graham, L. (1991). Predicting academic success of students in a master of business administration program. Educational and Psychological Measurement, 51, 721-727.
Grambsch, P. (1981). Business administration. In A.W. Chickering (Ed.), The Modern American College: 472-486. New York: Jossey-Bass.
Gropper, D. (2007). Does the GMAT matter for executive MBA students? Some empirical evidence. Academy of Management Learning and Education, 6(2), 206-216.
Gump, S. (2003). Defining distinction: characteristics of top MBA students at Cardiff business school. International Education, 32(2), 63-84.
Hancock, T. (1999). The gender difference: Validity of standardized admissions tests in predicting MBA performance. Journal of Education for Business, 75(2), 91-93.
Harkins, M. & Singer, S. (2009). The conundrum of large scale standardized testing: Making sure every student counts. Journal of Thought, 44 (1/2).
Hoefer, P. (2000). Assessment of admission criteria for predicting students’ academic performance in graduate business programs. Journal of Education for Business, 75(4), 225.
Holt, D., Bleckmann, C., & Zitzmann, C. (2006). The graduate record examination and success in an engineering management program: A case study. Engineering Management Journal, 18, 10-16.

84
Holton, E. III. (1996). The flawed four level evaluation model. Human Resource Development Quarterly, 7, 225-229.
Hunter, J., & Hunter, R. (1984). Validity and utility of alternative predictors of job performance. Psychological Bulletin, 96, 72-98.
Jones, P. (1991). Bayesian interpretation of test reliability. Educational and Psychological Measurement, 51, 627-635.
Joyce, A. (2002). First MBA lesson, supply and demand. Washington Post. Retrieved from http://www.gmat.com.
Kaplan, R. & Sacuzzo, D. (1997). Psychological Testing: Principles, Applications, and Issues. (4th Edition). Pacific Grove, CA: Brooks/Cole Publishing Company.
Kaplan Test Prep. (2012). Kaplan test prep survey: 69% of business schools now accept the GRE, but the overwhelming majority of MBA applicants are wary of abandoning the traditional GMAT route. Business Wire (English).
Katz, J., Motzer, S., & Woods, S. (2009). The graduate record examination: Help or hindrance in nursing graduate school admissions? Journal of Professional Nursing, 25(6), 369-372.
Koys, D. (2005). The validity of the graduate management admissions test for non-U.S. students. Journal of Education for Business, 80(4), 236-239.
Kuncel, N., Crede, M., & Thomas, L. (2007). A meta-analysis of the predictive validity of the graduate management admissions tests (GMAT) and Undergraduate Grade Point Average (UGPA) for graduate student academic performance. Academy of Management Learning and Education, 6(1), 51-68.
Kuncel, N., Hezlett, S. & Ones, D. (2001). A comprehensive meta-analysis of the predictive validity of the graduate record examinations: Implications for graduate student selection and performance. Psychological Bulletin, 127(1), 162-181.
Lomax, R. (2001). Bivariate measures of association. In An Introduction to Statistical Concepts for Education and Behavioral Sciences (pp. 173-190). Mahwah, NJ: Lawrence Erlbaum Associates.
Luce, D. (2011). Screening applicants for risk of poor academic performance: A novel scoring system using preadmission grade point averages and graduate record examination scores. The Journal of Physician Assistant Education, 22(3), 15-22.
Malone, B., Nelson, J.S., & Nelson, C.V. (2001). Completion and attrition raters of doctoral students in educational administration. Ed 457759.
Naik, B. et al. (2004). Using neural networks to predict MBA academic success. College Student Journal, 38(1), 143-149.

85
Norcoss, J., Hanych, J., & Terranova, R. (1996). Graduate study in psychology: 1992-1993. American Psychologist, 51, 631-643.
Nilsson, J. (1995). The GRE and the GMAT: A comparison of their correlations to GGPA. Educational and Psychological Measurement, 55, 637-640.
Oh, I., Schmidt, F., Shaffer, J., & Le, H. (2008). The graduate management admissions test (GMAT) is even more valid than we thought: A new development in meta-analysis and its implications for the validity of the GMAT. Academy of Management Learning & Education, 7(4), 563-570.
Olivas, M. (1999). Higher education admissions and the search for one important thing. University of Arkansas at Little Rock Law Review, 21 U. Ark. Little Rock L. Rev. 993.
Palmer, J. & Wright, R. (1996). Predicting academic performance in graduate business programs: when does age make a difference? Delta Pi Epsilon Journal, 38, 72-80.
Paolillo, J. (1982). The predictive validity of selected admissions variables relative to grade point average earned in a master of business administration program. Educational and Psychological Measurement, 42, 1163-1167.
Powers, D. (2004). Validity of graduate record examination (GRE) general test scores for admissions to colleges of veterinary medicine. Journal of Applied Psychology, 89(2), 208-219.
Ragothaman, S., Carpenter, J., & Davies, T. (2009). An empirical investigation of MPA student performance and admissions criteria. College Student Journal, 43(3), 879-875.
Sampson, C., & Boyer, P.G. (2001). GRE scores as predictors of minority students’ success in graduate study: An argument for change. College Student Journal, 35, 271.
Sobol, M. (1984). GPA, GMAT, and scale: A quantification of admissions criteria. Research in Higher Education, 20(1), 77-88.
Sternberg, R. & Williams, W. (1997). Does the graduate record examination predict meaningful success in the graduate training of psychologists? American Psychologist, 52(6), 630-641.
Talento-Miller, E. & Rudner, L. (2005). GMAT validity study summary report for 1997-2004. GMAC Research Reports, RR-05-06.
Tarr, C. (1986). How to humanize MBAs: Business schools should admit students who look like leaders, not just winners, and stress cooperation. Fortune, 113, 153-154.
Truitt, T. (2002). Validity of selection criteria in predicting MBA success. Paper presented at CBFA Conference.
Wernimont, P. & Campbell, J. (1968). Signs, samples, and criteria. Journal of Applied

86
Psychology, 52, 372-376.
Wightman, L. & Leary, L. (1985). GMAC validity study service: A three year summary. Princeton, New Jersey.
Wright, R.E. & Bachrach, D.G. (2003). Testing for bias against female test takers of the graduate management admissions test and potential impact on admissions to graduate programs in business. Journal of Education for Business, 78(6), 324-328.
Wright, R. E., & Palmer, J. C. (1994). GMAT scores and undergraduate GPAs as predictors of performance in graduate business programs. Journal of Education for Business, 69(6), 344-344.
Wright, R. E. & Palmer, J.C. (1997). Examining performance predictors for differentially successful MBA students. College Student Journal, 31(2), 276.
Yang, B. & Lu, D. (2001). Predicting academic performance in management education: An empirical investigation of MBA success. Journal of Education for Business, 76:15-20.
Young, P. (2008). Predictive validity of the GRE and GPAs for a doctoral program focusing on educational leadership. Journal of Research on Leadership Education, 3(1).
Youngblood, S. & Martin, B. (1982). Ability testing and graduate admissions: Decision process modeling and validation. Educational and Psychological Measurement, 42, 1153-1162.


![Comparing Apples and Oranges: The Fiduciary Principle in ... · Comparing Apples and Oranges: The Fiduciary Principle in Australia and Canada after Breen v Williams Abstract [extract]](https://img.pdfslide.net/doc/110x75/5ea1bf59ae781e1a62397e92/comparing-apples-and-oranges-the-fiduciary-principle-in-comparing-apples-and.jpg)