Embed Size (px)
Citation preview
LBNL-62440
Appliances, Lighting, Electronics, and Miscellaneous Equipment Electricity Use in New Homes
Richard Brown, Lawrence Berkeley National Laboratory William Rittelman, IBACOS
Danny Parker, Florida Solar Energy Center Gregory Homan, Lawrence Berkeley National Laboratory
Environmental Energy Technologies Division Ernest Orlando Lawrence Berkeley National Laboratory
University of California Berkeley, California 94720
February 2007
Also appears in the Proceedings of the 2006 ACEEE Summer Study on Energy Efficiency in Buildings, Less is More, En Route to Zero Energy Buildings (2006).
The work described in this paper was supported by the Office of Atmospheric Programs, Climate Protection Partnerships Division of the U.S. Environmental Protection Agency and prepared for the U.S. Department of Energy - Contract No. DE-AC02-05CH11231.
2
DISCLAIMER
This document was prepared as an account of work sponsored by the United States Government. While this document is believed to contain correct information, neither the United States Government nor any agency thereof, nor The Regents of the University of California, nor any of their employees, makes any warranty, express or implied, or assumes any legal responsibility for the accuracy, completeness, or usefulness of any information, apparatus, product, or process disclosed, or represents that its use would not infringe privately owned rights. Reference herein to any specific commercial product, process, or service by its trade name, trademark, manufacturer, or otherwise, does not necessarily constitute or imply its endorsement, recommendation, or favoring by the United States Government or any agency thereof, or The Regents of the University of California. The views and opinions of authors expressed herein do not necessarily state or reflect those of the United States Government or any agency thereof or The Regents of the University of California.
3
Appliances, Lighting, Electronics, and Miscellaneous Equipment Electricity Use in New Homes
Richard Brown, Lawrence Berkeley National Laboratory William Rittelman, IBACOS
Danny Parker, Florida Solar Energy Center Gregory Homan, Lawrence Berkeley National Laboratory
ABSTRACT
The “Other” end-uses (appliances, lighting, electronics, and miscellaneous equipment) continue to grow. This is particularly true in new homes, where increasing floor area and amenities are leading to higher saturation of these types of devices. This paper combines the findings of several field studies to assess the current state of knowledge about the “Other” end-uses in new homes. The field studies include sub-metered measurements of occupied houses in Arizona, Florida, and Colorado, as well as device-level surveys and power measurements in unoccupied new homes. We find that appliances, lighting, electronics, and miscellaneous equipment can consume from 46% to 88% of whole-house electricity use in current low-energy homes. Moreover, the annual consumption for the “Other” end-uses is not significantly lower in new homes (even those designed for low energy use) compared to existing homes. The device-level surveys show that builder-installed equipment is a significant contributor to annual electricity consumption, and certain devices that are becoming more common in new homes, such as structured wiring systems, contribute significantly to this power consumption. These findings suggest that energy consumption by these “Other” end uses is still too large to allow cost-effective zero-energy homes.
Introduction and Background
Historically, most of the energy consumed by the U.S. residential sector has been for
space heating, cooling, and water heating – what we call the “traditional” end-uses. The “Other” end-uses (appliances, lighting, electronics, and miscellaneous equipment), however, have grown to the point that they account for over half of residential electricity use (major appliances: 24%; lighting: 18%; miscellaneous equipment: 14%) and about 40% of total residential primary energy consumption (US DOE 2004). Moreover, miscellaneous energy is the fastest growing end-use in U.S. homes, projected to more than double in the next 20 years (US DOE 2005c).
This situation is particularly true in new homes, where increasing floor area and amenities are leading to higher saturation of lighting, electronics, and other plug-load devices. While new homes have long been the subject of programs and policies to reduce energy use, these programs have almost exclusively focused on the traditional end-uses.1 While these programs have been successful at reducing the traditional end-uses, analyses have shown that little progress has been made in reducing the “Other” end-uses in new homes. For instance, the
1 Notable exceptions are California’s Title-24 building standard, which includes requirements for lighting efficiency, and the ENERGY STAR New Home program, which requires some efficient appliances and lighting.
4
U.S. Department of Energy’s Building America program conducted a system optimization study and found that using current technologies to design homes with 40% lower whole-house energy use results in about half of the remaining energy being consumed by miscellaneous devices (Anderson et al. 2004). This is a significant barrier to reach net-zero energy consumption for these houses, because the same analysis shows that $20,000 to $30,000 worth of PV capacity would need to be installed just to offset the consumption of miscellaneous devices. Thus it seems clear that, especially in the context of zero-energy homes, the consumption of the “Other” end-uses is an important issue.
The purpose of this paper is to draw on results and data from several different field studies of new homes to improve our understanding of the “Other” electricity use in new homes. The work presented here is not a comprehensive analysis drawn from a single, integrated dataset, but rather a compilation of existing studies that address different aspects of the research problem. This paper addresses the following research questions: • How much of the remaining electricity use in low-energy homes is due to the “Other” end-
uses? • Do new homes consume more or less electricity for “Other” end-uses, compared to existing
homes? • How large a part does builder-installed equipment play in “Other” electricity consumption in
new homes, and what types of devices are the highest users? Methodology
This paper compiles and reports the results of several independent studies that shed light
on the consumption of “other” end-uses in new homes. Generally, the studies collected data using two different methodologies: whole-house monitoring or device-level metering.
Whole-house and “major” load monitoring
The first type of study involves long-term metering of electrical consumption at the
whole-house level and sub-metering of select “major” end-uses. In these studies the sub-metered end-uses include space heating, space cooling, water heating, and sometimes major appliances such as the refrigerator or clothes dryer. For this paper, we have only included studies with a year or more of metered data. A summary of each study is provided below.
It should be noted that the sample of new homes represented by these studies is generally skewed toward energy efficient and low-energy designs, because these tend to be the homes that have been most intensively monitored. The detailed sub-metering needed to measure consumption for appliances, lighting, and miscellaneous loads is expensive and has generally not been conducted on large samples of “average” new homes (the Florida study being a notable exception). The studies are also heavily skewed toward hot climates (Arizona, Florida, California), both because this is where a lot of building activity is occurring and also because low-energy homes using solar energy systems are being tested in these climates first. For this reason, the houses described here should not be considered representative of national building practices, but provide anecdotal evidence about a certain segment of the housing market.
Civano. Civano is a development in Tucson, Arizona, designed to follow sustainability

5
principles. Homes in the development were designed to consume 40% to 50% less energy for heating, cooling and water heating than homes meeting the 1993 Model Energy Code. The homes all also have efficient appliances and lighting, solar water heating systems, and some have roof-mounted solar photovoltaic (PV) systems (IBACOS 2000). IBACOS assisted with design of the pilot phase of the Civano development, and conducted long-term monitoring on twenty homes in that initial phase. Eight homes had adequate data for this analysis. The homes were constructed in 2000 and 2001, and monitored for a two-year period after occupancy (we only report one year of data here – calendar year 2001 in most cases). Energy measurements were conducted using current transducers at the circuit panel; current measurements were converted to power using a one-time voltage measurement. This method was found to be accurate to within 1% of the actual utility bills for a test house. Aspen Homes. As part of the Department of Energy’s Building America program, IBACOS also assisted with the design and monitoring of a low-energy home in Loveland, Colorado. The home was designed to consume 60% less energy than a standard home. The home is highly insulated and airtight, and features a 2 kW PV system, solar hot water, solar-assisted gas-fired boiler heating, a thermal wall assembly, high performance lighting, and high-efficiency appliances. The home was constructed in 2004 and monitored through 2005 (we report data for calendar year 2005 in this paper). The monitoring method was similar to that used for the Civano homes, but the sub-metering was performed at a much more detailed level, thus allowing disaggregation of consumption by device and electrical circuit type. Tucson ZEH. Another Building America demonstration home was the Zero Energy Home (ZEH) at Armory Park del Sol in Tucson, Arizona. The National Association of Home Builders (NAHB) Research Center assisted with the design and monitoring of this home. It was designed to consume 45% less energy than the builder’s standard design, which is itself designed to perform 50% better than the Model Energy Code (i.e., a total energy-use reduction of 72% from the Model Energy Code) (NAHB Research Center 2004). Design features include a highly-insulated envelope, a solar space and water heating system with tankless electric water heating backup, high-efficiency air conditioner, pin-based fluorescent lighting fixtures, ENERGY STAR-compliant major appliances, and a 4.2 kW PV array. The home was constructed in 2003 and monitored through 2005 (we report data for calendar year 2005 in this paper).
Table 1: Characteristics of low-energy homes subject to whole-house monitoring House Floor Area
(sq. ft.) Number of Occupants
Heating Type Back-up Water Heating Fuel
Civano1 1556 1 Gas Furnace Gas Civano2 2042 2 Heat Pump Electric Civano3 1566 3 Heat Pump Electric Civano4 1280 3 Fan-coil from
Gas WH Gas
Civano5 1834 2 Gas Furnace Gas Civano6 1834 2 Heat Pump Electric Civano7 1834 3 Heat Pump Electric Civano8 1227 2 Heat Pump Electric Aspen 3453 3 Gas boiler Gas Tucson ZEH 1718 Electric Electric
6
Florida. The final whole-house study monitored approximately 200 existing homes in central Florida during 1999 (Parker 2003). The homes represented a broad cross-section of building designs, heating fuel, and equipment and appliance ownership. Only homes without swimming pools and spas, and where the energy use of the clothes dryer is measured, are included in the sample set used in this paper. Total electricity use was metered in all homes by monitoring incoming electrical service. Major end-uses were also recorded in each home on a 15-minute basis. These included space heating, cooling, water heating and either the swimming pool, clothes dryer, or range. “Other” electricity consumption was derived by subtracting all the sub-metered end-uses from the total. Although the sample of homes was not specifically designed to study new homes, it covered a range of construction vintages, including homes built in the mid- to late-1990s. This allows investigation of whether new homes differ from older homes in their consumption for the “other” end-uses. The new homes in the study are broadly representative of building practices in Florida at that time and not skewed toward low-energy designs. Device-level surveys and metering
The second type of data collection is conducted at the level of the individual device. For
a sample of thirteen new, unoccupied homes in California, LBNL inventoried all the electrical equipment they contained and performed “spot” metering of plug-in devices to measure their power consumption in low-power modes (and active mode where possible). This sample of homes is intended to represent energy consumed by “builder-installed” devices (rather than the full complement of devices present in occupied homes). Some of the homes were sales models that included a few additional appliances and equipment that would normally be found in an occupied home. The sample includes seven distinct floor plans from four different housing developments. The homes include a range of efficiency levels, from typical new construction in California to low-energy homes with solar PV systems. To estimate annual energy use for the inventoried devices, we used our low-power mode measurements, supplemented by assumptions about power levels and time spent in other power modes using data collected by Nordman and McMahon (2004).
Results Low-energy home monitoring
The results of the long-term electricity monitoring of new, low-energy homes are shown in Figure 1 (the Tucson ZEH results are drawn from (NAHB Research Center, 2006)). On average, these homes use about 8,400 kWh per year of electricity, of which the “Other” end-uses account for 46% to 88%, with an average of 65%. Consumption for the “Other” end-uses ranges from 3,200 to 10,000 kWh/year, with an average of 5,400 kWh/year. For comparison, the average existing house in the Mountain census division (where all the monitored homes are located) consumes about 9,900 kWh/year, of which the “Other” end-uses account for about 6,900

7
kWh/year, or 70% of whole-house consumption (US DOE 2005a).2 Because most of these houses are located in Tucson, AZ, a better comparison might be the average residential customer in the Tucson Electric Power service territory, which consumes about 20% more electricity—10,200 kWh/year (US DOE 2005b, Table 6). Due to the hot climate in Tucson, the low-energy homes have large cooling and relatively small heating loads. Figure 1 indicates that for all the homes cooling is the second largest end-use after “Other.” Some of the variation in “Other” consumption can be explained by house size, but it also varies due to occupant lifestyle and the types of electrical devices they own. For instance, the occupants of one Civano house report doing a lot of laundry, which drives up their appliance use, while another of the homes (Civano8) has the highest “Other” consumption possibly due to a lot of electronic and audio equipment. Despite all of these houses having energy-efficient hard-wired lighting and ENERGY STAR-compliant appliances where possible, their consumption for “Other” end-uses is about 20% less than “Other” consumption in the average existing home in that region.
Figure 1: Annual Electricity Use by Low-Energy Houses (and % of electricity use by
“Other” end-uses)
Note: Electricity consumption is actual end-use consumption, before crediting any PV generation.
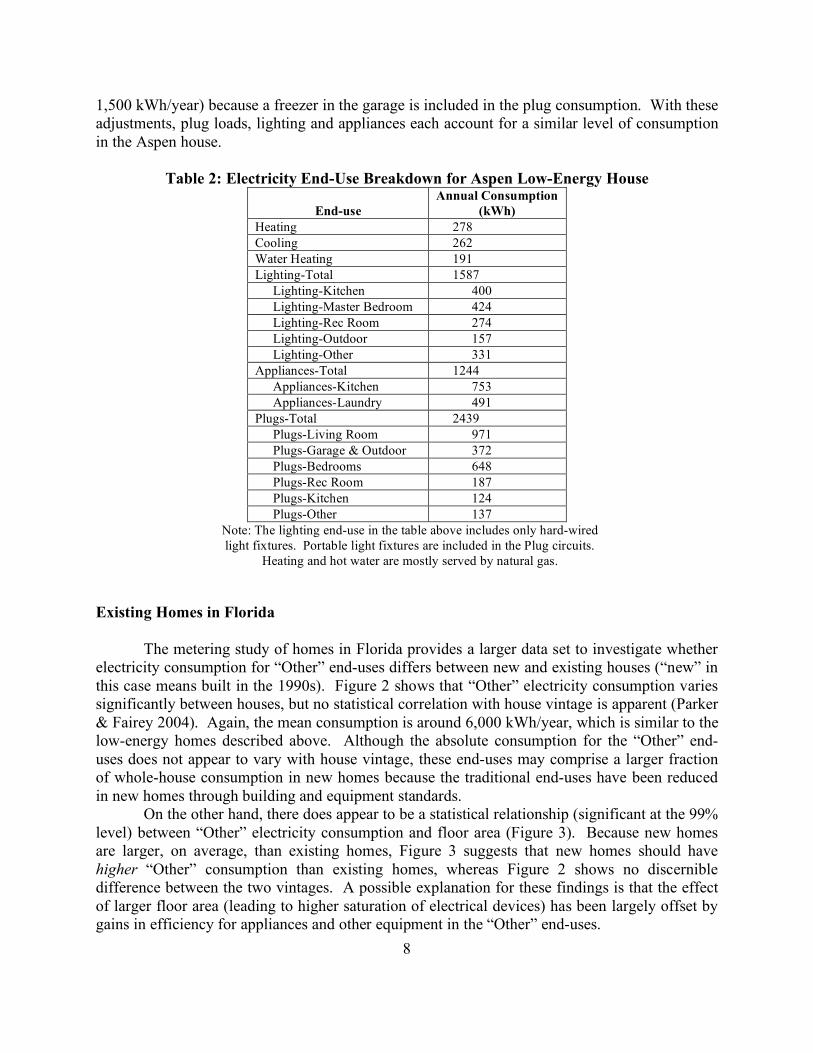
More detailed end-use metering in the Aspen house allows us to disaggregate the “Other” end-uses to see which components predominate. Table 2 shows that plug circuits are the largest end-use, followed by lighting and appliances. Lighting consumption is actually somewhat higher than indicated in the table (possibly around 2,000 kWh/year) because some of the plug circuits contain portable light fixtures. Likewise, appliance consumption is somewhat higher (around
2 The end-use consumption for existing homes is estimated using a regression-based bill disaggregation method, and is therefore not exactly comparable to the end-use metered data presented here. Nevertheless it is useful as a general comparison.
8
1,500 kWh/year) because a freezer in the garage is included in the plug consumption. With these adjustments, plug loads, lighting and appliances each account for a similar level of consumption in the Aspen house.
Table 2: Electricity End-Use Breakdown for Aspen Low-Energy House
End-use Annual Consumption
(kWh) Heating 278 Cooling 262 Water Heating 191 Lighting-Total 1587
Lighting-Kitchen 400 Lighting-Master Bedroom 424 Lighting-Rec Room 274 Lighting-Outdoor 157 Lighting-Other 331
Appliances-Total 1244 Appliances-Kitchen 753 Appliances-Laundry 491
Plugs-Total 2439 Plugs-Living Room 971 Plugs-Garage & Outdoor 372 Plugs-Bedrooms 648 Plugs-Rec Room 187 Plugs-Kitchen 124 Plugs-Other 137
Note: The lighting end-use in the table above includes only hard-wired light fixtures. Portable light fixtures are included in the Plug circuits.
Heating and hot water are mostly served by natural gas.
Existing Homes in Florida
The metering study of homes in Florida provides a larger data set to investigate whether
electricity consumption for “Other” end-uses differs between new and existing houses (“new” in this case means built in the 1990s). Figure 2 shows that “Other” electricity consumption varies significantly between houses, but no statistical correlation with house vintage is apparent (Parker & Fairey 2004). Again, the mean consumption is around 6,000 kWh/year, which is similar to the low-energy homes described above. Although the absolute consumption for the “Other” end-uses does not appear to vary with house vintage, these end-uses may comprise a larger fraction of whole-house consumption in new homes because the traditional end-uses have been reduced in new homes through building and equipment standards.
On the other hand, there does appear to be a statistical relationship (significant at the 99% level) between “Other” electricity consumption and floor area (Figure 3). Because new homes are larger, on average, than existing homes, Figure 3 suggests that new homes should have higher “Other” consumption than existing homes, whereas Figure 2 shows no discernible difference between the two vintages. A possible explanation for these findings is that the effect of larger floor area (leading to higher saturation of electrical devices) has been largely offset by gains in efficiency for appliances and other equipment in the “Other” end-uses.

9
Figure 2: Comparison of Consumption for “Other” End-Uses vs. House Age, Florida
Note: “Other” consumption does not include pools, spas, or electric clothes dryers. (Parker & Fairey 2004)
Figure 3: Comparison of Consumption for “Other” End-Uses vs. Floor Area, Florida
Note: “Other” consumption does not include pools, spas, or electric clothes dryers. (Parker & Fairey 2004)

10
Builder-installed devices
As one would expect, our study of unoccupied new homes found fewer devices than
occupied homes, which leads to lower electricity consumption (compared to the whole-house, occupied home studies above). Figure 4 shows that consumption by these builder-installed devices is about 800 kWh/year on average (rightmost bar). Note that these results only include energy use for non-lighting equipment. One of the main purposes of this study was to determine how much electricity is consumed in low-power vs. active modes; Figure 4 indicates that low-power modes account for about half of the electricity consumed by these devices (active mode is when the device is actively providing the service for which it is designed; low-power modes include all other operating modes, e.g., off or standby). The mean low-power consumption (approximately 440 kWh/year) translates to a continuous standby power draw of about 50 Watts.
Figure 4: Annual Electricity Use by Builder-Installed Equipment in New California
Homes, by Operating Mode
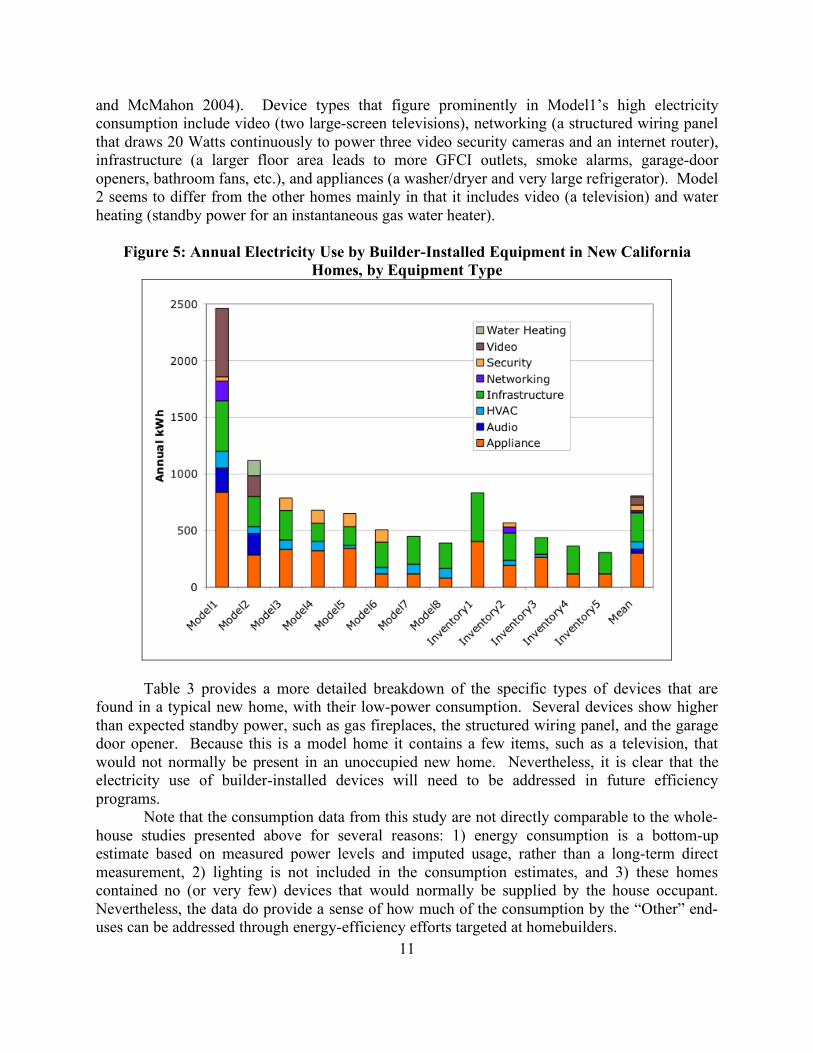
Figure 4 also distinguishes “model” from “inventory” homes: inventory homes include only the equipment and devices that would normally be in the home when sold to a homebuyer, whereas model homes include additional devices (e.g., appliances, video and audio equipment) used to decorate the sales model for prospective homebuyers. As expected, the model homes have somewhat higher consumption, particularly houses 1 and 2. To better understand the types of devices that account for the variation between homes, Figure 5 shows annual electricity consumption disaggregated by device type (these equipment categories are drawn from Nordman
11
and McMahon 2004). Device types that figure prominently in Model1’s high electricity consumption include video (two large-screen televisions), networking (a structured wiring panel that draws 20 Watts continuously to power three video security cameras and an internet router), infrastructure (a larger floor area leads to more GFCI outlets, smoke alarms, garage-door openers, bathroom fans, etc.), and appliances (a washer/dryer and very large refrigerator). Model 2 seems to differ from the other homes mainly in that it includes video (a television) and water heating (standby power for an instantaneous gas water heater).
Figure 5: Annual Electricity Use by Builder-Installed Equipment in New California
Homes, by Equipment Type
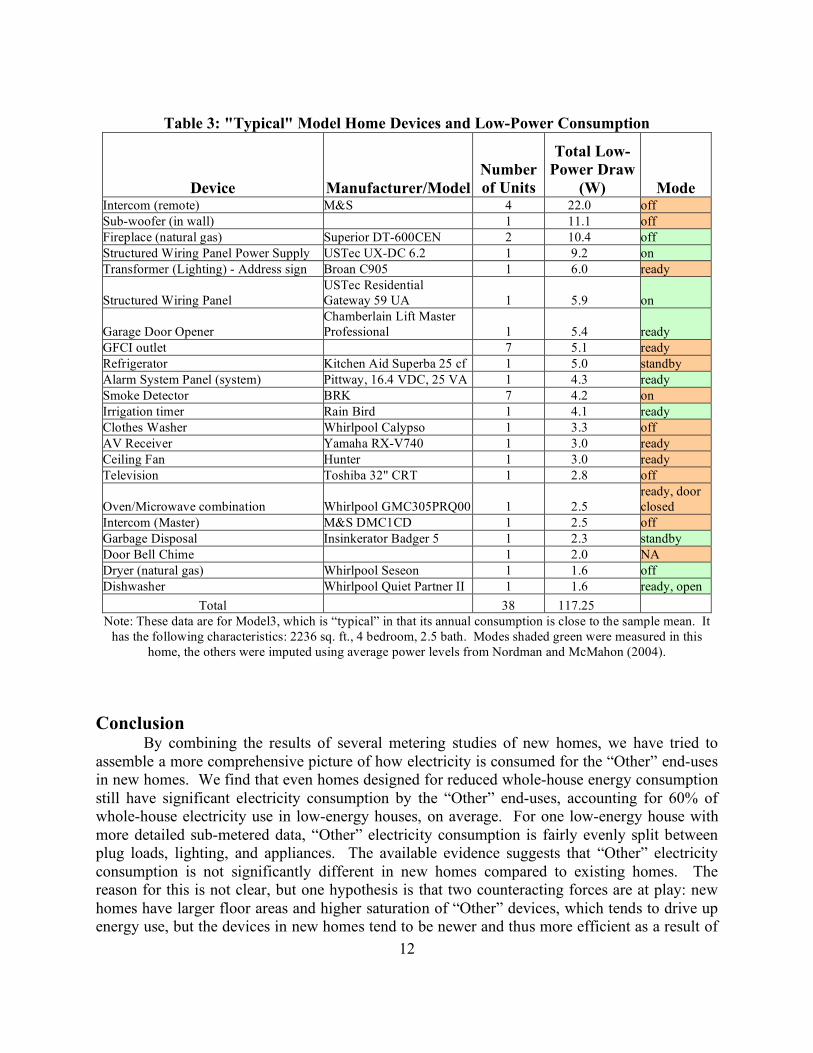
Table 3 provides a more detailed breakdown of the specific types of devices that are
found in a typical new home, with their low-power consumption. Several devices show higher than expected standby power, such as gas fireplaces, the structured wiring panel, and the garage door opener. Because this is a model home it contains a few items, such as a television, that would not normally be present in an unoccupied new home. Nevertheless, it is clear that the electricity use of builder-installed devices will need to be addressed in future efficiency programs.
Note that the consumption data from this study are not directly comparable to the whole-house studies presented above for several reasons: 1) energy consumption is a bottom-up estimate based on measured power levels and imputed usage, rather than a long-term direct measurement, 2) lighting is not included in the consumption estimates, and 3) these homes contained no (or very few) devices that would normally be supplied by the house occupant. Nevertheless, the data do provide a sense of how much of the consumption by the “Other” end-uses can be addressed through energy-efficiency efforts targeted at homebuilders.
12
Table 3: "Typical" Model Home Devices and Low-Power Consumption
Device Manufacturer/Model Number of Units
Total Low-Power Draw
(W) Mode Intercom (remote) M&S 4 22.0 off Sub-woofer (in wall) 1 11.1 off Fireplace (natural gas) Superior DT-600CEN 2 10.4 off Structured Wiring Panel Power Supply USTec UX-DC 6.2 1 9.2 on Transformer (Lighting) - Address sign Broan C905 1 6.0 ready
Structured Wiring Panel USTec Residential Gateway 59 UA 1 5.9 on
Garage Door Opener Chamberlain Lift Master Professional 1 5.4 ready
GFCI outlet 7 5.1 ready Refrigerator Kitchen Aid Superba 25 cf 1 5.0 standby Alarm System Panel (system) Pittway, 16.4 VDC, 25 VA 1 4.3 ready Smoke Detector BRK 7 4.2 on Irrigation timer Rain Bird 1 4.1 ready Clothes Washer Whirlpool Calypso 1 3.3 off AV Receiver Yamaha RX-V740 1 3.0 ready Ceiling Fan Hunter 1 3.0 ready Television Toshiba 32" CRT 1 2.8 off
Oven/Microwave combination Whirlpool GMC305PRQ00 1 2.5 ready, door closed
Intercom (Master) M&S DMC1CD 1 2.5 off Garbage Disposal Insinkerator Badger 5 1 2.3 standby Door Bell Chime 1 2.0 NA Dryer (natural gas) Whirlpool Seseon 1 1.6 off Dishwasher Whirlpool Quiet Partner II 1 1.6 ready, open
Total 38 117.25 Note: These data are for Model3, which is “typical” in that its annual consumption is close to the sample mean. It
has the following characteristics: 2236 sq. ft., 4 bedroom, 2.5 bath. Modes shaded green were measured in this home, the others were imputed using average power levels from Nordman and McMahon (2004).
Conclusion By combining the results of several metering studies of new homes, we have tried to
assemble a more comprehensive picture of how electricity is consumed for the “Other” end-uses in new homes. We find that even homes designed for reduced whole-house energy consumption still have significant electricity consumption by the “Other” end-uses, accounting for 60% of whole-house electricity use in low-energy houses, on average. For one low-energy house with more detailed sub-metered data, “Other” electricity consumption is fairly evenly split between plug loads, lighting, and appliances. The available evidence suggests that “Other” electricity consumption is not significantly different in new homes compared to existing homes. The reason for this is not clear, but one hypothesis is that two counteracting forces are at play: new homes have larger floor areas and higher saturation of “Other” devices, which tends to drive up energy use, but the devices in new homes tend to be newer and thus more efficient as a result of
13
equipment and building standards and market trends. Finally, it appears that builder-installed “Other” equipment is a non-trivial component in “Other” electricity use. This suggests that devices not traditionally addressed in energy efficiency programs (such as garage door openers, structured wiring systems, smoke alarms, ventilation fans, and even GFCI outlets) might be worth upgrading through residential new construction programs. These overall findings from these studies suggest that electricity consumption by “Other” end uses is still too large to allow cost-effective zero-energy homes (when residual electricity use must be offset with expensive PV power).
This paper is based on the available data on “Other” electricity use in new homes, but our conclusions are limited by the available data in this area. Clearly further research is needed to better understand this important area of energy use. Ideally, this research would be based on a more comprehensive set of long-term, whole-house metered consumption data in new homes (including a range of minimum code-compliant and low-energy homes). Further detailed sub-metering, of the kind performed in the Aspen house, would also be very valuable. It also would be valuable to collect long-term consumption data at the device level, to help prioritize efforts to reduce energy use in this area. Beyond just understanding how energy is used by the “Other” end-uses, work is also needed to develop more effective energy saving strategies for these devices. The results from the low-energy home metering indicate that efficient appliances and lighting are not sufficient to significantly reduce energy use in this area. Research is needed to investigate additional strategies such as better controls for plug-load devices or provision of central services (e.g., a central DC power bus). Ultimately, most of this energy use is due to purchasing or operational decisions made by house occupants. They need better information about the consequences of these decisions and options for reducing energy use for the “Other” end-uses.
Acknowledgements Leo Rainer of Davis Energy Group provided useful input about the issues discussed in this paper. Carrie Webber of LBNL helped compile data on typical power levels and usage patterns for builder-installed equipment. References Anderson, Ren, Craig Christensen, Scott Horowitz, Adam Courtney, Todd Givler, Kendra
Tupper, and Greg Barker. 2004. Analysis of System Strategies Targeting Near-Term Building America Energy-Performance Goals for New Single-Family Homes. NREL/TP-550-36920. Golden, CO: National Renewable Energy Laboratory. October.
IBACOS. 2000. Civano Pilot Community Project Progress Report. Pittsburgh, PA: IBACOS, Inc. September 12.
NAHB Research Center. 2004. Final Report: Zero Energy Home, Armory Park del Sol. Upper Marlboro, MD: NAHB Research Center. June 30. (http://www.toolbase.org/docs/MainNav/Energy/TucsonZEH1Report.pdf)
---. 2006. Tucson ZEH Monitoring Results. Available online: http://www.toolbase.org/tertiaryT.asp?TrackID=&CategoryID=1979&DocumentID=4783. ToolBase Services, NAHB Research Center.
14
Nordman, Bruce, and Jim McMahon. 2004. Developing and Testing Low Power Mode Measurement Methods. P500-04-057. Sacramento, CA: California Energy Commission. September.
Parker, Danny. 2003. "Research highlights from a large scale residential monitoring study in a hot climate." Energy and Buildings. 35 (9): 863-876.
Parker, Danny, and Philip Fairey. 2004. Internal Gains Derived from Monitored Field Data. Available online: http://www.fsec.ucf.edu/~pfairey/igain/. Florida Solar Energy Center.
US DOE. 2004. 2004 Buildings Energy Databook. Washington, DC: U.S. Department of Energy, Office of Energy Efficiency and Renewable Energy. August. (buildingsdatabook.eere.energy.gov)
---. 2005a. Home Energy Use and Costs: Residential Energy Consumption Survey (RECS). Available online: http://www.eia.doe.gov/emeu/recs/contents.html. EIA, Energy Information Administration, U.S. Department of Energy, Washington, DC. August 22.
---. 2005b. 2004 Electric Sales, Revenue and Price. Available online: www.eia.doe.gov/cneaf/electricity/esr/esr_sum.html. Washington, DC: Energy Information Administration, U.S. Department of Energy. December.
---. 2005c. Annual Energy Outlook 2005, with Projections to 2025. DOE/EIA-0383(2005). Washington, DC: Energy Information Administration, U.S. Department of Energy. February. (www.eia.doe.gov/oiaf/aeo/)