Embed Size (px)
Citation preview

Applicability of Microcomputer sfor Managing Water Us e
in Small River Basin s
b y
Roy W . Koc h
Water Resources Research Institut eOregon State Universit y
Corvallis, Orego n
WRRI-97
August 1984

APPLICABILITY OF MICROCOMPUTERS FOR MANAGING WATER US E
IN SMALL RIVER BASINS
by
Roy W. KochDepartment of Civil Engineerin g
Portland State University
Final Technical Completion Repor tProject Number G864-0 7
Submitted to
United States Department of the InteriorGeological Survey
Reston, Virginia 22092
Project Sponsored by :
Water Resources Research Institut eOregon State Universit yCorvallis, Oregon 9733 1
The research on which this report is based was financed in part by the Unite dStates Department of the Interior as authorized by the Water Research an dDevelopment Act of 1978 (P .L . 95-467) .
Contents of this publication do not necessarily reflect the views an dpolicies of the United States Department of the Interior, nor does mention oftrade names or commercial products constitute their endorsement by the U .S.Government .
WRRI-97
August 1984

ABSTRACT
The task of managing water resources under the appropriative system o f
water rights in the Western United States normally becomes one o f
simply assuring that the legal priority is satisfied . Since
irrigation is the primary use of water, to maximize availability i n
such a tightly constrained system requires the cooperation of users b y
increasing efficiency. To accomplish this, information on the bes t
timing and amount of water application is required . As an aid to th e
local individual such as a watermaster or irrigation district manage r
in making decisions on distribution and providing information to wate r
users on water availability, software has been developed to allow th e
necessary analysis . Principal data requirements are : legal informatio n
on water rights, effect of diversions on timing and rate of streamflow ,
and estimation of short term future water requirements . The
microcomputer-based series of programs, consisting of a Water Rights an d
Water Use Data Management system and a Hydrologic Simulation System, wer e
developed for the Apple IIe computer . The data management system provide s
information such as priority date, location and amount of each water righ t
along with the type of crop, soil and irrigation method . These data are
used in the simulation program which performs a field by field moistur e
balance and a river routing computation to evaluate the effects of th e
selected water distribution strategy . Both the soil moisture dynamics an d
river routing are described using simple, yet physically-based models ,
requiring a minimum of calibration and computation time . Tests of the

simulation system indicate the models are appropriate to this type o f
application . Based on the large amount of data and number of
computations, the personal computer does not appear appropriate to thi s
task ; the more powerful microcomputer, including hard disks, would be mor e
suitable due primarily to speed of operation and storage capability .
ii

FOREWORD
The Water Resources Research Institute, located on the Oregon Stat e
University campus, serves the State of Oregon . The Institute fosters ,
encourages and facilitates water resources research and educatio n
involving all aspects of the quality and quantity of water available fo r
beneficial use . The Institute administers and coordinates statewide an d
regional programs of multidisciplinary research in water and relate d
land resources . The Institute provides a necessary communications an d
coordination link between the agencies of local, state and federa l
government, as well as the private sector, and the board researc h
community at universities in the state on matters of water-relate d
research . The Institute also coordinates the interdisciplinary program
of graduate education in water resources at Oregon State University .
It is Institute policy to make available the results of significan t
water-related research conducted in Oregon's universities and colleges .
The Institute neither endorses nor rejects the findings of the author s
of such research . It does recommend careful consideration of th e
accumulated facts by those concerned with the solution of water-relate d
problems .
iii

ACKNOWLEDGEMENT S
Many individuals participated in both the development and execution o f
the ideas presented in this report . Vern Bissell, Hydrologist i n
Charge of the National Weather Service, Northwest River Forecas t
Center, was helpful in identifying the potential of this work . Newt
Perry, Oregon Department of Water Resources, discussed the State interest s
in the ideas and helped identify potential study areas . Monte McVay ,
U .S . Bureau of Reclamation, and Palmer Torvend, Manager of the Tualati n
Valley Irrigation District (TVID), were both instrumental in familiarizin g
us with the TVID and providing the data used to test the models .
Much of the program development and testing was performed by Rod Alle n
as part of his Master's Thesis . Additional assistance was provided by
Greg Jones and Dan Clark on development of the Data Management System, an d
by Theron Argraves in data reduction . The assistance of all thes e
individuals was instrumental in the success of this work .
iv
LIST OF CONTENTS
CHAPTER
Page
ABSTRACT
ACKNOWLEDGEMENTS
LIST OF FIGURES
LIST OF TABLE S
I
INTRODUCTION
Problems in Local Water Management
2
Project Objectives
4
II
SURVEY OF RELATED WOR K
III A WATER MANAGEMENT SYSTEM
System Structure
System Operation
Microcomputer Hardwar e
Programming Languag e
IV
DATA MANAGEMENT SYSTEM
Data Requirements
1 7
Water Rights and Water Use File
19
i
i v
vi i
viii
1
7
1 1
1 1
1 2
1 4
1 5
1 7
v

Chapter Page
V HYDROLOGIC SIMULATION SYSTEM 25
Model Requirements 25
Soil
Moisture Dynamics 26
Streamflow Routing 36
VI EVALUATION 45
Summary of the System 45
Evaluation of the Data Management System 45
Evaluation of the Hydrologic Models 46
Overall
Evaluation 46
REFERENCES 49
v i

LIST OF FIGURE S
FIGURE Pag e
1 General Flow Chart for the Water Rights and Wate rUse Data Management System
2 1
2 Sharp Wetting Front Model
for Soil
MoistureSimulation
2 7
3 Unsaturated Hydraulic Conductivity as a Functio nof Soil
Moisture .30
4 Assumed Behavior for Evapotranspiration as a Functionof Soil
Moisture31
5 Comparison of Simulated and Observed Soil
Moisture 35
6 Comparison of Simulated and Observed Streamflow fo rthe Tualatin River at Farmington Bridge
43
vi i

LIST OF TABLES
TABLE Title Pag e
1 Water Rights and Water Use Data File Contents 1 9
2 Soil
Properties and Crop Consumptive Use Coefficien t
for Field Application of the Soil
Moisture Model3 4
3 Location of River Reaches for Application of th e
Routing Algorithm to the Tualatin River Basin
39
4 Typical
Parameter Values for the Tualatin Rive r
Basin
40
5 Values of the Transition Matrix,
, for th e
Tualatin River Basin
41
fi Values of the Input Response Matrix, A , for th e
Tualatin River Basin
41
vii i
CHAPTER I : INTRODUCTION
To manage the distribution and use of water within the legal an d
hydrologic systems of the Western United States is indeed a difficul t
task . Legally, the appropriative doctrine governs the use of water ,
requiring, in general, that priority be associated with the date o f
first application or use . Administered at the state level, this give s
seniority to the historic early users . The amount allotted is generall y
restricted to that reasonably required for the proposed use . The
climate of this region is such that irrigation is required fo r
agriculture and has become the principal use of water . Hydrologically ,
the temporal distribution of water is out of phase with irrigatio n
demands . In most situations, high flows occur in the late spring o r
early summer as a result of either winter rains or spring snowmelt .
However, major water requirements occur in the mid to late summe r
months . In addition, there are many smaller river basins where storag e
facilities are either limited or nonexistent, making the users dependen t
on natural flows which are often insufficient during peak deman d
periods .
As a general objective, a state may wish to maximize the beneficial use s
of its water . This may take the form of attempting to satisfy more of
the existing irrigation water rights during low flow periods, thu s
increasing economic output . In addition to the consumptive use demand s
of irrigated agriculture, a new group of competing, nonconsumptive ,
1
demands have arisen over the last decade or so . These are instream use s
of water for such purposes as maintenance of aquatic habitats and wate r
quality . In many states, water rights have been filed for these uses .
However, they are junior to the many existing rights, and therefore ma y
not be satisfied during some of the more critical periods withou t
providing storage facilities .
One means of mitigating the conflicts and thus maximizing the beneficia l
use is through improved efficiency by irrigation . If less water i s
used, then more will be left in the stream . In this case, efficiency i s
defined in terms of proper timing and amount of water use . This i s
difficult without the cooperation of the water users . However, ther e
arepossible advantages, including improved crop yields, more efficien t
scheduling of irrigations relative to other tasks, decreased irrigatio n
costs and better community cooperation . For irrigation districts, wher e
control over the water is more centralized, it may be considerabl y
easier to realize results of increased supplies from improved water us e
and scheduling .
Problems in Local Water Managemen t
Those responsible for the day-to-day administration and management o f
water resources at the local level, such as a water master for th e
state, or the manager of an irrigation district, are faced with a
formidable task . The manager must at least assure that the legal
priorities are satisfied . For a small river basin, there may be as man y
as several thousand water rights and, in an irrigation district, severa l
hundred members . Thus, a major requirement for more effectiv e
2

management is efficient record keeping in terms of storage an d
retrieval . As an example, a water master may wish to know how man y
water users with junior rights are located above an irrigator who is no t
receiving adequate flow in order of their priority date . Currently ,
this must be researched manually and can become complex if there ar e
several upstream tributaries . In addition to the record keepin g
function, the manager often requires information on river travel time s
if water is to be released from storage in anticipation of downstrea m
demand . This is often estimated empirically so that flow can be mad e
available at approximately the time it is needed .
A function that would significantly enhance management capabilities i s
the estimation of the location and timing of future water demands . The
ability to forecast when a user is likely to require water requires a n
accounting of soil moisture in response to crop consumptive use on a
field by field basis . With this information, the manager can begin t o
advise the users on irrigation scheduling including suggesting rotation s
when available flows are low . In addition, demand forecasts provid e
information necessary for operation of any reservoirs in the system .
Thus, the prediction of water demand could allow the manager t o
realistically evaluate future distribution and operation schemes ,
resulting in more efficient operation and use of the available supply .
In summary, there are three primary requirements for local wate r
management : (1) more efficient record keeping, (2) streamflow routing t o
predicttravel time and (3) soil moisture accounting to forecast wate r
demand . The integration of these three functions would allow the

manager to advise for more efficient water use .
Project Objectives
The problem of improving water use efficiency to provide additiona l
supplies and mitigate conflicting uses within small river basins ha s
been identified, along with the major tasks and information requirement s
of the local water manager . The general objective of this project is to
investigate how microcomputer technology can be developed and integrate d
into the day-to-day decision making and to begin the development an d
testing of such a system . The hypothesis is that the microcomputer
provides an appropriate technology for application at this level o f
decision making due to a combination of its cost and computationa l
capabilities and that it can serve as an economical tool in improvin g
the efficiency of water use . To evaluate this hypothesis require s
several specific tasks that have been undertaken throughout the cours e
of this project . These are :
1. Develop the concept of a Water Management System Mode l
which satisfies the needs of the local water manager ;
2. Investigate microcomputer hardware in terms of storage
capability and computational speed ;
3. Investigate microcomputer software in terms of language
availability and compatibility between machines ;
4

4. Identify what information is required in the local water
management process and develop a system to process thes e
data ;
5. Identify what properties the hydrologic model components
must have to be consistent with the computer hardware ;
6. Select and/or develop appropriate hydrologic models fo r
use in the management system ; an d
7. Evaluate the performance of the computer and variou s
system components using data from a specific study area .
5

CHAPTER II : SURVEY OF RELATED WORK
Much of the research related to agricultural water management ha s
focused either on the operation and management in large river basin s
(e .g . Morel-Seytoux, 1979), often with extensive reservoir systems, o r
onthe agronomic and mechanical aspects of on-farm cropping, wate r
deliveryand application systems . There has been limited attention t o
the requirements of the water manager whose responsibility may becom e
aiding in irrigation scheduling on a small river basin or projec t
level . In particular, there is no published work integrating wate r
management duties through the use of microcomputer technology .
Even though no specific work has been reported covering the entir e
problem, there has been considerable work on various aspects of th e
problem and on related applications . As an aid to the conceptua l
development and design of microcomputer software, Hromadka et al . (1983 )
have presented numerous suggestions based on their experience to produc e
"humanized" computer programs . Particular emphasis is devoted to (a)
the logic, to assure that it follows the usual thought processes of th e
user when solving the problem ; (b) the input, to allow the user to se e
an entire "page"at a time and thus to first review the required data an d
then check the input, and (c) providing output in a useful tabular o r
graphical form . Prior to program development, the entire problem mus t
be defined, including decision points and interactions between progra m
elements .
7

Some of the functions of the water management system have been describe d
by Sutter et al . (1983) . In this case, the State of Idaho i n
conjunction with the U.S . Bureau of Reclamation (USBR) has developed a
computerized model of the Upper Snake River system to aid in th e
accounting of natural flow and storage water . Included are the water
rights and major diversions ; but no soil moisture accounting or rive r
routing are described . However, streamflow data are used on a real-time
basis to operate the system .
Scheduling irrigation has been an interest of the USBR for many years .
Termed the Water Management and Conservation (WMC) program (e .g . USBR ,
1981), this activity has evolved from one purely of field measurement s
of soil moisture to a combination of measurements and accompanying soi l
water balance computations . A suite of programs are available fo r
several minicomputers and microcomputers for this purpose (e .g . USBR ,
1983) . Typically, the crop coefficients necessary for use in thes e
programs aredeveloped by extensive field measurements (McVay, 1983) .
Thus, several of the pieces of the problem have been addressed but hav e
not been integrated . In addition, an intensive measurement scheme is an
expensive undertaking and, for large areas, must be replaced by a
reliable, computational model .
Modeling of the hydrologic system has been the subject of considerabl e
research, both in the area of soil moisture dynamics and streamflo w
routing . In the description of soil moisture, much has,been done wit h
the numerical solution of the one dimensional partial differentia l
equation governing soil water transportation (e .g . Remson et al ., 1971) .
8

This approach is quite computationally intensive and, although i t
provides detailed information, is not appropriate for repeated use in a
management problem . Simplifications of the process have been propose d
which provide an approximate solution to the problem . Dagan and
Bressler (1983) have presented such approximations ; however, they stil l
require numerical (iterative) solutions and are thus als o
computationally burdensome . An important aspect of soil moistur e
dynamics is evapotranspiration (ET) since it is this process tha t
accounts for the consumptive use . ET depends on the soil, plant an d
atmospheric conditions . It has been modeled in a very complex manne r
incorporating all of these aspects individually (Saxton et al ., 1974) o r
in an empirical manner as a function of potential evapotranspiration an d
crop coefficients . This latter approach utilizes the crop coefficien t
information together with either pan evaporation or potential E T
estimated from climatological variables (Jensen, 1973) .
In contrast to point estimates of soil moisture, water balance in th e
upper soil zone have been developed for use in watershed models tha t
reflect the lumped behavior of relatively large areas . These models ar e
conceptual rather than physically based and the parameters do no t
necessarily represent the physical quantities but, rather the behaviora l
properties . Thus, they require calibration prior to use which has been
found to be a difficult task (e .g . Sorooshian and Gupta, 1983) .
Although simple algebraic expressions such as these conceptual model s
are necessary for a management model, they should be physically based ,
have physically meaningful parameters, and require a minimum o f
calibration .
9

Streamflow routing has been studied in detail over the years . Weinmann
and Laurenson (1979) review a number of approximate methods, concludin g
that they are completely adequate but that parameter estimation i s
important . The traditional hydrologic routing methods are computation -
ally efficient and have been related to the hydraulics of the unstead y
flow process by Cunge (1969), who has shown the significance of th e
parameters in the Muskingum routing equation in terms of variables o f
the physical system . In addition, Ponce and Yevjevich (1978) have
extended the traditional Muskingum method to have variable parameters ,
thus allowing for a nonlinear effect with nearly equal computationa l
efficiency . Thus, it appears that existing routing algorithms ar e
available and need only to be formulated to fit the particular routin g
problem .
10

CHAPTER III : A WATER MANAGEMENT SYSTE M
To provide a tool which meets the needs of the local water manage r
requires the integration of several technologies . The microcompute r
serves as the central component of the proposed system, due to recen t
advances in the technology which have made them powerful and ye t
relatively economical . They have therefore become appropriate for use
in small-scale operations, particularly when tasks such as wor d
processing and bookkeeping can also be incorporated . The microcompute r
is the information processing unit which combines all of the relevant
legal and hydrologic information, simulates the system and provide s
estimates of the outcome of various decisions . The philosophy is to
allow the user to be the decision maker and use the computer to perfor m
the data handling, synthesis and simulation .
System Structur e
A natural structure for this computerized system seems to follow from a
basic understanding of the major tasks to be performed . The major
components are :
1. Water Rights and Water Use Data Management System ;
2. Hydrologic Data Management System ; and
3. Hydrologic Simulation System .
11

The Water Rights Data Management System (WRDMS) performs basic recor d
keeping functions necessary for water distribution and provide s
information for system simulation . The Hydrologic Data Managemen t
System (HDMS) provides input necessary for system simulation in the for m
of climatological data and streamflow . This component is not dealt wit h
here in that it is the subject of a subsequent project ; however, thi s
data file and management system are intended to provide continuousl y
updated information as well as forecasts for use in the simulations .
Finally, the Hydrologic Simulation System contains models of th e
relevant hydrologic processes (soil moisture and streamflow) which allo w
the estimation of the 'state' of the system based on distributio n
strategies selected by the user . Analysis of the simulated streamflow
then provides a basis for deciding if any of the requests for water mus t
be denied and also how any reservoirs in the system should be operated .
System Operatio n
The integration of these system components through the microcompute r
provides what can be called a Decision Support System (DSS) for loca l
water management . Such a system provides the user with the ability t o
evaluate alternative strategies by simulating their impact . The two
data management systems are used to provide information to th e
simulation program . The user then provides a water distribution
scenario which is simulated, providing an estimate of its feasibility .
Assuming that forecast values of climatological data and inflows to th e
river system are available for the selected period (one to seven days) ,
12

as well as the initial river flows and soil moisture values, th e
progress of a typical simulation for a given day is :
1 . Read the forecast climatological data and comput e
potential ET ;
2 . Build a working file of all necessary physical an d
climatological data in order of priority, one recor d
per water right ;
3 . Accept an estimate from the water manager of how man y
of the rights that need water are to be satisfied ;
4 . Read the working file, one record at a time, and updat e
the soil moisture based on :
a. If the soil moisture is depleted to the lowe r
limit, assume an irrigation is required an d
refill the soil moisture to the field capacity ;
b. If no irrigation is required, compute th e
consumptive use during the day and decreas e
the soil moisture ;
5 . Accumulate the required diversions for irrigation b y
river reach ;
6 . Compute the flow rate at the end of each reach base d
on initial conditions, inflows and estimated diversions ;
7 . Output the flow rate and accumulated diversion infor-
mation for each reach ; and
8 . Evaluate the results to see if more or less water i s
likely to actually be available and resimulate, i f
necessary .
13

Microcomputer Hardwar e
Even though the primary effort of this project is the development of
supporting software, the microcomputer itself is a key element . The
success and utility of the system depend on the ability of the machin e
to perform the data handling and computations within a reasonable length
of time, probably on the order of a few minutes for a simulation . This ,
in turn, depends on the storage capacity of the computer and the spee d
of computation and access of peripheral data storage devices such as
disk drives .
Although it is difficult to keep pace with the advances i n
microcomputers, at this time, a reasonable differentiation exist s
between those that are considered 'personal computers' (PC's), such as
the Apple IIe and the IBM PC, and a more powerful class developed for
commercial and scientific applications such as the IBM XT or th e
CROMEMCO systems . The difference in cost between these classes is o n
the order of 2 to 3 times, depending on peripheral devices, with the
PC's priced in the $2,500 range . Typically, a PC has 64 to 128
kilobytes (KB) of memory while the more powerful models will have 256 KB
or more . There may also be significant differences in th e
microprocessor, with the larger machines configured around a 16 bi t
microprocessor such as the 68000 used in the CROMEMCO system .
Since a significant amount of data handling and file manipulation in the
form of reading and updating is required, a key element is th e
peripheral devices . Normally, data files are stored on either 5-1/4 o r
8 inch floppy disks . For the case when an entire file cannot be rea d
14
into the central memory of the computer, repeated access is require d
which can be quite time consuming . Two disk drives would normally b e
included in the price of a PC . A hard disk would provide data retrieva l
at a rate at least five times faster than the floppy disks . These units
have storage on the order of 10 to 20 KB and are often used with th e
more powerful systems . They are also available for the PC's at a cost
in the neighborhood of $2,000 .
Since it is impossible to forecast the ultimate performance, an Appl e
IIe computer with two disk drives was selected for use in this project .
This selection was based on the availability of equipment and th e
feeling that, if the system worked reasonably well on a small PC, an y
improvement in hardware would only enhance its performance . On the
other hand, if the Apple IIe proved to be too slow or have inadequat e
memory, attention could be focused on the more powerful models in th e
future .
Programming Languag e
After selection of the computer, the programming language must b e
selected . Most of the PC's and all of the more powerful computers hav e
compilers for BASIC, FORTRAN and PASCAL . Upon inspection, it appear s
that there are many different versions of BASIC, with nearly eac h
machinehaving a slight variation . For many years, FORTRAN has been th e
standard language for scientific computing . In addition to this, it is ,
in general, completely standardized, the newest version being FORTRA N
77 . After considering the transferability of the code between machines ,
FORTRAN was selected as the programming language to minimize th e
15

incompatibility . In any transfer between computers, changes in fil e
handling, job control and possibly input and output (I/0) statements may
be required . However, it was felt that FORTRAN would minimize change s
in the simulation code .
16

CHAPTER IV : DATA MANAGEMENT SYSTE M
One of the major problems faced by the local water manager is data an d
information handling . Ultimately, any local water management system
must be equipped with a versatile data base management system as a mean s
of both storing and retrieving these significant volumes o f
information . Such a system would allow searches of the list of wate r
users to provide listings by such indicators as location or priorit y
date, and, in the case of an irrigation district, may provide a base fo r
annual assessments . The development of such a program is, however, mor e
in the realm of computer science and is somewhat outside the scope o f
this project . The immediate objective for this work, in terms of dat a
management, is to develop software capable of building, maintaining an d
using data relevant to the system simulation . To accomplish thi s
required first the identification of relevant data and, second, th e
development of necessary software .
Data Requirement s
The information necessary for a simulation includes a combination o f
legal and physical data for each water right . These data must allow th e
identification of the priority for water use, the location of th e
diversion and application, the amount of water allowed, and the amoun t
required . Priority of use depends simply on the date attached to eac h
water right based on the "first in time, first in right" principle . In
addition, the permit number may also be of interest to the manager .
17

Along with the priority date, there are restrictions on use in terms o f
location of diversion and application, flow rate, and volume (in th e
Oregon system), all of which are specified in the water right permit .
The water must be diverted from the river and used at the locatio n
indicated at a rate not to exceed that specified . Finally, the acreage
of the particular field is also included .
Determination of the amount of water required must be based on a soi l
moisture balance, in the case of irrigation . This requires som e
knowledge of soil properties and crop type, which, along with th e
acreage, dictate the water requirements and rate of depletion of soi l
moisture . An additional consideration is the method of irrigation ,
which determines the efficiency of use and, thus, the amount o f
application .
For any small river basin or irrigation district, there will be a
relatively small number of individual soils, crops and irrigatio n
methods . Water balance computations require several soil propertie s
which are generally related to the soil type, e .g . that assigned by th e
Soil Conservation Service (SCS) during a soil survey . Rather than
maintain several parameters in the water rights and water use data file ,
each soil is identified by a single number code which is then translate d
into the respective soil properties in building a working file for us e
in the simulation . A similar approach is taken for the crop an d
irrigation method, each being given a code which is translated into cro p
consumptive use coefficients, root zone depths and irrigatio n
efficiencies prior to simulation .
18

Water Rights and Water Use Fil e
The contents of one record of the water rights and water use file are
given in Table 1, including the name of each data field, the variabl e
type, its length and the range of values allowed .
Table 1
Water Rights and Water Us e
Data File Content s
Field NameVariabl eType
Fiel dLength
Range ofValues Units
Priority Number Integer 4 0-9999
Diversion Reach Integer 3 0-999
Return Reach Integer 3 0-999
Flow Rate Allowed Real 6 0-999 .99 cfs
Volume Allowed Integer 5 0-32767 ac-ft
Permit Number Character 8 0-9999999
Priority Date Character 8 0-1983 .123 1
Type of Use Code Integer 1 0-9
Irrigation Method Integer 1 0-9
Crop Code Integer 2 0-99
Soil
Code Integer 2 0-99
Acreage Integer 4 0-9999 acres
Soil
Moisture Real 4 0-1 .00
Year to Date Use Integer 5 0-3276 7
Zone Code Integer 1 0-9
Since there is one record for each water right or water user, the entire
file would contain as many records as there-were individual rights .
19

There are several fields not directly discussed previously that hav e
been included for completeness . A code for the type of use has bee n
included to allow for the possibility of water uses other tha n
irrigation, such as for municipal or industrial purposes . A zone code
inthe last field is used to identify in which climatic zone a wate r
right is located . Since use may be spread over reasonably large area s
and climatic factors such as precipitation or temperature may differ ,
this code has been included to indicate which climatic data should b e
used inpotential ET and soil moisture computations .
A brief flow chart of the program for creation and manipulation of th e
water rights and water use data file is given in Figure 1 .
The system startup file loads Program HDRV1, the overall drivin g
routine, and displays the first screen, a credit to the authors . It i s
followed by a request for the current date . The date is a four digi t
integer stored in the header of each file .
After the date is accepted, the HDRV1 system proceeds with the followin g
question :
Shall We :
1. Update or Adjust Files ?
2. Input Projection Data ?
3. Run Analysis of Watershed ?
Please choose a number . . .
This is the first of several responses required . The valid answe r
20

TuIz.N APPLEoN WITi ~Di~kS 11.1
Piz1VE
PISo&gA SI4 t7 V 1
5 Ut31ZoLTI kJ EMf?NU 2... IM::.g.ol)TI NIEs -re,
(,OAD F1LEI N Fo4MATIOI.1 :
TlZ T Dt7E LTAUNNoWNI-►7DF
5U~1`oUTI JELIST
5USFZ4UTIN1 EPEL ETE
5U8g.oLTl NEI KJ E ftT
FIGURE 1
General Flow Chart for the Water Rights
and Water Use Data Management System
21

to this question is an integer from 1 to 3, so the program will as k
again if given any other response .
The update and adjust data option allows for the change of informatio n
in any of the data files . Files such as hydrologic data, routin g
coefficients, return flow data, and water right information may need to
be adjusted periodically at frequencies currently unknown .
Choosing option one (update or adjust files) will advance the program
into a group of subroutines driven by Program Menu2 .
After choosing option one, the screen clears and fills with a new menu ,
referred to as Menu2 :
Choose the file to manipulate from those belo w
1. Water Right File (WTRRTD )
2. The Delta File (DELTA )
3. The File of Unknown Returns (UNKNOWN )
4. Hydrologic Data File (HDDF )
5. The End .
Please choose a number now . . .
The DELTA file contains data used in streamflow routing and the UNKNOW N
file is meant to contain data on return flows in the river system as a
result of inefficient irrigation .
An acceptable response to the menu prompt is an integer between 1 and
5 . A response of 5 returns the user back to the power-up menu . Any
22
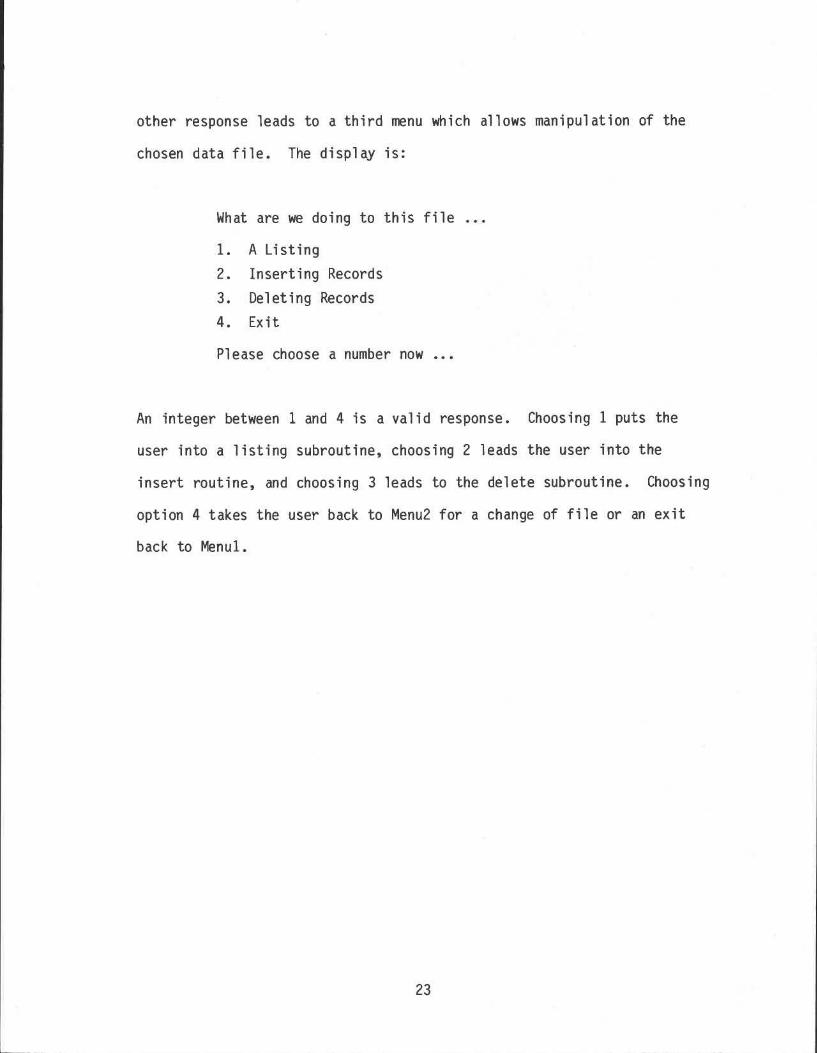
other response leads to a third menu which allows manipulation of th e
chosen data file . The display is :
What are we doing to this file . . .
1. A Listing
2. Inserting Records
3. Deleting Records
4. Exi t
Please choose a number now . . .
An integer between 1 and 4 is a valid response . Choosing 1 puts th e
user into a listing subroutine, choosing 2 leads the user into th e
insert routine, and choosing 3 leads to the delete subroutine . Choosin g
option 4 takes the user back to Menu2 for a change of file or an exi t
back to Menul .
23
CHAPTER V : HYDROLOGIC SIMULATION SYSTE M
Model Requirement s
To provide the manager with estimates of water demand for a system-wher e
irrigation is the primary use requires an accounting of the soi l
moisture . This dictates the irrigation scheduling as well as th e
effectsof diversions on the river flowrate . Soil moisture computati-ons
must beundertaken on a field by field basis corresponding to the variou s
water users . Thus, there may be from several hundred to severa l
thousand computations for each simulation time period . This, of course ,
requires an efficient computational scheme . In addition, it pose s
serious practical problems if calibration is required, due to the larg e
number of sites, which is in contrast to the lumped approach of mos t
watershed models . Thus, a model of soil moisture dynamics must be
sought that is simple and has parameters that reflect physical soi l
properties .
Routing of streamflow can be accomplished on the basis of rive r
reaches . These may be defined based on homogeneous physical properties ,
such as width, slope or roughness, at convenient measurement points o r
atlocations where major tributaries enter the system . The selection o f
hydrologic routing requires that each reach be viewed in a 'lumped '
manner . Thus, all diversions and return flows within each reach can b e
accumulated for a given time period (day) . The routing algorithm then
requires flow at selected convenient locations as output from eac h
routing computation for use by the manager .
25

The microcomputer is at present inherently slower than the more powerfu l
mainframe . Thus, the hydrologic simulation models must be
computationally efficient in order to minimize run time for a
simulation . However, the process models must also describe the syste m
in a realistic manner if useful results are to be obtained . Thes e
competing goals of simplicity and accuracy guide the search an d
development of hydrologic model components .
Soil Moisture Dynamics
As indicated previously, past efforts to model the dynamics of soi l
moisture have involved either computationally intensive and inefficien t
models or conceptually based descriptions suitable for large ,
heterogeneous areas . Neither of these types of models- was sufficien t
for the purposes of this work . To accomodate the requirement of thi s
particular application, a simplified, physically based model has bee n
developed based on the principle of volume conservation in the root zon e
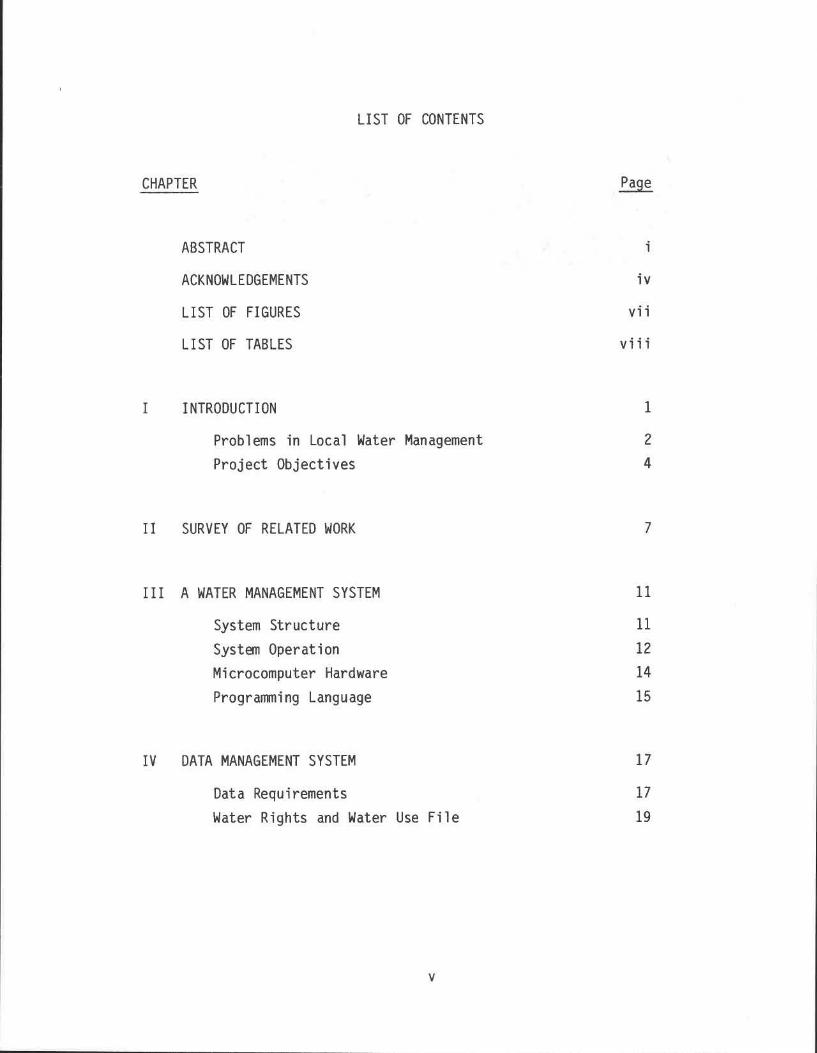
and an assumed soil moisture profile shape . The sharp wetting fron t
model was selected as an approximation to the distribution of soi l
moisture, as shown in Figure 2 . This assumes a uniform initial soi l
moisture ei, and a 'piston' shaped soil moisture profile at the end of
an irrigation or rainfall event with moisture equal to eu above th e
wetting front and ei below the wetting front . The continuity equation
for soil moisture after an irrigation or rainfall can then be writte n
as :
= -q(e) - ET(e)
(1 )
'26

soil moisture
0.I 0 u
zFIGURE 2
Sharp Wetting Front Model for Soil Moisture Simulatio n
27

where 0
is the volumetric water content per bulk volume of soi l
q(0) is the drainage rate, e .g . in ./day
ET(e) is the evapotranspiration rate, e .g . in ./day
Assuming the profile remains as a sharp front allows it to be tracked t o
determine when the front reaches the base of the root zone .
Drainage is modeled assuming that capillairy effects are negligible . In
this event, the drainage rate is simply the unsaturated hydrauli c
conductivity, K(O), so :
q(e) = K(e)
(2 )
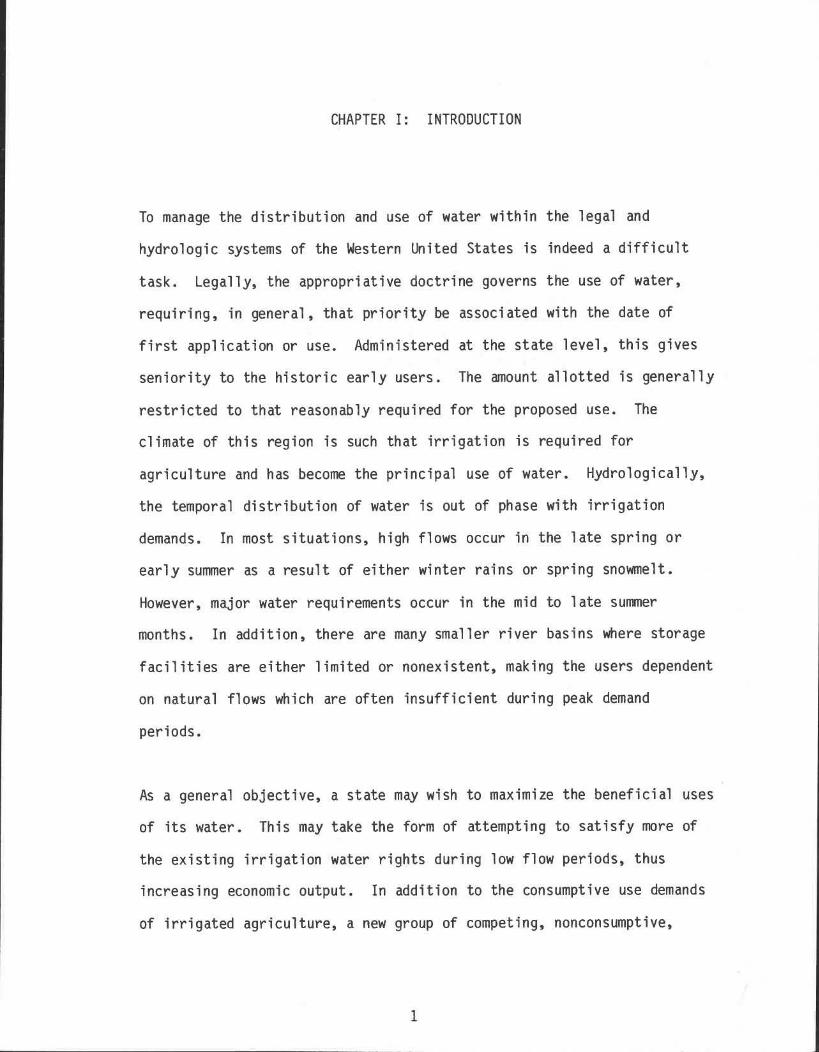
The hydraulic conductivity is a function of the soil type and soi l
moisture and can be approximated by a function of the form (Corey, 1977 )
0 , for e<efc
Ks(e-efc )n, for Ofc<O<O ses-efc
where Ks is the hydraulic conductivity of natural saturation, e .g .in ./day
e fc is the soil moisture at field capacity . (drainage by gravitystops at this poin ,
es is the soil moisture of natural saturation, an d
n
is an empirical exponent
This is shown graphically in Figure 3 . For analytical purposes, it i s
(3 )
28

necessary to approximate this as a linear function as shown in Figure 3 ,
where K 1 is the selected maximum hydraulic conductivity .
Evapotranspiration is also modeled as a simple, piecewise function o f
soil moisture (Yaron et al . 1973) as shown in Figure 4 and given as :
ET(e) =
ETp, e?ef c
ET ( e ewp ), if ewp<e< efcefc -ewp
(4 )
where ETp is the potential rate of evapotranspiration for areference crop, an d
ewp is the soil moisture at the permanent wetting point .
Actual evapotranspiration is a function of the crop type, so tha t
AET = KcET(e)
(5 )
where AET is the actual evapotranspiration, an d
Kc is the crop coefficient .
The potential rate of evapotranspiration can be computed from any numbe r
of equations, such as the expression developed by Jensen and Hais e
(e .g . Saxon and McGuinness, 1982) :
ETp = (0 .025T + 0.078)Rs
(6 )
where T is the mean daily temperature, celsius, an d
Rs is the solar radiation (cm/day) .
29

•
•
S
% •
w
t(sl•
(9
CINLNII_AIIA lJflONOJ 31 gdj0A4
'et
V )
30

LU
r-- 1LL
co 1. co Lf)
.t CT) N
NO Ilt_ I d NtalldtiJI3
31

The solution of the continuity equation for soil moisture results in two
expressions, one describing redistribution and drainage, the other ET
when soil moisture is less than the field capacity . For redistribution ,
ET is ignored for the time until the wetting front reaches the base of
the root zone, a relatively short period for many soils . For the case
when the cumulative infiltration, due to irrigation and rainfall, F, i s
sufficient to fill the soil moisture deficit, i .e ., F > (efc-ei)D ,
redistribution- will occur as :
e(t) =
efc + (eu-efc) exp (-K1(eu-efc)t/•F), for 0<t<t p
Oft + ((OD-efc) + ( es- efc)ETp/K 1 ) exp ( -K l t ( ( e s- efc) )
-(es-efc)ETp/K 1 , for t>tD
( 7 )
where tD is the time from the end of the irrigation or rainfall when
the wetting front reaches base of the root zone, an d
Qp is the moisture content at t = tD ,
QD = p + e i .
( 8 )
For the situation when F < (efc- ei)D, no drainage out of the root
zone occurs and the soil moisture is assumed to be uniformly distributed
within the root -zone at a value of e = e i + F/D . Although this does
not provide the proper spatial distribution, total water in the root
zone and the computed ET are the same as if a 'step' profile wer e
assumed .
In equation (7) all parameters except K 1 are physically based . For the
simulation model presented here, daily time steps were used . This par t
32

of the dynamics proved to be unimportant, as it occurs in times muc h
less than this . In addition, with efficient irrigation methods suc h
assprinklers, there is limited drainage out of the root zone, sinc e
applications closely approximate the soil moisture deficit . Thus ,
attention has been focused on the ET process of soil moistur e
depletion .
For the ET phase, the soil moisture is computed by solving th e
continuity equation with no drainage, leading to :
e(t) = ewp + (e i -ewp) exp (-ETpt/( efc- ewp))
( 9 )
where ei is the uniform initial soil water content at th e
beginning of the computation period, where ei < efc •
The soil moisture simulation is accomplished by applying the abov e
equation to each field that is not being irrigated, with t equal to 2 4
hours . Thus the soil water content at the end of the period results .
It is important to note that the soil moisture asymptotically approache s
the wilting point but efficient operation normally requires irrigatio n
at some critical value above ewp .
Although it is difficult to validate such equations, limited data ar e
available for such purposes where the USBR has initiated a WMC program .
This is the case in the Tualatin River Basin in Northwestern Oregon .
Using soil moisture, precipitation, temperature and solar radiation dat a
provided by the Tualatin Valley Irrigation District (TVID) and soi l
properties estimated from the Washington County, Oregon Soil Surve y
33

(Soil Conservation Service, 1982), a test of the ET phase of the soi l
moisture model was undertaken . The soil properties, as estimated fro m
the Soil Survey, are provided in Table 2 along with the crop coefficien t
for pasture (McVay, 1984, personal communication) . The field was i n
full cover by the time data were available . ETp was computed based on
the Jensen and Haise equation . The results of this simulation for th e
June to September period are presented in Figure 5 . Agreement wit h
observed soil moisture is quite good, considering that there was n o
calibration . Also, point values of precipitation, temperature and sola r
radiation for a location some distance from the field were used in the
computation .
TABLE 2
Soil Properties and Crop Consumptive Use Coefficient for Fiel dApplication of Soil Moisture Mode l
Property Symbol Value
Field capacity efc 0 .35
Available water efc- ewp 0 .20
Wilting pointewp
0 .1 5
Crop coefficient Kc 0 .85
34

U,m U,N N.3Inls I ow 1 I os
35

Streamflow Routing
Similar to the soil moisture dynamics, streamflow routing must b e
efficiently described for use on microcomputers . In this case, a
hydrologic routing model was selected : a special case of the classica l
Muskingum method (e .g . Viessman et . al . 1977 p . 232) . However, Cung e
(1969) has shown the correspondence between the Muskingum routing metho d
and the diffusive wave approximation of the St . Venant equations .
Further, Ponce et al . (1978) and Weinmann and Lawrenson (1979 )
demonstrate that this is an adequate approximation for most practica l
river routing problems .
The basis of this method is the storage equation :
dS=I - Q
dt
where S is storage in the river reach
Q is outflow from the reach, in cf s
I is inflow into the reach, in cf s
and an equation relating storage to inflow and outflo w
S = K(xI + (1-x)Q )
where K and x are parameters
Cunge has shown that
x =1 ( 1- Q
)
2
BoxcSf
and K = ~xc
(10 )
(12 )
(13 )
36

where Q is a reference flowrate ,
B is a the width of the river ,
ox is the reach length ,
c is the wave celerity, an d
Sf is the friction slope of the stream (ofte n
approximated as the bed slope) .
The celerity or speed of movement of the flood wave can be approximate d
as the slope of the discharge-stage relationship in the neighborhood of
the referenced discharge . A further simplification can be made if th e
parameter x is set equal to zero . This gives a linear reservoi r
approximation and provides guidance in selecting a representative reac h
length (Ponce, 1980), given b y
Ax = BcSf
(14 )
This approximation is used to describe the physical process o f
streamflow routing by assuming that the river system acts as a cascad e
of linear reservoirs with reach lengths, Ox, and storage constants, K .
The model is a hydrologic one but is based on parameters that can be
estimated in terms of physically realistic variables . Computationally ,
the problem was formulated in state space notation with the stat e
variables being the flow at intermediate locations on the river . Thi s
allows efficient, recursive computation of future flows based on th e
equation
37

Q(t) = t Q(0) + A I(t )
where Q(t) is the vector of flows at various intermediat elocations in the basin ,
Q(0) is the vector of initial conditions ,
is the transition matrix ,
A
is the matrix relating the inflows to flow at selectedlocations, and
I(t) is the vector of inflows, diversions and return flow sin the various reaches .
To apply the routing model requires dividing the river into a number o f
reaches . Each reach is then modeled as a single linear reservoir .
Thus, the entire river system is represented as a cascade of linea r
reservoirs, each with a different storage constant, K, reflecting th e
hydraulics of the reach . This conceptualization of the system allows
the state transition matrix, t , representing the response of the rive r
to the initial flow conditions, and the matrix relating inflow an d
outflow, A , to be derived analytically in the usual state-space fashio n
for a linear, ordinary differential equation (e .g . Wiberg, 1971) .
To evaluate the routing procedure, an isolated storm in the Tualati n
River basin that occurred in September 1974 was selected . During that
period there was limited diversion, due to both the precipitation an d
time of year . In addition, most of the tributary streams were gaged a t
that time . A convenient number of reaches was selected, based on th e
location of existing and possible future measuring stations . Thus, mos t
were at bridges crossing the river or at major confluences . The
selected locations are given in Table 3, based on the river mile an d
location at the downstream end of each reach .
38
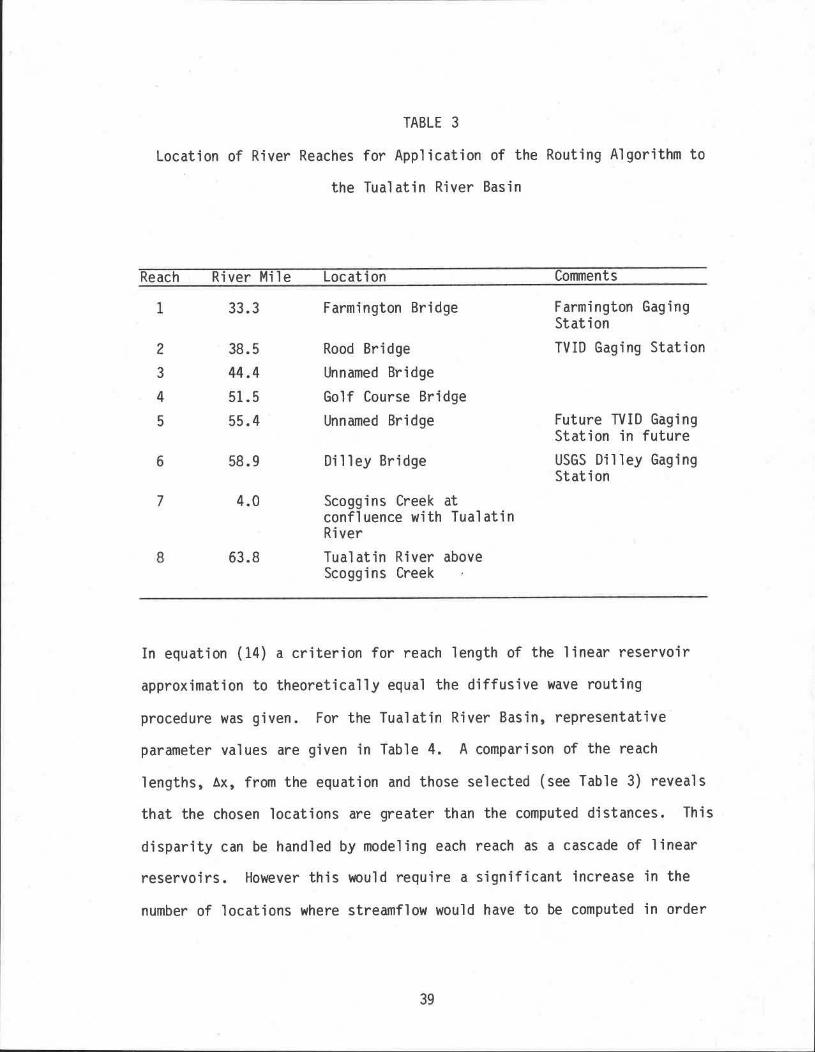
TABLE 3
Location of River Reaches for Application of the Routing Algorithm t o
the Tualatin River Basi n
Reach River Mile Location Comment s
1 33 .3 Farmington Bridge Farmington Gagin g
Statio n
2 38 .5 Rood Bridge TVID Gaging Statio n
3 44 .4 Unnamed Bridg e
4 51 .5 Golf Course Bridge
5 55 .4 Unnamed Bridge Future TVID Gagin g
Station in future
6 58 .9 Dilley Bridge USGS Dilley Gagin gStation
7 4 .0 Scoggins Creek at
confluence with Tualati n
River
8 63 .8 Tualatin River abov eScoggins Creek
In equation (14) a criterion for reach length of the linear reservoi r
approximation to theoretically equal the diffusive wave routin g
procedure was given . For the Tualatin River Basin, representativ e
parameter values are given in Table 4 . A comparison of the reac h
lengths, ex, from the equation and those selected (see Table 3) reveal s
that the chosen locations are greater than the computed distances . Thi s
disparity can be handled by modeling each reach as a cascade of linear
reservoirs . However this would require a significant increase in th e
number of locations where streamflow would have to be computed in orde r
39

TABLE 4
Typical Parameter Values for the Tualatin River Basi n
Value
Parameter Symbol Upper reaches Lower reaches
Slope Sf 0 .00063 0 .000 1
Width B 20 ft . 120 ft .
Representative Discharge Q 100 cfs 160 cfs
Wave Celerity c 1 .83 ft ./s . 1 .83 ft ./s .
Reach Length ox 4340 ft . 7308 ft .
Storage Constant K 0 .66 hr . 1 .1
hr .
for the system to have minimum number of state variables . This, i n
turn, increases the dimension of the transition and input respons e
matrices and thus requires computer storage and computation time .
Alternatively, the full Muskingum equation could be used . This approach
leads to a much more conceptually difficult problem . To explai n
briefly, the output of a 'Muskingum' reach is affected not only by th e
inflow but also by the derivative of the inflow, which makes state spac e
formulation much more difficult and not nearly as intuitive . Thus, at
this stage the linear reservoir approximation is preferred .
To overcome these difficulties, each of the reaches was modeled as a n
'equivalent' linear reservoir . That is, the response of each reach to a
given inflow was the same as if the inflow were routed through th e
required number of cascaded reservoirs . Based on this, the coefficient s
for the appropriate values for the transition and input respons e
40

matrices, 0 and A respectively, were obtained . The results are given i n
Tables 5 and 6 . These matrices may be interpreted to determine th e
outflow of a given reach due to the flow in all other reaches at th e
beginning of the day (Table 5) and any inflow (return flow or tributary )
or outflow (diversion) from any of the upstream reaches (Table 6) . Al l
blank spaces are zero . In the case of a return flow or inflow, I(t) i s
positive and for a diversion it is negative .
TABLE 5
Values of the Transition Matrix, 0 , for the Tualatin River Basi n
0 .008 0 .036 0 .137 0 .0885 0 .100 0 .024 0 .090 0 .105
0 .007 0 .068 0 .0526 0 .070 0 .017 0 .074 0 .10 7
0 .024 0 .0218 0 .035 0 .009 0 .044 0 .069
0 .0004 0 .003 0 .001 0 .007 0 .01 5
0,0002 0 .0001 0 .001 0 .004
0,0 0 .0 0 .00 1
•0 .0 0 . 0
0 . 0
TABLE 6
Values of the Input Response Matrix, A , for the Tualatin River Basi n
0 .992 0 .956 0 .819 0 .731 0 .630 0 .607 0 .517 0 .483
0 .993 0 .925 0 .872 0 .802 0 .785 0 .711 0 .677
0 .976 0 .954 0 .919 0 .911 0 .867 0 .842
0 .999 0 .997 0 .996 0 .990 0 .982
1 .000 1 .000 0 .999 0 .996
1 .000 1 .000 0 .999
1 .000 0 . 0
1 .000
4 1

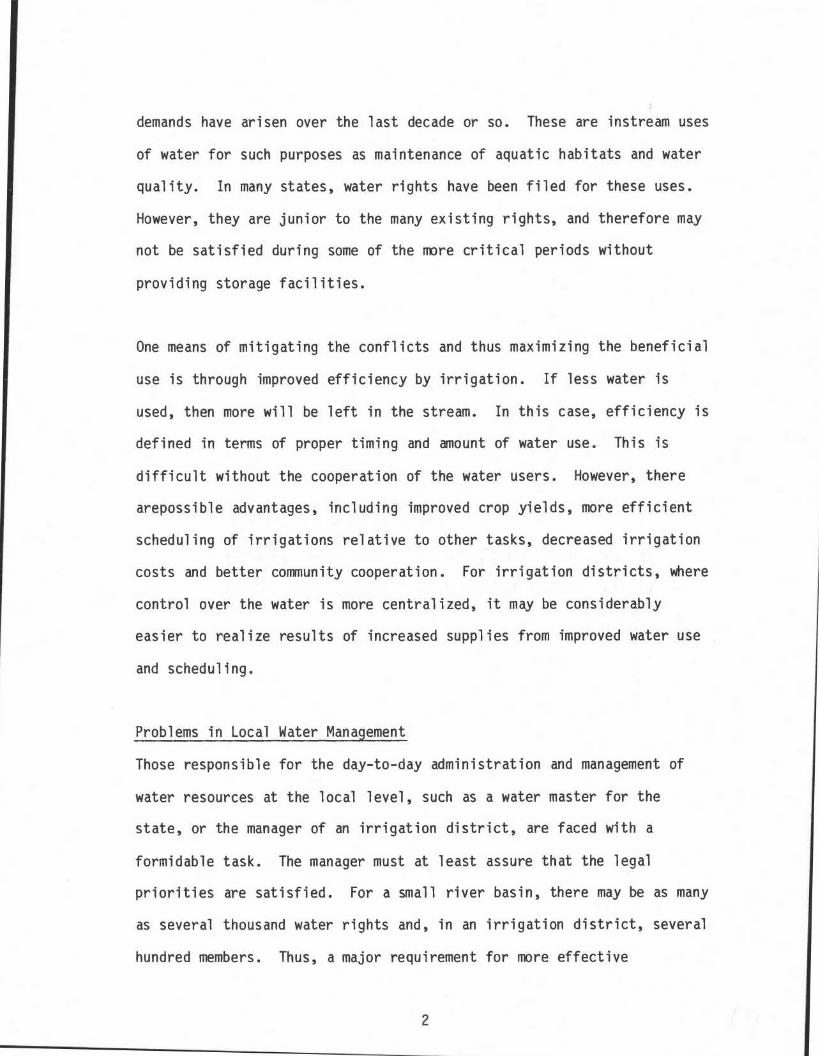
Results of the application of this method to the September 1974 storm
are shown in Figure 6 . Agreement with observed flow is good . It shoul d
be noted that no calibration of the model was undertaken ; parameter s
were based solely on the methods proposed by Cunge and the equivalent
linear reservoir concept . The streamflow routing then requires only tw o
matrix multiplications, given the intial flow conditions (results fro m
the previous computation) and the accumulated diversions and inflow to
each reach .
42

mms-0_ r
v-N
30
4.t'7
E9 m
61
`~ 61 m m l9 m m m ® m m
t S3] l 3%81-13S I 0
43

CHAPTER VI : EVALUATION
Summary of the System
Having identified possible gains in water availability throug h
increased irrigation efficiency, a microcomputer based system has bee n
proposed to guide water users in irrigation scheduling through th e
local water manager . The system is composed of a Data Managemen t
System for storing and handling data on water rights and water use an d
a simulation model for estimating irrigation requirements and th e
resulting river flows . A hydrologic data system for obtaining an d
storing real time data as well as providing forecast information i s
the subject of future research . A simplified, physically based model wa s
developed and tested for the soil moisture accounting . The resulting
equations were algebraic expressions with parameters describing physica l
soil properties . They are computationally efficient and were applie d
without calibration . A hydrologic routing scheme was used in a state
space formulation to evaluate the time variation of streamflow at selecte d
locations within the river system . The Data Management and Hydrologi c
Simulation Systems have been programmed on an Apple IIe in the FORTRA N
language .
Evaluation of the Data Management System
The program developed for storage and manipulation of water rights an d
water use data provides the necessary function of interfacing with th e
hydrologic simulation system . It is a well written, well documente d
45

program that is quite "user friendly" . As a result of the user
oriented nature, there are some inefficiencies and redundancies t o
prevent inadvertent loss of information . This, then, affects the speed of
editing data records .
Although the system works well for the particular purpose intended, i t
is not a complete data base management (DBM) system that is useful fo r
tasks other than providing the specific information required fo r
simulations . Thus, it does not meet the general need for recor d
keeping . A true DBM system would be a very valuable addition to th e
overall program but these are difficult to develop . There are ,
however, a number of commercially available programs that may b e
suitable for interfacing with the simulation model .
Evaluation of the Hydrologic Model s
The two components of the Hydrologic simulation system, soil moistur e
and river routing, have been tested and shown to reproduce observe d
data quite well with no calibration for the conditions tested . I n
addition, they are simple and therefore computationally efficient . In the
application of the models to the Tualatin River Basin, the effects o f
groundwater and return flow were not incorporated, since they have minima l
impact in this situation . In a more general case, these components must
also be included .
Overall Evaluation
The components of the local Water Management System that have bee n
developed seem to be adequate to the task and appropriate to th e
46

microcomputer technology . The microcomputer itself, in form of a PC ,
appears to be somewhat deficient in terms of both storage and speed o f
operation . Many of these problems could be overcome by the additio n
of a hard disk storage unit to the system . Particular problems of
requiring several disks to store the necessary programs and dat a
require either additional disk drives or special programming an d
repeated changing of disks . Thus, the hard disk is an attractiv e
alternative . It also appears as if the PC may not be appropriate i f
other tasks are to be combined with the water management activities o r
if multiple users are anticipated . Thus, the more advance d
microcomputers are suggested for consideration as being mor e
appropriate to the task .
The simulation program components have shown very encouraging results .
The soil moisture model needs to be tested under a broad range of cro p
and soil types before accepting the hypothesis that it can be use d
without calibration . The routing routine may require implementation of
the full Muskingum approach to more realistically represent the rive r
system . However, the present approach appears quite adequate .
The addition of the hydrologic data base is paramount to producing a n
operating system . Since this is the focus of current and future work, a n
evaluation of the true operational nature of the system must be postpone d
awaiting this phase . However, the overall approach appears sound, as d o
the components developed to date .
47

REFERENCES
Corey, A .T ., 1977, Mechanics of Heterogeneous Flow in Porous Media ,
Water Resources Publications, Ft . Collins, CO .
Cunge, J .A ., 1969, On the Subject of a Flood Propagation Computatio n
Method, Journal of Hydraulic Research, 7(2) : 205-230 .
Dagan, G. and E . Bresler, 1983, Unsaturated Flow in Spatially Variabl e
Fields ; Derivation of Models of Infiltration and Redistribution, Wate r
Resour . Res ., 19(2) : 413-420 .
Hromadka, T .V ., J .M . Clements and G.L . Guymon, 1983, Guidelines for
Interactive Computer Software in Water Resources Engineering, Wate r
Resour . Bull ., 19(1) : 91-96 .
Jensen, M .E ., Editor, 1973, Consumptive Use of Water and Irrigation Wate r
Requirements, Technical Committee on Irrigation Water Requirements o f
the Irrigation and Drainage Division, ASCE, 215pp .
McVay, M., 1983, Personal Communication, U .S . Bureau of Reclamation ,
Boise, ID .
Morel-Seytoux, H .J ., 1979, Cost Effective Methodology for
Stream-Aquifer Interaction Modeling and Use in Management o f
Large-Scale Systems, Contribution to Bilateral U .S .-Spanish Researc h
Project "Conjunctive Water Uses of Complex Surface and Groundwate r
Systems", Ft . Collins, CO .
Ponce, V .M ., 1980, Linear Reservoirs and Numerical Diffusion, Journal o f
the Hydraulics Division, ASCE, 106(HY5) : 691-700 .
49

Ponce, V .M ., R .M . Li and D.B . Simons, 1978, Applicability of Kinemati c
and Diffusion Models, Journal of the Hydraulics Division, ASCE, 10 4
(HY3) : 353-360 .
Ponce, V .M . and V . Yevjevich, 1978, Muskingum-Cunge Method with Variabl e
Parameters, Journal of the Hydraulics Division, ASCE, .104(HY12) :
1663-1667 .
Saxon, K .E . and J .L . McGuinness, 1982, Evapotranspiration, in :
Hydrologic Modeling of Small Watersheds, C .T . Haan, H .P . Johnson and
D .L . Brakensiek, Eds ., Monograph No . 5, American Society of
Agricultural Engineers, St . Joseph, Michigan, pp . 229-273 .
Sorooshian, S . and V .K. Gupta, 1983, Automatic Calibration o f
Conceptual Rainfall-Runoff Models : The Question of Paramete r
Observability and Uniqueness, Water Resour . Res ., 19(1) : 260-268
Sutter, R .J ., R .D . Carlson and D . Lute, 1983, Data Automation fo r
Water Supply Management, Journal of Water Resources Planning an d
Management, ASCE 109(3) : 237-252 .
United States Bureau of Reclamation, 1981, Water Management an d
Conservation Program, Annual Report, Engineering and Research Center ,
Denver, CO .
United States Bureau of Reclamation, 1983, Water Management an d
conservation, User's Manual for Mini-80 Computer Program on Cybe r
170/730, Engineering and Research Center, Denver, CO .
United States Department of Agriculture, Soil Conservation Service ,
1982, Soil Survey for Washington County, Oregon .
50

Viessman, W., Jr ., J .W . Knapp, G .L . Lewis and T .E . Harbaugh, 1977 ,
Introduction to Hydrology, Harper and Row, New York, 704pp .
Weinmann, P .E . and E .M . Laurenson, 1979, Approximate Flood Routin g
Methods : A Review, Journal of the Hydraulics Division, ASCE, 105(Hy2) :
1521-1536 .
Wiberg, D .M ., 1971, State Space and Linear Systems, Schaum's Outlin e
Series in Engineering, McGraw-Hill Book Company .
Yaron, D ., G. Strateener, D . Shimshi and M . Weisbrod, 1973, Wheat Respons e
to Soil Moisture and Optimal Irrigation Policy under Conditions o f
Unstable Rainfall, Water Resources Research, 9(5) : 1145-1153 .
51