Embed Size (px)
Citation preview

APPLICABILITY OF THE HIT FOR EVALUATING COMMINUTION AND
GEOMECHANICAL PARAMETERS FROM DRILL CORE SAMPLES – THE ODYSSEY
PROJECT CASE STUDY
*Y. Bergeron1, T. Kojovic
2, M-d-N. Gagnon
3, and P. Okono
4
1Agnico Eagle Mines Limited
10 200 Route Preissac
Rouyn Noranda, Quebec, Canada J0Y 1C0
(*Corresponding author: [email protected])
2SimSAGe Pty Ltd
Chapel Hill Qld 4073, Australia
3Mine Canadian Malartic
100 Chemin du Lac Mourier
Malartic, Quebec, Canada J0Y 1Z0
4Université Laval
2325 Rue de l’Université
Ville de Québec, Quebec, Canada J1V 0A6
ABSTRACT
In the mining industry, decisions regarding the type and number of comminution tests to be
completed typically rely on geologists‟ observations and conclusions when studying drill cores. Given that
these decisions are based on visual observations, they are essentially approximate and often inaccurate
from a comminution viewpoint, causing a sizeable margin of error in estimating characterization test needs.
Consequently, companies are often forced to perform more tests than necessary, requiring a significant
quantity of material, and accruing significant costs. Recently, a new device, called the Hardness Index
Tester (or HIT), was developed, offering users a low cost in-house mechanism for estimating the
comminution parameter A*b and the Bond Ball Mill Work Index at any mine site, with potential
applications on fragments up to 25 mm from drill core. In late 2016, Agnico Eagle Mines Limited initiated
a trial to investigate if having an HIT device installed in a core repository would make it possible to
identify the different rock properties more accurately and determine the number and type of comminution
tests required. The application of the HIT was not to replace the standard comminution tests, but rather to
generate a high number of comminution and geomechanical parameters for the rock mass. Ultimately, the
objective would be to determine the uniformity of the rock mass and, therefore, easily distinguish any
potentially problematic zones. With this method, the appropriate number of standard tests could be
determined, making the HIT not only an excellent complement to the standard laboratory tests, but also an
indispensable device for a geometallurgical characterization. This paper presents the results from the HIT
trial using samples from the Odyssey Project, which is a Mine Canadian Malartic property.
KEYWORDS
Comminution parameters, Drill core, Ore hardness, Geomechanical parameters, Geometallurgy, HIT
(Hardness Index Tester), Ore characterization, Rock properties
COM2017 | THE CONFERENCE OF METALLURGISTS hosting World Gold & Nickel Cobalt Proceedings ISBN: 978-1-926872-36-0
Published by the Canadian Institute of Mining, Metallurgy and Petroleum | www.metsoc.org
INTRODUCTION
Since the turn of the 21st Century, the use of geometallurgical programs for the characterization of
mineral projects has garnered increasing interest. The rise of geometallurgy (geomet) coincides with the
decline of mining project profitability, a situation explained by several factors including decreasing ore
grades, increasing energy costs and the complexity of today‟s ore deposits. This context spurs the
development of new, more efficient, less risky and environmentally friendly approaches. Geomet is the
study of the drivers of metallurgical response that lie in the geology and mineralogy of a deposit (Williams,
2011). Basically, it is a methodology that targets optimal recovery of a resource. The approach entails
acquiring a large amount of information in order to characterize a deposit before mining it. One objective
of geomet is to promote interactions between the different specialists (i.e. mining engineers, geologists,
metallurgists and environmental coordinators). This multidisciplinary approach removes barriers and
ensures the appropriate integration of the information, which increases the project benefits.
Ore hardness plays a key role in every mining project and is one of the critical parameters for
efficient processing. The wrong comminution circuit design may cause financial setbacks leading, in the
best case, to a longer payback period. Variability in ore hardness influences the plant throughput and the
liberation of the ore which drives the recoveries. To date, geomet projects have suffered from the small
number of reliable measurements related to ore hardness. This limitation is mainly due to the significant
quantity of material required to perform standard comminution tests (i.e. MacPherson, JK Drop Weight
Test (DWT), Steve Morrell Comminution test (SMC), SAGDesign, SAG Power Index (SPI), etc.). This
constraint favours usage of composite samples which decrease the „density‟ and the extent of the ore
hardness characterization. Currently, two approaches are used to evaluate ore hardness. The first and most
common practice is to undertake an expensive comminution program, while the second is a hybrid method
whereby the results from a limited amount of standard comminution tests are associated with other readily
available parameters. The hybrid approach relies on the geomet concept and involves geological or
geotechnical information in order to predict the ore hardness. This technique generates hardness proxies
using parameters like the lithologies, alterations, textures, valuable grades, Rock Quality Designation
(RQD), and density. Sometimes, geomechanical results are available and can also be used to correlate the
ore hardness. The Point Load Test index (PLT) is one of the most common tests since it can be performed
during core drilling. Clearly, all these parameters are linked to ore hardness in some way, but even the
hybrid approach has demonstrated limited precision and has sometimes led to ore hardness
misinterpretation (Wirfiyata, 2011).
In the past decade, efforts have been made to develop an alternative for the ore hardness
characterization in geomet programs (Couët, 2015; Windle, 2016). These developments allow ore hardness
to be quantified faster, using a moderate amount of sample. However, these alternatives yield limited
information relating to a specific hardness parameter (i.e. SAG Variability Test (SVT) and Bond Ball Mill
Work Index (BWi)), and cannot measure the hardness of the entire SAG feed Particle Size Distribution
(PSD). Recently, Dr. Toni Kojovic developed a portable device, the Hardness Index Tester (or HIT), which
rapidly quantifies the ore hardness for the well-known JK rock breakage parameters A*b and the BWi.
Together, these parameters cover a wider range of the SAG feed PSD compared to the previously
mentioned options. The HIT test requires a small amount of sample and can be performed on-site at low
cost. In late 2016, Agnico Eagle Mines Limited (AEML) initiated a trial to demonstrate the reliability of
the HIT for a geomet ore hardness characterization.
This paper presents the latest developments regarding the HIT, and the preliminary results
achieved during the ore hardness characterization of the “Nord” ore zone of the Odyssey Project, which is
a Mine Canadian Malartic property.
COM2017 | THE CONFERENCE OF METALLURGISTS hosting World Gold & Nickel Cobalt Proceedings ISBN: 978-1-926872-36-0
Published by the Canadian Institute of Mining, Metallurgy and Petroleum | www.metsoc.org
EXPERIMENTAL
Hardness Index Tester - an Update
The HIT proof of concept was presented in October 2016 at the 13th
AusIMM Mill Operators‟
Conference (Kojovic, 2016). Since that release, several developments were made. The first major
development relates to the A*b bias observed during the initial HIT development stage. Several hypotheses
were formulated to explain that bias, but now the main causes have been identified. The second significant
development is the potential to use HIT for the BWi characterization. These developments are summarized
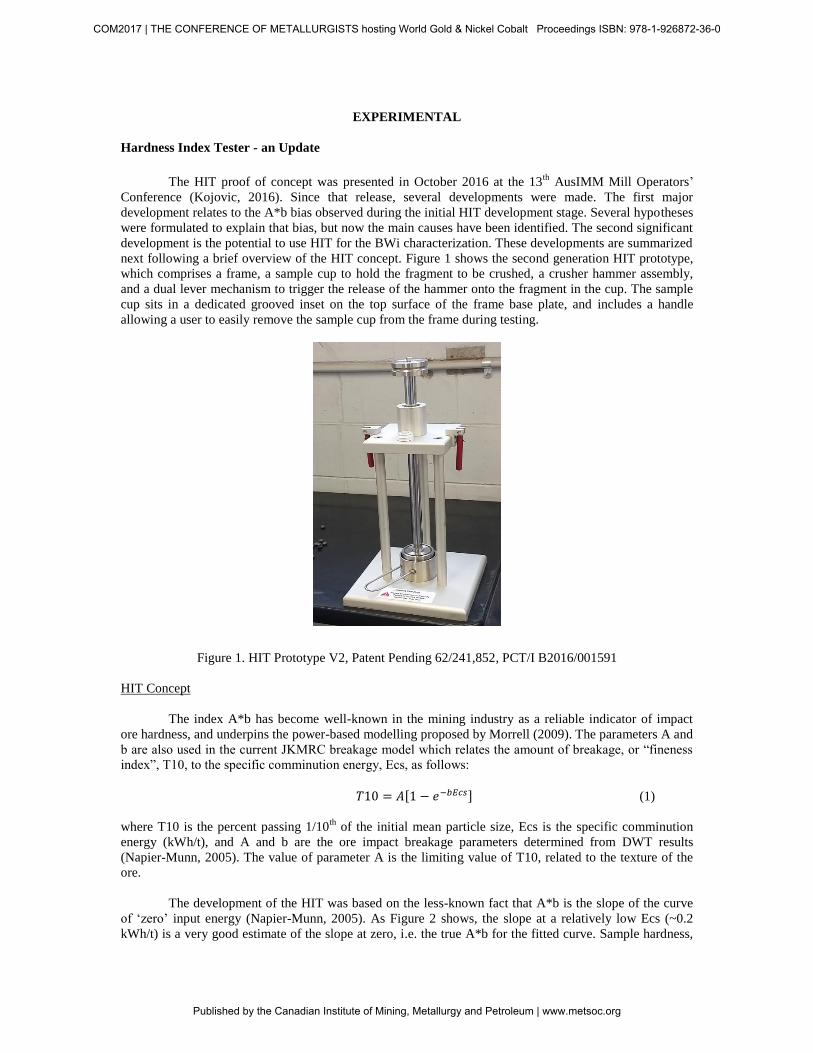
next following a brief overview of the HIT concept. Figure 1 shows the second generation HIT prototype,
which comprises a frame, a sample cup to hold the fragment to be crushed, a crusher hammer assembly,
and a dual lever mechanism to trigger the release of the hammer onto the fragment in the cup. The sample
cup sits in a dedicated grooved inset on the top surface of the frame base plate, and includes a handle
allowing a user to easily remove the sample cup from the frame during testing.
Figure 1. HIT Prototype V2, Patent Pending 62/241,852, PCT/I B2016/001591
HIT Concept
The index A*b has become well-known in the mining industry as a reliable indicator of impact
ore hardness, and underpins the power-based modelling proposed by Morrell (2009). The parameters A and
b are also used in the current JKMRC breakage model which relates the amount of breakage, or “fineness
index”, T10, to the specific comminution energy, Ecs, as follows:
[ ] (1)
where T10 is the percent passing 1/10th
of the initial mean particle size, Ecs is the specific comminution
energy (kWh/t), and A and b are the ore impact breakage parameters determined from DWT results
(Napier-Munn, 2005). The value of parameter A is the limiting value of T10, related to the texture of the
ore.
The development of the HIT was based on the less-known fact that A*b is the slope of the curve
of „zero‟ input energy (Napier-Munn, 2005). As Figure 2 shows, the slope at a relatively low Ecs (~0.2
kWh/t) is a very good estimate of the slope at zero, i.e. the true A*b for the fitted curve. Sample hardness,
COM2017 | THE CONFERENCE OF METALLURGISTS hosting World Gold & Nickel Cobalt Proceedings ISBN: 978-1-926872-36-0
Published by the Canadian Institute of Mining, Metallurgy and Petroleum | www.metsoc.org

variability and the number of particles tested would be expected to affect the precision of the T10 and
hence A*b (or slope) estimate at low energies. And the slope at the low energy would be expected to be
marginally lower than the actual A*b, which is not surprising knowing the slope decreases for Ecs > 0.
Calibration against the standard SMC or DWT parameters is possible, taking into account the offset for the
slope and effect of particle size.
Figure 2. Derivation of A*b Estimate Using Slope of T10-Ecs Curve at Ecs = 0.2 kWh/t
The proof of concept that impact testing at relatively low specific energies can provide a reliable
estimate of the actual A*b was evident in the comparison extracted from 93 sets of full DWT data covering
32 ore deposits. The data were used to calculate the slope at Ecs = 0.25 kWh/t using the raw T10 values for
the 31.5×26.5 mm size fraction. Figure 3 shows the complete set of results, confirming the strong
correlation, the scatter due partly to Ecs variation, but also differences in the properties (hardness and
shape) of the material in the 31.5×26.5 mm size fraction from the whole sample used to derive the A*b
parameters for the DWT sample.
Figure 3. Comparison of JKDWT A*b Values and Corresponding A*b Estimates Using T10 for
31.5×26.5 mm Fraction (93 samples, 32 ore deposits)
Investigation of the HIT A*b Bias
The previous HIT industrial trials at Newmont and AEML have confirmed both the mechanical
and technical integrity of the device, and its potential for the rapid generation of high-volume A*b and
BWi hardness proxies. However, comparison of the SMC A*b and HIT A*b estimates showed a consistent
bias, which required further investigation.
0
10
20
30
40
0.0 0.5 1.0 1.5 2.0 2.5
Per
cen
t o
f F
ines
, T
10
(%
)
Specific Energy (kWh/t), Ecs
0
20
40
60
80
100
120
0 20 40 60 80 100 120
A*
b (
Fu
ll J
KD
WT
)
A*b (= T10/0.25)
222.0
4.4b*A
COM2017 | THE CONFERENCE OF METALLURGISTS hosting World Gold & Nickel Cobalt Proceedings ISBN: 978-1-926872-36-0
Published by the Canadian Institute of Mining, Metallurgy and Petroleum | www.metsoc.org

The initial findings pointed to two major differences between SMC and HIT testing, 1) the
fragments chosen for SMC testing were consistently heavier (for a same size fraction), and 2) the product
sizing time and/or methods were different. For the HIT A*b proxy tests, Newmont technicians used a
Ro-Tap to size the broken product for one minute, whilst AEML used a Shaker for three minutes. For the
SMC test, a Ro-Tap was used to size the products for five minutes due to the larger sample mass.
The HIT vs DWT comparison in the MillOps‟16 paper showed no statistically significant
difference between the two devices if the rocks were similar, as far as the amount of broken product
generated at the same specific energy. However, a broader investigation was initiated post-conference to
confirm the energy applied in the HIT device, and if the energy varies with the type of bench used to
support the HIT device. To this end, samples of lead shot used to monitor the Quality Control (QC) of the
HIT device during testing were submitted for compression testing by LMATS (Laboratories for Materials
Advanced Testing Services), to quantify the force and hence energy required to compress the lead shot
across the range achieved by the HIT device. Knowing the lead shot compression results for the HIT
device in the laboratory installation allows direct calculation of the energy applied by the device by
referring to the LMATS test results. The LMATS results indicate a relatively low variability in the lead
shot compression strength (~ 2%).
The LMATS results clearly demonstrate the difference in applied energy at different levels of
compression, spanning the figures seen in the HIT trials and development testing. Essentially, the LMATS
work has confirmed the Newmont bench was losing around 27% of available energy, AEML and the
original bench used in development tests around 24%, and a solid concrete floor close to 0%. Hence, these
findings would easily explain a significant proportion of the bias seen between SMC and HIT results in the
trials.
The upshot from the LMATS and earlier investigation is that the bias could be completely
eliminated by taking into account the energy loss for each HIT installation, and avoiding any differences in
rock selection (shape/mass) and sizing procedure. This is clearly evident from Figure 4, showing the SMC
versus HIT A*b comparison for a range of sample sizes from an AEML deposit where these conditions
were largely met. The HIT A*b proxy testing used either duplicate or triplicate sets of ten fragments per
sample.
Figure 4. Comparison of DWT/SMC A*b Values and Corresponding HIT A*b Proxy Estimates,
(a) 16×13.2 mm, (b) 22.4×19 mm
Applicability of the HIT BWi Proxy
The two main factors which control the grinding circuit capacity and final grind size are feed size
distribution and ore hardness. The latter includes both A*b, the crushing hardness, and BWi, the
grindability of the ore. Measuring only A*b is therefore insufficient to properly characterize the deposit,
10
20
30
40
50
60
70
10 20 30 40 50 60 70
A*
b fr
om
DW
T a
nd
SM
C
HIT A*b (16x13.2 mm)
10
20
30
40
50
60
70
10 20 30 40 50 60 70
A*
b f
rom
DW
T a
nd
SM
C
HIT A*b (22.4x19 mm)
COM2017 | THE CONFERENCE OF METALLURGISTS hosting World Gold & Nickel Cobalt Proceedings ISBN: 978-1-926872-36-0
Published by the Canadian Institute of Mining, Metallurgy and Petroleum | www.metsoc.org
especially if the grinding circuit is predominantly ball mill limited. To this end, SimSAGe believed the HIT
device could be used to estimate the BWi, exploiting a novel feature of single particle testing that the Bond
grindability can be linked to the breakage response at one precise high energy test, similar to that applied
during one cycle in the BWi laboratory mill. This concept is based on supporting evidence found in
historical work, including the studies in coal breakage defining the slope and intercept of the Rosin-
Rammler curve to the coal hardness. Unlike the HIT A*b test, the Bond proxy test uses smaller fragments
(e.g. 11.2×9.5 mm) requiring the screening of the HIT product using sieves (i.e. 3.35, 2.36, 1.18, 0.60 and
0.15 mm openings) to determine the PSD, not only the T10 index.
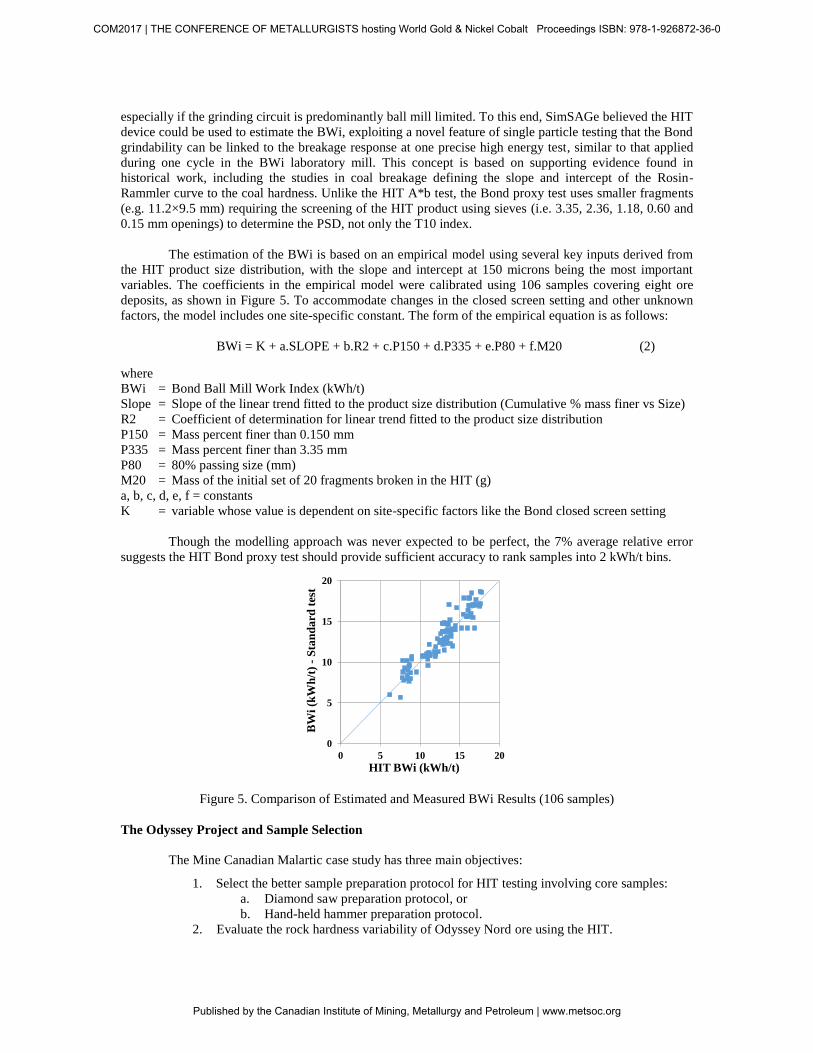
The estimation of the BWi is based on an empirical model using several key inputs derived from
the HIT product size distribution, with the slope and intercept at 150 microns being the most important
variables. The coefficients in the empirical model were calibrated using 106 samples covering eight ore
deposits, as shown in Figure 5. To accommodate changes in the closed screen setting and other unknown
factors, the model includes one site-specific constant. The form of the empirical equation is as follows:
BWi = K + a.SLOPE + b.R2 + c.P150 + d.P335 + e.P80 + f.M20 (2)
where
BWi = Bond Ball Mill Work Index (kWh/t)
Slope = Slope of the linear trend fitted to the product size distribution (Cumulative % mass finer vs Size)
R2 = Coefficient of determination for linear trend fitted to the product size distribution
P150 = Mass percent finer than 0.150 mm
P335 = Mass percent finer than 3.35 mm
P80 = 80% passing size (mm)
M20 = Mass of the initial set of 20 fragments broken in the HIT (g)
a, b, c, d, e, f = constants
K = variable whose value is dependent on site-specific factors like the Bond closed screen setting
Though the modelling approach was never expected to be perfect, the 7% average relative error
suggests the HIT Bond proxy test should provide sufficient accuracy to rank samples into 2 kWh/t bins.
Figure 5. Comparison of Estimated and Measured BWi Results (106 samples)
The Odyssey Project and Sample Selection
The Mine Canadian Malartic case study has three main objectives:
1. Select the better sample preparation protocol for HIT testing involving core samples:
a. Diamond saw preparation protocol, or
b. Hand-held hammer preparation protocol.
2. Evaluate the rock hardness variability of Odyssey Nord ore using the HIT.
0
5
10
15
20
0 5 10 15 20
BW
i (k
Wh
/t)
-S
tan
da
rd t
est
HIT BWi (kWh/t)
COM2017 | THE CONFERENCE OF METALLURGISTS hosting World Gold & Nickel Cobalt Proceedings ISBN: 978-1-926872-36-0
Published by the Canadian Institute of Mining, Metallurgy and Petroleum | www.metsoc.org

3. Perform comparative geomechanical tests and evaluate the usefulness of the HIT to
estimate these parameters.
Geological Context of Odyssey Nord
Mine Canadian Malartic (MCM) is a gold producer located in Malartic, Canada. MCM started
commercial production in 2011 and currently operates the largest gold mine in Canada with an annual
throughput of 19.6 Mt and a gold production of 585,000 gold ounces. In 2014, the company was acquired
by Yamana Gold and Agnico Eagle Mines Limited in partnership. Production is forecast to end in 2028
following the development of the Barnat and Jeffrey deposits. In an effort to extend mine production,
MCM is exploring a new zone called Odyssey. This new project is located to the east of the Canadian
Malartic open pit. Exploration programs outlined two mineralized zones, Odyssey Sud and Odyssey Nord;
only the latter will be studied in this paper. Odyssey Nord is the deepest zone and has been traced from a
depth of 550 to 1,200 m below the surface, while Odyssey Sud is from a depth of approximately 200 to 550
m below the surface. Odyssey is an Archean, deformed intrusion-related gold deposit. Mineralization
occurs as fine native gold grains or as gold inclusions within disseminated pyrite grains. The Odyssey Nord
zone is hosted by a quartz-monzonite porphyry, where the latter is cut by the Sladen Fault.
Figure 6 shows a typical section of the Odyssey Project. Nine alterations are recognized within the
porphyries and most of them are gold-bearing. However, due to the limited number of drill holes available,
only the biotitized (BTPO), sericitized (SRPO) and not altered porphyry (INPO) were tested. The BTPO
lithology is one of the most often observed in the mineralization with the potassic (AKPO), hematized
(HMPO) and silicified (SIPO) alterations. In the ultramafic host rock, alterations can be summarized by a
weakly to moderate talc-carbonate alteration (TCUM). The fault is dominated by schists showing a talc-
carbonate alteration. This zone is designated by the code TCSH and is sometimes mineralized.
Figure 6. Odyssey Project - Typical Geological Section
Core Sample Selection
In 2016, four drill holes were planned in order to initiate the preliminary metallurgical testwork
consisting of standard comminution tests and the HIT case study. The Drill Hole identifications (DHID) for
COM2017 | THE CONFERENCE OF METALLURGISTS hosting World Gold & Nickel Cobalt Proceedings ISBN: 978-1-926872-36-0
Published by the Canadian Institute of Mining, Metallurgy and Petroleum | www.metsoc.org
this testwork were: ODY16-5063AA, ODY16-5065AA, ODY16-5083A and ODY16-5084A. The
thickness of the ore zones was variable, ranging from 5 to 28 m. The thinner ore zones were problematic
due to the limited sample mass available for the standard comminution testwork run by MCM. The
standard metallurgical tests had been prioritized and the mineralized samples were preserved for that
purpose. This situation forced the use of samples with gold grades below the cut-off grade for the HIT
program. However, these samples were located close to the mineralized zones with the exception of
samples from hole 5063AA which were 10 m further off.
Samples selected for the Odyssey HIT case study had to meet the following criteria in order to be
considered suitable for the HIT / geomechanical comparison.
1.5 m of full NQ core is required to obtain a suitable sample mass
Samples must be regular throughout the 1.5 m (similar characteristics)
Core fragments must come from a section no longer than 2.5 m
The individual fragments compositing the sample must be at least 20 cm long
Figure 7 shows the schematic sample distribution for the comparative HIT and geomechanical
tests. A 20 cm core sample was taken from the center of the selection for the diamond saw HIT sample
preparation protocol while core samples from the extremities were reserved for the HIT sample preparation
protocol involving the hand-held hammer. These sets of samples were used to run the comparative HIT
tests designed to identify the most viable core sample preparation protocol.
Figure 7. Core Sample Selection Protocol for Tests
Four core samples of approximately 20 cm were taken from the middle of each selection, for
geomechanical testing. These samples were preserved in full core and sent to Amec Foster Wheeler in
Hamilton, Ontario, where four Uniaxial Compressive Strength (UCS) and four PLT tests were conducted.
The geotechnical and HIT hardness results were then compared to evaluate whether the HIT test results
could be used as a geomechanical proxy. This methodology was designed to ensure the reliability of results
for the comparison between ore hardness and geomechanical parameters. Table 1 presents the samples
used in the Odyssey case study.
Table 1. Samples Selected for the Comparative HIT and Geomechanical Parameters
Diamond Saw Core Preparation Protocol
Per the diamond saw core preparation protocol, the NQ core sample was quartered then cut into
several smaller fragments of similar shape (cut-core) using a diamond saw. Figure 8 shows a typical cut-
Half Core 1/4 CORE Half Core
20 cm 20 cm 20 cm 20 cm 20 cm 20 cm 20 cm
HIT Tests
(Hammer)
PLT/UCS
Tests
PLT/UCS
Tests
HIT Tests
(Diamond Saw)
PLT/UCS
Tests
PLT/UCS
Tests
HIT Tests
(Hammer)
NQ Full Core NQ Full Core
1.5 m NQ core
DHIDFROM
(m)
TO
(m)
SAMPLE
NUMBERMINERALIZED
LITHOLOGICAL
CODEPROTHOLITE ALTERATION
LEVEL OF
ALTERATION
RQD
(%)
1084.48 1085.95 697484 No BTPO Porphyry Biotitized Weak 98
1090.40 1092.00 697486 No BTPO Porphyry Biotitized Weak 96
1249.80 1251.77 D 114225 No BTPO Porphyry Biotitized Weak 90
1271.95 1273.80 D 114229 Yes SRPO Porphyry Sericitized Weak 94
1281.95 1283.65 D 114232 No TCUM Ultramafic Talc-Carbonate Weak 91
1360.79 1363.00 697493 No INPO Porphyry Not Altered No Alteration 76
1378.21 1380.74 697494 No INPO Porphyry Not Altered No Alteration 72
1416.70 1418.20 697497 No CHIM Mafic Intrusion Chloritized Weak to Moderate 100
1243.13 1244.65 D 114223 No BTPO Porphyry Biotitized Weak 89
1252.93 1254.85 D 114224 No TCSH Schist Talc-Carbonate Strong 96ODY16-5084A
ODY16-5083A
ODY16-5065AA
ODY16-5063AA
COM2017 | THE CONFERENCE OF METALLURGISTS hosting World Gold & Nickel Cobalt Proceedings ISBN: 978-1-926872-36-0
Published by the Canadian Institute of Mining, Metallurgy and Petroleum | www.metsoc.org

core fragment inside the HIT cup. This protocol produces regular fragments, which is known to be an
important factor for DWT testing (Chandramohan, 2015). During the core quartering, particular care had
be taken to align the cut. A misalignment generates irregular quarters that require an adjustment of the cut-
core thickness in order to maintain the mass at 16 g (± 1 g). This mass corresponds to the 22.4×19 mm size
class which varies with the specific gravity of the rock.
Figure 8. Cut-Core Fragment Produced with the Diamond Saw
The use of cut-core was investigated during the early development of the SMC test. No bias was
observed when comparing the cut-core to crushed rock lumps (Morrell, 2017), providing all three
orientations were used in the breakage of each set of 20 fragments. This latter approach was then
recommended when limited drill core samples were available. However, the crushed rocks and the cut-core
fragments exhibited a different breakage rate due to their particular shape (Kojovic, 2017). The average of
these three core orientations was found to be similar to results with crushed rock of comparable size /
volume. During the HIT A*b proxy tests, the average of all three possible orientations was used, to avoid
any bias. Figure 9 presents the three orientations used during the HIT A*b proxy tests.
Figure 9. Orientations of Cut-Core Used During HIT A*b Tests
The diamond saw preparation is exacting, particularly when the core quarters are misaligned. In
addition, the diamond saw protocol cannot produce samples for the HIT BWi proxy because the required
cut-core thickness is too fine.
Hand-Held Hammer Preparation Protocol
The hand-held hammer preparation protocol simply involves using a hand-held hammer to break
the half NQ core pieces into smaller fragments. This protocol produces irregular lump fragments, which
are suitable for HIT A*b and BWi proxy tests. To ensure consistency between protocols, the size class
used was 22.4×19 mm. Compared to the cut-core selection, even with the same size class, the average
COM2017 | THE CONFERENCE OF METALLURGISTS hosting World Gold & Nickel Cobalt Proceedings ISBN: 978-1-926872-36-0
Published by the Canadian Institute of Mining, Metallurgy and Petroleum | www.metsoc.org
fragment mass was lighter at 14 g (± 2 g). The variability in mass of these fragments was related to their
irregular shape.
The main interest in the hand-held hammer preparation is that it shares HIT characteristics: a fast,
simple and reliable method considering the portability of the device. The half core preparation entails
placing the half core sample on a steel plate and breaking it with a hand-held hammer. The operator must
hit the core with just enough force to produce the desired fragment size. Following the A*b sample
selection, the operator selected the HIT BWi samples. If the quantity of HIT BWi fragments is insufficient,
coarse rocks, not retained for A*b, can be broken again to produce smaller particles in the 11.2×9.5 mm
range.
Compared to the diamond saw preparation protocol, it was much faster and simpler to produce
fragments for both HIT A*b and BWi proxy tests using the hand-held hammer. However, an important
question still needs to be answered. Does the hand-held hammer protocol lead to reliable results?
RESULTS
HIT Ore Hardness Determination
HIT A*b Diamond Saw vs Hand-Held Hammer Protocols
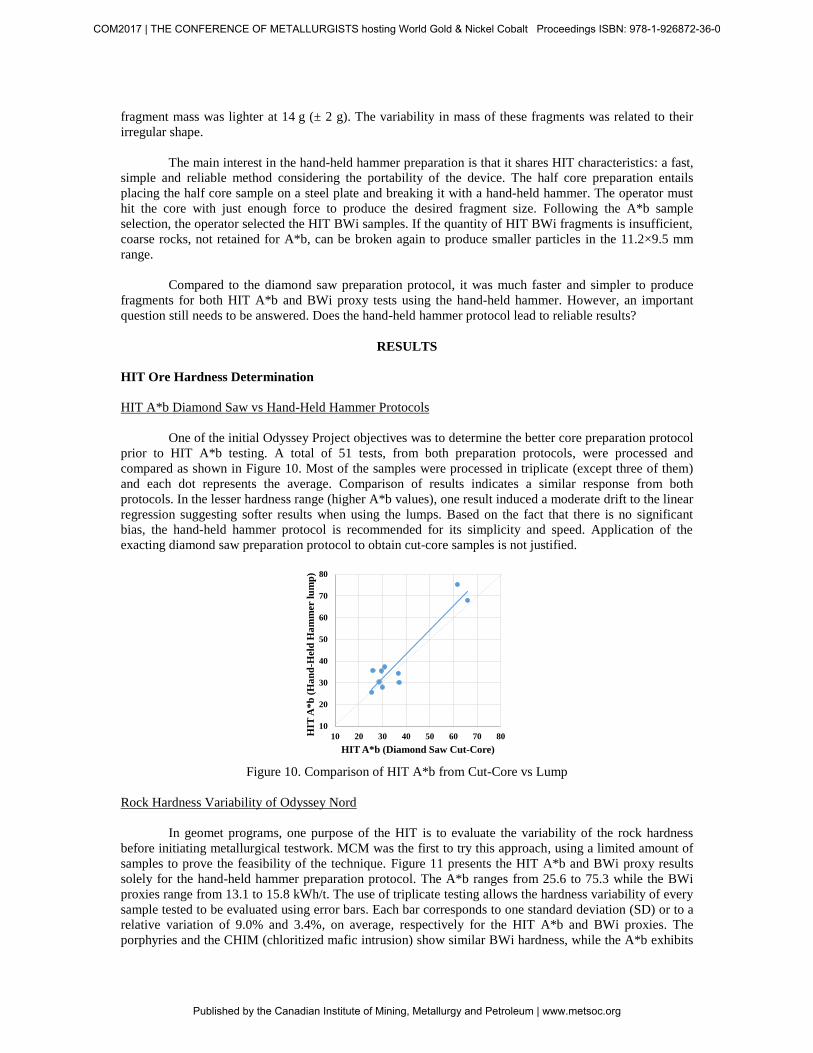
One of the initial Odyssey Project objectives was to determine the better core preparation protocol
prior to HIT A*b testing. A total of 51 tests, from both preparation protocols, were processed and
compared as shown in Figure 10. Most of the samples were processed in triplicate (except three of them)
and each dot represents the average. Comparison of results indicates a similar response from both
protocols. In the lesser hardness range (higher A*b values), one result induced a moderate drift to the linear
regression suggesting softer results when using the lumps. Based on the fact that there is no significant
bias, the hand-held hammer protocol is recommended for its simplicity and speed. Application of the
exacting diamond saw preparation protocol to obtain cut-core samples is not justified.
Figure 10. Comparison of HIT A*b from Cut-Core vs Lump
Rock Hardness Variability of Odyssey Nord
In geomet programs, one purpose of the HIT is to evaluate the variability of the rock hardness
before initiating metallurgical testwork. MCM was the first to try this approach, using a limited amount of
samples to prove the feasibility of the technique. Figure 11 presents the HIT A*b and BWi proxy results
solely for the hand-held hammer preparation protocol. The A*b ranges from 25.6 to 75.3 while the BWi
proxies range from 13.1 to 15.8 kWh/t. The use of triplicate testing allows the hardness variability of every
sample tested to be evaluated using error bars. Each bar corresponds to one standard deviation (SD) or to a
relative variation of 9.0% and 3.4%, on average, respectively for the HIT A*b and BWi proxies. The
porphyries and the CHIM (chloritized mafic intrusion) show similar BWi hardness, while the A*b exhibits
10
20
30
40
50
60
70
80
10 20 30 40 50 60 70 80HIT
A*
b (
Ha
nd
-Hel
d H
am
mer
lu
mp
)
HIT A*b (Diamond Saw Cut-Core)
COM2017 | THE CONFERENCE OF METALLURGISTS hosting World Gold & Nickel Cobalt Proceedings ISBN: 978-1-926872-36-0
Published by the Canadian Institute of Mining, Metallurgy and Petroleum | www.metsoc.org
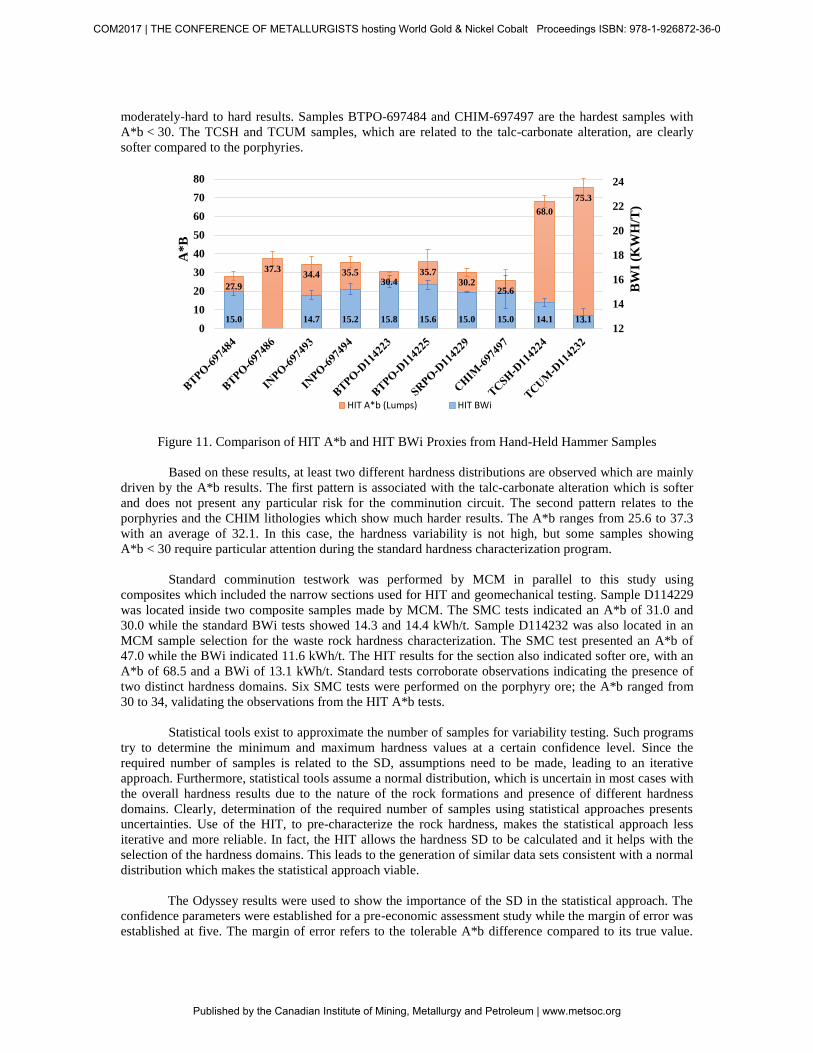
moderately-hard to hard results. Samples BTPO-697484 and CHIM-697497 are the hardest samples with
A*b < 30. The TCSH and TCUM samples, which are related to the talc-carbonate alteration, are clearly
softer compared to the porphyries.
Figure 11. Comparison of HIT A*b and HIT BWi Proxies from Hand-Held Hammer Samples
Based on these results, at least two different hardness distributions are observed which are mainly
driven by the A*b results. The first pattern is associated with the talc-carbonate alteration which is softer
and does not present any particular risk for the comminution circuit. The second pattern relates to the
porphyries and the CHIM lithologies which show much harder results. The A*b ranges from 25.6 to 37.3
with an average of 32.1. In this case, the hardness variability is not high, but some samples showing
A*b < 30 require particular attention during the standard hardness characterization program.
Standard comminution testwork was performed by MCM in parallel to this study using
composites which included the narrow sections used for HIT and geomechanical testing. Sample D114229
was located inside two composite samples made by MCM. The SMC tests indicated an A*b of 31.0 and
30.0 while the standard BWi tests showed 14.3 and 14.4 kWh/t. Sample D114232 was also located in an
MCM sample selection for the waste rock hardness characterization. The SMC test presented an A*b of
47.0 while the BWi indicated 11.6 kWh/t. The HIT results for the section also indicated softer ore, with an
A*b of 68.5 and a BWi of 13.1 kWh/t. Standard tests corroborate observations indicating the presence of
two distinct hardness domains. Six SMC tests were performed on the porphyry ore; the A*b ranged from
30 to 34, validating the observations from the HIT A*b tests.
Statistical tools exist to approximate the number of samples for variability testing. Such programs
try to determine the minimum and maximum hardness values at a certain confidence level. Since the
required number of samples is related to the SD, assumptions need to be made, leading to an iterative
approach. Furthermore, statistical tools assume a normal distribution, which is uncertain in most cases with
the overall hardness results due to the nature of the rock formations and presence of different hardness
domains. Clearly, determination of the required number of samples using statistical approaches presents
uncertainties. Use of the HIT, to pre-characterize the rock hardness, makes the statistical approach less
iterative and more reliable. In fact, the HIT allows the hardness SD to be calculated and it helps with the
selection of the hardness domains. This leads to the generation of similar data sets consistent with a normal
distribution which makes the statistical approach viable.
The Odyssey results were used to show the importance of the SD in the statistical approach. The
confidence parameters were established for a pre-economic assessment study while the margin of error was
established at five. The margin of error refers to the tolerable A*b difference compared to its true value.
27.9
37.334.4 35.5
30.435.7
30.225.6
68.0
75.3
15.0 14.7 15.2 15.8 15.6 15.0 15.0 14.1 13.112
14
16
18
20
22
24
0
10
20
30
40
50
60
70
80
BW
I (K
WH
/T)
A*
B
HIT A*b (Lumps) HIT BWi
COM2017 | THE CONFERENCE OF METALLURGISTS hosting World Gold & Nickel Cobalt Proceedings ISBN: 978-1-926872-36-0
Published by the Canadian Institute of Mining, Metallurgy and Petroleum | www.metsoc.org

All these parameters were kept constant in the following examples, only the SD was changed. The Odyssey
rock hardness characterization clearly shows two different ore hardness domains leading to a HIT A*b
overall SD of 17.1. This SD is quite high compared to 4.2 for the porphyries. The decrease in the SD
significantly reduces the number of samples required when using a statistical tool to draw up a variability
program. When using the overall SD, the number of samples recommended is 37, whereas it is only 3 for
each of the individual hardness domains (six tests in total). In this example, the statistical evaluation by
hardness domain significantly reduces the number of samples required to achieve the same confidence
level. Statistical tools must be used as a guideline and the recommended number of samples will be
considered as a minimum. For Odyssey Nord, it is recommended to increase the number of tests in the
porphyries due to the identification of hard rock (A*b < 30). A better understanding of the distribution of
these rocks is required in order to accurately predict their abundance in the mill feed at any point in time
during the mine life.
The new approach proposed in this paper combines a pre-characterization of the rock hardness
using the HIT device, with a statistical methodology to adequately estimate the number of samples required
for hardness variability testing. Use of the HIT to identify rock hardness variability is crucial to precisely
identify the hardness domains and evaluate the needs for the standard ore hardness characterization
program. In the case of the Odyssey Project, an approach by hardness domain significantly reduces the
number of samples required.
Geomechanical Results
The final objective of this study is to evaluate the use of the HIT to estimate geomechanical
parameters such as the UCS and the PLT. Geotechnical engineers are often faced with the same challenges
as metallurgists to characterize a deposit with better precision. These characterizations suffer from a low
density of data and require expensive programs involving specific drilling campaigns. Geomechanical
results usually show high variability due to the nature of the tested rocks. Every single pre-existing plane of
weakness, (i.e. foliation planes, vein, default, joint, etc.) can cause a premature failure of the rock.
Compared to the UCS test, the PLT is faster and cheaper, and it is used to increase the density of strength
data throughout the deposit. PLT is an accepted test in geotechnical evaluations (ISRM, 1985; Rusnak,
2000). Table 2 summarizes the Odyssey Nord geomechanical and rock hardness results from averages.
UCS results ranged from 33 to 237 MPa while the PLT axial tests varied from 3.2 to 10.6 MPa. Odyssey
Nord showed quite competent rocks in the porphyries, while the talc-carbonate alteration (i.e. TCUM and
TCSH) displayed less competency. UCS and PLT results are presented in two separate columns. The first
column refers to the sample average strength (regardless of the failure mode) while the second column
pertains to the test that showed only a „brittle failure through intact rock‟, designated by „Intact‟. As
described in the Amec report, a „brittle failure‟ is related to a specimen that failed suddenly and completely
with a rapid release of stored energy while „intact rock‟ indicates that no portion of the main failure plane
contained any pre-existing planes of weakness. It is supposed that the intact rock strength can be estimated
from the HIT A*b results.
Table 2. Geomechanical and Hardness Results Compilation
DHIDSAMPLE
NUMBERMINERALIZED
LITHOLOGICAL
CODE
HIT
A*b
HIT
BWi proxy
(kWh/t)
UCS
(MPa)
UCS
INTACT
(MPa)
PLT axial
(MPa)
PLT axial
INTACT
(MPa)
697484 No BTPO 27.9 15.0 178 261 7.1 10.1
697486 No BTPO 37.3 NA 208 214 10.6 10.6
D 114225 No BTPO 35.7 15.6 163 227 8.7 8.7
D 114229 Yes SRPO 30.2 15.0 164 156 8.1 10.0
D 114232 No TCUM 75.3 13.1 47 44 4.7 5.1
697493 No INPO 34.4 14.7 237 273 9.4 10.4
697494 No INPO 35.5 15.2 162 198 7.2 9.2
697497 No CHIM 25.6 15.0 141 NA 10.5 10.5
D 114223 No BTPO 30.4 15.8 131 192 9.2 10.9
D 114224 No TCSH 68.0 14.1 33 44 3.2 3.3
ODY16-5083A
ODY16-5065AA
ODY16-5063AA
ODY16-5084A
COM2017 | THE CONFERENCE OF METALLURGISTS hosting World Gold & Nickel Cobalt Proceedings ISBN: 978-1-926872-36-0
Published by the Canadian Institute of Mining, Metallurgy and Petroleum | www.metsoc.org

Literature describes different relationships linking geomechanical parameters to rock hardness
(Vatandoost, 2010; Gamal, 2012). One such relation was used to compare the Odyssey PLT results. This
reference, presented in Figure 12a, is derived from personal compilations assembled by Dr. Kojovic over
time, and was partially presented by Vatandoost (2010) in their thesis. Graphs a) and b) present the
relationship between the geomechanical parameter and the HIT A*b hardness respectively for the PLT and
the UCS results from Odyssey Nord. The hardness is divided by the specific gravity of the rock sample to
eliminate this influence, as both UCS and PLT were completed on fixed sample volumes. Odyssey Nord
shows consistent results with respect to the PLT reference curve. The set of results from intact breakages
seems to be slightly better than the overall average. A similar relationship is observed in Figure 12b, with
the UCS results, showing a potentially better distribution of the intact breakages.
Figure 12. Cross-Plots of Different Geomechanical Parameters versus A*b/SG (a) PLT, (b) UCS
Odyssey results are consistent with the reference curve indicating an opportunity to estimate the
PLT based on HIT measurements. Figure 13 compares the PLT proxies (calculated from the HIT A*b
average) and the PLT results measured from standard axial tests (intact breakage only). The relation used
to calculate the PLT proxies refers to the regression obtained from intact PLT results, as presented in
Figure 12a. The regression was adapted to calculate the PLT proxies, as follows:
[
]
(3)
With the exception of the sample in the top-right section of the chart, which shows high
variability, most of results are in good agreement with the measured PLT. These results are promising and
indicate the potential for using the HIT to estimate the PLT for intact rock samples.
Figure 13. Comparison of Calculated versus Measured PLT
y = 68.361x-0.757
y = 50.081x-0.616
5
10
15
20
25
30
35
40
0 5 10 15
A*
b/S
G
PLT (MPa)
Overall PLT results
Intact PLT Results
References
Puissance (Overall PLT results)
Puissance (Intact PLT Results)
Puissance (References)
5
10
15
20
25
30
35
40
0 50 100 150 200 250 300
A*
b/S
G
UCS (MPa)
Overall UCS results
Intact UCS Results
Puissance (Overall UCS results)
Puissance (Intact UCS Results)
0
2
4
6
8
10
12
14
16
0 2 4 6 8 10 12 14 16
PL
T i
nta
ct b
rea
ka
ge
(mea
sure
d)
PLT (calculated based on HIT A*b)
COM2017 | THE CONFERENCE OF METALLURGISTS hosting World Gold & Nickel Cobalt Proceedings ISBN: 978-1-926872-36-0
Published by the Canadian Institute of Mining, Metallurgy and Petroleum | www.metsoc.org

Geomechanical parameters are known for their variability which makes them difficult to estimate.
Comparative tests involving the HIT indicate the potential of using the HIT A*b result to obtain
geotechnical parameter proxies, but more tests are needed to validate the correlation for rocks of
intermediate strength.
DISCUSSION
The Odyssey Nord HIT hardness characterization was a preliminary test and further testwork is
required to corroborate results on a larger scale. However, the results obtained, during the Odyssey case
study, are positive and indicate that the HIT can play an important role in the early stages of any mineral
exploration program. The HIT does not replace standard comminution tests: rather it generates a high
number of comminution and geomechanical parameters for a given rock mass. The increased definition
that the HIT provides makes it possible to determine the uniformity of the rock mass and distinguish
problematic zones with respect to comminution circuits.
CONCLUSIONS
The HIT trial conducted at AEML has led to several developments establishing the HIT as an
essential device for hardness quantification regarding A*b and BWi. The bias previously observed in 2016
with A*b results was mainly resolved, and was attributed to energy losses. Lead shot deformation, used for
QC, confirmed that the energy loss was significant and related to the bench support. Performing HIT tests
in triplicate delivered more precise results and provided an estimate of the sample hardness variability.
One purpose of the HIT is to estimate ore hardness during the early stages of a project. A case
study involving core samples was performed at MCM. Testwork entailed comparing two preparation
protocols prior to running HIT tests, and verifying the possibility of using HIT A*b results to estimate
geomechanical parameters (i.e. UCS and PLT). While both preparation protocols produced statistical
similar results, it was more difficult to prepare HIT samples with a diamond saw. The hand-held hammer
preparation protocol was preferred because it proved to be accurate, simple, faster and portable (like the
HIT device itself). HIT A*b and BWi proxy results indicated the presence of two hardness domains at
Odyssey Nord, a harder one associated with porphyries, and a softer one associated with talc-carbonate
alteration. The most interesting finding pertained to some hard samples (A*b < 30). The distribution of this
material in the domain must be determined in order to control mill performance at any point in time during
the mine life. Statistics obtained during the HIT testing were used to evaluate the number of standard tests
required to adequately characterize the Odyssey Nord rock hardness. By separating the results by hardness
domain, combined with the use of a statistical approach, the number of standard tests required could be
significantly reduced. The UCS and PLT results are, by nature, variable, and several tests are usually
required to obtain an appropriate average. The relationship between the geomechanical intact breakage
results and the HIT A*b shows a fair potential that certainly needs to be developed further. In this context,
it is believed that the HIT can help geotechnical engineers obtain improved results density.
ACKNOWLEDGMENTS
Many people were involved in the realization of this study, and the authors would like thank all of
them for their time and their exceptional contribution. We wish to thank Mine Canadian Malartic for their
remarkable participation in this case study and for granting their permission to publish this paper. We
express special thanks to Agnico Eagle Mines Limited for their countless contributions to so many aspects
of the project. Without their help, it would not have been possible to achieve these notable outcomes.
Special thanks also to Dr. Toni Kojovic for his flawless support and brilliant advice. Finally, our thanks go
out to SimSAGe Pty Ltd for graciously accepting to supply us with an HIT device.
COM2017 | THE CONFERENCE OF METALLURGISTS hosting World Gold & Nickel Cobalt Proceedings ISBN: 978-1-926872-36-0
Published by the Canadian Institute of Mining, Metallurgy and Petroleum | www.metsoc.org

REFERENCES
Chandramohan, R. (2015). Reliability of Some Ore Characterization Tests. Proceedings of the SAG
Conference 2015, Vancouver, Canada, Paper No 7.
Couët, F., Goudreau, S., Makni, S., Brissette, M., Longuépée, H., Gagnon, G., & Rochefort, C. (2015). A
New Methodology for Geometallurgical Mapping of Ore Hardness. Proceedings of the SAG
Conference 2015, Vancouver, Canada, Paper No 8.
Gamal, S., Abdel, H. (2012). Correlation between Bond Work Index and Mechanical Properties of some
Saudi Ores. Journal of Engineering Sciences, Assiut University, Vol. 40, No 1, (pp. 271-280).
ISRM, (1985). Suggested Method for Determining Point Load Strength. International Journal of Rock
Mechanics and Mining Sciences & Geomechanic Abstract, Vol. 22, No 2, (pp. 51-60).
Kojovic, T. (2016). HIT – a Portable Field Device for Rapid Testing at Site. Proceedings of the 13th
AUSIMM Mill Operator’s Conference, Perth, West Australia, Paper No 107.
Kojovic, T. (2017). Unpublished results. Personal communications.
Morrell, S. (2009). Predicting the Overall Specific Energy Requirement of Crushing, High Pressure
Grinding Roll and Tumbling Mill Circuits. Minerals Engineering, 22, (pp. 544-549).
Morrell, S. (2017). About the SMC Test®. http://www.smctesting.com/about/technical-information.
Napier-Munn, T. J., Morrell, S., Morrison, R. D., & Kojovic, T. (2005). Mineral Comminution Circuits:
Their Operation and Optimization, Julius Kruttschnitt Mineral Research Centre, The University
of Queensland, Brisbane.
Rusnak, J., Mark, C. (2000). Using the Point Load Test to Determine the Uniaxial Compressive Strength of
Coal. Proceedings of the 19th
International Conference on Ground Control in Mining,
Morgantown WV, West Virginia University, (pp. 362-371).
Vatandoost, A. (2010). Petrophysical Characterization of Comminution Behavior (Thesis submitted for the
degree of Doctor of Philosophy (Geometallurgy)). ARC Centre of Excellence in Ore Deposits,
University of Tasmania.
Williams, S. (2011). The Challenge of Communication in Geometallurgy. SEG Newsletter, July 2011 – No
86, (pp. 31).
Windle, S. J., Kojovic, T., & Sullivan, J. (2016). Use of a Modified Comminution Index to Predict Bond
Work Index and SMC A*b at the Antamina Mine, Peru. Proceedings of the Third AUSIMM
International Geometallurgy Conference, Perth, West Australia, Paper No 67, (pp.153-160).
Wirfiyata, F., & McCaffery, K. (2011). Applied Geo-metallurgical Characterisation for Life of Mine
Throughput Prediction at Batu Hijau. Proceedings of the SAG Conference 2011, Vancouver,
Canada, Paper No 32.
COM2017 | THE CONFERENCE OF METALLURGISTS hosting World Gold & Nickel Cobalt Proceedings ISBN: 978-1-926872-36-0
Published by the Canadian Institute of Mining, Metallurgy and Petroleum | www.metsoc.org


![Evaluating HIT Standards...interoperable communications. With increased mandates to use standards from HIPAA1 (e.g., ASC X12, National Council for Prescription Drug Programs [NCPDP]),](https://img.pdfslide.net/doc/110x75/5e836071800a4d2b8e6c66d7/evaluating-hit-standards-interoperable-communications-with-increased-mandates.jpg)