Embed Size (px)
Citation preview
The Pennsylvania State University
The Graduate School
The School of Labor and Employment Relations
APPLICANT REACTIONS TO DIFFERENT EMPLOYMENT INTERVIEW
MODALITIES AND WAITING AFTER THE SCHEDULED TIME: EXAMINATION OF
THE MODERATING EFFECTS OF GENERAL SELF-EFFICACY
A Thesis in
Human Resources and Employment Relations
by
Juseob Lee
© 2015 Juseob Lee
Submitted in Partial Fulfillment
of the Requirements
for the Degree of
Master of Science
December 2015
ii
The thesis of Juseob Lee was reviewed and approved* by the following:
Stanley M. Gully
Professor of Human Resource Management
Thesis Advisor
Rick R. Jacobs
Professor of Psychology
Jean M. Phillips
Professor of Human Resource Management
Director of the Graduate Program in Human Resources and Employment Relations
*Signatures are on file in the Graduate School
iii
ABSTRACT
The employment interview is one of the most popular selection techniques to date.
Recent technological developments have enabled organizations to utilize technology-mediated
interviews for cost-saving, while expanding the definition of interviews beyond face-to-face
interaction. Given this current practice, this study addresses the effects of interview modality
(face-to-face and phone) on applicant reactions and suggests that a new variable, time waiting –
the time an applicant is kept waiting after the scheduled time – has an impact on applicant
reactions during selection procedures. The proposed model was tested by moderated regression
analyses with a sample of 171 undergraduate students recruited for the experimental survey. The
results demonstrate that interview modality predicts perceived fairness and organizational
attraction, time waiting predicts organizational attraction, and general self-efficacy moderates the
relationships between them. Implications for theory and practice are discussed.
iv
TABLE OF CONTENTS List of Tables ........................................................................................................................................... v List of Figures ........................................................................................................................................ vi
Chapter 1. Introduction ............................................................................................................................ 1
Chapter 2. Literature Review and Hypotheses .......................................................................................... 4
Applicant Reactions to Selection Procedures..................................................................................... 4 Organizational Attraction .................................................................................................................. 6
Perceived Fairness ............................................................................................................................ 8
Job Pursuit Intentions ..................................................................................................................... 12 Interview Modality ......................................................................................................................... 13
Time Waiting .................................................................................................................................. 16
Interaction: Interview Modality and Time Waiting .......................................................................... 18
Individual Difference: General Self-Efficacy .................................................................................. 19 Chapter 3. Methodology ........................................................................................................................ 24
Participants ..................................................................................................................................... 24
Research Design ............................................................................................................................. 24 Procedure ....................................................................................................................................... 25
Manipulation Check ....................................................................................................................... 27
Independent Variables ..................................................................................................................... 27 Interview modality .................................................................................................................. 27
Waiting past the scheduled time ............................................................................................... 28
Dependent Variables ....................................................................................................................... 29
Perceived fairness .................................................................................................................... 29 Organizational attraction .......................................................................................................... 30
Job pursuit intentions ............................................................................................................... 30
Individual Differences .................................................................................................................... 30 General self-efficacy................................................................................................................ 30
Control Variables and Demographic Questions ............................................................................... 31
Statistical Methods ......................................................................................................................... 31 Chapter 4. Results ................................................................................................................................. 32
Data Cleaning Procedures and Descriptive Statistics ....................................................................... 32
Confirmatory Factor Analysis ......................................................................................................... 34
Hypotheses Testing ......................................................................................................................... 36 Chapter 5. Discussion ............................................................................................................................ 42
Theoretical Implications ................................................................................................................. 43
Signaling theory ...................................................................................................................... 44 Instrumental-symbolic framework of organizational attraction ................................................. 45
Effects of the type of interview on applicant reactions .............................................................. 45
General self-efficacy................................................................................................................ 47
Practical Implications ..................................................................................................................... 49 Limitations and Future Research Directions .................................................................................... 51
Chapter 6. Conclusions .......................................................................................................................... 55
APPENDIX ........................................................................................................................................... 56 Appendix A: Scenarios ................................................................................................................... 56
Appendix B: Measures Grouped by Constructs ............................................................................... 57
Appendix C: Summary Explanation of Research ............................................................................. 61 Appendix D: Questionnaire ............................................................................................................ 62
Appendix E: Regression Results with Continuous Predictors Mean Centered (Original) .................. 68
Bibliography ......................................................................................................................................... 71
v
LIST OF TABLES
Table 1: List of Hypotheses .................................................................................................... 22
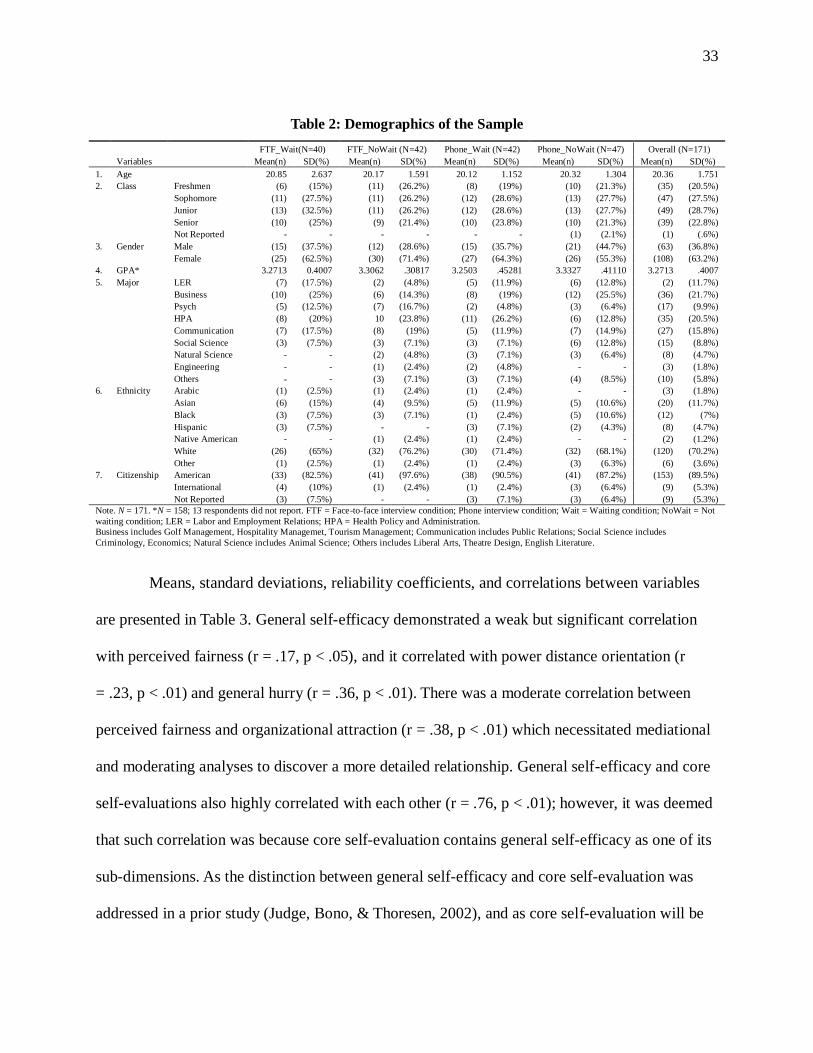
Table 2: Demographics of the Sample .................................................................................... 33
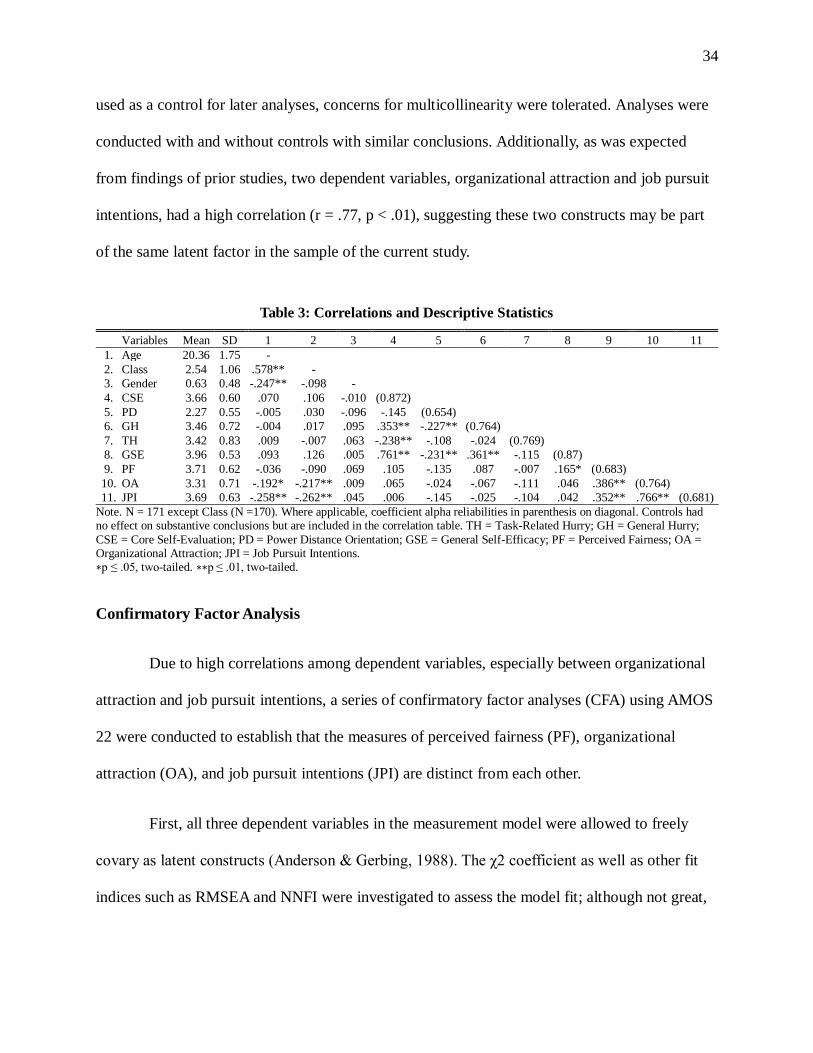
Table 3: Correlations and Descriptive Statistics ...................................................................... 34
Table 4: Regression Results with Continuous Predictors Mean Centered ................................ 38
Table 5: Coefficient Change Depending on Control Variables (Perceived Fairness) ................ 42
Table 6: Coefficient Change Depending on Control Variables (Organizational Attraction) ...... 43
vi
LIST OF FIGURES
Figure 1: The Proposed Model of the Study.................................................................................6
Figure 2: Moderating Effect of General Self-Efficacy on the Relationship between Interview
Modality and Perceived Fairness ...................................................................................... 39
Figure 3: Moderating Effect of General Self-Efficacy on the Relationship between Time
Waiting and Perceived Fairness ........................................................................................ 39
Figure 4: Moderating Effects of General Self-Efficacy on the Relationships among Interview
Modality, Time Waiting, and Organizational Attraction .................................................... 41
1
Chapter 1
Introduction
The employment interview has been reported as the most common method for making
hiring decisions in businesses (Arvey, 1979; Macan, 2009). Due to its widespread use, it has
been a focus of many decades of research. Factors that affect the interviewer’s ratings as well as
its predictive validity for future performance have been investigated by previous studies (e.g.,
McDaniel, Whetzel, Schmidt, & Maurer, 1994). Research has demonstrated its usefulness as a
selection and assessment tool but also have identified other variables that affect interviews. For
example, interview faking (Levashina & Campion, 2007), impression management (Van
Iddekinge, McFarland, & Raymark, 2007), physical attractiveness (Pingatore, Dugoni, Tindale,
& Spring, 1994), and searching for negative evidence (Rowe, 1989) were found to be related to
interview outcomes. However, applicant reactions to interviews with different types of interview
modalities (e.g., face-to-face, videoconference, and phone interviews) as well has their reactions
to time spent waiting for interviews have not been given much attention. Likewise, individual
differences that may influence applicant reactions to modalities and time spent waiting have not
been investigated.
When applicants are invited to job interviews, they typically go through a series of
interactions with the organization. The experience of such interactions may be positive or
negative to the applicants. Positive applicant reactions are related to higher job acceptance
intentions, but negative reactions induced by organizations often result in negative recruiting
outcomes such as withdrawal of applicants from the pool (Ryan, Sacco, McFarland, & Kriska,
2000; Schmit & Ryan, 1997). This highlights organizations’ need to maintain positive
2
perceptions of the organization by applicants during the selection process. Although applicant
reactions that arise from selection procedures may be influenced by objective (factual) or
subjective (affective or attitudinal) variables by involved parties (applicants or recruiters), this
study focuses specifically upon perceived fairness, organizational attraction, and job pursuit
intentions resulting from different interviewing methods. More specifically, this study examines
what type of employment interview method might positively or negatively influence applicant
reactions.
The traditional way of conducting employment interviews is to invite job applicants to a
designated place and have a face-to-face conversation between the applicant(s) and the
interviewer(s) (Chapman, Uggerslev, & Webster, 2003). However, geographically scattered
applicants have necessitated applicants traveling or utilization of technology during interviews
(Chapman, 1999). Technology-mediated interview techniques such as videoconferencing and
phone interviews are now used by many human resources (HR) practitioners (SHRM, 2013), and
it is not surprising anymore for job seekers to be invited to a job interview that is conducted in a
place convenient to the applicant using technology. If applicants are invited to technology-
mediated interviews (videoconferencing or phone interviews), the nature of interaction between
the recruiter(s) and interviewee(s) would not be the same as it would be during face-to-face
interviews. There may be possible issues caused by technology based mediation, and this
mediation may hinder the timeliness and effectiveness of employment interviews. For example,
technical failure or administrative issues may hinder recruiters’ efficacy in overseeing interview
procedures in a timely manner, causing the applicants to wait for interviews without notice. It is
expected that such occasions will impact applicants’ reactions toward the organization as well as
their reactions to selection procedures. This study addresses the impacts of an organization’s
3
technology-mediated employment behavior – that is, inviting applicants to technology-mediated
interviews instead of face-to-face interviews as well as examining the influence of making
applicants wait before the interview, whether intentional or unintentional – on applicants'
perceived fairness, organizational attraction, and job pursuit intentions.
The main purpose of this study is to understand the relationship among interview
modality, time spent waiting, and applicant reactions to employment interviews. As has been
suggested by previous researchers (e.g., Ryan & Ployhart, 2000), individual differences may
have a moderating effect on such reactions. Accordingly, general self-efficacy was chosen as an
important individual difference variable to investigate because of its conceptual relevance, as
discussed later. This study contributes to the existing literature about applicant reactions,
employment interviews, temporal variables (time waiting), and individual differences by filling
the gap between findings associated with each other, especially findings related to perceived
fairness (e.g., Colquitt, Conlon, Wesson, & Porter, 2001; Steiner & Gilliland, 1996),
organizational attraction (e.g., Turban & Greening, 1997), and job pursuit intentions (e.g.,
Lievens & Highhouse, 2003).
4
Chapter 2
Literature Review and Hypotheses
Applicant Reactions to Selection Procedures
The primary objective of employment selection is to choose top talent from an
organization’s applicant pool. However, in addition to identifying the best candidate for job
positions, the selection process itself is also an important tool for maintaining the pool of
applicants (Ryan & Polyhart, 2000). Negative applicant reactions promote early withdrawal from
the applicant pool (Ryan et al, 2000; Schmit & Ryan, 1997). Therefore, keeping applicant
reactions positive toward the organization is imperative for sustaining the high quality of human
resources that is necessary for businesses to succeed (Priem & Butler, 2001).
Signaling theory (Spence, 1973) plays an important role in the process of applicant
reactions. This theory explains the behaviors of two parties (in this case, organizations and
applicants) when there is asymmetry in shared information. Signaling theory was first suggested
to understand the effect of educational attainments on labor suppliers’ (i.e., individuals)
attractiveness to organizations in the labor market. However, in recruitment/selection contexts, it
explains the mechanism of applicants’ information acquisition behaviors regarding external and
inferred characteristics of employing organizations. Although there are various sources of
information that a job applicant can access to learn about an organization, these public sources
usually contain only positive information (Turban, 2001) that is selectively shared by the
organization, requiring applicants to search for more information by inference (Connelly, Certo,
Ireland, & Reutzel, 2011). To better understand an employing organization, applicants interpret
signals of the organization to infer its unknown attributes (Rynes, 1989). For instance, if an
5
organization sends a signal to a job applicant that is interpreted in a positive way (e.g., an email
invitation to an interview in a professional manner rather than in a condescending manner), the
applicant will perceive the employer more favorably because they will perceive the employer-
sent signal as echoing the climate of the employer-employee relationship within the organization.
Based on signaling theory in selection contexts, this study examines factors that may
influence applicants’ reactions during interviewing procedures. According to Ryan and Polyhart
(2000), there are two major streams of research in the applicant reactions literature. The first
stream focuses on how applicant perceptions affect recruiting outcomes such as organizational
attraction (e.g., Smither, Reilly, Millsap, Pearlman, & Stoffey, 1993). The other stream of
research investigates relationships between applicant attitudes and their performance in selection
procedures (e.g., Arvey, Strickland, Drauden, & Martin, 1990; Bauer, Maertz, Dolen, &
Campion, 1998). Although both streams are important in understanding applicant perceptions,
emotions, and their behaviors (Ryan & Polyhart, 2000), the emphasis of this study is on the first
main stream of research: investigation of a selection procedure and its influence on recruiting
outcomes (i.e., applicant reactions). Specifically, this study focuses on the relationships between
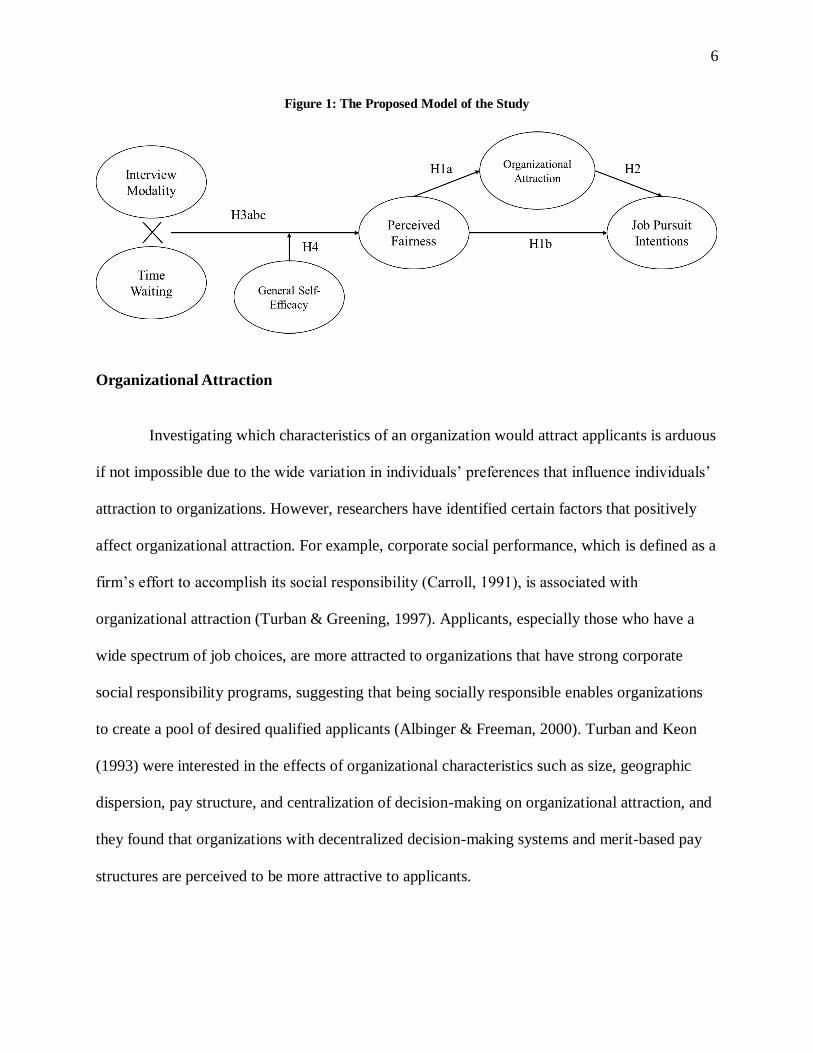
organizational attraction, job pursuit intentions, and perceived fairness. Figure 1 illustrates the
proposed model of the study. Theoretical background, findings from previous studies, and
development of hypotheses will be discussed in this chapter.
6
Figure 1: The Proposed Model of the Study
Organizational Attraction
Investigating which characteristics of an organization would attract applicants is arduous
if not impossible due to the wide variation in individuals’ preferences that influence individuals’
attraction to organizations. However, researchers have identified certain factors that positively
affect organizational attraction. For example, corporate social performance, which is defined as a
firm’s effort to accomplish its social responsibility (Carroll, 1991), is associated with
organizational attraction (Turban & Greening, 1997). Applicants, especially those who have a
wide spectrum of job choices, are more attracted to organizations that have strong corporate
social responsibility programs, suggesting that being socially responsible enables organizations
to create a pool of desired qualified applicants (Albinger & Freeman, 2000). Turban and Keon
(1993) were interested in the effects of organizational characteristics such as size, geographic
dispersion, pay structure, and centralization of decision-making on organizational attraction, and
they found that organizations with decentralized decision-making systems and merit-based pay
structures are perceived to be more attractive to applicants.
7
Applicants are also attracted to more familiar organizations. According to Turban
(2001), there are two reasons why familiar organizations are attractive to applicants. First, people
feel more comfortable with what is already known to them. Familiarity is built upon
organizations’ public relations, recruitment practices, and advertisements that usually contain
positive information about the organization, and individuals exposed to such positive information
form a positive attitude about organizations in accordance with the information available.
Another reason familiarity breeds applicant attraction is based on social identity theory (Tajfel,
1979). People classify themselves as well as others into social categories based on organizational
and religious memberships. Such classifications allow individuals to define their identity in
society, and they feel pride to work for an organization that is widely known within the social
circles to which they belong.
In addition to familiarity, the perceived tone of an organization can affect its desirability
as a place to work. Lievens and Highhouse (2003) examine instrumental and symbolic attributes
of organizational attraction. The instrumental-symbolic framework, which is commonly
discussed in marketing literature, suggests that a consumer’s choice about purchasing and using a
product is not only based on its instrumental functions (e.g., the utility of a ball-point pen), but is
also based on the symbolic image of using the product (e.g., using a luxurious fountain pen) that
is related to self-identity and self-image (Aaker, 1997; 1999). Beyond job and organizational
factors such as pay, location, and organizational structure, they posit that “applicants’ initial
attraction to an employing organization is also based on the symbolic meanings (in terms of
inferred traits) that they associate with organizations” (Lievens & Highhouse, 2003, p. 77). In
other words, some organizations possess traits that may be perceived by individuals as outdated
while other organizations may be perceived to be trendy, and this symbolic function affects
8
applicants’ desire toward organizations as a potential employer. This mechanism of
organizational attraction explained by the instrumental-symbolic framework is somewhat similar
to that of signaling theory. However, they differ because signaling theory focuses on how
information (signals) shape perceptions about organizations (or how signals shape perceptions
about labor) whereas the instrumental-symbolic framework focuses on the meaning and value of
the information (instrumental versus symbolic) that is sent or shared.
Besides organizational characteristics, there are studies that focus on the impact of
recruitment and selection procedures on organizational employment success. For example,
Turban, Forret, and Hendrickson (1998) find that organizational attraction is associated with
recruiter behavior. Another study conducted by Carless (2005) finds that perceived person-job
and person-organization fit influences organizational attraction to applicants during the
recruitment and selection procedure.
Perceived Fairness
Gilliland (1993) postulates that perceived fairness is associated with recruiting outcomes
such as job application and acceptance decisions, in addition to other outcomes such as
endorsement of the organization’s products, self-esteem, and self-efficacy. Studies about
perceived fairness in organizational contexts have their theoretical basis in organizational justice
theory (Colquitt et al., 2001; Greenberg, 1987; Gilliland, 1993). Organizational justice theory
and its implications for recruitment/selection context will be discussed in this section.
9
Organizational justice theory (Greenberg, 1987) has inspired many researchers to
examine how fairness operates in workplaces. Organizational justice states that employees’
perception of fairness drives their behaviors in workplaces (Polyhart & Ryan, 1997).
Organizational justice consists of distributive justice, procedural justice, and interactional justice,
which is further divided into interpersonal and informational justice (Colquitt et al., 2001).
Distributive justice focuses on fairness in the distribution of outcomes according to the social
exchange theory framework (Adams, 1965). According to Adams, when people perceive how
fair the distribution of outcomes are in organizations, they are concerned about whether the given
outcome corresponds to individuals’ perceived inputs (e.g., labor offered for a project, education,
and intelligence). In other words, people are more interested in the amount of relative outcome
distribution given to individuals rather than the absolute amount of the distribution. Therefore,
distributive justice concerns how much credit for an outcome is distributed to an individual in
comparison to others.
Procedural justice focuses on how decision-making procedures are administered and
whether they are perceived to be administered accurately and consistently without any bias
(Leventhal, 1980). According to Leventhal, Karuza, and Fry (1980), procedural justice demands
that decision-making procedures be consistent across people and time, remain unbiased, based on
accurate information, and should be corrected for any flawed decisions. Also, it should be ethical
and open to opinions from various groups. Interactional justice is concerned with the degree of
politeness, dignity, and respect presented by authorities (interpersonal justice) to those in a
subordinate role, as well as the adequacy of explanation given to people for decisions made by
the organization (informational justice) (Colquitt, 2001; Greenberg, 1993).
10
There have been many efforts to identify the effects of fairness in organizations.
Procedural justice affects an individual’s self-esteem (Siegel, Post, Brokner, Fishman, & and
Garden, 2005) and interactional justice is associated with the likelihood of retaliation against the
employer after lay-off decisions (Skarlicki, Barclay, & Pugh, 2008). Colquitt and colleagues
(2001) found in their meta-analysis study of 183 justice-related studies that all four facets of
justice (distributive, procedural, informational, and interpersonal) are related to several key
outcomes in organizations such as job satisfaction, organizational commitment, and withdrawal.
In the same study, procedural justice is highly correlated to outcome satisfaction, job satisfaction,
organizational commitment, and trust. Procedural justice is also moderately correlated to
organizational citizenship behavior of organization (OCBOs).
Gilliland (1993) conceptualizes procedural justice rules using three categories: formal
characteristics of procedures, explanation of procedures and decision making, and interpersonal
treatment. Steiner and Gilliland (1996) investigated applicants’ perceptions of fairness toward
selection methods used in the United States and France. In the study, they measured college
students’ process favorability and perceived fairness of different selection techniques:
interviews, résumé, work-sample tests, biodata, ability tests, personal references, personality
tests, honesty tests, personal contacts, and graphology. Participants were given brief descriptions
of each selection method and were asked to rate their favorability and the perceived fairness of
each method. It was found that in the United States sample, interviews, résumé, and work-sample
tests are most highly favored. Among seven procedural dimensions that were labeled as (a)
scientific evidence, (b) employer’s right to obtain information, (c) opportunity to perform, (d)
interpersonal warmth, (e) face validity, (f) widespread use, and (g) respect for privacy, the
11
United States sample rated face validity, widespread use, and employer’s right to obtain
information as the most relevant components of favorability.
In the recruitment/selection context, Chapman, Uggerslev, Carroll, Piasentin, and Jones
(2005) investigated predictors of recruiting outcomes in a meta-analysis involving 71 prior
studies. In their study, dimensions of recruiting outcomes are defined as (a) job pursuit intentions
(willingness to enter or stay in the applicant pool), (b) job-organization attractions (applicants’
overall evaluation of the job and/or organization), (c) acceptance intentions (likelihood that an
applicant would accept a job offer), and (d) job choice (whether to accept the real job offer).
They investigated the relationship between recruiting outcomes and their predictors: job and
organizational characteristics, recruiter characteristics, perceptions of the recruitment process,
perceived fit, perceived alternatives, and hiring expectancies. Among other predictors, they
found that justice perception is one of the most important predictors of job-organization
attraction and job acceptance intention.
As described above, studies about applicant reactions demonstrate that determinants of
favorable recruiting outcomes, which are conceptualized as organizational attraction and job
pursuit intention, are closely related to perceived fairness (Chapman et al., 2005). However, it
should be noted that the causality of the relationship between fairness perceptions and
organizational attraction is not necessarily clear; Ryan and Polyhart (2000) propose that
organizational attraction may be the cause that drives how applicants perceive selection
procedures. Cognitive dissonance (Festinger, 1962) may lead to distorted perceptions of
applicants regarding selection procedures. For example, if an organization is attractive to a job
applicant, the selection process of the attractive organization is regarded as “thorough” rather
than “invasive” (Ryan & Polyhart, 2000). Building on the large body of research connecting
12
perceived fairness to attraction, it is hypothesized that perceived fairness will be positively
related to organizational attraction. Likewise, it is expected that perceived fairness will also
increase intentions to engage in job pursuit.
Hypothesis 1a: Applicants' perceived fairness will be positively related to organizational
attraction.
Hypothesis 1b: Applicants' perceived fairness will be positively related to job pursuit
intentions.
Job Pursuit Intentions
Chapman et al. (2005) suggests that “measuring acceptance intentions is the best
available proxy variable for actual job choice” (p. 940) when measuring actual behavior is not
feasible. Organizational studies in the context of recruitment have investigated the relationship
between attitude and actual behavior (Chapman et al, 2005, Highhouse, Lievens, & Sinar, 2003).
Those studies were conducted based upon the assumption that behavioral intentions will result in
actual behaviors consistent with the theory of reasoned action (Fishbein & Ajzen, 1975). The
theory of reasoned action describes how people’s attitudes and behavior are associated; attitudes
affect behavioral intentions and behavioral intentions then influence actual behaviors. Highhouse
et al. (2003) studied the relationship among attraction to the organization, job pursuit intentions,
and actual job pursuit behavior of undergraduate students based on company descriptions in
recruitment booklets. In the study, the effects of organization attraction and prestige on actual
pursuit behaviors were mediated by job pursuit intentions, supporting the postulations of the
theory of reasoned action. Gully and colleagues (Gully, Phillips, Castellano, Han, & Kim, 2013)
13
also examined the relationship between organizational attraction and job pursuit intentions.
Results of the study show that job pursuit intentions of 332 online job seekers are significantly
predicted by organizational attraction; moreover, it was also found that organizational attraction
fully mediates the relationship between perceived person-organization fit and job pursuit
intentions.
Following prior findings of relationships between job pursuit intentions and
organizational attraction (Chapman et al., 2005, Gully et al., 2013; Highhouse et al., 2003), this
study will re-examine the relationship between organizational attraction and job pursuit
intentions.
Hypothesis 2: Organizational attraction will increase job pursuit intentions.
Interview Modality
Traditionally, employment interviews are conducted through face-to-face interactions
between interviewer(s) and interviewee(s) (Chapman et al., 2003). However, interviews are no
longer constrained to face-to-face interactions. According to a survey conducted in 2013 by the
Society for Human Resources Management (SHRM), only 34% of 383 HR practitioners who
responded to the survey specified that their employing organizations never utilize online
interviews (SHRM, 2014). Following this trend, Levashina and colleagues (2014) redefined an
employment interview as “a personally interactive process of one or more people asking
questions orally to another person and evaluating the answers for the purpose of determining the
qualifications of the person in order to make employment decisions” (p. 243). This expansive
definition can be applied to interviews conducted via any medium. One of the objectives of this
14
paper is to examine applicants’ reactions towards different types of interview modality. It is
expected that applicants who experience interviews via different modalities would feel
differently about their job pursuit intentions as the nature of interaction changes with the change
in modality.
Few studies have examined applicants’ reactions towards interviews conducted via
various modalities (Chapman et al., 2003; Kroeck & Magnusen, 1997; Straus, Milesb, &
Levesquec, 2001). Straus et al. (2001) studied reactions of interviewers and interviewees by
conducting mock interviews with 59 MBA students posing as applicants and PhD students
posing as interviewers. Interviewees in the study reported that they felt more comfortable in
face-to-face interviews than in videoconferencing interviews. They rated interviewers to be more
likeable in face-to-face than videoconferencing and reported feeling more self-conscious about
their behavior during face-to-face interviews than during phone interviews. Chapman et al.
(2003) also conducted a field study to examine the effect of interview modality (face-to-face,
videoconferencing, and phone) on perceived fairness, perceived interview difficulty, acceptance
intentions, and expectancy of a favorable outcome. They found that face-to-face interviews are
positively associated with higher perceived fairness than phone interviews.
There are two theories that may explain why the difference in applicant reactions relies
on the type of interview modality: media richness theory and signaling theory. According to
media richness theory (Daft & Lengel, 1986), richness of information varies by a specific
medium of communication. Face-to-face interviews have more richness compared to
videoconferencing and phone interviews because they provide the full spectrum of verbal cues
(words spoken), paraverbal cues (vocal inflection and tone), and nonverbal cues (gestures). On
15
the other hand, videoconferencing offers a limited viewable space and shifts interaction from a
three-dimensional space to a two-dimensional screen (Fletcher & Major, 2006). Therefore, video
communication reduces the richness in information available to participants by restricting the
amount of observable nonverbal cues. Phone communication further reduces information
richness by completely eliminating nonverbal cues (McGrath & Hollingshead, 1993). In the
context of an employment interview, a reduction in information richness limits individuals’
cognitive interpretation of complex and subjective information (Levashina et al., 2014).
Signaling theory also plays a role in applicant reactions to interview modality because an
invitation to a certain type of interview sends a signal to the applicant about how much the
person is valued in the selection process (Chapman et al., 2003). The chosen way of conducting
an employment interview may also be interpreted as a signal about future treatment of the
applicant by the organization. Compared to face-to-face interviews, scheduling a technology-
mediated interview may denote that the employing organization does not give appropriate
attention to the applicants (Chapman & Rowe, 2002), or it may simply signal that the applicant is
not valuable enough to earn a face-to-face interview. Either perception will affect the overall
reactions of the applicant to the organization during the selection procedures. Therefore, one of
the objectives of this study is to confirm the earlier findings of applicant reactions toward
interview methods based on interview modality. As was found in a prior study (Chapman et al.,
2003), in which face-to-face interviews yielded higher perceived fairness, it is also expected in
the current study that applicants who experience face-to-face interviews will perceive more
fairness to the interview process than those who experience phone interviews.
16
Hypothesis 3a: Face-to-face interviews will have higher perceived fairness than phone
interviews.
Time Waiting
Waiting induces stress in people (Confer & Appley, 1964; Lazarus & Folkman, 1984).
When experiencing waiting, individuals perceive detrimental outcomes such as harm and loss of
their well-being; spending non-useful time generates “psychological cost” that hinders initiation
of planned activities and impairs people’s performance (Suck & Holling, 1997). Waiting and its
effects have been studied in healthcare and fast-food industries where delays in service produce
financial damage to organizations, and it was found that perceived waiting time is a valuable
predictor of customer satisfaction (Davis & Heineke, 1998; Thompson, Yarnold, Williams, &
Adams, 1996; Tom & Lucey, 1997). However, in recruitment/selection contexts, the effects of
time spent waiting have been given less attention.
Although there is no empirical study examining the effects of waiting in recruitment or
selection contexts, Purser’s (2006) recall of his experience as a day laborer may be helpful to
understand such effects on people. Day laborers persistently experience job insecurity, and “the
insecurity of employment propel many workers into a profound state of anxiety, condemned as
they are to wait for an indeterminate length of time, never knowing from one day to the next
whether they will get work” (p. 12). Waiting to be employed, especially if job seekers have to
provide for their family, is very difficult.
Unfortunately, it is not only day laborers who have to go through waiting processes for
employment. When looking for employment, people who are well-educated, capable, or even
17
well-experienced within a desired industry have to go through a certain type of waiting process
to get a job. Most applicants do not only wait for the final results – whether they receive
employment offer or not – but also during the selection processes which they must endure to
reach the final decisions of the organization. Employment selection processes are vulnerable to
delays. For example, a recruiter may suddenly experience a personal emergency that temporarily
prevents him/her from engaging in interviews. Delays can occur for less drastic reasons as well,
such as previously scheduled interviews that consume more time than allotted.
From an applicant's perspective, the agreed upon interview time is based upon a promise
between the applicant and the employing organization. For the applicant, an interview time is
regarded as a type of verbal contract, and applicants expect that the organization will commit to
the timeliness of interview as much as applicants are committed. This is in accordance with the
psychological contract described by Rousseau (1989). When a delay is foreseeable, the
employing organization can notify applicants that the interview is getting delayed/cancelled due
to unexpected problems and that the organization hopes to reschedule the interview soon.
However, if the delay was not foreseeable due to emergencies, administrative reasons, or the
recruiter’s failure to inform the applicant, it is unlikely that the applicant would anticipate
waiting for a reasonable cause. In such occasions, applicants will feel that the interview process
is unfair in terms of procedural justice and informational justice, and this occasion can be taken
as a signal that the organization does not care enough about its applicants and further, employees
(Rynes, 1989; Spence, 1973). In addition, applicants may feel that they are disadvantaged by
waiting, which may result in loss of their interview time (e.g., if there is another interview
waiting for the interviewer). Concerns stemming from a perceived lack of consistency in
administration may occur (“I must be the only one waiting”) and their perceived opportunity to
18
perform will decrease (“I missed the best window when I was prepared for this interview”),
causing applicants to perceive the whole interview process as less fair (Leventhal et al., 1980).
Waiting aggravates the stress of the interview process, and negative perceptions toward
the interview can spill over to other parts of the selection process (Rynes & Barber, 1990).
Therefore, one of the objectives in this study is to investigate the effect of time waiting on
applicants’ reactions to the employment interview.
Hypothesis 3b: Interviews will be perceived as less fair if the interview is conducted past
the scheduled time (time waiting).
Interaction: Interview Modality and Time Waiting
If the interview is conducted through face-to-face interaction, applicants usually talk to a
receptionist to check in and be guided to the waiting room. If a delay is expected, the receptionist
may explain why there is a delay, or the applicant may observe why the interviewer(s) is/are not
available (e.g., there is another interview in process at the time of waiting). Additionally, after a
certain waiting time, a good-mannered interpersonal introductory interaction, such as
handshaking between the interviewer and the applicant, may mitigate the applicant's negative
feeling from the breach of the psychological contract (Rousseau, 1989). It is also likely that the
applicant will forget the negative feelings from waiting because of the interaction with the
recruiter during the interview procedures, in accordance with the recency effect studied by Bjork
and Whitten (1974). Taken together, although waiting time may induce stress and a sense of
unfairness to applicants during face-to-face interviews, there are protective procedures
employing organizations can take that may mitigate the unpleasant feeling involved with delays.
19
Compared to face-to-face interviews, however, technology-mediated interviews may
induce more stress to applicants due to the limited information available in the contexts. Lazarus
& Folkman (1984) refer to stress from a lack of event information as event uncertainty. During a
phone interview, conversation with the receptionist, in-person observations, and interpersonal
interactions are not available. Applicants are expected to wait without any notice or cue, and the
uncertainty of the interview initiation aggravates the stress level. This can later result in a
perception of unfairness during or after the actual interview, and applicants may develop a
concern for the organization's lack of administrative consistency and their hindered opportunity
to perform that are closely related to procedural justice dimensions (Gilliland, 1993). Combined
with increased stress due to uncertainty (Lazarus & Folkman, 1984) as well as reduced
informational richness from a medium, which encumbers an individual’s ability to process
information (Levashina et al., 2014), phone interviews that involve waiting may result in
increased perceived unfairness in comparison to a face-to-face interview with waiting.
Hypothesis 3c: Phone interviews will be perceived as less fair than a face-to-face
interview if the interview is conducted past the scheduled time (time
waiting).
Individual Difference: General Self-Efficacy
Nikolaou and Judge (2007) examined the moderating effect of individual personality
differences, core self-evaluation in particular, by postulating that core self-evaluation makes a
difference in individuals’ perceived fairness of different selection procedures. Although the
moderation effect was not statistically significant in the study, it called for rigorous examination
20
of individual differences in applicant reaction literature. In addition to core self-evaluation, there
have been endeavors to find the connection between applicant reactions and other individual
differences. Self-monitoring (Chapman et al., 2003), job search self-efficacy (Rynes &
Connerley, 1993), individual’s background (Macan, Avedon, Paese, & Smith, 1994; Rynes &
Connerley, 1993), and desire for significant impact (Gully et al., 2013) were examined for their
effects on applicant reactions. Costa and McCrae’s (1992) Big Five personality dimensions
(conscientiousness, Dineen, Noe, & Wang, 2004; openness to experience, Kohn & Dipboye,
1998) were also examined for their influence on applicant reactions. Despite the influential
findings of prior studies, the effects of individual differences in selection procedures remain
underexplored. This may be because personality variables might be considered less important for
applicant reactions because of the many important factors that have been shown to influence
applicants’ reactions. Another possibility is that because personality variables have been a major
focus of literature about job performance (Barrick & Mount, 1991; Hurtz & Donovan, 2000),
their effects on applicant reaction are often neglected. In order to contribute to the findings on
individual difference variables, the current study focuses on a trait-like individual difference
variable, general self-efficacy (Eden, 1996), due to its relevance to coping strategies in stressful
situations (Gist & Mitchell, 1992).
Defined as “beliefs in one’s capabilities to mobilize the motivation, cognitive resources,
and courses of action needed to meet given situational demands” (Wood & Bandura, 1989, p.
408), self-efficacy has been found to be associated with MBA students’ entrepreneurial intentions
(Hao, Seibert, & Hills, 2005), college students’ self-set goal level, academic performance,
satisfaction, mathematical problem solving, and psychological health (Coffman & Gilligan,
2003; Karademas & Kalantzi-Azizi, 2004; Pajares & Miller, 1994; Phillips & Gully, 1997;
21
Zajacova & Espenshade, 2005). The concept of self-efficacy first introduced by Bandura (1986)
is task-specific. However, self-efficacy can be also a general estimation of oneself, working as a
trait-like individual difference that pertains to the generalized feeling that one can be successful
in a wide variety of achievement-oriented situations (Chen, Gully & Eden, 2001).
General self-efficacy is defined as “one’s estimate of one’s overall ability to perform
successfully in a wide variety of challenging achievement situations” (Eden, 1996, p. 9). This
definition of general self-efficacy differentiates itself from the task-specific self-efficacy
(Bandura, 1986). Task-specific self-efficacy is a state-like construct that can be changed over
time or in different contexts, whereas general self-efficacy is relatively stable over time, similar
to cognitive ability and personality (Chen, Gully, & Eden, 2004).
There are concerns about utilizing general self-efficacy in behavioral studies. For
example, Bandura (1997) expresses his concern that general efficacy beliefs have little
relationship to a specific task. However, by using a newly developed and validated scale, Chen
and his colleagues (2001) have found that general self-efficacy and task-specific self-efficacy
have strong, positive relationships. Judge and Bono’s (2001) meta-analysis found that general
self-efficacy is positively related to work performance, and Chen et al. (2004) found that the
concept is associated with task performance through its direct relationships to motivational states
that are “achievement/approach motivational processes” (p. 376).
According to Gist and Mitchell (1992), individuals who have a high level of task-
specific self-efficacy are more persistent and better able to cope with difficult situations than
individuals with a low level of task-specific self-efficacy. Similarly, individuals with high
general self-efficacy are less vulnerable to external stressors than individuals with low general
22
self-efficacy because those with a high level of general self-efficacy are more confident in their
abilities in general and less likely to fear failing on specific tasks (Chen, Gully, Whiteman, &
Kilcullen, 2000).
In a stressful situation where employment insecurity and waiting are involved,
individuals with high general self-efficacy are expected to be less vulnerable to stressors.
Therefore, along with technology-mediated interview styles and time waiting, the moderating
effect of general self-efficacy in the relationship among interview types, time waiting, and
applicants’ reactions will be examined within the current study.
Hypothesis 4: The relationships between interview modality, time waiting, and perceived
fairness will be weaker when individuals have a higher level of general
self-efficacy. The relationships between interview modality, time waiting,
and perceived fairness will be stronger when individuals have lower level
of general self-efficacy.
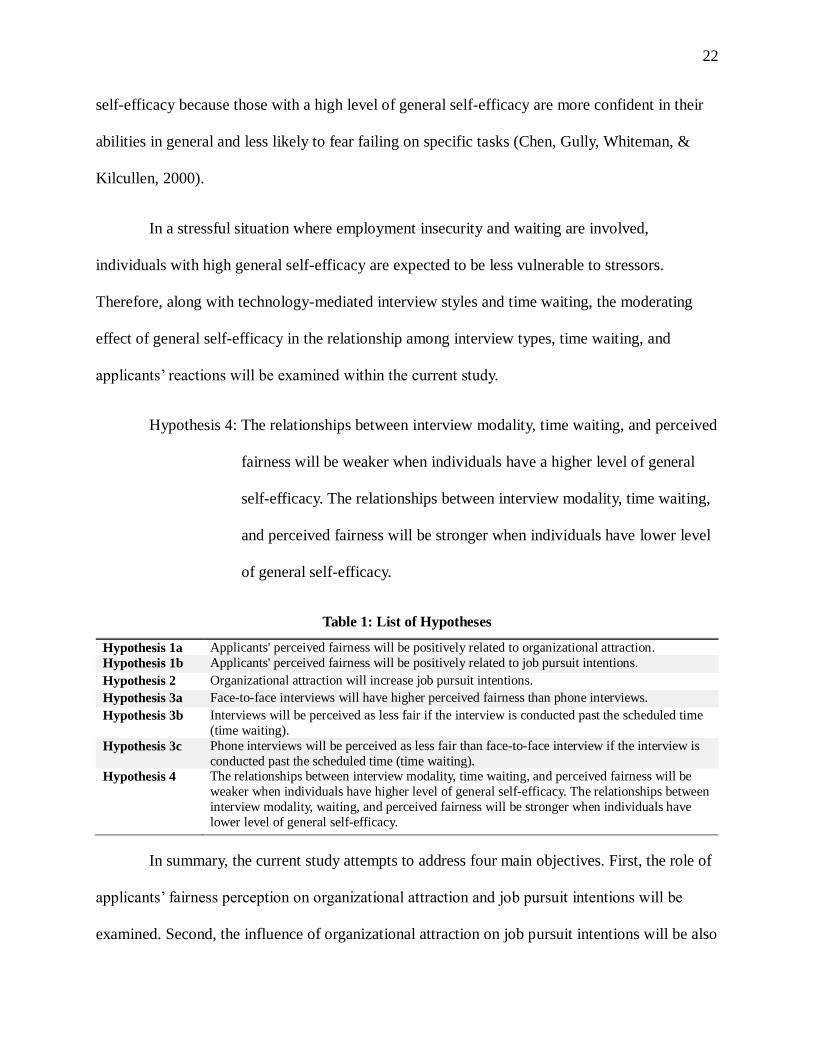
Table 1: List of Hypotheses
Hypothesis 1a Applicants' perceived fairness will be positively related to organizational attraction.
Hypothesis 1b Applicants' perceived fairness will be positively related to job pursuit intentions.
Hypothesis 2 Organizational attraction will increase job pursuit intentions.
Hypothesis 3a Face-to-face interviews will have higher perceived fairness than phone interviews.
Hypothesis 3b Interviews will be perceived as less fair if the interview is conducted past the scheduled time
(time waiting).
Hypothesis 3c Phone interviews will be perceived as less fair than face-to-face interview if the interview is
conducted past the scheduled time (time waiting).
Hypothesis 4 The relationships between interview modality, time waiting, and perceived fairness will be
weaker when individuals have higher level of general self-efficacy. The relationships between
interview modality, waiting, and perceived fairness will be stronger when individuals have
lower level of general self-efficacy.
In summary, the current study attempts to address four main objectives. First, the role of
applicants’ fairness perception on organizational attraction and job pursuit intentions will be
examined. Second, the influence of organizational attraction on job pursuit intentions will be also
23
investigated. Third, based on media richness theory, signaling theory, and postulations of stress
mechanisms, the effects of interview modality (face-to-face versus phone interviews) and time
waiting, as well as the interaction of both on applicants’ perceived fairness will be investigated.
Lastly, the moderating effects of general self-efficacy on the relationships between interview
modality, time waiting, and perceived fairness will be examined.
24
Chapter 3
Methodology
Participants
A total of 206 undergraduate students enrolled in a university located in the northeastern
region of the United States participated in a paper-and-pencil experiment. Participation was
voluntary, and there was no extra credit or monetary compensation provided for participation.
Data cleaning procedures resulted in a total of 171 cases to be used for further analysis (for a
detailed description of data cleaning procedures, please see Chapter 4). More of the participants
were female (63.2%), and identified themselves as white/Caucasian (70.2%) and American
(87.2%). Each class level was somewhat equally represented within the sample (Freshmen =
20.5%; Sophomore = 27.5%; Junior = 28.7%; Senior = 22.8%). Average age and GPA of the
sample were 20.36 (SD = 1.75) and 3.27 (SD = .4), respectively. More detailed demographic
information about participants is provided in Table 2.
Research Design
A 2×2 between-subjects factorial design was used for the study. Although lab
experiments involving interviews for real job positions (e.g., research assistant) or a field study
would be most appropriate for examining applicants’ reactions to selection methods, data was
collected through experimental survey for practical reasons. To my best knowledge, the current
study is the first investigation that attempts to examine the interactions of interview modality,
temporal variable (time waiting), and individual differences in selection contexts. Therefore, it
was still deemed meaningful to investigate the effects of these variables on recruitment outcomes
using a paper and pencil methodology with random assignment.
25
Participants were asked to answer questionnaire items designed to measure variables of
interest, after reading a scenario and picturing a particular interview situation. There were four
scenarios in total: two levels of interview modality (face-to-face and phone interview) and two
levels of waiting conditions (time waiting and no-waiting). Each participant was given one
scenario. In addition to the variables of interest and general self-efficacy, other individual
difference variables such as time urgency (Conte, Ringenbach, Moran, & Landy, 2001),
individual power distance orientation (Kirkman, Chen, Farh, Chen, & Lowe, 2009), and core
self-evaluation (Judge, Erez, Bono, & Thoresen, 2003) were also measured as control variables.
Procedure
At the beginning of introductory-level business/industrial-relations classes, verbal
introduction about the study was given to students, and then the scenarios/surveys were
distributed. The summary explanation of the research was placed on top of the survey and
students were asked for voluntary participation after being provided a brief explanation of the
study. Upon consenting to participate in the survey, participants first responded to a set of
questions that measured general self-efficacy, time urgency, power distance orientation, and core
self-evaluation. Next, participants read a hypothetical employment interview scenario and were
asked to imagine what it would be like to be in the interview situation. In order to improve
participants’ engagement with the scenarios, they were given instructions before reading the
scenarios. The instruction asked participants to spend from one to two minutes to think about the
context of the employment interview and to think about the answers to the interview questions
asked by the hypothetical recruiter in the scenario. Those questions were generic to most
interview contexts, addressing teamwork issues and communication styles. An example question
26
is, “You have an idea for a future project, but your manager disagrees with your idea. What
would you do next?”
In addition to the behavioral instruction, a brief description of the employing
organization was provided to help participants create concrete images of the hypothetical
interview. However, due to varying individual preference for organization/job characteristics, the
description of the organization was generalized as follows:
“You have applied for an entry-level job position relevant to your major in a large-sized
company (approximately 500 or more employees). Expectations, responsibilities, salary
level, and other information about the job position are consistent with other jobs that
people in your major commonly take upon graduation.”
Perceived fairness and organizational attraction were measured following reading and
reflecting upon the scenario presented. In each participant’s survey, one of the four possible
scenarios was randomly presented. Four types of questionnaires (i.e., scenarios 1 to 4) were
mixed beforehand for distribution. At the end of the survey, demographic questions were
presented. Upon completion of survey, participants were given a debriefing form that briefly
explained the main objectives of the current research. The average time taken for survey
completion was approximately eight minutes in the pilot study for eight master’s-level graduate
students. The amount of time for the actual data collection was from 20 to 25 minutes in
classrooms, including short verbal introduction, survey distribution, and survey collection with
teaching assistants’ help.
27
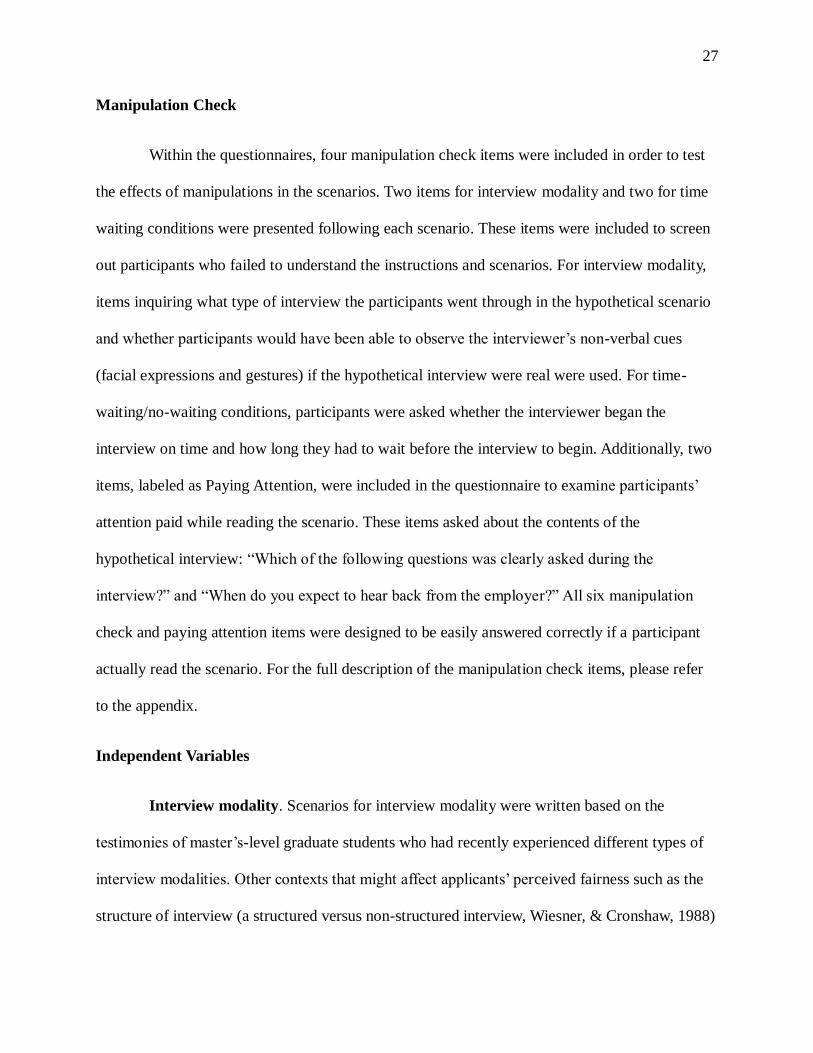
Manipulation Check
Within the questionnaires, four manipulation check items were included in order to test
the effects of manipulations in the scenarios. Two items for interview modality and two for time
waiting conditions were presented following each scenario. These items were included to screen
out participants who failed to understand the instructions and scenarios. For interview modality,
items inquiring what type of interview the participants went through in the hypothetical scenario
and whether participants would have been able to observe the interviewer’s non-verbal cues
(facial expressions and gestures) if the hypothetical interview were real were used. For time-
waiting/no-waiting conditions, participants were asked whether the interviewer began the
interview on time and how long they had to wait before the interview to begin. Additionally, two
items, labeled as Paying Attention, were included in the questionnaire to examine participants’
attention paid while reading the scenario. These items asked about the contents of the
hypothetical interview: “Which of the following questions was clearly asked during the
interview?” and “When do you expect to hear back from the employer?” All six manipulation
check and paying attention items were designed to be easily answered correctly if a participant
actually read the scenario. For the full description of the manipulation check items, please refer
to the appendix.
Independent Variables
Interview modality. Scenarios for interview modality were written based on the
testimonies of master’s-level graduate students who had recently experienced different types of
interview modalities. Other contexts that might affect applicants’ perceived fairness such as the
structure of interview (a structured versus non-structured interview, Wiesner, & Cronshaw, 1988)
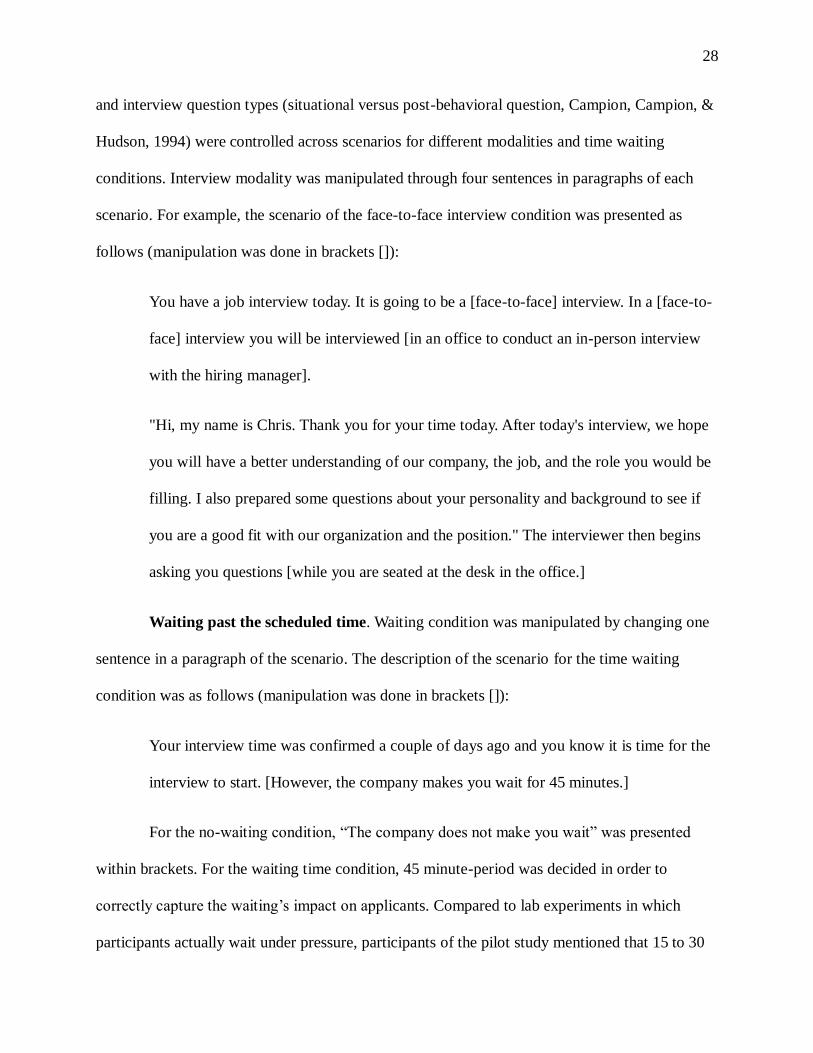
28
and interview question types (situational versus post-behavioral question, Campion, Campion, &
Hudson, 1994) were controlled across scenarios for different modalities and time waiting
conditions. Interview modality was manipulated through four sentences in paragraphs of each
scenario. For example, the scenario of the face-to-face interview condition was presented as
follows (manipulation was done in brackets []):
You have a job interview today. It is going to be a [face-to-face] interview. In a [face-to-
face] interview you will be interviewed [in an office to conduct an in-person interview
with the hiring manager].
"Hi, my name is Chris. Thank you for your time today. After today's interview, we hope
you will have a better understanding of our company, the job, and the role you would be
filling. I also prepared some questions about your personality and background to see if
you are a good fit with our organization and the position." The interviewer then begins
asking you questions [while you are seated at the desk in the office.]
Waiting past the scheduled time. Waiting condition was manipulated by changing one
sentence in a paragraph of the scenario. The description of the scenario for the time waiting
condition was as follows (manipulation was done in brackets []):
Your interview time was confirmed a couple of days ago and you know it is time for the
interview to start. [However, the company makes you wait for 45 minutes.]
For the no-waiting condition, “The company does not make you wait” was presented
within brackets. For the waiting time condition, 45 minute-period was decided in order to
correctly capture the waiting’s impact on applicants. Compared to lab experiments in which
participants actually wait under pressure, participants of the pilot study mentioned that 15 to 30
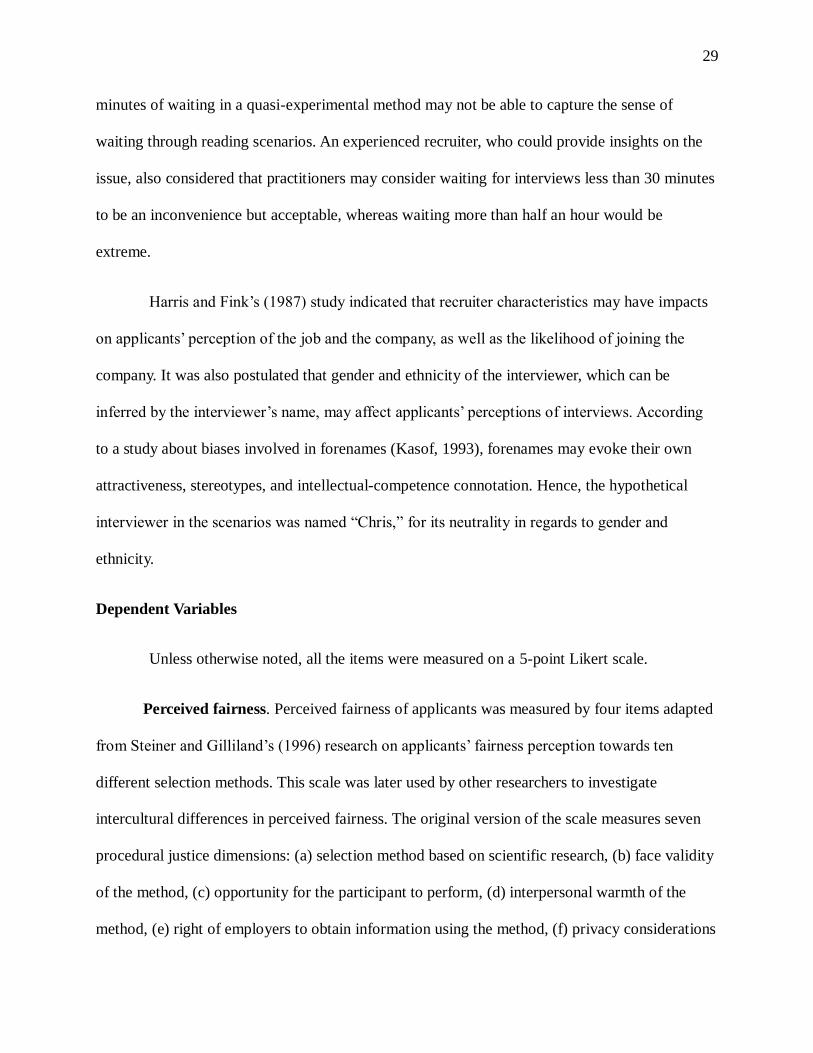
29
minutes of waiting in a quasi-experimental method may not be able to capture the sense of
waiting through reading scenarios. An experienced recruiter, who could provide insights on the
issue, also considered that practitioners may consider waiting for interviews less than 30 minutes
to be an inconvenience but acceptable, whereas waiting more than half an hour would be
extreme.
Harris and Fink’s (1987) study indicated that recruiter characteristics may have impacts
on applicants’ perception of the job and the company, as well as the likelihood of joining the
company. It was also postulated that gender and ethnicity of the interviewer, which can be
inferred by the interviewer’s name, may affect applicants’ perceptions of interviews. According
to a study about biases involved in forenames (Kasof, 1993), forenames may evoke their own
attractiveness, stereotypes, and intellectual-competence connotation. Hence, the hypothetical
interviewer in the scenarios was named “Chris,” for its neutrality in regards to gender and
ethnicity.
Dependent Variables
Unless otherwise noted, all the items were measured on a 5-point Likert scale.
Perceived fairness. Perceived fairness of applicants was measured by four items adapted
from Steiner and Gilliland’s (1996) research on applicants’ fairness perception towards ten
different selection methods. This scale was later used by other researchers to investigate
intercultural differences in perceived fairness. The original version of the scale measures seven
procedural justice dimensions: (a) selection method based on scientific research, (b) face validity
of the method, (c) opportunity for the participant to perform, (d) interpersonal warmth of the
method, (e) right of employers to obtain information using the method, (f) privacy considerations
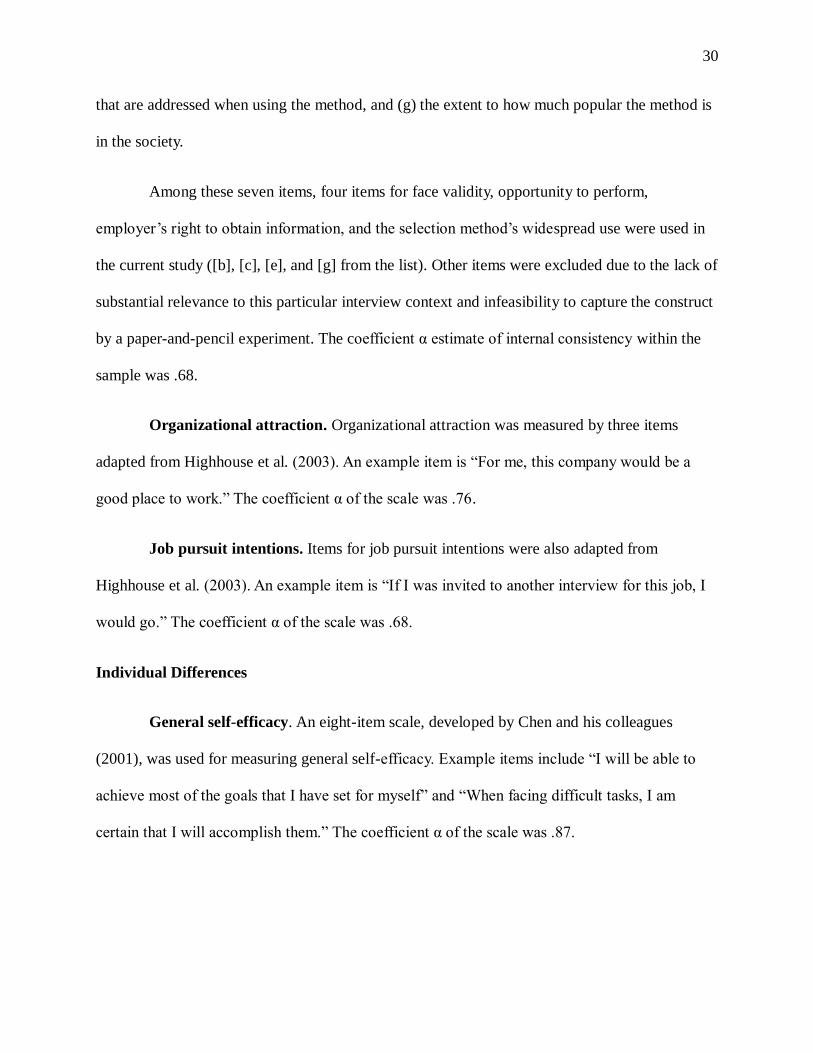
30
that are addressed when using the method, and (g) the extent to how much popular the method is
in the society.
Among these seven items, four items for face validity, opportunity to perform,
employer’s right to obtain information, and the selection method’s widespread use were used in
the current study ([b], [c], [e], and [g] from the list). Other items were excluded due to the lack of
substantial relevance to this particular interview context and infeasibility to capture the construct
by a paper-and-pencil experiment. The coefficient α estimate of internal consistency within the
sample was .68.
Organizational attraction. Organizational attraction was measured by three items
adapted from Highhouse et al. (2003). An example item is “For me, this company would be a
good place to work.” The coefficient α of the scale was .76.
Job pursuit intentions. Items for job pursuit intentions were also adapted from
Highhouse et al. (2003). An example item is “If I was invited to another interview for this job, I
would go.” The coefficient α of the scale was .68.
Individual Differences
General self-efficacy. An eight-item scale, developed by Chen and his colleagues
(2001), was used for measuring general self-efficacy. Example items include “I will be able to
achieve most of the goals that I have set for myself” and “When facing difficult tasks, I am
certain that I will accomplish them.” The coefficient α of the scale was .87.
31
Control Variables and Demographic Questions
Due to their conceptual relevance, core self-evaluation (Judge et al., 2003), time urgency
(general hurry and task-related hurry; Conte et al., 2001), and individual power distance
orientation (power differential; Earley & Erez, 1997) were measured to control for their
confounding effects on the variables of interest. As it has been found in previous studies that
applicants’ perceived fairness may vary by cultural contexts (Steiner & Gilliland, 1996),
immigration status of respondents (whether participants hold the international student status) was
also asked. Likewise, interview experiences, and other demographic information such as
academic major, gender, age, ethnicity, GPA, and current academic standing were asked.
Statistical Methods
In order to investigate the relationships among variables in the study, a series of
descriptive statistical analysis, univariate analysis of variance (ANOVA), and moderated
regression analysis were employed. Also, a series of confirmatory factor analyses (CFA) were
performed to establish that the measures of dependent variables are distinct from each other
before regression analyses were conducted.
32
Chapter 4
Results
Data Cleaning Procedures and Descriptive Statistics
Upon completion of data collection, all responses were typed and coded into Microsoft
Excel spreadsheets and then transferred to the Statistical Package for Social Science (SPSS 22).
From the total number of 206 respondents, those who failed to respond to at least one item that
measured dependent variables (N = 8) and failed to respond to more than two items within the
entire survey (N = 5) were removed, resulting in 193 complete responses. Also, those who failed
to correctly answer all items of any manipulation category and those who failed to provide the
correct answer to three of the six overall manipulation check items (N = 22) were removed,
resulting in a total of 171 respondents for further analysis. Missing values were estimated by
substituting medians for each scale within each experimental condition. Reverse-coded items
were re-calculated within SPSS by subtracting them from six. A series of ANOVAs were
conducted to find out whether there are differences of dependent variables between those who
were removed due to manipulation check screening and those who remained, and it was found
that there were no significant differences except for organizational attraction in the face-to-
face/no-waiting condition (F [1, 46] = 11.453, p < .01) and the phone/time-waiting condition (F
[1, 46] = 8.226, p < .01). Those respondents were kept removed because such differences in
responses would have resulted from misinterpreting scenarios.
33
Table 2: Demographics of the Sample
Variables
FTF_Wait(N=40) FTF_NoWait (N=42) Phone_Wait (N=42) Phone_NoWait (N=47) Overall (N=171)
Mean(n) SD(%) Mean(n) SD(%) Mean(n) SD(%) Mean(n) SD(%) Mean(n) SD(%)
1. Age 20.85 2.637 20.17 1.591 20.12 1.152 20.32 1.304 20.36 1.751
2. Class Freshmen (6) (15%) (11) (26.2%) (8) (19%) (10) (21.3%) (35) (20.5%)
Sophomore (11) (27.5%) (11) (26.2%) (12) (28.6%) (13) (27.7%) (47) (27.5%)
Junior (13) (32.5%) (11) (26.2%) (12) (28.6%) (13) (27.7%) (49) (28.7%)
Senior (10) (25%) (9) (21.4%) (10) (23.8%) (10) (21.3%) (39) (22.8%)
Not Reported - - - - - - (1) (2.1%) (1) (.6%)
3. Gender Male (15) (37.5%) (12) (28.6%) (15) (35.7%) (21) (44.7%) (63) (36.8%)
Female (25) (62.5%) (30) (71.4%) (27) (64.3%) (26) (55.3%) (108) (63.2%)
4. GPA* 3.2713 0.4007 3.3062 .30817 3.2503 .45281 3.3327 .41110 3.2713 .4007
5. Major LER (7) (17.5%) (2) (4.8%) (5) (11.9%) (6) (12.8%) (2) (11.7%)
Business (10) (25%) (6) (14.3%) (8) (19%) (12) (25.5%) (36) (21.7%)
Psych (5) (12.5%) (7) (16.7%) (2) (4.8%) (3) (6.4%) (17) (9.9%)
HPA (8) (20%) 10 (23.8%) (11) (26.2%) (6) (12.8%) (35) (20.5%)
Communication (7) (17.5%) (8) (19%) (5) (11.9%) (7) (14.9%) (27) (15.8%)
Social Science (3) (7.5%) (3) (7.1%) (3) (7.1%) (6) (12.8%) (15) (8.8%)
Natural Science - - (2) (4.8%) (3) (7.1%) (3) (6.4%) (8) (4.7%)
Engineering - - (1) (2.4%) (2) (4.8%) - - (3) (1.8%)
Others - - (3) (7.1%) (3) (7.1%) (4) (8.5%) (10) (5.8%)
6. Ethnicity Arabic (1) (2.5%) (1) (2.4%) (1) (2.4%) - - (3) (1.8%)
Asian (6) (15%) (4) (9.5%) (5) (11.9%) (5) (10.6%) (20) (11.7%)
Black (3) (7.5%) (3) (7.1%) (1) (2.4%) (5) (10.6%) (12) (7%)
Hispanic (3) (7.5%) - - (3) (7.1%) (2) (4.3%) (8) (4.7%)
Native American - - (1) (2.4%) (1) (2.4%) - - (2) (1.2%)
White (26) (65%) (32) (76.2%) (30) (71.4%) (32) (68.1%) (120) (70.2%)
Other (1) (2.5%) (1) (2.4%) (1) (2.4%) (3) (6.3%) (6) (3.6%)
7. Citizenship American (33) (82.5%) (41) (97.6%) (38) (90.5%) (41) (87.2%) (153) (89.5%)
International (4) (10%) (1) (2.4%) (1) (2.4%) (3) (6.4%) (9) (5.3%)
Not Reported (3) (7.5%) - - (3) (7.1%) (3) (6.4%) (9) (5.3%)
Note. N = 171. *N = 158; 13 respondents did not report. FTF = Face-to-face interview condition; Phone interview condition; Wait = Waiting condition; NoWait = Not
waiting condition; LER = Labor and Employment Relations; HPA = Health Policy and Administration.
Business includes Golf Management, Hospitality Managemet, Tourism Management; Communication includes Public Relations; Social Science includes
Criminology, Economics; Natural Science includes Animal Science; Others includes Liberal Arts, Theatre Design, English Literature.
Means, standard deviations, reliability coefficients, and correlations between variables
are presented in Table 3. General self-efficacy demonstrated a weak but significant correlation
with perceived fairness (r = .17, p < .05), and it correlated with power distance orientation (r
= .23, p < .01) and general hurry (r = .36, p < .01). There was a moderate correlation between
perceived fairness and organizational attraction (r = .38, p < .01) which necessitated mediational
and moderating analyses to discover a more detailed relationship. General self-efficacy and core
self-evaluations also highly correlated with each other (r = .76, p < .01); however, it was deemed
that such correlation was because core self-evaluation contains general self-efficacy as one of its
sub-dimensions. As the distinction between general self-efficacy and core self-evaluation was
addressed in a prior study (Judge, Bono, & Thoresen, 2002), and as core self-evaluation will be
34
used as a control for later analyses, concerns for multicollinearity were tolerated. Analyses were
conducted with and without controls with similar conclusions. Additionally, as was expected
from findings of prior studies, two dependent variables, organizational attraction and job pursuit
intentions, had a high correlation (r = .77, p < .01), suggesting these two constructs may be part
of the same latent factor in the sample of the current study.
Confirmatory Factor Analysis
Due to high correlations among dependent variables, especially between organizational
attraction and job pursuit intentions, a series of confirmatory factor analyses (CFA) using AMOS
22 were conducted to establish that the measures of perceived fairness (PF), organizational
attraction (OA), and job pursuit intentions (JPI) are distinct from each other.
First, all three dependent variables in the measurement model were allowed to freely
covary as latent constructs (Anderson & Gerbing, 1988). The χ2 coefficient as well as other fit
indices such as RMSEA and NNFI were investigated to assess the model fit; although not great,
Table 3: Correlations and Descriptive Statistics
Variables Mean SD 1 2 3 4 5 6 7 8 9 10 11
1. Age 20.36 1.75 -
2. Class 2.54 1.06 .578** -
3. Gender 0.63 0.48 -.247** -.098 -
4. CSE 3.66 0.60 .070 .106 -.010 (0.872)
5. PD 2.27 0.55 -.005 .030 -.096 -.145 (0.654)
6. GH 3.46 0.72 -.004 .017 .095 .353** -.227** (0.764)
7. TH 3.42 0.83 .009 -.007 .063 -.238** -.108 -.024 (0.769)
8. GSE 3.96 0.53 .093 .126 .005 .761** -.231** .361** -.115 (0.87)
9. PF 3.71 0.62 -.036 -.090 .069 .105 -.135 .087 -.007 .165* (0.683)
10. OA 3.31 0.71 -.192* -.217** .009 .065 -.024 -.067 -.111 .046 .386** (0.764)
11. JPI 3.69 0.63 -.258** -.262** .045 .006 -.145 -.025 -.104 .042 .352** .766** (0.681)
Note. N = 171 except Class (N =170). Where applicable, coefficient alpha reliabilities in parenthesis on diagonal. Controls had no effect on substantive conclusions but are included in the correlation table. TH = Task-Related Hurry; GH = General Hurry;
CSE = Core Self-Evaluation; PD = Power Distance Orientation; GSE = General Self-Efficacy; PF = Perceived Fairness; OA = Organizational Attraction; JPI = Job Pursuit Intentions. ∗p ≤ .05, two-tailed. ∗∗p ≤ .01, two-tailed.
35
the model yielded a decent fit (χ2= 84.495, df = 32, p < .01, RMSEA = .098, NFI = .858, NNFI
= .866, CFI = .904).
Constraining all three dependent variables into a single factor significantly reduced fit
(Δχ2= 73.285, Δdf = 3, p < .01, RMSEA = .144, NFI = .735, NNFI = .713, CFI = .776),
indicating at least some of the dependent variables were distinct from the others. Constraining PF
and OA to be the same latent factor also resulted in a significant decrement in model fit (Δχ2=
72.841, Δdf = 2, p < .01, RMSEA = .146, NFI = .735, NNFI = .703, CFI = .775). Forcing PF and
JPI into the same factor also resulted in a significant decrement in model fit (Δχ2= 73.223, Δdf =
2, p < .01, RMSEA = .146, NFI = .735, NNFI = .702, CFI = .775). However, combining OA and
JPI failed to produce a reduced fit (Δχ2= .852, Δdf = 2, p = .6531, RMSEA = .094, NFI = .856,
NNFI = .876, CFI = .907), suggesting the current sample could not differentiate JPI from OA.
This finding contradicts previous studies that investigated the relationships between OA
and JPI (Chapman et al, 2005, Gully et al., 2013; Highhouse et al., 2003). It is postulated that
such a result is due to the sample characteristics of the current study. The current study uses a
sample different from workplace samples that distinguish how much they are attracted to the
organization (OA) from how much effort they will put in to pursue work within an organization
(JPI). Undergraduate students who lack professional experiences do not seem to distinguish these
factors as much. Additionally, these students were not actively looking for jobs, which could
have influenced such distinctions. Considering the demographics of the sample in which mean
age is 20.35 and many of respondents are either freshmen or sophomores, it is likely that
respondents are less conscious of the difference between being attracted to an organization and
actually pursuing work within an organization, thereby responding identically to the
questionnaire items of OA and JPI. Significant correlations between age and OA (r = .19, p
36
< .01) as well as age and JPI (r = .25, p < .01) support such reasoning. As OA was deemed to be
more closely related to individuals’ job choice decisions than JPI, JPI was excluded from the
further analysis while keeping OA.
Hypotheses Testing
In order to investigate interactions between interview modality, waiting, and moderating
variables, the procedures recommended by Aiken and West (1991) were used. General self-
efficacy (GSE), PF, and control variables were mean-centered before regression analyses were
conducted. Interaction terms between interview modality (IM), time waiting (TW), and GSE
were created by multiplying centered variables: IM×TW, IM×GSE, TW×GSE, and
IM×TW×GSE variables were created.
Hierarchical regression analyses predicting PF and OA from the list of variables were
performed. In Step 1, control variables – gender (dummy coded as 1 for female), age, task-
related hurry, general hurry, individual power distance orientation, and core self-evaluation –
were entered. By entering control variables in the first step, investigations of relationships
between predictors and dependent variables of interest are allowed in later steps. In Step 2, GSE
was entered as a predictor in order to examine its main effects. In Step 3, IM and TW were
entered for their main effects. IM was coded as 0 if the hypothetical interview in the scenario
was face-to-face interview and coded as 1 if it was phone interview. Likewise, TW was coded as
0 if waiting was not involved in the scenario and 1 if participants had to wait within the
hypothetical interview. In Step 4, a two-way interaction term, IM×TW, was entered for its
interaction effects. In Step 5, other two-way interaction terms, IM×GSE and TW×GSE, were
entered in order to investigate the two-way interactions between predictors of primary interest
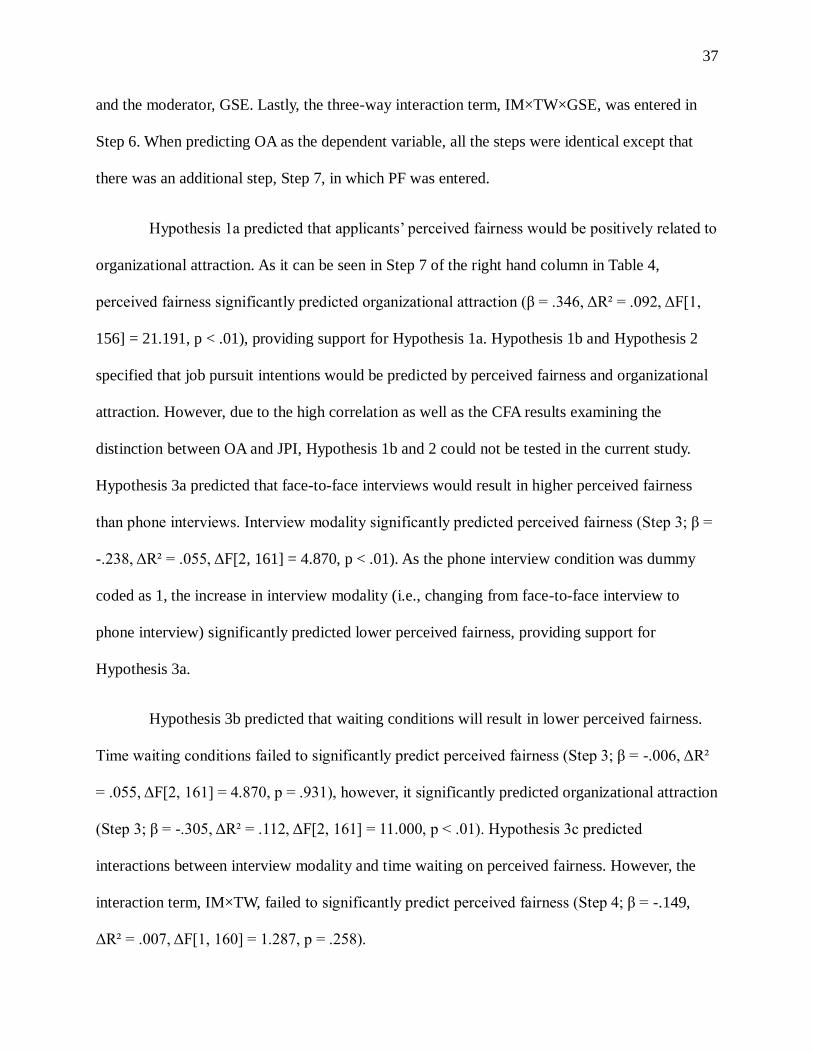
37
and the moderator, GSE. Lastly, the three-way interaction term, IM×TW×GSE, was entered in
Step 6. When predicting OA as the dependent variable, all the steps were identical except that
there was an additional step, Step 7, in which PF was entered.
Hypothesis 1a predicted that applicants’ perceived fairness would be positively related to
organizational attraction. As it can be seen in Step 7 of the right hand column in Table 4,
perceived fairness significantly predicted organizational attraction (β = .346, ΔR² = .092, ΔF[1,
156] = 21.191, p < .01), providing support for Hypothesis 1a. Hypothesis 1b and Hypothesis 2
specified that job pursuit intentions would be predicted by perceived fairness and organizational
attraction. However, due to the high correlation as well as the CFA results examining the
distinction between OA and JPI, Hypothesis 1b and 2 could not be tested in the current study.
Hypothesis 3a predicted that face-to-face interviews would result in higher perceived fairness
than phone interviews. Interview modality significantly predicted perceived fairness (Step 3; β =
-.238, ΔR² = .055, ΔF[2, 161] = 4.870, p < .01). As the phone interview condition was dummy
coded as 1, the increase in interview modality (i.e., changing from face-to-face interview to
phone interview) significantly predicted lower perceived fairness, providing support for
Hypothesis 3a.
Hypothesis 3b predicted that waiting conditions will result in lower perceived fairness.
Time waiting conditions failed to significantly predict perceived fairness (Step 3; β = -.006, ΔR²
= .055, ΔF[2, 161] = 4.870, p = .931), however, it significantly predicted organizational attraction
(Step 3; β = -.305, ΔR² = .112, ΔF[2, 161] = 11.000, p < .01). Hypothesis 3c predicted
interactions between interview modality and time waiting on perceived fairness. However, the
interaction term, IM×TW, failed to significantly predict perceived fairness (Step 4; β = -.149,
ΔR² = .007, ΔF[1, 160] = 1.287, p = .258).
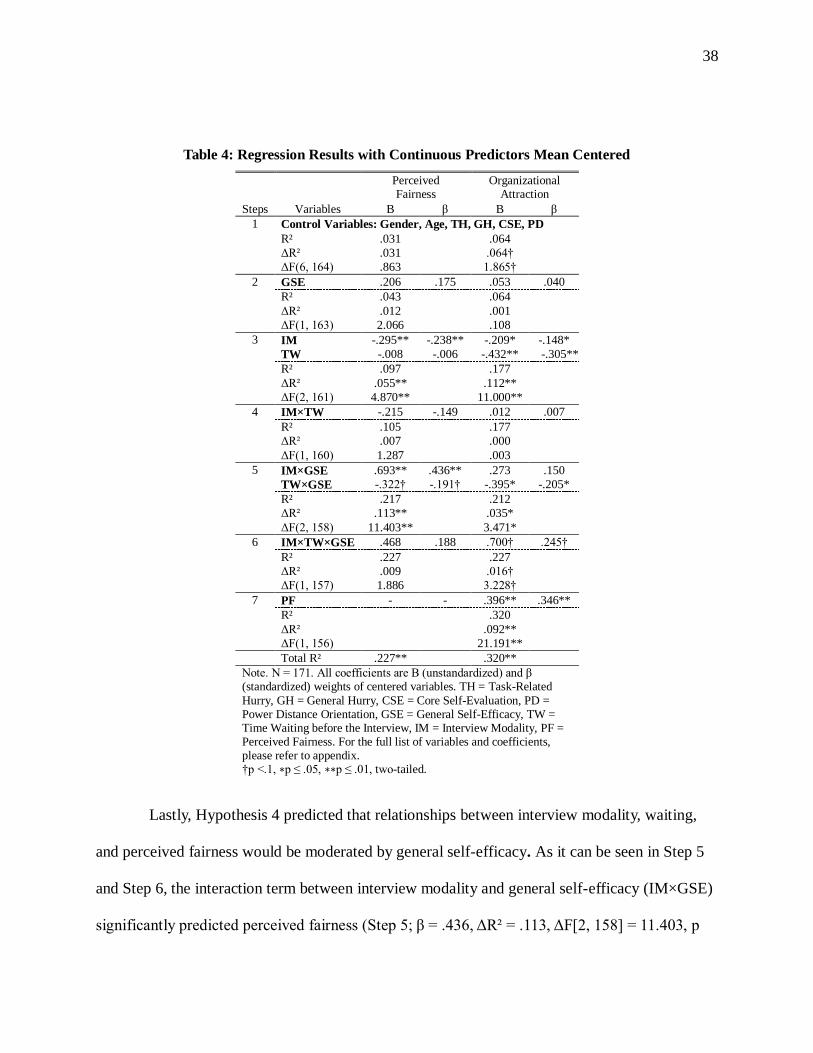
38
Table 4: Regression Results with Continuous Predictors Mean Centered
Perceived Fairness
Organizational Attraction
Steps Variables B β B β
1 Control Variables: Gender, Age, TH, GH, CSE, PD
R² .031 .064
ΔR² .031 .064†
ΔF(6, 164) .863 1.865†
2 GSE .206 .175 .053 .040
R² .043 .064
ΔR² .012 .001
ΔF(1, 163) 2.066 .108
3 IM -.295** -.238** -.209* -.148*
TW -.008 -.006 -.432** -.305**
R² .097 .177
ΔR² .055** .112**
ΔF(2, 161) 4.870** 11.000**
4 IM×TW -.215 -.149 .012 .007
R² .105 .177
ΔR² .007 .000
ΔF(1, 160) 1.287 .003
5 IM×GSE .693** .436** .273 .150 TW×GSE -.322† -.191† -.395* -.205*
R² .217 .212
ΔR² .113** .035*
ΔF(2, 158) 11.403** 3.471*
6 IM×TW×GSE .468 .188 .700† .245†
R² .227 .227
ΔR² .009 .016†
ΔF(1, 157) 1.886 3.228†
7 PF - - .396** .346**
R² .320
ΔR² .092**
ΔF(1, 156) 21.191**
Total R² .227** .320**
Note. N = 171. All coefficients are B (unstandardized) and β (standardized) weights of centered variables. TH = Task-Related
Hurry, GH = General Hurry, CSE = Core Self-Evaluation, PD = Power Distance Orientation, GSE = General Self-Efficacy, TW = Time Waiting before the Interview, IM = Interview Modality, PF = Perceived Fairness. For the full list of variables and coefficients, please refer to appendix. †p <.1, ∗p ≤ .05, ∗∗p ≤ .01, two-tailed.
Lastly, Hypothesis 4 predicted that relationships between interview modality, waiting,
and perceived fairness would be moderated by general self-efficacy. As it can be seen in Step 5
and Step 6, the interaction term between interview modality and general self-efficacy (IM×GSE)
significantly predicted perceived fairness (Step 5; β = .436, ΔR² = .113, ΔF[2, 158] = 11.403, p
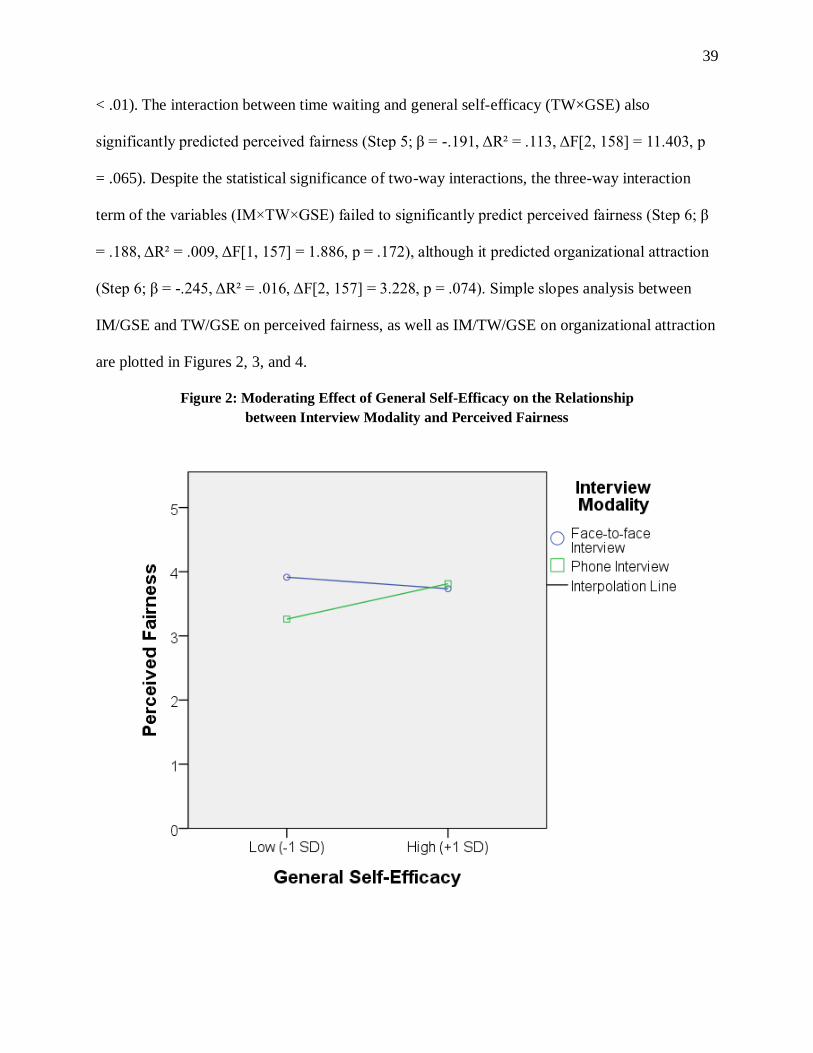
39
< .01). The interaction between time waiting and general self-efficacy (TW×GSE) also
significantly predicted perceived fairness (Step 5; β = -.191, ΔR² = .113, ΔF[2, 158] = 11.403, p
= .065). Despite the statistical significance of two-way interactions, the three-way interaction
term of the variables (IM×TW×GSE) failed to significantly predict perceived fairness (Step 6; β
= .188, ΔR² = .009, ΔF[1, 157] = 1.886, p = .172), although it predicted organizational attraction
(Step 6; β = -.245, ΔR² = .016, ΔF[2, 157] = 3.228, p = .074). Simple slopes analysis between
IM/GSE and TW/GSE on perceived fairness, as well as IM/TW/GSE on organizational attraction
are plotted in Figures 2, 3, and 4.
Figure 2: Moderating Effect of General Self-Efficacy on the Relationship
between Interview Modality and Perceived Fairness
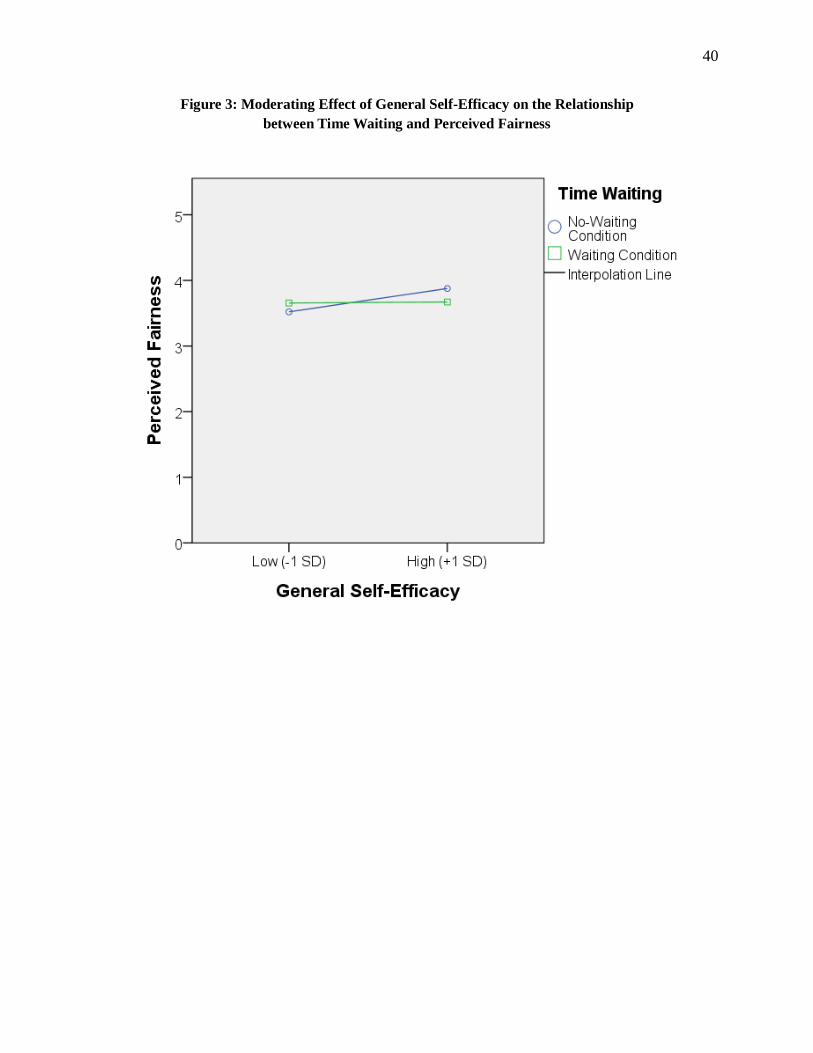
40
Figure 3: Moderating Effect of General Self-Efficacy on the Relationship
between Time Waiting and Perceived Fairness
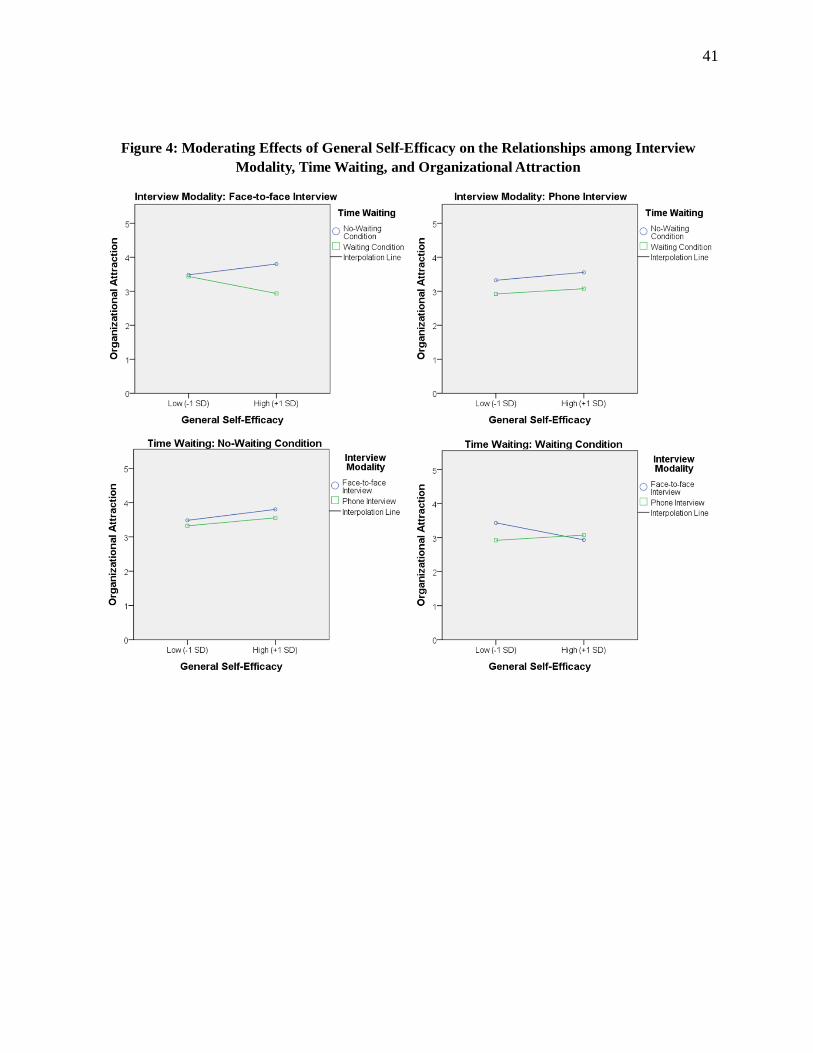
41
Figure 4: Moderating Effects of General Self-Efficacy on the Relationships among Interview
Modality, Time Waiting, and Organizational Attraction
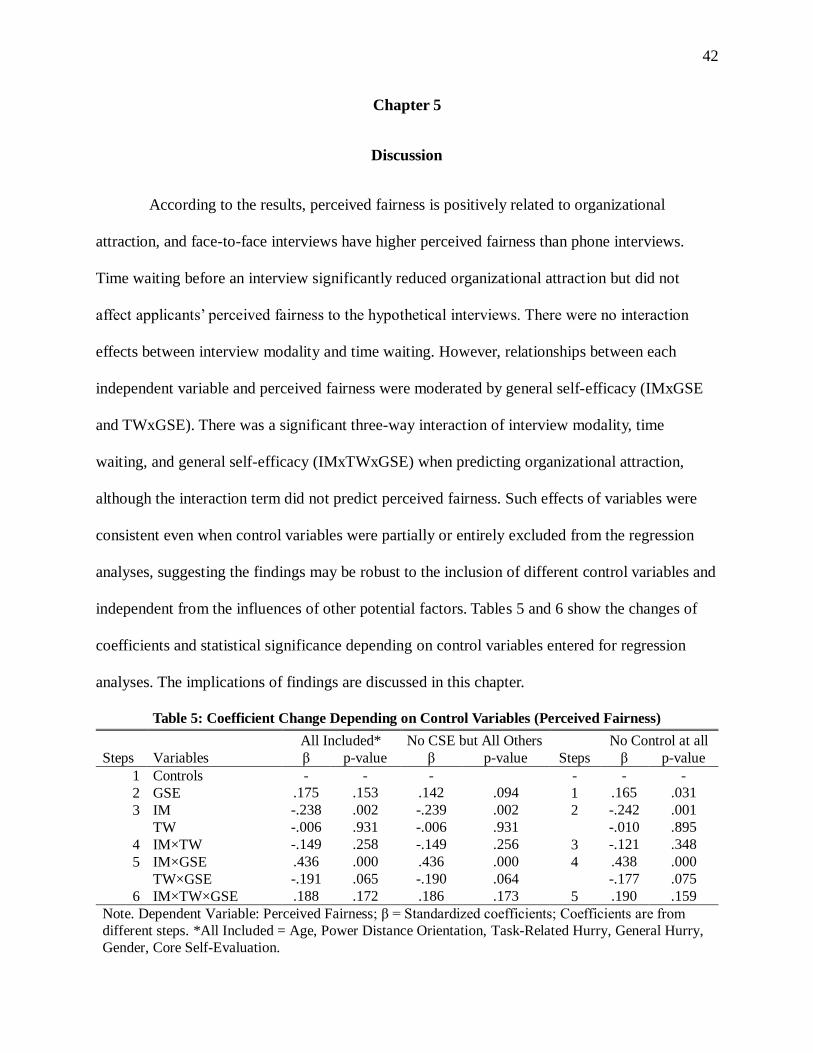
42
Chapter 5
Discussion
According to the results, perceived fairness is positively related to organizational
attraction, and face-to-face interviews have higher perceived fairness than phone interviews.
Time waiting before an interview significantly reduced organizational attraction but did not
affect applicants’ perceived fairness to the hypothetical interviews. There were no interaction
effects between interview modality and time waiting. However, relationships between each
independent variable and perceived fairness were moderated by general self-efficacy (IMxGSE
and TWxGSE). There was a significant three-way interaction of interview modality, time
waiting, and general self-efficacy (IMxTWxGSE) when predicting organizational attraction,
although the interaction term did not predict perceived fairness. Such effects of variables were
consistent even when control variables were partially or entirely excluded from the regression
analyses, suggesting the findings may be robust to the inclusion of different control variables and
independent from the influences of other potential factors. Tables 5 and 6 show the changes of
coefficients and statistical significance depending on control variables entered for regression
analyses. The implications of findings are discussed in this chapter.
Table 5: Coefficient Change Depending on Control Variables (Perceived Fairness)
All Included* No CSE but All Others No Control at all
Steps Variables β p-value β p-value Steps β p-value
1 Controls - - - - - -
2 GSE .175 .153 .142 .094 1 .165 .031
3 IM -.238 .002 -.239 .002 2 -.242 .001
TW -.006 .931 -.006 .931 -.010 .895
4 IM×TW -.149 .258 -.149 .256 3 -.121 .348
5 IM×GSE .436 .000 .436 .000 4 .438 .000
TW×GSE -.191 .065 -.190 .064 -.177 .075
6 IM×TW×GSE .188 .172 .186 .173 5 .190 .159
Note. Dependent Variable: Perceived Fairness; β = Standardized coefficients; Coefficients are from
different steps. *All Included = Age, Power Distance Orientation, Task-Related Hurry, General Hurry,
Gender, Core Self-Evaluation.
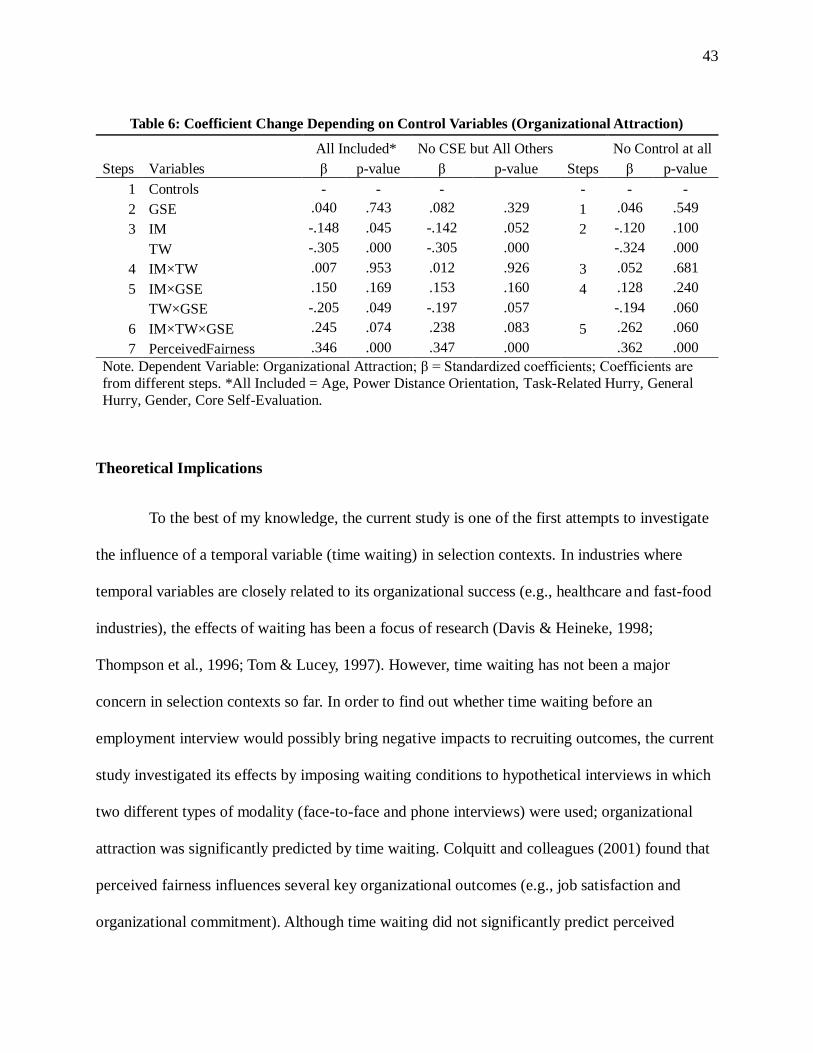
43
Table 6: Coefficient Change Depending on Control Variables (Organizational Attraction)
All Included* No CSE but All Others No Control at all
Steps Variables β p-value β p-value Steps β p-value
1 Controls - - - - - -
2 GSE .040 .743 .082 .329 1 .046 .549
3 IM -.148 .045 -.142 .052 2 -.120 .100
TW -.305 .000 -.305 .000 -.324 .000
4 IM×TW .007 .953 .012 .926 3 .052 .681
5 IM×GSE .150 .169 .153 .160 4 .128 .240
TW×GSE -.205 .049 -.197 .057 -.194 .060
6 IM×TW×GSE .245 .074 .238 .083 5 .262 .060
7 PerceivedFairness .346 .000 .347 .000 .362 .000
Note. Dependent Variable: Organizational Attraction; β = Standardized coefficients; Coefficients are
from different steps. *All Included = Age, Power Distance Orientation, Task-Related Hurry, General
Hurry, Gender, Core Self-Evaluation.
Theoretical Implications
To the best of my knowledge, the current study is one of the first attempts to investigate
the influence of a temporal variable (time waiting) in selection contexts. In industries where
temporal variables are closely related to its organizational success (e.g., healthcare and fast-food
industries), the effects of waiting has been a focus of research (Davis & Heineke, 1998;
Thompson et al., 1996; Tom & Lucey, 1997). However, time waiting has not been a major
concern in selection contexts so far. In order to find out whether time waiting before an
employment interview would possibly bring negative impacts to recruiting outcomes, the current
study investigated its effects by imposing waiting conditions to hypothetical interviews in which
two different types of modality (face-to-face and phone interviews) were used; organizational
attraction was significantly predicted by time waiting. Colquitt and colleagues (2001) found that
perceived fairness influences several key organizational outcomes (e.g., job satisfaction and
organizational commitment). Although time waiting did not significantly predict perceived
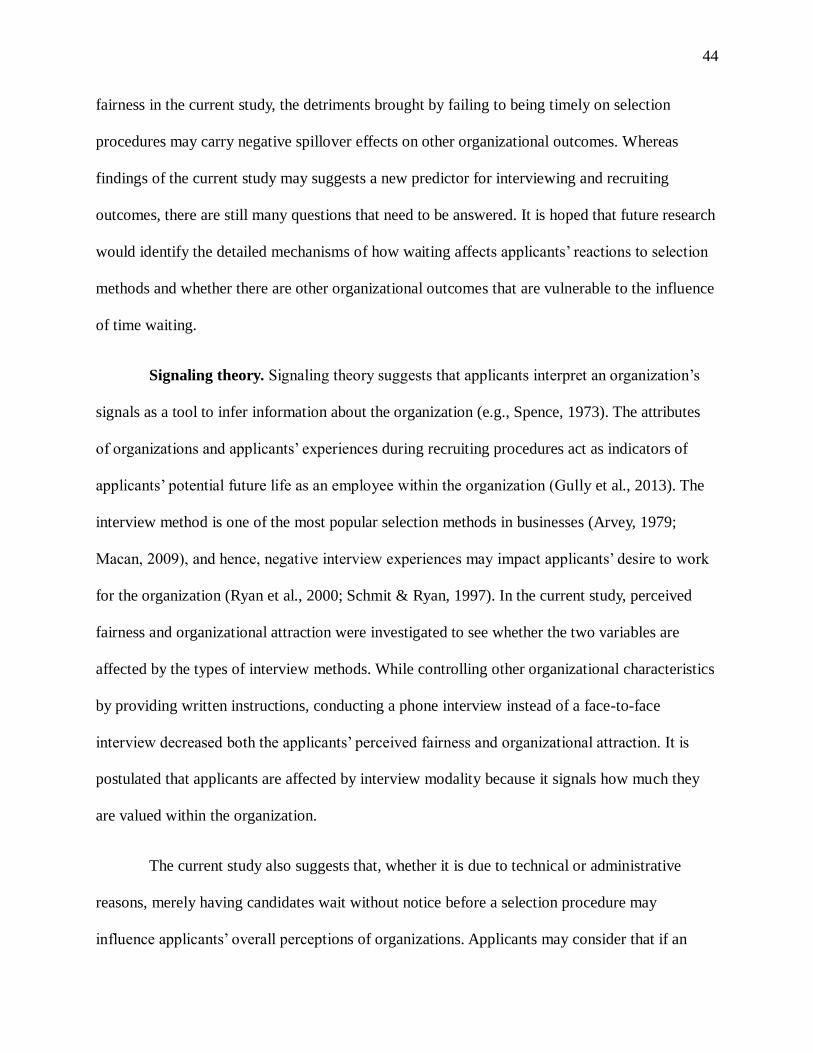
44
fairness in the current study, the detriments brought by failing to being timely on selection
procedures may carry negative spillover effects on other organizational outcomes. Whereas
findings of the current study may suggests a new predictor for interviewing and recruiting
outcomes, there are still many questions that need to be answered. It is hoped that future research
would identify the detailed mechanisms of how waiting affects applicants’ reactions to selection
methods and whether there are other organizational outcomes that are vulnerable to the influence
of time waiting.
Signaling theory. Signaling theory suggests that applicants interpret an organization’s
signals as a tool to infer information about the organization (e.g., Spence, 1973). The attributes
of organizations and applicants’ experiences during recruiting procedures act as indicators of
applicants’ potential future life as an employee within the organization (Gully et al., 2013). The
interview method is one of the most popular selection methods in businesses (Arvey, 1979;
Macan, 2009), and hence, negative interview experiences may impact applicants’ desire to work
for the organization (Ryan et al., 2000; Schmit & Ryan, 1997). In the current study, perceived
fairness and organizational attraction were investigated to see whether the two variables are
affected by the types of interview methods. While controlling other organizational characteristics
by providing written instructions, conducting a phone interview instead of a face-to-face
interview decreased both the applicants’ perceived fairness and organizational attraction. It is
postulated that applicants are affected by interview modality because it signals how much they
are valued within the organization.
The current study also suggests that, whether it is due to technical or administrative
reasons, merely having candidates wait without notice before a selection procedure may
influence applicants’ overall perceptions of organizations. Applicants may consider that if an
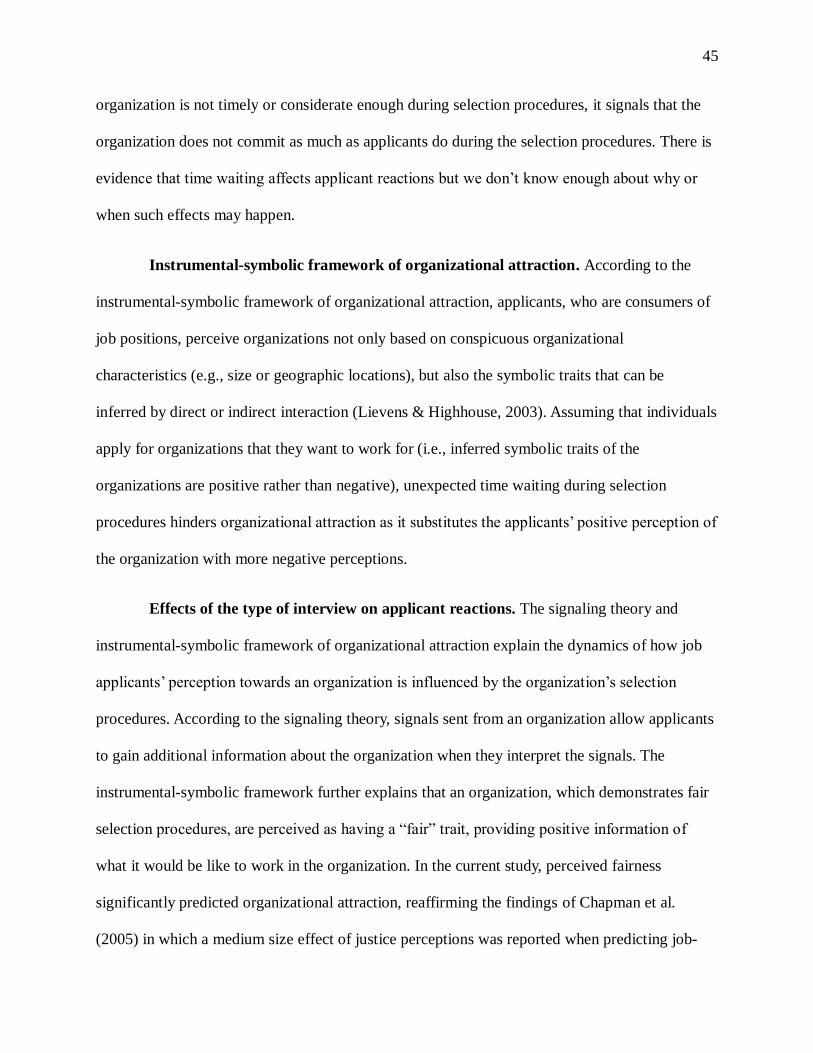
45
organization is not timely or considerate enough during selection procedures, it signals that the
organization does not commit as much as applicants do during the selection procedures. There is
evidence that time waiting affects applicant reactions but we don’t know enough about why or
when such effects may happen.
Instrumental-symbolic framework of organizational attraction. According to the
instrumental-symbolic framework of organizational attraction, applicants, who are consumers of
job positions, perceive organizations not only based on conspicuous organizational
characteristics (e.g., size or geographic locations), but also the symbolic traits that can be
inferred by direct or indirect interaction (Lievens & Highhouse, 2003). Assuming that individuals
apply for organizations that they want to work for (i.e., inferred symbolic traits of the
organizations are positive rather than negative), unexpected time waiting during selection
procedures hinders organizational attraction as it substitutes the applicants’ positive perception of
the organization with more negative perceptions.
Effects of the type of interview on applicant reactions. The signaling theory and
instrumental-symbolic framework of organizational attraction explain the dynamics of how job
applicants’ perception towards an organization is influenced by the organization’s selection
procedures. According to the signaling theory, signals sent from an organization allow applicants
to gain additional information about the organization when they interpret the signals. The
instrumental-symbolic framework further explains that an organization, which demonstrates fair
selection procedures, are perceived as having a “fair” trait, providing positive information of
what it would be like to work in the organization. In the current study, perceived fairness
significantly predicted organizational attraction, reaffirming the findings of Chapman et al.
(2005) in which a medium size effect of justice perceptions was reported when predicting job-
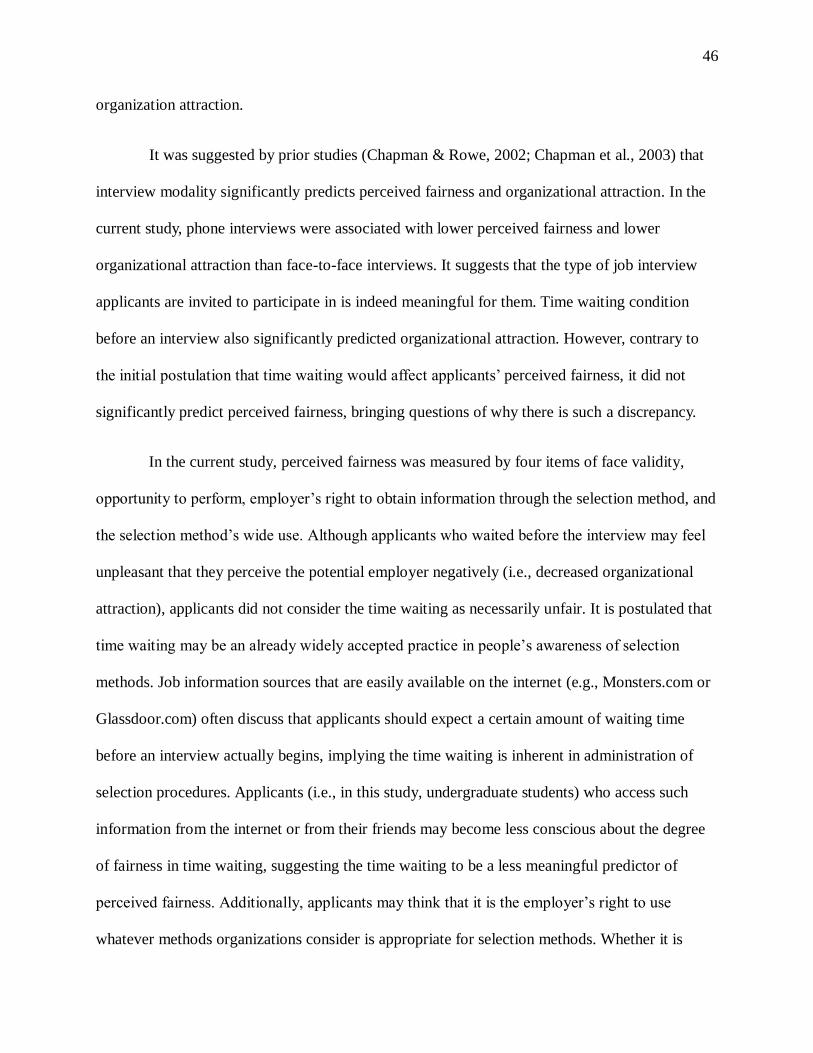
46
organization attraction.
It was suggested by prior studies (Chapman & Rowe, 2002; Chapman et al., 2003) that
interview modality significantly predicts perceived fairness and organizational attraction. In the
current study, phone interviews were associated with lower perceived fairness and lower
organizational attraction than face-to-face interviews. It suggests that the type of job interview
applicants are invited to participate in is indeed meaningful for them. Time waiting condition
before an interview also significantly predicted organizational attraction. However, contrary to
the initial postulation that time waiting would affect applicants’ perceived fairness, it did not
significantly predict perceived fairness, bringing questions of why there is such a discrepancy.
In the current study, perceived fairness was measured by four items of face validity,
opportunity to perform, employer’s right to obtain information through the selection method, and
the selection method’s wide use. Although applicants who waited before the interview may feel
unpleasant that they perceive the potential employer negatively (i.e., decreased organizational
attraction), applicants did not consider the time waiting as necessarily unfair. It is postulated that
time waiting may be an already widely accepted practice in people’s awareness of selection
methods. Job information sources that are easily available on the internet (e.g., Monsters.com or
Glassdoor.com) often discuss that applicants should expect a certain amount of waiting time
before an interview actually begins, implying the time waiting is inherent in administration of
selection procedures. Applicants (i.e., in this study, undergraduate students) who access such
information from the internet or from their friends may become less conscious about the degree
of fairness in time waiting, suggesting the time waiting to be a less meaningful predictor of
perceived fairness. Additionally, applicants may think that it is the employer’s right to use
whatever methods organizations consider is appropriate for selection methods. Whether it is
47
unintentional (e.g., administrative reasons) or intentional (e.g., intentionally putting them into a
stressful situation) applicants just accept the time waiting, making the time waiting as a
negligible predictor of perceived fairness.
Future research should examine whether the amount of time waiting or the cause of the
waiting influences applicant reactions, including fairness and attraction. It is possible, even
likely, that waiting caused by negligence (e.g., forgot to call) versus waiting caused intentionally
(e.g., intentionally causing stress) versus waiting caused by context (e.g., an emergency
occurred) will have different influences on applicant reactions. Controllable causes of waiting
(e.g., scheduled it wrong) are likely to bring more intense negative reactions than uncontrollable
causes of waiting (e.g., unexpected event). It is possible that the cause of waiting could have
more influence on perceived fairness than whether or not waiting occurred. Also providing
reasonable explanation of waiting may make a difference in perception of the organization when
waiting is unavoidable.
Contrary to initial postulations, the interaction of interview modality and time waiting
could not significantly predict perceived fairness and organizational attraction. However, it may
be due to the study design in which experiments were conducted through paper-and-pencil
survey. It is likely that individuals who actually go through a real interview may experience the
anxiety and confusion that the interaction of both variables brings. More research is needed to
better understand the interaction effects on applicant reactions – whether such interaction would
exist in lab experiments or real selection contexts.
General self-efficacy. Ryan and Ployhart (2000) called for rigorous research to better
understand the role of individual differences in applicant reactions to selection methods. Due to
48
its relevance to stress coping strategies, general self-efficacy was investigated for its moderating
effects on the relationships between independent variables (interview modality and time waiting)
and applicant reactions (perceived fairness and organizational attraction). As can be seen in
Figure 2, those who have higher level of general self-efficacy were less sensitive to interview
modality when predicting perceived fairness. Also, individuals with higher general self-efficacy
perceived the interviews generally fairer than those with lower general self-efficacy (Figure 3).
However, once the waiting condition was induced, the moderating effects of general self-efficacy
dissipated. When predicting organizational attraction within face-to-face interviews, those with a
higher level of general self-efficacy were especially sensitive to time waiting condition than
those with lower level. Time waiting generally yielded lower organizational attraction regardless
of the general self-efficacy level during phone interviews.
Self-efficacy is related to coping strategies of individuals in stressful situations (Gist &
Mitchell, 1992). Therefore, Hypothesis 4 postulated that applicants with high level of general
self-efficacy – who, in other words, have the belief that they would be successful in any
challenging tasks – would be less affected by stressors such as reduced richness in information
and time waiting. Whereas higher general self-efficacy indicated lower sensitivity to interview
modality when predicting perceived fairness (Figure 2), they were more vulnerable to waiting in
regards to organizational attraction during face-to-face interviews (Figure 4). When it was no-
waiting condition, individuals with higher general self-efficacy demonstrated higher perceived
fairness than those with lower general self-efficacy in any interview modality, but once waiting is
induced, those with higher general self-efficacy reacted more negatively to face-to-face
interviews with waiting condition than phone interviews with waiting condition. Although
general self-efficacy’s vulnerability to time waiting on organizational attraction was not
49
hypothesized, it contradicts initial expectations that high general self-efficacy would predict
lower sensitivity to time waiting.
It is postulated that those with higher general self-efficacy may be less concerned with
internal factors that can be controlled by themselves, such as regulating their own feelings or
behaviors during interviews, whereas they may be more concerned with factors that are not
controllable by them. Therefore, rather than internal stressors, they put more weights on external
stressors which may hinder their performance during selection procedures. For example, an
applicant with a higher level of general self-efficacy might think that he/she could have
performed much better during the interview because he/she believes in himself, but consider that
the external factors (i.e., waiting) prohibited the applicant from performing to his/her optimal
level (“I know I could have done better if they didn’t have me wait”). It is also likely that they
may believe in their efficacy in a wide variety of achievement oriented challenges (Chen et al.,
2001), but this belief does not necessarily prevent individuals’ negative affects towards
organizations. As it can be seen in Figure 3, no considerable difference was found in perceived
fairness between those who have higher level of general self-efficacy and those with lower level
once the time waiting condition was induced. It is likely that once applicants were forced to wait
under pressure before an important event, their beliefs in themselves may not be as relevant as it
should be during no-waiting conditions. More research is needed to find out how the mechanism
of general self-efficacy operates in applicant reactions to selection procedures.
Practical Implications
The instrumental-symbolic framework of organizational attraction denotes that
organizational attraction does not shape only from instrumental functions (e.g., job or
50
organizational characteristics) but it is also affected by the symbolic images of organizations
(e.g., responsible) (Lievens & Highhouse, 2003). Socially responsible organizations are more
likely to attract applicants who have more job acceptance choices (Albinger & Freeman, 2000;
Turban & Greening, 1997), indicating that best candidates in the job market would be more
conscious of symbolic images of companies and would be more willing to accept offers from
“socially responsible” companies than just “big and influential” companies. Fair practices done
by an organization would act as a signal that the organization cares about not only its
shareholders but also other stakeholders involved and the organization would strive to bring
fairness throughout the applicants’ future employment within the organization.
The treatment of applicants is likely to have spillover effects to other aspects of an
organization’s operating functions and business. Gilliland (1993) postulated that perceived
fairness during selection procedures would be associated with consumers’ endorsement of the
organization’s products. Crever (1997) found that customers carefully consider the ethicality of
an organization’s behavior during product purchase decisions, by being willing to spend
premiums for buying products from ethical firms. Experiences from the interaction with the
employing organization may spread to the applicants’ family and friends. Practitioners should be
aware that positive experiences of applicants during selection procedures may bring positive
outcomes to organizations through spillover effects with other people within that person’s
relationship network, and negative treatment can result in negative spillover effects.
It should be noted that conducting technology-mediated interviews instead of face-to-
face interviews may have its advantages. For example, it may be an effective selection tool for
certain purposes. Organizations might be interested in verifying communication skills while the
applicant is talking through phone calls if the core skill necessary for the job position is
51
telephone communication. Telemarketers, fundraisers or service-representatives may primarily
operate making or receiving phone calls, and the phone interview may be an effective tool to
screen out those who may be physically attractive (thus favorable) but less capable when they are
“off-screen.” Additionally, it may also reduce recruiter’s bias, such as similar-to-me bias (Rand
& Wexley, 1975) or biases from the physical attractiveness of interviewees (Pingatore et al.,
1994) resulting from factors that may fall outside of interviewees’ knowledge, skills, and ability
(KSAs).
Organizations should work to minimize time waiting because of its possible negative
impacts on applicant reactions. There may be some rare instances in which time waiting
conditions may be intentionally created in order to devise a stress interview, but generally this
would not be advised because of the negative perceptions it may engender.
Limitations and Future Research Directions
The current study has its limitations. The survey design enabled participants to
experience imaginary selection interviews. It also constrained the realism of anxiety which
interviewees would generally experience during real job interviews. Despite the methodological
bias, the stability of regression coefficients yielded from variations to entering control variables
suggests that the findings may be consistent and robust. More research is needed to better
understand the contexts in which time waiting and general self-efficacy affects perceived fairness
and organizational attraction.
This study is not free from selection bias as well. Due to practical reasons,
undergraduate students were recruited for participation. Although there were certain variations in
the demographics of participants, most of the participants majored in business or business-related
52
fields, and identified themselves as Caucasian and American. Considering there may be
discrepancies in applicants’ perceived fairness or organizational attraction across different
countries or cultural values, more research is required to understand whether the findings of the
current study is vulnerable to cultural indices. For example, in countries that are characterized as
exhibiting relatively high power distance orientation (e.g., China, Singapore, or United Arab
Emirates) the negative effects of time waiting on applicant reactions may be mitigated, as
individuals may think that employers have the right to obtain information through any techniques
employers find useful. Uncertainty avoidance may play a part in cultural differences too. In
countries where ambiguity in event occurrence is not tolerable (i.e., uncertainty avoidance is
high), the effects of time waiting, which brings more uncertainty to selection procedures, may be
more destructive to applicant reactions than in the countries where individuals possess high
tolerance to ambiguity (Hofstede, 2011).
Compared to previous studies in which participants were able to differentiate job pursuit
intentions from organizational attraction (Chapman et al, 2005, Gully et al., 2013; Highhouse et
al., 2003), the current study in which participants were undergraduate students considered the
two constructs as the same, bringing questions about the incongruity in findings. It is deemed
that such incongruity is due to the characteristics of the sample; undergraduates who lack
professional experiences in organizations may not consider the difference between how attractive
an organization is for them to work for (organizational attraction) and how much they want to
pursue the job to get employed in the organization (job pursuit intentions). However, the
response rate for respondents’ previous organizational experience was not at the appropriate
level, possibly due to the placement of questionnaire items at the end of the survey or just simply
due to lack of full time employment. Therefore, the effects of the respondents’ previous
53
organizational experience could not be taken into account in the current study. Other factors
could have operated in the failure to differentiate the constructs. Maybe the distinction between
organizational attraction and job pursuit intentions are not substantial to entry-level job seekers
or people not actively searching for jobs. Applicants may need a certain period of deliberation or
experience to find out what kind of organization (e.g., person-organization fit) or job (e.g.,
person-job fit) would be the best choice for them before they could differentiate job pursuit
intentions from organizational attraction. Before applicants understand what they truly want for
their career choices, such a distinction may be less meaningful for them.
Finally, continuous research is required to better understand the dynamics of what
elements of a selection procedure would affect applicant reactions and how it affects
organizational effectiveness. Although the current study addressed how modality, time waiting,
and general self-efficacy would explain certain recruiting outcomes, there are still vast research
opportunities to better understand the contexts. Would the findings of the study be replicated in a
lab experiments or field study? Would the detrimental impacts of time waiting be aggravated in
the contexts of videoconferencing or online video-recording interviews? Would there be any
difference in applicant reactions when applicants are invited to online video-recording interviews
in which they record responses to certain questions by themselves without recruiters, compared
to other technology-mediated interviews that involve human interaction? In an online video-
recording interview in which the applicants could log-in to a designated website, would there be
any difference if recruiters give them a discretion when to record the interview responses
compared to the cases applicants should log-in at an exact time (e.g., Monday 7:00 PM)? What if
discretion is given to choose the modality in which employment interview will be conducted –
would it increase applicants’ perceived fairness to the selection tool or attraction of the
54
organization?
In the same manner, there are many questions waiting to be answered in regards to the
effects of individual differences in selection contexts. Is anger related to applicants’ perception of
selection procedures and organizations? Is it more likely that those who easily get angry to
seemingly unjust treatment or the sense of being less-valued than other candidates, would be
more sensitive to technology-mediated interviews or time waiting? Would job-seekers’ perceived
competitiveness within the candidate pool moderate applicant reactions to the employing
organizations? It is also likely that self-esteem or psychological capital would operate in the
mechanism of applicant reactions. It is hoped that future research would identify the details of
mechanisms on applicant reactions.
55
Chapter 6
Conclusions
Despite previous endeavors to understand how organizations can achieve its success in
recruitment and selection, we still do not understand the mechanism of what organizational or
job characteristics would attract more and better candidates. This study addressed interview
modality’s effects on applicant reactions, and newly suggested that a new variable, time waiting,
would impact applicant reactions during selection procedures. Interview modality significantly
predicted both perceived fairness and organizational attraction. Also, time waiting significantly
predicted organizational attraction, but it did not predict perceived fairness, affirming the
distinction of two constructs. General self-efficacy was investigated for its moderating effects in
the relationships between predictors (interview modality and time waiting) and dependent
variables (perceived fairness and organizational attraction). Further research should examine
additional factors that predict applicant reactions to selection methods, models that better explain
the mechanism of applicant reactions, and specific contexts in which certain variables (e.g., time
waiting) would bring more positive or negative consequences to organizational outcomes.
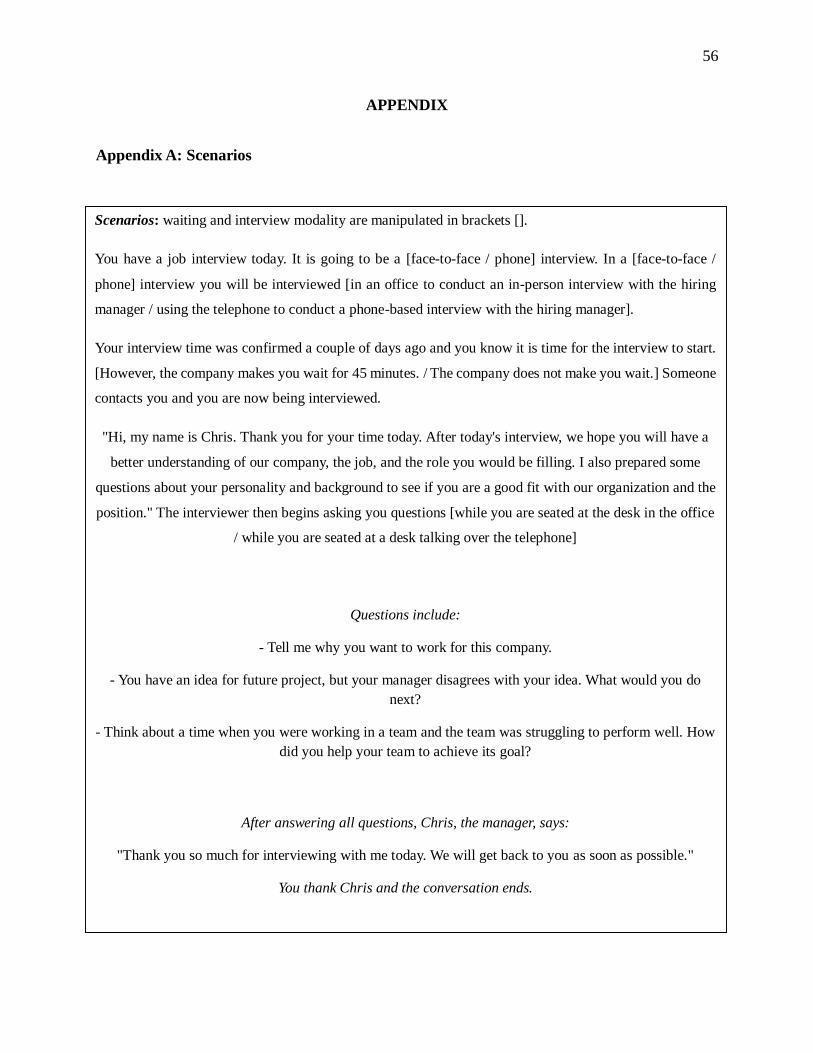
56
APPENDIX
Appendix A: Scenarios
Scenarios: waiting and interview modality are manipulated in brackets [].
You have a job interview today. It is going to be a [face-to-face / phone] interview. In a [face-to-face /
phone] interview you will be interviewed [in an office to conduct an in-person interview with the hiring
manager / using the telephone to conduct a phone-based interview with the hiring manager].
Your interview time was confirmed a couple of days ago and you know it is time for the interview to start.
[However, the company makes you wait for 45 minutes. / The company does not make you wait.] Someone
contacts you and you are now being interviewed.
"Hi, my name is Chris. Thank you for your time today. After today's interview, we hope you will have a
better understanding of our company, the job, and the role you would be filling. I also prepared some
questions about your personality and background to see if you are a good fit with our organization and the
position." The interviewer then begins asking you questions [while you are seated at the desk in the office
/ while you are seated at a desk talking over the telephone]
Questions include:
- Tell me why you want to work for this company.
- You have an idea for future project, but your manager disagrees with your idea. What would you do
next?
- Think about a time when you were working in a team and the team was struggling to perform well. How
did you help your team to achieve its goal?
After answering all questions, Chris, the manager, says:
"Thank you so much for interviewing with me today. We will get back to you as soon as possible."
You thank Chris and the conversation ends.
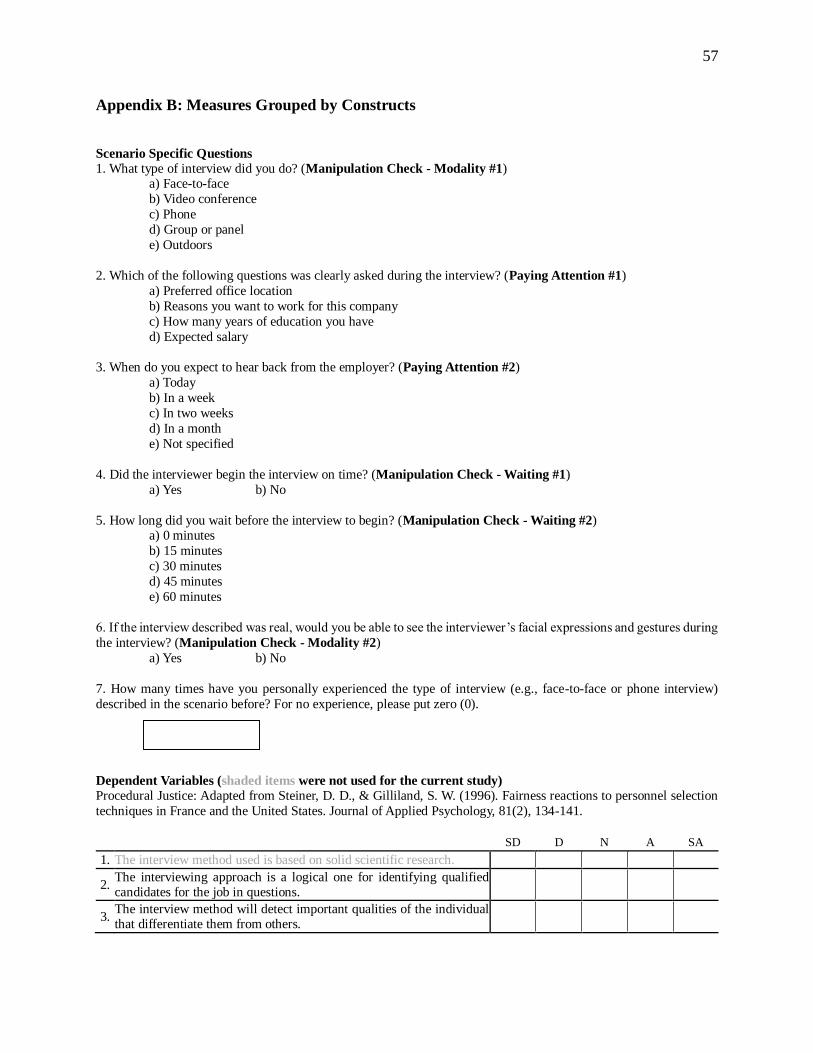
57
Appendix B: Measures Grouped by Constructs
Scenario Specific Questions
1. What type of interview did you do? (Manipulation Check - Modality #1) a) Face-to-face
b) Video conference
c) Phone
d) Group or panel
e) Outdoors
2. Which of the following questions was clearly asked during the interview? (Paying Attention #1)
a) Preferred office location
b) Reasons you want to work for this company
c) How many years of education you have
d) Expected salary
3. When do you expect to hear back from the employer? (Paying Attention #2)
a) Today
b) In a week
c) In two weeks
d) In a month
e) Not specified
4. Did the interviewer begin the interview on time? (Manipulation Check - Waiting #1)
a) Yes b) No
5. How long did you wait before the interview to begin? (Manipulation Check - Waiting #2) a) 0 minutes
b) 15 minutes
c) 30 minutes
d) 45 minutes
e) 60 minutes
6. If the interview described was real, would you be able to see the interviewer’s facial expressions and gestures during
the interview? (Manipulation Check - Modality #2)
a) Yes b) No
7. How many times have you personally experienced the type of interview (e.g., face-to-face or phone interview)
described in the scenario before? For no experience, please put zero (0).
Dependent Variables (shaded items were not used for the current study)
Procedural Justice: Adapted from Steiner, D. D., & Gilliland, S. W. (1996). Fairness reactions to personnel selection
techniques in France and the United States. Journal of Applied Psychology, 81(2), 134-141.
SD D N A SA
1. The interview method used is based on solid scientific research.
2. The interviewing approach is a logical one for identifying qualified candidates for the job in questions.
3. The interview method will detect important qualities of the individual that differentiate them from others.
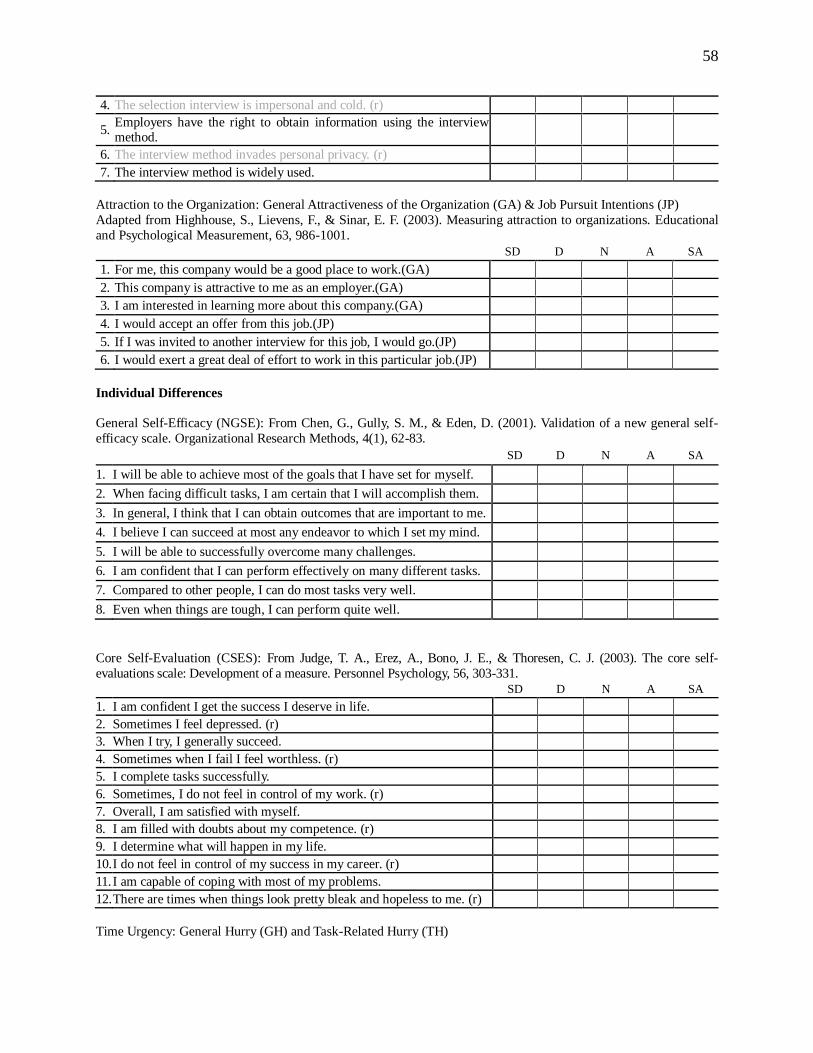
58
4. The selection interview is impersonal and cold. (r)
5. Employers have the right to obtain information using the interview method.
6. The interview method invades personal privacy. (r)
7. The interview method is widely used.
Attraction to the Organization: General Attractiveness of the Organization (GA) & Job Pursuit Intentions (JP)
Adapted from Highhouse, S., Lievens, F., & Sinar, E. F. (2003). Measuring attraction to organizations. Educational
and Psychological Measurement, 63, 986-1001.
SD D N A SA
1. For me, this company would be a good place to work.(GA)
2. This company is attractive to me as an employer.(GA)
3. I am interested in learning more about this company.(GA)
4. I would accept an offer from this job.(JP)
5. If I was invited to another interview for this job, I would go.(JP)
6. I would exert a great deal of effort to work in this particular job.(JP)
Individual Differences
General Self-Efficacy (NGSE): From Chen, G., Gully, S. M., & Eden, D. (2001). Validation of a new general self-
efficacy scale. Organizational Research Methods, 4(1), 62-83.
SD D N A SA
1. I will be able to achieve most of the goals that I have set for myself.
2. When facing difficult tasks, I am certain that I will accomplish them.
3. In general, I think that I can obtain outcomes that are important to me.
4. I believe I can succeed at most any endeavor to which I set my mind.
5. I will be able to successfully overcome many challenges.
6. I am confident that I can perform effectively on many different tasks.
7. Compared to other people, I can do most tasks very well.
8. Even when things are tough, I can perform quite well.
Core Self-Evaluation (CSES): From Judge, T. A., Erez, A., Bono, J. E., & Thoresen, C. J. (2003). The core self-
evaluations scale: Development of a measure. Personnel Psychology, 56, 303-331.
SD D N A SA
1. I am confident I get the success I deserve in life.
2. Sometimes I feel depressed. (r)
3. When I try, I generally succeed.
4. Sometimes when I fail I feel worthless. (r)
5. I complete tasks successfully.
6. Sometimes, I do not feel in control of my work. (r)
7. Overall, I am satisfied with myself.
8. I am filled with doubts about my competence. (r)
9. I determine what will happen in my life.
10. I do not feel in control of my success in my career. (r)
11. I am capable of coping with most of my problems.
12. There are times when things look pretty bleak and hopeless to me. (r)
Time Urgency: General Hurry (GH) and Task-Related Hurry (TH)
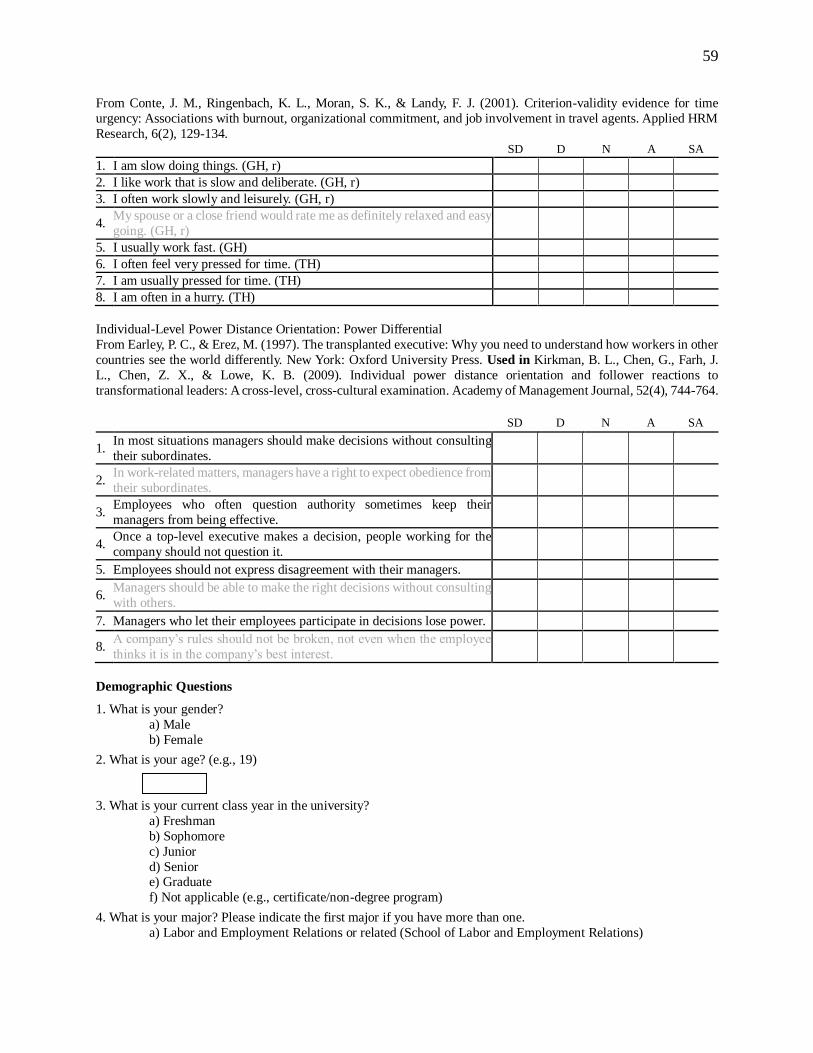
59
From Conte, J. M., Ringenbach, K. L., Moran, S. K., & Landy, F. J. (2001). Criterion-validity evidence for time
urgency: Associations with burnout, organizational commitment, and job involvement in travel agents. Applied HRM
Research, 6(2), 129-134.
SD D N A SA
1. I am slow doing things. (GH, r)
2. I like work that is slow and deliberate. (GH, r)
3. I often work slowly and leisurely. (GH, r)
4. My spouse or a close friend would rate me as definitely relaxed and easy
going. (GH, r)
5. I usually work fast. (GH)
6. I often feel very pressed for time. (TH)
7. I am usually pressed for time. (TH)
8. I am often in a hurry. (TH)
Individual-Level Power Distance Orientation: Power Differential
From Earley, P. C., & Erez, M. (1997). The transplanted executive: Why you need to understand how workers in other
countries see the world differently. New York: Oxford University Press. Used in Kirkman, B. L., Chen, G., Farh, J.
L., Chen, Z. X., & Lowe, K. B. (2009). Individual power distance orientation and follower reactions to
transformational leaders: A cross-level, cross-cultural examination. Academy of Management Journal, 52(4), 744-764.
SD D N A SA
1. In most situations managers should make decisions without consulting
their subordinates.
2. In work-related matters, managers have a right to expect obedience from
their subordinates.
3. Employees who often question authority sometimes keep their
managers from being effective.
4. Once a top-level executive makes a decision, people working for the
company should not question it.
5. Employees should not express disagreement with their managers.
6. Managers should be able to make the right decisions without consulting
with others.
7. Managers who let their employees participate in decisions lose power.
8. A company’s rules should not be broken, not even when the employee
thinks it is in the company’s best interest.
Demographic Questions
1. What is your gender?
a) Male
b) Female
2. What is your age? (e.g., 19)
3. What is your current class year in the university?
a) Freshman
b) Sophomore
c) Junior
d) Senior e) Graduate
f) Not applicable (e.g., certificate/non-degree program)
4. What is your major? Please indicate the first major if you have more than one.
a) Labor and Employment Relations or related (School of Labor and Employment Relations)
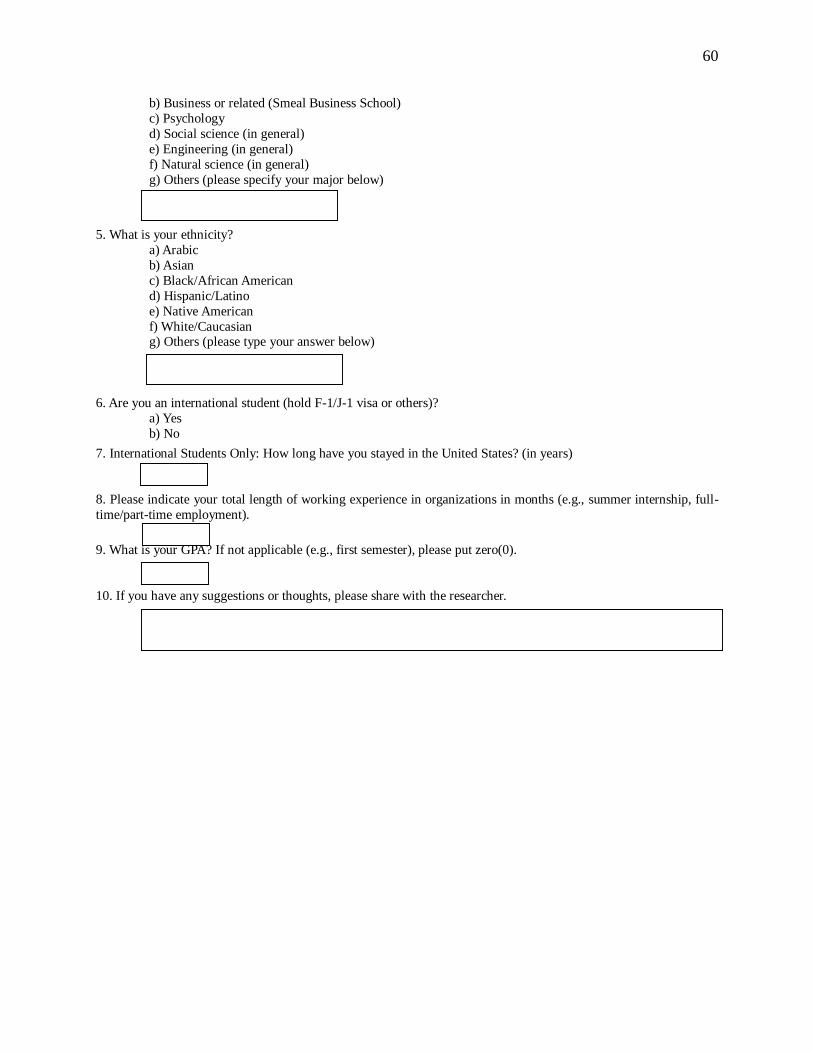
60
b) Business or related (Smeal Business School)
c) Psychology
d) Social science (in general)
e) Engineering (in general)
f) Natural science (in general)
g) Others (please specify your major below)
5. What is your ethnicity?
a) Arabic
b) Asian
c) Black/African American
d) Hispanic/Latino
e) Native American
f) White/Caucasian g) Others (please type your answer below)
6. Are you an international student (hold F-1/J-1 visa or others)?
a) Yes
b) No
7. International Students Only: How long have you stayed in the United States? (in years)
8. Please indicate your total length of working experience in organizations in months (e.g., summer internship, full-
time/part-time employment).
9. What is your GPA? If not applicable (e.g., first semester), please put zero(0).
10. If you have any suggestions or thoughts, please share with the researcher.
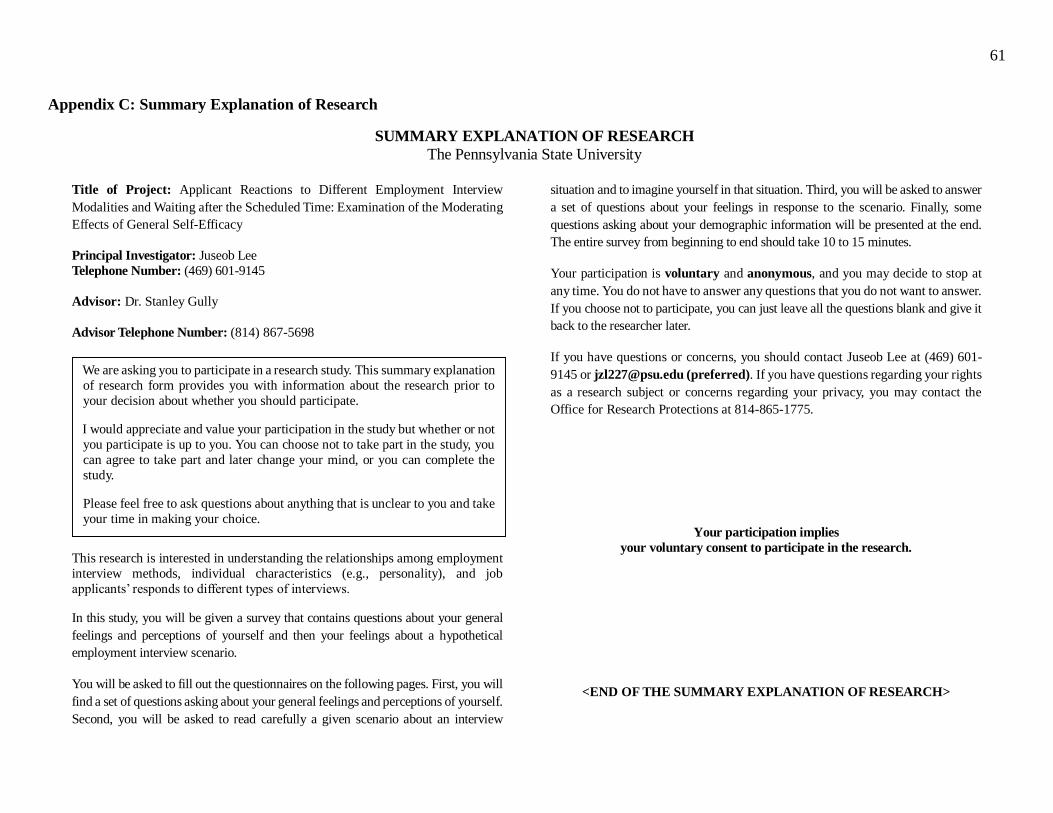
61
Appendix C: Summary Explanation of Research
SUMMARY EXPLANATION OF RESEARCH
The Pennsylvania State University
Title of Project: Applicant Reactions to Different Employment Interview
Modalities and Waiting after the Scheduled Time: Examination of the Moderating
Effects of General Self-Efficacy
Principal Investigator: Juseob Lee
Telephone Number: (469) 601-9145
Advisor: Dr. Stanley Gully
Advisor Telephone Number: (814) 867-5698
This research is interested in understanding the relationships among employment
interview methods, individual characteristics (e.g., personality), and job
applicants’ responds to different types of interviews.
In this study, you will be given a survey that contains questions about your general
feelings and perceptions of yourself and then your feelings about a hypothetical
employment interview scenario.
You will be asked to fill out the questionnaires on the following pages. First, you will
find a set of questions asking about your general feelings and perceptions of yourself.
Second, you will be asked to read carefully a given scenario about an interview
situation and to imagine yourself in that situation. Third, you will be asked to answer
a set of questions about your feelings in response to the scenario. Finally, some
questions asking about your demographic information will be presented at the end.
The entire survey from beginning to end should take 10 to 15 minutes.
Your participation is voluntary and anonymous, and you may decide to stop at
any time. You do not have to answer any questions that you do not want to answer.
If you choose not to participate, you can just leave all the questions blank and give it
back to the researcher later.
If you have questions or concerns, you should contact Juseob Lee at (469) 601-
9145 or [email protected] (preferred). If you have questions regarding your rights
as a research subject or concerns regarding your privacy, you may contact the
Office for Research Protections at 814-865-1775.
Your participation implies
your voluntary consent to participate in the research.
<END OF THE SUMMARY EXPLANATION OF RESEARCH>
We are asking you to participate in a research study. This summary explanation
of research form provides you with information about the research prior to
your decision about whether you should participate.
I would appreciate and value your participation in the study but whether or not
you participate is up to you. You can choose not to take part in the study, you
can agree to take part and later change your mind, or you can complete the
study.
Please feel free to ask questions about anything that is unclear to you and take
your time in making your choice.
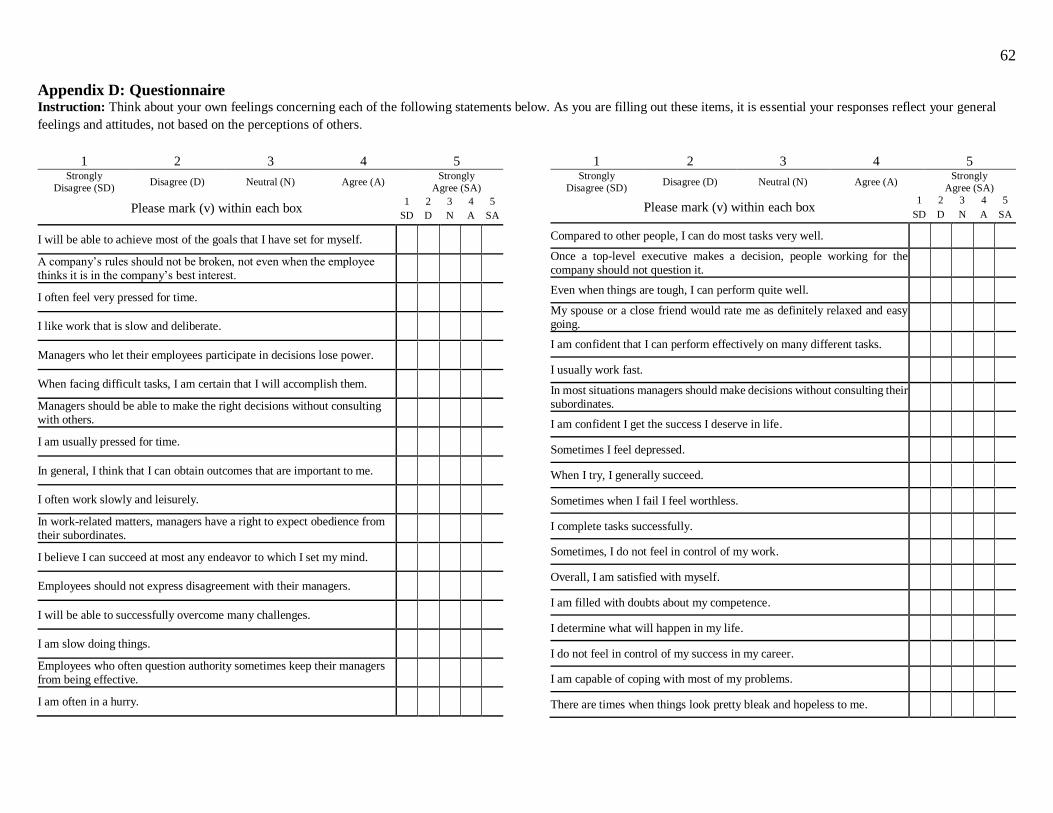
62
Appendix D: Questionnaire Instruction: Think about your own feelings concerning each of the following statements below. As you are filling out these items, it is essential your responses reflect your general
feelings and attitudes, not based on the perceptions of others.
1 2 3 4 5 Strongly
Disagree (SD) Disagree (D) Neutral (N) Agree (A)
Strongly
Agree (SA)
Please mark (v) within each box 1
SD
2
D
3
N
4
A
5
SA
I will be able to achieve most of the goals that I have set for myself.
A company’s rules should not be broken, not even when the employee thinks it is in the company’s best interest.
I often feel very pressed for time.
I like work that is slow and deliberate.
Managers who let their employees participate in decisions lose power.
When facing difficult tasks, I am certain that I will accomplish them.
Managers should be able to make the right decisions without consulting with others.
I am usually pressed for time.
In general, I think that I can obtain outcomes that are important to me.
I often work slowly and leisurely.
In work-related matters, managers have a right to expect obedience from their subordinates.
I believe I can succeed at most any endeavor to which I set my mind.
Employees should not express disagreement with their managers.
I will be able to successfully overcome many challenges.
I am slow doing things.
Employees who often question authority sometimes keep their managers from being effective.
I am often in a hurry.
1 2 3 4 5 Strongly
Disagree (SD) Disagree (D) Neutral (N) Agree (A)
Strongly
Agree (SA)
Please mark (v) within each box 1
SD
2
D
3
N
4
A
5
SA
Compared to other people, I can do most tasks very well.
Once a top-level executive makes a decision, people working for the company should not question it.
Even when things are tough, I can perform quite well.
My spouse or a close friend would rate me as definitely relaxed and easy going.
I am confident that I can perform effectively on many different tasks.
I usually work fast.
In most situations managers should make decisions without consulting their subordinates.
I am confident I get the success I deserve in life.
Sometimes I feel depressed.
When I try, I generally succeed.
Sometimes when I fail I feel worthless.
I complete tasks successfully.
Sometimes, I do not feel in control of my work.
Overall, I am satisfied with myself.
I am filled with doubts about my competence.
I determine what will happen in my life.
I do not feel in control of my success in my career.
I am capable of coping with most of my problems.
There are times when things look pretty bleak and hopeless to me.
63
<THIS PAGE IS INTENTIONALLY LEFT BLANK>
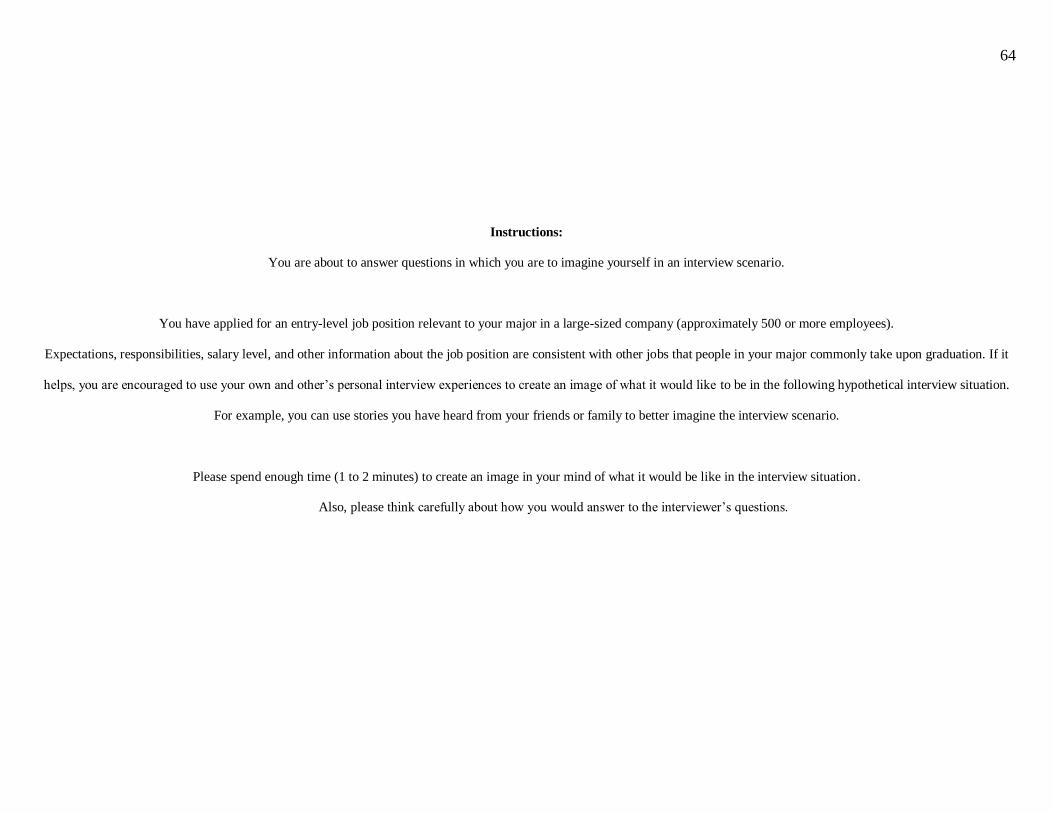
64
Instructions:
You are about to answer questions in which you are to imagine yourself in an interview scenario.
You have applied for an entry-level job position relevant to your major in a large-sized company (approximately 500 or more employees).
Expectations, responsibilities, salary level, and other information about the job position are consistent with other jobs that people in your major commonly take upon graduation. If it
helps, you are encouraged to use your own and other’s personal interview experiences to create an image of what it would like to be in the following hypothetical interview situation.
For example, you can use stories you have heard from your friends or family to better imagine the interview scenario.
Please spend enough time (1 to 2 minutes) to create an image in your mind of what it would be like in the interview situation.
Also, please think carefully about how you would answer to the interviewer’s questions.
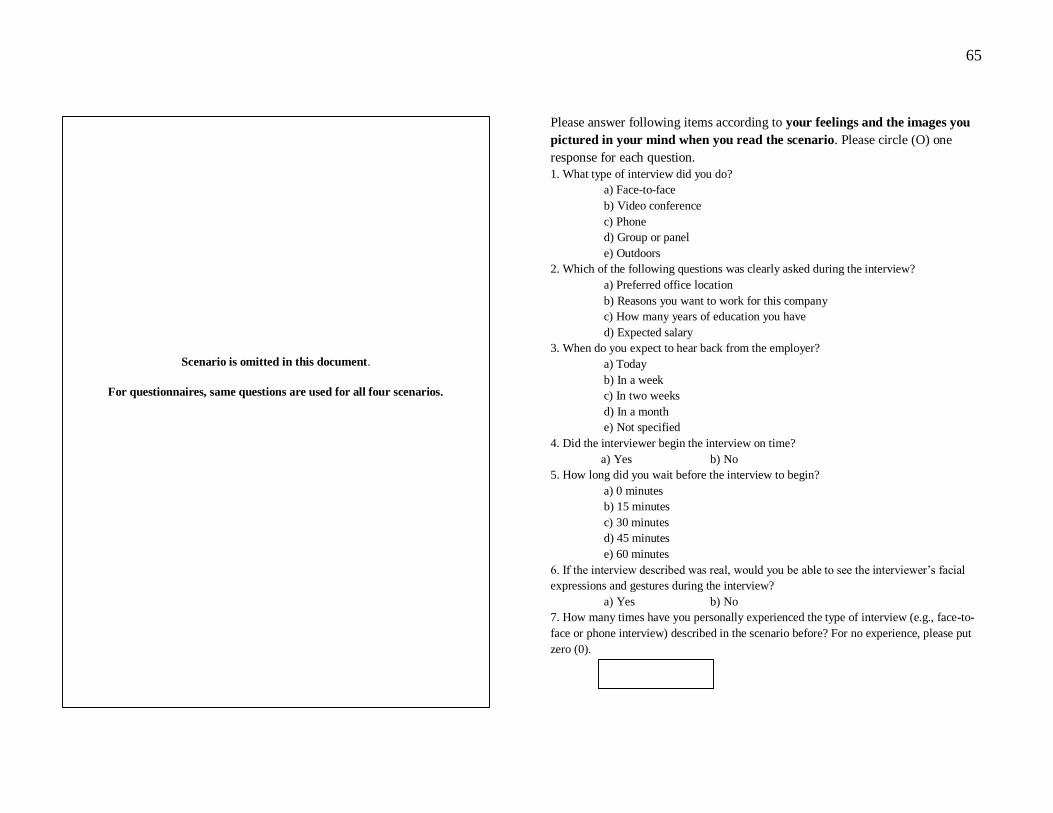
65
Please answer following items according to your feelings and the images you
pictured in your mind when you read the scenario. Please circle (O) one
response for each question.
1. What type of interview did you do?
a) Face-to-face
b) Video conference
c) Phone
d) Group or panel
e) Outdoors
2. Which of the following questions was clearly asked during the interview?
a) Preferred office location
b) Reasons you want to work for this company
c) How many years of education you have
d) Expected salary
3. When do you expect to hear back from the employer?
a) Today
b) In a week
c) In two weeks
d) In a month
e) Not specified
4. Did the interviewer begin the interview on time?
a) Yes b) No
5. How long did you wait before the interview to begin?
a) 0 minutes
b) 15 minutes
c) 30 minutes
d) 45 minutes
e) 60 minutes
6. If the interview described was real, would you be able to see the interviewer’s facial
expressions and gestures during the interview?
a) Yes b) No
7. How many times have you personally experienced the type of interview (e.g., face-to-
face or phone interview) described in the scenario before? For no experience, please put
zero (0).
Scenario is omitted in this document.
For questionnaires, same questions are used for all four scenarios.
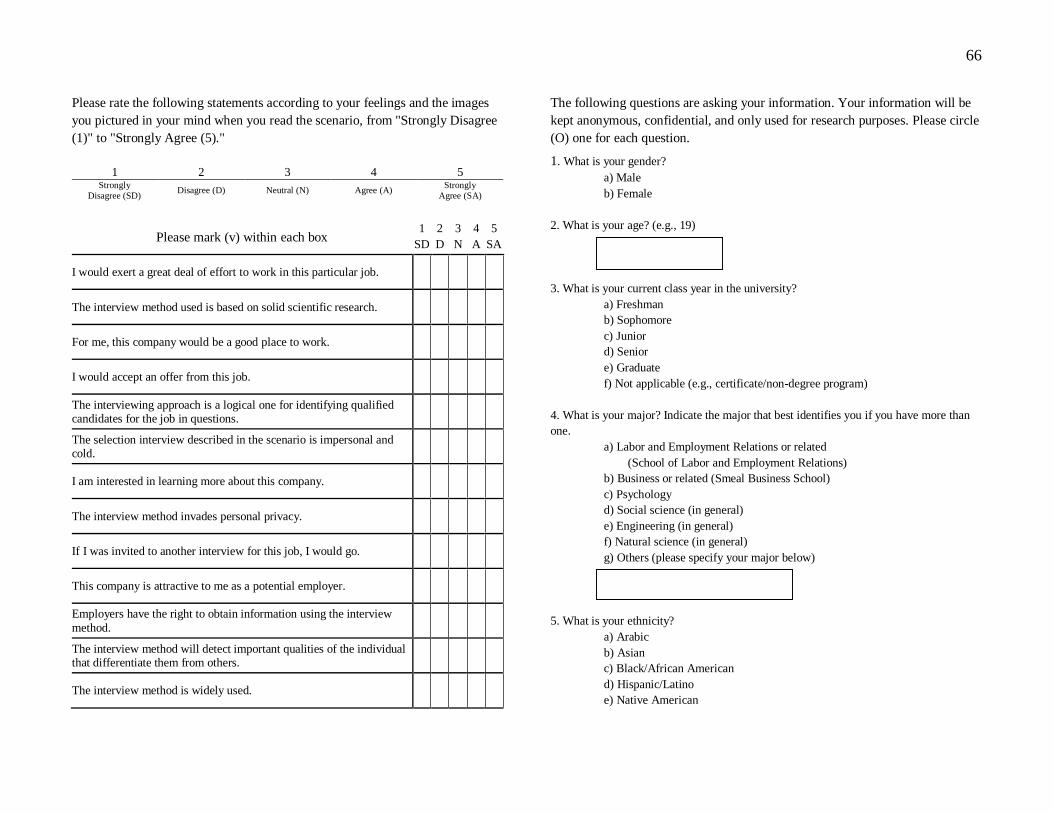
66
Please rate the following statements according to your feelings and the images
you pictured in your mind when you read the scenario, from "Strongly Disagree
(1)" to "Strongly Agree (5)."
1 2 3 4 5 Strongly
Disagree (SD) Disagree (D) Neutral (N) Agree (A)
Strongly
Agree (SA)
Please mark (v) within each box 1
SD
2
D
3
N
4
A
5
SA
I would exert a great deal of effort to work in this particular job.
The interview method used is based on solid scientific research.
For me, this company would be a good place to work.
I would accept an offer from this job.
The interviewing approach is a logical one for identifying qualified candidates for the job in questions.
The selection interview described in the scenario is impersonal and cold.
I am interested in learning more about this company.
The interview method invades personal privacy.
If I was invited to another interview for this job, I would go.
This company is attractive to me as a potential employer.
Employers have the right to obtain information using the interview
method.
The interview method will detect important qualities of the individual that differentiate them from others.
The interview method is widely used.
The following questions are asking your information. Your information will be
kept anonymous, confidential, and only used for research purposes. Please circle
(O) one for each question.
1. What is your gender?
a) Male
b) Female
2. What is your age? (e.g., 19)
3. What is your current class year in the university?
a) Freshman
b) Sophomore
c) Junior
d) Senior
e) Graduate
f) Not applicable (e.g., certificate/non-degree program)
4. What is your major? Indicate the major that best identifies you if you have more than
one.
a) Labor and Employment Relations or related
(School of Labor and Employment Relations)
b) Business or related (Smeal Business School)
c) Psychology
d) Social science (in general)
e) Engineering (in general)
f) Natural science (in general)
g) Others (please specify your major below)
5. What is your ethnicity?
a) Arabic
b) Asian
c) Black/African American
d) Hispanic/Latino
e) Native American
67
f) White/Caucasian
g) Others (please type your answer below)
6. Are you an international student (hold F-1/J-1 visa or others)?
a) Yes
b) No
7. International Students Only:
How long have you stayed in the United States? (in years)
8. Please indicate your total length of working experience in organizations in months
(e.g., summer internship, full-time/part-time employment).
9. What is your GPA? If not applicable (e.g., first semester), please put zero (0).
10. If you have any suggestions or thoughts, please share it with the researcher.
<END OF THE SURVEY>
Thank you for your participation.
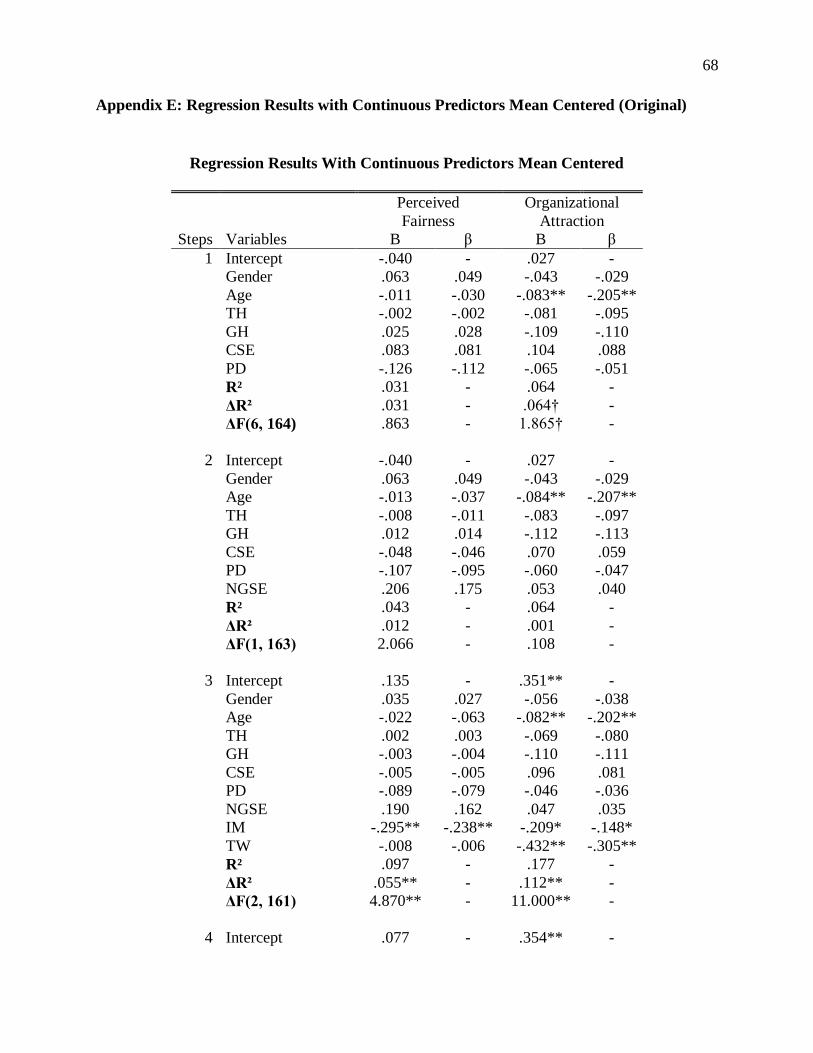
68
Appendix E: Regression Results with Continuous Predictors Mean Centered (Original)
Regression Results With Continuous Predictors Mean Centered
Perceived
Fairness
Organizational
Attraction
Steps Variables B β B β
1 Intercept -.040 - .027 -
Gender .063 .049 -.043 -.029
Age -.011 -.030 -.083** -.205**
TH -.002 -.002 -.081 -.095
GH .025 .028 -.109 -.110
CSE .083 .081 .104 .088
PD -.126 -.112 -.065 -.051
R² .031 - .064 -
ΔR² .031 - .064† -
ΔF(6, 164) .863 - 1.865† -
2 Intercept -.040 - .027 -
Gender .063 .049 -.043 -.029
Age -.013 -.037 -.084** -.207**
TH -.008 -.011 -.083 -.097
GH .012 .014 -.112 -.113
CSE -.048 -.046 .070 .059
PD -.107 -.095 -.060 -.047
NGSE .206 .175 .053 .040
R² .043 - .064 -
ΔR² .012 - .001 -
ΔF(1, 163) 2.066 - .108 -
3 Intercept .135 - .351** -
Gender .035 .027 -.056 -.038
Age -.022 -.063 -.082** -.202**
TH .002 .003 -.069 -.080
GH -.003 -.004 -.110 -.111
CSE -.005 -.005 .096 .081
PD -.089 -.079 -.046 -.036
NGSE .190 .162 .047 .035
IM -.295** -.238** -.209* -.148*
TW -.008 -.006 -.432** -.305**
R² .097 - .177 -
ΔR² .055** - .112** -
ΔF(2, 161) 4.870** - 11.000** -
4 Intercept .077 - .354** -
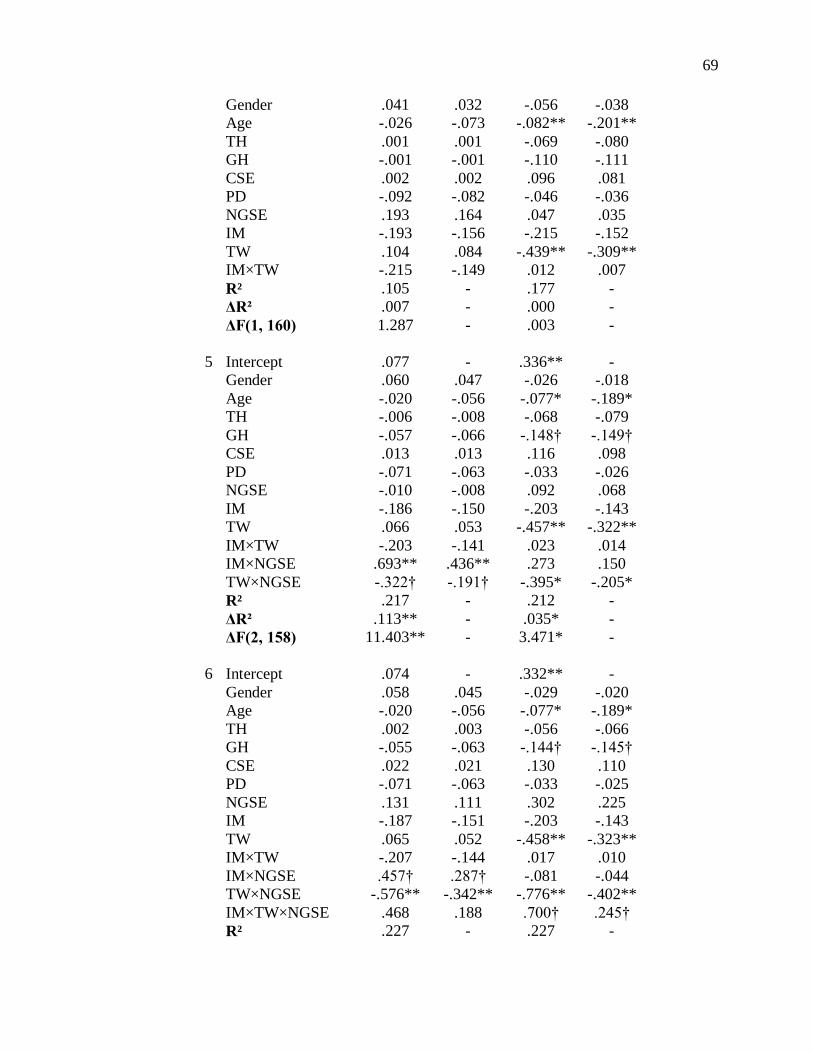
69
Gender .041 .032 -.056 -.038
Age -.026 -.073 -.082** -.201**
TH .001 .001 -.069 -.080
GH -.001 -.001 -.110 -.111
CSE .002 .002 .096 .081
PD -.092 -.082 -.046 -.036
NGSE .193 .164 .047 .035
IM -.193 -.156 -.215 -.152
TW .104 .084 -.439** -.309**
IM×TW -.215 -.149 .012 .007
R² .105 - .177 -
ΔR² .007 - .000 -
ΔF(1, 160) 1.287 - .003 -
5 Intercept .077 - .336** -
Gender .060 .047 -.026 -.018
Age -.020 -.056 -.077* -.189*
TH -.006 -.008 -.068 -.079
GH -.057 -.066 -.148† -.149†
CSE .013 .013 .116 .098
PD -.071 -.063 -.033 -.026
NGSE -.010 -.008 .092 .068
IM -.186 -.150 -.203 -.143
TW .066 .053 -.457** -.322**
IM×TW -.203 -.141 .023 .014
IM×NGSE .693** .436** .273 .150
TW×NGSE -.322† -.191† -.395* -.205*
R² .217 - .212 -
ΔR² .113** - .035* -
ΔF(2, 158) 11.403** - 3.471* -
6 Intercept .074 - .332** -
Gender .058 .045 -.029 -.020
Age -.020 -.056 -.077* -.189*
TH .002 .003 -.056 -.066
GH -.055 -.063 -.144† -.145†
CSE .022 .021 .130 .110
PD -.071 -.063 -.033 -.025
NGSE .131 .111 .302 .225
IM -.187 -.151 -.203 -.143
TW .065 .052 -.458** -.323**
IM×TW -.207 -.144 .017 .010
IM×NGSE .457† .287† -.081 -.044
TW×NGSE -.576** -.342** -.776** -.402**
IM×TW×NGSE .468 .188 .700† .245†
R² .227 - .227 -
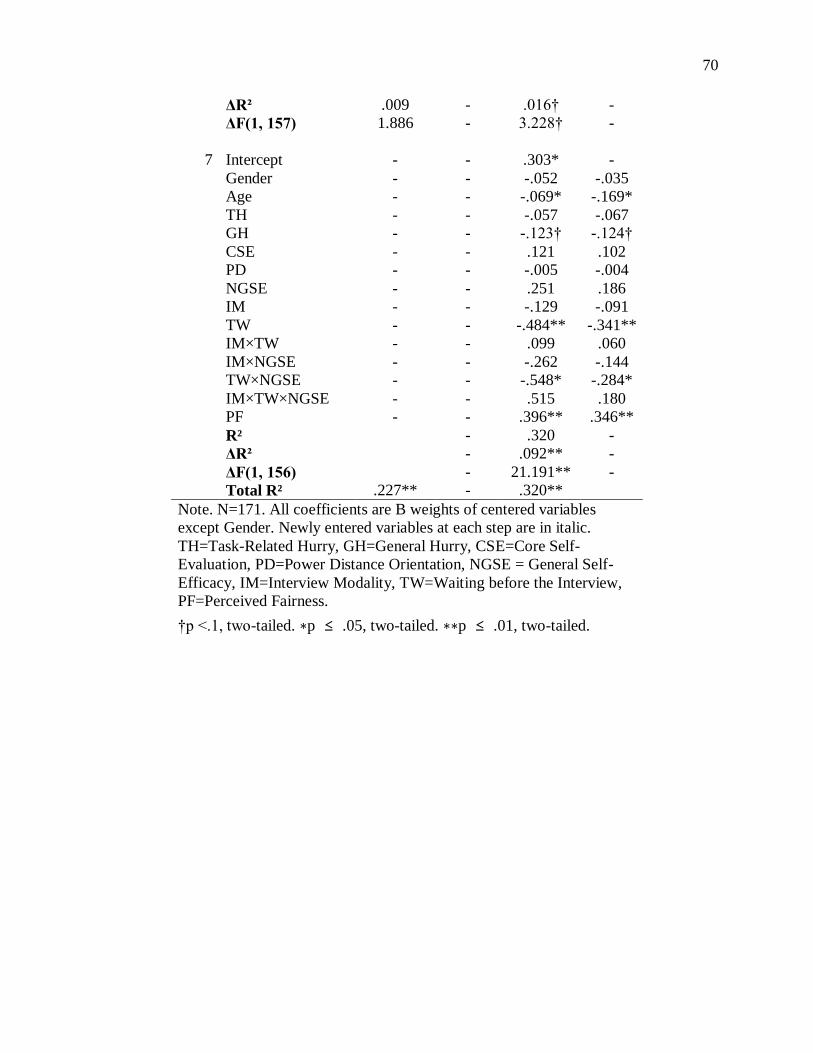
70
ΔR² .009 - .016† -
ΔF(1, 157) 1.886 - 3.228† -
7 Intercept - - .303* -
Gender - - -.052 -.035
Age - - -.069* -.169*
TH - - -.057 -.067
GH - - -.123† -.124†
CSE - - .121 .102
PD - - -.005 -.004
NGSE - - .251 .186
IM - - -.129 -.091
TW - - -.484** -.341**
IM×TW - - .099 .060
IM×NGSE - - -.262 -.144
TW×NGSE - - -.548* -.284*
IM×TW×NGSE - - .515 .180
PF - - .396** .346**
R² - .320 -
ΔR² - .092** -
ΔF(1, 156) - 21.191** -
Total R² .227** - .320**
Note. N=171. All coefficients are B weights of centered variables
except Gender. Newly entered variables at each step are in italic.
TH=Task-Related Hurry, GH=General Hurry, CSE=Core Self-
Evaluation, PD=Power Distance Orientation, NGSE = General Self-
Efficacy, IM=Interview Modality, TW=Waiting before the Interview,
PF=Perceived Fairness.
†p <.1, two-tailed. ∗p ≤ .05, two-tailed. ∗∗p ≤ .01, two-tailed.
71
Bibliography
Aaker, J. L. (1997). Dimensions of brand personality. Journal of Marketing Research, 34, 347-
356.
Aaker, J. L. (1999). The malleable self: The role of self-expression in persuasion. Journal of
Marketing Research, 36, 45-57.
Adams, J. S. (1965). Inequity in social exchange. In L. Berkowitz (Ed.), Advances in
experimental social psychology (pp. 267-299). New York: Academic Press.
Aiken, L. S., & West, S. G. (1991). Multiple regression: Testing and interpreting interactions.
Newbury Park, CA: Sage.
Albinger, H. S., & Freeman, S. J. (2000). Corporate social performance and attractiveness as an
employer to different job seeking populations. Journal of Business Ethics, 28(3), 243-
253.
Arvey, R. D. (1979). Unfair discrimination in the employment interview: Legal and
psychological aspects. Psychological Bulletin, 86, 736-765.
Arvey, R. D., Strickland, W., Drauden, G., & Martin, C. (1990). Motivational components of test
taking. Personnel Psychology, 43(4), 695-716.
Bandura, A. (1986). Social foundations of thought and action: A social-cognitive view.
Englewood Cliffs, NJ: Prentice-Hall.
Barrick, M. R., & Mount, M. K. (1991). The big five personality dimensions and job
performance: A meta‐analysis. Personnel Psychology, 44(1), 1-26.
Bauer, T. N., Maertz Jr, C. P., Dolen, M. R., & Campion, M. A. (1998). Longitudinal assessment
of applicant reactions to employment testing and test outcome feedback. Journal of
Applied Psychology, 83(6), 892.
72
Bertolino, M., & Steiner, D. D. (2007). Fairness reactions to selection methods: An Italian
study. International Journal of Selection and Assessment, 15(2), 197-205.
Bjork & Whitten (1974). Recency sensitive retrieval processes in long-term free recall. Cognitive
Psychology, 6, 173-189.
Campion, M. A., Pursell, E. D., & Brown, B. K. (1988). Structured interviewing: Raising the
psychometric properties of the employment interview. Personnel Psychology, 41(1), 25-
42.
Campion, M. A., Campion, J. E., & Hudson, J. P. (1994). Structured interviewing: A note on
incremental validity and alternative question types. Journal of Applied Psychology, 79(6),
998.
Carless, S. A. (2005). Person–job fit versus person–organization fit as predictors of
organizational attraction and job acceptance intentions: A longitudinal study. Journal of
Occupational and Organizational Psychology, 78(3), 411-429.
Carroll, A. B. (1991). The pyramid of corporate social responsibility: Toward the moral
management of organizational stakeholders, Business Horizons, 34(4), 39-48.
Chapman, D. S. (1999). Expanding the search for talent; Adopting technology-based strategies
for campus recruiting and selection. Journal of Cooperative Education, 34, 35-41.
Chapman, D. S., & Rowe, P. M. (2002). The influence of videoconference technology and
interview structure on the recruiting function of the employment interview: A field
experiment. International Journal of Selection and Assessment, 10, 185-197.
Chapman, D. S., Uggerslev, K. L., & Webster, J. (2003). Applicant reactions to face-to-face and
technology-mediated interviews: A field investigation. Journal of Applied Psychology,
88(5), 944.
73
Chapman, D. S., Uggerslev, K. L., Carroll, S. A., Piasentin, K. A., & Jones, D. A. (2005).
Applicant attraction to organizations and job choice: a meta-analytic review of the
correlates of recruiting outcomes. Journal of Applied Psychology, 90(5), 928-944.
Chen, G., Gully, S. M., & Eden, D. (2001). Validation of a new general self-efficacy scale.
Organizational Research Methods, 4(1), 62-83.
Chen, G., Gully, S. M., & Eden, D. (2004). General self‐efficacy and self‐esteem: Toward
theoretical and empirical distinction between correlated self‐evaluations. Journal of
Organizational Behavior, 25(3), 375-395.
Chen, G., Gully, S. M., Whiteman, J. A., & Kilcullen, R. N. (2000). Examination of relationships
among trait-like individual differences, state-like individual differences, and learning
performance. Journal of Applied Psychology, 85(6), 835.
Cofer, C. N., & Appley, M. H. (1964). Motivation: Theory and research. New York: Wiley.
Coffman, D. L., & Gilligan, T. D. (2003). Social support, stress, and self-efficacy: Effects on
students’ satisfaction. Journal of College Student Retention, 4(1), 53-66.
Cohen, J. (1992). A power primer. Psychological Bulletin, 112(1), 155.
Colquitt, J. A. (2001). On the dimensionality of organizational justice: A construct validation of
a measure. Journal of Applied Psychology, 86, 386–400.
Colquitt, J. A., Conlon, D. E., Wesson, M. J., Porter, C. O., & Ng, K. Y. (2001). Justice at the
millennium: A meta-analytic review of 25 years of organizational justice
research. Journal of Applied Psychology, 86(3), 425-445.
Connelly, B. L., Certo, S. T., Ireland, R. D., & Reutzel, C. R. (2011). Signaling theory: A review
and assessment. Journal of Management, 37(1), 39-67.
74
Creyer, E. H. (1997). The influence of firm behavior on purchase intention: Do consumers really
care about business ethics?. Journal of Consumer Marketing, 14(6), 421-432.
Daft, R. L., & Lengel, R. H. (1986). Organizational information requirements, media richness
and structural design. Management Science, 32(5), 554.
Davis, M. M., & Heineke, J. (1998). How disconfirmation, perception and actual waiting times
impact customer satisfaction. International Journal of Service Industry Management,
9(1), 64-73.
Dineen, B. R., Noe, R. A., & Wang, C. (2004). Perceived fairness of web‐based applicant
screening procedures: Weighing the rules of justice and the role of individual
differences. Human Resource Management, 43(2‐3), 127-145.
Eden, D. (1996, August). From self-efficacy to means efficacy: Internal and external sources of
general and specific efficacy. In 56th annual meeting of the Academy of Management,
Cincinnati, OH.
Festinger, L. (1962). Cognitive dissonance. Scientific American.
Fletcher, T.D., & Major, D.A. (2006). The effects of communication modality on performance
and self-ratings of teamwork components. Journal of Computer-Mediated
Communication, 11, 557-576.
Gilliland, S. W. (1993). The perceived fairness of selection systems: An organizational justice
perspective. Academy of Management Review, 18(4), 694-734.
Gilliland, S. W. (1995). Fairness from the applicant's perspective: Reactions to employee
selection Procedures. International Journal of Selection and Assessment, 3(1), 11-18.
75
Gilliland, S. W., & Chan, D. (2001). Justice in organizations. In N. Anderson, D. Ones, H. K.
Sinangil, & C. Viswesvaran (Eds.), Handbook of Industrial, Work, and Organizational
Psychology (pp. 143-165). London: Sage
Gist, M. E., & Mitchell, T. R. (1992). Self-efficacy: A theoretical analysis of its determinants
and malleability. Academy of Management Review, 17, 183-211.
Greenberg, J. (1987). A taxonomy of organizational justice theories. Academy of Management
Review, 12(1), 9-22.
Greenberg, J. (1993). The social side of fairness: Interpersonal and informational classes of
organizational justice. In R. Cropanzano (Ed.), Justice in the workplace: Approaching
fairness in human resource management (pp. 79-103). Hillsdale, NJ: Erlbaum.
Gully, S. M., Phillips, J. M., Castellano, W. G., Han, K., & Kim, A. (2013). A mediated
moderation model of recruiting socially and environmentally responsible job
applicants. Personnel Psychology, 66(4), 935-973.
Hao, Z., Seibert, S. E., & Hills, G. E. (2005). The mediating role of self-efficacy in the
development of entrepreneurial intentions. Journal of Applied Psychology, 90(6), 1265-
1272.
Highhouse, S., Lievens, F., & Sinar, E. F. (2003). Measuring attraction to
organizations. Educational and Psychological Measurement, 63(6), 986-1001.
Hofstede, G. (2011). Dimensionalizing cultures: The Hofstede model in context. Online
Readings in Psychology and Culture, 2(1), 8.
Hurtz, G. M., & Donovan, J. J. (2000). Personality and job performance: The Big Five revisited.
Journal of Applied Psychology, 85(6), 869.
76
Judge, T. A., & Bono, J. E. (2001). Relationship of core self-evaluations traits—self-esteem,
generalized self-efficacy, locus of control, and emotional stability—with job satisfaction
and job performance: A meta-analysis. Journal of Applied Psychology, 86(1), 80-92.
Judge, T. A., Erez, A., Bono, J. E., & Thoresen, C. J. (2002). Are measures of self-esteem,
neuroticism, locus of control, and generalized self-efficacy indicators of a common core
construct?. Journal of Personality and Social Psychology, 83(3), 693.
Judge, T. A., Erez, A., Bono, J. E., & Thoresen, C. J. (2003). The core self‐evaluations scale:
Development of a measure. Personnel Psychology, 56(2), 303-331.
Karademas, E. C., & Kalantzi-Azizi, A. (2004). The stress process, self-efficacy expectations,
and psychological health. Personality and Individual Differences, 37(5), 1033-1043.
Kasof, J. (1993). Sex bias in the naming of stimulus persons. Psychological Bulletin, 113(1),
140.
Kohn, L. S., & Dipboye, R. L. (1998). The effects of interview structure on recruiting outcomes.
Journal of Applied Social Psychology, 28(9), 821-843.
Kroeck, K. G., & Magnusen, K. O. (1997). Employer and job candidate reactions to
videoconference job interviewing. International Journal of Selection and Assessment, 5,
137-142.
Lazarus, R. S., & Folkman, S. (1984). Stress, appraisal, and coping. New York: Springer-
Verlag.
Leventhal, G. S. (1980). What should be done with equity theory? New approaches to the study
of fairness in social relationships. In K. Gergen, M. Greenberg, & R. Willis (Eds.), Social
exchange: Advances in theory and research (pp. 27–55). New York: Plenum Press.
77
Leventhal, G. S., Karuza, J., & Fry, W. R. (1980). Beyond fairness: A theory of allocation
preferences. In G. Mikula (Ed.), Justice and social interaction (p. 167-218). New York:
Springer-Verlag.
Levashina, J., Hartwell, C. J., Morgeson, F. P., & Campion, M. A. (2014). The structured
employment interview: Narrative and quantitative review of the research literature.
Personnel Psychology, 67(1), 241-293.
Lievens, F., & Highhouse, S. (2003). The relation of instrumental and symbolic attributes to a
company's attractiveness as an employer. Personnel Psychology, 56(1), 75-102.
Macan, T. (2009). The employment interview: A review of current studies and directions for
future research. Human Resource Management Review, 19, 203-218.
Macan, T. H., Avedon, M. J., Paese, M., & Smith, D. E. (1994). The effects of applicants'
reactions to cognitive ability tests and an assessment center. Personnel Psychology, 47(4),
715-738.
McCrae, R. R., & Costa, P. T. (1997). Personality trait structure as a human universal. American
Psychologist, 52(5), 509.
McDaniel, M. A., Whetzel, D. L., Schmidt, F. L., & Maurer, S. D. (1994). The validity of
employment interviews: A comprehensive review and meta-analysis. Journal of Applied
Psychology, 79(4), 599-616.
McGrath, J. E., & Hollingshead, A. B. (1993). Putting the group back in group support systems:
Some theoretical issues about dynamic processes in groups with technological
enhancements. In Jessup L. M., & Valacich J. S. (Eds.), Group support systems: New
perspectives (pp. 78-96). New York: Macmillan.
78
Moscoso, S., & Salgado, J. F. (2004). Fairness reactions to personnel selection techniques in
Spain and Portugal. International Journal of Selection and Assessment, 12(1‐2), 187-196.
Nikolaou, I., & Judge, T. A. (2007). Fairness reactions to personnel selection techniques in
Greece: The role of core self‐evaluations. International Journal of Selection and
Assessment, 15(2), 206-219.
Pajares, F., & Miller, M. D. (1994). Role of self-efficacy and self-concept beliefs in
mathematical problem solving: A path analysis. Journal of Educational Psychology,
86(2), 193-203.
Rand, T. M., & Wexley, K. N. (1975). Demonstration of the effect," similar to me," in simulated
employment interviews. Psychological Reports, 36(2), 535-544.
Purser, G. (2006). Waiting for work: An ethnography of a day labor agency. Institute for the
Study of Social Change. UC Berkeley: Institute for the Study of Societal Issues.
Phillips, J. M., & Gully, S. M. (1997). Role of goal orientation, ability, need for achievement,
and locus of control in the self-efficacy and goal-setting process. Journal of Applied
Psychology, 82(5), 792-802.
Phillips, J. M., & Gully, S. M. (2002). Fairness reactions to personnel selection techniques in
Singapore and the United States. International Journal of Human Resource
Management, 13(8), 1186-1205.
Pingatore, R., Dugoni, B. L., Tindale, R. S., & Spring, B. (1994). Bias against overweight job
applicants in a simulated employment interview. Journal of Applied Psychology, 79, 909-
917.
79
Polyhart, R. E. & Ryan, A. M. (1997). Toward an explanation of applicant reactions: An
examination of organizational justice and attribution frameworks. Organizational
Behavior and Human Decision Processes, 72(3), 308–335.
Premack, S. L., & Wanous, J. P. (1985). A meta-analysis of realistic job preview experiments.
Journal of Applied Psychology, 70(4), 706.
Priem, R. L., & Butler, J. E. (2001). Is the resource-based “view” a useful perspective for
strategic management research?. Academy of Management Review, 26(1), 22-40.
Rousseau, D. M. (1989). Psychological and implied contracts in organizations. Employee
Responsibilities and Rights Journal, 2(2), 121-139.
Rowe, P. M. (1989). Unfavorable information and interview decisions. In R. W. Eder, & G. R.
Ferris (Eds.), The employment interview: Theory, research, and practice (pp. 77-89).
Newbury Park, CA: Sage.
Ryan, A. M., & Polyhart, R. E. (2000). Applicants' perceptions of selection procedures and
decisions: A critical review and agenda for the future. Journal of Management, 26, 565-
606.
Rynes, S. L. (1989). Recruitment, job choice, and post-hire consequences: A call for new research
directions. CAHRS Working Paper Series, 398.
Rynes, S. L., & Barber, A. E. (1990). Applicant attraction strategies: An organizational
perspective. Academy of Management Review, 15(2), 286-310.
Rynes, S. L., & Connerley, M. L. (1993). Applicant reactions to alternative selection procedures.
Journal of Business and Psychology, 7(3), 261-277.
SHRM. (2014). SHRM Survey Findings: Résumés, Cover Letters and Interviews [PowerPoint
slides]. Retrieved from
80
http://www.shrm.org/research/surveyfindings/documents/shrm%202013%20survey%20fi
ndings_resume_v7%20(2).pptx
Siegel, P. A., Post, C., Brockner, J., Fishman, A. Y., & Garden, C. (2005). The moderating
influence of procedural fairness on the relationship between work-life conflict and
organizational commitment. Journal of Applied Psychology, 90(1), 13.
Silvester, J., Anderson, N., Haddleton, E., Cunningham-Snell, N., & Gibb, A. (2000). A cross-
modal comparison of telephone and face-to-face selection interviews in graduate
recruitment. International Journal of Selection and Assessment, 8, 16-21.
Skarlicki, D. P., Barclay, L. J., & Pugh, D. S. (2008). When explanations for layoffs are not enough:
Employer's integrity as a moderator of the relationship between informational justice and
retaliation. Journal of Occupational and Organizational Psychology, 81(1), 123-146.
Smither, J. W., Reilly, R. R., Millsap, R. E., Pearlman, K., & Stoffey, R. W. (1993). Applicant
reactions to selection procedures. Personnel Psychology, 46(1), 49-76.
Spence, M. (1973). Job market signalling. Quarterly Journal of Economics, 87, 355-374.
Steiner, D. D., & Gilliland, S. W. (1996). Fairness reactions to personnel selection techniques in
France and the United States. Journal of Applied Psychology, 81(2), 134.
Straus, S. G., Miles, J. A., & Levesque, L. L. (2001). The effects of videoconference, telephone,
and face-to-face media on interviewer and applicant judgments in employment interviews.
Journal of Management, 27(3), 363-381.
Suck, R., & Holling, H. (1997). Stress caused by waiting: A theoretical evaluation of a
mathematical model. Journal of Mathematical Psychology, 41, 280-286.
Thompson, D. A., Yarnold, P. R., Williams, D. R., & Adams, S. L. (1996). Effects of actual
waiting time, perceived waiting time, information delivery, and expressive quality on
81
patient satisfaction in the emergency department. Annals of Emergency Medicine, 28(6),
657-665.
Tom, G., & Lucey, S. (1997). A field study investigating the effect of waiting time on customer
satisfaction. The Journal of Psychology, 131(6), 655-660.
Turban, D. B. (2001). Organizational attractiveness as an employer on college campuses: An
examination of the applicant population. Journal of Vocational Behavior, 58(2), 293-312.
Turban, D. B., & Keon, T. L. (1993). Organizational attractiveness: An interactionist
perspective. Journal of Applied Psychology, 78(2), 184.
Turban, D. B., & Greening, D. W. (1997). Corporate social performance and organizational
attractiveness to prospective employees. Academy of Management Journal, 40(3), 658-
672.
Turban, D. B., Forret, M. L., & Hendrickson, C. L. (1998). Applicant attraction to firms:
Influences of organization reputation, job and organizational attributes, and recruiter
behaviors. Journal of Vocational Behavior, 52(1), 24-44.
Van Iddekinge, C. H., McFarland, L. A., & Raymark, P. H. (2007). Antecedents of impression
management use and effectiveness in a structured interview. Journal of
Management, 33(5), 752-773.
Wiesner, W. H., & Cronshaw, S. F. (1988). A meta‐analytic investigation of the impact of
interview format and degree of structure on the validity of the employment
interview. Journal of Occupational Psychology, 61(4), 275-290.
Zajacova, A., Lynch, S. M., & Espenshade, T. J. (2005). Self-efficacy, stress, and academic
success in college. Research in Higher Education, 46(6), 677-706.


![IN THE EMPLOYMENT RELATIONS AUTHORITY · 2018-06-05 · IN THE EMPLOYMENT RELATIONS AUTHORITY CHRISTCHURCH [2018] NZERA Christchurch 84 3001384 BETWEEN SHARYN PAYNE Applicant AND](https://img.pdfslide.net/doc/110x75/5f66b239ecc2531fab66e543/in-the-employment-relations-authority-2018-06-05-in-the-employment-relations-authority.jpg)