Embed Size (px)
Citation preview
Applicant’s Environmental Report –Operating License Renewal Stage
St. Lucie Units 1 & 2
Florida Power & Light Company
Docket Nos. 50-335 and 50-389
LICENSE RENEWAL APPLICATIONST. LUCIE UNITS 1 & 2
ENVIRONMENTAL REPORT Page i
TABLE OF CONTENTS
Section Page
1.0 INTRODUCTION.......................................................................................................1.1-11.1 Purpose of and Need for Action ................................................................................ 1.1-11.2 Environmental Scope and Methodology.................................................................... 1.2-11.3 St. Lucie Units 1 & 2 Licensee and Ownership ......................................................... 1.3-11.4 References................................................................................................................ 1.4-12.0 SITE AND ENVIRONMENTAL INTERFACES .........................................................2.1-12.1 Location and Features .............................................................................................. 2.1-12.2 Aquatic Ecological Communities ............................................................................... 2.2-1
2.2.1 Atlantic Ocean ............................................................................................2.2-12.2.2 Indian River Lagoon ...................................................................................2.2-3
2.3 Critical and Important Terrestrial Habitats................................................................. 2.3-12.4 Threatened or Endangered Species ......................................................................... 2.4-12.5 Regional Demography .............................................................................................. 2.5-1
2.5.1 Introduction.................................................................................................2.5-12.5.2 Minority and Low-income Populations........................................................2.5-4
2.5.2.1 Minority Populations ................................................................2.5-42.5.2.2 Low-income Populations..........................................................2.5-52.5.2.3 Migrant Farm Workers .............................................................2.5-9
2.6 Economic Base ......................................................................................................... 2.6-12.7 Taxes ........................................................................................................................ 2.7-12.8 Land Use Planning.................................................................................................... 2.8-1
2.8.1 Housing ......................................................................................................2.8-22.9 Social Services and Public Facilities ......................................................................... 2.9-1
2.9.1 Public Water Supply ...................................................................................2.9-12.9.2 Transportation ............................................................................................2.9-3
2.10 Historic and Archaeological Resources................................................................... 2.10-12.11 References.............................................................................................................. 2.11-13.0 PROPOSED ACTION ...............................................................................................3.1-13.1 General Plant Information ......................................................................................... 3.1-1
3.1.1 Reactor and Containment Systems............................................................3.1-33.1.2 Nuclear Fuel ...............................................................................................3.1-33.1.3 Cooling and Auxiliary Water Systems ........................................................3.1-3
3.1.3.1 Water Use Overview................................................................3.1-33.1.3.2 Cooling Water Systems ...........................................................3.1-43.1.3.3 Municipal Water Supply ...........................................................3.1-6
3.1.4 Power Transmission Systems ....................................................................3.1-63.2 Refurbishment Activities............................................................................................ 3.2-13.3 Programs and Activities for Managing the Effects of Aging....................................... 3.3-1
LICENSE RENEWAL APPLICATIONST. LUCIE UNITS 1 & 2
ENVIRONMENTAL REPORT Page ii
TABLE OF CONTENTS (Continued)
Section Page3.4 Employment .............................................................................................................. 3.4-1
3.4.1 Current Workforce ......................................................................................3.4-13.4.2 License Renewal Increment .......................................................................3.4-1
3.5 References................................................................................................................ 3.5-14.0 ENVIRONMENTAL CONSEQUENCES OF THE PROPOSED ACTION AND
MITIGATING ACTIONS............................................................................................4.1-14.1 Introduction ...............................................................................................................4.1-1
4.1.1 Category 1 License Renewal Issues ..........................................................4.1-24.1.2 Category 2 License Renewal Issues ..........................................................4.1-34.1.3 “NA” License Renewal Issues ....................................................................4.1-4
4.2 Entrainment of Fish and Shellfish in Early Life Stages.............................................. 4.2-14.3 Impingement of Fish and Shellfish ............................................................................ 4.3-14.4 Heat Shock................................................................................................................ 4.4-14.5 Impacts of Refurbishment on Terrestrial Resources ................................................. 4.5-14.6 Threatened or Endangered Species ......................................................................... 4.6-14.7 Air Quality During Refurbishment (Non-attainment or Maintenance Areas) .............. 4.7-14.8 Electric Shock from Transmission-line-induced Currents.......................................... 4.8-14.9 Housing Impacts ....................................................................................................... 4.9-14.10 Public Utilities: Public Water Supply Availability..................................................... 4.10-14.11 Education Impacts from Refurbishment .................................................................. 4.11-14.12 Offsite Land Use ..................................................................................................... 4.12-1
4.12.1 Refurbishment ..........................................................................................4.12-14.12.2 Offsite Land Use: License Renewal Term ...............................................4.12-2
4.13 Transportation ......................................................................................................... 4.13-14.14 Historic and Archaeological Resources................................................................... 4.14-14.15 Severe Accident Mitigation Alternatives .................................................................. 4.15-1
4.15.1 Methodology Overview.............................................................................4.15-14.15.2 Establishing the Base Case......................................................................4.15-3
4.15.2.1 Offsite Exposure Costs ..........................................................4.15-44.15.2.2 Offsite Economic Costs .........................................................4.15-54.15.2.3 Onsite Exposure Costs ..........................................................4.15-54.15.2.4 Onsite Economic Costs .........................................................4.15-74.15.2.5 Maximum Attainable Benefit ................................................4.15-10
4.15.3 SAMA Identification and Screening ........................................................4.15-104.15.3.1 Preliminary Screening..........................................................4.15-114.15.3.2 Final Screening/Cost-Benefit Analysis.................................4.15-11
4.15.4 Results ...................................................................................................4.15-134.16 Environmental Justice ............................................................................................. 4.16-14.17 References.............................................................................................................. 4.17-1
LICENSE RENEWAL APPLICATIONST. LUCIE UNITS 1 & 2
ENVIRONMENTAL REPORT Page iii
TABLE OF CONTENTS (Continued)
Section Page
5.0 ASSESSMENT OF NEW AND SIGNIFICANT INFORMATION ...............................5.0-15.1 References................................................................................................................ 5.1-16.0 SUMMARY OF LICENSE RENEWAL IMPACTS AND MITIGATING ACTIONS .....6.1-16.1 License Renewal Impacts ......................................................................................... 6.1-16.2 Mitigation................................................................................................................... 6.2-16.3 Unavoidable Adverse Impacts................................................................................... 6.3-16.4 Irreversible or Irretrievable Resource Commitments ................................................. 6.4-16.5 Short-term Use versus Long-term Productivity of the Environment........................... 6.5-16.6 References................................................................................................................ 6.6-17.0 ALTERNATIVES TO THE PROPOSED ACTION.....................................................7.0-17.1 No-action Alternative................................................................................................. 7.1-17.2 Alternatives That Meet System Generating Needs ................................................... 7.2-1
7.2.1 Alternatives Considered .............................................................................7.2-17.2.1.1 Build New Generating Capacity ...............................................7.2-17.2.1.2 Purchase Power ....................................................................7.2-117.2.1.3 Reduce Demand....................................................................7.2-12
7.2.2 Environmental Impacts of Alternatives .....................................................7.2-137.2.2.1 Coal-fired Generation ............................................................7.2-147.2.2.2 Oil-fired Generation ...............................................................7.2-227.2.2.3 Gas-fired Generation .............................................................7.2-287.2.2.4 Purchase Power ....................................................................7.2-33
7.3 References................................................................................................................ 7.3-18.0 COMPARISON OF ENVIRONMENTAL IMPACTS OF LICENSE RENEWAL
WITH THE ALTERNATIVES ....................................................................................8.0-18.1 References................................................................................................................ 8.1-19.0 STATUS OF COMPLIANCE.....................................................................................9.1-19.1 Proposed Action........................................................................................................ 9.1-1
9.1.1 General ......................................................................................................9.1-19.1.2 Threatened and Endangered Species Consultation ...................................9.1-19.1.3 Coastal Zone Management Program Compliance......................................9.1-89.1.4 Historic Preservation Consultation .............................................................9.1-89.1.5 Water Quality (401) Certification ................................................................9.1-8
9.2 Feasible Alternatives................................................................................................. 9.2-19.3 References................................................................................................................ 9.3-1
LICENSE RENEWAL APPLICATIONST. LUCIE UNITS 1 & 2
ENVIRONMENTAL REPORT Page iv
TABLE OF CONTENTS (Continued)
APPENDICES
Appendix A - Discussion of NRC License Renewal National Environmental Policy ActIssues
Appendix B - Clean Water Act Documentation
Appendix C - Threatened and Endangered Species Correspondence
Appendix D - Cultural Resources Correspondence
Appendix E - Severe Accident Mitigation Alternatives Analysis
Appendix F - Other Agency Correspondence
LICENSE RENEWAL APPLICATIONST. LUCIE UNITS 1 & 2
ENVIRONMENTAL REPORT Page v
LIST OF TABLES
Table Page
1.2-1 Environmental Report Responses to License RenewalEnvironmental Regulatory Requirements ............................................................... 1.2-2
2.4-1 Endangered, Threatened, or Special Concern Animal andPlant Species That May Occur at St. Lucie Units 1 & 2 or AlongAssociated Transmission Lines .............................................................................. 2.4-2
2.5-1 Populations and Annual Growth Rates in St. Lucie and Martin Countiesfrom 1980 to 2040 .................................................................................................. 2.5-3
2.5-2 Minority and Low-income Population Census Tracts.............................................. 2.5-62.7-1 St. Lucie Units 1 & 2 Contribution to County Property Tax Revenues.................... 2.7-12.9-1 Level of Service Definitions .................................................................................... 2.9-44.15-1 Estimated Present Dollar Value Equivalent for Severe Accident
Risk at St. Lucie Units 1 & 2 ............................................................................... 4.15-104.15-2 Disposition of SAMAs Related to St. Lucie Units 1 & 2 ...................................... 4.15-156.1-1 Environmental Impacts Related to License Renewal at St. Lucie Units 1 & 2 ........ 6.1-27.2-1 1991 Technical Feasibility Evaluation of FPL Generation Options ......................... 7.2-37.2-2 2000 Technical Feasibility Evaluation of FPL Generation Options ......................... 7.2-67.2-3 Coal-fired Generation Alternative ........................................................................... 7.2-77.2-4 Oil-fired Generation Alternative .............................................................................. 7.2-97.2-5 Gas-fired Generation Alternative .......................................................................... 7.2-107.2-6 Air Emissions from Coal-fired Generation Alternative........................................... 7.2-187.2-7 Air Emissions from Oil-fired Generation Alternative.............................................. 7.2-267.2-8 Air Emissions from Gas-fired Generation Alternative ........................................... 7.2-328.0-1 Impacts Comparison Summary .............................................................................. 8.0-28.0-2 Impacts Comparison Detail .................................................................................... 8.0-39.1-1 Environmental Authorizations for Current St. Lucie Units 1 & 2 Operations ........... 9.1-29.1-2 Environmental Authorizations for St. Lucie Units 1 & 2 License Renewal .............. 9.1-7
LICENSE RENEWAL APPLICATIONST. LUCIE UNITS 1 & 2
ENVIRONMENTAL REPORT Page vi
LIST OF FIGURES
Figure Page
2.1-1 St. Lucie Units 1 & 2, 50-mile Region ..................................................................... 2.1-22.1-2 St. Lucie Units 1 & 2, 6-mile Region....................................................................... 2.1-32.1-3 St. Lucie Units 1 & 2 Site Boundary........................................................................ 2.1-42.5-1 Black Minority Populations within 50 Miles of St. Lucie Units 1 & 2........................ 2.5-72.5.2 Low-income Population within 50 Miles of St. Lucie Units 1 & 2 ............................ 2.5-83.1-1 St. Lucie Units 1 & 2 Power Block Area.................................................................. 3.1-23.1-2 FPL St. Lucie Units 1 & 2 to Midway Transmission Corridor .................................. 3.1-77.2-1 Florida Utility Generation Capability and Utilization (1998)..................................... 7.2-27.2-2 FPL Generation Utilization (1998 and 2000) .......................................................... 7.2-27.2-3 FPL Demand-side Management (1993-2000) ...................................................... 7.2-12
LICENSE RENEWAL APPLICATIONST. LUCIE UNITS 1 & 2
ENVIRONMENTAL REPORT Page vii
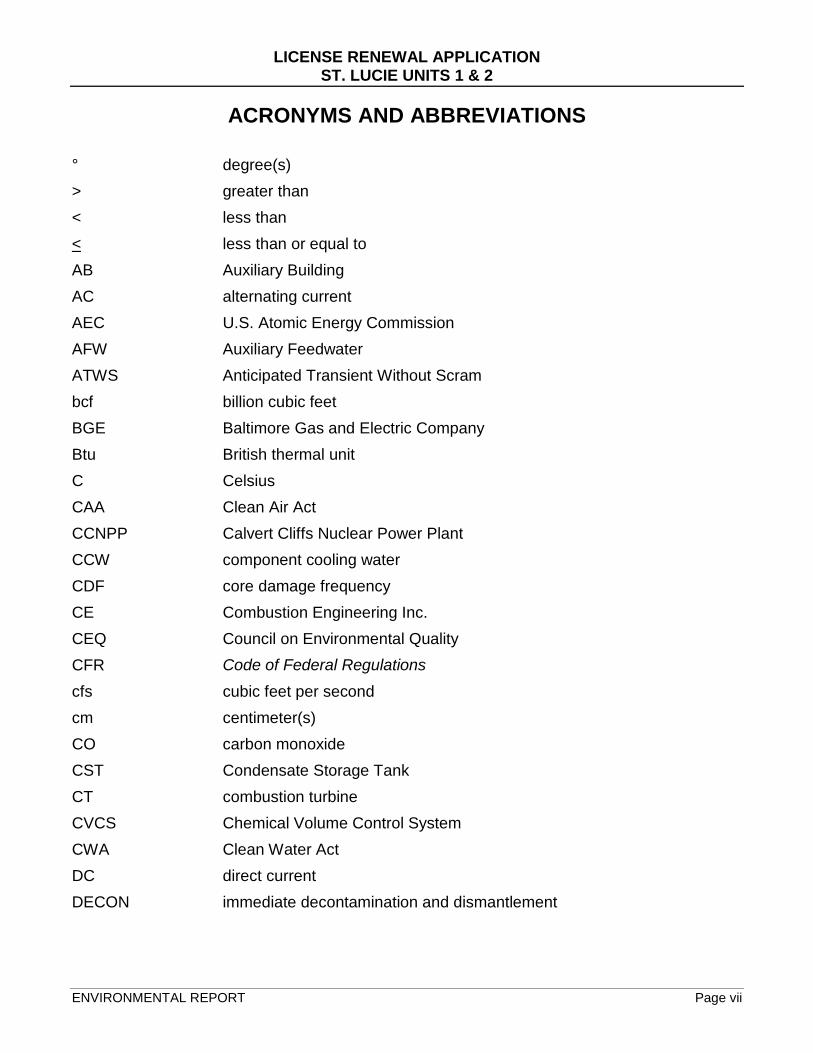
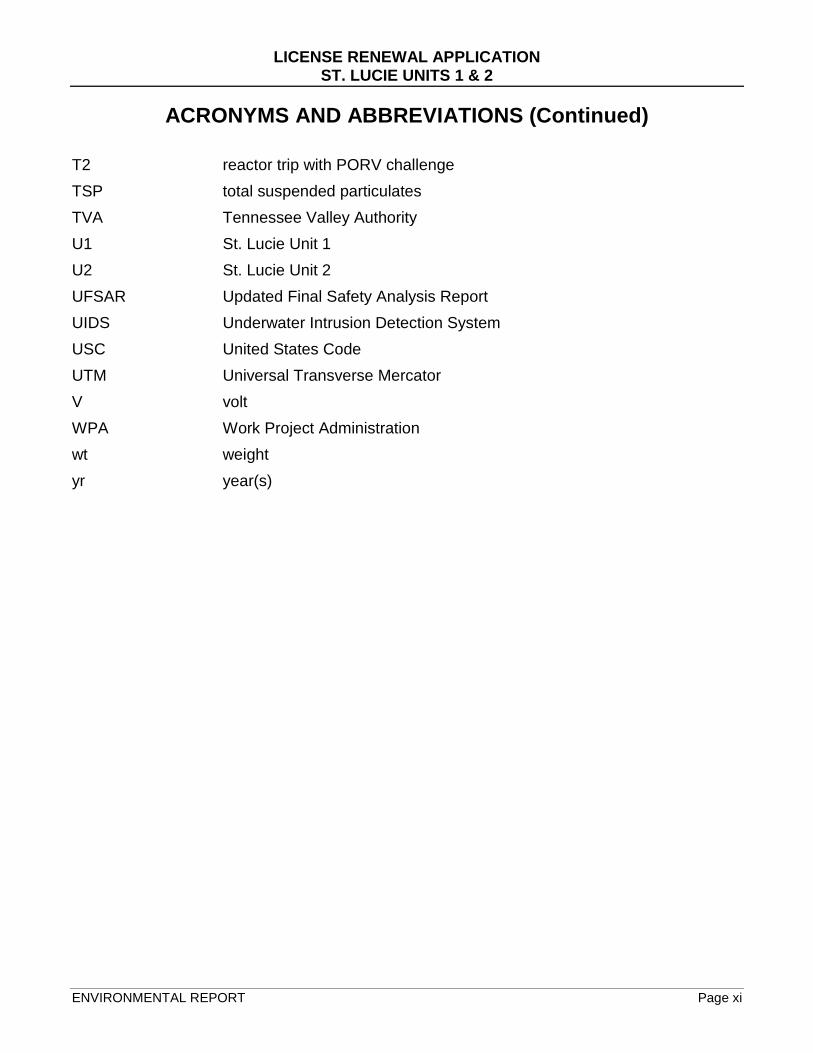
ACRONYMS AND ABBREVIATIONS
° degree(s)> greater than< less than< less than or equal toAB Auxiliary BuildingAC alternating currentAEC U.S. Atomic Energy CommissionAFW Auxiliary FeedwaterATWS Anticipated Transient Without Scrambcf billion cubic feetBGE Baltimore Gas and Electric CompanyBtu British thermal unitC CelsiusCAA Clean Air ActCCNPP Calvert Cliffs Nuclear Power PlantCCW component cooling waterCDF core damage frequencyCE Combustion Engineering Inc.CEQ Council on Environmental QualityCFR Code of Federal Regulationscfs cubic feet per secondcm centimeter(s)CO carbon monoxideCST Condensate Storage TankCT combustion turbineCVCS Chemical Volume Control SystemCWA Clean Water ActDC direct currentDECON immediate decontamination and dismantlement
LICENSE RENEWAL APPLICATIONST. LUCIE UNITS 1 & 2
ENVIRONMENTAL REPORT Page viii
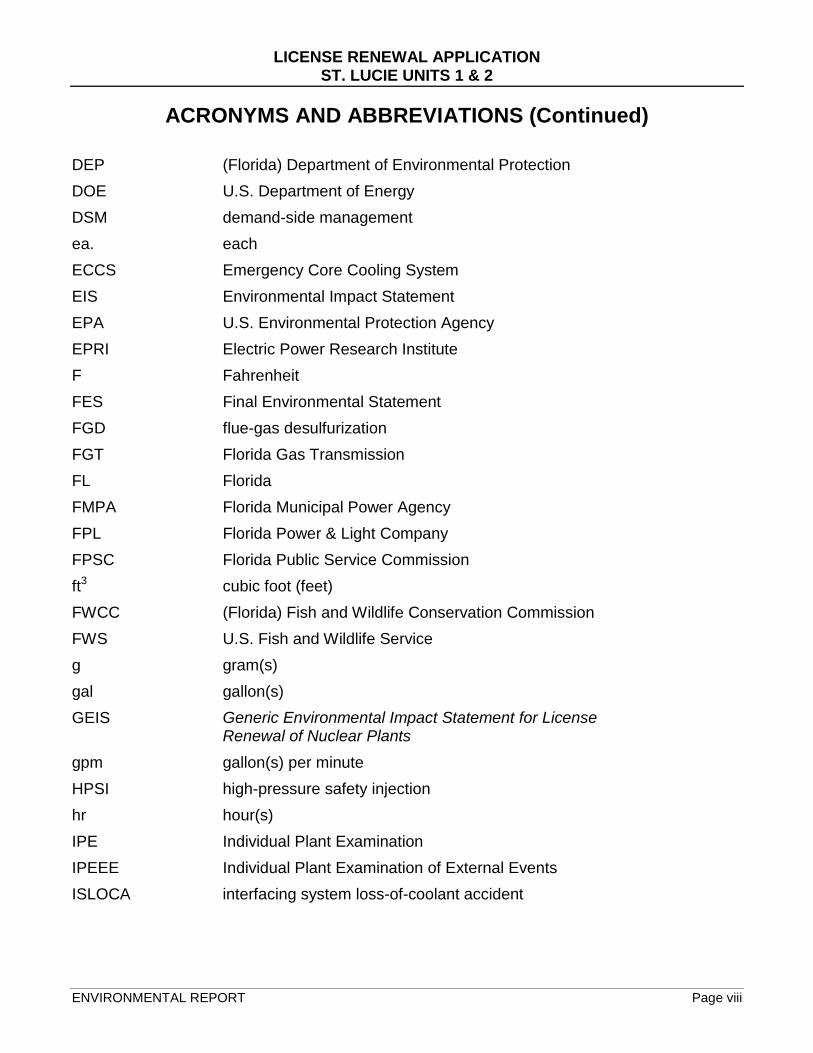
ACRONYMS AND ABBREVIATIONS (Continued)
DEP (Florida) Department of Environmental ProtectionDOE U.S. Department of EnergyDSM demand-side managementea. eachECCS Emergency Core Cooling SystemEIS Environmental Impact StatementEPA U.S. Environmental Protection AgencyEPRI Electric Power Research InstituteF FahrenheitFES Final Environmental StatementFGD flue-gas desulfurizationFGT Florida Gas TransmissionFL FloridaFMPA Florida Municipal Power AgencyFPL Florida Power & Light CompanyFPSC Florida Public Service Commissionft3 cubic foot (feet)FWCC (Florida) Fish and Wildlife Conservation CommissionFWS U.S. Fish and Wildlife Serviceg gram(s)gal gallon(s)GEIS Generic Environmental Impact Statement for License
Renewal of Nuclear Plantsgpm gallon(s) per minuteHPSI high-pressure safety injectionhr hour(s)IPE Individual Plant ExaminationIPEEE Individual Plant Examination of External EventsISLOCA interfacing system loss-of-coolant accident
LICENSE RENEWAL APPLICATIONST. LUCIE UNITS 1 & 2
ENVIRONMENTAL REPORT Page ix
ACRONYMS AND ABBREVIATIONS (Continued)
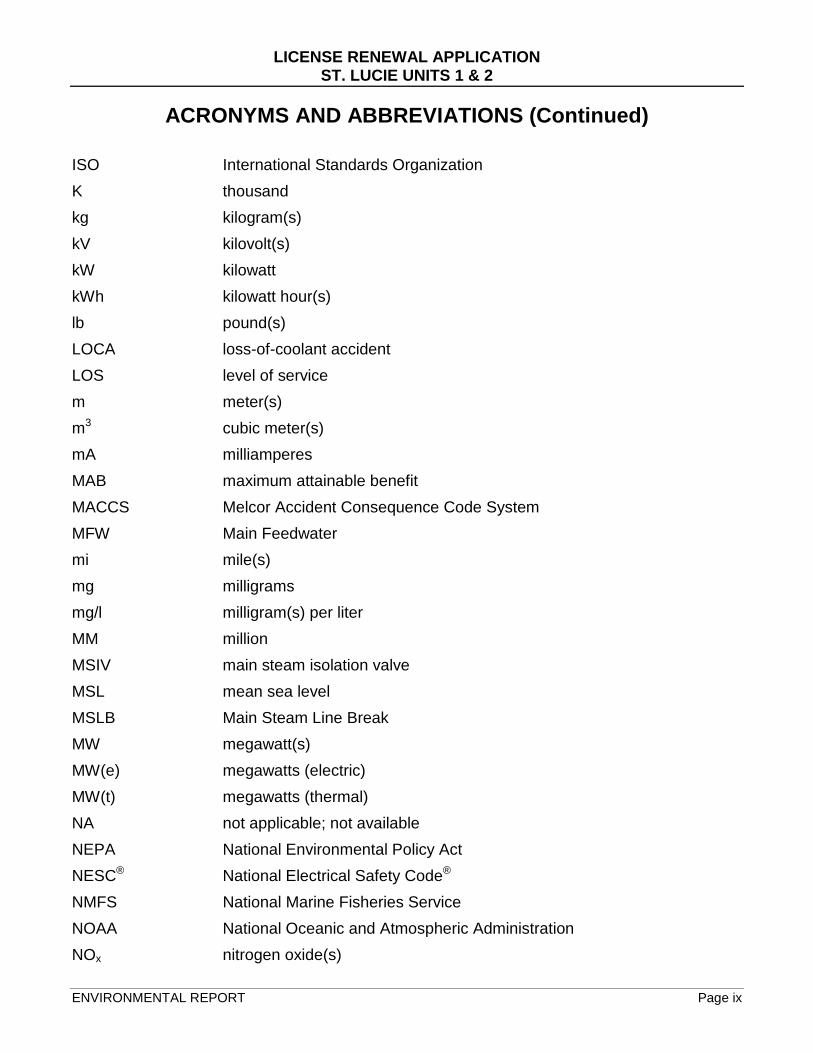
ISO International Standards OrganizationK thousandkg kilogram(s)kV kilovolt(s)kW kilowattkWh kilowatt hour(s)lb pound(s)LOCA loss-of-coolant accidentLOS level of servicem meter(s)m3 cubic meter(s)mA milliamperesMAB maximum attainable benefitMACCS Melcor Accident Consequence Code SystemMFW Main Feedwatermi mile(s)mg milligramsmg/l milligram(s) per literMM millionMSIV main steam isolation valveMSL mean sea levelMSLB Main Steam Line BreakMW megawatt(s)MW(e) megawatts (electric)MW(t) megawatts (thermal)NA not applicable; not availableNEPA National Environmental Policy ActNESC® National Electrical Safety Code®
NMFS National Marine Fisheries ServiceNOAA National Oceanic and Atmospheric AdministrationNOx nitrogen oxide(s)
LICENSE RENEWAL APPLICATIONST. LUCIE UNITS 1 & 2
ENVIRONMENTAL REPORT Page x
ACRONYMS AND ABBREVIATIONS (Continued)
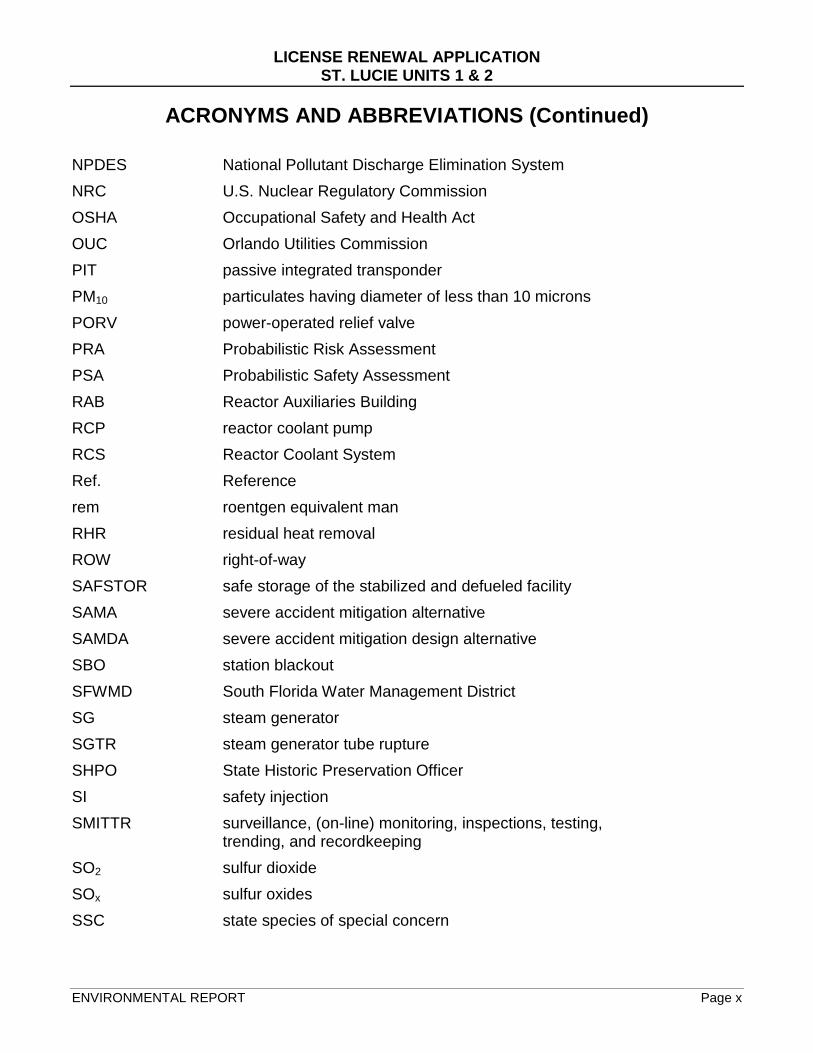
NPDES National Pollutant Discharge Elimination SystemNRC U.S. Nuclear Regulatory CommissionOSHA Occupational Safety and Health ActOUC Orlando Utilities CommissionPIT passive integrated transponderPM10 particulates having diameter of less than 10 micronsPORV power-operated relief valvePRA Probabilistic Risk AssessmentPSA Probabilistic Safety AssessmentRAB Reactor Auxiliaries BuildingRCP reactor coolant pumpRCS Reactor Coolant SystemRef. Referencerem roentgen equivalent manRHR residual heat removalROW right-of-waySAFSTOR safe storage of the stabilized and defueled facilitySAMA severe accident mitigation alternativeSAMDA severe accident mitigation design alternativeSBO station blackoutSFWMD South Florida Water Management DistrictSG steam generatorSGTR steam generator tube ruptureSHPO State Historic Preservation OfficerSI safety injectionSMITTR surveillance, (on-line) monitoring, inspections, testing,
trending, and recordkeepingSO2 sulfur dioxideSOx sulfur oxidesSSC state species of special concern
LICENSE RENEWAL APPLICATIONST. LUCIE UNITS 1 & 2
ENVIRONMENTAL REPORT Page xi
ACRONYMS AND ABBREVIATIONS (Continued)
T2 reactor trip with PORV challengeTSP total suspended particulatesTVA Tennessee Valley AuthorityU1 St. Lucie Unit 1U2 St. Lucie Unit 2UFSAR Updated Final Safety Analysis ReportUIDS Underwater Intrusion Detection SystemUSC United States CodeUTM Universal Transverse MercatorV voltWPA Work Project Administrationwt weightyr year(s)
LICENSE RENEWAL APPLICATIONST. LUCIE UNITS 1 & 2
CHAPTER 1.0 INTRODUCTION Page 1.1-1
1.0 INTRODUCTION
1.1 PURPOSE OF AND NEED FOR ACTIONThe U.S. Nuclear Regulatory Commission (NRC) licenses the operation of domestic nuclearpower plants in accordance with the Atomic Energy Act and NRC implementing regulations.Florida Power & Light Company (FPL) operates St. Lucie Units 1 & 2 pursuant to NRCOperating Licenses DPR-67 and NPF-16, respectively. The Unit 1 license will expireMarch 1, 2016, and the Unit 2 license will expire April 6, 2023. FPL has prepared thisenvironmental report in connection with its application to the NRC to renew the St. LucieUnits 1 & 2 licenses, as provided for by the following NRC regulations:
• Title 10, Energy, Code of Federal Regulations, Part 54, Requirements for Renewal ofOperating Licenses for Nuclear Power Plants, Section 54.23, Contents ofApplication—Environmental Information (10 CFR 54.23); and
• Title 10, Energy, Code of Federal Regulations, Part 51, Environmental ProtectionRegulations for Domestic Licensing and Related Regulatory Functions, Section51.53, Postconstruction Environmental Reports, Subsection 51.53(c), OperatingLicense Renewal Stage [10 CFR 51.53(c)].
The NRC’s regulations at 10 CFR 54.17(c) state that an application for a renewed licensemay not be submitted earlier than 20 years before the current operating license for a unitexpires. However, FPL has obtained an exemption from this requirement for St. Lucie Unit 2license renewal (Ref. 1.1-1), in accordance with provisions of 10 CFR 54.15. Therefore, aswith other portions of this application, this environmental report addresses both of the St.Lucie Units.
The NRC has defined the purpose and need for the proposed action, the renewal of theoperating licenses for nuclear power plants such as St. Lucie Units 1 & 2, as follows:
...The purpose and need for the proposed action (renewal of an operating license) is toprovide an option that allows for power generation capability beyond the term of acurrent nuclear power plant operating license to meet future system generating needs,as such needs may be determined by State, utility, and, where authorized, Federal(other than NRC) decision makers.... (Ref. 1.1-2, page 28472).
The renewed operating licenses would allow 20 additional years of plant operation beyondthe current St. Lucie Units 1 & 2 licensed operating periods of 40 years.
LICENSE RENEWAL APPLICATIONST. LUCIE UNITS 1 & 2
CHAPTER 1.0 INTRODUCTION Page 1.2-1
1.2 ENVIRONMENTAL SCOPE AND METHODOLOGYNRC regulations for domestic licensing of nuclear power plants require environmentalreview of applications to renew operating licenses. The NRC regulation 10 CFR 51.53(c)requires that an applicant for license renewal submit with its application a separatedocument entitled Applicant’s Environmental Report - Operating License Renewal Stage. Indetermining what information to include in the St. Lucie Units 1 & 2 environmental report,FPL has relied on NRC regulations and the following supporting documents that provideadditional insight into the regulatory requirements:
• NRC supplemental information in the Federal Register (Ref. 1.1-2; Ref. 1.2-1; Ref.1.2-2; Ref. 1.2-3)
• Generic Environmental Impact Statement for License Renewal of Nuclear Plants(GEIS) (Ref. 1.2-4; Ref. 1.2-5)
• Regulatory Analysis for Amendments to Regulations for the Environmental Reviewfor Renewal of Nuclear Power Plant Operating Licenses (Ref. 1.2-6)
• Public Comments on the Proposed 10 CFR Part 51 Rule for Renewal of NuclearPower Plant Operating Licenses and Supporting Documents: Review of Concernsand NRC Staff Response (Ref. 1.2-7)
FPL has prepared Table 1.2-1 to verify conformance with regulatory requirements. Table1.2-1 indicates where the environmental report responds to each requirement of 10 CFR51.53(c). In addition, each responsive section is prefaced by a boxed quote of theregulatory language and applicable supporting document language.
LICENSE RENEWAL APPLICATIONST. LUCIE UNITS 1 & 2
CHAPTER 1.0 INTRODUCTION Page 1.2-2
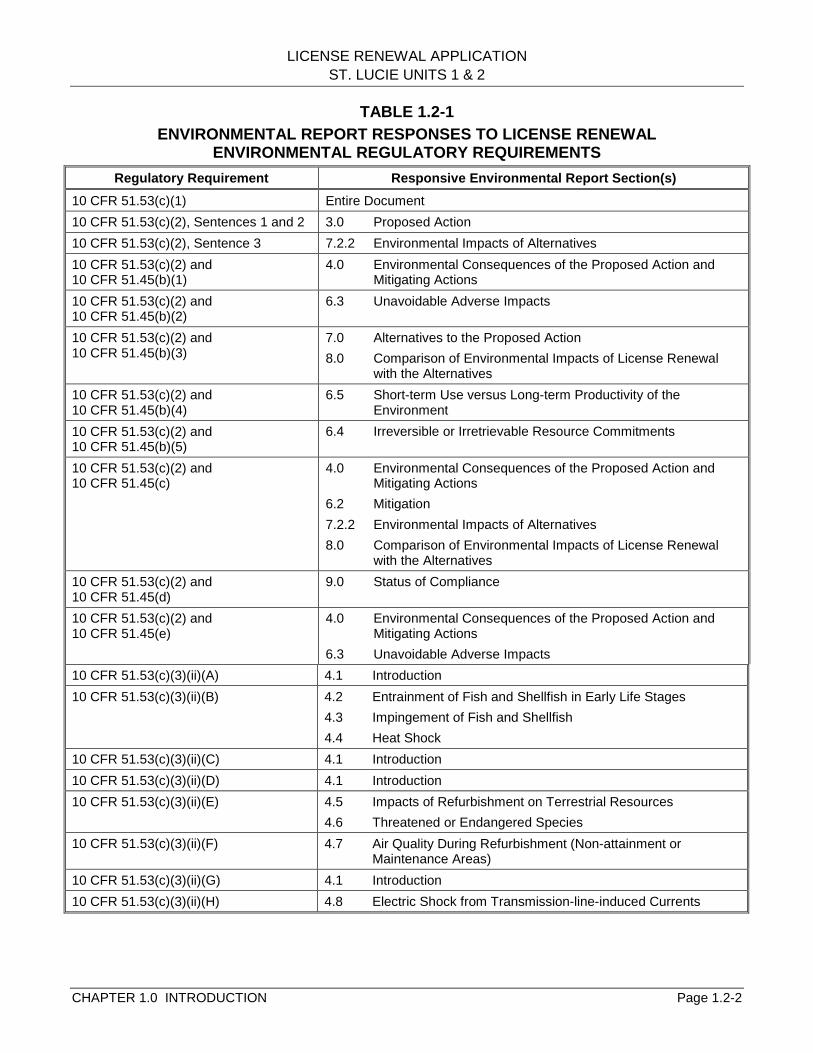
TABLE 1.2-1ENVIRONMENTAL REPORT RESPONSES TO LICENSE RENEWAL
ENVIRONMENTAL REGULATORY REQUIREMENTSRegulatory Requirement Responsive Environmental Report Section(s)
10 CFR 51.53(c)(1) Entire Document10 CFR 51.53(c)(2), Sentences 1 and 2 3.0 Proposed Action10 CFR 51.53(c)(2), Sentence 3 7.2.2 Environmental Impacts of Alternatives10 CFR 51.53(c)(2) and10 CFR 51.45(b)(1)
4.0 Environmental Consequences of the Proposed Action and Mitigating Actions
10 CFR 51.53(c)(2) and10 CFR 51.45(b)(2)
6.3 Unavoidable Adverse Impacts
10 CFR 51.53(c)(2) and10 CFR 51.45(b)(3)
7.0 Alternatives to the Proposed Action8.0 Comparison of Environmental Impacts of License Renewal
with the Alternatives10 CFR 51.53(c)(2) and10 CFR 51.45(b)(4)
6.5 Short-term Use versus Long-term Productivity of the Environment
10 CFR 51.53(c)(2) and10 CFR 51.45(b)(5)
6.4 Irreversible or Irretrievable Resource Commitments
10 CFR 51.53(c)(2) and10 CFR 51.45(c)
4.0 Environmental Consequences of the Proposed Action and Mitigating Actions
6.2 Mitigation7.2.2 Environmental Impacts of Alternatives8.0 Comparison of Environmental Impacts of License Renewal
with the Alternatives10 CFR 51.53(c)(2) and10 CFR 51.45(d)
9.0 Status of Compliance
10 CFR 51.53(c)(2) and10 CFR 51.45(e)
4.0 Environmental Consequences of the Proposed Action and Mitigating Actions
6.3 Unavoidable Adverse Impacts10 CFR 51.53(c)(3)(ii)(A) 4.1 Introduction10 CFR 51.53(c)(3)(ii)(B) 4.2 Entrainment of Fish and Shellfish in Early Life Stages
4.3 Impingement of Fish and Shellfish4.4 Heat Shock
10 CFR 51.53(c)(3)(ii)(C) 4.1 Introduction10 CFR 51.53(c)(3)(ii)(D) 4.1 Introduction10 CFR 51.53(c)(3)(ii)(E) 4.5 Impacts of Refurbishment on Terrestrial Resources
4.6 Threatened or Endangered Species10 CFR 51.53(c)(3)(ii)(F) 4.7 Air Quality During Refurbishment (Non-attainment or
Maintenance Areas)10 CFR 51.53(c)(3)(ii)(G) 4.1 Introduction10 CFR 51.53(c)(3)(ii)(H) 4.8 Electric Shock from Transmission-line-induced Currents
LICENSE RENEWAL APPLICATIONST. LUCIE UNITS 1 & 2
CHAPTER 1.0 INTRODUCTION Page 1.2-3
TABLE 1.2-1 (continued)ENVIRONMENTAL REPORT RESPONSES TO LICENSE RENEWAL
ENVIRONMENTAL REGULATORY REQUIREMENTSRegulatory Requirement Responsive Environmental Report Section(s)
10 CFR 51.53(c)(3)(ii)(I) 4.9 Housing Impacts4.10 Public Utilities: Public Water Supply Availability4.11 Education Impacts from Refurbishment4.12 Offsite Land Use
10 CFR 51.53(c)(3)(ii)(J) 4.13 Transportation10 CFR 51.53(c)(3)(ii)(K) 4.14 Historic and Archaeological Resources10 CFR 51.53(c)(3)(ii)(L) 4.15 Severe Accident Mitigation Alternatives10 CFR 51.53(c)(3)(iii) 4.0 Environmental Consequences of the Proposed Action
and Mitigating Actions6.2 Mitigation
10 CFR 51.53(c)(3)(iv) 5.0 Assessment of New and Significant Information10 CFR 51, Appendix B,Table B-1, Footnote 6
4.16 Environmental Justice
LICENSE RENEWAL APPLICATIONST. LUCIE UNITS 1 & 2
CHAPTER 1.0 INTRODUCTION Page 1.3-1
1.3 ST. LUCIE UNITS 1 & 2 LICENSEE AND OWNERSHIPSt. Lucie Unit 1 is owned by FPL. St. Lucie Unit 2 is co-owned by FPL, Orlando UtilitiesCommission (OUC), and Florida Municipal Power Agency (FMPA). Together, OUC andFMPA own 14.9 percent of St. Lucie Unit 2. FPL built St. Lucie Units 1 & 2 and has hadsole responsibility for operation of the Units since March 1, 1976, and April 6, 1983,respectively.
LICENSE RENEWAL APPLICATIONST. LUCIE UNITS 1 & 2
CHAPTER 1.0 INTRODUCTION Page 1.4-1
1.4 REFERENCES
1.1-1 Jabbour, K.N. (NRC) Letter to T.F. Plunkett (FPL). St. Lucie Plant, Unit No. 2,Exemption from the Requirements of 10 CFR 54.17, Section 54.17 (c) RegardingSchedule for License Renewal Application (TAC No. MB0418).” February 27,2001.
1.1-2 U.S. Nuclear Regulatory Commission. “Environmental Review for Renewal ofNuclear Power Plant Operating Licenses.” Federal Register. Vol. 61, No. 109.(June 5, 1996): 28467-97.
1.2-1 U.S. Nuclear Regulatory Commission. “Environmental Review for Renewal ofNuclear Power Plant Operating Licenses; Correction.” Federal Register. Vol. 61,No. 147. (July 30, 1996): 39555-6.
1.2-2 U.S. Nuclear Regulatory Commission. “Environmental Review for Renewal ofNuclear Power Plant Operating Licenses.” Federal Register. Vol. 61, No. 244.(December 18, 1996): 66537-54.
1.2-3 U.S. Nuclear Regulatory Commission. “Changes to Requirements forEnvironmental Review for Renewal of Nuclear Power Plant Operating Licenses;Final Rules.” Federal Register. Vol. 64, No. 171. (September 3, 1999): 48496-507.
1.2-4 U.S. Nuclear Regulatory Commission. Generic Environmental Impact Statementfor License Renewal of Nuclear Plants. NUREG-1437. Office of NuclearRegulatory Research. Washington, D.C. May 1996.
1.2-5 U.S. Nuclear Regulatory Commission. Generic Environmental Impact Statementfor License Renewal of Nuclear Plants. Section 6.3, “Transportation,” and Table9-1, “Summary of Findings on NEPA Issues for License Renewal of NuclearPower Plants.” NUREG-1437, Vol. 1, Addendum 1. Office of Nuclear ReactorRegulation. Washington, D.C. August 1999.
1.2-6 U.S. Nuclear Regulatory Commission. Regulatory Analysis for Amendments toRegulations for the Environmental Review for Renewal of Nuclear Power PlantOperating Licenses. NUREG-1440. Office of Nuclear Regulatory Research.Washington, D.C. May 1996.
1.2-7 U.S. Nuclear Regulatory Commission. Public Comments on the Proposed 10CFR Part 51 Rule for Renewal of Nuclear Power Plant Operating Licenses andSupporting Documents: Review of Concerns and NRC Staff Response.NUREG-1529. Office of Nuclear Regulatory Research. Washington, D.C.May 1996.
LICENSE RENEWAL APPLICATIONST. LUCIE UNITS 1 & 2
CHAPTER 2.0 SITE AND ENVIRONMENTAL INTERFACES Page 2.1-1
2.0 SITE AND ENVIRONMENTAL INTERFACES
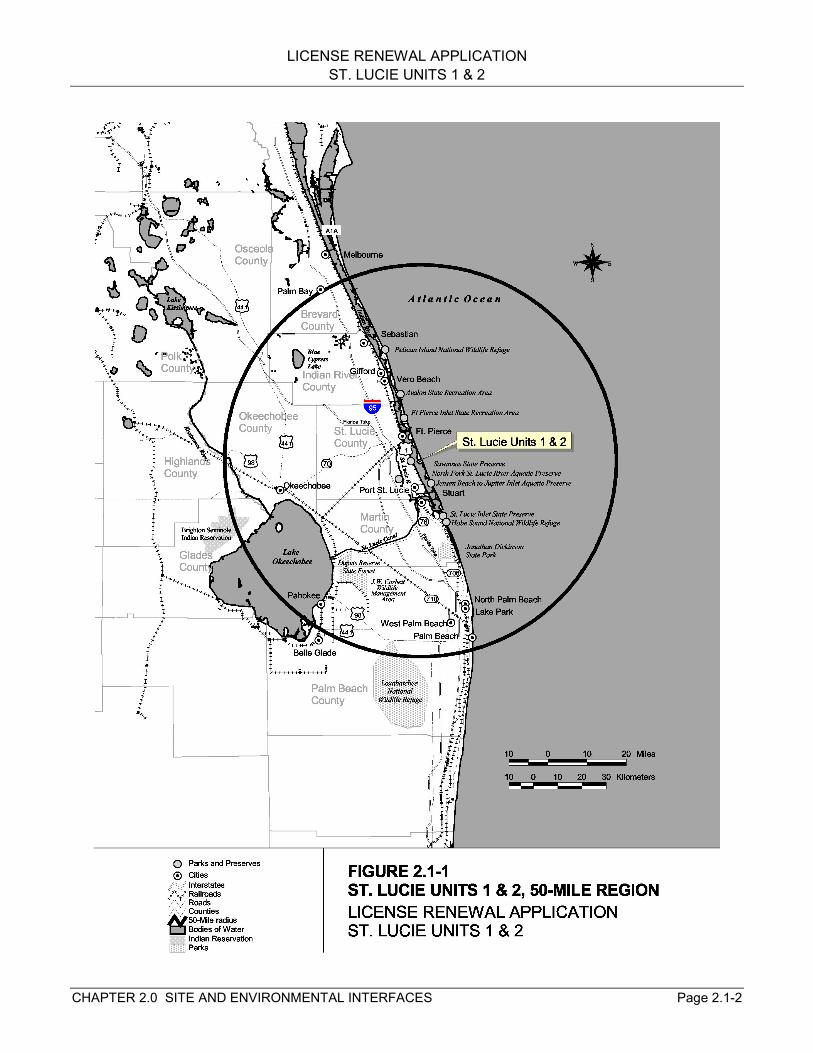
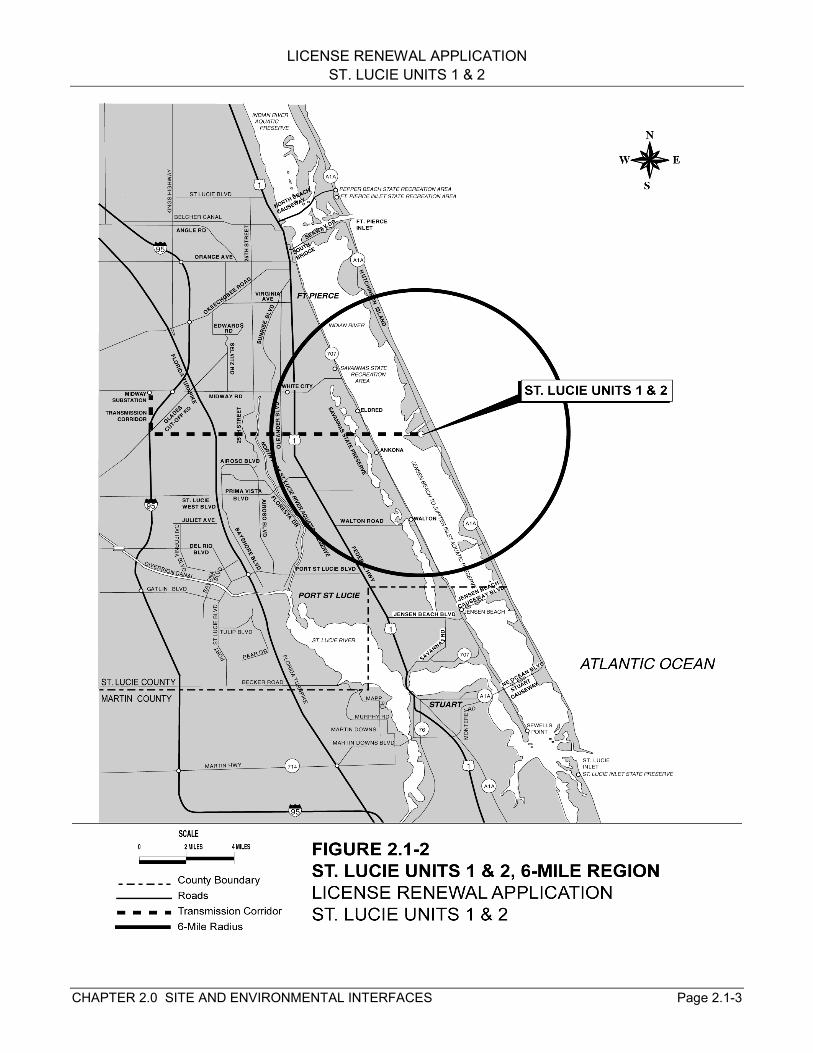
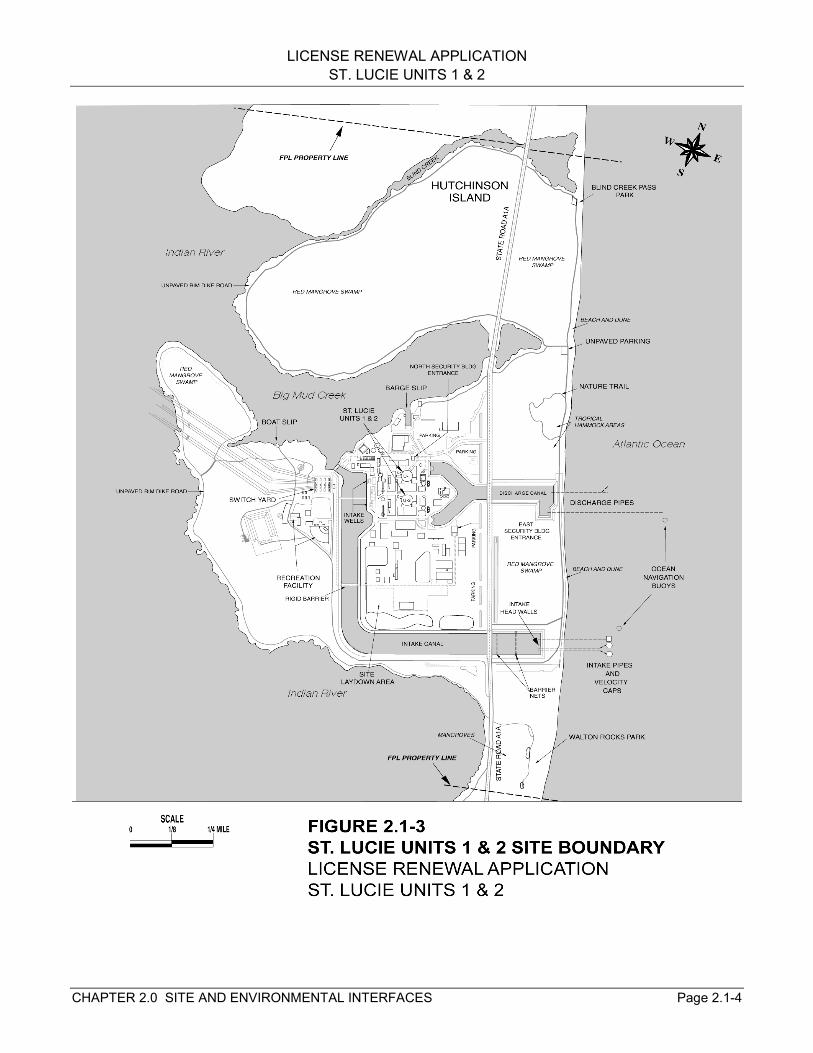
2.1 LOCATION AND FEATURESFlorida Power & Light Company’s (FPL’s) St. Lucie Units 1 & 2 are located on HutchinsonIsland in St. Lucie County, Florida. The site is in Sections 8, 9, 15, 16, and 17, Township 36South, Range 41 East. The nearest municipalities are Fort Pierce, approximately sevenmiles northwest of the plant; Port St. Lucie, approximately four and a half miles to the west;and Stuart, approximately eight miles to the south. Port St. Lucie is the largest city within 50miles of St. Lucie Units 1 & 2. State Road A1A provides road access to the plant andtransverses FPL property in a north-south direction approximately 1,000 feet east of St.Lucie Units 1 & 2 (Ref. 2.1-1, Section 2.1.1). Figures 2.1-1 and 2.1-2 show the site locationand features within 50 and 6 miles, respectively. Figure 2.1-3 shows the site boundary inrelation to the powerblock and adjacent features. The exclusion area for the plant, asdefined in 10 CFR 100.3, corresponds to the area within 0.97 miles of the reactors and lieswithin the FPL property boundary (Ref. 2.1-1, Section 2.1.1).
The St. Lucie Units 1 & 2 site consists of approximately 1,130 acres of land on the widestsection of Hutchinson Island in an area previously degraded by mosquito control projects.The plant site is bordered by the Atlantic Ocean to the east and the Indian River Lagoon tothe west. The topography of the site is generally flat. The most prominent topographicfeature of the site is the grade for State Road A1A, which passes through the easternportion of FPL property. Between the dunes and State Road A1A, the principal feature is aseries of mangrove-dominated mosquito impoundments interspersed with islands of naturalcoastal strand vegetation. St. Lucie Units 1 & 2 are located on the west side of State RoadA1A in a relatively flat, sheltered area of the island. West of the facility, the land graduallyslopes downward to a mangrove fringe bordering the intertidal shoreline of the Indian RiverLagoon. East of the facility, land rises from the ocean shore to form dunes and ridgesapproximately 15 feet above mean low water (Ref. 2.1-2, Section 2.1). Two county parkswith beach access, Blind Creek Pass Park and Walton Rocks Park, lie within the St. LucieUnits 1 & 2’s property boundary. Recreational facilities for FPL employees and their familiesare also available within the site’s property boundary (Ref. 2.1-1, Section 2.1.1).
The Indian River Lagoon is a long, shallow, tidally influenced estuary stretching alongFlorida’s central east coast between the mainland and a series of offshore islands. At St.Lucie Units 1 & 2, the Indian River Lagoon is approximately 7,200 feet wide (Ref. 2.1-3,Section II-A). Blind Creek and Big Mud Creek, inlets off the Indian River Lagoon, areadjacent to the site. The stretch of lagoon adjacent to the site is designated as the JensenBeach to Jupiter Inlet Aquatic Preserve. The North Fork St. Lucie River Aquatic Preserve islocated on the north fork of the river as it parallels the coast north of where it flows into theSt. Lucie River at Port St. Lucie. The St. Lucie Canal connects the St. Lucie River with LakeOkeechobee and parallels State Route 76, south of Stuart.
LICENSE RENEWAL APPLICATIONST. LUCIE UNITS 1 & 2
CHAPTER 2.0 SITE AND ENVIRONMENTAL INTERFACES Page 2.1-2
LICENSE RENEWAL APPLICATIONST. LUCIE UNITS 1 & 2
CHAPTER 2.0 SITE AND ENVIRONMENTAL INTERFACES Page 2.1-3
LICENSE RENEWAL APPLICATIONST. LUCIE UNITS 1 & 2
CHAPTER 2.0 SITE AND ENVIRONMENTAL INTERFACES Page 2.1-4
LICENSE RENEWAL APPLICATIONST. LUCIE UNITS 1 & 2
CHAPTER 2.0 SITE AND ENVIRONMENTAL INTERFACES Page 2.1-5
Fort Pierce Inlet State Recreation Area is approximately nine miles north of St. Lucie Units 1 & 2immediately north of the Fort Pierce Inlet (see Figure 2.1-2). Activities include beach access,swimming, picnicking, camping, and hiking (Ref. 2.1-4). Other state recreation areas include Avalon,Savannas, and Pepper Beach. The Savannas State Preserve, a freshwater lagoon, is located on themainland approximately two miles west of St. Lucie Units 1 & 2, and offers fishing, hiking, picnicking,and other outdoor related activities (Ref. 2.1-5). Other prominent features within 50 miles of St. LucieUnits 1 & 2 include Lake Okeechobee, Blue Cypress Lake, Jonathan Dickinson State Park, the DupuisReserve State Forest, J. W. Corbett Wildlife Management Area, portions of the Brighton SeminoleIndian Reservation, and the Hobe Sound, Pelican Island, and Loxahatchee National Wildlife Refuges(see Figure 2.1-1).
Section 3.1 describes the major features of St. Lucie Units 1 & 2, including reactor and containmentsystems; fuel configuration and refueling activities; cooling and auxiliary water systems; and powertransmission systems.
LICENSE RENEWAL APPLICATIONST. LUCIE UNITS 1 & 2
CHAPTER 2.0 SITE AND ENVIRONMENTAL INTERFACES Page 2.2-1
2.2 AQUATIC ECOLOGICAL COMMUNITIESThe St. Lucie Units 1 & 2 location on Hutchinson Island places it between two major aquaticecosystems: the Atlantic Ocean to the east and the Indian River Lagoon to the west. Theplant uses a once-through cooling water system that withdraws from and discharges into theAtlantic Ocean via offshore intake and discharge structures. The plant is also equipped withan emergency cooling water intake that can withdraw water from the Indian River Lagoonvia Big Mud Creek but this pathway is closed during normal operation (see Section 3.1.3).These areas contain markedly different habitats and biotic communities, as discussedbelow.
2.2.1 ATLANTIC OCEAN
Submerged coquinoid rock formations parallel much of Hutchinson Island. A notable beachfrontage feature at the plant site, just south of the St. Lucie Units 1 & 2 Intake Canal, is anintertidal coquina-rock formation that protrudes through the sand at Walton Rocks Park.The hard substrate is colonized extensively by an encrusting tube-building polychaete worm.These worm rock communities in turn support a rich and diverse association of otherinvertebrates, algae, and fishes. Several studies of the worm rock communities wereconducted at Walton Rocks Park. Studies performed to support the early operations ofSt. Lucie Unit 1 indicated that thermal effluents did not significantly alter the speciescomposition of the worm rock communities.
The near shore area has no reef structures, grass beds, or rock outcroppings. Seaward, theocean floor consists of unconsolidated sediments composed of quartz and calcareoussands, broken shell fragments, and negligible amounts of silts and clays. The sea floorgently slopes into a trough with a maximum depth of about 39 feet at about one nautical mileoffshore. Continuing offshore, the sea floor rises to form the Pierce Shoal at about twomiles.
The marine communities in the vicinity of St. Lucie Units 1 & 2 were studied in detail prior tostartup of Unit 1 in 1976 (Ref. 2.1-2, Section 2.7.5). Phytoplankton were collected at fivelocations offshore of Hutchinson Island. Densities ranged from 1.0 to 35,532.9 cells/literduring the study period, but varied little from location to location. The community wasdominated by diatoms, the most common of which were the genera Nitzschia, Bellerochea,and Chaetoceros, and the species Thalassionema nitzschioides and Skeletonemacostatum. The data indicated the possibility of two blooms per year, one in September-October and one in January. Chlorophyll a concentrations ranged from 0.08 to 7.7 mg/m3
and correlated well with the September-October phytoplankton bloom. The composition ofthe phytoplankton communities was typical of those described for other nearshore areasalong the eastern seaboard of the United States.
Zooplankton were sampled at the same locations as phytoplankton, and ranged in densityfrom 244 to 12,023 organisms/m3. The zooplankton community was characterized primarilyby neritic holoplanktonic species (species that spend their entire life cycle in the watercolumn). Copepods dominated the collections with the genera Acartia, Paracalamis,Oithona, Temora, Undinula, Corycaeus, Euterpina, and Labidocera being common.Zooplankton density appeared to be broadly correlated with phytoplankton density.
LICENSE RENEWAL APPLICATIONST. LUCIE UNITS 1 & 2
CHAPTER 2.0 SITE AND ENVIRONMENTAL INTERFACES Page 2.2-2
Baseline monitoring established that there were three sub-tidal microhabitats offshore of theplant: shallow beach terrace, offshore shoal, and a deeper trough in between the two.Sediment composition differed among these zones. The biological composition ofmacroinvertebrate communities is largely influenced by sediment composition. Because ofthe sediment heterogeneity, the trough supports the most abundant fauna. It wascharacterized by high diversity and relatively rapid turnover of less abundant and moretransient species. In the intertidal zone, the worm reef community provided yet anotherdistinct habitat for macroinvertebrates. Patterns of fish abundance and diversity were alsolargely aligned along microhabitat boundaries. In addition to the habitats identified above,the surf zone harbored yet another distinct assemblage of fish.
Baseline studies identified 127 species of arthropods and nearly 300 species of mollusks.The diverse makeup of these groups, and to some extent their seasonal variability, wasattributed to the transitional temperate, sub-tropical, and tropical mix of climate and watermasses in the general vicinity of Hutchinson Island. Some estuarine affinities were alsonoted and attributed to water mass intrusions from the Indian River Lagoon by way of St.Lucie Inlet and prevailing northerly coastal currents. Among species of direct commercialvalue, the calico scallop was the only mollusk recorded. Arthropods of potential commercialvalue included penaeid shrimp and the blue crab. However, these species were generallycollected in small numbers and infrequently.
Benthic studies were conducted through 1984 and produced remarkable databases forregional sediments, hydrology, and bottom dwelling organisms. A total of 934 taxa ofbenthic macroinvertebrates, many species new to science, were identified by the monitoring.The sediment, water quality, and biological data show that the combined operations of St.Lucie Units 1 & 2 had little impact on benthic environments in the vicinity of the dischargediffusers and within the boundaries of the thermal plume.
The fish communities offshore are transitional assemblages of temperate and tropical forms.Since oceanic icthyofauna are most diverse and abundant near reefs and other hard-bottomareas, FPL sited intake and discharge structures for St. Lucie Units 1 & 2 in areas devoid ofthese habitats.
Multi-year fisheries assessments were carried out in association with startup and operationsof St. Lucie Units 1 & 2. Bottom trawls were used for several years, but produced few fish(Ref. 2.1-2, Section 2.7.5). For example, sampling every other month at five HutchinsonIsland offshore locations from September 1971 to March 1972 produced only 39 individualfish among 13 species. The sheepshead (Archosargus probatocephalus) was mostabundant in this small catch. Beach seines were deployed over this same time period.Ninety-eight percent of the catch of 11,598 fish was collected in November 1971, andconsisted primarily of Cuban and longnose anchovies (Anchoa cubana and Anchoa nasuta)and 20 other much less abundant species. Ichthyoplankton was also sampled during theearly monitoring studies (Ref. 2.2-1, Section 4.3.8.2.5). Larvae of herring and anchovieswere most common, and generally abundant during spring and summer. This programyielded 5,570 individuals distributed among 49 species. The five most abundant speciesaccounted for nearly 70 percent of the catch: Atlantic bumper (Chloroscombrus chrysurus),Spanish mackerel (Scomberomorus maculatus), Atlantic croaker (Micropogonias undulatus),spot (Leiostomus xanthurus), and bluefish (Pomatomus saltatrix). Catches were higher infall and winter than spring and summer. In comparing eight years of monitoring data (1977-
LICENSE RENEWAL APPLICATIONST. LUCIE UNITS 1 & 2
CHAPTER 2.0 SITE AND ENVIRONMENTAL INTERFACES Page 2.2-3
1984), investigators found temporal and spatial distributions to be highly variable (Ref. 2.2-2,Section B).
Commercial and recreational fishing are important activities in the vicinity of St. Lucie Units 1& 2. Commercial landing data for St. Lucie County were summarized for 1970-1972 (Ref.2.1-2, Section 2.7.5.9). Their evaluation focused on three of the most abundant species incommercial catches at that time, the bluefish, Spanish mackerel, and king mackerel(Scomberomorus cavalla). All three species are highly migratory, spawn in coastal watersfrom late summer into winter (depending on species), and migrate northward along the EastCoast during the warmer seasons. For the 1971 season, landed weights of bluefish,Spanish mackerel, and king mackerel from St. Lucie County were 228,663 lb, 679,110 lb,and 1,217,356 lb, respectively. These landings represented 10.7 percent, 6.8 percent, and21.6 percent, respectively, of total Florida landings. These species were also prominent inthe 1982 landings for St. Lucie County (Ref. 2.2-2, Section B), ranging from 236,146 lb ofbluefish to 899,944 lb of Spanish mackerel. However, several other species were quiteabundant in 1982, including tilefish (e.g., Caulolatilus spp.) (587,654 lb) and swordfish(Xiphias gladius) (451,503 lb).
FPL (Ref. 2.1-2, Section 2.7.5.9) reported that St. Lucie County is the northernmost countyon Florida’s east coast that has an extensive winter sport fishery. Ladyfish (Elops saurus),snook, and various billfish species were common in recreational catches. Pre-operationalstudies revealed that the three most important commercially valuable fish in local oceanfisheries (bluefish, Spanish mackerel, and king mackerel) occur farther offshore than wherethe intake and discharge lines now terminate (i.e., trough habitat). These species are onlyseasonally abundant during migrations in spring and fall.
2.2.2 INDIAN RIVER LAGOON
The Indian River Lagoon is a productive estuary that abuts the western edge of the St. LucieUnits 1 & 2 property. A number of environmental studies were conducted in the Lagoonfrom the late 1960s into the 1980s in association with siting, construction, and operation ofSt. Lucie Units 1 & 2. The results of these studies have previously been summarized in theSt. Lucie Unit 2 Environmental Report (Ref. 2.1-2, Section 2.7.4) and the FinalEnvironmental Statement for Unit 2 (Ref. 2.2-1, Section 4.3.8.1).
The Lagoon is characterized by extensive growths of manatee grass (Syringodium filiforme)and red algae such as the dominant form Gracilaria. In turn, the grass and algae areinhabited by a variety of gammarids, shrimp, isopods, crabs, and juvenile fish. A variety ofmicroscopic organisms are supported by this vegetative community, including diatomsattached to the plant leaves.
Planktonic organisms are abundant and diverse in the Indian River Lagoon owing toconstant deposition of organic matter from the plant community. The organic matter isdecomposed by bacteria, releasing mineral nutrients that are utilized by algae (includingphytoplankton). Zooplankton such as protozoa, rotifers, and copepods maintain abundantpopulations by feeding on the bacteria. More than 90 phytoplankton species have beenreported from the Lagoon.
Benthic organisms are also abundant and include tube-dwelling worms and crustaceans, thelatter including larger shellfish such as shrimp and blue crabs. Twenty-four decapod
LICENSE RENEWAL APPLICATIONST. LUCIE UNITS 1 & 2
CHAPTER 2.0 SITE AND ENVIRONMENTAL INTERFACES Page 2.2-4
species (e.g., shrimp, crabs) were collected from Big Mud Creek near St. Lucie Units 1 & 2in the early 1970s.
Big Mud Creek, a backwater cove of the Indian River Lagoon, was dredged to a maximumdepth of 46 feet during plant construction to provide deep-water access to the Intra-CoastalWaterway. Being some distance from both the Fort Pierce and St. Lucie inlets, Big MudCreek receives little tidal influence and so has minimal water exchange with Indian RiverLagoon. This results in water stratification in the summer and anoxic conditions on thebottom. During the winter months, the water masses turn over as the surface cools.
A diverse and abundant fish community of over 300 species has been identified in thesouthern portion of the Indian River Lagoon (Ref. 2.2-1, Section 4.3.8.1). Red drum(Sciaenops ocellatus), spotted seatrout (Cynoscion nebulosus), common snook(Centropomus undecimalus), sheepshead (Archosargus probatocephalus), and graysnapper (Lutjanus griseus) were commonly reported.
During the last 20 years, the increasing levels of human activities in its watershed haveimpacted the Lagoon’s water, sediment, and habitat quality. As the construction ofextensive agricultural and urban drainage projects have increased the watershed’s size, theland use changes associated with increased residential, commercial, agricultural, andindustrial development have altered the freshwater inputs to the Lagoon. Alteration of thenormal patterns of freshwater inputs has contributed to changes in the biologicalcommunities in the Lagoon. Reductions in abundance and distribution of sea grasses andoysters are evidence of these changes.
LICENSE RENEWAL APPLICATIONST. LUCIE UNITS 1 & 2
CHAPTER 2.0 SITE AND ENVIRONMENTAL INTERFACES Page 2.3-1
2.3 CRITICAL AND IMPORTANT TERRESTRIAL HABITATSAs described in Section 2.1, Hutchinson Island is a typical Florida barrier island, separatedfrom the mainland by the Indian River Lagoon. Its eastern side is composed of ocean beachand dunes to an approximate elevation of 15 feet above mean sea level (MSL). From thedunes westward, the topography slopes to about four feet above MSL forming a swale. Thisarea is characterized by a mangrove community (Ref. 2.1-2, Section 2.7).
There are no designated critical terrestrial habitats for endangered species in the vicinity ofSt. Lucie Units 1 & 2 and the transmission corridor associated with the plant. The beachand dunes, mangrove, and tropical hammock habitats are important, however, in that theyrepresent important coastal ecosystems that have historically been reduced bydevelopment. Also, these habitats support a variety of animal species.
At the St. Lucie Units 1 & 2 site, the beach and dune habitat consists of a narrow band alongthe Atlantic Ocean shoreline and is subject to significant wave erosion. The seaward side ofthe dunes currently has no vegetation. Vegetation on the inland side of the dunes includessea oats (Unida paniculata), sea grape (Coccoloba uvifera), salt marsh hay (Spartinapatens), Australian pine (Casuarina equisetifolia), marsh ox-eye (Barrichia frutescens),beach sunflower (Helianthus debilis), marsh elder (Iva frutescens), bay bean (Canaualiarosea), and railroad vine (Ipomoea peseaprae).
The mangrove habitat has been considerably altered from its former natural state (Ref. 2.1-2, Section 2.7). In the 1930s and 1940s, the mangrove forest was destroyed by trenching,diking, and flooding with seawater as part of a Work Project Administration (WPA) mosquitocontrol program. Many trees were killed by hydrologic alterations, particularly the blackmangrove (Avicennia nitida). Since that time there has been partial restoration, particularlyof red mangrove (Rhizophora mangle), which tends to grow in lower, wetter portions ofmangrove forests. Some black and white mangrove (Laguncularia racemosa), fish poison(Dalbergia ecastophyllum), and giant leather fern (Acrostichum danceifolium) have sincebeen established at higher elevations.
The mangrove stands suffered freeze damage in 1989, and revegetation has not occurred inall areas. Currently the mangrove areas are either inundated or intertidal, and function asmud flat habitats for wildlife. The tropical hammock habitat occurs east of State Road A1A.The largest area of occurrence is located amid the mangrove stands north of the St. LucieUnits 1 & 2 Discharge Canal. Prominent species include gumbo-limbo (Bursera simaruba),paradise tree (Simarouba glauca), white and Spanish stoppers (Eugenia axillaris and E.foetida), wild lime (Zanthoxylum fagara), white indigo berry (Randia aculeata), mastic(Mastichodendron foetidissimum), and snow berry (Chiocococca alba). The occurrence oftropical hammocks this far north on the Atlantic coast and with a distinct assemblage oftropical species is unusual.
Notwithstanding the debilitation of the mangrove habitat that occurred in the 1930s and1940s, Hutchinson Island habitats support a variety of animal species. FPL (Ref. 2.1-2,Section 2.7) reported 24 mammals from Hutchinson Island, of which the Virginia opossum(Didelphis virginiana), raccoon (Procyon lotor), and beach mouse (Peromyscus polionotus)were most common. Nearly 160 bird species were reported to use Hutchinson Island, atleast during part of their life cycles. Abundant resident species were typified by water-associated birds such as great egret (Casmerodius albus), American coot (Fulica
LICENSE RENEWAL APPLICATIONST. LUCIE UNITS 1 & 2
CHAPTER 2.0 SITE AND ENVIRONMENTAL INTERFACES Page 2.3-2
americana), ring-billed gull (Larus delawarensis), and fish crow (Corvus ossifragus). Manymigratory species pass through the area such as warblers [e.g., black and white warbler(Mniotilta varia)], spotted sandpiper (Actitis macularia), and Forster’s tern (Sterna forsteri).Gopher tortoise (Gopherus polyphemus) are present on the site and have active burrows inareas of soft soils that are not subject to flooding.
Habitat in the transmission line corridor is a mixture of man-altered areas, sand pine scrub,prairie/pine flatwoods, wet prairie, and isolated marshes. In the 1970s, most of the corridorwas in agricultural usage such as orange groves and pastureland (Ref. 2.1-2, Section 3.9).Current land use in the man-altered areas includes pastures, abandoned agricultural lands,and areas disturbed by grading or clearing.
LICENSE RENEWAL APPLICATIONST. LUCIE UNITS 1 & 2
CHAPTER 2.0 SITE AND ENVIRONMENTAL INTERFACES Page 2.4-1
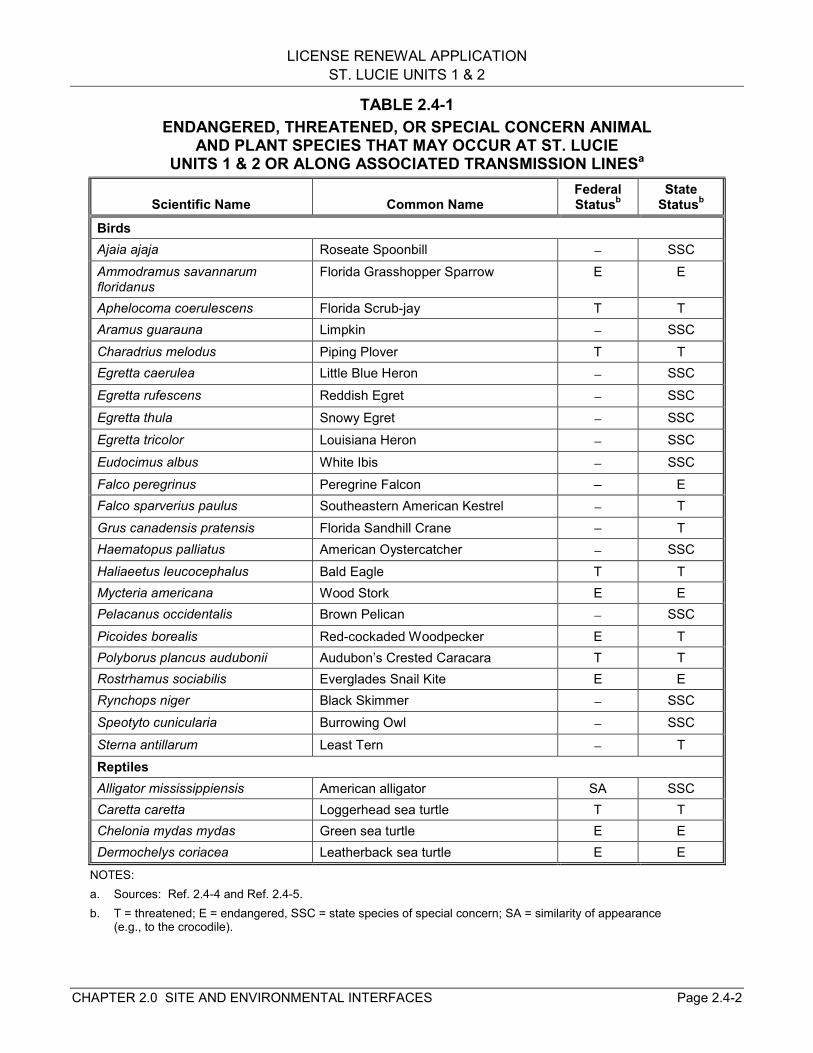
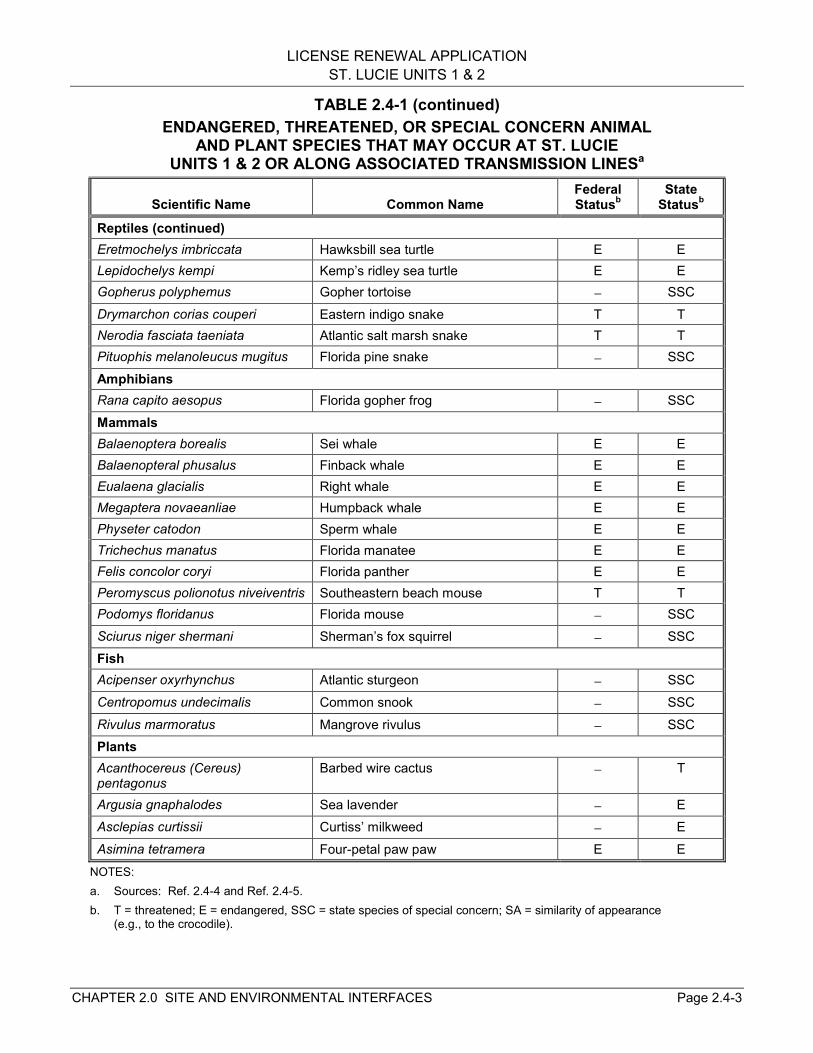
2.4 THREATENED OR ENDANGERED SPECIESA list of threatened or endangered species, or state species of special concern (SSC) thathave been observed on or near the St. Lucie Units 1 & 2 site, or could potentially occur inthe vicinity or along the transmission line corridor, is provided in Table 2.4-1. Certainspecies, such as the Least Tern (Sterna antillarum), Black Skimmer (Rynchops niger),American Oystercatcher (Haematopus palliateus), several species of sea turtle, gophertortoise (Gopherus polyphemus), and the Florida manatee (Trichechas manatus) have beendocumented at the St. Lucie Units 1 & 2 site. There are species on the list that could occurin St. Lucie County, but would not likely occur at the St. Lucie Units 1 & 2 site because ofhabitat requirements. For example, the American alligator (Alligator mississippiensis) wouldbe very unlikely to occur in the high salinity waters of the Atlantic Ocean or the Indian RiverLagoon, on either side of the plant. The Red-cockaded Woodpecker (Picoides borealis)requires mature pine or pine-oak woods (Ref. 2.4-1) and would be very unlikely to occur inthe beach-dune or mangrove habitats of Hutchinson Island. The most common occurrencesof threatened or endangered species at the site are several species of sea turtle that nest onHutchinson Island beaches.
Five species of sea turtle have been reported from Hutchinson Island. The federallythreatened loggerhead sea turtle (Caretta caretta) has historically been most common.Between 5,000 and 8,000 loggerhead nests have been reported on Hutchinson Island overthe last 10 years (Ref. 2.4-2). The endangered green sea turtle (Chelonia mydas mydas)also nests on Hutchinson Island, but these nests are less abundant than those of theloggerhead. Juveniles of both species use the area near the St. Lucie Units 1 & 2 site as adevelopmental area. The endangered leatherback sea turtle (Dermochelys coriacea)infrequently nests on Hutchinson Island. Nest numbers have shown an upward trend in thelast 20 years though they have varied widely. For the years 1996 through 2000, the numberof leatherback nests has ranged from a low of 42 in 1997 to a high of 143 in 1999 (Ref. 2.4-3). The endangered Kemp’s ridley sea turtle (Lepidochelys kempi) and hawksbill sea turtle(Eretmochelys imbriccata) do not nest on Hutchinson Island and have only infrequently beenreported from the area.
A number of the protected bird species listed in Table 2.4-1 have been seen on HutchinsonIsland, including Least Tern, Brown Pelican (Pelacanus occidentalis), Bald Eagle(Haliaeetus leucocephalus), Peregrine Falcon (Falco peregrinus), Wood Stork (Mycteriaamericana), Little Blue Heron (Egretta caerulea), Snowy Egret (Egretta thula), ReddishEgret (Egretta rufescens), and Louisiana Heron (Egretta tricolor) (Ref. 2.2-1). The latter fivespecies all nest in mangroves. The Least Tern, a state threatened species, and the BlackSkimmer, a state species of special concern, nest on the canal berms and building rooftopswithin the St. Lucie Units 1 & 2 property boundary. The American Oystercatcher, a statespecies of special concern, also nests on the canal berms. The Brown Pelican, White Ibis(Eudocimus albus), Little Blue Heron, and the Southeastern American Kestrel (Falcosparverius paulus) were observed on site in recent surveys.
Recent surveys indicate gopher tortoises, a state-listed species of special concern, occupyapproximately 43 active burrows on the site. Burrows are located in the area east of StateRoad A1A in the vicinity of the Intake and Discharge canals in areas of soft soils that are notsubject to flooding. Three active gopher tortoise burrows were also found in one area along
LICENSE RENEWAL APPLICATIONST. LUCIE UNITS 1 & 2
CHAPTER 2.0 SITE AND ENVIRONMENTAL INTERFACES Page 2.4-2
TABLE 2.4-1ENDANGERED, THREATENED, OR SPECIAL CONCERN ANIMAL
AND PLANT SPECIES THAT MAY OCCUR AT ST. LUCIEUNITS 1 & 2 OR ALONG ASSOCIATED TRANSMISSION LINESa
Scientific Name Common NameFederalStatusb
StateStatusb
BirdsAjaia ajaja Roseate Spoonbill − SSCAmmodramus savannarumfloridanus
Florida Grasshopper Sparrow E E
Aphelocoma coerulescens Florida Scrub-jay T TAramus guarauna Limpkin − SSCCharadrius melodus Piping Plover T TEgretta caerulea Little Blue Heron − SSCEgretta rufescens Reddish Egret − SSCEgretta thula Snowy Egret − SSCEgretta tricolor Louisiana Heron − SSCEudocimus albus White Ibis − SSCFalco peregrinus Peregrine Falcon – EFalco sparverius paulus Southeastern American Kestrel − TGrus canadensis pratensis Florida Sandhill Crane – THaematopus palliatus American Oystercatcher − SSCHaliaeetus leucocephalus Bald Eagle T TMycteria americana Wood Stork E EPelacanus occidentalis Brown Pelican − SSCPicoides borealis Red-cockaded Woodpecker E TPolyborus plancus audubonii Audubon’s Crested Caracara T TRostrhamus sociabilis Everglades Snail Kite E ERynchops niger Black Skimmer − SSCSpeotyto cunicularia Burrowing Owl − SSCSterna antillarum Least Tern − TReptilesAlligator mississippiensis American alligator SA SSCCaretta caretta Loggerhead sea turtle T TChelonia mydas mydas Green sea turtle E EDermochelys coriacea Leatherback sea turtle E E
NOTES:a. Sources: Ref. 2.4-4 and Ref. 2.4-5.b. T = threatened; E = endangered, SSC = state species of special concern; SA = similarity of appearance
(e.g., to the crocodile).
LICENSE RENEWAL APPLICATIONST. LUCIE UNITS 1 & 2
CHAPTER 2.0 SITE AND ENVIRONMENTAL INTERFACES Page 2.4-3
TABLE 2.4-1 (continued)ENDANGERED, THREATENED, OR SPECIAL CONCERN ANIMAL
AND PLANT SPECIES THAT MAY OCCUR AT ST. LUCIEUNITS 1 & 2 OR ALONG ASSOCIATED TRANSMISSION LINESa
Scientific Name Common NameFederalStatusb
StateStatusb
Reptiles (continued)Eretmochelys imbriccata Hawksbill sea turtle E ELepidochelys kempi Kemp’s ridley sea turtle E EGopherus polyphemus Gopher tortoise − SSCDrymarchon corias couperi Eastern indigo snake T TNerodia fasciata taeniata Atlantic salt marsh snake T TPituophis melanoleucus mugitus Florida pine snake − SSCAmphibiansRana capito aesopus Florida gopher frog − SSCMammalsBalaenoptera borealis Sei whale E EBalaenopteral phusalus Finback whale E EEualaena glacialis Right whale E EMegaptera novaeanliae Humpback whale E EPhyseter catodon Sperm whale E ETrichechus manatus Florida manatee E EFelis concolor coryi Florida panther E EPeromyscus polionotus niveiventris Southeastern beach mouse T TPodomys floridanus Florida mouse − SSCSciurus niger shermani Sherman’s fox squirrel − SSCFishAcipenser oxyrhynchus Atlantic sturgeon − SSCCentropomus undecimalis Common snook − SSCRivulus marmoratus Mangrove rivulus − SSCPlantsAcanthocereus (Cereus)pentagonus
Barbed wire cactus − T
Argusia gnaphalodes Sea lavender − EAsclepias curtissii Curtiss’ milkweed − EAsimina tetramera Four-petal paw paw E E
NOTES:a. Sources: Ref. 2.4-4 and Ref. 2.4-5.b. T = threatened; E = endangered, SSC = state species of special concern; SA = similarity of appearance
(e.g., to the crocodile).
LICENSE RENEWAL APPLICATIONST. LUCIE UNITS 1 & 2
CHAPTER 2.0 SITE AND ENVIRONMENTAL INTERFACES Page 2.4-4
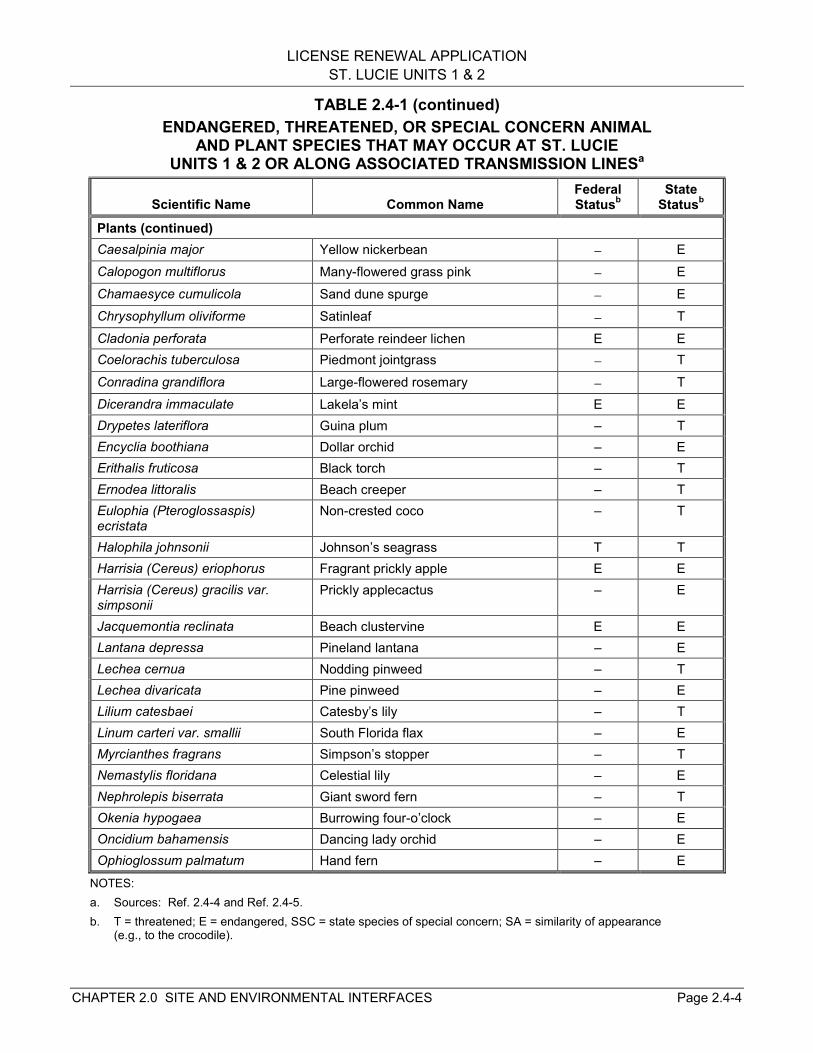
TABLE 2.4-1 (continued)ENDANGERED, THREATENED, OR SPECIAL CONCERN ANIMAL
AND PLANT SPECIES THAT MAY OCCUR AT ST. LUCIEUNITS 1 & 2 OR ALONG ASSOCIATED TRANSMISSION LINESa
Scientific Name Common NameFederalStatusb
StateStatusb
Plants (continued)Caesalpinia major Yellow nickerbean − ECalopogon multiflorus Many-flowered grass pink − EChamaesyce cumulicola Sand dune spurge − EChrysophyllum oliviforme Satinleaf − TCladonia perforata Perforate reindeer lichen E ECoelorachis tuberculosa Piedmont jointgrass − TConradina grandiflora Large-flowered rosemary − TDicerandra immaculate Lakela’s mint E EDrypetes lateriflora Guina plum – TEncyclia boothiana Dollar orchid – EErithalis fruticosa Black torch – TErnodea littoralis Beach creeper – TEulophia (Pteroglossaspis)ecristata
Non-crested coco – T
Halophila johnsonii Johnson’s seagrass T THarrisia (Cereus) eriophorus Fragrant prickly apple E EHarrisia (Cereus) gracilis var.simpsonii
Prickly applecactus – E
Jacquemontia reclinata Beach clustervine E ELantana depressa Pineland lantana – ELechea cernua Nodding pinweed – TLechea divaricata Pine pinweed – ELilium catesbaei Catesby’s lily – TLinum carteri var. smallii South Florida flax – EMyrcianthes fragrans Simpson’s stopper – TNemastylis floridana Celestial lily – ENephrolepis biserrata Giant sword fern – TOkenia hypogaea Burrowing four-o’clock – EOncidium bahamensis Dancing lady orchid – EOphioglossum palmatum Hand fern – E
NOTES:a. Sources: Ref. 2.4-4 and Ref. 2.4-5.b. T = threatened; E = endangered, SSC = state species of special concern; SA = similarity of appearance
(e.g., to the crocodile).
LICENSE RENEWAL APPLICATIONST. LUCIE UNITS 1 & 2
CHAPTER 2.0 SITE AND ENVIRONMENTAL INTERFACES Page 2.4-5
TABLE 2.4-1 (continued)ENDANGERED, THREATENED, OR SPECIAL CONCERN ANIMAL
AND PLANT SPECIES THAT MAY OCCUR AT ST. LUCIEUNITS 1 & 2 OR ALONG ASSOCIATED TRANSMISSION LINESa
Scientific Name Common NameFederalStatusb
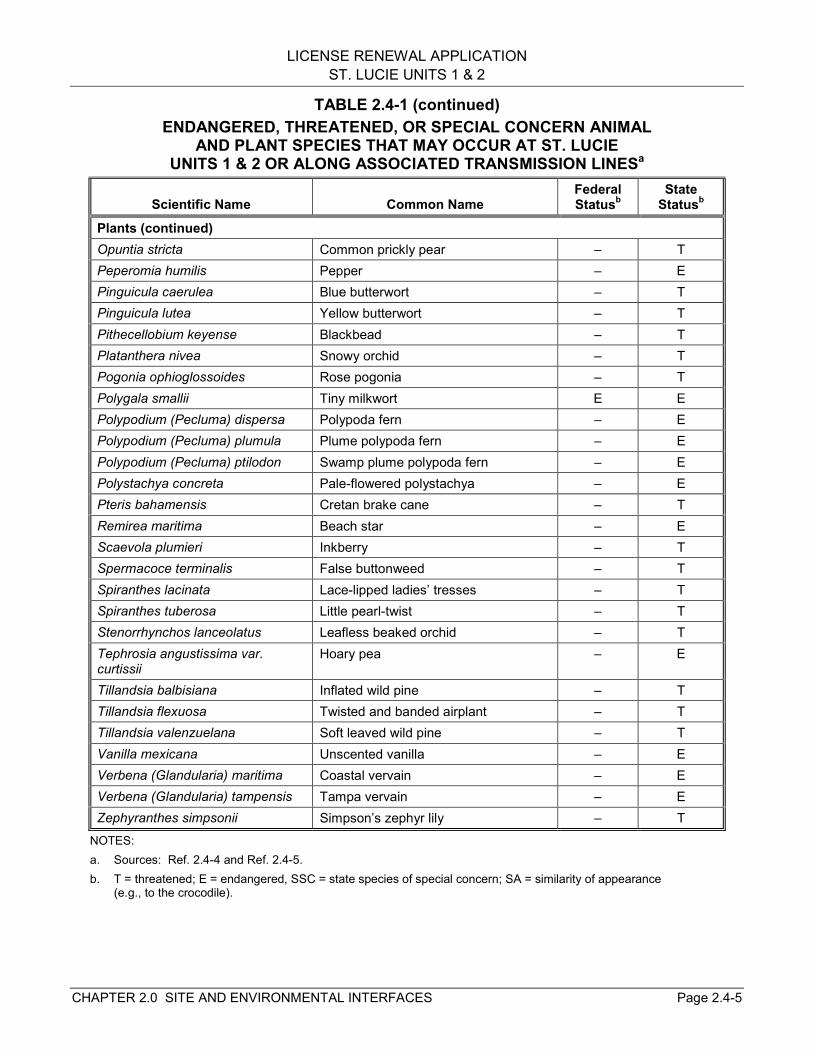
StateStatusb
Plants (continued)Opuntia stricta Common prickly pear – TPeperomia humilis Pepper – EPinguicula caerulea Blue butterwort – TPinguicula lutea Yellow butterwort – TPithecellobium keyense Blackbead – TPlatanthera nivea Snowy orchid – TPogonia ophioglossoides Rose pogonia – TPolygala smallii Tiny milkwort E EPolypodium (Pecluma) dispersa Polypoda fern – EPolypodium (Pecluma) plumula Plume polypoda fern – EPolypodium (Pecluma) ptilodon Swamp plume polypoda fern – EPolystachya concreta Pale-flowered polystachya – EPteris bahamensis Cretan brake cane – TRemirea maritima Beach star – EScaevola plumieri Inkberry – TSpermacoce terminalis False buttonweed – TSpiranthes lacinata Lace-lipped ladies’ tresses – TSpiranthes tuberosa Little pearl-twist – TStenorrhynchos lanceolatus Leafless beaked orchid – TTephrosia angustissima var.curtissii
Hoary pea – E
Tillandsia balbisiana Inflated wild pine – TTillandsia flexuosa Twisted and banded airplant – TTillandsia valenzuelana Soft leaved wild pine – TVanilla mexicana Unscented vanilla – EVerbena (Glandularia) maritima Coastal vervain – EVerbena (Glandularia) tampensis Tampa vervain – EZephyranthes simpsonii Simpson’s zephyr lily – T
NOTES:a. Sources: Ref. 2.4-4 and Ref. 2.4-5.b. T = threatened; E = endangered, SSC = state species of special concern; SA = similarity of appearance
(e.g., to the crocodile).
LICENSE RENEWAL APPLICATIONST. LUCIE UNITS 1 & 2
CHAPTER 2.0 SITE AND ENVIRONMENTAL INTERFACES Page 2.4-6
the transmission line corridor. Though none have been sighted, eastern indigo snakes(Drymarchon corias couperi) have been observed on Hutchinson Island and commonlyinhabit gopher tortoise burrows.
Two protected plant-species were also observed in recent surveys, inkberry (Scaevolaplumieri) and common prickly pear (Opuntia stricta). The potential impacts of operation ofSt. Lucie Units 1 & 2 on these and the other species listed in Table 2.4-1 are discussed inSection 4.6 of this Environmental Report.
LICENSE RENEWAL APPLICATIONST. LUCIE UNITS 1 & 2
CHAPTER 2.0 SITE AND ENVIRONMENTAL INTERFACES Page 2.5-1
2.5 REGIONAL DEMOGRAPHY
2.5.1 INTRODUCTION
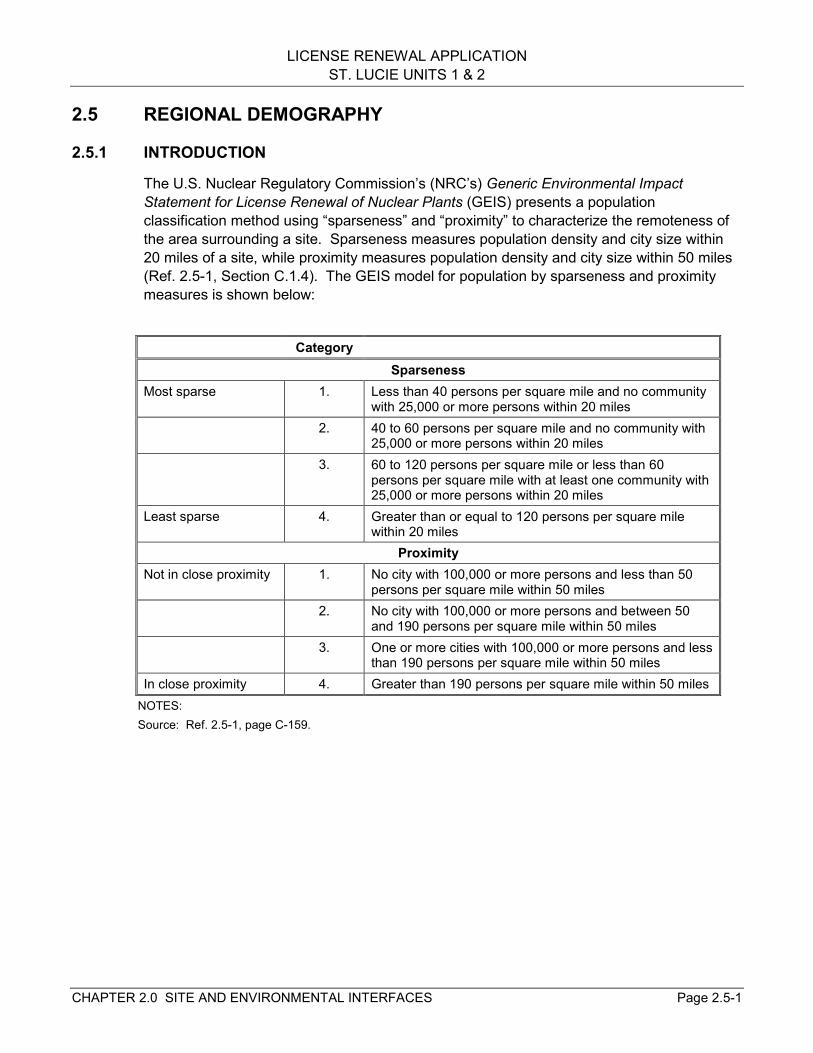
The U.S. Nuclear Regulatory Commission’s (NRC’s) Generic Environmental ImpactStatement for License Renewal of Nuclear Plants (GEIS) presents a populationclassification method using “sparseness” and “proximity” to characterize the remoteness ofthe area surrounding a site. Sparseness measures population density and city size within20 miles of a site, while proximity measures population density and city size within 50 miles(Ref. 2.5-1, Section C.1.4). The GEIS model for population by sparseness and proximitymeasures is shown below:
CategorySparseness
Most sparse 1. Less than 40 persons per square mile and no communitywith 25,000 or more persons within 20 miles
2. 40 to 60 persons per square mile and no community with25,000 or more persons within 20 miles
3. 60 to 120 persons per square mile or less than 60persons per square mile with at least one community with25,000 or more persons within 20 miles
Least sparse 4. Greater than or equal to 120 persons per square milewithin 20 miles
ProximityNot in close proximity 1. No city with 100,000 or more persons and less than 50
persons per square mile within 50 miles2. No city with 100,000 or more persons and between 50
and 190 persons per square mile within 50 miles3. One or more cities with 100,000 or more persons and less
than 190 persons per square mile within 50 milesIn close proximity 4. Greater than 190 persons per square mile within 50 miles
NOTES:Source: Ref. 2.5-1, page C-159.
LICENSE RENEWAL APPLICATIONST. LUCIE UNITS 1 & 2
CHAPTER 2.0 SITE AND ENVIRONMENTAL INTERFACES Page 2.5-2
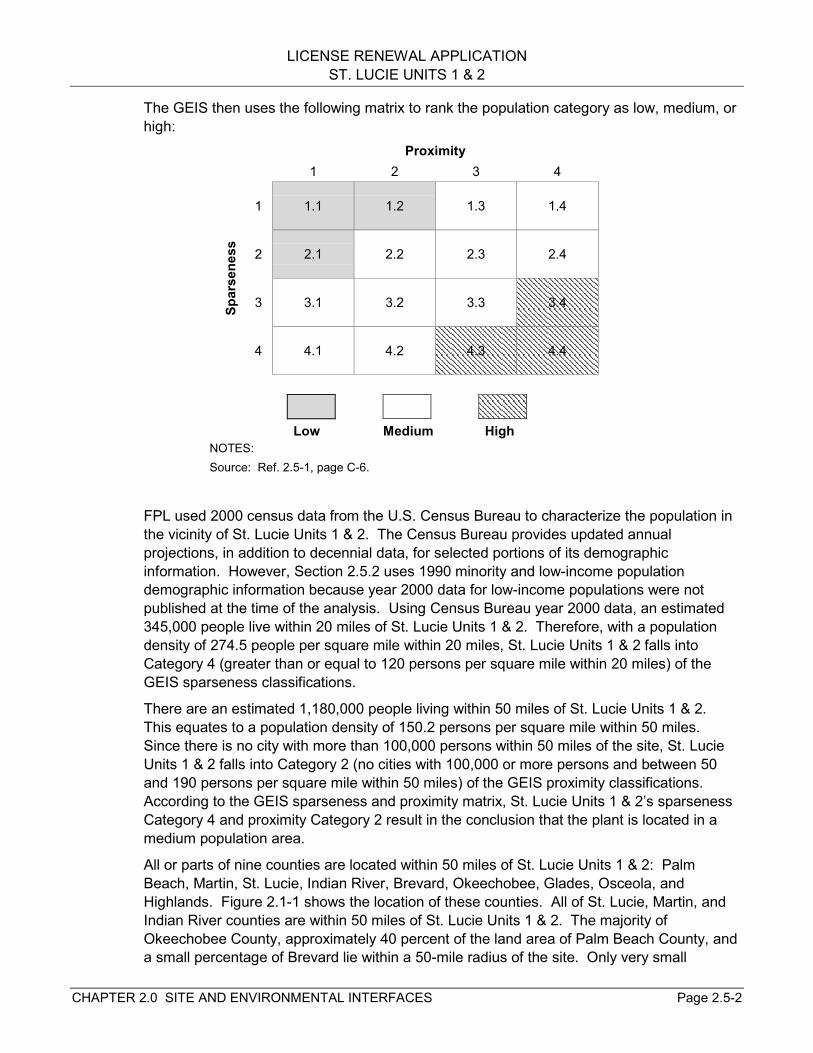
The GEIS then uses the following matrix to rank the population category as low, medium, orhigh:
Proximity1 2 3 4
1 1.1 1.2 1.3 1.4
2 2.1 2.2 2.3 2.4
3 3.1 3.2 3.3 3.4Spar
sene
ss
4 4.1 4.2 4.3 4.4
Low Medium HighNOTES:Source: Ref. 2.5-1, page C-6.
FPL used 2000 census data from the U.S. Census Bureau to characterize the population inthe vicinity of St. Lucie Units 1 & 2. The Census Bureau provides updated annualprojections, in addition to decennial data, for selected portions of its demographicinformation. However, Section 2.5.2 uses 1990 minority and low-income populationdemographic information because year 2000 data for low-income populations were notpublished at the time of the analysis. Using Census Bureau year 2000 data, an estimated345,000 people live within 20 miles of St. Lucie Units 1 & 2. Therefore, with a populationdensity of 274.5 people per square mile within 20 miles, St. Lucie Units 1 & 2 falls intoCategory 4 (greater than or equal to 120 persons per square mile within 20 miles) of theGEIS sparseness classifications.
There are an estimated 1,180,000 people living within 50 miles of St. Lucie Units 1 & 2.This equates to a population density of 150.2 persons per square mile within 50 miles.Since there is no city with more than 100,000 persons within 50 miles of the site, St. LucieUnits 1 & 2 falls into Category 2 (no cities with 100,000 or more persons and between 50and 190 persons per square mile within 50 miles) of the GEIS proximity classifications.According to the GEIS sparseness and proximity matrix, St. Lucie Units 1 & 2’s sparsenessCategory 4 and proximity Category 2 result in the conclusion that the plant is located in amedium population area.
All or parts of nine counties are located within 50 miles of St. Lucie Units 1 & 2: PalmBeach, Martin, St. Lucie, Indian River, Brevard, Okeechobee, Glades, Osceola, andHighlands. Figure 2.1-1 shows the location of these counties. All of St. Lucie, Martin, andIndian River counties are within 50 miles of St. Lucie Units 1 & 2. The majority ofOkeechobee County, approximately 40 percent of the land area of Palm Beach County, anda small percentage of Brevard lie within a 50-mile radius of the site. Only very small
LICENSE RENEWAL APPLICATIONST. LUCIE UNITS 1 & 2
CHAPTER 2.0 SITE AND ENVIRONMENTAL INTERFACES Page 2.5-3
fractions of land in Glades, Osceola, and Highlands counties are located within the 50-mileradius, and combined they account for less than half of a percent of the 2000 populationwithin 50 miles of the plant. Dupuis Reserve State Forest, most of Lake Okeechobee andportions of Loxahatchee National Wildlife Refuge and the Brighton Seminole IndianReservation fall within the 50-mile radius of St. Lucie Units 1 & 2.
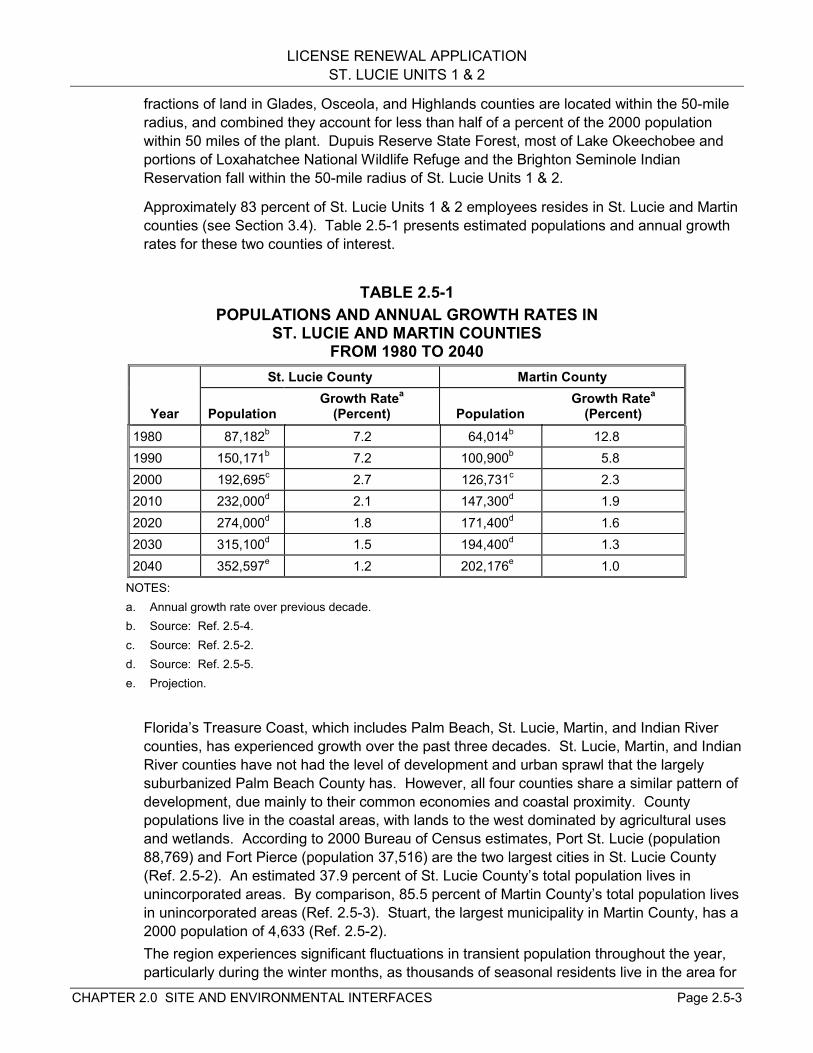
Approximately 83 percent of St. Lucie Units 1 & 2 employees resides in St. Lucie and Martincounties (see Section 3.4). Table 2.5-1 presents estimated populations and annual growthrates for these two counties of interest.
TABLE 2.5-1POPULATIONS AND ANNUAL GROWTH RATES IN
ST. LUCIE AND MARTIN COUNTIESFROM 1980 TO 2040
St. Lucie County Martin County
Year PopulationGrowth Ratea
(Percent) PopulationGrowth Ratea
(Percent)1980 87,182b 7.2 64,014b 12.81990 150,171b 7.2 100,900b 5.82000 192,695c 2.7 126,731c 2.32010 232,000d 2.1 147,300d 1.92020 274,000d 1.8 171,400d 1.62030 315,100d 1.5 194,400d 1.32040 352,597e 1.2 202,176e 1.0
NOTES:a. Annual growth rate over previous decade.b. Source: Ref. 2.5-4.c. Source: Ref. 2.5-2.d. Source: Ref. 2.5-5.e. Projection.
Florida’s Treasure Coast, which includes Palm Beach, St. Lucie, Martin, and Indian Rivercounties, has experienced growth over the past three decades. St. Lucie, Martin, and IndianRiver counties have not had the level of development and urban sprawl that the largelysuburbanized Palm Beach County has. However, all four counties share a similar pattern ofdevelopment, due mainly to their common economies and coastal proximity. Countypopulations live in the coastal areas, with lands to the west dominated by agricultural usesand wetlands. According to 2000 Bureau of Census estimates, Port St. Lucie (population88,769) and Fort Pierce (population 37,516) are the two largest cities in St. Lucie County(Ref. 2.5-2). An estimated 37.9 percent of St. Lucie County’s total population lives inunincorporated areas. By comparison, 85.5 percent of Martin County’s total population livesin unincorporated areas (Ref. 2.5-3). Stuart, the largest municipality in Martin County, has a2000 population of 4,633 (Ref. 2.5-2).The region experiences significant fluctuations in transient population throughout the year,particularly during the winter months, as thousands of seasonal residents live in the area for
LICENSE RENEWAL APPLICATIONST. LUCIE UNITS 1 & 2
CHAPTER 2.0 SITE AND ENVIRONMENTAL INTERFACES Page 2.5-4
several months before returning to their permanent residences in other states in the spring.The region also experiences a significant population influx from vacationing tourists in thewinter and summer months (Ref. 2.1-1, Section 2.1.3.3).
Proportionally, the populations in both St. Lucie and Martin counties are older than that ofthe State of Florida and the Nation as a whole. This is primarily due to the immigration ofelderly into the area. In Martin County, 28.3 percent of the population is over age 65. Thiscompares to 22.8 percent in St. Lucie County, 17.6 percent in the State of Florida, and 12.7percent for the Nation. Martin County has a particularly aged population, with a median ageof 47.3, compared to a median age of 42.0 for St. Lucie County and a median age of 38.7for the State of Florida (Ref. 2.5-2; Ref. 2.5-6).
2.5.2 MINORITY AND LOW-INCOME POPULATIONS
2.5.2.1 MINORITY POPULATIONS
The NRC guidance for performing environmental justice analyses defines “minority” as:American Indian or Alaskan Native; Asian or Pacific Islander; Black not of Hispanic origin, orHispanic (Ref. 2.5-7, Attachment 4). The guidance indicates that a minority populationexists if:
Exceeds 50 Percent – the minority population of the environmental impact site exceeds50 percent, or
More than 20 Percent Greater – the minority population percentage of the environmentalimpact site is significantly greater (typically at least 20 percent) than the minoritypopulation percentage in the geographic area chosen for comparative analysis.
The NRC performed environmental justice analyses for the Calvert Cliffs Nuclear PowerPlant and Oconee Nuclear Station license renewals (Ref. 2.5-8, Section 4.4-6; Ref. 2.5-9,Section 4.4.6). In doing so, the NRC used a 50-mile radius as the environmental impact siteand the state as the geographic area for comparative analysis. FPL has adopted thisapproach for the St. Lucie Units 1 & 2 environmental justice analysis.
The NRC guidance calls for use of the most recent U.S. Census Bureau decennial censusdata. FPL used 1990 census data from the U.S. Census Bureau website in determining thepercentage of the total population within the State of Florida for each minority category andin identifying minority (Ref. 2.5-10) and low-income (Ref. 2.5-11) populations within 50 milesof St. Lucie Units 1 & 2. The U.S. Census Bureau provides updated annual populationprojections for selected portions of its demographic information; however, the updatedprojections are not available for census-tract levels of analysis. FPL used ArcView®
software to combine U.S. Census Bureau tract data with Environmental Systems ResearchInstitute tract-boundary spatial data to produce tract-by-tract data and associated figures.The 50-mile radius (geographic area) includes 194 census tracts. The total number ofcensus tracts was determined by superimposing a 50-mile radius grid, using ArcView®
software by Environmental Systems Research Institute spatial data, with U.S. CensusBureau tract data. Tracts were included if 50 percent or greater of their area lay within the50-mile radius grid.
FPL divided U.S. Census Bureau population numbers for each minority by the totalpopulation for the State of Florida to obtain the percentage of the total represented by each

LICENSE RENEWAL APPLICATIONST. LUCIE UNITS 1 & 2
CHAPTER 2.0 SITE AND ENVIRONMENTAL INTERFACES Page 2.5-5
minority. Table 2.5-2 shows the results of this calculation and the threshold for determiningwhether a minority population exists. Because the state percentages are low, the “morethan 20 percent greater” criterion is more encompassing than the “exceeds 50 percent”criterion. For example, if 40 percent of a Florida tract were Black, it would not contain aminority population under the “exceeds 50 percent” criterion. However, because 13 percentof the Florida population is Black, the tract would contain a minority population under the“more than 20 percent greater” criterion because 40 percent does exceed 33 percent (13percent plus 20 percent).
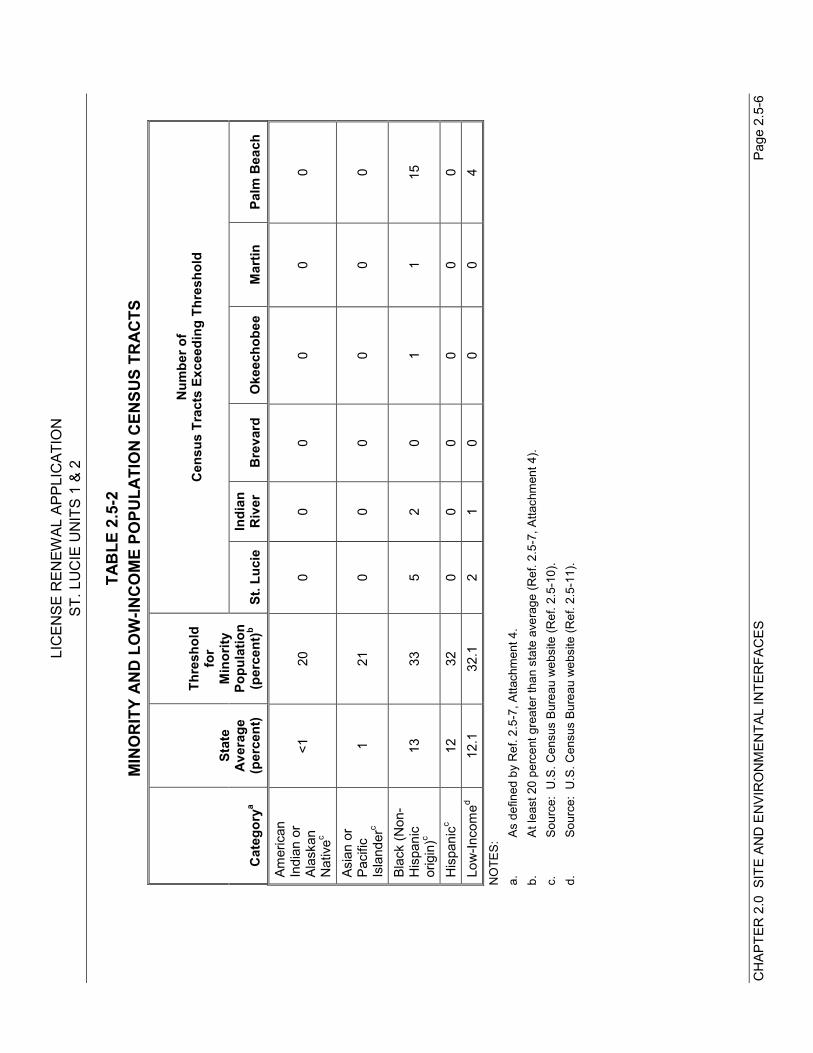
For each of the 194 census tracts within 50 miles of St. Lucie Units 1 & 2, FPL calculatedthe percentage of the population in each minority category and compared the results to thecorresponding threshold percentages to determine whether minority populations exist. The50-mile radius surrounding St. Lucie Units 1 & 2 encompasses in whole or in part ninecounties: St. Lucie, Indian River, Brevard, Okeechobee, Martin, Palm Beach, Osceola,Highlands, and Glades (see Figure 2.5-1). Only six counties, St. Lucie, Indian River,Brevard, Okeechobee, Martin, and Palm Beach, have census tracts that have 50 percent orgreater of their area within the 50-mile radius. These six counties were evaluated in theenvironmental justice analysis. Table 2.5-2 indicates how many census tracts within eachcounty exceed the threshold for determining the presence of a minority population.
Based on the “more than 20 percent greater” criterion, St. Lucie County has Black minoritypopulations in five tracts. There are no tracts with American Indian minority populations,Asian minority populations, or Hispanic minority populations in St. Lucie County. IndianRiver County has Black minority populations in two tracts and no tracts with American Indianminority populations, Asian minority populations, or Hispanic minority populations. BrevardCounty has no tracts with Black minority populations, American Indian minority populations,Asian minority populations, or Hispanic minority populations. Okeechobee County has aBlack minority population in one tract and no tracts with American Indian minoritypopulations, Asian minority populations, or Hispanic minority populations. Martin Countyhas a Black minority population in one tract and no tracts with American Indian minoritypopulations, Asian minority populations, or Hispanic minority populations. Palm BeachCounty has Black minority populations in 15 tracts and no tracts with American Indianminority populations, Asian minority populations, or Hispanic minority populations.
Figure 2.5-1 depicts the locations of Black minority populations that occur in St. Lucie,Indian River, Palm Beach, and Okeechobee Counties.
2.5.2.2 LOW-INCOME POPULATIONS
NRC guidance defines “low-income” using U.S. Census Bureau statistical poverty thresholds(Ref. 2.5-7, Attachment 4). The guidance indicates that a low-income population is presentif the percentage of households below the poverty level in an environmental impact site issignificantly greater (typically at least 20 percent) than the low-income populationpercentage in the geographical area chosen for comparative analysis. U.S. Census Bureaudata (Ref. 2.5-11) characterizes 12 percent of Florida households as low-income. Applyingthe NRC criterion (at least 20 percent greater than the State), two St. Lucie County censustracts, one Indian River County census tracts, no Brevard County census tracts, noOkeechobee County census tract, no Martin County census tracts, and four Palm BeachCounty census tracts have low-income populations (see Table 2.5-2). Figure 2.5-2 showslocations of the low-income population census tracts.
LIC
ENSE
REN
EWAL
APP
LIC
ATIO
NST
. LU
CIE
UN
ITS
1 &
2
CH
APTE
R 2
.0 S
ITE
AND
EN
VIR
ON
MEN
TAL
INTE
RFA
CES
Page
2.5
-6
TAB
LE 2
.5-2
MIN
OR
ITY
AND
LO
W-IN
CO
ME
POPU
LATI
ON
CEN
SUS
TRAC
TS
Num
ber o
fC
ensu
s Tr
acts
Exc
eedi
ng T
hres
hold
Cat
egor
ya
Stat
eAv
erag
e(p
erce
nt)
Thre
shol
dfo
rM
inor
ityPo
pula
tion
(per
cent
)bSt
. Luc
ieIn
dian
Riv
erB
reva
rdO
keec
hobe
eM
artin
Palm
Bea
ch
NO
TES:
a.As
def
ined
by
Ref
. 2.5
-7, A
ttach
men
t 4.
b.At
leas
t 20
perc
ent g
reat
er th
an s
tate
ave
rage
(Ref
. 2.5
-7, A
ttach
men
t 4).
c.So
urce
: U
.S. C
ensu
s Bu
reau
web
site
(Ref
. 2.5
-10)
.d.
Sour
ce:
U.S
. Cen
sus
Bure
au w
ebsi
te (R
ef. 2
.5-1
1).
Amer
ican
Indi
an o
rAl
aska
nN
ativ
ec
<120
00
00
00
Asia
n or
Paci
ficIs
land
erc
121
00
00
00
Blac
k (N
on-
His
pani
cor
igin
)c13
335
20
11
15
His
pani
cc12
320
00
00
0Lo
w-In
com
ed12
.132
.12
10
00
4
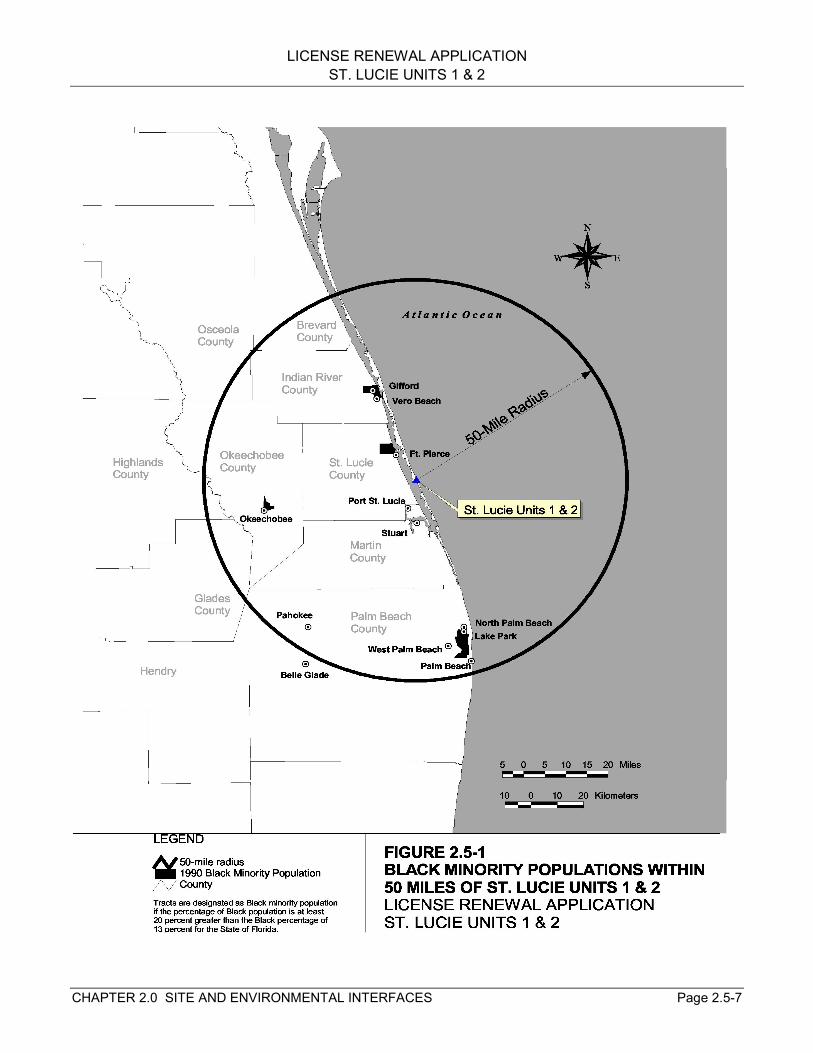
LICENSE RENEWAL APPLICATIONST. LUCIE UNITS 1 & 2
CHAPTER 2.0 SITE AND ENVIRONMENTAL INTERFACES Page 2.5-7
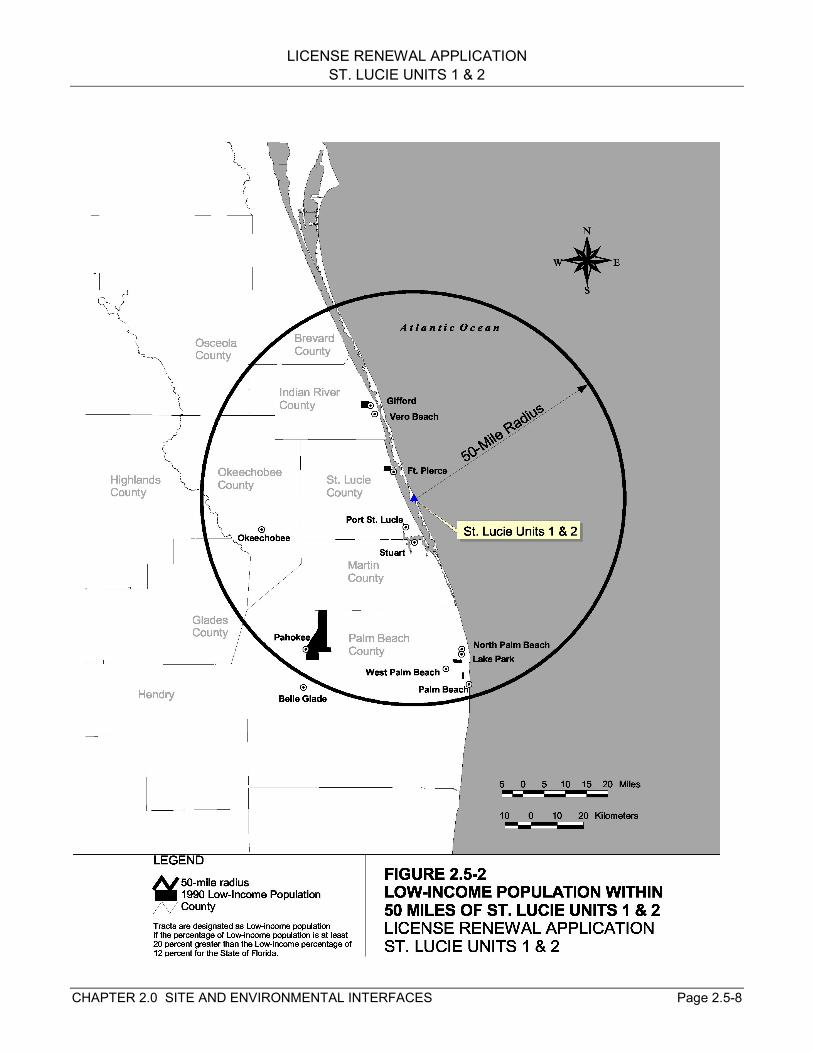
LICENSE RENEWAL APPLICATIONST. LUCIE UNITS 1 & 2
CHAPTER 2.0 SITE AND ENVIRONMENTAL INTERFACES Page 2.5-8
LICENSE RENEWAL APPLICATIONST. LUCIE UNITS 1 & 2
CHAPTER 2.0 SITE AND ENVIRONMENTAL INTERFACES Page 2.5-9
2.5.2.3 MIGRANT FARM WORKERS
Migrant farm workers are those whose employment requires travel that prevents theemployee from returning to his or her permanent place of residence the same day (Ref. 2.5-12). Migrant farm workers can be members of minority or low-income populations, but theirtravel could prevent them from being available for census data gathering. In addition,migrant farm workers can spend a significant amount of time in an area without beingresidents. These factors could result in migrant farm worker numbers being under-represented in minority and low-income population analyses based on U.S. Census Bureaudata.
Citrus groves, orchards, and row crops are important land-use categories in the vicinity ofSt. Lucie Units 1 & 2, and migrant farm workers are frequently present at these locations.However, FPL is unaware of any reliable estimate of the number of migrant farm workersthat might be present. In 1997, there were 2,159 hired farm workers in St. Lucie County,1,848 in Indian River County, 924 in Brevard County, 1,479 in Okeechobee County, 2,653 inMartin County, and 10,707 in Palm Beach County (Ref. 2.5-12). Using the 12.5 percentNational average of hired farm workers who meet the definition of migrant workers (Ref. 2.5-12), there may be as many as 2,471 migrant workers present at any time within 50 miles ofSt. Lucie Units 1 & 2.
A large number of farms in the vicinity hire farm workers: 215 in St. Lucie County, 201 inIndian River County, 180 in Brevard County, 165 in Okeechobee County, 144 in MartinCounty, and 528 in Palm Beach County (Ref. 2.5-13). These farms cover a largegeographic area; therefore, FPL assumes that migrant farm workers are located throughoutthe region’s agricultural areas and not clustered in a single location. Due to their smallnumber compared to the overall population, FPL does not expect the migrant farm workerpopulation to change the population characteristics of any particular census tract.
LICENSE RENEWAL APPLICATIONST. LUCIE UNITS 1 & 2
CHAPTER 2.0 SITE AND ENVIRONMENTAL INTERFACES Page 2.6-1
2.6 ECONOMIC BASETraditionally, tourism and in-migration have been key contributors to the overall growth ofthe region's economy, while retail trade and services are becoming increasingly importanteconomic sectors. Visitors are attracted to the region’s warm weather and the recreationalactivities found at public beaches, Lake Okeechobee, the Indian River, the LoxahatcheeRiver, golf courses, parks, and natural habitats. Often in-migrating residents relocate to theregion after first arriving as a tourist or seasonal resident (Ref. 2.6-1).
While supporting a relatively small work force, agriculture contributes significantly to theeconomies in both St. Lucie and Martin counties, as St. Lucie County leads Florida in citrusproduction (Ref. 2.6-2), and Martin County is fifth in both vegetable and citrus production(Ref. 2.6-3).
St. Lucie County has an estimated labor force of 78,757, and Martin County has anestimated labor force of 49,480. Services is currently the largest employment sector in bothSt. Lucie and Martin counties, accounting for 24.7 percent of total employment in St. LucieCounty and 35.2 percent of total employment in Martin County. Retail trade accounts for20.6 percent of total employment in St. Lucie County, and 23.3 percent of total employmentin Martin County (Ref. 2.6-4). The region’s transportation network includes rail and truckingterminals, the St. Lucie County International Airport, and a deep-water seaport at Fort Piercethat provides access to domestic and international markets. Two major interstates, theFlorida Turnpike and Interstate 95, intersect with State Road 70 and State Road 76, givingthe region access to east-west and north-south corridors (Ref. 2.6-5). The Fort Pierce-PortSt. Lucie area is the 31st fastest growing metropolitan statistical area in the United States,according to U.S. Census Bureau estimates (Ref. 2.6-6).
Since the early 1980s, unemployment rates in St. Lucie County have generally been higherthan the state average. Unemployment rates in Martin County have generally exceeded thestate average since the mid-1980s. Employment in tourism and agriculture is strongerduring winter months, resulting in employment fluctuations throughout the year (Ref. 2.6-1).In 2000, St. Lucie County had a 7.7 percent unemployment rate, and Martin County a 4.4percent unemployment rate (Ref. 2.6-4). Florida’s unemployment rate was 3.6 percentduring the same year (Ref. 2.6-7).
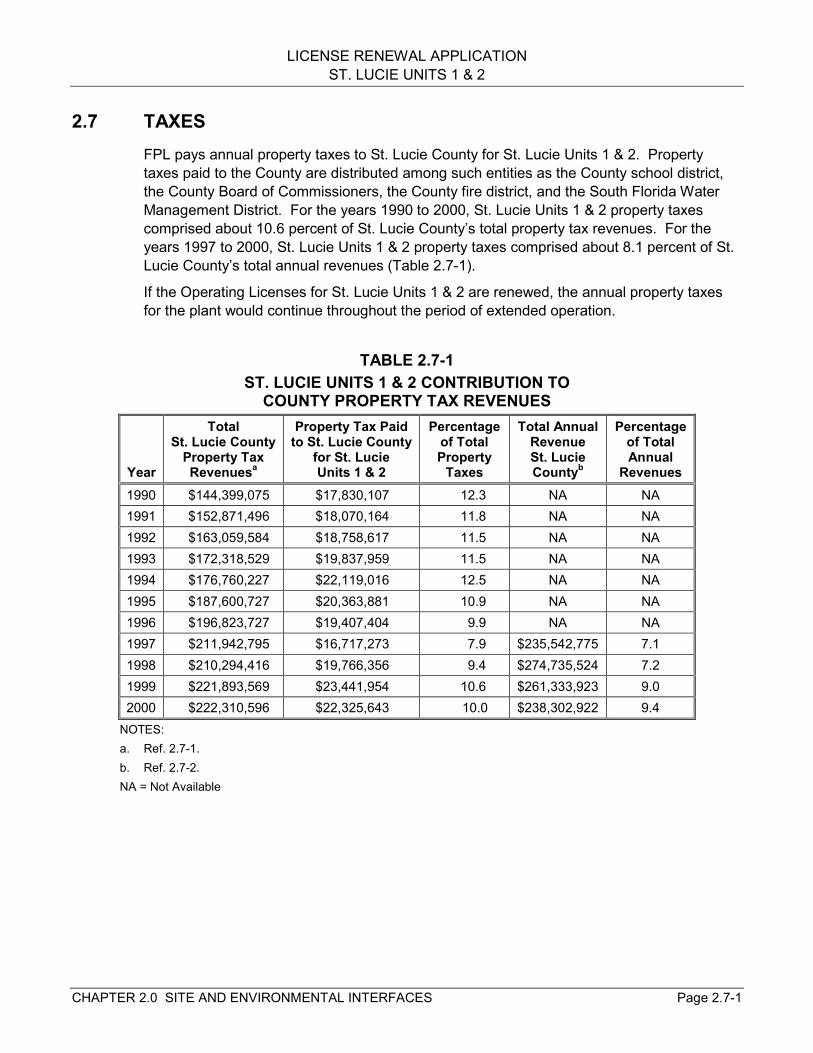
LICENSE RENEWAL APPLICATIONST. LUCIE UNITS 1 & 2
CHAPTER 2.0 SITE AND ENVIRONMENTAL INTERFACES Page 2.7-1
2.7 TAXESFPL pays annual property taxes to St. Lucie County for St. Lucie Units 1 & 2. Propertytaxes paid to the County are distributed among such entities as the County school district,the County Board of Commissioners, the County fire district, and the South Florida WaterManagement District. For the years 1990 to 2000, St. Lucie Units 1 & 2 property taxescomprised about 10.6 percent of St. Lucie County’s total property tax revenues. For theyears 1997 to 2000, St. Lucie Units 1 & 2 property taxes comprised about 8.1 percent of St.Lucie County’s total annual revenues (Table 2.7-1).
If the Operating Licenses for St. Lucie Units 1 & 2 are renewed, the annual property taxesfor the plant would continue throughout the period of extended operation.
TABLE 2.7-1ST. LUCIE UNITS 1 & 2 CONTRIBUTION TO
COUNTY PROPERTY TAX REVENUES
Year
TotalSt. Lucie County
Property TaxRevenuesa
Property Tax Paidto St. Lucie County
for St. LucieUnits 1 & 2
Percentageof TotalProperty
Taxes
Total AnnualRevenueSt. LucieCountyb
Percentageof TotalAnnual
Revenues1990 $144,399,075 $17,830,107 12.3 NA NA1991 $152,871,496 $18,070,164 11.8 NA NA1992 $163,059,584 $18,758,617 11.5 NA NA1993 $172,318,529 $19,837,959 11.5 NA NA1994 $176,760,227 $22,119,016 12.5 NA NA1995 $187,600,727 $20,363,881 10.9 NA NA1996 $196,823,727 $19,407,404 9.9 NA NA1997 $211,942,795 $16,717,273 7.9 $235,542,775 7.11998 $210,294,416 $19,766,356 9.4 $274,735,524 7.21999 $221,893,569 $23,441,954 10.6 $261,333,923 9.02000 $222,310,596 $22,325,643 10.0 $238,302,922 9.4
NOTES:a. Ref. 2.7-1.b. Ref. 2.7-2.NA = Not Available
LICENSE RENEWAL APPLICATIONST. LUCIE UNITS 1 & 2
CHAPTER 2.0 SITE AND ENVIRONMENTAL INTERFACES Page 2.8-1
2.8 LAND USE PLANNINGThis subsection focuses on St. Lucie and Martin counties because approximately 83 percentof the permanent St. Lucie Units 1 & 2 workforce lives in the St. Lucie and Martin combined-county area (see Section 3.4 for workforce description), and FPL pays property taxes in St.Lucie County.
The Florida Statutes require counties and cities to develop and implement comprehensiveplanning and land development regulations. In order to accommodate and regulate growthand development, St. Lucie and Martin counties have developed comprehensive growthmanagement plans characterizing current conditions and setting standards, regulations, andgoals for land development and appropriate uses for land, water, and resources. MartinCounty’s plan was adopted February 20, 1990, and was last amended September 28, 1999(Ref. 2.8-1). St. Lucie County’s plan is currently being updated.
Both Martin and St. Lucie counties have experienced significant growth over the pastdecade and utilize land use planning tools, such as zoning, to manage future growth anddevelopment. Planning agencies in St. Lucie and Martin counties require that urbandevelopment be confined within urban service districts and encourage growth in existingurban areas where public facilities and services are either currently available or are plannedto be made available. Each county planning agency supports the goal of protectingenvironmentally sensitive lands, natural resources, rural and agricultural land uses, historicand archaeological resources, and habitats for threatened and endangered species. Thereare no growth control measures in place to restrict development on the mainland in eithercounty. Growth is encouraged in existing urban areas where public facilities and servicesare either currently available or are planned to be made available (Ref. 2.8-1). Much of St.Lucie County’s coastal area has already been developed, and much of the currentdevelopment is concentrated in areas surrounding Interstate 95. Commercial developmentis allowed in certain areas of Hutchinson Island, a barrier island that extends along the coastof St. Lucie County and a portion of Martin County. Development of unvested (vacant oruncommitted) parcels in the Martin County portion of Hutchinson Island is limited to single-family residences. St. Lucie County does not restrict residential development of the Island(Ref. 2.8-2). Much of Hutchinson Island near Fort Pierce has been developed, as haveportions south of St. Lucie Units 1 & 2.
Agriculture accounts for approximately 50 percent of all land use in St. Lucie County. Urbanuses, such as residential, industrial, and institutional, account for approximately 19 percentof the land area. Wetlands, parks, and other protected areas account for the rest of thecurrent land use. The City of Port St. Lucie is the fastest growing municipality in St. LucieCounty, covering approximately one-sixth of St. Lucie County’s land area. Approximately 82percent of Port St. Lucie’s land area has been classified as residential, and only 36 percentof this area has been developed (Ref. 2.8-3).
Martin County has approximately 348,792 acres of unincorporated land area, 70 percent ofwhich is classified as agricultural. Residential, institutional, parks, recreational, andagricultural uses are the predominant land uses in Martin County (Ref. 2.8-1).
Development has been particularly strong in the northern region of Martin County. Much ofthe current development is occurring between the coast and the Florida Turnpike, andgrowth is particularly strong in the area surrounding the City of Stuart. Lands west of the
LICENSE RENEWAL APPLICATIONST. LUCIE UNITS 1 & 2
CHAPTER 2.0 SITE AND ENVIRONMENTAL INTERFACES Page 2.8-2
Florida Turnpike are largely agricultural or rural, with a small urban center in Indiantown(Ref. 2.8-1).
Agriculture remains a dominant land use component in both Martin and St. Lucie counties,occupying 278,000 and 294,158 acres, respectively, in 1990. Between 1981 and 1990,farmland acreage decreased by approximately 22,000 acres in Martin County and 30,842 inSt. Lucie County. This represents losses of 7.3 percent and 9.5 percent for the period. Asresidential and commercial development expands westward from the coastal regions,agricultural uses move further west. Although wetland draining is no longer permitted, themigration of agricultural land use has stressed the wetland habitats dominating much ofwestern Martin and St. Lucie counties (Ref. 2.8-4).
2.8.1 HOUSING
In 1990, the Martin and St. Lucie combined-county area had housing stocks of 154,199 and73,843 units, respectively, with vacancy rates of 26 percent and 27 percent, respectively(Ref. 2.8-5). As the area’s population has grown, so have housing stocks. U.S. CensusBureau year 2000 estimates for housing units have increased to 65,471 in Martin Countyand 91,262 in St. Lucie County with vacancy rates of 15.6 percent and 15.7 percent,respectively (Ref. 2.8-6, Chapter 6).
Neither St. Lucie nor Martin County has growth control measures in place that restrict thedevelopment of new housing. Both counties have in place policies and programs to promotethe development of affordable housing.
LICENSE RENEWAL APPLICATIONST. LUCIE UNITS 1 & 2
CHAPTER 2.0 SITE AND ENVIRONMENTAL INTERFACES Page 2.9-1
2.9 SOCIAL SERVICES AND PUBLIC FACILITIES
2.9.1 PUBLIC WATER SUPPLY
St. Lucie Units 1 & 2 acquire potable water from the City of Fort Pierce through the FortPierce Utilities Authority. Current plant usage averages 4 million gallons per month (anaverage of approximately 131,500 gallons per day) for St. Lucie Units 1 & 2, with norestrictions on supply. Discussion of public water systems focuses on St. Lucie and Martincounties because approximately 83 percent of St. Lucie Units 1 & 2’s permanent employeesresides in these counties (see Section 3.4 for workforce description). Potable water serviceis provided by local municipalities and private water companies to residents who do nothave individual onsite wells. These providers are subject to regulation under the FederalSafe Drinking Water Act as implemented by Florida’s Department of EnvironmentalRegulation.
Groundwater—drawn from the shallow, unconfined Surficial Aquifer is—the primary sourceof potable water supplies in St. Lucie and Martin counties (Ref. 2.9-1). Currently, smallamounts of groundwater are also drawn from the Floridan Aquifer. This deeper aquifer is oflower quality and requires desalination (Ref. 2.9-2). As the demand for potable waterincreases, the Floridan Aquifer is seen as a promising source of potable water for urbanareas (Ref. 2.9-1).
The South Florida Water Management District (SFWMD) estimates that in 1990,approximately 42.2 percent of St. Lucie County residents and 45.6 percent of Martin Countyresidents obtained potable water from private wells. The SFWMD estimates that by 2010,these percentages will decrease to 23.7 percent and 34.1 percent for St. Lucie and Martincounties, respectively (Ref. 2.9-3).
There are approximately 107 permitted water treatment plants in St. Lucie County, 104 ofwhich are privately owned. Only five of the privately owned water treatment plants havepermitted capacities greater than 0.1 million gallons per day, and St. Lucie West Utilities isthe only privately owned water treatment plant with a permitted capacity of 1.0 milliongallons per day or above (Ref. 2.9-4). In 1990, the SFWMD estimates that 23.43 milliongallons per day were withdrawn from the Surficial and Floridan aquifers to satisfy waterdemand in St. Lucie County. Public utilities in St. Lucie County were allocated an averageflow of approximately 24.93 million gallons per day. The SFWMD estimates that by 2010,water supply systems in St. Lucie County will service a population of 221,320 people andwill have an average daily demand of 40.06 million gallons per day (Ref. 2.9-3).
The City of Port St. Lucie and the City of Fort Pierce, which supplies St. Lucie Units 1 & 2,are the primary public potable water service providers in St. Lucie County. The Fort PierceUtilities Authority has approximately 40,000 connections in the City of Fort Pierce and invarious areas in St. Lucie County. The water treatment plant has a permitted capacity of20 million gallons per day. SFWMD allocations for the plant include an average flow of17.2 million gallons per day from the Surficial Aquifer. For the 12 months ending December1999, actual daily demand averaged 8.5 million gallons per day with a peak demand ofapproximately 11 million gallons per day. The water treatment plant is not near its capacityand there are no plans to expand the plant’s service capabilities, although construction hasbegun on an adjacent reverse osmosis water plant with a capacity of 5.0 million gallons per
LICENSE RENEWAL APPLICATIONST. LUCIE UNITS 1 & 2
CHAPTER 2.0 SITE AND ENVIRONMENTAL INTERFACES Page 2.9-2
day. The SFWMD estimates that by 2010, the Fort Pierce Utilities Authority will service apopulation of 81,105 people and will have an average daily demand of 14.03 million gallonsper day (Ref. 2.9-3).
Prior to 1991, General Development Utilities, Inc., had a franchise agreement with the Cityof Port St. Lucie to provide potable water services. Water main connections were notkeeping pace with the level of development in the area and only 55 percent of Port St.Lucie’s population was connected to a public water supply system. St. Lucie Countycondemned the utility in 1991, and in 1994, the City of Port St. Lucie bought the utility andagreed to provide service to portions of St. Lucie County (Ref. 2.9-5).
Port St. Lucie Utilities is currently expanding its service capabilities. Port St. Lucie Utilitiesoperates a water service plant withdrawing raw water from the Surficial Aquifer with apermitted capacity of 6.85 million gallons per day, and a reverse osmosis plant withdrawingwater from the Floridan Aquifer with a permitted capacity of 4.0 million gallons per day. Thecapacity of the reverse osmosis plant can be expanded to withdraw 10.0 million gallons ofwater per day. SFWMD allocations for the plant include a maximum permitted raw waterwithdrawal of 7.27 million gallons per day from the Surficial Aquifer and 7.34 million gallonsper day from the Floridan Aquifer. The plant has approximately 26,542 connections and isadding between 200 and 300 connections each month. For the 12 months endingDecember 1999, actual daily demand averaged 5.847 million gallons per day with a peakdemand of approximately 8.246 million gallons per day. The SFWMD estimates that by2010, Port St. Lucie Utilities will service a population of 103,378 people and will have anaverage daily demand of 12.40 million gallons per day (Ref. 2.9-3).
St. Lucie West Utilities is the largest privately owned utility in St. Lucie County and servicesa seven square mile service area in the City of Port St. Lucie. Its one plant has a permittedcapacity of 1.0 million gallons per day and an average daily flow of 0.6 million gallons perday (Ref. 2.9-5). SFWMD allocations for the plant include a maximum permitted raw waterwithdrawal of 4.03 million gallons per day and an average flow of 2.68 million gallons perday. The plant can easily be expanded to treat 10 million gallons of water per day. TheSFWMD estimates that by 2010, St. Lucie West will service a population of 20,399 peopleand will have an average daily demand of 7.51 million gallons per day (Ref. 2.9-3).
St. Lucie County Utilities operates the Holiday Pines and Lakewood Park Subdivision watertreatment plants, for which the combined permitted capacity is less than 0.3 million gallonsper day. St. Lucie County Utilities also operates the North Hutchinson Island WaterDistribution system, which purchases water from Fort Pierce Utilities (Ref. 2.9-4).
There are 139 water supply systems in Martin County (Ref. 2.9-2). Water plants in NorthMartin County, the City of Stuart, Port Salerno, and Hobe Sound all have a permittedcapacity of at least 3.0 million gallons per day. Three other plants and one proposed planthave permitted capacities between 1.0 and 2.0 million gallons per day (Ref. 2.9-3). In 1990,SFWMD estimates that 21.30 million gallons per day were withdrawn from the Surficial andFloridan aquifers to satisfy water demand in Martin County. Public utilities in Martin Countywere allocated an average flow of approximately 20.73 million gallons per day. TheSFWMD estimates that by 2010, water supply systems in Martin County will service apopulation of 101,520 people and will have an average daily demand of 24.36 milliongallons per day (Ref. 2.9-3).
LICENSE RENEWAL APPLICATIONST. LUCIE UNITS 1 & 2
CHAPTER 2.0 SITE AND ENVIRONMENTAL INTERFACES Page 2.9-3
The City of Stuart’s municipal water treatment plant is the largest in Martin County, with apermitted capacity of 6.0 million gallons per day. SFWMD allocations for the plant include amaximum permitted raw water withdrawal of 6.56 million gallons per day and an averageflow of 3.86 million gallons per day. In 1999, average plant production was 3.2 milliongallons per day, with a peak demand of 5.4 million gallons per day. The SFWMD estimatesthat by 2010, the City of Stuart will service a population of 16,296 people and will have anaverage daily demand of 3.96 million gallons per day (Ref. 2.9-3).
2.9.2 TRANSPORTATION
The U.S. Transportation Research Board has developed a commonly used indicator, called“level of service (LOS),” for measuring roadway traffic volume. “Level of service” is aqualitative assessment of traffic flow and how much delay the average vehicle mightencounter during peak hours. Table 2.9-1 presents the “level of service” definitions used bylocal and state agencies, as well as by the NRC in the GEIS (Ref. 2.5-1, Section 3.7.4.2).
Road access to St. Lucie Units 1 & 2 is via State Road A1A, a two-lane highway onHutchinson Island. In the vicinity of the site, State Road A1A carries an LOS designation of‘A’ (Ref. 2.9-6). In Martin County, mainland access to Hutchison Island is available from theJensen Beach Bridge approximately seven miles south of the site, and the Stuart Causewayapproximately 10 miles south of the site. In St. Lucie County, mainland access to HutchisonIsland is available from the South Bridge approximately nine miles north of the plant. Northof St. Lucie Units 1 & 2, in the areas east of the intersection with U.S. Highway 1 on themainland and south of Seaway Drive, State Road A1A carries an LOS of ‘B.’ The SouthBridge area has an LOS designation of ‘C’ (Ref. 2.9-6). South of the site, State Road A1Afrom the Jensen Beach Causeway to where the State Road leaves Hutchinson Islandcarries an LOS designation of ‘B.’ The Stuart Causeway carries an LOS of ‘A’ (Ref. 2.9-7).A fourth bridge, connecting Hutchinson Island to the mainland, has been proposed to bebuilt in St. Lucie County. However, there are no current plans to build such a bridge and it iscurrently uncertain when or where the bridge will be constructed (Ref. 2.1-1, Section2.1.3.1.5). FPL is responsible for the maintenance of the bridges on State Road A1A thatcross the site’s Intake and Discharge canals (Ref. 2.9-8).
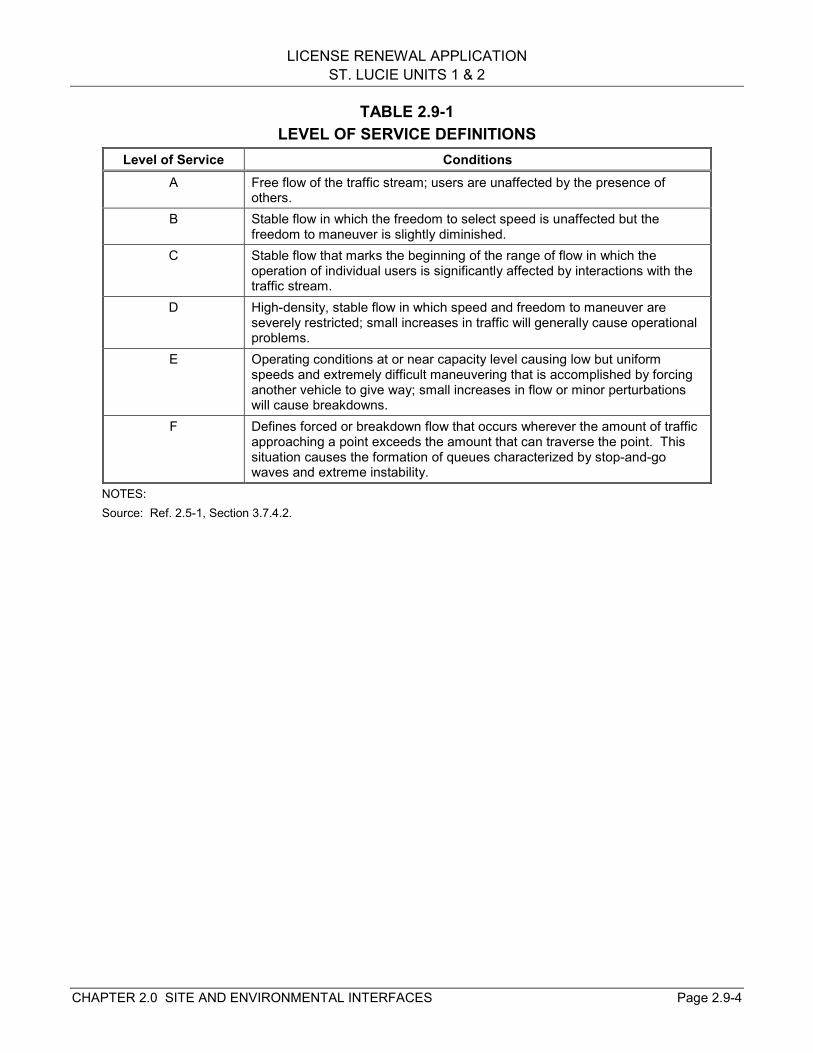
LICENSE RENEWAL APPLICATIONST. LUCIE UNITS 1 & 2
CHAPTER 2.0 SITE AND ENVIRONMENTAL INTERFACES Page 2.9-4
TABLE 2.9-1LEVEL OF SERVICE DEFINITIONS
Level of Service ConditionsA Free flow of the traffic stream; users are unaffected by the presence of
others.B Stable flow in which the freedom to select speed is unaffected but the
freedom to maneuver is slightly diminished.C Stable flow that marks the beginning of the range of flow in which the
operation of individual users is significantly affected by interactions with thetraffic stream.
D High-density, stable flow in which speed and freedom to maneuver areseverely restricted; small increases in traffic will generally cause operationalproblems.
E Operating conditions at or near capacity level causing low but uniformspeeds and extremely difficult maneuvering that is accomplished by forcinganother vehicle to give way; small increases in flow or minor perturbationswill cause breakdowns.
F Defines forced or breakdown flow that occurs wherever the amount of trafficapproaching a point exceeds the amount that can traverse the point. Thissituation causes the formation of queues characterized by stop-and-gowaves and extreme instability.
NOTES:Source: Ref. 2.5-1, Section 3.7.4.2.

LICENSE RENEWAL APPLICATIONST. LUCIE UNITS 1 & 2
CHAPTER 2.0 SITE AND ENVIRONMENTAL INTERFACES Page 2.10-1
2.10 HISTORIC AND ARCHAEOLOGICAL RESOURCESThe construction of St. Lucie Units 1 & 2 in the 1970s did not threaten any known historic orarchaeological resources of significance. The north end of the site, which has been left in itsnatural state, was noted as having some unexplored Indian mounds and middens (Ref. 2.1-2, Section 2.3). An archaeological and historical resources survey of St. Lucie Units 1 & 2’stransmission line corridor, performed in 1973 by the Florida Bureau of Historic Sites andProperties, did not reveal any impacts to known historic or archaeological resources ofsignificance (Ref. 2.10-1).
The National Register of Historic Places lists no historic places on or near the St. Lucie Units1 & 2 site, associated transmission lines, or Hutchinson Island. The nearest site listed is theCaptain Hammond House, a residential home built in 1902 in White City, Florida,approximately five and a half miles west of the plant (Ref. 2.10-2). Approximately seven anda half miles northeast of the site lies the Fort Pierce Site, a wooded park that encompassesthe ruins of an Ais Indian culture, which was listed with the National Register of HistoricPlaces in 1974.
Florida’s Bureau of Archaeological Research of the Division of Historical Resources haslisted in the Florida Master Site File some 22 archaeological sites and 47 standing structureswithin approximately 5 miles of St. Lucie Units 1 & 2. Of these, eight archaeological sitesare in close proximity to the plant (within 1-2 miles). Four of these sites are shipwrecks ofvarious ages. The other four sites include middens, mounds, and burial middens ranging inage from unspecified, to prehistoric, to the St. John’s Period (500 B.C. to 1300 A.D.). Thetwo sites from the St. John’s Period are associated with the Malabar Indian culture (Ref.2.10-3).
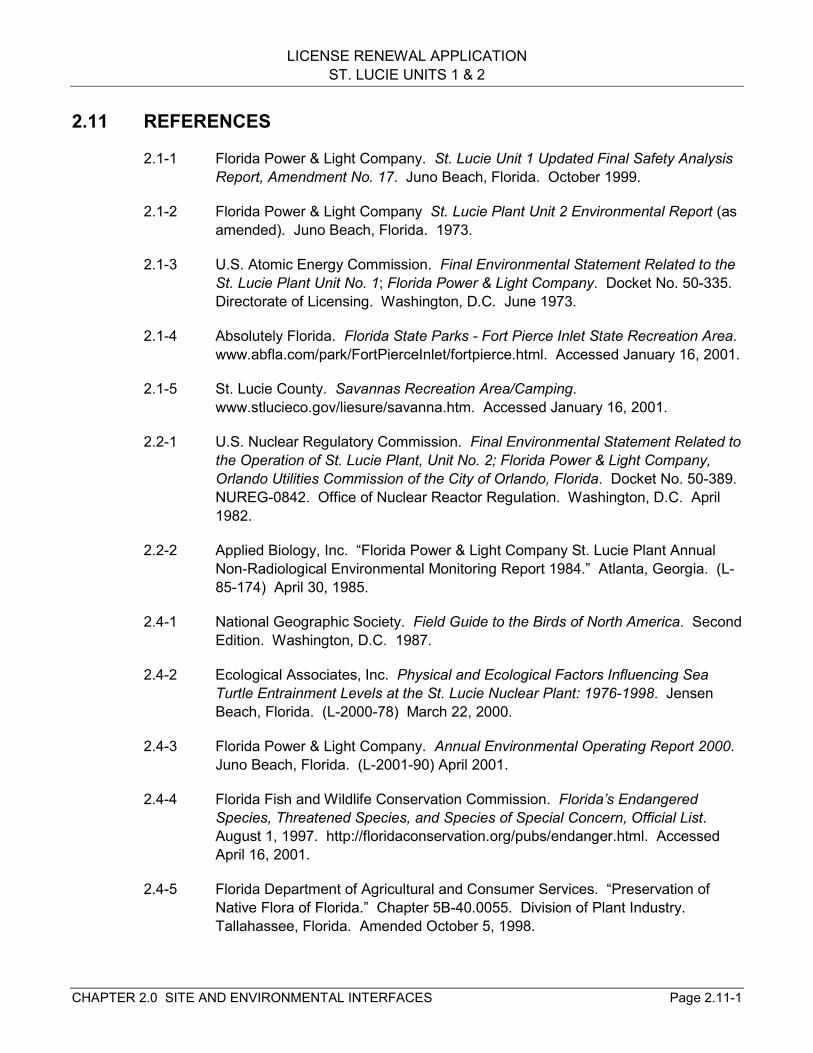
LICENSE RENEWAL APPLICATIONST. LUCIE UNITS 1 & 2
CHAPTER 2.0 SITE AND ENVIRONMENTAL INTERFACES Page 2.11-1
2.11 REFERENCES
2.1-1 Florida Power & Light Company. St. Lucie Unit 1 Updated Final Safety AnalysisReport, Amendment No. 17. Juno Beach, Florida. October 1999.
2.1-2 Florida Power & Light Company St. Lucie Plant Unit 2 Environmental Report (asamended). Juno Beach, Florida. 1973.
2.1-3 U.S. Atomic Energy Commission. Final Environmental Statement Related to theSt. Lucie Plant Unit No. 1; Florida Power & Light Company. Docket No. 50-335.Directorate of Licensing. Washington, D.C. June 1973.
2.1-4 Absolutely Florida. Florida State Parks - Fort Pierce Inlet State Recreation Area.www.abfla.com/park/FortPierceInlet/fortpierce.html. Accessed January 16, 2001.
2.1-5 St. Lucie County. Savannas Recreation Area/Camping.www.stlucieco.gov/liesure/savanna.htm. Accessed January 16, 2001.
2.2-1 U.S. Nuclear Regulatory Commission. Final Environmental Statement Related tothe Operation of St. Lucie Plant, Unit No. 2; Florida Power & Light Company,Orlando Utilities Commission of the City of Orlando, Florida. Docket No. 50-389.NUREG-0842. Office of Nuclear Reactor Regulation. Washington, D.C. April1982.
2.2-2 Applied Biology, Inc. “Florida Power & Light Company St. Lucie Plant AnnualNon-Radiological Environmental Monitoring Report 1984.” Atlanta, Georgia. (L-85-174) April 30, 1985.
2.4-1 National Geographic Society. Field Guide to the Birds of North America. SecondEdition. Washington, D.C. 1987.
2.4-2 Ecological Associates, Inc. Physical and Ecological Factors Influencing SeaTurtle Entrainment Levels at the St. Lucie Nuclear Plant: 1976-1998. JensenBeach, Florida. (L-2000-78) March 22, 2000.
2.4-3 Florida Power & Light Company. Annual Environmental Operating Report 2000.Juno Beach, Florida. (L-2001-90) April 2001.
2.4-4 Florida Fish and Wildlife Conservation Commission. Florida’s EndangeredSpecies, Threatened Species, and Species of Special Concern, Official List.August 1, 1997. http://floridaconservation.org/pubs/endanger.html. AccessedApril 16, 2001.
2.4-5 Florida Department of Agricultural and Consumer Services. “Preservation ofNative Flora of Florida.” Chapter 5B-40.0055. Division of Plant Industry.Tallahassee, Florida. Amended October 5, 1998.
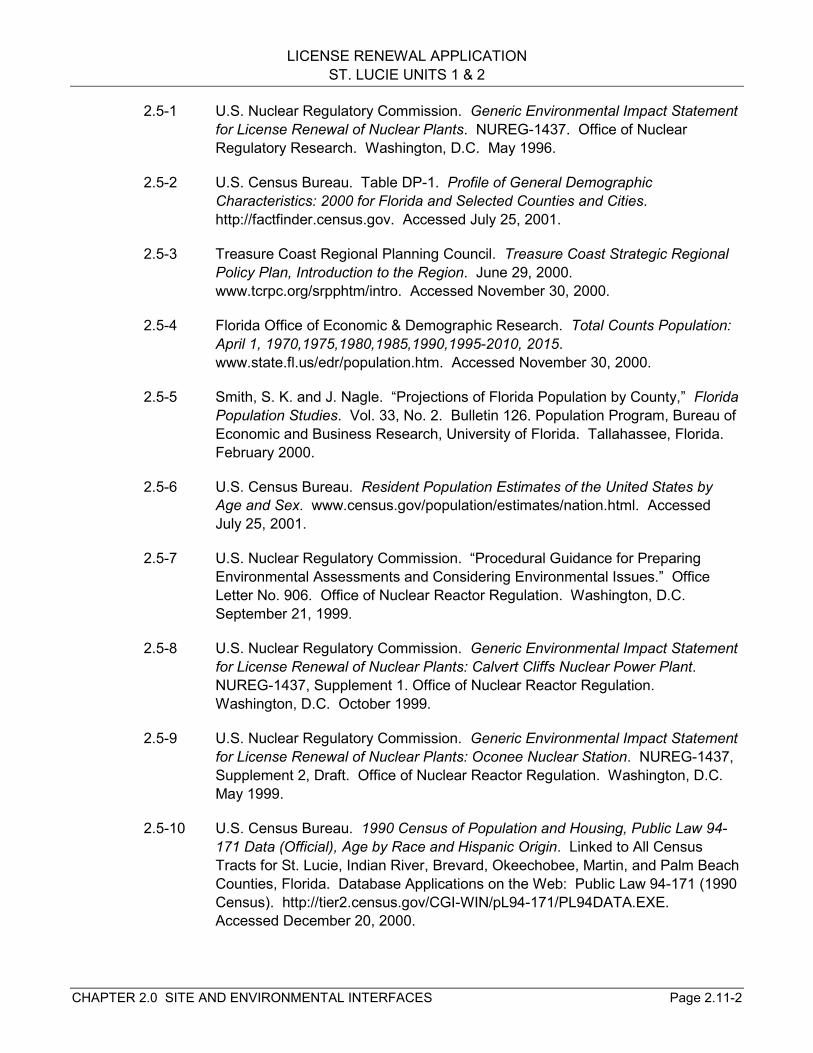
LICENSE RENEWAL APPLICATIONST. LUCIE UNITS 1 & 2
CHAPTER 2.0 SITE AND ENVIRONMENTAL INTERFACES Page 2.11-2
2.5-1 U.S. Nuclear Regulatory Commission. Generic Environmental Impact Statementfor License Renewal of Nuclear Plants. NUREG-1437. Office of NuclearRegulatory Research. Washington, D.C. May 1996.
2.5-2 U.S. Census Bureau. Table DP-1. Profile of General DemographicCharacteristics: 2000 for Florida and Selected Counties and Cities.http://factfinder.census.gov. Accessed July 25, 2001.
2.5-3 Treasure Coast Regional Planning Council. Treasure Coast Strategic RegionalPolicy Plan, Introduction to the Region. June 29, 2000.www.tcrpc.org/srpphtm/intro. Accessed November 30, 2000.
2.5-4 Florida Office of Economic & Demographic Research. Total Counts Population:April 1, 1970,1975,1980,1985,1990,1995-2010, 2015.www.state.fl.us/edr/population.htm. Accessed November 30, 2000.
2.5-5 Smith, S. K. and J. Nagle. “Projections of Florida Population by County,” FloridaPopulation Studies. Vol. 33, No. 2. Bulletin 126. Population Program, Bureau ofEconomic and Business Research, University of Florida. Tallahassee, Florida.February 2000.
2.5-6 U.S. Census Bureau. Resident Population Estimates of the United States byAge and Sex. www.census.gov/population/estimates/nation.html. AccessedJuly 25, 2001.
2.5-7 U.S. Nuclear Regulatory Commission. “Procedural Guidance for PreparingEnvironmental Assessments and Considering Environmental Issues.” OfficeLetter No. 906. Office of Nuclear Reactor Regulation. Washington, D.C.September 21, 1999.
2.5-8 U.S. Nuclear Regulatory Commission. Generic Environmental Impact Statementfor License Renewal of Nuclear Plants: Calvert Cliffs Nuclear Power Plant.NUREG-1437, Supplement 1. Office of Nuclear Reactor Regulation.Washington, D.C. October 1999.
2.5-9 U.S. Nuclear Regulatory Commission. Generic Environmental Impact Statementfor License Renewal of Nuclear Plants: Oconee Nuclear Station. NUREG-1437,Supplement 2, Draft. Office of Nuclear Reactor Regulation. Washington, D.C.May 1999.
2.5-10 U.S. Census Bureau. 1990 Census of Population and Housing, Public Law 94-171 Data (Official), Age by Race and Hispanic Origin. Linked to All CensusTracts for St. Lucie, Indian River, Brevard, Okeechobee, Martin, and Palm BeachCounties, Florida. Database Applications on the Web: Public Law 94-171 (1990Census). http://tier2.census.gov/CGI-WIN/pL94-171/PL94DATA.EXE.Accessed December 20, 2000.
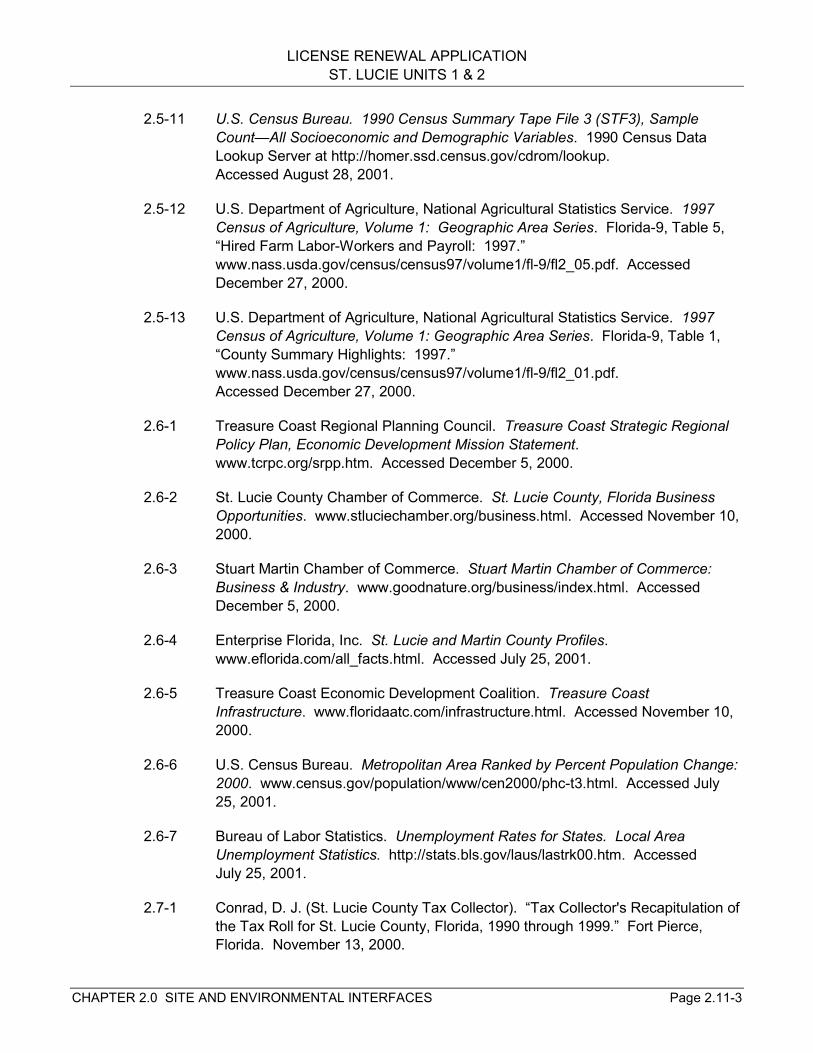
LICENSE RENEWAL APPLICATIONST. LUCIE UNITS 1 & 2
CHAPTER 2.0 SITE AND ENVIRONMENTAL INTERFACES Page 2.11-3
2.5-11 U.S. Census Bureau. 1990 Census Summary Tape File 3 (STF3), SampleCount—All Socioeconomic and Demographic Variables. 1990 Census DataLookup Server at http://homer.ssd.census.gov/cdrom/lookup.Accessed August 28, 2001.
2.5-12 U.S. Department of Agriculture, National Agricultural Statistics Service. 1997Census of Agriculture, Volume 1: Geographic Area Series. Florida-9, Table 5,“Hired Farm Labor-Workers and Payroll: 1997.”www.nass.usda.gov/census/census97/volume1/fl-9/fl2_05.pdf. AccessedDecember 27, 2000.
2.5-13 U.S. Department of Agriculture, National Agricultural Statistics Service. 1997Census of Agriculture, Volume 1: Geographic Area Series. Florida-9, Table 1,“County Summary Highlights: 1997.”www.nass.usda.gov/census/census97/volume1/fl-9/fl2_01.pdf.Accessed December 27, 2000.
2.6-1 Treasure Coast Regional Planning Council. Treasure Coast Strategic RegionalPolicy Plan, Economic Development Mission Statement.www.tcrpc.org/srpp.htm. Accessed December 5, 2000.
2.6-2 St. Lucie County Chamber of Commerce. St. Lucie County, Florida BusinessOpportunities. www.stluciechamber.org/business.html. Accessed November 10,2000.
2.6-3 Stuart Martin Chamber of Commerce. Stuart Martin Chamber of Commerce:Business & Industry. www.goodnature.org/business/index.html. AccessedDecember 5, 2000.
2.6-4 Enterprise Florida, Inc. St. Lucie and Martin County Profiles.www.eflorida.com/all_facts.html. Accessed July 25, 2001.
2.6-5 Treasure Coast Economic Development Coalition. Treasure CoastInfrastructure. www.floridaatc.com/infrastructure.html. Accessed November 10,2000.
2.6-6 U.S. Census Bureau. Metropolitan Area Ranked by Percent Population Change:2000. www.census.gov/population/www/cen2000/phc-t3.html. Accessed July25, 2001.
2.6-7 Bureau of Labor Statistics. Unemployment Rates for States. Local AreaUnemployment Statistics. http://stats.bls.gov/laus/lastrk00.htm. AccessedJuly 25, 2001.
2.7-1 Conrad, D. J. (St. Lucie County Tax Collector). “Tax Collector's Recapitulation ofthe Tax Roll for St. Lucie County, Florida, 1990 through 1999.” Fort Pierce,Florida. November 13, 2000.
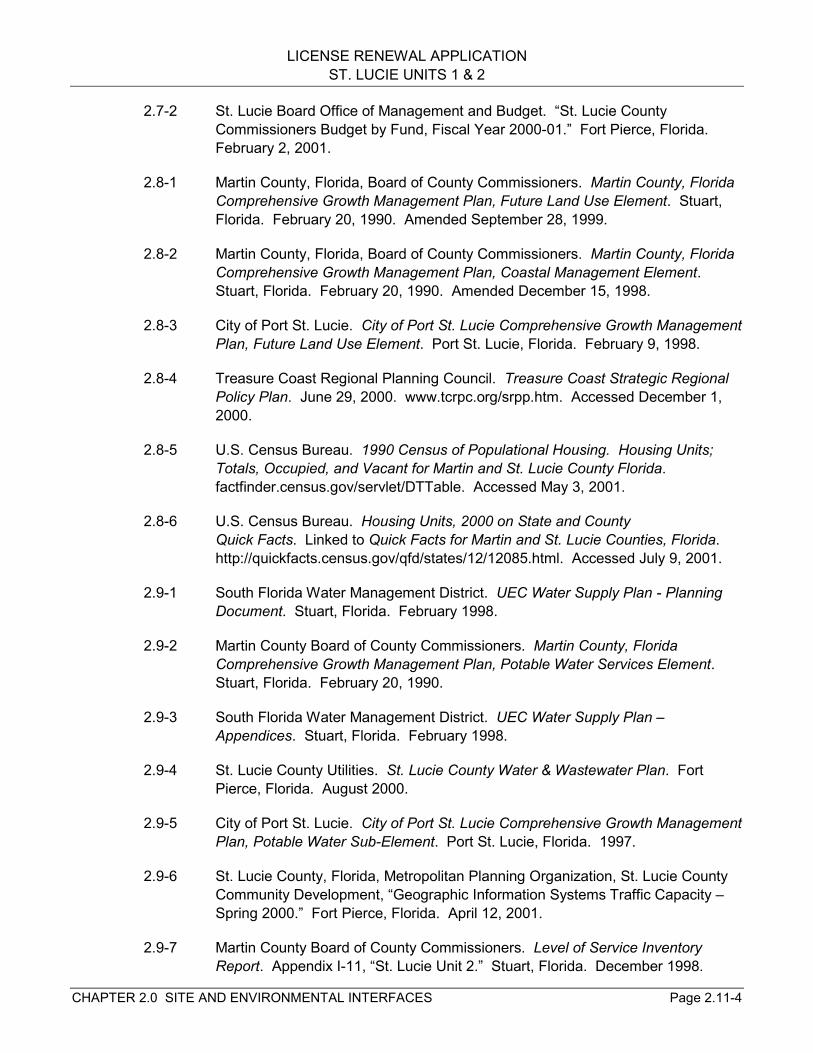
LICENSE RENEWAL APPLICATIONST. LUCIE UNITS 1 & 2
CHAPTER 2.0 SITE AND ENVIRONMENTAL INTERFACES Page 2.11-4
2.7-2 St. Lucie Board Office of Management and Budget. “St. Lucie CountyCommissioners Budget by Fund, Fiscal Year 2000-01.” Fort Pierce, Florida.February 2, 2001.
2.8-1 Martin County, Florida, Board of County Commissioners. Martin County, FloridaComprehensive Growth Management Plan, Future Land Use Element. Stuart,Florida. February 20, 1990. Amended September 28, 1999.
2.8-2 Martin County, Florida, Board of County Commissioners. Martin County, FloridaComprehensive Growth Management Plan, Coastal Management Element.Stuart, Florida. February 20, 1990. Amended December 15, 1998.
2.8-3 City of Port St. Lucie. City of Port St. Lucie Comprehensive Growth ManagementPlan, Future Land Use Element. Port St. Lucie, Florida. February 9, 1998.
2.8-4 Treasure Coast Regional Planning Council. Treasure Coast Strategic RegionalPolicy Plan. June 29, 2000. www.tcrpc.org/srpp.htm. Accessed December 1,2000.
2.8-5 U.S. Census Bureau. 1990 Census of Populational Housing. Housing Units;Totals, Occupied, and Vacant for Martin and St. Lucie County Florida.factfinder.census.gov/servlet/DTTable. Accessed May 3, 2001.
2.8-6 U.S. Census Bureau. Housing Units, 2000 on State and CountyQuick Facts. Linked to Quick Facts for Martin and St. Lucie Counties, Florida.http://quickfacts.census.gov/qfd/states/12/12085.html. Accessed July 9, 2001.
2.9-1 South Florida Water Management District. UEC Water Supply Plan - PlanningDocument. Stuart, Florida. February 1998.
2.9-2 Martin County Board of County Commissioners. Martin County, FloridaComprehensive Growth Management Plan, Potable Water Services Element.Stuart, Florida. February 20, 1990.
2.9-3 South Florida Water Management District. UEC Water Supply Plan –Appendices. Stuart, Florida. February 1998.
2.9-4 St. Lucie County Utilities. St. Lucie County Water & Wastewater Plan. FortPierce, Florida. August 2000.
2.9-5 City of Port St. Lucie. City of Port St. Lucie Comprehensive Growth ManagementPlan, Potable Water Sub-Element. Port St. Lucie, Florida. 1997.
2.9-6 St. Lucie County, Florida, Metropolitan Planning Organization, St. Lucie CountyCommunity Development, “Geographic Information Systems Traffic Capacity –Spring 2000.” Fort Pierce, Florida. April 12, 2001.
2.9-7 Martin County Board of County Commissioners. Level of Service InventoryReport. Appendix I-11, “St. Lucie Unit 2.” Stuart, Florida. December 1998.
LICENSE RENEWAL APPLICATIONST. LUCIE UNITS 1 & 2
CHAPTER 2.0 SITE AND ENVIRONMENTAL INTERFACES Page 2.11-5
2.9-8 State of Florida and Florida Power & Light Company. State Road A1AAgreement for Plant St. Lucie. Stuart, Florida. July 9, 1973.
2.10-1 Morrell, L. R. (State of Florida, Bureau of Historic Sites and Properties) Letter toW. J. Barrow (FPL). “Archaeological and Historical Survey Results of the St.Lucie Plant Transmission Line Right-of-Way.” May 31, 1973 [See Appendix 6 tothe Unit 1 Final Environmental Statement dated June 1973].
2.10-2 National Register Information System. National Register of Historic Places.www.nr.nps.gov/nrloc1.htm. Accessed November 8, 2000.
2.10-3 Florida Division of Historical Resources, Bureau of Archaeological Research.Florida Master Site File. St. Lucie County, Florida. 2000.
LICENSE RENEWAL APPLICATIONST. LUCIE UNITS 1 & 2
Chapter 3.0 The Proposed Action Page 3.1-1
3.0 PROPOSED ACTION
NRC“The report must contain a description of the proposed action, including the applicant’s plansto modify the facility or its administrative control procedures…This report must describe indetail the modifications directly affecting the environment or affecting plant effluents thataffect the environment….” 10 CFR 51.53(c)(2)
Florida Power & Light Company (FPL) proposes that the U.S. Nuclear RegulatoryCommission (NRC) renew the St. Lucie Units 1 & 2 operating licenses for an additional 20years. Renewal would give FPL and the State of Florida the option of relying on St. LucieUnits 1 & 2 to meet Florida’s future needs for electric generation. Section 3.1 provides ageneral description of selected plant design and operating features. Sections 3.2 through3.4 address potential changes that could be required to support renewed operating licenses.
3.1 GENERAL PLANT INFORMATIONGeneral information about design and operational features of St. Lucie Units 1 & 2 ofinterest from an environmental impact standpoint is available in several documents. Amongthe most comprehensive sources are the Final Environmental Statements prepared by theNRC or its predecessor agency, the U.S. Atomic Energy Commission (AEC), and UpdatedFinal Safety Analysis Reports (UFSARs), prepared and maintained by FPL. The AECissued a Final Environmental Statement (FES) in 1973 that addressed continuedconstruction and operation of Unit 1 (Ref. 3.1-1), and issued an FES in 1974 that addressedconstruction of Unit 2 (Ref. 3.1-2). The NRC issued the FES for Unit 2 operation in 1982(Ref. 3.1-3). FPL maintains separate Unit 1 and Unit 2 UFSARs, which provide currentdesign information (Ref. 3.1-4; Ref. 3.1-5). The NRC’s Generic Environmental ImpactStatement for License Renewal of Nuclear Plants (GEIS) describes some St. Lucie Units 1 &2 plant features of interest to license renewal (Ref. 3.1-6). FPL used these documents andother sources as a basis for the plant descriptive information presented in the remainder ofSection 3.1.
The arrangement of St. Lucie Units 1 & 2 major structures and equipment in the power blockand nearby areas is shown in Figure 3.1-1. The prominent structures and housed facilitiesand equipment associated with each of the Units include: the Containment Building, whichhouses the nuclear steam supply system, including the reactor, steam generators, reactorcoolant pumps, and related equipment; the Turbine Generator Building, where the turbinegenerator and associated main condensers are located; the Auxiliary Building, which houseswaste management facilities, engineered safety features components, and other facilities;and the Fuel Handling Building, where the spent fuel storage pool and storage facilities fornew fuel are located. Prominent features beyond the power block area include the IntakeCanal, Discharge Canal, Intake Wells, Evaporation/Percolation (i.e., Evapo-percolation)Ponds, Switchyard, technical and administrative support facilities, and public educationfacilities (Energy Encounter Exhibit, Marine Education Facility). The taller buildings on thesite, particularly the Containment Buildings (approximately 200 feet high) are visible from themainland.
LICENSE RENEWAL APPLICATIONST. LUCIE UNITS 1 & 2
Chapter 3.0 The Proposed Action Page 3.1-2
LICENSE RENEWAL APPLICATIONST. LUCIE UNITS 1 & 2
Chapter 3.0 The Proposed Action Page 3.1-3
3.1.1 REACTOR AND CONTAINMENT SYSTEMS
The nuclear power units for St. Lucie Units 1 & 2 are of comparable design, each consistingof a pressurized light-water reactor with two steam generators that produce steam that turnsa turbine to generate electricity. Each Unit is currently licensed to operate at an output of2,700 megawatts (thermal) [MW(t)], with a corresponding gross electrical output ofapproximately 890 megawatts (electric) [MW(e)]. Discounting onsite electrical power usage,each reactor unit has a current net capability of 839 MW(e), for a combined plant capabilityof 1,678 MW(e) (net summer rating) (Ref. 3.1-4; Ref. 3.1-5, Section1.1; Ref. 3.1-7,Schedule 1).
Each reactor is housed in a containment comprising a steel containment vessel surroundedby a reinforced concrete shield building. The dry containment structures are designed towithstand environmental effects and the internal pressure and temperature accompanying apostulated loss-of-coolant accident (LOCA). Together with its engineered safety features,each containment structure is designed to adequately retain fission products that couldescape from the reactor coolant system in the event of a LOCA.
3.1.2 NUCLEAR FUEL
St. Lucie Units 1 & 2 are licensed for uranium-dioxide fuel that is slightly enriched up to 4.5percent by weight uranium-235. The uranium-dioxide fuel is in the form of pellets containedin Zircaloy tubes with welded end plugs to confine radionuclides. The tubes are fabricatedinto assemblies designed for loading into the reactor core. Each reactor core includes 217fuel assemblies.
FPL currently replaces approximately one-third of the fuel assemblies in each reactor at aninterval of approximately 18 months. FPL operates the reactors such that the averageburnup for fuel discharged from the reactors is approximately 47,000 megawatt-days permetric ton uranium.
3.1.3 COOLING AND AUXILIARY WATER SYSTEMS
3.1.3.1 WATER USE OVERVIEW
Water use associated with operation of St. Lucie Units 1 & 2 consists of saltwater withdrawnfrom the Atlantic Ocean for non-contact cooling purposes and freshwater from a municipalwater source for potable and service water use, discussed in more detail below. Minoramounts of ocean water are also withdrawn by St. Lucie County from the Intake Canal forseasonal flushing of the mangrove impoundment between the Intake and Discharge canals(see Figure 3.1-1) to enhance growth of mangroves and assist in mosquito control (Ref. 3.1-8). FPL also withdraws small amounts of water from the canals for mariculture and relatedprojects.
As described in Section 2.9-1, FPL acquires potable and service water from the City of FortPierce through the Fort Pierce Utilities Authority. Although the municipal water supply for St.Lucie Units 1 & 2 draws on groundwater sources, plant operation does not involve any directwithdrawals of groundwater. Onsite groundwater withdrawals are limited to those needed tocontain and treat groundwater that was contaminated by a diesel fuel spill in 1992. The totaldesign flow rate for recovery wells associated with this remediation activity is 7.5 gallons perminute (gpm); actual withdrawals have averaged substantially less (Ref. 3.1-9). FPL
LICENSE RENEWAL APPLICATIONST. LUCIE UNITS 1 & 2
Chapter 3.0 The Proposed Action Page 3.1-4
expects the remediation to be completed within the next few years, prior to the period ofextended operation.
An onsite package plant was originally used to treat the site’s sanitary wastewater, whichwas then discharged into the Discharge Canal. However, since September 1997, uponcompletion of St. Lucie County’s South Hutchinson Island Water Reclamation Facility, sitesanitary wastewater has been discharged to the St. Lucie County system for treatment.
3.1.3.2 COOLING WATER SYSTEMS
St. Lucie Units 1 & 2 use once-through cooling water from the Atlantic Ocean to removeheat from the main (turbine) condensers via the Circulating Water System, and to removeheat from other auxiliary equipment via the Intake Cooling Water System (i.e., AuxiliaryCooling Water System). The great majority of this cooling water is used for the CirculatingWater System.
As with other pressurized water reactors, heat generated in the reactors is transferred inloops in a way that useful energy can be safely extracted to produce electricity. St. LucieUnits 1 & 2 have a two-loop, three-stage heat-transfer design. The primary systemcirculates reactor coolant (demineralized water that has been treated to control chemistryand corrosion) under high pressure through the reactor and two steam generators. Thesteam generators, steam turbine, and main turbine condensers are similarly connected in asecondary closed loop containing treated, demineralized water. Secondary-system waterflashes to steam in the steam generators and the steam turns the turbine to generateelectricity. After exiting the turbine, the steam in the secondary system passes through themain condensers, where it is cooled to liquid water before returning to the steam generatorto complete the secondary loop.
The Circulating Water System is the final (tertiary) stage in this heat transfer system. Unlikethe primary and secondary loops, the tertiary stage is unconfined. Ocean water is drawnthrough three offshore intake structures into the Intake Canal. This water is then pumpedfrom the Intake Canal at the Intake Wells through the main condensers to the DischargeCanal. The heated water is finally discharged back to the Atlantic Ocean through offshorediffusers (see Figures 2.1-3 and 3.1-1). Circulation of water in the system is provided by atotal of eight circulating water pumps (four per Unit) located at the Intake Wells. Nominaltotal capacity of the pumps is 968,000 gpm, though capacity may range from 800,000 gpmto 1,120,000 gpm, depending on condenser cleanliness (Ref. 3.1-8). When all pumps areoperating and both Units are operating at 100 percent capacity, temperature rise across thecondensers is approximately 24°F.
The three cooling water intake structures for St. Lucie Units 1 & 2 are located approximately1,200 feet offshore where the water is approximately 23 feet deep. Two of the structureswere installed prior to startup of Unit 1 in 1976. The third intake structure, which is largerthan the initial two, was installed in 1983. The designs of the structures are essentiallyidentical, featuring a large concrete base with a vertical cylindrical opening in the center anda concrete velocity cap supported by columns extending approximately 6 feet from the base(Ref. 3.1-3; Ref. 3.1-10). The velocity cap configuration was designed to reduce potentialentrainment of marine organisms by eliminating vertical flows and limiting horizontal flowvelocities. Water withdrawn from the structures is conveyed through separate buried pipes,beneath the beach and dune system, to the Intake Canal. Inside diameters of the pipes,
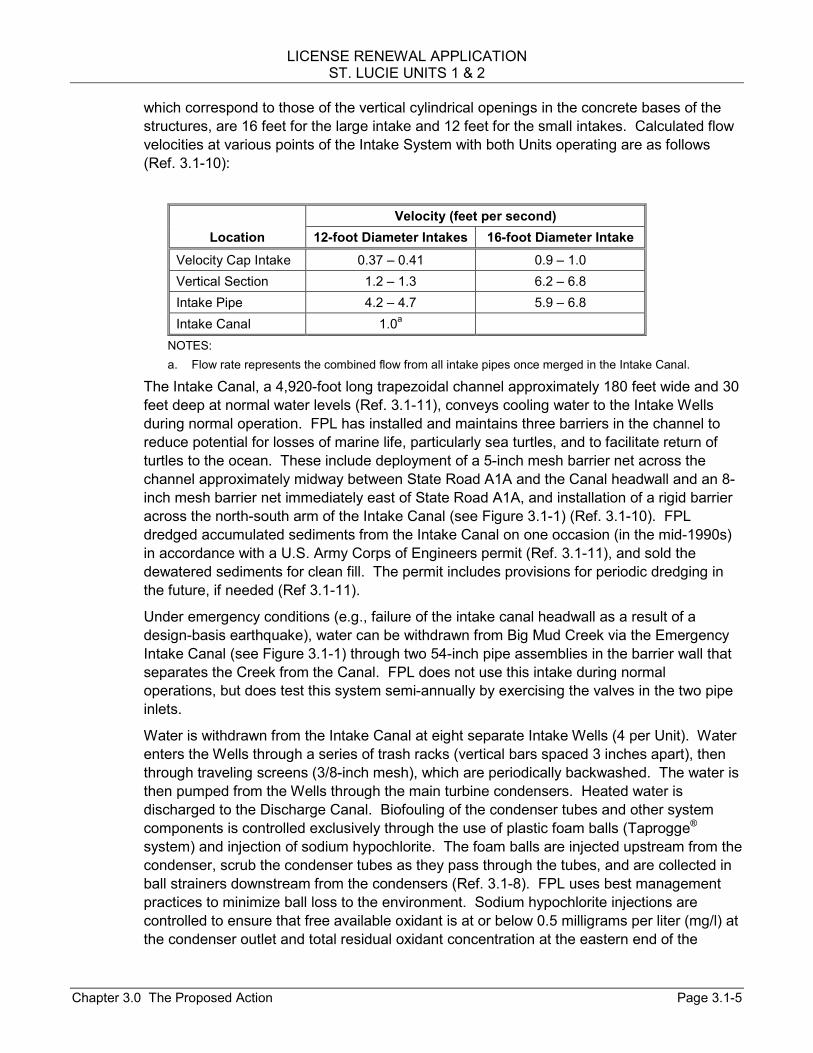
LICENSE RENEWAL APPLICATIONST. LUCIE UNITS 1 & 2
Chapter 3.0 The Proposed Action Page 3.1-5
which correspond to those of the vertical cylindrical openings in the concrete bases of thestructures, are 16 feet for the large intake and 12 feet for the small intakes. Calculated flowvelocities at various points of the Intake System with both Units operating are as follows(Ref. 3.1-10):
Velocity (feet per second)Location 12-foot Diameter Intakes 16-foot Diameter Intake
Velocity Cap Intake 0.37 – 0.41 0.9 – 1.0Vertical Section 1.2 – 1.3 6.2 – 6.8Intake Pipe 4.2 – 4.7 5.9 – 6.8Intake Canal 1.0a
NOTES:a. Flow rate represents the combined flow from all intake pipes once merged in the Intake Canal.
The Intake Canal, a 4,920-foot long trapezoidal channel approximately 180 feet wide and 30feet deep at normal water levels (Ref. 3.1-11), conveys cooling water to the Intake Wellsduring normal operation. FPL has installed and maintains three barriers in the channel toreduce potential for losses of marine life, particularly sea turtles, and to facilitate return ofturtles to the ocean. These include deployment of a 5-inch mesh barrier net across thechannel approximately midway between State Road A1A and the Canal headwall and an 8-inch mesh barrier net immediately east of State Road A1A, and installation of a rigid barrieracross the north-south arm of the Intake Canal (see Figure 3.1-1) (Ref. 3.1-10). FPLdredged accumulated sediments from the Intake Canal on one occasion (in the mid-1990s)in accordance with a U.S. Army Corps of Engineers permit (Ref. 3.1-11), and sold thedewatered sediments for clean fill. The permit includes provisions for periodic dredging inthe future, if needed (Ref 3.1-11).
Under emergency conditions (e.g., failure of the intake canal headwall as a result of adesign-basis earthquake), water can be withdrawn from Big Mud Creek via the EmergencyIntake Canal (see Figure 3.1-1) through two 54-inch pipe assemblies in the barrier wall thatseparates the Creek from the Canal. FPL does not use this intake during normaloperations, but does test this system semi-annually by exercising the valves in the two pipeinlets.
Water is withdrawn from the Intake Canal at eight separate Intake Wells (4 per Unit). Waterenters the Wells through a series of trash racks (vertical bars spaced 3 inches apart), thenthrough traveling screens (3/8-inch mesh), which are periodically backwashed. The water isthen pumped from the Wells through the main turbine condensers. Heated water isdischarged to the Discharge Canal. Biofouling of the condenser tubes and other systemcomponents is controlled exclusively through the use of plastic foam balls (Taprogge®
system) and injection of sodium hypochlorite. The foam balls are injected upstream from thecondenser, scrub the condenser tubes as they pass through the tubes, and are collected inball strainers downstream from the condensers (Ref. 3.1-8). FPL uses best managementpractices to minimize ball loss to the environment. Sodium hypochlorite injections arecontrolled to ensure that free available oxidant is at or below 0.5 milligrams per liter (mg/l) atthe condenser outlet and total residual oxidant concentration at the eastern end of the
LICENSE RENEWAL APPLICATIONST. LUCIE UNITS 1 & 2
Chapter 3.0 The Proposed Action Page 3.1-6
Discharge Canal is at or below 0.10 mg/l, as required by the Industrial Wastewater FacilityPermit for St. Lucie Units 1 & 2 (Ref. 3.1-12).
The Discharge Canal, 2,200 feet long with transverse dimensions similar to those describedfor the Intake Canal, transports the heated cooling water to two discharge pipes at itseastern terminus. The pipes transport water beneath the beach and dune system back tothe Atlantic Ocean. One of the pipes, completed in 1975 to serve St. Lucie Unit 1, is 12 feetin diameter, extends approximately 1,500 feet offshore, and terminates in a two-port “Y”diffuser. The other pipe, installed in 1981 for two-unit operation, is 16 feet in diameter,extends approximately 3,400 feet offshore, and features a multiport diffuser. This diffuserconsists of fifty-eight 16-inch diameter ports located 24 feet apart on the easternmost 1,400feet of the pipe. The discharge of heated water through the Y-port and multiport diffusersensure distribution over a wide area and rapid and efficient mixing with ambient waters (Ref.3.1-8; Ref. 3.1-9). Modeling studies presented by the AEC and NRC in the operating stageFESs indicate that the areas of the thermal plumes to the 2°F isotherm from the St. LucieUnits 1 & 2 diffusers under typical conditions would be approximately 180 acres and 175acres, respectively (Ref. 3.1-1; Ref. 3.1-3).
Temperature of the discharged cooling water is limited by the Industrial Wastewater FacilityPermit for St. Lucie Units 1 & 2 (Ref. 3.1-12). These limits require that heated water fromthe diffusers, as measured near the exit from the Discharge Canal, not exceed 113°F or30°F above ambient during normal operations; a maximum temperature of 117°F or 32°Fabove ambient is permitted during certain maintenance operations, when throttlingcirculating water pumps to minimize use of chlorine, and when biofouling of the CirculatingWater System occurs.
The Intake Cooling Water System for St. Lucie Units 1 & 2 is also a once-through coolingsystem, but uses much less water than the Circulating Water Systems. Up to 58,000 gpm ofocean cooling water is pumped from the Intake Canal using intake cooling water pumps.This non-contact cooling water is pumped through heat exchangers to provide cooling for awide variety of plant equipment, and is discharged to the Discharge Canal. Low-levelchlorination is used to control biofouling of this system (Ref. 3.1-8).
3.1.3.3 MUNICIPAL WATER SUPPLY
St. Lucie Units 1 & 2 use a combined total of approximately 4 million gallons per month(0.13 million gallons per day) of fresh water from the Fort Pierce Municipal Water SupplySystem. This water supply provides the raw water source for the plant water treatmentfacility, which provides demineralized water for makeup to various plant systems includingthe primary and secondary reactor cooling loops and the spent fuel pool. The municipalwater also is the source of supply to potable, sanitary, and fire protection systems.
3.1.4 POWER TRANSMISSION SYSTEMS
FPL constructed three 230 kilovolt (kV) transmission lines for the purpose of connectingSt. Lucie Units 1 & 2 to the transmission system. Beginning at the St. Lucie Units 1 & 2Switchyard, these three lines run west across the Indian River and overland forapproximately 11 miles in one corridor, with the lines terminating at the Midway Substation(see Figure 3.1-2). “Corridor” is a general term used to identify land over which utilitiesconstruct and operate transmission lines. A utility can own the land, in which case it holds
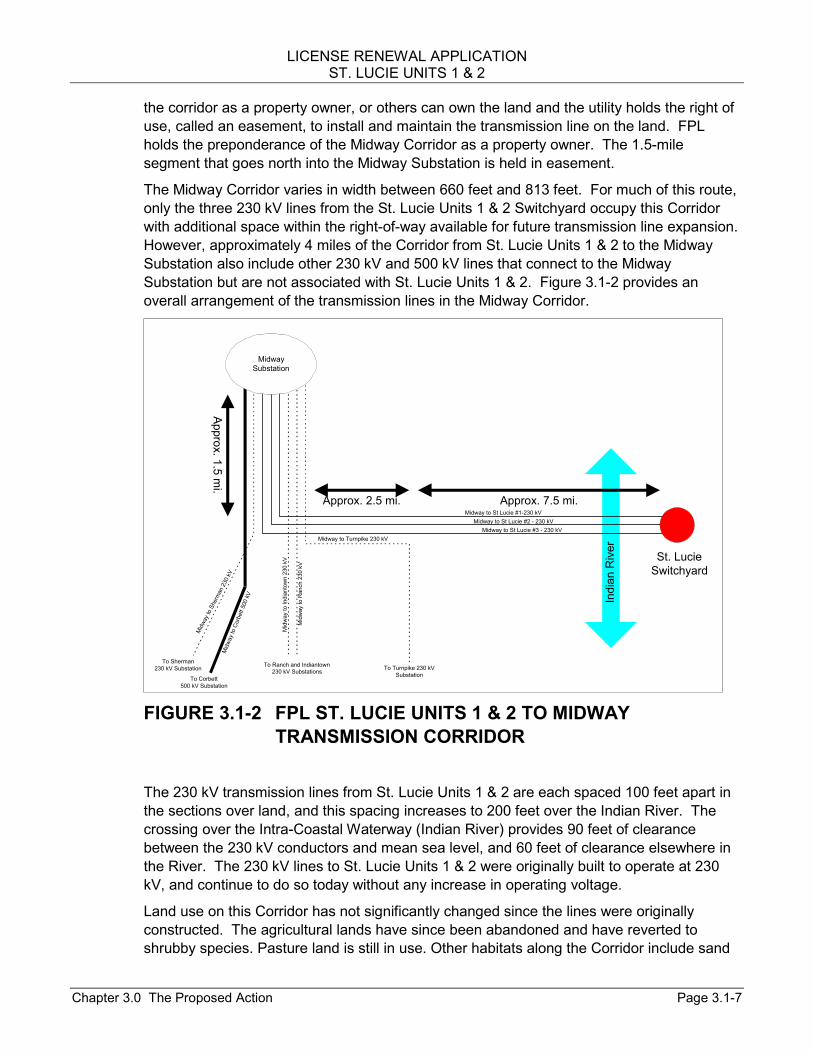
LICENSE RENEWAL APPLICATIONST. LUCIE UNITS 1 & 2
Chapter 3.0 The Proposed Action Page 3.1-7
the corridor as a property owner, or others can own the land and the utility holds the right ofuse, called an easement, to install and maintain the transmission line on the land. FPLholds the preponderance of the Midway Corridor as a property owner. The 1.5-milesegment that goes north into the Midway Substation is held in easement.
The Midway Corridor varies in width between 660 feet and 813 feet. For much of this route,only the three 230 kV lines from the St. Lucie Units 1 & 2 Switchyard occupy this Corridorwith additional space within the right-of-way available for future transmission line expansion.However, approximately 4 miles of the Corridor from St. Lucie Units 1 & 2 to the MidwaySubstation also include other 230 kV and 500 kV lines that connect to the MidwaySubstation but are not associated with St. Lucie Units 1 & 2. Figure 3.1-2 provides anoverall arrangement of the transmission lines in the Midway Corridor.
MidwaySubstation
Midway to St Lucie #1-230 kV
Midway to St Lucie #3 - 230 kVMidway to St Lucie #2 - 230 kV
Midway to Turnpike 230 kV
Mid
way
to R
anch
230
kV
Mid
way
to In
dian
tow
n 23
0 kV
Mid
way
to S
herm
an 2
30 k
VM
idwa
y to
Cor
bett
500
kV
St. LucieSwitchyard
Approx. 1.5 mi.
Approx. 2.5 mi. Approx. 7.5 mi.
To Turnpike 230 kVSubstation
To Ranch and Indiantown230 kV Substations
To Sherman230 kV Substation
To Corbett500 kV Substation
Indi
an R
iver
FIGURE 3.1-2 FPL ST. LUCIE UNITS 1 & 2 TO MIDWAYTRANSMISSION CORRIDOR
The 230 kV transmission lines from St. Lucie Units 1 & 2 are each spaced 100 feet apart inthe sections over land, and this spacing increases to 200 feet over the Indian River. Thecrossing over the Intra-Coastal Waterway (Indian River) provides 90 feet of clearancebetween the 230 kV conductors and mean sea level, and 60 feet of clearance elsewhere inthe River. The 230 kV lines to St. Lucie Units 1 & 2 were originally built to operate at 230kV, and continue to do so today without any increase in operating voltage.
Land use on this Corridor has not significantly changed since the lines were originallyconstructed. The agricultural lands have since been abandoned and have reverted toshrubby species. Pasture land is still in use. Other habitats along the Corridor include sand
LICENSE RENEWAL APPLICATIONST. LUCIE UNITS 1 & 2
Chapter 3.0 The Proposed Action Page 3.1-8
pine scrub, dry prairie, pine flatwoods, wet prairie, isolated marshes, and ruderal ordisturbed sites. The corridor passes through the Savannas State Preserve.
FPL maintains the Midway Corridor using a combination of trimming, mowing, and herbicideapplication. Where required, FPL trims trees at the 14-foot level to maintain clearances.Typically, FPL only needs to do this at mid-span. In open, undeveloped areas, FPL mowsapproximately every five years. FPL uses spot and broadcast treatment with herbicidesprimarily to control tall exotic grasses and spot treatment for individual trees that may growover 14 feet tall. These herbicides are applied under supervision by persons licensed by theState for herbicide application. These are the most common management practices for theMidway Corridor.
LICENSE RENEWAL APPLICATIONST. LUCIE UNITS 1 & 2
Chapter 3.0 The Proposed Action Page 3.2-1
3.2 REFURBISHMENT ACTIVITIES
NRC“The report must contain a description of...the applicant’s plans to modify the facility or itsadministrative control procedures.... This report must describe in detail the modificationsdirectly affecting the environment or affecting plant effluents that affect the environment….”10 CFR 51.53(c)(2)“The incremental aging management activities carried out to allow operation of a nuclearpower plant beyond the original 40-year license term will be from one of two broad categories:(1) SMITTR actions, most of which are repeated at regular intervals, and (2) majorrefurbishment or replacement actions, which usually occur fairly infrequently and possiblyonly once in the life of the plant for any given item….” (Ref. 3.1-6, Section 2.6.3.1, page 2-41.)[“SMITTR” defined at GEIS Section 2.4, page 2-30, as surveillance, on-line monitoring,inspections, testing, trending, and recordkeeping]
In the GEIS (Ref. 3.1-6, Section 3.1 and Table B.2, Appendix B), the NRC identifiesrefurbishment activities that utilities might perform for license renewal. Performing suchmajor refurbishment activities would necessitate changing administrative control proceduresand modifying the facility. The GEIS analysis assumed that an applicant would begin anymajor refurbishment work shortly after the NRC granted a renewed license and wouldcomplete the activities during five outages, including one major outage at the end of the40th year of operation. The GEIS refers to this as the refurbishment period.
GEIS Table B.2 lists license renewal refurbishment activities that the NRC anticipatedutilities might undertake. In identifying these activities, the GEIS intended to encompassactions that typically take place only once in the life of a nuclear power plant, if at all. TheGEIS analysis assumed that a utility would undertake these activities solely for the purposeof extending plant operations beyond 40 years and would undertake them during therefurbishment period. The GEIS indicates that many plants will have undertaken variousmajor refurbishment activities to support the current license period but that some plantsmight undertake such tasks only to support extended plant operations.
FPL has performed some major construction activities at St. Lucie Units 1 & 2 (e.g., Unit 1steam generator replacement, and velocity cap repair). However, the St. Lucie Units 1 & 2Integrated Plant Assessment that FPL has conducted under 10 CFR Part 54 and includedas part of this Application has not identified the need to undertake any refurbishment orreplacement actions to maintain the functionality of important systems, structures, andcomponents during the St. Lucie Units 1 & 2 license renewal period or any othermodifications related to license renewal. Therefore, no refurbishments or modificationshave been identified that would directly affect the environment or plant effluents.
LICENSE RENEWAL APPLICATIONST. LUCIE UNITS 1 & 2
Chapter 3.0 The Proposed Action Page 3.3-1
3.3 PROGRAMS AND ACTIVITIES FOR MANAGING THE EFFECTS OFAGING
NRC“The report must contain a description of...the applicant’s plans to modify the facility or itsadministrative control procedures....This report must describe in detail the modificationsdirectly affecting the environment or affecting plant effluents that affect the environment….”10 CFR 51.53(c)(2)“The incremental aging management activities carried out to allow operation of a nuclearpower plant beyond the original 40-year license term will be from one of two broad categories:(1) SMITTR actions, most of which are repeated at regular intervals, and (2) majorrefurbishment or replacement actions, which usually occur fairly infrequently and possiblyonly once in the life of the plant for any given item….” (Ref. 3.1-6, Section 2.6.3.1, page 2-41.)[“SMITTR” defined at GEIS Section 2.4, page 2-30, as surveillance, on-line monitoring,inspections, testing, trending, and recordkeeping]
Appendix A of the St. Lucie Units 1 & 2 License Renewal Application contains a separatesupplement for each Unit’s Updated Final Safety Analysis Report. In accordance with NRCrequirements [10 CFR 54.21(d)], the supplements contain a description of the programs andactivities for managing the effects of St. Lucie Units 1 & 2 aging. In addition to describingexisting programs, the supplements describe proposed modifications (enhancements) toexisting programs and proposed programs and activities.
LICENSE RENEWAL APPLICATIONST. LUCIE UNITS 1 & 2
Chapter 3.0 The Proposed Action Page 3.4-1
3.4 EMPLOYMENT
3.4.1 CURRENT WORKFORCE
FPL employs a permanent workforce of approximately 791 employees and 138 contractorsat St. Lucie Units 1 & 2, a number that is less than the range of 600 to 800 personnel perreactor unit that the NRC cited in GEIS Section 2.3.8.1. Of the total number of employees,approximately 46 percent lives in St. Lucie County, 37 percent in Martin County, 8 percent inIndian River County, 6 percent in Palm Beach County, with the rest living in various otherlocations.
FPL refuels each St. Lucie Unit on an 18-month schedule, which typically means at least 1refueling every year and 2 refuelings every third year. During refueling outages, siteemployment increases by as many as 575 to 870 workers for temporary (30 to 40 days)duty. These numbers are within the GEIS range of 200 to 900 additional workers perreactor outage.
3.4.2 LICENSE RENEWAL INCREMENT
Performing the license renewal surveillance, on-line monitoring, inspections, testing,trending, and recordkeeping (SMITTR) activities discussed in Section 3.3 would necessitateincreasing St. Lucie Units 1 & 2 staff workload by some increment. The size of thisincrement would be a function of the schedule within which FPL must accomplish the workand the amount of work involved.
In the GEIS, the NRC assumes that each nuclear power plant license renewal would be fora 20-year period plus the remaining duration of the current license and that the NRC wouldissue the renewal approximately 10 years prior to current license expiration. In other words,the renewed license would be effective for 30 years. The NRC determined that the utilitywould initiate SMITTR activities at the time of issuance and would conduct license renewalSMITTR activities throughout the remaining 30-year life of the plant, sometimes during full-power operation (Ref. 3.1-6, Section B.3.1.3) but mostly during normal refueling, and during5-year and 10-year in-service inspections during refueling outages (Ref. 3.1-6, Table B.4).
FPL has determined that the NRC’s scheduling assumptions in the GEIS are reasonablyrepresentative of St. Lucie Units 1 & 2 incremental license renewal workload scheduling.Many SMITTR activities that Section 3.3 encompasses would have to be performed duringoutages. Although some St. Lucie Units 1 & 2 license renewal SMITTR activities would beone-time efforts, others would be recurring, periodic activities that would continue for thelives of the Units.
The NRC estimates in the GEIS that no more than 60 additional personnel would be neededto perform license renewal SMITTR activities during the 3-month duration of a 10-year in-service inspection refueling outage. Having established this upper value for what would bea single event in 20 years, the NRC uses this number as the expected number of additionalpermanent workers needed per unit attributable to license renewal. In GEIS (Ref. 3.1-6)Section C.3.1.2, the NRC uses this approach in order to, “...provide a realistic upper boundto potential population-driven impacts….”
LICENSE RENEWAL APPLICATIONST. LUCIE UNITS 1 & 2
Chapter 3.0 The Proposed Action Page 3.4-2
FPL expects that existing “surge” capabilities for routine activities such as outages willenable plant staff to perform the increased SMITTR workload without adding St. Lucie Units1 & 2 personnel. For the purpose of performing its own analyses in this EnvironmentalReport, FPL is adopting the NRC’s GEIS approach with one alteration. FPL license renewalplant modifications would be SMITTR activities that would be performed mostly duringoutages, and FPL would generally stagger St. Lucie Units 1 & 2 outage schedules so thatboth Units are not shut down at the same time. Therefore, FPL believes that it isunreasonable to assume that each Unit would need an additional 60 workers. Instead, as areasonably conservative high estimate, FPL is assuming that St. Lucie Units 1 & 2 wouldrequire no more than a total of 60 additional permanent workers to perform license renewalSMITTR activities.
Adding full-time employees to the plant workforce for continued operation during the licenserenewal period would have the indirect effect of creating additional jobs and relatedpopulation growth in the community. Using 1997 data, University of Florida researcherscalculated a regional employment multiplier appropriate for the electric services sector in thecombined-county area of Martin and St. Lucie counties. FPL has used this value, 2.3044, toestimate the number of direct and indirect jobs supported by additional St. Lucie Units 1 & 2employees that might be needed during the license renewal period (Ref. 3.4-1). Applyingthe multiplier, a total of 138 (60 × 2.3044) new jobs would be created in the Martin and St.Lucie combined-county area, where total employment in 2000 was slightly over 128,000persons. These 138 new direct and indirect jobs represent 0.1 percent of current totalemployment in the two counties (Ref. 3.4-2). In summary, FPL is assuming that 60additional permanent direct workers during the license renewal period would create anadditional 78 indirect jobs in the community.
These 138 new jobs (60 direct and 78 indirect) could result in a population increase of 339in the area [138 jobs multiplied by 2.46 average number of persons per household in theState of Florida (Ref. 3.4-3)]. This increase represents approximately 0.1 percent of thepopulation in 2000 (319,426 persons) for the combined-county area.
LICENSE RENEWAL APPLICATIONST. LUCIE UNITS 1 & 2
Chapter 3.0 The Proposed Action Page 3.5-1
3.5 REFERENCES
3.1-1 U.S. Atomic Energy Commission. Final Environmental Statement Related to theSt. Lucie Plant Unit No. 1; Florida Power & Light Company. Docket No. 50-335.Directorate of Licensing. Washington, D.C. June 1973.
3.1-2 U.S. Atomic Energy Commission. Final Environmental Statement Related to theConstruction of St. Lucie Plant, Unit No. 2; Florida Power & Light Company.Docket No. 50-389. Directorate of Licensing. Washington, D.C. May 1974.
3.1-3 U.S. Nuclear Regulatory Commission. Final Environmental Statement Related tothe Operation of St. Lucie Plant, Unit No. 2; Florida Power & Light Company,Orlando Utilities Commission of the City of Orlando, Florida. Docket No. 50-389.NUREG-0842. Office of Nuclear Reactor Regulation. Washington, D.C. April1982.
3.1-4 Florida Power & Light Company. St. Lucie Unit 1 Updated Final Safety AnalysisReport. Amendment 17. Juno Beach, Florida. October 1999.
3.1-5 Florida Power & Light Company. St. Lucie Unit 2 Updated Final Safety AnalysisReport. Amendment 13. Juno Beach, Florida. May 16, 2000.
3.1-6 U.S. Nuclear Regulatory Commission. Generic Environmental Impact Statementfor License Renewal of Nuclear Plants. NUREG-1437. Office of NuclearRegulatory Research. Washington, D.C. May 1996.
3.1-7 Florida Power & Light Company. Ten Year Power Plant Site Plan; 2001-2010.Miami, Florida. April 2001.
3.1-8 Florida Power & Light Company. St. Lucie Plant Wastewater Permit Application.Jensen Beach, Florida. April 1996.
3.1-9 Foster-Wheeler Environmental Corporation. Annual Operation & MaintenanceStatus Report (1999-2000) for FPL St. Lucie Power Plant Unit 1 & Unit 2Remedial Action. Stuart, Florida. August 3, 2000.
3.1-10 Ecological Associates, Inc. Physical and Ecological Factors Influencing SeaTurtle Entrainment Levels at the St. Lucie Nuclear Plant: 1976-1998. JensenBeach, Florida. (L-2000-78) March 22, 2000.
3.1-11 U.S. Army Corps of Engineers. Department of the Army Permit No. 199301803.U.S. Army Engineer District. Jacksonville, Florida. December 27, 1993.
3.1-12 Florida Department of Environmental Protection. State of Florida WastewaterFacility Permit. Permit No. FL0002208-Major. Issued to Florida Power & LightCompany for St. Lucie Power Plant Units 1 & 2. Tallahassee, Florida.January 10, 2000.
LICENSE RENEWAL APPLICATIONST. LUCIE UNITS 1 & 2
Chapter 3.0 The Proposed Action Page 3.5-2
3.4-1 University of Florida. Employment Multipliers for the Combined-County Regionof St. Lucie and Martin Counties. Food and Resource Economic Department.Tallahassee, Florida. December 12, 2000.
3.4-2 State of Florida. St. Lucie and Martin County Profiles.www.eflorida.com/all_facts.html. Accessed July 25, 2001.
3.4-3 U.S. Census Bureau. Table DP-1. Profile of General DemographicCharacteristics: 2000 for Florida and Selected Counties and Cities.http://factfinder.census.gov. Accessed July 25, 2001.
LICENSE RENEWAL APPLICATIONST. LUCIE UNITS 1 & 2
CHAPTER 4.0 ENVIRONMENTAL CONSEQUENCES OF THE PROPOSED ACTION Page 4.1-1AND MITIGATING ACTIONS
4.0 ENVIRONMENTAL CONSEQUENCES OF THE PROPOSED ACTIONAND MITIGATING ACTIONS
NRCThe environmental report shall discuss the “…impact of the proposed action on theenvironment. Impacts shall be discussed in proportion to their significance[.]” 10 CFR51.45(b)(1) as adopted by 51.53(c)(2)
4.1 INTRODUCTIONChapter 4 presents an assessment of the environmental consequences and potentialmitigating actions associated with the renewal of the St. Lucie Units 1 & 2 operatinglicenses. The U.S. Nuclear Regulatory Commission (NRC) has identified and analyzed 92environmental issues that it considers associated with nuclear power plant license renewaland has designated the issues as Category 1, Category 2, or Not Applicable (NA). TheNRC has designated the issues as “Category 1” if, after analysis, the following criteria weremet:
• The environmental impacts associated with the issue have been determined to applyeither to all plants or, for some issues, to plants having a specific type of coolingsystem or other specified plant or site characteristic; and
• A single significance level (i.e., small, moderate, or large) has been assigned to theimpacts (except for collective offsite radiological impacts from the fuel cycle and fromhigh-level-radioactive waste and spent-fuel disposal); and
• Mitigation of adverse impacts associated with the issue has been considered in theanalysis, and it has been determined that additional plant-specific mitigationmeasures are likely not to be sufficiently beneficial to warrant implementation.
If the NRC analysis concluded that one or more of the Category 1 criteria could not be met,the NRC designated the issue as Category 2. The NRC requires plant-specific analyses forCategory 2 issues. The NRC designated two issues as “NA,” signifying that thecategorization and impact definitions do not apply to these issues. NRC rules do not requireanalyses of Category 1 issues that the NRC has resolved using generic findings (10 CFR51, Subpart A, Appendix B, Table B-1) based on its Generic Environmental ImpactStatement for License Renewal of Nuclear Plants (GEIS). An applicant may reference thegeneric findings or GEIS analyses for Category 1 issues.
Appendix A of the St. Lucie Units1 & 2 Environmental Report lists the 92 issues with theirNRC-assigned categorizations, and identifies the Environmental Report and GEIS sectionsthat address each issue. For those issues not applicable to St. Lucie Units 1 & 2, a notationgives the basis for that designation. The issues are numbered in the same order in whichthey are listed in Table B-1 of Appendix B to Subpart A of 10 CFR 51, for ease of reference.
LICENSE RENEWAL APPLICATIONST. LUCIE UNITS 1 & 2
CHAPTER 4.0 ENVIRONMENTAL CONSEQUENCES OF THE PROPOSED ACTION Page 4.1-2AND MITIGATING ACTIONS
4.1.1 CATEGORY 1 LICENSE RENEWAL ISSUES
NRC“The environmental report for the operating license renewal stage is not required to containanalyses of the environmental impacts of the license renewal issues identified as Category 1issues in Appendix B to subpart A of this part.” 10 CFR 51.53(c)(3)(i)“…[A]bsent new and significant information, the analysis for certain impacts codified by thisrulemaking need only be incorporated by reference in an applicant’s environmental report forlicense renewal….” (61 Federal Register, page 28483).
Florida Power & Light Company (FPL) has determined that of the 69 Category 1 issues, 15do not apply to St. Lucie Units 1 & 2 because they apply to design, operational, or locationfeatures that do not exist at the facility. These features are intake and discharge from asmall river, lake, or canal; cooling towers; and groundwater withdrawal. In addition, becauseFPL does not plan to conduct any refurbishment activities, the NRC findings for the sevenCategory 1 issues that apply only to refurbishment clearly overestimate St. Lucie Units 1 & 2refurbishment impacts and do not apply. FPL has reviewed the NRC findings and hasidentified no new and significant information, or become aware of any such information thatwould make the NRC findings inapplicable to St. Lucie Units 1 & 2. Therefore, FPL adoptsby reference the NRC findings for the 47 Category 1 issues that FPL determined to beapplicable to St. Lucie Units 1 & 2.
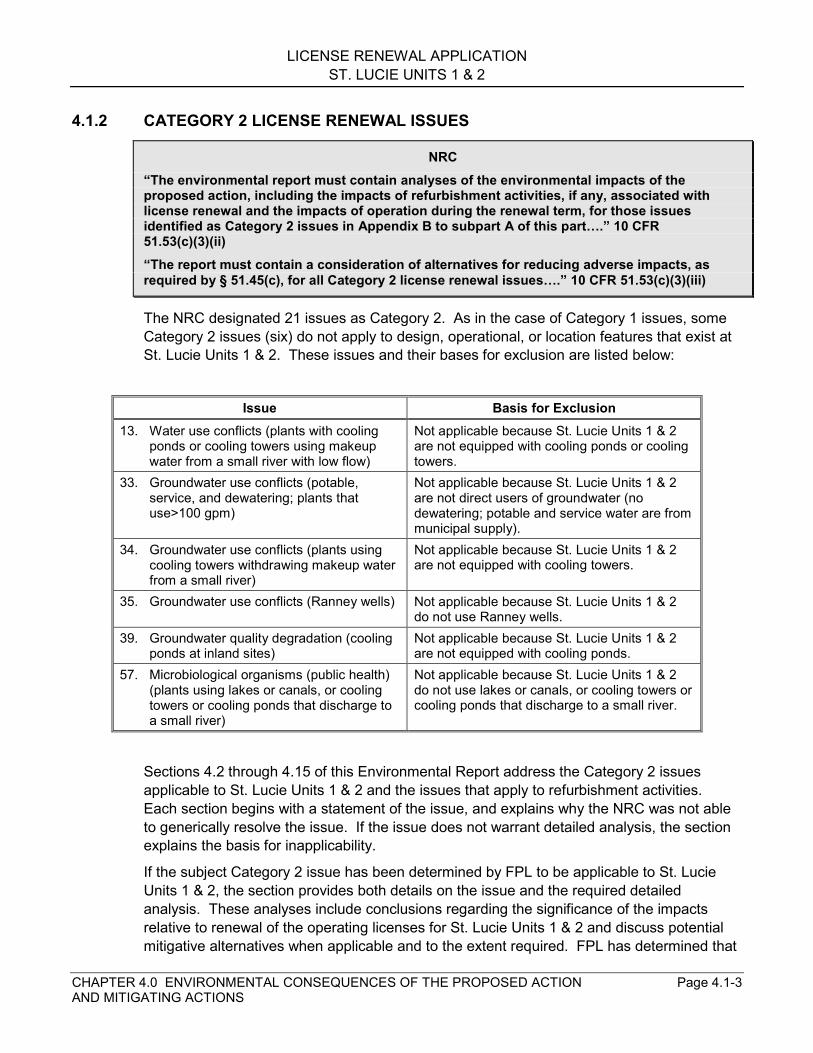
LICENSE RENEWAL APPLICATIONST. LUCIE UNITS 1 & 2
CHAPTER 4.0 ENVIRONMENTAL CONSEQUENCES OF THE PROPOSED ACTION Page 4.1-3AND MITIGATING ACTIONS
4.1.2 CATEGORY 2 LICENSE RENEWAL ISSUES
NRC“The environmental report must contain analyses of the environmental impacts of theproposed action, including the impacts of refurbishment activities, if any, associated withlicense renewal and the impacts of operation during the renewal term, for those issuesidentified as Category 2 issues in Appendix B to subpart A of this part….” 10 CFR51.53(c)(3)(ii)“The report must contain a consideration of alternatives for reducing adverse impacts, asrequired by § 51.45(c), for all Category 2 license renewal issues….” 10 CFR 51.53(c)(3)(iii)
The NRC designated 21 issues as Category 2. As in the case of Category 1 issues, someCategory 2 issues (six) do not apply to design, operational, or location features that exist atSt. Lucie Units 1 & 2. These issues and their bases for exclusion are listed below:
Issue Basis for Exclusion13. Water use conflicts (plants with cooling
ponds or cooling towers using makeupwater from a small river with low flow)
Not applicable because St. Lucie Units 1 & 2are not equipped with cooling ponds or coolingtowers.
33. Groundwater use conflicts (potable,service, and dewatering; plants thatuse>100 gpm)
Not applicable because St. Lucie Units 1 & 2are not direct users of groundwater (nodewatering; potable and service water are frommunicipal supply).
34. Groundwater use conflicts (plants usingcooling towers withdrawing makeup waterfrom a small river)
Not applicable because St. Lucie Units 1 & 2are not equipped with cooling towers.
35. Groundwater use conflicts (Ranney wells) Not applicable because St. Lucie Units 1 & 2do not use Ranney wells.
39. Groundwater quality degradation (coolingponds at inland sites)
Not applicable because St. Lucie Units 1 & 2are not equipped with cooling ponds.
57. Microbiological organisms (public health)(plants using lakes or canals, or coolingtowers or cooling ponds that discharge toa small river)
Not applicable because St. Lucie Units 1 & 2do not use lakes or canals, or cooling towers orcooling ponds that discharge to a small river.
Sections 4.2 through 4.15 of this Environmental Report address the Category 2 issuesapplicable to St. Lucie Units 1 & 2 and the issues that apply to refurbishment activities.Each section begins with a statement of the issue, and explains why the NRC was not ableto generically resolve the issue. If the issue does not warrant detailed analysis, the sectionexplains the basis for inapplicability.
If the subject Category 2 issue has been determined by FPL to be applicable to St. LucieUnits 1 & 2, the section provides both details on the issue and the required detailedanalysis. These analyses include conclusions regarding the significance of the impactsrelative to renewal of the operating licenses for St. Lucie Units 1 & 2 and discuss potentialmitigative alternatives when applicable and to the extent required. FPL has determined that
LICENSE RENEWAL APPLICATIONST. LUCIE UNITS 1 & 2
CHAPTER 4.0 ENVIRONMENTAL CONSEQUENCES OF THE PROPOSED ACTION Page 4.1-4AND MITIGATING ACTIONS
11 Category 2 issues warrant this detailed discussion. For each, FPL has identified thesignificance of the impacts associated with the issue as either small, moderate, or large,consistent with the criteria that the NRC established at 10 CFR 51, Subpart A, Appendix B,Table B-1, Footnote 3, as follows:
Small – Environmental effects are not detectable or are so minor that they will neitherdestabilize nor noticeably alter any important attribute of the resource. For the purposesof assessing radiological impacts, the NRC has concluded that those impacts that do notexceed permissible levels in the NRC’s regulations are considered small.
Moderate – Environmental effects are sufficient to alter noticeably but not to destabilizeany important attribute of the resource.
Large – Environmental effects are clearly noticeable and are sufficient to destabilize anyimportant attributes of the resource.
In accordance with National Environmental Policy Act practice, FPL considered ongoing andpotential additional mitigation in proportion to the significance of the impact to be addressed(i.e., impacts that are small receive less mitigative consideration than do impacts that arelarge).
4.1.3 “NA” LICENSE RENEWAL ISSUES
The NRC determined that its categorization and impact finding definitions did not apply totwo issues. FPL included these issues in Appendix A. The NRC noted that applicantscurrently do not need to submit information on chronic effects from electromagnetic fields(10 CFR 51, Subpart A, Appendix B, Table B-1, Footnote 5). For the other NA issue,environmental justice, the NRC does not require information from applicants but noted that itwill be addressed in individual license renewal reviews (10 CFR 51, Subpart A, Appendix B,Table B-1, Footnote 6). FPL has included an environmental justice analysis in Section 4.16,along with supporting demographic information in Section 2.5.2.
LICENSE RENEWAL APPLICATIONST. LUCIE UNITS 1 & 2
CHAPTER 4.0 ENVIRONMENTAL CONSEQUENCES OF THE PROPOSED ACTION Page 4.2-1AND MITIGATING ACTIONS
4.2 ENTRAINMENT OF FISH AND SHELLFISH IN EARLY LIFE STAGES
NRC“If the applicant’s plant utilizes once-through cooling or cooling pond heat dissipationsystems, the applicant shall provide a copy of current Clean Water Act 316(b)determinations…or equivalent State permits and supporting documentation. If the applicantcan not provide these documents, it shall assess the impact of the proposed action on fishand shellfish resources resulting from…entrainment.” 10 CFR 51.53(c)(3)(ii)(B)“The impacts of entrainment are small at many plants but may be moderate or even large at afew plants with once-through and cooling-pond cooling systems. Further, ongoing efforts inthe vicinity of these plants to restore fish populations may increase the numbers of fishsusceptible to intake effects during the license renewal period, such that entrainment studiesconducted in support of the original license may no longer be valid....” 10 CFR 51, Subpart A,Appendix B, Table B-1, Issue 25
The NRC made impacts on fish and shellfish resources resulting from entrainment aCategory 2 issue because it could not assign a single significance level (small, moderate, orlarge) to the issue; the impacts of entrainment are small at many plants, but they may bemoderate or large impacts at some plants. Also, ongoing restoration efforts may increasethe number of fish susceptible to intake effects during the license renewal period (Ref. 4.2-1,Section 4.2.2.1.2). Information to be ascertained includes: (1) type of cooling system(whether once-through or cooling pond); and (2) current Clean Water Act Section 316(b)determination or equivalent state documentation.
As indicated in Section 3.1.3, St. Lucie Units 1 & 2 have a once-through heat dissipationsystem. Entrainment at St. Lucie Units 1 & 2 was evaluated based on densities ofentrainable forms in the ocean during pre-operational and early operational monitoring forUnit 1. The NRC summarized early Unit 1 operational data from ocean ichthyoplanktonsurveys. The most common larval fishes in the area of the intakes were herrings andanchovies (Ref. 4.2-2, Section 4.3.8.2.5). Based on five years of ichthyoplankton sampling,an estimate was made of the conditional mortality of fish larvae due to entrainment. Undernormal conditions, it was estimated that 0.4 percent of the fish eggs and larvae passing thesite could be entrained. Using the most conservative assumptions, the loss was estimatedat less than 4 percent. Based on this assessment, the NRC concluded that entrainmentlosses would not represent a significant impact to the local fisheries (Ref. 4.2-2, Section5.6.3).
As indicated in the current Industrial Wastewater Facility Permit No. FL0002208 for St. LucieUnits 1 & 2 (see Appendix B), St. Lucie Units 1 & 2 have documentation of Clean Water Act316(b) compliance indicating that the existing Intake Structure reflects the best technologyavailable for minimizing environmental impacts at St. Lucie Units 1 & 2. Given thisdetermination, FPL concludes that St. Lucie Units 1 & 2 entrainment impacts (Issue 25; seeAppendix A, Table A-1) are SMALL, and that further mitigation would be unwarranted.
LICENSE RENEWAL APPLICATIONST. LUCIE UNITS 1 & 2
CHAPTER 4.0 ENVIRONMENTAL CONSEQUENCES OF THE PROPOSED ACTION Page 4.3-1AND MITIGATING ACTIONS
4.3 IMPINGEMENT OF FISH AND SHELLFISH
NRC“If the applicant’s plant utilizes once-through cooling or cooling pond heat dissipationsystems, the applicant shall provide a copy of current Clean Water Act 316(b)determinations…or equivalent State permits and supporting documentation. If the applicantcan not provide these documents, it shall assess the impact of the proposed action on fishand shellfish resources resulting from…impingement…” 10 CFR 51.53(c)(3)(ii)(B)“The impacts of impingement are small at many plants but may be moderate or even large at afew plants with once-through and cooling-pond cooling systems....” 10 CFR 51, Subpart A,Appendix B, Table B-1, Issue 26
The NRC made impacts on fish and shellfish resources resulting from impingement aCategory 2 issue because it could not assign a single significance level to the issue;impingement impacts are small at many plants, but might be moderate or large at a fewplants. Information to be ascertained includes: (1) type of cooling system (whether once-through or cooling pond); and (2) current Clean Water Act 316(b) determination orequivalent state documentation.
As indicated in Section 3.1.3, St. Lucie Units 1 & 2 have a once-through heat dissipationsystem. The NRC summarized impingement sampling carried out at St. Lucie Unit 1 during1976-1978, as directed by the Unit 1 operating license (Ref. 4.2-2, Section 5.6.2). Duringthis period, 226 twenty-four-hour (24-hr) collections were made of fish and shellfish trappedon the traveling intake screens. Assuming continuous operation, annual impingement rateswere estimated at 34,000 (1978) to 131,000 (1976) finfish, and 26,000 (1976) to 37,000(1978) shellfish. Over the entire study, mean numbers of finfish and shellfish impinged per24-hr period were 222 and 82 individuals, respectively. Corresponding mean weights were1.7 kilograms (kg) and 0.5 kg. The most commonly impinged species groups were anchovy,grunt, jack, croaker, mojarro, shrimp, and blue crab (Callinectes sapidus). The length ofover 80 percent of the impinged fish was 8 centimeters (cm) or less, and virtually all of theimpinged shrimp were 4 cm or less in length. In January 1979, the NRC issued anamendment to the Unit 1 operating license deleting the requirement for impingementmonitoring. It was concluded that impingement losses at Unit 1 were insignificant whencompared to the fish populations in the site vicinity and (for shrimp) the number caughtcommercially off of Florida’s east coast (Ref. 4.2-2, Section 5.6.2).
The NRC acknowledged that startup of St. Lucie Unit 2 would double the intake flow volumeand increase impingement rates over those measured during only Unit 1 operation (Ref. 4.2-2, Section 5.6.2). It was projected that a doubling of the weight of organisms impingedwould be equivalent to less than one-half of one percent of the commercial catch of fish andshellfish in either St. Lucie or Martin County. Based on this, the NRC concluded that eventhe combined estimates of Unit 1 and Unit 2 impingement would be insignificant whencompared to local commercial landings. Additional impingement monitoring for St. LucieUnit 2 was not required.
Applied Biology reported on Intake Canal gill-net sampling carried out annually from 1976 to1984 (Ref. 4.3-1, Section B). The purpose of this program was to determine the extent ofentrapment and accumulation of fish and shellfish in the Intake Canal, and whether this
LICENSE RENEWAL APPLICATIONST. LUCIE UNITS 1 & 2
CHAPTER 4.0 ENVIRONMENTAL CONSEQUENCES OF THE PROPOSED ACTION Page 4.3-2AND MITIGATING ACTIONS
could represent an adverse impact to the communities in the site vicinity. It was concludedthat fish and shellfish were not accumulating in the Intake Canal, based on an average catchrate for the study period of 3.5 to 12.5 fish per 30 meters (m) of gill net per day. There werepeaks in some years due to influxes of blue runners (Caranx crysos), crevalle jacks (Caranxhippos), and smooth dogfish (Mustelus canis) in 1977, 1978, and 1984, respectively. Thehighest mean catch rate for the period occurred in 1980, and resulted from an influx of spot(Leiostomus xanthurus) into the Intake Canal. In spite of these sporadic influxes of somespecies into the Canal, there was no accumulation documented. It is possible that factorssuch as predation within the Canal operate to keep the numbers low. Some of the fishentrapped in the Intake Canal were commercial species, but losses were negligible relativeto the weight of commercial landings. Of particular note is that of three of the mostimportant commercial species, only five Spanish mackerel, 10 king mackerel, and 37bluefish were found in the Intake Canal over the nine-year study period. The low rate ofentrapment was attributed to the velocity caps at the ocean intakes, which create horizontalcurrents that are more easily avoided by fish relative to vertical currents.
Pursuant to a special condition of the St. Lucie Unit 2 Site Certification issued by the FloridaDepartment of Environmental Protection in compliance with Florida Law (Ref. 4.3-2, SectionXI), a mitigation program was implemented whereby FPL periodically traps fish from theIntake Canal, tags them, and releases them in the ocean. This program is carried out at thebehest of the Florida Fish and Wildlife Conservation Commission (FWCC). Although thespecial condition specified that this mitigation take place during construction of St. Lucie Unit2, FPL has continued the program beyond the construction period. Collections are made ona quarterly to a monthly basis, with a goal of tagging and releasing 1,000 fish per year.
Additional mitigation is provided via FPL’s cooperation with various institutions to providespecimens for display and research. Upon request, FPL makes the Intake Canal availableto these institutions for the collection of fish. Such in-state institutions as the FloridaAquarium (Tampa), the Marinelife Center of Juno Beach, the Living Seas at Disney EpcotCenter, and the Florida Oceanographic Society Keys Marine Laboratory avail themselves ofthe unique collection opportunity afforded by the St. Lucie Units 1 & 2 Intake Canal. Out-of-state institutions also take advantage of the opportunity, with regular collections made by theSouth Carolina Aquarium and the National Aquarium (Baltimore, Maryland). The collectionof specimens from the Intake Canal rather than the open ocean is much more economicalfor the institutions involved. Consequently, by making the Intake Canal available to theseinstitutions, FPL provides valuable support to public education and research on marineresources.
As indicated in the current Industrial Wastewater Facility Permit No. FL0002208 for St. LucieUnits 1 & 2 (see Appendix B), St. Lucie Units 1 & 2 have documentation of Clean Water Act316(b) compliance indicating that the existing Intake Structure reflects the best technologyavailable for minimizing environmental impacts at St. Lucie Units 1 & 2. Given thisdetermination, FPL concludes that St. Lucie Units 1 & 2 impingement impacts (Issue 26;Appendix A, Table A-1)) are SMALL, and that further mitigation would not be warranted.

LICENSE RENEWAL APPLICATIONST. LUCIE UNITS 1 & 2
CHAPTER 4.0 ENVIRONMENTAL CONSEQUENCES OF THE PROPOSED ACTION Page 4.4-1AND MITIGATING ACTIONS
4.4 HEAT SHOCK
NRC“If the applicant’s plant utilizes once-through cooling or cooling pond heat dissipationsystems, the applicant shall provide a copy of current Clean Water Act… 316(a) variance inaccordance with 40 CFR part 125, or equivalent State permits and supporting documentation.If the applicant can not provide these documents, it shall assess the impact of the proposedaction on fish and shellfish resources resulting from heat shock …” 10 CFR 51.53(c)(3)(ii)(B)“Because of continuing concerns about heat shock and the possible need to modify thermaldischarges in response to changing environmental conditions, the impacts may be ofmoderate or large significance at some plants....”10 CFR 51, Subpart A, Appendix B, Table B-1, Issue 27
The NRC made impacts on fish and shellfish resources resulting from heat shock aCategory 2 issue because of continuing concerns about thermal discharge effects and thepossible need to modify thermal discharges in the future in response to changingenvironmental conditions. Information to be ascertained includes: (1) type of coolingsystem (whether once-through or cooling pond); and (2) evidence of a Clean Water Act316(a) variance or equivalent state documentation.
As indicated in Section 3.1.3, St. Lucie Units 1 & 2 have a once-through heat dissipationsystem. Prior to startup of both Units 1 and 2, extensive thermal plume modeling studieswere conducted, as summarized by the NRC and its predecessor agency, the U.S. AtomicEnergy Commission (AEC) (Ref. 4.2-2, Section 5.6.4; Ref. 4.4-1, Section V-B). Thesestudies described rapidly rising, buoyant thermal plumes from the diffuser discharges withresulting surface temperatures less than the 97° Fahrenheit (36.1° Celsius) surface waterlimitation in the Water Quality Standards [Ref. 4.4-2, Section 62-302.520(4)(c)]. Potentialinteraction of the thermal plume with benthic, planktonic, and nektonic (fish and sea turtles)communities was evaluated and projected to be minimal. No detectable impact waspredicted due to scouring of the benthic community, plume entrainment of plankton(including fish eggs and larvae), or heat shock to adult fish or turtle hatchlings.
As indicated in Section 3(C)(1) of the Fact Sheet associated with the current IndustrialWastewater Facility Permit No. FL0002208 for St. Lucie Units 1 & 2 (see Appendix B), thethermal discharge from the plant complies with Florida Water Quality Standards withoutrecourse to a Clean Water Act Section 316(a) variance. Consequently, FPL concludes thatSt. Lucie Units 1 & 2 heat shock impacts (Issue 27; Appendix A, Table A-1) would beSMALL and, because the standard-setting process provides for minimizing environmentalimpact, further mitigation would not be warranted.
LICENSE RENEWAL APPLICATIONST. LUCIE UNITS 1 & 2
CHAPTER 4.0 ENVIRONMENTAL CONSEQUENCES OF THE PROPOSED ACTION Page 4.5-1AND MITIGATING ACTIONS
4.5 IMPACTS OF REFURBISHMENT ON TERRESTRIAL RESOURCES
NRCThe environmental report must contain an assessment of “…the impact of refurbishment andother license-renewal-related construction activities on important plant and animalhabitats….” 10 CFR 51.53(c)(3)(ii)(E)“Refurbishment impacts are insignificant if no loss of important plant and animal habitatoccurs. However, it cannot be known whether important plant and animal communities maybe affected until the specific proposal is presented with the license renewal application.” 10CFR 51, Subpart A, Appendix B, Table B-1, Issue 40“If no important resources would be affected, the impacts would be considered minor and ofsmall significance. If important resources could be affected by refurbishment activities, theimpacts would be potentially significant….” (Ref. 4.2-1, Section 3.6, page 3-6)
The NRC made impacts of refurbishment on terrestrial resources a Category 2 issuebecause the significance of ecological impacts cannot be determined without consideringsite-specific and project-specific details (Ref. 4.2-1, Section 3.6). Aspects of the site and theproject to be ascertained are: (1) the identification of important ecological resources; (2) thenature of refurbishment activities; and (3) the extent of impacts to plant and animal habitat.
Detailed analyses are not required for this issue because, as discussed in Section 3.2, FPLhas no plans for major refurbishment or other license-renewal-related construction activitiesat St. Lucie Units 1 & 2.
LICENSE RENEWAL APPLICATIONST. LUCIE UNITS 1 & 2
CHAPTER 4.0 ENVIRONMENTAL CONSEQUENCES OF THE PROPOSED ACTION Page 4.6-1AND MITIGATING ACTIONS
4.6 THREATENED OR ENDANGERED SPECIES
NRC“All license renewal applicants shall assess the impact of refurbishment and other license-renewal-related construction activities on important plant and animal habitats. Additionally,the applicant shall assess the impact of the proposed action on threatened or endangeredspecies in accordance with the Endangered Species Act.” 10 CFR 51.53(c)(3)(ii)(E)“Generally, plant refurbishment and continued operation are not expected to adversely affectthreatened or endangered species. However, consultation with appropriate agencies wouldbe needed at the time of license renewal to determine whether threatened or endangeredspecies are present and whether they would be adversely affected.” 10 CFR Part 51,Subpart A, Appendix B, Table B-1, Issue 49
The NRC made impacts to threatened and endangered species a Category 2 issue becausethe status of many species is being reviewed, and site-specific assessment is required todetermine whether any identified species could be affected by refurbishment activities orcontinued plant operations through the renewal period. In addition, compliance with theEndangered Species Act requires consultation with the appropriate Federal agency (Ref.4.2-1, Sections 3.9 and 4.1).
Sections 2.2 and 2.3 discuss ecological habitats at St. Lucie Units 1 & 2 and alongassociated transmission lines. Section 2.4 presents a list of federally threatened andendangered species and state species of special concern (SSC) that may occur at St. LucieUnits 1 & 2 and along transmission lines. In this section, the environmental consequencesto these species of future plant refurbishment activities and continued operation of the plantare assessed.
As discussed in Section 3.2, FPL has no plans for major refurbishment or construction at St.Lucie Units 1 & 2 in association with license renewal. Therefore, there would be norefurbishment-related impacts to special-status species, and no further analysis ofrefurbishment-related impacts is required. During the almost 20 years of St. Lucie Unit 2commercial operation, the only notable effect of the two-unit facility’s operation on protectedspecies has related to sea turtles that have entered the Intake Canal. There have beenisolated incidents involving Florida manatees and Least Terns. A notable positive impact onprotected species would be realized by the continuation of the educational programs andmarine environmental protection programs that would be supported by the continuedoperation of St. Lucie Units 1 & 2.
There have been five occasions when manatees have entered in the Intake Canal. Duringthe first event, in 1991, FPL coordinated the capture with the U.S. Fish and Wildlife Service(FWS) and Florida Department of Environmental Protection (predecessor to the FWCC).Due to techniques employed, capture took 32 days. The animal underwent evaluation andrehabilitation and was released to the wild. During the four subsequent events, improvedcapture techniques were employed and the animals were removed from the Canal within aday of each first sighting. Two of these animals were taken to rehabilitation facilities prior totheir release. One was treated for deep propeller wounds that it incurred prior to enteringthe Canal and one appeared to be a small calf separated from its mother. None of themanatees appeared to have been harmed or to have died as a result of entering the Intake
LICENSE RENEWAL APPLICATIONST. LUCIE UNITS 1 & 2
CHAPTER 4.0 ENVIRONMENTAL CONSEQUENCES OF THE PROPOSED ACTION Page 4.6-2AND MITIGATING ACTIONS
Canal. FPL procedures require coordination with the FWCC on the capture and evaluationof entrapped manatees. FPL assists the FWCC, as needed, in transporting ill or injuredanimals to approved rehabilitation facilities, and in releasing animals that have entered theIntake Canal back to the wild.
There have been two incidents, one in 1991 and one in 1998, in which juvenile Least Ternswere washed by stormwater from nests built on the roof of the St. Lucie Units 1 & 2 TrainingCenter. The loss of a total 17 Terns occurred because of the failure of a protective nettingsystem covering the stormwater system. The FWS was notified of the incident under therequirements of the Migratory Bird Treaty Act. The stormwater system has since beenmodified to prevent such incidents.
Soon after startup of St. Lucie Unit 1, in 1976, sea turtles were discovered in the IntakeCanal (Ref. 4.6-1; Ref. 4.6-2). These turtles had entered the offshore velocity cap intakeand were swept through the intake pipe into the Canal. A program was initiated to capturethe turtles from the Intake Canal and return them to the ocean. In 1978, a large-mesh (eightinch) barrier net was deployed in the Canal to capture turtles before they transited the entireIntake Canal, entered the Intake Wells, and became impinged on the traveling intakescreens. A Biological Assessment and Endangered Species Act Section 7 Consultationwere completed in 1982 (Ref. 4.6-2) to address turtle entrapment in light of the pendingconstruction and operation of St. Lucie Unit 2. At this time, the turtle entrapment history atSt. Lucie Unit 1 was approximately 150 turtles per year from 1976 to 1981. Mortality ratesfor loggerhead and green sea turtles for this period were 14.6 percent and 8.9 percent,respectively. Projecting mortality losses to include operation of St. Lucie Unit 2, theBiological Assessment indicated that turtle losses at St. Lucie Units 1 & 2 would represent0.1 percent (loggerhead) to 0.03 percent (green) of the respective adult Caribbeanpopulations. It was concluded that no impact to the population of either species would beexpected. The assessment made several recommendations for enhancement of theongoing capture-release and beach-nest monitoring programs.
In 1995 in response to an increase in the number of sea turtles that had entered the IntakeCanal, particularly green sea turtles, the NRC reinitiated the Endangered Species ActSection 7 Consultation process with the National Marine Fisheries Service (NMFS). Early inthis consultation process, construction of a new, smaller mesh barrier east of the large meshbarrier was identified as appropriate, and construction of this small-mesh (five inch) barriernet was completed January 1996. The size of the mesh was selected to be smaller thanany of the green sea turtles that had entered the Intake Canal during the first half of 1995.The new net was located halfway between the old eight-inch mesh barrier net and the intakeheadwall, confining sea turtles that enter the Intake Canal to a smaller area, thus facilitatingtheir safe capture and release. The new net is anchored along the bottom of the Canal andheld up by an aerial wire that is strung between tensioning towers on the sides of the Canal.The net is inspected and maintained regularly.
As a result of this consultation, the NMFS issued a Biological Opinion on the matter (Ref.4.6-3). In the Biological Opinion, the NMFS concluded that the continued operation of St.Lucie Units 1 & 2 is not likely to jeopardize the existence of the sea turtle species. Toincrease protective measures for the turtles, NMFS included in the Biological Opinion anIncidental Take Statement. This Incidental Take Statement specifies the permissible annualmortality level of sea turtles that enter the Intake Canal. The requirements of the Incidental
LICENSE RENEWAL APPLICATIONST. LUCIE UNITS 1 & 2
CHAPTER 4.0 ENVIRONMENTAL CONSEQUENCES OF THE PROPOSED ACTION Page 4.6-3AND MITIGATING ACTIONS
Take Statement were incorporated as part of the St. Lucie Units 1 & 2 operating licenses. Ifthe annual mortality level criteria are exceeded, reinitiation of Section 7 Consultation isrequired.
In November 1999, the NRC formally requested reinitiation of the Section 7 process after St.Lucie Units 1 & 2 exceeded the NMFS’s anticipated incidental take of green turtles per yearestablished in the Incidental Take Statement of the 1997 Opinion. In March 2000, FPLsubmitted to the NMFS a report analyzing the physical and ecological facts influencing seaturtle entrainment levels during the period 1976 through 1998 (Ref. 4.6-1). In May 2001, theNMFS released their Biological Opinion and revised Incidental Take Statement. TheOpinion reiterates the previous conclusions and states, “…it is NMFS’ biological opinion thatthe continued use of St. Lucie Nuclear Power Plant’s circulating seawater cooling system isnot likely to jeopardize the continued existence of the endangered green, leatherback,hawksbill, and Kemp’s ridley sea turtles or the threatened loggerhead sea turtle.” (Ref. 4.6-5, page 42) The requirement of the revised Incidental Take Statement will be appended tothe St. Lucie Units 1 & 2 operating licenses. The NMFS specified that the annual incidentalcapture could be up to 1,000 turtles with that number being in any combination of the fivespecies found in the area. The permissible annual mortality of entrapped green andloggerhead sea turtles for the next 10 years is one percent of the total combined number ofgreen and loggerhead sea turtles captured. The permissible mortality levels for the otherthree species of sea turtle found in the area are two Kemp’s ridley turtles per year and onehawksbill or leatherback turtle every two years for the next 10 years. Some of the terms andconditions of the previous Opinion were also revised. Specifically, there are additionalrequirements for the Intake Canal capture and release program. Citing the loss rate onflipper tags and the scarring that can result, the NMFS now requires all turtles captured inthe Intake Canal be tagged with a passive integrated transponder (PIT). Those turtles notexhibiting flipper scarring and damage shall also be flipper tagged so that data can continueto be collected on the loss rates. Additionally, FPL biologists must notify the Florida SeaTurtle Stranding and Salvage Network staff of any sick or injured turtles within 30 minutes ofdiscovery so that the turtles can receive proper attention. The NMFS again stipulated that ifthe Incidental Take Statement requirements are exceeded, reinitiation of Section 7Consultation is required.
An extensive program is in place at St. Lucie Units 1 & 2 to mitigate the effects on seaturtles that enter the Intake Canal. This program includes recovery of turtles from the IntakeCanal and release to the ocean, beach-nest monitoring, beach-stranding monitoring, andcompliance with facility lighting restrictions to protect turtles. The Canal-monitoring programhas evolved over the years, and currently is based on the protection afforded by barrier netsupstream (east) of the State Road A1A bridge, at the State Road A1A bridge, anddownstream of the State Road A1A bridge (see Figure 2.1-3). This system of barriersrestricts turtles to the eastern end of the Canal where capture efficiency is greatest andresidency time is reduced. The Canal and barrier nets are monitored seven days a week, 8to 12 hours per day, by onsite biologists. In addition to entanglement nets, which are usedonly in daylight hours and under continual surveillance, turtles are removed by dip nets andhand capture by snorkel and skin divers. Hand captures have had a significant impact inreducing residence time for turtles in the Canal. FPL has constantly evaluated andcontinuously improved its netting program to minimize trauma to turtles and to maximizecapture efficiency. Any captured turtles are identified, measured, weighed, tagged, and
LICENSE RENEWAL APPLICATIONST. LUCIE UNITS 1 & 2
CHAPTER 4.0 ENVIRONMENTAL CONSEQUENCES OF THE PROPOSED ACTION Page 4.6-4AND MITIGATING ACTIONS
examined for health condition (Ref. 4.6-1, page 5). Healthy turtles are released to the oceanthe day of capture. Sick or injured turtles are sent to rehabilitation facilities determined bythe FWCC. Any dead turtles are processed similarly and, if in fresh condition, necropsied.Additional mitigation carried out by FPL includes performance of sea turtle nesting surveys,participation in the Sea Turtle Stranding and Salvage Network, and sponsorship ofeducational public sea turtle walks. FPL has also created a vegetative light screen, anduses shielded security lighting to prevent direct lighting of the beach. This was done toavoid disorientation of turtle hatchlings, or discouragement of females from nesting near theSt. Lucie Units 1 & 2 site. FPL also participates in a 24-hour on-call (beach) strandingmonitoring program (Ref. 4.6-4, Sections 6.2, 6.3, 6.4, and 7.2.3).
In summarizing the sea turtle issue at St. Lucie Units 1 & 2, the NMFS (Ref. 4.6-3)concluded that the increase in the number of turtles entering the Intake Canal over theoperating history of the plant was most likely due to an increase in turtle abundance in thearea. The agency acknowledged that protective measures have been refined and enhancedover the years. Improvements to the Canal capture program have included improvementsto the barrier net and capture techniques, and leaving the nets in the water for longer timeintervals. The new turtle barrier net, installed in 1996, greatly restricts the movement ofturtles within the Intake Canal and so facilitates their capture and removal. Since 1996,mortality rates have been less than 1 percent for loggerhead and green sea turtles (Ref. 4.6-6).
FPL has initiated contacts with the FWS, the NMFS, and the FWCC regarding St. LucieUnits 1 & 2 license renewal. Copies of the contact letters are provided in Appendix C.Based on the FPL analysis, license renewal impacts to threatened, endangered, or otherspecial-status species (Issue 49) would be SMALL, and further mitigation would not bewarranted.
LICENSE RENEWAL APPLICATIONST. LUCIE UNITS 1 & 2
CHAPTER 4.0 ENVIRONMENTAL CONSEQUENCES OF THE PROPOSED ACTION Page 4.7-1AND MITIGATING ACTIONS
4.7 AIR QUALITY DURING REFURBISHMENT (NON-ATTAINMENT ORMAINTENANCE AREAS)
NRC“If the applicant’s plant is located in or near a nonattainment or maintenance area, anassessment of vehicle exhaust emissions anticipated at the time of peak refurbishmentworkforce must be provided in accordance with the Clean Air Act as amended.” 10 CFR51.53(c)(3)(ii)(F)“Air quality impacts from plant refurbishment associated with license renewal are expected tobe small. However, vehicle exhaust emissions could be cause for concern at locations in ornear nonattainment or maintenance areas. The significance of the potential impact cannot bedetermined without considering the compliance status of each site and the numbers ofworkers expected to be employed during the outage….” 10 CFR 51, Subpart A, Appendix B,Table B-1, Issue 50
The NRC made impacts to air quality during refurbishment a Category 2 issue becausevehicle exhaust emissions could be cause for some concern, and a general conclusionabout the significance of the potential impact could not be drawn without considering thecompliance status of each site and the number of workers expected to be employed duringthe outage (Ref. 4.2-1, Section 3.3). Information needed would include: (1) the attainmentstatus of the plant-site area; and (2) number of additional vehicles as a result ofrefurbishment activities.
St. Lucie Units 1 & 2 are not located in or near a non-attainment or maintenance area.Additionally, detailed analysis is not required for this issue because, as discussed in Section3.2, FPL has no plans for major refurbishment at St. Lucie Units 1 & 2 in association withlicense renewal.
LICENSE RENEWAL APPLICATIONST. LUCIE UNITS 1 & 2
CHAPTER 4.0 ENVIRONMENTAL CONSEQUENCES OF THE PROPOSED ACTION Page 4.8-1AND MITIGATING ACTIONS
4.8 ELECTRIC SHOCK FROM TRANSMISSION-LINE-INDUCEDCURRENTS
NRC“If the applicant’s transmission lines that were constructed for the specific purpose ofconnecting the plant to the transmission system do not meet the recommendations of theNational Electrical Safety Code for preventing electric shock from induced currents, anassessment of the impact of the proposed action on the potential shock hazard from thetransmission lines must be provided.” 10 CFR 51.53 (c)(3)(ii)(H)“Electrical shock resulting from direct access to energized conductors or from inducedcharges in metallic structures have not been found to be a problem at most operating plantsand generally are not expected to be a problem during the license renewal term. However,site-specific review is required to determine the significance of the electric shock potential atthe site.” 10 CFR Part 51, Subpart A, Appendix B, and Table B-1, Issue 59
The NRC made the impact of electric shock from transmission lines a Category 2 issuebecause without a review of each plant’s transmission line conformance with the NationalElectrical Safety Code® (NESC®) criteria, the NRC could not determine the significance ofthe electrical shock potential. The regulation at 10 CFR 51.53(c)(3)(ii)(H) does not definethe phrase “transmission line,” but in the GEIS, the NRC indicates that transmission linesuse voltages of about 115/138 kilovolts (kV) and higher, and that, in contrast, distributionlines use voltages below the 115/138 kV level (Ref. 4.2-1, Sections 2.2.7 and 4.5.1). TheGEIS also specifies that the transmission line of concern is located between the plantswitchyard and the intertie to the transmission system. Information to be ascertainedincludes: (1) change in line use and voltage since last analysis; (2) conformance withNESC® (1981) standards; and the potential change in land use along the transmission linessince the initial National Environmental Policy Act (NEPA) review.
The NESC® specifies minimum vertical clearances to the ground for electric lines. Forelectric lines operating at voltages exceeding 98 kV alternating current (AC) to ground (Ref.4.8-1), the clearance provided must limit the steady-state current1 due to electrostatic effectsto 5 milliamperes (mA) if the largest anticipated vehicle were short-circuited to ground. Forthis determination, the lines should be evaluated assuming final unloaded conductor sag at120°F. The Electric Power Research Institute (EPRI) has published a guide (Ref. 4.8-2) andhas developed a computer program named ENVIRO (Ref. 4.8-3), which together are usedto calculate the steady-state short-circuit current that may exist beneath transmission lines.The calculation is a two-step process in which the analyst first calculates the electric fieldstrength profile under the transmission line at the location(s) of minimum wire clearance.The second step is to utilize the calculated electric field strength profile to calculate thesteady-state short-circuit current value.
The St. Lucie to Midway Substation 230 kV transmission lines #1, #2, and #3 were installedin 1973, before the NESC® established a steady-state current limit. For this reason, ananalysis was performed to evaluate the lines’ adherence to the NESC® present steady-statelimit. The largest vehicle that is anticipated under the St. Lucie lines is a 65-foot long
1 The NESC® and the GEIS use the phrase “steady-state current,” whereas 10 CFR 51.53(c)(3)(ii)(H) uses the phrase “induced current.” The
phrases have the same meaning here.
LICENSE RENEWAL APPLICATIONST. LUCIE UNITS 1 & 2
CHAPTER 4.0 ENVIRONMENTAL CONSEQUENCES OF THE PROPOSED ACTION Page 4.8-2AND MITIGATING ACTIONS
tractor-trailer parked along a public roadway. The minimum design clearance above anypublic roadway along the transmission line corridor occurs at I-95 where the conductor is 28feet above ground at the NESC®-specified temperature of 120°F. The wire clearances atthis location, together with line characteristics such as voltage, current, and conductorposition, were entered into the EPRI ENVIRO computer program. The results yielded bythis program include the electric field strengths at 1m above ground and at 10-foot intervalsunder the lines. The maximum calculated electric field strength at this roadway crossing is2.79 kV/m. Centering a 65-foot object under the line at the location of the maximum electricfield and perpendicular to the alignment of the transmission lines would result in the objectbeing located in fields between 2.79 kV/m and 1.40 kV/m. The maximum average electricfield strength along the 65-foot long object is 2.09 kV/m.
Using the maximum average electric field strength and the EPRI reference bookmethodology (Ref. 4.8-2, Section 8.8), calculations were made to determine the steady-statecurrent for a tractor trailer 65 feet long, 8 feet wide, and 13.5 feet high (which is the largestregularly allowed vehicle on Florida roads). The resultant value, 1.9 mA, is less than the 5-mA limit imposed by the NESC®.
An additional analysis was performed to evaluate the electric shock concern if a vehiclewere parked anywhere under the lines at a point where the transmission conductor was aslow as allowable under the NESC® (Ref. 4.8-4). For this analysis, FPL used a clearance toground of 22 feet for the 230 kV lines. Using the same methods as detailed above, FPLcalculated a maximum electric field of 3.3 kV/m. The associated average electric field for a65-foot object centered under the line at the location of the maximum electric field andperpendicular to the alignment of the lines at this location is 2.51 kV/m. Using this maximumaverage electric field strength, the EPRI calculation method for steady-state current resultsin a value of 2.3 mA, which is again less than the 5-mA limit imposed by the NESC®.
A final supplemental analysis was performed for a section of the transmission line corridorwhere the St. Lucie 230 kV transmission lines run parallel to a 500 kV circuit. These twolines share the corridor for about 1.5 miles prior to the transmission lines terminating at theMidway Substation. For this analysis, FPL calculated the maximum electric field strength tobe 6.15 kV/m under the 500 kV line. While these field strengths are clearly associated withthe 500 kV line and not the St. Lucie 230 kV lines located 188 feet away, the corridorcontains both sets of lines. While it is, therefore, not needed, FPL included an analysis ofthis section for completeness. The maximum electric field strength under the 500 kV linewas calculated to be 6.15 kV/m, with an average over a 65-foot span located perpendicularto the line of 4.95 kV/m. Using this maximum average electric field strength, the EPRIcalculation method for steady-state currents results in a value of 4.5 mA, which is again lessthan the 5-mA limit imposed by the NESC®.
As described previously, the St. Lucie to Midway Substation 230 kV transmission lines #1,#2, and #3 adhere to the NESC®’s present steady-state current limit. Therefore, FPLconcludes that the St. Lucie 230 kV transmission lines #1, #2, and #3 meet the NESC®
recommendations for preventing electric shock from induced currents and furtherassessment of the impact of the proposed action on the potential shock hazard is notrequired. FPL adopts, by reference, the NRC’s conclusion in the GEIS that the impact ofelectric shock (Issue 59) is of SMALL significance for such lines. Due to the small
LICENSE RENEWAL APPLICATIONST. LUCIE UNITS 1 & 2
CHAPTER 4.0 ENVIRONMENTAL CONSEQUENCES OF THE PROPOSED ACTION Page 4.8-3AND MITIGATING ACTIONS
significance of the issue, mitigation measures, such as the installation of warning signs atroadway crossings or increasing wire clearances, are not warranted.
LICENSE RENEWAL APPLICATIONST. LUCIE UNITS 1 & 2
CHAPTER 4.0 ENVIRONMENTAL CONSEQUENCES OF THE PROPOSED ACTION Page 4.9-1AND MITIGATING ACTIONS
4.9 HOUSING IMPACTS
NRCThe environmental report must contain “ …An assessment of the impact of the proposedaction on housing availability…” 10 CFR 51.53(c)(3)(ii)(I)“Housing impacts are expected to be of small significance at plants located in a medium orhigh population area and not in an area where growth control measures that limit housingdevelopment are in effect. Moderate or large housing impacts of the workforce associatedwith refurbishment may be associated with plants located in sparsely populated areas orareas with growth control measures that limit housing development.” 10 CFR Part 51,Subpart A, Appendix B, Table B-1, Issue 63“…[S]mall impacts result when no discernible change in housing availability occurs, changesin rental rates and housing values are similar to those occurring statewide, and no housingconstruction or conversion occurs.” (Ref. 4.2-1, Section 4.7.1.1)
The NRC made housing impacts a Category 2 issue because impact magnitude depends onlocal conditions that the NRC could not predict for all plants at the time of GEIS publication(Ref. 4.2-1, Section 3.7.2). Local conditions to be ascertained are: (1) populationcategorization as small, medium, or high; and (2) applicability of growth control measures.
Refurbishment activities and continued operations could result in housing impacts due toincreased staffing. As described in Section 3.2, FPL does not plan to perform majorrefurbishment activities in association with license renewal. FPL concludes that there wouldbe no refurbishment-related impacts to area housing and, therefore, no analysis is required.Accordingly, the following discussion focuses on impacts of continued operations on localhousing availability.
As described in Section 2.5, the St. Lucie Units 1 & 2 site is located in a medium populationarea. Martin and St. Lucie counties, as noted in Section 2.8, are not subject to growthcontrol measures that limit housing development. At 10 CFR Part 51, Subpart A, AppendixB, Table B-1 (Issue 63), the NRC concludes that impacts to housing are expected to be ofsmall significance at plants located in “medium” population areas where growth controlmeasures are not in effect. Therefore, FPL expects housing impacts to be small.
This conclusion is supported by the following site-specific housing analysis. The maximumimpact to area housing is calculated using the following assumptions: (1) all direct andindirect jobs would be filled by in-migrating residents; (2) the residential distribution of newresidents would be similar to current worker distribution; and (3) each new job created(direct and indirect) represents one housing unit. As described in Section 3.4,approximately 83 percent of the total number of St. Lucie Units 1 & 2 employees resides inMartin and St. Lucie counties. Therefore, the focus of the housing impact analysis is onthese two counties. As described in Section 3.4, FPL’s conservative estimate of 60 licenserenewal employees could generate the demand for 138 housing units (60 direct and 78indirect jobs). If it is assumed that 83 percent of the 138 new workers would locate in theMartin- and St. Lucie-County areas, consistent with current employee trends, a need for 115new housing units would be created. In an area with a population of over 319,000 andvacancy rates in excess of 15 percent, this would not create a discernible change in housingavailability, change rental rates and housing values, or spur housing construction or
LICENSE RENEWAL APPLICATIONST. LUCIE UNITS 1 & 2
CHAPTER 4.0 ENVIRONMENTAL CONSEQUENCES OF THE PROPOSED ACTION Page 4.9-2AND MITIGATING ACTIONS
conversion. Given the magnitude of impact, which is SMALL, mitigative measures are notnecessary.
LICENSE RENEWAL APPLICATIONST. LUCIE UNITS 1 & 2
CHAPTER 4.0 ENVIRONMENTAL CONSEQUENCES OF THE PROPOSED ACTION Page 4.10-1AND MITIGATING ACTIONS
4.10 PUBLIC UTILITIES: PUBLIC WATER SUPPLY AVAILABILITY
NRCThe environmental report must contain “…an assessment of the impact of populationincreases attributable to the proposed project on the public water supply.” 10 CFR51.53(c)(3)(ii)(I)“An increased problem with water shortages at some sites may lead to impacts of moderatesignificance on public water supply availability.” 10 CFR Part 51, Subpart A, Appendix B,Table B-1, Issue 65“Impacts on public utility services are considered small if little or no change occurs in theability to respond to the level of demand and thus there is no need to add capital facilities.Impacts are considered moderate if overtaxing of facilities during peak demand periodsoccurs. Impacts are considered large if existing service levels (such as quality of water andsewage treatment) are substantially degraded and additional capacity is needed to meetongoing demands for services.” (Ref. 4.2-1, Section 3.7.4.5)
The NRC made public utility impacts a Category 2 issue because an increased problem withwater availability may occur in conjunction with plant demand and plant-related populationgrowth as a result of current water shortages in some areas (Ref. 4.2-1, Section 4.7.3.5).Local information needed would include: (1) a description of water shortages experienced inthe area; and (2) an assessment of the public water supply system’s available capacity.
The NRC’s analysis of impacts to the public water supply system considered both plantdemand and plant-related population growth demands on local water resources. Asdiscussed in Section 3.2, FPL plans no major refurbishment in association with licenserenewal, so plant demand would not be affected by major refurbishment activities.
The impact to the local water supply systems resulting from plant-related population growthcan be determined by calculating the amount of water that would be required by theseindividuals. The average American uses between 50 and 80 gallons per day for personaluse (Ref. 4.10-1, page 2). As described in Section 3.4, FPL’s conservative estimate of 60license renewal employees could generate a total of 138 new jobs. This could result in apopulation increase of 339 in the area [138 jobs multiplied by 2.46 average number ofpersons per household in the State of Florida (Ref. 4.10-2)]. Using this consumption rate,the plant-related population increase would require approximately 17,000 to 27,000additional gallons per day. This amount represents less than one percent of the currentSouth Florida Water Management District allocation for either Martin or St. Lucie County.Therefore, the impacts resulting from plant-related population growth to the public watersupply would be SMALL, requiring no increase in allocations and not warranting mitigation.
LICENSE RENEWAL APPLICATIONST. LUCIE UNITS 1 & 2
CHAPTER 4.0 ENVIRONMENTAL CONSEQUENCES OF THE PROPOSED ACTION Page 4.11-1AND MITIGATING ACTIONS
4.11 EDUCATION IMPACTS FROM REFURBISHMENT
NRCThe environmental report must contain, “An assessment of the impact of the proposed actionon…public schools (impacts from refurbishment activities only) within the vicinity of theplant….” 10 CFR 51.53(c)(3)(ii)(I)“Most sites would experience impacts of small significance but larger impacts are possibledepending on site- and project-specific factors.” 10 CFR 51, Subpart A, Appendix B, Table B-1, Issue 66“…[S]mall impacts are associated with project-related enrollment increases of 3 percent orless. Impacts are considered small if there is no change in the school systems’ abilities toprovide educational services and if no additional teaching staff or classroom space is needed.Moderate impacts generally are associated with 4 to 8 percent increases in enrollment…and…if a school system must increase its teaching staff or classroom space even slightly topreserve its pre-project level of service…. Large impacts are associated with project-relatedenrollment increases above 8 percent….” (Ref. 4.2-1, Section 3.7.4.1)
The NRC made impacts to education a Category 2 issue because site-specific and project-specific factors determine the significance of impacts (Ref. 4.2-1, Section 3.7.4.1). Localfactors to be ascertained include: (1) project-related enrollment increases; and (2) status ofthe student/teacher ratio.
As described in Section 3.2, FPL does not plan to perform major refurbishment activities atSt. Lucie Units 1 & 2 in association with license renewal. FPL concludes that there would beno refurbishment-related impacts to education and, therefore, no analysis is required.
LICENSE RENEWAL APPLICATIONST. LUCIE UNITS 1 & 2
CHAPTER 4.0 ENVIRONMENTAL CONSEQUENCES OF THE PROPOSED ACTION Page 4.12-1AND MITIGATING ACTIONS
4.12 OFFSITE LAND USE
4.12.1 REFURBISHMENT
NRCThe environmental report must contain, “An assessment of the impact of the proposed actionon…land-use… (impacts from refurbishment activities only) within the vicinity of the plant….”10 CFR 51.53(c)(3)(ii)(I)“Impacts may be of moderate significance at plants in low population areas.” 10 CFR 51,Subpart A, Appendix B, Table B-1, Issue 68“…if plant-related population growth is less than 5 percent of the study area’s totalpopulation, off-site land-use changes would be small, especially if the study area hasestablished patterns of residential and commercial development, a population density of atleast 60 persons per square mile…and at least one urban area with a population of 100,000 ormore within…50 miles….” (Ref. 4.2-1, Section 3.7.5)
The NRC made impacts to offsite land use as a result of refurbishment activities a Category2 issue because land-use changes could be considered beneficial by some communitymembers and adverse by others. Local conditions to be ascertained include: (1) plant-related population growth; (2) patterns of residential and commercial development; and (3)proximity to an urban area of at least 100,000.
As described in Section 3.2, FPL does not plan to perform major refurbishment activities atSt. Lucie Units 1 & 2 in association with license renewal. FPL concludes that there would beno refurbishment-related impacts to offsite land use and, therefore, no analysis is required.
LICENSE RENEWAL APPLICATIONST. LUCIE UNITS 1 & 2
CHAPTER 4.0 ENVIRONMENTAL CONSEQUENCES OF THE PROPOSED ACTION Page 4.12-2AND MITIGATING ACTIONS
4.12.2 OFFSITE LAND USE: LICENSE RENEWAL TERM
NRCThe environmental report must contain, “An assessment of the impact of the proposed actionon …land-use…within the vicinity of the plant…” 10 CFR 51.53(c)(3)(ii)(I)“Significant changes in land use may be associated with population and tax revenue changesresulting from license renewal.” 10 CFR Part 51, Subpart A, Appendix B, Table B-1, Issue 69“…if plant-related population growth is less than five percent of the study area’s totalpopulation, off-site land-use changes would be small…” (Ref. 4.2-1, Section 3.7.5)“If the plant’s tax payments are projected to be small relative to the community’s totalrevenue, new tax-driven land-use changes during the plant’s license renewal term would besmall, especially where the community has pre-established patterns of development and hasprovided adequate public services to support and guide development.” (Ref. 4.2-1, Section4.7.4.1)
The NRC made impacts to offsite land use during the license renewal term a Category 2issue because land-use changes may be perceived to be beneficial by some communitymembers and adverse by others. Therefore, the NRC could not assess the potentialsignificance of site-specific offsite land-use impacts (Ref. 4.2-1, Section 4.7.4.1). Site-specific factors to consider in an assessment of new tax-driven land-use impacts include:(1) the size of plant-related population growth compared to the area’s total population; (2)the size of the plant’s tax payments relative to the community’s total revenue; (3) the natureof the community’s existing land-use pattern; and (4) the extent to which the communityalready has public services in place to support and guide development.
In the GEIS, the NRC presents an analysis of offsite land use for the renewal term that ischaracterized by two components, population-driven and tax-driven impacts (Ref. 4.2-1,Section 4.7.4.1). Based on the GEIS case study analysis, the NRC concludes that all newpopulation-driven land-use changes during the license renewal term at all nuclear powerplants would be small. [Population growth caused by license renewal would represent amuch smaller “percentage of the local area’s” total population than the percentagerepresented by operations-related growth (Ref. 4.2-1, Section 4.7.4.2)].
As described in Section 3.2, no major refurbishment or construction activities will beassociated with St. Lucie Units 1 & 2 license renewal. FPL, therefore, does not anticipateany new tax payments that would influence offsite land use. As shown in Table 2.7-1 ofSection 2.7, FPL annual property tax payments to St. Lucie County for St. Lucie Units 1 & 2represented approximately 10.8 percent of the county’s total annual property tax revenuesfrom 1990 through 2000, and for the years 1997-2000 approximately 8.2 percent of St. LucieCounty’s annual total revenues. The NRC has determined that the significance of taxpayments is small if payments are less than 10 percent of a taxing jurisdiction’s totalrevenues (Ref. 4.2-1, Section 4.7.2.1). The NRC has further determined that if a plant’s taxpayments are projected to be small, license renewal tax-driven land-use changes wouldmost likely be small with very little new development and minimal changes to the area’sland-use patterns (Ref. 4.2-1, Section 4.7.4.1). FPL concurs with the NRC determinationand concludes that tax-driven land-use impacts would be SMALL and mitigative measureswould not be warranted.
LICENSE RENEWAL APPLICATIONST. LUCIE UNITS 1 & 2
CHAPTER 4.0 ENVIRONMENTAL CONSEQUENCES OF THE PROPOSED ACTION Page 4.13-1AND MITIGATING ACTIONS
4.13 TRANSPORTATION
NRCThe environmental report must contain an assessment of “…the impact of the proposedproject on local transportation during periods of license renewal refurbishment activities….”10 CFR 51.53(c)(3)(ii)(J)“Transportation impacts are generally expected to be of small significance. However, theincrease in traffic associated with the additional workers and the local road and traffic controlconditions may lead to impacts of moderate or large significance at some sites.” 10 CFR Part51, Subpart A, Appendix B, Table B-1, Issue 70Level of Service (LOS) “A and B are associated with small impacts because the operation ofindividual users is not substantially affected by the presence of other users.” LOS A ischaracterized by “free flow at the traffic stream; users are unaffected by the presence ofothers.” LOS B is characterized by “stable flow in which the freedom to maneuver is slightlydiminished.” (Ref. 4.2-1, Section 3.7.4.2)
The NRC made impacts to transportation a Category 2 issue because impact significance isdetermined primarily by road conditions existing at the time of the project, which the NRCcould not forecast for all plants (Ref. 4.2-1, Section 3.7.4.2). Local road conditions to beascertained are: (1) level of service conditions; and (2) incremental increase in trafficassociated with refurbishment activities and license renewal staff.
As described in Section 3.2, FPL does not plan to perform major refurbishment activities atSt. Lucie Units 1 & 2 in association with license renewal. FPL concludes that there would beno refurbishment-related impacts to local transportation and, therefore, no analysis isrequired.
As noted in Section 2.9.2, access to St. Lucie Units 1 & 2 is via State Road A1A, whichcarries a level-of-service (LOS) designation of ‘A’ in the vicinity of the site. North and southof the site, State Road A1A carries an LOS designation of ‘B.’ In GEIS Section 3.7.4.2 (Ref.4.2-1), the NRC concluded that impacts to roads with LOS designations of ‘A’ or ‘B’ aresmall.
The current workforce associated with St. Lucie Units 1 & 2 is approximately 930 employees(FPL and contractors). Each refueling outage, which lasts about 30 days, adds 575-870workers. Each Unit has a refueling outage once every 18 months. The FPL conservativeprojection of 60 additional employees associated with “operating over the license renewalterm” for St. Lucie Units 1 & 2 represents approximately a 6 percent increase in the currentnumber of employees and an even smaller percentage of the employees present on siteduring periodic refueling. Given these employment projections and LOS designations of ‘A’and ‘B’ for the access road to St. Lucie Units 1 & 2, it is consistent with the GEIS toconclude that impacts to transportation would be SMALL and mitigative measures would notbe necessary.
LICENSE RENEWAL APPLICATIONST. LUCIE UNITS 1 & 2
CHAPTER 4.0 ENVIRONMENTAL CONSEQUENCES OF THE PROPOSED ACTION Page 4.14-1AND MITIGATING ACTIONS
4.14 HISTORIC AND ARCHAEOLOGICAL RESOURCES
NRCThe environmental report must contain an assessment of “…whether any historic orarchaeological properties will be affected by the proposed project.” 10 CFR 51.53(c)(3)(ii)(K)“Generally, plant refurbishment and continued operation are expected to have no more thansmall adverse impacts on historic and archaeological resources. However, the NationalHistoric Preservation Act requires the Federal agency to consult with the State HistoricPreservation Officer to determine whether there are properties present that requireprotection.” 10 CFR 51, Subpart A, Appendix B, Table B-1, Issue 71“Sites are considered to have small impacts to historic and archaeological resources if (1) theState Historic Preservation Office (SHPO) identifies no significant resources on or near thesite; or (2) the SHPO identifies (or has previously identified) significant historic resources butdetermines they would not be affected by plant refurbishment, transmission lines, andlicense-renewal term operations and there are no complaints from the affected public aboutthe character; and (3) if the conditions associated with moderate impacts do not occur.” (Ref.4.2-1, Section 3.7.7)
The NRC made impacts to historic and archaeological resources a Category 2 issuebecause determinations of impacts to historic and archaeological resources are site-specificin nature, and the National Historic Preservation Act mandates that determination of impactsmust be made through consultation with the State Historic Preservation Officer (SHPO) (Ref.4.2-1, Section 4.7.7.3).
As described in Section 3.2, FPL does not plan to perform land-disturbing refurbishmentactivities at St. Lucie Units 1 & 2 in association with license renewal. Therefore, FPLconcludes that there would be no refurbishment-related impacts to historic andarchaeological resources and, therefore, no analysis is required.
As described in Section 2.10, no known archaeological or historic sites of significance werethreatened during construction of St. Lucie Units 1 & 2 in the 1970s and 1980s. The recordsof the SHPO depict, on the north end of the site in the vicinity of the property boundary, twoarchaeological sites consisting of Malibar Indian middens, mounds, and burial mounds. Onthe south end of the site, in the vicinity of the property boundary, is a swamp wreck datingfrom the 19th or 20th century. These areas are wetlands and mangroves and, therefore,would not be likely candidates for land-disturbing activities during the license renewal term.
Transmission line rights-of-way have been categorized and inventoried. No knownarchaeological or historic sites of significance have been identified on the rights-of-way.Therefore, continued use of transmission lines and rights-of-way are projected to cause littleor no impact.
FPL has initiated discussions with the SHPO regarding St. Lucie Units 1 & 2 licenserenewal, and the SHPO has determined that it is unlikely that historical properties would beaffected by this undertaking. Copies of the correspondence with the SHPO are provided inAppendix D.
Appropriate care will be taken to protect archaeological and historic resources should anyland-clearing or ground-disturbing activities be undertaken in previously undisturbed areasduring the period of continued operations. FPL concludes that continued operation would
LICENSE RENEWAL APPLICATIONST. LUCIE UNITS 1 & 2
CHAPTER 4.0 ENVIRONMENTAL CONSEQUENCES OF THE PROPOSED ACTION Page 4.14-2AND MITIGATING ACTIONS
have no adverse impacts to historic resources; hence, there would be no impacts tomitigate. Because the definition of “small” includes impacts that are not detectable, theappropriate characterization of the impact on historic and archaeological resources isSMALL.
LICENSE RENEWAL APPLICATIONST. LUCIE UNITS 1 & 2
CHAPTER 4.0 ENVIRONMENTAL CONSEQUENCES OF THE PROPOSED ACTION Page 4.15-1AND MITIGATING ACTIONS
4.15 SEVERE ACCIDENT MITIGATION ALTERNATIVES
NRCThe environmental report must contain a consideration of alternatives to mitigating severeaccidents “[i]f the staff has not previously considered severe accident mitigation alternativesfor the applicant’s plant in an environmental impact statement or related supplement or in anenvironmental assessment…” 10 CFR 51.53(c)(3)(ii)(L)“The probability weighted consequences of atmospheric releases, fallout onto open bodies ofwater, releases to ground water, and societal and economic impacts from severe accidentsare small for all plants. However, alternatives to mitigate severe accidents must beconsidered for all plants that have not considered such alternatives.” 10 CFR Part 51, SubpartA, Appendix B, Table B-1, Issue 76
The term “accident” refers to any unintentional event (i.e., outside the normal or expectedplant operational envelope) that results in the release or a potential for release of radioactivematerial to the environment. Generally, the NRC categorizes accidents as “design basis” or“severe.” Design basis accidents are those for which the risk is great enough that anapplicant is required to design and construct a plant to prevent unacceptable accidentconsequences. Severe accidents are those considered too unlikely to warrant designcontrols.
Historically, the NRC has not included in its Environmental Impact Statements (EISs) orenvironmental assessments any analysis of alternative ways to mitigate the environmentalimpacts of severe accidents. A 1989 court decision ruled that, in the absence of an NRCfinding that severe accidents are remote and speculative, severe accident mitigationalternatives (SAMAs) should be considered in the NEPA analysis [Limerick Ecology Actionv. NRC, 869 F.d 719 (3rd Cir. 1989)]. For most plants, including St. Lucie Units 1 & 2,license renewal is the first licensing action that would necessitate consideration of SAMAs.
The NRC concludes in its generic license renewal rulemaking that the unmitigatedenvironmental impacts from severe accidents meet the Category 1 criteria, but the NRC hasmade consideration of mitigation alternatives a Category 2 issue because ongoingregulatory programs related to mitigation [i.e., Individual Plant Examination (IPE) andAccident Management] are not complete for all plants. Since these programs haveidentified plant programmatic and procedural improvements (and, in a few cases, minormodifications) as cost-effective in reducing severe accident and risk consequences, theNRC thought it premature to draw a generic conclusion as to whether severe accidentmitigation would be required for license renewal. Site-specific information to be presented inthe environmental report includes: (1) potential SAMAs; (2) benefits and costs ofimplementing potential SAMAs; and (3) sensitivity of the analysis to changes to keyunderlying assumptions.
4.15.1 METHODOLOGY OVERVIEW
The methodology to perform the SAMA cost-benefit analysis is based primarily on thehandbook used by the NRC to analyze benefits and costs of its regulatory activities,NUREG/BR-0184 (Ref. 4.15-1), subject to consideration of plant-specific SAMAs identifiedby FPL.
LICENSE RENEWAL APPLICATIONST. LUCIE UNITS 1 & 2
CHAPTER 4.0 ENVIRONMENTAL CONSEQUENCES OF THE PROPOSED ACTION Page 4.15-2AND MITIGATING ACTIONS
EISs and environmental reports are prepared using a sliding scale in which impacts ofgreater concern and mitigating measures of greater potential value receive more detailedanalysis than do impacts of less concern and mitigating measures of less potential value.Accordingly, FPL uses less detailed feasibility investigative and cost estimation techniquesfor SAMAs having disproportionately high costs and low benefits and more detailedevaluations for the most viable candidates. The reduction in the total potential costs ofsevere accidents resulting from the implementation of a SAMA constitutes the benefitassociated with that SAMA. This benefit is compared with the estimated cost of theimplementation of the SAMA to determine if it is cost beneficial to implement that SAMA.
The following is a brief outline of the approach taken in the SAMA analysis:
• Establish the Base Case – The current Probabilistic Risk Assessment (PRA) at thetime of the evaluation was considered the base case for comparison. Themethodology of NUREG/BR-0184 was followed to evaluate severe accident impacts:o Offsite exposure – Monetary value of consequences (dose) to offsite population:
Use the St. Lucie Units 1 & 2 Probabilistic Safety Assessment (PSA) model,which uses PRA techniques, to determine total accident frequency (core damagefrequency and containment release frequency); the Melcor AccidentConsequence Code System (MACCS) to convert release input to public dose;and the NUREG/BR-0184 methodology to convert dose to present-worth dollars(based on valuation of $2,000 per person-rem and a present-worth discountfactor of 7 percent).
o Offsite economic costs – Monetary value of damage to offsite property:Use the PSA model to determine total accident frequency (core damagefrequency and containment release frequency); the MACCS to convert releaseinput to offsite property damage; and the NUREG/BR-0184 methodology toconvert offsite property damage estimate to present-worth dollars.
o Onsite exposure costs – Monetary value of dose to workers:Use NUREG/BR-0184 best estimate occupational dose values for immediate andlong-term dose, then apply the NUREG/BR-0184 methodology to convert dose topresent worth dollars (based on valuation of $2,000 per person-rem and apresent-worth discount factor of 7 percent).
o Onsite economic costs – Monetary value of damage to onsite property:Use NUREG/BR-0184 best estimate cleanup and decontamination costs,including replacement power costs; then apply the NUREG/BR-0184methodology to convert onsite property damage estimate to present-worthdollars.
• SAMA Identification – Identify potential SAMAs from the following sources:o Severe Accident Mitigation Design Alternative (SAMDA) analyses submitted in
support of original licensing activities for other operating nuclear power plantsand advanced light water reactor plants; SAMA analyses submitted in support oflicense renewal activities for other nuclear power plants; NRC and industrydocumentation discussing potential plant improvements; and documentedinsights provided by plant staff.
LICENSE RENEWAL APPLICATIONST. LUCIE UNITS 1 & 2
CHAPTER 4.0 ENVIRONMENTAL CONSEQUENCES OF THE PROPOSED ACTION Page 4.15-3AND MITIGATING ACTIONS
• Preliminary Screening – Eliminate obviously non-viable candidates, based upon:o SAMA improvements that modify features not applicable to St. Lucie Units 1 & 2;
oro SAMA improvements already implemented at the plant.
• Final Disposition of Remaining SAMAs – Eliminate candidates based on cost-benefit:o Screening based on excessive cost – Eliminate candidates based upon whether
the cost of implementing the SAMA would greatly exceed the maximum benefitfor base case evaluation.
o Benefit/cost evaluation – Evaluate benefits and costs of implementing the SAMA: Benefit calculation – Estimate benefits of implementing each SAMA
individually; use updated Level 2 model to determine revised core damagefrequency (CDF) and release fractions.
SAMA impacts – Calculate impacts (i.e., onsite/offsite dose and damages) bymanipulating the plant model to simulate revised plant risk followingimplementation of each individual SAMA.
SAMA benefits – Calculate benefits for each SAMA in terms of avertedconsequences. Averted consequences are the arithmetic differencesbetween the calculated impact for the base case and the revised impactfollowing implementation of each individual SAMA.
Cost estimate – Estimate cost of implementing each evaluated SAMA. Thedetail of the cost estimate must be commensurate with the benefit; if a benefitis very low, it is not necessary to perform a detailed cost estimate todetermine that the SAMA is not cost beneficial—engineering judgment can beapplied.
• Sensitivity Analysis – Determine the effect that changing the discount rate wouldhave on the cost-benefit calculation.
• Conclusions – Identify SAMAs that are cost beneficial, if any, and describeimplementation plans or the basis for not implementing.
The FPL SAMA analysis for St. Lucie Units 1 & 2 is presented in the following sections.These sections provide a detailed discussion of the process presented above.
4.15.2 ESTABLISHING THE BASE CASE
The purpose of establishing the base case is to provide the baseline for determining the riskreductions (benefits) that would be attributable to the implementation of potential SAMAs.The primary source of data relating to the base case is the PSA model. Severe accidentrisk is calculated through use of the St. Lucie Units 1 & 2 PSA model and the MACCS2Level 3 model. The model is the latest version of the St. Lucie Units 1 & 2 risk model anduses PRA techniques to:
• Develop an understanding of severe accident behavior;• Understand the most likely severe accident consequences;
LICENSE RENEWAL APPLICATIONST. LUCIE UNITS 1 & 2
CHAPTER 4.0 ENVIRONMENTAL CONSEQUENCES OF THE PROPOSED ACTION Page 4.15-4AND MITIGATING ACTIONS
• Gain a quantitative understanding of the overall probabilities of core damage andfission product releases; and
• Evaluate hardware and procedure changes to assess the overall probabilities of coredamage and fission product releases.
The PSA model includes internal events (e.g., loss of feedwater event, loss-of-coolantaccident) and is far more advanced than the IPE submitted by FPL to the NRC December1993 (Ref. 4.15-2). Due to periodic refinement, the PSA model is considered a “living” plantrisk model. The PSA model is periodically updated as a result of:
• Equipment Performance – As data collection progresses, estimated failure rates andsystem unavailability change.
• Plant Configuration Changes – A time lag exists between changes to the plant andincorporation of those changes into the PSA model.
• Modeling Changes – The PSA model is continually refined to incorporate the lateststate of knowledge. For example, if a new design calculation indicates that the heat-up rate of various plant areas is not as significant as initially estimated, then thisinformation is incorporated into the model.
The PSA model describes the results of the first two levels of the PSA for the plant. Theselevels are defined as follows: Level 1 – determines core damage frequencies based onsystem analyses and human-factor evaluations; and Level 2 – determines the physical andchemical phenomena that affect the performance of the containment and other radiologicalrelease mitigation features to quantify accident behavior and release of fission products tothe environment. The scope of plant challenges considered in the PSA model includes onlyinternal events (e.g., turbine trips, loss of main feedwater, internal floods). Appendix E.1provides information regarding the St. Lucie Units 1 & 2 PSA models and the modelingapproaches used in this SAMA analysis.
Using the results of these analyses, the next step is to perform a Level 3 PRA analysis,which calculates the hypothetical impacts of severe accidents on the surroundingenvironment and members of the public. The MACCS2 computer code is used fordetermining the offsite impacts for the Level 3 analysis, whereas the magnitude of the onsiteimpacts (in terms of cleanup and decontamination costs and occupational dose) are basedon information provided in NUREG/BR-0184 (Ref. 4.15-1). The principal phenomenaanalyzed are atmospheric transport of radionuclides; mitigating actions (i.e., evacuation,condemnation of contaminated crops and milk) based on dose projection; doseaccumulation by a number of pathways, including food and water ingestion; and economiccosts. Input for the Level 3 analysis includes the reactor core radionuclide inventory, sourceterms from the IPE (as applied to the PSA model), site meteorological data, projectedpopulation distribution (within a 50-mile radius) for the year 2025, emergency responseevacuation modeling, and economic data. Appendix E.2 describes the MACCS input data,assumptions, and results.
4.15.2.1 OFFSITE EXPOSURE COSTS
The Level 3 base case analysis shows an annual offsite exposure risk of 15.31 person-rem.This calculated value is converted to a monetary equivalent (dollars) via application of the
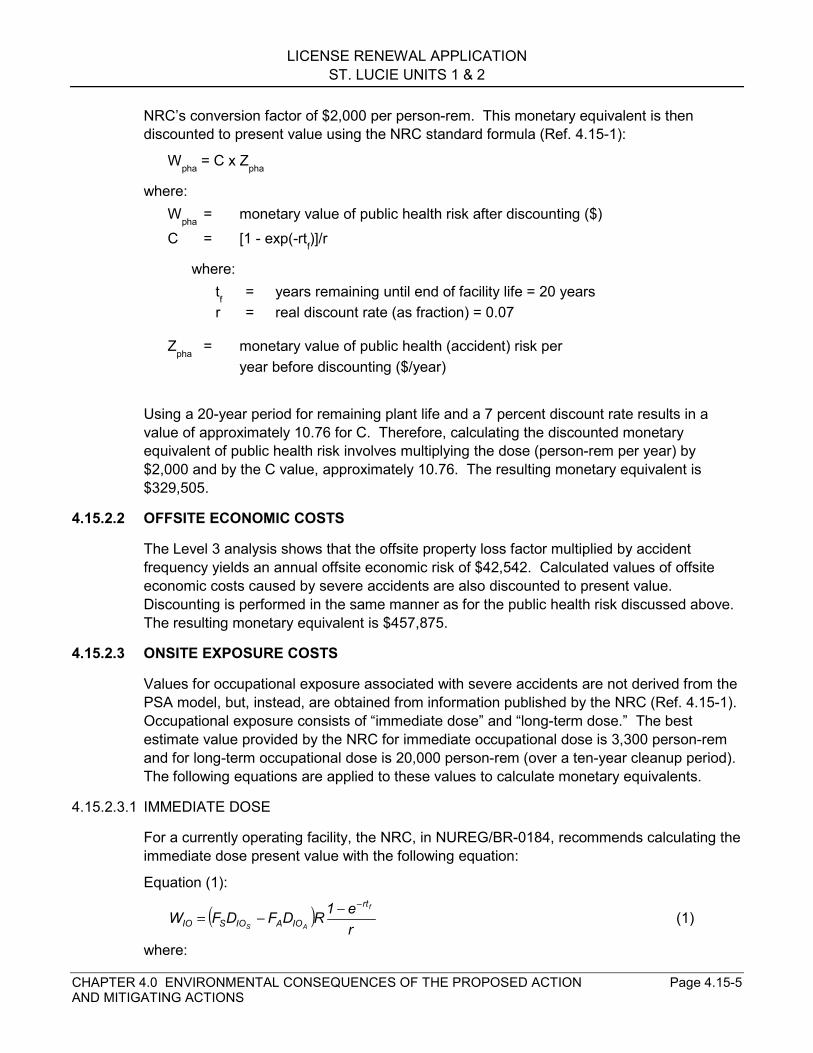
LICENSE RENEWAL APPLICATIONST. LUCIE UNITS 1 & 2
CHAPTER 4.0 ENVIRONMENTAL CONSEQUENCES OF THE PROPOSED ACTION Page 4.15-5AND MITIGATING ACTIONS
NRC’s conversion factor of $2,000 per person-rem. This monetary equivalent is thendiscounted to present value using the NRC standard formula (Ref. 4.15-1):
Wpha = C x Zpha
where:Wpha = monetary value of public health risk after discounting ($)C = [1 - exp(-rtf)]/r
where:tf = years remaining until end of facility life = 20 yearsr = real discount rate (as fraction) = 0.07
Zpha = monetary value of public health (accident) risk peryear before discounting ($/year)
Using a 20-year period for remaining plant life and a 7 percent discount rate results in avalue of approximately 10.76 for C. Therefore, calculating the discounted monetaryequivalent of public health risk involves multiplying the dose (person-rem per year) by$2,000 and by the C value, approximately 10.76. The resulting monetary equivalent is$329,505.
4.15.2.2 OFFSITE ECONOMIC COSTS
The Level 3 analysis shows that the offsite property loss factor multiplied by accidentfrequency yields an annual offsite economic risk of $42,542. Calculated values of offsiteeconomic costs caused by severe accidents are also discounted to present value.Discounting is performed in the same manner as for the public health risk discussed above.The resulting monetary equivalent is $457,875.
4.15.2.3 ONSITE EXPOSURE COSTS
Values for occupational exposure associated with severe accidents are not derived from thePSA model, but, instead, are obtained from information published by the NRC (Ref. 4.15-1).Occupational exposure consists of “immediate dose” and “long-term dose.” The bestestimate value provided by the NRC for immediate occupational dose is 3,300 person-remand for long-term occupational dose is 20,000 person-rem (over a ten-year cleanup period).The following equations are applied to these values to calculate monetary equivalents.
4.15.2.3.1 IMMEDIATE DOSE
For a currently operating facility, the NRC, in NUREG/BR-0184, recommends calculating theimmediate dose present value with the following equation:
Equation (1):
( )re1RDFDFW
f
AS
rt
IOAIOSIO
−−−= (1)
where:
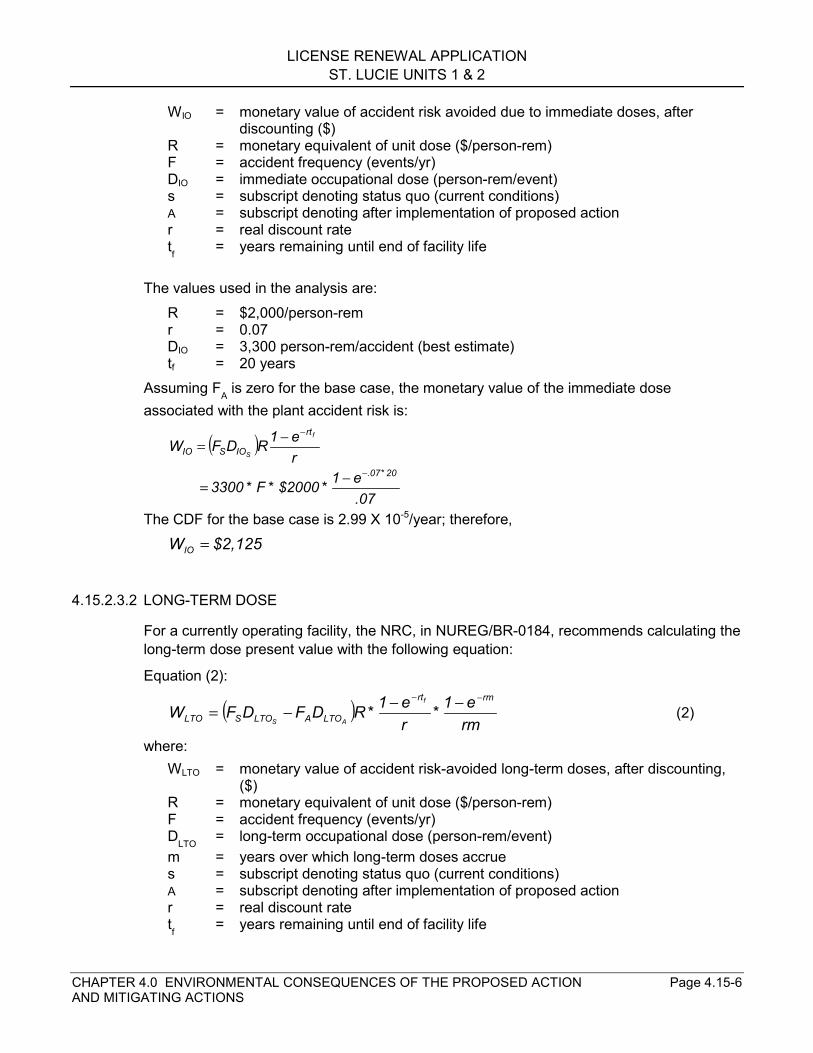
LICENSE RENEWAL APPLICATIONST. LUCIE UNITS 1 & 2
CHAPTER 4.0 ENVIRONMENTAL CONSEQUENCES OF THE PROPOSED ACTION Page 4.15-6AND MITIGATING ACTIONS
WIO = monetary value of accident risk avoided due to immediate doses, afterdiscounting ($)
R = monetary equivalent of unit dose ($/person-rem)F = accident frequency (events/yr)DIO = immediate occupational dose (person-rem/event)s = subscript denoting status quo (current conditions)A = subscript denoting after implementation of proposed actionr = real discount ratetf = years remaining until end of facility life
The values used in the analysis are:R = $2,000/person-remr = 0.07DIO = 3,300 person-rem/accident (best estimate)tf = 20 years
Assuming FA is zero for the base case, the monetary value of the immediate doseassociated with the plant accident risk is:
( )re1RDFW
f
S
rt
IOSIO
−−=
.07e1*$2000*F*3300
20*.07−−=
The CDF for the base case is 2.99 X 10⁻⁵/year; therefore,
$2,125WIO =
4.15.2.3.2 LONG-TERM DOSE
For a currently operating facility, the NRC, in NUREG/BR-0184, recommends calculating thelong-term dose present value with the following equation:
Equation (2):
( )rme1*
re1*RDFDFW
rmrt
LTOALTOSLTO
f
AS
−− −−−= (2)
where:WLTO = monetary value of accident risk-avoided long-term doses, after discounting,
($)R = monetary equivalent of unit dose ($/person-rem)F = accident frequency (events/yr)DLTO = long-term occupational dose (person-rem/event)m = years over which long-term doses accrues = subscript denoting status quo (current conditions)A = subscript denoting after implementation of proposed actionr = real discount ratetf = years remaining until end of facility life
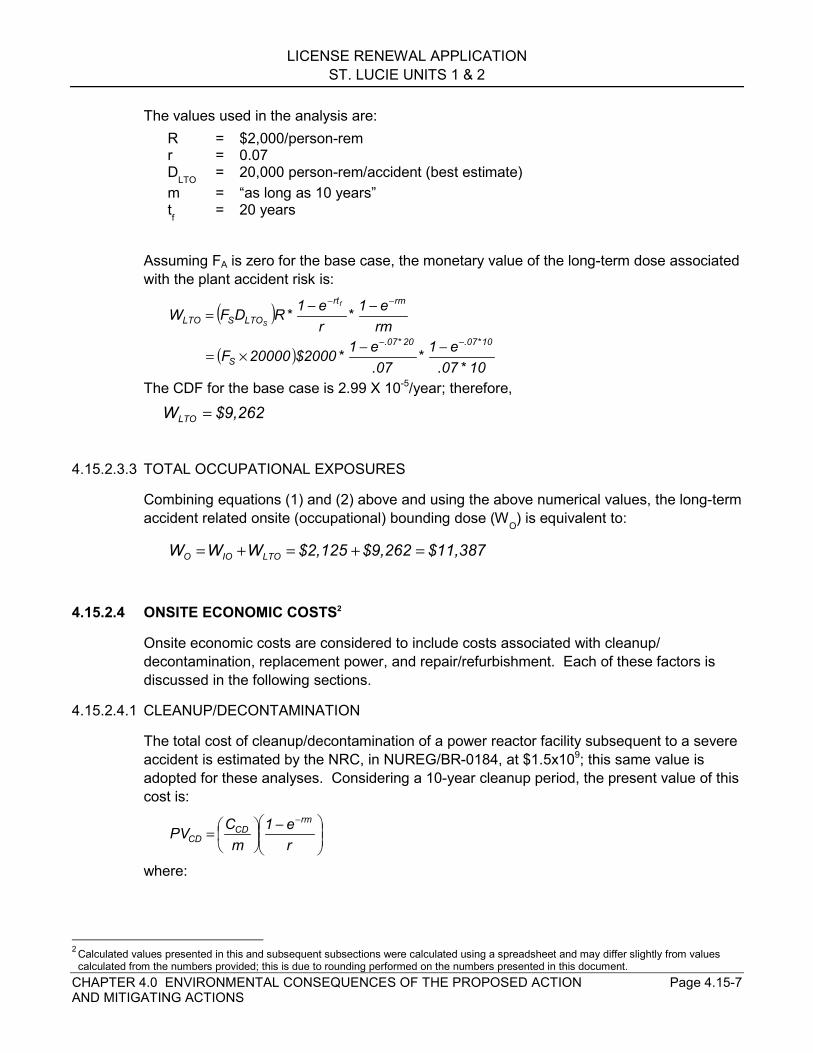
LICENSE RENEWAL APPLICATIONST. LUCIE UNITS 1 & 2
CHAPTER 4.0 ENVIRONMENTAL CONSEQUENCES OF THE PROPOSED ACTION Page 4.15-7AND MITIGATING ACTIONS
The values used in the analysis are:R = $2,000/person-remr = 0.07DLTO = 20,000 person-rem/accident (best estimate)m = “as long as 10 years”tf = 20 years
Assuming FA is zero for the base case, the monetary value of the long-term dose associatedwith the plant accident risk is:
( )rme1*
re1*RDFW
rmrt
LTOSLTO
f
S
−− −−=
( )10*.07
e1*.07e1*$200020000F
10*.0720*.07
S
−− −−×=
The CDF for the base case is 2.99 X 10⁻⁵/year; therefore,
$9,262WLTO =
4.15.2.3.3 TOTAL OCCUPATIONAL EXPOSURES
Combining equations (1) and (2) above and using the above numerical values, the long-termaccident related onsite (occupational) bounding dose (WO) is equivalent to:
$11,387$9,262$2,125WWW LTOIOO =+=+=
4.15.2.4 ONSITE ECONOMIC COSTS2
Onsite economic costs are considered to include costs associated with cleanup/decontamination, replacement power, and repair/refurbishment. Each of these factors isdiscussed in the following sections.
4.15.2.4.1 CLEANUP/DECONTAMINATION
The total cost of cleanup/decontamination of a power reactor facility subsequent to a severeaccident is estimated by the NRC, in NUREG/BR-0184, at $1.5x10⁹; this same value isadopted for these analyses. Considering a 10-year cleanup period, the present value of thiscost is:
−
=
−
re1
mCPV
rmCD
CD
where:
2 Calculated values presented in this and subsequent subsections were calculated using a spreadsheet and may differ slightly from values
calculated from the numbers provided; this is due to rounding performed on the numbers presented in this document.
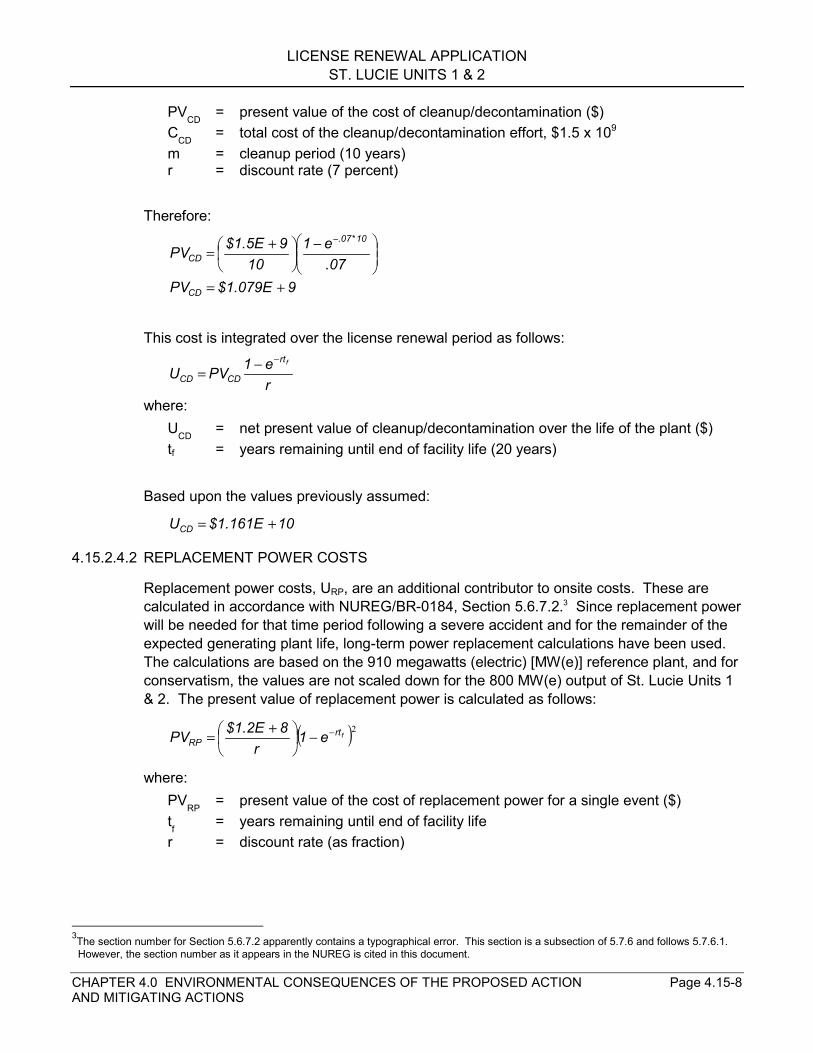
LICENSE RENEWAL APPLICATIONST. LUCIE UNITS 1 & 2
CHAPTER 4.0 ENVIRONMENTAL CONSEQUENCES OF THE PROPOSED ACTION Page 4.15-8AND MITIGATING ACTIONS
PVCD = present value of the cost of cleanup/decontamination ($)CCD = total cost of the cleanup/decontamination effort, $1.5 x 10⁹
m = cleanup period (10 years)r = discount rate (7 percent)
Therefore:
−
+=
−
.07e1
109$1.5EPV
10*.07
CD
9$1.079E PVCD +=
This cost is integrated over the license renewal period as follows:
re1PVU
frt
CDCD
−−=
where:UCD = net present value of cleanup/decontamination over the life of the plant ($)tf = years remaining until end of facility life (20 years)
Based upon the values previously assumed:
10$1.161E UCD +=
4.15.2.4.2 REPLACEMENT POWER COSTS
Replacement power costs, URP, are an additional contributor to onsite costs. These arecalculated in accordance with NUREG/BR-0184, Section 5.6.7.2.3 Since replacement powerwill be needed for that time period following a severe accident and for the remainder of theexpected generating plant life, long-term power replacement calculations have been used.The calculations are based on the 910 megawatts (electric) [MW(e)] reference plant, and forconservatism, the values are not scaled down for the 800 MW(e) output of St. Lucie Units 1& 2. The present value of replacement power is calculated as follows:
( )2frtRP e1
r8$1.2EPV −−
+=
where:PVRP = present value of the cost of replacement power for a single event ($)tf = years remaining until end of facility lifer = discount rate (as fraction)
3The section number for Section 5.6.7.2 apparently contains a typographical error. This section is a subsection of 5.7.6 and follows 5.7.6.1.
However, the section number as it appears in the NUREG is cited in this document.
LICENSE RENEWAL APPLICATIONST. LUCIE UNITS 1 & 2
CHAPTER 4.0 ENVIRONMENTAL CONSEQUENCES OF THE PROPOSED ACTION Page 4.15-9AND MITIGATING ACTIONS
The $1.2 × 10⁸ value has no intrinsic meaning but is a substitute for a string of non-constantreplacement power costs that occur over the lifetime of a “generic” reactor after an event(Ref. 4.15-1). This equation was developed per NUREG/BR-0184 for discount ratesbetween 5 percent and 10 percent only.
For discount rates between 1 percent and 5 percent, NUREG/BR-0184 indicates that alinear interpolation is appropriate between present values of $1.2 × 10⁹ at 5 percent and$1.6 × 10⁹ at 1 percent (Ref. 4.15-1). So for discount rates in this range, the followingequation was used to perform this linear interpolation:
( ) ( ) ( )[ ][ ] [ ]
+++= 1%- r *
1%-5%9$1.2E- 9$1.6E- 9$1.6E PV sRP
where:rs = discount rate (small), between 1 percent and 5 percent
To account for the entire lifetime of the facility, URP was then calculated from PVRP, asfollows:
( )2rtRPRP
fe1r
PVU −−=
where:URP = present value of the cost of replacement power over the life of the facility ($)
As noted for PVRP, the equation for URP is only applicable in the range of discount rates from5 percent to 10 percent. NUREG/BR-0184 states that for lower discount rates, linearinterpolations for URP are recommended between $1.9 × 10¹⁰ at 1 percent and $1.2 × 10¹⁰ at5 percent. Therefore, for the sensitivity analysis, which considers a 3 percent discount rate,the following equation was used to perform this linear interpolation:
( ) ( ) ( )[ ][ ] [ ]
+++= 1%- r *
1%-5%10$1.2E- 10$1.9E- 10$1.9E U sRP
where:rs = Discount rate (small), between 1 percent and 5 percent
Based upon the values previously assumed,9$7.89E URP +=
4.15.2.4.3 REPAIR AND REFURBISHMENT
FPL has no plans for major repair/refurbishment following a severe accident; therefore,there is no contribution to onsite economic costs from this source.
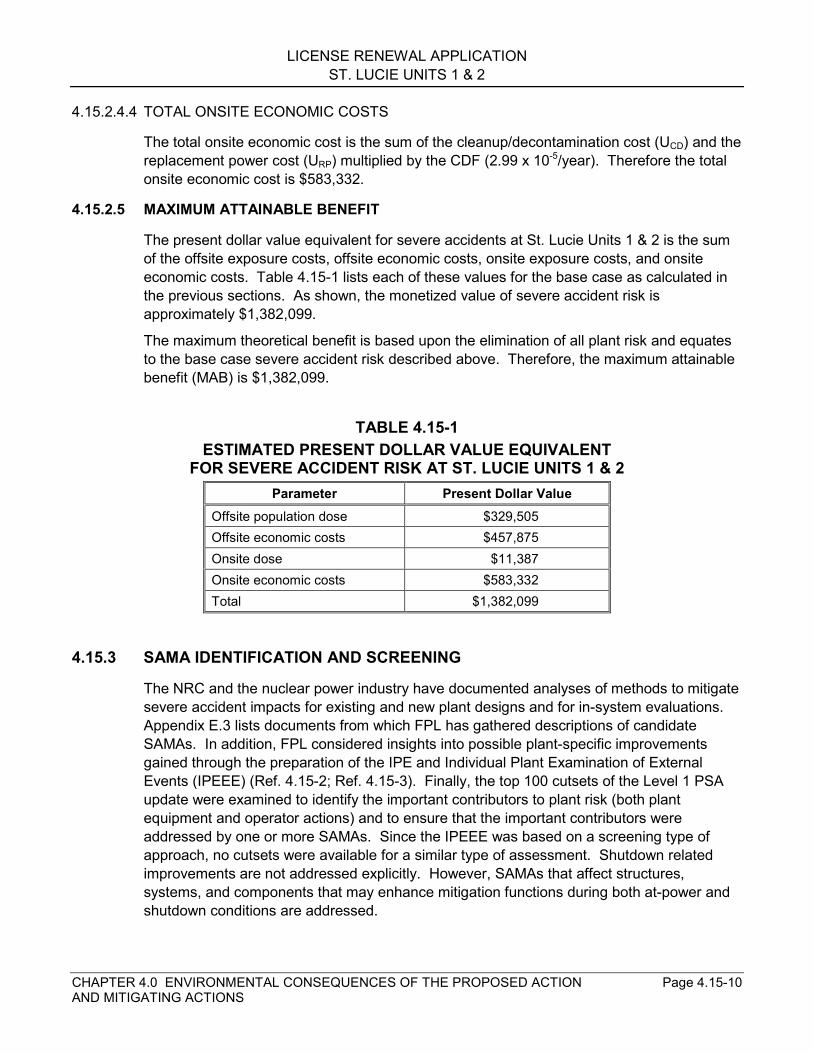
LICENSE RENEWAL APPLICATIONST. LUCIE UNITS 1 & 2
CHAPTER 4.0 ENVIRONMENTAL CONSEQUENCES OF THE PROPOSED ACTION Page 4.15-10AND MITIGATING ACTIONS
4.15.2.4.4 TOTAL ONSITE ECONOMIC COSTS
The total onsite economic cost is the sum of the cleanup/decontamination cost (UCD) and thereplacement power cost (URP) multiplied by the CDF (2.99 x 10⁻⁵/year). Therefore the totalonsite economic cost is $583,332.
4.15.2.5 MAXIMUM ATTAINABLE BENEFIT
The present dollar value equivalent for severe accidents at St. Lucie Units 1 & 2 is the sumof the offsite exposure costs, offsite economic costs, onsite exposure costs, and onsiteeconomic costs. Table 4.15-1 lists each of these values for the base case as calculated inthe previous sections. As shown, the monetized value of severe accident risk isapproximately $1,382,099.
The maximum theoretical benefit is based upon the elimination of all plant risk and equatesto the base case severe accident risk described above. Therefore, the maximum attainablebenefit (MAB) is $1,382,099.
TABLE 4.15-1ESTIMATED PRESENT DOLLAR VALUE EQUIVALENT
FOR SEVERE ACCIDENT RISK AT ST. LUCIE UNITS 1 & 2Parameter Present Dollar Value
Offsite population dose $329,505Offsite economic costs $457,875Onsite dose $11,387Onsite economic costs $583,332Total $1,382,099
4.15.3 SAMA IDENTIFICATION AND SCREENING
The NRC and the nuclear power industry have documented analyses of methods to mitigatesevere accident impacts for existing and new plant designs and for in-system evaluations.Appendix E.3 lists documents from which FPL has gathered descriptions of candidateSAMAs. In addition, FPL considered insights into possible plant-specific improvementsgained through the preparation of the IPE and Individual Plant Examination of ExternalEvents (IPEEE) (Ref. 4.15-2; Ref. 4.15-3). Finally, the top 100 cutsets of the Level 1 PSAupdate were examined to identify the important contributors to plant risk (both plantequipment and operator actions) and to ensure that the important contributors wereaddressed by one or more SAMAs. Since the IPEEE was based on a screening type ofapproach, no cutsets were available for a similar type of assessment. Shutdown relatedimprovements are not addressed explicitly. However, SAMAs that affect structures,systems, and components that may enhance mitigation functions during both at-power andshutdown conditions are addressed.
LICENSE RENEWAL APPLICATIONST. LUCIE UNITS 1 & 2
CHAPTER 4.0 ENVIRONMENTAL CONSEQUENCES OF THE PROPOSED ACTION Page 4.15-11AND MITIGATING ACTIONS
Table E.3-1, in Appendix E.3, lists 169 candidate SAMAs that FPL identified for analysis andidentifies the sources of the information. The first step in the analysis is to eliminate non-viable SAMAs through preliminary screening.
4.15.3.1 PRELIMINARY SCREENING
The purpose of the preliminary SAMA screening is to eliminate from further considerationenhancements that are obviously not viable for implementation at St. Lucie Units 1 & 2.Screening criteria include:
• Not applicable to the plant, and• Met the intent or already implemented at the plant.
Table E.3-1 of Appendix E.3 provides a brief discussion of each candidate SAMA and itsdisposition, whether eliminated from further consideration as not applicable or as alreadyimplemented, or designated for further analysis. Based on this preliminary screening, 119candidate SAMAs were eliminated, and 50 of the original SAMAs were designated forfurther analysis.
4.15.3.2 FINAL SCREENING/COST-BENEFIT ANALYSIS
FPL estimates the costs of implementing each SAMA through the application of engineeringjudgment, estimates from other licensee submittals, and site-specific cost estimates (ifnecessary). The evaluation is on a single-unit implementation basis. The cost estimates donot include the cost of replacement power during extended outages required to implementthe modifications, nor do they include contingency costs associated with unforeseenimplementation obstacles. Estimates based on modifications that were implemented orestimated in the past are presented in terms of dollar values at the time of implementation(or estimation) and are not adjusted to present-day dollars.
In the performance of the cost-benefit analyses two basic values were assumed, theminimum cost of a procedure change and the minimum cost of a hardware change. Theminimum cost associated with implementation of a procedure change was assumed to be$30,000, and the minimum cost associated with development and implementation of anintegrated hardware modification package (including post-implementation costs, e.g.,training) was assumed to be $70,000.
The benefits resulting from the bounding estimates presented in the benefit analysis are, ingeneral, rather low. In most cases the benefits are so low that it is obvious that theimplementation costs would exceed the benefit, even without a detailed cost estimate. Inmany cases, plant staff judgment is applied in assessing whether the benefit approaches theexpected implementation costs. A detailed cost estimate is only applied to those situationsin which the benefit is significant and application of judgment might be questioned.
Screening based on level of benefit achieved is carried out in two steps. The first stepinvolves using the maximum benefit that could possibly be provided by any one SAMA orcombination of SAMAs. As shown in Table 4.15-1, the monetized value of this risk isapproximately $1,382,099. Therefore, any SAMA having an estimated single-unit cost ofimplementation exceeding this value is not considered cost beneficial and is screened fromfurther consideration.
LICENSE RENEWAL APPLICATIONST. LUCIE UNITS 1 & 2
CHAPTER 4.0 ENVIRONMENTAL CONSEQUENCES OF THE PROPOSED ACTION Page 4.15-12AND MITIGATING ACTIONS
The next step involves performing a benefits analysis on the remaining SAMAs. Section4.15.2 discusses maximum benefit calculations in more detail. The methodology fordetermining if a SAMA is beneficial consists of determining whether the benefit provided byimplementation of the SAMA exceeds the expected cost of implementation. Where thebenefits of the SAMAs are small, engineering judgment is used as the basis for costs. Thebenefit is defined as the sum of the reductions in the dollar equivalents for each severeaccident impact (offsite exposure, offsite economic costs, occupational exposure, and onsiteeconomic costs) resulting from the implementation of a SAMA. In general, if the expectedcost exceeds twice the calculated benefit, the SAMA is considered not to be cost beneficial.Comparison of the expected cost with twice the benefit calculated from consideration of onlyinternal events is undertaken to recognize and account for the potential contribution to riskfrom external events.
The result of implementation of each SAMA would be a change in the plant’s severeaccident risk (i.e., a change in frequency or consequence of severe accidents). Themethodology for calculating the magnitude of these changes is straightforward. First, thesevere accident risk after implementation of each SAMA is calculated using the samemethodology as for the base case. A spreadsheet is then used to combine the results of theLevel 2 model with the Level 3 model to calculate these post-SAMA risks. The results of thebenefit analysis for each of the SAMAs are presented in Section 4.15.4.
Each SAMA evaluation is performed in a bounding fashion. Bounding evaluations areperformed to address the generic nature of the initial SAMA concepts. Such boundingcalculations overestimate the benefit and thus are conservative calculations. For example,one SAMA deals with a digital feedwater upgrade (SAMA #101); the bounding calculation toestimate the benefit of this improvement assumes total elimination of feedwater trips andfailures not involving steam generator check valves or feed line breaks. Such a calculationobviously overestimates the benefit. However, if the inflated benefit indicates that the SAMAis not cost-beneficial, then the purpose of the analysis is satisfied.
Two types of evaluations are used in determining the benefit of the SAMAs, modelrequantification and importance measure analysis. Some of the SAMAs involve modificationof system models; these SAMAs are evaluated by making relatively simple boundingchanges to one or more system models and requantifying the full model. This results in anew set of plant damage-state frequencies that are analyzed to determine the impact onpublic risk. An example of such an evaluation is the estimation of the benefit of lessdependence on Reactor Auxiliaries Building (RAB) ventilation. This SAMA is evaluated in abounding manner by modifying the fault trees such that the Emergency Core CoolingSystem (ECCS) pumps are not dependent on any RAB ventilation; this results in an upperlimit on the improvement that is possible through more reliable ventilation.
Other SAMAs are more quickly evaluated simply by examining (through importancemeasures) the contribution of specific components or human actions to the CDF. Forexample, the SAMA associated with replacing ECCS pump motors with air-cooled motors(SAMA #13); this failure was found to contribute essentially nothing (approximately 0percent) to CDF. Thus, the benefit from replacing the ECCS pump motors with air-cooledmotors is estimated to be negligibly small. For the cases in which the impact on risk isestimated through use of component or human action contribution to CDF, it is assumed
LICENSE RENEWAL APPLICATIONST. LUCIE UNITS 1 & 2
CHAPTER 4.0 ENVIRONMENTAL CONSEQUENCES OF THE PROPOSED ACTION Page 4.15-13AND MITIGATING ACTIONS
that the benefit is approximately proportional to the reduction in CDF. Appendix E.4describes the modeling approaches used to evaluate the SAMAs.
As described above for the base case, values for avoided public and occupational healthrisks (benefits) are converted to a monetary equivalent (dollars) via application of the NRC’sconversion factor of $2,000 per person-rem (Ref. 4.15-1) and discounted to present value.Values for avoided offsite economic costs (benefits) are also discounted to present value.The formula for calculating net value for each SAMA is as follows:
Net value = ($APE + $AOC + $AOE + $AOSC) – COE
where:$APE = monetized value of averted public exposure ($)$AOC = monetized value of averted offsite costs ($)$AOE = monetized value of averted occupational exposure ($)$AOSC = monetized value of averted onsite costs ($)COE = cost of enhancement ($)
If the net value of a SAMA is negative, the cost of the enhancement is greater than thebenefit and the SAMA is not cost beneficial. The expected cost of each SAMA (COE) wasdetermined by either utilizing applicable cost estimates published in NRC submittals fromother licensees or by expert judgment by knowledgeable plant staff. If these previouslicensee submittals contain costs for a specific mitigation alternative, the description isreviewed to determine if the cost estimate can reasonably be applied at St. Lucie Units 1& 2, based on the plant design and licensing bases and knowledge of implementing plantmodifications. If the previous licensee submittals do not contain cost estimates or if thesecost estimates cannot be applied, an expert panel reviews the benefit to determine whetherthe SAMA can be implemented for a cost equivalent to twice the benefit.
4.15.4 RESULTS
FPL analyzed 169 conceptual alternatives for mitigating severe accident impacts.Preliminary screening eliminated 119 SAMAs from further consideration, based oninapplicability to the plant design or features already incorporated into the current designand/or procedures and programs. During the final disposition, 50 remaining SAMAcandidates were eliminated because the cost is expected to exceed twice their benefit orbecause of disproportionately high implementation costs (see Table 4.15-2).
In NUREG/BR-0184, the NRC recommends using a 7 percent real (i.e., inflation-adjusted)discount rate for value-impact analyses and notes that a 3 percent discount rate should beused for sensitivity analyses to indicate the sensitivity of the results to the choice of discountrate. This reduced discount rate takes into account the additional uncertainties (i.e., interestrate fluctuations) in predicting costs for activities that would take place several years in thefuture. Analyses presented in Section 4.15.3 use the 7 percent discount rate in calculatingpotential SAMA benefits. FPL performed a sensitivity analysis by substituting the lowerdiscount rate and recalculating the benefits of the candidate SAMAs. Reducing the discountrate increases the benefits of potential SAMAs but does not change any decision concerningwhether they are cost beneficial. Table 4.15-2 presents the results of the cost-benefitanalysis for each of the SAMAs evaluated for St. Lucie Units 1 & 2.

LICENSE RENEWAL APPLICATIONST. LUCIE UNITS 1 & 2
CHAPTER 4.0 ENVIRONMENTAL CONSEQUENCES OF THE PROPOSED ACTION Page 4.15-14AND MITIGATING ACTIONS
In summary, based on the results of this SAMA analysis, FPL found no SAMAs that werecost-beneficial associated with license renewal.
LIC
ENSE
REN
EWAL
APP
LIC
ATIO
NST
. LU
CIE
UN
ITS
1 &
2
CH
APTE
R 4
.0 E
NVI
RO
NM
ENTA
L C
ON
SEQ
UEN
CES
OF
THE
PRO
POSE
D A
CTI
ON
Page
4.1
5-15
AND
MIT
IGAT
ING
AC
TIO
NS
TAB
LE 4
.15-
2D
ISPO
SITI
ON
OF
SAM
AS R
ELAT
ED T
O S
T. L
UC
IE U
NIT
S 1
& 2
SAM
AN
umbe
rPo
tent
ial
Impr
ovem
ent
Ben
efit
Eval
uatio
naC
ost o
fIm
plem
enta
tion
Scre
enin
g R
esul
ts a
nd D
iscu
ssio
n8
Elim
inat
e R
CP
ther
mal
bar
rier
depe
nden
ce o
nC
CW
, suc
h th
atlo
ss o
f CC
Wdo
es n
ot re
sult
dire
ctly
in c
ore
dam
age.
Cas
e 4,
elim
inat
ing
U2
seal
LOC
As fo
r cau
ses
othe
r tha
nop
erat
or fa
ilure
s ha
s a
bene
fitof
$50
K fo
r U2,
less
for U
1.
Cos
t of m
odify
ing
4se
als,
plu
s sp
ares
, per
Uni
t and
revi
sing
mul
tiple
proc
edur
es w
ould
be
>>2x
bene
fit.
Neg
ativ
e ne
t val
ue.
Cur
rent
U1
and
U2
seal
s ar
e no
t des
igne
d fo
r sea
lin
ject
ion.
Im
prov
ed s
eals
hav
e be
en in
stal
led
at S
t.Lu
cie.
The
new
RC
P se
al d
esig
n is
suc
h th
atfa
ilure
is v
ery
unlik
ely
if R
CPs
are
sto
pped
and
blee
doff
isol
ated
with
in o
ne h
our o
f los
s of
CC
W.
Proc
edur
es re
quire
this
and
ope
rato
rs a
re tr
aine
d to
do s
o (s
ee S
AMAs
2 &
3 in
App
endi
x E.
4).
Ifop
erat
ors
do n
ot s
top
RC
Ps a
nd is
olat
e bl
eedo
ff, it
wou
ld n
ot b
e pr
uden
t to
assu
me
they
wou
ld in
itiat
ese
al in
ject
ion,
thus
incr
emen
tal i
mpr
ovem
ents
rela
ted
to s
eal i
njec
tion
and
impr
oved
cha
rgin
gpu
mps
wou
ld b
e lo
w o
r non
-exi
sten
t whi
le c
osts
of
new
coo
ling
syst
em w
ould
be
high
.10
Cre
ate
anin
depe
nden
tR
CP
seal
inje
ctio
n sy
stem
,w
ith d
edic
ated
dies
el.
Cas
e 4,
elim
inat
ing
U2
seal
LOC
As fo
r cau
ses
othe
r tha
nop
erat
or fa
ilure
s ha
s a
bene
fitof
$50
K.
>>2x
ben
efit.
Neg
ativ
e ne
t val
ue.
This
SAM
A w
ould
add
redu
ndan
cy to
RC
P se
alco
olin
g al
tern
ativ
es, r
educ
ing
CD
F fro
m lo
ss o
fC
CW
or s
ervi
ce w
ater
, or f
rom
SBO
. Si
tepr
oced
ure
[1(2
)-EO
P-02
] is
spec
ific
abou
t sto
ppin
gR
CPs
on
loss
of C
CW
. Th
e co
st o
f mod
ifyin
g se
als
and
spar
es, i
nsta
lling
inde
pend
ent s
yste
m w
ithdi
esel
, rev
isin
g m
ultip
le p
roce
dure
s, a
nd tr
aini
ngop
erat
ors
wou
ld fa
r exc
eed
the
bene
fits.
LIC
ENSE
REN
EWAL
APP
LIC
ATIO
NST
. LU
CIE
UN
ITS
1 &
2
CH
APTE
R 4
.0 E
NVI
RO
NM
ENTA
L C
ON
SEQ
UEN
CES
OF
THE
PRO
POSE
D A
CTI
ON
Page
4.1
5-16
AND
MIT
IGAT
ING
AC
TIO
NS
TAB
LE 4
.15-
2 (c
ontin
ued)
DIS
POSI
TIO
N O
F SA
MAS
REL
ATED
TO
ST.
LU
CIE
UN
ITS
1 &
2SA
MA
Num
ber
Pote
ntia
lIm
prov
emen
tB
enef
it Ev
alua
tiona
Cos
t of
Impl
emen
tatio
nSc
reen
ing
Res
ults
and
Dis
cuss
ion
11C
reat
e an
inde
pend
ent
RC
P se
alin
ject
ion
syst
em,
with
out
dedi
cate
d di
esel
.
Cas
e 4,
elim
inat
ing
U2
seal
LOC
As fo
r cau
ses
othe
r tha
nop
erat
or fa
ilure
s ha
s a
bene
fitof
$50
K.
>>2x
ben
efit.
Neg
ativ
e ne
t val
ue.
This
SAM
A w
ould
add
redu
ndan
cy to
RC
P se
alco
olin
g al
tern
ativ
es, r
educ
ing
CD
F fro
m lo
ss o
fC
CW
or s
ervi
ce w
ater
, or f
rom
SBO
. Th
e pr
esen
tU
1 an
d U
2 se
als
do n
ot h
ave
prov
isio
ns fo
r sea
lin
ject
ion.
Site
pro
cedu
re [1
(2)-E
OP-
02] i
s sp
ecifi
cab
out s
topp
ing
RC
Ps o
n lo
ss o
f CC
W.
The
cost
of
mod
ifyin
g se
als
and
spar
es, i
nsta
lling
inde
pend
ent
syst
em w
ith d
iese
l, re
visi
ng m
ultip
le p
roce
dure
s,an
d tra
inin
g op
erat
ors
wou
ld fa
r exc
eed
the
bene
fits.
12U
se e
xist
ing
hydr
o te
st p
ump
for R
CP
seal
inje
ctio
n.
Cas
e 4,
elim
inat
ing
U2
seal
LOC
As fo
r cau
ses
othe
r tha
nop
erat
or fa
ilure
s ha
s a
bene
fitof
$50
K.
>>2x
ben
efit.
Neg
ativ
e ne
t val
ue.
This
SAM
A w
ould
pro
vide
an
inde
pend
ent s
eal
inje
ctio
n so
urce
, with
out c
ost o
f a n
ew s
yste
m.
The
pres
ent U
1 an
d U
2 se
als
do n
ot h
ave
prov
isio
ns fo
rse
al in
ject
ion.
The
cos
t of m
odify
ing
seal
s an
dsp
ares
, rev
isin
g m
ultip
le p
roce
dure
s, a
nd tr
aini
ngop
erat
ors
wou
ld fa
r exc
eed
the
bene
fits.
13R
epla
ce E
CC
Spu
mp
mot
ors
with
air-
cool
edm
otor
s.
The
max
imum
ben
efit
for
elim
inat
ing
all H
PSI f
ailu
res
is$2
79K.
Sin
ce o
nly
a sm
all
fract
ion
is a
ctua
lly C
CW
rela
ted,
this
pro
vide
s m
argi
n to
also
bou
nd th
e lo
w-p
ress
ure
safe
ty in
ject
ion
and
cont
ainm
ent s
pray
pum
ps.
>>2x
ben
efit.
Neg
ativ
e ne
t val
ue.
Man
y pr
oced
ures
rela
te to
the
thre
e af
fect
edsy
stem
s an
d th
e co
st o
f the
requ
ired
proc
edur
ere
visi
ons
wou
ld e
xcee
d th
e be
nefit
, with
out e
ven
cons
ider
ing
desi
gn c
hang
e an
d ha
rdw
are
repl
acem
ent c
osts
.
LIC
ENSE
REN
EWAL
APP
LIC
ATIO
NST
. LU
CIE
UN
ITS
1 &
2
CH
APTE
R 4
.0 E
NVI
RO
NM
ENTA
L C
ON
SEQ
UEN
CES
OF
THE
PRO
POSE
D A
CTI
ON
Page
4.1
5-17
AND
MIT
IGAT
ING
AC
TIO
NS
TAB
LE 4
.15-
2 (c
ontin
ued)
DIS
POSI
TIO
N O
F SA
MAS
REL
ATED
TO
ST.
LU
CIE
UN
ITS
1 &
2SA
MA
Num
ber
Pote
ntia
lIm
prov
emen
tB
enef
it Ev
alua
tiona
Cos
t of
Impl
emen
tatio
nSc
reen
ing
Res
ults
and
Dis
cuss
ion
16Pr
even
t cha
rgin
gpu
mp
flow
dive
rsio
n fro
mth
e re
lief v
alve
s.
Cas
e 4,
elim
inat
ing
U2
seal
LOC
As fo
r cau
ses
othe
r tha
nop
erat
or fa
ilure
s ha
s a
bene
fitof
$50
K.
>>2x
ben
efit.
Neg
ativ
e ne
t val
ue.
If re
lief v
alve
ope
ning
cau
ses
a flo
w d
iver
sion
larg
een
ough
to p
reve
nt R
CP
seal
inje
ctio
n, th
enm
odifi
catio
n ca
n re
duce
freq
uenc
y of
loss
of R
CP
seal
coo
ling.
How
ever
, the
pre
sent
U1
and
U2
seal
s do
not
hav
e pr
ovis
ions
for s
eal i
njec
tion.
The
cost
of m
odify
ing
seal
s an
d sp
ares
, mod
ifyin
g th
ech
argi
ng s
yste
m re
lief v
alve
s, re
visi
ng m
ultip
lepr
oced
ures
, and
trai
ning
ope
rato
rs w
ould
sign
ifica
ntly
exc
eed
the
bene
fits.
34In
stal
l a fi
ltere
dco
ntai
nmen
t ven
tto
rem
ove
deca
yhe
at.
NA
TVA
estim
ate
$20M
(Ref
. 4.1
5-4)
; exp
ecte
d to
wel
l exc
eed
MAB
($1.
38M
).
Neg
ativ
e ne
t val
ue.
This
SAM
A as
sum
es in
ject
ion
is a
vaila
ble
(non
-AT
WS
sequ
ence
s) a
nd it
wou
ld p
rovi
de a
ltern
ate
deca
y he
at re
mov
al w
ith th
e re
leas
ed fi
ssio
npr
oduc
ts b
eing
scr
ubbe
d.35
Inst
all a
nun
filte
red,
hard
ened
cont
ainm
ent
vent
.
NA
TVA
estim
ate
$20M
(Ref
. 4.1
5-4)
; exp
ecte
d to
wel
l exc
eed
MAB
($1.
38M
).
Neg
ativ
e ne
t val
ue.
This
SAM
A w
ould
pro
vide
an
alte
rnat
e de
cay
heat
rem
oval
met
hod
(non
-ATW
S), w
hich
is n
ot fi
ltere
d.To
har
den
the
St. L
ucie
Uni
ts 1
& 2
pur
ge s
yste
mw
ould
be
quite
cos
tly a
nd im
pact
s of
the
mod
ifica
tion
on th
e en
viro
nmen
t wou
ld b
e hi
gh,
redu
cing
the
bene
fits.
38C
reat
e a
gian
tco
ncre
te c
ruci
ble
with
hea
tre
mov
al p
oten
tial
unde
r the
base
mat
toco
ntai
n m
olte
nde
bris
.
NA
CE
SYS
80 e
stim
ate
$108
M (R
ef. 4
.15-
5);
expe
cted
to w
ell e
xcee
dM
AB ($
1.38
M).
Neg
ativ
e ne
t val
ue.
A m
olte
n co
re e
scap
ing
from
the
vess
el w
ould
be
cont
aine
d w
ithin
the
cruc
ible
. Th
e w
ater
-coo
ling
mec
hani
sm w
ould
coo
l the
mol
ten
core
, pre
vent
ing
a m
elt t
hrou
gh.
LIC
ENSE
REN
EWAL
APP
LIC
ATIO
NST
. LU
CIE
UN
ITS
1 &
2
CH
APTE
R 4
.0 E
NVI
RO
NM
ENTA
L C
ON
SEQ
UEN
CES
OF
THE
PRO
POSE
D A
CTI
ON
Page
4.1
5-18
AND
MIT
IGAT
ING
AC
TIO
NS
TAB
LE 4
.15-
2 (c
ontin
ued)
DIS
POSI
TIO
N O
F SA
MAS
REL
ATED
TO
ST.
LU
CIE
UN
ITS
1 &
2SA
MA
Num
ber
Pote
ntia
lIm
prov
emen
tB
enef
it Ev
alua
tiona
Cos
t of
Impl
emen
tatio
nSc
reen
ing
Res
ults
and
Dis
cuss
ion
39C
reat
e a
wat
er-
cool
ed ru
bble
bed
on th
epe
dest
al.
NA
CE
SYS
80 e
stim
ate
$18M
(Ref
. 4.1
5-5)
;ex
pect
ed to
wel
l exc
eed
MAB
($1.
38M
).
Neg
ativ
e ne
t val
ue.
This
rubb
le b
ed w
ould
con
tain
a m
olte
n co
redr
oppi
ng o
nto
the
pede
stal
, and
wou
ld a
llow
the
debr
is to
be
cool
ed.
The
wet
cav
ity d
esig
n al
som
eets
par
t of t
he in
tent
.46
Prov
ide
cont
ainm
ent
iner
ting
capa
bilit
y.
NA
TVA
estim
ate
$10.
9M(R
ef. 4
.15-
4); e
xpec
ted
tow
ell e
xcee
d M
AB($
1.38
M).
Neg
ativ
e ne
t val
ue.
This
SAM
A w
ould
pre
vent
com
bust
ion
of h
ydro
gen
and
carb
on m
onox
ide
gase
s. A
lso,
St.
Luci
e U
nits
1 &
2 ha
ve h
ydro
gen
reco
mbi
ners
that
mee
t par
t of
the
inte
nt.
48In
stal
l a p
assi
veC
onta
inm
ent
Spra
y S
yste
m.
Cas
e 1
calc
ulat
ed $
200K
(U1)
and
$112
K (U
2), i
f Con
tain
men
tSp
ray
Sys
tem
impa
ct o
n Le
vel
2/3
resu
lts w
as e
limin
ated
.
TVA
estim
ated
$20
M(R
ef. 4
.15-
4).
Neg
ativ
e ne
t val
ue.
Con
tain
men
t spr
ay fu
nctio
ns a
t a v
ery
high
relia
bilit
y, a
nd w
ithou
t sup
port
syst
ems.
Fun
ctio
n to
limit
post
-acc
iden
t pre
ssur
e in
con
tain
men
t is
also
supp
orte
d/pr
ovid
ed b
y co
ntai
nmen
t fan
coo
lers
,re
duci
ng b
enef
its.
50In
crea
seco
ntai
nmen
tde
sign
pre
ssur
e.
NA
>>M
AB ($
1.38
M).
Neg
ativ
e ne
t val
ue.
This
SAM
A w
ould
redu
ce c
hanc
e of
con
tain
men
tov
erpr
essu
re.
53C
reat
e an
othe
rbu
ildin
g,m
aint
aine
d at
ava
cuum
, to
beco
nnec
ted
to th
eco
ntai
nmen
t.
NA
CE
SYS
80 e
stim
ate
of>$
10M
(Ref
. 4.1
5-5)
far
exce
eds
MAB
($1.
38M
).
Neg
ativ
e ne
t val
ue.
In a
n ac
cide
nt, c
onne
ctin
g th
e ne
w b
uild
ing
to th
eco
ntai
nmen
t wou
ld d
epre
ssur
ize
the
cont
ainm
ent
and
redu
ce a
ny fi
ssio
n pr
oduc
t rel
ease
.
59U
se fu
el c
ells
inst
ead
of le
ad-
acid
bat
terie
s.
Elim
inat
ion
of b
atte
ry fa
ilure
szz
bat1
a[b]
dep
and
R#d
c-ab
= F
give
CD
F re
duct
ion
of 1
0.6%
,gi
ving
est
imat
ed b
enef
it of
$147
K.
Cos
t of r
epla
cing
one
batte
ry in
kin
d is
estim
ated
to b
e $1
20K.
Neg
ativ
e ne
t val
ue.
This
SAM
A w
ould
ext
end
DC
pow
er a
vaila
bilit
y in
aSB
O.
Rep
laci
ng b
oth
train
s w
ith n
ew te
chno
logy
requ
ires
exte
nsiv
e en
gine
erin
g an
d co
nstru
ctio
n;th
eref
ore
the
cost
to re
plac
e al
l bat
terie
s w
ould
far
exce
ed th
e be
nefit
.
LIC
ENSE
REN
EWAL
APP
LIC
ATIO
NST
. LU
CIE
UN
ITS
1 &
2
CH
APTE
R 4
.0 E
NVI
RO
NM
ENTA
L C
ON
SEQ
UEN
CES
OF
THE
PRO
POSE
D A
CTI
ON
Page
4.1
5-19
AND
MIT
IGAT
ING
AC
TIO
NS
TAB
LE 4
.15-
2 (c
ontin
ued)
DIS
POSI
TIO
N O
F SA
MAS
REL
ATED
TO
ST.
LU
CIE
UN
ITS
1 &
2SA
MA
Num
ber
Pote
ntia
lIm
prov
emen
tB
enef
it Ev
alua
tiona
Cos
t of
Impl
emen
tatio
nSc
reen
ing
Res
ults
and
Dis
cuss
ion
71In
stal
l gas
turb
ine
gene
rato
rs.
The
CD
F co
ntrib
utio
n of
loss
of
grid
is 1
6.2%
giv
ing
anes
timat
ed b
enef
it of
$22
4K fo
rU
1.
CC
NPP
est
imat
e $1
0M(R
ef. 4
.15-
6); t
his
isex
pect
ed to
wel
l exc
eed
MAB
($1.
38M
).
Neg
ativ
e ne
t val
ue.
This
SAM
A w
ould
impr
ove
onsi
te A
C p
ower
relia
bilit
y.
75Pr
ovid
e a
conn
ectio
n to
alte
rnat
e of
fsite
pow
er s
ourc
e.
The
CD
F co
ntrib
utio
n of
loss
of
grid
is 1
6.2%
, giv
ing
anes
timat
ed b
enef
it of
$22
4K fo
rU
1.
In 1
994,
at B
GE,
a 5
00kV
line
was
inst
alle
d at
aco
st o
f $1M
/mile
(Ref
. 4.1
5-6)
; thi
s is
expe
cted
to w
ell e
xcee
dM
AB ($
1.38
M).
Neg
ativ
e ne
t val
ue.
This
SAM
A w
ould
incr
ease
offs
ite p
ower
redu
ndan
cy.
Giv
en th
e ge
ogra
phy
and
dist
ance
(mile
s) re
quire
d, th
is w
ould
far e
xcee
d th
e M
AB.
76Im
plem
ent
unde
rgro
und
offs
ite p
ower
lines
.
The
CD
F co
ntrib
utio
n of
loss
of
grid
is 1
6.2%
, giv
ing
anes
timat
ed b
enef
it of
$22
4K fo
rU
1.
>>M
AB ($
1.38
M).
Neg
ativ
e ne
t val
ue.
This
SAM
A co
uld
impr
ove
offs
ite p
ower
relia
bilit
y,pa
rticu
larly
dur
ing
seve
re w
eath
er.
How
ever
, thi
sw
ould
requ
ire s
ever
al m
iles
of b
urie
d ca
ble,
giv
enth
at th
e se
vere
wea
ther
to w
hich
the
plan
t is
susc
eptib
le (p
rimar
ily h
urric
anes
) typ
ical
ly a
ffect
s a
broa
d ar
ea.
Also
, FPL
grid
sou
rces
are
not
supp
lied
by b
urie
d ca
ble.
80Im
prov
e SG
TRco
ping
abi
litie
s.C
ase
NO
SGTR
cal
cula
tes
bene
fit fo
r elim
inat
ing
U1
SGTR
s as
<$1
11K
(U2
muc
hle
ss).
CC
NPP
est
imat
e $9
.5M
for s
crub
bing
rele
ases
(Ref
. 4.1
5-6)
; thi
s w
ell
exce
eds
MAB
($1.
38M
).
Neg
ativ
e ne
t val
ue.
This
SAM
A w
ould
impr
ove
inst
rum
enta
tion
to d
etec
tSG
TR, o
r add
sys
tem
s to
scr
ub fi
ssio
n pr
oduc
tre
leas
es.
St. L
ucie
Uni
ts 1
& 2
pro
cedu
res
alre
ady
prov
ide
dire
ctio
n re
gard
ing
prop
er d
iagn
osis
tove
rify
(and
isol
ate)
SG
TR.
Ther
efor
e, in
tent
is m
etfo
r det
ectio
n, a
nd th
e “fi
ssio
n pr
oduc
t scr
ubbe
r”as
pect
is n
ot c
ost b
enef
icia
l.
LIC
ENSE
REN
EWAL
APP
LIC
ATIO
NST
. LU
CIE
UN
ITS
1 &
2
CH
APTE
R 4
.0 E
NVI
RO
NM
ENTA
L C
ON
SEQ
UEN
CES
OF
THE
PRO
POSE
D A
CTI
ON
Page
4.1
5-20
AND
MIT
IGAT
ING
AC
TIO
NS
TAB
LE 4
.15-
2 (c
ontin
ued)
DIS
POSI
TIO
N O
F SA
MAS
REL
ATED
TO
ST.
LU
CIE
UN
ITS
1 &
2SA
MA
Num
ber
Pote
ntia
lIm
prov
emen
tB
enef
it Ev
alua
tiona
Cos
t of
Impl
emen
tatio
nSc
reen
ing
Res
ults
and
Dis
cuss
ion
81Ad
d ot
her S
GTR
copi
ng fe
atur
es.
Cas
e N
OSG
TR c
alcu
late
sbe
nefit
for e
limin
atin
g U
1SG
TRs
as <
$111
K (U
2 m
uch
less
).
>>2x
bene
fit.
Neg
ativ
e ne
t val
ue.
This
SAM
A co
uld
be c
onsi
dere
d th
ree
way
s: (
a) A
high
ly re
liabl
e (c
lose
d lo
op) S
G s
hell-
side
hea
tre
mov
al s
yste
m th
at re
lies
on n
atur
al c
ircul
atio
n an
dst
ored
wat
er s
ourc
es; (
b) a
sys
tem
that
retu
rns
the
disc
harg
e fro
m th
e SG
relie
f val
ve b
ack
to th
epr
imar
y co
ntai
nmen
t; (c
) an
incr
ease
d pr
essu
reca
pabi
lity
on th
e SG
she
ll si
de w
ith c
orre
spon
ding
incr
ease
s in
the
safe
ty v
alve
set
poin
ts.
How
ever
,C
CN
PP d
eter
min
ed th
at in
crea
sing
the
seco
ndar
y-si
de p
ress
ure
at a
n ex
istin
g pl
ant w
ould
not
be
feas
ible
. Ad
ditio
nally
, per
Sys
tem
80+
, rel
ief v
alve
retu
rn to
con
tain
men
t req
uire
s m
ajor
rede
sign
.82
Incr
ease
seco
ndar
y-si
depr
essu
reca
paci
ty s
uch
that
an
SGTR
wou
ld n
ot c
ause
the
relie
f val
ves
to li
ft.
Cas
e N
OSG
TR c
alcu
late
sbe
nefit
for e
limin
atin
g U
1SG
TRs
as <
$111
K (U
2 m
uch
less
).
>>2x
bene
fit.
Neg
ativ
e ne
t val
ue.
SGTR
seq
uenc
es w
ould
not
hav
e a
dire
ct re
leas
epa
thw
ay.
CC
NPP
det
erm
ined
that
incr
easi
ng th
ese
cond
ary-
side
pre
ssur
e at
an
exis
ting
plan
t wou
ldno
t be
feas
ible
.
83R
epla
ce S
Gs
with
new
des
ign.
Cas
e N
OSG
TR c
alcu
late
sbe
nefit
for e
limin
atin
g U
1SG
TRs
as <
$111
K (U
2 m
uch
less
).
Indu
stry
(and
U1)
cos
tes
timat
es a
ppro
ach
$100
M; w
hich
wel
lex
ceed
s M
AB ($
1.38
M).
Neg
ativ
e ne
t val
ue.
This
SAM
A w
ould
low
er th
e fre
quen
cy o
f SG
TRs.
U1
has
repl
aced
SG
s w
ith n
ew d
esig
n an
d U
2 ha
sha
d re
lativ
ely
few
pro
blem
s w
ith it
s SG
s.85
Esta
blis
h a
mai
nten
ance
prac
tice
that
insp
ects
100
% o
fth
e tu
bes
in a
nSG
.
Cas
e N
OSG
TR c
alcu
late
sbe
nefit
for e
limin
atin
g U
1SG
TRs
as <
$111
K (U
2 m
uch
less
).
Addi
tiona
l ins
pect
ion
cost
s of
$50
0K-$
750K
per i
nspe
ctio
n>>
2xbe
nefit
.
Neg
ativ
e ne
t val
ue.
This
SAM
A w
ould
redu
ce c
hanc
es o
f tub
e ru
ptur
e.U
nit 2
per
form
s 10
0% tu
be in
spec
tions
. U
nit 1
has
repl
aced
SG
s w
ith n
ew d
esig
n an
d in
spec
tions
do
not i
ndic
ate
any
need
for 1
00%
insp
ectio
ns.
Ifpr
oble
ms
are
foun
d, F
PL is
requ
ired
to e
xpan
d th
ein
spec
tion,
mee
ting
at le
ast p
art o
f the
inte
nt.
LIC
ENSE
REN
EWAL
APP
LIC
ATIO
NST
. LU
CIE
UN
ITS
1 &
2
CH
APTE
R 4
.0 E
NVI
RO
NM
ENTA
L C
ON
SEQ
UEN
CES
OF
THE
PRO
POSE
D A
CTI
ON
Page
4.1
5-21
AND
MIT
IGAT
ING
AC
TIO
NS
TAB
LE 4
.15-
2 (c
ontin
ued)
DIS
POSI
TIO
N O
F SA
MAS
REL
ATED
TO
ST.
LU
CIE
UN
ITS
1 &
2SA
MA
Num
ber
Pote
ntia
lIm
prov
emen
tB
enef
it Ev
alua
tiona
Cos
t of
Impl
emen
tatio
nSc
reen
ing
Res
ults
and
Dis
cuss
ion
87Lo
cate
RH
Rin
side
of
cont
ainm
ent.
NA
>>M
AB ($
1.38
M).
Neg
ativ
e ne
t val
ue.
This
SAM
A w
ould
pre
vent
ISLO
CA
occu
rrenc
es v
iath
e R
HR
pat
hway
. Fo
r an
exis
ting
plan
t suc
h as
St. L
ucie
Uni
ts 1
& 2
, rel
ocat
ing
the
RH
R in
side
the
cont
ainm
ent i
s no
t fea
sibl
e, a
s it
wou
ld re
quire
an
entir
ely
new
RH
R s
yste
m.
88In
stal
l sel
f-ac
tuat
ing
cont
ainm
ent
isol
atio
n va
lves
.
Alth
ough
ear
ly c
onta
inm
ent
failu
res
are
calc
ulat
ed a
t 1%
of
CD
F, if
10%
is a
ssum
ed th
eC
DF
impa
ct o
f 10%
giv
eses
timat
ed b
enef
its o
f $1
38K
(U1)
.
>>2x
bene
fit.
Neg
ativ
e ne
t val
ue.
This
SAM
A w
ould
redu
ce th
e fre
quen
cy o
f iso
latio
nfa
ilure
. St
. Luc
ie p
enet
ratio
ns th
at a
re re
quire
d to
clos
e fo
r acc
iden
ts h
ave
at le
ast o
ne fa
il cl
osed
valv
e ei
ther
on
loss
of a
ir or
ele
ctric
pow
er o
r are
chec
k va
lves
and
thus
mee
t the
inte
nt.
Also
, it m
ust
be n
oted
that
NR
C re
gula
tions
do
not a
llow
onl
ych
eck
valv
es fo
r iso
latio
n—th
ere
mus
t be
at le
ast
one
valv
e th
at is
not
a c
heck
val
ve (a
nd w
ithpo
sitiv
e po
sitio
n in
dica
tion)
.89
Inst
all a
dditi
onal
inst
rum
enta
tion
for I
SLO
CA
sequ
ence
s.
Cas
e N
OIS
LOC
A ca
lcul
ated
bene
fits
of $
251K
for U
1 an
d$4
87K
for U
2.
TVA
estim
ate
$2.3
M(R
ef. 4
.15-
4);
>>2x
bene
fit.
Neg
ativ
e ne
t val
ue.
This
SAM
A w
ould
dec
reas
e IS
LOC
A fre
quen
cy b
yin
stal
ling
pres
sure
or l
eak
mon
itorin
g in
stru
men
tsbe
twee
n th
e fir
st tw
o pr
essu
re is
olat
ion
valv
es o
nlo
w-p
ress
ure
inje
ctio
n lin
es, R
HR
suc
tion
lines
, and
high
-pre
ssur
e in
ject
ion
lines
.90
Incr
ease
frequ
ency
of
valv
e le
akte
stin
g.
Cas
e N
OIS
LOC
A ca
lcul
ated
bene
fits
of $
251K
for U
1 an
d$4
87K
for U
2.
>>2x
bene
fit.
Neg
ativ
e ne
t val
ue.
This
SAM
A w
ould
dec
reas
e IS
LOC
A fre
quen
cy.
Test
ing
at p
ower
wou
ld re
quire
inst
alla
tion
ofin
stru
men
ts to
allo
w p
rope
r and
saf
e te
stin
g. C
ost
of e
xtra
shu
t dow
ns fo
r tes
ting
wou
ld e
xcee
dbe
nefit
s in
a re
lativ
ely
shor
t tim
e.
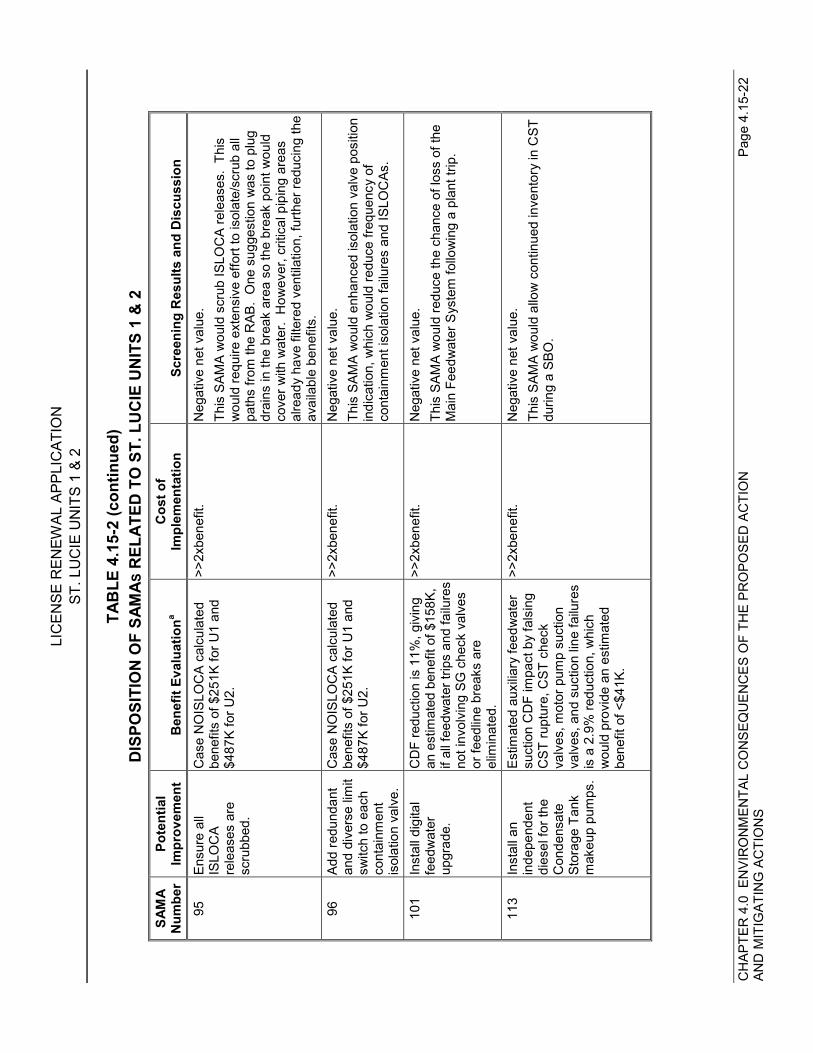
LIC
ENSE
REN
EWAL
APP
LIC
ATIO
NST
. LU
CIE
UN
ITS
1 &
2
CH
APTE
R 4
.0 E
NVI
RO
NM
ENTA
L C
ON
SEQ
UEN
CES
OF
THE
PRO
POSE
D A
CTI
ON
Page
4.1
5-22
AND
MIT
IGAT
ING
AC
TIO
NS
TAB
LE 4
.15-
2 (c
ontin
ued)
DIS
POSI
TIO
N O
F SA
MAS
REL
ATED
TO
ST.
LU
CIE
UN
ITS
1 &
2SA
MA
Num
ber
Pote
ntia
lIm
prov
emen
tB
enef
it Ev
alua
tiona
Cos
t of
Impl
emen
tatio
nSc
reen
ing
Res
ults
and
Dis
cuss
ion
95En
sure
all
ISLO
CA
rele
ases
are
scru
bbed
.
Cas
e N
OIS
LOC
A ca
lcul
ated
bene
fits
of $
251K
for U
1 an
d$4
87K
for U
2.
>>2x
bene
fit.
Neg
ativ
e ne
t val
ue.
This
SAM
A w
ould
scr
ub IS
LOC
A re
leas
es.
This
wou
ld re
quire
ext
ensi
ve e
ffort
to is
olat
e/sc
rub
all
path
s fro
m th
e R
AB.
One
sug
gest
ion
was
to p
lug
drai
ns in
the
brea
k ar
ea s
o th
e br
eak
poin
t wou
ldco
ver w
ith w
ater
. H
owev
er, c
ritic
al p
ipin
g ar
eas
alre
ady
have
filte
red
vent
ilatio
n, fu
rther
redu
cing
the
avai
labl
e be
nefit
s.96
Add
redu
ndan
tan
d di
vers
e lim
itsw
itch
to e
ach
cont
ainm
ent
isol
atio
n va
lve.
Cas
e N
OIS
LOC
A ca
lcul
ated
bene
fits
of $
251K
for U
1 an
d$4
87K
for U
2.
>>2x
bene
fit.
Neg
ativ
e ne
t val
ue.
This
SAM
A w
ould
enh
ance
d is
olat
ion
valv
e po
sitio
nin
dica
tion,
whi
ch w
ould
redu
ce fr
eque
ncy
ofco
ntai
nmen
t iso
latio
n fa
ilure
s an
d IS
LOC
As.
101
Inst
all d
igita
lfe
edw
ater
upgr
ade.
CD
F re
duct
ion
is 1
1%, g
ivin
gan
est
imat
ed b
enef
it of
$15
8K,
if al
l fee
dwat
er tr
ips
and
failu
res
not i
nvol
ving
SG
che
ck v
alve
sor
feed
line
brea
ks a
reel
imin
ated
.
>>2x
bene
fit.
Neg
ativ
e ne
t val
ue.
This
SAM
A w
ould
redu
ce th
e ch
ance
of l
oss
of th
eM
ain
Feed
wat
er S
yste
m fo
llow
ing
a pl
ant t
rip.
113
Inst
all a
nin
depe
nden
tdi
esel
for t
heC
onde
nsat
eSt
orag
e Ta
nkm
akeu
p pu
mps
.
Estim
ated
aux
iliary
feed
wat
ersu
ctio
n C
DF
impa
ct b
y fa
lsin
gC
ST ru
ptur
e, C
ST c
heck
valv
es, m
otor
pum
p su
ctio
nva
lves
, and
suc
tion
line
failu
res
is a
2.9
% re
duct
ion,
whi
chw
ould
pro
vide
an
estim
ated
bene
fit o
f <$4
1K.
>>2x
bene
fit.
Neg
ativ
e ne
t val
ue.
This
SAM
A w
ould
allo
w c
ontin
ued
inve
ntor
y in
CST
durin
g a
SBO
.
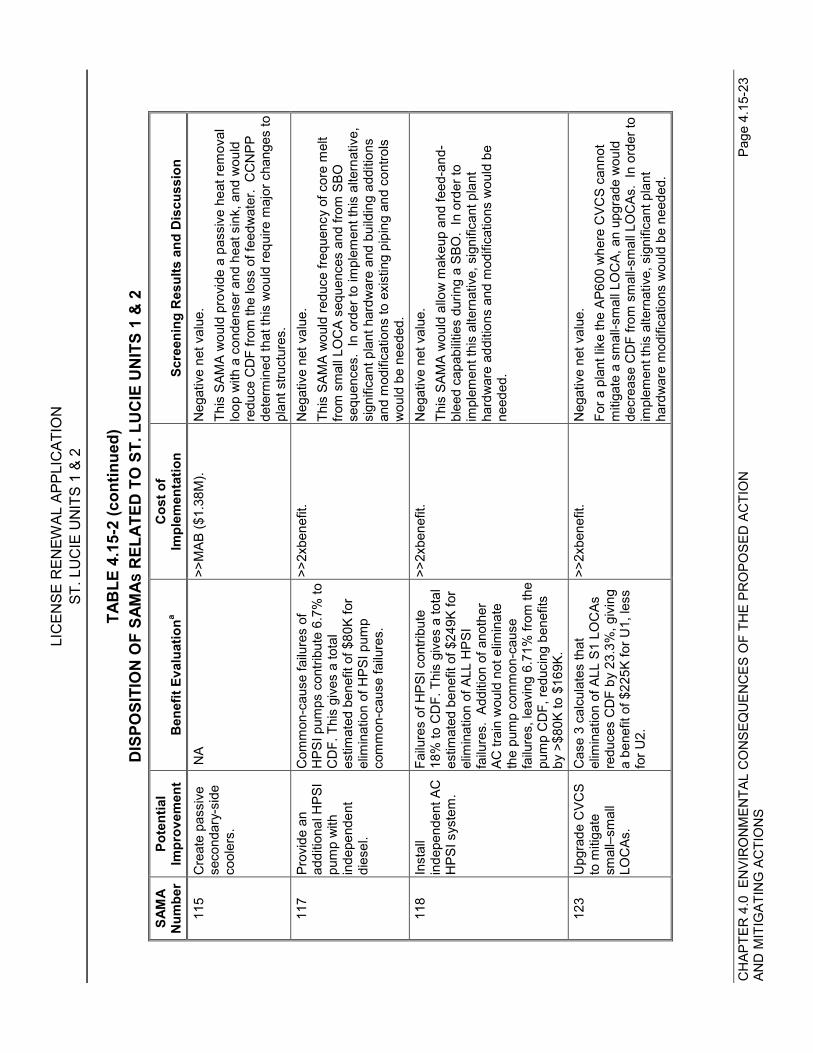
LIC
ENSE
REN
EWAL
APP
LIC
ATIO
NST
. LU
CIE
UN
ITS
1 &
2
CH
APTE
R 4
.0 E
NVI
RO
NM
ENTA
L C
ON
SEQ
UEN
CES
OF
THE
PRO
POSE
D A
CTI
ON
Page
4.1
5-23
AND
MIT
IGAT
ING
AC
TIO
NS
TAB
LE 4
.15-
2 (c
ontin
ued)
DIS
POSI
TIO
N O
F SA
MAS
REL
ATED
TO
ST.
LU
CIE
UN
ITS
1 &
2SA
MA
Num
ber
Pote
ntia
lIm
prov
emen
tB
enef
it Ev
alua
tiona
Cos
t of
Impl
emen
tatio
nSc
reen
ing
Res
ults
and
Dis
cuss
ion
115
Cre
ate
pass
ive
seco
ndar
y-si
deco
oler
s.
NA
>>M
AB ($
1.38
M).
Neg
ativ
e ne
t val
ue.
This
SAM
A w
ould
pro
vide
a p
assi
ve h
eat r
emov
allo
op w
ith a
con
dens
er a
nd h
eat s
ink,
and
wou
ldre
duce
CD
F fro
m th
e lo
ss o
f fee
dwat
er.
CC
NPP
dete
rmin
ed th
at th
is w
ould
requ
ire m
ajor
cha
nges
topl
ant s
truct
ures
.11
7Pr
ovid
e an
addi
tiona
l HPS
Ipu
mp
with
inde
pend
ent
dies
el.
Com
mon
-cau
se fa
ilure
s of
HPS
I pum
ps c
ontri
bute
6.7
% to
CD
F. T
his
give
s a
tota
les
timat
ed b
enef
it of
$80
K fo
rel
imin
atio
n of
HPS
I pum
pco
mm
on-c
ause
failu
res.
>>2x
bene
fit.
Neg
ativ
e ne
t val
ue.
This
SAM
A w
ould
redu
ce fr
eque
ncy
of c
ore
mel
tfro
m s
mal
l LO
CA
sequ
ence
s an
d fro
m S
BOse
quen
ces.
In
orde
r to
impl
emen
t thi
s al
tern
ativ
e,si
gnifi
cant
pla
nt h
ardw
are
and
build
ing
addi
tions
and
mod
ifica
tions
to e
xist
ing
pipi
ng a
nd c
ontro
lsw
ould
be
need
ed.
118
Inst
all
inde
pend
ent A
CH
PSI s
yste
m.
Failu
res
of H
PSI c
ontri
bute
18%
to C
DF.
Thi
s gi
ves
a to
tal
estim
ated
ben
efit
of $
249K
for
elim
inat
ion
of A
LL H
PSI
failu
res.
Add
ition
of a
noth
erAC
trai
n w
ould
not
elim
inat
eth
e pu
mp
com
mon
-cau
sefa
ilure
s, le
avin
g 6.
71%
from
the
pum
p C
DF,
redu
cing
ben
efits
by >
$80K
to $
169K
.
>>2x
bene
fit.
Neg
ativ
e ne
t val
ue.
This
SAM
A w
ould
allo
w m
akeu
p an
d fe
ed-a
nd-
blee
d ca
pabi
litie
s du
ring
a SB
O.
In o
rder
toim
plem
ent t
his
alte
rnat
ive,
sig
nific
ant p
lant
hard
war
e ad
ditio
ns a
nd m
odifi
catio
ns w
ould
be
need
ed.
123
Upg
rade
CVC
Sto
miti
gate
smal
l–sm
all
LOC
As.
Cas
e 3
calc
ulat
es th
atel
imin
atio
n of
ALL
S1
LOC
Asre
duce
s C
DF
by 2
3.3%
, giv
ing
a be
nefit
of $
225K
for U
1, le
ssfo
r U2.
>>2x
bene
fit.
Neg
ativ
e ne
t val
ue.
For a
pla
nt li
ke th
e AP
600
whe
re C
VCS
cann
otm
itiga
te a
sm
all-s
mal
l LO
CA,
an
upgr
ade
wou
ldde
crea
se C
DF
from
sm
all-s
mal
l LO
CAs
. In
ord
er to
impl
emen
t thi
s al
tern
ativ
e, s
igni
fican
t pla
ntha
rdw
are
mod
ifica
tions
wou
ld b
e ne
eded
.
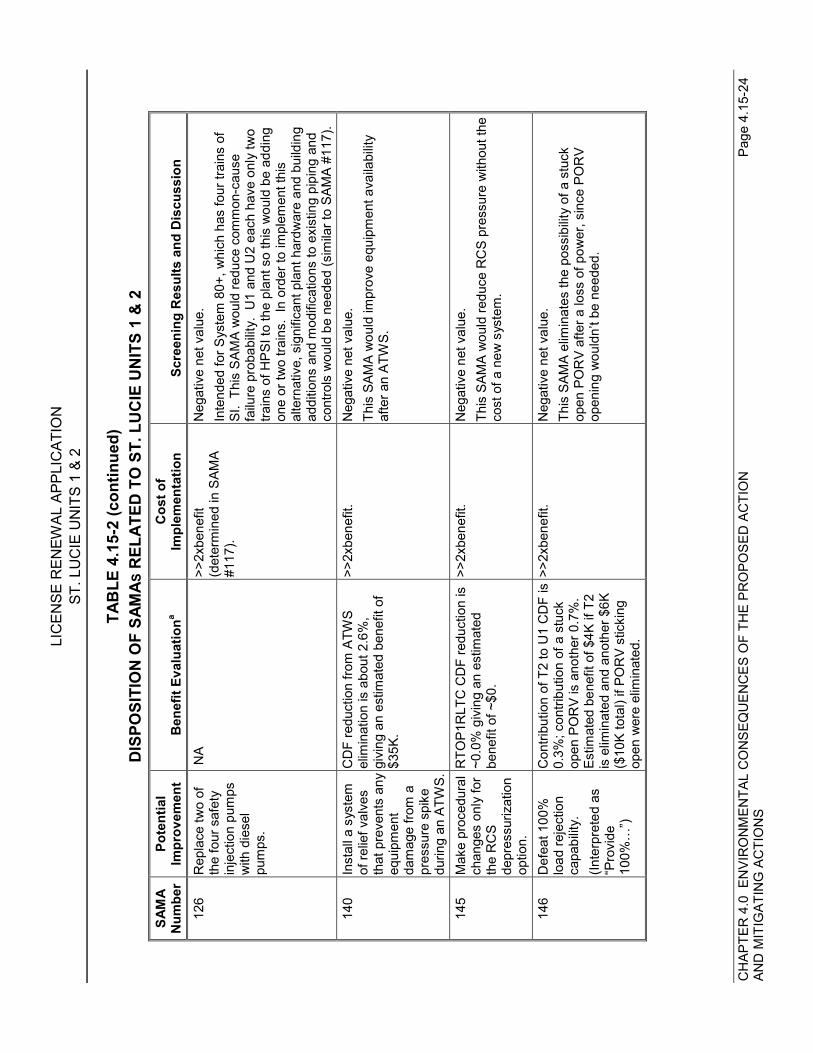
LIC
ENSE
REN
EWAL
APP
LIC
ATIO
NST
. LU
CIE
UN
ITS
1 &
2
CH
APTE
R 4
.0 E
NVI
RO
NM
ENTA
L C
ON
SEQ
UEN
CES
OF
THE
PRO
POSE
D A
CTI
ON
Page
4.1
5-24
AND
MIT
IGAT
ING
AC
TIO
NS
TAB
LE 4
.15-
2 (c
ontin
ued)
DIS
POSI
TIO
N O
F SA
MAS
REL
ATED
TO
ST.
LU
CIE
UN
ITS
1 &
2SA
MA
Num
ber
Pote
ntia
lIm
prov
emen
tB
enef
it Ev
alua
tiona
Cos
t of
Impl
emen
tatio
nSc
reen
ing
Res
ults
and
Dis
cuss
ion
126
Rep
lace
two
ofth
e fo
ur s
afet
yin
ject
ion
pum
psw
ith d
iese
lpu
mps
.
NA
>>2x
bene
fit(d
eter
min
ed in
SAM
A#1
17).
Neg
ativ
e ne
t val
ue.
Inte
nded
for S
yste
m 8
0+, w
hich
has
four
trai
ns o
fSI
. Th
is S
AMA
wou
ld re
duce
com
mon
-cau
sefa
ilure
pro
babi
lity.
U1
and
U2
each
hav
e on
ly tw
otra
ins
of H
PSI t
o th
e pl
ant s
o th
is w
ould
be
addi
ngon
e or
two
train
s. I
n or
der t
o im
plem
ent t
his
alte
rnat
ive,
sig
nific
ant p
lant
har
dwar
e an
d bu
ildin
gad
ditio
ns a
nd m
odifi
catio
ns to
exi
stin
g pi
ping
and
cont
rols
wou
ld b
e ne
eded
(sim
ilar t
o SA
MA
#117
).14
0In
stal
l a s
yste
mof
relie
f val
ves
that
pre
vent
s an
yeq
uipm
ent
dam
age
from
apr
essu
re s
pike
durin
g an
ATW
S.
CD
F re
duct
ion
from
ATW
Sel
imin
atio
n is
abo
ut 2
.6%
,gi
ving
an
estim
ated
ben
efit
of$3
5K.
>>2x
bene
fit.
Neg
ativ
e ne
t val
ue.
This
SAM
A w
ould
impr
ove
equi
pmen
t ava
ilabi
lity
afte
r an
ATW
S.
145
Mak
e pr
oced
ural
chan
ges
only
for
the
RC
Sde
pres
suriz
atio
nop
tion.
RTO
P1R
LTC
CD
F re
duct
ion
is~0
.0%
giv
ing
an e
stim
ated
bene
fit o
f ~$0
.
>>2x
bene
fit.
Neg
ativ
e ne
t val
ue.
This
SAM
A w
ould
redu
ce R
CS
pres
sure
with
out t
heco
st o
f a n
ew s
yste
m.
146
Def
eat 1
00%
load
reje
ctio
nca
pabi
lity.
(Inte
rpre
ted
as“P
rovi
de10
0%…
”)
Con
tribu
tion
of T
2 to
U1
CD
F is
0.3%
; con
tribu
tion
of a
stu
ckop
en P
OR
V is
ano
ther
0.7
%.
Estim
ated
ben
efit
of $
4K if
T2
is e
limin
ated
and
ano
ther
$6K
($10
K to
tal)
if PO
RV
stic
king
open
wer
e el
imin
ated
.
>>2x
bene
fit.
Neg
ativ
e ne
t val
ue.
This
SAM
A el
imin
ates
the
poss
ibilit
y of
a s
tuck
open
PO
RV
afte
r a lo
ss o
f pow
er, s
ince
PO
RV
open
ing
wou
ldn’
t be
need
ed.
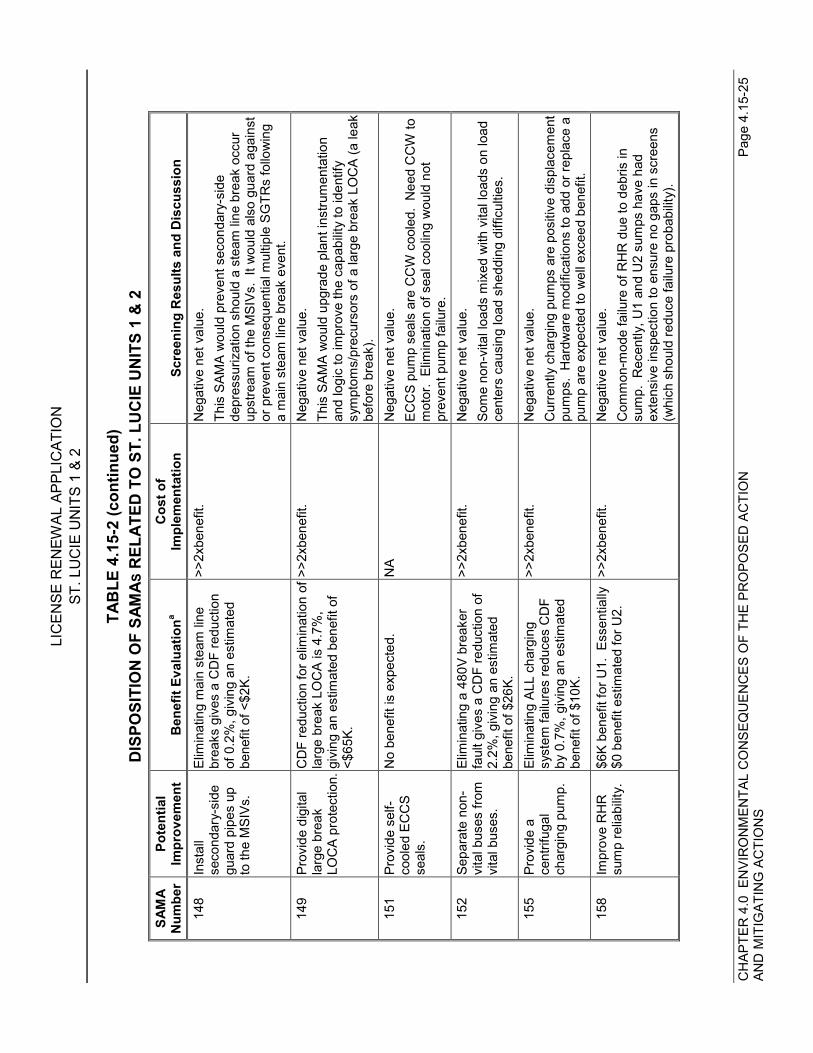
LIC
ENSE
REN
EWAL
APP
LIC
ATIO
NST
. LU
CIE
UN
ITS
1 &
2
CH
APTE
R 4
.0 E
NVI
RO
NM
ENTA
L C
ON
SEQ
UEN
CES
OF
THE
PRO
POSE
D A
CTI
ON
Page
4.1
5-25
AND
MIT
IGAT
ING
AC
TIO
NS
TAB
LE 4
.15-
2 (c
ontin
ued)
DIS
POSI
TIO
N O
F SA
MAS
REL
ATED
TO
ST.
LU
CIE
UN
ITS
1 &
2SA
MA
Num
ber
Pote
ntia
lIm
prov
emen
tB
enef
it Ev
alua
tiona
Cos
t of
Impl
emen
tatio
nSc
reen
ing
Res
ults
and
Dis
cuss
ion
148
Inst
all
seco
ndar
y-si
degu
ard
pipe
s up
to th
e M
SIVs
.
Elim
inat
ing
mai
n st
eam
line
brea
ks g
ives
a C
DF
redu
ctio
nof
0.2
%, g
ivin
g an
est
imat
edbe
nefit
of <
$2K.
>>2x
bene
fit.
Neg
ativ
e ne
t val
ue.
This
SAM
A w
ould
pre
vent
sec
onda
ry-s
ide
depr
essu
rizat
ion
shou
ld a
ste
am li
ne b
reak
occ
urup
stre
am o
f the
MSI
Vs.
It w
ould
als
o gu
ard
agai
nst
or p
reve
nt c
onse
quen
tial m
ultip
le S
GTR
s fo
llow
ing
a m
ain
stea
m li
ne b
reak
eve
nt.
149
Prov
ide
digi
tal
larg
e br
eak
LOC
A pr
otec
tion.
CD
F re
duct
ion
for e
limin
atio
n of
larg
e br
eak
LOC
A is
4.7
%,
givi
ng a
n es
timat
ed b
enef
it of
<$65
K.
>>2x
bene
fit.
Neg
ativ
e ne
t val
ue.
This
SAM
A w
ould
upg
rade
pla
nt in
stru
men
tatio
nan
d lo
gic
to im
prov
e th
e ca
pabi
lity
to id
entif
ysy
mpt
oms/
prec
urso
rs o
f a la
rge
brea
k LO
CA
(a le
akbe
fore
bre
ak).
151
Prov
ide
self-
cool
ed E
CC
Sse
als.
No
bene
fit is
exp
ecte
d.N
AN
egat
ive
net v
alue
.EC
CS
pum
p se
als
are
CC
W c
oole
d. N
eed
CC
W to
mot
or.
Elim
inat
ion
of s
eal c
oolin
g w
ould
not
prev
ent p
ump
failu
re.
152
Sepa
rate
non
-vi
tal b
uses
from
vita
l bus
es.
Elim
inat
ing
a 48
0V b
reak
erfa
ult g
ives
a C
DF
redu
ctio
n of
2.2%
, giv
ing
an e
stim
ated
bene
fit o
f $26
K.
>>2x
bene
fit.
Neg
ativ
e ne
t val
ue.
Som
e no
n-vi
tal l
oads
mix
ed w
ith v
ital l
oads
on
load
cent
ers
caus
ing
load
she
ddin
g di
fficu
lties
.
155
Prov
ide
ace
ntrif
ugal
char
ging
pum
p.
Elim
inat
ing
ALL
char
ging
syst
em fa
ilure
s re
duce
s C
DF
by 0
.7%
, giv
ing
an e
stim
ated
bene
fit o
f $10
K.
>>2x
bene
fit.
Neg
ativ
e ne
t val
ue.
Cur
rent
ly c
harg
ing
pum
ps a
re p
ositi
ve d
ispl
acem
ent
pum
ps.
Har
dwar
e m
odifi
catio
ns to
add
or r
epla
ce a
pum
p ar
e ex
pect
ed to
wel
l exc
eed
bene
fit.
158
Impr
ove
RH
Rsu
mp
relia
bilit
y.$6
K be
nefit
for U
1. E
ssen
tially
$0 b
enef
it es
timat
ed fo
r U2.
>>2x
bene
fit.
Neg
ativ
e ne
t val
ue.
Com
mon
-mod
e fa
ilure
of R
HR
due
to d
ebris
insu
mp.
Rec
ently
, U1
and
U2
sum
ps h
ave
had
exte
nsiv
e in
spec
tion
to e
nsur
e no
gap
s in
scr
eens
(whi
ch s
houl
d re
duce
failu
re p
roba
bilit
y).
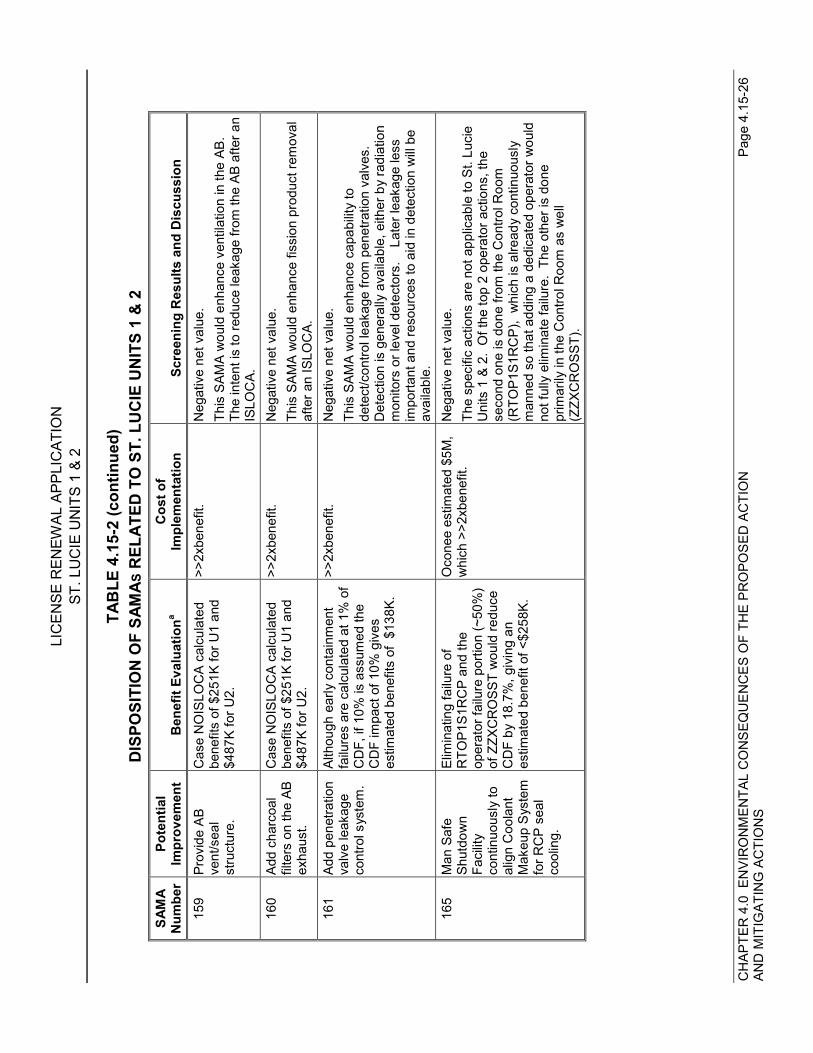
LIC
ENSE
REN
EWAL
APP
LIC
ATIO
NST
. LU
CIE
UN
ITS
1 &
2
CH
APTE
R 4
.0 E
NVI
RO
NM
ENTA
L C
ON
SEQ
UEN
CES
OF
THE
PRO
POSE
D A
CTI
ON
Page
4.1
5-26
AND
MIT
IGAT
ING
AC
TIO
NS
TAB
LE 4
.15-
2 (c
ontin
ued)
DIS
POSI
TIO
N O
F SA
MAS
REL
ATED
TO
ST.
LU
CIE
UN
ITS
1 &
2SA
MA
Num
ber
Pote
ntia
lIm
prov
emen
tB
enef
it Ev
alua
tiona
Cos
t of
Impl
emen
tatio
nSc
reen
ing
Res
ults
and
Dis
cuss
ion
159
Prov
ide
ABve
nt/s
eal
stru
ctur
e.
Cas
e N
OIS
LOC
A ca
lcul
ated
bene
fits
of $
251K
for U
1 an
d$4
87K
for U
2.
>>2x
bene
fit.
Neg
ativ
e ne
t val
ue.
This
SAM
A w
ould
enh
ance
ven
tilat
ion
in th
e AB
.Th
e in
tent
is to
redu
ce le
akag
e fro
m th
e AB
afte
r an
ISLO
CA.
160
Add
char
coal
filte
rs o
n th
e AB
exha
ust.
Cas
e N
OIS
LOC
A ca
lcul
ated
bene
fits
of $
251K
for U
1 an
d$4
87K
for U
2.
>>2x
bene
fit.
Neg
ativ
e ne
t val
ue.
This
SAM
A w
ould
enh
ance
fiss
ion
prod
uct r
emov
alaf
ter a
n IS
LOC
A.16
1Ad
d pe
netra
tion
valv
e le
akag
eco
ntro
l sys
tem
.
Alth
ough
ear
ly c
onta
inm
ent
failu
res
are
calc
ulat
ed a
t 1%
of
CD
F, if
10%
is a
ssum
ed th
eC
DF
impa
ct o
f 10%
giv
eses
timat
ed b
enef
its o
f $1
38K.
>>2x
bene
fit.
Neg
ativ
e ne
t val
ue.
This
SAM
A w
ould
enh
ance
cap
abilit
y to
dete
ct/c
ontro
l lea
kage
from
pen
etra
tion
valv
es.
Det
ectio
n is
gen
eral
ly a
vaila
ble,
eith
er b
y ra
diat
ion
mon
itors
or l
evel
det
ecto
rs.
Lat
er le
akag
e le
ssim
porta
nt a
nd re
sour
ces
to a
id in
det
ectio
n w
ill be
avai
labl
e.16
5M
an S
afe
Shut
dow
nFa
cilit
yco
ntin
uous
ly to
alig
n C
oola
ntM
akeu
p S
yste
mfo
r RC
P se
alco
olin
g.
Elim
inat
ing
failu
re o
fR
TOP1
S1R
CP
and
the
oper
ator
failu
re p
ortio
n (~
50%
)of
ZZX
CR
OSS
T w
ould
redu
ceC
DF
by 1
8.7%
, giv
ing
anes
timat
ed b
enef
it of
<$2
58K.
Oco
nee
estim
ated
$5M
,w
hich
>>2
xben
efit.
Neg
ativ
e ne
t val
ue.
The
spec
ific
actio
ns a
re n
ot a
pplic
able
to S
t. Lu
cie
Uni
ts 1
& 2
. O
f the
top
2 op
erat
or a
ctio
ns, t
hese
cond
one
is d
one
from
the
Con
trol R
oom
(RTO
P1S1
RC
P),
whi
ch is
alre
ady
cont
inuo
usly
man
ned
so th
at a
ddin
g a
dedi
cate
d op
erat
or w
ould
not f
ully
elim
inat
e fa
ilure
. Th
e ot
her i
s do
nepr
imar
ily in
the
Con
trol R
oom
as
wel
l(Z
ZXC
RO
SST)
.
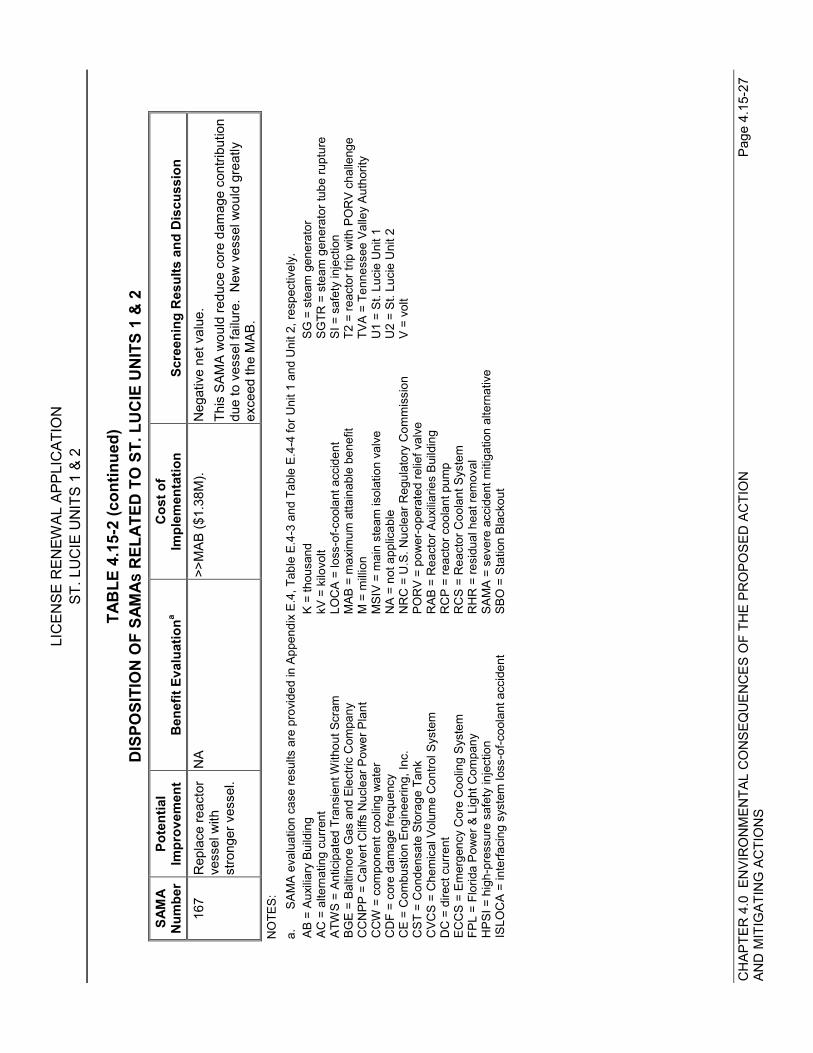
LIC
ENSE
REN
EWAL
APP
LIC
ATIO
NST
. LU
CIE
UN
ITS
1 &
2
CH
APTE
R 4
.0 E
NVI
RO
NM
ENTA
L C
ON
SEQ
UEN
CES
OF
THE
PRO
POSE
D A
CTI
ON
Page
4.1
5-27
AND
MIT
IGAT
ING
AC
TIO
NS
TAB
LE 4
.15-
2 (c
ontin
ued)
DIS
POSI
TIO
N O
F SA
MAS
REL
ATED
TO
ST.
LU
CIE
UN
ITS
1 &
2SA
MA
Num
ber
Pote
ntia
lIm
prov
emen
tB
enef
it Ev
alua
tiona
Cos
t of
Impl
emen
tatio
nSc
reen
ing
Res
ults
and
Dis
cuss
ion
167
Rep
lace
reac
tor
vess
el w
ithst
rong
er v
esse
l.
NA
>>M
AB ($
1.38
M).
Neg
ativ
e ne
t val
ue.
This
SAM
A w
ould
redu
ce c
ore
dam
age
cont
ribut
ion
due
to v
esse
l fai
lure
. N
ew v
esse
l wou
ld g
reat
lyex
ceed
the
MAB
.N
OTE
S:a.
SAM
A ev
alua
tion
case
resu
lts a
re p
rovi
ded
in A
ppen
dix
E.4,
Tab
le E
.4-3
and
Tab
le E
.4-4
for U
nit 1
and
Uni
t 2, r
espe
ctiv
ely.
AB =
Aux
iliary
Bui
ldin
gAC
= a
ltern
atin
g cu
rrent
ATW
S =
Antic
ipat
ed T
rans
ient
With
out S
cram
BGE
= Ba
ltim
ore
Gas
and
Ele
ctric
Com
pany
CC
NPP
= C
alve
rt C
liffs
Nuc
lear
Pow
er P
lant
CC
W =
com
pone
nt c
oolin
g w
ater
CD
F =
core
dam
age
frequ
ency
CE
= C
ombu
stio
n En
gine
erin
g, In
c.C
ST =
Con
dens
ate
Stor
age
Tank
CVC
S =
Che
mic
al V
olum
e C
ontro
l Sys
tem
DC
= d
irect
cur
rent
ECC
S =
Emer
genc
y C
ore
Coo
ling
Syst
emFP
L =
Flor
ida
Pow
er &
Lig
ht C
ompa
nyH
PSI =
hig
h-pr
essu
re s
afet
y in
ject
ion
ISLO
CA
= in
terfa
cing
sys
tem
loss
-of-c
oola
nt a
ccid
ent
K =
thou
sand
kV =
kilo
volt
LOC
A =
loss
-of-c
oola
nt a
ccid
ent
MAB
= m
axim
um a
ttain
able
ben
efit
M =
milli
onM
SIV
= m
ain
stea
m is
olat
ion
valv
eN
A =
not a
pplic
able
NR
C =
U.S
. Nuc
lear
Reg
ulat
ory
Com
mis
sion
POR
V =
pow
er-o
pera
ted
relie
f val
veR
AB =
Rea
ctor
Aux
iliarie
s Bu
ildin
gR
CP
= re
acto
r coo
lant
pum
pR
CS
= R
eact
or C
oola
nt S
yste
mR
HR
= re
sidu
al h
eat r
emov
alSA
MA
= se
vere
acc
iden
t miti
gatio
n al
tern
ativ
eSB
O =
Sta
tion
Blac
kout
SG =
ste
am g
ener
ator
SGTR
= s
team
gen
erat
or tu
be ru
ptur
eSI
= s
afet
y in
ject
ion
T2 =
reac
tor t
rip w
ith P
OR
V ch
alle
nge
TVA
= Te
nnes
see
Valle
y Au
thor
ityU
1 =
St. L
ucie
Uni
t 1U
2 =
St. L
ucie
Uni
t 2V
= vo
lt
LICENSE RENEWAL APPLICATIONST. LUCIE UNITS 1 & 2
CHAPTER 4.0 ENVIRONMENTAL CONSEQUENCES OF THE PROPOSED ACTION Page 4.16-1AND MITIGATING ACTIONS
4.16 ENVIRONMENTAL JUSTICE
NRC“The need for and the content of an analysis of environmental justice will be addressed inplant-specific reviews.” 10 CFR Part 51, Subpart A, Appendix B, Table B-1, Issue 92
Executive Order 12898, “Federal Actions to Address Environmental Justice in MinorityPopulations and Low-Income Populations” (Ref. 4.16-1), requires Executive agencies toidentify and address, as appropriate, “disproportionately high and adverse human health orenvironmental effects” from their programs, policies, and activities on minority and low-income populations. The Presidential Memorandum that accompanied Executive Order12898 emphasized the importance of using existing laws, including the NEPA, to identifyand address environmental justice concerns, “including human health, economic, and socialeffects, of Federal actions.”
Although the NRC is not subject to Executive Order 12898, it has voluntarily committed toconducting environmental justice reviews of actions under its jurisdiction and has issuedprocedural guidance (Ref. 4.16-2, Attachment 4). The guidance does not provide astandard approach or formula for identifying and addressing environmental justice issues.Instead, it offers general principles for conducting an environmental justice analysis underNEPA. The NRC guidance makes clear that if no significant impacts are anticipated fromthe proposed action, then “…no member of the public will be substantially affected” and, asa consequence, “…there can be no disproportionate high and adverse effects or impacts onany member of the public including minority or low income populations.”
FPL has reviewed and adopted by reference NRC findings for Category 1 issues that FPLdetermined are applicable to St. Lucie Units 1 & 2 (see Section 4.1.1). The NRC hadconcluded that environmental impacts for each of these issues would be SMALL. FPL hasaddressed each Category 2 issue and has performed required analyses for those that FPLdetermined are applicable to St. Lucie Units 1 & 2 (see Sections 4.1 through 4.15 andAppendix A).
For each applicable Category 2 issue requiring analysis, FPL has concluded that theenvironmental impacts would be SMALL. These include:
• Entrainment, impingement, and heat shock;• Threatened or endangered species;• Electric shock from transmission-line-induced currents;• Housing, public water supply, offsite land use, and transportation;• Historic and archaeological resources; and• Severe accident mitigation alternatives.
Based on the FPL review, St. Lucie Units 1 & 2 license renewal and continued operationswould result in no significant impact. No member of the public would be substantiallyaffected and, as a consequence, there would be no disproportionately high and adverseimpacts on any member of the public, including minority and low-income populations. In
LICENSE RENEWAL APPLICATIONST. LUCIE UNITS 1 & 2
CHAPTER 4.0 ENVIRONMENTAL CONSEQUENCES OF THE PROPOSED ACTION Page 4.16-2AND MITIGATING ACTIONS
such instances, a qualitative review of potential environmental justice impacts is adequateand no mitigation measures need be described.
LICENSE RENEWAL APPLICATIONST. LUCIE UNITS 1 & 2
CHAPTER 4.0 ENVIRONMENTAL CONSEQUENCES OF THE PROPOSED ACTION Page 4.17-1AND MITIGATING ACTIONS
4.17 REFERENCES
4.2-1 U.S. Nuclear Regulatory Commission. Generic Environmental Impact Statementfor License Renewal of Nuclear Plants. NUREG-1437. Office of NuclearRegulatory Research. Washington, D.C. May 1996.
4.2-2 U.S. Nuclear Regulatory Commission. Final Environmental Statement Related tothe Operation of St. Lucie Plant, Unit No. 2; Florida Power & Light Company,Orlando Utilities Commission of the City of Orlando, Florida. Docket No. 50-389.NUREG-0842. Office of Nuclear Reactor Regulation. Washington, D.C. April1982.
4.3-1 Applied Biology, Inc. “Florida Power & Light Company St. Lucie Plant AnnualNon-Radiological Environmental Monitoring Report 1984.” Atlanta, Georgia.(L-85-174) April 30, 1985.
4.3-2 Florida Department of Environmental Protection. “Site Certification, St. LuciePower Plant Unit 2, Florida Power & Light Co.” Certification No. PA 74-02C,OGC Case No. 94-1053. 1976 (and subsequent modifications).
4.4-1 U.S. Atomic Energy Commission. Final Environmental Statement Related to theSt. Lucie Plant Unit No. 1; Florida Power & Light Company. Docket No. 50-335.Directorate of Licensing. Washington, D.C. June 1973.
4.4-2 Florida Department of Environmental Protection. “Surface Water QualityStandards.” Rule G2-302.520(4)(c). December 26, 1996.
4.6-1 Ecological Associates, Inc. Physical and Ecological Factors Influencing SeaTurtle Entrainment Levels at the St. Lucie Nuclear Plant: 1976-1998. JensenBeach, Florida. (L-2000-78) March 22, 2000.
4.6-2 U.S. Nuclear Regulatory Commission. Assessment of the Impacts of the St.Lucie Nuclear Plant on Threatened and Endangered Species. Docket No. 50-398. Office of Nuclear Reactor Regulation. Washington, D.C. March 1982.
4.6-3 National Marine Fisheries Service. Endangered Species Act Section 7Consultation Biological Opinion. St. Petersburg, Florida. February 7, 1997.
4.6-4 Florida Power & Light Company. Assessment of the Impacts of the St. LucieNuclear Generating Plant on Sea Turtle Species Found in the Nearshore Watersof Florida. Juno Beach, Florida. (L-95-309) November 20, 1995.
4.6-5 Letter from J.E. Powers (NMFS) to K.N. Jabbour (NRC), “National MarineFisheries Service Biological Opinion.” St. Petersburg, Florida. May 4, 2001.
4.6-6 Florida Power & Light Company. Annual Environmental Operating Report 2000.Juno Beach, Florida. (L-2001-90) April 2001.
LICENSE RENEWAL APPLICATIONST. LUCIE UNITS 1 & 2
CHAPTER 4.0 ENVIRONMENTAL CONSEQUENCES OF THE PROPOSED ACTION Page 4.17-2AND MITIGATING ACTIONS
4.8-1 National Electrical Safety Code®. Part 2, Rules 232Cic and 232D3c. 1997Edition. C2-1997.
4.8-2 Electric Power Research Institute. Transmission Line Reference Book. 345 kVand Above. Second Edition, Revised. Palo Alto, California. 1987.
4.8-3 Electromagnetic Workstation: ENVIRO Code. Electric Power Research Institute,Version 3.1, Baltimore Gas & Electric. October 18, 1994.
4.8-4 National Electrical Safety Code®. Part 2, Rules 232A1 and 232B1. 1997Edition. C2-1997.
4.10-1 Fetter, Jr., C. W. Applied Hydrogeology. Charles E. Merrill Publishing Co./Bell &Howell Co. Columbus, Ohio. 1980.
4.10-2 U.S. Census Bureau. DP-1. Profile of General Demographic Characteristics:2000 for Florida and Selected Counties and Cities. http://factfinder.census.gov.Accessed July 25, 2001.
4.15-1 U.S. Nuclear Regulatory Commission. Regulatory Analysis Technical EvaluationHandbook. NUREG/BR-0184. Office of Nuclear Regulatory Research.Washington, D.C. January 1997.
4.15-2 Letter from D.A. Sager (FPL) to Document Control Desk (NRC), “St. Lucie Units1 & 2 Summary Report of Individual Plant Examination for Severe AccidentVulnerabilities – Generic Letter 88-20.” (L-93-301) December 9, 1993.
4.15-3 Letter from D.A. Sager (FPL) to Document Control Desk (NRC), “St. Lucie Units1 & 2 – NRC Generic Letter 88-20, Supplement 4, Individual Plant Examinationfor Severe Accident Vulnerabilities Report.” (L-94-318, with Enclosure)December 15, 1994.
4.15-4 Letter from Mr. W. J. Museler (TVA) to Document Control Desk (NRC), “WattsBar Nuclear Plant (WBN) Units 1 and 2 – Severe Accident Mitigation DesignAlternatives (SAMDA) - (TAC Nos. M77222 and M77223).” June 5, 1993.
4.15-5 U.S. Nuclear Regulatory Commission. Final Safety Evaluation Report Related tothe Certification of the System 80+ Design. NUREG-1462. Associate Directorfor Advanced Reactors & License Renewal. Washington, D.C. August 1994.
4.15-6 Baltimore Gas & Electric Company. Calvert Cliffs Nuclear Power Plant, Units 1and 2, License Renewal Application. Attachment 3, “Applicant’s EnvironmentalReport – Operating License Renewal Stage.” Lusby, Maryland. April 1998.
4.16-1 “Executive Order 12898, Federal Actions to Address Environmental Justice inMinority Populations and Low Income Populations.” Federal Register. Vol. 59,No. 32. (February 16, 1994). www.access.gpo/su_docs/aces/aaces002.html.Accessed February 27, 2001.
LICENSE RENEWAL APPLICATIONST. LUCIE UNITS 1 & 2
CHAPTER 4.0 ENVIRONMENTAL CONSEQUENCES OF THE PROPOSED ACTION Page 4.17-3AND MITIGATING ACTIONS
4.16-2 U.S. Nuclear Regulatory Commission. “Procedural Guidance for PreparingEnvironmental Assessments and Considering Environmental Issues.” NRROffice Letter No. 906, Rev. 2. Office of Nuclear Reactor Regulation.Washington, D.C. September 21, 1999.
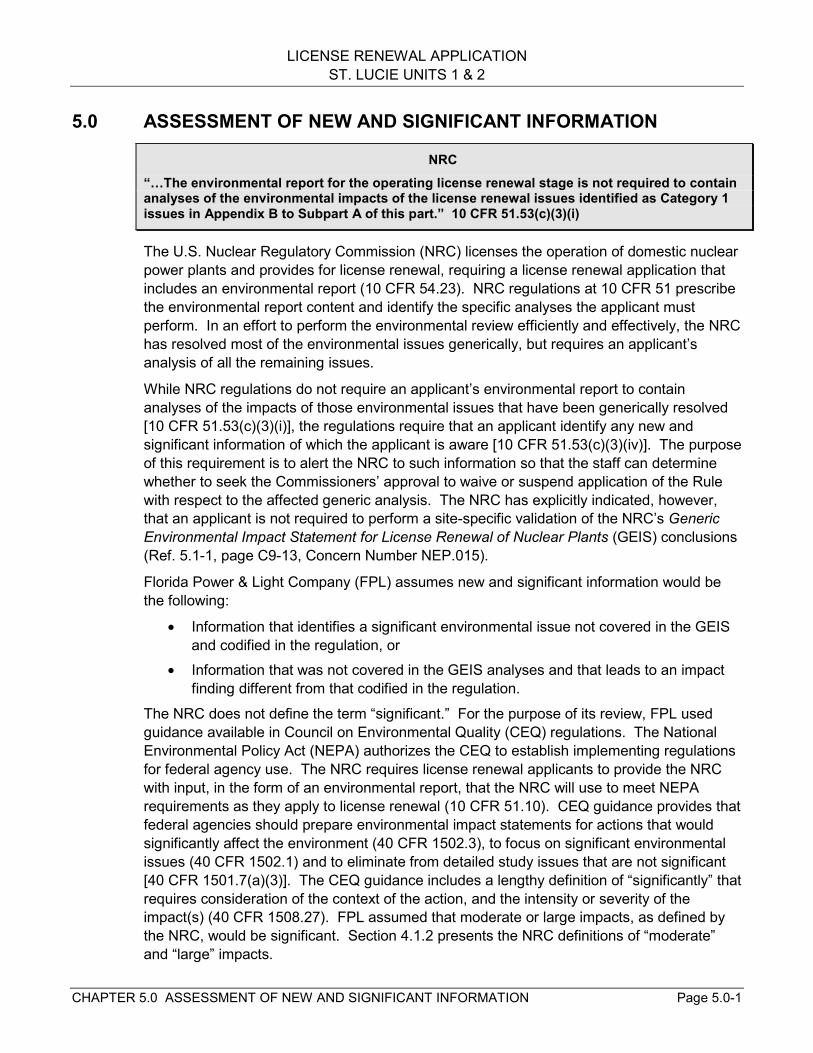
LICENSE RENEWAL APPLICATIONST. LUCIE UNITS 1 & 2
CHAPTER 5.0 ASSESSMENT OF NEW AND SIGNIFICANT INFORMATION Page 5.0-1
5.0 ASSESSMENT OF NEW AND SIGNIFICANT INFORMATION
NRC“…The environmental report for the operating license renewal stage is not required to containanalyses of the environmental impacts of the license renewal issues identified as Category 1issues in Appendix B to Subpart A of this part.” 10 CFR 51.53(c)(3)(i)
The U.S. Nuclear Regulatory Commission (NRC) licenses the operation of domestic nuclearpower plants and provides for license renewal, requiring a license renewal application thatincludes an environmental report (10 CFR 54.23). NRC regulations at 10 CFR 51 prescribethe environmental report content and identify the specific analyses the applicant mustperform. In an effort to perform the environmental review efficiently and effectively, the NRChas resolved most of the environmental issues generically, but requires an applicant’sanalysis of all the remaining issues.
While NRC regulations do not require an applicant’s environmental report to containanalyses of the impacts of those environmental issues that have been generically resolved[10 CFR 51.53(c)(3)(i)], the regulations require that an applicant identify any new andsignificant information of which the applicant is aware [10 CFR 51.53(c)(3)(iv)]. The purposeof this requirement is to alert the NRC to such information so that the staff can determinewhether to seek the Commissioners’ approval to waive or suspend application of the Rulewith respect to the affected generic analysis. The NRC has explicitly indicated, however,that an applicant is not required to perform a site-specific validation of the NRC’s GenericEnvironmental Impact Statement for License Renewal of Nuclear Plants (GEIS) conclusions(Ref. 5.1-1, page C9-13, Concern Number NEP.015).
Florida Power & Light Company (FPL) assumes new and significant information would bethe following:
• Information that identifies a significant environmental issue not covered in the GEISand codified in the regulation, or
• Information that was not covered in the GEIS analyses and that leads to an impactfinding different from that codified in the regulation.
The NRC does not define the term “significant.” For the purpose of its review, FPL usedguidance available in Council on Environmental Quality (CEQ) regulations. The NationalEnvironmental Policy Act (NEPA) authorizes the CEQ to establish implementing regulationsfor federal agency use. The NRC requires license renewal applicants to provide the NRCwith input, in the form of an environmental report, that the NRC will use to meet NEPArequirements as they apply to license renewal (10 CFR 51.10). CEQ guidance provides thatfederal agencies should prepare environmental impact statements for actions that wouldsignificantly affect the environment (40 CFR 1502.3), to focus on significant environmentalissues (40 CFR 1502.1) and to eliminate from detailed study issues that are not significant[40 CFR 1501.7(a)(3)]. The CEQ guidance includes a lengthy definition of “significantly” thatrequires consideration of the context of the action, and the intensity or severity of theimpact(s) (40 CFR 1508.27). FPL assumed that moderate or large impacts, as defined bythe NRC, would be significant. Section 4.1.2 presents the NRC definitions of “moderate”and “large” impacts.
LICENSE RENEWAL APPLICATIONST. LUCIE UNITS 1 & 2
CHAPTER 5.0 ASSESSMENT OF NEW AND SIGNIFICANT INFORMATION Page 5.0-2
FPL is aware of no new and significant information regarding the environmental impacts ofSt. Lucie Units 1 & 2 license renewal.
LICENSE RENEWAL APPLICATIONST. LUCIE UNITS 1 & 2
CHAPTER 5.0 ASSESSMENT OF NEW AND SIGNIFICANT INFORMATION Page 5.1-1
5.1 REFERENCES
5.1-1 U.S. Nuclear Regulatory Commission. Public Comments on the Proposed10 CFR Part 51 Rule for Renewal of Nuclear Power Plant Operating Licensesand Supporting Documents: Review of Concerns and NRC Staff Response.NUREG-1529. Office of Nuclear Regulatory Research. Washington, D.C.May 1996.
LICENSE RENEWAL APPLICATIONST. LUCIE UNITS 1 & 2
CHAPTER 6.0 SUMMARY OF LICENSE RENEWAL IMPACTS Page 6.1-1AND MITIGATING ACTIONS
6.0 SUMMARY OF LICENSE RENEWAL IMPACTS AND MITIGATINGACTIONS
6.1 LICENSE RENEWAL IMPACTSFlorida Power & Light Company (FPL) has reviewed the environmental impacts associatedwith renewing the St. Lucie Units 1 & 2 operating licenses and has concluded that all of theimpacts would be small and would not require mitigation. This environmental reportdocuments FPL’s bases for its conclusion. Section 4.1.1 incorporates by reference U.S.Nuclear Regulatory Commission (NRC) findings for the 47 Category 1 issues that apply toSt. Lucie Units 1 & 2, all of which have impacts that are SMALL (see Appendix A).Subsections 4.2 through 4.15 of Chapter 4 analyze the 15 Category 2 issues that apply toSt. Lucie Units 1 & 2, all of which have impacts that would be SMALL or non-existent, due tothe lack of refurbishment activities associated with St. Lucie Units 1 & 2 license renewal.Section 4.16 discusses the basis for inclusion and appropriate depth of an environmentaljustice analysis summarizing that there are no disproportionately high and adverse humanhealth or environmental effects since impacts from all Category 1 and Category 2 issuesapplicable to St. Lucie Units 1 & 2 are SMALL. Table 6.1-1 identifies the impacts that St.Lucie Units 1 & 2 license renewal would have on resources associated with Category 2issues and environmental justice.
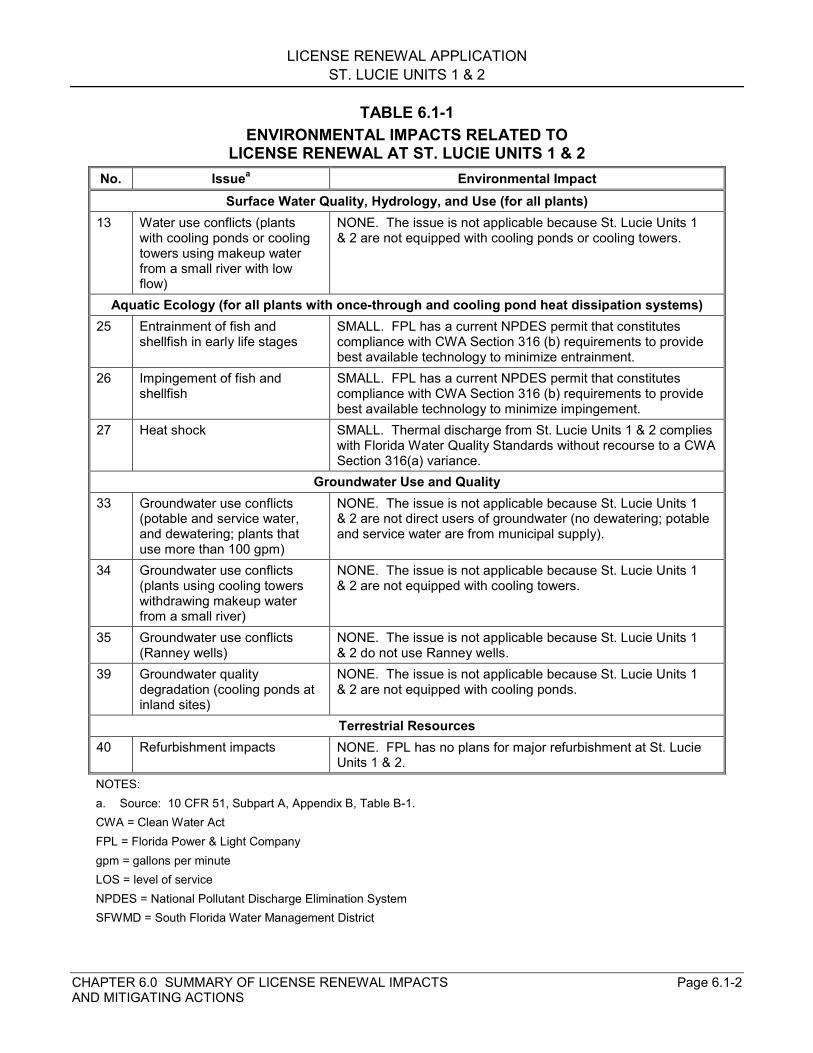
LICENSE RENEWAL APPLICATIONST. LUCIE UNITS 1 & 2
CHAPTER 6.0 SUMMARY OF LICENSE RENEWAL IMPACTS Page 6.1-2AND MITIGATING ACTIONS
TABLE 6.1-1ENVIRONMENTAL IMPACTS RELATED TO
LICENSE RENEWAL AT ST. LUCIE UNITS 1 & 2No. Issuea Environmental Impact
Surface Water Quality, Hydrology, and Use (for all plants)13 Water use conflicts (plants
with cooling ponds or coolingtowers using makeup waterfrom a small river with lowflow)
NONE. The issue is not applicable because St. Lucie Units 1& 2 are not equipped with cooling ponds or cooling towers.
Aquatic Ecology (for all plants with once-through and cooling pond heat dissipation systems)25 Entrainment of fish and
shellfish in early life stagesSMALL. FPL has a current NPDES permit that constitutescompliance with CWA Section 316 (b) requirements to providebest available technology to minimize entrainment.
26 Impingement of fish andshellfish
SMALL. FPL has a current NPDES permit that constitutescompliance with CWA Section 316 (b) requirements to providebest available technology to minimize impingement.
27 Heat shock SMALL. Thermal discharge from St. Lucie Units 1 & 2 complieswith Florida Water Quality Standards without recourse to a CWASection 316(a) variance.
Groundwater Use and Quality33 Groundwater use conflicts
(potable and service water,and dewatering; plants thatuse more than 100 gpm)
NONE. The issue is not applicable because St. Lucie Units 1& 2 are not direct users of groundwater (no dewatering; potableand service water are from municipal supply).
34 Groundwater use conflicts(plants using cooling towerswithdrawing makeup waterfrom a small river)
NONE. The issue is not applicable because St. Lucie Units 1& 2 are not equipped with cooling towers.
35 Groundwater use conflicts(Ranney wells)
NONE. The issue is not applicable because St. Lucie Units 1& 2 do not use Ranney wells.
39 Groundwater qualitydegradation (cooling ponds atinland sites)
NONE. The issue is not applicable because St. Lucie Units 1& 2 are not equipped with cooling ponds.
Terrestrial Resources40 Refurbishment impacts NONE. FPL has no plans for major refurbishment at St. Lucie
Units 1 & 2.NOTES:a. Source: 10 CFR 51, Subpart A, Appendix B, Table B-1.CWA = Clean Water ActFPL = Florida Power & Light Companygpm = gallons per minuteLOS = level of serviceNPDES = National Pollutant Discharge Elimination SystemSFWMD = South Florida Water Management District
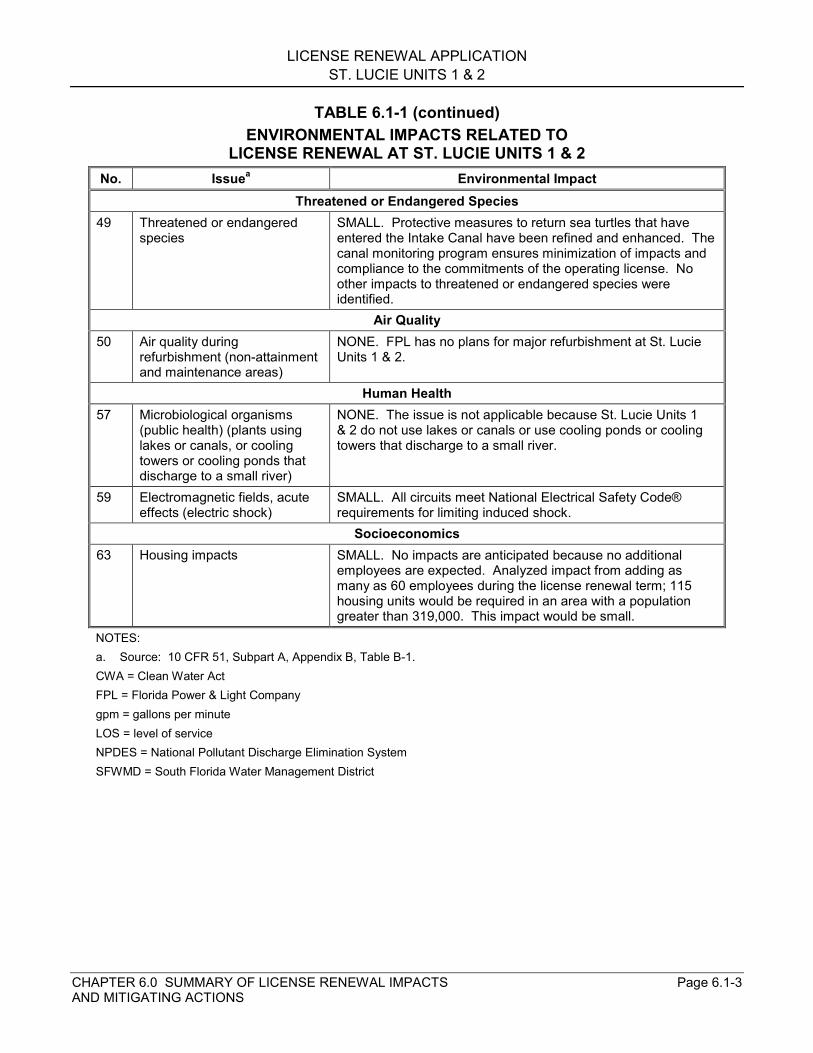
LICENSE RENEWAL APPLICATIONST. LUCIE UNITS 1 & 2
CHAPTER 6.0 SUMMARY OF LICENSE RENEWAL IMPACTS Page 6.1-3AND MITIGATING ACTIONS
TABLE 6.1-1 (continued)ENVIRONMENTAL IMPACTS RELATED TO
LICENSE RENEWAL AT ST. LUCIE UNITS 1 & 2No. Issuea Environmental Impact
Threatened or Endangered Species49 Threatened or endangered
speciesSMALL. Protective measures to return sea turtles that haveentered the Intake Canal have been refined and enhanced. Thecanal monitoring program ensures minimization of impacts andcompliance to the commitments of the operating license. Noother impacts to threatened or endangered species wereidentified.
Air Quality50 Air quality during
refurbishment (non-attainmentand maintenance areas)
NONE. FPL has no plans for major refurbishment at St. LucieUnits 1 & 2.
Human Health57 Microbiological organisms
(public health) (plants usinglakes or canals, or coolingtowers or cooling ponds thatdischarge to a small river)
NONE. The issue is not applicable because St. Lucie Units 1& 2 do not use lakes or canals or use cooling ponds or coolingtowers that discharge to a small river.
59 Electromagnetic fields, acuteeffects (electric shock)
SMALL. All circuits meet National Electrical Safety Code®requirements for limiting induced shock.
Socioeconomics63 Housing impacts SMALL. No impacts are anticipated because no additional
employees are expected. Analyzed impact from adding asmany as 60 employees during the license renewal term; 115housing units would be required in an area with a populationgreater than 319,000. This impact would be small.
NOTES:a. Source: 10 CFR 51, Subpart A, Appendix B, Table B-1.CWA = Clean Water ActFPL = Florida Power & Light Companygpm = gallons per minuteLOS = level of serviceNPDES = National Pollutant Discharge Elimination SystemSFWMD = South Florida Water Management District
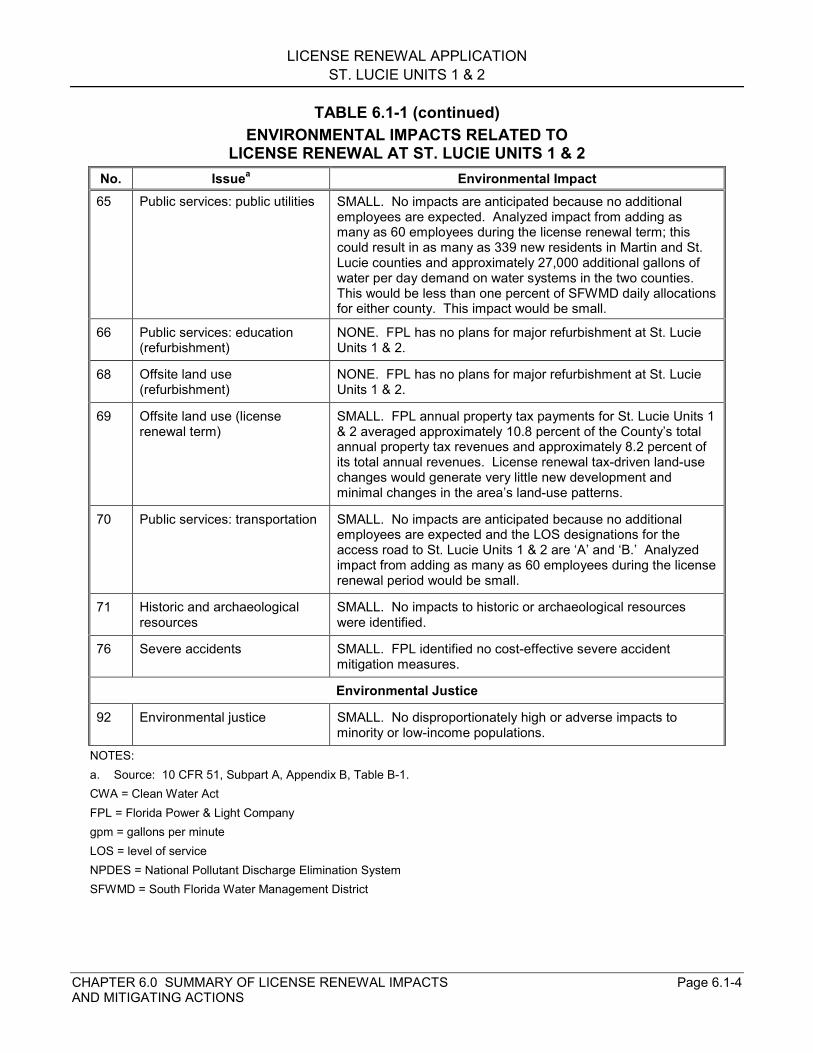
LICENSE RENEWAL APPLICATIONST. LUCIE UNITS 1 & 2
CHAPTER 6.0 SUMMARY OF LICENSE RENEWAL IMPACTS Page 6.1-4AND MITIGATING ACTIONS
TABLE 6.1-1 (continued)ENVIRONMENTAL IMPACTS RELATED TO
LICENSE RENEWAL AT ST. LUCIE UNITS 1 & 2No. Issuea Environmental Impact65 Public services: public utilities SMALL. No impacts are anticipated because no additional
employees are expected. Analyzed impact from adding asmany as 60 employees during the license renewal term; thiscould result in as many as 339 new residents in Martin and St.Lucie counties and approximately 27,000 additional gallons ofwater per day demand on water systems in the two counties.This would be less than one percent of SFWMD daily allocationsfor either county. This impact would be small.
66 Public services: education(refurbishment)
NONE. FPL has no plans for major refurbishment at St. LucieUnits 1 & 2.
68 Offsite land use(refurbishment)
NONE. FPL has no plans for major refurbishment at St. LucieUnits 1 & 2.
69 Offsite land use (licenserenewal term)
SMALL. FPL annual property tax payments for St. Lucie Units 1& 2 averaged approximately 10.8 percent of the County’s totalannual property tax revenues and approximately 8.2 percent ofits total annual revenues. License renewal tax-driven land-usechanges would generate very little new development andminimal changes in the area’s land-use patterns.
70 Public services: transportation SMALL. No impacts are anticipated because no additionalemployees are expected and the LOS designations for theaccess road to St. Lucie Units 1 & 2 are ‘A’ and ‘B.’ Analyzedimpact from adding as many as 60 employees during the licenserenewal period would be small.
71 Historic and archaeologicalresources
SMALL. No impacts to historic or archaeological resourceswere identified.
76 Severe accidents SMALL. FPL identified no cost-effective severe accidentmitigation measures.
Environmental Justice
92 Environmental justice SMALL. No disproportionately high or adverse impacts tominority or low-income populations.
NOTES:a. Source: 10 CFR 51, Subpart A, Appendix B, Table B-1.CWA = Clean Water ActFPL = Florida Power & Light Companygpm = gallons per minuteLOS = level of serviceNPDES = National Pollutant Discharge Elimination SystemSFWMD = South Florida Water Management District
LICENSE RENEWAL APPLICATIONST. LUCIE UNITS 1 & 2
CHAPTER 6.0 SUMMARY OF LICENSE RENEWAL IMPACTS Page 6.2-1AND MITIGATING ACTIONS
6.2 MITIGATION
NRC“The report must contain a consideration of alternatives for reducing adverse impacts...for allCategory 2 license renewal issues...” 10 CFR 51.53(c)(3)(iii)“The environmental report shall include an analysis that considers and balances...alternativesavailable for reducing or avoiding adverse environmental effects....” 10 CFR 51.45(c) asincorporated by 10 CFR 51.53(c)(2)
All impacts of St. Lucie Units 1 & 2 license renewal are beneficial or small, and would notrequire additional mitigation. St. Lucie Units 1 & 2’s once-through cooling system wasdesigned and constructed so as to minimize impacts to aquatic life. Baseline studies weredone characterizing the environs of the Indian River Lagoon and the Atlantic Ocean alongHutchinson Island. Data indicated that the Lagoon supports a diverse and abundantassemblage of marine life. The marine life of the Atlantic, particularly within the offshore,mid-island region inside Pierce Shoal, is less so. Indications of this include less variability inhydrographic condition, absence of attached macrophytes and hard-bottom substrate, andisolation from major spawning grounds of most species of finfish and shellfish.
Additionally, the St. Lucie Units 1 & 2 intake pipes were sited seaward of the nearshoreworm rocks in an area devoid of hard bottom and the intake structures were fitted withvelocity caps. The caps on the vertical intake shafts prevent the formation of a vortex andallow cooling water to be drawn from mid-depth rather than from the surface or the bottom ofthe water column. These two design features reduce the potential for entrainment of marinelife since fish eggs and larvae are buoyant and drift near the surface, and most invertebratesand many fish species live on the bottom.
An effective program to return sea turtles that have entered the Intake Canal was developedwith the permitting of St. Lucie Unit 1, and has evolved over time. FPL has performedstudies of techniques to deter the turtles from entering the intake structures. Techniquessuch as static light and bubble screens, weak electric impulses, seismic profiling/pneumaticair guns, and strobe lights have been tested. The practicality of using physical barriers atthe intake structures was also assessed. It was also determined that the series of barriernets coupled with visual monitoring proved to be the most effective and practical approach.
Current operations include mitigation activities that would continue during the term of theSt. Lucie Units 1 & 2 license renewals. FPL would continue to utilize protective measures,including mesh barriers and capture and release, to prevent sea turtles from entering theIntake Canal. FPL makes additional contributions to promote awareness of speciesprotection through additional mitigative activities including sea turtle surveys, Sea TurtleStranding and Salvage Network participation, and sea turtle nesting public awareness walks(Ref. 6.2-1).
Since initial operations began, FPL has evaluated and implemented many mitigativemeasures as summarized above. As discussed in Chapter 4, the impacts associated withcontinued operations during the license renewal term would be either beneficial or small,and further mitigation would not be warranted.
LICENSE RENEWAL APPLICATIONST. LUCIE UNITS 1 & 2
CHAPTER 6.0 SUMMARY OF LICENSE RENEWAL IMPACTS Page 6.3-1AND MITIGATING ACTIONS
6.3 UNAVOIDABLE ADVERSE IMPACTS
NRCThe environmental report shall discuss any “...adverse environmental effects which cannot beavoided should the proposal be implemented...” 10 CFR 51.45(b)(2) as adopted by 51.53(c)(2)
FPL adopts by reference for this environmental report the NRC findings stated in theGeneric Environmental Impact Statement for License Renewal of Nuclear Plants (GEIS) forapplicable Category 1 issues (see Appendix A), including discussions of any unavoidableadverse impacts. In Chapter 4.0, FPL examined the 21 Category 2 issues identified by theNRC in the GEIS and the environmental justice issue, and identified the followingunavoidable adverse impacts of renewing the operating licenses for St. Lucie Units 1 & 2:
• Some early life stages of fish and shellfish are entrained by the cooling water systemduring plant operation. The NRC has estimated that, under normal conditions, 0.4percent of the fish eggs and larvae passing the site could be entrained, andconcluded that entrainment losses would not represent a significant impact to localfisheries (see Section 4.2).
• Some fish and shellfish are impinged on the traveling screens at the St. Lucie Units1 & 2 Intake Wells. The NRC concluded that the combined estimates of Unit 1 andUnit 2 impingement would be insignificant when compared to local commerciallandings (see Section 4.3).
• Some fish and shellfish are entrained in the St. Lucie Units 1 & 2 intake structuresand become entrapped in the Intake Canal. Monitoring studies conducted duringearly years of plant operation did not document accumulation of these organisms inthe Canal, possibly because factors such as predation within the Canal operate tokeep numbers low. Some of the fish entrapped in the Intake Canal were commercialspecies, but these losses were negligible relative to the weight of commerciallandings (see Section 4.3).
• Some protected sea turtles enter the St. Lucie Units 1 & 2 Intake Canal. FPLimplements a highly effective program to capture turtles that have entered the IntakeCanal and to return them to the ocean; however, some losses do occur. Mortalitiesare closely monitored, and the National Marine Fisheries Service (NMFS) hasestablished permissible annual mortalities in an Incidental Take Statement (seeSection 4.6). FPL has modified plant design and procedures over the years tominimize impacts to sea turtles entrained in the Intake Canal. FPL further mitigatespotential adverse impacts to sea turtles by conducting sea turtle surveys and seaturtle nesting public awareness walks, and by participating in the Sea TurtleStranding and Salvage Network (see Sections 4.6 and 6.2).
• FPL does not expect to add additional staff for the license renewal period. However,for purposes of analysis, FPL assumed that license renewal could necessitateadding as many as 60 additional staff. The assumed addition of 60 direct workers toMartin and St. Lucie counties, where approximately 83 percent of the St. Lucie Units1 & 2 employees resides, could result in small impacts to housing availability, publicwater supplies, offsite land use, or transportation infrastructure (see Sections 4.9,
LICENSE RENEWAL APPLICATIONST. LUCIE UNITS 1 & 2
CHAPTER 6.0 SUMMARY OF LICENSE RENEWAL IMPACTS Page 6.3-2AND MITIGATING ACTIONS
4.10, 4.12.2, and 4.13). All of these impacts are small, and do not warrant furthermitigation.
LICENSE RENEWAL APPLICATIONST. LUCIE UNITS 1 & 2
CHAPTER 6.0 SUMMARY OF LICENSE RENEWAL IMPACTS Page 6.4-1AND MITIGATING ACTIONS
6.4 IRREVERSIBLE OR IRRETRIEVABLE RESOURCE COMMITMENTS
NRCThe environmental report shall discuss any “...irreversible and irretrievable commitments ofresources which would be involved in the proposed action should it be implemented...” 10CFR 51.45(b)(5) as adopted by 51.53(c)(2)
The continued operation of St. Lucie Units 1 & 2 for the license renewal term will result inirreversible and irretrievable resource commitments including:
• Nuclear fuel, which is utilized in the reactor and converted to radioactive waste;• Land required to permanently store, or dispose of this spent nuclear fuel and the low-
level radioactive wastes generated as a result of plant operations;
• Elemental materials that will become radioactive; and• Materials used for the normal industrial operations of the plant that cannot be
recovered or recycled or that are consumed or reduced to unrecoverable forms.
LICENSE RENEWAL APPLICATIONST. LUCIE UNITS 1 & 2
CHAPTER 6.0 SUMMARY OF LICENSE RENEWAL IMPACTS Page 6.5-1AND MITIGATING ACTIONS
6.5 SHORT-TERM USE VERSUS LONG-TERM PRODUCTIVITY OF THEENVIRONMENT
NRCThe environmental report shall discuss the “...relationship between local short-term uses ofman’s environment and the maintenance and enhancement of long-term productivity...” 10CFR 51.45(b)(4) as adopted by 51.53(c)(2)
The current balance between short-term use and long-term productivity of the environmentat the St. Lucie Units 1 & 2 site was basically set once the Units began operating in 1976and 1983, respectively. The U.S. Atomic Energy Commission (AEC) documented itsevaluations of this balance in its Final Environmental Statement (FES) for St. Lucie Unit 1(Ref. 6.5-1) and in its construction-phase FES for Unit 2 (Ref. 6.5-2). The latter evaluationwas subsequently reaffirmed by the NRC in its FES for the operation phase of Unit 2 (Ref.6.5-3). Of particular note in these evaluations was the conversion of approximately 300acres of land, mostly mangrove swamps that had been previously modified for mosquitocontrol, to facilities for electrical power generation. The AEC noted that upondecommissioning, much of the facility could be dismantled and restored to its originalcondition for the long term. The AEC also acknowledged in its Unit 1 evaluation that someadverse impacts on the marine environment from plant operation could occur, but would beappropriately monitored and mitigated, and thus were expected to be temporary andrepresent a potential short-term cost for production of electric power (Ref. 6.5-1).
FPL notes that the current balance is now well established, and can be expected to remainessentially unchanged by renewal of the operating licenses and extended operation of St.Lucie Units 1 & 2. Extended operation of the Units would postpone restoration of the siteand its potential availability for uses other than electrical power generation. It would alsoresult in other short-term impacts on the environment, all of which have been determined onthe basis of the NRC’s evaluation in the GEIS and FPL’s evaluation in this environmentalreport to be small. In addition, extended operation would enable FPL to continue its effortsto monitor sea turtle populations in the vicinity of the site, and carry out related mitigationactivities noted in Section 6.2.
LICENSE RENEWAL APPLICATIONST. LUCIE UNITS 1 & 2
CHAPTER 6.0 SUMMARY OF LICENSE RENEWAL IMPACTS Page 6.6-1AND MITIGATING ACTIONS
6.6 REFERENCES
6.2-1 Gleaves, W.C. (NRC) Letter to T.F. Plunkett (FPL). “St. Lucie Plant, Units 1and 2 – Issuance of Amendments Regarding the Environmental Protection Plans(TAC Nos. M99396, M99397, MA4605, and MA4606).” July 2, 1999.
6.5-1 U.S. Atomic Energy Commission. Final Environmental Statement Related to theSt. Lucie Plant Unit No. 1; Florida Power & Light Company. Docket No. 50-335.Directorate of Licensing. Washington, D.C. June 1973.
6.5-2 U.S. Atomic Energy Commission. Final Environmental Statement Related to theConstruction of St. Lucie Plant, Unit No. 2; Florida Power & Light Company.Docket No. 50-389. Directorate of Licensing. Washington, D.C. May 1974.
6.5-3 U.S. Nuclear Regulatory Commission. Final Environmental Statement Related tothe Operation of St. Lucie Plant, Unit No. 2; Florida Power & Light Company,Orlando Utilities Commission of the City of Orlando, Florida. Docket No. 50-389.NUREG-0842. Office of Nuclear Reactor Regulation. Washington, D.C.April 1982.
LICENSE RENEWAL APPLICATIONST. LUCIE UNITS 1 & 2
CHAPTER 7.0 ALTERNATIVES TO THE PROPOSED ACTION Page 7.0-1
7.0 ALTERNATIVES TO THE PROPOSED ACTION
NRCThe environmental report shall discuss “Alternatives to the proposed action.…” 10 CFR51.45(b)(3), as adopted by reference at 10 CFR 51.53(c)(2)“...The report is not required to include discussion of need for power or the economic costsand economic benefits of ... alternatives to the proposed action except insofar as such costsand benefits are either essential for a determination regarding the inclusion of an alternativein the range of alternatives considered or relevant to mitigation....” 10 CFR 51.53(c)(2)“While many methods are available for generating electricity, and a huge number ofcombinations or mixes can be assimilated to meet a defined generating requirement, suchexpansive consideration would be too unwieldy to perform given the purposes of thisanalysis. Therefore, NRC has determined that a reasonable set of alternatives should belimited to analysis of single, discrete electric generation sources and only electric generationsources that are technically feasible and commercially viable…” (Ref. 7.0-1, Section 8.1)“…The consideration of alternative energy sources in individual license renewal reviews willconsider those alternatives that are reasonable for the region, including power purchasesfrom outside the applicant’s service area.…” (Ref. 7.0-2, Section II.H, page 66541)
Florida Power & Light Company’s (FPL’s) evaluation of alternatives to St. Lucie Units 1 & 2license renewal is described in this Chapter. The evaluation includes an examination ofactions that FPL might take, and associated environmental impacts, if the U.S. NuclearRegulatory Commission (NRC) does not renew the plant operating licenses. It also includesa description of alternative actions that FPL has evaluated but determined to beunreasonable and presents the information upon which FPL bases that determination.
FPL divided its alternatives discussion into two categories: “no action” and “alternatives thatmeet system generating needs.” In determining the level of detail and analysis necessaryfor each category, FPL relied on the NRC decision-making standard for license renewal:
“…the NRC staff, adjudicatory officers, and Commission shall determine whether or notthe adverse environmental impacts of license renewal are so great that preserving theoption of license renewal for energy planning decision makers would be unreasonable.”[10 CFR 51.95(c)(4)]
FPL determined that as long as the environmental report provides information sufficient toclearly indicate whether an alternative would have a smaller, comparable, or greaterenvironmental impact than the proposed action, the document would support NRC decisionmaking. Providing additional detail or analysis would serve no function if it would only bringto light more adverse impacts of alternatives to license renewal. This approach is consistentwith regulations of the Council on Environmental Quality, which provide that theconsideration of alternatives (including the proposed action) devote substantial enoughtreatment that reviewers may evaluate their comparative merits [40 CFR 1502.14(b)].Therefore, FPL has generally limited its evaluation of alternatives to the level of detailsufficient to establish the basis for comparisons with impacts of the proposed action, whichare described in Chapter 4.
In characterizing environmental impacts from alternatives, FPL has used the samedefinitions of “SMALL,” “MODERATE,” and “LARGE” that are provided in the Chapter 4Introduction (see Section 4.1.2).
LICENSE RENEWAL APPLICATIONST. LUCIE UNITS 1 & 2
CHAPTER 7.0 ALTERNATIVES TO THE PROPOSED ACTION Page 7.1-1
7.1 NO-ACTION ALTERNATIVEFPL is using the phrase “no-action alternative” to refer to a scenario in which the NRC doesnot renew the St. Lucie Units 1 & 2 operating licenses. Components of this alternativeinclude replacing the generating capacity of St. Lucie Units 1 & 2, or otherwise meetingFPL’s generating needs, and decommissioning the facility as described below.
St. Lucie Units 1 & 2 supply approximately 1,678 megawatts (MW) of capacity to the FPLsystem and annually provide approximately 13.7 terawatt-hours of electricity to the grid thatsupplies electricity to Florida customers, including approximately ½-million households. FPLbelieves that any alternative would be unreasonable if it did not include replacing anequivalent amount of capacity in a way that would enable the FPL system to “make up” thisamount of annual energy. Replacement could be accomplished by (1) building newgenerating capacity, (2) purchasing power from outside the FPL system, or (3) reducingpower requirements through demand reduction. FPL provides a detailed description of eachof these possibilities in Section 7.2.1; Section 7.2.2 describes the environmental impactsthat would result from implementation of alternatives determined to be feasible.
The NRC, in its Generic Environmental Impact Statement for License Renewal of NuclearPlants (GEIS), i.e., NUREG-1437, defines decommissioning as the safe removal of anuclear facility from service and the reduction of residual radioactivity to a level that permitsrelease of the property for unrestricted use and termination of the license. Thedecommissioning options that the NRC evaluated in the GEIS include immediatedecontamination and dismantlement (DECON) and safe storage of the stabilized anddefueled facility (SAFSTOR) for a period of time, followed by decontamination anddismantlement. Regardless of the option chosen, decommissioning must be completedwithin a 60-year period (Ref. 7.0-1, Chapter 7). Under the no-action alternative, FPL wouldcontinue operating St. Lucie Units 1 & 2 until the current licenses expire, then initiatedecommissioning activities for both Units at the time of expiration of the Unit 2 license inaccordance with NRC requirements. The GEIS describes decommissioning activities basedon an evaluation of a reactor larger than St. Lucie Units 1 & 2 (the “reference” pressurized-water reactor is the 1,175-MW Trojan Nuclear Plant). This description boundsdecommissioning activities that FPL would conduct for St. Lucie Units 1 & 2.
As indicated in the GEIS, the NRC has evaluated environmental impacts fromdecommissioning. The impacts the NRC evaluated include occupational and public dose;impacts of waste management; and impacts to air, water, ecological, and socioeconomicresources. The NRC has indicated that the decommissioning environmental effects ofgreatest concern (i.e., radiation dose and releases to the environment) are substantially lessthan the same effects resulting from reactor operations (Ref. 7.1-1, page 4-15). FPL adoptsby reference the GEIS conclusions regarding environmental impacts of decommissioning.
FPL notes that decommissioning activities and their impacts are not discriminators betweenthe proposed action and the no-action alternative. FPL will have to decommission St. LucieUnits 1 & 2 regardless of the NRC decision on license renewal; license renewal would onlypostpone decommissioning for another 20 years. The NRC has established in the GEISthat the timing of decommissioning operations does not substantially influence theenvironmental impacts of decommissioning. FPL adopts by reference the NRC findings tothe effect that delaying decommissioning until after the renewal term would have small
LICENSE RENEWAL APPLICATIONST. LUCIE UNITS 1 & 2
CHAPTER 7.0 ALTERNATIVES TO THE PROPOSED ACTION Page 7.1-2
environmental impacts (10 CFR 51, Subpart A, Appendix B, Table B-1, “Decommissioning”).The discriminators between the proposed action and the no-action alternative lie within thechoice of generation replacement options that compose the no-action alternative. FPL’sanalysis of the impacts from these options is provided in Section 7.2.2.
FPL concludes that the decommissioning impacts under the no-action alternative would notbe substantially different from those that would occur following license renewal as identifiedin the GEIS. These impacts would be temporary and would occur at the same time as theimpacts from meeting system generating needs.
LICENSE RENEWAL APPLICATIONST. LUCIE UNITS 1 & 2
CHAPTER 7.0 ALTERNATIVES TO THE PROPOSED ACTION Page 7.2-1
7.2 ALTERNATIVES THAT MEET SYSTEM GENERATING NEEDSDecisions regarding reasonable alternatives for meeting electric reliability needs in Floridaare made primarily by two entities, utility companies and the Florida Public ServiceCommission (FPSC). The current mix of generation in Florida is one indicator of what theseentities believe have been and continue to be feasible alternatives within the State. Dataavailable at the time of this study show that Florida’s electric utility industry had a totalgenerating capability of 36.5 gigawatts-electric fueled by gas or oil dual fired (35 percent),coal (29 percent), oil (17 percent), nuclear (11 percent), gas (8 percent), and other, whichincludes hydroelectric, geothermal, biomass, wind, solar thermal, and photovoltaic(0.1 percent) (Ref. 7.2-1). Based on 1998 generation, utilization of this capability wasdominated by coal (39 percent), followed by oil (24 percent), gas (19 percent), nuclear(18 percent), and other (0.1 percent) (Ref. 7.2-1).
The differences between capability and utilization are reflections of preferential usageinfluenced primarily by the economics of dispatching the various types of units. Forexample, nuclear energy represented 11 percent of installed capability but produced 18percent of the electricity generated. This reflects the state’s preferential reliance on nuclearenergy as a baseload generating source. Figure 7.2-1 illustrates Florida utilities’ 1998generating capabilities and utilization.
Florida has experienced a drop in oil-fired generation that is at least partially attributable toFPSC Order 9552 and Rule 25-17.016, which the FPSC issued during the 1980s to reducereliance on oil as a generation fuel. The FPSC has since repealed the Rule and Order.
FPL’s generation utilization is slightly different than the State composite, reflecting a higherreliance on nuclear energy and a lower reliance on coal, as illustrated in Figure 7.2-2 for theyears 1998 and 2000. FPL’s Ten-Year Power Plant Site Plan: 2001-2010 provides detailedfuel and energy source forecasts through 2010 (Ref. 7.2-2).
7.2.1 ALTERNATIVES CONSIDERED
7.2.1.1 BUILD NEW GENERATING CAPACITY
The NRC indicated in the GEIS that while many methods are available for generatingelectricity and a huge number of combinations or mixes can be assimilated to meet systemneeds, such expansive consideration would be too unwieldy given the purposes of thealternatives analysis. Therefore, the NRC determined that a reasonable set of alternativesshould be limited to analysis of single, discrete electric generation sources and only electricgeneration technologies that are technically reasonable and commercially viable (Ref. 7.0-1,page 8-1). Consistent with the NRC determination, FPL has not evaluated mixes ofgenerating sources.
FPL periodically performs a rigorous evaluation of a wide variety of generating technologiesand annually evaluates what it considers to be the most viable options. FPL’s lastevaluation of a wide variety of generating technologies took place in 1991. The evaluationconsidered not only commercially existing supply technologies, but also emergingtechnologies that might prove to be feasible later on. The 38 generation options FPLevaluated and the evaluation results are summarized in Table 7.2-1.
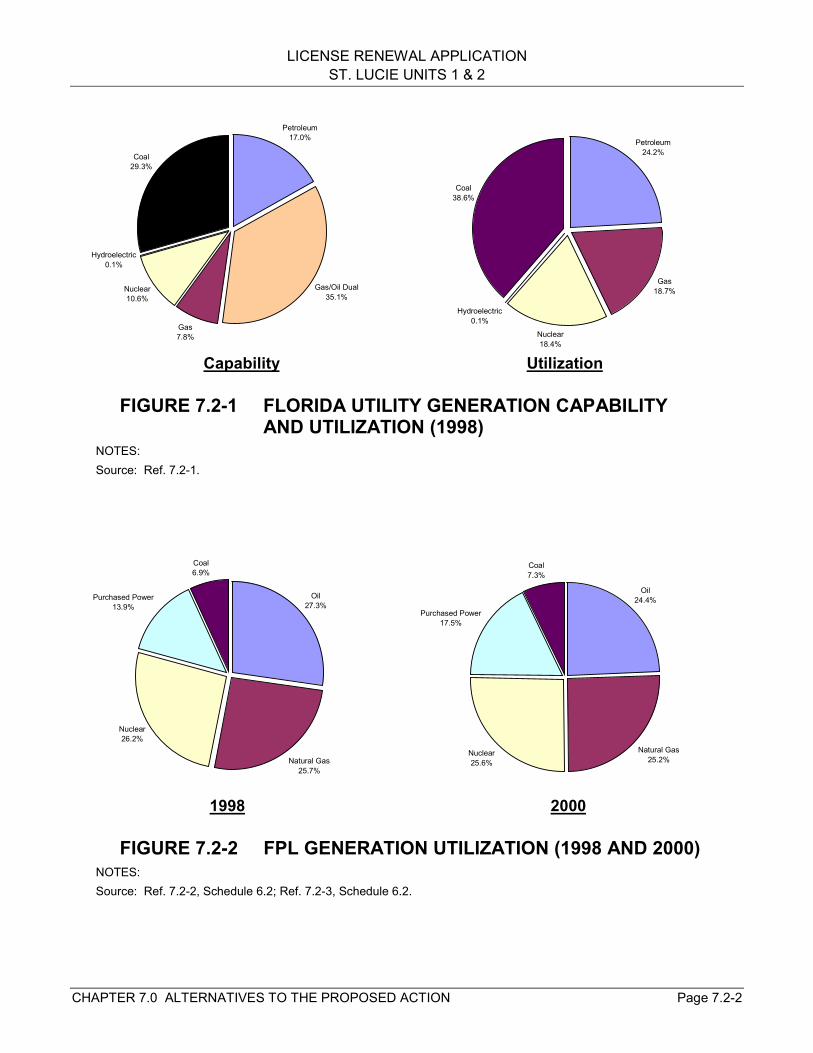
LICENSE RENEWAL APPLICATIONST. LUCIE UNITS 1 & 2
CHAPTER 7.0 ALTERNATIVES TO THE PROPOSED ACTION Page 7.2-2
Capability Utilization
FIGURE 7.2-1 FLORIDA UTILITY GENERATION CAPABILITYAND UTILIZATION (1998)
NOTES:Source: Ref. 7.2-1.
1998 2000
FIGURE 7.2-2 FPL GENERATION UTILIZATION (1998 AND 2000)NOTES:Source: Ref. 7.2-2, Schedule 6.2; Ref. 7.2-3, Schedule 6.2.
Petroleum24.2%
Gas18.7%
Nuclear18.4%
Hydroelectric0.1%
Coal38.6%
Oil 27.3%
Natural Gas25.7%
Nuclear26.2%
Purchased Power13.9%
Coal6.9%
Oil 24.4%
Natural Gas25.2%
Nuclear25.6%
Purchased Power17.5%
Coal7.3%
Petroleum17.0%
Gas/Oil Dual35.1%
Gas7.8%
Nuclear10.6%
Hydroelectric0.1%
Coal29.3%
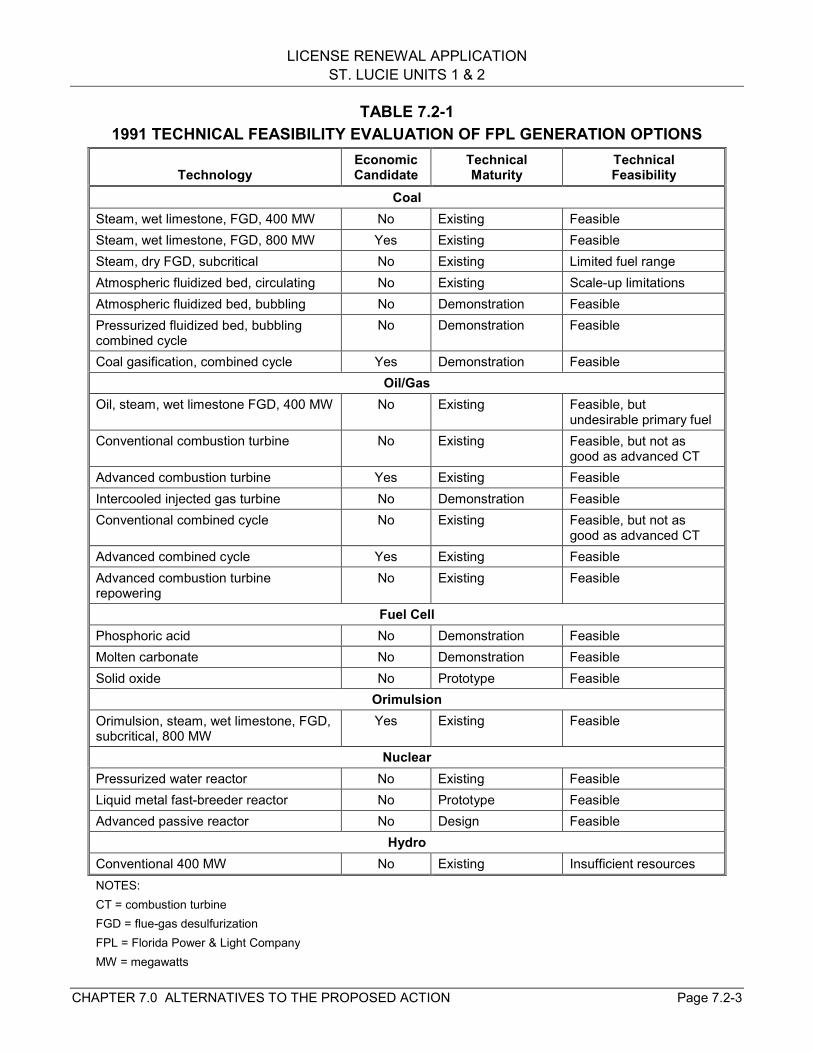
LICENSE RENEWAL APPLICATIONST. LUCIE UNITS 1 & 2
CHAPTER 7.0 ALTERNATIVES TO THE PROPOSED ACTION Page 7.2-3
TABLE 7.2-11991 TECHNICAL FEASIBILITY EVALUATION OF FPL GENERATION OPTIONS
TechnologyEconomicCandidate
TechnicalMaturity
TechnicalFeasibility
CoalSteam, wet limestone, FGD, 400 MW No Existing FeasibleSteam, wet limestone, FGD, 800 MW Yes Existing FeasibleSteam, dry FGD, subcritical No Existing Limited fuel rangeAtmospheric fluidized bed, circulating No Existing Scale-up limitationsAtmospheric fluidized bed, bubbling No Demonstration FeasiblePressurized fluidized bed, bubblingcombined cycle
No Demonstration Feasible
Coal gasification, combined cycle Yes Demonstration FeasibleOil/Gas
Oil, steam, wet limestone FGD, 400 MW No Existing Feasible, butundesirable primary fuel
Conventional combustion turbine No Existing Feasible, but not asgood as advanced CT
Advanced combustion turbine Yes Existing FeasibleIntercooled injected gas turbine No Demonstration FeasibleConventional combined cycle No Existing Feasible, but not as
good as advanced CTAdvanced combined cycle Yes Existing FeasibleAdvanced combustion turbinerepowering
No Existing Feasible
Fuel CellPhosphoric acid No Demonstration FeasibleMolten carbonate No Demonstration FeasibleSolid oxide No Prototype Feasible
OrimulsionOrimulsion, steam, wet limestone, FGD,subcritical, 800 MW
Yes Existing Feasible
NuclearPressurized water reactor No Existing FeasibleLiquid metal fast-breeder reactor No Prototype FeasibleAdvanced passive reactor No Design Feasible
HydroConventional 400 MW No Existing Insufficient resourcesNOTES:CT = combustion turbineFGD = flue-gas desulfurizationFPL = Florida Power & Light CompanyMW = megawatts
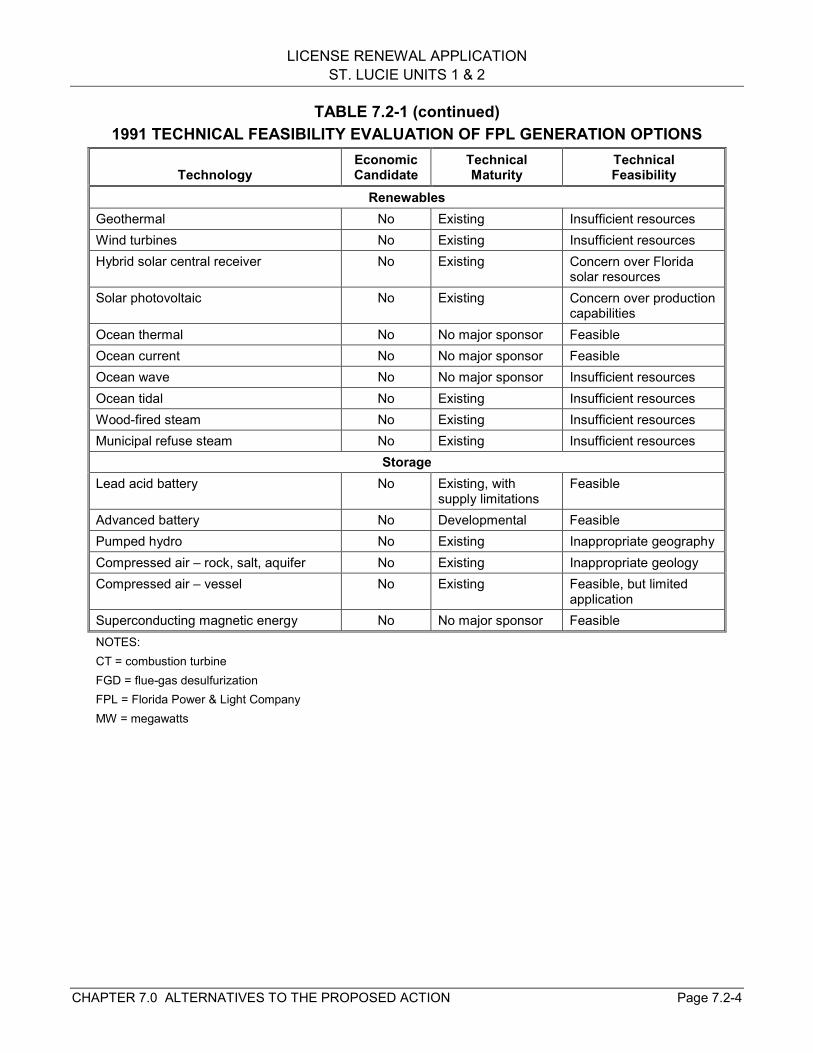
LICENSE RENEWAL APPLICATIONST. LUCIE UNITS 1 & 2
CHAPTER 7.0 ALTERNATIVES TO THE PROPOSED ACTION Page 7.2-4
TABLE 7.2-1 (continued)1991 TECHNICAL FEASIBILITY EVALUATION OF FPL GENERATION OPTIONS
TechnologyEconomicCandidate
TechnicalMaturity
TechnicalFeasibility
RenewablesGeothermal No Existing Insufficient resourcesWind turbines No Existing Insufficient resourcesHybrid solar central receiver No Existing Concern over Florida
solar resourcesSolar photovoltaic No Existing Concern over production
capabilitiesOcean thermal No No major sponsor FeasibleOcean current No No major sponsor FeasibleOcean wave No No major sponsor Insufficient resourcesOcean tidal No Existing Insufficient resourcesWood-fired steam No Existing Insufficient resourcesMunicipal refuse steam No Existing Insufficient resources
StorageLead acid battery No Existing, with
supply limitationsFeasible
Advanced battery No Developmental FeasiblePumped hydro No Existing Inappropriate geographyCompressed air – rock, salt, aquifer No Existing Inappropriate geologyCompressed air – vessel No Existing Feasible, but limited
applicationSuperconducting magnetic energy No No major sponsor FeasibleNOTES:CT = combustion turbineFGD = flue-gas desulfurizationFPL = Florida Power & Light CompanyMW = megawatts
LICENSE RENEWAL APPLICATIONST. LUCIE UNITS 1 & 2
CHAPTER 7.0 ALTERNATIVES TO THE PROPOSED ACTION Page 7.2-5
Of the nine alternative generation options that the NRC evaluated in the GEIS (wind, solarphotovoltaic, solar thermal power, hydroelectric, geothermal, wood waste, municipal solidwaste, energy crops, and advanced light-water reactor), the FPL study addressed all butenergy crops. The NRC analyzed these latter two technologies for the Calvert Cliffs,Oconee, Arkansas Nuclear One, and Plant Hatch license renewals (Ref. 7.2-4, Section8.2.4; Ref. 7.2-5, Section 8.2.4; Ref. 7.2-6, Section 8.2.4; Ref. 7.2-7, Section 8.2.4). TheNRC indicated that energy crop technology is not currently competitive or reliable enoughfor large baseload applications. FPL is unaware of any new information that would changethis assessment and also concludes that this technology is not a reasonable alternative toSt. Lucie Units 1 & 2 license renewal.
Similarly, the NRC cited relatively high costs and political uncertainties as reasons why newnuclear power plants were not forecasted to be built in the U.S. in the foreseeable future.Although both industry and government have recently expressed positive interest in thedevelopment of new nuclear power plants, new reactor designs have not yet beendemonstrated to be capable of being built at a sufficiently attractive capital cost. Therefore,FPL does not consider nuclear power to be a reasonable alternative to St. Lucie Units 1 & 2license renewal.
Table 7.2-2 presents the types of generating units examined by FPL in its annual review ofalternative generation options. That analysis resulted in the preferred generation expansionplan presented in FPL’s Ten Year Power Plant Site Plan: 2001-2010 (Ref. 7.2-2, pages 5-8). As shown, the FPL review has focused on constructing coal- and gas-fired units andrepowering existing units. Consistent with Table 7.2-2, FPL has evaluated one coal-firedtechnology, pulverized coal, and one gas-fired technology, combined cycle, as potentialalternatives to St. Lucie Units 1 & 2 license renewal. In addition, FPL has evaluated oil-firedsteam technology. Although FPL believes this presently to be an economically infeasiblealternative (see Table 7.2-1), FPL has evaluated this option because of the unpredictabilityin the future price of oil relative to other fuel options, and because use of oil-fired generationmay be advisable to provide the diversity of generation/fuel sources needed to ensureneeded reliability in the future. FPL describes these alternatives in more detail in thefollowing sections.
FPL has implemented a program of repowering existing units in order to meet its currentpredictions of load growth. “Repowering” means converting existing generating technologyto combined-cycle technology. FPL has evaluated combined-cycle technology as onealternative to St. Lucie Units 1 & 2 license renewal, and believes that it appropriatelyrepresents repowering as an alternative. Therefore, FPL has not separately evaluatedrepowering as an alternative to St. Lucie Units 1 & 2 license renewal.
Generation capacity changes in the FPL system planned for 2001 through 2010 areprojected to add 6,392 MW (summer) to 6,299 MW (winter) (Ref. 7.2-2, Section III.B).These changes reflect changes to existing units, scheduled changes in the deliveredamounts of purchased power, repowering of existing units, new unit construction, andconversion of combustion turbine units to combined-cycle units. Since these generationcapacity changes have been credited in FPL’s Ten-Year Power Plant Site Plan: 2001-2010as necessary to meet projected customer demand and reserve margins (Ref. 7.2-2,Schedule 7.1), the capacity gains are not available to replace St. Lucie Units 1 & 2 capacity.
LICENSE RENEWAL APPLICATIONST. LUCIE UNITS 1 & 2
CHAPTER 7.0 ALTERNATIVES TO THE PROPOSED ACTION Page 7.2-6
TABLE 7.2-22000 TECHNICAL FEASIBILITY EVALUATION OF FPL GENERATION OPTIONS
TechnologyEconomicCandidate
TechnicalMaturity
TechnicalFeasibility
CoalCirculating fluidized bed, 400 MW Yes Existing FeasiblePulverized coal, 400 MW Yes Existing Feasible
Oil/GasCombined cycle, H Machine, 400 MW Yes Design FeasibleCombined cycle, G Machine, 300 MW Yes Existing FeasibleCombined cycle, H Machine, 800 MW Yes Design FeasibleCombustion turbine, 150 MW Yes Existing FeasibleCombined cycle, F Machine, 500 MW Yes Existing FeasibleRepowering of existing steam units Yes Existing FeasibleNOTES:FPL = Florida Power & Light CompanyMW = megawatt
A discussion of fossil-fuel-fired generation and imported power as reasonable alternatives tolicense renewal follows. Due to the need to have “replacement” fossil-fuel generatingfacilities in operation on the date the St. Lucie Units 1 & 2 facility would cease operation andthe small amount of potentially usable space at the St. Lucie site, FPL made theassumption that all of the replacement units would be constructed at presently unknown“greenfield” sites in central Florida, generally in the area south of Orlando and north ofMiami.
FPL owns 100 percent of the St. Lucie Unit 1 capacity, but 15 percent of the capacity ofSt. Lucie Unit 2 is contractually obligated to entities in Florida other than FPL. A denial ofthe St. Lucie Units 1 & 2 license renewal request would nonetheless result in the need toreplace 100 percent of the capacity of both Units. Therefore, FPL has assumed for thisevaluation that the entire capacity of St. Lucie Units 1 & 2 would be replaced.
7.2.1.1.1 COAL-FIRED GENERATION
A scenario of, for example, four 420-MW coal-fired units could be assumed to replace the1,678-MW St. Lucie Units 1 & 2 capacity. However, FPL’s experience indicates thatalthough customized unit sizes can be built, using standardized sizes is more economical.As Table 7.2-2 shows, FPL has recently evaluated a 400-MW coal-fired unit. Assuming four400-MW units, for a total of 1,600 MW, would result in slightly less generating capacity thana one-for-one replacement of St. Lucie Units 1 & 2. Assuming five 400-MW units, for a totalof 2,000 MW, would result in excess capacity. In order to avoid overestimatingenvironmental impacts from the coal-fired generation alternative, FPL evaluated analternative that consists of four 400-MW coal-fired units.
Table 7.2-3 presents the basic coal-fired generation alternative and associated emissioncontrol characteristics. FPL based its emission control technology and percentage control
LICENSE RENEWAL APPLICATIONST. LUCIE UNITS 1 & 2
CHAPTER 7.0 ALTERNATIVES TO THE PROPOSED ACTION Page 7.2-7
TABLE 7.2-3COAL-FIRED GENERATION ALTERNATIVE
Characteristic Basis
Unit size = 400-MW ISO rating neta Standard size (FPL experience)
Unit size = 424-MW ISO rating grossa Calculated based on 6 percent onsite power usage(FPL experience): 400 MW x 1.06
Number of units = 4 Calculated to be < St. Lucie Units 1 & 2 net capacityof 1,678 MW
Boiler type = tangentially fired, dry-bottom Minimizes nitrogen oxides emissions (Ref. 7.2-8,Table 1.1-3)
Fuel type = bituminous, pulverized coal Typical for coal used in Florida (FPL experience)
Fuel heating value = 12,116 Btu/lb Typical for coal used in Florida - 1999 (Ref. 7.2-9)
Fuel ash content by weight = 8.0 percent Typical for coal used in Florida - 1999 (Ref. 7.2-9)
Fuel sulfur content by weight = 1.63 percent Typical for coal used in Florida - 1999 (Ref. 7.2-9)
Heat rate = 9,800 Btu/kWh Typical for coal-fired steam turbine generators (FPLexperience)
Capacity factor = 0.9 Typical for large coal-fired units (FPL experience)
NOx control = low NOx burners, overfire air,selective catalytic reduction (95 percent reduction)
Best available for minimizing NOx emissions(Ref. 7.2-8, Section 1.1.4.3 and Table 1.1-2).
Particulate control = fabric filters or electrostaticprecipitators (99.9 percent removal efficiency)
Best available for minimizing particulate emissions(Ref. 7.2-8, Section 1.1.4.1)
SOx control = Wet limestone flue-gasdesulfurization (90 percent removal efficiency)
Best available for minimizing SOx emissions(Ref. 7.2-8, Section 1.1.4.2 and Table 1.1-1)
NOTES:a. The difference between “net” and “gross” is electricity consumed on site.Btu = British thermal unitFPL = Florida Power & Light CompanyISO rating = International Standards Organization rating at standard atmospheric conditions of 59°F, 60 percent relative humidity, and 14.696 pounds of atmospheric pressure per square inchkWh = kilowatt hourlb = pound(s)MW = megawattsNOx = nitrogen oxidesRef. = ReferenceSOx = sulfur oxides
LICENSE RENEWAL APPLICATIONST. LUCIE UNITS 1 & 2
CHAPTER 7.0 ALTERNATIVES TO THE PROPOSED ACTION Page 7.2-8
assumptions on alternatives that the U.S. Environmental Protection Agency (EPA) hasidentified as being available for minimizing emissions (Ref. 7.2-8). A pulverized coal-fireddesign for this alternative would likely utilize precipitators and, at inland sites with anadequate freshwater supply, wet scrubbers. Coal and limestone (or lime) would bedelivered by rail, or possibly barge at coastal locations, to the greenfield site. Additionaloffsite facilities that could be required for this alternative include transmission lines toconnect the plant to the grid and cooling water intake and discharge pipelines (see Section7.2.2).
7.2.1.1.2 OIL-FIRED GENERATION
Use of oil as an energy source for power generation in Florida has declined since the late-1980s (Ref. 7.2-1), due in part to past FPSC policies that encouraged alternatives thatminimized use of oil as a generation fuel, and in part by economic considerations. In orderto make the oil-fired generation alternative most directly comparable to the coal- and gas-fired generation alternatives, FPL assumed four 400-MW units. The basic oil-firedgeneration alternative characteristics are presented in Table 7.2-4. As is the case for thecoal-fired generation alternative, FPL assumed construction at a greenfield site in centralFlorida, but assumed fuel would be delivered by barge and, for inland sites, pipelines.
Additional offsite facilities that could be required for this alternative include transmissionlines to connect the plant to the grid and cooling water intake and discharge pipelines (seeSection 7.2.2).
FPL has assumed a capacity factor for the oil-fired generation alternative, 90 percent, that isthe same as that for the coal- and gas-fired generation alternatives. This assumption makesthe three alternatives most directly comparable. However, FPL notes that, from a practicalstandpoint, the oil-fired utilization would probably be closer to 50 percent. This reducedutilization would be a reflection of the high cost of fuel oil rather than any limitation inherentin the technology. The utility might choose to operate other technologies or purchase powerbefore using the oil-fired generation alternative. However, FPL has addressed the impactsof other technologies (i.e., gas- and coal-fired generation) and power purchase in itsalternatives analysis.
7.2.1.1.3 GAS-FIRED GENERATION
As previously discussed for coal-fired generation, FPL experience indicates thatstandardized gas-fired unit sizes are available and are more economical than customizedunit sizes. FPL has analyzed three 596-MW gas-fired combined-cycle units located at agreenfield site in central Florida. These units correspond to the 500-MW “F-Machine” listedin Table 7.2-2, but are configured for duct-firing to more readily accommodate changes indemand.
The total net capability of the units (1,788 MW), more fully described in Table 7.2-5, wouldbe slightly higher than the combined capability of St. Lucie Units 1 & 2 (1,680 MW) when allthree units are duct-fired. It is unclear what pollution control equipment would be required forthese units in 2016, when St. Lucie Unit 1 would be replaced. However, for purposes of thisanalysis, dry-low nitrogen oxides (NOx) combustors or water-steam injection and selectivecatalytic reduction for NOx control are assumed.
LICENSE RENEWAL APPLICATIONST. LUCIE UNITS 1 & 2
CHAPTER 7.0 ALTERNATIVES TO THE PROPOSED ACTION Page 7.2-9
TABLE 7.2-4OIL-FIRED GENERATION ALTERNATIVE
Characteristic BasisUnit size = 400-MW ISO rating neta Standard size (FPL experience)Unit size = 416-MW ISO rating grossa Calculated based on 4 percent onsite power usage
(FPL experience): 400 MW x 1.04Number of units = 4 Calculated to be < St. Lucie Units 1 & 2 net capacity
of 1,678 MWFuel type = No. 6 fuel oil Typical for oil-fired units in Florida (FPL experience)Fuel heating value = 151,705 Btu/gal Typical for No. 6 fuel oil used in Florida - 1999
(Ref. 7.2-9)Fuel ash content by weight = 0.21 percent Typical for No. 6 fuel oil (calculated from
uncontrolled emission factor for particulates fromRef. 7.2-10, Table 1.3-4; density of residual oil fromRef. 7.2-11, page A-6)b
Fuel sulfur content by weight = 1.45 percent Typical for No. 6 fuel oil used in Florida - 1999(Ref. 7.2-9)
Heat rate = 9,800 Btu/kWh Typical for fuel-oil-fired steam turbine generators(FPL experience)
Capacity factor = 0.9 Typical for large oil-fired units (FPL experience)NOx control = low NOx burners; selective catalyticreduction (85 percent reduction)
Best available for minimizing NOx emissions(Ref. 7.2-10, Section 1.3.4.3)
Particulate control = fabric filters (99 percentremoval efficiency)
Best available for minimizing particulate emissions(Ref. 7.2-10, Section 1.3.4.1)
SOx control = Wet limestone flue-gasdesulfurization (90 percent removal efficiency)
Best available for minimizing SOx emissions(Ref. 7.2-10, Section 1.3.4.2)
NOTES:a. The difference between “net” and “gross” is electricity consumed on site.b. Percent Ash (assumed approx. = percent particulates) = 8.3A lb/1000 gal x 1gal/7.88 lb x 100, where A = 1.12 x
percent sulfur by weight + 0.37. Therefore: Percent Ash = 8.3 x [1.12 x 1.45 + 0.37] x 1/7.88 x 100 = 0.21.Btu = British thermal unitFPL = Florida Power & Light Companygal = gallonISO rating = International Standards Organization rating at standard atmospheric conditions of 59°F, 60 percent relative humidity, and 14.696 pounds of atmospheric pressure per square inchkWh = kilowatt hourlb = poundMW = megawattNOx = nitrogen oxidesRef. = ReferenceSOx = sulfur oxides
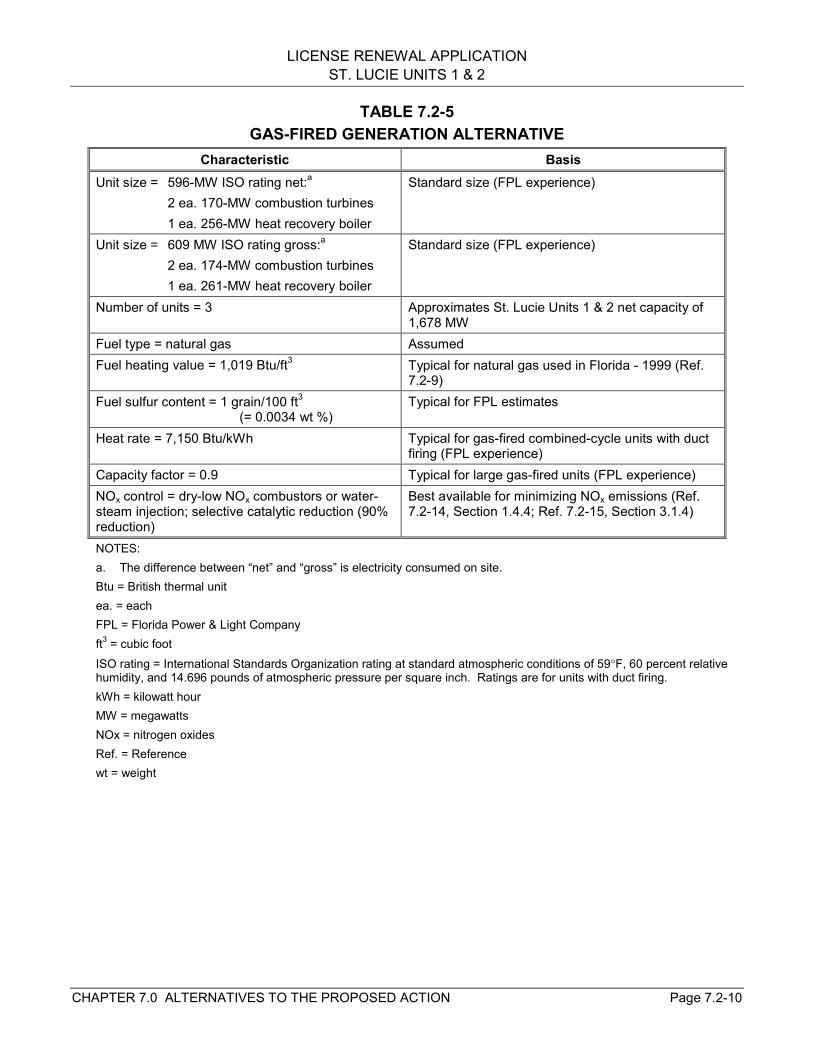
LICENSE RENEWAL APPLICATIONST. LUCIE UNITS 1 & 2
CHAPTER 7.0 ALTERNATIVES TO THE PROPOSED ACTION Page 7.2-10
TABLE 7.2-5GAS-FIRED GENERATION ALTERNATIVE
Characteristic BasisUnit size = 596-MW ISO rating net:a
2 ea. 170-MW combustion turbines1 ea. 256-MW heat recovery boiler
Standard size (FPL experience)
Unit size = 609 MW ISO rating gross:a
2 ea. 174-MW combustion turbines1 ea. 261-MW heat recovery boiler
Standard size (FPL experience)
Number of units = 3 Approximates St. Lucie Units 1 & 2 net capacity of1,678 MW
Fuel type = natural gas AssumedFuel heating value = 1,019 Btu/ft3 Typical for natural gas used in Florida - 1999 (Ref.
7.2-9)Fuel sulfur content = 1 grain/100 ft3
(= 0.0034 wt %)Typical for FPL estimates
Heat rate = 7,150 Btu/kWh Typical for gas-fired combined-cycle units with ductfiring (FPL experience)
Capacity factor = 0.9 Typical for large gas-fired units (FPL experience)NOx control = dry-low NOx combustors or water-steam injection; selective catalytic reduction (90%reduction)
Best available for minimizing NOx emissions (Ref.7.2-14, Section 1.4.4; Ref. 7.2-15, Section 3.1.4)
NOTES:a. The difference between “net” and “gross” is electricity consumed on site.Btu = British thermal unitea. = eachFPL = Florida Power & Light Companyft3 = cubic footISO rating = International Standards Organization rating at standard atmospheric conditions of 59°F, 60 percent relative humidity, and 14.696 pounds of atmospheric pressure per square inch. Ratings are for units with duct firing.kWh = kilowatt hourMW = megawattsNOx = nitrogen oxidesRef. = Referencewt = weight
LICENSE RENEWAL APPLICATIONST. LUCIE UNITS 1 & 2
CHAPTER 7.0 ALTERNATIVES TO THE PROPOSED ACTION Page 7.2-11
It is currently unclear whether adequate supplies of natural gas would be available in centralFlorida for a large consumptive facility such as the St. Lucie Units 1 & 2 gas-fired generationalternative. Demand is expected to exceed current capacity in the near future; however, thecurrent main supplier to Florida’s utilities, Florida Gas Transmission (FGT), has indicated itwould expand its natural gas pipeline system, which has a current capacity of 1.5 billioncubic feet per day (bcf/day), to meet all forecasted electric demand (Ref. 7.2-12, page 15).In addition, a major new supply pipeline is being constructed to meet demand in this area ofFlorida, the Williams-Duke Gulfstream Natural Gas System “Gulfstream” project. Thisproject, recently approved, is projected to provide an additional 1.1 bcf/day in Phase Icapacity to Florida through pipelines from Pascagoula, Mississippi, and Mobile, Alabama,across the Gulf of Mexico some 400 miles to near Tampa, Florida, then to interior Florida(Ref. 7.2-13). This project is expected to be completed by June 2002, and would meetdemands for many years. However, FPL assumes that if sufficient capacity is not available,demand posed by the gas-fired generation alternative could contribute to a decision toconstruct an additional pipeline similar to the Gulfstream project or development of anyalternate means of ensuring adequate supply.
In any event, FPL assumes that a natural gas pipeline from a main supply line would have tobe constructed to implement this alternative. Additional offsite facilities that could berequired include transmission lines to connect the plant to the grid and cooling water intakeand discharge pipelines (see Section 7.2.2).
7.2.1.2 PURCHASE POWER
FPL currently has contracts (some extending through 2026) with a number of cogeneration,small power-production facilities, and other utilities to purchase firm capacity and energy(Ref. 7.2-2, Sections 1.B and 1.D). A cogeneration facility simultaneously produceselectrical and thermal energy, with the thermal energy being used for industrial, commercial,or cooling and heating purposes. A small power-production facility does not (withoutexemption) exceed 80-MW capacity and uses renewable resources as its primary energysource. Because these contracts are part of FPL’s current and future capacity and nosubstantial new capacity additions from cogeneration facilities are foreseen in the non-utilitygeneration sector, FPL does not consider such power purchases a feasible option for thepurchase-power alternative.
Florida is a net importer of power (Ref. 7.2-1) and, as Figure 7.2-2 shows, power purchaseis a substantial portion of the FPL energy mix. FPL plans to contract the purchase ofapproximately 1,300-2,400 megawatts of capacity annually, much of which is coal-fired, tomeet projected customer demand through mid-year 2010 (Ref. 7.2-2, Section 1.0). FPLpresumes that this capacity might be available for purchase after the year 2010, and couldbe imported to the region to meet demand. However, because FPL is using it to meetcurrently projected demand, FPL could not rely on this power purchase as an alternative toSt. Lucie Units 1 & 2 license renewal. Therefore, FPL assumes that the capacity for thepurchase-power alternative would come from other sources. FPL also assumes that thegenerating technology for the purchase-power alternative would be one of those that theNRC analyzed in the GEIS. For this reason, FPL is adopting by reference, asrepresentative of the purchase-power alternative, the GEIS description of the alternativegenerating technologies.
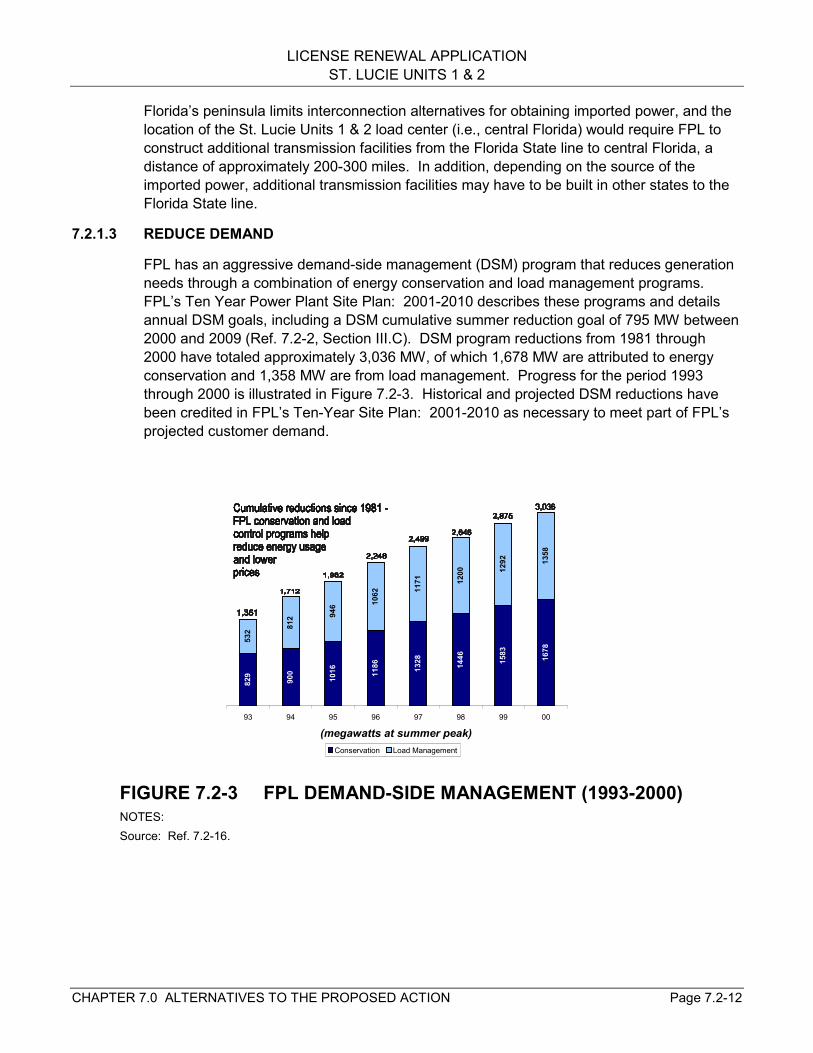
LICENSE RENEWAL APPLICATIONST. LUCIE UNITS 1 & 2
CHAPTER 7.0 ALTERNATIVES TO THE PROPOSED ACTION Page 7.2-12
Florida’s peninsula limits interconnection alternatives for obtaining imported power, and thelocation of the St. Lucie Units 1 & 2 load center (i.e., central Florida) would require FPL toconstruct additional transmission facilities from the Florida State line to central Florida, adistance of approximately 200-300 miles. In addition, depending on the source of theimported power, additional transmission facilities may have to be built in other states to theFlorida State line.
7.2.1.3 REDUCE DEMAND
FPL has an aggressive demand-side management (DSM) program that reduces generationneeds through a combination of energy conservation and load management programs.FPL’s Ten Year Power Plant Site Plan: 2001-2010 describes these programs and detailsannual DSM goals, including a DSM cumulative summer reduction goal of 795 MW between2000 and 2009 (Ref. 7.2-2, Section III.C). DSM program reductions from 1981 through2000 have totaled approximately 3,036 MW, of which 1,678 MW are attributed to energyconservation and 1,358 MW are from load management. Progress for the period 1993through 2000 is illustrated in Figure 7.2-3. Historical and projected DSM reductions havebeen credited in FPL’s Ten-Year Site Plan: 2001-2010 as necessary to meet part of FPL’sprojected customer demand.
FIGURE 7.2-3 FPL DEMAND-SIDE MANAGEMENT (1993-2000)NOTES:Source: Ref. 7.2-16.
829
900
1016 11
86 1328 1446 15
83
1678
532 81
2 946 10
62 1171 12
00 1292 13
58
93 94 95 96 97 98 99 00
(megawatts at summer peak)Conservation Load Management
LICENSE RENEWAL APPLICATIONST. LUCIE UNITS 1 & 2
CHAPTER 7.0 ALTERNATIVES TO THE PROPOSED ACTION Page 7.2-13
In theory, additional DSM could be found in FPL's service territory, which would, in total or inpart, replace the resources lost if the St. Lucie Units 1 & 2 licenses were not renewed. FPLcan only ascertain the actual feasibility of additional DSM with a detailed economic-basedstudy, which would determine how much money would be cost-effective to spend on DSMversus other options such as license renewal or acquiring replacement generation capacity.Once this amount of money was established, FPL could determine the market potential ofDSM that could reasonably be achieved with these expenditures. FPL has not performedsuch an economic analysis of this specific issue.
However, FPL has performed relevant environmental analyses of DSM versus newgenerating units that provide valuable insight into how DSM would compare with licenserenewal of a nuclear power unit from an environmental perspective. These analyses, whichfocused on total air emissions from the FPL system, looked at whether total systememissions would be greater with the addition of new units or with the addition of DSM tomeet FPL's new resource needs. The results of these analyses have consistently shownthat FPL's total system emissions would be higher if DSM were chosen instead of newbaseload units, particularly so if the new baseload units were gas-fired. This result is drivenby two primary factors: the relatively low “capacity factor” of DSM compared to that ofbaseload units, and the significantly lower emission rates of new baseload units comparedto those of FPL's existing units. Based on these results, it is expected that a similar analysisthat focused on additional DSM versus the continued operation of a baseload nuclear powerunit (which has even lower emissions than a new gas-fired unit) would show that DSM as areplacement for this nuclear power capacity would be an even worse choice from an air-emissions perspective. Consequently, from an environmental perspective, additional DSMis not considered to be a viable alternative to the license renewal and continued operation ofSt. Lucie Units 1 & 2.
7.2.2 ENVIRONMENTAL IMPACTS OF ALTERNATIVES
In this section, FPL evaluates the feasible alternatives to St. Lucie Units 1 & 2 licenserenewal that were presented in Section 7.2.1.1 (i.e., development of new coal-, oil-, or gas-fired generating capacity at hypothetical greenfield sites in central Florida, and purchase ofpower from other suppliers). FPL has made the following common assumptions to facilitateits evaluation of new generation alternatives presented in Sections 7.2.2.1 through 7.2.2.3,and to establish development scenarios that are reasonable and do not overstate potentialadverse impacts of these alternatives relative to the proposed action:
• The new generating capacity would be developed as a single multi-unit site ratherthan multiple sites. Location of multiple units at a single site is standard utilitypractice that offers economies through the use of shared facilities and resources,and minimizes the amount of land required.
• The new generating capacity would be developed with closed-cycle cooling usingmechanical draft cooling towers. This cooling scheme is commonly used for newpower plants and broadens the potential availability of potentially acceptablegreenfield sites for purposes of the evaluation.
• The new generating capacity would be phased as needed to replace the capacity ofSt. Lucie Unit 1 in 2016, and Unit 2 in 2023.
LICENSE RENEWAL APPLICATIONST. LUCIE UNITS 1 & 2
CHAPTER 7.0 ALTERNATIVES TO THE PROPOSED ACTION Page 7.2-14
• The new generating capacity would operate for 25-40 years. Design lives of 25 yearsfor gas-fired units and 40 years for coal-fired units are commonly assumed by theutility industry. Based on economic considerations, FPL would not commit to buildand operate new baseload units for only 20 years, the period of extended operationof St. Lucie Units 1 & 2.
• The hypothetical greenfield site would be located on the basis of a siting analysisthat would ensure it is within reasonable distance to an acceptable source of coolingwater and the transmission grid, and would avoid areas of obviously conflicting landuse or resource value (e.g., residential areas, formally designated natural andcultural resource areas). It is specifically assumed for these analyses that the sitewould be located:o in central Florida in the area generally north of Miami and south of Orlando,o close enough to a coastal or inland water body suitable as a cooling water
source, precluding the necessity to construct a cooling pond,o within approximately 20 miles from suitable interconnection to the grid [a 330-foot
transmission line right-of-way (ROW) is assumed, based on that currently usedfor transmission lines from St. Lucie Units 1 & 2], and
o on land where development can be essentially restricted to areas that have beenpreviously disturbed (e.g., through agriculture, logging, industrial development).
7.2.2.1 COAL-FIRED GENERATION
As discussed in Section 7.2.1.1, FPL’s reference coal-fired generation alternative for thisevaluation consists of a four-unit pulverized coal-fired plant. Basic specifications for thegenerating units, fuel, and air emissions controls are provided in Table 7.2-3. In addition tothe general assumptions stated above, FPL assumes for purposes of this evaluation thatlimestone used for scrubber operation and coal would be delivered by rail or possibly bargeat coastal sites or by rail at inland sites. FPL’s evaluation is based, in part, on informationprovided by the NRC in the GEIS (Ref. 7.0-1, Chapter 8) and GEIS supplements (Ref. 7.2-4,Section 8.2.1; Ref. 7.2-5, Section 8.2.1), which reference utility plans for modern pulverizedcoal-fired plants comparable to FPL’s representative plant.
7.2.2.1.1 LAND USE
The amount of land required to accommodate the representative coal-fired power plantalternative can vary widely from site to site, depending on such factors as facilityconfiguration, and the need for onsite disposal of site clearing debris or buffer areas as maybe appropriate for isolation from adjacent land uses (e.g., visual screening) or protection ofnatural resources (e.g., wetlands). Based on estimates for power generating and supportfacilities cited by the NRC for a comparable three-unit, 1,800-MW new facility (Ref. 7.2-4)and calculated area requirements for onsite waste disposal, FPL estimates thatapproximately 1,155 acres would be required for the plant site. Estimated onsite landrequirements and possible land requirements for offsite facilities are as follows:
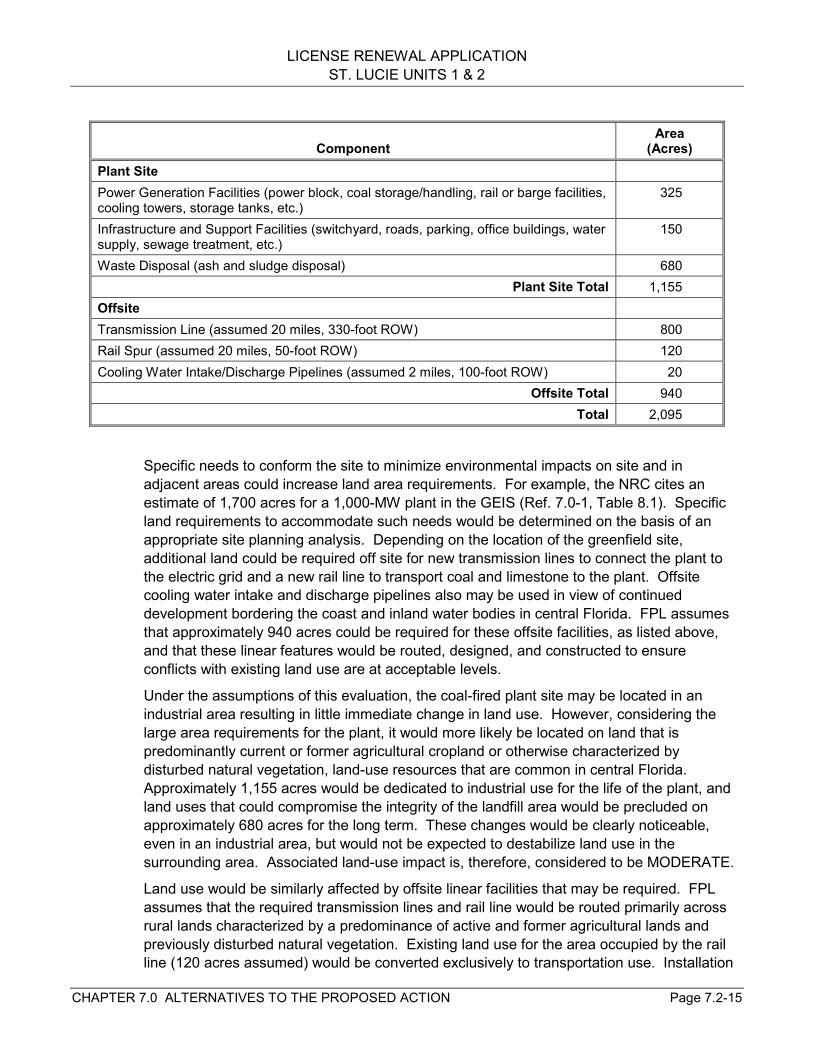
LICENSE RENEWAL APPLICATIONST. LUCIE UNITS 1 & 2
CHAPTER 7.0 ALTERNATIVES TO THE PROPOSED ACTION Page 7.2-15
ComponentArea
(Acres)Plant SitePower Generation Facilities (power block, coal storage/handling, rail or barge facilities,cooling towers, storage tanks, etc.)
325
Infrastructure and Support Facilities (switchyard, roads, parking, office buildings, watersupply, sewage treatment, etc.)
150
Waste Disposal (ash and sludge disposal) 680Plant Site Total 1,155
OffsiteTransmission Line (assumed 20 miles, 330-foot ROW) 800Rail Spur (assumed 20 miles, 50-foot ROW) 120Cooling Water Intake/Discharge Pipelines (assumed 2 miles, 100-foot ROW) 20
Offsite Total 940Total 2,095
Specific needs to conform the site to minimize environmental impacts on site and inadjacent areas could increase land area requirements. For example, the NRC cites anestimate of 1,700 acres for a 1,000-MW plant in the GEIS (Ref. 7.0-1, Table 8.1). Specificland requirements to accommodate such needs would be determined on the basis of anappropriate site planning analysis. Depending on the location of the greenfield site,additional land could be required off site for new transmission lines to connect the plant tothe electric grid and a new rail line to transport coal and limestone to the plant. Offsitecooling water intake and discharge pipelines also may be used in view of continueddevelopment bordering the coast and inland water bodies in central Florida. FPL assumesthat approximately 940 acres could be required for these offsite facilities, as listed above,and that these linear features would be routed, designed, and constructed to ensureconflicts with existing land use are at acceptable levels.
Under the assumptions of this evaluation, the coal-fired plant site may be located in anindustrial area resulting in little immediate change in land use. However, considering thelarge area requirements for the plant, it would more likely be located on land that ispredominantly current or former agricultural cropland or otherwise characterized bydisturbed natural vegetation, land-use resources that are common in central Florida.Approximately 1,155 acres would be dedicated to industrial use for the life of the plant, andland uses that could compromise the integrity of the landfill area would be precluded onapproximately 680 acres for the long term. These changes would be clearly noticeable,even in an industrial area, but would not be expected to destabilize land use in thesurrounding area. Associated land-use impact is, therefore, considered to be MODERATE.
Land use would be similarly affected by offsite linear facilities that may be required. FPLassumes that the required transmission lines and rail line would be routed primarily acrossrural lands characterized by a predominance of active and former agricultural lands andpreviously disturbed natural vegetation. Existing land use for the area occupied by the railline (120 acres assumed) would be converted exclusively to transportation use. Installation
LICENSE RENEWAL APPLICATIONST. LUCIE UNITS 1 & 2
CHAPTER 7.0 ALTERNATIVES TO THE PROPOSED ACTION Page 7.2-16
of these facilities would be noticeable but would not be expected to change the basic land-use characteristics of the area, and some current land uses (e.g., agriculture) could continuewithin the transmission line ROW. Resultant impacts are, therefore, considered to beSMALL to MODERATE.
Overall, impact on land use associated with the coal-fired generation alternative isconsidered to be MODERATE.
7.2.2.1.2 ECOLOGICAL RESOURCES
Under the conditions assumed for this evaluation and considerations discussed below,potential impact to ecological resources resulting from development of the coal-firedgeneration alternative at a hypothetical greenfield site is considered to be MODERATE.FPL assumes that all onsite and offsite facilities would be located and configured to ensureappropriate protection of highly valued species and habitats on the basis of an appropriatesiting analysis and pre-construction baseline surveys. In addition, FPL notes that actual siteconfiguration could result in increased protection of onsite habitats that are not occupied byplant facilities.
Construction of site facilities is assumed to result in the loss of 1,155 acres of relativelymarginal terrestrial habitat (e.g., vacant industrial land, active or former agricultural land,disturbed natural vegetation) that is common in central Florida. A loss of 120 acres ofmostly marginal terrestrial habitat could result from construction of rail access, if needed.Permanent alteration of habitat for construction of transmission lines would be limitedprimarily to conversion of forested areas to scrubland. Construction would also result inalteration of some aquatic habitat from construction of cooling water intake and dischargestructures and, for coastal sites, possibly the construction of a barge channel andassociated dockage and unloading facilities. Any construction in aquatic habitats andwetlands would be conducted in accordance with applicable U.S. Army Corps of Engineersand state permit conditions. Considering these controls and previously stated assumptions,construction impacts would noticeably alter habitats on the plant site and areas occupied byoffsite facilities, but would not be expected to destabilize any species or other attribute ofthese ecological resources, a characteristic of MODERATE impact.
Operation of the coal-fired plant and associated transmission facilities would not beexpected to result in noticeable adverse impact to terrestrial ecological resources, andpositive impacts could be realized from management practices with respect to habitatmaintenance in unoccupied areas of the site and along pipelines and transmission linessuch as is practiced by FPL at the St. Lucie Units 1 & 2 site and associated transmissionline rights-of-way. Potential impacts on aquatic ecological resources from plant operationinclude potential cooling water system impacts, particularly impingement and entrainment ofaquatic organisms and potential impacts of thermal and biocide discharges. However,required compliance with provisions of the Clean Water Act (CWA), most notably Section316(b) related to cooling water intake impacts and Section 402 [National Pollutant DischargeElimination System (NPDES) permit for discharges to surface water], should ensure thatassociated adverse impacts on aquatic resources, while potentially noticeable, would notdestabilize any important attribute of the resource. A similar conclusion applies tomaintenance and operation of facilities associated with barge delivery of coal and limestone,which would be closely regulated by the U.S. Army Corps of Engineers and U.S. Coast
LICENSE RENEWAL APPLICATIONST. LUCIE UNITS 1 & 2
CHAPTER 7.0 ALTERNATIVES TO THE PROPOSED ACTION Page 7.2-17
Guard. Operational impacts on ecological resources are, therefore, considered to beSMALL to MODERATE.
7.2.2.1.3 WATER QUALITY
Potential impacts on surface water quality from construction of onsite and offsite facilities forthe coal-fired generation alternative may include minor, localized, and temporaryintroduction of sediments from such activities as land clearing, installation of cooling waterintake and discharge structures, and possibly a barge channel and associated shore-basedfacilities. These impacts would be limited by appropriate best management practices andassociated permit restrictions during both construction and operation. Considering thetemporary and localized nature of these impacts and the regulatory controls that would be inplace, associated impacts are considered to be SMALL.
Discharge of cooling water and other wastewater to surface water during operationrepresents a potential source of impact to water quality during operation. The proposedcoal-fired generation alternative features closed-cycle cooling with mechanical draft coolingtowers. Wastewater discharges from the plant would consist mostly of cooling towerblowdown, characterized primarily by an increased temperature and concentration ofdissolved solids relative to the receiving water body (assuming it also serves as the makeupwater source), and intermittent low concentrations of biocides (e.g., chlorine). Appropriatelytreated low-volume process waste streams and sanitary wastewater may also bedischarged. However, all of these discharges would be subject to the strict limitations of anNPDES permit and, outside of an allowable mixing zone, changes in water qualitycharacteristics generally should not be noticeable.
Overall impact to water quality is, therefore, considered to be SMALL.
7.2.2.1.4 AIR QUALITY
Air quality impacts of coal-fired generation differ substantially from those of nuclear power.A coal-fired plant would emit sulfur oxides, nitrogen oxides, particulate matter, and carbonmonoxide, all of which are regulated pollutants. As indicated in Section 7.2.1.1, FPL hasassumed a plant design that would minimize air emissions through a combination of boilertechnology and post-combustion pollutant removal. FPL estimates the coal-fired generationalternative emissions to be as follows:
Sulfur oxides(SOx) = 16,748 tons per year
Nitrogen oxides (NOx) = 2,028 tons per year
Carbon monoxide (CO) = 1,352 tons per year
Particulates:
Total suspended particulates = 216 tons per year
PM10 (particulates having diameter of less than 10 microns) = 50 tons per year
Table 7.2-6 shows the FPL calculations for these emissions.
All counties in Florida are in attainment for all criteria air pollutants. However, Orange,Duval, Hillsborough, Pinellas, Miami-Dade, Broward, and Palm Beach counties are
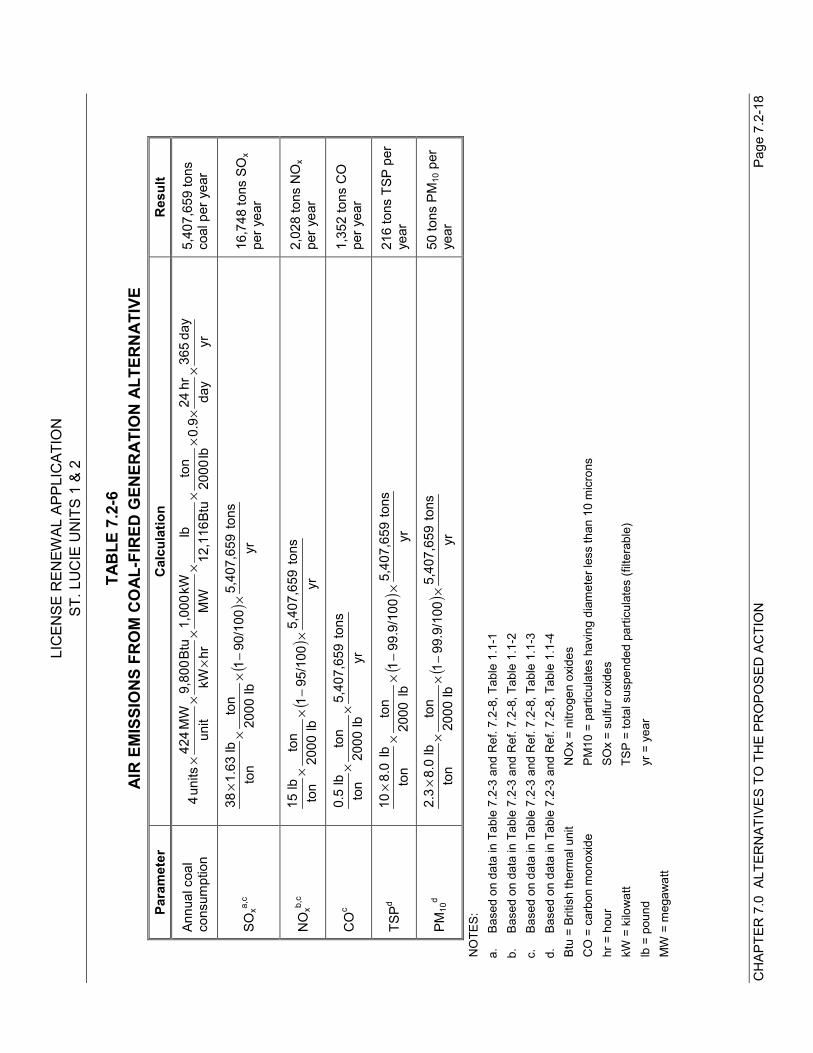
LIC
ENSE
REN
EWAL
APP
LIC
ATIO
NST
. LU
CIE
UN
ITS
1 &
2
CH
APTE
R 7
.0 A
LTER
NAT
IVES
TO
TH
E PR
OPO
SED
AC
TIO
NPa
ge 7
.2-1
8
TAB
LE 7
.2-6
AIR
EM
ISSI
ON
S FR
OM
CO
AL-F
IRED
GEN
ERAT
ION
ALT
ERN
ATIV
EPa
ram
eter
Cal
cula
tion
Res
ult
Annu
al c
oal
cons
umpt
ion
yrday
365
dayhr
240.
9lb
2000to
nBt
u12
,116lb
MWkW
1,00
0hr
kWBt
u9,
800
unitM
W42
4
units
4×
××
××
××
××
5,40
7,65
9 to
nsco
al p
er y
ear
SOxa,
c
()
yrto
ns5,
407,
659
90/1
001
lb20
00ton
ton
lb1.
6338
×−
××
×16
,748
tons
SO
xpe
r yea
r
NO
xb,c
(
)yr
tons
5,40
7,65
995
/100
1lb
2000to
nto
nlb15
×−
××
2,02
8 to
ns N
Ox
per y
ear
CO
c
yr
tons
5,40
7,65
9lb
2000to
nto
nlb0.
5×
×1,
352
tons
CO
per y
ear
TSPd
(
)yr
tons
5,40
7,65
999
.9/1
001
lb20
00ton
ton
lb8.
010
×−
××
×21
6 to
ns T
SP p
erye
ar
PM10
d
(
)yr
tons
5,40
7,65
999
.9/1
001
lb20
00ton
ton
lb8.
02.
3×
−×
××
50 to
ns P
M10
per
year
NO
TES:
a.Ba
sed
on d
ata
in T
able
7.2
-3 a
nd R
ef. 7
.2-8
, Tab
le 1
.1-1
b.Ba
sed
on d
ata
in T
able
7.2
-3 a
nd R
ef. 7
.2-8
, Tab
le 1
.1-2
c.Ba
sed
on d
ata
in T
able
7.2
-3 a
nd R
ef. 7
.2-8
, Tab
le 1
.1-3
d.Ba
sed
on d
ata
in T
able
7.2
-3 a
nd R
ef. 7
.2-8
, Tab
le 1
.1-4
Btu
= Br
itish
ther
mal
uni
tN
Ox
= ni
troge
n ox
ides
CO
= c
arbo
n m
onox
ide
PM10
= p
artic
ulat
es h
avin
g di
amet
er le
ss th
an 1
0 m
icro
nshr
= h
our
SOx
= su
lfur o
xide
skW
= k
ilow
att
TSP
= to
tal s
uspe
nded
par
ticul
ates
(filt
erab
le)
lb =
pou
ndyr
= y
ear
MW
= m
egaw
att
LICENSE RENEWAL APPLICATIONST. LUCIE UNITS 1 & 2
CHAPTER 7.0 ALTERNATIVES TO THE PROPOSED ACTION Page 7.2-19
maintenance areas for ozone (Ref. 7.2-17). While there are numerous areas in centralFlorida where a plant could be located, proximity to maintenance areas would make itimportant to conduct modeling of NOx emissions in view of the role they play in the formationof ground-level ozone.
The Clean Air Act (CAA) Amendments of 1990 specified a number of utility-owned/operatedpower plants to begin compliance with stricter emissions standards for SOx and NOx in1995. Emissions of SOx from Florida electric power generation declined from 1994 to 1995,but increased from 1995 to 1998. Emissions of both CO and NOx, which had increased inyears prior to 1995, leveled off in the period 1995-1997, then increased in 1998 (Ref. 7.2-1).
Although Florida participated in the Ozone Transport Assessment Group process, Floridagenerators are not subject to the recently announced proposal from the EPA requiringsubmission of state implementation plans to address the regional transport of ground-levelozone. However, Florida fossil-fuel-fired units are subject to the emissions reductionsrequirements of Phase II of the EPA’s Acid Rain Program, which took effect January 1,2000.
The CAA Amendments capped the nation’s sulfur dioxide (SO2) emissions from powerplants, and each utility was allocated SO2 allowances. To be in compliance with the Act,FPL must hold enough allowances to cover its SO2 emissions annually. FPL would have topurchase additional allowances from the open market if it did not have enough surplusallowances to operate an additional fossil-burning plant at the greenfield site. The NRC didnot quantify coal-fired emissions in the GEIS, but implied that air impacts would besubstantial. In particular, the NRC noted that adverse human health effects from coalcombustion have led to important federal legislation in recent years, and that public healthrisks, such as cancer and emphysema, have been associated with coal combustion. TheNRC also mentioned global warming and acid rain as potential impacts. FPL concludes thatfederal legislation and large-scale issues, such as acid rain and global warming, areindications of concerns about destabilizing important attributes of air resources, and thatsulfur dioxide emissions allowances, nitrogen oxide emissions offsets, low NOx burners,overfire air, selective catalytic reduction, fabric filters or electrostatic precipitators, andscrubbers are essentially mitigation measures imposed through regulation. As such, FPLconcludes that the coal-fired generation alternative impacts on air quality would beMODERATE; the impacts would be clearly noticeable but would not destabilize air quality inthe area.
7.2.2.1.5 WASTE MANAGEMENT
FPL concurs with the NRC’s assessment in the GEIS that the coal-fired generationalternative would generate a substantial amount of solid waste. Depending on landcharacteristics, large quantities of debris could be generated from construction clearing andgrubbing operations on approximately 1,155 acres of the site. FPL assumes that this debriscould be disposed of on site, possibly requiring additional acreage, or at an offsite facility.FPL assumes that municipal solid waste generated during construction and operation wouldbe disposed of at a permitted offsite facility.
The coal-fired generation alternative would annually consume approximately 5,400,000 tonsof coal having an ash content of 8.0 percent (see Tables 7.2-6 and 7.2-3). Nearly all of theash (99.9 percent), approximately 430,000 tons per year (dry weight), would be collected.
LICENSE RENEWAL APPLICATIONST. LUCIE UNITS 1 & 2
CHAPTER 7.0 ALTERNATIVES TO THE PROPOSED ACTION Page 7.2-20
FPL assumes that approximately 10 percent of the ash is bottom ash that would be usedbeneficially, and that the remaining (90 percent) would be fly-ash and disposed of on site. Inaddition, approximately 270,000 tons of limestone would be used annually for flue-gasdesulfurization, generating approximately 586,000 tons (wet) of scrubber sludge that wouldbe disposed of on site each year. Assuming a landfill depth of 30 feet, FPL estimates thatash and scrubber waste disposal over the 40-year plant life would impact approximately 680acres. While only half of this waste volume and land use would be attributable to the 20-year license renewal period alternative, the total numbers are pertinent as a cumulativeimpact.
FPL notes that some or all scrubber sludge from the assumed flue-gas desulfurizationprocess (gypsum) and fly ash potentially represent useable products. However, consideringthe large volume of these wastes and uncertainties in future demand, FPL has ignored thispotential in the evaluation of impacts for both the coal-fired and oil-fired generationalternatives.
FPL believes that with proper facility siting, design, operation, and closure in accordancewith regulatory requirements, waste disposal would not destabilize any resources. Afterclosure and revegetation of the ash-sludge waste disposal facility, the land could be madeavailable for other noninvasive uses (e.g, recreation). For these reasons, FPL believes thatwaste disposal impacts for the coal-fired generation alternative would be MODERATE; theimpacts would be clearly noticeable but would not destabilize any important resource.
7.2.2.1.6 HUMAN HEALTH
In the GEIS, the NRC cites risk of accidents to workers and public risks (e.g., cancer,emphysema) from inhalation of toxics and particulates associated with air emissions aspotential risks to human health associated with the coal-fired generation alternative. FPLassumes that regulatory requirements imposed on facility design and operations underauthority of the Occupational Safety and Health Act (OSHA), CAA, and related statutes aredesigned to provide an appropriate level of protection to workers and the public with respectto these risks, and that compliance with those requirements should, therefore, result inSMALL, if any, impacts on human health.
7.2.2.1.7 SOCIOECONOMICS
Major sources of potential impact of the coal-fired generation alternative from asocioeconomic perspective include the following:
• temporary increases in jobs, general economic activity, and demand for housing andpublic services in communities surrounding the greenfield site during the constructionperiod, and
• changes in permanent jobs, economic activity, and tax revenues for the period ofplant operation, considering also corresponding losses resulting from shutdown of St.Lucie Units 1 & 2.
FPL assumes that construction of the alternative coal-fired plant would be staged tocomplete two units in time to replace St. Lucie Unit 1 in 2016, and two units in time toreplace St. Lucie Unit 2 in 2023. Estimates cited by the NRC (Ref. 7.2-4; Ref. 7.2-7)indicate that three 600-MW pulverized coal units could be constructed in approximately fiveyears with an average and peak construction workforce of 1,500 and 2,000 workers,
LICENSE RENEWAL APPLICATIONST. LUCIE UNITS 1 & 2
CHAPTER 7.0 ALTERNATIVES TO THE PROPOSED ACTION Page 7.2-21
respectively. Scaling from these estimates, FPL expects that the first two coal-fired unitscould be constructed in approximately four to five years with an average and peak workforceof approximately 1,000 and 2,000 workers, respectively. On the same basis, and assumingthat the first stage of construction includes basic site work and other appropriateaccommodations for full site development, FPL estimates that the second two units wouldbe constructed in approximately four years with a similar workforce. The NRC estimates inthe GEIS that an operating workforce of 250 would be required for a 1,000-MW coal-firedplant; similar estimates (220-250) are cited for plants consisting of 600-MW units (Ref. 7.2-4;Ref. 7.2-7). On this basis, FPL has assumed permanent operating workforces of 250 and300 for the first two units and the fully developed plant, respectively.
Potential impacts related to increased demand for housing and public services from a 1,000-to 2,000-person construction workforce and a 250- to 300-person operating workforce woulddepend to a large extent on the nearness of the greenfield site to high population areas thatprovide a relatively large source of available labor and have greater ability to absorb theseincreased demands. FPL notes that the vast majority of central Florida is withinapproximately 40 miles (commuting distance) of growing metropolitan areas with currentpopulations greater than 250,000 (Ref. 7.2-18), and that, with few exceptions, the projected2010 populations for all counties in south-central Florida are greater than 30,000 (Ref. 7.2-19).
In view of these data, FPL considers it reasonable to expect that a greenfield site in centralFlorida could be located within 40 miles of one or more metropolitan areas with populationsgreater than 250,000, and in a county with a population greater than 30,000. Under thisscenario, it is expected that relatively few construction workers would relocate to smallercommunities in the site vicinity. Permanent in-migration to these communities duringoperation, represented by some plant workers and their families and some secondary jobscreated in these communities, would be limited by these same factors, and by the moderateoperating workforce requirement (250 initially and 50 more when all four units operate). It isexpected that the increased demand for housing and public services would be clearlynoticeable in communities near the site, but that these communities could accommodatethese demands without a destabilizing effect. Depending on the nearness of the site tolarge population centers, resultant impacts may range from SMALL to MODERATE.Communities in the site vicinity would realize some temporary socioeconomic benefitsduring construction, including some increase in jobs and plant expenditures. Thesecommunities would similarly realize the benefits of additional permanent jobs, plantexpenditures, and substantial tax revenues during the operational phase.
Implementation of the coal-fired generation alternative at a greenfield site has specificsocioeconomic implications for the St. Lucie Units 1 & 2 area. FPL employs approximately930 workers at St. Lucie Units 1 & 2, mostly residents of St. Lucie and Martin counties, andproperty taxes from the plant amount to approximately 8 percent of St. Lucie County’s totalannual revenues (see Sections 2.7 and 3.4). Implementation of the coal-fired generationalternative at a greenfield site remote from the St. Lucie and Martin combined-county areawould result in the eventual loss of virtually all of these direct jobs and loss of tax revenuesfollowing shutdown and decommissioning of St. Lucie Units 1 & 2. St. Lucie and Martincounties are experiencing rapid growth, projected to reach approximately 379,300 by 2010(Ref. 7.2-19). Therefore, it is expected that these job losses and the resultant slowdown ineconomic activity would have a SMALL impact. Similarly, assuming the proportion of tax
LICENSE RENEWAL APPLICATIONST. LUCIE UNITS 1 & 2
CHAPTER 7.0 ALTERNATIVES TO THE PROPOSED ACTION Page 7.2-22
revenues to St. Lucie County attributable to operation of St. Lucie Units 1 & 2 remains below10 percent, associated impacts are considered to be SMALL. Location of the greenfield sitein the St. Lucie and Martin combined-county area would reduce net loss of direct jobs in thearea by 300, and would similarly help to offset impacts resulting from indirect job losses,plant expenditures, and tax revenues.
7.2.2.1.8 AESTHETICS
Based on design characteristics cited for comparable pulverized coal plants, the boilerbuildings for the proposed coal-fired generation alternative would be approximately 200 feethigh, and mechanical draft cooling towers may be 50 to 100 feet tall (Ref. 7.2-4; Ref. 7.2-7,Section 8.2.1.2). Using the EPA’s criteria for good engineering practice stack height (40CFR 51.100) and assuming the height of the boiler building is the governing parameter,exhaust stacks would be approximately 500 feet high. The boiler buildings, stacks, andvapor plumes from the plant may be visible for several miles, and some noise from themechanical draft towers and coal handling equipment could be noticeable off site. Theaesthetic impact of the facility would vary substantially with topography and land use in thegeneral area of the plant. Location in an industrialized area would likely result in SMALL toMODERATE impact. However, the plant could markedly change the perceived aestheticcharacter of a relatively large area at other sites (e.g., relatively flat rural agricultural lands),and impact could be considered LARGE.
7.2.2.1.9 CULTURAL RESOURCES
The greenfield site for the coal-fired generating plant and associated offsite facilities wouldbe located on previously disturbed areas on the basis of siting studies that would considerthe potential existence of cultural resources, including archaeological and historicalstructures and sites. Site-specific cultural resource studies and resource preservation, asappropriate, would be conducted in the pre-construction and construction phases of theproject. In view of these measures, development of the plant should result in little or nodetectable impact, and could result in benefits (e.g., through study or preservation) in theevent resources are present. FPL concludes that impacts to cultural resources would beSMALL, if any.
7.2.2.2 OIL-FIRED GENERATION
As discussed in Section 7.2.1.2, FPL’s reference oil-fired generation alternative for thisevaluation is a 1,600-MW (net) plant consisting of four 400-MW units, located at a greenfieldsite in central Florida. Basic specifications for the generating units, fuel, and air emissioncontrols are provided in Table 7.2-4. In addition to the general assumptions stated in theintroductory text to Section 7.2.2, FPL assumes for purposes of this evaluation thatlimestone used for scrubber operation would be delivered by truck or possibly barge (atcoastal sites), and that oil would be delivered by barge and then by pipeline to inland sites.
FPL’s evaluation is based, in part, on information provided by the NRC in the GEIS for oil-fired power production (Ref. 7.0-1), and the layout and selected design features of FPL’s oil-fired Turkey Point Units 1 & 2. Turkey Point Units 1 & 2 are co-located with two nuclearpower units (Units 3 & 4) at a coastal site about 25 miles south of Miami, Florida. Each ofthe two oil-fired units has a net continuous rating of 404 MW, and fuel is delivered by bargeto the site. The switchyard, administrative and some technical support facilities, and
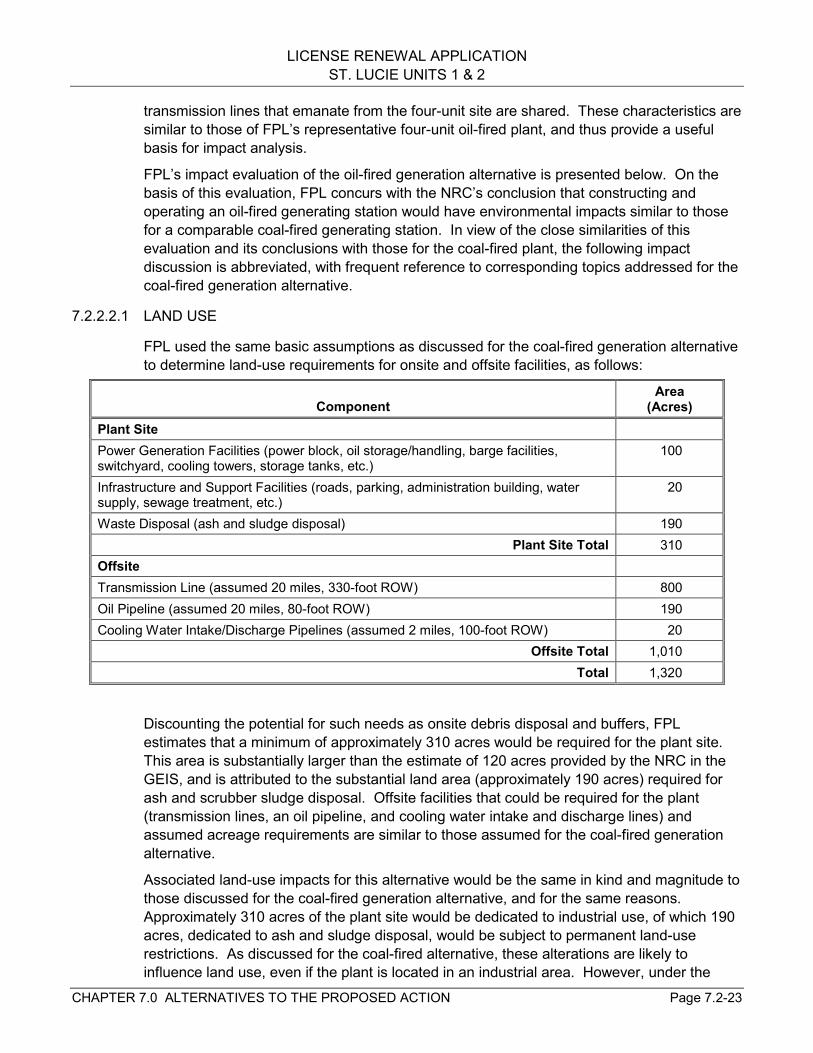
LICENSE RENEWAL APPLICATIONST. LUCIE UNITS 1 & 2
CHAPTER 7.0 ALTERNATIVES TO THE PROPOSED ACTION Page 7.2-23
transmission lines that emanate from the four-unit site are shared. These characteristics aresimilar to those of FPL’s representative four-unit oil-fired plant, and thus provide a usefulbasis for impact analysis.
FPL’s impact evaluation of the oil-fired generation alternative is presented below. On thebasis of this evaluation, FPL concurs with the NRC’s conclusion that constructing andoperating an oil-fired generating station would have environmental impacts similar to thosefor a comparable coal-fired generating station. In view of the close similarities of thisevaluation and its conclusions with those for the coal-fired plant, the following impactdiscussion is abbreviated, with frequent reference to corresponding topics addressed for thecoal-fired generation alternative.
7.2.2.2.1 LAND USE
FPL used the same basic assumptions as discussed for the coal-fired generation alternativeto determine land-use requirements for onsite and offsite facilities, as follows:
ComponentArea
(Acres)Plant SitePower Generation Facilities (power block, oil storage/handling, barge facilities,switchyard, cooling towers, storage tanks, etc.)
100
Infrastructure and Support Facilities (roads, parking, administration building, watersupply, sewage treatment, etc.)
20
Waste Disposal (ash and sludge disposal) 190Plant Site Total 310
OffsiteTransmission Line (assumed 20 miles, 330-foot ROW) 800Oil Pipeline (assumed 20 miles, 80-foot ROW) 190Cooling Water Intake/Discharge Pipelines (assumed 2 miles, 100-foot ROW) 20
Offsite Total 1,010Total 1,320
Discounting the potential for such needs as onsite debris disposal and buffers, FPLestimates that a minimum of approximately 310 acres would be required for the plant site.This area is substantially larger than the estimate of 120 acres provided by the NRC in theGEIS, and is attributed to the substantial land area (approximately 190 acres) required forash and scrubber sludge disposal. Offsite facilities that could be required for the plant(transmission lines, an oil pipeline, and cooling water intake and discharge lines) andassumed acreage requirements are similar to those assumed for the coal-fired generationalternative.
Associated land-use impacts for this alternative would be the same in kind and magnitude tothose discussed for the coal-fired generation alternative, and for the same reasons.Approximately 310 acres of the plant site would be dedicated to industrial use, of which 190acres, dedicated to ash and sludge disposal, would be subject to permanent land-userestrictions. As discussed for the coal-fired alternative, these alterations are likely toinfluence land use, even if the plant is located in an industrial area. However, under the
LICENSE RENEWAL APPLICATIONST. LUCIE UNITS 1 & 2
CHAPTER 7.0 ALTERNATIVES TO THE PROPOSED ACTION Page 7.2-24
assumptions of this evaluation, it is not expected that land use in the area would bedestabilized, and impact is considered to be MODERATE. Similarly, assuming offsitefacilities are located on the basis of an appropriate siting analysis, associated impacts toland use are expected to be MODERATE.
7.2.2.2.2 ECOLOGICAL RESOURCES
As discussed above, construction of the oil-fired generation alternative is expected torequire less land for the plant site than a comparable coal-fired facility, while estimated landrequirements for offsite facilities are approximately the same. FPL assumes that thepotential for adverse effects on ecological resources would be similarly reduced but wouldotherwise be as previously described for the coal-fired generation alternative. That is,approximately 310 acres of relatively marginal terrestrial habitat (e.g., active or formeragricultural land, disturbed natural vegetation) common in central Florida would beeliminated on site. Similar offsite habitats would be altered from construction of pipelines(e.g., 190 acres) and transmission lines (e.g., 800 acres). Any construction in or affectingaquatic habitats and wetlands would be conducted in accordance with applicable permitconditions. Overall, predicted construction impacts are similar to those expected for a coal-fired plant and, therefore, are considered to be MODERATE, for the same reasons.
Operation of an oil-fired plant and associated transmission facilities poses a potential foradverse impact on ecological resources comparable to that discussed for the coal-firedgeneration alternative. Maintenance practices along transmission line rights-of-way couldresult in improved habitat. Cooling water requirements are expected to be similar to thosefor the coal-fired facility (Ref. 7.0-1) and, as for the coal-fired facility, potential intake anddischarge effects would be subject to protective regulation. Impacts related to operationare, therefore, considered to be SMALL to MODERATE.
Based on the above considerations and general assumptions of this evaluation, overallimpact to ecological resources from development of the oil-fired generation alternative isconsidered to be MODERATE.
7.2.2.2.3 WATER QUALITY
Potential sources of impact on surface water quality from construction of the oil-firedgeneration alternative would be the same as for the coal-fired facility, though impacts maybe smaller due to the relatively smaller land area disturbed and associated potential forerosion and sedimentation. Potential sources of impact during operation would becomparable to those from the coal-fired generation alternative, with the notable exception ofpotential releases of fuel oil. However, fuel oil transport, unloading, storage, and handlingwould be undertaken with appropriate measures for spill prevention and control in place andin accordance with applicable regulatory requirements (e.g., U.S. Coast Guard, U.S.Department of Transportation, EPA), which should provide a high level of protection.Discharges of cooling water and other smaller volume waste streams also would be similarto those expected for a coal-fired plant, and would be subject to strict regulation. Potentialadverse impacts related to water quality are, therefore, considered to be SMALL.
LICENSE RENEWAL APPLICATIONST. LUCIE UNITS 1 & 2
CHAPTER 7.0 ALTERNATIVES TO THE PROPOSED ACTION Page 7.2-25
7.2.2.2.4 AIR QUALITY
Predicted air emissions from oil-fired generation are lower than those for coal-firedgeneration for most parameters. An oil-fired plant would emit sulfur oxides, nitrogen oxides,particulate matter, and carbon monoxide. The plant design would minimize air emissionsthrough a combination of boiler technology and post-combustion pollutant removal. FPLestimates the oil-fired generation alternative emissions to be as follows:
SOx = 9,646 tons per year
NOx = 1,653 tons per year
CO = 2,119 tons per year
Particulates:
Total suspended particulates = 70 tons per year
PM10 = 44 tons per year
Table 7.2-7 shows the FPL calculations for these emissions.
The discussion of regional air quality and CAA requirements in Section 7.2.2.1 is alsoapplicable to the oil-fired generation alternative. The effect of NOx emissions on ozonelevels, SO2 allowances, and nitrogen oxide emissions offsets could all be issues of concernfor oil-fired combustion at a greenfield site in the area of central Florida considered underassumptions of this evaluation.
The NRC did not quantify oil-fired emissions but noted that they would be typical of coalplants. FPL concurs and believes that, for the same reasons as for coal-fired generation,impacts from oil-fired generation on air quality would be MODERATE assuming theapplication of mitigation measures imposed by air emissions regulations.
7.2.2.2.5 WASTE MANAGEMENT
Construction of the oil-fired generation alternative would generate the same types of wasteas discussed previously for the coal-fired generation alternative. However, the smaller landarea requirements could result in less debris from land clearing and grubbing operations.As is the case for coal, oil combustion and removal of pollutants by air pollution controlequipment would generate solid waste in the form of ash and scrubber sludge, but amountsfor the oil-fired units would be less. FPL estimates that the oil-fired generation alternativewould result in annual combustion of 847,473,480 gallons of fuel having an ash content ofapproximately 0.21 percent (see Table 7.2-4). FPL assumes nearly all of this ash(99 percent, approximately 7,000 tons per year, dry) would be collected and disposed of onsite. In addition, approximately 150,000 tons of limestone would be used annually for flue-gas desulfurization, generating approximately 320,000 tons of wet scrubber sludge thatwould be disposed of on site each year. Assuming a landfill depth of 30 feet, FPL estimatesthat ash and scrubber waste disposal over the 40-year plant life would impact approximately190 acres. For the same reasons cited previously for the coal-fired generation alternative,FPL concludes that the oil-fired generation alternative impacts from waste managementwould be MODERATE.
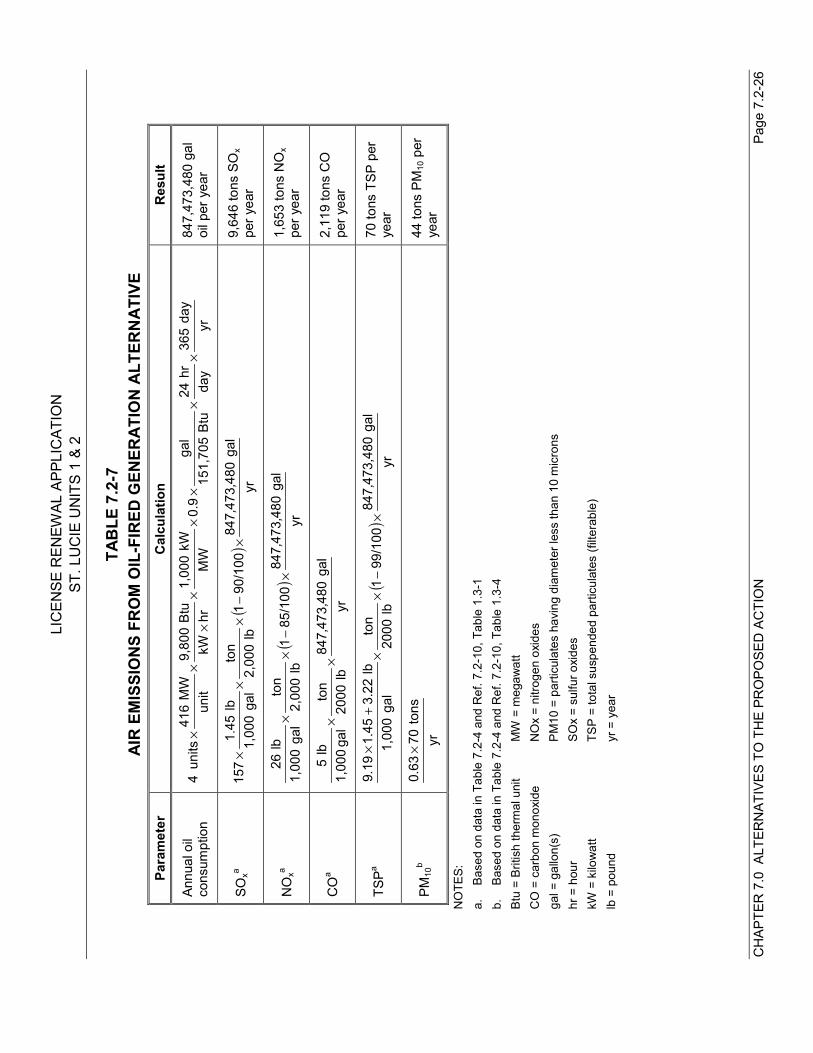
LIC
ENSE
REN
EWAL
APP
LIC
ATIO
NST
. LU
CIE
UN
ITS
1 &
2
CH
APTE
R 7
.0 A
LTER
NAT
IVES
TO
TH
E PR
OPO
SED
AC
TIO
NPa
ge 7
.2-2
6
TAB
LE 7
.2-7
AIR
EM
ISSI
ON
S FR
OM
OIL
-FIR
ED G
ENER
ATIO
N A
LTER
NAT
IVE
Para
met
erC
alcu
latio
nR
esul
t
Annu
al o
ilco
nsum
ptio
nyrda
y36
5da
yhr24
Btu
151,
705
gal
0.9
MW
kW1,
000
hrkW
Btu
9,80
0un
itMW
416
units
4×
××
××
××
×84
7,47
3,48
0 ga
loi
l per
yea
r
SOxa
()
yrga
l48
047
384
790
/100
1lb
2,00
0to
nga
l1,
000
lb1.
4515
7,
,×
−×
××
9,64
6 to
ns S
Ox
per y
ear
NO
xa(
)yr
gal
480
473
847
85/1
001
lb2,
000
ton
gal
1,00
0lb26
,,
×−
××
1,65
3 to
ns N
Ox
per y
ear
CO
a
yrga
l48
047
384
7lb
2000to
nga
l1,
000lb
5,
,×
×2,
119
tons
CO
per y
ear
TSPa
()
yrga
l48
047
384
799
/100
1lb
2000to
nga
l1,
000
lb3.
221.
459.
19,
,×
−×
×+
×70
tons
TSP
per
year
PM10
b
yrto
ns07
0.63
×44
tons
PM
10 p
erye
ar
NO
TES:
a.Ba
sed
on d
ata
in T
able
7.2
-4 a
nd R
ef. 7
.2-1
0, T
able
1.3
-1b.
Base
d on
dat
a in
Tab
le 7
.2-4
and
Ref
. 7.2
-10,
Tab
le 1
.3-4
Btu
= Br
itish
ther
mal
uni
tM
W =
meg
awat
tC
O =
car
bon
mon
oxid
eN
Ox
= ni
troge
n ox
ides
gal =
gal
lon(
s)PM
10 =
par
ticul
ates
hav
ing
diam
eter
less
than
10
mic
rons
hr =
hou
rSO
x =
sulfu
r oxi
des
kW =
kilo
wat
tTS
P =
tota
l sus
pend
ed p
artic
ulat
es (f
ilter
able
)lb
= p
ound
yr =
yea
r
LICENSE RENEWAL APPLICATIONST. LUCIE UNITS 1 & 2
CHAPTER 7.0 ALTERNATIVES TO THE PROPOSED ACTION Page 7.2-27
7.2.2.2.6 HUMAN HEALTH
As discussed for the coal-fired generation alternative, FPL assumes that regulatoryrequirements imposed on facility design and operations under authority of the OSHA, CAA,and related statutes are designed to provide an appropriate level of protection to workersand the public with respect to risks to worker safety and to the public from air emissionscited by the NRC for this alternative, and that compliance with those requirements wouldresult in SMALL, if any, impacts on human health from the oil-fired generation alternative.
7.2.2.2.7 SOCIOECONOMICS
FPL notes that the sources and types of socioeconomic impacts from development of theoil-fired generation alternative would be essentially the same as those examined previouslyfor the coal-fired generation alternative. At a given greenfield site, the magnitude of impactscan be attributed primarily to the size of construction and operating workforces.
FPL assumes that construction of the alternative oil-fired plant would be staged to completetwo units in time to replace St. Lucie Unit 1 in 2016, and two units in time to replace St.Lucie Unit 2 in 2023. These units would be similar in general configuration, but somewhatsmaller and less complex to construct and operate than the alternative coal-fired units.Similarly, the amount of land to be developed for the overall site would be less than for thecoal-fired generation alternative. Estimates provided by the NRC in the GEIS (Ref. 7.0-1,Tables 8.1 and 8.2) indicate that construction and operating workforces for a 1,000-MW oil-fired facility could be approximately 32 percent and 20 percent less, respectively, than wouldbe required for a comparable coal-fired plant. On this basis, and using the sameassumptions as for the coal-fired generation alternative, FPL estimates that the first two oil-fired units would be constructed in approximately four to five years with an average andpeak workforce of approximately 700 and 1,400 workers, respectively, and that the secondtwo units would be constructed in approximately four years with a similar or somewhatsmaller workforce. On this basis, estimates for permanent operating workforce are 200 and240 for the first two units and the fully developed plant, respectively.
FPL concludes that potential impacts related to increased demand for housing and publicservices during construction and operation of the oil-fired generation alternative would besimilar but somewhat less than those determined for the coal-fired generation alternative.The actual impact on socioeconomics would depend on the proximity of the site to largepopulation centers, and could range from SMALL to MODERATE in surroundingcommunities.
The socioeconomic impact of the oil-fired generation alternative on the St. Lucie Units 1 & 2area would differ little from that previously discussed for the coal-fired plant. Locating theoil-fired plant in the St. Lucie-Martin combined-county vicinity would provide fewer jobs thanthe coal-fired generation alternative to offset those lost as a result of shutdown of St. LucieUnits 1 & 2; however, these losses are expected to result in only SMALL impacts regardlessof the alternative plant location. Similarly, locating the oil-fired generation alternative in theSt. Lucie-Martin combined-county area would reduce losses of tax revenues to St. LucieCounty resulting from shutdown of St. Lucie Units 1 & 2, and better ensure that localimpacts resulting from this revenue loss would be SMALL.
LICENSE RENEWAL APPLICATIONST. LUCIE UNITS 1 & 2
CHAPTER 7.0 ALTERNATIVES TO THE PROPOSED ACTION Page 7.2-28
7.2.2.2.8 AESTHETICS
Although the plant site and facilities for the oil-fired units may be somewhat smaller than fora coal-fired plant, these differences would not be appreciable from an aesthetic standpoint.The site would constitute a large industrial complex, and the boiler buildings, stacks(estimated to be 400 feet high based on the Turkey Point Units 1 & 2 facility), and coolingtower plumes could be visible for several miles. As such, the facility could be viewed asaesthetically disruptive outside of an industrial setting. For the same reasons citedpreviously for the coal-fired generation alternative, FPL considers that aesthetic impactsfrom the oil-fired generation alternative could range from SMALL to LARGE, depending onlocation-specific factors.
7.2.2.2.9 CULTURAL RESOURCES
The greenfield site for the oil-fired generating plant and associated offsite facilities would belocated on previously disturbed areas, and appropriate efforts would be made to ensure thatresources are appropriately protected. For the same reasons cited for the coal-firedgeneration alternative, FPL concludes that impacts to cultural resources from the oil-firedgeneration alternative would be SMALL.
7.2.2.3 GAS-FIRED GENERATION
As discussed in Section 7.2.1.1, FPL’s reference gas-fired generation alternative for thisevaluation is a 1,788-MW (net) plant consisting of three 596-MW units, located at agreenfield site in south Florida. Basic specifications for the generating units, fuel, and airemission controls are provided in Table 7.2-5. As for the coal- and oil-fired generationalternatives, FPL used the general assumptions stated in the introductory text toSection 7.2.2 for its evaluation of this alternative. However, unlike the previous alternatives,no rail or barge facilities would be required because fuel (natural gas) would be delivered tothe site by pipeline, and no scrubber would be required.
The NRC has evaluated the environmental impacts of constructing and operating a 1,000-MW gas-fired power plant in the GEIS (Ref. 7.0-1), and has specifically evaluated theimpacts of a 1,760-MW, four-unit combined-cycle gas-fired plant as an alternative to nuclearpower plant license renewal (Ref. 7.2-4, Section 8.2.2). Although FPL’s gas-fired generationalternative consists of only three units, the facility is comparable in design and capacity tothe plant evaluated by the NRC, so FPL used information from this plant as a partial basisfor impact estimates. Similarly, FPL also used the U.S. Department of Energy’s (DOE’s)evaluation of the proposed Griffith Energy Project (Ref. 7.2-20, Section 2.1.1) to estimatesome impact parameters. The Griffith Energy Project design is for a modern two-unitcombined-cycle plant with baseload and peaking capacities of 520 MW and 650 MW,respectively, and features closed-cycle cooling using mechanical draft cooling towers. Thepreviously evaluated plants thus provide a reasonable basis for evaluating the impacts ofFPL’s alternative.
FPL’s impact evaluation of the gas-fired generation alternative is presented below. In viewof the similarities of this evaluation to those presented previously, the following impactdiscussion is abbreviated, with frequent reference to corresponding topics addressed for thecoal- and oil-fired generation alternatives.
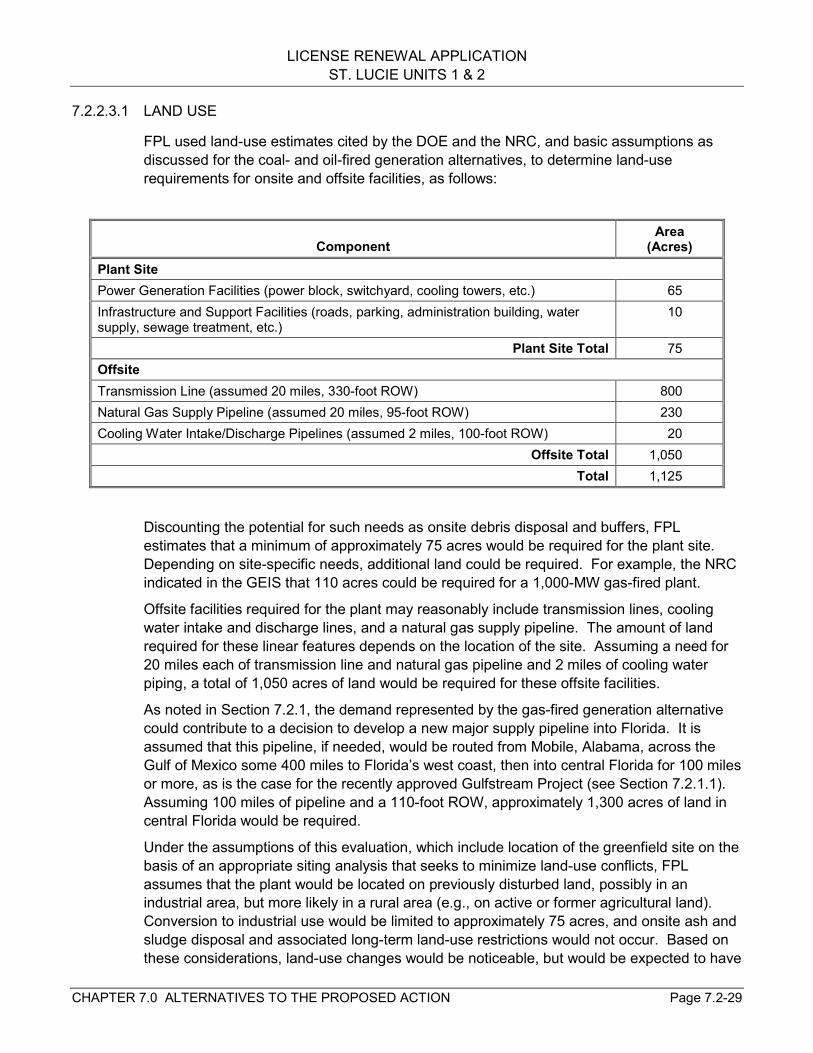
LICENSE RENEWAL APPLICATIONST. LUCIE UNITS 1 & 2
CHAPTER 7.0 ALTERNATIVES TO THE PROPOSED ACTION Page 7.2-29
7.2.2.3.1 LAND USE
FPL used land-use estimates cited by the DOE and the NRC, and basic assumptions asdiscussed for the coal- and oil-fired generation alternatives, to determine land-userequirements for onsite and offsite facilities, as follows:
ComponentArea
(Acres)Plant SitePower Generation Facilities (power block, switchyard, cooling towers, etc.) 65Infrastructure and Support Facilities (roads, parking, administration building, watersupply, sewage treatment, etc.)
10
Plant Site Total 75OffsiteTransmission Line (assumed 20 miles, 330-foot ROW) 800Natural Gas Supply Pipeline (assumed 20 miles, 95-foot ROW) 230Cooling Water Intake/Discharge Pipelines (assumed 2 miles, 100-foot ROW) 20
Offsite Total 1,050Total 1,125
Discounting the potential for such needs as onsite debris disposal and buffers, FPLestimates that a minimum of approximately 75 acres would be required for the plant site.Depending on site-specific needs, additional land could be required. For example, the NRCindicated in the GEIS that 110 acres could be required for a 1,000-MW gas-fired plant.
Offsite facilities required for the plant may reasonably include transmission lines, coolingwater intake and discharge lines, and a natural gas supply pipeline. The amount of landrequired for these linear features depends on the location of the site. Assuming a need for20 miles each of transmission line and natural gas pipeline and 2 miles of cooling waterpiping, a total of 1,050 acres of land would be required for these offsite facilities.
As noted in Section 7.2.1, the demand represented by the gas-fired generation alternativecould contribute to a decision to develop a new major supply pipeline into Florida. It isassumed that this pipeline, if needed, would be routed from Mobile, Alabama, across theGulf of Mexico some 400 miles to Florida’s west coast, then into central Florida for 100 milesor more, as is the case for the recently approved Gulfstream Project (see Section 7.2.1.1).Assuming 100 miles of pipeline and a 110-foot ROW, approximately 1,300 acres of land incentral Florida would be required.
Under the assumptions of this evaluation, which include location of the greenfield site on thebasis of an appropriate siting analysis that seeks to minimize land-use conflicts, FPLassumes that the plant would be located on previously disturbed land, possibly in anindustrial area, but more likely in a rural area (e.g., on active or former agricultural land).Conversion to industrial use would be limited to approximately 75 acres, and onsite ash andsludge disposal and associated long-term land-use restrictions would not occur. Based onthese considerations, land-use changes would be noticeable, but would be expected to have
LICENSE RENEWAL APPLICATIONST. LUCIE UNITS 1 & 2
CHAPTER 7.0 ALTERNATIVES TO THE PROPOSED ACTION Page 7.2-30
minor or, at most, moderate effect on land-use patterns in the general area. Similarly, FPLassumes that appropriate routing studies would ensure that natural gas pipelines,transmission lines, and cooling water intake/discharge pipelines required for the plant couldbe routed such that land-use impacts in the area would be, at most, moderate. Potentialdirect impacts to land use from this alternative are therefore considered to be SMALL toMODERATE.
Development of a new natural gas supply pipeline into Florida as a partial result of demandcreated by the gas-fired generation alternative represents a potential source of indirectimpact on land use. FPL assumes that such a pipeline would be located on the basis of anappropriate routing analysis that would minimize potential impacts, e.g., by maximizing useof existing ROW. Resultant impacts could be noticeable in some areas, but in any casewould not be expected to destabilize land use. On that basis, resultant impacts would beSMALL to MODERATE.
7.2.2.3.2 ECOLOGICAL RESOURCES
Under the assumptions of this evaluation, construction of onsite facilities for the gas-firedgeneration alternative would result in the loss of approximately 75 acres of relativelymarginal terrestrial habitat (e.g., active or former agricultural land, disturbed naturalvegetation) common in central Florida. Similar offsite habitats could be disrupted fromconstruction of pipelines (e.g., 230 acres) and transmission lines (e.g., 800 acres).However, as previously discussed for the coal- and gas-fired generation alternatives,appropriate site configuration and maintenance practices (e.g., along transmission linerights-of-way) could preserve and enhance habitat values. Any construction in, or affectingaquatic habitats and wetlands, would be conducted in accordance with applicable permitconditions. Similarly, potential intake and discharge effects on aquatic organisms (e.g.,impingement, entrainment, thermal effects) would be subject to protective regulations.Based on the above considerations and general assumptions of this evaluation, FPLexpects that construction and operation of the gas-fired generation alternative andassociated offsite facilities would result in little or no noticeable change in available habitatand that populations of important species in the area would not be noticeably affected.Therefore, direct impacts on ecological resources would be appropriately considered to beSMALL to MODERATE.
Indirect impacts that could result from construction of a new natural gas pipeline into centralFlorida would similarly depend on pipeline routing. Assuming that routing is established onthe basis of an appropriate pipeline routing study, impacts on ecological resources shouldbe SMALL to MODERATE.
7.2.2.3.3 WATER QUALITY
The potential sources of adverse impact on water quality from the gas-fired generationalternative are essentially the same as discussed for the coal- and oil-fired generationalternatives. However, FPL would expect that potential impacts would be relatively smallerbecause less land would be disturbed, potentially less construction in aquatic habitat wouldbe required (e.g., no barge channel construction), and a smaller quantity of water would berequired for cooling (Ref. 7.0-1, Table 8.2). On the basis of rationale provided for previousalternatives (e.g., adherence to regulatory requirements), potential adverse impacts onwater quality from this alternative would be SMALL.
LICENSE RENEWAL APPLICATIONST. LUCIE UNITS 1 & 2
CHAPTER 7.0 ALTERNATIVES TO THE PROPOSED ACTION Page 7.2-31
7.2.2.3.4 AIR QUALITY
Natural gas is a relatively clean-burning fuel, and the gas-fired generation alternative wouldrelease similar types of emissions but in much smaller quantities than the coal- and oil-firedgeneration alternatives, excluding particulates emissions. Control technology for gas-firedturbines focuses on nitrogen oxide emissions. FPL estimates the gas-fired generationalternative emissions to be as follows:
SOx = 165 tons per year
NOx = 669 tons per year
CO = 1,545 tons per year
Particulates (filterable) = 98 tons per year (all particulates are PM10)
Table 7.2-8 shows the FPL calculations for these emissions.
The discussion in Section 7.2.2.1 of regional air quality and CAA requirements is alsoapplicable to the gas-fired generation alternative. The effect of NOx emissions on ozonelevels, SO2 allowances, and nitrogen oxide emissions offsets could all be issues of concernfor gas-fired combustion. While gas-fired turbine emissions are less than coal- and oil-firedboiler emissions, and regulatory requirements are less stringent, the emissions are stillsubstantial. However, site-specific modeling would be necessary to determine whether theemissions would noticeably alter local air quality. In the absence of modeling, and in orderto avoid overstating the impacts, FPL concludes that the impacts of the gas-fired generationalternative on air quality would be SMALL.
7.2.2.3.5 WASTE MANAGEMENT
Gas-fired generation would result in little waste generation, producing minor, if any, impacts.FPL concludes that gas-fired generation waste management impacts would be SMALL.
7.2.2.3.6 HUMAN HEALTH
The GEIS mentions potential gas-fired generation alternative risks that are associated withair emissions. Regulatory requirements imposed on air emissions are designed to protecthuman health. Compliance with those requirements should keep any impacts on humanhealth SMALL.
7.2.2.3.7 SOCIOECONOMICS
FPL notes that the substantially smaller construction and operating workforces needed for agas-fired combined-cycle plant would result in smaller socioeconomic impacts than for acomparably sized coal- or oil-fired plant at the same site, although the types of impactsobserved would be essentially the same.
The DOE’s evaluation of the Griffith Energy Project indicates that a 520- to 650-MW two-unitcombined-cycle plant could be constructed in 18-22 months with a peak workforce of 350workers, and could be operated by 22 full-time staff, assuming remote monitoring anddispatching and outsourcing of such functions as major turbine and generator maintenance(Ref. 7.2-20, Sections 2.1.1.3, 2.1.1.4). The NRC has indicated that a 1,760-MW four-unit
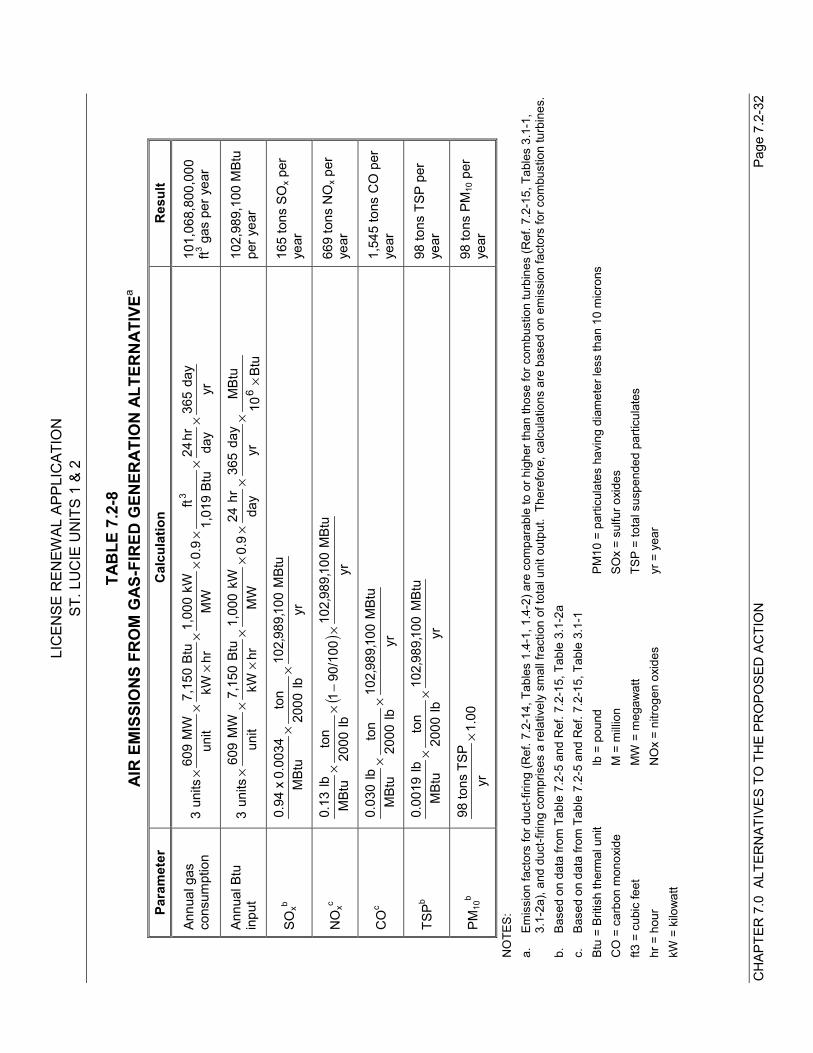
LIC
ENSE
REN
EWAL
APP
LIC
ATIO
NST
. LU
CIE
UN
ITS
1 &
2
CH
APTE
R 7
.0 A
LTER
NAT
IVES
TO
TH
E PR
OPO
SED
AC
TIO
NPa
ge 7
.2-3
2
TAB
LE 7
.2-8
AIR
EM
ISSI
ON
S FR
OM
GAS
-FIR
ED G
ENER
ATIO
N A
LTER
NAT
IVEa
Para
met
erC
alcu
latio
nR
esul
t
Annu
al g
asco
nsum
ptio
nyrda
y36
5da
yhr24
Btu
1,01
9ft0.
9M
WkW
1,00
0hr
kWBt
u7,
150
unitM
W60
9un
its3
3×
××
××
××
×10
1,06
8,80
0,00
0ft3 g
as p
er y
ear
Annu
al B
tuin
put
Btu
10M
Btu
yrday
365
dayhr
240.
9M
WkW
1,00
0hr
kWBt
u7,
150
unitM
W60
9un
its3
6×
××
××
××
××
102,
989,
100
MBt
upe
r yea
r
SOxb
yrM
Btu
100
989
102
lb20
00ton
MBt
u0.
0034
x
0.94
,,
××
165
tons
SO
x per
year
NO
xc(
)yr
MBt
u10
098
910
290
/100
1lb
2000to
nM
Btulb
0.13
,,
×−
××
669
tons
NO
x per
year
CO
c
yrM
Btu
100
989
102
lb20
00ton
MBt
ulb0.
030
,,
××
1,54
5 to
ns C
O p
erye
ar
TSPb
yrM
Btu
10
098
910
2lb
2000to
nM
Btulb
0.00
19,
,×
×98
tons
TSP
per
year
PM10
b1.
00yr
TSP
tons
98×
98 to
ns P
M10
per
year
NO
TES:
a.Em
issi
on fa
ctor
s fo
r duc
t-firi
ng (R
ef. 7
.2-1
4, T
able
s 1.
4-1,
1.4
-2) a
re c
ompa
rabl
e to
or h
ighe
r tha
n th
ose
for c
ombu
stio
n tu
rbin
es (R
ef. 7
.2-1
5, T
able
s 3.
1-1,
3.
1-2a
), an
d du
ct-fi
ring
com
pris
es a
rela
tivel
y sm
all f
ract
ion
of to
tal u
nit o
utpu
t. T
here
fore
, cal
cula
tions
are
bas
ed o
n em
issi
on fa
ctor
s fo
r com
bust
ion
turb
ines
.b.
Base
d on
dat
a fro
m T
able
7.2
-5 a
nd R
ef. 7
.2-1
5, T
able
3.1
-2a
c.Ba
sed
on d
ata
from
Tab
le 7
.2-5
and
Ref
. 7.2
-15,
Tab
le 3
.1-1
Btu
= Br
itish
ther
mal
uni
tlb
= p
ound
PM10
= p
artic
ulat
es h
avin
g di
amet
er le
ss th
an 1
0 m
icro
nsC
O =
car
bon
mon
oxid
eM
= m
illion
SOx
= su
lfur o
xide
sft3
= c
ubic
feet
MW
= m
egaw
att
TSP
= to
tal s
uspe
nded
par
ticul
ates
hr =
hou
rN
Ox
= ni
troge
n ox
ides
yr =
yea
rkW
= k
ilow
att
LICENSE RENEWAL APPLICATIONST. LUCIE UNITS 1 & 2
CHAPTER 7.0 ALTERNATIVES TO THE PROPOSED ACTION Page 7.2-33
combined-cycle plant could be constructed in three years with average and peak workforcesof 500 and 750 workers, respectively, and operated with 125 workers (Ref. 7.2-4,Section 8.2.2.1). Considering these estimates and assuming that construction of thealternative gas-fired plant would be staged to facilitate replacement of St. Lucie Unit 1 in2016 and St. Lucie Unit 2 in 2023, FPL estimates that the first two units could beconstructed as a single project in two to three years with a peak workforce of less than 700,and that the operating workforce for the fully developed plant would be below the 125-worker estimate cited by the NRC for a comparable facility.
These workforce requirements are modest. Considering also the proximity of a greenfieldsite to population centers, as discussed for the coal-fired generation alternative, FPLconcludes that increased demand for housing and public services during construction andoperation would not result in appreciable adverse effects even for communities in the sitevicinity. Therefore, these impacts are considered to be SMALL.
Locating the gas-fired plant in the St. Lucie-Martin combined-county vicinity would providefew jobs to offset those lost as a result of shutdown of St. Lucie Units 1 & 2; however, theselosses are expected to result in only SMALL impacts regardless of the alternative plantlocation. Similarly, locating the gas-fired generation alternative in the St. Lucie-Martincombined-county area would provide partial replacement of tax revenue losses to St. LucieCounty resulting from shutdown of St. Lucie Units 1 & 2, and better ensure that resultantlocal impacts resulting from this revenue loss would be SMALL.
7.2.2.3.8 AESTHETICS
The combustion turbines and heat recovery steam generators would be relatively lowstructures that could be visible at a moderate offsite distance depending on the areachosen. Taller structures, most notably the exhaust stacks (130-230 feet, based on NRCand DOE descriptions of comparable facilities), and cooling tower vapor plumes would bevisible for greater distances off site. Aesthetic resource impacts would be noticeable, butwould not exert a destabilizing effect. FPL concludes that the gas-fired generationalternative aesthetics impacts would be SMALL to MODERATE.
7.2.2.3.9 CULTURAL RESOURCES
The greenfield site for the gas-fired generating plant and associated offsite facilities wouldbe located on previously disturbed areas, and appropriate efforts would be made to ensurethat resources are appropriately protected. For the same reasons cited for the coal- and oil-fired generation alternatives, FPL concludes that impacts of the gas-fired generationalternative to cultural resources would be SMALL, if any.
7.2.2.4 PURCHASE POWER
As discussed in Section 7.2.1.2, FPL assumes that the generating technology employedunder the purchase power alternative would be one of those that the NRC analyzed in theGEIS. FPL is adopting by reference the NRC analysis of the environmental impacts fromthose technologies. Therefore, under the purchase power alternative, environmentalimpacts would still occur, but would be located elsewhere, probably within the southeasternUnited States.
LICENSE RENEWAL APPLICATIONST. LUCIE UNITS 1 & 2
CHAPTER 7.0 ALTERNATIVES TO THE PROPOSED ACTION Page 7.2-34
The purchase power alternative would include adding as much as 200-300 miles oftransmission lines to transmit power (perhaps from the State line) to meet the demand incentral Florida that is satisfied by St. Lucie Units 1 & 2. Assuming a 350-foot ROW, thiscould affect 8,500-12,700 acres of land with associated impact on land use and relatedecological resources (e.g., aesthetics). FPL assumes that the transmission line constructionmostly would be on previously disturbed land along existing transmission line rights-of-way,and concludes that the impact on land use and related resources in these segments wouldbe small to moderate. Generally, changes would be so minor that they would neitherdestabilize nor noticeably alter any important attributes of these resources. However, giventhe length of the transmission lines, it is reasonable to assume changes to land use andrelated resources would be clearly noticeable in some transmission line segments, acharacteristic of MODERATE impact.
LICENSE RENEWAL APPLICATIONST. LUCIE UNITS 1 & 2
CHAPTER 7.0 ALTERNATIVES TO THE PROPOSED ACTION Page 7.3-1
7.3 REFERENCES
7.0-1 U.S. Nuclear Regulatory Commission. Generic Environmental Impact Statementfor License Renewal of Nuclear Plants. NUREG-1437. Office of NuclearRegulatory Research. Washington, D.C. May 1996.
7.0-2 U.S. Nuclear Regulatory Commission. “Environmental Review for Renewal ofNuclear Power Plant Operating Licenses.” Federal Register. Vol. 61, No. 244.(December 18, 1996): 66537-54.
7.1-1 U.S. Nuclear Regulatory Commission. Final Generic Environmental ImpactStatement on Decommissioning of Nuclear Facilities. NUREG-0586. Office ofNuclear Regulatory Research. Washington, D.C. August 1988.
7.2-1 Energy Information Administration. State Electricity Profiles - Florida. November25, 2000 (data through 1998).www.eia.doe.gov/cneaf/electricity/st_profiles/florida.pdf. Accessed February 4,2001.
7.2-2 Florida Power & Light Company. FPL Ten Year Power Plant Site Plan; 2001-2010. Miami, Florida. April 2001.
7.2-3 Florida Power & Light Company. FPL Ten Year Power Plant Site Plan; 2000-2009. Miami, Florida. April 2000.
7.2-4 U.S. Nuclear Regulatory Commission. Generic Environmental Impact Statementfor License Renewal of Nuclear Plants: Calvert Cliffs Nuclear Power Plant.NUREG-1437, Supplement 1. Office of Nuclear Reactor Regulation.Washington, D.C. October 1999.
7.2-5 U.S. Nuclear Regulatory Commission. Generic Environmental Impact Statementfor License Renewal of Nuclear Plants: Oconee Nuclear Station. NUREG-1437,Supplement 2. Office of Nuclear Reactor Regulation. Washington, D.C.December 1999.
7.2-6 U.S. Nuclear Regulatory Commission. Generic Environmental Impact Statementfor License Renewal of Nuclear Plants: Arkansas Nuclear One, Unit 1. NUREG-1437, Supplement 3. Office of Nuclear Reactor Regulation. Washington, D.C.April 2001.
7.2-7 U.S. Nuclear Regulatory Commission. Generic Environmental Impact Statementfor License Renewal of Nuclear Plants: Edwin I. Hatch Nuclear Plant, Units 1 & 2.NUREG-1437, Supplement 4. Office of Nuclear Reactor Regulation.Washington, D.C. May 2001.
LICENSE RENEWAL APPLICATIONST. LUCIE UNITS 1 & 2
CHAPTER 7.0 ALTERNATIVES TO THE PROPOSED ACTION Page 7.3-2
7.2-8 U.S. Environmental Protection Agency. Compilation of Air Pollutant EmissionFactors. Vol. 1, Stationary Point and Area Sources. Chapter 1, ExternalCombustion Sources, Section 1.1, “Bituminous and Subbituminous CoalCombustion.” AP-42. September 1998.www.epa.gov/ttn/chief/ap42/ch01/final/c01s01.pdf. Accessed February 5, 2001.
7.2-9 Energy Information Administration. Electric Power Annual 1999. Volume 2,Table 28, “Average Quality of Fossil Fuels Burned at U.S. Electric Utilities byCensus Division and State, 1998 and 1999.” DOE/EPA-0348(99/2.October 2000. Available at www.eia.doe.gov/cneaf/electricity/epav2/epav2.pdf.
7.2-10 U.S. Environmental Protection Agency. Compilation of Air Pollutant EmissionFactors. Vol. 1, Stationary Point and Area Sources. Chapter 1, ExternalCombustion Sources, Section 1.3, “Fuel Oil Combustion.” AP-42. September1998, and Errata to Section 1.3, April 28, 2000.www.epa.gov/ttn/chief/ap42/ch01/final/c01s03.pdf. Accessed February 5, 2001.
7.2-11 U.S. Environmental Protection Agency. Air Pollution Emission Factors. Vol. 1,Stationary Point and Area Sources. Appendix A, “Miscellaneous Data &Conversion Factors.” AP-42. September 1985.www.epa.gov/ttn/chief/ap42/appendix/appol.pdf. Accessed May 2, 2001.
7.2-12 Florida Public Service Commission. Review of Electric Utility 2000 Ten-Year SitePlans. Tallahassee, Florida. December 2000.
7.2-13 GULFSTREAM: Project Description. www.gulfstream gas.com/project.html.Accessed July 30, 2001.
7.2-14 U.S. Environmental Protection Agency. Compilation of Air Pollutant EmissionFactors. Vol. 1, Stationary Point Sources and Area Sources. Chapter 1,External Combustion Sources, Section 1.4, “Natural Gas Combustion.” AP-42.July 1998.www.epa.gov/ttn/chief/ap42/ch01/final/c01s04.pdf. Accessed February 21, 2001.
7.2-15 U.S. Environmental Protection Agency. Compilation of Air Pollutant EmissionFactors. Vol. 1, Stationary Point and Area Sources. Chapter 3, StationaryInternal Combustion Sources, Section 3.1, “Stationary Gas Turbines forElectricity Generation.” AP-42. October 1996.www.epa.gov/ttn/chief/ap42/ch03/final/c03s01.pdf. Accessed February 5, 2001.
7.2-16 Florida Power & Light Company. FPL Conservation and Load Control Programs.www.fpl.com/about/profile/contents/reducing_demand/shtml. Accessed April 30,2001.
7.2-17 Florida Department of Environmental Protection. Air Monitoring Report. Divisionof Air Resources Management. Tallahassee, Florida. 2000.
LICENSE RENEWAL APPLICATIONST. LUCIE UNITS 1 & 2
CHAPTER 7.0 ALTERNATIVES TO THE PROPOSED ACTION Page 7.3-3
7.2-18 U.S. Census Bureau. American FactFinder. Detailed Tables, P001. Persons.Data Set: 1990 Summary Tape File 3. http://factfinder.census.gov. AccessedJanuary 29, 2001.
7.2-19 Smith, S. K. and J. Nagle. “Projections of Florida Population by County,” FloridaPopulation Studies. Vol. 33, No. 2. Bulletin 126. Population Program, Bureau ofEconomic and Business Research, University of Florida. Tallahassee, Florida.February 2000.
7.2-20 U.S. Department of Energy. Griffith Energy Project Draft Environmental ImpactStatement. DOE/EIS-0297. Western Area Power Administration. Kingman,Arizona. October 1998.
LICENSE RENEWAL APPLICATIONST. LUCIE UNITS 1 & 2
CHAPTER 8.0 COMPARISON OF ENVIRONMENTAL IMPACT OF Page 8.0-1LICENSE RENEWAL WITH THE ALTERNATIVES
8.0 COMPARISON OF ENVIRONMENTAL IMPACTS OF LICENSERENEWAL WITH THE ALTERNATIVES
NRC“To the extent practicable, the environmental impacts of the proposal and the alternativesshould be presented in comparative form...” 10 CFR 51.45(b)(3) as adopted by 51.53(c)(2)
Florida Power & Light Company (FPL) has presented its evaluation of environmentalimpacts associated with renewal of the operating licenses for St. Lucie Units 1 & 2 inChapter 4.0, and impacts associated with alternatives to license renewal in Chapter 7.0.Table 8.0-1 summarizes the environmental impacts of the proposed action (license renewal)and the alternatives in a comparative format. The environmental impacts summarized inTable 8.0-1 consist of Category 2 issues associated with the proposed action and issuesthat the U.S. Nuclear Regulatory Commission (NRC) identified in the Generic EnvironmentalImpact Statement for License Renewal of Nuclear Plants (GEIS) (Ref 8.0-1, Section 8.1) asmajor considerations in an alternatives analysis. For example, the NRC concluded in theGEIS that air quality and resultant human health impacts from the proposed action would besmall (Category 1), but noted the potential for major human health concerns associated withair emissions from fossil-fuel generation alternatives (see Section 7.2.2.1). Therefore, Table8.0-1 compares the air quality impacts among the proposed action and the evaluatedalternatives. Table 8.0-2 provides a more detailed impacts comparison.
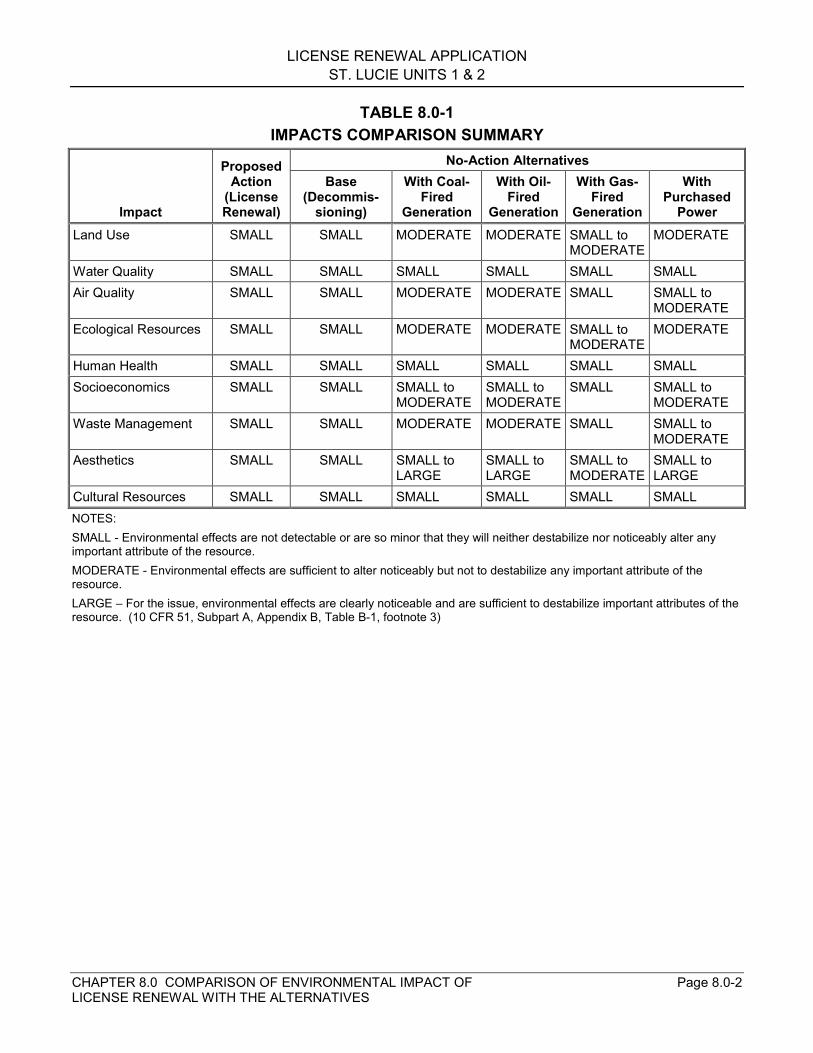
LICENSE RENEWAL APPLICATIONST. LUCIE UNITS 1 & 2
CHAPTER 8.0 COMPARISON OF ENVIRONMENTAL IMPACT OF Page 8.0-2LICENSE RENEWAL WITH THE ALTERNATIVES
TABLE 8.0-1IMPACTS COMPARISON SUMMARY
No-Action Alternatives
Impact
ProposedAction
(LicenseRenewal)
Base(Decommis-
sioning)
With Coal-Fired
Generation
With Oil-Fired
Generation
With Gas-Fired
Generation
WithPurchased
PowerLand Use SMALL SMALL MODERATE MODERATE SMALL to
MODERATEMODERATE
Water Quality SMALL SMALL SMALL SMALL SMALL SMALLAir Quality SMALL SMALL MODERATE MODERATE SMALL SMALL to
MODERATEEcological Resources SMALL SMALL MODERATE MODERATE SMALL to
MODERATEMODERATE
Human Health SMALL SMALL SMALL SMALL SMALL SMALLSocioeconomics SMALL SMALL SMALL to
MODERATESMALL toMODERATE
SMALL SMALL toMODERATE
Waste Management SMALL SMALL MODERATE MODERATE SMALL SMALL toMODERATE
Aesthetics SMALL SMALL SMALL toLARGE
SMALL toLARGE
SMALL toMODERATE
SMALL toLARGE
Cultural Resources SMALL SMALL SMALL SMALL SMALL SMALLNOTES:SMALL - Environmental effects are not detectable or are so minor that they will neither destabilize nor noticeably alter anyimportant attribute of the resource.MODERATE - Environmental effects are sufficient to alter noticeably but not to destabilize any important attribute of theresource.LARGE – For the issue, environmental effects are clearly noticeable and are sufficient to destabilize important attributes of theresource. (10 CFR 51, Subpart A, Appendix B, Table B-1, footnote 3)
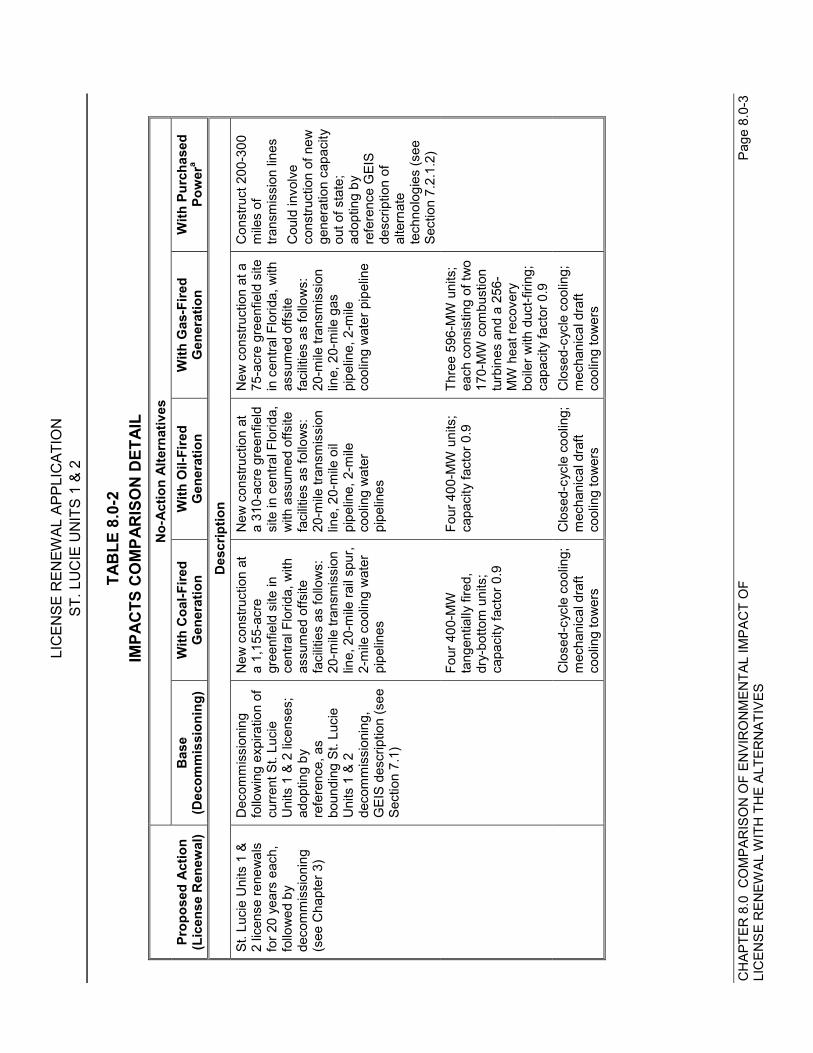
LIC
ENSE
REN
EWAL
APP
LIC
ATIO
NST
. LU
CIE
UN
ITS
1 &
2
CH
APTE
R 8
.0 C
OM
PAR
ISO
N O
F EN
VIR
ON
MEN
TAL
IMPA
CT
OF
Page
8.0
-3LI
CEN
SE R
ENEW
AL W
ITH
TH
E AL
TER
NAT
IVES
TAB
LE 8
.0-2
IMPA
CTS
CO
MPA
RIS
ON
DET
AIL
No-
Actio
n Al
tern
ativ
esPr
opos
ed A
ctio
n(L
icen
se R
enew
al)
Bas
e(D
ecom
mis
sion
ing)
With
Coa
l-Fire
dG
ener
atio
nW
ith O
il-Fi
red
Gen
erat
ion
With
Gas
-Fire
dG
ener
atio
nW
ith P
urch
ased
Pow
era
Des
crip
tion
St. L
ucie
Uni
ts 1
&2
licen
se re
new
als
for 2
0 ye
ars
each
,fo
llow
ed b
yde
com
mis
sion
ing
(see
Cha
pter
3)
Dec
omm
issi
onin
gfo
llow
ing
expi
ratio
n of
curre
nt S
t. Lu
cie
Uni
ts 1
& 2
lice
nses
;ad
optin
g by
refe
renc
e, a
sbo
undi
ng S
t. Lu
cie
Uni
ts 1
& 2
deco
mm
issi
onin
g,G
EIS
desc
riptio
n (s
eeSe
ctio
n 7.
1)
New
con
stru
ctio
n at
a 1,
155-
acre
gree
nfie
ld s
ite in
cent
ral F
lorid
a, w
ithas
sum
ed o
ffsite
faci
litie
s as
follo
ws:
20-m
ile tr
ansm
issi
onlin
e, 2
0-m
ile ra
il sp
ur,
2-m
ile c
oolin
g w
ater
pipe
lines
New
con
stru
ctio
n at
a 31
0-ac
re g
reen
field
site
in c
entra
l Flo
rida,
with
ass
umed
offs
itefa
cilit
ies
as fo
llow
s:20
-mile
tran
smis
sion
line,
20-
mile
oil
pipe
line,
2-m
ileco
olin
g w
ater
pipe
lines
New
con
stru
ctio
n at
a75
-acr
e gr
eenf
ield
site
in c
entra
l Flo
rida,
with
assu
med
offs
itefa
cilit
ies
as fo
llow
s:20
-mile
tran
smis
sion
line,
20-
mile
gas
pipe
line,
2-m
ileco
olin
g w
ater
pip
elin
e
Con
stru
ct 2
00-3
00m
iles
oftra
nsm
issi
on li
nes
Cou
ld in
volv
eco
nstru
ctio
n of
new
gene
ratio
n ca
paci
tyou
t of s
tate
;ad
optin
g by
refe
renc
e G
EIS
desc
riptio
n of
alte
rnat
ete
chno
logi
es (s
eeSe
ctio
n 7.
2.1.
2)Fo
ur 4
00-M
Wta
ngen
tially
fire
d,dr
y-bo
ttom
uni
ts;
capa
city
fact
or 0
.9
Four
400
-MW
uni
ts;
capa
city
fact
or 0
.9Th
ree
596-
MW
uni
ts;
each
con
sist
ing
of tw
o17
0-M
W c
ombu
stio
ntu
rbin
es a
nd a
256
-M
W h
eat r
ecov
ery
boile
r with
duc
t-firi
ng;
capa
city
fact
or 0
.9C
lose
d-cy
cle
cool
ing;
mec
hani
cal d
raft
cool
ing
tow
ers
Clo
sed-
cycl
e co
olin
g;m
echa
nica
l dra
ftco
olin
g to
wer
s
Clo
sed-
cycl
e co
olin
g;m
echa
nica
l dra
ftco
olin
g to
wer
s
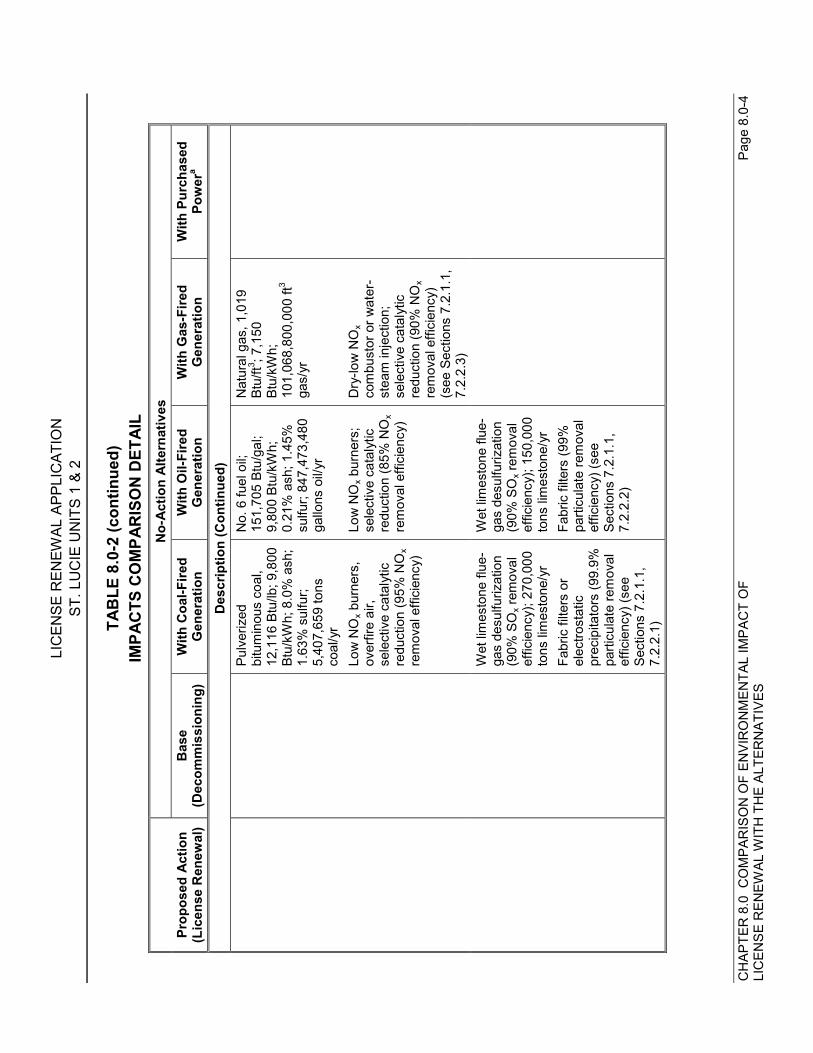
LIC
ENSE
REN
EWAL
APP
LIC
ATIO
NST
. LU
CIE
UN
ITS
1 &
2
CH
APTE
R 8
.0 C
OM
PAR
ISO
N O
F EN
VIR
ON
MEN
TAL
IMPA
CT
OF
Page
8.0
-4LI
CEN
SE R
ENEW
AL W
ITH
TH
E AL
TER
NAT
IVES
TAB
LE 8
.0-2
(con
tinue
d)IM
PAC
TS C
OM
PAR
ISO
N D
ETAI
LN
o-Ac
tion
Alte
rnat
ives
Prop
osed
Act
ion
(Lic
ense
Ren
ewal
)B
ase
(Dec
omm
issi
onin
g)W
ith C
oal-F
ired
Gen
erat
ion
With
Oil-
Fire
dG
ener
atio
nW
ith G
as-F
ired
Gen
erat
ion
With
Pur
chas
edPo
wer
a
Des
crip
tion
(Con
tinue
d)Pu
lver
ized
bitu
min
ous
coal
,12
,116
Btu
/lb; 9
,800
Btu/
kWh;
8.0
% a
sh;
1.63
% s
ulfu
r;5,
407,
659
tons
coal
/yr
No.
6 fu
el o
il;15
1,70
5 Bt
u/ga
l;9,
800
Btu/
kWh;
0.21
% a
sh; 1
.45%
sulfu
r; 84
7,47
3,48
0ga
llons
oil/
yr
Nat
ural
gas
, 1,0
19Bt
u/ft3 ; 7
,150
Btu/
kWh;
101,
068,
800,
000
ft3
gas/
yr
Low
NO
x bur
ners
,ov
erfir
e ai
r,se
lect
ive
cata
lytic
redu
ctio
n (9
5% N
Ox
rem
oval
effi
cien
cy)
Low
NO
x bur
ners
;se
lect
ive
cata
lytic
redu
ctio
n (8
5% N
Ox
rem
oval
effi
cien
cy)
Dry
-low
NO
xco
mbu
stor
or w
ater
-st
eam
inje
ctio
n;se
lect
ive
cata
lytic
redu
ctio
n (9
0% N
Ox
rem
oval
effi
cien
cy)
(see
Sec
tions
7.2
.1.1
,7.
2.2.
3)W
et li
mes
tone
flue
-ga
s de
sulfu
rizat
ion
(90%
SO
x rem
oval
effic
ienc
y); 2
70,0
00to
ns li
mes
tone
/yr
Fabr
ic fi
lters
or
elec
trost
atic
prec
ipita
tors
(99.
9%pa
rticu
late
rem
oval
effic
ienc
y) (s
eeSe
ctio
ns 7
.2.1
.1,
7.2.
2.1)
Wet
lim
esto
ne fl
ue-
gas
desu
lfuriz
atio
n(9
0% S
Ox r
emov
alef
ficie
ncy)
; 150
,000
tons
lim
esto
ne/y
rFa
bric
filte
rs (9
9%pa
rticu
late
rem
oval
effic
ienc
y) (s
eeSe
ctio
ns 7
.2.1
.1,
7.2.
2.2)
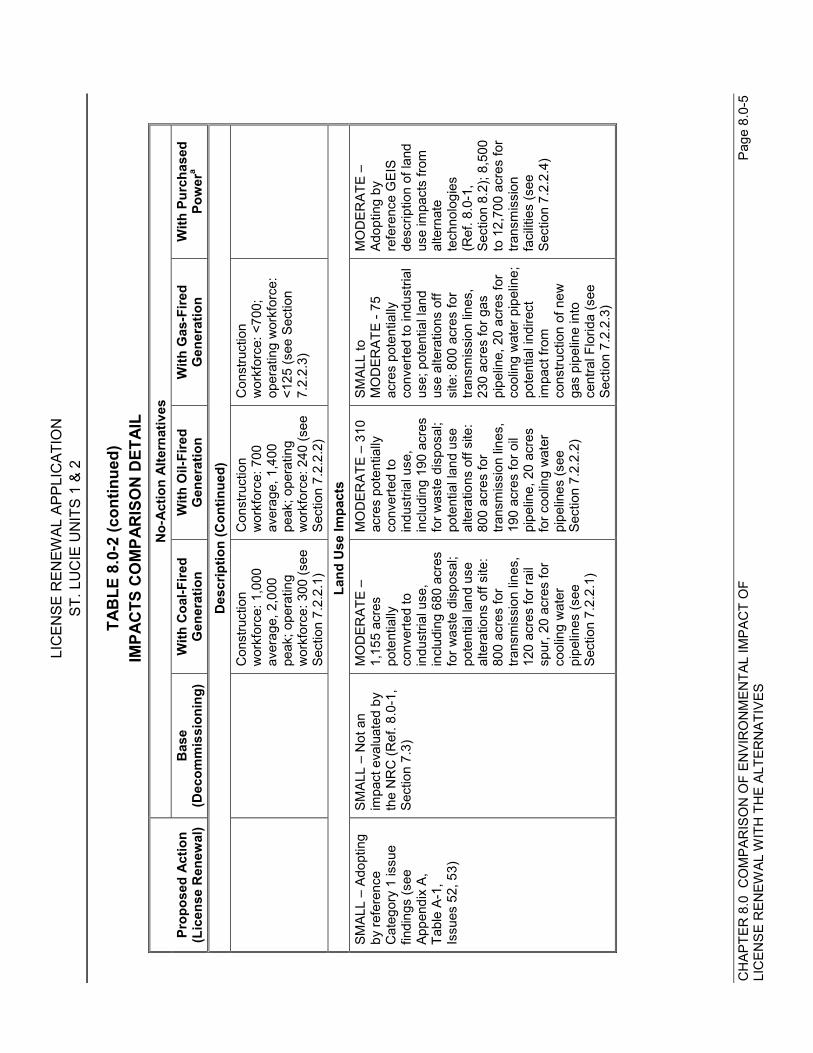
LIC
ENSE
REN
EWAL
APP
LIC
ATIO
NST
. LU
CIE
UN
ITS
1 &
2
CH
APTE
R 8
.0 C
OM
PAR
ISO
N O
F EN
VIR
ON
MEN
TAL
IMPA
CT
OF
Page
8.0
-5LI
CEN
SE R
ENEW
AL W
ITH
TH
E AL
TER
NAT
IVES
TAB
LE 8
.0-2
(con
tinue
d)IM
PAC
TS C
OM
PAR
ISO
N D
ETAI
LN
o-Ac
tion
Alte
rnat
ives
Prop
osed
Act
ion
(Lic
ense
Ren
ewal
)B
ase
(Dec
omm
issi
onin
g)W
ith C
oal-F
ired
Gen
erat
ion
With
Oil-
Fire
dG
ener
atio
nW
ith G
as-F
ired
Gen
erat
ion
With
Pur
chas
edPo
wer
a
Des
crip
tion
(Con
tinue
d)C
onst
ruct
ion
wor
kfor
ce: 1
,000
aver
age,
2,0
00pe
ak; o
pera
ting
wor
kfor
ce: 3
00 (s
eeSe
ctio
n 7.
2.2.
1)
Con
stru
ctio
nw
orkf
orce
: 700
aver
age,
1,4
00pe
ak; o
pera
ting
wor
kfor
ce: 2
40 (s
eeSe
ctio
n 7.
2.2.
2)
Con
stru
ctio
nw
orkf
orce
: <70
0;op
erat
ing
wor
kfor
ce:
<125
(see
Sec
tion
7.2.
2.3)
Land
Use
Impa
cts
SMAL
L –
Adop
ting
by re
fere
nce
Cat
egor
y 1
issu
efin
ding
s (s
eeAp
pend
ix A
,Ta
ble
A-1,
Issu
es 5
2, 5
3)
SMAL
L –
Not
an
impa
ct e
valu
ated
by
the
NR
C (R
ef. 8
.0-1
,Se
ctio
n 7.
3)
MO
DER
ATE
–1,
155
acre
spo
tent
ially
conv
erte
d to
indu
stria
l use
,in
clud
ing
680
acre
sfo
r was
te d
ispo
sal;
pote
ntia
l lan
d us
eal
tera
tions
off
site
:80
0 ac
res
for
trans
mis
sion
line
s,12
0 ac
res
for r
ail
spur
, 20
acre
s fo
rco
olin
g w
ater
pipe
lines
(see
Sect
ion
7.2.
2.1)
MO
DER
ATE
– 31
0ac
res
pote
ntia
llyco
nver
ted
toin
dust
rial u
se,
incl
udin
g 19
0 ac
res
for w
aste
dis
posa
l;po
tent
ial l
and
use
alte
ratio
ns o
ff si
te:
800
acre
s fo
rtra
nsm
issi
on li
nes,
190
acre
s fo
r oil
pipe
line,
20
acre
sfo
r coo
ling
wat
erpi
pelin
es (s
eeSe
ctio
n 7.
2.2.
2)
SMAL
L to
MO
DER
ATE
- 75
acre
s po
tent
ially
conv
erte
d to
indu
stria
lus
e; p
oten
tial l
and
use
alte
ratio
ns o
ffsi
te: 8
00 a
cres
for
trans
mis
sion
line
s,23
0 ac
res
for g
aspi
pelin
e, 2
0 ac
res
for
cool
ing
wat
er p
ipel
ine;
pote
ntia
l ind
irect
impa
ct fr
omco
nstru
ctio
n of
new
gas
pipe
line
into
cent
ral F
lorid
a (s
eeSe
ctio
n 7.
2.2.
3)
MO
DER
ATE
–Ad
optin
g by
refe
renc
e G
EIS
desc
riptio
n of
land
use
impa
cts
from
alte
rnat
ete
chno
logi
es(R
ef. 8
.0-1
,Se
ctio
n 8.
2); 8
,500
to 1
2,70
0 ac
res
for
trans
mis
sion
faci
litie
s (s
eeSe
ctio
n 7.
2.2.
4)
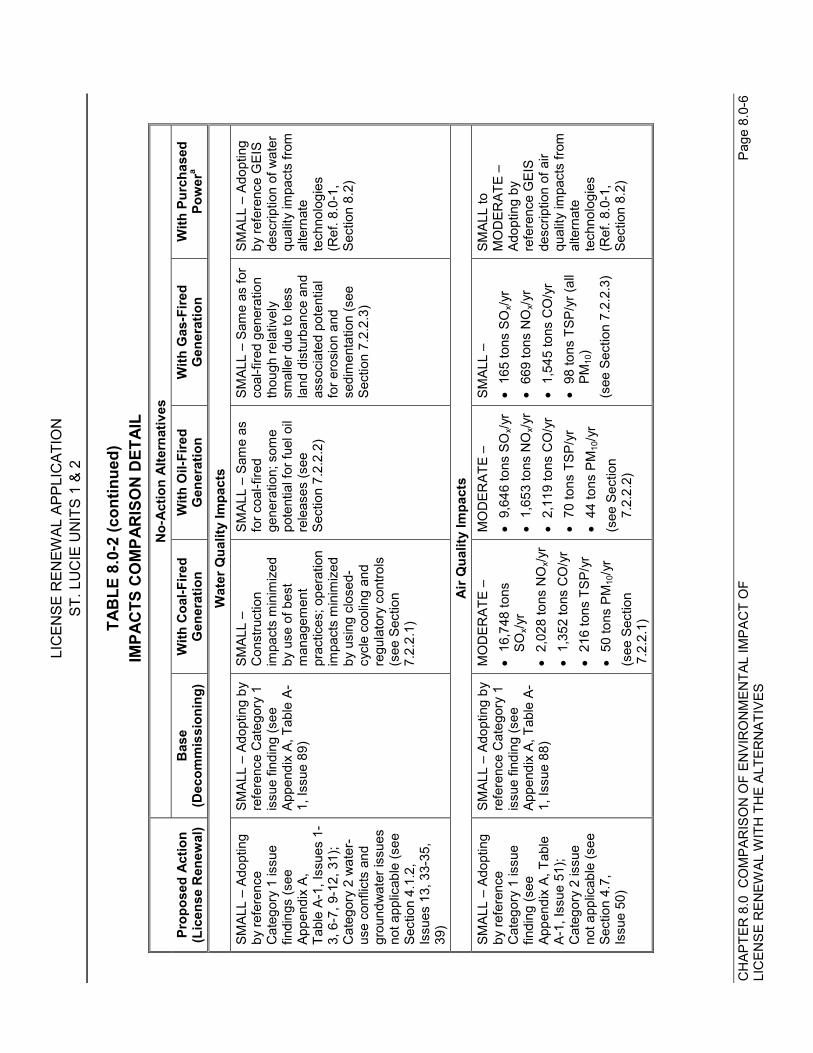
LIC
ENSE
REN
EWAL
APP
LIC
ATIO
NST
. LU
CIE
UN
ITS
1 &
2
CH
APTE
R 8
.0 C
OM
PAR
ISO
N O
F EN
VIR
ON
MEN
TAL
IMPA
CT
OF
Page
8.0
-6LI
CEN
SE R
ENEW
AL W
ITH
TH
E AL
TER
NAT
IVES
TAB
LE 8
.0-2
(con
tinue
d)IM
PAC
TS C
OM
PAR
ISO
N D
ETAI
LN
o-Ac
tion
Alte
rnat
ives
Prop
osed
Act
ion
(Lic
ense
Ren
ewal
)B
ase
(Dec
omm
issi
onin
g)W
ith C
oal-F
ired
Gen
erat
ion
With
Oil-
Fire
dG
ener
atio
nW
ith G
as-F
ired
Gen
erat
ion
With
Pur
chas
edPo
wer
a
Wat
er Q
ualit
y Im
pact
sSM
ALL
– Ad
optin
gby
refe
renc
eC
ateg
ory
1 is
sue
findi
ngs
(see
Appe
ndix
A,
Tabl
e A-
1, Is
sues
1-
3, 6
-7, 9
-12,
31)
;C
ateg
ory
2 w
ater
-us
e co
nflic
ts a
ndgr
ound
wat
er is
sues
not a
pplic
able
(see
Sect
ion
4.1.
2,Is
sues
13,
33-
35,
39)
SMAL
L –
Adop
ting
byre
fere
nce
Cat
egor
y 1
issu
e fin
ding
(see
Appe
ndix
A, T
able
A-
1, Is
sue
89)
SMAL
L –
Con
stru
ctio
nim
pact
s m
inim
ized
by u
se o
f bes
tm
anag
emen
tpr
actic
es; o
pera
tion
impa
cts
min
imiz
edby
usi
ng c
lose
d-cy
cle
cool
ing
and
regu
lato
ry c
ontro
ls(s
ee S
ectio
n7.
2.2.
1)
SMAL
L –
Sam
e as
for c
oal-f
ired
gene
ratio
n; s
ome
pote
ntia
l for
fuel
oil
rele
ases
(see
Sect
ion
7.2.
2.2)
SMAL
L –
Sam
e as
for
coal
-fire
d ge
nera
tion
thou
gh re
lativ
ely
smal
ler d
ue to
less
land
dis
turb
ance
and
asso
ciat
ed p
oten
tial
for e
rosi
on a
ndse
dim
enta
tion
(see
Sect
ion
7.2.
2.3)
SMAL
L –
Adop
ting
by re
fere
nce
GEI
Sde
scrip
tion
of w
ater
qual
ity im
pact
s fro
mal
tern
ate
tech
nolo
gies
(Ref
. 8.0
-1,
Sect
ion
8.2)
Air Q
ualit
y Im
pact
sSM
ALL
– Ad
optin
gby
refe
renc
eC
ateg
ory
1 is
sue
findi
ng (s
eeAp
pend
ix A
, Tab
leA-
1, Is
sue
51);
Cat
egor
y 2
issu
eno
t app
licab
le (s
eeSe
ctio
n 4.
7,Is
sue
50)
SMAL
L –
Adop
ting
byre
fere
nce
Cat
egor
y 1
issu
e fin
ding
(see
Appe
ndix
A, T
able
A-
1, Is
sue
88)
MO
DER
ATE
–•
16,7
48 to
nsSO
x/yr
•2,
028
tons
NO
x/yr
•1,
352
tons
CO
/yr
•21
6 to
ns T
SP/y
r•
50 to
ns P
M10
/yr
(see
Sec
tion
7.2.
2.1)
MO
DER
ATE
–•
9,64
6 to
ns S
Ox/y
r•
1,65
3 to
ns N
Ox/y
r•
2,11
9 to
ns C
O/y
r•
70 to
ns T
SP/y
r•
44 to
ns P
M10
/yr
(see
Sec
tion
7.2.
2.2)
SMAL
L –
•16
5 to
ns S
Ox/y
r•
669
tons
NO
x/yr
•1,
545
tons
CO
/yr
•98
tons
TSP
/yr (
all
PM10
)(s
ee S
ectio
n 7.
2.2.
3)
SMAL
L to
MO
DER
ATE
–Ad
optin
g by
refe
renc
e G
EIS
desc
riptio
n of
air
qual
ity im
pact
s fro
mal
tern
ate
tech
nolo
gies
(Ref
. 8.0
-1,
Sect
ion
8.2)
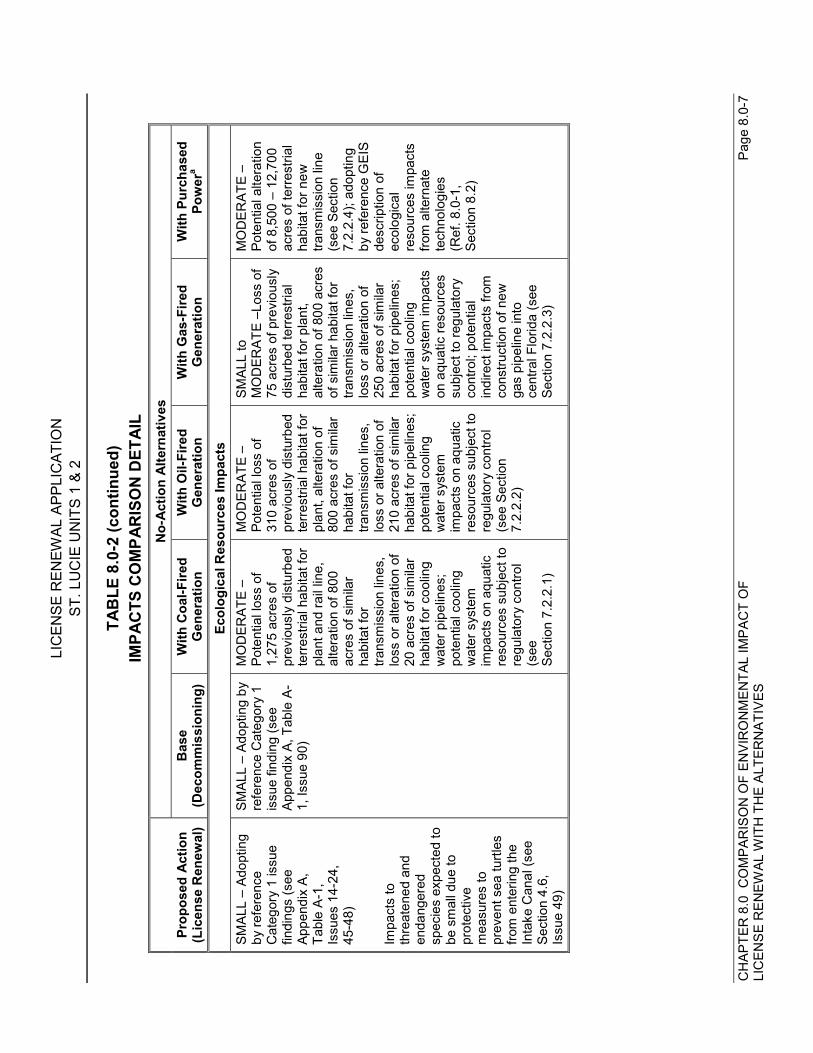
LIC
ENSE
REN
EWAL
APP
LIC
ATIO
NST
. LU
CIE
UN
ITS
1 &
2
CH
APTE
R 8
.0 C
OM
PAR
ISO
N O
F EN
VIR
ON
MEN
TAL
IMPA
CT
OF
Page
8.0
-7LI
CEN
SE R
ENEW
AL W
ITH
TH
E AL
TER
NAT
IVES
TAB
LE 8
.0-2
(con
tinue
d)IM
PAC
TS C
OM
PAR
ISO
N D
ETAI
LN
o-Ac
tion
Alte
rnat
ives
Prop
osed
Act
ion
(Lic
ense
Ren
ewal
)B
ase
(Dec
omm
issi
onin
g)W
ith C
oal-F
ired
Gen
erat
ion
With
Oil-
Fire
dG
ener
atio
nW
ith G
as-F
ired
Gen
erat
ion
With
Pur
chas
edPo
wer
a
Ecol
ogic
al R
esou
rces
Impa
cts
SMAL
L –
Adop
ting
by re
fere
nce
Cat
egor
y 1
issu
efin
ding
s (s
eeAp
pend
ix A
,Ta
ble
A-1,
Issu
es 1
4-24
,45
-48)
Impa
cts
toth
reat
ened
and
enda
nger
edsp
ecie
s ex
pect
ed to
be s
mal
l due
topr
otec
tive
mea
sure
s to
prev
ent s
ea tu
rtles
from
ent
erin
g th
eIn
take
Can
al (s
eeSe
ctio
n 4.
6,Is
sue
49)
SMAL
L –
Adop
ting
byre
fere
nce
Cat
egor
y 1
issu
e fin
ding
(see
Appe
ndix
A, T
able
A-
1, Is
sue
90)
MO
DER
ATE
–Po
tent
ial l
oss
of1,
275
acre
s of
prev
ious
ly d
istu
rbed
terre
stria
l hab
itat f
orpl
ant a
nd ra
il lin
e,al
tera
tion
of 8
00ac
res
of s
imila
rha
bita
t for
trans
mis
sion
line
s,lo
ss o
r alte
ratio
n of
20 a
cres
of s
imila
rha
bita
t for
coo
ling
wat
er p
ipel
ines
;po
tent
ial c
oolin
gw
ater
sys
tem
impa
cts
on a
quat
icre
sour
ces
subj
ect t
ore
gula
tory
con
trol
(see
Sect
ion
7.2.
2.1)
MO
DER
ATE
–Po
tent
ial l
oss
of31
0 ac
res
ofpr
evio
usly
dis
turb
edte
rrest
rial h
abita
t for
plan
t, al
tera
tion
of80
0 ac
res
of s
imila
rha
bita
t for
trans
mis
sion
line
s,lo
ss o
r alte
ratio
n of
210
acre
s of
sim
ilar
habi
tat f
or p
ipel
ines
;po
tent
ial c
oolin
gw
ater
sys
tem
impa
cts
on a
quat
icre
sour
ces
subj
ect t
ore
gula
tory
con
trol
(see
Sec
tion
7.2.
2.2)
SMAL
L to
MO
DER
ATE
–Los
s of
75 a
cres
of p
revi
ousl
ydi
stur
bed
terre
stria
lha
bita
t for
pla
nt,
alte
ratio
n of
800
acr
esof
sim
ilar h
abita
t for
trans
mis
sion
line
s,lo
ss o
r alte
ratio
n of
250
acre
s of
sim
ilar
habi
tat f
or p
ipel
ines
;po
tent
ial c
oolin
gw
ater
sys
tem
impa
cts
on a
quat
ic re
sour
ces
subj
ect t
o re
gula
tory
cont
rol;
pote
ntia
lin
dire
ct im
pact
s fro
mco
nstru
ctio
n of
new
gas
pipe
line
into
cent
ral F
lorid
a (s
eeSe
ctio
n 7.
2.2.
3)
MO
DER
ATE
–Po
tent
ial a
ltera
tion
of 8
,500
– 1
2,70
0ac
res
of te
rrest
rial
habi
tat f
or n
ewtra
nsm
issi
on li
ne(s
ee S
ectio
n7.
2.2.
4); a
dopt
ing
by re
fere
nce
GEI
Sde
scrip
tion
ofec
olog
ical
reso
urce
s im
pact
sfro
m a
ltern
ate
tech
nolo
gies
(Ref
. 8.0
-1,
Sect
ion
8.2)
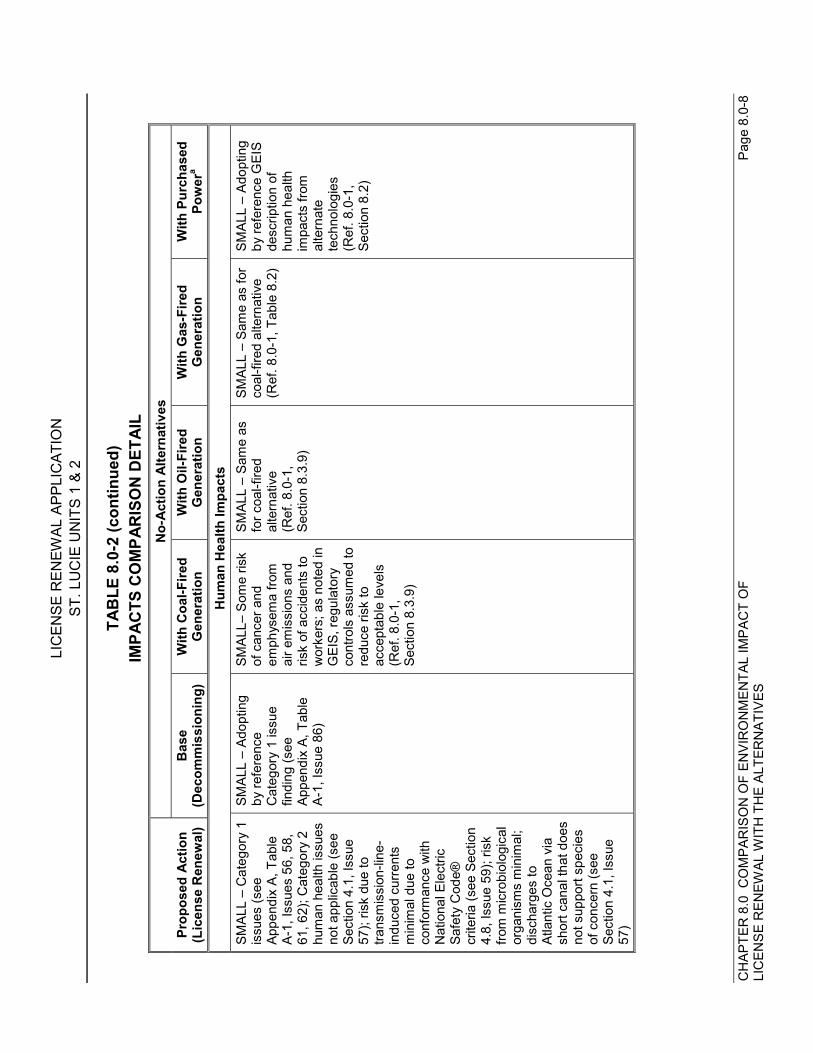
LIC
ENSE
REN
EWAL
APP
LIC
ATIO
NST
. LU
CIE
UN
ITS
1 &
2
CH
APTE
R 8
.0 C
OM
PAR
ISO
N O
F EN
VIR
ON
MEN
TAL
IMPA
CT
OF
Page
8.0
-8LI
CEN
SE R
ENEW
AL W
ITH
TH
E AL
TER
NAT
IVES
TAB
LE 8
.0-2
(con
tinue
d)IM
PAC
TS C
OM
PAR
ISO
N D
ETAI
LN
o-Ac
tion
Alte
rnat
ives
Prop
osed
Act
ion
(Lic
ense
Ren
ewal
)B
ase
(Dec
omm
issi
onin
g)W
ith C
oal-F
ired
Gen
erat
ion
With
Oil-
Fire
dG
ener
atio
nW
ith G
as-F
ired
Gen
erat
ion
With
Pur
chas
edPo
wer
a
Hum
an H
ealth
Impa
cts
SMAL
L –
Cat
egor
y 1
issu
es (s
eeAp
pend
ix A
, Tab
leA-
1, Is
sues
56,
58,
61, 6
2); C
ateg
ory
2hu
man
hea
lth is
sues
not a
pplic
able
(see
Sect
ion
4.1,
Issu
e57
); ris
k du
e to
trans
mis
sion
-line
-in
duce
d cu
rrent
sm
inim
al d
ue to
conf
orm
ance
with
Nat
iona
l Ele
ctric
Safe
ty C
ode®
crite
ria (s
ee S
ectio
n4.
8, Is
sue
59);
risk
from
mic
robi
olog
ical
orga
nism
s m
inim
al;
disc
harg
es to
Atla
ntic
Oce
an v
iash
ort c
anal
that
doe
sno
t sup
port
spec
ies
of c
once
rn (s
eeSe
ctio
n 4.
1, Is
sue
57)
SMAL
L –
Adop
ting
by re
fere
nce
Cat
egor
y 1
issu
efin
ding
(see
Appe
ndix
A, T
able
A-1,
Issu
e 86
)
SMAL
L– S
ome
risk
of c
ance
r and
emph
ysem
a fro
mai
r em
issi
ons
and
risk
of a
ccid
ents
tow
orke
rs; a
s no
ted
inG
EIS,
regu
lato
ryco
ntro
ls a
ssum
ed to
redu
ce ri
sk to
acce
ptab
le le
vels
(Ref
. 8.0
-1,
Sect
ion
8.3.
9)
SMAL
L –
Sam
e as
for c
oal-f
ired
alte
rnat
ive
(Ref
. 8.0
-1,
Sect
ion
8.3.
9)
SMAL
L –
Sam
e as
for
coal
-fire
d al
tern
ativ
e(R
ef. 8
.0-1
, Tab
le 8
.2)
SMAL
L –
Adop
ting
by re
fere
nce
GEI
Sde
scrip
tion
ofhu
man
hea
lthim
pact
s fro
mal
tern
ate
tech
nolo
gies
(Ref
. 8.0
-1,
Sect
ion
8.2)
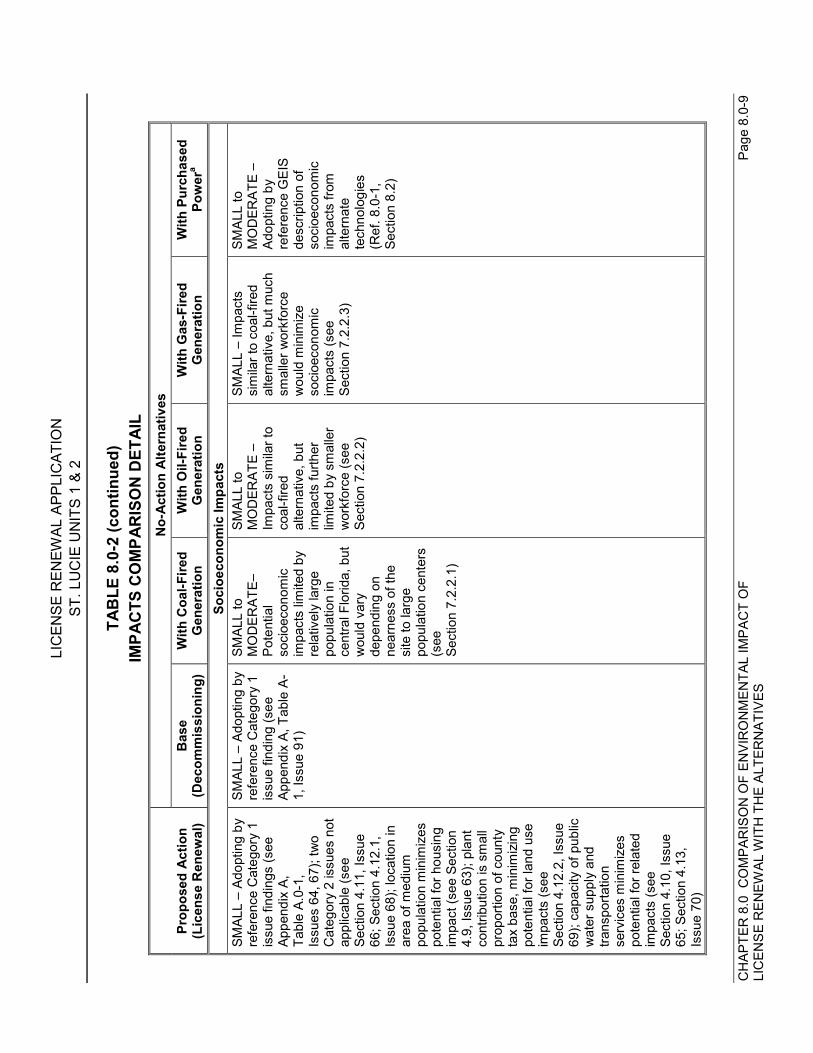
LIC
ENSE
REN
EWAL
APP
LIC
ATIO
NST
. LU
CIE
UN
ITS
1 &
2
CH
APTE
R 8
.0 C
OM
PAR
ISO
N O
F EN
VIR
ON
MEN
TAL
IMPA
CT
OF
Page
8.0
-9LI
CEN
SE R
ENEW
AL W
ITH
TH
E AL
TER
NAT
IVES
TAB
LE 8
.0-2
(con
tinue
d)IM
PAC
TS C
OM
PAR
ISO
N D
ETAI
LN
o-Ac
tion
Alte
rnat
ives
Prop
osed
Act
ion
(Lic
ense
Ren
ewal
)B
ase
(Dec
omm
issi
onin
g)W
ith C
oal-F
ired
Gen
erat
ion
With
Oil-
Fire
dG
ener
atio
nW
ith G
as-F
ired
Gen
erat
ion
With
Pur
chas
edPo
wer
a
Soci
oeco
nom
ic Im
pact
sSM
ALL
– Ad
optin
g by
refe
renc
e C
ateg
ory
1is
sue
findi
ngs
(see
Appe
ndix
A,
Tabl
e A.
0-1,
Issu
es 6
4, 6
7); t
wo
Cat
egor
y 2
issu
es n
otap
plic
able
(see
Sect
ion
4.11
, Iss
ue66
; Sec
tion
4.12
.1,
Issu
e 68
); lo
catio
n in
area
of m
ediu
mpo
pula
tion
min
imiz
espo
tent
ial f
or h
ousi
ngim
pact
(see
Sec
tion
4.9,
Issu
e 63
); pl
ant
cont
ribut
ion
is s
mal
lpr
opor
tion
of c
ount
yta
x ba
se, m
inim
izin
gpo
tent
ial f
or la
nd u
seim
pact
s (s
eeSe
ctio
n 4.
12.2
, Iss
ue69
); ca
paci
ty o
f pub
licw
ater
sup
ply
and
trans
porta
tion
serv
ices
min
imiz
espo
tent
ial f
or re
late
dim
pact
s (s
eeSe
ctio
n 4.
10, I
ssue
65; S
ectio
n 4.
13,
Issu
e 70
)
SMAL
L –
Adop
ting
byre
fere
nce
Cat
egor
y 1
issu
e fin
ding
(see
Appe
ndix
A, T
able
A-
1, Is
sue
91)
SMAL
L to
MO
DER
ATE–
Pote
ntia
lso
cioe
cono
mic
impa
cts
limite
d by
rela
tivel
y la
rge
popu
latio
n in
cent
ral F
lorid
a, b
utw
ould
var
yde
pend
ing
onne
arne
ss o
f the
site
to la
rge
popu
latio
n ce
nter
s(s
eeSe
ctio
n 7.
2.2.
1)
SMAL
L to
MO
DER
ATE
–Im
pact
s si
mila
r to
coal
-fire
dal
tern
ativ
e, b
utim
pact
s fu
rther
limite
d by
sm
alle
rw
orkf
orce
(see
Sect
ion
7.2.
2.2)
SMAL
L –
Impa
cts
sim
ilar t
o co
al-fi
red
alte
rnat
ive,
but
muc
hsm
alle
r wor
kfor
cew
ould
min
imiz
eso
cioe
cono
mic
impa
cts
(see
Sect
ion
7.2.
2.3)
SMAL
L to
MO
DER
ATE
–Ad
optin
g by
refe
renc
e G
EIS
desc
riptio
n of
soci
oeco
nom
icim
pact
s fro
mal
tern
ate
tech
nolo
gies
(Ref
. 8.0
-1,
Sect
ion
8.2)
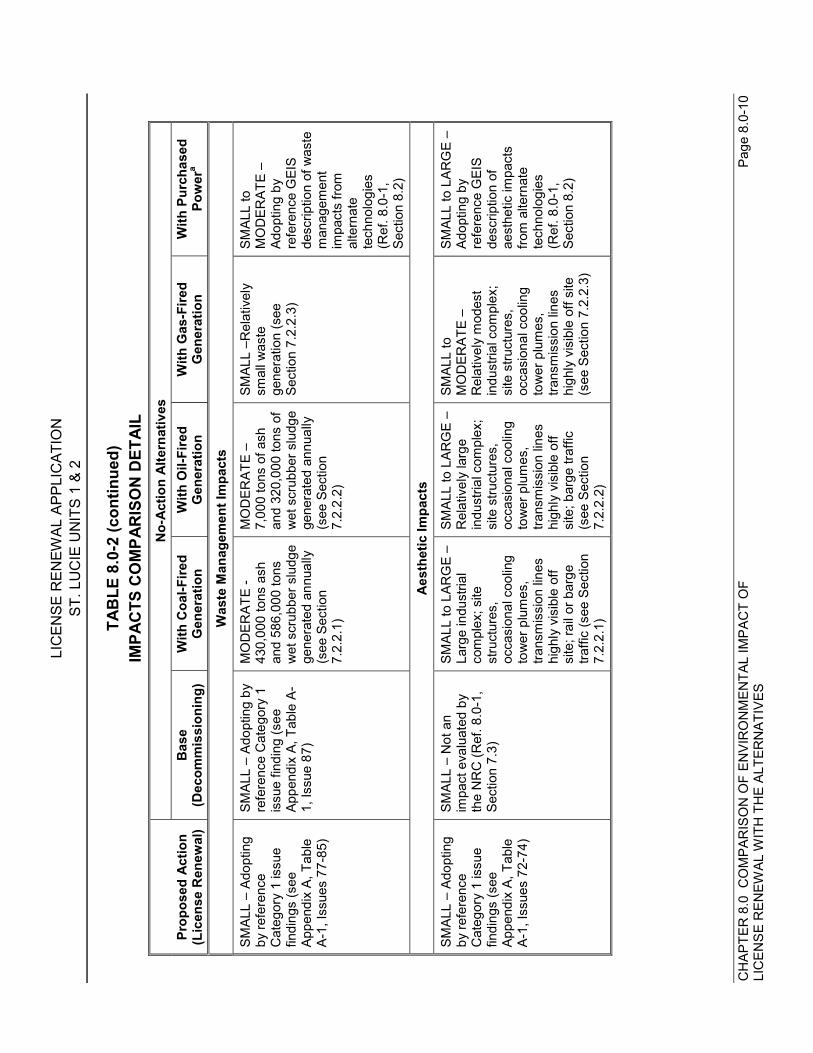
LIC
ENSE
REN
EWAL
APP
LIC
ATIO
NST
. LU
CIE
UN
ITS
1 &
2
CH
APTE
R 8
.0 C
OM
PAR
ISO
N O
F EN
VIR
ON
MEN
TAL
IMPA
CT
OF
Page
8.0
-10
LIC
ENSE
REN
EWAL
WIT
H T
HE
ALTE
RN
ATIV
ES
TAB
LE 8
.0-2
(con
tinue
d)IM
PAC
TS C
OM
PAR
ISO
N D
ETAI
LN
o-Ac
tion
Alte
rnat
ives
Prop
osed
Act
ion
(Lic
ense
Ren
ewal
)B
ase
(Dec
omm
issi
onin
g)W
ith C
oal-F
ired
Gen
erat
ion
With
Oil-
Fire
dG
ener
atio
nW
ith G
as-F
ired
Gen
erat
ion
With
Pur
chas
edPo
wer
a
Was
te M
anag
emen
t Im
pact
s
SMAL
L –
Adop
ting
by re
fere
nce
Cat
egor
y 1
issu
efin
ding
s (s
eeAp
pend
ix A
, Tab
leA-
1, Is
sues
77-
85)
SMAL
L –
Adop
ting
byre
fere
nce
Cat
egor
y 1
issu
e fin
ding
(see
Appe
ndix
A, T
able
A-
1, Is
sue
87)
MO
DER
ATE
-43
0,00
0 to
ns a
shan
d 58
6,00
0 to
nsw
et s
crub
ber s
ludg
ege
nera
ted
annu
ally
(see
Sec
tion
7.2.
2.1)
MO
DER
ATE
–7,
000
tons
of a
shan
d 32
0,00
0 to
ns o
fw
et s
crub
ber s
ludg
ege
nera
ted
annu
ally
(see
Sec
tion
7.2.
2.2)
SMAL
L –R
elat
ivel
ysm
all w
aste
gene
ratio
n (s
eeSe
ctio
n 7.
2.2.
3)
SMAL
L to
MO
DER
ATE
–Ad
optin
g by
refe
renc
e G
EIS
desc
riptio
n of
was
tem
anag
emen
tim
pact
s fro
mal
tern
ate
tech
nolo
gies
(Ref
. 8.0
-1,
Sect
ion
8.2)
Aest
hetic
Impa
cts
SMAL
L –
Adop
ting
by re
fere
nce
Cat
egor
y 1
issu
efin
ding
s (s
eeAp
pend
ix A
, Tab
leA-
1, Is
sues
72-
74)
SMAL
L –
Not
an
impa
ct e
valu
ated
by
the
NR
C (R
ef. 8
.0-1
,Se
ctio
n 7.
3)
SMAL
L to
LAR
GE
–La
rge
indu
stria
lco
mpl
ex; s
itest
ruct
ures
,oc
casi
onal
coo
ling
tow
er p
lum
es,
trans
mis
sion
line
shi
ghly
vis
ible
off
site
; rai
l or b
arge
traffi
c (s
ee S
ectio
n7.
2.2.
1)
SMAL
L to
LAR
GE
–R
elat
ivel
y la
rge
indu
stria
l com
plex
;si
te s
truct
ures
,oc
casi
onal
coo
ling
tow
er p
lum
es,
trans
mis
sion
line
shi
ghly
vis
ible
off
site
; bar
ge tr
affic
(see
Sec
tion
7.2.
2.2)
SMAL
L to
MO
DER
ATE
–R
elat
ivel
y m
odes
tin
dust
rial c
ompl
ex;
site
stru
ctur
es,
occa
sion
al c
oolin
gto
wer
plu
mes
,tra
nsm
issi
on li
nes
high
ly v
isib
le o
ff si
te(s
ee S
ectio
n 7.
2.2.
3)
SMAL
L to
LAR
GE
–Ad
optin
g by
refe
renc
e G
EIS
desc
riptio
n of
aest
hetic
impa
cts
from
alte
rnat
ete
chno
logi
es(R
ef. 8
.0-1
,Se
ctio
n 8.
2)
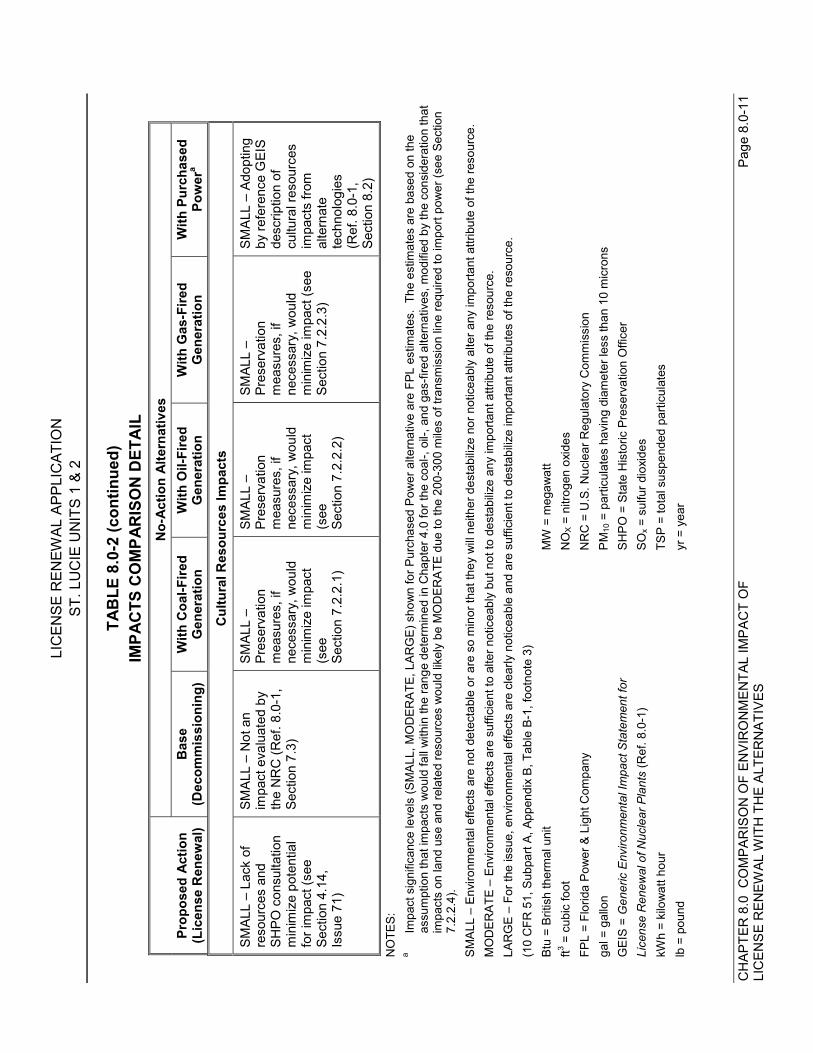
LIC
ENSE
REN
EWAL
APP
LIC
ATIO
NST
. LU
CIE
UN
ITS
1 &
2
CH
APTE
R 8
.0 C
OM
PAR
ISO
N O
F EN
VIR
ON
MEN
TAL
IMPA
CT
OF
Page
8.0
-11
LIC
ENSE
REN
EWAL
WIT
H T
HE
ALTE
RN
ATIV
ES
TAB
LE 8
.0-2
(con
tinue
d)IM
PAC
TS C
OM
PAR
ISO
N D
ETAI
LN
o-Ac
tion
Alte
rnat
ives
Prop
osed
Act
ion
(Lic
ense
Ren
ewal
)B
ase
(Dec
omm
issi
onin
g)W
ith C
oal-F
ired
Gen
erat
ion
With
Oil-
Fire
dG
ener
atio
nW
ith G
as-F
ired
Gen
erat
ion
With
Pur
chas
edPo
wer
a
Cul
tura
l Res
ourc
es Im
pact
s
SMAL
L –
Lack
of
reso
urce
s an
dSH
PO c
onsu
ltatio
nm
inim
ize
pote
ntia
lfo
r im
pact
(see
Sect
ion
4.14
,Is
sue
71)
SMAL
L –
Not
an
impa
ct e
valu
ated
by
the
NR
C (R
ef. 8
.0-1
,Se
ctio
n 7.
3)
SMAL
L –
Pres
erva
tion
mea
sure
s, if
nece
ssar
y, w
ould
min
imiz
e im
pact
(see
Sect
ion
7.2.
2.1)
SMAL
L –
Pres
erva
tion
mea
sure
s, if
nece
ssar
y, w
ould
min
imiz
e im
pact
(see
Sect
ion
7.2.
2.2)
SMAL
L –
Pres
erva
tion
mea
sure
s, if
nece
ssar
y, w
ould
min
imiz
e im
pact
(see
Sect
ion
7.2.
2.3)
SMAL
L –
Adop
ting
by re
fere
nce
GEI
Sde
scrip
tion
ofcu
ltura
l res
ourc
esim
pact
s fro
mal
tern
ate
tech
nolo
gies
(Ref
. 8.0
-1,
Sect
ion
8.2)
NO
TES:
aIm
pact
sig
nific
ance
leve
ls (S
MAL
L, M
OD
ERAT
E, L
ARG
E) s
how
n fo
r Pur
chas
ed P
ower
alte
rnat
ive
are
FPL
estim
ates
. Th
e es
timat
es a
re b
ased
on
the
assu
mpt
ion
that
impa
cts
wou
ld fa
ll w
ithin
the
rang
e de
term
ined
in C
hapt
er 4
.0 fo
r the
coa
l-, o
il-, a
nd g
as-fi
red
alte
rnat
ives
, mod
ified
by
the
cons
ider
atio
n th
atim
pact
s on
land
use
and
rela
ted
reso
urce
s w
ould
like
ly b
e M
OD
ERAT
E du
e to
the
200-
300
mile
s of
tran
smis
sion
line
requ
ired
to im
port
pow
er (s
ee S
ectio
n7.
2.2.
4).
SMAL
L –
Envi
ronm
enta
l effe
cts
are
not d
etec
tabl
e or
are
so
min
or th
at th
ey w
ill ne
ither
des
tabi
lize
nor n
otic
eabl
y al
ter a
ny im
porta
nt a
ttrib
ute
of th
e re
sour
ce.
MO
DER
ATE
– En
viro
nmen
tal e
ffect
s ar
e su
ffici
ent t
o al
ter n
otic
eabl
y bu
t not
to d
esta
biliz
e an
y im
porta
nt a
ttrib
ute
of th
e re
sour
ce.
LAR
GE
– Fo
r the
issu
e, e
nviro
nmen
tal e
ffect
s ar
e cl
early
not
icea
ble
and
are
suffi
cien
t to
dest
abiliz
e im
porta
nt a
ttrib
utes
of t
he re
sour
ce.
(10
CFR
51,
Sub
part
A, A
ppen
dix
B, T
able
B-1
, foo
tnot
e 3)
Btu
= Br
itish
ther
mal
uni
tM
W =
meg
awat
tft3 =
cub
ic fo
otN
OX
= ni
troge
n ox
ides
FPL
= Fl
orid
a Po
wer
& L
ight
Com
pany
NR
C =
U.S
. Nuc
lear
Reg
ulat
ory
Com
mis
sion
gal =
gal
lon
PM10
= p
artic
ulat
es h
avin
g di
amet
er le
ss th
an 1
0 m
icro
nsG
EIS
= G
ener
ic E
nviro
nmen
tal I
mpa
ct S
tate
men
t for
SHPO
= S
tate
His
toric
Pre
serv
atio
n O
ffice
rLi
cens
e R
enew
al o
f Nuc
lear
Pla
nts
(Ref
. 8.0
-1)
SOx =
sul
fur d
ioxi
des
kWh
= ki
low
att h
our
TSP
= to
tal s
uspe
nded
par
ticul
ates
lb =
pou
ndyr
= y
ear
LICENSE RENEWAL APPLICATIONST. LUCIE UNITS 1 & 2
CHAPTER 8.0 COMPARISON OF ENVIRONMENTAL IMPACT OF Page 8.1-1LICENSE RENEWAL WITH THE ALTERNATIVES
8.1 REFERENCES
8.0-1 U.S. Nuclear Regulatory Commission. Generic Environmental Impact Statementfor License Renewal of Nuclear Plants. NUREG-1437. Office of NuclearRegulatory Research. Washington, D.C. May 1996.
LICENSE RENEWAL APPLICATIONST. LUCIE UNITS 1 & 2
CHAPTER 9.0 STATUS OF COMPLIANCE Page 9.1-1
9.0 STATUS OF COMPLIANCE
9.1 PROPOSED ACTION
NRC“The environmental report shall list all Federal permits, licenses, approvals and otherentitlements which must be obtained in connection with the proposed action and shalldescribe the status of compliance with these requirements. The environmental report shallalso include a discussion of the status of compliance with applicable environmental qualitystandards and requirements including, but not limited to, applicable zoning and land-useregulations, and thermal and other water pollution limitations or requirements which havebeen imposed by Federal, State, regional, and local agencies having responsibility forenvironmental protection.” 10 CFR 51.45(d), as required by 10 CFR 51.53(c)(2)
9.1.1 GENERAL
Table 9.1-1 lists environmental authorizations that Florida Power & Light Company (FPL)has obtained for current St. Lucie Units 1 & 2 operations. In this context, FPL uses“authorizations” to include any permits, licenses, approvals, or other entitlements. FPLexpects to continue renewing these authorizations during the current license period andthrough the license renewal period. FPL operates St. Lucie Units 1 & 2 in compliance withapplicable environmental standards and requirements.
Table 9.1-2 lists additional environmental authorizations and consultations that would beconditions precedent to U.S. Nuclear Regulatory Commission (NRC) renewal of the St.Lucie Units 1 & 2 licenses to operate. As indicated, FPL anticipates needing relatively fewsuch authorizations and consultations. Sections 9.1.2 through 9.1.5 discuss some of theseitems in more detail.
No permits from, or consultations with, states others than Florida are necessary becauseSt. Lucie Units 1 & 2 are located on the peninsula of Florida. Given this location, the qualityof the water and air in neighboring states would not be affected by the proposed action oflicense renewal.
9.1.2 THREATENED AND ENDANGERED SPECIES CONSULTATION
Section 7 of the Endangered Species Act (16 USC 1531 et seq.) requires Federal agenciesto ensure that agency action is not likely to jeopardize any species that is listed orthreatened. Depending on the action involved, the Act requires consultation with the U.S.Fish and Wildlife Service (FWS) regarding effects on non-marine species, or the NationalMarine Fisheries Service (NMFS), for marine species, or both. FWS and NMFS have issuedjoint procedural regulations at 50 CFR 402, Subpart B, which address consultation, andFWS maintains the joint list of threatened and endangered species at 50 CFR 17.
As discussed in Section 2.4, several Federal threatened and endangered species and statespecies of special concern are found on the St. Lucie Units 1 & 2 site, along the St. LucieUnits 1 & 2 transmission line corridor, and in the vicinity of St. Lucie Units 1 & 2. Theseinclude marine and non-marine species. In preparation for the Federal consultation
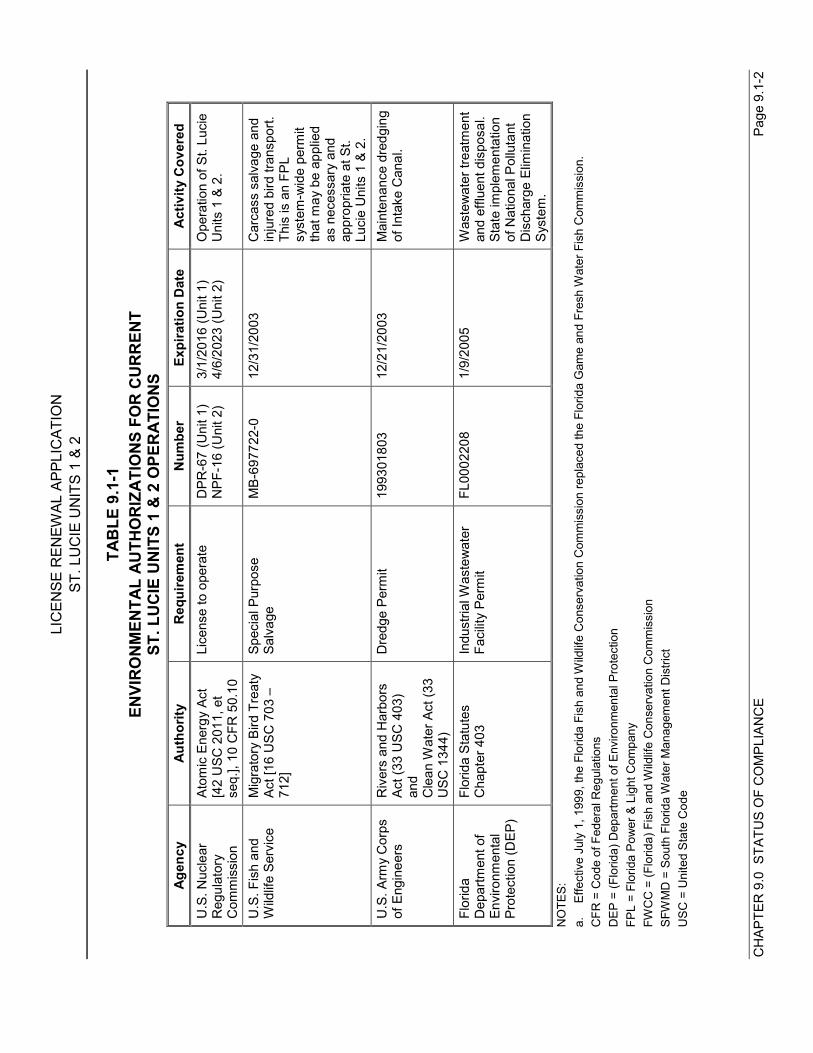
LIC
ENSE
REN
EWAL
APP
LIC
ATIO
NST
. LU
CIE
UN
ITS
1 &
2
CH
APTE
R 9
.0 S
TATU
S O
F C
OM
PLIA
NC
EPa
ge 9
.1-2
TAB
LE 9
.1-1
ENVI
RO
NM
ENTA
L AU
THO
RIZ
ATIO
NS
FOR
CU
RR
ENT
ST. L
UC
IE U
NIT
S 1
& 2
OPE
RAT
ION
SAg
ency
Auth
ority
Req
uire
men
tN
umbe
rEx
pira
tion
Dat
eAc
tivity
Cov
ered
U.S
. Nuc
lear
Reg
ulat
ory
Com
mis
sion
Atom
ic E
nerg
y Ac
t[4
2 U
SC 2
011,
et
seq.
], 10
CFR
50.
10
Lice
nse
to o
pera
teD
PR-6
7 (U
nit 1
)N
PF-1
6 (U
nit 2
)3/
1/20
16 (U
nit 1
)4/
6/20
23 (U
nit 2
)O
pera
tion
of S
t. Lu
cie
Uni
ts 1
& 2
.
U.S
. Fis
h an
dW
ildlif
e Se
rvic
eM
igra
tory
Bird
Tre
aty
Act [
16 U
SC 7
03 –
712]
Spec
ial P
urpo
seSa
lvag
eM
B-69
7722
-012
/31/
2003
Car
cass
sal
vage
and
inju
red
bird
tran
spor
t.Th
is is
an
FPL
syst
em-w
ide
perm
itth
at m
ay b
e ap
plie
das
nec
essa
ry a
ndap
prop
riate
at S
t.Lu
cie
Uni
ts 1
& 2
.U
.S. A
rmy
Cor
psof
Eng
inee
rsR
iver
s an
d H
arbo
rsAc
t (33
USC
403
)an
dC
lean
Wat
er A
ct (3
3U
SC 1
344)
Dre
dge
Perm
it19
9301
803
12/2
1/20
03M
aint
enan
ce d
redg
ing
of In
take
Can
al.
Flor
ida
Dep
artm
ent o
fEn
viro
nmen
tal
Prot
ectio
n (D
EP)
Flor
ida
Stat
utes
Cha
pter
403
Indu
stria
l Was
tew
ater
Faci
lity
Perm
itFL
0002
208
1/9/
2005
Was
tew
ater
trea
tmen
tan
d ef
fluen
t dis
posa
l.St
ate
impl
emen
tatio
nof
Nat
iona
l Pol
luta
ntD
isch
arge
Elim
inat
ion
Syst
em.
NO
TES:
a.Ef
fect
ive
July
1, 1
999,
the
Flor
ida
Fish
and
Wild
life
Con
serv
atio
n C
omm
issi
on re
plac
ed th
e Fl
orid
a G
ame
and
Fres
h W
ater
Fis
h C
omm
issi
on.
CFR
= C
ode
of F
eder
al R
egul
atio
nsD
EP =
(Flo
rida)
Dep
artm
ent o
f Env
ironm
enta
l Pro
tect
ion
FPL
= Fl
orid
a Po
wer
& L
ight
Com
pany
FWC
C =
(Flo
rida)
Fis
h an
d W
ildlif
e C
onse
rvat
ion
Com
mis
sion
SFW
MD
= S
outh
Flo
rida
Wat
er M
anag
emen
t Dis
trict
USC
= U
nite
d St
ate
Cod
e
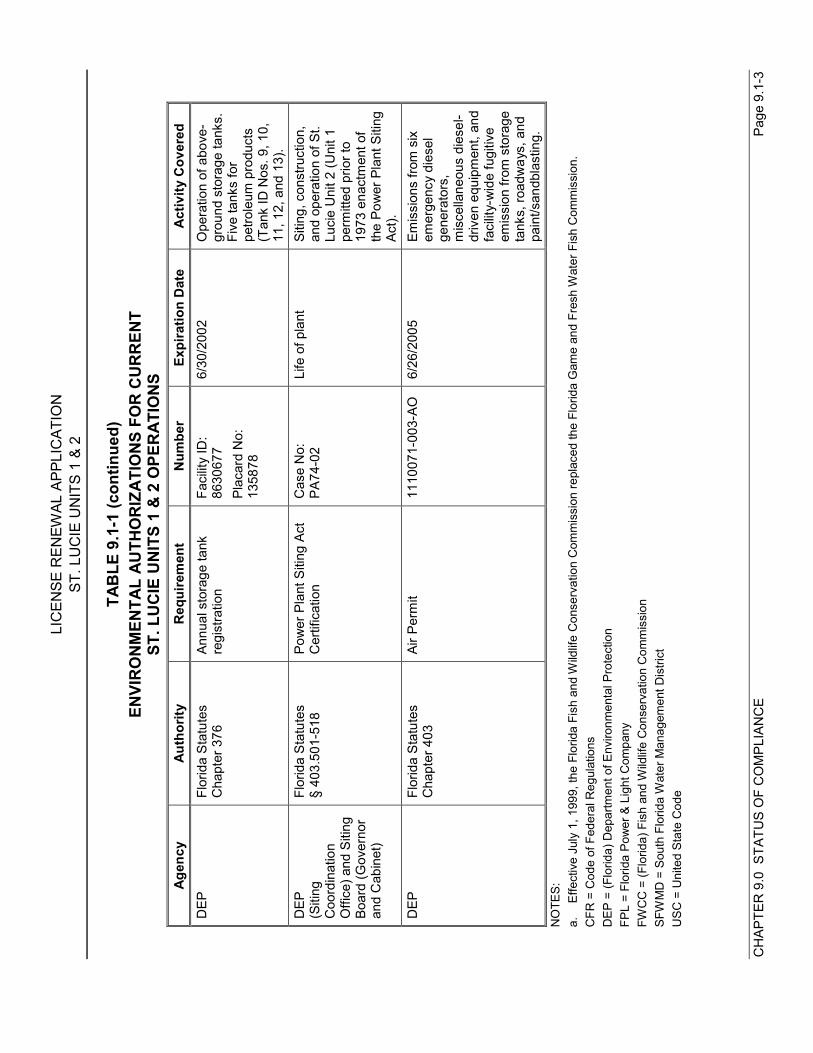
LIC
ENSE
REN
EWAL
APP
LIC
ATIO
NST
. LU
CIE
UN
ITS
1 &
2
CH
APTE
R 9
.0 S
TATU
S O
F C
OM
PLIA
NC
EPa
ge 9
.1-3
TAB
LE 9
.1-1
(con
tinue
d)EN
VIR
ON
MEN
TAL
AUTH
OR
IZAT
ION
S FO
R C
UR
REN
TST
. LU
CIE
UN
ITS
1 &
2 O
PER
ATIO
NS
Agen
cyAu
thor
ityR
equi
rem
ent
Num
ber
Expi
ratio
n D
ate
Activ
ity C
over
edD
EPFl
orid
a St
atut
esC
hapt
er 3
76An
nual
sto
rage
tank
regi
stra
tion
Faci
lity
ID:
8630
677
Plac
ard
No:
1358
78
6/30
/200
2O
pera
tion
of a
bove
-gr
ound
sto
rage
tank
s.Fi
ve ta
nks
for
petro
leum
pro
duct
s(T
ank
ID N
os. 9
, 10,
11, 1
2, a
nd 1
3).
DEP
(Siti
ngC
oord
inat
ion
Offi
ce) a
nd S
iting
Boar
d (G
over
nor
and
Cab
inet
)
Flor
ida
Stat
utes
§ 40
3.50
1-51
8Po
wer
Pla
nt S
iting
Act
Cer
tific
atio
nC
ase
No:
PA74
-02
Life
of p
lant
Sitin
g, c
onst
ruct
ion,
and
oper
atio
n of
St.
Luci
e U
nit 2
(Uni
t 1pe
rmitt
ed p
rior t
o19
73 e
nact
men
t of
the
Pow
er P
lant
Siti
ngAc
t).D
EPFl
orid
a St
atut
esC
hapt
er 4
03Ai
r Per
mit
1110
071-
003-
AO6/
26/2
005
Emis
sion
s fro
m s
ixem
erge
ncy
dies
elge
nera
tors
,m
isce
llane
ous
dies
el-
driv
en e
quip
men
t, an
dfa
cilit
y-w
ide
fugi
tive
emis
sion
from
sto
rage
tank
s, ro
adw
ays,
and
pain
t/san
dbla
stin
g.N
OTE
S:a.
Effe
ctiv
e Ju
ly 1
, 199
9, th
e Fl
orid
a Fi
sh a
nd W
ildlif
e C
onse
rvat
ion
Com
mis
sion
repl
aced
the
Flor
ida
Gam
e an
d Fr
esh
Wat
er F
ish
Com
mis
sion
.C
FR =
Cod
e of
Fed
eral
Reg
ulat
ions
DEP
= (F
lorid
a) D
epar
tmen
t of E
nviro
nmen
tal P
rote
ctio
nFP
L =
Flor
ida
Pow
er &
Lig
ht C
ompa
nyFW
CC
= (F
lorid
a) F
ish
and
Wild
life
Con
serv
atio
n C
omm
issi
onSF
WM
D =
Sou
th F
lorid
a W
ater
Man
agem
ent D
istri
ctU
SC =
Uni
ted
Stat
e C
ode
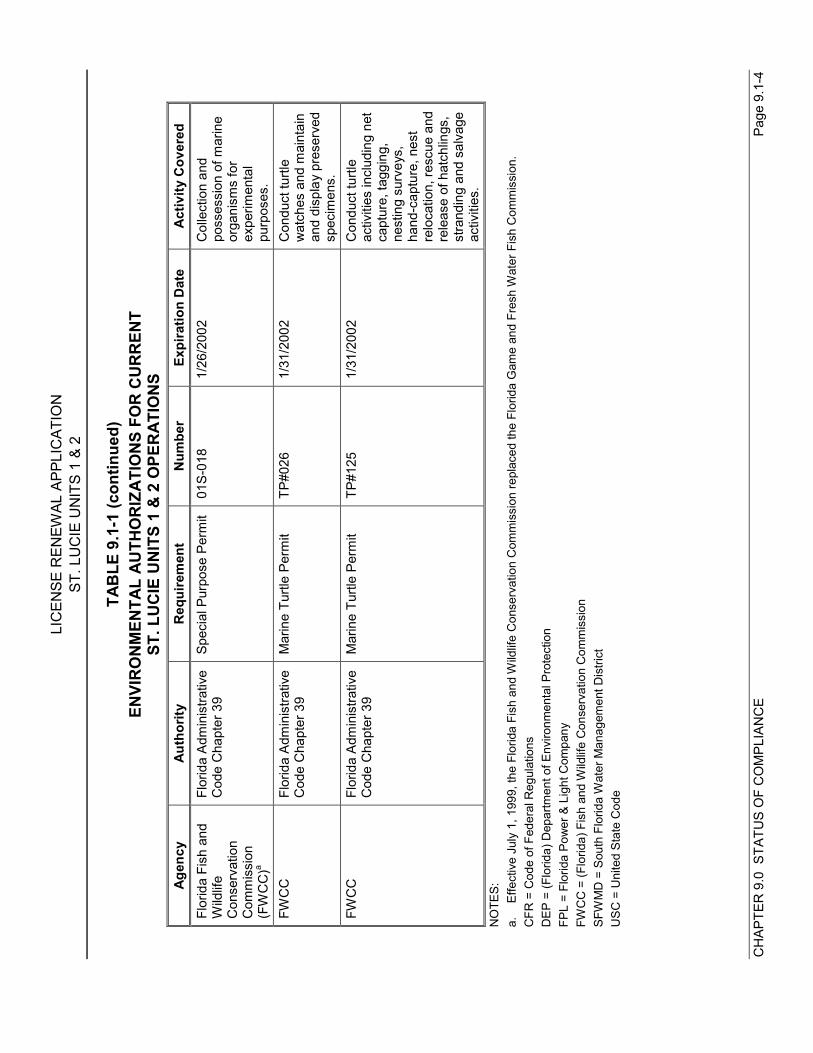
LIC
ENSE
REN
EWAL
APP
LIC
ATIO
NST
. LU
CIE
UN
ITS
1 &
2
CH
APTE
R 9
.0 S
TATU
S O
F C
OM
PLIA
NC
EPa
ge 9
.1-4
TAB
LE 9
.1-1
(con
tinue
d)EN
VIR
ON
MEN
TAL
AUTH
OR
IZAT
ION
S FO
R C
UR
REN
TST
. LU
CIE
UN
ITS
1 &
2 O
PER
ATIO
NS
Agen
cyAu
thor
ityR
equi
rem
ent
Num
ber
Expi
ratio
n D
ate
Activ
ity C
over
edFl
orid
a Fi
sh a
ndW
ildlif
eC
onse
rvat
ion
Com
mis
sion
(FW
CC
)a
Flor
ida
Adm
inis
trativ
eC
ode
Cha
pter
39
Spec
ial P
urpo
se P
erm
it01
S-01
81/
26/2
002
Col
lect
ion
and
poss
essi
on o
f mar
ine
orga
nism
s fo
rex
perim
enta
lpu
rpos
es.
FWC
CFl
orid
a Ad
min
istra
tive
Cod
e C
hapt
er 3
9M
arin
e Tu
rtle
Perm
itTP
#026
1/31
/200
2C
ondu
ct tu
rtle
wat
ches
and
mai
ntai
nan
d di
spla
y pr
eser
ved
spec
imen
s.FW
CC
Flor
ida
Adm
inis
trativ
eC
ode
Cha
pter
39
Mar
ine
Turtl
e Pe
rmit
TP#1
251/
31/2
002
Con
duct
turtl
eac
tiviti
es in
clud
ing
net
capt
ure,
tagg
ing,
nest
ing
surv
eys,
hand
-cap
ture
, nes
tre
loca
tion,
resc
ue a
ndre
leas
e of
hat
chlin
gs,
stra
ndin
g an
d sa
lvag
eac
tiviti
es.
NO
TES:
a.Ef
fect
ive
July
1, 1
999,
the
Flor
ida
Fish
and
Wild
life
Con
serv
atio
n C
omm
issi
on re
plac
ed th
e Fl
orid
a G
ame
and
Fres
h W
ater
Fis
h C
omm
issi
on.
CFR
= C
ode
of F
eder
al R
egul
atio
nsD
EP =
(Flo
rida)
Dep
artm
ent o
f Env
ironm
enta
l Pro
tect
ion
FPL
= Fl
orid
a Po
wer
& L
ight
Com
pany
FWC
C =
(Flo
rida)
Fis
h an
d W
ildlif
e C
onse
rvat
ion
Com
mis
sion
SFW
MD
= S
outh
Flo
rida
Wat
er M
anag
emen
t Dis
trict
USC
= U
nite
d St
ate
Cod
e
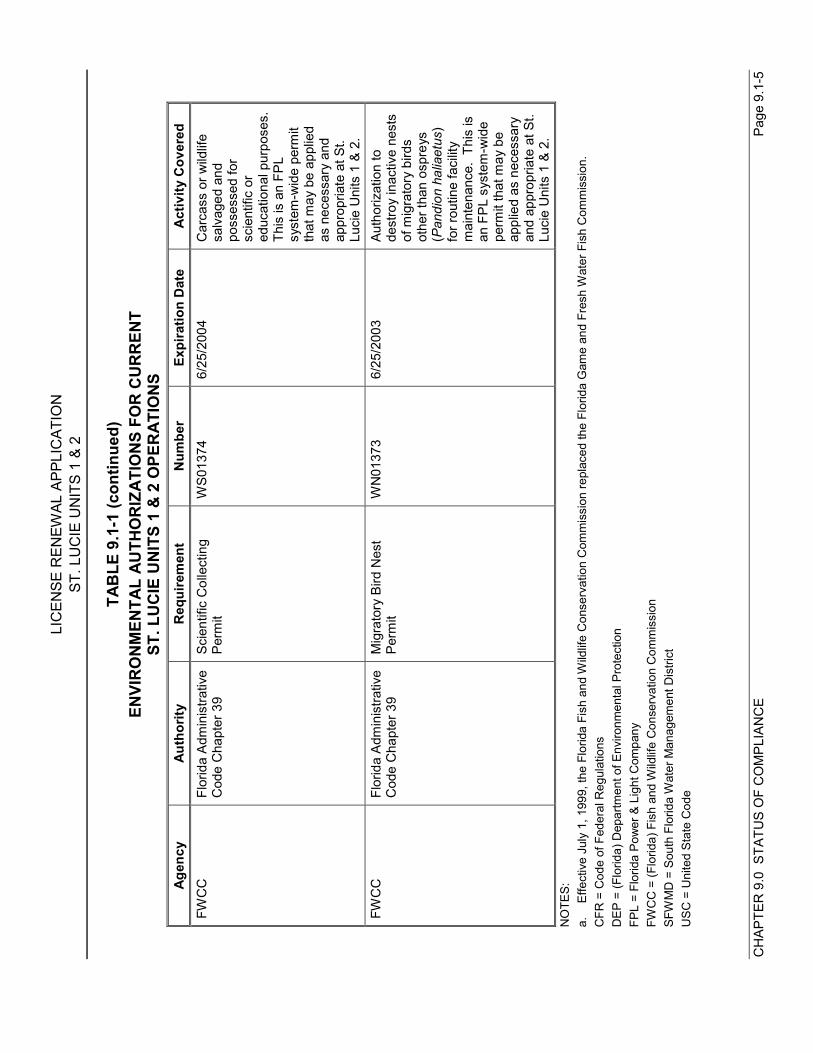
LIC
ENSE
REN
EWAL
APP
LIC
ATIO
NST
. LU
CIE
UN
ITS
1 &
2
CH
APTE
R 9
.0 S
TATU
S O
F C
OM
PLIA
NC
EPa
ge 9
.1-5
TAB
LE 9
.1-1
(con
tinue
d)EN
VIR
ON
MEN
TAL
AUTH
OR
IZAT
ION
S FO
R C
UR
REN
TST
. LU
CIE
UN
ITS
1 &
2 O
PER
ATIO
NS
Agen
cyAu
thor
ityR
equi
rem
ent
Num
ber
Expi
ratio
n D
ate
Activ
ity C
over
edFW
CC
Flor
ida
Adm
inis
trativ
eC
ode
Cha
pter
39
Scie
ntifi
c C
olle
ctin
gPe
rmit
WS0
1374
6/25
/200
4C
arca
ss o
r wild
life
salv
aged
and
poss
esse
d fo
rsc
ient
ific
ored
ucat
iona
l pur
pose
s.Th
is is
an
FPL
syst
em-w
ide
perm
itth
at m
ay b
e ap
plie
das
nec
essa
ry a
ndap
prop
riate
at S
t.Lu
cie
Uni
ts 1
& 2
.FW
CC
Flor
ida
Adm
inis
trativ
eC
ode
Cha
pter
39
Mig
rato
ry B
ird N
est
Perm
itW
N01
373
6/25
/200
3Au
thor
izat
ion
tode
stro
y in
activ
e ne
sts
of m
igra
tory
bird
sot
her t
han
ospr
eys
(Pan
dion
hal
iaet
us)
for r
outin
e fa
cilit
ym
aint
enan
ce.
This
isan
FPL
sys
tem
-wid
epe
rmit
that
may
be
appl
ied
as n
eces
sary
and
appr
opria
te a
t St.
Luci
e U
nits
1 &
2.
NO
TES:
a.Ef
fect
ive
July
1, 1
999,
the
Flor
ida
Fish
and
Wild
life
Con
serv
atio
n C
omm
issi
on re
plac
ed th
e Fl
orid
a G
ame
and
Fres
h W
ater
Fis
h C
omm
issi
on.
CFR
= C
ode
of F
eder
al R
egul
atio
nsD
EP =
(Flo
rida)
Dep
artm
ent o
f Env
ironm
enta
l Pro
tect
ion
FPL
= Fl
orid
a Po
wer
& L
ight
Com
pany
FWC
C =
(Flo
rida)
Fis
h an
d W
ildlif
e C
onse
rvat
ion
Com
mis
sion
SFW
MD
= S
outh
Flo
rida
Wat
er M
anag
emen
t Dis
trict
USC
= U
nite
d St
ate
Cod
e
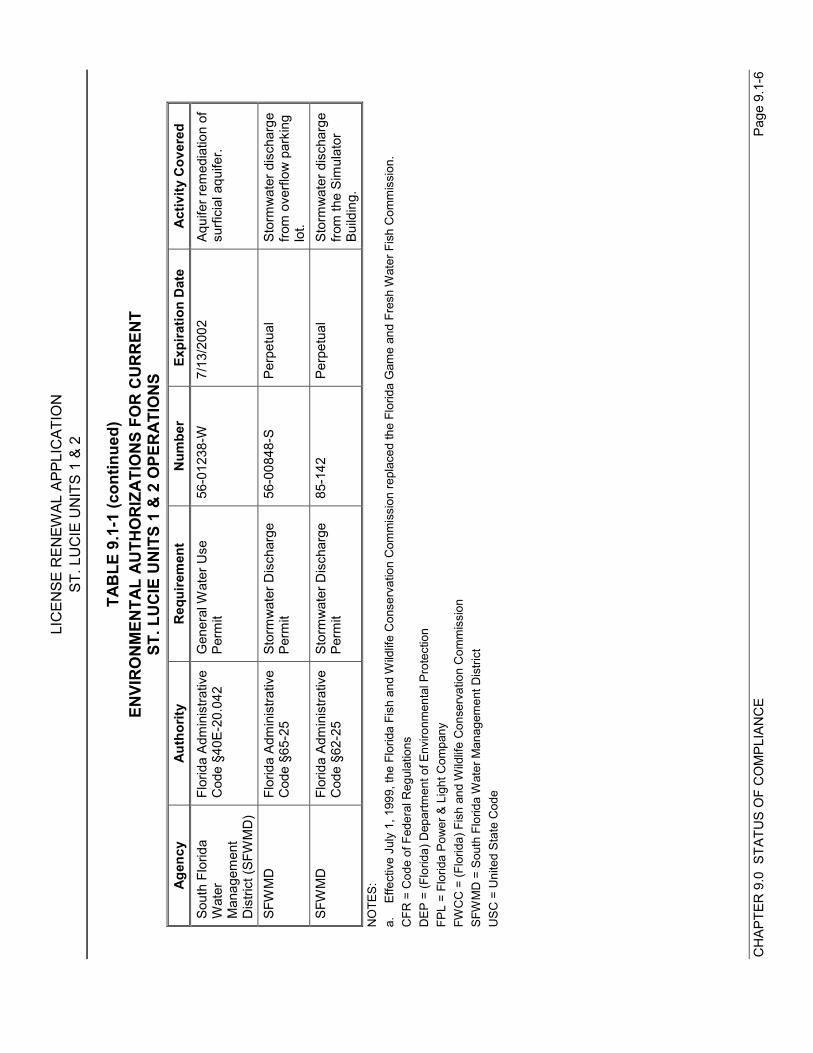
LIC
ENSE
REN
EWAL
APP
LIC
ATIO
NST
. LU
CIE
UN
ITS
1 &
2
CH
APTE
R 9
.0 S
TATU
S O
F C
OM
PLIA
NC
EPa
ge 9
.1-6
TAB
LE 9
.1-1
(con
tinue
d)EN
VIR
ON
MEN
TAL
AUTH
OR
IZAT
ION
S FO
R C
UR
REN
TST
. LU
CIE
UN
ITS
1 &
2 O
PER
ATIO
NS
Agen
cyAu
thor
ityR
equi
rem
ent
Num
ber
Expi
ratio
n D
ate
Activ
ity C
over
edSo
uth
Flor
ida
Wat
erM
anag
emen
tD
istri
ct (S
FWM
D)
Flor
ida
Adm
inis
trativ
eC
ode
§40E
-20.
042
Gen
eral
Wat
er U
sePe
rmit
56-0
1238
-W7/
13/2
002
Aqui
fer r
emed
iatio
n of
surfi
cial
aqu
ifer.
SFW
MD
Flor
ida
Adm
inis
trativ
eC
ode
§65-
25St
orm
wat
er D
isch
arge
Perm
it56
-008
48-S
Perp
etua
lSt
orm
wat
er d
isch
arge
from
ove
rflow
par
king
lot.
SFW
MD
Flor
ida
Adm
inis
trativ
eC
ode
§62-
25St
orm
wat
er D
isch
arge
Perm
it85
-142
Perp
etua
lSt
orm
wat
er d
isch
arge
from
the
Sim
ulat
orBu
ildin
g.N
OTE
S:a.
Effe
ctiv
e Ju
ly 1
, 199
9, th
e Fl
orid
a Fi
sh a
nd W
ildlif
e C
onse
rvat
ion
Com
mis
sion
repl
aced
the
Flor
ida
Gam
e an
d Fr
esh
Wat
er F
ish
Com
mis
sion
.C
FR =
Cod
e of
Fed
eral
Reg
ulat
ions
DEP
= (F
lorid
a) D
epar
tmen
t of E
nviro
nmen
tal P
rote
ctio
nFP
L =
Flor
ida
Pow
er &
Lig
ht C
ompa
nyFW
CC
= (F
lorid
a) F
ish
and
Wild
life
Con
serv
atio
n C
omm
issi
onSF
WM
D =
Sou
th F
lorid
a W
ater
Man
agem
ent D
istri
ctU
SC =
Uni
ted
Stat
e C
ode
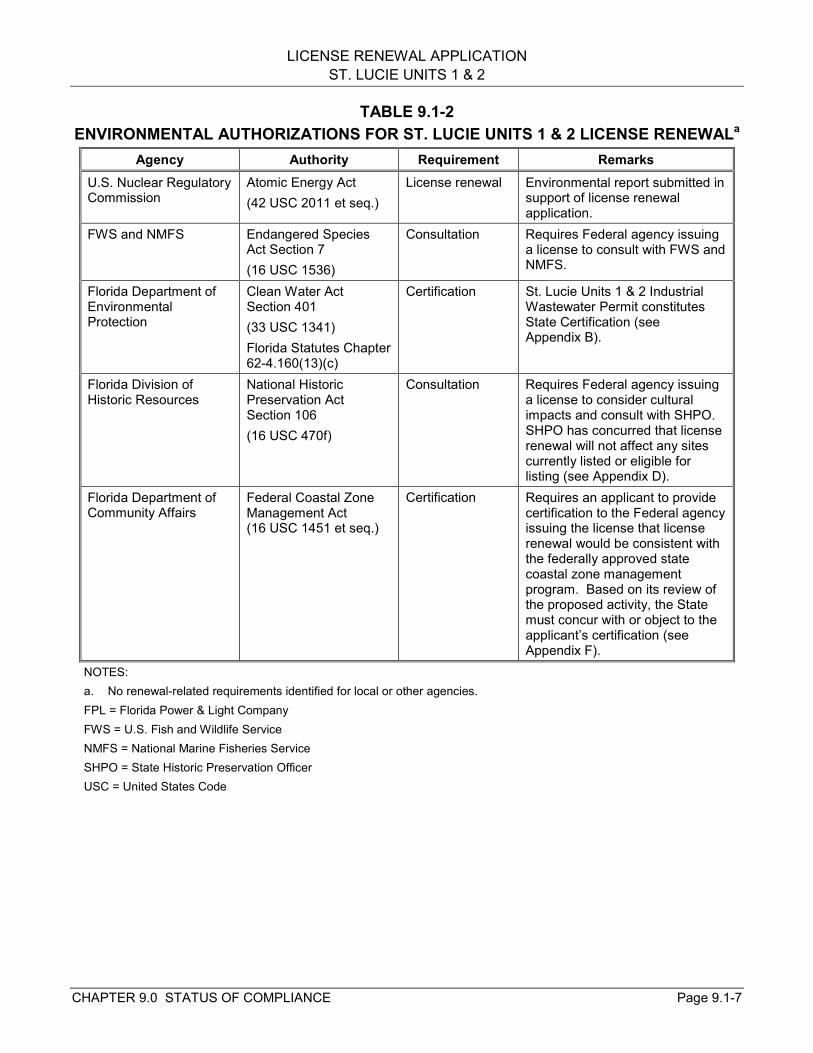
LICENSE RENEWAL APPLICATIONST. LUCIE UNITS 1 & 2
CHAPTER 9.0 STATUS OF COMPLIANCE Page 9.1-7
TABLE 9.1-2ENVIRONMENTAL AUTHORIZATIONS FOR ST. LUCIE UNITS 1 & 2 LICENSE RENEWALa
Agency Authority Requirement RemarksU.S. Nuclear RegulatoryCommission
Atomic Energy Act(42 USC 2011 et seq.)
License renewal Environmental report submitted insupport of license renewalapplication.
FWS and NMFS Endangered SpeciesAct Section 7(16 USC 1536)
Consultation Requires Federal agency issuinga license to consult with FWS andNMFS.
Florida Department ofEnvironmentalProtection
Clean Water ActSection 401(33 USC 1341)Florida Statutes Chapter62-4.160(13)(c)
Certification St. Lucie Units 1 & 2 IndustrialWastewater Permit constitutesState Certification (seeAppendix B).
Florida Division ofHistoric Resources
National HistoricPreservation ActSection 106(16 USC 470f)
Consultation Requires Federal agency issuinga license to consider culturalimpacts and consult with SHPO.SHPO has concurred that licenserenewal will not affect any sitescurrently listed or eligible forlisting (see Appendix D).
Florida Department ofCommunity Affairs
Federal Coastal ZoneManagement Act(16 USC 1451 et seq.)
Certification Requires an applicant to providecertification to the Federal agencyissuing the license that licenserenewal would be consistent withthe federally approved statecoastal zone managementprogram. Based on its review ofthe proposed activity, the Statemust concur with or object to theapplicant’s certification (seeAppendix F).
NOTES:a. No renewal-related requirements identified for local or other agencies.FPL = Florida Power & Light CompanyFWS = U.S. Fish and Wildlife ServiceNMFS = National Marine Fisheries ServiceSHPO = State Historic Preservation OfficerUSC = United States Code
LICENSE RENEWAL APPLICATIONST. LUCIE UNITS 1 & 2
CHAPTER 9.0 STATUS OF COMPLIANCE Page 9.1-8
process, FPL invited comment from Federal and State of Florida agencies regardingpotential effects that St. Lucie Units 1 & 2 license renewal might have on threatened andendangered species. Appendix C includes copies of FPL correspondence with the FWSand NMFS. In addition, FPL has corresponded with the Florida Fish and WildlifeConservation Commission regarding potential effects on state-listed species; Appendix Calso includes copies of this correspondence. License renewal effects on threatened andendangered species could be beneficial due to continued stewardship of species habitat.
9.1.3 COASTAL ZONE MANAGEMENT PROGRAM COMPLIANCE
The Federal Coastal Zone Management Act (16 USC 1451 et seq.) imposes requirementson applicants for a Federal license to conduct an activity that could affect a state’s coastalzone. The Act requires the applicant to certify to the licensing agency that the proposedactivity would be consistent with the state’s federally approved coastal zone managementplan [16 USC 1456(c)(3)(A)]. The National Oceanic and Atmospheric Administration(NOAA) has promulgated implementing regulations that indicate that the requirement isapplicable to renewal of Federal licenses for activities not previously reviewed by the state[15 CFR 930.51(b)(1)]. The regulations require that the license applicant provide itscertification to the Federal licensing agency and a copy to the applicable state agency [15CFR 930.57(a)].
The NRC Office of Nuclear Reactor Regulation has issued guidance to its staff regardingcompliance with the Act. This guidance acknowledges that Florida has an approved coastalzone management program (Ref. 9.1-1, Attachment 5). St. Lucie Units 1 & 2 are locatedwithin the Florida coastal zone, and Appendix F contains a copy of the FPL coastal zonemanagement program certification for St. Lucie Units 1 & 2 license renewal. FPL submittedproject descriptive material and a certification to the State. Concurrent with submitting theApplicant’s Environmental Report - Operating License Renewal Stage to the NRC, FPL willsubmit a copy of this report to the State of Florida in fulfillment of the regulatory requirement.
9.1.4 HISTORIC PRESERVATION CONSULTATION
Section 106 of the National Historic Preservation Act (16 USC 470 et seq.) requires Federalagencies having the authority to license any undertaking, prior to issuing the license, to takeinto account the effect of the undertaking on historic properties and to afford the AdvisoryCommittee on Historic Preservation an opportunity to comment on the undertaking.Committee regulations provide for establishing an agreement with any State HistoricPreservation Officer (SHPO) to substitute state review for Council review (35 CFR 800.7).Although not required by Federal law or NRC regulation, FPL has chosen to invite commentby the Florida SHPO. Appendix D includes copies of FPL correspondence with the SHPO.Based on the FPL submittal and meeting discussions, the SHPO concurred with the FPLconclusion that St. Lucie Units 1 & 2 license renewal would not affect known historic orarchaeological properties.
9.1.5 WATER QUALITY (401) CERTIFICATION
Federal Clean Water Act Section 401 requires that applicants for a Federal license toconduct an activity that might result in a discharge into navigable waters provide thelicensing agency a certification from the state that the discharge will comply with applicable
LICENSE RENEWAL APPLICATIONST. LUCIE UNITS 1 & 2
CHAPTER 9.0 STATUS OF COMPLIANCE Page 9.1-9
Clean Water Act requirements (33 USC 1341). FPL is applying to the NRC for a license(i.e., license renewal) to continue St. Lucie Units 1 & 2 operations.
The State of Florida has U.S. Environmental Protection Agency (EPA) authorization toimplement the National Pollutant Discharge Elimination System (NPDES) within the State forfacilities such as St. Lucie Units 1 & 2. Pursuant to State authority and the EPAauthorization, the Florida Department of Environmental Protection has issued an IndustrialWastewater Facility permit for St. Lucie Units 1 & 2. Chapter 62-4.160 of the FloridaAdministrative Code addresses conditions of permits issued by the Florida Department ofEnvironmental Protection and specifies, at 62-4.160(13)(c), that the “permit also constitutes .. . certification of compliance with State Water Quality Standards (Section 401, PL92-500).”Appendix B contains a copy of the permit.
LICENSE RENEWAL APPLICATIONST. LUCIE UNITS 1 & 2
CHAPTER 9.0 STATUS OF COMPLIANCE Page 9.2-1
9.2 FEASIBLE ALTERNATIVES
NRC“The discussion of alternatives in the report shall include a discussion of whether thealternatives will comply with such applicable environmental quality standards andrequirements.” 10 CFR 45(d) as required by 10 CFR 51.53(c)(2)
The coal-, gas-, and oil-fired generation and purchase power alternatives that Section 7.2.1discusses probably could be constructed and operated so as to comply with all applicableenvironmental quality standards and requirements. FPL notes that increasingly stringent airquality protection requirements could make construction of a large fossil-fuel-fired powerplant infeasible in many locations.
Although construction and operation details for the purchase power alternative (see Section7.2.1.2) are not known, it is reasonable to assume that any facility offering power forpurchase would be in compliance.
LICENSE RENEWAL APPLICATIONST. LUCIE UNITS 1 & 2
CHAPTER 9.0 STATUS OF COMPLIANCE Page 9.3-1
9.3 REFERENCES
9.1-1 U.S. Nuclear Regulatory Commission. “Procedural Guidance for PreparingEnvironmental Assessments and Considering Environmental Issues.” NRROffice Letter No. 906, Rev. 2. Office of Nuclear Reactor Regulation.Washington, D.C. September 21, 1999.