Embed Size (px)
Citation preview

Dioxin determination in foodstuffs
SpeedExtractor E-914: Pressurized Solvent Extraction using SpeedExtractor E-914 for the Determination of Dioxins in Dairy, Egg, Pork and Fish. Authors:,Philippe Marchanda, Vincent Vacchera, Loic Ehannob and Claudia Blumc a Laberca, Nantes, b BUCHI France, Rungis, c BUCHI Labortechnik, Flawil.
Application Note No. 205/2015
Application Note 205/2015 16 November 2015 2/21
1. Introduction
Dioxins are toxic substances that are released in the environment by incomplete combustion processes. “Dioxin” is the umbrella term for polychlorinated dibenzo-p-dioxins (PCDDs) and polychlorinated dibenzofurans (PCDFs). See Figure 1.
Figure 1: Chemical structure of dioxins (PCDDs) left and furans (PCDFs) right. There are many dioxin congeners, but only some of them are cancerogenic because they can attach to a human receptor (AhR) which regulates cell division. The toxicity of each congener is expressed by the TEF (toxic equivalent factor), the most toxic dioxin (TCDD, the so-called “Seveso”-dioxin) has a factor of 1. The overall toxicity is expressed as TEQ (toxic equivalent quantity), which is a sum parameter based on the TEF and the corresponding concentration of all congeners present. Dioxins have never been produced they have only been released unintentionally into the environment, whereas, PCBs have been produced in large volumes for industrial applications. From a toxicological point of view, 12 PCBs are classified as “dioxin-like” (DL PCBs) because they can attach to the same receptor as dioxins and they are included in the assessment of the overall dioxin toxicity. Six other PCBs are defined as “non-dioxin like” PCBs (NDL PCBs), because their toxicity is based on another mechanism. From the chemical point of view, there are two classes of PCBs: non-ortho PCBs and mono- and di-ortho PCBs. For the non-ortho PCBs the two phenyl rings are in the same plane and they have a rigid structure similar to the PCDD/Fs.
Figure 2: Chemical structure of PCBs
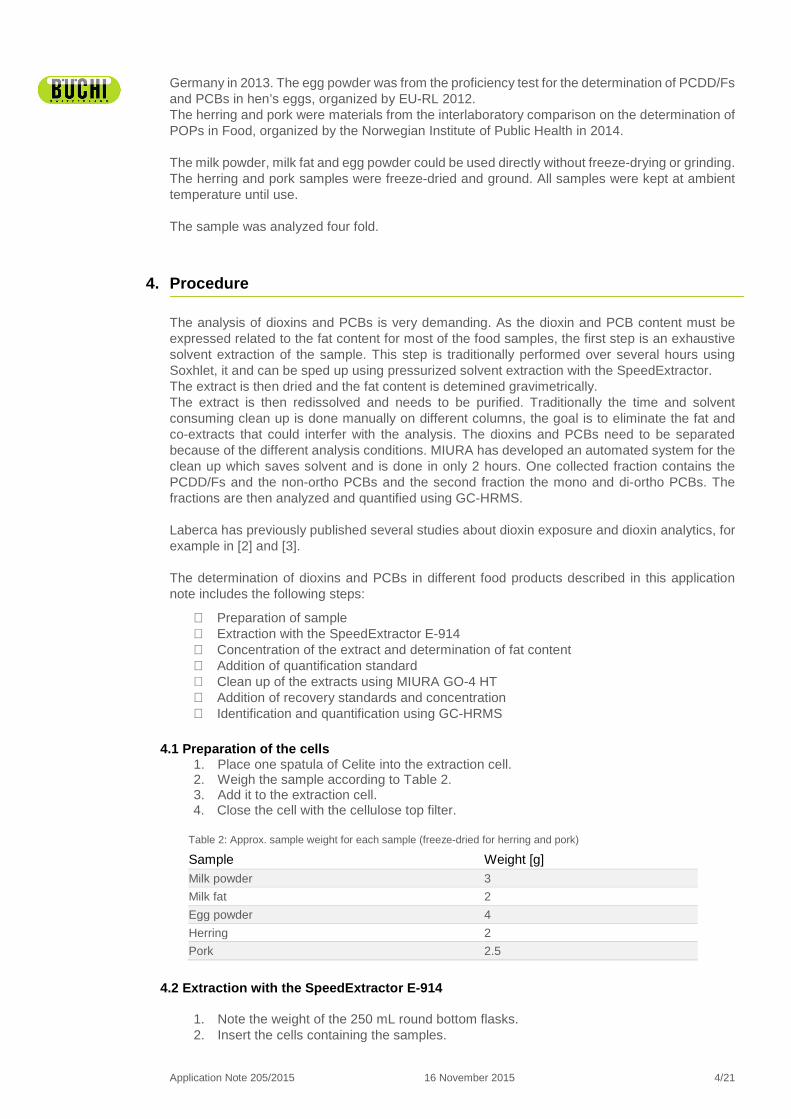
Dioxins and PCBs are lipophilic and accumulate in human and animal tissue. Therefore high fat foods from animals such as meat, eggs, milk and derived products are at a higher risk of contamination. Both, dioxins and PCBs are persistant organic polluants and as such have been banned by the Stockholm conventions. In the EU, the maximum allowed TEQs for dioxin, the TEQ for the sum of dioxins and dioxin-like PCBs as well as the sum of the non dioxin-like indicator PCBs is regulated [1]. See Table 1.
Table 1: Maximum allowed levels of PCDD/Fs, the sum of PCDD/Fs and DL PCBs (expressed as TEQ) and NDL PCBs.
TEQ PCDD/F TEQ (PCDD/F + DL PCBs) NDL PCBs
Milk powder 2.5 pg/g fat 5.5 pg/g fat 40 ng/g fat
Milk fat 2.5 pg/g fat 5.5 pg/g fat 40 ng/g fat
Egg powder 2.5 pg/g fat 5 pg/g fat 40 ng/g fat
Herring 3.5 pg/g fresh weight 5.5 pg/g fresh weight 75 pg/g fresh weight
Pork 1.0 pg/g fat 1.25 pg/g fat 40 ng/g fat
2. Equipment
⋅ SpeedExtractor E-914 mounted on a pedestal, equipped with 40 mL extraction cells, the extracts are collected in 250 mL round bottom flasks (BUCHI 000433)
⋅ Rotavapor R-200 with vacuum pump and controller. ⋅ MIURA Clean up system GO-4HT

Application Note 205/2015 16 November 2015 3/21
⋅ GC-HRMS system: Gas chromatograph (Agilent 7890A) with autosampler coupled to high resolution mass spectometer (JEOL JMS 700 and JEOL 800D).
⋅ Nitrogen Blowdown device for hemolysis test tubes and vials (Liebisch evaporator, type 50006101)
⋅ Freeze Dryer (Christ, Alpha 1-2) ⋅ Drying oven ⋅ Analytical balance (accuracy ± 0.1 mg)
3. Chemicals and Materials
Chemicals:
⋅ Acetone Picograde® (Promochem, 1142) ⋅ Ethanol absolute (Promochem, 9263) ⋅ Hexane Picograde® (Promochem, 1244) ⋅ Toluene Picograde® (Promochem, 1263)
Internal standards:
- Standard Diox/PCB 13C (quantification standard for dioxins/furans and PCBs): solution containing 13C labelled dioxins and furans at the following concentrations : 13C PCDD/Fs at 1.25 ng/mL except 13C OCDD/Fs at 2.50 ng/mL; the dioxin-like PCBs: 13C PCB 77/ 81/ 105/ 114/ 118/ 123/ 126/ 156/ 157/ 167/ 169/ 189 at a concentration of 20 ng/mL and non dioxin-like PCBs : 13C PCB 28/ 52/ 101/ 138/ 153/ 180 at 20 ng/mL.
- Recovery standard Diox/PCB (for dioxins/furans and non-ortho PCBs): Solution containing 13C 1,2,3,4-TCDD at 1.25 ng/mL and 13C PCB 111 at 20 ng/mL.
- Recovery standard for mono- and di-ortho PCBs: solution of 13C PCB 111 at 20 ng/mL. All standards were provided by BCP Instruments (Lyon). The solutions were prepared in toluene and stored in the fridge, protected from sunlight. Materials:
- Celite 545, 20/45 µm-(Coger, 16391) - Cellulose bottom filters for E-914 (BUCHI, 051249) - Cellulose top filters (BUCHI, 049569) - GC Vials (Fischer Bioblock, 1183-3912) - Hemolysis test tubes (Dutscher, 057-038)
Columns for MIURA GO-HT4 system:
- Column containing 10 % (m/m) silver nitrate impregnated silica gel (17.6 mm i.d. x 100 mm) (Miura)
- Column filled with 44 % (m/m) sulfuric acid impregnated silica gel (17.6 mm i.d. x 80 mm) (Miura)
- Column filled with activated carbon (6 mm i.d. x 34 mm) (Miura) - Column filled with alumina (6 mm i.d. x 34 mm) (Miura)
The columns are stored in the freezer at -20°C and taken out 30 min before use to bring them to ambient temperature. For safe handling please refer to the corresponding MSDS. Samples:
⋅ milk powder (1302-MIA) ⋅ milk fat (1302-MIB) ⋅ egg yolk powder (1202-HEB) ⋅ herring (Herring-2014) ⋅ pork (Pork-2014)
Milk powder and milk fat used were from the proficiency test for the determination of PCDD/Fs and PCBs in milk, organized by the European Reference Laboratory (EU-RL) in Freiburg,
Application Note 205/2015 16 November 2015 4/21
Germany in 2013. The egg powder was from the proficiency test for the determination of PCDD/Fs and PCBs in hen’s eggs, organized by EU-RL 2012. The herring and pork were materials from the interlaboratory comparison on the determination of POPs in Food, organized by the Norwegian Institute of Public Health in 2014. The milk powder, milk fat and egg powder could be used directly without freeze-drying or grinding. The herring and pork samples were freeze-dried and ground. All samples were kept at ambient temperature until use. The sample was analyzed four fold.
4. Procedure
The analysis of dioxins and PCBs is very demanding. As the dioxin and PCB content must be expressed related to the fat content for most of the food samples, the first step is an exhaustive solvent extraction of the sample. This step is traditionally performed over several hours using Soxhlet, it and can be sped up using pressurized solvent extraction with the SpeedExtractor. The extract is then dried and the fat content is detemined gravimetrically. The extract is then redissolved and needs to be purified. Traditionally the time and solvent consuming clean up is done manually on different columns, the goal is to eliminate the fat and co-extracts that could interfer with the analysis. The dioxins and PCBs need to be separated because of the different analysis conditions. MIURA has developed an automated system for the clean up which saves solvent and is done in only 2 hours. One collected fraction contains the PCDD/Fs and the non-ortho PCBs and the second fraction the mono and di-ortho PCBs. The fractions are then analyzed and quantified using GC-HRMS. Laberca has previously published several studies about dioxin exposure and dioxin analytics, for example in [2] and [3]. The determination of dioxins and PCBs in different food products described in this application note includes the following steps:
⋅ Preparation of sample ⋅ Extraction with the SpeedExtractor E-914 ⋅ Concentration of the extract and determination of fat content ⋅ Addition of quantification standard ⋅ Clean up of the extracts using MIURA GO-4 HT ⋅ Addition of recovery standards and concentration ⋅ Identification and quantification using GC-HRMS
4.1 Preparation of the cells 1. Place one spatula of Celite into the extraction cell. 2. Weigh the sample according to Table 2. 3. Add it to the extraction cell. 4. Close the cell with the cellulose top filter.
Table 2: Approx. sample weight for each sample (freeze-dried for herring and pork)
Sample Weight [g] Milk powder 3
Milk fat 2
Egg powder 4
Herring 2
Pork 2.5
4.2 Extraction with the SpeedExtractor E-914
1. Note the weight of the 250 mL round bottom flasks. 2. Insert the cells containing the samples.

Application Note 205/2015 16 November 2015 5/21
3. Extract the samples using the parameters given in Table 3 and 4.
Table 3: Extraction parameters for all samples, except milk powder
Parameter Value
Temperature 120 °C
Pressure 100 bar
Solvent Toluene 70%:Acetone 30 %
Cells 40 mL
Vials unspecified1
Cycles 3
Heat-up Hold Discharge
4 min / 1 min / 1 min 5 min 3 min
Flush with solvent 0 min
Flush with gas 3 min
Total extraction time 53 min
Table 4: Extraction parameters for milk powder2
Parameter Value
Temperature 100 °C
Pressure 100 bar
Solvent Toluene 100 % (1st cycle) Toluene 90%:Ethanol 10 % (2nd + 3rd cycle)
Cells 40 mL
Vials unspecified1
Cycles 3
Heat-up Hold Discharge
3 min / 1 min / 1 min 15 min 3 min
Flush with solvent 0 min
Flush with gas 3 min
Total extraction time 1 h 23 min
4.3 Concentration and determination of fat content 1. Evaporate the extracts to dryness using a rotavapor. 2. Evaporate the residual solvent under a nitrogen stream for 20 min. 3. Leave the round bottom flasks in the fume hood overnight. Alternatively dry the extracts
in a drying oven (80°C) for at least 5 hours. 4. Weigh the round bottom flasks containing the extracts and calculate the fat content.
4.4 Clean up with MIURA GO-4HT 1. Dissolve the extracted fat in 5 mL of hexane. 2. Add 20 µL of the internal standard (Diox/ PCB 13C quantification standard) just before the
extracts are cleaned up on the MIURA system. 3. Connect the two purification columns (column with silver nitrate and column with sulfuric
acid). 4. Add the dissolved sample carefully to the top of the assembled columns. 5. Rinse the round bottom flask twice using 5 mL of hexane and add the residue to the top
of the assembled columns.
1 As 250 mL round bottom flasks were used, the vial has to be programmed as ”unspecified“ 2 The fat determination of milk powder using the extraction method in Table 3 gave unacceptable results, therfore another extraction was used.

Application Note 205/2015 16 November 2015 6/21
6. Connect the column containing carbon and the column containing alumina to the purification columns.
7. Connect the tubes and place the assembled columns into the instrument. 1. Insert the two vials collecting the PCDD/Fs plus non-ortho PCBs and the mono- and di-
ortho PCBs, respectively. 2. Choose the program depending on the expected fat content (1-3 g) and the diameter of
the columns (17.6 mm) and press start.3. The purification is completed in approx. 2 h.
Fraction PCDD/Fs and non-ortho PCBs:
1. Transfer the contents of the vial into a hemolysis test tube and add 20 µL of the Diox/PCB recovery standard.
2. Concentrate the extract to approx. 200 µL under a nitrogen stream. 3. Transfer the extract to a GC vial and evaporate to dryness under a nitrogen stream. 4. Redissolve the extract in 10 µL of toluene. 5. The sample is first injected for the analysis of the PCDD/Fs (see chapter 4.5). 6. Add 10 µL of toluene to the sample and analyze the PCBs (see chapter 4.5).
Fraction PCBs:
1. Transfer the content of the vial into a hemolysis test tube and add 20 µL of the PCB recovery standard.
2. Concentrate the extract to approx. 200 µL under a nitrogen stream. 3. Transfer the extract to a GC vial and evaporate to dryness under a nitrogen stream. 4. Redissolve the extract in 50 µL of toluene.
4.5 Quantification with GC-HRMS
1. Analyze and quantify the dioxins and the PCBs using the parameters in Table 5 and 6.
Table 5: GC-HRMS parameters for dioxins
GC-HRMS Agilent 7890A-JEOL JMS 700/ JEOL 800-D
Column DB-5MS (Agilent Technologies): 60 m x 0.25 mm (i.d.), 0.25 μm film
thickness.
Carrier gas Helium (1 mL/min)
Injection mode Splitless 1 min
Injection volume 2 µL
Temperature injector and transfer line 280 °C
Temperature program 120°C for 3 min; 20 °C /min up to 170 °C; 3 °C/min up to 260°C, 25 °C/min
up to 300 °C, 300 °C for 3 min. Total time of the run: 43 min.
Ionisation Electronic impact
Ionisation energy 38-40 eV
Emission current 400-600 μA
Source temperature 280°C
Resolution ≥10,000
3 For more detailed information about the MIURA system please refer to their manual.

Application Note 205/2015 16 November 2015 7/21
Table 6: GC-HRMS parameters for analyzing the non-ortho PCBs and the PCBs
GC-HRMS Agilent 7890A-JEOL 700-D / JEOL 800-D
Column HT8PCB (SGE): 60 m x 0.25 mm (i.d.), 0.25 μm film thickness.
Carrier gas Helium (1 mL/min)
Injection mode Splitless 1 min
Injection volume 2 µL
Temperature injector and transfer line 280 °C
Temperature program 120°C for 0.85 min; 20 °C /min up to 200 °C; 3 °C/min up to 260.5 °C, 30
°C/min up to 330 °C, 330 °C for 3.5 min. Total time of the run: 31 min.
Ionisation Electronic impact
Ionisation energy 38-40 eV
Emission current 400-600 μA
Source temperature 280°C
Resolution ≥10,000
The identification and quantification is done using the retention time, the masses of two specific ions and their ratio. The response factors are determined by injecting standard solutions before and during the sample series. The identification criteria are described by internationally recognised standards, for example, in standard EN 16215:2012 and/or in EPA methods 1613 and 1668.
5. Result
5.1 Overview In Figures 3 to 5, the TEQ values determined in the food products are compared to the assigned values from the proficiency tests.
Figure 3: Comparison of the determined TEQ- WHO PCDD/F with the assigned values from the proficiency test sample
materials (in [pg/g fat] for all samples except herring, where it is [pg/g fresh weight]). The error bars correspond to the
concentration range to get a z-score between +2 and -2. Mean values, n=4.
0.0
0.5
1.0
1.5
2.0
2.5
3.0
3.5
4.0
Milk powder Milk fat Egg powder Herring Pork
TE
Q W
HO
200
5, P
CD
D/F
SpeedExtractor
Assigned value

Application Note 205/2015 16 November 2015 8/21
Figure 4: Comparison of the determined TEQ- WHO of the dioxin-like PCBs with the assigned values from the proficiency
test sample materials (in [pg/g fat] for all samples except herring, where it is [pg/g fresh weight]). The error bars correspond
to the concentration range to get a z-score between +2 and -2. Mean values, n=4.
Figure 5: Comparison of the determined TEQ- WHO (sum of PCDD/Fs and dioxin-like PCBs) with the assigned values
from the proficiency test sample materials, (in [pg/g fat] for all samples except herring, where it is [pg/g fresh weight]). The
error bars correspond to the concentration range to get a z-score between +2 and -2. Mean values, n=4.
0.0
0.5
1.0
1.5
2.0
2.5
3.0
3.5
4.0
Milk powder Milk fat Egg powder Herring Pork
TE
Q W
HO
200
5, P
CB
dio
xin-
like
SpeedExtractor
Assigned value
0
1
2
3
4
5
6
7
Milk powder Milk fat Egg powder Herring Pork
TE
Q W
HO
200
5, P
CD
D/F
+ P
CB
DL
SpeedExtractor
Assigned value

Application Note 205/2015 16 November 2015 9/21
5.2 Dioxins and Dioxin-like PCBs in Milk powder The determined contents of dioxins and furans in milk powder samples are shown in Table 7 and Figure 6.
Table 7: Results for the determination of dioxins and furans in pg/g fat in milk powder (n=5)
PCDDs Mean value (rsd %) Assigned value z-score 4 TEF WHO 2005
2.3.7.8 - TCDD 0.197 (15.1%) 0.236 -0.8 1
1.2.3.7.8 - PeCDD 0.839 (19.3%) 0.720 0.8 1
1.2.3.4.7.8 - HxCDD 0.469 (16.9%) 0.556 -0.8 0.1
1.2.3.6.7.8 - HxCDD 1.41 (17.2%) 1.38 0.1 0.1
1.2.3.7.8.9 - HxCDD 0.487 (20.6%) 0.578 -0.8 0.1
1.2.3.4.6.7.8- HpCDD 4.92 (8.7%) 5.16 -0.2 0.01
OCDD 10.3 (5.1%) 9.84 0.3 0.0003
PCDFs
2.3.7.8 - TCDF 0.965 (6.4%) 1.02 -0.3 0.1
1.2.3.7.8 - PeCDF 0.472 (24.8%) 0.622 -1.2 0.03
2.3.4.7.8 - PeCDF 1.39 (12.9%) 1.44 -0.2 0.3
1.2.3.4.7.8 - HxCDF 0.923 (15.7%) 0.974 -0.3 0.1
1.2.3.6.7.8 - HxCDF 0.726 (9.4%) 0.706 0.1 0.1
1.2.3.7.8.9 - HxCDF 0.302 (27.1%) 0.309 -0.1 0.1
2.3.4.6.7.8 - HxCDF 1.04 (18.3%) 1.05 0.0 0.1
1.2.3.4.6.7.8 -HpCDF 1.70 (15.4%) 1.73 -0.1 0.01
1.2.3.4.7.8.9 -HpCDF LOQ5 NC6 - 0.01
OCDF LOQ NC - 0.0003
TEQ PCDD/Fs 2.18 (5.7%) 2.08 0.5
Fat content [%] 19.8 (3.8%) 20.8 -0.2
4 The z-score is a measure of the performance of the result in proficiency tests. The z-score is calculated from the assigned value and the variation coefficient. The assigned value has a z-score of 0. A z-score of +/- 2 is the warning limit, a z-score of +/- 3 is the action limit. Z-scores within +/-2 are considered as good, and a z-score outside of +/-3 is considered as not acceptable. 5 LOQ: These values were below the limit of quantification (LOQ) 6 NC: Not quantified. The content of these congeners were too low to be quantified in the proficiency test and therefore no value is indicated. As a consequence, no z-scores were calculated.

Application Note 205/2015 16 November 2015 10/21
Figure 6: Dioxins and furans in milk powder. Comparison of the determined dioxin and furan contents (PCDD/Fs) with the assigned values from the proficiency test sample materials [pg/g fat]. The error bars correspond to the concentration range to get a z-score between +2 and -2. Mean values, n=5. Congeners with values below the LOQ are excluded from the chart.
0
1
10
diox
ins
and
fura
ns (
PC
DD
/Fs)
[pg
/g fa
t]
SpeedExtactor
Assigned value
Application Note 205/2015 16 November 2015 11/21
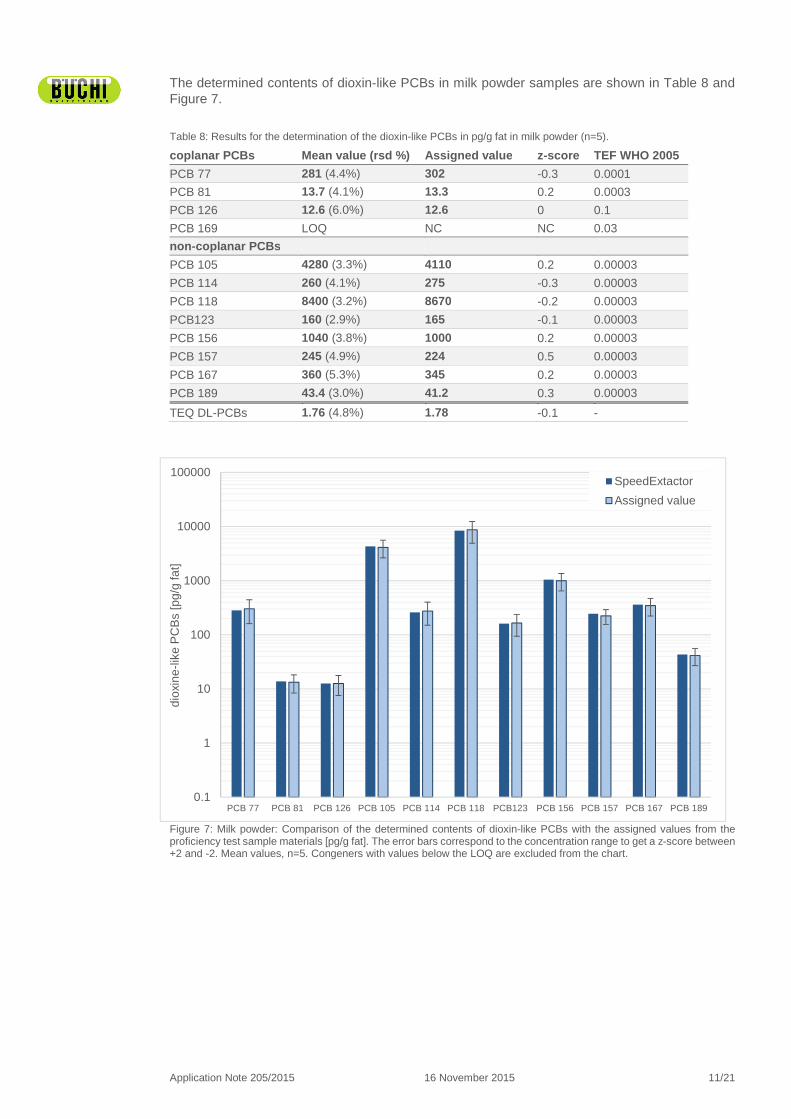
The determined contents of dioxin-like PCBs in milk powder samples are shown in Table 8 and Figure 7.
Table 8: Results for the determination of the dioxin-like PCBs in pg/g fat in milk powder (n=5).
coplanar PCBs Mean value (rsd %) Assigned value z-score TEF WHO 2005
PCB 77 281 (4.4%) 302 -0.3 0.0001
PCB 81 13.7 (4.1%) 13.3 0.2 0.0003
PCB 126 12.6 (6.0%) 12.6 0 0.1
PCB 169 LOQ NC NC 0.03
non -coplanar PCBs
PCB 105 4280 (3.3%) 4110 0.2 0.00003
PCB 114 260 (4.1%) 275 -0.3 0.00003
PCB 118 8400 (3.2%) 8670 -0.2 0.00003
PCB123 160 (2.9%) 165 -0.1 0.00003
PCB 156 1040 (3.8%) 1000 0.2 0.00003
PCB 157 245 (4.9%) 224 0.5 0.00003
PCB 167 360 (5.3%) 345 0.2 0.00003
PCB 189 43.4 (3.0%) 41.2 0.3 0.00003
TEQ DL-PCBs 1.76 (4.8%) 1.78 -0.1 -
Figure 7: Milk powder: Comparison of the determined contents of dioxin-like PCBs with the assigned values from the proficiency test sample materials [pg/g fat]. The error bars correspond to the concentration range to get a z-score between +2 and -2. Mean values, n=5. Congeners with values below the LOQ are excluded from the chart.
0.1
1
10
100
1000
10000
100000
PCB 77 PCB 81 PCB 126 PCB 105 PCB 114 PCB 118 PCB123 PCB 156 PCB 157 PCB 167 PCB 189
diox
ine-
like
PC
Bs
[pg/
g fa
t]
SpeedExtactor
Assigned value

Application Note 205/2015 16 November 2015 12/21
5.2 Dioxins and Dioxin-like PCBs in Milk fat The determined contents for dioxins and furans in milk fat samples are shown in Table 9 and Figure 8.
Table 9: Results of the determination of dioxins and furans in pg/g fat in milk fat (n=4)
PCDDs Mean value (rsd %) Assigned value z-score TEF WHO 2005
2.3.7.8 - TCDD 0.260 (6.1%) 0.315 -0.9 1
1.2.3.7.8 - PeCDD 0.827 (24.0%) 0.973 -0.8 1
1.2.3.4.7.8 - HxCDD 0.680 (11.1%) 0.758 -0.5 0.1
1.2.3.6.7.8 - HxCDD 1.64 (6.1%) 1.83 -0.5 0.1
1.2.3.7.8.9 - HxCDD 0.638 (19.5%) 0.763 -0.8 0.1
1.2.3.4.6.7.8- HpCDD 6.53 (10.8%) 6.79 -0.2 0.01
OCDD 11.6 (11.1%) 12.9 -0.5 0.0003
PCDFs
2.3.7.8 - TCDF 1.28 (8.4%) 1.29 0.0 0.1
1.2.3.7.8 - PeCDF 0.724 (6.3%) 0.833 -0.7 0.03
2.3.4.7.8 - PeCDF 1.71 (8.8%) 1.86 -0.4 0.3
1.2.3.4.7.8 - HxCDF 1.21 (9.3%) 1.27 -0.2 0.1
1.2.3.6.7.8 - HxCDF 0.826 (5.7%) 0.901 -0.4 0.1
1.2.3.7.8.9 - HxCDF 0.334 (6.2%) 0.399 -0.8 0.1
2.3.4.6.7.8 - HxCDF 1.27 (9.3%) 1.40 -0.5 0.1
1.2.3.4.6.7.8 -HpCDF 1.84 (3.6%) 2.17 -0.8 0.01
1.2.3.4.7.8.9 -HpCDF 0.275 (37.6%) 0.313 -0.6 0.01
OCDF 1.18 (12.5%) 1.55 -1.2 0.0003
TEQ PCDD/Fs 2.50 (10.2%) 2.81
Fat content [%] 97.9 (0.3%) NC
Figure 8: Dioxin and furans in milk fat. Comparison of the determined contents with the assigned values from the proficiency test sample materials. in [pg/g fat]. The error bars correspond to the concentration range to get a z-score between +2 and -2. Mean values, n=5.Mean values, n=4
0
1
10
diox
ins
and
fura
ns (
PC
DD
/Fs)
[pg
/g fa
t]
SpeedExtactor
Assigned value

Application Note 205/2015 16 November 2015 13/21
The determined contents of dioxin-like PCBs in the milk fat samples are shown in Table 10 and Figure 9.
Table 10: Results for the determination of the dioxin-like PCBs in pg/g fat in milk fat (n=4).
coplanar PCBs Mean value (rsd %) Assigned value z-score TEF WHO 2005
PCB 77 400 (1.9%) 404 -0.1 0.0001
PCB 81 19.2 (0.9%) 18.8 0.1 0.0003
PCB 126 16.6 (1.4%) 16.0 0.2 0.1
PCB 169 0.542 (59.2%) NC NC 0.03
non -coplanar PCBs
PCB 105 5540 (2.2%) 5730 -0.2 0.00003
PCB 114 361 (3.8%) 405 -0.5 0.00003
PCB 118 11’200 (1.6%) 12’100 -0.4 0.00003
PCB123 219 (3.5%) 232 -0.3 0.00003
PCB 156 1340 (2.4%) 1370 -0.1 0.00003
PCB 157 305 (27.1%) 310 -0.1 0.00003
PCB 167 473 (4.0%) 462 0.1 0.00003
PCB 189 53.0 (4.2%) 52.3 0.1 0.00003
TEQ DL PCBs 2.30 (0.6%) 2.32 -
Figure 9: Milk fat: Comparison of the determined contents of dioxin-like PCBs with the assigned values from the proficiency test sample materials. The error bars correspond to the concentration range to get a z-score between +2 and -2. Mean values in [pg/g fat], n=5. All the values determined in milk fat after the extraction with the SpeedExtractor are in accordance with the assigned value with z-scores of <1.
1
10
100
1000
10000
PCB 77 PCB 81 PCB 126 PCB 105 PCB 114 PCB 118 PCB123 PCB 156 PCB 157 PCB 167 PCB 189
diox
ine-
like
PC
Bs
[pg/
g fa
t]
SpeedExtactorAssigned value

Application Note 205/2015 16 November 2015 14/21
5.2 Dioxins and Dioxin-like PCBs in Egg Powder The determined contents of dioxins and furans in the egg powder samples are shown in Table 11 and Figure 10.
Table 11: Results for the determination of dioxins and furans in pg/g fat in egg powder (n=4)
PCDDs Mean value (rsd %) Assigned value z-score TEF WHO 2005
2.3.7.8 - TCDD 0.260 (13%) 0.318 -0.9 1
1.2.3.7.8 - PeCDD 0.657 (23.6%) 0.717 -0.4 1
1.2.3.4.7.8 - HxCDD 0.535 (33.3%) 0.651 -0.9 0.1
1.2.3.6.7.8 - HxCDD 1.39 (8.7%) 1.51 -0.4 0.1
1.2.3.7.8.9 - HxCDD 0.587 (19.6%) 0.676 -0.7 0.1
1.2.3.4.6.7.8- HpCDD 2.80 (9.6%) 3.20 -0.6 0.01
OCDD 6.54 (3.2%) 7.32 -0.5 0.0003
PCDFs
2.3.7.8 - TCDF 0.434 (10.2%) 0.443 -0.1 0.1
1.2.3.7.8 - PeCDF 0.359 (6.6%) 0.428 -0.8 0.03
2.3.4.7.8 - PeCDF 1.40 (4.2%) 1.64 -0.7 0.3
1.2.3.4.7.8 - HxCDF 0.777 (3.2%) 0.843 -0.4 0.1
1.2.3.6.7.8 - HxCDF 0.711 (5.6%) 0.769 -0.4 0.1
1.2.3.7.8.9 - HxCDF 0.328 (24.8%) 0.397 -0.9 0.1
2.3.4.6.7.8 - HxCDF 0.441 (12.1%) 0.495 -0.5 0.1
1.2.3.4.6.7.8 -HpCDF 0.865 (15.7%) 1.11 -1.1 0.01
1.2.3.4.7.8.9 -HpCDF 0.315 (40.9%) 0.419 -1.2 0.01
OCDF 1.47 (21.6%) 1.76 -0.8 0.0003
TEQ PCDD/Fs 1.91 (10.2%) 2.81 -1.3
Fat content [%] 57.3 (0.6%) 55.8 0.1
Figure 10: Dioxin and furans in egg powder. Comparison of the determined contents with the assigned values from the proficiency test sample materials. The error bars correspond to the concentration range to get a z-score between +2 and -2. Mean values in [pg/g fat], n=4.
0
0
1
10
diox
ins
and
fura
ns (
PC
DD
/Fs)
[pg
/g fa
t]
SpeedExtactor
Assigned value

Application Note 205/2015 16 November 2015 15/21
The determined contents of dioxin-like PCBs in egg powder samples are shown in Table 12 and Figure 11.
Table 12: Results for the determination of the dioxin-like PCBs in pg/g fat in egg powder (n=4).
coplanar PCBs Mean value (rsd %) Assigned value z-score TEF WHO 2005
PCB 77 689 (3.0%) 711 -0.2 0.0001
PCB 81 35.1 (2.4%) 34.6 0.1 0.0003
PCB 126 15.8 (3.2%) 15.2 0.2 0.1
PCB 169 0.200 (29%) NC - 0.03
non -coplanar PCBs
PCB 105 4222 (0.9%) 4160 0.1 0.00003
PCB 114 282 (1.0%) 304 -0.4 0.00003
PCB 118 7540 (1.9%) 7960 -0.3 0.00003
PCB123 180 (3.6%) 170 0.3 0.00003
PCB 156 762 (2.8%) 759 0 0.00003
PCB 157 172 (2.0%) 167 0.2 0.00003
PCB 167 264 (1.8%) 256 0.2 0.00003
PCB 189 33.5 (2.7%) 32.0 0.2 0.00003
TEQ DL-PCBs 2.07 (2.7%) 2.05 0.1 -
Figure 11: Egg powder: Comparison of the determined contents of dioxin-like PCBs with the assigned values from the proficiency test sample materials. The error bars correspond to the concentration range to get a z-score between +2 and -2. Mean values in [pg/g fat], n=5. Congeners with values below the LOQ/NC are excluded from the chart.
1
10
100
1000
10000
PCB 77 PCB 81 PCB 126 PCB 105 PCB 114 PCB 118 PCB123 PCB 156 PCB 157 PCB 167 PCB 189
diox
in-li
ke P
CB
s [in
pg/
g fa
t]
SpeedExtactor
Assigned value

Application Note 205/2015 16 November 2015 16/21
5.2 Dioxins and Dioxin-like PCBs in Herring The determined contents of dioxins and furans in the herring samples are shown in Table 13 and Figure 12.
Table 13: Results for the determination of dioxins and furans in pg/g fresh weight in herring (n=4)
PCDDs Mean value (rsd %) Assigned value z-score TEF WHO 2005
2.3.7.8 - TCDD 0.139 (9.7%) 0.180 -1.1 1
1.2.3.7.8 - PeCDD 0.375 (8.5%) 0.480 -1.1 1
1.2.3.4.7.8 - HxCDD 0.051 (6.6%) 0.069 -1.3 0.1
1.2.3.6.7.8 - HxCDD 0.250 (3.5%) 0.320 -1.1 0.1
1.2.3.7.8.9 - HxCDD 0.032 (18.2%) 0.049 -1.8 0.1
1.2.3.4.6.7.8- HpCDD 0.059 (20.9%) 0.076 -1.1 0.01
OCDD 0.081 (13.8%) 0.071 0.8 0.0003
PCDFs
2.3.7.8 - TCDF 2.29 (2.9%) 2.90 -1.1 0.1
1.2.3.7.8 - PeCDF 0.553 (4.2%) 0.780 -1.5 0.03
2.3.4.7.8 - PeCDF 2.20 (3.3%) 3.00 -1.3 0.3
1.2.3.4.7.8 - HxCDF 0.136 (12.4%) 0.180 -1.2 0.1
1.2.3.6.7.8 - HxCDF 0.211 (8.6%) 0.260 -1.0 0.1
1.2.3.7.8.9 - HxCDF LOQ NC 0.1
2.3.4.6.7.8 - HxCDF 0.192 (5.2%) 0.270 -1.4 0.1
1.2.3.4.6.7.8 -HpCDF 0.025 (30.7%) 0.041 -1.9 0.01
1.2.3.4.7.8.9 -HpCDF LOQ NC - 0.01
OCDF LOQ NC - 0.0003
TEQ PCDD/Fs 1.51 (10.2%) 2.00 -1.2
Fat content [%] 5.59 (0.6%) 6.80 -0.9
Figure 12: Dioxin and furans in herring. Comparison of the determined contents with the assigned values from the proficiency test sample materials. The error bars correspond to the concentration range to get a z-score between +2 and -2. Mean values in [pg/g fresh weight], n=4. Congeners with values below the LOQ/NC are excluded from the chart.
0.001
0.01
0.1
1
10
diox
ins
and
fura
ns (
PC
DD
/Fs)
[in
pg/g
fres
h w
eigh
t] SpeedExtactor
Assigned value

Application Note 205/2015 16 November 2015 17/21
The determined contents of dioxin-like PCBs in herring samples are shown in Table 14 and Figure 13.
Table 14: Results for the determination of the dioxin-like PCBs in pg/g fresh weight in herring (n=4).
coplanar PCBs Mean value (rsd %) Assigned value z-score TEF WHO 2005
PCB 77 34.5 (1.1%) 41.0 -0.8 0.0001
PCB 81 0.91 (2.0%) 1.00 -0.4 0.0003
PCB 126 16.0 (0.8%) 19.0 -0.8 0.1
PCB 169 4.50 (2.0%) 5.4 -0.8 0.03
non -coplana r PCBs
PCB 105 574 (1.6%) 721 -1.0 0.00003
PCB 114 29.7 (2.2%) 42.0 -1.5 0.00003
PCB 118 1710 (1.6%) 2332 -1.3 0.00003
PCB123 21 (1.6%) 25.0 -0.7 0.00003
PCB 156 251 (0.6%) 321 -1.1 0.00003
PCB 157 61.9 (3.0%) 77.0 -1.0 0.00003
PCB 167 162 (2.2%) 203 -1.0 0.00003
PCB 189 28.9 (6.3%) 36.0 -1.0 0.00003
TEQ DL-PCBs 1.82 (0.6%) 2.18 -0.8 -
Figure 13: Herring: Comparison of the determined contents of dioxin-like PCBs with the assigned values from the proficiency test sample materials. The error bars correspond to the concentration range to get a z-score between +2 and -2. Mean values in [pg/g fresh weight], n=4.
0.01
0.1
1
10
100
1000
10000
PCB 77 PCB 81 PCB 126 PCB 169 PCB 105 PCB 114 PCB 118 PCB123 PCB 156 PCB 157 PCB 167 PCB 189
diox
ine-
like
PC
Bs
[pg/
g fr
esh
wei
ght]
SpeedExtactor
Assigned value

Application Note 205/2015 16 November 2015 18/21
5.2 Dioxins and Dioxin-like PCBs in Pork The determined contents of dioxins and furans in pork samples are shown in Table 15 and Figure 14.
Table 15: Results for the determination of dioxins and furans in pg/g fat in pork (n=4)
PCDDs Mean value (rsd %) Assigned value z-score TEF WHO 2005
2.3.7.8 - TCDD LOQ NC - 1
1.2.3.7.8 - PeCDD 0.096 (12.4%) 0.075 1.4 1
1.2.3.4.7.8 - HxCDD 0.092 (12.1%) 0.104 -0.5 0.1
1.2.3.6.7.8 - HxCDD 6.00 (5.0%) 6.43 -0.3 0.1
1.2.3.7.8.9 - HxCDD 0.772 (13.6%) 0.857 -0.5 0.1
1.2.3.4.6.7.8- HpCDD 9.47 (3.5%) 10.4 -0.4 0.01
OCDD 4.13 (11.3%) 5.00 -0.9 0.0003
PCDFs
2.3.7.8 - TCDF 0.069 (10.1%) 0.025 8.9 0.1
1.2.3.7.8 - PeCDF LOQ NC - 0.03
2.3.4.7.8 - PeCDF 0.050 (44.1%) 0.036 2.1 0.3
1.2.3.4.7.8 - HxCDF 0.028 (40.1%) 0.032 0.3 0.1
1.2.3.6.7.8 - HxCDF 0.022(43.5%) 0.021 -1.0 0.1
1.2.3.7.8.9 - HxCDF LOQ NC - 0.1
2.3.4.6.7.8 - HxCDF LOQ NC - 0.1
1.2.3.4.6.7.8 -HpCDF 0.161 (8.8%) 0.204 -1.0 0.01
1.2.3.4.7.8.9 -HpCDF LOQ NC - 0.01
OCDF LOQ NC - 0.0003
TEQ PCDD/F 0.937 (4.6%) 0.929 0.0
Fat content [%] 26.49 (1.9%) 28.00 -0.3
Figure 14: Dioxin and furans in pork. Comparison of the determined contents with the assigned values from the proficiency test sample materials. The error bars correspond to the concentration range to get a z-score between +2 and -2. Mean values in [pg/g fat], n=4. Congeners with values below the LOQ/NC are excluded from the chart.
0.01
0.1
1
10
diox
ins
and
fura
ns (
PC
DD
/Fs)
[in
pg/g
fat]
SpeedExtactor
Assigned value

Application Note 205/2015 16 November 2015 19/21
The determined contents of dioxin-like PCBs in pork samples are shown in Table 16 and Figure 15.
Table 16: Results for the determination of dioxin-like PCBs in pg/g fat in pork (n=4)
coplanar PCBs Mean value (rsd %) Assigned value z-score TEF WHO 2005
PCB 77 6.10 (9.0%) 4.29 2.1 0.0001
PCB 81 0.275 (22%) 0.182 2.5 0.0003
PCB 126 0.747 (9.3%) 0.571 1.5 0.1
PCB 169 0.257 (6.9%) 0.175 2.3 0.03
non -coplana r PCBs
PCB 105 44.0 (6.8%) 26.8 3.2 0.00003
PCB 114 3.51 (5.8%) 2.54 1.9 0.00003
PCB 118 173 (11.0%) 121 2.1 0.00003
PCB123 1.33 (10.4%) 0.929 2.2 0.00003
PCB 156 41.4 (4.4%) 39.3 0.3 0.00003
PCB 157 6.53(4.4%) 5.71 0.7 0.00003
PCB 167 13.7 (4.6%) 11.1 1.3 0.00003
PCB 189 5.86 (5.21%) 5.36 0.5 0.00003
TEQ DL-PCBs 0.092 (7.5%) 0.069 1.7 -
Figure 15: Pork: Comparison of the determined contents of dioxin-like PCBs with the assigned values from the proficiency
test sample materials. The error bars correspond to the concentration range to get a z-score between +2 and -2. Mean
values in [pg/g fat], n=4
0.01
0.1
1
10
100
1000
10000
PCB 77 PCB 81 PCB 126 PCB 169 PCB 105 PCB 114 PCB 118 PCB123 PCB 156 PCB 157 PCB 167 PCB 189
diox
ine-
like
PC
Bs
[pg/
g fa
t]
SpeedExtactor
Assigned value

Application Note 205/2015 16 November 2015 20/21
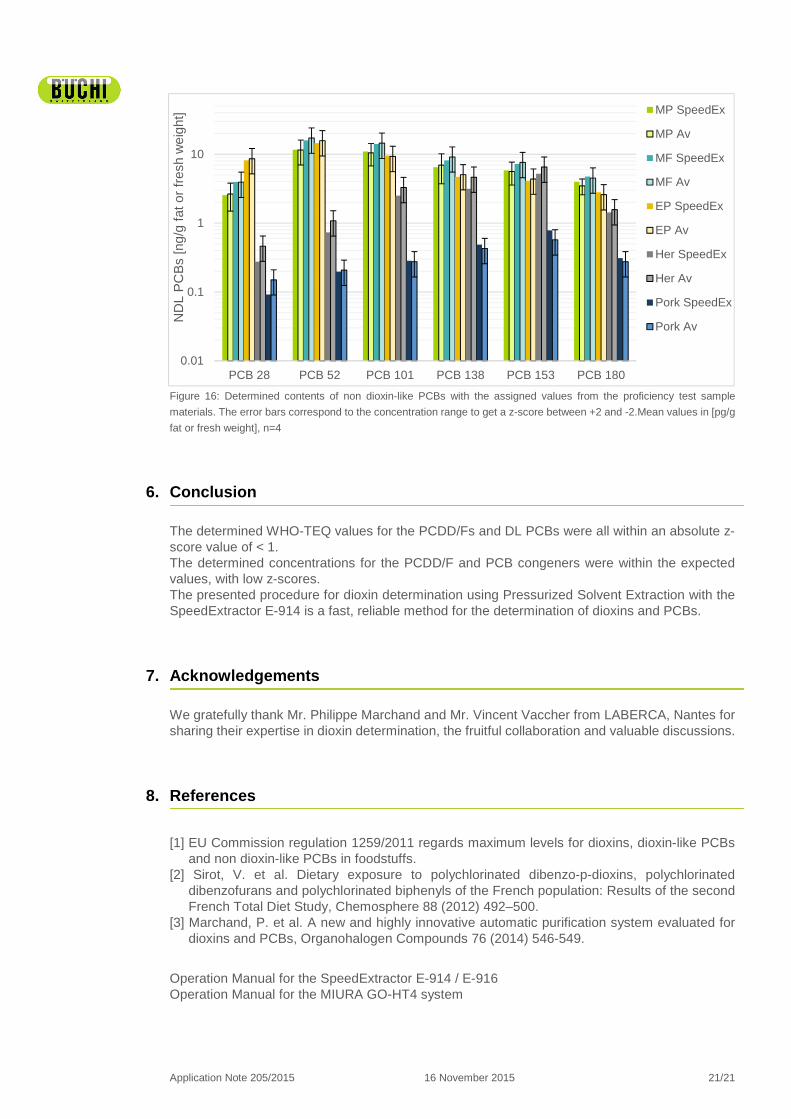
5.2 Non Dioxin-like PCBs The determined contents of non dioxin-like PCBs in the proficiency test samples are shown in Table 17 and Figure 16. Table 17: Determined contents for non dioxin-like PCBs in milk powder, milk fat, egg powder, herring and pork (in pg/p
fat exept for herring, where it is in pg/g fresh weight).
Non dioxin -like PCBs Milk powder Milk fat
SpeedEx Ass value z-score SpeedEx Ass value z-score
PCB 28 2.55 (8.2%) 2.65 -0.2 3.95 (2.2%) 3.92 0.0
PCB 52 11.6 (5.3%) 11.5 0.0 15.9 (2.6%) 17.2 -0.4
PCB 101 11.0 (4.1%) 10.5 0.2 14.0 (2.7%) 14.5 -0.2
PCB 138 6.50 (2.8%) 6.94 -0.3 8.14 (2.6%) 9.13 -0.5
PCB 153 5.82 (3.1%) 5.62 0.2 7.22 (2.0%) 7.61 -0.3
PCB 180 3.96 (2.1%) 3.47 0.7 4.77 (5.1%) 4.52 0.3
Sum of NDL PCBs 41.4 (3.6%) 41.9 -0.1 54.0 (1.8 %) 57.9 -0.5
Non dioxin -like PCBs Egg powder Herring
SpeedEx Ass value z-score SpeedEx Ass value z-score
PCB 28 8.17 (3.1%) 8.62 -0.3 0.276 (5.2%) 0.463 -2.0
PCB 52 14.51 (2.6%) 15.7 -0.4 0.736 (2.4%) 1.08 -1.6
PCB 101 9.54 (2.0%) 9.30 0.1 2.51 (2.8%) 3.29 -1.2
PCB 138 4.67 (2.7%) 5.05 -0.4 3.16 (1.9%) 4.64 -1.6
PCB 153 4.13 (2.2%) 4.36 -0.3 5.20 (1.0%) 6.52 -1.0
PCB 180 2.80 (2.4%) 2.59 0.4 1.43 (2.7%) 1.57 -0.4
Sum of NDL PCBs 43.8 (0.6%) 46.7 -0.4 13.3 (0.1%) 17.6 -1.2
Non dioxin -like PCBs Pork
SpeedEx Ass value z-score
PCB 28 0.092 (10%) 0.150 -1.9
PCB 52 0.197 (5.5%) 0.207 -0.2
PCB 101 0.284 (9.0%) 0.275 0.2
PCB 138 0.487 (6.6%) 0.429 0.7
PCB 153 0.782 (6.3%) 0.571 1.8
PCB 180 0.309 (3.9%) 0.275 0.6
Sum of NDL PCBs 3.03 (6.5%) 1.91 2.9
Application Note 205/2015 16 November 2015 21/21
Figure 16: Determined contents of non dioxin-like PCBs with the assigned values from the proficiency test sample
materials. The error bars correspond to the concentration range to get a z-score between +2 and -2.Mean values in [pg/g
fat or fresh weight], n=4
6. Conclusion
The determined WHO-TEQ values for the PCDD/Fs and DL PCBs were all within an absolute z-score value of < 1. The determined concentrations for the PCDD/F and PCB congeners were within the expected values, with low z-scores. The presented procedure for dioxin determination using Pressurized Solvent Extraction with the SpeedExtractor E-914 is a fast, reliable method for the determination of dioxins and PCBs.
7. Acknowledgements
We gratefully thank Mr. Philippe Marchand and Mr. Vincent Vaccher from LABERCA, Nantes for sharing their expertise in dioxin determination, the fruitful collaboration and valuable discussions.
8. References
[1] EU Commission regulation 1259/2011 regards maximum levels for dioxins, dioxin-like PCBs and non dioxin-like PCBs in foodstuffs.
[2] Sirot, V. et al. Dietary exposure to polychlorinated dibenzo-p-dioxins, polychlorinated dibenzofurans and polychlorinated biphenyls of the French population: Results of the second French Total Diet Study, Chemosphere 88 (2012) 492–500.
[3] Marchand, P. et al. A new and highly innovative automatic purification system evaluated for dioxins and PCBs, Organohalogen Compounds 76 (2014) 546-549.
Operation Manual for the SpeedExtractor E-914 / E-916 Operation Manual for the MIURA GO-HT4 system
0.01
0.1
1
10
PCB 28 PCB 52 PCB 101 PCB 138 PCB 153 PCB 180
ND
L P
CB
s [n
g/g
fat o
r fr
esh
wei
ght] MP SpeedEx
MP Av
MF SpeedEx
MF Av
EP SpeedEx
EP Av
Her SpeedEx
Her Av
Pork SpeedEx
Pork Av