Embed Size (px)
Citation preview

Application of a Land Surface Temperature Validation Protocol to AATSR dataDarren Ghent1, Frank Göttsche2, Folke Olesen2 & John Remedios11Earth Observat ion Science, Department of Physics and Astronomy, Universi ty of Leicester, UK
2Inst i tu te f rom Meteoro logy and Cl imate Research, Kar lsruhe Inst i tute of Technology, Germany

© ESA – GlobTemperature Consortium
LPVE, 28-30 January 2014, ESRINDUE GlobTemperature
2
LST Validation Protocol
Land surface temperature validation protocol:No existing protocol for LST validation
To establish several categories classifying the primary approaches to validation of satellite-based LST
To establish several quality levels for each validation category
To describe a recommended LST validation methodology for each category and level
To satisfy the community requirements for a set of guidelines for validating LST
To be sensor independent
To present a standard and consistent nomenclature
Document open to community for feedback

© ESA – GlobTemperature Consortium
LPVE, 28-30 January 2014, ESRINDUE GlobTemperature
3
LST Validation Protocol
Category A: Comparison of satellite LST with in situ measurements
This is the traditional and most straightforward approach to validating LST. It involves a direct comparison of satellite-derived LST with collocated and simultaneously acquired LST from ground-based radiometers.
Category B: Radiance-based validation
This technique uses top-of-atmosphere (TOA) brightness temperatures (BTs) in conjunction with a radiative transfer model to simulate ground LST using data of surface emissivity and a atmospheric profiles of air temperature and water vapour content.
Category C: Inter-comparison with similar LST products
A wide variety of airborne and spaceborne instruments collects thermal infrared data and many provide operational LST products. An inter-comparison of LST products from different satellite instruments can be very valuable for determining LST.
Category D: Time series analysis
Analysing time series of satellite data over a temporally stable target site allows for the identification of potential calibration drift or other issues of the instrument that manifest themselves over time. Furthermore, problems associated with cloud contamination for example may be identified from artefacts evident in the time series. Care must be taken in distinguishing between instrument-related issues such as calibration drift and real geophysical changes of the target site or the atmosphere.

© ESA – GlobTemperature Consortium
LPVE, 28-30 January 2014, ESRINDUE GlobTemperature
4
LST Validation Protocol
Schematic overview of LST validation categories
Each of the four validation categories are subdivided into classes based on the complexity of the methodology and the expected accuracy of the validation
Category
A B C D
In situ Radiance-based Inter-comparison Time series
Highest accuracy A1
B1 C1D1
Accuracy Class
A2
D2A3
B2 C2A4 D3
A5
B3 C3 D4A6Lowest
accuracy

© ESA – GlobTemperature Consortium
LPVE, 28-30 January 2014, ESRINDUE GlobTemperature
5
In-situ LST based on the following components:• Upwelling radiance from relevant surface covers, i.e.
the ’end members’ • Land surface emissivities (LSE) of end members• Downwelling radiance in spectral range of in-situ
radiometer
• Directional distribution of surface leaving radiance
• Composition of end members over validation area
Requirements for Category A validaton

© ESA – GlobTemperature Consortium
LPVE, 28-30 January 2014, ESRINDUE GlobTemperature
6SLIDE 6
Large, homogeneous sites
Well characterised Different climates &
biomes Dedicated to LST
validation
Portugal,Evora
Namibia, Gobabeb
Namibia,Farms
Senegal,Dahra
Temperate vegetation
Desert
Kalahari bush
Semi-arid (tiger bush)
KIT Validation Stations
© ESA – GlobTemperature Consortium
LPVE, 28-30 January 2014, ESRINDUE GlobTemperature
7
Gobabeb, Namibia: Desert
Main end-members: gravel (75%) and dry grass (25%)
Rain every few years
Some “rivier” (wadis) and rock outcrops
Desert climate (~23° South)
460 m asl

© ESA – GlobTemperature Consortium
LPVE, 28-30 January 2014, ESRINDUE GlobTemperature
8
T-Based AATSR Example: Gobabeb 2009
ESA_V2
UOL_LST

© ESA – GlobTemperature Consortium
LPVE, 28-30 January 2014, ESRINDUE GlobTemperature
9
R-Based Methodology
The radiance-based (R-based) approach does not require ground-based LST measurements
An opportunity to validate satellite LST retrievals over a wide range of biomes, under different surface and atmospheric regimes
Radiative transfer is used to simulate at-sensor BTs from atmospheric profiles and surface data
Iteratively perturb the surface temperature until the simulated BTs bracket the observed BT - the input surface temperature being the satellite-retrieved LST – the R-based temperature (LSTR) is determined by interpolation
The difference, δLST, between the satellite-retrieved LST and LSTR is the LST uncertainty
Key criteria are the homogeneity of the surface in terms of emissivity and accurate representation of the atmosphere
To assess whether the atmospheric profiles represent the true atmospheric conditions observed during satellite retrievals the discrepancy δ(T11 – T12) between the observed BT difference (T11 – T12)obs and the simulated BT difference (T11 – T12)sim is assessed. A sensitivity analysis is used to determine the correct threshold for this quality test

© ESA – GlobTemperature Consortium
LPVE, 28-30 January 2014, ESRINDUE GlobTemperature
10
R-based example: AATSR validation
Biome #
Day NightESA_V2 UOL_LST ESA_V2 UOL_LST
μ (K) σ (K) RMSE (K) μ (K) σ (K) RMSE (K) μ (K) σ (K) RMSE (K) μ (K) σ (K) RMSE (K)
1 -0.27 1.65 1.67 0.23 0.55 0.59 -0.57 1.55 1.65 0.32 0.55 0.642 1.83 2.90 3.43 1.28 0.70 1.45 -0.38 0.70 0.79 -0.02 1.00 1.003 -0.68 1.85 1.97 -0.17 0.80 0.82 -0.17 1.90 1.91 0.58 0.30 0.654 0.38 1.80 1.84 0.98 0.60 1.14 0.18 2.25 2.26 1.78 1.95 2.645 3.08 4.33 5.31 -0.02 0.60 0.60 2.82 4.58 5.37 0.68 0.85 1.096 4.77 5.85 7.55 0.83 0.65 1.05 4.02 5.10 6.50 0.63 0.50 0.807 1.58 3.50 3.84 0.98 0.70 1.20 -0.82 1.60 1.80 0.63 0.55 0.838 0.68 2.30 2.40 0.38 0.55 0.67 0.22 1.95 1.96 0.38 0.55 0.679 -0.32 1.55 1.58 -0.02 0.70 0.70 -2.48 1.95 3.15 -0.13 0.80 0.8110 1.68 2.75 3.22 -0.18 0.85 0.87 0.63 1.80 1.91 -0.13 0.70 0.7111 1.77 2.65 3.19 -0.77 1.15 1.39 -0.38 1.45 1.50 -0.63 1.20 1.3512 0.03 2.15 2.15 0.63 0.80 1.02 0.27 1.90 1.92 1.18 1.00 1.5413 0.73 1.25 1.45 1.18 0.70 1.37 -0.22 2.30 2.31 1.18 0.80 1.4214 0.03 1.75 1.75 1.02 0.45 1.12 -0.13 1.65 1.65 0.92 0.65 1.1315 -0.17 1.60 1.61 0.18 0.60 0.63 -1.58 1.55 2.21 -0.43 1.05 1.1316 2.52 1.70 3.04 -0.52 1.10 1.22 -0.98 0.95 1.36 -0.72 1.35 1.5317 3.18 5.10 6.01 -0.47 1.05 1.15 2.77 3.65 4.59 -0.52 1.00 1.1318 -0.03 1.80 1.80 -0.07 0.75 0.75 -0.58 1.55 1.65 -0.33 1.00 1.0519 -0.82 1.60 1.80 0.58 0.60 0.83 -1.27 2.05 2.41 -0.12 0.70 0.7120 -1.23 1.45 1.90 -0.37 0.75 0.84 -1.73 1.70 2.42 0.78 0.20 0.8021 -2.72 2.10 3.44 1.38 0.90 1.64 -3.83 3.15 4.96 0.83 0.50 0.9622 -1.47 1.45 2.07 0.82 0.60 1.02 -3.02 2.15 3.71 0.58 0.60 0.8323 -1.98 1.70 2.61 0.77 0.55 0.95 -3.33 2.55 4.19 0.57 0.50 0.7624 -2.88 2.00 3.50 0.53 0.55 0.76 -3.13 2.25 3.85 0.43 0.60 0.7425 -1.37 1.55 2.07 -0.58 1.15 1.29 -1.68 1.65 2.35 -0.63 1.10 1.2726 -0.38 1.55 1.59 -0.32 0.85 0.91 -0.97 1.45 1.75 -1.53 1.95 2.4827 1.52 2.70 3.10 1.28 0.90 1.56 0.43 2.10 2.14 1.08 0.65 1.26
© ESA – GlobTemperature Consortium
LPVE, 28-30 January 2014, ESRINDUE GlobTemperature
11
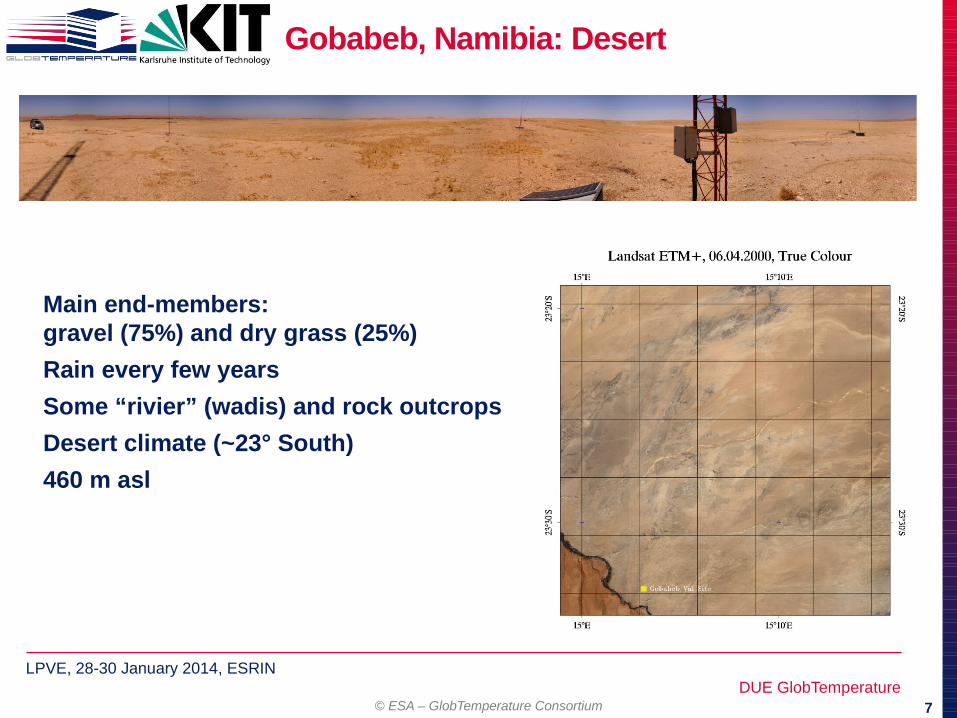
Intercomparison
Only the highest quality cloud-free pixels are considered. LST data that do not meet the highest quality control are discarded.
Spatial variability in the IFOV for each the satellite is handled through spatial re-gridding onto a common grid (in this example 0.05º x 0.05º) by way of averaging all geo-referenced, cloud free pixels of the highest quality weighted by the proportion of each individual pixel within the grid-cell.
Temporal variability between the LST datasets for a matchup is minimised by time interpolation between adjacent GEO measurements for example to correspond to the coincident overpass time of LEO.
Daytime and night-time monthly composites of the differences between datasets are derived from the individual comparisons carried out over the course of the month.

© ESA – GlobTemperature Consortium
LPVE, 28-30 January 2014, ESRINDUE GlobTemperature
12
Intercomparison: AATSR vs. SEVIRI
JulyApril October
Night
January
ESA_V2
ESA_V2
UOL_LST
UOL_LST
Day

© ESA – GlobTemperature Consortium
LPVE, 28-30 January 2014, ESRINDUE GlobTemperature
13
Intercomparison: AATSR vs. SEVIRI
MonthLST product
Day Night
μ (K) σ (K)RMSE
(K)μ (K) σ (K)
RMSE (K)
Jan
ESA_V2
-1.75 1.87 2.56 -0.65 1.68 1.80
UOL_V3
-1.63 1.54 2.24 -0.35 1.29 1.34
Feb
ESA_V2 -1.73 2.21 2.81 -0.19 1.91 1.92
UOL_V3
-1.78 1.83 2.55 -0.03 1.57 1.57
Mar
ESA_V2
-0.29 2.74 2.75 -0.31 1.74 1.76
UOL_V3
-0.76 2.15 2.28 -0.12 1.32 1.33
Apr
ESA_V2
1.73 2.96 3.43 0.38 1.61 1.65
UOL_V3
0.80 2.35 2.48 0.45 1.34 1.41
May
ESA_V2
3.41 2.77 4.39 1.09 1.57 1.91
UOL_V3
2.24 2.36 3.25 1.02 1.31 1.66
Jun
ESA_V2
4.04 2.71 4.86 1.59 1.62 2.27
UOL_V3
2.75 2.24 3.55 1.39 1.30 1.91
Jul
ESA_V2
3.78 2.82 4.72 1.79 1.75 2.50
UOL_V3
2.13 2.05 2.96 1.27 1.20 1.74
Aug
ESA_V2
2.81 3.01 4.12 1.51 1.96 2.48
UOL_V3
1.29 2.21 2.55 1.11 1.34 1.74
Sep
ESA_V2
1.72 3.06 3.51 1.65 2.10 2.68
UOL_V3
0.24 2.11 2.13 1.04 1.38 1.73
Oct
ESA_V2
0.93 2.99 3.13 1.22 1.72 2.11
UOL_V3 -0.01 2.48 2.48 1.07 1.22 1.63
Nov
ESA_V2
0.32 2.40 2.42 0.91 1.96 2.16
UOL_V3
-0.23 1.72 1.73 0.97 1.38 1.69
Dec
ESA_V2 -0.40 2.12 2.16 1.04 2.08 2.32
UOL_V3
-0.55 1.61 1.70 1.03 1.58 1.89
Day
Night
© ESA – GlobTemperature Consortium
LPVE, 28-30 January 2014, ESRINDUE GlobTemperature
14
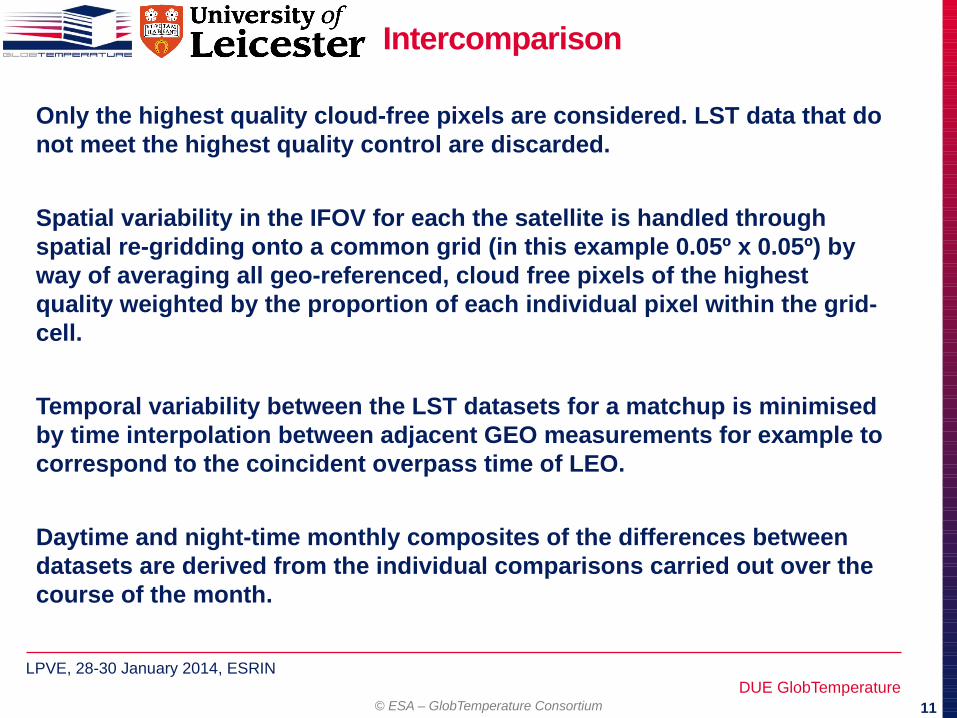
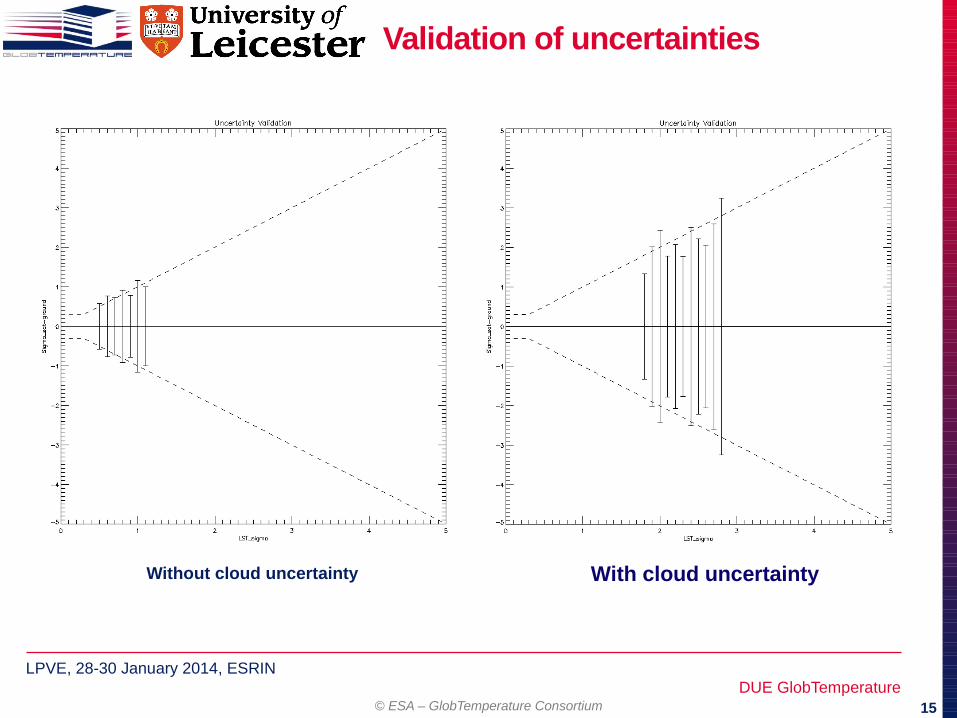
Validation of uncertainties
Biome map
Geolocation
Surface component
Cloud detection
Radiometric noise Atmosphere component
Model fitting Total
© ESA – GlobTemperature Consortium
LPVE, 28-30 January 2014, ESRINDUE GlobTemperature
15
Validation of uncertainties
Without cloud uncertainty With cloud uncertainty

© ESA – GlobTemperature Consortium
LPVE, 28-30 January 2014, ESRINDUE GlobTemperature
16
Matchup database (GT_MDB)
1. Definition of validation and intercomparison protocol and plan• Create a list of suitable sources of ground-based validation data, e.g.
KIT’s stations, SURFRAD sites (see Yu et al.), Lake Tahoe, Salton Sea, BSRN, Atmospheric Radiation Measurement (ARM) sites …
2. Data preparation•. Collect sample sets of ground-based validation data
•. Construction of an in situ matchup database
•. Development of tools for extracting matchups
•. Extraction of satellite vs. in-situ LST matchups
•. Populations of in situ matchup databases for all instruments at selected sites
•. Construction of an intercomparison matchup database
3. Maintain the in-situ matchup database populating with new matchups as satellite and in situ datasets are updated
•. LST from matchup sources – in situ, satellite
•. Uncertainties from matchup sources – in situ, satellite
•. Time of matchup (Julian Date)
•. Satellite Quality Flags including cloud cover
•. Solar zenith angle
•. Satellite zenith angle
•. Emissivity
•. Land cover type
•. Met. fields – LSAT, up- and downwelling radiation (if available)
•. Additional info, e.g. location (area), sensor, producer, version, etc.
© ESA – GlobTemperature Consortium
LPVE, 28-30 January 2014, ESRINDUE GlobTemperature
17
LST Validation Protocol: Summary
• A standard and consistent nomenclature
• Sensor independent approach for LST / IST / LSWT validation
• Set of guidelines open to the community
• Successfully applied to AATSR validation – chosen methodology for GlobTemperature
• A suggested baseline for a LPV best practices guide fro LST