Embed Size (px)
Citation preview

APPLICATION OF A MODIFIED STATISTICAL SEGMENTATION METHOD TO TIMBER MACHINE STRENGTH GRADING
Frkdkric Rouger Research Manager
Department of Timber Engineering Centre Technique du Bois et de I'Amenblement
10 Avenue de Saint Mand.5 7501 2 Paris, France
(Received October 1995)
ABSTRACT
In this paper, a new method for deriving grading rules is given. This method is based on the multiple regression and discrimination techniques by binary prediction t m s , which are of high interest for classification purposes. A modification to the existingpractice that tends to predict the bending modulus of rupture (MOR) is presented. This method consists in creating a nominal variable, the "optimal strength class value," which contains the information necessaly to enter into a strength class system, i.e., the density, the bending modulus of elasticity (MOE), and the MOR. A comparison between a regression technique aimed at predicting the MOR and a discrimination technique aimed at predicting the optimal strength class assignment illustrates the innovative aspect of this method.
Keywords: Timber, machine grading, statistics, classification.
INTRODUCTION
Most of the research camed out in the field of timber grading is based on the parametric regression method. The regressions may be simple, as for classical bending type grading machines, or multiple, as for new multiple de- vices grading machines. Some of the models are linear; others may be nonlinear. These parametric regressions are limited because the models apply to the whole population and only explain an average trend. Another constraint is that we need to derive grade limits that are calculated from this average trend but must insure the required safey level of a grade, given by lower fractiles (see Fewell undated). The statistical segmentation technique is innova- tive because it is nonparametric, i.e., there is no analytical model to predict an average trend, but a set of limits that divide the population into "segments" of distinct quality levels. The method was introduced originally by Morgan and Sonquist (1963), who developed the AID (Automatic Interaction Detection) technique. It aims at reducing the variance of the parent sample by dividing it into binary segments that WoodnndFibw Science, 28(4), 1996, pp. 4 3 8 4 1 9 O 1996 by the S ~ F W of Wood Scicnn and Technology
are determined by a limited value (upper bound on the let? segment and lower bound on the right segment) on a predictive variable. The method was improved by Breiman et al. (1 984), who found an algorithm to "prune" the initial trees and give an optimal tree.
The CART (Classification and Regression Tree) method can be applied for predicting a continuous variable. In this case, it is named a regression method. For grading purposes, the variable to be predicted is the MOR, given for each specimen. But the CART method may also be applied for predicting a nominal vari- able, i.e., a variable that can take only a limited set of values. In that case, it is named a dis- crimination method. For grading purposes, a nominal variable is the strength class to which a given specimen "should" be assigned. It can be derived by an optimal ranking technique.
OPTIMAL RANKING METHOD
If we want to grade timber according to EN 338 strength classes system (AFNOR 1995), three requirements for each strength class have to be fulfilled:

ROUR~~-STATISTICAL SEGMENTATION FOR TIMBER MACHINE STRENGTH GRADING 439
-characteristic density, corresponding to 5th N
percentile lower fractile, 2 xi
-characteristic MOR, corresponding to 5th p ( ~ = ( 5 ) percentile lower fractile,
-mean MOE. where j is the number of pieces taken out from
Before describing how to rank a population of timber in an "optimal way," let us explain how to achieve a characteristic value (so-called target value) from a parent population. If a given sample of size N, ranked according to ascending values of x, is such that the target value x, has a cumulative frequency f, higher than 5%, x, will have a cumulative frequency of 5% in the new sample by taking out a num- ber of pieces n from the lower part of the dis- tribution. To determine the cutting level n, let us assume that
where i is the rank of x, in the original sample of size N (which means Prob(x s x 3 = i/N). We want to have
which gives
or, by using Eq. (1)
Now consider a population of size N, in which we know for each specimen the MOE, the MOR, and the density. If we want to ex- tract from this population the specimens that should enter into a given strength class, we have to apply the algorithm given in Fig. 1. Note that for the MOE, Eq. (4) does not apply and we have to use a step by step procedure (see Fig. 2) to determine the cutting level n,. In this algorithm, the mean value of a variable X, ranked according to ascending values (XI 5 X2 5 . . . 5 X, 5 5 . . . 5 XN), is given by
the lower part of the sample. Ifwe now want to perform an optimal rank-
ing according to the whole EN338 system (AF- NOR 1995), we repeat the procedure by de- scending strength classes order. This method gives spectacular results, compared for ex- ample to a visual grading method (see Rouger et al. 1993). In Table 1, a comparison of yields between visual grading and optimal ranking is given for three species. In this table, three strength classes (C30, C22, C18) have been selected. To illustrate the computation corre- sponding to the algorithm given in Fig. 1, in- . . - .
termediate values of (n,, n,, n,) for the optimal ranking of spruce and fir are reported in Table 2. It is obvious that any grading method could not reach the yields of the optimal grading method, but it gives an upper limit that we should try to work toward.
This optimal strength class is given for each specimen, and therefore can constitute a nom- inal variable that we wish to explain. This op- tion is more powerful than a simple explana- tion of the MOR, because the strength class assignment depends on the density, the MOR, and the MOE. The following sections refer to a comparison of both methods.
BASIC PRINCIPLES OF THE
SEGMENTATION TECHNIQUE
Let us assume that we want to explain a variable Y by a set of predicting variables XI, X,, . . . , X,. The purpose of classification is to reduce the initial variance ofthe parent sam- ple by giving limiting values on the predictive variables. When dividing a segment into two subsegments, the best division has to mini- mize the weighted mean of the variances of Y in the subsegments (so-called "intravari- ance"). The algorithm that is used to divide a segment into two "subsegments" is illustrated in Fig. 3.
The "largest tree" is a tree in which each

Sort N density values into ascending numerical order; Determine the cutting level nl
Sort N MOR values into ascending numerical order; Determine the cutting level n2
Sort N MOE values into ascending numerical order; Determine the cutting level n3
n = Max (nl, n2, n3)
.. . ..
Keep the (N-nl) higher density values
Keep the (N-n2) higher MOR values
Keep the (N-n3) higher MOE values
RG. I. Algorithm for optimal ranking (for one strength class).
Rouser-ST4TISTICAL SEGMENTATION FOR TIMBER MACHINE STRENGTH GRADING 44 I
calculate (x) k- - - ----- - I according to equation
( 5 )
FIG. 2. Algorithm for MOE cutting level.
"terminal segment" contains only one speci- men. The intravariance of this tree equals zero. Two mathematical functions are used to mea-
TAB]-E 2. Optimal ranking of spruce andfir; Nlustration of dlgorithm given in Fig. I .
there is very little chance that this tree is ap- plicable to another sample (the ETP is high). For the smallest tree, both the EAP and the ETP are high (this tree does not predict any- thing). These functions (EAP and ETP) are also expressed in relative terms (relative errors of prediction). The algorithm of "pruning" aims to optimize the combination of the EAP and the ETP.
To calculate the EAP, let us consider a given tree (A). For each terminal segment (t), the weighted variance is calculated
sure the performance of a given tree: R(t) = p(t)s2(t) (6)
-the apparent error ofprediction (EAP), which where R(t) is the weighted variance of segment is used to measure the capacity of prediction I, p(t) is the yield of segment t, s2(t) is the of the tree on the learning sample, variance of segment t. p(t) and s2(t) are cal-
-the theoretical error of prediction (ETP), culated according to which is used to measure the capacity of prediction of the tree on the test sample. N(t)
2 i ~ i - p(y(t))I2 iet p(t) = 7 s2(t) =
For the largest tree, the EAP equals zero, but (7)
TABLE I. Comparison of yields between visual grading and optimal ranking
C30 10% 79% 9% 78% 0% 61% C22 49% 3.5% I I% 13.5% 0% 13% C18 12% 4.5% 2 2 8 5% 54% 7.5% Reject 29% 13% 58% 3.5% 46% 18.5%

WOOD AND FTBER SCIENCE, October 1996, V. 28(4)
For i=l to v Try different values of ai
Divide the segment into two x sub-segments according to the
following rule : I I
ui that minimizes
the intra-variance
Retain the value of i that gives the best
FIG. 3. Algorithm for constructing the trees.
where N(t) is the number of specimens in seg- ment (t), N is the total number of specimens, y, is the individual value of Y for a specimen i in segment t, p(y(t)) is the mean of Y in seg- ment t. The EAP of the tree (A) is given by
EAP(A) = z R(t). IEA
(8)
mal," in the sense that it is not applicable to another sample. The algorithm of pruning is necessary to extend the prediction capability of the tree. It can be summarized according to the following rules:
(a) Separate randomly the parent sample into two subsamples: the "LEARNING SAM- PLE," which will be further used for cre- ating the trees, and the "TEST SAMPLE," which will be used to select among these trees the optimal one. Work is currently being done to check the effect of the ran- dom selection on the results. A further publication will focus on this topic.
(b) With the LEARNING SAMPLE construct a largest tree A- with a minimum num- ber of specimens in each terminal segment (e.g., n,,. = 5).
(e) Construct a series S* of smaller and smaller trees (up to a tree of one segment only, which is the LEARNING SAMPLE), by suppressing pairs of segments.
(d) Each tree Ai of S* has a given number of terminal segments (i). Among the possi- bilities of trees with the same number of terminal segments, choose the one that minimizes the EAP.
(e) Among the trees A, of S* which satisfy rule (d), select the optimal tree by using the TEST SAMPLE. The optimal tree A* is the smallest one that gives the smallest ETP. The ETP of a tree (A) is given by
with
and
w='(t) ~"(t) = - pees'
ALGORITHM OF "PRUNING" where NIeSf(t) is the number of specimens The tree constructed by the method de- in segment (t), A""' is the total number of
scribed earlier is symmetrical and not "opti- specimens of the TEST SAMPLE, p'' is

Rouser-STATISTICAL SEGMENTATION FOR TIMBER MACHINE STRENGTH GRADING 443
the individual value of Y for a specimen i in segment t, p ( p l ( t ) ) is the mean of Y in segment t.
(f) Apply the "One standard-deviation rule": If A* is the optimal tree, i.e.,
where k is the number of terminal seg- ments of the tree A,, then choose the tree with k, segments, where k, is the maxi- mum value of k which verifies
where std-dev(ETP(A*)) is the standard de- viation of the theoretical errors of predic- tion (see Eq. (9)) corresponding to the trees having the same number of terminal seg- ments as the tree A*.
For each tree A, of S*, the relative errors of prediction are given by
where $(test) is the initial variance of the TEST SAMPLE.
where sZ(basic) is the initial variance of the LEARNING SAMPLE.
DISCRIMINATION METHOD
A similar technique is called the "Discrim- '
ination Technique by binary trees."In this case, the variable Y to be predicted is a nominal variable, i.e., it can take only discrete values. The errors of prediction are subsequently cal- culated by evaluating the percentage of "badly classified specimens."
On the whole sample, an initial assignment to ONE value of Y (Yo) is given, which cor- responds to the most frequent value of Y in the whole sample. An initial ratio of badly classified specimens is calculated according to
2 6, TEI = 5 with 6 , = 1 if Yi + Yo
N 0 if Yi = Yo
where TEZis the initial ratio of badly classified specimens, N is the number of specimens in the whole sample, Y, is the value of Y for spec- imen i, Yo is the initial assignment ofthe sam- ple.
For a given tree, each terminal segment (t) is assigned to a value of Y (Y,), which corre- sponds to the most frequent value of Y in the segment t. For each terminal segment, a ratio of badly classified specimens is calculated ac- cording to
- ~-,
2 ail
RBC(~) = with 6, = 1 if Yi # Y, N(f) 0 if Y, = Y,
where RBC(t) is the ratio of badly classified specimens of segment 1, N(t) is the number of specimens of segment t, Yi is the value of Y for specimen i, Y, is the assignment of seg- ment I.
For each tree, the ratio of badly classified specimens is calculated by a weighted mean of the ratios ofbadly classified specimens for each terminal segment. This calculation is per- formed for both the LEARNING SAMPLE (TEA) and the TEST SAMPLE (TET).
TEA = 2 p(l).RBC(t) ,FA
TET = 2 p'es'(t).RBC'eI'(t) (18) IEA
where p(t) and pte"(t) are given by Eqs. (7) and ( 1 1). These ratios are divided by the initial ratio (TEI) to give the relative errors (REA, RET). Therefore, the ratios of badly classified specimens are given by
TEA = REA. TEI TET = RET. TEI (19)
Therefore, the ratios of "well classified speci- mens" are given by

WOOD AND FIBER SCIENCE, October 1996, V. 28(4)
~
X
Central third *- . ~- ~ ~ z
114 compressive r~ ~ ~ ~ - .l t
.. -
Full length
112 medium
1H tensile
FIG. 4. Pseudo-KAR calculations.
WCSA = 1 - TEA WCST= 1 - TET (20)
. . . .
APPLICATION OF BOTH METHODS TO
STRENGTH GRADING
-. 4
The regression technique may be applied to strength grading, by predicting the MOR val- ues from nondestructive variables. The dis- crimination technique may also be applied by predicting the optimal strength class. The op- timal trees are then treated to get the correct strength classes:
X
(a) Apply the tree on the whole sample (learn- ing + test).
(b) For each segment, calculate the 5% MOR, mean MOE, 5% density.
(c) Classify the terminal segments according to the 5% MOR.
(d) Select a set of strength classes. (e) Aggregate the terminal segments (and the
corresponding criteria) if necessary to meet the requirements of the strength classes, i.e., 5% MOR, mean MOE, 5% density.
The following example illustrates the effi- ciency of the method: A sample of 166 spec-
imens of Scots pine (50 x 150 x 3000 mm) have been tested by using different nondestruc- tive devices, as well as tested in destructive bending to get the MOE and MOR values. For each specimen, 32 nondestructive variables have been measured by using 4 devices:
-slope of grain -gamma-radiation device -Cook-Bolinder flatwise bending machine -SCANWOOD vision system.
The list of nondestructive variables is re- ported below. The gamma-radiation device is used to get the density, but also to calculate pseudo-KAR values (knots area ratios), as il- lustrated in Fig. 4. Whereas the usual knots area ratios are calculated on the (y, z) plane, the pseudo-KAR values are calculated in the (x, z) plane. In the bending machine, two runs are analyzed, due to a different influence of a knot at the beginning of the board and at the end of the board. A combination of both runs is subsequently derived.
*) SLOPE OF GRAIN Average face slope of grain SOGl Minimum face slope of grain SOG2 Maximum face slope of grain SOG3
Rouser-STATISTICAL SEGMENTATION FOR TIMBER MACHINE STRENGTH GRADING 445
Average edge slope of grain SOG4 Minimum edge slope of grain SOG5 Maximum edge slope of grain SOG6
*) GAMMA-RADIATION DEVICE Average density Pseudo-KAR-tensile zone-
full length Pseudo-KAR-medium zone-
full length Pseudo-KAR-compressive
zone-full length Pseudo-KAR-full width-
full length Pseudo-KAR-tensile zone-
central third Pseudo-KAR-medium zone-
central third Pseudo-KAR-compressive
zone-central third Pseudo-KAR-full width-
central third
GAM 1
GAM3
GAM5
GAM7
GAM9
GAM 12
GAM 14
GAM 16
GAM 18
*) COOK-BOLINDER FLATWISE BENDING MACHINE Mean En,-first run STR 1 Standard-deviation En.,-
first run STR2 Minimum En,,-first run STR3 Maximum En,,-first run STR4 Mean En.,-second run STR5 Standard-deviation En.,-
second run STR6 Minimum En.,-second run STR7 Maximum En.,-second run STR8 Mean En,-combination STR9 Standard-deviation En,,-
combination STRlO Minimum En.,-combination STRl 1 Maximum En,,-combination STRl2
*) SCANWOOD SYSTEM (VIDEO SCANNING OF KNOTS) Face knots NOD1 Edge knots NOD2 Tensile KAR NOD3 Comprehensive KAR NOD4 Total KAR NOD5
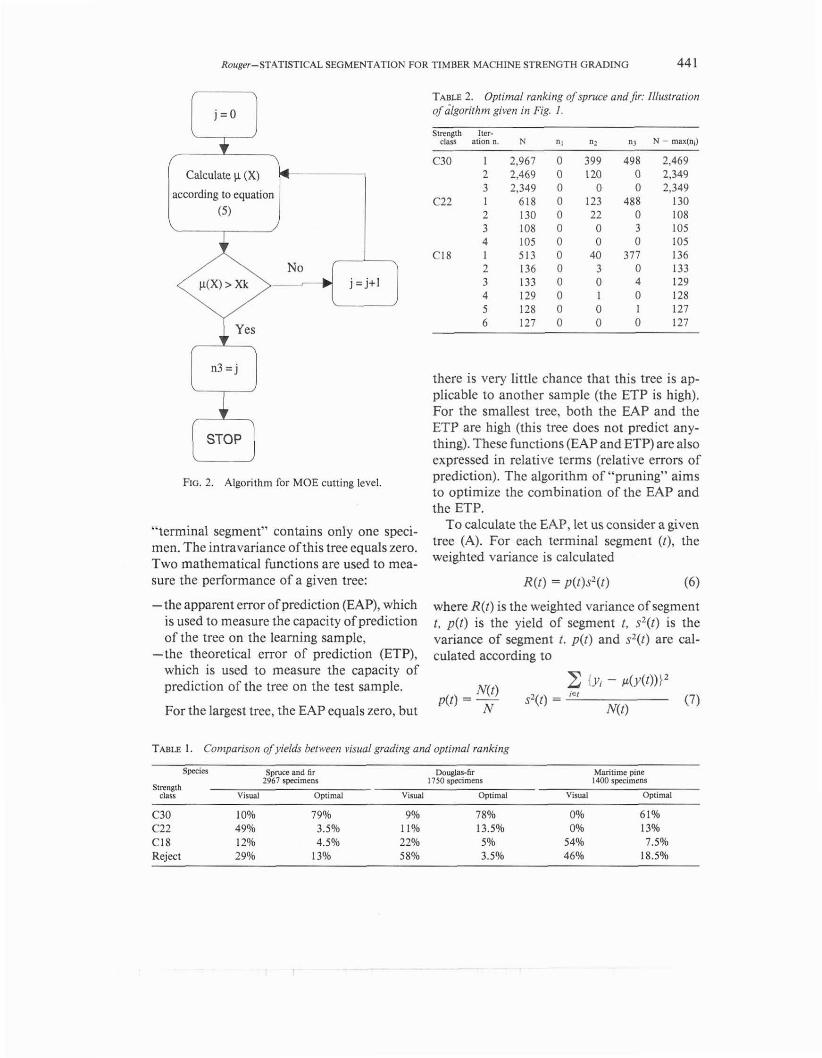
TABU 3. Visual grading of the sample.
Visvll pading rtpuimmcnla
S e n d class ~ a c c bars ~ d ~ e b o t s yield
C24 5113 2 1 3 39% C18 s 112 a213 23% Reject 38%
Ungraded material
The ungraded material has the following characteristics, which justify an assignment to C18.
MOR 5% = 20.8 MPa mean MOE = 10.1 GPa density 5% = 463 kg/m3
Visual grading
The visual grading method, as proposed in a draft version of NFB52001-4 (French Visual Grading Rule) (AFNOR 1996) gives the yields shown in Table 3.
Optimal ranking
When applying the algorithm given in pre- vious sections, one gets the optimal yields giv- en in Table 4. The strength classes require- ments are given in Table 5. It can be clearly noticed that the MOE is the limiting variable that determines the optimal strength class. Therefore, one can suspect that the discrimi- nation should give a better grading than a re- gression aiming at predicting only the MOR.
Regression method
The initial variance of the whole sample is equal to 274.3. According to the algorithm de- scribed earlier, a list oftrees is given in Table 6.
TABLE 4. Optimal ranking of the initial sample.
Stmngh Number of Mcan MOE MOR 5% IXnrity 5% elas swc. (yield) (in GPs) (in MPa) (in kgim3)
C40 23 (14%) 14.0 53.5 550 c 2 4 5 s (33%) 1 1 . 0 27.8 473 C18 66 (40%) 9.0 19.4 460 Reject 22 (13%) 7.0 16.1 453

446 WOOD AND FIBER SCIENCE. October 1996, V. 28(4)
TABLE 5. Strength classes requirements according 10
EN338.
Smoh Mean MOE MOR5% Dmsity 5% class (in IGPa) (in MPa) (in Wmll
The tree A1 has the maximum number of segments. It predicts very well the LEARN- ING SAMPLE (REA = 0.01 15) but does not fit to the TEST SAMPLE (RET = 0.66). The tree A40 corresponds to the initial sample. It does not predict anything (REA = RET = 1). The tree A38 has been selected as the optimal one (REA = 0.36, RET = 0.51), because it gives the best compromise between the LEARNING and the TEST SAMPLE for a
TABLE 6. List oftrees (S*) given by the regression method.
RSWVC em= of pndinion (REP)
Number of TEST LEARNING terminal SAMPLE SAMPLE
T m n. sc~mcnu IRET) lRF-4)
minimum number of segments (N = 3). This tree is illustrated in Fig. 5.
Only two variables are used to construct the tree:
-GAM3: Pseudo-KAR-tensile zone-full length
-NOD3: Tensile KAR
For each division level of the tree, the means of each segment are separated and the vari- ances are reduced as much as possible. This is illustrated in Fig. 6. When applying the grading
Mean = 41 N = 105 s2(Y/1) = 260.4
Mean = 61.7 N = 25 s2(Y/2) = 128.9
Mean = 34.5 N = 80 s2(Y/3) = 125.9
Mean = 40.4 N = 44 Mean = 27.3 N = 36 s2(Y/6) = 122.4 s2(Y/7) = 35.8
RG. 5. Optimal t m given by regression method.

Rou~er-STATISTICAL SEGMENTATION FOR TIMBER MACHINE STRENGTH GRADING 447
Level 0
" 0 50 IW
MOR (MPa)
- Segment l MOR (MPa)
- Segment 2 - Segment 3
MOR (MPa)
- Segment 2 - - Segment 6 - Segment 7
Fro. 6. Reduction of the initial sample according to the tree level.
rules to the whole sample, one can derive strength classes, as illustrated in Table 7.
Discrimination method
The discrimination technique gives a series of trees, illustrated in Table 8. The tree A1 has the maximum number of segments. It predicts very well the LEARNING SAMPLE (REA =
0.09) hut does not fit to the TEST SAMPLE (RET = 0.5 1). The tree A8 corresponds to the initial sample. It does not predict anything (REA = RET = 1).
The tree A5 has been selected as the optimal one (REA = 0.27, RET = 0.51), because it gives the best compromise between the LEARNING and the TEST SAMPLE for a minimum number of segments (N = 4). This tree is illustrated in Fig. 7. The percentage val- ues correspond to the ratios of well-classified specimens.
Only three variables are used to construct the tree:
-STRl 1: Minimum Em-combination oftwo Nlls
-STRl: Mean En,,-first run -STR5: Mean E,,,-second run
One can also see that, as the division level increases, the minimum ratio ofwell-classified specimens increases. This is illustrated in Fig. 8. When applying the grading rules to the whole sample, one can derive strength classes, as il- lustrated in Table 9.
Comparisons ofthe results
It is difficult to compare different grading results, since the strength classes are different and the yields are different. One can suggest a performance factor that is influenced by higher yields in higher strength classes:
TABLE 8. List of trees (SY given by the discrimination technigue.
- Relati -
N u m b of TEST TNG TBLE 7. Strengih class assignment. temuoal SAMPLE LE Tne n. m g r n ~ n t ~ (RETI L)
M a n MOR Density - - Segment N v m k o f MOE 5% 5% A1 I5 0.51
n. spec. (yield) (in wa) (in MPsl (in kg/rnj) ''Z?' 0.09 ... ... ... ...
2 31(19%) 12.5 42.4 473 C30 A5 4 0.51 0.27 ... ... ... 6 76 (46%) 10.0 23.6 468 C22 . . ,
7 59 (35%) 8.9 17.5 451 Reject A8 1 1.0 I .O

WOOD AND FIBER SCIENCE, October 1996, V. 28(4)
FIG. 7. Optimal tree given by the discrimination method.
N = 111 1 : C18 (39.6%)
Min. %age of well classified specimens
loo 0
strll <= 7.95
0 1 2
Division Level
FIG. 8. Illustration of the effect of segmentation.
str11 > 7.95
N = 5 6 2 : C18 (68%)
N = 55 3 : C24 (62%)
strl <= 7.22 strl > 7.22 str5 <= 8.9 str5 > 8.9
N = l l 4 : Reject (100%)
N = 45 5 : C18 (84.5%)
-
N = 3 9 6 : C24 (79.5%)
N = 1 6 7 : C40 (81%)
Rower-STATISTICAL SEGMENTATION FOR TIMBER MACHINE STRENGTH GRADING 449
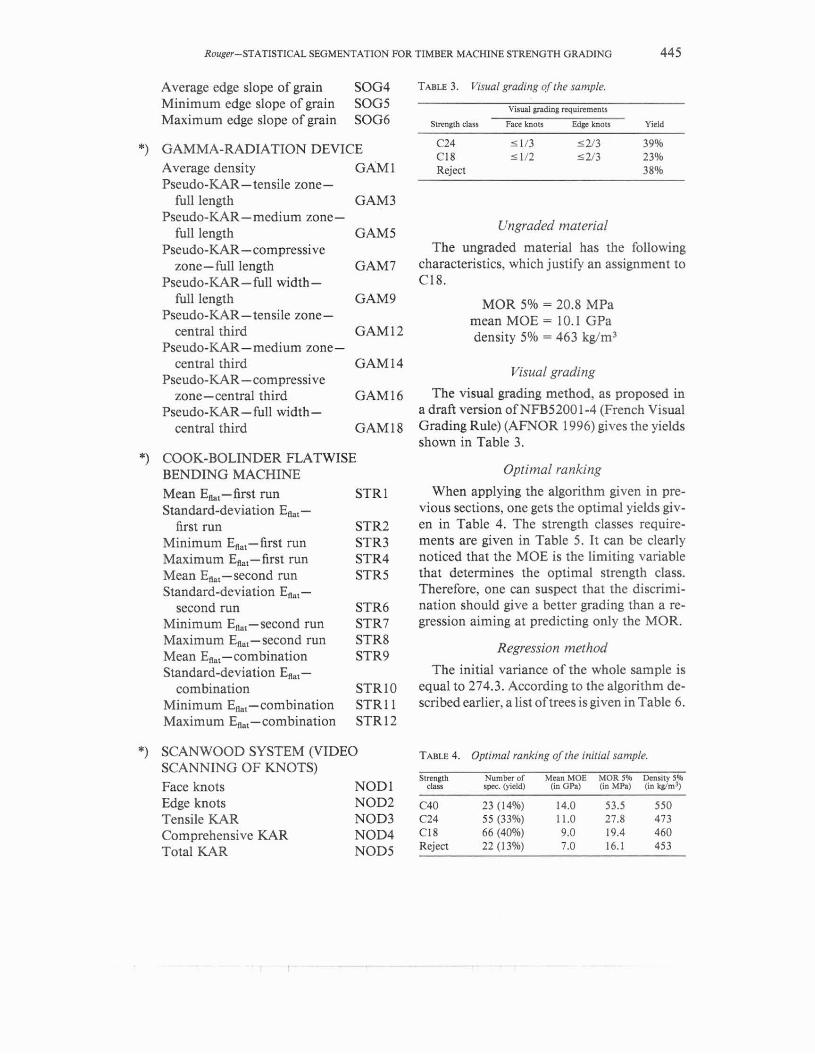
TABLE 9. Strength class assignmenl. TABLE 10. Pe$ormance factor& direrent grading sys- tems.
Mean Density %mcnt Number af MOE MOR 5% 5% Sfnngth
n. spec. (yidd) (in GPa) (m MPa) (in kg/ml) class Pcrfomsnec R e - m l d &ding sysem factor value
7 22 (13%) 14.0 42.6 539 C40 - Visually graded 17.3 0.0
6 62 (37%) 10.8 24.8 476 C22 Ungraded 18.0 0.12 5 64 (39%) 9.0 19.2 460 C18 Regression 19.7 0.40 4 18 (1 1%) 7.0 12.4 408 Reject Discrimination 22.8 0.92
Optimal ranking 23.3 1.0
Performance factor = the existing grading machines. Beside the - - 2 method presented in this paper, one could
srrensh C I ~ ~ X (5'M0R)2'yie'd (21) mention neural networks or object-oriented classification systems, which seem very prom-
The performance factors for the different anal- ising, ysis described earlier are given in Table 10.
REFERENCES
CONCLUSIONS ~SOC. FRANWE DE NORMAUSATION (AFNOR). 1996.
The nonparametric regression and discrim- NFB 52001.4: Regles d'utilisation du bois dans la con- struction. Partie 4: Classement visuel pour I'emploi en
methods are very powerful and give stmciun des principales essences resineuses et feuillues. simple rules for machine strength grading, even Venion 1996 privisoire et non publike. AFNOR, Paris, with multiple sensing devices. An alternative France. to regression methods has been presented, by - . 1995. NF EN338: Bois de structure-classe de
resistance. P21353. (Structural timber-Strength class- using an optimal ranking algorithm before per- es),
forminga discrimination analysis. One should B Re,w, L, H, FRIEDw, R. A. WHEN, AND C, J. prefer the regression method when the MOR STONE. 1984. Classification and regression trees.
is determining the strength class assignment Wadsworth Int. Group.
and the discrimination when either the MOE FBK~LL, A. R. Undated. Derivation of setting for stress grading machines. A brief description of the approach or the density is determining the strength class used to derive in the U.K, Undated Report,
assignment. When looking at the relative per- Building Research Establishment, Watford, UK. formance of these methods, it is clear that one Monom, J. N., AND A. SONQUIST. 1963. Problems in should expect very efficient grading rules, to theanalysisofsurveydataandaproposal.1. Am. Statist.
be confirmed by further analysis. It also shows ASSOc. 58:415--435. ROUGER, F., C. DE LAFOND, AND A. EL. OUADRAN. 1993. that One should only On different
Structural properties of French grown timber according measuring technologies, but also on new clas- tovariousgradingmethods. 26th CIBW18 ~ e e t i n g , AU- sification methods, which can highly improve gust 1993, Athens, GA.


![Robust Statistical Estimation and Segmentation of …cs294-6/fa06/papers/RANSAC25-Yang-A… · Robust Statistical Estimation and Segmentation of Multiple Subspaces ... [5,16,34]](https://img.pdfslide.net/doc/110x75/5ad8473b7f8b9a991b8d1c81/robust-statistical-estimation-and-segmentation-of-cs294-6fa06papersransac25-yang-arobust.jpg)